Embed Size (px)
Citation preview
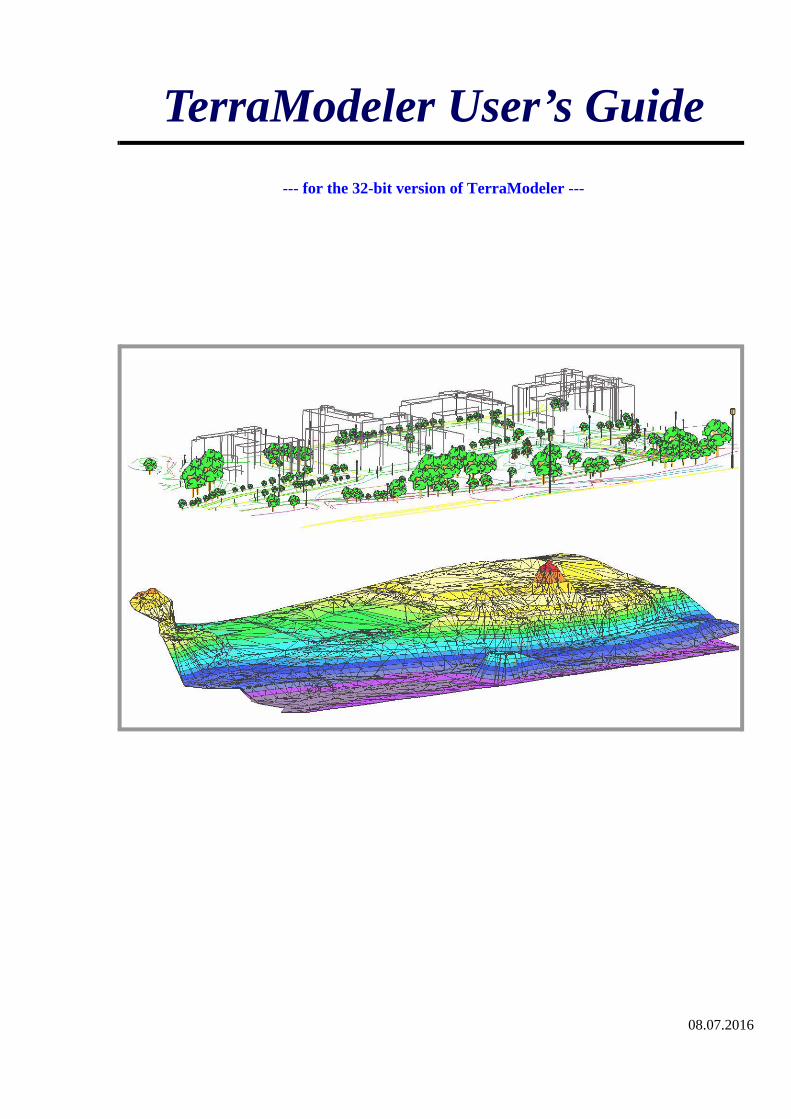
TerraModeler User’s Guide--- for the 32-bit version of TerraModeler ---
08.07.2016

Page 2
Trademarks
MicroStation®, MDL® and MicroStation stylized "M" are registered trademarks of Bentley Systems, Incorporated. Bentley Map PowerView, MicroStation PowerDraft, and MicroStation GeoOutlook are trademarks of Bentley Systems, Incorporated.
TerraBore, TerraGas, TerraLink, TerraMatch, TerraModeler, TerraPark, TerraPhoto, TerraPipe, TerraScan, TerraSlave, TerraStereo, TerraStreet, and TerraSurvey are trademarks of Terrasolid Limited.
Windows is a trademark of Microsoft Corporation.
Acrobat Reader is a trademark of Adobe Systems Incorporated.
Intergraph Raster File Formats - Copyright - 1994 Intergraph Corporation. Used with permission.
Copyright
© 1995-2016 Arttu Soininen, Terrasolid. All rights reserved.
Acknowledgements
The picture on the cover was created from a design file provided as a courtesy of Soil and Water Ltd, Itälahdenkatu 2, 00210 Helsinki, Finland. The design file was created from an aerial photograph using TerraSurvey and TerraModeler.

Page 3
Table of Contents
Getting Started1 Documentation................................................................................................ 9
About the documentation...................................................................... 9Accessing the documentation online .................................................... 9Document conventions ......................................................................... 9MicroStation documentation ................................................................ 9
2 Introduction to TerraModeler .................................................................... 10Introduction ........................................................................................ 10Terra application family ..................................................................... 11
3 Installation .................................................................................................... 12Hardware and software requirements ................................................. 12Installation media ............................................................................... 12Installation from zip file ..................................................................... 13Installation from CD/USB-Stick ........................................................ 13
4 Starting TerraModeler ................................................................................ 15Start TerraModeler ............................................................................. 15Unload TerraModeler ......................................................................... 16
Tutorial5 Tutorial.......................................................................................................... 18
TerraModeler interface ....................................................................... 18Opening an example design file ......................................................... 18Starting TerraModeler ........................................................................ 18Creating a surface model .................................................................... 19Viewing surface statistics ................................................................... 20Viewing triangulation ......................................................................... 20Placing elements on surface elevation................................................ 21Calculating slopes............................................................................... 21Creating a design surface.................................................................... 23Computing excavation quantities ....................................................... 24Displaying a colored grid ................................................................... 26Drawing a profile................................................................................ 27
Tool Reference6 General Tools................................................................................................ 29
General tool box............................................................................................ 29Settings ............................................................................................... 30Define Coordinate Setup .................................................................... 45Set Scale ............................................................................................. 47Surfaces .............................................................................................. 47Save Surfaces...................................................................................... 48About TerraModeler ........................................................................... 48Help On TerraModeler ....................................................................... 48
Page 4
7 Creating Surface Models ............................................................................. 49
Create Surfaces tool box ............................................................................... 49Triangulate Survey ............................................................................. 50Triangulate View ................................................................................ 52Triangulate Elements .......................................................................... 53Insert Random Elements..................................................................... 56Insert Breakline Element .................................................................... 57Triangulate Multiple Sources ............................................................. 58Rebuild Models................................................................................... 60
8 Drawing Elements ........................................................................................ 61
Draw using Surface tool box......................................................................... 61View Elevation ................................................................................... 62Compare Elevations............................................................................ 63View Slope ......................................................................................... 63Drop Element On Surface................................................................... 64Calculate Slope ................................................................................... 66Fill Area With Cells............................................................................ 67
Drawing Utilities tool box ............................................................................ 69Measure Slope .................................................................................... 70Label Elevation................................................................................... 71Label Area .......................................................................................... 71Place Sloped Line ............................................................................... 72Force Downstream Flow .................................................................... 72Set Linear Elevation ........................................................................... 73Thin Linear Element ........................................................................... 74Densify Linear Element...................................................................... 74Connect Linear Elements.................................................................... 75Copy Linear Element.......................................................................... 76Alignment Offset ................................................................................ 78Validate Linear Elements ................................................................... 79Fix Touching Elements....................................................................... 82Read Piles From File .......................................................................... 83
9 Editing Surface Models................................................................................ 85
Edit Point tool box ........................................................................................ 85Construct Breakline ............................................................................ 86Insert Point Along Breakline .............................................................. 87Insert Point.......................................................................................... 88Move Point ......................................................................................... 89Remove Point ..................................................................................... 90Exclude Triangle................................................................................. 91
Edit Area tool box......................................................................................... 93Flatten Area ........................................................................................ 94Move Area .......................................................................................... 95Drop Area ........................................................................................... 96Exclude Area ...................................................................................... 97Insert Hole Element ............................................................................ 98Remove Area ...................................................................................... 99
10 Generating Displays ................................................................................. 100
Display Surface tool box............................................................................. 100Display Contours .............................................................................. 103Display Triangles.............................................................................. 110

Page 5
Display Grid ..................................................................................... 112Display Elevation Texts.................................................................... 113Display Slopes .................................................................................. 116Display Shaded Surface.................................................................... 118Update Displays................................................................................ 120Erase Display .................................................................................... 120Display Boundary ............................................................................. 121Label Peaks and Pits ......................................................................... 122
Display Regions tool box............................................................................ 123Display Drainage .............................................................................. 124Display Themes ................................................................................ 126Display Region Triangles ................................................................. 128Display Raster Triangles .................................................................. 129
11 Drawing Profiles....................................................................................... 130
Profiles tool box.......................................................................................... 130Draw Section View........................................................................... 131Draw Profile ..................................................................................... 133Draw Alignment Sections................................................................. 137Update Profile................................................................................... 140Setup Automatic Sections................................................................. 141Project Into Profile............................................................................ 142Project From Profile ......................................................................... 143Label Profile Elevations ................................................................... 144Output Profile Elevations ................................................................. 146Output Section Elevations ................................................................ 148
12 Computing Quantities.............................................................................. 151
Quantity tool box ........................................................................................ 151Compute Quantity............................................................................. 152Compute Prismoidal Quantity .......................................................... 156Compute Alignment Quantity .......................................................... 157Define Section Templates................................................................. 160Compute Section Quantity................................................................ 162Compute Tunnel Volume ................................................................. 166Draw Surface Intersection ................................................................ 168Compute Area................................................................................... 169
13 Using Domains .......................................................................................... 170
Domains tool box........................................................................................ 170Define Domains ................................................................................ 171Domain View.................................................................................... 173Set Area Domain .............................................................................. 173Set Domain Between Lines .............................................................. 174Set Triangle Domain......................................................................... 175Display Domain Triangles................................................................ 176
14 Placing Single Display Elements ............................................................. 177
Display Single tool box............................................................................... 177Place Contour ................................................................................... 178Place Elevation Text ......................................................................... 179Place Slope Arrow ............................................................................ 180Modify Contour Symbology............................................................. 181

Page 6
15 Using Regions ........................................................................................... 182
Regions tool box ......................................................................................... 182Regions ............................................................................................. 183Create Region ................................................................................... 186Delete Region ................................................................................... 188Edit Region Info ............................................................................... 189Move Region Center......................................................................... 190Update Regions................................................................................. 190
16 Managing Surfaces................................................................................... 191
File pulldown menu .................................................................................... 192File / New surface............................................................................. 193File / Open surface............................................................................ 193File / Close surface ........................................................................... 194File / Save surface............................................................................. 195File / Open reference ........................................................................ 196File / Import ...................................................................................... 196File / Export ...................................................................................... 196File / Restore from file...................................................................... 197File / User settings ............................................................................ 197File / Exit .......................................................................................... 197
Edit pulldown menu.................................................................................... 198Edit / Modify settings ....................................................................... 199Edit / Profile settings ........................................................................ 199Edit / Exclude long triangles ............................................................ 200Edit / Modify elevations ................................................................... 201Edit / Thin ......................................................................................... 202Edit / Compress ................................................................................ 203Edit / Add inferred points ................................................................. 204Edit / Delete surface ......................................................................... 205
Utility pulldown menu ................................................................................ 206Utility / View statistics ..................................................................... 207Utility / Copy surface ....................................................................... 208Utility / Merge surfaces .................................................................... 209Utility / Subtract surfaces ................................................................. 211Utility / Statistical model .................................................................. 212Utility / Output control report........................................................... 214Utility / Produce contours................................................................. 216Utility / Produce lattice models ........................................................ 219Utility / Produce triangles................................................................. 223Utility / Lattice database................................................................... 226
Tools pulldown menu ................................................................................. 227
View pulldown menu.................................................................................. 228View / Fields..................................................................................... 229View / Sort by................................................................................... 229
Help pulldown menu................................................................................... 230Help / Contents ................................................................................. 230
17 Importing and Exporting Data ............................................................... 231Import / XYZ text file....................................................................... 232Import / XYZ binary file .................................................................. 234Import / Lattice file........................................................................... 235Import / Triangles ............................................................................. 236

Page 7
Export / Xyz text file ........................................................................ 237Export / Triangle text file ................................................................. 238Export / Lattice file........................................................................... 239Export / Raster image ....................................................................... 242Export / Graphical elements ............................................................. 245
18 Lattice Database ....................................................................................... 246Lattice database / Draw boundaries.................................................. 247Viewing lattice database elevation ................................................... 247Lattice database / Draw contours...................................................... 248Lattice database / Import fence contents .......................................... 249
19 Flood Mapping ......................................................................................... 250
Flood Mapping tool box.............................................................................. 250Import River Sections ....................................................................... 251Edit River Sections ........................................................................... 252Export River Sections ....................................................................... 259Input Water Elevations ..................................................................... 260Draw River Section Boundaries ....................................................... 261Display Flood ................................................................................... 262
20 Lifting 2D Contours ................................................................................. 264
2D Contours tool box.................................................................................. 264Lift 2D Contours............................................................................... 265Set Contour Elevation....................................................................... 267Check Linear Elevations................................................................... 268
Programming Interface21 MDL Public Functions............................................................................. 270
Calling Method ................................................................................. 271Function Prototypes .......................................................................... 272Triangulate Survey ........................................................................... 281
22 TIN File Format Specification ................................................................ 283File Organization .............................................................................. 283C Structure Definitions ..................................................................... 286
Additional Information23 Installation Directories ............................................................................ 288
24 Configuration Variables .......................................................................... 289

Getting Started

Page 91 Documentation
1 Documentation
About the documentationThis document serves as a user's guide for two 32-bit versions of TerraModeler. The entry-level version, TerraModeler Lite, is functionally a subset of the full version, TerraModeler. Tools available in TerraModeler and TerraModeler Lite work identically in the two versions. Tools that are not available in TerraModeler Lite are marked as "Not Lite" in the documentation.
This User's Guide is divided into several parts:
• Getting Started - general information about TerraModeler and instructions on how to install and run the application.
• Tutorial - lessons in order to introduce the basic concepts and some of the most common tools in the application.
• Tool Reference - detailed descriptions of all the tools and menu commands in TerraModeler.• Programming Interface - a list of public functions as well as a description of file formats.• Additional Information - information about the installation configuration.
Accessing the documentation onlineThe documentation is accessible as an Acrobat Reader PDF document which serves the role of online help. Accessing the electronic format of the documentation has the following advantages:
• You can conduct automated searches for keywords in topic names or body text.• You can click hypertext to "jump" to related topics.
Document conventionsThe following conventions and symbols appear in this guide:
• Data click - mouse click with the data mouse button, usually the left button on a right-hand mouse.
• Reset click - mouse click with the reset mouse button, usually the right button on a right-hand mouse.
• < > - angle brackets used for keyboard keys, for example, <Return>.• Key in - input a command in the key-in line of MicroStation and then press <Return>.• OR - alternate procedures or steps in a procedure.• C:/TERRA - paths to directories of files on a hard disk are written with capital letters.• Icons used to specify special information:
• When no distinction between MicroStation versions is necessary, this document refers to the CAD environment simply as "MicroStation".
MicroStation documentationThis document is written under the assumption that the reader knows how to use basic MicroStation features. You should refer to the printed documentation or on-line help of MicroStation whenever you need information about using the CAD environment.
Icon: Appears next to:Notes and HintsProcedures

Page 102 Introduction to TerraModeler
2 Introduction to TerraModeler
IntroductionTerraModeler is a terrain modeling application built on top of MicroStation. It enables the creation of triangulated models of ground, soil layers, or design surfaces. The models can be created based on survey data, graphical elements, XYZ text files, or laser points loaded in TerraScan or stored in LAS or TerraScan binary formats.
Theoretically, TerraModeler can handle an unlimited number of different surfaces in the same design file. In practice, however, the number and size of loaded models as well as the performance of TerraModeler and MicroStation depend on the RAM of the computer.
You can edit any of the surface models interactively. Editing options include add, move or delete individual points; move, drop, or flatten all the points inside a fence; construct breaklines, and add new elements to the models.
Surface models can be used, for example, as a design aid. You can place elements on the elevation of the surface model or drop existing elements to follow the surface.
Profile generation in TerraModeler includes separate tools for drawing 3D section views, profiles and alignment cross sections, or tunnel sections. Additionally, 3D elements can be projected into a profile and elements drawn in a profile can be projected back to their true 3D positions.
Surface model visualization can be done by generating contours, drawing colored triangles, shaded surfaces, colored grid displays, slope arrows, and numerical representations of elevation points. All of these visualisation displays can be updated after you have made modifications to a surface model.
Tools for quantity computation can be utilized to calculate and report the volume between two surfaces and/or based on tunnel or trench sections. The area of computation can be limited to take place only inside a fence.
While many tools in TerraModeler are suited for traditional survey data types, TerraModeler can also work with laser points because it is tightly integrated with TerraScan. Laser data loaded in TerraScan can be used to create a surface model in TerraModeler. This is especially useful for ground classification verification because the surface model is updated automatically according to point class changes as long as the surface model is linked with the laser data. In addition, laser points can be used directly for quantity computations.
The full version of TerraModeler includes tools for producing lattice models, triangles, and contour lines in batch processes for large project areas. The processes can produce the output files based on laser points organized in a TerraScan project. Additionally, breaklines can be included in the contour line/lattice model/triangle creation.

Page 112 Introduction to TerraModeler
Terra application familyTerraModeler is just one in a full family of civil engineering applications. Almost all Terra applications are tightly integrated with MicroStation presenting an easy-to-use graphical interface to the user.
TerraBore is a solution for reading in, editing, storing and displaying bore hole data. You can triangulate soil layers with the help of TerraModeler.
TerraMatch fixes mismatches between laser points from different data strips automatically. It can be used for the calibration of a laser scanner system and for fixing project data.
TerraPhoto rectifies digital photographs taken during laser scanning survey campaigns and produces orthorectified images.
TerraPipe is used for designing underground pipes. It gives you powerful tools for designing networks of drainage, sewer, potable water, or irrigation pipes.
TerraScan processes laser scanning data. It reads in laser points from text or binary files and lets you view the point cloud three dimensionally, classify the data, and create vector data based on the points.
TerraSlave is a stand-alone application that processes TerraScan macros. It enables distributed processing and scheduling tasks to gain optimal time and working performance.
TerraStereo is a stand-alone application for viewing very large point clouds in mono and stereo mode. It utilizes advanced point rendering techniques and the graphics card memory in order to display huge amounts of points.
TerraStreet is an application for street design. It includes all the terrain modeling capabilities of TerraModeler. The street design process starts with the creation of horizontal and vertical geometries for street alignments.
TerraSurvey reads in traditional survey data and creates a three dimensional survey drawing. The application recognizes a number of survey data formats automatically.

Page 123 Installation
3 Installation
Hardware and software requirementsTerraModeler is built on top of MicroStation. You must have a computer system capable of running this CAD software.
To run TerraModeler, you must have the following:
• Pentium or higher processor• Windows 8, 7, Vista, XP, or 2000 (64-bit version recommended)• mouse• 1024*768 resolution display or better• 1 GB RAM or better• MicroStation V8, MicroStation V8i (Select Series 2 or higher) or Map PowerView. Check
Terrasolid’s web pages for a more detailed overview of compatible MicroStation versions.
The installation of TerraModeler requires about 5 MB of free hard disk space.
Installation mediaTerraModeler may be delivered on a CD/USB-Stick or as a zip file.
A zip package only contains the actual software - it does not include the PDF User’s Guide.
A Terra Installation CD/USB-Stick includes the software and the online documentation. When you install from the CD/USB-Stick, the software and the documentation are copied to your hard disk. The CD/USB-Stick may include versions for multiple environments. You should locate the directory which corresponds to your operating system and MicroStation version.
Directory on CD/USB For operating system For MicroStation\setup\eng Windows V8 or V8i

Page 133 Installation
Installation from zip fileTo install TerraModeler from a zip file:
1. Unpack the zip archive with any zip file manager.2. Start SETUP.EXE which is part of the zip archive.
This may open a dialog confirming the execution of SETUP.EXE and/or prompting for the administrator password.
The installation program needs to know where MicroStation has been installed. It automatically searches all local hard disks to find the MicroStation directory.
The installation dialog opens:
3. Enter the directory where to install TerraModeler.
The default path is C:\TERRA. You may change this to another location. The specified directory is created automatically if it does not exist.
4. Check the MicroStation directory. Replace the path if the correct location was not found automatically.
5. Click OK to start the installation.
When the installation is finished, a message is displayed.
See chapters Installation Directories on page 288 and Configuration Variables on page 289 for more information.
Installation from CD/USB-StickTo install TerraModeler from CD/USB-Stick:
1. Insert the Terra Installation CD/USB-Stick.2. Locate the correct directory which corresponds to your computer configuration.3. Start SETUP.EXE from that directory.
The installation program tries to determine where MicroStation has been installed and opens the Terra Setup dialog:

Page 143 Installation
4. Enter the directory where to install the application(s).
The default path is C:\TERRA. You can change this to another location. The specified directory is created automatically, if it does not exist.
5. Check the MicroStation directory. Replace the path if the correct location was not found automatically.
Alternatively, you can use the Scan button to automatically search the hard disk for the MicroStation installation or you can use the Browse button to locate the MicroStation executable yourself.
6. Check the MicroStation version information in the Version field. Select the correct version if it was not detected automatically.
7. Click OK to continue.
This opens another Terra Setup dialog:
8. Check TerraModeler for MicroStation item in the dialog.
You may select other applications as well for which you have installation files.
9. Click OK to start the installation.
A message is displayed when the installation is finished.
See chapters Installation Directories on page 288 and Configuration Variables on page 289 for more information.

Page 154 Starting TerraModeler
4 Starting TerraModeler
Start TerraModelerTerraModeler is an MDL application that runs on top of MicroStation.
To start TerraModeler:
1. Select MDL Applications command from the Utilities menu in MicroStation.
The MDL dialog opens:
2. In the Available Applications list, select TMODEL.3. Click on the Load button.
OR
1. Key in MDL LOAD TMODEL.
The user settings determine what menus and tool boxes are opened during startup. See Operation category in TerraModeler Settings for more information. By default, TerraModeler adds an Applications menu to MicroStation’s menu bar and opens the TerraModeler Main tool box:
The Available Applications list shows all MDL applications that MicroStation is able to locate. MicroStation searches for MDL applications in the directories listed in the MS_MDLAPPS configuration variable. If MicroStation can not find TMODEL.MA, you should check the value assigned to this configuration variable. Make sure the directory path of the TMODEL.MA file is included in the variable. To view configuration variables, select Configuration command from the Workspace menu in MicroStation. See also Sections Installation Directories on page 288 and Configuration Variables on page 289 for more information.

Unload TerraModelerTerraModeler is unloaded automatically when you exit MicroStation. Sometimes you may want to unload the application while continuing to work with MicroStation. This frees up the memory reserved by TerraModeler.
To unload TerraModeler:
1. Select MDL Applications command from the Utilities menu in MicroStation.
The MDL dialog opens:
2. In the Loaded Applications list, select TMODEL.3. Click on the Unload button.
OR
1. Key in MDL UNLOAD TMODEL.
OR
1. Close TerraModeler's Main tool box.
This unloads the application, if the corresponding user setting is on. See Operation category in TerraModeler Settings for more information.

Page 174 Starting TerraModeler
Tutorial

Page 185 Tutorial
5 TutorialThis tutorial introduces some basic concepts and terminology used by TerraModeler. With the help of an example design file, you are guided through a number of exercises using some of the features in the software. The tutorial assumes that you are already familiar with basic viewing and drawing tools in MicroStation.
TerraModeler interface
The user interface of TerraModeler is very similar to that of MicroStation. When you load TerraModeler, it opens its Main tool box. All TerraModeler tools are located in this tool box, which is actually a parent of 13 children tool boxes. These children tool boxes can be dragged out from the Main tool box. They contain icons representing the individual tools. To activate a tool, click the tool icon.
You can control the operation of a tool with tool settings. These are control fields affecting the operation of that specific tool. Most of the tools display their settings in a separate dialog where you can enter the appropriate values.
Opening an example design file
This tutorial uses an example design file that is installed with TerraModeler. This example file has been provided by courtesy of Soil and Water Ltd, a company with expertise in many fields of civil engineering. The design file was created from an aerial photograph using TerraSurvey.
To open the example design file:
1. Select Open command from the File menu in MicroStation.
The Open Design File dialog opens.
2. Locate the MODEL.DGN file by browsing your computer’s directory structure.
If you installed TerraModeler in the default directory C:\TERRA, you can find the design file in C:\TERRA\EXAMPLE\MODEL.DGN.
3. Select MODEL.DGN and click OK.
After opening the design file, you can take a closer look at it. View 1 has been fitted to show all the elements in the design. You can rotate this view or zoom in to see smaller details.
Starting TerraModeler
Start TerraModeler as described in Section Starting TerraModeler on page 15.

Page 195 Tutorial
Creating a surface model
TerraModeler can create a surface model from a number of data sources. The best tool to use depends on the source and format of the data:
To create a surface model in the example design file:
1. Bring view 2 in front of the other views.
This view displays only selected levels in the design file. Elements that do not reside on the ground elevation have been hidden by switching off their levels.
2. Select Triangulate View tool from the Create Surfaces tool box.3. Identify view 2.
The Triangulate surface dialog opens:
4. Click OK.
The Surface settings dialog opens:
5. Enter Ground as the surface name.6. Click OK.
TerraModeler processes the information. A progress bar shows the progress of the process.
Data source: Use tool:Survey data Triangulate Survey after reading in the survey data with
TerraSurvey. Design file elements Triangulate View or Triangulate Elements.XYZ text file Surfaces tool opens a window for managing surfaces. The File
pulldown menu in this window has a command for importing xyz text files.

Page 205 Tutorial
Viewing surface statistics
You just created your first surface model with TerraModeler. The model exists in two types of memory. It has been saved to a binary file on the hard disk for permanent storage. When you work with TerraModeler, the surface model is also loaded in the RAM of your computer.
You can use the Surfaces tool to view information about loaded surfaces.
To view surface statistics:
1. Select Surfaces tool from the General tool box.
The Surfaces window opens showing a list of loaded surfaces. Select Ground, if it is not selected already.
2. Select View statistics from the Utility menu.
The Surface statistics dialog opens:
The dialog shows the internal ID of the surface model, the number of points and triangles, and the ranges of easting, northing, and elevation coordinates.
3. Click OK after reviewing the statistics.
Viewing triangulation
TerraModeler creates surface models by triangulation. This means that the application creates a network of triangles connecting the points in the model. The network is constructed in a way that there is one triangle at every XY location inside the surface area. Thus, in a surface model every XY location has one and only one elevation value.
To view the triangulation:
1. Zoom in on a position in view 2 inside the surveyed area.2. Select Exclude Triangle tool from the Edit Point tool box.
This tool can be used to excluding or including triangles. In TerraModeler’s terminology, to exclude a triangle means to mark it as invalid or unknown.
This tool can also be used just to view the triangulation.
3. Move the mouse inside view 2. As you move the mouse, TerraModeler displays the triangle at the mouse pointer position.

Page 215 Tutorial
Placing elements on surface elevation
A surface model can be used as a design aid. TerraModeler makes it easy to place elements at the elevation of a surface. You may use this capability, for example, to place items such as manholes, trees, or shrubs on the ground elevation.
To place elements on surface elevation:
1. Select View Elevation tool from the Draw tool box.
The View elevation dialog opens:
As you move the mouse, the dialog dynamically displays the elevation value of the selected Surface at the mouse pointer position.
2. Set Points on surface lock on.3. Start drawing an element using any MicroStation tool for drawing elements. Feel free to
experiment with by drawing some lines, shapes, or placing a few cells.
The elements are drawn as 3D elements using the elevation value from the Ground surface.
When Points on surface lock is on, TerraModeler calculates the elevation for all data points entered in a top view inside the surface area. Therefore, be sure to turn the lock off if you do not want to use it any longer.
Calculating slopes
When designing new construction surfaces, you may need to create a slope onto an existing surface. Calculate Slope tool supports this task. As a first step, you have to create a graphical element representing the upper or lower edge of a slope. The example design file has a suitable element for this purpose. It is a green shape element that represents the bottom of a flat rectangular excavation at elevation +29.50.
To locate the shape element:
1. Bring view 4 in front of all other views.
The view displays only the green shape element on level 56.
To calculate a slope upwards to the ground surface:
1. Select yellow as the active color.2. Select the Calculate Slope tool.
This opens the Slope dialog:
Page 225 Tutorial
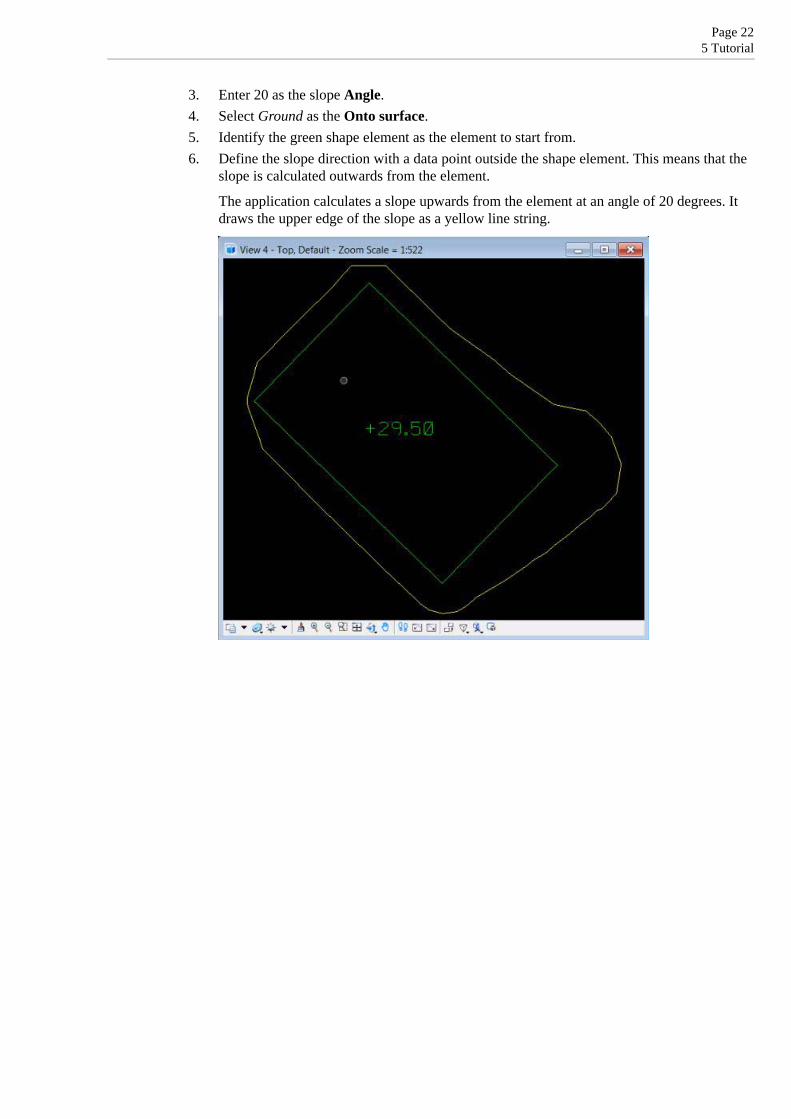
3. Enter 20 as the slope Angle.4. Select Ground as the Onto surface.5. Identify the green shape element as the element to start from.6. Define the slope direction with a data point outside the shape element. This means that the
slope is calculated outwards from the element.
The application calculates a slope upwards from the element at an angle of 20 degrees. It draws the upper edge of the slope as a yellow line string.

Page 235 Tutorial
Creating a design surface
TerraModeler can be used to create design surfaces for earthworks projects. The best approach is to first create graphical elements representing the shape of the design surface. This is exactly what you did in the previous step with the Calculate Slope tool. You can now use the green shape element and the yellow slope element to create a new design surface.
To create a design surface:
1. Select the elements in view 4.
Your selection set should include the green shape element and the yellow line string representing the upper slope edge.
2. Select Insert Breakline Element tool from the Create Surfaces tool box.
This opens the Insert Breakline Element dialog:
3. Select New surface as the Surface to insert points into and Type as Hard breakline.4. Switch Generate points along breakline on and enter 10.0 into the Every field.
This setting generates new points along a long breakline if the distance between two breakline points is longer than 10 meters.
5. Accept the elements.
This opens the Triangulate surface dialog.
6. Accept default settings by clicking OK which in turn opens the Surface settings dialog:
7. Select Plan in the Type field.8. Enter Plan as the surface Name.9. Click OK.
TerraModeler creates a new surface using the vertices of the selected elements.

Page 245 Tutorial
Computing excavation quantities
You have now two surface models. The first one, Ground, is based on survey information. The second one, Plan, is a design model of a planned excavation with slopes onto the ground surface.
You are ready to compute excavation quantities using the Compute Quantity tool. It computes the volume between two surfaces and produces results summing up both, cut and fill volumes. The calculation is based on a grid method.
To compute excavation quantities:
1. Select Compute Quantity tool from the Quantity tool box.
The Compute Quantity dialog opens:
2. Select Ground as the Upper surface.3. Select Plan as the Lower surface.4. Enter 1.0 as the Step value.5. Make sure that Draw temporarily or Write to file (MicroStation V8i) is selected as the
Display option and Vertical lines as Draw as option.6. Click on the Calculate button to start computation.
The application starts calculating the volume between the two surfaces. It displays the progress of the calculation as vertical linear elements. The color of each line indicates if that grid position results in cut or fill volume.
When the calculation is finished, check the results. TerraModeler reports about 7951 cubic meters of cut volume and about 36 cubic meters of fill volume. The cut volume is a correct value. The fill volume, however, is something you may want to take a closer look at.
When TerraModeler creates a surface model, the triangulated area is a concave polygon which encloses all the points in the model. To control the actual area that should be covered by the model, you can exclude some of unnecessary triangles on the outer boundaries.
When you create a surface with tools in TerraModeler, the application can automatically exclude narrow, long triangles from the outer boundaries. The same task can be done later by modifying an existing surface model.
In our excavation example, you may decide simply to ignore the fill volume reported by the Compute Quantity tool as you know for sure that the fill volume should be zero. Alternatively, you may decide to exclude the extra triangles in the Plan surface model.

Page 255 Tutorial
To exclude triangles from the excavation automatically:
1. Select Surfaces tool from General tool box.
The Surfaces window opens showing a list of loaded surfaces. Select Plan if it is not selected already.
2. Select Edit / Exclude long triangles.
The Exclude long triangles dialog opens:
3. Enter 12.0 as the Maximum length for outer boundary triangles.4. Click OK.
To exclude triangles manually:
1. Select Exclude Triangle tool from the Edit Point tool box.2. Select Plan as the active surface in the tool’s dialog.3. Enter a data click inside each of the triangles to exclude.
After excluding the extra triangles, you may recalculate the excavation quantities as described above.

Page 265 Tutorial
Displaying a colored grid
A surface model is often used for visualization purposes. TerraModeler is able to display a surface model with several display method.
To display a colored grid:
1. Select Display Grid tool from the Display Surface tool box.
The Display grid dialog opens:
2. Select Ground in the Surface field and Display only in the Mode field.3. Enter 10.0 in the Grid size field.4. Click on the Colors button to define a coloring scheme.
The Coloring scheme dialog opens:
5. Select Open command from the File menu to load a coloring scheme from a file.6. Locate and open MODEL.CLR file.
If you installed TerraModeler in the default directory C:\TERRA, you can find this file in C:\TERRA\EXAMPLE\MODEL.CLR.
7. Click OK to close the Coloring scheme dialog.8. Click OK to close the Display grid dialog.
TerraModeler draws a colored grid. To view the grid, use view controls to change the rotation angle and to zoom in or out. Use view 2 for displaying the grid.

Page 275 Tutorial
Make sure the level used in displaying the grid is switched on in view 2. The default level is 51. You may also switch off the Clip Front and Clip Back options in the View Attributes dialog for view 2.
The grid was drawn in Display only mode. This means that TerraModeler did not write the grid into the design file. The grid is erased when you unload TerraModeler or exit MicroStation. Alternatively, you can erase the grid with Erase Display tool.
Drawing a profile
You can create a profile along any linear element. The profile shows the shape of surface models along the alignment element. A profile is drawn as a cell element that can be freely positioned anywhere in the design file.
To create an alignment element:
1. Make an empty level the active level in MicroStation.2. Place a line string element that runs across or inside the ground surface model using the
Place Line String tool in MicroStation.
To draw a profile:
1. Select the Draw Profile tool.2. Identify the alignment element you just created and accept the highlighted element.
The Draw profile dialog opens:
3. Define settings in the dialog.4. Click on the Surfaces button and select Ground as the only surface for being drawn in
profiles in the Profile surfaces dialog.5. Click on the Labels button and define settings in the Profile labels dialog.6. Enter a data point to position the profile cell. It is a good idea to position the profile outside
the surveyed site in order to avoid overlap with any existing elements.

Page 285 Tutorial
Tool Reference

Page 296 General Tools
6 General Tools
General tool boxThe tools in the General tool box are used to define user settings, to set intended plotting scale, to manage surfaces, to save surface models, to view and send license information, and to access the on-line help.
To: Use:
Change user settings Settings
Define coordinate range and resolution Define Coordinate Setup
Set intended plotting scale / rescale elements Set Scale
Manage surfaces Surfaces
Save all modified surface models Save Surfaces
View information about TerraModeler About TerraModeler
View on-line help Help On TerraModeler

Settings
Settings tool lets you change a number of settings that control how TerraModeler works. Selecting this tool opens the TerraModeler settings window.
The settings are grouped into logical categories. Selecting a category in the list displays the appropriate controls to the right of the category list.
Cross sections / Elevation grid categoryElevation grid category in Cross sections folder defines the symbology of elevation grid range lines and labels in cross sections.
Cross sections / Elevation labels categoryElevation labels category in Cross sections folder defines the symbology of elevation labels in cross sections.
Setting: Effect:Style Defines the line style of range lines. Uses MicroStation line styles.Weight Defines the line weight of range lines. Uses MicroStation line
weights.Font Font type of elevation grid labels.Size Text size of elevation grid range labels. Given in millimeters on paper.On side Defines the location of labels of range elevations: on the Left, on the
Right, or on Both sides of the range.
Setting: Effect:Font Font type of elevation labels. Uses font types available in
MicroStation.Size Text size of elevation labels. Given in millimeters on paper.Direction Text rotation: horizontal or vertical.Digits Number of full-number digits in elevation labels.Decimals Number of decimals in elevation labels.

Cross sections / Offset labels categoryOffset labels category in Cross sections folder defines the symbology of offset labels in cross sections.
Cross sections / Placement categoryPlacement category in Cross sections folder defines how Draw Alignment Sections tool groups the cross sections for the display..
Display tools / Color scheme legendsColor scheme legends category in Display tools folder defines the size and the symbology of color scheme legend bars, boundaries, and labels.
Color Text and note line color for binding elevation labels. Uses the active color table in MicroStation.
Setting: Effect:Font Font type of offset labels. Uses font types available in MicroStation.Size Text size of offset labels. Given in millimeters on paper.Color Color of offset labels. Uses the active color table in MicroStation.Direction Text rotation: horizontal or vertical.Show sign in offsets If on, the plus sign is displayed for positive and the minus sign for
negative offset label values.
Setting: Effect:Rows Defines how many cross sections to draw on top of each other.Order Order of cross sections in a group:
• First one at the bottom - station values increase upwards.• First one at the top - station values increase downwards.
X spacing Defines the spacing between cross sections in X direction (between cross section columns).
Y spacing Defines the spacing between cross sections in Y direction (between cross section rows).
Setting: Effect:Scale Method for scaling the color bar height:
• Fixed - every color occupies the same height in the bar. You can define the height of one color as millimeters on paper.
• Relative - height of a color is relative to its elevation or slope interval. You can define the height of the whole bar.
Height Height of one color in the color bar or of the whole color bar. This depends on the setting for Scale described above. Given in millimeters on paper.
Width Color bar width in millimeters on paper.Draw border If on, an outer border line is drawn around the color bar using the
given Border color and line weight.Draw boundary lines If on, each color of the color bar is surrounded by a boundary line
using the given Boundary color and line weight.Symbology Color and line weight of boundary labels of color schemes. Uses
MicroStation colors and line weights.
Setting: Effect:

Page 326 General Tools
Display tools / Contours categoryContours category in Display tools folder defines the default symbology of contour line labels.
Display tools / Display Shaded Surface categoryDisplay Shaded Surface category in Display tools folder defines default settings for the shaded surface display mode.
Drawing utilities / Label Area categoryLabel Area category in Drawing utilities folder defines the format and the symbology of area labels which Label Area tool creates.
Drawing utilities / Label Elevation categoryLabel Elevation category in Drawing utilities folder defines the format and the symbology of elevation labels which Label Elevation tool creates.
Font Font type of color scheme labels. Uses font types available in MicroStation.
Size Text size of color scheme labels. Given in millimeters on paper.
Setting: Effect:Font Font type of contour labels. Uses font types available in
MicroStation.Size Text size of contour labels. Given in millimeters on paper.Style Line style of contour line labels. Uses MicroStation line styles.Weight Line weight of contour line labels. Uses MicroStation line weights.
Setting: Effect:Sun azimuth Azimuth angle of the sun. North direction is defined as 0 degree,
angle values increase clockwise.Sun angle Angle of the sun above the horizon.Color cycles Number of color cycles. Use zero to create a gray scale display
showing triangle slope only.Views Views for displaying the shaded surface.
Setting: Effect:Font Font type of area text elements. Uses font types available in
MicroStation.Size Text size of area labels. Given in millimeters on paper.Accuracy Number of decimals and unit for area labels.2D area label prefix/suffix Prefix/Suffix that is added to the area label of 2D areas.3D area label prefix/suffix Prefix/Suffix that is added to the area label of 3D areas.
Setting: Effect:Position Position of the label related to the guiding line: Above line,
Extending from line, or Below line.Font Font type of elevation label text elements. Uses font types
available in MicroStation.Size Text size of elevation label texts. Given in millimeters on paper.
Setting: Effect:

Page 336 General Tools
Drawing utilities / Measure Slope categoryMeasure Slope category in Drawing utilities folder defines the symbology of labels which Measure Slope tool creates.
Place Slope Arrow / Arrows categoryArrows category in Place Slope Arrow folder defines the length and the design of arrows drawn by Place Slope Arrow tool.
Place Slope Arrow / Labels categoryLabels category in Place Slope Arrow folder defines the format and the symbology of labels drawn by Place Slope Arrow tool.
Accuracy Number of decimals of elevation labels.Display plus If on, the plus sign is displayed for positive elevations.Display minus If on, the minus sign is displayed for negative elevations.
Setting: Effect:Font Font type of slope measurement labels. Uses font types
available in MicroStation.Size Text size of slope measurement labels. Given in millimeters on
paper. Color Color of slope measurement labels. Uses the active color table
in MicroStation.Style Line style of slope measurement labels. Uses MicroStation line
styles.Weight Line weight of slope measurement labels. Uses MicroStation
line weights.
Setting: Effect:Place by Placement point of a slope arrow: Arrow start or Arrow center.Arrowheads Number of arrowheads in a slope arrow:
• One - all arrows have one arrowhead.• One to three - number of arrowheads depends on the slope.
Length Two fields specifying the maximum and the minimum length of a slope arrow. Given in millimeters on paper.
Slope Slope values at which the arrow length is equal to:- maximum length- two thirds of maximum length- one third of maximum length- minimum length
Setting: Effect:Write slope label If on, a text label is placed along a slope arrow.Level Level number in the MicroStation design file on which the arrow label
is placed.Font Font type of slope arrow labels. Uses font types available in
MicroStation.Size Text size of slope arrow labels. Given in millimeters on paper. Accuracy Number of decimals of the slope arrow label.
Setting: Effect:

Page 346 General Tools
Profiles / Elevation grid categoryElevation grid category in Profiles folder defines the symbology of elevation grid lines and labels in profiles.
Profiles / Labels categoryLabels category in Profiles folder defines the format of station and elevation labels in profiles.
Profiles / Layouts categoryLayouts category in Profiles folder displays a list of user defined profile layouts. Each layout definition contains a list of data rows that appear below the profile.
You can edit existing layouts by using the Edit button in the Settings dialog. This opens the Profile layout dialog which shows data rows defined for this layout. The dialog lets you add, edit, or delete existing data rows for a profile layout.
You can delete existing layouts by using the Delete button in the Settings dialog. The Copy button creates an identical copy of a selected layout definition.
To define a new profile layout:
1. Open the Layouts category in the Profiles folder.2. Click Add in the Settings dialog.
The Profile layout dialog opens.
3. Type a Name for the profile layout.
Symbology Color and line weight of slope arrow labels. Uses MicroStation colors and line weights.
Setting: Effect:Style Line style of grid lines. Uses MicroStation line styles.Weight Line weight of grid lines. Uses MicroStation line weights.Extend left Defines how long grid lines are extended over the left boundary of the
profile. Given in millimeters on paper.Extend right Defines how long grid lines are extended over the right boundary of
the profile. Given in millimeters on paper.Font Font type of elevation grid labels in profiles. Uses font types available
in MicroStation.Size Text size of elevation grid labels in profiles. Given in millimeters on
paper.On side Defines the location of grid labels: on the Left, on the Right, or on
Both sides of the profile.
Setting: Effect:Font Font type of profile labels. Uses font types available in
MicroStation.Size Text size of profile labels. Given in millimeters on paper.Color Text color of station labels. Uses the active color table in
MicroStation.Direction Text rotation of station labels: horizontal or vertical.Digits Number of full-number digits of elevation labels.Decimals Number of decimals of elevation labels.
Setting: Effect:

Page 356 General Tools
4. Click Add in the Profiles layout dialog in order to add a new data row that is displayed below a profile.
The Bottom row dialog opens:
5. Define basic information settings.6. Select an auto-text option for the Content list as well as additional settings depending on
the content selection. Choose Other as Content if nothing of the list entries fit to your data.7. Select settings for frame lines.8. Click OK in the Bottom row dialog.9. Add more data rows if necessary.10. Click OK to the Profile layout dialog.11. Close the Settings dialog in order to save the modified settings for TerraModeler.
Setting: Effect:Title 1 Free text used as first line of a title in the bottom row.Title 2 Free text used as second line of a title in the bottom row.Height Height of the bottom row. Given in millimeters on paper.Content Defines the type of information displayed in the bottom row:
• Surface elevations - elevations of surfaces of the given Surface type
• Surface difference - Difference between surfaces of the two given surface types
• Pipe - space reservation for information of a given Pipe type. The content is filled by TerraPipe.
• Pipe stations - space reservation for pipe stationing of a given Pipe type. The content is filled by TerraPipe.
• Stationing - stations along the alignment element of the profile
• Other - space reservation for any other content that can be added manually.
Vertical lines on the sides
If on, vertical lines are drawn on the left and right side of the bottom row.
Horizontal line below If on, a horizontal line is drawn below the bottom row using the given symbology.
Page 366 General Tools
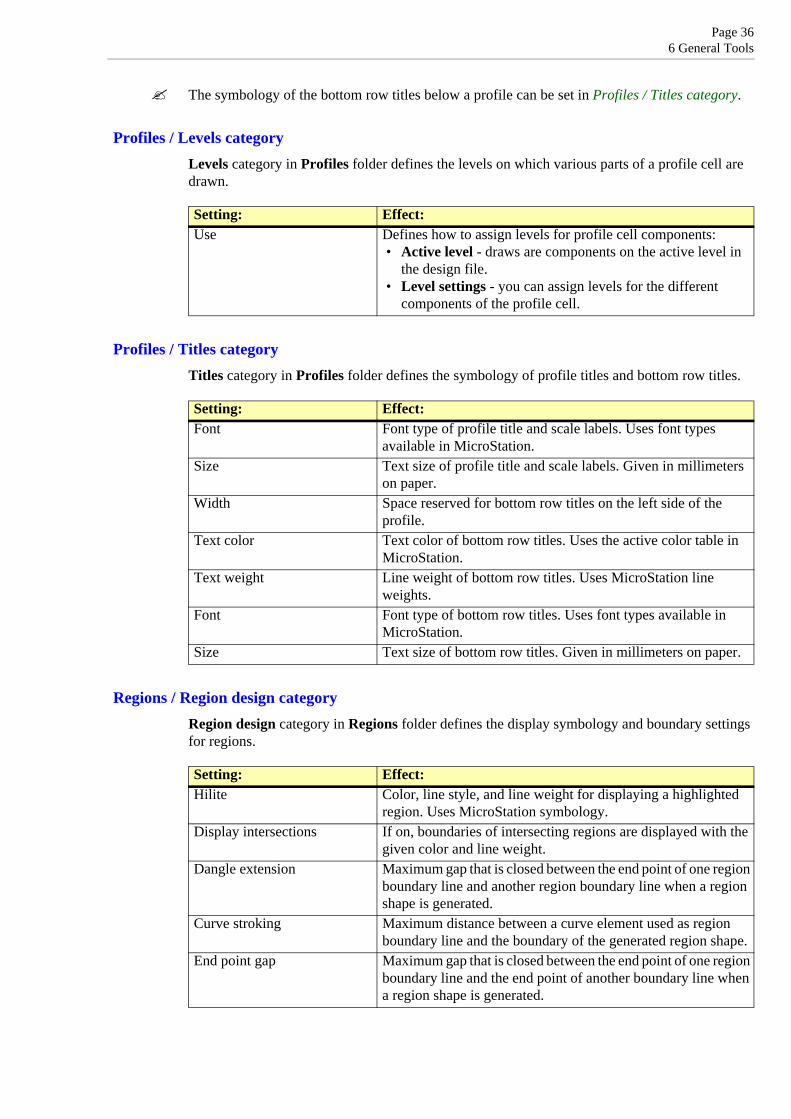
The symbology of the bottom row titles below a profile can be set in Profiles / Titles category.
Profiles / Levels categoryLevels category in Profiles folder defines the levels on which various parts of a profile cell are drawn.
Profiles / Titles categoryTitles category in Profiles folder defines the symbology of profile titles and bottom row titles.
Regions / Region design categoryRegion design category in Regions folder defines the display symbology and boundary settings for regions.
Setting: Effect:Use Defines how to assign levels for profile cell components:
• Active level - draws are components on the active level in the design file.
• Level settings - you can assign levels for the different components of the profile cell.
Setting: Effect:Font Font type of profile title and scale labels. Uses font types
available in MicroStation.Size Text size of profile title and scale labels. Given in millimeters
on paper.Width Space reserved for bottom row titles on the left side of the
profile.Text color Text color of bottom row titles. Uses the active color table in
MicroStation.Text weight Line weight of bottom row titles. Uses MicroStation line
weights.Font Font type of bottom row titles. Uses font types available in
MicroStation.Size Text size of bottom row titles. Given in millimeters on paper.
Setting: Effect:Hilite Color, line style, and line weight for displaying a highlighted
region. Uses MicroStation symbology.Display intersections If on, boundaries of intersecting regions are displayed with the
given color and line weight.Dangle extension Maximum gap that is closed between the end point of one region
boundary line and another region boundary line when a region shape is generated.
Curve stroking Maximum distance between a curve element used as region boundary line and the boundary of the generated region shape.
End point gap Maximum gap that is closed between the end point of one region boundary line and the end point of another boundary line when a region shape is generated.

Page 376 General Tools
Regions / Region levels categoryRegion levels category in Regions folder defines the levels in the design file which are used for drawing the different components of regions.
Regions / Region types categoryRegion types category in Regions folder displays a list of types of regions. By default there are two region types defined but more can be added using the Add button.
You can edit existing region types by using the Edit button in the Settings dialog. This opens the Region type dialog which lets you change the symbology settings for this region type. With the Delete button the selected region type is removed from the list.
To define a new region type:
1. Open the Region types category in the Regions folder.2. Click Add in the Settings dialog.
This opens the Region type dialog:
3. Type a Name and (Optional) a Description for the region type.4. Defne symbology settings for region pattern. The symbology settings become active if
Draw patterning is switched on.5. Define symbology settings for region color fill. The symbology settings become active if
Draw color fill is switched on.6. Click OK to the Region type dialog.7. Close the Settings dialog in order to save the modified settings for TerraModeler.
Setting: Effect:Level usage Levels used for region components by defining the
MicroStation level numbers.

Page 386 General Tools
Regions / Title formats categoryTitle formats category in Regions folder displays a list of title formats for regions. By default there are two region title formats defined but more can be added using the Add button.
You can edit existing region title formats by using the Edit button in the Settings dialog. This opens the Title format dialog which lets you change the settings for this region title format. With the Delete button the selected region title format is removed from the list.
To define a new title format for regions:
1. Open the Title formats category in the Regions folder.2. Click Add in the Settings dialog.
This opens the Title format dialog:
3. Type a Name for the title format and select settings for title placement.4. Choose symbology settings for the title format. 5. Select auto-text options depending on what you want to display as a region title.6. Click OK to the Title format dialog.7. Close the Settings dialog in order to save the modified settings for TerraModeler.
River sections / Coefficients categoryCoefficients category in River sections folder defines default friction coefficients for river sections.
Setting: Effect:Left bank Default friction coefficient for the left bank.Channel Default friction coefficient for the channel.Right bank Default friction coefficient for the right bank.

Page 396 General Tools
River sections / Eeby files categoryEeby files category in River sections folder defines a setting for handling codes in Eeby files.
River sections / Symbology categorySymbology category in River sections folder defines the levels and the symbology of river cross section cells.
Compatibility categoryCompatibility category defines how triangles are displayed in preview mode using the Display Triangles tool. This applies only for MicroStation versions earlier than V8i.
Editable laser model categoryEditable laser model category defines the default settings for surface models that are created from laser data.
Setting: Effect:First letters Defines points that are ignored when reading in Eeby files.
Setting: Effect:Surveyed section group Level, color, line style, and line weight of the surveyed part of the
river section. Uses MicroStation symbology.Extended section group Level, color, line style, and line weight of the part of the river
section which has been derived by extending a section based on a ground surface. Uses MicroStation symbology.
Labels group Level and symbology settings for river section labels. Uses MicroStation symbology and font types. The size of a label is given in millimeters on paper.
Setting: Effect:Draw filled shapes in fast mode
If on, the setting effects the preview mode of displaying triangles (not MicroStation V8i).
Setting: Effect:Naming Naming method for new surface models:
• Ask name - user types a name when a new model is created.• Automatic - the new model gets the name given in the Name
field automatically.Exclude Method of exclusion of outer boundary triangles for new surface
models:• No exclusion - no triangles are excluded.• Default exclusion - the software computes a reasonable triangle
length for exclusion from the surface’s point density.• By key-in length - triangles up to the length given in the
Longer than field are excluded.Exclude any long triangles If on, any triangles with edge lengths longer than the value given in
the following Longer than field are excluded (internal triangles as well as outer boundary triangles).

Page 406 General Tools
Element usage categoryElement usage category defines how graphical elements are interpreted as points and how text elements are interpreted as elevation points. The settings are used by the Triangulate Survey tool.
Elevation labels categoryElevation labels category defines the symbology if elevation labels. The settings effect the Insert Point tool, the Label Peaks and Pits tool, the Place Elevation Text tool, and the leveling texts for random and inferred points of the Export / Graphical elements command.
Setting: Effect:Radius Circles smaller than defined in the Radius field are interpreted as
a single points (circle center). Larger circles are stroked into several points along the circumference.
Accept single character symbols
If on, single character text elements are interpreted as elevation points.
Require +- sign in numbers If on, numerical text elements must have a sign character in order to be interpreted as elevation labels.
Require decimal point in numbers
If on, numerical text elements must have a decimal point in order to be interpreted as elevation labels.
Accept elevation text cells If on, MicroStation cell elements are interpreted as elevation marker and labels. The cell origin is used as xy location of the elevation point and the text as elevation label.
Setting: Effect:Justify Location of the placement point (= point of elevation
measurement):• Left, Center, Right | Top, Middle, Bottom - placement point
location relative to the label text box.• Decimal point - placement point is located at the decimal point.
Offset dx Offset between the placement point and the label in x (left-right) direction. Given in millimeters on paper. Only active if Justify is not set to Decimal point.
Offset dy Offset between the placement point and the label in y (up-down) direction. Given in millimeters on paper. Only active if Justify is not set to Decimal point.
Font Font type of elevation label text elements. Uses font types available in MicroStation.
Size Text size of elevation label texts. Given in millimeters on paper.Accuracy Number of decimals of elevation labels.Display plus If on, the plus sign is displayed for positive elevations.Display minus If on, the minus sign is displayed for negative elevations.Point marker Type of the placement point:
• None - no point marker is drawn.• Character - a given character is drawn as point marker.• Zero length line - a line element of zero length (= point) is
drawn as point marker.• Library cell - a cell element from the active cell library is
drawn as point marker.Font Font type of the point marker character. Uses font types available
in MicroStation. Only active if Point marker is set to Character.Size Text size of point marker character. Given in millimeters on paper.
Only active if Point marker is set to Character.

Page 416 General Tools
Insert Point categoryInsert Point category defines whether Insert Point tool draws elevation labels permanently into the design file.
Lattice database categoryLattice database category defines the storage location and elevation units of lattice database files. Additionally, it defines how lattice database files are drawn in profiles and cross sections.
Character Character used as point marker symbol. Only active if Point marker is set to Character.
Weight Weight of the point marker. Uses MicroStation line weights. Only active if Point marker is set to Zero length line.
Cell Name of the cell used as point marker. Only active if Point marker is set to Library cell.
Size Cell size give in millimeters on paper. Only active if Point marker is set to Library cell.
Setting: Effect:Draw permanently If on, the text element is written to the design file.
If off, the text element is displayed temporarily.
Setting: Effect:Directory Defines the directory where lattice database files are located.
This directory may contain Intergraph GRD, Disimp, or Ordnance Survey NTF files.
Draw in profiles If on, the lattice database files from the given Directory are drawn in profiles and cross sections.
Color Color of the lattice database files. Uses the active MicroStation color table. Only active if Draw in profiles is switched on.
Weight Line weight of the lattice database files. Uses MicroStation line weights. Only active if Draw in profiles is switched on.
Style Line style of lattice data base files:• Standard - uses MicroStation line styles.• Custom - uses user-defined line styles.
Only active if Draw in profiles is switched on.Style name Name of a user-defined line style. The Select button opens a list
of custom styles. Only active if Style is set to Custom.Style scale Scale of a user-defined line style. Expressed as relation between
the original custom style and a scale factor. Only active if Style is set to Custom.
Intergraph Elevation unit of Intergraph GRD files. Based on that, the software derives decimal elevation values from the integer values stored in the lattice files.
Disimp Elevation unit of Disimp files. Based on that, the software derives decimal elevation values from the integer values stored in the lattice files.
Setting: Effect:

Page 426 General Tools
LEM & DMF formats categoryLEM & DMF formats category defines level and format settings for Japanese LEM & DMF format files.
Operation categoryOperation category defines what menus the application opens at startup and how the application can be closed.
Quantity calculation categoryQuantity calculation category defines how small elevation differences are ignored in quantity calculation and settings for quantity reports.
Saving surfaces categorySaving surfaces category defines when surface models are saved automatically to the surface file on a hard disk.
Setting: Effect:Search Defines where to search for polygons: in the Active design file,
Reference files, or Both.Water bodies Level in the design file(s) where water polygons are located.Islands Level in the design file(s) where island polygons are located.Row order Order of rows in LEM files: Bottom first or Top first.
Setting: Effect:Create Applications Menu If on, TerraModeler creates an Applications pulldown menu in
MicroStation's menu bar at startup. This menu contains items for opening TerraModeler tool boxes.
Open Main tool box If on, the application opens its Main tool box at startup.Open Surfaces window If on, the application opens the Surfaces window at startup.Main tool box is closed If on, the application is unloaded when the Main tool box is
closed.Open Flood Mapping If on, the application opens the Flood Mapping extension tool
box at startup.Use standard file open dialog If on, the application uses a standard Windows dialog for
opening surface files.
Setting: Effect:Less than Accuracy limit for quantity calculation tools. If the elevation
difference between two surfaces is less than the limit, this column is ignored.
Volume Accuracy of volume values in quantity reports.Area Accuracy of area values in quantity report.Max usage Maximum amount of memory used for creating quantity
reports.
Setting: Effect:When first created Save surfaces automatically when the surface is first created.When saving design file Save surfaces automatically when saving the design file.

Page 436 General Tools
Surface types categorySurface types category displays a list of user defined surface types. Typical surface types are ground, plan, bedrock, and various soil layers. Whenever you create a new surface, you have to select a surface type from which the surface gets predefined symbology settings for profiles and colored triangles.
You can use the Edit button to modify settings for an existing surface type. The button opens the Surface type dialog which lets you adjust settings for this surface type. With the Delete button an existing surface type can be removed from the list.
To add or edit a surface type:
1. Open the Surface types category. Click Add in the Settings dialog.
OR
1. Open the Surface types category. Select a surface type definition and click Edit in the Settings dialog.
This opens the Surface type dialog:
2. Type a Name for the surface type.3. Select symbology settings for drawing the surface type into profiles.4. Define settings for displaying the surface type as triangles.5. Click OK to the Surface type dialog.6. Close the Settings dialog in order to save the modified settings for TerraModeler.
Triangulate Survey categoryTriangulate Survey tool creates a surface model from graphical elements created by a survey drawing or a mapping application. The feature coding of this application is used when deciding what elements can be used as valid source data for the selected surface. Other tools and commands using these settings are Triangulate Multiple Sources, Utility / Produce contours, Utility / Produce lattice models, and Utility / Produce triangles.
The settings in Triangulate Survey category determine what applications can be called to enquire if an element represents valid data for the selected surface. An application can be called only if it

Page 446 General Tools
is installed on the computer. An exception is TerraSurvey which does not have to be installed on the computer.
You do not have to have TerraSurvey installed to use its feature coding to filter elements for a surface model. When TerraSurvey creates survey drawing elements, it stores the active modeling settings of this feature as attribute data. TerraModeler knows how to interpret the data and can select elements based on the creation time modeling settings.
View Elevation categoryView Elevation category defines how the Points on surface lock in View Elevation tool works if a new element is snapped to another MicroStation element.
Setting: Effect:TerraSurvey If on, use elements created by TerraSurvey. Accept by How to determine suitability of elements:
• Active feature list - call TerraSurvey to enquire suitability of an element based on the current feature list.
• Creation time settings - do not call TerraSurvey. Elements created by TerraSurvey may be accepted for the surface model based on information stored with the elements at creation time.
PRO600 If on, call Leica's PRO600.DigiCad If on, call GeoCad's DigiCad.DigiCad - Load if not loaded If on, load DIGICAD.MA if necessary. Only active if DigiCad
is switched on.Espa If on, call ESPA System’s Espa software.Scan reference files If on, the application checks reference files attached to the active
design file for graphical elements in order to create a surface model.
Setting: Effect:Apply to snapped points If on, the elevation value derived from the surface given in the
View Elevation tool’s dialog is applied for all data points, no matter if they are snapped to other 3D elements or not. Thus, the snap determines only the xy location of the data point.

Page 456 General Tools
Define Coordinate Setup
Define Coordinate Setup tool sets up the coordinate system that TerraModeler uses for surface model points. It determines the coordinate range inside which all points must be located and the resolution to which coordinate values are rounded. The coordinate setup is stored into the active design file and is used by TerraScan, TerraPhoto, TerraModeler, and TerraMatch.
TerraModeler uses signed 32 bit integer values for storing coordinates of points. This has the advantage of using only 12 bytes of memory for the coordinate information of each point. You can control how accurately coordinate values are stored by defining how big each integer step is.
If, for example, one integer step is equal to one millimeter, all coordinate values are rounded to the closest millimeter. At the same time it would impose a limitation on how far apart points can be or how big the coordinate ranges are. Millimeter steps produce a coordinate cube which has a size of 232 millimeters or 4294967.296 meters. If the origin of the coordinate system is at [0.0, 0.0, 0.0], the coordinate ranges are limited to values between -2147483 and +2147483. If necessary, you can fit the coordinate ranges to your data by modifying the Easting and Northing coordinates of the coordinate system origin.
If one integer step is equal to one centimeter, the coordinate values can range from -21 million to +21 million which is large enough for most coordinate systems.
To define a coordinate setup:
1. Select the Define Coordinate Setup tool.
This opens the Define Coordinate Setup dialog:
2. Define settings and click OK.
This modifies the coordinate system used by all Terra Applications in the active design file.
MicroStation SE and MicroStation JEach design file contains a definition of a 32 bit integer coordinate system which MicroStation uses internally for vector elements. All applications share the same coordinate setup with MicroStation. When you change the coordinate setup with Define Coordinate Setup, it changes the design file coordinate system.
Since Terra Applications’ version 009.00x these MicroStation versions are no longer supported.

Page 466 General Tools
MicroStation V8MicroStation V8 uses 64 bit values for storing vector elements. TerraModeler uses a coordinate setup which is separate from the design file coordinate system. The application uses a default coordinate setup of 100 integer steps for each master unit. You can use Define Coordinate Setup tool to change the coordinate setup which the application stores in the design file but it does not affect MicroStation itself or the vector elements.

Page 476 General Tools
Set Scale
Set Scale tool sets the intended plotting scale of the design and rescales elements. Plotting scale affects the size of text elements that TerraModeler creates.
To set the intended plotting scale:
1. Select the Set Scale tool.
The Set plotting scale dialog opens:
2. Enter value for the new scale.3. Select elements to be rescaled.4. Click OK.
The selected element types are rescaled.
Surfaces
Surfaces tool opens a window for managing surface models. You can use it, for example, to open, close, and delete surfaces, to rename surfaces, view surface statistics, perform mathematical operations with surfaces, and to import and export surface data.
The Surfaces window shows a list of available and active surfaces. For every existing surface model the list shows the number of points in the model and the elevation range. You may choose additional fields to be shown in the window.
See chapter Managing Surfaces on page 191 for a complete description of the menu commands.

Page 486 General Tools
Save Surfaces
Save Surfaces tool saves all modified surface models to the hard disk. When you work on a surface model, all the surface data is kept in the computer's RAM. This tool ensures that all modifications are saved permanently to the surface model file.
You can use Surfaces tool to check what surfaces have been modified. The Status field in the Surfaces window indicates the storage status of each surface.
In the TerraModeler Settings, there is a category for controling when surface models are saved automatically. See Saving surfaces category on page 42 for more information.
About TerraModeler
About TerraModeler tool opens a dialog which shows information about TerraModeler and about the license.
From this dialog you can open the License information dialog:
Use the Request license button to start the online registration for node-locked licenses.
More information about license registration is available on the Terrasolid web pages: www.terrasolid.com/registration.php.
Help On TerraModeler
Help On TerraModeler tool launches Acrobat Reader for accessing this Users’ Guide in PDF format. The PDF must be stored in the /docs folder of your Terra Software installation directory.
If you installed TerraModeler in the default directory C:\TERRA, the Users’ Guide must be stored in C:\TERRA\DOCS\TMODEL.PDF.
The PDF has hypertext links built in, so you can jump between topics by clicking on the topic names highlighted in green color.
Accessing the PDF also requires that you have the Acrobat Reader installed on your computer. The software looks for a file named ACRORD32.EXE. If the file can not be found, you are asked to locate the file on the hard disk manually.
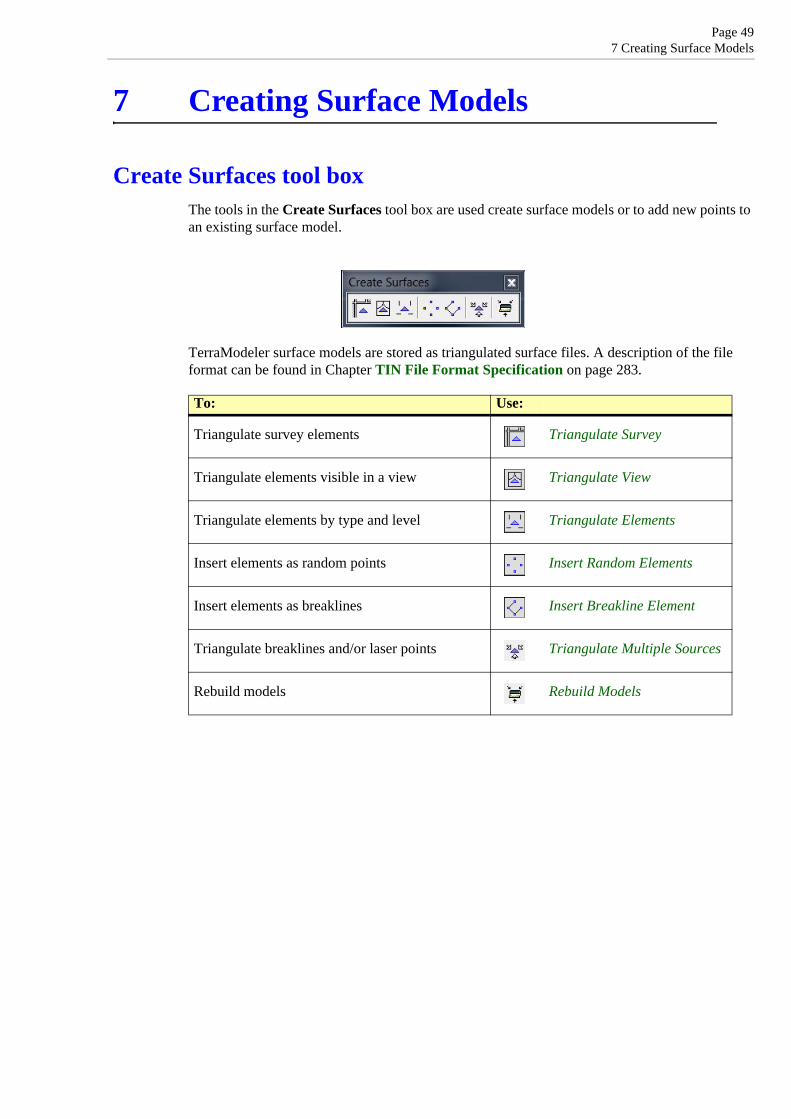
Page 497 Creating Surface Models
7 Creating Surface Models
Create Surfaces tool boxThe tools in the Create Surfaces tool box are used create surface models or to add new points to an existing surface model.
TerraModeler surface models are stored as triangulated surface files. A description of the file format can be found in Chapter TIN File Format Specification on page 283.
To: Use:
Triangulate survey elements Triangulate Survey
Triangulate elements visible in a view Triangulate View
Triangulate elements by type and level Triangulate Elements
Insert elements as random points Insert Random Elements
Insert elements as breaklines Insert Breakline Element
Triangulate breaklines and/or laser points Triangulate Multiple Sources
Rebuild models Rebuild Models

Page 507 Creating Surface Models
Triangulate Survey
Triangulate Survey tool creates a surface model from survey data that has been drawn into the design file with survey drawing or mapping applications. The feature coding of this other application is used to decide what elements can be accepted as valid data for the TerraModeler surface model.
The elements may originate from one of the supported applications:
• TerraSurvey - a survey drawing application by Terrasolid.• PRO600 - a mapping application by Leica.• DigiCad - a map digitizing application by GeoCad.• Espa - a mapping application by ESPA Systems Ltd.
The applications must be activated in Triangulate Survey category of TerraModeler Settings before the software can create surface models from the respective survey data. More information about the implementation of functions related to survey feature coding in other applications can be found in Section Triangulate Survey on page 281.
You can use this tool to create a new surface model or to add points to an existing model loaded in TerraModeler.
To triangulate survey elements:
1. Select the Triangulate Survey tool.
The Triangulate surface dialog opens:
2. Select the surface to be triangulated. You can select a new surface or an existing surface that is loaded in TerraModeler.
3. If required, select additional settings for excluding triangles and point handling.4. Click OK.
If a new surface is created, the software opens the Surface settings dialog:
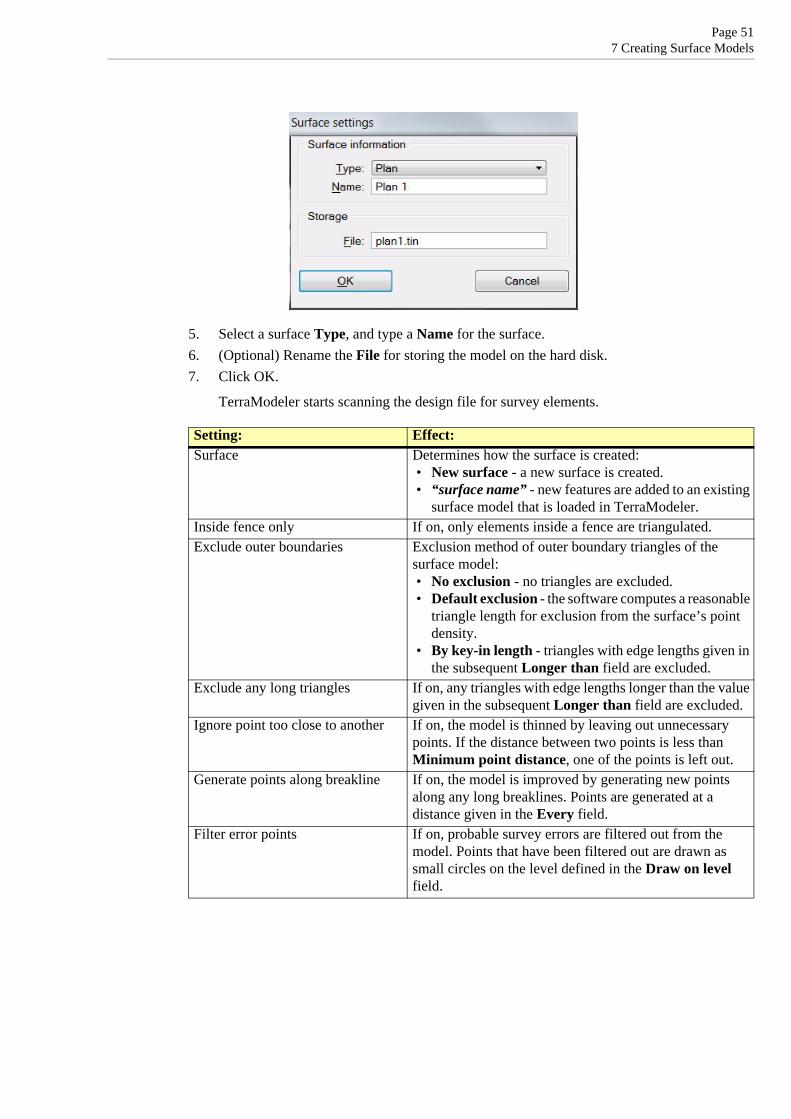
Page 517 Creating Surface Models
5. Select a surface Type, and type a Name for the surface.6. (Optional) Rename the File for storing the model on the hard disk.7. Click OK.
TerraModeler starts scanning the design file for survey elements.
Setting: Effect:Surface Determines how the surface is created:
• New surface - a new surface is created.• “surface name” - new features are added to an existing
surface model that is loaded in TerraModeler.Inside fence only If on, only elements inside a fence are triangulated.Exclude outer boundaries Exclusion method of outer boundary triangles of the
surface model:• No exclusion - no triangles are excluded.• Default exclusion - the software computes a reasonable
triangle length for exclusion from the surface’s point density.
• By key-in length - triangles with edge lengths given in the subsequent Longer than field are excluded.
Exclude any long triangles If on, any triangles with edge lengths longer than the value given in the subsequent Longer than field are excluded.
Ignore point too close to another If on, the model is thinned by leaving out unnecessary points. If the distance between two points is less than Minimum point distance, one of the points is left out.
Generate points along breakline If on, the model is improved by generating new points along any long breaklines. Points are generated at a distance given in the Every field.
Filter error points If on, probable survey errors are filtered out from the model. Points that have been filtered out are drawn as small circles on the level defined in the Draw on level field.

Page 527 Creating Surface Models
Triangulate View
Triangulate View tool creates a surface model from graphical elements displayed in a view. This tool uses only elements residing on levels visible in the selected view and located inside the view range.
This tool includes closed elements as breakline points or holes, linear elements as breakline or contour points, and single point elements as random points into a surface model.
You can use this tool to create a new surface model or to add points to an existing model loaded in TerraModeler.
To triangulate view elements:
1. Select the Triangulate View tool.
This opens the Triangulate View dialog:
2. Identify the view to triangulate by a mouse click inside the view.
This opens the Triangulate surface dialog. Continue as described for Triangulate Survey on page 50.
The software creates the surface model from elements that are visible in the selected view.
Setting: Effect:Closed elements How to use closed elements: As breaklines, As 3D holes
or As 2D holes. Curve elements How to use curve elements: As breaklines or As contours.B-spline elements How to use B-splines: As breaklines or As contours.Other linear elements Other linear elements are always used as breaklines.Single point elements Single point elements are always used as random points.Scan reference files If on, elements in reference files that are attached to the
active design file are used for surface creation as well.
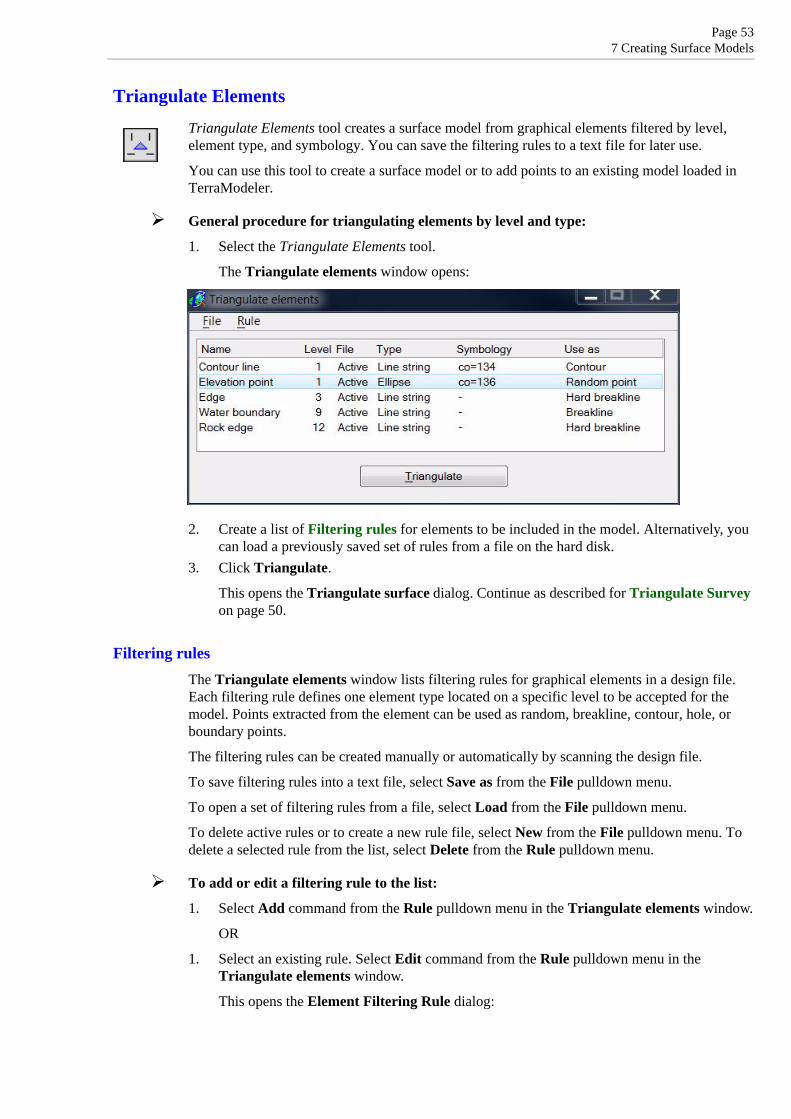
Page 537 Creating Surface Models
Triangulate Elements
Triangulate Elements tool creates a surface model from graphical elements filtered by level, element type, and symbology. You can save the filtering rules to a text file for later use.
You can use this tool to create a surface model or to add points to an existing model loaded in TerraModeler.
General procedure for triangulating elements by level and type:
1. Select the Triangulate Elements tool.
The Triangulate elements window opens:
2. Create a list of Filtering rules for elements to be included in the model. Alternatively, you can load a previously saved set of rules from a file on the hard disk.
3. Click Triangulate.
This opens the Triangulate surface dialog. Continue as described for Triangulate Survey on page 50.
Filtering rulesThe Triangulate elements window lists filtering rules for graphical elements in a design file. Each filtering rule defines one element type located on a specific level to be accepted for the model. Points extracted from the element can be used as random, breakline, contour, hole, or boundary points.
The filtering rules can be created manually or automatically by scanning the design file.
To save filtering rules into a text file, select Save as from the File pulldown menu.
To open a set of filtering rules from a file, select Load from the File pulldown menu.
To delete active rules or to create a new rule file, select New from the File pulldown menu. To delete a selected rule from the list, select Delete from the Rule pulldown menu.
To add or edit a filtering rule to the list:
1. Select Add command from the Rule pulldown menu in the Triangulate elements window.
OR
1. Select an existing rule. Select Edit command from the Rule pulldown menu in the Triangulate elements window.
This opens the Element Filtering Rule dialog:

Page 547 Creating Surface Models
2. Type a Name for the rule.3. Select settings for defining the rule.4. Click OK.
This adds the rule to the list or modifies the existing rule.
You can use the Selection tool as an aid for creating new rules. Select an example element before choosing Add command from the Rule pulldown menu. This applies the type and symbology of the selected element to the Element Filtering Rule dialog.
To add rules to the list by scanning the design file:
1. Select Create by scanning command from the File pulldown menu in the Triangulate elements window.
This opens the Create rules by scanning dialog:
Setting: Effect:Name Description of the feature depicted by the elements. Level The rule applies to elements on this design file level.Type Element type the rule applies to.Color If on, the rule applies only to elements with a given line
Color.Weight If on, the rule applies only to elements with a given line
Weight.Style If on, the rule applies only to elements with a given line
Style.Point type Defines how the element vertices are used as points in the
surface model: Random point, Hard breakline, Soft breakline, Guiding breakline, Contour, 2D hole, 3D hole, 2D boundary, or 3D boundary.

Page 557 Creating Surface Models
2. Select settings and click OK.
The software creates the rules automatically.
Setting: Effect:Scan Defines where the software scans elements to create the
rules:• Design file - in the active design file• Design and references - in the active design file and in
reference files attached to the active design file• View contents - in a selected view. Only elements
visible in the selected view are used for rule creation.Keep current rules If on, the new rules are added to the existing rules.
If off, existing rules are deleted.Color If on, rules are distinguished by element color.Weight If on, rules are distinguished by element weight.Style If on, rules are distinguished by element style.

Page 567 Creating Surface Models
Insert Random Elements
Insert Random Elements tool adds graphical elements as random points to a surface model. You can use this tool to create a surface model or to add points to an existing model loaded in TerraModeler.
To insert element(s) as random points to a surface:
1. Select the Insert Random Elements tool.
This opens the Insert Random Element dialog:
2. Select a Surface and define a minimum distance between points.3. Identify the element to insert.4. Accept the element.
TerraModeler inserts the element to the surface. You can continue with step 3.
OR
1. Select element(s) to insert.2. Select the Insert Random Elements tool.
This opens the Insert Random Element dialog.
3. Define settings.4. Accept the element(s).
If a new surface is created, the Triangulate surface dialog opens. Continue as described for Triangulate Survey on page 50.
TerraModeler inserts the element(s) to the surface.
Setting: Effect:Surface Surface to which points are inserted:
• New surface - a new surface is created.• “surface name” - points are added to an existing
surface model that is loaded in TerraModeler.Minimum distance Thins the model by leaving out unnecessary points. If the
distance between two points is less than Minimum distance, one of the points is left out.

Page 577 Creating Surface Models
Insert Breakline Element
Insert Breakline Element tool adds graphical elements as breakline points to a surface model. You can use this tool to create a surface model or to add points to an existing model loaded in TerraModeler.
To insert element(s) as breakline points to a surface:
1. Select the Insert Breakline Element tool.
This opens the Insert Breakline Element dialog:
2. Select a Surface and a breakline Type.3. (Optional) Define additional settings related to minimum distance between points or
generation of additional points along the breakline.4. Identify the element to insert.5. Accept the element.
TerraModeler inserts the element to the surface. You can continue to step 4.
OR
1. Select element(s) to insert.2. Select the Insert Breakline Elements tool.
This opens the Insert Breakline Element dialog.
3. Define settings.4. Accept the element(s).
If a new surface is created, the Triangulate surface dialog opens. Continue as described for Triangulate Survey on page 50.
TerraModeler inserts the element(s) to the surface.
Setting: Effect:Surface Surface to which breakline points are inserted:
• New surface - a new surface is created.• “surface name” - points are added to an existing
surface model that is loaded in TerraModeler.Type Defines how the element vertices are used as points in the
surface model: Random point, Hard breakline, Soft breakline, Guiding breakline, Contour, 2D hole, 3D hole, 2D boundary, or 3D boundary.
Ignore point too close to another If on, filter out unnecessary points. If the distance between two points is less than Minimum point distance, one of the points is left out.
Generate points along breakline If on, the model is improved by generating new points along any long breaklines. Points are generated at a distance given in the Every field.

Page 587 Creating Surface Models
Triangulate Multiple Sources
Triangulate Multiple Sources tool creates a new surface model from breakline elements and/or laser data in one operation. The surface model can be created as:
• Normal model - the model can not be rebuild when the source data has been changed.• Rebuildable model - the surface model can be rebuild after the source data has been changed
by using the Rebuild Models tool.• Editable model - the surface model is updated if there are modifications of the laser points
used in the model. This requires the usage of loaded points in TerraScan.
The breaklines can be defined as vector elements filtered by rules. See Filtering rules on page 53 for more information about rule files and how to create them. Alternatively, breaklines can be derived from survey elements created by TerraSurvey or other applications enabled in Triangulate Survey category of the TerraModeler Settings.
Laser data can be used from laser points loaded into TerraScan or directly from a TerraScan binary file stored on a hard disk.
To create a surface model from multiple sources:
1. Select the Triangulate Multiple Sources tool.
This opens the Triangulate Multiple Sources dialog:
2. Define settings for the surface model creation.3. Select data sources and define settings.4. Click OK.
This opens the Triangulate surface dialog. Continue as described for Triangulate Survey on page 50.

Page 597 Creating Surface Models
Setting: Effect:Create As Defines surface model rebuild options:
• Normal model - the model can not be rebuild.• Rebuildable model - the model can be rebuild after
changes to the source data using the Rebuild Models tool.
Type Surface model type.Name Name of the new surface model.File name Name of the surface model file stored on the hard disk.Vector elements If on, breaklines are included in the model. The breaklines
are defined by vector elements and the given Rule file.Survey elements If on, breaklines are included in the model. The breaklines
are defined by TerraSurvey or any other application enabled in TerraModeler settings.
Laser points in TerraScan If on, laser points loaded in TerraScan are included in the model. Only points of the given Classes are included.
Make this ‘Editable model’ If on, the model created from the laser points is updated if the point class changes. Only active if Laser points in TerraScan is switched on.
Run preprocessing macro If on, the given TerraScan Macro is applied to the loaded points before the surface model is created. Only active if Laser points in TerraScan is switched on.
Laser points from binary file If on, laser points from the given TerraScan binary File stored on a hard disk are included in the model.

Page 607 Creating Surface Models
Rebuild Models
Rebuild Models tool is used to rebuild surface models that were created by the Triangulate Multiple Sources tool. The models must have been created as Rebuildable models.
The rebuild process deletes the old surface, reads the source information, triangulates the new surface, and redraws the display methods.
To rebuild a model:
1. Select the Rebuild Models tool.
If there are one or more rebuildable models loaded in TerraModeler, the rebuilding process starts immediately for these models.
If there is no rebuildable model loaded in TerraModeler, an information message appears.

Page 618 Drawing Elements
8 Drawing Elements
Draw using Surface tool boxThe tools in the Draw using Surface tool box are used to view surface elevations or slopes, and to draw 3D elements based on a surface model.
To: Use:
View surface elevation / place elements on surface View Elevation
Compare elevations of two surfaces Compare Elevations
View slope of triangles View Slope
Drop elements to follow surface Drop Element On Surface
Calculate and draw slope from an element Calculate Slope
Fill area with cells Fill Area With Cells

Page 628 Drawing Elements
View Elevation
View Elevation tool shows the elevation of a surface model at the mouse pointer location. It also supports the placement of 3D vector elements by deriving surface elevations for the elements.
To view surface elevation:
1. Select the View Elevation tool.
The View elevation dialog opens:
If you move the mouse pointer inside a view, the Surface elevation at the mouse pointer location is displayed in the dialog.
To place elements on surface elevation:
1. Select the View Elevation tool.
The View elevation dialog opens.
2. Select a Surface from which to derive the elevation values.3. Switch Points on surface lock on.
If you want to place elements above or below the surface, enter a Dz value. A positive value places the elements above the surface and a negative value below the surface.
4. Start the digitization of a vector element.
When Points on surface lock is on, TerraModeler calculates the elevation from the given surface for all data points entered in a MicroStation top view. The data point is effected if the XY location falls inside the surface model area.
The view used for entering data points can be a top view which has been rotated around the Z-axis.
Make sure to turn off the Points on surface lock if you do not need it any longer. As it effects all data points, it may interfere with your normal work. The lock is turned off when the View elevation dialog is closed.

Page 638 Drawing Elements
Compare Elevations
Compare Elevations tool compares elevations of two surfaces at the mouse pointer location. It opens a dialog which shows the elevations of two surfaces and their difference.
The tool requires at least two surfaces loaded in TerraModeler.
To compare surface elevations:
1. Select the Compare Elevations tool.
The Compare surfaces dialog opens:
2. Select the surfaces for comparison.
If you move the mouse pointer into a top view, the surface elevations at the mouse pointer position are displayed. The dialog also shows the difference between the two selected surfaces.
View Slope
View Slope tool shows the slope gradient and the slope direction of a surface model triangle at the mouse pointer location.
To view slope directions and gradients:
1. Select the View Slope tool.
This opens the View Slope dialog:
2. Select a Surface model and Accuracy setting.3. Move the mouse pointer inside the surface area.
If the mouse pointer is inside a surface model, the triangle at the mouse pointer position is highlighted, its slope direction is displayed as an arrow, and its gradient is displayed as numerical percentage value in the status bar of MicroStation.
Setting: Effect:Surface Name of the surface for slope gradient and direction
display.Accuracy Number of decimals for the slope gradient display.

Page 648 Drawing Elements
Drop Element On Surface
Drop Element On Surface tool drops elements to follow a surface model. The XY shape of an element remains unchanged but its Z shape is forced to follow the elevation of a surface model.
The tool works for all linear elements and cells. A linear element is converted into a line string or a complex chain of line strings. The elevation of the line string vertices is calculated from the surface model. A cell element remains as a cell. It is dropped on the surface by calculating the elevation of its origin point.
To drop element(s) on a surface:
1. Select the Drop Element On Surface tool.
This opens the Drop Element On Surface dialog:
2. Define settings in the dialog.3. Identify the element to drop.4. Accept the element.
The element is dropped on the surface. You can continue to step 2 or 3.
OR
1. Select element(s) to drop.2. Select the Drop Element On Surface tool.3. Define settings in the dialog.4. Accept element(s).
All selected elements are dropped on the surface.
Setting: Effect:Surface Name of the surface to which elements are dropped.Drop to Defines how elevations for the element are calculated:
• Follow surface - each vertex gets the elevation value of the surface at its location.
• Highest elevation - all vertices get the elevation value of the highest vertex.
• Lowest elevation - all vertices get the elevation value of the lowest vertex.
Dz Elevation offset added to the dropped element. A positive value drops the element above the surface model elevation. A negative value drops the element below the surface model elevation.

Page 658 Drawing Elements
If there are parts of a linear element outside the surface model, the element is split into separate dropped elements. Thus, a line string or a shape is split into single line strings.
Drop only original vertices If on, only the existing vertices of the element are dropped on the surface. If off, the software adds intermediate vertices to the element to make it follow the surface elevation more accurately. This is only active if Drop to is set to Follow surface.
Make copy If on, the original element is not effected. Instead, a copy of the element is created.
Set level If on, a dropped element is placed on the given level.Use fence If on, a MicroStation fence is used to determine what elements are
effected. MicroStation fence modes are used:• Inside - only elements that are fully inside a fence are dropped.• Overlap - elements that overlap with a fence are dropped.• Clip - the part of an element that is overlapped by a fence is
dropped, other parts are not effected.• Void - only elements that are fully outside a fence are dropped.• Void overlap - elements that do not overlap with a fence are
dropped.• Void clip - the part of an element that is not overlapped by a
fence is dropped, overlapped parts are not effected.Outside surface Defines the way an element is drawn outside the surface model
area. The methods are:• Outside part remains unchanged in elevation but is drawn with
active color, line style, and line width.• Outside part gets interpolated elevation values and is drawn
with active color, line style, and line weight.• Outside part is not drawn and thus, resulting in a gap.
Setting: Effect:

Page 668 Drawing Elements
Calculate Slope
Calculate Slope tool calculates a slope from a graphical element onto a surface model. The starting element is either the top or the bottom edge of a slope. The tool calculates the other edge of the slope and draws it as a new line string element. The new element follows the elevation of a selected surface model.
The starting element has to be linear. Valid MicroStation element types include lines, line strings, curves, arcs, ellipses, shapes, complex chains, and complex shapes.
To calculate slope from an element:
1. Select the Calculate Slope tool.
This opens the Slope dialog:
2. Enter a slope angle and a minimum distance value.3. Select a surface to be used for slope calculation.4. Identify the element to start from.5. Define the slope direction with a data point. The direction is either left or right from the
starting element.
If found, the other edge of the slope is drawn. You can continue to step 2, 3, or 4.
Setting: Effect:Angle Slope angle in degrees. A positive value calculates a slope upwards
from the starting element. A negative value calculates a slope downwards. You can enter the angle as ratio of vertical and horizontal distances, for example, 1:3.
Min dist Minimum distance of vertices in the new line string. A mathematical slope may have some vertices very close to each other. For practical reasons, it is recommended to remove some of these vertices.
Onto surface Name of the surface used to compute the other edge of the slope.
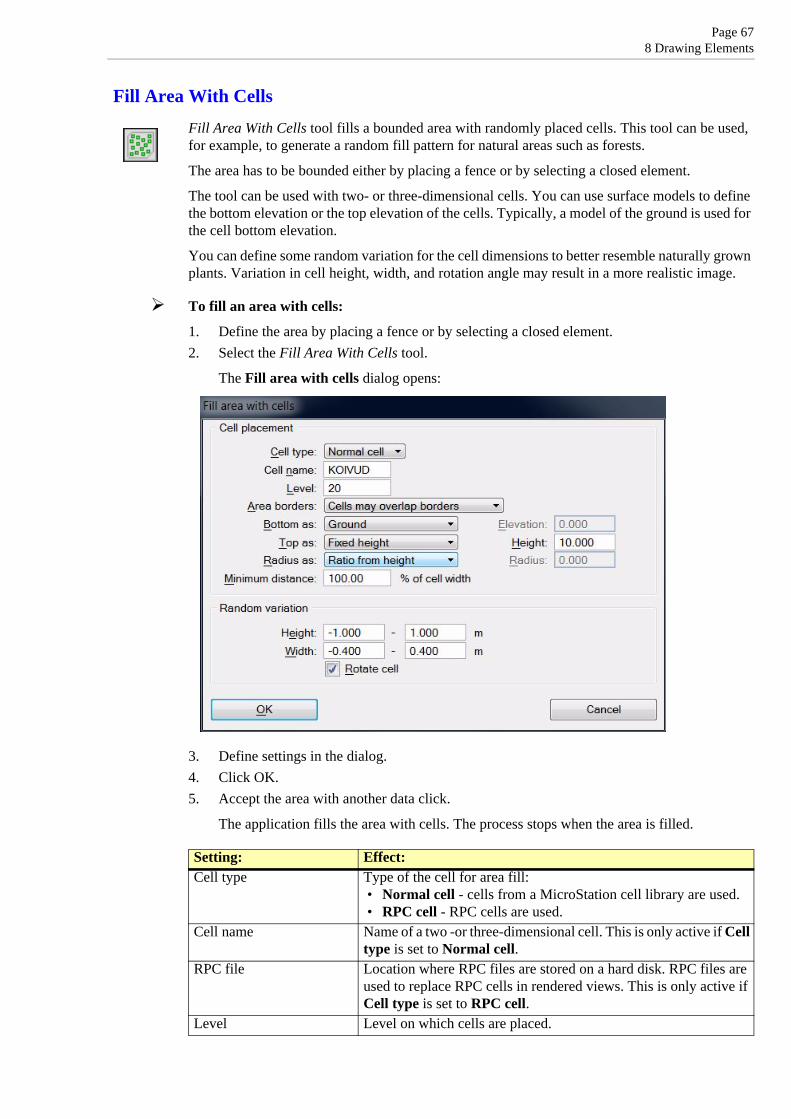
Page 678 Drawing Elements
Fill Area With Cells
Fill Area With Cells tool fills a bounded area with randomly placed cells. This tool can be used, for example, to generate a random fill pattern for natural areas such as forests.
The area has to be bounded either by placing a fence or by selecting a closed element.
The tool can be used with two- or three-dimensional cells. You can use surface models to define the bottom elevation or the top elevation of the cells. Typically, a model of the ground is used for the cell bottom elevation.
You can define some random variation for the cell dimensions to better resemble naturally grown plants. Variation in cell height, width, and rotation angle may result in a more realistic image.
To fill an area with cells:
1. Define the area by placing a fence or by selecting a closed element.2. Select the Fill Area With Cells tool.
The Fill area with cells dialog opens:
3. Define settings in the dialog.4. Click OK.5. Accept the area with another data click.
The application fills the area with cells. The process stops when the area is filled.
Setting: Effect:Cell type Type of the cell for area fill:
• Normal cell - cells from a MicroStation cell library are used.• RPC cell - RPC cells are used.
Cell name Name of a two -or three-dimensional cell. This is only active if Cell type is set to Normal cell.
RPC file Location where RPC files are stored on a hard disk. RPC files are used to replace RPC cells in rendered views. This is only active if Cell type is set to RPC cell.
Level Level on which cells are placed.

Page 688 Drawing Elements
RPC cells are not part of Terrasolid software. They are purchased by Archvision (www.archvision.com) and used in rendered views. These cells include texture maps of an object from different directions and angles. They can be used to render objects like trees, cars, road furniture etc. in a realistic and correct way no matter from which direction the object is viewed.
Area borders Defines how cells are placed close to the area boundaries:• Cells completely within borders - cells have to be completely
within the area boundaries.• Cells may overlap borders - cells may partially overlap area
boundaries.Bottom as Name of a surface model for the bottom elevation of cells. If set to
Fixed elevation, all cells are placed at the given Elevation.Top as Name of a surface model for the top elevation of cells. If set to
Fixed height, all cells are drawn with the given Height.Radius as Defines the width of cells:
• Constant - use the given Radius for all cells.• Ratio from height - calculates the width as a direct ratio from
the cell height defined in the cell library.Minimum distance Defines how close to each other cells are placed. If less than 100 %,
some cells may partially overlap each other. For forests, recommended values are between 60 and 120 %.
Height Random variation for the cell height. Width Random variation for the cell width.Rotate cells If on, cells are rotated randomly.
Setting: Effect:
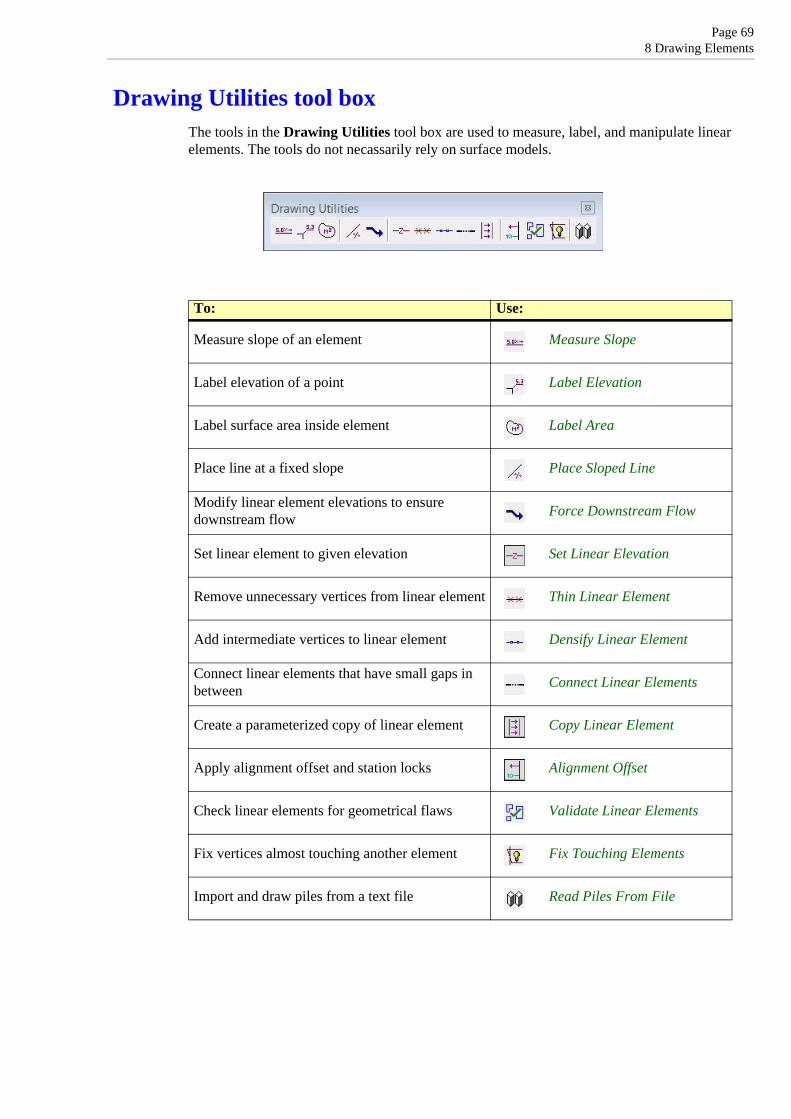
Page 698 Drawing Elements
Drawing Utilities tool boxThe tools in the Drawing Utilities tool box are used to measure, label, and manipulate linear elements. The tools do not necassarily rely on surface models.
To: Use:
Measure slope of an element Measure Slope
Label elevation of a point Label Elevation
Label surface area inside element Label Area
Place line at a fixed slope Place Sloped Line
Modify linear element elevations to ensure downstream flow Force Downstream Flow
Set linear element to given elevation Set Linear Elevation
Remove unnecessary vertices from linear element Thin Linear Element
Add intermediate vertices to linear element Densify Linear Element
Connect linear elements that have small gaps in between Connect Linear Elements
Create a parameterized copy of linear element Copy Linear Element
Apply alignment offset and station locks Alignment Offset
Check linear elements for geometrical flaws Validate Linear Elements
Fix vertices almost touching another element Fix Touching Elements
Import and draw piles from a text file Read Piles From File

Page 708 Drawing Elements
Measure Slope
Measure Slope tool measures and labels the average vertical slope of a linear element. The slope is calculated using the following mathematical expression:
Slope = 100 * (End z - Start z) / Horizontal length of element
Even if the element is a line string, the tool does not use the individual segments of the element. The slope is always calculated from the element's start point to its end point.
The element to be measured has to be linear. Valid MicroStation element types include lines, line strings, curves, and arcs.
The tool places the slope gradient as a percentage value and the slope direction as an arrow close to the linear element and at the mouse click location. The settings for the label symbology are defined in Drawing utilities / Measure Slope category of the TerraModeler Settings.
To measure the slope of an element:
1. Select the Measure Slope tool.
This opens the Measure Slope dialog:
2. Select the number of decimals for slope gradient display in the Accuracy list.3. Identify the element. The data click also defines the location of the label.
The slope percentage and the slope direction are displayed in the MicroStation status bar.
4. Enter a data click to accept the labeling or a reset click to reject the labeling. You can continue to step 2 or 3.

Page 718 Drawing Elements
Label Elevation
Label Elevation tool creates an elevation label for a data point. The tool can be used to label the elevation of points on vector elements in the design file.
The tool places the elevation value of the data point and a guiding line which connects the data point and the text. The settings for the tool are defined in Drawing utilities / Label Elevation category of the TerraModeler Settings. The symbology of the label is further determined by the active symbology settings in MicroStation.
To create elevation labels:
1. Select the Label Elevation tool.2. Identify the data point, for example, by snapping to a linear element.
The label is displayed at the mouse pointer location.
3. Enter the location of the label.
This draws the label in the design file. You can continue with step 2 or 3.
Label Area
Label Area tool measures and labels the size of a bounded area. The tool can be used to label the area of closed elements in the design file.
The tool places the area size value and possibly some prefix and/or suffix. The settings for the tool are defined in Drawing utilities / Label Area category of the TerraModeler Settings. The symbology of the label is further determined by the active symbology settings in MicroStation.
To create area labels:
1. Select the Label Area tool.
This opens the Label Area dialog:
2. Select the area type for labeling.3. Identify the bounding element which defines the area.
The label is displayed at the mouse pointer location.
4. Define the location of the label with another data click.
This draws the label in the design file. You can continue with step 2 or 3.
Setting: Effect:Label 2d area The tool measures and labels the 2d area defined by the closed
element.Label 3d area The tool measures and labels the 3d area defined by the closed
element that is projected on the given Surface.

Page 728 Drawing Elements
Place Sloped Line
Place Sloped Line tool places a 3D line at a fixed vertical slope. You enter the start point of the line as a normal data point. The second data point defines the XY position of the end point. The elevation of the end point is calculated using the given slope or the given end point elevation.
The slope is expressed as a percentage by the following mathematical expression:
Slope = 100 * Vertical distance / Horizontal distance
To place a line at a fixed slope:
1. Select the Place Sloped Line tool.
This opens the Place Sloped Line dialog:
2. Fix the Slope and/or End Z value. If both values are fixed, the lenght of the line is defined by the two values. If only one value is fixed, step 4 defines the end point of the line.
3. Enter the start point of the line with a data click.4. Enter the end point of the line data click.
You can continue with step 2 or 4. The finish the line, click the reset mouse button.
Force Downstream Flow
Force Downstream Flow tool modifies the elevation values of vertices of linear elements to enforce a consistent slope direction down for the linear element. The tool is useful to ensure that water stream breaklines run down all the time without small upward changes. The tool only modifies elevations of vertices if this is required to enforce the consistent downward direction.
To enforce that linear element(s) go down consistently:
1. Select the Force Downstream Flow tool.2. Identify the element.3. Accept the element selection.
This modifies the elevation values of the vertices of the selected linear element.
OR
1. Select linear element(s).2. Select the Force Downstream Flow tool.3. Accept the selected element(s).
This modifies the elevation values of the vertices of all selected elements.

Page 738 Drawing Elements
Set Linear Elevation
Set Linear Elevation tool adjusts a linear element to a given elevation. It sets a constant elevation for each vertex of the element.
To set the elevation of linear element(s):
1. Select the Set Linear Elevation tool.
The Set Linear Elevation dialog opens:
2. Define an Elevation value.3. Identify the element to adjust.4. Accept the element.
The element is adjusted to the given elevation. You can continue to step 2 or 3.
OR
1. Select element(s) to adjust.2. Select the Set Linear Elevation tool.3. Define an Elevation value.4. Accept element(s).
All selected element(s) are adjusted to the given elevation.

Page 748 Drawing Elements
Thin Linear Element
Thin Linear Element tool removes unnecessary vertices from linear elements. A tolerance value determines the largest allowed 3D distance between the original and the resulting linear element.
To thin linear element(s):
1. Select the Thin Linear Element tool.
The Thin Linear Element dialog opens:
2. Define a Tolerance value that determines how much the element is allowed to move.3. Identify the element to thin.4. Accept the element.
All unnecessary vertices are removed from the selected element.
OR
1. Select linear element(s) to thin.2. Select the Thin Linear Element tool.3. Define a Tolerance value that determines how much the element(s) are allowed to move.4. Accept the element(s).
All unnecessary vertices are removed from selected element(s).
Densify Linear Element
Densify Linear Element tool adds intermediate vertices to linear elements. A spacing value determines the desired distance between consecutive vertices. The tool adds vertices if the distance between two consecutive vertices in the original element is longer than 1.333 * Spacing.
To densify linear element(s):
1. Select the Densify Linear Element tool.
The Densify Linear Element dialog opens:
2. Define a Spacing value that determines the distance between consecutive vertices.3. Identify the element to densify.4. Accept the element.
Intermediate vertices are added to the selected element.
OR
1. Select linear element(s) to thin.2. Select the Densify Linear Element tool.3. Define a Spacing value that determines the distance between consecutive vertices.4. Accept the element(s).
Intermediate vertices are added to all selected element(s).
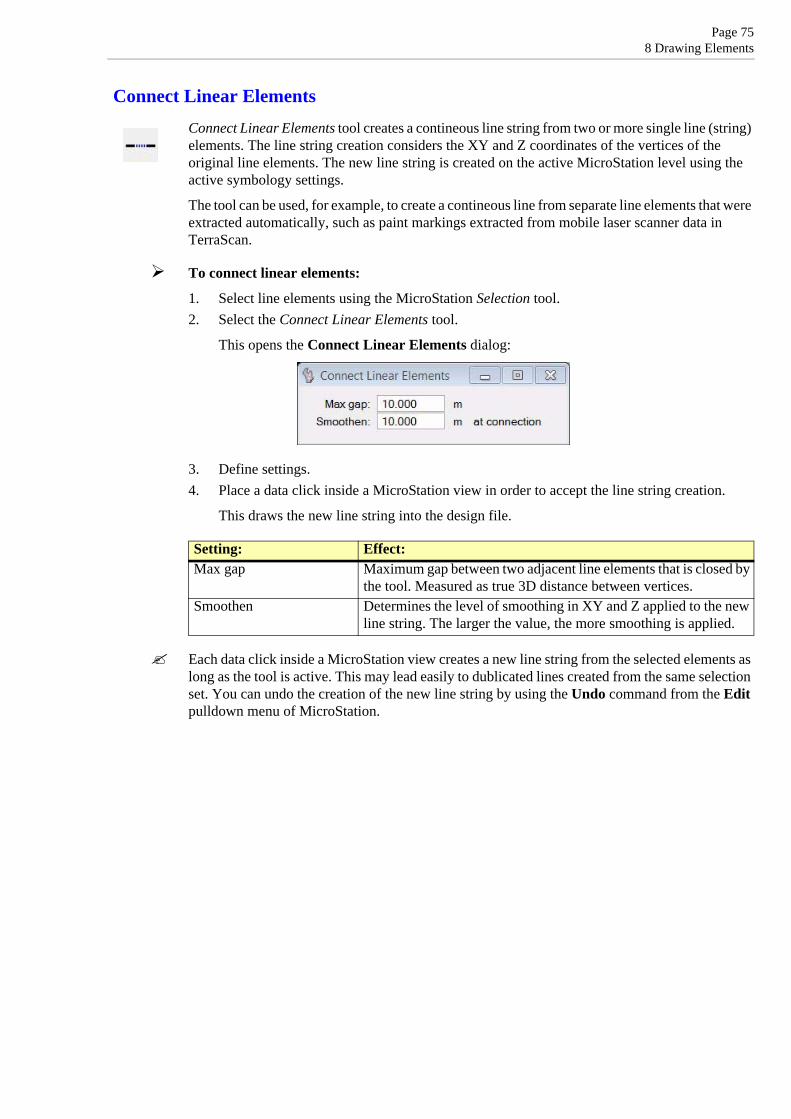
Page 758 Drawing Elements
Connect Linear Elements
Connect Linear Elements tool creates a contineous line string from two or more single line (string) elements. The line string creation considers the XY and Z coordinates of the vertices of the original line elements. The new line string is created on the active MicroStation level using the active symbology settings.
The tool can be used, for example, to create a contineous line from separate line elements that were extracted automatically, such as paint markings extracted from mobile laser scanner data in TerraScan.
To connect linear elements:
1. Select line elements using the MicroStation Selection tool.2. Select the Connect Linear Elements tool.
This opens the Connect Linear Elements dialog:
3. Define settings.4. Place a data click inside a MicroStation view in order to accept the line string creation.
This draws the new line string into the design file.
Each data click inside a MicroStation view creates a new line string from the selected elements as long as the tool is active. This may lead easily to dublicated lines created from the same selection set. You can undo the creation of the new line string by using the Undo command from the Edit pulldown menu of MicroStation.
Setting: Effect:Max gap Maximum gap between two adjacent line elements that is closed by
the tool. Measured as true 3D distance between vertices.Smoothen Determines the level of smoothing in XY and Z applied to the new
line string. The larger the value, the more smoothing is applied.

Page 768 Drawing Elements
Copy Linear Element
Copy Linear Element tool creates a parameterized copy of a linear element. Furthermore, the tool can be used to move a linear element in xy and/or z direction without keeping the original element.
The elevation of the new element may be derived in several ways:
• no change in elevation• set elevation to a fixed value• use a given elevation difference from the original element• use a given elevation difference or a gradient from another linear element
To create a copy of a linear element:
1. Select the Copy Linear Element tool.
This opens the Copy Linear Element dialog:
2. Define settings.3. Identify the original element which determines the horizonal shape.4. Identify another element if the vertical shape of the new element is determined from another
element.5. Select the offset side (left or right) with a data click.
A linear copy of the original element is created or the original element is moved to its new location.
Setting: Effect:Offset If on, the horizontal offset from the original element to the new
element is fixed. If off, the offset is determined by the last data click of the workflow.
Add vertices to long segments
If on, the application adds intermediate vertices to long line segments. This is useful to ensure that the created copy follows both the horizontal shape of the original element and the vertical shape of another element.

Page 778 Drawing Elements
Elevation by Defines the method of elevation value derivation for the new element:• Keyin value - constant elevation given as a numerical value in
the Elevation field.• Elevation point - constant elevation given by a data click.• Dz from original - elevation difference from the original ele-
ment given in the Dz field.• Dz from another element - elevation difference from another
element given in the Dz field.• Gradient from another element - gradient percentage from an-
other element given in the Gradient field.Projection Defines how the elevation of the new element is derived from
another element:• Shortest distance - each vertex is compared against the closest
position on the other element.• Perpendicular - each vertex is projected perpendicularly to the
other element and the elevation is derived from the projected lo-cation.
Only active if Elevation by is set to Dz from another element or Gradient from another element.
Create copy If on, a copy of the original element is created. The original element remains unchanged.
Setting: Effect:

Page 788 Drawing Elements
Alignment Offset
Alignment Offset tool provides an easy way to place elements at a specific station or at a specific 3D offset from an alignment element. The tool can use any linear element as the alignment.
Alignment Offset tool opens a dialog which dynamically displays station and offset values at the mouse pointer location. You can lock data points by station, offset, elevation difference, or gradient from the selected alignment.
General procedure for applying alignment locks:
1. Select the Alignment Offset tool.2. Identify the alignment element.3. Accept the element.
This opens the Alignment Offset dialog:
4. Switch on the locks which you want to apply.5. Select any MicroStation element placement tool you want to use.
When you enter a data point, its coordinates are adjusted according to the alignment offset locks and related to the selected alignment element.
Make sure to turn off Alignment Offset locks if you do not need it any longer. As it effects all data points, it may interfere with your normal work. The lock is turned off when the Alignment Offset dialog is closed.
Setting: Effect:Start station Station value for the start point of the alignment. Default is zero. Station If on, the XY location of a data point is adjusted to the given station
position.Offset If on, the XY location of a data point is adjusted to the given offset
from the alignment. The data point determines whether the offset is computed to the left or to the right of the alignment.
Dz If on, the Z value of a data point is adjusted by adding this elevation difference to the elevation of the alignment element.
Gradient If on, the Z value of a data point is adjusted by using this gradient percentage from the elevation of the alignment element.

Page 798 Drawing Elements
Validate Linear Elements
Validate Linear Elements tool can be used for checking linear elements for geometrical flaws. It is intended to be used, for example, for checking vector data from existing maps (such as building footprints) before it is used for further processing or for validating newly created vector data before delivery.
The following figure illustrates the geometrical flaws that can be found with the tool.
The tool opens a dialog with a list of all geometry flaws that it found according to the selected settings. In this dialog, there are user controls for checking the issues in an organized way.
To validate linear elements:
1. Select elements using the MicroStation Selection tool.2. Select the Validate Linear Elements tool.
This opens the Validate linear elements processing dialog:
3. Select which geometrical flaws you want to validate.

Page 808 Drawing Elements
4. If applicable, define additional settings.5. Click OK.
This opens the Validate linear elements dialog, a dialog that helps you to check the geometrical flaws in the vector data.
Validate linear elementsThe Validate linear elements dialog shows a list of geometrical flaws that the tool found in the selected elements. Further, it provides user controls for checking the problems in an organized way. MicroStation tools can be used to fix the geometry problems.
Index - unique ID number of a vector element. One element can have several geometry flaws.
Element type - MicroStation element type. Valid element types include shapes, complex shapes, ellipses, lines, line strings.
Problem type - geometry flaw.
Status - status of the element. Can be Active, Approved, or Dropped.
Vertices - number of vertices of the element.
Min. elevation
Setting: Effect:Stroking Tolerance distance for checking the geometry. A geometrical flaw
is detected if the location of a vertex differs more than the given value from other vertices or lines.
Touching Minimum distance between separate elements. If the distance is smaller, elements are detected as touching elements.
Angle Determines what is a sharp XY turn in the geometry. A value of 145 means that the smallest allowed angle between two lines at a vertex is 35 degrees. Smaller angles are considered a sharp turn. Values can range from 0 to 180.
z-Angle Determines what is a sharp Z turn in the geometry. Defined in the same way as Angle. Values can range from 0 to 180 degree.
Exclude crossings

Page 818 Drawing Elements
Buttons
Show - highlights the selected problem location or element. Select a row in the list and click on the button. Move the mouse pointer inside a MicroStation view. This highlights a problem location by drawing small squares around vertices. Place a data click inside a view in order to center the problem location/element in the view.
Identify - selects a problem location or element in the list. Click on the button and place a data click close to an element in a MicroStation view. The problem location or element closest to the data click is selected in the list.
Approve - sets the status of a problem element to Approved. This should be used after a geometrical flaw has been fixed.
Reactivate - sets the status of a problem element to Active. The button is only available if an element with status Approved is selected in the list.
Drop - drops a complex element into its single elements. Dropping a complex element is necessary to fix a gap (break). The button is only available if an element with problem type Break and status Active is selected. The status of the dropped element is changed to Dropped.
Select - selects the geometry of the element that is selected in the list. Select a row in the list and click on the button. This selects the element. You may use the Show button in order to move the view to the location of the element.
Settings pulldown menu
Processing settings command in the Settings pulldown menu lets you view and change the settings for validating elements. The command opens the Validate linear elements processing dialog described above. After changing settings, the list of elements in the Validate linear elements dialog is updated automatically.
View settings command in the Settings pulldown menu define the content and order of elements in the Validate linear elements dialog.
Setting: Effect:Show Determines what elements are displayed in the list: All elements or
Problem elements.Primary sort The elements are sorted primarily according to the given attribute.Secondary sort The elements are sorted secondarily according to the given
attribute.For elevation show Determines what vertex elevation value is shown in the last column
of the list: Minimum elevation, Maximum elevation, or Elevation change.

Page 828 Drawing Elements
Fix Touching Elements
Fix Touching Elements tool tries to fix selected linear elements in places where elements intersect or almost touch each other. As a result, the elements are snapped to each other as shown in the following illustration.
You may run the Validate Linear Elements tool with validation method Touching on in order to find out if there are such issues in a set of vector elements.
To fix touching elements:
1. Select elements using the MicroStation Selection tool.2. Select the Fix Touching Elements tool.
This opens the Fix touching elements dialog:
3. Define settings and click OK.
This fixes touching elements according to the given settings and moves them to the active MicroStation level. An information dialog shows the number of effected elements.
Setting: Effect:Stroking tolerance Tolerance distance for checking intersecting elements. Two
elements are considered as touching if the location of a vertex of one element differs more than the given value from a vertex or line of the other element.
Touching tolerance Minimum distance between separate elements. If the distance is smaller, elements are considered as touching elements.

Page 838 Drawing Elements
Read Piles From File
Read Piles From File tool imports and draws pile locations into the design file. "Pile" refers to piles or pillars that are slammed into the ground for stabilizing ground, e.g. close to construction sides, roads, etc. When such an object is placed, its location is also surveyed with either top + bottom Z or top Z + length. TerraModeler can read a text file with the following attributes for each pile:
• Easting - X coordinate of the pile. Mandatory attribute.• Northing - Y coordinate of the pile. Mandatory attribute.• Top Z - top elevation coordinate of the pile. Mandatory attribute.• Base Z - base elevation coordinate of the pile. Mandatory attribute if length is not provided.• Length - length of the pile. Mandatory attribute if Base Z is not provided.• Width - width of the pile.• Number - number of the pile.
The tool draws a cylindric cell element in the design file if the pile has a circular base shape or a cell with polygons on each sides if the base shape is rectangular.
The tool aims for checking tasks (are the piles placed correctly) and for monitoring. Later ground surface surveys may reveal changes of the ground and then, the pile drawings can be used to check if the ground changes because of problems with the piles.
To read piles from a text file:
1. Select the Read Piles from File tool.
This opens the first Read piles from file dialog, a standard dialog for selecting files.
2. Select the text file that stores the pile attributes and click Done.
This opens the File format for import dialog:
The dialog shows the first rows of the text file.
3. Check the Delimiter and select the correct one if the automatic selection is incorrect.4. Select the correct attributes for each column in the text file. Select Ignore, if a column from
the text file must not be imported.5. Click OK.

Page 848 Drawing Elements
This opens another Read piles from file dialog:
6. Define settings and click OK.
This draws the pile elements into the design file. The elements (and labels) are drawn on the given level(s) using the active symbology of MicroStation.
Setting: Effect:Pile type Shape of the pile: Circular or Rectangular.Pile width Diameter or edge length of a pile. The value is used if no width
value for each pile is provided in the text file.Level Design file level on which the pile elements are drawn.Draw number label If on, the number attribute is drawn on the given Level. This
requires a number attribute for each pile in the text file.

Page 859 Editing Surface Models
9 Editing Surface Models
Edit Point tool boxThe tools in the Edit Point tool box are used to modify a surface model on point-by-point basis.
To: Use:
Construct / remove a breakline between points Construct Breakline
Insert point along a breakline Insert Point Along Breakline
Insert a point to the model Insert Point
Move a point in the model Move Point
Remove a point from the model Remove Point
Exclude/include triangles Exclude Triangle

Page 869 Editing Surface Models
Construct Breakline
Construct Breakline tool constructs or removes breaklines between existing points in a model. Breaklines effect the way a model is triangulated. In this context, a breakline is a triangle edge connecting two points in the surface model. Thus, constructing or removing breaklines does not effect the actual points in a model, but it changes the way those points are connected by the triangle network.
The tool prompts you to identify two points in a surface model. A breakline is constructed, if the two points are not already connected by a breakline of the same type. If the two points are connected by a breakline of the same type, this tool removes the existing breakline.
To construct or remove breaklines:
1. Select the Construct Breakline tool.
The Construct Breakline dialog opens:
2. Select a view for breakline display.
Breaklines inside the selected view are highlighted with colors according to the breakline type.
3. Define settings in the dialog.4. Identify a first point in the model.5. Identify a second point in the model.
A breakline is constructed or removed. You can continue with steps 3 or 4.
Attempting to construct a breakline may fail because:
• The new breakline would intersect an existing breakline. Breaklines can not intersect each other. Try to remove the old breakline first.
• The two points are far apart. Try to construct a shorter breakline first.• The breakline would break through a very large number of triangle edges. Try to construct a
shorter breakline first.
Setting: Effect:Surface Name of the surface for which to add or remove breaklines.Construct Type of the new breakline points: Hard breakline, Soft breakline,
or Guided breaklineDraw hard Preview color for hard breaklines.Draw soft Preview color for soft breaklines.Draw guided Preview color for guided breaklines.

Page 879 Editing Surface Models
Insert Point Along Breakline
Insert Point Along Breakline tool inserts new points along an existing breakline. This is useful if the distance between two breakline points is very long compared to the average distance between surface points. A long breakline produces long narrow triangles in the surface model. Interpolating new points along the breakline may improve the surface model by making the triangles more uniform in size and closer to equilateral.
The elevation along the breakline does not change as the elevation of the new point is interpolated from the two end points of the breakline.
To insert a point along a breakline:
1. Select the Insert Point Along Breakline tool.
This opens the Insert Point Along Breakline dialog:
2. Select a view for breakline display.
Breaklines inside the selected view are highlighted as colored lines according to the breakline type.
3. Select a Surface model for which to enter breakline points.4. Enter a new point. The data point is projected to the closest breakline. The effected
breakline is highlighted as blue line if the mouse pointer comes close to it.
A new point is interpolated and inserted to the model. You can continue with steps 3 or 4.

Page 889 Editing Surface Models
Insert Point
Insert Point tool adds a new point to a surface model. You enter the X and Y location as a data point. The elevation can be a key-in value or the elevation of the data point.
In addition, the tool can add a leveling text for the new point and optional, a point marker. The settings for the label are defined in Elevation labels category and Insert Point category of the TerraModeler Settings. The symbology of the label is further determined by the active symbology settings in MicroStation.
To insert a point to a surface model:
1. Select the Insert Point tool.
This opens the Insert Point dialog:
2. Select a Surface model for which to insert new points.3. Switch Z on and enter an elevation value in order to use a key-in elevation for new points.
OR
Switch Z off in order to use the data point elevation for new points.
4. Move the mouse pointer inside a view.
The XY coordinates a of the mouse pointer location are dynamically displayed in the dialog. The elevation of the data point is displayed at the mouse pointer location.
5. Define the location of the new point with a data click.
The point is added to the model and possibly, a leveling text is drawn at the location. You can continue to step 2, 3, or 4.

Page 899 Editing Surface Models
Move Point
Move Point tool moves an existing point in a surface model. The tool can change a point location in different ways:
• Elevation - only the elevation of the point changes. The XY location remains the same. You can enter the new elevation as a key-in value or as a data point.
• Xy location - only the XY location changes, the elevation remains the same.• Xyz location - all of the coordinate values are modified.
The tool opens a dialog which shows dynamically the current coordinate values of the point to be moved and the new coordinate values close to the mouse pointer location to which the point is moved.
To move a point in a surface model:
1. Select the Move Point tool.
The Move Point dialog opens:
2. Define settings for moving a point.3. Identify the point to move. The effected point is highlighted by a circle if the mouse pointer
comes close to it.
The XY and/or Z coordinates of the effected point and the mouse pointer location are dynamically displayed in the dialog.
4. Define the new location of the point with a data click.
You can continue with steps 2 or 3.
Setting: Effect:Surface Name of the effected surface model.Change Defines what coordinates are changed for the point:
• Elevation - the Z coordinate of the point is modified.• Xy location - the XY coordinates of the point are modified.• Xyz location - the XYZ coordinates of the point are modified.
Move to If on, the point is moved to the given elevation value. If off, the point is moved to an elevation given by the data point. This is only active if Change is set to Elevation.

Page 909 Editing Surface Models
Remove Point
Remove Point tool deletes a point from a surface model. It automatically reorganizes the triangulation at the modified location.
To remove a point from a model:
1. Select the Remove Point tool.
This opens the Remove Point dialog:
2. Select a Surface model from which to remove points.3. Identify a point. The effected point is highlighted by a circle if the mouse pointer comes
close to it.
The point is removed from the model. You can continue with steps 2 or 3.

Page 919 Editing Surface Models
Exclude Triangle
Exclude Triangle tool excludes or includes triangles in a surface model. An included triangle is considered to be valid information about a surface. An excluded triangle is invalid, the surface does not exist at this location or the elevation is unknown. An excluded triangle is neither drawn in profiles, used in volume calculations, nor displayed in surface representations.
There are several methods of changing the status of a triangle with the tool:
• One at a time - triangles are defined one-by-one with data clicks inside the triangles. Can toggle between included and excluded status.
• Paint - several triangles are defined by touching them with the mouse pointer between two data clicks. Can toggle between included and excluded status.
• Boundary line - triangles are defined by the area between a boundary line and a line determined by a data click. The boundary line can be any linear element. The status can be changed from included to excluded only.
• Between lines - triangles are defined by two linear elements. The status can be changed from included to excluded only.
To include or exclude triangles:
1. Select the Exclude Triangle tool.
The Exclude Triangle dialog opens:
2. Select a Surface and colors for highlighting Included and Excluded triangles.3. Select a Method for changing the status of triangles.
Continue depending on the selected Method.
Method: One at a time
4. Identify the triangle. The effected triangle is highlighted in either Included color or Excluded color if the mouse point is inside the triangle area.
A mouse click toggles the status of the triangle.
Method: Paint
4. Identify a view for triangle display.5. Enter a data click in the first triangle. The effected triangle is highlighted in either Included
color or Excluded color if the mouse point is inside the triangle area.
This mouse click determines whether triangles are included or excluded. If the first triangle is currently included, the tool excludes triangles the mouse pointer passes through. If the first triangle is currently excluded, the tool includes triangles.
6. Move the mouse over all triangles that are to be excluded/included.7. To finish changing the status of triangles, enter a second data click.
The status is toggled for all triangles that were touched by the mouse pointer.

Page 929 Editing Surface Models
Method: Boundary line
4. Identify a linear element as boundary line.5. Identify the direction to which triangles are excluded by moving the mouse pointer away
from the linear element.
A line is displayed at the mouse pointer location which defines the other boundary for excluding triangles.
6. Accept the area for triangle exclusion with a data click.
The status is toggled to excluded for all triangles that are between the boundary line and the line defined by the second data click in step 6. A triangle is effected if its center point is between the boundary lines.
Method: Between lines
4. Identify a linear element as first line.5. Identify another linear element as second line.
The status is toggled to excluded for all triangles that are between the two selected linear elements. A triangle is effected if its center point is between the two lines.
To exclude/include triangles within a specific area, see Exclude Area tool for another option. Long triangles inside a surface model or along outer boundaries of a surface model can be excluded automatically during surface model creation or using the Edit / Exclude long triangles command in the Surfaces window.

Page 939 Editing Surface Models
Edit Area tool boxThe tools in the Edit Area tool box are used to modify surface model points or triangles inside or outside an area. The area is defined by a MicroStation fence or a shape element. Valid element types include shapes, complex shapes, and ellipses.
These tools considers the area boundary usually as a two-dimensional boundary. The Z coordinates of both, boundary vertices and surface model points are ignored when deciding what points are inside or outside the area.
To: Use:
Flatten points to a fixed elevation Flatten Area
Raise / lower points by a vertical distance Move Area
Drop / lift points to follow another surface Drop Area
Exclude triangles Exclude Area
Insert elements as internal hole boundaries Insert Hole Element
Remove points from the model Remove Area

Page 949 Editing Surface Models
Flatten Area
Flatten Area tool flattens surface model points to a fixed elevation. The tool sets the elevation of all points inside or outside a fence.
You can enter the new elevation as a key-in value or as a data point.
The fence can be defined by a MicroStation fence or by a closed shape element. Valid element types include shapes, complex shapes, and ellipses.
To flatten area points to a fixed elevation:
1. Place a fence or a shape element to define the area. (Optional) Select the shape.2. Select the Flatten Area tool.
The Flatten Area dialog opens:
3. Define settings.4. Identify the bounding shape for the area, if a shape element is used and not selected already.5. Accept the fence contents with a data click. The data point determines the new elevation
value for the surface points if Z is switched off.
The points are moved to the given elevation.
Flatten Area tool can be used for creating a flat plane inside a model. However, this operation alone does not produce a flat area with an exact boundary because the tool does not clip the triangles overlapping the fence border. The tool effects only the points inside the area. After the operation the surface model may start sloping down or up within the area boundary.
In order to create an exactly bounded flat area, you have to add the boundary lines to the surface model and make sure that triangles do not overlap the boundary.
General procedure for creating a flat plane:
1. Set the active depth of a top view to the desired elevation.2. Place a shape element at the desired elevation to define the area.3. Add the shape element as Hard breakline points to the surface model using the Insert
Breakline Element tool.4. Select the shape element.5. Start the Flatten Area tool to fix all the points inside the bounding element to the desired
elevation.
Setting: Effect:Surface Name of the effected surface model.Fence Defines where points are effected:
• Inside - points inside the fence are modified in elevation.• Outside - points outside the fence are modified in elevation.
Z Elevation value to which points are moved. If on, the points are fixed to the given elevation value. If off, points are fixed to an elevation value given by the data point in step 5.

Page 959 Editing Surface Models
Move Area
Move Area tool moves surface model points up or down by a given distance. The tool modifies the elevation of all points inside or outside a fence.
You can enter the distance as a key-in value or with a data point.
The fence can be defined by a MicroStation fence or by a closed shape element. Valid element types include shapes, complex shapes, and ellipses.
To move area points:
1. Place a fence or a shape element to define the area. (Optional) Select the shape.2. Select the Move Area tool.
The Move Area dialog opens:
3. Define settings.4. Identify the bounding shape for the area, if a shape element is used and not selected already.5. Accept the fence contents with a data click. The data point determines the distance for
moving the points if Dz is switched off.
The points are moved up or down.
Setting: Effect:Surface Name of the effected surface model.Fence Defines where points are effected:
• Inside - points inside the fence are modified in elevation.• Outside - points outside the fence are modified in elevation.
Dz Vertical distance by which the points are moved. A positive value moves points upwards, a negative value downwards.If on, the points are moved by the given elevation difference value. If off, points are moved by the distance defined with the last data click.

Page 969 Editing Surface Models
Drop Area
Drop Area tool modifies the elevations of surface model points by dropping them to other selected surfaces. The direction of movement is either up or down:
• Down - a point in the active surface is modified if one of the selected surfaces is located below that point's elevation. The elevation of the point is set to the highest elevation of the surfaces below the point.
• Up - a point in the active surface is modified if one of the selected surfaces is located above that point's elevation. The elevation of the point is set to the lowest elevation of the surfaces above the point.
The tool drops points inside or outside a fence. The fence can be defined by a MicroStation fence or by a closed shape element. Valid element types include shapes, complex shapes, and ellipses.
To drop area points:
1. Place a fence or a shape element to define the area. (Optional) Select the shape.2. Select the Drop Area tool.
The Drop Area dialog opens:
3. Select the active Surface from which to drop points and a Fence mode.4. Identify the bounding shape for the area, if a shape element is used and not selected already.5. Accept the fence contents with a data click.
The Drop surface points onto surfaces dialog opens:
6. Select a Direction and surface(s) to which points are dropped.7. Click OK.
The points are dropped to the surface(s).

Page 979 Editing Surface Models
Exclude Area
Exclude Area tool excludes or includes surface model triangles. The tool changes the status of all the triangles inside or outside a fence. The application uses the center point of a triangle to determine whether a triangle is inside or outside the fence.
The fence can be defined by a MicroStation fence or by a closed shape element. Valid element types include shapes, complex shapes, and ellipses.
To include/exclude triangles inside an area:
1. Place a fence or a shape element to define the area. (Optional) Select the shape.2. Select the Exclude Area tool.
The Exclude Area dialog opens:
3. Select settings for modifying the status of triangles.4. Identify the bounding shape for the area, if a shape element is used and not selected already.5. Accept the fence contents with a data click.
The status of the triangles is modified.
The tool effects triangles in the same way as the Exclude Triangle tool. Thus, you may include triangles with the Exclude Area tool that were previously excluded with the Exclude Triangle tool or vice versa.
Setting: Effect:Surface Name of the effected surface model.Fence Defines where triangles are effected:
• Inside - status of triangles inside the fence is changed.• Outside - status of triangles outside the fence is changed.
Operation Status to which the triangles are changed: Exclude or Include.Included Highlight color for included triangles.Excluded Highlight color for excluded triangles.

Page 989 Editing Surface Models
Insert Hole Element
Insert Hole Element tool creates a void area inside the surface model by excluding all triangles inside a closed element. The bounding element can serve as a 2d boundary or as a 3d boundary:
• 2d boundary - the elevation of the element has no effect. The two dimensional shape of the element is combined with the existing elevation of the surface model to create a boundary.
• 3d boundary - the three dimensional vertices of the element are are combined with the surface model to create a boundary.
The boundary element has to be a closed linear element. Valid element types include shapes, complex shapes, and ellipses.
The tool modifies the triangle network of the surface by adding addition vertices along the boundary element.
To insert element(s) to a surface as hole boundaries:
1. Select the Insert Hole Element tool.
The Insert Hole Element dialog opens:
2. Define settings for the hole area.3. Identify the boundary element to insert.4. Accept the element with a data click.
TerraModeler inserts the element to the surface and creates a void area inside. You can continue to step 2 or 3.
OR
1. Select element(s) to insert as holes.2. Select the Insert Hole Element tool.3. Accept the element(s).
TerraModeler inserts the element(s) to the surface and creates void area(s) inside.
The tool changes the status of the triangles inside the void area to excluded. You may include triangles with the Exclude Area tool or the Exclude Triangle tool in order to remove the void area.
Setting: Effect:Surface Name of the effected surface model.Insert as Set the boundary type:
• 2d boundary - use only the two dimensional shape of the element.• 3d boundary - insert vertices using the elevation of the element.
Generate points along breakline
If on, additional intermediate vertices are added to the boundary element at the given Every distance. This is only active if Insert as is set to 3d boundary.

Page 999 Editing Surface Models
Remove Area
Remove Area tool deletes points from a surface model. This tool removes all points inside or outside a fence.
The fence can be defined by a MicroStation fence or by a closed shape element. Valid element types include shapes, complex shapes, and ellipses.
To remove area points:
1. Place a fence or a shape element to define the area. (Optional) Select the shape.2. Select the Remove Area tool.
This opens the Remove Area dialog:
3. Select a Surface from which to remove points.4. Select a Fence mode to determine where points are effected.5. Identify the bounding shape for the area, if a shape element is used and not selected already.6. Accept the fence contents.
The points are removed and the triangle network is updated.

Page 10010 Generating Displays
10 Generating Displays
Display Surface tool boxThe tools in the Display Surface tool box are used to generate displays from a surface model.
The first six tools generate different visualizations of a surface model. TerraModeler is capable of generating contours, colored triangles, a colored grid, elevation texts, slope arrows, or a shaded surface. The first five display methods can be drawn as permanent elements into the design file or as temporary elements which are not saved with the design file. A shaded surface is always drawn temporarily.
All six display methods can be updated after modifications to the surface model,using the Update Displays tool. The visualizations can be removed from display by using the Erase Display tool.
Display Boundary tool and Label Peaks and Pits tool create elements which are not updated with the Update Displays tool or removed by the Erase Display tool.
To: Use:
Display contours Display Contours
Display colored triangles Display Triangles
Display colored grid Display Grid
Display elevation as grid spaced texts Display Elevation Texts
Display grid spaced slope arrows Display Slopes
Display coloring by elevation and sun angle Display Shaded Surface
Update displays after surface modification Update Displays
Erase contours, triangles or grid Erase Display
Display surface model boundary Display Boundary
Label local minimum and maximum points Label Peaks and Pits

Page 10110 Generating Displays
Display modesTerraModeler supports three different modes in which surface displays may be generated.
Write to file mode adds the created elements to the design file. This has the disadvantage of increasing the design file size quite substantially with some display methods. Very large surface models may result in design files which are very combersome for processing with MicroStaiton tools or for display in dynamic views. The advantages include the option to manipulate the elements using MicroStation tools and the ability to save the display on a hard disk as a part of the design file.
Display only mode computes the display elements and stores them in the RAM. Elements are drawn when a view is updated. This mode is supported only by tools which may require longer calculations to create the display. These include Display Contours and Display Grid tools.
Preview mode recalculates and draws the display elements each time a view is updated. This display mode does neither increase the design file size nor consume any RAM space. The mode is supported only by tools which can quickly re-calculate the whole display.
Creating a coloring scheme of discrete colorsThere are several display tools in TerraModeler that enable the definition of color schemes from discrete colors for surface model display. The Coloring scheme dialog is used to create such a coloring scheme by assigning colors for different elevations. The dialog uses the active color table of MicroStation.
The vertical bar on the left shows all the colors currently assigned in the scheme. Each color boundary has a label displaying the elevation value where that color change occurs. The text label is black, if the elevation value is fixed to the color boundary. A white elevation value has not been fixed and is recalculated if you change the number of colors in the scheme.
From the coloring scheme dialog, you can save a coloring scheme file to a hard disk.
To assign a new color:
1. Click on one of the available colors in the color table on the right.
This adds the new color at the lower end of the Colors bar and recalculates all unfixed elevation boundaries.

Page 10210 Generating Displays
To fix an elevation boundary:
1. Click on the text label of the elevation boundary.
This opens a dialog where you can enter an elevation value.
To create a new color scheme:
1. Select Remove all command from the Color pulldown menu in the Coloring scheme dialog.
This removes all assigned colors from the current color bar.
2. Assign new colors to the color bar as described above.
Each color is added to the lower end of the bar, thus, the first color is assigned to the highest elevation value.
3. (Optional) Save the color scheme as a file on a hard disk using the Save as command from the File pulldown menu in the Coloring scheme dialog.
Use menu item: To:File - Open Open a previously saved coloring scheme file.File - Save As Save the coloring scheme to a file.Color - Add empty Add an empty color which is not drawn.Color - Remove last Remove last color from the coloring scheme.Color - Remove all Remove all colors from the coloring scheme.

Page 10310 Generating Displays
Display Contours
Display Contours tool draws contour lines for a surface model. You can generate quick contours which are suitable for verifying the surface model or higher-quality contours to be plotted on paper.
The tool can also be used to save a contour settings file that is required for producing contour lines automatically in a batch process. The settings file stores all information related to contour lines, labels, and ticks, except the name of the surface model. See Utility / Produce contours on page 216 for more information.
Contours can be drawn as:
• Curves - smooth elements for which MicroStation computes the curvature. This results in fairly compact elements but can cause contours to intersect each other.
• Line strings - sharp elements suitable for mathematical design surfaces or for surface verification.
• Soft line strings - smooth elements for which TerraModeler computes the smoothing by inserting additional vertices. This results in larger elements.
TerraModeler supports three different types of contours. Minor, basic, and major contours can be distinguished from each other by line color, weight, or style. You can select which of the contour types is displayed and at what intervals. If more than three contour types have to be distinguished, you may use the Modify Contour Symbology tool in order to assign a different level and symbology to contours that are already drawn into the design file.
In addition to the contour lines, the software can create labels and ticks for the contours. Further, depressions can be displayed using different symbology settings than for hills. Labels, ticks, and depression line symbology are available in display modes Write to file and Display only, but not in Preview mode.
To display contours:
1. Select the Display Contours tool.
The Display contours dialog opens:
2. Define settings for contour generation.3. Define settings for the symbology of contour lines, labels, and ticks. This can be done using
commands Contour options, Contour label options, and Contour tick options from the Options pulldown menu in the Display contours dialog.

Page 10410 Generating Displays
OR
3. Load a previously saved settings file into the dialog using the Load settings command from the File pulldown menu.
4. (Optional) Save the settings into a file on a hard disk by using the Save settings As command from the File pulldown menu.
Click Cancel to the Display contours dialog if you just want to save a contour settings file for automatic contour line production.
5. Click OK to the Display contours dialog.
The contours for the selected surface model are displayed.
Setting: Effect:Surface Name of the effected surface model.Mode Display mode for contour lines:
• Display only - elements are stored in RAM and redrawn whenever a view is updated.
• Write to file - elements are written and stored in the design file.
• Preview - elements are recalculated and redrawn whenever the view is updated.
Draw as Element type of the contour lines:• Curves - smooth elements for which MicroStation computes
the curvature, may overlap each other, compact elements.• Line strings - sharp elements, suitable for preview.• Soft line strings - smooth elements for which TerraModeler
computes smoothening, best quality, large elements.Minor contours If on, minor contours are drawn at Every distance.Basic contours If on, basic contours are drawn at Every distance.Major contours If on, major contours are drawn at Every distance.Ticks If on, ticks are drawn along contour lines. Not available if Mode
is set to Preview.Automatic labels If on, labels are drawn along contour lines. Not available if
Mode is set to Preview.Inside fence only If on, contours are displayed only inside a MicroStation fence.
This requires a MicroStation fence drawn in the design file. Not available if Mode is set to Preview.
Write attributes If on, the software writes the contour elements in a way that enables the update of the contours using the Update Displays tool and the removal of contours using the Erase Display tool. This is only active if Inside fence only is switched on.
Place legend If on, a legend for contour line symbology is placed. This is only active if Color by is set to Elevation in the Contour options dialog.

Page 10510 Generating Displays
Contour optionsContour options define symbology settings for contour lines, such as level, coloring, line style, and line weight for the diffent contour types. They can also limit the contour display to specific domains or an elevation range, define the minimum areas for closed contours, or incluence the way of contour line generation.
To define contour options:
1. Select Contours command from the Options pulldown menu in the Display contours dialog.
The Contour options dialog opens:.
2. Define settings and click OK.
Contour option: Effect:Color by Contour line coloring method:
• Contour type - different colors according to the type of the contour line.
• Elevation - a coloring scheme is used for coloring contour lines according to their elevation value.
Colors Color scheme for coloring contours by their elevation value. The color scheme is defined using the Define button. See Creating a coloring scheme of discrete colors for information about how to create a coloring scheme. Only active if Color by is set to Elevation.
Minor Level, color, line style, and line weight for minor contours of hills/depressions.
Basic Level, color, line style, and line weight for basic contours of hills/depressions.

Page 10610 Generating Displays
Major Level, color, line style, and line weight for major contours of hills/depressions.
Only selected domains If on, contours are only drawn for domains for which the Draw contours option is switched on. See Define Domains tool for more information.
Only elevations If on, contours are drawn only for the given elevation range.Minimum area A closed contour line is not drawn, if the enclosed surface area
is smaller than Minimum area. Separate settings for Hills and Depressions. Helps to leave out unnecessary detail.
Build complex chains If on, contours are drawn as complex chains or as complex shapes.
Smoothing If on, contour vertices are slightly adjusted to produce smoother lines. If off, contours pass through triangle edges at mathematically correct positions which may result in jagged contour lines.
Thin by removing points if If on, some of the computed contour vertices may be left out. This helps to minimize the design file size when creating contours for large surface models.
Distance A vertex can be left out if the distance between the previous and the next remaining vertex is smaller than this value. Only active if Thin by removing points if is switched on.
Deviation A vertex can be left out if it is closer than this distance value to the line segment connecting the previous and the next remaining point. Only active if Thin by removing points if is switched on.
Turn angle A vertex can be left out if the contour direction changes less than this value at the vertex location. Only active if Thin by removing points if is switched on.
Contour option: Effect:

Page 10710 Generating Displays
Contour label optionsContour label options define the position of contour labels in relation to the contour lines, as well as their symbology settings, and their text format.
To define contour label options:
1. Select Contour labels command from the Options pulldown menu in the Display contours dialog.
The Contour label options dialog opens:.
2. Define settings and click OK.
Contour label option: Effect:Label Defines the contour line type(s) for labeling: All contours,
Major and basic contours, or Major contours only.Position Location where label text elements are placed along a contour
line:• Above contour - above the contour line at specified
intervals.• On contour - overlapping the contour line at specified
intervals.• Below contour - below the contour line at specified
intervals.• At contour start - at the start point of a contour chain.
Rotation Rotation of the label text element:• Uphill - label is readable when looking uphill.• Downhill - label is readable when looking downhill.• North up - label is readable when looking in north direction.
Every Distance between consecutive contour labels. Given in meters along the contour.
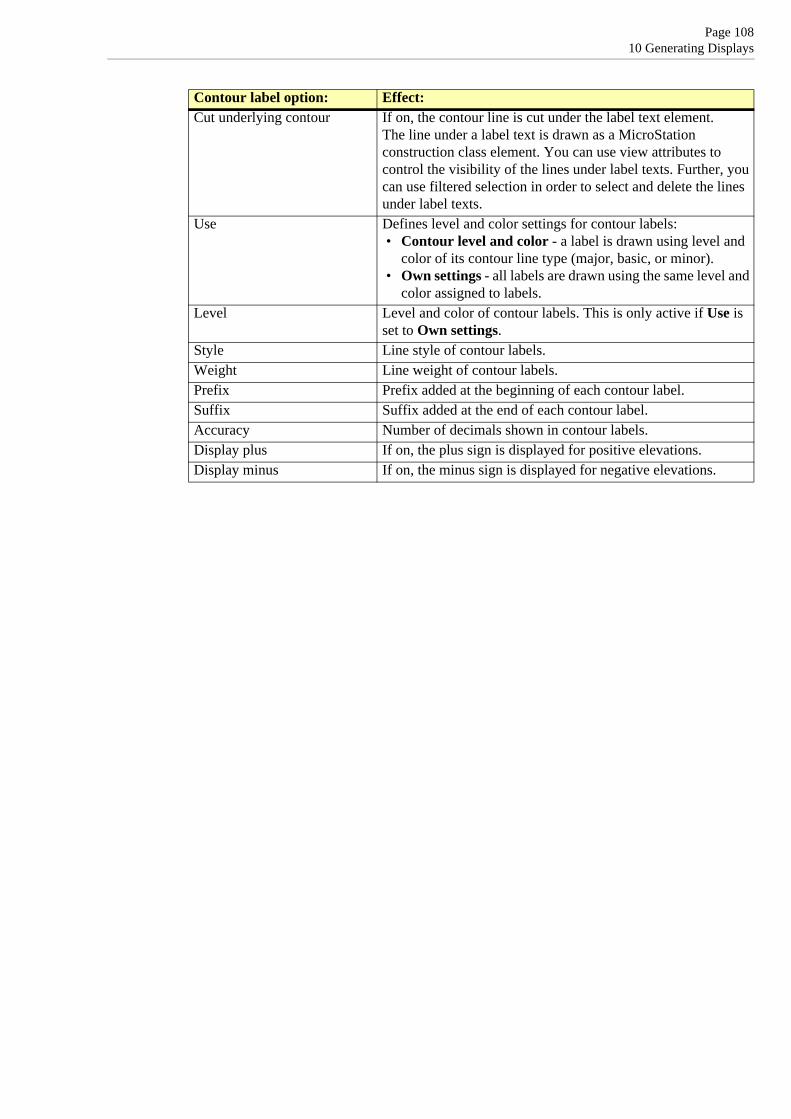
Page 10810 Generating Displays
Cut underlying contour If on, the contour line is cut under the label text element.The line under a label text is drawn as a MicroStation construction class element. You can use view attributes to control the visibility of the lines under label texts. Further, you can use filtered selection in order to select and delete the lines under label texts.
Use Defines level and color settings for contour labels:• Contour level and color - a label is drawn using level and
color of its contour line type (major, basic, or minor).• Own settings - all labels are drawn using the same level and
color assigned to labels.Level Level and color of contour labels. This is only active if Use is
set to Own settings.Style Line style of contour labels.Weight Line weight of contour labels.Prefix Prefix added at the beginning of each contour label.Suffix Suffix added at the end of each contour label.Accuracy Number of decimals shown in contour labels.Display plus If on, the plus sign is displayed for positive elevations.Display minus If on, the minus sign is displayed for negative elevations.
Contour label option: Effect:

Page 10910 Generating Displays
Contour tick optionsContour tick options define the position of ticks in relation to the contour lines, as well as the format of the ticks.
To define contour tick options:
1. Select Contour ticks command from the Options pulldown menu in the Display contours dialog.
The Contour tick options dialog opens:
2. Define settings and click OK.
Contour tick option: Effect:Every Distance between consecutive contour ticks given in
meters along the contour.Only depressions If on, ticks are drawn only for closed depressions.Maximum area If on, ticks are drawn only for closed depressions smaller
than a given area.Draw as Shape of ticks: Line or Triangle.Length Length of the tick line or triangle.

Page 11010 Generating Displays
Display Triangles
Display Triangles tool draws colored triangles for a surface model. You can create a coloring scheme where the color changes according to the surface elevation or according to the slope gradient of the triangles.
To display triangles:
1. Select the Display Triangles tool.
The Display triangles dialog opens:
2. Define settings and click OK.
This draws triangles for the selected surface model on the given level.
3. If Place legend is switched on, define the location of drawing the legend with another data point.
Setting: Effect:Surface Name of the effected surface model.Mode Display mode for triangles:
• Write to file - elements are written and stored in the design file.
• Preview - elements are recalculated and redrawn whenever the view is updated.
Color by Attribute used for coloring:• Elevation - elevation value of the triangle determines its
color.• Slope - slope gradient of the triangle determines its color.
Level Number of the level in the design file on which triangles are drawn.
Create filled shapes If on, triangles are filled with color.Planarize If on, triangles are drawn as planarized triangles at the given
Elevation.Smooth facets for rendering If on, triangles are displayed with a smoother change in coloring
if MicroStation rendering is applied (Not MicroStation V8i).

Page 11110 Generating Displays
Triangles can be produced automatically in batch mode using the Utility / Produce triangles command from the Surfaces window.
Inside fence only If on, triangles are drawn if their center point is located inside a fence. This is only active if Mode is set to Write to file and if a MicroStation fence has been drawn before starting the tool.
Colors Opens the Color scheme dialog. See Creating a coloring scheme of discrete colors for more information.
Color button Opens the MicroStation color table for single color selection.Place legend If on, a legend for the triangle colors can be placed in the design
file. This is only active if a color scheme is defined.
Setting: Effect:

Page 11210 Generating Displays
Display Grid
Display Grid tool generates a grid presentation of a surface model. You can create a coloring scheme where the color of the grid squares changes according to the surface elevation.
To display a grid:
1. Select the Display Grid tool.
The Display grid dialog opens:
2. Define settings and click OK.3. If Enter origin is switched on, define the origin point of the grid with a data point.
This draws a squared grid for the selected surface model on the given level.
4. If Place legend is switched on, define the location of drawing the legend with another data point.
Setting: Effect:Surface Name of the effected surface model.Mode Display mode for the grid:
• Display only - elements are stored in RAM and redrawn whenever a view is updated.
• Write to file - elements are written and stored in the design file.
Grid size Size of rectangular squares in the grid.Level Number of the level in the design file on which the grid is
drawn.Enter origin If on, you can enter the origin point of the grid with another data
point. If this point is inside the surface area, it becomes a corner point of the grid square at this location.
Create flat shapes If on, each grid square is drawn as flat square at the elevation of its center point.
Create filled shapes If on the grid squares are filled with color.Colors Opens the Color scheme dialog. See Creating a coloring
scheme of discrete colors for more information.Color button Opens the MicroStation color table for single color selection.Place legend If on, a legend for the triangle colors can be placed in the design
file. This is only active if a color scheme is defined.

Page 11310 Generating Displays
Display Elevation Texts
Display Elevation Texts tool draws a grid of labels which display the surface elevation. The exact location of the elevation can be marked by a point marker or by the decimal point of the elevation text.
To display elevation texts:
1. Select the Display Elevation Texts tool.
The Display elevation texts dialog opens:
2. Define settings.3. (Optional) Click on the Options button in order to open the Elevation text settings dialog
and define settings for elevation label symbology.4. Click OK to the Display elevation texts dialog.5. If Enter origin is switched on, enter the origin point of the grid with a data point.
This draws elevation texts for the selected surface model on the given level.
Setting: Effect:Surface Name of the effected surface model.Mode Display mode for elevation texts:
• Write to file - elements are written and stored in the design file.
Grid size Distance between elevation text locations.Level Number of the level in the design file on which elevation texts
are drawn.Enter origin If on, you can enter the origin point of the grid with another data
point. If the point is inside the surface area, an elevation text is drawn at this location.
Options Opens the Elevation text settings dialog. See Elevation text settings on page 114 for more information.
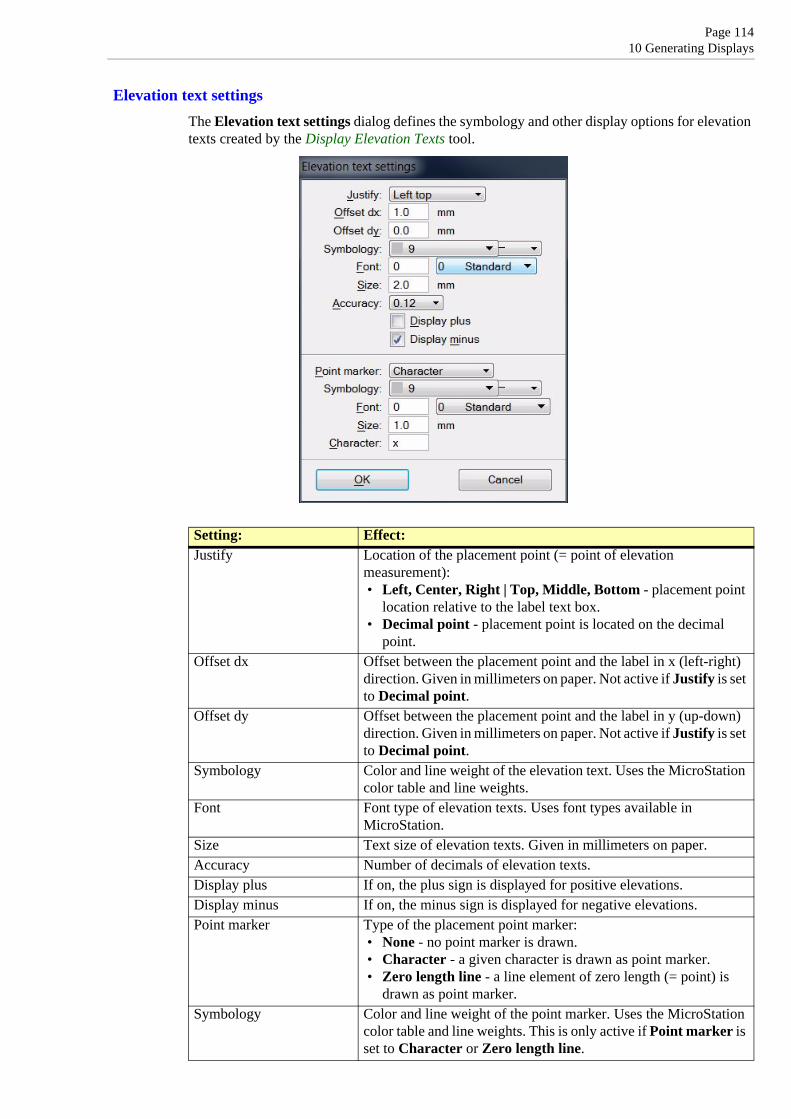
Page 11410 Generating Displays
Elevation text settingsThe Elevation text settings dialog defines the symbology and other display options for elevation texts created by the Display Elevation Texts tool.
Setting: Effect:Justify Location of the placement point (= point of elevation
measurement):• Left, Center, Right | Top, Middle, Bottom - placement point
location relative to the label text box.• Decimal point - placement point is located on the decimal
point.Offset dx Offset between the placement point and the label in x (left-right)
direction. Given in millimeters on paper. Not active if Justify is set to Decimal point.
Offset dy Offset between the placement point and the label in y (up-down) direction. Given in millimeters on paper. Not active if Justify is set to Decimal point.
Symbology Color and line weight of the elevation text. Uses the MicroStation color table and line weights.
Font Font type of elevation texts. Uses font types available in MicroStation.
Size Text size of elevation texts. Given in millimeters on paper.Accuracy Number of decimals of elevation texts.Display plus If on, the plus sign is displayed for positive elevations.Display minus If on, the minus sign is displayed for negative elevations.Point marker Type of the placement point marker:
• None - no point marker is drawn.• Character - a given character is drawn as point marker.• Zero length line - a line element of zero length (= point) is
drawn as point marker.Symbology Color and line weight of the point marker. Uses the MicroStation
color table and line weights. This is only active if Point marker is set to Character or Zero length line.

Page 11510 Generating Displays
Font Font type of the point marker character. Uses font types available in MicroStation. This is only active if Point marker is set to Character.
Size Text size of the point marker character. Given in millimeters on paper. This is only active if Point marker is set to Character.
Character Character used as point marker symbol. This is only active if Point marker is set to Character.
Weight Weight of the point marker zero lenght line. Uses MicroStation line weights. This is only active if Point marker is set to Zero length line.
Setting: Effect:

Page 11610 Generating Displays
Display Slopes
Display Slopes tool draws a grid of slope arrows. Each slope arrow shows the direction of water flow at this location. The arrow length indicates the steepness of the surface at this location. The tool can also create labels along the arrows which show the gradient of the slope.
To display slope arrows:
1. Select the Display Slopes tool.
The Display slopes dialog opens:
2. Define settings.3. (Optional) Click on the Options button in order to open the Slope settings dialog and
define settings for slope arrow symbology.4. Click OK to the Display slopes dialog.5. If Enter origin is switched on, enter the origin point of the grid with a data point.
This draws slope arrows for the selected surface model on the given level.
Setting: Effect:Surface Name of the effected surface model.Mode Display mode for slope arrows:
• Write to file - elements are written and stored in the design file.
Grid size Distance between slope arrow locations.Level Number of the level in the design file on which triangles are
drawn.Color Color of the arrows. Uses the MicroStation color table.Weight Line weight of the arrows. Uses MicroStation line weights.Style Line style of the arrows. Uses MicroStation line styles.Enter origin If on, you can enter the origin point of the grid with another data
point. If the point is inside the surface area, an elevation text is drawn at this location.
Options Opens the Slope settings dialog. See Slope settings on page 117 for more information.

Page 11710 Generating Displays
Slope settingsThe Slope settings dialog defines the symbology and label display options for slope arrows created by the Display Slopes tool.
Setting: Effect:Place by Placement point (= point of elevation measurement) of a slope arrow:
Arrow start or Arrow center.Arrowheads Number of arrowheads of a slope arrow:
• One - all arrows have one arrowhead.• One to three - number of arrowheads depends on the slope.
Length Two fields specifying the maximum and the minimum length of a slope arrow.
Slope Slope values at which the arrow length is equal to:- maximum length- two thirds of maximum length- one third of maximum length- minimum length
Write slope label If on, a text label showing the slope gradient is placed along a slope arrow.
Level Level number in the MicroStation design file on which the label is placed.
Font Font type of slope arrow labels. Uses font types available in MicroStation.
Size Text size of slope arrow labels. Given in millimeters on paper. Accuracy Number of decimals in the slope arrow label.Color Color of slope arrow labels. Uses the active color table of
MicroStation. Weight Line weight of slope arrow labels. Uses MicroStation line weights.

Page 11810 Generating Displays
Display Shaded SurfaceNot Lite
Display Shaded Surface tool draws the surface model colored by elevation and by triangle slope at the same time. The display method utilizes the Hue-Saturation-Value (HSV) color model in order to visualize the surface. The elevation value is represented by the color hue while the triangle slope is determined by the color value. The sun angle above the horizon further influences the brightness of colors in a shaded surface dislplay.
The display is drawn temporarily as a raster in MicroStation views, it is not written into the design file.
To display a shaded surface:
1. Select the Display Shaded Surface tool.
This opens the Display Shaded Surface dialog:
2. Define settings and click OK.
This creates a shaded surface display in the selected views.
Shaded surface GeoTIFF files can be produced automatically in batch mode using the Utility / Produce lattice models command from the Surfaces window.
Setting: Effect:Surface Name of the effected surface model.Sun azimuth Direction from which the sun illuminates the model. Zero is north and
angles increase clockwise.Sun angle Sun angle above the horizon.Color scheme Color scheme to use:
• Default - default color scheme containing magenta, red, yellow, green, cyan, and blue.
• Selected colors - use the Define button to create a customized color scheme. See Define a customized color scheme on page 119 for more information.
Color cycles Number of color cycles. Use zero to create a gray scale display showing triangle slope only.
Views View(s) in which the shaded surface is displayed.

Page 11910 Generating Displays
Define a customized color schemeThe Color Scheme dialog allows you to create a color scheme for a shaded surface display. The dialog uses a Hue-Saturation color model. The software creates smooth transitions between the colors assigned to the color scheme.
The vertical bar on the left shows the colors currently assigned to the scheme. The color field on the right shows color hues of the color cycle from top to bottom and color saturations from left to right.
To assign a new color:
1. Click in the color field on the right at the location of the color you want to add to the color scheme.
OR
1. Define Hue and Saturation values by typing a number or moving the slider. The hue value can range from 0 to 359, the saturation value from 0 to 100.
This selects the color and adjusts the value in the Hue and Saturation fields. The color is displayed in the Color field.
2. Click Add in order to add the selected color to the color scheme.
The color is added to the lower end of the bar, thus, the first color is assigned to the highest elevation values.
To create a new color scheme:
1. Select Remove all command from the Color pulldown menu in the Coloring scheme dialog.
This removes all assigned colors from the current color scheme.
2. Assign new colors to the color scheme as described above.3. (Optional) Save the color scheme as a file on a hard disk using the Save as command from
the File pulldown menu in the Color Scheme dialog.
Use menu item: To:File - Open Open a previously saved color scheme file.File - Save As Save the color scheme to a file.Color - Remove last Remove last color from the color scheme.Color - Remove all Remove all colors from the color scheme.

Page 12010 Generating Displays
Update Displays
Update Displays tool updates contours, triangles, a grid, elevation texts, slope arrows, and shaded surfaces after surface models were modified. This tool updates all display methods for all modified surfaces immediately after clicking on the tool icon.
Erase Display
Erase Display tool removes previously displayed contours, triangles, a grid, elevation texts, slope arrows, raster triangles, or shaded surfaces.
The tools opens a window which shows the status of the display methods for the selected surface. In the example below, for the surface named Ground, contours are displayed in Display only mode, elevation texts are drawn in Write to file mode, and a shaded surface is displayed as well. Triangles, a grid, slope arrows, or raster triangles are not displayed.
To erase display methods:
1. Select the Erase Display tool.2. This opens the Erase display dialog:
3. Select the Surface for which to remove a display method.4. Use the Erase button next to a display method to erase the respective display.5. Click Done in order to close the Erase display dialog.

Page 12110 Generating Displays
Display Boundary
Display Boundary tool draws a boundary shape of a surface model. This can be used to outline the area covered by the surface model.
To display the boundary of a surface model:
1. Select the Display Boundary tool.2. This opens the Display Boundary dialog:
3. Select the Surface you want to display.4. Move the mouse pointer inside a view.
The boundaries of the selected surface model are highlighted.
5. (Optional) Select a view with a data click to draw the boundary shape permanently in to the design file and/or to fit the view to the surface model.
Setting: Effect:Surface Name of the effected surface model.Draw permanently If on, the surface boundary is drawn as shape into the design file
when you enter a data point in a view.Fit view by surface If on, the software fits the view to the surface area when you
enter a data point.

Page 12210 Generating Displays
Label Peaks and Pits
Label Peaks and Pits tool draws labels for the highest point on hill tops and the lowest points inside depressions into the design file. The label contains a text showing the elevation value and a point marker placed at the location of the elevation point.
The layout of the label is determined by the settings in Elevation labels category of the TerraModeler Settings.
From the dialog of the tool, a peaks and pits settings file can saved for being used in automatic contour production. See Utility / Produce contours on page 216 for more information. The settings file stores all information given in the dialog except the surface model name.
To draw peaks and pits into the design file:
1. Select the Label Peaks and Pits tool.
This opens the Label Peaks and Pits dialog:
2. Define settings for peaks and pits display.
OR
2. Load a previously saved settings file into the dialog using the Load settings command from the File pulldown menu.
3. (Optional) Save the settings into a file on a hard disk by using the Save settings As command from the File pulldown menu.
Click Cancel to the Label Peaks and Pits dialog if you just want to save a peaks and pits settings file for automatic contour line production.
4. Click OK to the Label Peaks and Pits dialog.
The software searches for peaks and pits in the surface model and writes the labels into the design file.
Setting: Effect:Surface Name of the effected surface model.Peak level Level, color, and line weight of labels for peaks. Uses the active
MicroStation color table and MicroStation line weights.Pit level Level, color, and line weight of labels for pits. Uses the active
MicroStation color table and MicroStation line weights.Contour interval Distance between two consecutive contour lines.Peak area A peak label is placed if the area enclosed by the biggest closed
contour line around a hill top is at least as big as the given value.Pit area A pit label is placed if the area enclosed by the biggest closed
contour line around a depression is at least as big as the given value.

Page 12310 Generating Displays
Display Regions tool boxNot Lite
The tools in the Display Regions tool box are used to generate region-based displays from a surface model.
These display methods rely on fairly complex computations which are performed when you start a tool. The created display elements are not updated after modifications of a surface if the tool is run again or by the Update Displays tool.
To: Use:
Display rain water flow on surface Display Drainage
Display theme polygons colored by elevation, slope, or domain Display Themes
Display triangles colored by region boundaries Display Region Triangles
Display triangles with raster materials Display Raster Triangles

Page 12410 Generating Displays
Display DrainageNot Lite
Display Drainage tool computes and displays the flow of drainage water on a surface model. It uses a grid-based approach to determine the water flow.
The process starts by placing an imaginary rain drop at each grid cell. Then the software determines where that rain drop would travel. It compares the elevation of the cell center point with the elevation of each of the neighbouring cells. If a lower elevation is found, the rain drop travels to the neighbouring cell to which the slope is steepest. This process continues until each of the rain drops have reached a pit or a local minimum elevation point.
Display Drainage tool creates design file elements which are not linked to a surface model. Thus, TerraModeler is not able to update or erase elements created by this tool.
To display drainage:
1. Select the Display Drainage tool.
The Display drainage dialog opens:
2. Define settings and click OK.3. If Enter origin is switched on, define the origin point of a drainage grid cell with a data
point.
This computes the drainage water flow and displays the results temporarily in all open views. The display is updated every time when MicroStation updates the view contents.
In addition, the Drainage Detail dialog opens for Viewing the drainage system in detail.
Setting: Effect:Surface Name of the effected surface model.Grid size Size of the grid cells for drainage computation.Level Number of the level in the design file on which the drainage
network is drawn if it is drawn permanently into the design file.Color Color of the lines and arrows the represent the water flow. Uses
the MicroStation color table.Inside fence If on, the drainage system is only displayed inside a fence. This
is only active if a MicroStation fence has been drawn before the tool is started.
Enter origin If on, you can enter the origin point of a drainage grid cell with another data point.

Page 12510 Generating Displays
Viewing the drainage system in detailThe drainage display shows the paths that rain drops would travel according to the grid-based calculation. The arrows show the flow direction and the line width gives an indication on how many rain drops travel along a path. Red squares mark places where drainage water would gather (outlet, pour point). As the rain drops can not travel outside the surface model, there may be several squares at the outer edges of the model.
The Drainage Detail dialog allows you to control the level of detail in the drainage display.
When the slider is set to High, the drainage display shows the paths of each single rain drop. If you move the slider closer to Low, the software leaves out smaller streams and only displays the major paths. The drainage network remains visible as long as you keep the Drainage Detail dialog open.
In addition, the Show area button in the Drainage Detail dialog can be used to identify the runoff area for a selected drainage grid cell.
To view a runoff area:
1. Click on the Show area button in the Drainage Detail dialog.2. Move the mouse inside a view.
The size of the Runoff area for the grid square at the mouse pointer location is displayed in the Drainage Detail dialog. This is the combined surface area of all the squares from which a rain drop travels to or through the selected grid cell.
3. (Optional) Enter a data point in order to display the boundaries of the runoff area.
This draws the runoff area as a shape element into the design file using the active symbology.
When you close the Drainage Detail dialog, the software asks you if you want to draw the drainage display permanently. Confirm with Yes in order to draw the drainage network into the design file or with No in order to remove the temporary display of the drainage network.

Page 12610 Generating Displays
Display ThemesNot Lite
Display Themes tool creates colored shape elements to display theme areas in a surface model. Each theme area can represent an elevation range, a slope range, or a domain which has been assigned a distinctive color.
The result of theme coloring is very similar to the visualization created by Display Triangles tool. Both create elevation-based representations of a surface model which may look exactly the same when viewed in a top view. Display Themes tool has the advantage of creating only one shape element for each elevation or slope range. This results in a much smaller design file size compared with the triangle visualization approach which is advantageous especially in dynamic views.
Display Themes tool creates design file elements which are not linked to a surface model. Thus, TerraModeler is not able to update or erase elements created by this tool.
To display theme areas:
1. Select the Display Themes tool.
The Display themes dialog opens:
2. Define settings and click OK.
The theme areas are drawn as filled shape elements into the design file.
3. If Place legend is switched on, define the location of drawing the legend with another data point.
Setting: Effect:Surface Name of the effected surface model.Color by Defines the content of the theme areas:
• Elevation - each theme area represents an elevation range.• Slope - each theme area represent a slope range.• Domain - creates theme polygons from neighbouring triangles
assigned to the same domain. See Define Domains tool for more information.
Draw as Defines the shape type of theme areas:• 3d shapes - the shapes follow the surface model elevation.• 2d shapes - the shapes are plane and drawn at zero elevation.
Level Number of the level in the design file on which the theme area shapes are drawn.
Colors Opens the Color scheme dialog. See Creating a coloring scheme of discrete colors for more information.
Color button Opens the MicroStation color table for single color selection.

Page 12710 Generating Displays
Place legend If on, a legend for the theme colors can be placed in the design file. This is only active if a color scheme is defined.
Setting: Effect:

Page 12810 Generating Displays
Display Region TrianglesNot Lite
Display Region Triangles tool displays the trianlges of a surface model. The triangles are colored by regions which are defined by closed shape elements. The triangles and the parts of triangles falling inside each region are drawn using the color of the boundary shape. The tool may be used to visualize, for example, land use regions, soil type regions, or property boundaries.
Display Region Triangles tool creates design file elements which are not linked to a surface model. Thus, TerraModeler is not able to update or erase elements created by this tool.
To display region triangles:
1. Use MicroStation Selection tool to select region boundary shapes.2. Select the Display Region Triangles tool.
This opens the Display Region Triangles dialog:
3. Define settings and click OK.
This writes triangles colored by region into the design file.
Setting: Effect:Surface Name of the effected surface model.Level Number of the level in the design file on which region
triangles are drawn.Create graphical groups If on, the triangles inside each region form one graphical
group.Draw triangles outside regions If on, triangles which are outside all selected boundary
shapes are drawn using the given Color.

Page 12910 Generating Displays
Display Raster TrianglesNot Lite
Display Raster Triangles tool displays triangles in a manner suitable for rendered images. The triangles are used by TerraPhoto in order to drape images on a surface model in rendered views. The images have to be attached as raster references in TerraPhoto.
The raster triangles are not drawn permanently into the design file and they remain linked to the surface model. This allows TerraModeler to update the display after modifications and to erase the display using the Erase Display tool.
To display raster triangles:
1. Select the Display Raster Triangles tool.
This opens the Display Raster Triangles dialog:
2. Define settings and click OK.
This displays the triangles. You can now use TerraPhoto tools to create rendered views.
Setting: Effect:Surface Name of the effected surface model.Display for Rendering method that uses the raster triangles:
• TerraPhoto rendering - raster files attached in TerraPhoto are draped on the triangles if a view is rendered with TerraPhoto rendering tools.
Level Number of the level in the design file on which the raster triangles are drawn.
Color Color of the raster triangles. Uses the active MicroStation color table.

Page 13011 Drawing Profiles
11 Drawing Profiles
Profiles tool boxThe tools in the Profiles tool box are used to draw profiles and cross sections. Profiles and cross sections rely on alignment elements. The tools for updating profiles, projecting elements to and from profiles, labeling profile elevations, and creating output reports from profiles only work as long as the alignment element is available in the design file.
For reasons of simpicity, the following text refers to profiles and cross sections with the term “profile” if no differentiation between the two elements is necessary. This corresponds to the way of naming the tools in the software. The tools Update Profile, Project into Profile, Project From Profile, and Label Profile Elevations can be applied to cross sections as well.
To: Use:
Draw cross section view Draw Section View
Draw profile along an alignment Draw Profile
Draw cross sections along an alignment Draw Alignment Sections
Update profile or cross section Update Profile
Setup views to automatically display surface sections Setup Automatic Sections
Project 3d elements into a profile Project Into Profile
Project elements from a profile to 3d Project From Profile
Label profile with an element's elevations Label Profile Elevations
Output surface elevations along an alignment Output Profile Elevations
Output surface elevations for cross sections Output Section Elevations

Page 13111 Drawing Profiles
Draw Section View
Draw Section View tool creates a 3D section view that can be used for design purposes. A section view is a rotated view along a section line.
A section view is not meant to be plotted on paper. As its name implies, it is a rotated cross section view drawn at the true 3D position of the section line. This makes it ideal for design purposes. If you use a section view to place elements, they are drawn to a true 3D position.
The tool draws a line for each surface at the section’s location if the surface type is selected to be drawn in profiles. The symbology of the line is related to the surface type and determined by settings in Surface types category in TerraModeler Settings. Optionally, the elevation range can be drawn including grid lines and labels.
To draw a section view:
1. Select the Draw Section View tool.
This opens the Draw Section View dialog:
2. Define settings in the dialog.3. Enter the start point and the end point of the section line in a top view.
Continue with step 4 below.
OR
1. Select the center line element of the section view.2. Select the Draw Section View tool.3. Define settings in the dialog.4. Define the section view depth by entering a data click in the top view or by defining the
value in the Depth field.5. Identify the view to be used as the section view with a data click.6. If Z range is set to Prompt for, the Section view range dialog opens:
7. Define a Start elevation, End elevation, and vertical Step size and click OK.
The view is rotated to show the section with the section line start point on the left and the section line end point on the right. The depth of the view corresponds to the given depth value of the section.
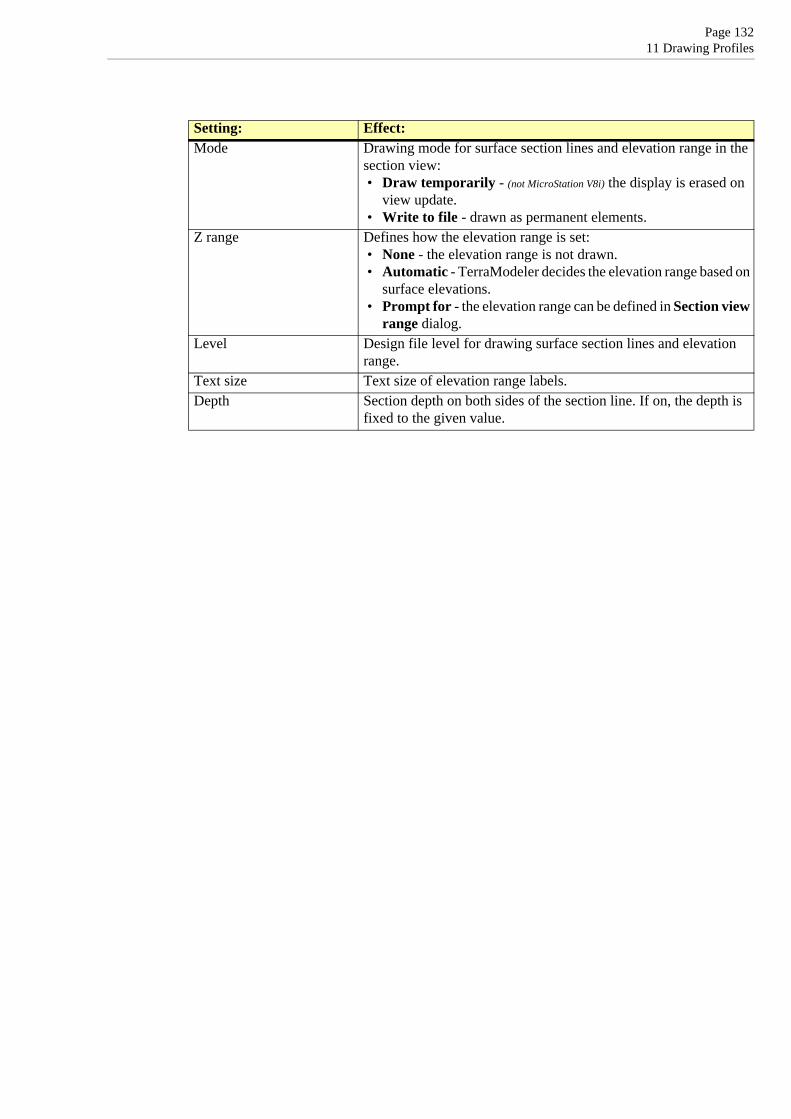
Page 13211 Drawing Profiles
Setting: Effect:Mode Drawing mode for surface section lines and elevation range in the
section view:• Draw temporarily - (not MicroStation V8i) the display is erased on
view update.• Write to file - drawn as permanent elements.
Z range Defines how the elevation range is set:• None - the elevation range is not drawn.• Automatic - TerraModeler decides the elevation range based on
surface elevations.• Prompt for - the elevation range can be defined in Section view
range dialog.Level Design file level for drawing surface section lines and elevation
range.Text size Text size of elevation range labels.Depth Section depth on both sides of the section line. If on, the depth is
fixed to the given value.

Page 13311 Drawing Profiles
Draw Profile
Draw Profile tool draws a profile along an alignment element. The profile shows the shape of surface models along the alignment.
The alignment element can be any linear element. Valid element types include lines, line strings, curves, arcs, ellipses, shapes, complex chains, and complex shapes.
A profile is drawn as a cell element that can be freely positioned anywhere in the design file.
The horizontal length of the profile cell is equal to the 2D length of the alignment element. The horizontal scale represents the intended plotting scale of the profile. All text items in the profile are scaled according to the plotting scale.
The design of the elevation range grid for the profile is defined by settings in the Draw profile dialog as well as in Profiles / Elevation grid category of the TerraModeler Settings. The profile cell is drawn into the design file on the active level or on several levels that are defined in Profiles / Levels category of the TerraModeler Settings.
A profile can have a name written on top of the profile. The symbology settings for the name as well as for bottom row titles of specific layouts can be found in Profiles / Titles category of the TerraModeler Settings. There is also the option to add additional information at the bottom of the profile. This is defined in Profiles / Layouts category of the TerraModeler Settings.
To draw a profile:
1. (Optional) Select the alignment element.2. Select the Draw Profile tool.3. Identify the alignment element if it has not been selected in step 1.
The Draw profile dialog opens:
4. Define settings in the dialog.5. (Optional) Select surfaces for being displayed in profiles using the Surfaces button. See
Profile surfaces for more information.

Page 13411 Drawing Profiles
6. (Optional) Define settings for profile labels using the Labels button. See Profile labels for more information.
7. Click OK in the Draw profile dialog.
The profile outline is displayed at the mouse pointer position.
8. Define the location of the profile cell in a design file top view with a data click.
This draws the profile into the design file.
Setting: Effect:Name Name drawn on top of the profile.Layout Layout scheme which defines the data rows that appear below the
elevation grid of the profile:• No layout - no data row is drawn below the profile.• “layout name” - uses the selected layout scheme which has
been defined in Profiles / Layouts category of TerraModeler Settings.
Horizontal Horizontal scale that defines the intended plotting scale.Vertical Vertical scale that defines the elevation exaggeration as the ratio of
horizontal / vertical scale.Label Position where scale labels are drawn: Along axis or Upper
corner.Color Color of the elevation range grid lines and labels.Start Lowest elevation of the elevation range.End Highest elevation of the elevation range.Step Vertical step size of the elevation range.Start station Start station value of the alignment element.End station End station defined by the length of the alignment element:
• Increasing - station values are increasing from start to end station.
• Decreasing - station values are decreasing from start to end station.
Draw only partial alignment If on, the profile is only drawn for a part of the alignment defined by From station and To station.
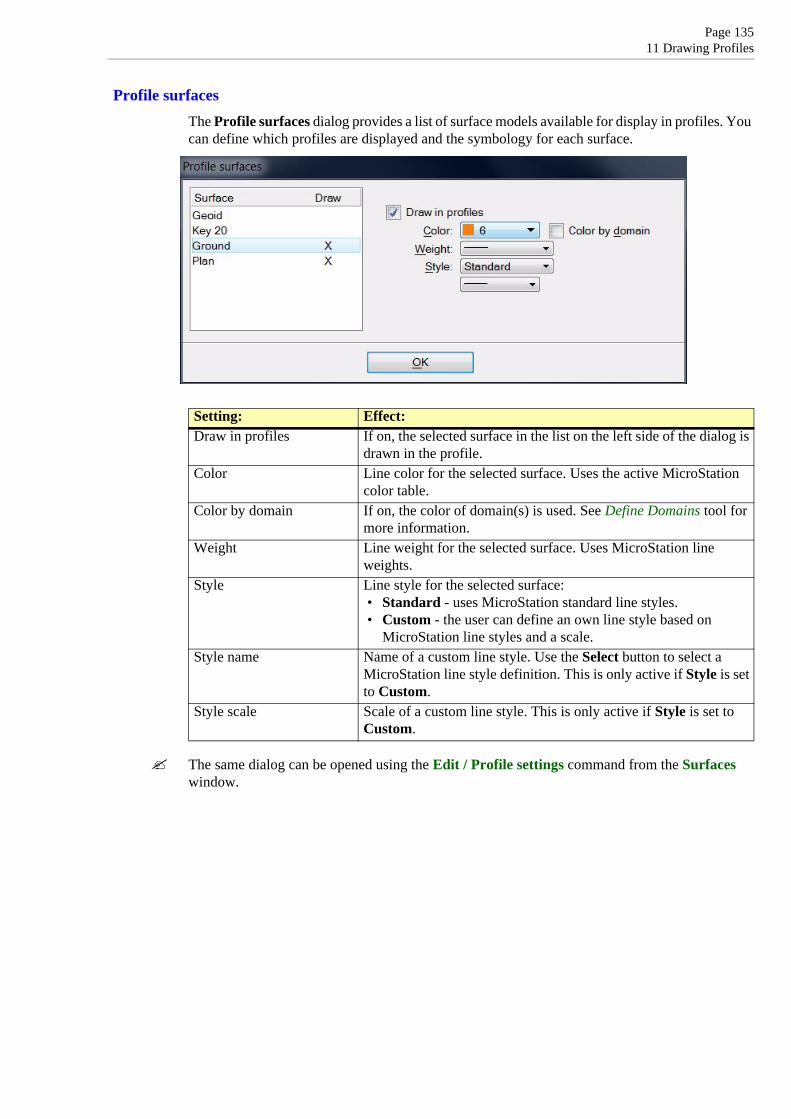
Page 13511 Drawing Profiles
Profile surfacesThe Profile surfaces dialog provides a list of surface models available for display in profiles. You can define which profiles are displayed and the symbology for each surface.
The same dialog can be opened using the Edit / Profile settings command from the Surfaces window.
Setting: Effect:Draw in profiles If on, the selected surface in the list on the left side of the dialog is
drawn in the profile.Color Line color for the selected surface. Uses the active MicroStation
color table.Color by domain If on, the color of domain(s) is used. See Define Domains tool for
more information.Weight Line weight for the selected surface. Uses MicroStation line
weights.Style Line style for the selected surface:
• Standard - uses MicroStation standard line styles.• Custom - the user can define an own line style based on
MicroStation line styles and a scale.Style name Name of a custom line style. Use the Select button to select a
MicroStation line style definition. This is only active if Style is set to Custom.
Style scale Scale of a custom line style. This is only active if Style is set to Custom.

Page 13611 Drawing Profiles
Profile labelsThe Profile labels dialog defines settings for labeling stations and surface elevations in a profile. The symbology for bottom row labels, station labels, and elevation labels can be defined in Profiles / Labels category of TerraModeler Settings.
Setting: Effect:Label stations If on, the station values along the alignment are drawn below the
profile.Step Horizontal step size of alignment stations that are labeled.At fixed intervals If on, surface elevation labels are drawn below the profile at fixed
Steps.Draw vertical line If on, a vertical line is drawn at the location of an elevation label.
This is only active if At fixed intervals is switched on.At locations If on, elevation labels are drawn at locations where there is a change
in the surface model:• All triangle edges - locations where the alignment intersects a
triangle edge.• Breakline edges - locations where the alignment intersects a
breakline edge.• Slope changes - locations where the slope changes more than
the given Change limit value.• Peaks and pits - local maximum and minimum elevations.
Label station of each location
If on, a station label is placed at the location of an elevation label. This is only active if At locations is switched on.
Draw vertical line If on, a vertical line is drawn at the location of an elevation label. This is only active if At locations is switched on.

Page 13711 Drawing Profiles
Draw Alignment Sections
Draw Alignment Sections tool draws cross sections along an alignment. Each cross section shows the shape of surface models at a position along the alignment. You can specify the width of the cross sections as a left and a right width perpendicular from the alignment.
The alignment element can be any linear element. Valid element types include lines, line strings, curves, arcs, ellipses, shapes, complex chains, and complex shapes.
The cross sections are drawn as a group of cells that can be freely positioned anywhere in the design file. The arrangement of the cross sections in the group can be defined in Cross sections / Placement category of the TerraModeler Settings.
The design of the elevation range grid drawn for each cross sections is defined by settings in the Draw sections along alignment dialog as well as in Cross sections / Elevation grid category of the TerraModeler Settings. The cross section cells are drawn into the design file on the active level or on several levels that are defined in Profiles / Levels category of the TerraModeler Settings.
To draw alignment sections:
1. (Optional) Select the alignment element.2. Select the Draw Alignment Sections tool.3. Identify the alignment element if it has not been selected in step 1.
The Draw sections along alignment dialog opens:
4. Define settings in the dialog.5. (Optional) Select surfaces for being displayed in cross sections using the Surfaces button.
See Profile surfaces for more information.6. (Optional) Define settings for cross section labels using the Labels button. See Alignment
section labels for more information.7. Click OK in the Draw sections along alignment dialog.
The cross section outlines are displayed at the mouse pointer position.

Page 13811 Drawing Profiles
8. Define the location of the group of profile cells in a design file top view with a data click.
This draws the cross sections into the design file.
Alignment section labelsThe Alignment section labels dialog defines settings for labeling offsets and surface elevations in cross sections. The symbology for offset labels can be defined in Cross sections / Offset labels category and for surface elevation labels in Cross sections / Elevation labels category of TerraModeler Settings.
Setting: Effect:Start station Start station value of the alignment element.End station End station value defined by the length of the alignment
element:• Increasing - stations values are increasing from start to end
station.• Decreasing - station values are decreasing from start to end
stationFrom station First station on which a cross section is drawn.To station Last station from which a cross section can be drawn.Interval Station interval between two successive cross sections.
Determines the number of cross sections drawn.Left width Cross section width perpendicular to the left from the alignment.Right width Cross section width perpendicular to the right from the
alignment.Horizontal Horizontal scale which defines the intended plotting scale.Vertical Vertical scale which defines the elevation exaggeration as the
ratio of horizontal / vertical scale.Color Color of the elevation range grid lines and labels.Binding Defines how the elevation range changes along the alignment:
• Stays constant - the range stays the same as for the first cross section.
• Follows 3d alignment - the range is adjusted to the elevation of the alignment at the cross section location.
• Follows surface - the range is adjusted to the elevation of the selected Surface at the cross section location.
From Lowest elevation range value for the first cross section. The 1. z value next to the field shows the elevation value at the first cross section location.
To Highest elevation range value for the first cross section.Step Vertical step size of the elevation range.Label binding elevation If on, the binding elevation is labeled by a text and a guide line
in each cross section.

Page 13911 Drawing Profiles
Setting: Effect:Label offsets at fixed intervals
If on, labels for the offset from the alignment are drawn below each cross section. The distance between offset labels is defined in the Step field. Offset values are negative to the left and positive to the right of the alignment.
Draw offset ticks If on, small lines for the offset from the alignment are drawn at the bottom of each cross section. The distance between offset ticks is defined in the Step field.
At fixed intervals If on, surface elevations labels at fixed Steps are drawn below the cross section.
Draw vertical line If on, a vertical line is drawn at the location of an elevation label. This is only active if At fixed intervals is switched on.
At locations If on, elevation labels are drawn at locations where there is a change in the surface model:• All triangle edges - locations where the alignment intersects a
triangle edge.• Breakline edges - locations where the alignment intersects a
breakline edge.• Slope changes - locations where the slope changes more than a
given Change limit.• Peaks and pits - local maximum and minimum elevations.
Label offset of each location
If on, an offset label is placed at the location of an elevation label. This is only active if At locations is switched on.
Draw vertical line. If on, a vertical line is drawn at the location of an elevation label. This is only active if At locations is switched on.

Page 14011 Drawing Profiles
Update Profile
Update Profile tool updates profile cell(s) after surface models or alignment elements were modified. The tool redraws the selected cells.
To update a profile:
1. Select profile cell(s) to update.2. Select the Update Profile tool.
The selected cell(s) are redrawn.
The Update Profile tool works only as long as the alignment element for a profile is drawn in the design file. Once the alignment element is deleted, the update is no longer possible.

Page 14111 Drawing Profiles
Setup Automatic Sections
Setup Automatic Sections tool defines views and symbology settings for displaying surface models in section views automatically. The settings are used by several tools in TerraScan, such as Draw Vertical Section, Rotate Section, Cut Section, Synchronize Views, and Travel Path. The surface(s) are drawn as lines in the section views. The display option can be used, for example, to compare laser data elevations with surface elevations.
To setup automatic sections:
1. Select the Setup Automatic Sections tool.
This opens the Automatic Sections dialog:
2. Select view(s) in which the surfaces are to be displayed.3. Click on the Colors button.
This opens the Profile surfaces dialog.
4. Define symbology settings for surfaces that are drawn in section views.5. Click OK to the Profile surfaces dialog.
The surface(s) are now displayed in section views that are created by TerraScan tools. The display is active as long as a view is selected in the Automatic Sections dialog. Thus, you may close the Automatic Sections dialog.

Page 14211 Drawing Profiles
Project Into Profile
Project Into Profile tool projects 3D elements into a profile. This tool creates a copy of the element with its coordinates translated into the profile's coordinate system.
The element to be projected has to be a cell or a linear element. The element should be positioned within the extents of the profile alignment.
Linear elements are projected as a line string or a complex chain into profile cells. The application calculates a line string that approximates an arc, an ellipse, or a curve. The symbology of the elements in the profile is determined by the symbology of the original element.
To project element(s) into a profile:
1. Select the Project Into Profile tool.2. Identify a profile into which the element(s) are projected.3. Identify an element to project.4. Accept the element with another data click.
The element is projected into the profile. You can continue with step 3.
OR
1. Select element(s) to project.2. Select the Project Into Profile tool.3. Identify a profile into which the element(s) are projected.4. Accept the element(s) with another data click.
The element(s) are projected into the profile.
The Project Into Profile tool works only as long as the alignment element for a profile is drawn in the design file. Once the alignment element is deleted, the projection of element into a profile is no longer possible.

Page 14311 Drawing Profiles
Project From Profile
Project From Profile tool projects elements from a profile into their 3D position. The tool creates a copy of the elements that run along the profile's alignment.
The tool can be used, for example, with an element representing a vertical alignment that has been designed in the profile. The element has to be linear. It should not extend beyond the profile's left or right margin.
The tool creates a new 3D complex chain running along the profile's alignment. The symbology of the new element is determined by the active symbology in MicroStation.
To project element(s) from a profile:
1. Select the Project From Profile tool.
The Project From Profile dialog opens:
2. Enter a Horizontal step value in order to define the maximum distance between consecutive vertices along the new 3D element.
3. Identify the profile from which the element(s) are projected.4. Identify an element to project.5. Accept the element with another data click.
The element is projected into a new 3D complex chain running along the profile's alignment. You can continue with step 3.
OR
1. Select element(s) to project.2. Select the Project From Profile tool.3. Enter a Horizontal step value in order to define the maximum distance between
consecutive vertices along the new 3D element.4. Identify the profile from which the element(s) are projected.5. Accept the element(s) with another data click.
The Project from Profile tool works only as long as the alignment element for a profile is drawn in the design file. Once the alignment element is deleted, the projection of element from a profile is no longer possible.

Page 14411 Drawing Profiles
Label Profile Elevations
Label Profile Elevations tool labels a profile with elevation values. The tool can label a linear element drawn in the profile or single points identified with data points in the profile.
This tool can be used, for example, with an element representing a vertical alignment that has been designed in the profile. The element has to be linear. It should not extend beyond the profile's left or right margin. The tool translates the y-coordinates of the element into elevation values and writes these values below the profile.
The font, size, and number settings for the labels can be defined in Profiles / Labels category of TerraModeler Settings. The symbology of the labels is determined by the active symbology settings in MicroStation.
To label a profile with elevations:
1. Select the Label Profile Elevations tool.
This opens the Label Profile Elevations dialog:
2. Define settings in the dialog.3. Identify the profile to label.
Continue according to the selected Method.
Method: Linear element
4. Identify a linear element to be labeled.5. Accept the element.
The element's elevations are labelled. You can continue with step 4.
Method: Single location
4. Move the mouse pointer inside the profile area.
The elevation at the mouse pointer location is displayed.
5. Enter a data point in order to draw the label into the design file.
You can continue with step 5.
Setting: Effect:Method Labeling method:
• Linear element - labels elevations of a linear element at fixed Steps.
• Single location - labels the elevation of a single data point.Label station / offset If on, the station value (profiles) or the offset from an alignment
(cross sections) is drawn for each elevation. For station values the labeling relies on the settings for bottom row contents defined in Profiles / Layouts category of the TerraModeler Settings.
Draw vertical line If on, a vertical line is drawn at each elevation label location.

Page 14511 Drawing Profiles
The Label Profile Elevations tool works only as long as the alignment element for a profile is drawn in the design file. Once the alignment element is deleted, labeling profile elevations is no longer possible.
Bottom row Distance between the lower boundary of the profile’s elevation range and the line of elevation labels. Given as millimeters on paper.
Setting: Effect:

Page 14611 Drawing Profiles
Output Profile ElevationsNot Lite
Output Profile Elevations tool creates a text report which contains surface model elevations along an alignment element. The elevation positions for the output can be at fixed intervals or only at locations where there is a change in the shape of the surface model. You can view the report, print it out, or save it as a text file.
To output elevations along an alignment:
1. Select the Output Profile Elevations tool.2. Identify the alignment to output elevations along.3. Accept the highlighted alignment.
This opens the Output profile elevations dialog:
4. Define settings.5. (Optional) Click on the Format button to select options controling the Profile Output
format.6. Click OK to the Output profile elevations dialog.
This opens a report window which contains the output information. Use the commands from the File pulldown menu to print the report or save it into a text file.
Setting: Effect:Surface Name of the surface for which a report is created.Alignment name Descriptive name for the alignment in the report.Start station Station value at the start point of the alignment element.End station End station value defined by the length of the alignment element:
• Increasing - station values are increasing from start to end station.
• Decreasing - station values are decreasing from start to end station.
Output at fixed intervals If on, output surface elevations at a fixed interval. The Step field value determines the size of the interval.

Page 14711 Drawing Profiles
Profile Output formatThe Profile output format dialog provides some choices for formatting the output of the Output Profile Elevations tool.
The output file may contain some starting rows including Header, Surface name, and Alignment name. Each generates one output line if selected.
Each elevation position is written in one line. You can select what information fields are included in the output: Station, Easting, Northing, and Elevation.
When using Output at fixed intervals, the application computes elevation positions at fixed intervals along the alignment. Some of these positions may be outside the surface model. The Outside field determines if outside positions are written and what text is used for the output.
When using Output at surface changes with All triangle edges as locations, the application generates output positions only at triangle edges. The alignment may go outside the surface model in between the generated positions. If Write row is on, the application outputs a line between the positions to indicate that the alignment is outside the surface model or goes through a hole in the model.
At locations If on, output surface elevations at locations where there is a change in the surface model:• All triangle edges - locations where the alignment intersects a
triangle edge.• Breakline edges - locations where the alignment intersects a
breakline edge.• Slope changes - locations where the slope changes more than a
given limit.• Peaks and pits - local maximum and minimum elevations.
Setting: Effect:

Page 14811 Drawing Profiles
Output Section ElevationsNot Lite
Output Section Elevations tool creates a text report which contains surface model elevations from cross sections along an alignment element. The cross section positions for the output can be at fixed intervals or only at locations where there is a change in the shape of the surface model. You can view the report, print it out, or save it as a text file.
To output elevations from alignment sections:
1. Select the Output Section Elevations tool.2. Identify the alignment for the sections.3. Accept the highlighted alignment.
This opens the Output section elevations dialog:
4. Define settings.5. Select surfaces from the list in the lower part of the dialog. Only selected surfaces are
included in the output.6. (Optional) Click on the Format button to select options controling the Section output
format.7. Click OK to the Output section elevations dialog.
This opens a report window which contains the output information. Use the commands from the File pulldown menu to print the report or save it into a text file.
Setting: Effect:Alignment name Descriptive name for the alignment in the report.Start station Station value at the start point of the alignment element.

Page 14911 Drawing Profiles
Section output formatThe Section output format dialog provides some choices for formatting the output of the Output Section Elevations tool.
The output file may contain some starting rows including Header, Alignment name, and Surface count. Each generates one output line if selected.
End station End station value defined by the length of the alignment element:• Increasing - station values are increasing from start to end
station.• Decreasing - station values are decreasing from start to end
station.From station First station on which a cross section is included in the output.To station Last station from which a cross section can be included in the
output.Interval Station interval between two successive cross sections.
Determines the number of cross sections in the output.Left width Cross section width perpendicular to the left from the alignment.Right width Cross section width perpendicular to the right from the
alignment.Output at fixed intervals If on, output surface elevations at a fixed interval along the cross
section. The Step field determines the size of the interval.Output at surface changes If on, output surface elevations at locations where there is a
change in the surface model:• All triangle edges - locations where the alignment intersects
a triangle edge.• Breakline edges - locations where the alignment intersects a
breakline edge.• Slope changes - locations where the slope changes more
than a given limit.• Peaks and pits - local maximum and minimum elevations.
Setting: Effect:

Page 15011 Drawing Profiles
If Section start is switched on, a line is written to indicate the start of a new cross section. You can specify the prefix text appearing before the station value.
If Surface start field is switched on, a line is written to indicate the start of a new surface. You can specify the prefix text appearing before the surface name.
Each elevation position of a cross section is written in one line. You can select what information fields are included in the output: Offset, Easting, Northing, and Elevation.
When using Output at fixed intervals, the application computes elevation positions at fixed intervals along the cross section. Some of these positions may be outside the surface model. The Outside field determines if outside positions are written and what text is used for the output.
When using Output at surface changes with All triangle edges as locations, the application generates output positions only at triangle edges. The alignment may go outside the surface model in between the generated positions. If Write row is on, the application outputs a line between the positions to indicate that the cross section is outside the surface model or goes through a hole in the model.

Page 15112 Computing Quantities
12 Computing Quantities
Quantity tool boxThe Quantity tool box contains tools that can be used to compute quantities between surface models or between surface models and cross sections of trenches, to find the intersection between two surfaces or to compute surface model areas. Further, there is a tool for computing tunnel volumes based on tunnel cross sections.
Compute Quantity is probably used most often. It calculates volumes between two surfaces using the grid method. It can calculate volumes from entire surface models or from areas restricted by a MicroStation fence.
Define Section Templates and Compute Section Quantity tools can be used for calculating volumes along an alignment. The calculation is based on the traditional end-area method.
To: Use:
Compute quantities using grid method Compute Quantity
Compute quantities using prismoidal method Compute Prismoidal Quantity
Compute quantities along an alignment Compute Alignment Quantity
Define section templates for trenches Define Section Templates
Compute trench quantities using section templates Compute Section Quantity
Compute tunnel volume from section elements Compute Tunnel Volume
Draw intersection of two surfaces Draw Surface Intersection
Compute surface area Compute Area

Page 15212 Computing Quantities
Compute Quantity
Compute Quantity tool computes quantities between two surfaces and produces results summing up both, cut and fill volumes. The calculation is based on a grid method. You can control the accuracy and speed of calculation by defining the grid size.
You can use a fence or a selected shape element to define the area for calculation. The computation area can be further limited by another surface.
The surfaces for volume calculation can be defined by surface models loaded in TerraModeler or by laser points loaded in TerraScan.
The tool provides several options for creating text reports of the quantity calculation results. The results are presented in a separate report windows from which a text file can be saved or the report can be printed directly. Besides a simple report for the overall calculation results, there is also the possibility to output Quantity reports for subregions.
To compute quantities using the grid method:
1. Select the Compute Quantity tool.
The Compute Quantity dialog opens:
2. Define settings.3. If a text report for subregions should be created, click on the Reporting button to define
settings for the output. See Quantity reports for subregions for more information.4. Click on the Calculate button to start the computation.
The computation results are displayed on the right side of the Compute Quantity dialog, and possibly in the design file and a separate report window.
The results of the calculation for the whole area can be saved into a simple text report using the Print button in the Compute Quantity dialog.
The Erase display button appears if the results of the quantity computation have been displayed with setting Display only. Then, the button can be used to remove the temporary elements that illustrate the computation result. The temporary elements also disappear if the Compute Quantity dialog is closed.
Setting: Effect:Upper surface Name of the upper surface model for the quantity calculation. If
Laser points is selected, the field for entering class number(s) becomes active. Use the >> button in order to open the Select classes dialog for class selection.This requires that respective laser points are loaded in TerraScan.

Page 15312 Computing Quantities
Quantity reports for subregionsThe Quantity reporting dialog provides an option to create output reports of quantity computa-tions for subregions. In addition, a text file can be created that stores variable - value pairs.
Subregions and their names in the report can be defined in several ways:
• Coordinate blocks - the software divides the computation area automatically into squared blocks of a given size. The corner coordinates of the blocks are full meter coordinate values. The names for the subregions are automatically generated from the lower left corner coordinates of each block.
• Selected shapes - subregions are defined by selected shapes. This is useful for creating output values for distributed computation areas that are not adjacent to each other. The names for the subregions can be defined by text elements that is placed inside the shapes and selected together with the shapes. The software uses the selected text element whose origin point is
Lower surface Name of the lower surface model for the quantity calculation. If Laser points is selected, the field for entering class number(s) becomes active. Use the >> button in order to open the Select classes dialog for class selection.This requires respective laser points are loaded in TerraScan.
Limit Limiting surface to restrict the calculation area:• None - no limiting surface used.• Area - calculate only within the Limit surface area.• Lower limit - calculate only above Limit surface.• Upper limit - calculate only below Limit surface.
Limit surface Surface to limit the calculation area. This is not active if Limit is set to None.
Inside fence If on, the calculation takes place only inside a fence or a selected shape element. This is only active if a MicroStation fence has been placed or a shape selected.
Step Defines the grid size for the calculation. A small step produces more accurate results but the calculation process takes longer.
Surf cut limit The software computes the cut volume separately for places where the cut depth is less than this value. This may be used for billing purposes if the price is not based on the cut volume but on the cut area.
Display Display method for presenting the calculation results graphically in the design file:• No display - nothing is drawn into the design file.• Display only - draws temporary vertical line elements.• Write to file - draws permanent elements on the active level.
Draw as Elements used to present the results graphically:• Vertical lines - a vertical line is drawn at the center of each
calculated grid cell. This is the only available option if Display is set to Display only.
• Horizontal lines - a horizontal lines is drawn for each calculated grid cell row.
• Filled shapes - a shape is drawn for each calculated grid cell row.
• Pilars - a 3D block is drawn for each calculated grid cell. Each block is build from 4 shape elements which may end up with a big number of elements to draw.
Color fields next to calculation result lines
Defines the display color for drawing the results in the design file. Uses the active color table in MicroStation.
Setting: Effect:

Page 15412 Computing Quantities
inside a selected shape for naming the respective subregion in the report. In addition, if the text element ends with a numerical value, this can be used as a multiplier for the calculated quantities. This may be useful, for example, if a material has a certain density which effects the volume of this material. If no text element is used, the subregions are named automatically with "Region 1", "Region 2", etc.
• Elevation range - the computation is performed for a given elevation or depth range. A subregion is defined by a given elevation or depth value interval. The subregions are named automatically by the range values.
A report can include both, results for horizontal regions and for vertical ranges.
A variable text file can be created for horizontal regions only. The file saves a variable name and its value into a comma-separated text file. Each variable - value pair is written into a new line which starts with the # character. The file starts with the Metadata variables, followed by variables for each region, and finally the total values for the whole computation area.
The variable names for each region are a combination of the subregions name and the variable name separated by a underline character, for example, Region 1_CUT for the cut volume of a subregion, or Example1_FILL for the fill volume of a region named Example1.
To setup quantity reports for subregions:
1. Click on the Reporting button in the Compute Quantity dialog.
The Quantity reporting dialog opens:
2. Define settings according to your needs for the output report.3. Click OK.
You can continue with Calculate in the Compute Quantity dialog.
If one of the options in the Quantity reporting dialog is switched on, an Output report window is displayed. Use the commands from the File pulldown menu in the report window to save the report as a text file or to print it directly.
If Variables is set to Write text file in the Quantity reporting dialog, the file storing variable - value pairs is created and saved at the given location on a hard disk.
Setting: Effect:Report title Free text that is used as title in the report.
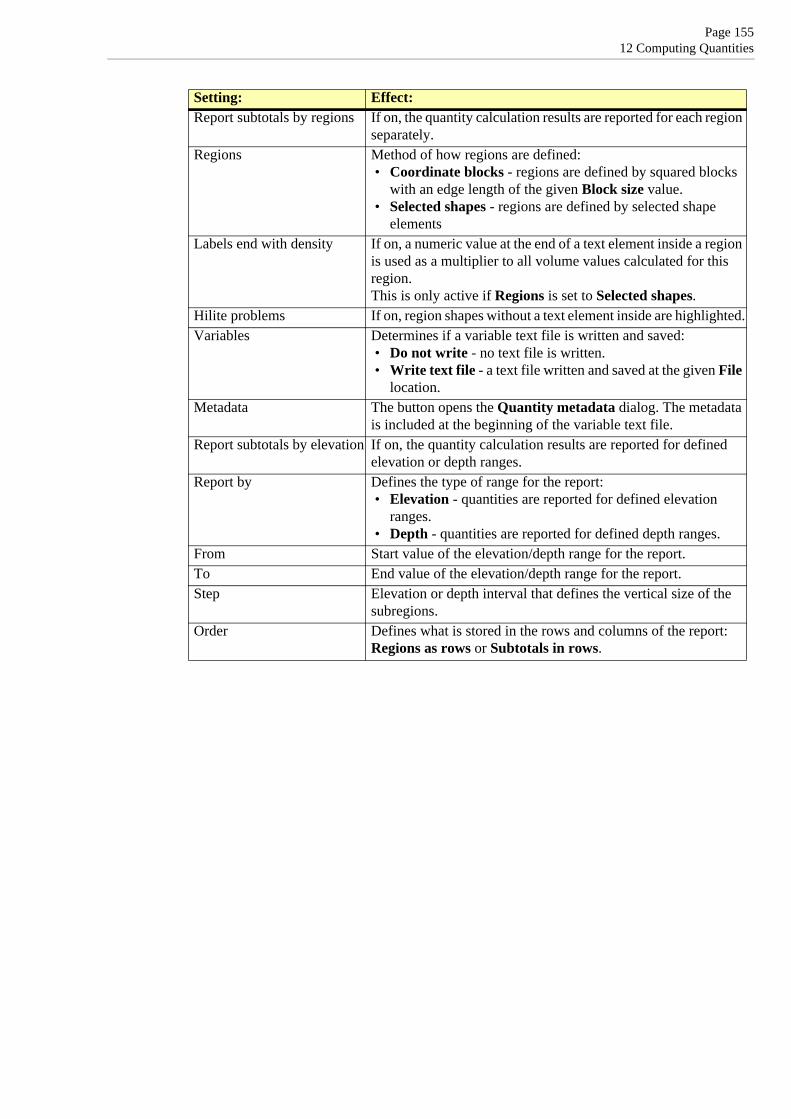
Page 15512 Computing Quantities
Report subtotals by regions If on, the quantity calculation results are reported for each region separately.
Regions Method of how regions are defined:• Coordinate blocks - regions are defined by squared blocks
with an edge length of the given Block size value.• Selected shapes - regions are defined by selected shape
elementsLabels end with density If on, a numeric value at the end of a text element inside a region
is used as a multiplier to all volume values calculated for this region.This is only active if Regions is set to Selected shapes.
Hilite problems If on, region shapes without a text element inside are highlighted.Variables Determines if a variable text file is written and saved:
• Do not write - no text file is written.• Write text file - a text file written and saved at the given File
location.Metadata The button opens the Quantity metadata dialog. The metadata
is included at the beginning of the variable text file.Report subtotals by elevation If on, the quantity calculation results are reported for defined
elevation or depth ranges.Report by Defines the type of range for the report:
• Elevation - quantities are reported for defined elevation ranges.
• Depth - quantities are reported for defined depth ranges.From Start value of the elevation/depth range for the report.To End value of the elevation/depth range for the report.Step Elevation or depth interval that defines the vertical size of the
subregions.Order Defines what is stored in the rows and columns of the report:
Regions as rows or Subtotals in rows.
Setting: Effect:

Page 15612 Computing Quantities
Compute Prismoidal QuantityNot Lite
Compute Prismoidal Quantity tool computes quantities between two surfaces and produce results summing up both, cut and fill volumes. The calculation is based on a prismoidal method: the application compares the triangles of the two surfaces. This is the mathematically accurate method for computing quantities.
You can use a fence or a selected shape element to limit the area for calculation.
To compute quantities using prismoidal method:
1. Select the Compute Prismoidal Quantity tool.
The Compute prismoidal quantity dialog opens:
2. Define settings and click Compute.
The computation results are displayed in the Compute prismoidal quantity dialog and possibly in the design file.
Setting: Effect:Upper surface Name of the upper surface model for the quantity calculation.Lower surface Name of the lower surface model for the quantity calculation.Inside fence If on, the calculation takes place only inside a fence or a selected
shape element. This is only active if a MicroStation fence is placed or a shape is selected.
Display Display method for presenting the calculation results graphically in the design file:• No display - nothing is drawn into the design file.• Draw temporarily - (not MicroStation V8i) draws triangles as
temporary elements.• Write to file - draws triangles as permanent elements into the
design file on the active level.Color fields next to calculation result lines
Defines the display color for drawing the results in the design file. Uses the active color table in MicroStation.

Page 15712 Computing Quantities
Compute Alignment QuantityNot Lite
Compute Alignment Quantity tool computes quantities along an alignment element. The tool uses the grid method for computing quantities between two surfaces.
The alignment can be defined by a linear element, such as a 3D line string or complex chain. The area of calculation is limited by the extension of the alignment element. It may be further limited by another surface model.
The surfaces can be defined by surface models in TerraModeler or by laser points loaded in TerraScan.
The results of the computation are shown in the tool’s dialog. They can be presented graphically in the design file and a text report can be stored as well.
To compute quantities along an alignment:
1. Select an alignment element.2. Select the Compute Alignment Quantity tool.
The Compute alignment quantities dialog opens:
3. Define settings for the computation related to the alignment element.4. Click on the Calculation button.
This opens another Compute alignment quantities dialog:

Page 15812 Computing Quantities
5. Define settings related to surface models, computation steps, and display of the results.6. Click on the Calculate button.
The computation of the quantities starts. The results are displayed in the Compute alignment dialog on the right side and possibly in the design file. If Print to file was selected in the first dialog, a window opens to define the location for storing the text file on a hard disk.
Setting: Effect:Start station Station value at the start point of the alignment element.End station End station value defined by the length of the alignment
element:• Increasing - station values are increasing from start to end
station.• Decreasing - station values are decreasing from start to end
stationFrom station Start station value for the quantity computation.To station End station value for the quantity computation.Left width Defines the computation area boundary parallel to the left from
the alignment.Right width Defines the computation area boundary parallel to the right from
the alignment.Print to file If on, the results of the computation are saved into a simple text
file.Draw into design If on, the boundaries of the computation area and a linear scale
of the alignment are drawn into the design file. The scale is divided into sections of the length defined by the Interval value.For each section, the rounded calculated quantity value is displayed.
Setting: Effect:Upper surface Name of the upper surface model for quantity calculation. The use
of Laser points requires that the points which define the surface are loaded into TerraScan .
Lower surface Name of the lower surface for quantity calculation. The use of Laser points requires that the points which define the surface are loaded into TerraScan.

Page 15912 Computing Quantities
TerraModeler has two tools for computing quantities along an alignment. Compute Alignment Quantity tool calculates volumes using the grid method and requires that you have an existing surface model for the excavation/accumulation. Compute Section Quantity tool uses section templates to define the excavation/accumulation and calculates volumes using the end-area method.
Limit Limiting surface to restrict the calculation area:• None - no limiting surface used.• Area - calculate only within the Limit surface area.• Lower limit - calculate only above Limit surface.• Upper limit - calculate only below Limit surface.
Limit surface Surface to limit the calculation area. This is not active if Limit is set to None.
Step Defines the grid size for the calculation. A small step produces more accurate results but the calculation process takes longer.
Surf cut limit The software computes the cut volume separately for places where the cut depth is less than this value. This may be used for billing purposes if the price is not based on the cut volume but on the cut area.
Display Display method for presenting the calculation results graphically in the design file:• No display - nothing is drawn into the design file.• Draw temporarily - (not MicroStation V8i) draws temporary
elements.• Write to file - draws permanent elements into the design file on
the active level.Draw as Elements used to present the results graphically:
• Vertical lines - a vertical line is drawn at the center of each calculated grid cell.
• Horizontal lines - a horizontal lines is drawn for each calculated grid cell row.
• Filled shapes - a shape is drawn for each calculated grid cell row.
• Pilars - a 3D block is drawn for each calculated grid cell. Each block is build from 4 shape elements which may end up with a big number of elements to draw.
Color fields next to calculation result lines
Defines the display color for drawing the results in the design file. Uses the active color table in MicroStation.
Setting: Effect:

Page 16012 Computing Quantities
Define Section TemplatesNot Lite
Define Section Templates tool lets you create a list section templates, which are, for example, definitions of typical trench cross sections.
TerraModeler's cross sections templates are meant to be used for computing trench excavation quantities with the Compute Section Quantity tool. The cross section templates are automatically saved into a file using the same directory and name as the active design file. The file extension is *.KDB. For example, if the active design file is D:\DGN\PROJ12.DGN, the section templates are saved to and loaded from the file D:\DGN\PROJ12.KDB.
To add or edit section templates:
1. Select the Define Section Templates tool.
The Define section templates dialog opens:
2. Use the Add button to add new template definitions to the list.
OR
2. Use the Edit button to edit a selected section template.
This opens the Section template dialog which is used to define a section template:
A small circle in the center of the template preview symbolizes the spot where an alignment element goes through. Dz specifies an initial depth below that spot.
The shape of the cross section is defined as component lists that extend to the left and to the right from the initial Dz point. A component can be a line or a slope. A line has a vertical and a horizontal distance. A slope has a fixed angle at which it extends until it reaches a specified surface.

Page 16112 Computing Quantities
3. Enter a Name for the section template and a Dz value.4. Define components for the left and right side of the section by clicking on the respective
Add line or Add slope buttons in the Section template dialog. You can delete the last added component using the Delete last buttons.
5. After a section has been defined, click OK in the Section template dialog.
This adds the new template to the list or applies the changes to an existing template.
6. Close the Define section templates dialog.
This saves the *.KDB file to the hard disk.
You can use the Delete button in the Define section templates dialog in order to delete a selected section template.

Page 16212 Computing Quantities
Compute Section QuantityNot Lite
Compute Section Quantity tool lets you attach section templates to station ranges along an alignment element. This template list can be used for computing quantities and for generating an excavation based on the cross section templates. The section templates must be defined with the Define Section Templates tool before they can be used for section quantity computation.
The alignment can be defined by a linear element, such as a 3D line string or complex chain. The area of calculation is limited by the extensions of the alignment element and the section template(s).
The excavation is computed related to one or two surfaces. The surfaces can be defined by surface models loaded in TerraModeler.
The results of the computation are shown in the tool’s dialog. They can be presented graphically in the design file and a text report can be stored as well.
To attach templates to an alignment:
1. Select an alignment element.2. Select the Compute Section Quantity tool.
The Define alignment section templates dialog opens:
The template list contains rows with a station value range and the name of an assigned section template. A gap between station ranges of successive rows is interpreted as a linear transformation between two template types. You can skip a station range by selecting template type None. Such a station range is not included in the calculation.
Setting: Effect:Start station Station value at the start point of the alignment element.End station End station value defined by the length of the alignment
element:• Increasing - station values are increasing from start to end
station.• Decreasing - station values are decreasing from start to end
station

Page 16312 Computing Quantities
3. Use the Add button to add a new template to the list.
OR
3. Use the Edit button to edit a selected template.
This opens the Template for alignment interval dialog:
4. Define From station and To station values in order to define the station range for using this template.
5. Select a section template form the list of Section templates that is used for the given section range.
6. Click OK.
The template is added to the list in the Define alignment section templates dialog. You can continue with step 3 until templates for all station ranges for computation are defined.
It is recommended to save the template list into a file that can be reloaded into the dialog. Select Save as command from the File menu to create a simple text file with the extension *.KLS.
7. Click on the Calculation button in the Define alignment section templates dialog.
This closes the list and opens the Compute alignment quantities dialog:
To: Choose button/menu command:Add a new station range to the list. AddModify the template for a selected station range. EditDelete a selected station range from the list. DeleteStart the quantity calculation based on the template list. CalculationLoad a previously saved template list file from a hard disk. File / LoadSave a template list into a text file on a hard disk. File / Save asDraw the section templates into cross sections. The cross sections must be created in advance along the same alignment elements using the Draw Alignment Sections tool.
Draw / In sections
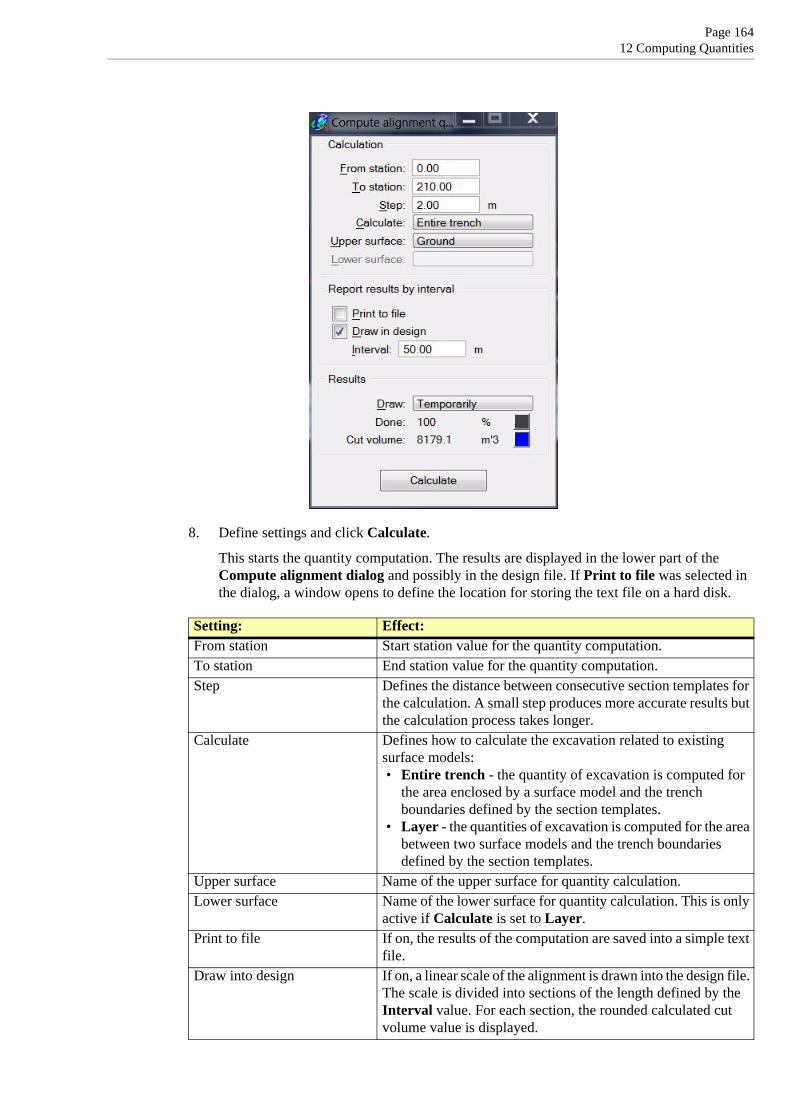
Page 16412 Computing Quantities
8. Define settings and click Calculate.
This starts the quantity computation. The results are displayed in the lower part of the Compute alignment dialog and possibly in the design file. If Print to file was selected in the dialog, a window opens to define the location for storing the text file on a hard disk.
Setting: Effect:From station Start station value for the quantity computation.To station End station value for the quantity computation.Step Defines the distance between consecutive section templates for
the calculation. A small step produces more accurate results but the calculation process takes longer.
Calculate Defines how to calculate the excavation related to existing surface models:• Entire trench - the quantity of excavation is computed for
the area enclosed by a surface model and the trench boundaries defined by the section templates.
• Layer - the quantities of excavation is computed for the area between two surface models and the trench boundaries defined by the section templates.
Upper surface Name of the upper surface for quantity calculation.Lower surface Name of the lower surface for quantity calculation. This is only
active if Calculate is set to Layer.Print to file If on, the results of the computation are saved into a simple text
file.Draw into design If on, a linear scale of the alignment is drawn into the design file.
The scale is divided into sections of the length defined by the Interval value. For each section, the rounded calculated cut volume value is displayed.

Page 16512 Computing Quantities
Draw Display method for presenting the calculation results graphically in the design file:• Temporarily - (not MicroStation V8i) draws temporary elements.• Permanently - draws permanent elements into the design
file on the active level.Color fields next to calculation result lines
Defines the display color for drawing the results in the design file. Uses the active color table in MicroStation.
Setting: Effect:

Page 16612 Computing Quantities
Compute Tunnel VolumeNot Lite
Compute Tunnel Volume tool computes the volume of a tunnel defined by cross section elements drawn into their true 3D positions. The cross section elements may represent the design of a new tunnel or may be created based on the point cloud from a terrestrial laser scanner. The tool does not rely on surface models loaded in TerraModeler.
The cross section elements must be closed vector elements, such as shapes or complex shapes, drawn perpendicular to an alignment element that runs along the tunnel. The interval between consecutive cross sections may vary.
The volume can be computed for the whole tunnel area defined by the cross sections. Upper and lower elevation values can be defined for limiting the calculation to the area between the limit(s) and the cross section boundaries. The limits are given in absolute elevation values.
The tool can also compute multiple volumes for several elevation intervals within the cross sections. Then, the upper or lower elevation limit is moved within the tunnel area between two absolute elevation values in steps of a given size. The volumes are reported for each elevation interval defined by the lowest or highest elevation value and the moving elevation limit.
To compute tunnel volume:
1. Select the Compute Tunnel Volume tool.
This opens the Compute Tunnel Volume dialog:
The upper list contains a list of alignments along which tunnel sections are used for the computation. The lower list displays all the tunnel cross sections defined for the alignment selected in the upper list.
2. Use the MicroStation Selection tool to select an alignment element running along a tunnel.3. Click Add next to the upper list to add the selected alignment.
This opens the Tunnel alignment dialog:

Page 16712 Computing Quantities
4. Type a Name for the alignment, define a Start station value, and click OK.5. Select the row of the alignment in the upper list box of the Compute Tunnel Volume dia-
log.6. Use the MicroStation Selection tool to select cross section elements for the selected
alignment.7. Click Add next to the lower list to add the selected cross sections.8. Validate the created list of cross sections. Make sure that station positions and cross section
areas make sense.9. Click Compute to start the volume computation.
This opens the Report tunnel volume dialog:
10. Define settings and click OK.
This computes the volume and displays a report. You can save the report as a text file or print it directly by using the corresponding commands from the File menu in the Output window.
Setting: Effect:Report Method of volume reporting:
• One volume - calculates one volume for the complete tunnel area defined by the cross sections.
• Multiple volumes - calculates volumes for multiple elevation steps within the tunnel and the cross sections.
Upper limit If on, the volume is calculated from the tunnel floor up to the given elevation value. This is only active if Report is set to One volumes.
Lower limit If on, the volume is calculated from the given elevation value up to the tunnel roof. This is only active if Report is set to One volumes.
Move Limit that is moved to define the elevation steps for multiple volume calculation: Upper limit or Lower limit. This is only active if Report is set to Multiple volumes.
First First elevation value included in volume calculation. This is only active if Report is set to Multiple volumes.
Last Last elevation value included in volume calculation. This is only active if Report is set to Multiple volumes.
Step Size of an elevation interval for volume calculation. This is only active if Report is set to Multiple volumes.

Page 16812 Computing Quantities
Draw Surface Intersection
Draw Surface Intersection calculates the intersection of two surfaces and draws linear elements along the intersection. These linear elements represent the line of intersection along which the two surfaces have exactly the same elevation.
When calculating the line of intersection, TerraModeler compares individual triangles from the two surfaces with each other. If the planes of two triangles intersect each other, the intersection is drawn as a line segment. Thus, the intersection line might be represented by quite complex line strings or even by several line elements.
This tool can be used, for example, when computing cut and fill volumes as it creates a linear element showing the location where two surfaces have the same elevation. The line of intersection is the boundary between cut and fill areas of the two surfaces.
To draw intersection of two surfaces:
1. Select the Draw Surface Intersection tool.
The Intersect surfaces dialog opens:
2. Select the two surfaces and click OK.
This starts the calculation of the intersection line. The line is drawn into the design file using active level and symbology settings in MicroStation.
Setting: Effect:Use fence If on, the intersection is calculated for an area that is defined by
a MicroStation fence: Inside or Outside the fence. This is only active if a MicroStation fence is drawn.

Page 16912 Computing Quantities
Compute AreaNot Lite
Compute Area tool computes the area covered by a surface model. It calculates values for both, the two-dimensional and the three-dimensional area.
The 3D value is the true surface area of the triangles. The 2D value is computed using only x and y coordinates of the triangle vertices.
You can use a fence or selected shape element(s) to define the area for calculation. The area of computation can be further limited to a specific domain or to a given slope range.
To compute surface area:
1. Select the Compute Area tool.
The Compute Area dialog opens:
2. Define settings and click on the Calculate button.
The computation starts. The results are displayed in the lower part of the tool’s dialog and possibly in the design file.
Setting: Effect:Surface Name of the surface model for area calculation.Compute Area to compute:
• Whole surface - whole surface model.• Fence contents - only inside a MicroStation fence.• Selected shapes - only inside selected shape element(s).
Domain If on, compute only triangles assigned to the selected domain.Slope If on, compute only triangles within a given slope range. The
lower and upper limits are defined as slope percentages.Paint calculated area If on, draw each calculated triangle as a temporary shape
element into the design file (not MicroStation V8i).Label 3d area of each shape If on, the computed 3D area value of each shape is drawn inside
the shape as a permanent text element. This is only active if Compute is set to Selected shapes.

Page 17013 Using Domains
13 Using Domains
Domains tool boxNot Lite
The tools in the Domain tool box are used to define domains, to assign domain information for triangles, and to display domains.
Domains are related to the triangles in TerraModeler surface models. The domain number is stored for each triangle in the surface model TIN file.
You can use domains to separate different types of surface regions from each other. By defining a list of domains, you can create your own classification system for surface regions. This classification system may be used for visualization purposes. It allows to distinguish different-looking surfaces regions from each other.
Typically, you create a list of domains for various regions of the ground surface. The list could include domains such as Ground, Grass, Rock, Forest, or Road. For each domain a unique coloring scheme and level should be assigned.
Display Domain Triangles tool draws surface model triangles using coloring schemes and levels that are assigned for each domain. If each domain is drawn on a unique design file level, it is easier to do further manipulation with MicroStation tools, such as:
• Apply area pattern on all triangles belonging to a certain domain using the MicroStation Pattern Area tool.
• Assign MicroStation rendering materials to triangles belonging to a certain domain. • Drape an aerial photograph on a surface model using material assignment in MicroStation.
There are also a few tools in TerraModeler which enable the application of processes to certain domains only. Examples are Display Contours, Display Themes, Draw Profile, Compute Area.
To: Use:
Define domains Define Domains
Assign a view for dynamic domain display Domain View
Set domain of triangles inside an area Set Area Domain
Set domain of triangles between two linear elements Set Domain Between Lines
Set domain of triangles Set Triangle Domain
Display triangles using domain coloring Display Domain Triangles

Page 17113 Using Domains
Define DomainsNot Lite
Define Domains tool opens a dialog for defining domains. The dialog contains buttons for adding new domains, editing a domain, and deleting a domain.
The domain definitions can be saved into a text file or loaded from a previously saved file by using the commands from the File pulldown menu. When you open a design file, TerraModeler automatically loads the domain definition file that was used last with this design file.
For each domain, a single color or a color scheme can be choosen for visualization. If a color scheme is defined, the elevation differences of a surface model within the domain area are represented. Areas for which no specific domain is assiged are displayed using the Default domain settings.
To add or edit a domain:
1. Click Add in the Define domains dialog.
OR
1. Select a domain definition and click Edit in the Define domains dialog.
This opens the Domain dialog:
2. Define settings for the domain.3. Click OK.
The new domain definition is added to the list in the Define domains dialog or the selected domain is modified.
A selected domain can be removed from the list by using the Delete button in the dialog.

Page 17213 Using Domains
Setting: Effect:Number Number of the new domain. The domain number is stored for each
triangle in the surface model TIN file if a domain is assigned to it.Abbreviation A free text that can be used as abbreviation for the new domain.Name A free text used as name for the domain.Elevations Name of the surface model that is used for determining the elevation
ranges for the coloring scheme.Level Level number for displaying triangles in the design file.Draw contours If on, contour lines are drawn for this domain. This effects the display
of contour lines with Display Contours tool.Colors Opens the Color scheme dialog which is used to define a coloring
scheme. See Creating a coloring scheme of discrete colors for more information.
Color button Opens the active MicroStation color table for single color selection.

Page 17313 Using Domains
Domain ViewNot Lite
Domain View lets you select a view which displays domain assignments of the surface model you are working on. Whenever MicroStation redraws the contents of this view, TerraModeler draws the surface model triangles as temporary elements using domain colors.
It is recommended to select a domain view when you are assigning domains to triangles. It provides the best way of seeing the effects of your work.
To assign a domain view:
1. Select the Domain View tool.
The Domain View dialog opens:
2. Select the View in which you want to see domain assignments.
Set Area DomainNot Lite
Set Area Domain tool defines a domain for all triangles inside or outside a fence. The tool uses the center point of a triangle to decide if a triangle is inside or outside the fence.
The area can be defined by a MicroStation fence or by selected shape element(s).
To set domain of fence contents:
1. Place a fence or select shape element(s) that define the area.2. Select the Set Area Domain tool.
This opens the Set Area Domain dialog:
3. Define settings.4. Accept the fence contents with a mouse click.
The selected domain is assigned to the triangles inside or outside the fence.
Setting: Effect:Draw only active domain If on, it speeds up the view update by drawing only the
active domain.
Setting: Effect:Surface Name of the effected surface model.Set to Domain that is assigned to the triangles.Fence Fence mode: Inside or Outside.

Page 17413 Using Domains
Set Domain Between LinesNot Lite
Set Domain Between Lines tool assigns a domain to all triangles between two linear elements. This tool is designed to be used with linear elements that are close to parallel to each other. TerraMod-eler uses the center point of a triangle to decide if the triangle is between the two linear elements.
To set domain between two linear elements:
1. Select the Set Domain Between Lines tool.
This opens the Set Domain Between Lines dialog:
2. Define settings.3. Identify the first linear element.4. Identify the second linear element.5. Accept the two highlighted linear elements.
The selected domain is assigned to the triangles between the two linear elements.
Setting: Effect:Surface Name of the effected surface model.Set to Domain that is assiged to the triangles.

Page 17513 Using Domains
Set Triangle DomainNot Lite
Set Triangle Domain tool assigns a domain to individual triangles. The tool can assign a domain to single triangles or to multiple triangles using a paint method.
To set triangle domains one triangle at a time:
1. Select the Set Triangle Domain tool.2. This opens the Set Triangle Domain dialog:
3. Define settings.4. Move the mouse pointer in a MicroStation view.
The shape of the triangle at the mouse pointer location is dynamically highlighted.
5. To set the domain of a single triangle, enter a data click.6. If the Method is set to Paint, move the mouse pointer.
The domain is assigned to all triangles the mouse pointer passes over. The end the domain assignment, enter another data point.
Setting: Effect:Surface Name of the effected surface model.Set to Domain that is assigned to the triangles.Method Defines how triangles are selected for domain assignment:
• One at a time - each triangle is defined by a data click in order to assign the domain.
• Paint - all triangles the mouse pointer passes over between two data clicks are assigned to the domain.

Page 17613 Using Domains
Display Domain TrianglesNot Lite
Display Domain Triangles tool draws triangles for a surface model using domain coloring schemes and levels.
If there are areas of the surface model where no specific domain is assigned, the display options of the default domain are used.
To display domain triangles:
1. Select the Display Domain Triangles tool.
The Display domain triangles dialog opens:
2. Define settings and click OK.
The display is created.
This tool is very similar to the Display Triangles tool. In fact, display domain triangles is an alternate way of displaying surface model triangles. You can update domain triangles with the Update Displays tool or erase them with the Erase Display tool.
Setting: Effect:Surface Name of the effected surface model.Mode Display method for drawing domains:
• Preview - displays triangles in preview mode.• Write to file - draws triangles permanently into the design file.
Smooth facets for rendering
If on, triangles are displayed with a smoother change in coloring if MicroStation rendering is applied (Not MicroStation V8i).

Page 17714 Placing Single Display Elements
14 Placing Single Display Elements
Display Single tool boxNot Lite
The tools in the Display Single tool box are used to place single contours, elevation texts, or slope arrows. There is another tool for modifying the symbology of contour lines.
To: Use:
Place a contour at a single elevation Place Contour
Place an elevation text Place Elevation Text
Place a slope arrow Place Slope Arrow
Modify symbology of contours at given intervals Modify Contour Symbology

Page 17814 Placing Single Display Elements
Place ContourNot Lite
Place Contour tool draws a contour at a single elevation. The tool detects the surface elevation at the mouse pointer position and draws contour lines for this elevation.
The contour lines are drawn using the active level and symbology settings in MicroStation.
You can place the contour at a precise elevation by locking the elevation to a key-in value.
To place a single contour:
1. Select the Place Contour tool.
The Place Contour dialog opens:
2. Define settings.3. Move the mouse inside a view.
A preview of the contour running at the mouse pointer location is dyamically displayed.
4. Confirm the contour with a data click.
This draws the contour(s) into the design file. You can continue with steps 2 or 3.
Setting: Effect:Surface Name of the effected surface model.Create Defines which contour lines are drawn:
• Only one - only the contour line at the mouse pointer location is drawn.
• All chains - all contour lines at the elevation of the mouse pointer location are drawn.
Draw as Element type of the contour lines:• Curves - smooth elements for which MicroStation computes the
curvature, compact elements.• Line strings - sharp elements, suitable for preview.
Elevation If on, contours are drawn at the given elevation.

Page 17914 Placing Single Display Elements
Place Elevation TextNot Lite
Place Elevation Text tool places a single elevation text. It shows the surface elevation at a given location. The tool can be used to label the difference between two surfaces as well.
Text font, size, and numeric format are determined by leveling point settings in Elevation labels category of the TerraModeler Settings. The settings also define the location of the label relative to the exact elevation point and if a point marker is set at the location of the elevation point. The label is drawn using active level and symbology settings in MicroStation.
To place a single elevation text:
1. Select the Place Elevation Text tool.
This opens the Place Elevation Text dialog:
2. Define settings.3. Move the mouse pointer inside a view.
A preview of the label at the mouse pointer location is dynamically displayed.
4. Confirm the elevation text location with a data click.
The elevation label is drawn into the design file. You can continue with steps 2 or 3.
Setting: Effect:Write Defines the type of the label:
• Elevation - the elevation value of a surface model is drawn.• Difference - the elevation difference between two surface
models is drawn.Surface Surface model for which a label is placed. If Write is set to
Difference, the surface is used as lower surface for the difference calculation.
- If Write is set to Difference, the second surface is used as upper surface for the difference calculation.

Page 18014 Placing Single Display Elements
Place Slope ArrowNot Lite
Place Slope Arrow tool places a single slope arrow. The slope arrow shows the direction of water flow at a given location. The arrow length indicates the steepness of the surface at that location.
The shape of the slope arrows can be defined in Place Slope Arrow / Arrows category of the TerraModeler settings. It is further determined by the active symbology settings in MicroStation. In addition, a label showing the gradient of the slope can be placed for each slope arrow. The label settings are defined in Place Slope Arrow / Labels category of the TerraModeler settings.
To place a single slope arrow:
1. Select the Place Slope Arrow tool.
This opens the Place Slope Arrow dialog:
2. Select a Surface model for which slope arrows are placed.3. Move the mouse pointer inside a view.
The slope arrow is dynamically displayed at the mouse pointer location.
4. Confirm the arrow location with a data click.
A slope arrow is drawn at the given location. You can continue with steps 2 or 3.

Page 18114 Placing Single Display Elements
Modify Contour SymbologyNot Lite
Modify Contour Symbology tool modifies the symbology of contour lines. It can also move contour lines to another level in the design file. The contour lines have to be created with Mode set to Write to file in the Display Contours tool in order to apply the tool.
The tool may be useful, for example, if contour lines need to be distinguished into more than three types that are supported by the Display Contours tool.
To modify the symbology of contours:
1. Select the Modify Contour Symbology tool.
This opens the Modify Contour Symbology dialog:
2. Define settings and click OK.
Setting: Effect:Surface Name of the effected surface model.Interval Interval of contour lines that are modified.Set contour level If on, the contour lines are moved to the given MicroStation Level.Set contour symbology If on, the color, style, and weight of the contour lines are modified
to the given Symbology. Uses the active color table of MicroStation, and MicroStation line styles and weights.
Set label level If on, the contour labels are moved to the given MicroStation Level.Set label symbology If on, the color, style, and weight of the contour labels are modified
to the given Symbology. Uses the active color table of MicroStation, and MicroStation line styles and weights.

Page 18215 Using Regions
15 Using Regions
Regions tool boxNot Lite
The tools in the Regions tool box are used to create, manage, delete, and update regions.
Regions are another method to divide an area into thematical subareas, the regions. From linear region boundaries the tools can create and update closed shapes. A center point identifies the region and links it to thematical information.
Region definitions can be used for:
• labeling surface areas• using color-filled shapes for visualization purposes• create pattern for boundaries and region areas for visualization purposes
Settings related to regions can be found in Regions / Region design category, Regions / Region levels category, Regions / Region types category, and Regions / Title formats category of the TerraModeler settings.
In contrast to tools in the Domains tool box, region tools do not rely on surface models or relate to the triangle structure of surfaces.
To: Use:
Open regions window Regions
Create a new region definition Create Region
Delete existing region definition Delete Region
Edit region information Edit Region Info
Move region center point and title Move Region Center
Update region definitions (modified boundaries) Update Regions

Page 18315 Using Regions
RegionsNot Lite
Regions tool opens the Regions window. The window contains a list of regions that are currently defined in the design file. The window’s menu includes commands for creating, modifying, and deleting regions, and for creating output files of the region list.
Region / CreateCreate command performs the same action as the Create Region tool.
Region / Edit informationEdit information command performs the same action as the Edit Region Info tool.
Region / Move center pointMove center point command performs the same action as the Move Region Center tool.
Region / Assign new boundaryAssign new boundary command defines a new boundary to a region. The new boundary must be a closed MicroStation shape element.
To assign a new boundary to a region:
1. Place the new boundary as MicroStation shape element.2. Select the region in the Regions window.3. Select Assign new boundary command from the Region pulldown menu.4. Identify the new boundary shape with a data click.
To: Choose menu command:Create a new region Region / CreateModify the information for a region Region / Edit informationMove the center point of a region Region / Move center pointAssign a new boundary to a region Region / Assign new boundaryDelete a region Region / Delete
Modify the size of the windowView/Small dialogView/Medium dialogView/Large dialog
Define fields that are displayed in the list View / FieldsSort the list of regions View / Sort byCreate output files for the list of regions List / Regions

Page 18415 Using Regions
5. Accept the selected boundary.
This assigns the new boundary to the selected region. The boundary type changes to Shape for this region. Use Update Regions tool in order to see the changes in the design file.
Region / DeleteDelete command deletes a region definition. The region definition must be selected in the list of regions.
To delete a region:
1. Select the region in the Regions window.2. Select the Delete command from the Region pulldown menu.
The software asks you to confirm the deletion process.
3. Click Yes in the Alert dialog.
This deletes the region definition and all related elements.
The Delete command can perform the same action for all regions as the Delete Region tool.
View / FieldsFields command lets you choose the fields that are displayed in the Regions window. The fields show the information stored for each region, such as number, name, information, size, type, if a region forms a hole within another region, title format, and boundary status.
If the information for a field is not displayed completely in the list, you may enlarge the Regions window by using the commands from the View pulldown menu.
View / Sort bySort by command sorts the list of regions according to the selected attribute:
• Name - ascending alphabetical order of region names.• Number - ascending by region number, the smallest number is displayed first in the list.• Type - ascending alphabetical order of region types.• Area - descending by region size, the largest region is displayed first in the list.
List / RegionsRegions command provides several options for the output of the list. The output options include:
• Picture - the list is drawn as MicroStation cell element into the design file. The list can include a color field and/or an area pattern field which illustrate the symbology of the different regions.
• Text file - a simple text file is created where fields are delimited by spaces.

Page 18515 Using Regions
• Table file - a text file is created where fields are delimited by a tab.
The output can either contain each region of the list or summarize regions of the same type. De-pending on the output settings, the list can include information such as type, name, area, count of regions per type, total area per type, color field, area pattern field.
To create output of the region list:
1. Select the Regions command from the List pulldown menu.
The List regions dialog opens:
2. Define settings and click OK.3. If Create as is set to Picture, move the mouse pointer inside a top view. Define the location
of the region list by a data click.
OR
3. If Create as is set to Text file or Table file, a standard dialog opens for saving a file. Define a location on a hard disk in order to store the text file.
Setting: Effect:Create as Type of the output:
• Picture - draws the list of regions as a cell element into the design file.
• Text file - saves a space-delimited text file.• Table file - saves a tab-delimited text file.
Output Defines how regions of the same type are included in the output:• Each region - the output includes a line for each region.• Region type totals - the output includes a line for each region
type, the areas of regions of the same type are summarized.Draw area pattern If on, the list output includes an area pattern field for each region
(type). This is only active if Create as is set to Picture.Draw coloring If on, the list output includes a color field for each region (type).
This is only active if Create as is set to Picture.Round regions areas before adding
If on, the region sizes are rounded before they are summed up for the total size. This is only active if Output is set to Region type totals.
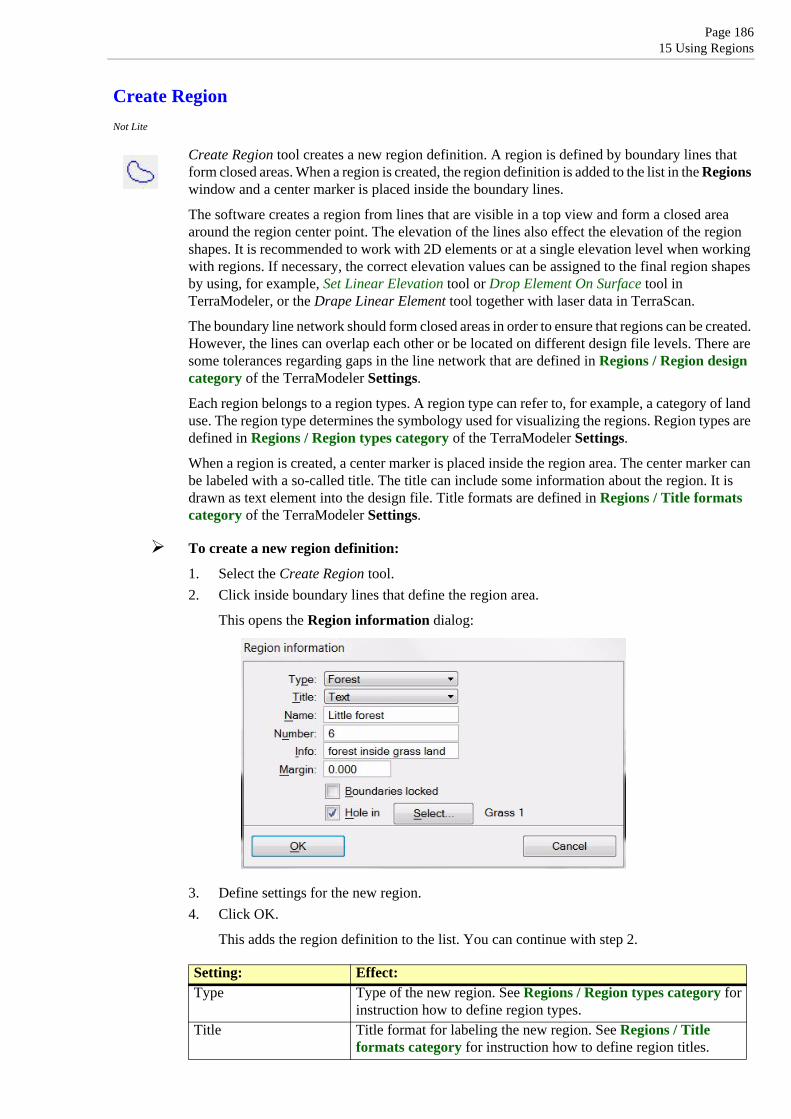
Page 18615 Using Regions
Create RegionNot Lite
Create Region tool creates a new region definition. A region is defined by boundary lines that form closed areas. When a region is created, the region definition is added to the list in the Regions window and a center marker is placed inside the boundary lines.
The software creates a region from lines that are visible in a top view and form a closed area around the region center point. The elevation of the lines also effect the elevation of the region shapes. It is recommended to work with 2D elements or at a single elevation level when working with regions. If necessary, the correct elevation values can be assigned to the final region shapes by using, for example, Set Linear Elevation tool or Drop Element On Surface tool in TerraModeler, or the Drape Linear Element tool together with laser data in TerraScan.
The boundary line network should form closed areas in order to ensure that regions can be created. However, the lines can overlap each other or be located on different design file levels. There are some tolerances regarding gaps in the line network that are defined in Regions / Region design category of the TerraModeler Settings.
Each region belongs to a region types. A region type can refer to, for example, a category of land use. The region type determines the symbology used for visualizing the regions. Region types are defined in Regions / Region types category of the TerraModeler Settings.
When a region is created, a center marker is placed inside the region area. The center marker can be labeled with a so-called title. The title can include some information about the region. It is drawn as text element into the design file. Title formats are defined in Regions / Title formats category of the TerraModeler Settings.
To create a new region definition:
1. Select the Create Region tool.2. Click inside boundary lines that define the region area.
This opens the Region information dialog:
3. Define settings for the new region.4. Click OK.
This adds the region definition to the list. You can continue with step 2.
Setting: Effect:Type Type of the new region. See Regions / Region types category for
instruction how to define region types.Title Title format for labeling the new region. See Regions / Title
formats category for instruction how to define region titles.

Page 18715 Using Regions
Create region tool does not draw the region shape or any other display into the design file. Use Update Regions tool in order to display the region.
Name Free text that is used a name for the new region.Number Number of the region. Counts up automatically.Info Free text that is used as additional information about the new
region.Margin Area added around a region as a placeholder, for example, for line
pattern that need more space than a simple line. The region is shrinked by this value in order to avoid overlap between adjacent regions when using different line pattern for the display.
Boundaries locked If on, the region is not recomputed when using the Update Regions tool after the boundary line elements were modified.
Hole in If on, the new region is defined as a hole. If the area of the new region is completely surrounded by another region, the option is switched on automatically. The name of the surrounding region is displayed next to the Select button.If the region should not form a hole, click on the Select button and select Not a hole in the Select parent region dialog.
Setting: Effect:

Page 18815 Using Regions
Delete RegionNot Lite
Delete Region tool deletes a region definition. The region must be drawn in the design file by the Update Regions tool in order to be deleted with this tool.
You may use the Region / Delete command to perform the same action for selected regions in the Regions window. The command can also remove regions that are not drawn into the design file.
To delete a region:
1. Select the Delete Regions tool.2. Move the mouse pointer inside a top view.
The region at the mouse pointer location is highlighted.
3. Identify the region to be deleted with a data click inside the region.
The software asks you to confirm the deletion process.
4. Click Yes in the Alert dialog.
This deletes the region definition and all related elements. You can continue with step 2.
The region display is always linked to the region definition via a MicroStation linkage. If a region definition is deleted, all display elements are deleted as well.

Page 18915 Using Regions
Edit Region InfoNot Lite
Edit Region Info tool enables the modification of thematical information of a region.
To change region information:
1. Select the Edit Region Info tool.2. Move the mouse pointer inside a top view.
The region at the mouse pointer location is highlighted.
3. Identify the region to be modified with a data click.
This opens the Region information dialog:
4. Modify the information for the region.5. Click OK in order to apply the changes.
You can continue with step 2. Use the Update Regions tool in order to apply changes to the display.
Setting: Effect:Type Type of the region. See Regions / Region types category for
instruction how to define region types.Title Title format for labeling the region. See Regions / Title formats
category for instruction how to define region titles.Name Free text that is used a name for the region.Number Number of the region.Info Free text that is used as additional information about the region.Margin Area added around a region as a placeholder, for example, for line
pattern that need more space than a simple line. The region is shrinked by this value in order to avoid overlap between adjacent regions when using different line pattern for the display.
Boundaries locked If on, the region is not recomputed when using the Update Regions after the boundary line elements were modified.
Hole in If on, the region is defined as a hole. If the area of the region is completely surrounded by another area, the option is switched on automaticall. The name of the surrounding area is dislplayed next to the Select button.If the region should not form a hole, click on the Select button and select Not a hole in the Select parent region dialog.

Page 19015 Using Regions
Move Region CenterNot lite
Move Region Center tool moves the center marker of a region to another location. The center marker may be linked with a text element which has been defined as region title.
To move the region center marker:
1. Select the Move Region Center tool.2. Move the mouse pointer inside a top view.
The region center closest to the mouse pointer location is highlighted.
3. Identify the region center to be moved with a data click.4. Define the new location of the center marker with another data click.
Update RegionsNot lite
Update Regions tool redraws the regions in the design file. If new region definitions were created or existing regions were updated, the tool draws all display elements into the design file that are defined for a region. This includes a center marker, a so-called solution shape, and optionally a color-filled shape, area pattern, and a title.
A region is displayed by the center marker and the solution shape. The additional elements drawn for a region depend on the region type and are defined in Regions / Region types category of the TerraModeler Settings. The title format and content are defined in Regions / Title formats category of the TerraModeler Settings.
The different region elements can be drawn on several MicroStation levels which supports their modification with MicroStation tools. The levels are defined in Regions / Region levels category of the TerraModeler Settings.
To redraw regions:
1. Select the Update Regions tool.
The Update Regions dialog opens:
2. Select in the Update list what is updated: All regions or regions in the current View contents only.
3. Click inside a top view.
The update starts and regions are redrawn.
If a region can not be drawn, an error message is displayed. This can be caused, for example if region boundaries are not closed or if they are deleted. There are some tolerances related to gaps in the boundary line network which are defined in Regions / Region design category of the TerraModeler Settings.

Page 19116 Managing Surfaces
16 Managing SurfacesTerraModeler supports theoretically an unlimited number of surfaces during the same session. In practice, the performance of the software and the ability to create, process, and display surface models depends on the size of the models and the amount of RAM available on the computer.
The Surfaces tool opens a window that contains a list of surfaces that are currently loaded into TerraModeler.
The list of loaded surfaces in the Surfaces window shows information about each surface. The information that can be displayed includes surface attributes, storage information, and status information. The File status determines, whether a surface model has been modified (Status = Modified), saved (Status = Saved), or opened as a reference surface (Status = Reference).
The window’s menu provides commands for managing the surfaces, such as open, save, rename, and close a surface, view surface statistics, modify the triangles of a surface, import and export data, etc. Further, there are options to derive new surfaces by applying calculations to existing surface models. The menu also contains commands for opening all tool boxes that are part of the TerraModeler Main tool box.
There are three methods included in the Surfaces window that produce surface representation files in batch processes:
• Produce contours - creates contour design files that can store contour lines, labels, and ticks.• Produce lattice models - creates lattice text files that store a gridded DEM of format XYZ.• Produce triangles - creates triangle design files that stores the triangle shapes.
The batch processes can include data from several sources, such as laser data from TerraScan projects, survey elements from TerraSurvey or other applications, and breaklines filtered by breakline rules.

Page 19216 Managing Surfaces
File pulldown menuMenu commands from File pulldown menu in the Surfaces window are used to open, save, close, and restore surfaces.
To: Choose menu command:Create a new surface file File / New surfaceOpen a surface file stored on a hard disk File / Open surfaceClose a surface file File / Close surfaceSave a surface file on a hard disk File / Save surfaceOpen a reference surface File / Open referenceImport surface files File / ImportExport to surface files File / ExportRestore a surface after modifications File / Restore from fileOpen the TerraModeler Settings dialog File / User settingsUnload TerraModeler File / Exit

Page 19316 Managing Surfaces
File / New surface
New surface command creates a new empty surface model. The command adds the new surface to the list. Optionally, the model can be saved to the hard disk automatically after it is created. This is defined in Saving surfaces category of the TerraModeler Settings.
To create a new surface:
1. Select New surface command from the File menu.
This opens the Surface settings dialog:
2. Select a surface Type3. Enter a Name for the surface.4. (Optional) Rename the File for storing the model on the hard disk.5. Click OK.
A new empty surface is added to the list in the Surfaces window. You can continue with adding elements to the surface by using tools from the TerraModeler Create Surfaces tool box.
File / Open surface
TerraModeler surface models are stored in binary files. Open surface command opens a previously stored surface model file from a hard disk.
To open a surface file:
1. Select Open command from the File pulldown menu.
The Open surface dialog opens, a standard TerraModeler or MicroStation dialog for opening files.
2. Locate and select the surface file to be opened.3. Click OK.
This reads in the surface model file and adds it to the list of loaded surfaces.

Page 19416 Managing Surfaces
File / Close surface
Close surface command removes a surface model from the list of loaded surfaces. It does not delete the surface model file from the hard disk.
To close a surface model:
1. Select a surface model in the list of loaded surfaces.2. Select Close surface command from the File pulldown menu.
The Close surface dialog opens:
3. Select the Surface to be closed.4. Click OK.
This removes the selected surface model from the list of loaded surfaces. If the surface has been modified, you need to confirm whether you want to save the changes to the surface model file or not.
Alternatively, all loaded surface models can be closed at once with the Close all command from the File pulldown menu.

Page 19516 Managing Surfaces
File / Save surface
TerraModeler keeps surface models in the RAM memory of the computer. Modifications to the surface model effect only the copy in memory until the model is saved to the hard disk.
TerraModeler surface models are saved as binary files. When a new surface model is created, the application assigns a default file name by combining the design file name with an extension such as T00, T01, T02, etc. You can change the file name and store it on any hard disk or other storage device. See Chapter TIN File Format Specification on page 283 for more information about the surface model file format.
You can save surface models to files using one of the three options in the File menu of the Surfaces window:
• Save surface - save a surface model to the file that is assigned to this model.• Save as - save a new copy of a surface model file.• Save all - save all modified surface models to the files that are assigned to the models.
To save a single surface model:
1. Select the Save surface command from the File pulldown menu.
The Save surface dialog opens:
2. Select a Surface to save.3. Click OK.
The surface is saved to the file displayed as File name in the Save surface dialog.
To save a new copy of a surface model file:
1. Select the Save As command from the File pulldown menu.
The Save Surface As dialog opens:
2. Select a Surface to save.3. Define a location and file name in the As file field. The Browse button lets you select a
location on the PC for storing the file.4. Click OK.
The surface is saved to the given file.
TerraModeler surface models can be saved automatically when the design file is saved or after a model is created. This is defined in Saving surfaces category of the TerraModeler settings.

Page 19616 Managing Surfaces
File / Open reference
Open reference command opens a surface model file for read-only access. A reference surface can be viewed and displayed using display options for surfaces, and it can be included in calculation processes. A reference surface can not by modified.
To open a reference surface:
1. Select Open reference command from the File pulldown menu.
The Open reference surface dialog box opens, a standard TerraModeler or MicroStation dialog for opening files.
2. Locate and select the file to be opened.3. Click OK.
This reads in the surface model file and adds it to the list of loaded surfaces. You can use the reference surface in all tools which do not modify a surface.
When a reference surface is opened, the application reads a copy of the model in the RAM memory. It uses this copy during the session and does not detect if somebody else makes changes to the original surface model file.
File / Import
Import commands can be used for importing surface data from files of different formats. This is described in detail in Chapter Importing and Exporting Data on page 231.
File / Export
Export commands can be used for exporting surface data into files of different formats. This is described in detail in Chapter Importing and Exporting Data on page 231.

Page 19716 Managing Surfaces
File / Restore from file
Restore from file command reloads the surface model file from the hard disk. This can be used after modifying a surface in order to restore the previously saved situation, for example if it turns out that the modifications were a mistake.
The restore process can only be done for surfaces that have a status "Modified" which means that the surface model in the RAM memory has been changed but not yet saved to the hard disk. Once the status is "Saved", all modifications are written to the file on the hard disk and the restore process would not change anything to the surface model.
To restore a surface model from a file:
1. Select Restore from file command from the File pulldown menu.
This opens the Restore surface from file dialog:
2. Select a Surface to restore.3. Click OK.
The surface file is reloaded from the file displayed as File name in the Restore surface from file dialog.
The list of surfaces in the Restore surface from file dialog contains only surfaces that can be reloaded from file. If there is no such surface available, a dialog is displayed with the information that none of the surface models can be restored.
File / User settings
User settings command opens the TerraModeler Settings window. It performs the same action as the Settings tool in TerraModeler General tool box.
File / Exit
Exit command closes TerraModeler, it unloads the application from MicroStation.
If there are modified and unsaved surface models, the software asks you if you want to save changes to the surface model files. Confirm with Yes if you want to save the changes or with No if you want to close the application without saving changes to surface model files.

Page 19816 Managing Surfaces
Edit pulldown menuMenu commands from Edit pulldown menu in the Surfaces window are used to modify surfaces and to delete surface files from the hard disk.
To: Choose menu command:Modify surface information Edit / Modify settingsModify display settings for surfaces in profiles Edit / Profile settingsExclude long triangles from a surface Edit / Exclude long trianglesChange elevations of a surface by a mathematical equation Edit / Modify elevations
Remove unnecessary points from a surface Edit / ThinRemove previously deleted points and triangles from a surface Edit / Compress
Add intermediate points to a surface Edit / Add inferred pointsDelete a surface file from the hard disk Edit / Delete surface

Page 19916 Managing Surfaces
Edit / Modify settings
Modify settings command is used to modify the basic information of a surface model, such as type, name, and file for storing the model.
To modify the basic information of a surface:
1. (Optional) Select a surface model from the list in the Surfaces window.2. Select Modify settings from the Edit pulldown menu.
This opens the Surface settings dialog:
3. Select a Surface to modify. If a surface was selected in step 1, this surface is selected in the dialog.
4. Modify the surface Type, enter a new Name for the surface, or assign a new File name for the surface.
5. Close the dialog.
This saves the new settings to the surface model file. If the File name was modified, a new copy of the surface model file is created at the same location where the original file is stored.
Edit / Profile settings
Profile settings command opens the Profile surfaces dialog. The dialog contains settings for drawing surfaces into profiles. See Profile surfaces for a description of the settings in the dialog.

Page 20016 Managing Surfaces
Edit / Exclude long triangles
Exclude long triangles command excludes narrow, long triangles from a surface model. There can be different exclusion settings for triangles at the outer boundary of a surface model or for any long triangles.
Excluded triangles are neither displayed nor included in surface-based computation processes. They can be included again, for example, by using the Exclude Triangle tool or the Exclude Area tool. To delete excluded triangles completely from a surface model, use Edit / Compress command from the Surfaces window.
To exclude long triangles:
1. (Optional) Select a surface model from the list in the Surfaces window.2. Select Exclude long triangles from the Edit pulldown menu.
This opens the Exclude long triangles dialog:.
3. Select a Surface to exclude triangles from. If a surface was selected in step 1, this surface is selected in the dialog.
4. Define settings for triangle exclusion.5. Click OK.
This excludes triangles from the selected surface.
You can use this command several times with different maximum lengths. If the results of the first exclusion is not satisfying, you can re-run the process with a new maximum length.
Setting: Effect:Exclude outer triangles If on, only triangles along the outer boundary of the surface
model with an edge length Longer than the given value are excluded.
Exclude any long triangles If on, any triangles of the surface model with an edge length Longer than the given value are excluded.

Page 20116 Managing Surfaces
Edit / Modify elevations
Modify elevations command changes the elevation values of a surface model by using a mathematical equation. The process computes a new elevation value for each point of a surface model.
The old elevation of a point can be used in the equation as variable Z. The equation is actually a C language expression. You can use any mathematical functions that MDL recognizes. Valid expressions include functions, such as sin(a), cos(a), tan(a), exp(a), log(a), log10(a), pow(a,b), sqrt(a), ceil(a), fabs(a), and floor(a), where a and b are floating point values.
To modify elevation values:
1. (Optional) Select a surface model from the list in the Surfaces window.2. Select Modify elevations from the Edit pulldown menu.
This opens the Modify surface elevations dialog:.
3. Select a Surface to modify elevations. If a surface was selected in step 1, this surface is selected in the dialog.
4. Define the mathematical equation.5. Click OK.
This starts the calculation of the new elevation values. Depending on the size of the surface the process may take some time. Use the Update Displays tool or another MicroStation method for updating a view in order to visualize changes in visible surface displays.
Setting: Effect:Surface Name of the effected surface model.Use fence If on, only points Inside or Outside a fence are effected.
This is only active if a MicroStation fence was drawn before the command is selected.
Z = Mathematical expression that is applied to surface model points in order to calculated new elevation values.
Surface Z The button opens the Append surface dialog which lets you select a surface model. The elevation values of this surface are then used in the mathematical expression.

Page 20216 Managing Surfaces
Edit / Thin
Thin command removes points from a surface model if they are too close to each other. The allowed minimum distances between points are defined in the tool’s dialog. A point is removed if it is within both, the minimum horizontal distance and the minimum vertical distance from the closest adjacent point.
To delete points close to each other:
1. (Optional) Select a surface model from the list in the Surfaces window.2. Select Thin command from the Edit pulldown menu.
This opens the Thin surface dialog:
3. Select a Surface to thin. If a surface was selected in step 1, this surface is selected in the dialog.
4. Define minimum distances.5. Click OK.
This starts the thinning process. Depending on the size of the surface the process may take some time.
Removed points and triangles remain as inactive data in a surface model. Use the Edit / Compress command in order to delete the inactive data completely from a surface model.
Setting: Effect:Surface Name of the effected surface model.XY distance Minimum horizontal distance between two points.Z distance Minimum vertical distance between two points.

Page 20316 Managing Surfaces
Edit / Compress
Compress command deletes previously removed points and triangles from a surface model. It can also delete excluded triangles from the model. Thus, the tool is used to minimize the amount of memory for storing the surface model.
To compress a surface model:
1. Select Compress command from the Edit pulldown menu.
This opens the Compress surface model dialog:
2. Select a Surface to compress. 3. Define what triangles are removed: Deleted triangles only or Deleted or excluded
triangles.4. Click OK.
This starts the compression process. When the process is finished, a information dialog appears that informs about the file size after the compression.
The process is applied to the surface model in the RAM. Therefore, it is still possible to restore the uncompressed model from the file on the hard disk using the File / Restore from file command in the Surface window. To save the compressed model, use one of the options from File / Save surface.

Page 20416 Managing Surfaces
Edit / Add inferred points
Add inferred points command inserts points on hill tops and in depressions in a surface model that is created from contour point types. The added points result in a rounder shape for hill tops and depressions.
The points are added as points of type inferred points to the surface model. See Point Types on page 285 for more information about surface model point types. The surface model can be created, for example, from contour line elements drawn in the design file using the Triangulate View or Triangulate Elements tools. The element type for inserting the line elements into the surface must be set to Contour.
To add inferred points to a surface model:
1. (Optional) Select a surface model from the list in the Surfaces window.2. Select Add inferred points command from the Edit pulldown menu.
This opens the Add Inferred Points dialog:
3. Select a Surface to which points are added. If a surface was selected in step 1, this surface is selected in the dialog.
4. Define additional settings and click OK.
This adds the inferred points to the surface model. An information dialog is displayed that shows the number of added points.
Setting: Effect:Surface Name of the effected surface model.Distance Horizontal spacing between the highest/lowest closed
contour line and inferred points as well as between the points.
Dz Vertical distance between the highest/lowest closed contour line and inferred points as well as between the points.

Page 20516 Managing Surfaces
Edit / Delete surface
Delete surface command deletes a surface model completely. It removes the surface model from the RAM and deletes the surface model file from the hard disk.
To delete a surface model completely:
1. Select a surface model in the list of loaded surfaces.2. Select Delete surface command from the Edit pulldown menu.3. Confirm the process with Yes in the alert dialog.
This deletes a surface from the memory and the related file on the hard disk.

Page 20616 Managing Surfaces
Utility pulldown menuMenu commands from Utility pulldown menu in the Surfaces window are used to create derived surface models from existing surfaces, to validate the elevation accuracy of a surface model, and to produce output files in batch mode.
To: Choose menu command:View surface statistics Utility / View statisticsCreate a copy of a surface Utility / Copy surfaceCreate a combined surface from two surfaces Utility / Merge surfacesSubtract elevations of two surfaces Utility / Subtract surfacesCreate a statistical grid surface model Utility / Statistical modelCheck surface model elevations against ground control points Utility / Output control report
Create contour lines in batch mode Utility / Produce contoursCreate lattice files in batch mode Utility / Produce lattice modelsCreate triangles in batch mode Utility / Produce trianglesWork with lattice databases Utility / Lattice database

Page 20716 Managing Surfaces
Utility / View statistics
View statistics command shows statistical information for a selected surface model. This includes the numbers of points and triangles, and the coordinate ranges for easting, northing, and elevation.
To view surface statistics:
1. (Optional) Select a surface model from the list in the Surfaces window.2. Select View statistics command from the Utility pulldown menu.
This opens the Surface statistics dialog:
3. Select a Surface to view statistics. If a surface was selected in step 1, this surface is selected in the dialog.
This displays the statistics for the selected surface model.

Page 20816 Managing Surfaces
Utility / Copy surface
Copy surface command creates an identical copy of a surface model. The copy is created for the surface model in the RAM and for the surface model file stored on a hard disk. The new surface model file is saved at the same location where the original surface model is stored.
To create a copy of a surface model:
1. (Optional) Select a surface model from the list in the Surfaces window.2. Select Copy surface command from the Utility pulldown menu.
This opens the Copy surface dialog:
3. Select a Surface to copy from. If a surface was selected in step 1, this surface is selected in the dialog.
4. Click Copy.
This opens the Surface settings dialog:
5. Select a Type for the new surface.6. Define a Name for the surface.7. (Optional) Define a new File name for the surface model file stored on the hard disk.8. Click OK.
This creates a copy of the surface model.

Page 20916 Managing Surfaces
Utility / Merge surfaces
Merge surfaces command combines two surfaces. It creates a new surface model in the RAM and as surface model file on a hard disk. The new surface model file is saved at the same location where the original surface models are stored.
The command can be used, for example, to create a surface representing a new ground level by combining a design surface and an existing ground surface. The design surface, such as an excavation or a road, is set to be the primary surface. The merging operation copies all the information from the primary surface to the new surface. The secondary surface, existing ground, enlarges the area of the new surface. The points from the secondary surface are only used if they are located outside the primary surface.
To merge two surface models:
1. Select Merge surfaces command from the Utility pulldown menu.
This opens the Merge surfaces dialog:
2. Select Primary and Secondary surfaces to merge.3. Select a surface that is used in areas where the two surfaces overlap.4. Click OK.
This opens the Surface settings dialog:
5. Select a Type for the combined surface.6. Define a Name for the surface.7. (Optional) Define a new File name for the surface model file stored on the hard disk.8. Click OK.
This creates a combined surface model.
Setting: Effect:Primary All the information from the primary surface is copied to the new
surface.

Page 21016 Managing Surfaces
Secondary Information from the secondary surface is used only outside the primary surface.
Use Defines which surface to use in places where the surfaces overlap:• Primary surface - use the primary surface.• Highest surface - use the higher of the two surfaces.• Lowest surface - use the lower of the two surfaces.
Setting: Effect:
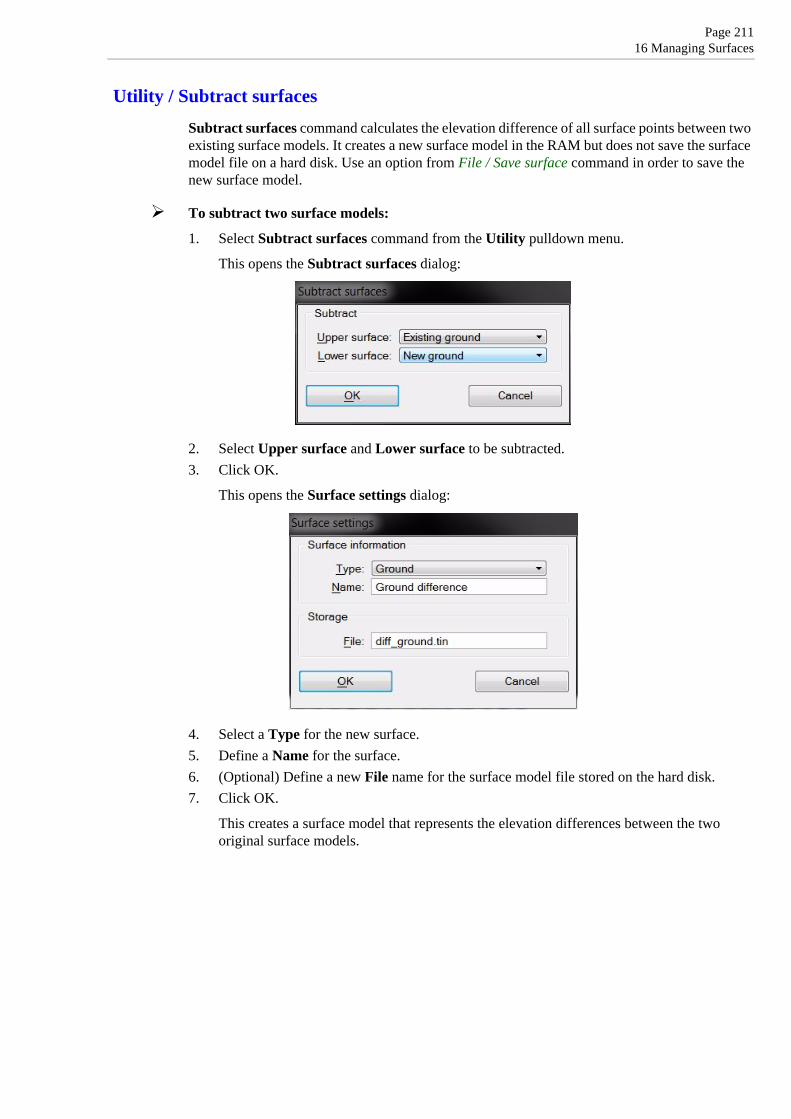
Page 21116 Managing Surfaces
Utility / Subtract surfaces
Subtract surfaces command calculates the elevation difference of all surface points between two existing surface models. It creates a new surface model in the RAM but does not save the surface model file on a hard disk. Use an option from File / Save surface command in order to save the new surface model.
To subtract two surface models:
1. Select Subtract surfaces command from the Utility pulldown menu.
This opens the Subtract surfaces dialog:
2. Select Upper surface and Lower surface to be subtracted.3. Click OK.
This opens the Surface settings dialog:
4. Select a Type for the new surface.5. Define a Name for the surface.6. (Optional) Define a new File name for the surface model file stored on the hard disk.7. Click OK.
This creates a surface model that represents the elevation differences between the two original surface models.

Page 21216 Managing Surfaces
Utility / Statistical model
Statistical model command calculates statistical values based on an existing surface model. It creates a new grid model in the RAM and as surface model file on a hard disk. The new grid model file is saved at the same location where the original surface model is stored.
The new surface is a grid type surface. It contains evenly spaced points at constant intervals in both, X and Y directions. The statistical values are mathematically derived from the existing surface within a circular or squared calculation area. When calculating a value for a grid point, the application searches for points in the existing model within a given radius from the grid point location. The values in the grid model can represent the number of points; the average, sum, or gravitational sum of elevation values; the minimum or maximum elevation values.
To create a statistical grid model:
1. Select Statistical model command from the Utility pulldown menu.
This opens the Create balanced grid model dialog:
2. Define settings and click OK.
This opens the Surface settings dialog:
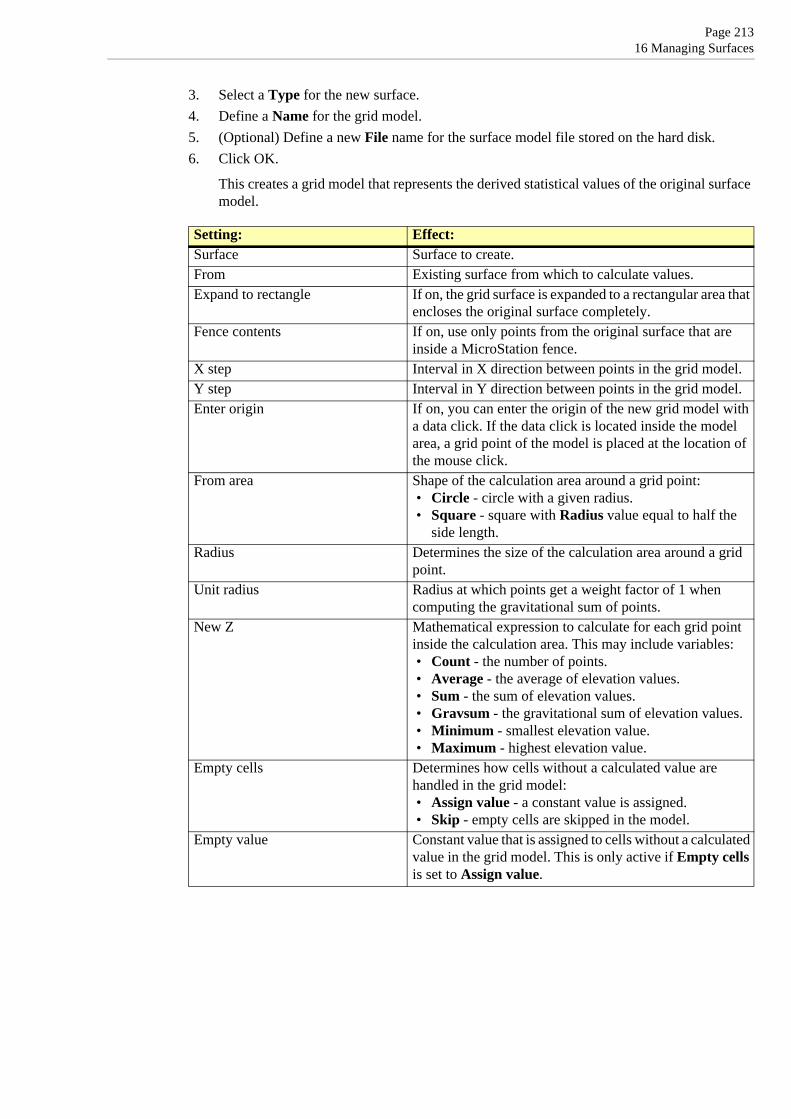
Page 21316 Managing Surfaces
3. Select a Type for the new surface.4. Define a Name for the grid model.5. (Optional) Define a new File name for the surface model file stored on the hard disk.6. Click OK.
This creates a grid model that represents the derived statistical values of the original surface model.
Setting: Effect:Surface Surface to create.From Existing surface from which to calculate values.Expand to rectangle If on, the grid surface is expanded to a rectangular area that
encloses the original surface completely.Fence contents If on, use only points from the original surface that are
inside a MicroStation fence. X step Interval in X direction between points in the grid model.Y step Interval in Y direction between points in the grid model.Enter origin If on, you can enter the origin of the new grid model with
a data click. If the data click is located inside the model area, a grid point of the model is placed at the location of the mouse click.
From area Shape of the calculation area around a grid point:• Circle - circle with a given radius.• Square - square with Radius value equal to half the
side length.Radius Determines the size of the calculation area around a grid
point.Unit radius Radius at which points get a weight factor of 1 when
computing the gravitational sum of points.New Z Mathematical expression to calculate for each grid point
inside the calculation area. This may include variables:• Count - the number of points.• Average - the average of elevation values.• Sum - the sum of elevation values.• Gravsum - the gravitational sum of elevation values.• Minimum - smallest elevation value.• Maximum - highest elevation value.
Empty cells Determines how cells without a calculated value are handled in the grid model:• Assign value - a constant value is assigned.• Skip - empty cells are skipped in the model.
Empty value Constant value that is assigned to cells without a calculated value in the grid model. This is only active if Empty cells is set to Assign value.

Page 21416 Managing Surfaces
Utility / Output control report
Output control report command creates a report of elevation differences between a surface model and control points. This can be used to check the elevation accuracy of the surface model and to calculate a correction value for improving the elevation accuracy of the model.
The control points have to be stored in a space delimited text file in which each row has four fields: identifier, easting, northing, and elevation. The identifier field is normally a number but it may include non-numeric characters as well.
To create a control report:
1. Select Output control report command from the Utility pulldown menu.
This opens the Output control report dialog:
2. Select the text file that stores the control points.3. Define settings and click OK.
This calculates the elevation differences and opens the Control report window.
Setting: Effect:Known points Name and location of the file that stores the coordinates of
the control points.Surface Surface model used for comparison with the control points.Max slope Maximum terrain slope for which an elevation difference
is computed.Z tolerance Elevation variation in the surface model points. This value
is used only when computing the terrain slope so that small triangles do not exceed the Max slope value.
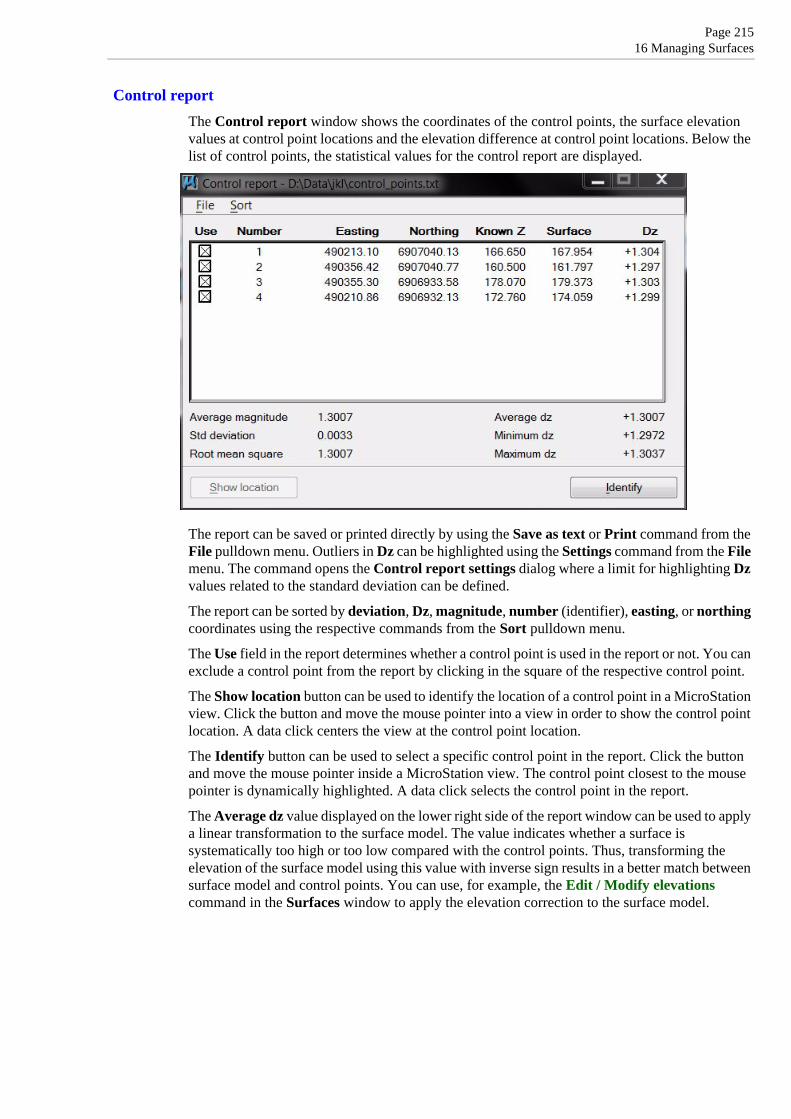
Page 21516 Managing Surfaces
Control reportThe Control report window shows the coordinates of the control points, the surface elevation values at control point locations and the elevation difference at control point locations. Below the list of control points, the statistical values for the control report are displayed.
The report can be saved or printed directly by using the Save as text or Print command from the File pulldown menu. Outliers in Dz can be highlighted using the Settings command from the File menu. The command opens the Control report settings dialog where a limit for highlighting Dz values related to the standard deviation can be defined.
The report can be sorted by deviation, Dz, magnitude, number (identifier), easting, or northing coordinates using the respective commands from the Sort pulldown menu.
The Use field in the report determines whether a control point is used in the report or not. You can exclude a control point from the report by clicking in the square of the respective control point.
The Show location button can be used to identify the location of a control point in a MicroStation view. Click the button and move the mouse pointer into a view in order to show the control point location. A data click centers the view at the control point location.
The Identify button can be used to select a specific control point in the report. Click the button and move the mouse pointer inside a MicroStation view. The control point closest to the mouse pointer is dynamically highlighted. A data click selects the control point in the report.
The Average dz value displayed on the lower right side of the report window can be used to apply a linear transformation to the surface model. The value indicates whether a surface is systematically too high or too low compared with the control points. Thus, transforming the elevation of the surface model using this value with inverse sign results in a better match between surface model and control points. You can use, for example, the Edit / Modify elevations command in the Surfaces window to apply the elevation correction to the surface model.

Page 21616 Managing Surfaces
Utility / Produce contoursNot Lite
Produce contours command creates contours in an automated process. This is useful for contour production on project level, when contours have to be created for a large area.
The automatic contour production does not rely on surface models loaded in TerraModeler. The ground model can be defined by:
• Laser points in a TerraScan project - usually contour keypoints (for rather smooth, cartographic contours) or model keypoints (for accurate, mathematical contours) in separate files referenced by a TerraScan project.
• Feature coded breakline elements - in reference design files, vector elements created with TerraSurvey or any other application enabled in Triangulate Survey category in the TerraModeler Settings.
• Breakline elements - in reference design files, vector elements properly organized by level and symbology, breaklines filtered by rules using the Triangulate Elements tool.
The settings for contour lines, labels, ticks, and peaks and pits labels are stored in text files which are then used by the batch process.
The automatic process writes the contours into multiple design files. A seed file is used as starting point for creating the contour design files.
Workflow for automatic contour production:
1. Prepare the laser data in TerraScan. Normally, this includes the classification of model/contour keypoints into separate files. Create a TerraScan project that references the keypoint files.
2. If required, create breakline vector elements using MicroStation and TerraScan tools.3. Define and save a contour settings file using the Display Contours tool.
Use Write to file as Mode. Contours should be drawn preferable as Soft line strings. The contour settings file stores settings from Display Contours tool, Contour options tool, Contour label options tool, and Contour tick options tool.
4. (Optional) Define and save a settings file for peaks and pits using the Label Peaks and Pits tool.
5. Create a seed file for storing the contour lines.
The seed file is usually an empty MicroStation 3D design file possibly with a reference file attached. The reference file contains the breaklines that are included in the contour line computation. Alternatively, the breaklines can be stored in the seed file directly.
6. If breakline vectors are used, create filtering rules for breaklines using the Triangulate Elements tool.
7. Create shapes that divide the project area into smaller parts.
Each shape results in a separate design file for contours. The shape boundary is used by the software as fence in order to clip the contour lines to the shape dimensions.
8. (Optional) Place text elements inside the shapes.
The texts are used for naming the contour design files. If no texts are selected, the files are named by automatic numbering.
9. Select the shapes and (optional) the texts.10. Select Produce contours command from the Utility pulldown menu in TerraModeler
Surfaces window.

Page 21716 Managing Surfaces
This opens the Produce contours dialog:
11. Define settings and click OK.
This opens the Triangulate surface dialog.
12. Define settings for surface creation. See Triangulate Survey on page 50 for a description of the settings in the dialog.
13. Click OK.
The software starts the contour line production. First, it closes the original design file from which the process was started. Next, it opens the seed file, computes the contours for the first shape, writes them into the design file, and closes the design file. Then the process continues with the next shape. After all contour design files are created, the original design file is opened again.
Setting: Effect:Model buffer Area around each shape for which the surface model is
created in addition to the area of the active shape itself. The buffer should be big enough to ensure smooth contour line transitions on shape boundaries.
Save each model If on, a surface model file is saved for each shape.Draw contours If on, contours are drawn in the design files. The given
Settings are used for contour computation and display.Label peaks and pits If on, labels for peaks and pits are drawn in the design file.
The given Settings are used for label display.Seed file Location of the design file that serves as seed file for
contour line production.
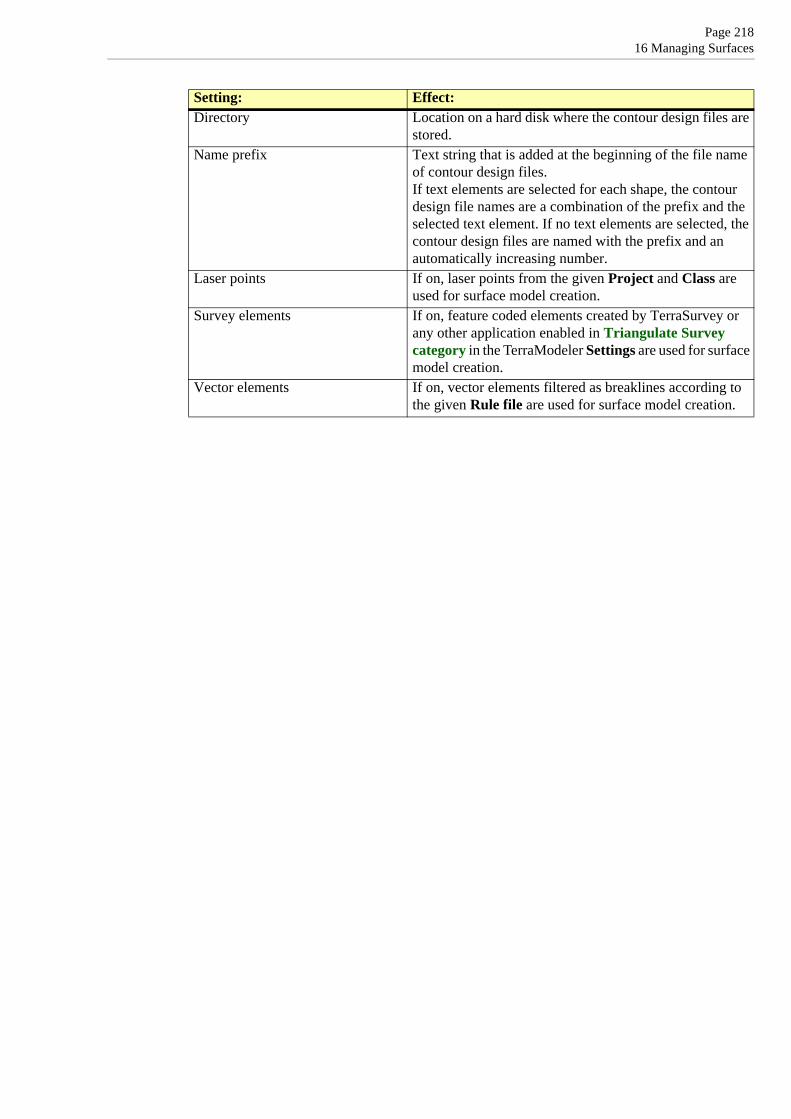
Page 21816 Managing Surfaces
Directory Location on a hard disk where the contour design files are stored.
Name prefix Text string that is added at the beginning of the file name of contour design files.If text elements are selected for each shape, the contour design file names are a combination of the prefix and the selected text element. If no text elements are selected, the contour design files are named with the prefix and an automatically increasing number.
Laser points If on, laser points from the given Project and Class are used for surface model creation.
Survey elements If on, feature coded elements created by TerraSurvey or any other application enabled in Triangulate Survey category in the TerraModeler Settings are used for surface model creation.
Vector elements If on, vector elements filtered as breaklines according to the given Rule file are used for surface model creation.
Setting: Effect:

Page 21916 Managing Surfaces
Utility / Produce lattice modelsNot Lite
Produce lattice models command creates lattice model files in an automated process. This is useful for lattice model production on project level, when lattice model files have to be created for a large area.
Lattice models are representations of a surface using a grid structure of points. The lattice model files include regularly distributed points at constant intervals in both, X and Y directions. Common storage formats are text files, image files, or program-specific grid file formats. The automatic process writes the lattice model points into multiple output files of a defined format.
The automatic lattice model production does not rely on surface models loaded in TerraModeler. It is more closely connected with laser data processing functionality in TerraScan. The source data for the lattice model can be defined by:
• Laser points in a TerraScan project - usually ground points referenced by a TerraScan project.
• Feature coded breakline elements - in reference design files, vector elements created with TerraSurvey or any other application enabled in Triangulate Survey category in the TerraModeler Settings.
• Breakline elements - in reference design files, vector elements properly organized by level and symbology, breaklines filtered by rules using the Triangulate Elements tool.
See Export / Lattice file on page 239 for a description of how to create a lattice model file from a surface model.
Workflow for automatic lattice model production:
1. Prepare the laser data in TerraScan. Normally, this includes the classification of ground points. Create a TerraScan project that references the laser point files.
2. If required, create breakline vector elements using MicroStation and TerraScan tools.3. If breakline vectors are used, create filtering rules for breaklines using the Triangulate
Elements tool.4. Create shapes that divide the project area into smaller parts.
Each shape results in a separate lattice model file. The shape boundary is used by the software as fence in order to clip the lattice model to the shape dimensions.
5. (Optional) Place text elements inside the shapes.
The texts are used for naming the lattice model files. If no texts are selected, the files are named by automatic numbering.
6. Select the shapes and (optional) the texts.7. Select Produce lattice models command from the Utility pulldown menu in TerraModeler
Surfaces window.
This opens the Produce lattice models dialog:
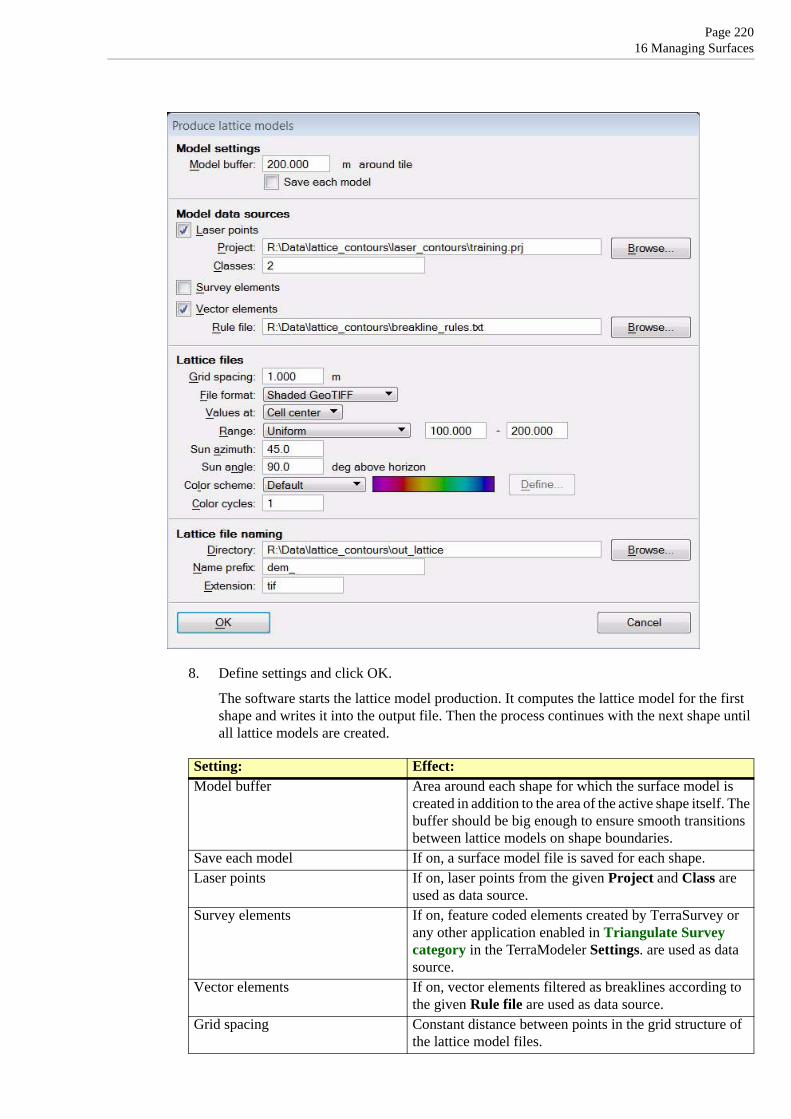
Page 22016 Managing Surfaces
8. Define settings and click OK.
The software starts the lattice model production. It computes the lattice model for the first shape and writes it into the output file. Then the process continues with the next shape until all lattice models are created.
Setting: Effect:Model buffer Area around each shape for which the surface model is
created in addition to the area of the active shape itself. The buffer should be big enough to ensure smooth transitions between lattice models on shape boundaries.
Save each model If on, a surface model file is saved for each shape.Laser points If on, laser points from the given Project and Class are
used as data source.Survey elements If on, feature coded elements created by TerraSurvey or
any other application enabled in Triangulate Survey category in the TerraModeler Settings. are used as data source.
Vector elements If on, vector elements filtered as breaklines according to the given Rule file are used as data source.
Grid spacing Constant distance between points in the grid structure of the lattice model files.

Page 22116 Managing Surfaces
File format Format of the output files. Available formats are:• ArcInfo Grid, Intergraph GRD• GeoTIFF formats, Shaded GeoTIFF• Japanese DMF and LEM• Raw image formats• Surfer ASCII and binary• XYZ text
Many of the additional settings for the lattice files depend on the selected format for the output files.
Values at Defines the exact location of the lattice point coordinates:• Cell center - the coordinates of the grid cell center are
stored.• Cell corner - the coordinates of the grid cell corner are
stored.For some output file formats only one option is available.
Outside Z Defines a constant value for grid cells outside the lattice model area where no elevation value can be derived from the source data. This can be, for example, a software-specific value.
Z unit Defines the elevation value unit for several raster formats.Create TFW files If on, external georeferencing files are created for
GeoTIFFs.Write coordinate block If on, a coordinate block file is written for Intergraph
GRD files.Byte order Defines the byte order for Raw integer image formats
related to the processor type: Intel or Motorola.Range Determines how the color scheme is fitted to the elevation
values for Shaded GeoTIFF files:• Uniform - the range should include all elevation values
of the area for which GeoTIFFs are produced in order to ensure seamless coloring over all images.
• Fit to tile - the colors are fitted to elevation values of each tile individually.
Sun azimuth Direction of the light for Shaded GeoTIFFs. The direction from the north is defined with zero and angle values increase clockwise.
Sun angle Height of the light source above the horizon.Color scheme Color scheme to use for Shaded GeoTIFFs:
• Default - default color scheme containing magenta, red, yellow, green, cyan, blue, and purple.
• Selected colors - use Define button to create a customized color scheme. See Define a customized color scheme on page 119 for more information.
Color cycles Number of color cycles used for Shaded GeoTIFFs. Use zero to create a gray scale display showing triangle slope only.
Outside points Defines for Xyz text files how to handle grid points outside the lattice model area where no elevation value can be derived from the source data:• Skip - outside grid points are not written into the text
file.• Output - outside grid points are written into the text file
using the constant value given in the Outside Z field.
Setting: Effect:

Page 22216 Managing Surfaces
Produce lattice models command can be used to create GeoTIFFs of shaded surface model representations in a batch process. Select Shaded GeoTIFF as File format and respective settings for elevation range, sun azimuth, sun angle, and color scheme. The output result is similar to the display created by the Display Shaded Surface tool.
Directory Location on a hard disk where the lattice model files are stored.
Name prefix Text string that is added at the beginning of the file name of lattice model files.If text elements are selected for each shape, the lattice model file names are a combination of the prefix and the selected text element. If no text elements are selected, the lattice model files are named with the prefix and an automatically increasing number.
Extension Extension for the lattice model files. It is recommended to use the standard extensions for specific file formats, for example, .tif for GeoTIFFs, .grd for ArcInfo Grids, .txt, .xyz, or .asc for text files.
Setting: Effect:

Page 22316 Managing Surfaces
Utility / Produce trianglesNot Lite
Produce triangles command creates triangles in an automated process. This is useful for triangle design file production on project level, when triangles have to be drawn for a large area.
The automatic triangle production does not rely on surface models loaded in TerraModeler. The ground model can be defined by:
• Laser points in a TerraScan project - usually ground point or model keypoints referenced by a TerraScan project.
• Feature coded breakline elements - in reference design files, vector elements created with TerraSurvey or any other application enabled in Triangulate Survey category in the TerraModeler Settings.
• Breakline elements - in reference design files, vector elements properly organized by level and symbology, breaklines filtered by rules using the Triangulate Elements tool.
The automatic process writes the triangles as shape elements into multiple design files. A seed file is used as starting point for creating the triangle design files.
To produce triangle design files automatically in a batch process:
1. Prepare the laser data in TerraScan. Normally, this includes the classification of ground or model keypoints. Create a TerraScan project that references the laser point files.
2. If required, create breakline vector elements using MicroStation and TerraScan tools.3. Create a seed file for storing the triangles.
The seed file is usually an empty MicroStation 3D design file possibly with a reference file attached. The reference file contains the breaklines that are included in the triangle computation. Alternatively, the breaklines can be stored in the seed file directly.
4. If breakline vectors are used, create filtering rules for breaklines using the Triangulate Elements tool.
5. Create shapes that divide the project area into smaller parts.
Each shape results in a separate design file for triangles. The shape boundary is used by the software as fence in order to decide whether triangles are inside or outside the shape and to clip the triangles to the shape dimensions.
6. (Optional) Place text elements inside the shapes.
The texts are used for naming the triangle design files. If no texts are selected, the files are named by automatic numbering.
7. Select the shapes and (optional) the texts.8. Select Produce triangles command from the Utility pulldown menu in TerraModeler
Surfaces window.
This opens the Produce triangles dialog:
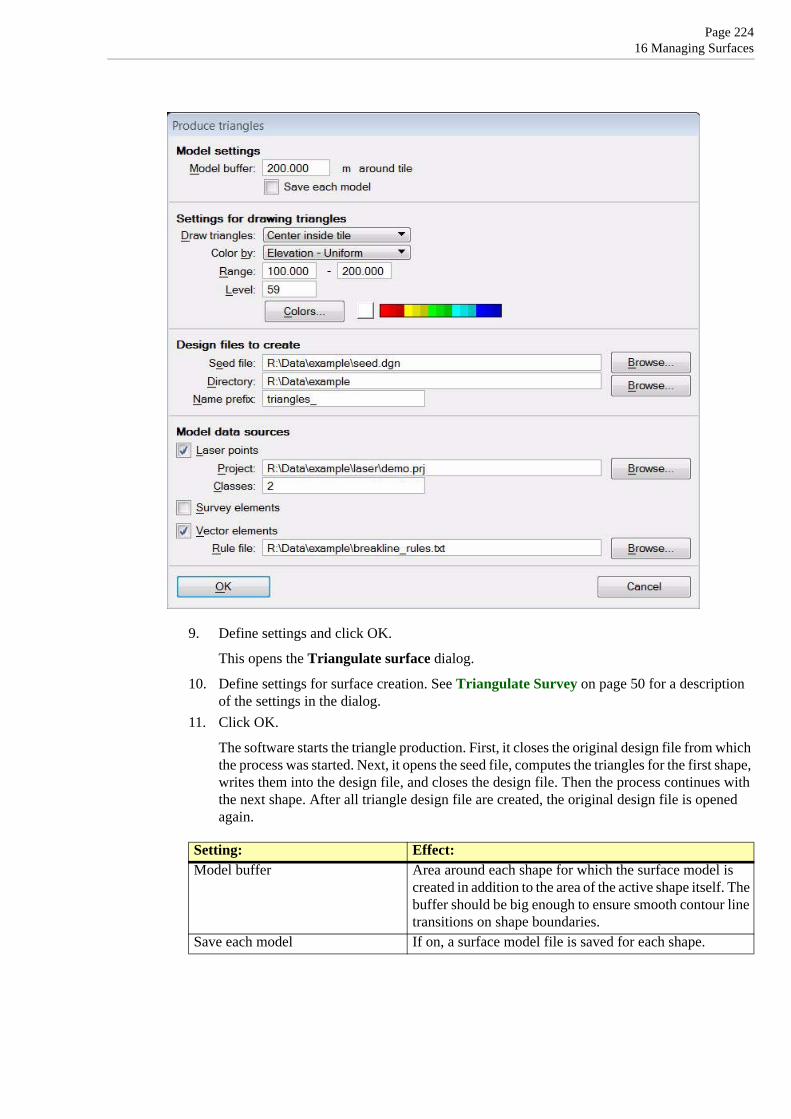
Page 22416 Managing Surfaces
9. Define settings and click OK.
This opens the Triangulate surface dialog.
10. Define settings for surface creation. See Triangulate Survey on page 50 for a description of the settings in the dialog.
11. Click OK.
The software starts the triangle production. First, it closes the original design file from which the process was started. Next, it opens the seed file, computes the triangles for the first shape, writes them into the design file, and closes the design file. Then the process continues with the next shape. After all triangle design file are created, the original design file is opened again.
Setting: Effect:Model buffer Area around each shape for which the surface model is
created in addition to the area of the active shape itself. The buffer should be big enough to ensure smooth contour line transitions on shape boundaries.
Save each model If on, a surface model file is saved for each shape.

Page 22516 Managing Surfaces
Draw triangles Defines how triangles are drawn on tile boundaries:• All - all triangles are drawn.• Center inside tile - triangles are drawn completely if
the center point is inside the tile.• Clipped to tile boundary - triangles are clipped to the
tile boundaries. This results in rectangles along tile boundaries..
Color by Defines the coloring mode:• Elevation - Uniform - triangles are colored by
elevation value. The colors are fitted to the given Range of elevation values.
• Elevation - Fit to tile - triangles are colored by elevation value. The colors are fitted to elevation values of each tile individually.
• Slope - triangles are colored by slope gradient.Range Elevation range for all triangle design files. The range
should include all elevation values of the area for which triangles are produced in order to ensure seamless coloring over all triangle design files. This is only active if Color by is set to Elevation - Uniform.
Level Level on which the triangles are drawn into the design file.Colors Opens the Color scheme dialog for the definition of a
color scheme for triangle coloring. See Creating a coloring scheme of discrete colors for more information.
Color button Opens the MicroStation color table for single color selection.
Seed file Location of the design file that serves as seed file for triangle production.
Directory Location on a hard disk where the triangle design files are stored.
Name prefix Text string that is added at the beginning of the file name of triangle design files.If text elements are selected for each shape, the triangle design file names are a combination of the prefix and the selected text element. If no text elements are selected, the triangle design files are named with the prefix and an automatically increasing number.
Laser points If on, laser points from the given Project and Class are used as data source.
Survey elements If on, feature coded elements created by TerraSurvey or any other application enabled in Triangulate Survey category in the TerraModeler Settings are used as data source.
Vector elements If on, vector elements filtered as breaklines according to the given Rule file are used as data source.
Setting: Effect:

Page 22616 Managing Surfaces
Utility / Lattice databaseNot Lite
Lattice database commands can be used for working with lattice databases, a collection of grid files stored in the same directory. This is described in detail in Chapter Lattice Database on page 246.

Page 22716 Managing Surfaces
Tools pulldown menuMenu commands from Tools pulldown menu in Surfaces window can be used to open tool boxes of TerraModeler. The tool boxes are the same as in the Main tool box of the application. In addition, there is an Extension category with two tool boxes that are not part of the Main tool box: Flood Mapping and Lifting 2D Contours .
In TerraModeler Lite, only tool boxes that are available in the Lite version are included in the Tools pulldown menu.
To: Choose menu command:Open the Main tool box Tools / MainOpen the General tool box Tools / GeneralOpen the Create Surfaces tool box Tools / Create SurfacesOpen the Draw using Surface tool box Tools / Draw using SurfaceOpen the Drawing Utilities tool box Tools / Drawing UtilitiesOpen the Edit Point tool box Tools / Edit PointOpen the Edit Area tool box Tools / Edit AreaOpen the Display Surface tool box Tools / Display SurfaceOpen the Display Regions tool box Tools / Display RegionsOpen the Profiles tool box Tools / ProfilesOpen the Quantity tool box Tools / QuantityOpen the Domains tool box Tools / DomainsOpen the Flood Mapping tool box Tools / Extensions / Flood MappingOpen the 2D Contours tool box Tools / Extensions / 2D Contours

Page 22816 Managing Surfaces
View pulldown menuMenu commands from View pulldown menu in Surfaces window are used to change the appearance of the Surfaces window.
To: Choose menu command:Display a minimized Surface window View / Minimal dialogDisplay a small size Surfaces window View / Small dialogDisplay a medium size Surfaces window View / Medium dialogDisplay a large size Surfaces window View / Large dialogChange the display of fields in the Surfaces window View / Fields
Sort the list of surfaces in the Surfaces window View / Sort by
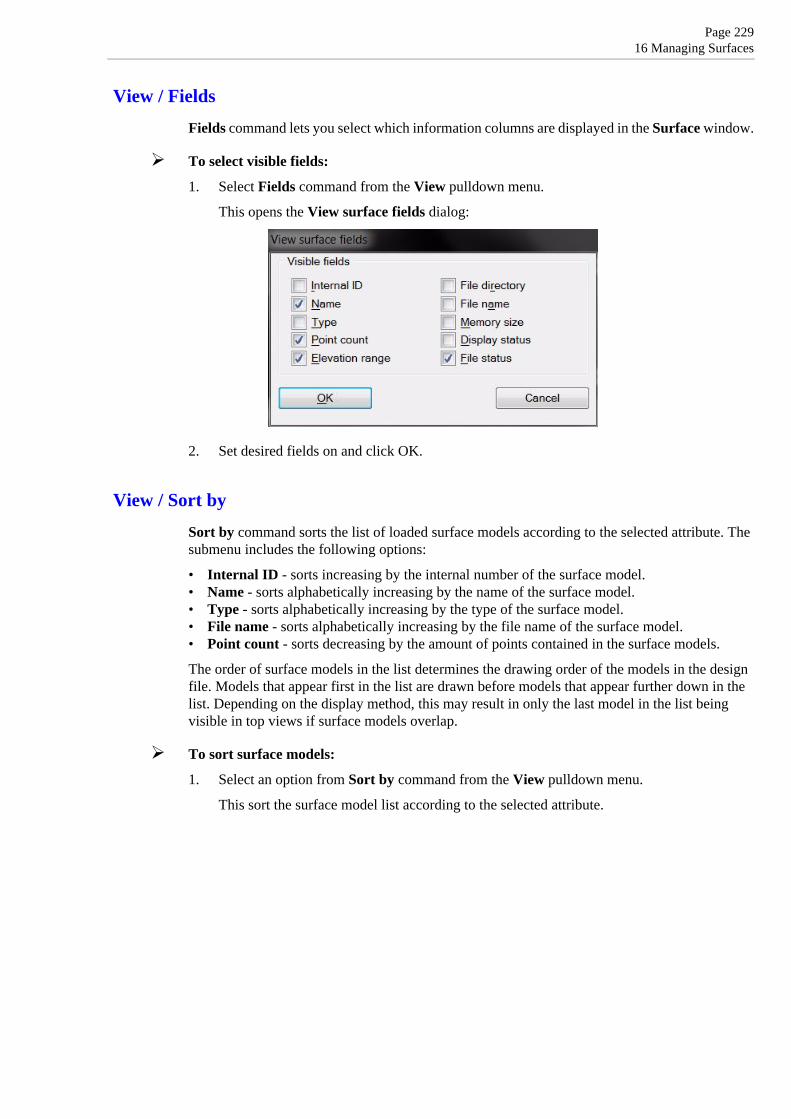
Page 22916 Managing Surfaces
View / Fields
Fields command lets you select which information columns are displayed in the Surface window.
To select visible fields:
1. Select Fields command from the View pulldown menu.
This opens the View surface fields dialog:
2. Set desired fields on and click OK.
View / Sort by
Sort by command sorts the list of loaded surface models according to the selected attribute. The submenu includes the following options:
• Internal ID - sorts increasing by the internal number of the surface model.• Name - sorts alphabetically increasing by the name of the surface model.• Type - sorts alphabetically increasing by the type of the surface model.• File name - sorts alphabetically increasing by the file name of the surface model.• Point count - sorts decreasing by the amount of points contained in the surface models.
The order of surface models in the list determines the drawing order of the models in the design file. Models that appear first in the list are drawn before models that appear further down in the list. Depending on the display method, this may result in only the last model in the list being visible in top views if surface models overlap.
To sort surface models:
1. Select an option from Sort by command from the View pulldown menu.
This sort the surface model list according to the selected attribute.

Page 23016 Managing Surfaces
Help pulldown menuMenu commands from Help pulldown menu in Surfaces window are used to open this Users’ Guide and to display license information for TerraModeler.
Help / Contents
Contents command launches Acrobat Reader for accessing this Users’ Guide in PDF format. It performs the same action as the Help On TerraModeler tool.
To: Choose menu command:Open the TerraModeler Users’ Guide Help / ContentsDisplay the license information dialog Help / About TerraModeler

Page 23117 Importing and Exporting Data
17 Importing and Exporting DataTerraModeler can import data from a variety of sources and output data to several file formats. Most of the import and export functions can be found in the File pulldown menu of the Surfaces windows.
For data type: Use for import: Use for export:Xyz text file Import / XYZ text file Export / Xyz text fileXyz binary file (LAS, BIN, FBI) Import / XYZ binary file -Disimp grid file Import / Lattice file Export / Lattice fileIntergraph grid file (GRD) Import / Lattice file Export / Lattice fileOrdnance Survey NTF grid file Import / Lattice file -Triangles in design file Import / Triangles Display Triangles toolTriangle text file - Export / Triangle text fileArcInfo grid file (GRD) - Export / Lattice fileGeoTIFF grid file - Export / Lattice fileJapanese grid file - Export / Lattice fileRaw binary grid file - Export / Lattice fileSurfer grid file - Export / Lattice fileXyz text grid file Import / XYZ text file Export / Lattice fileElevation-colored raster image - Export / Raster imageGraphical elements Triangulate Elements tool Export / Graphical elementsSiteWorks surface model File / Open surface -

Page 23217 Importing and Exporting Data
Import / XYZ text file
Xyz text file command in used to create a new surface model or to add points to an existing model from a text file. The text file stores the easting, northing, and elevation coordinates for each point of the model.
TerraModeler requires that one row in a text file represents one point. The coordinates have to be stored in fields separated by white space, comma, or semicolon. The text file may have additional fields, such as a point number, code, a text string, pen up field, or any other fields that can be ignored for the import.
To import points from a text file
1. Select Xyz text file command from the File / Import pulldown menu.
This opens the Import Xyz text file dialog, a standard dialog for opening files.
2. Locate the text file that stores the surface model points.
This opens the File format for import dialog:
TerraModeler reads the first 25 rows from the text file and displays them in the dialog. The Delimiter is detected automatically.
3. Check the Delimiter and select the fields where E, N, and Z coordinates are stored.4. If required, define additional fields and settings.5. Click OK.
This opens the Point usage dialog:
6. Define whether to use the points as Random points or as Breakline points.7. Click OK.
This opens the Triangulate surface dialog. Continue as described for Triangulate Survey on page 50.
A new surface model is created from the xyz text file or the points are added to an existing surface model.

Page 23317 Importing and Exporting Data
Setting: Effect:Delimiter Character that separates the fields in a line of one point
from each other: Space, Comma, or Semicolon.Non-continuous point number breaks string
If on, breaklines are splitted into separate chains if the point number increment is bigger than 1.
Invalid row breaks the string If on, breaklines are splitted into separate chains if there is an empty or invalid line in the input text file.
Attributes for fields in the text file Attribute that is stored for a point in a specific field:• Ignore - the field is ignored during import.• E, N, Z - easting, northing, elevation coordinates.• Code - text string. Defines, for example, the type of a
breakline element.• Number - point number.• String - chain number. Defines, for example,
contineous breakline elements.• Pen up - marks the end of a chain if it is not 0.

Page 23417 Importing and Exporting Data
Import / XYZ binary file
Xyz binary file command is used to create a new surface model or to add points to an existing model from a TerraScan binary file. The binary file stores the easting, northing, and elevation coordinates for each point of the model.
The binary file may have additional fields, such as the point code, which determines the type of the point. See Point Types on page 285 for the code definitions.
To import points from a binary file
1. Select Xyz binary file command from the File / Import pulldown menu.
This opens the Import Xyz binary file dialog, a standard dialog for opening files.
2. Locate the file that stores the surface model points.
This opens the Code usage dialog which defines point codes and their usage for the surface model creation:
By default, a new code definition file includes a line for Any other code used as random points in a surface model. You can add specific code definitions by using the Add button in the Code usage dialog.
The Code definition dialog opens where you can enter a Code, (optional) a Description, and define how points with this code are used. Available surface model elements are Random point, Soft breakline, Hard breakline, Contour, 2d hole, 3d hole. Points with certain codes may also be ignored for the import.
You can modify or delete a code definition by using the Edit or Delete buttons respectively in the Code usage dialog. Use commands from the File pulldown menu in order to save the code definitions into a file, open an existing code definition file, or create a new file.
3. If required, create additional code definitions in the Code usage dialog.4. (Optional) Save the code definitions into a text file using the Save as command from the
File pulldown menu in the Code usage dialog.
The code definitions are saved into a text file with the ending .COD.
5. Click OK.
This opens the Triangulate surface dialog. Continue as described for Triangulate Survey on page 50.
A new surface model is created from the xyz binary file or the points are added to an existing surface model.

Page 23517 Importing and Exporting Data
Import / Lattice fileNot Lite
Lattice file command imports lattice files and create a triangulated surface model using the grid-based points. Accepted lattice file formats are ArcInfo Grid, Intergraph GRD, Finnish National Land Survey Disimp grid files, and Ordnance Survey NTF grid files.
To import a lattice file:
1. Select Lattice file command from the File / Import pulldown menu.
This opens the Import grid file dialog, a standard dialog for opening files.
2. Locate the file that stores the surface model points.
This opens the Import lattice file dialog:
3. Define settings and click OK.
This opens the Surface settings dialog. Continue as described for File / New surface on page 193.
A new surface model is created from the lattice file.
A triangulated surface model requires a lot more memory than a lattice model file, if all the lattice points are used in the triangulation. Therefore, it might be necessary to leave out some of the lattice points. TerraModeler is capable of leaving out less relevant points and still building a triangulated network within a given tolerance of the original grid points.
Setting: Effect:Surface Surface to be created from the lattice file. Always New
surface.Thin model If on, the software leaves out less relevant points from the
lattice file in order to reduce the file size of the surface model file.
Allow Z error Tolerance for leaving out points from the original lattice file. The software creates the final surface model file within the given tolerance value. This is only active if Thin model is switched on.

Page 23617 Importing and Exporting Data
Import / Triangles
Triangles command creates a new surface model from triangle elements drawn in the design file. This can be used, for example, to import a triangulated surface model created by another application.
To import triangles from the design file:
1. Select Triangles command from the File / Import pulldown menu.
This opens the Import triangles dialog:
2. Define settings and click OK.
This opens the Surface settings dialog. Continue as described for File / New surface on page 193.
A new surface model is created from the triangle elements. The triangle structure of the surface model is identical with the original triangle elements.
Setting: Effect:Surface Surface to be created from the triangles. Always New
surface.From level Level in the design file on which the triangle elements are
located.

Page 23717 Importing and Exporting Data
Export / Xyz text file
Xyz text file command creates a text file from surface model points. The points can be written into a simple text file where the easting, northing, and elevation coordinates of each point are stored in one line, or into survey application-specific text files. Supported text file formats are Geodimeter, Gemini, Tekla, Wild GRE, Wild COGO, and XYZ Text.
To create a text file from surface model points
1. Select a surface in the Surfaces window.2. Select Xyz text file command from the File / Export menu.
The Export XYZ dialog opens:
3. Select a Format for the output file.4. If another format than XYZ Text is selected, define additional settings.5. Click OK.
This opens the File for point output dialog, a standard dialog for saving files.
6. Enter a name for the output file and click OK.
This creates the output file.
Setting: Effect:Format Format of the output file.Tekla Order of fields in Tekla text files. This is only active when
Format is set to Tekla.Codes Feature codes for different surface point types in the output
file. This is only active if Format is not set to XYZ Text.
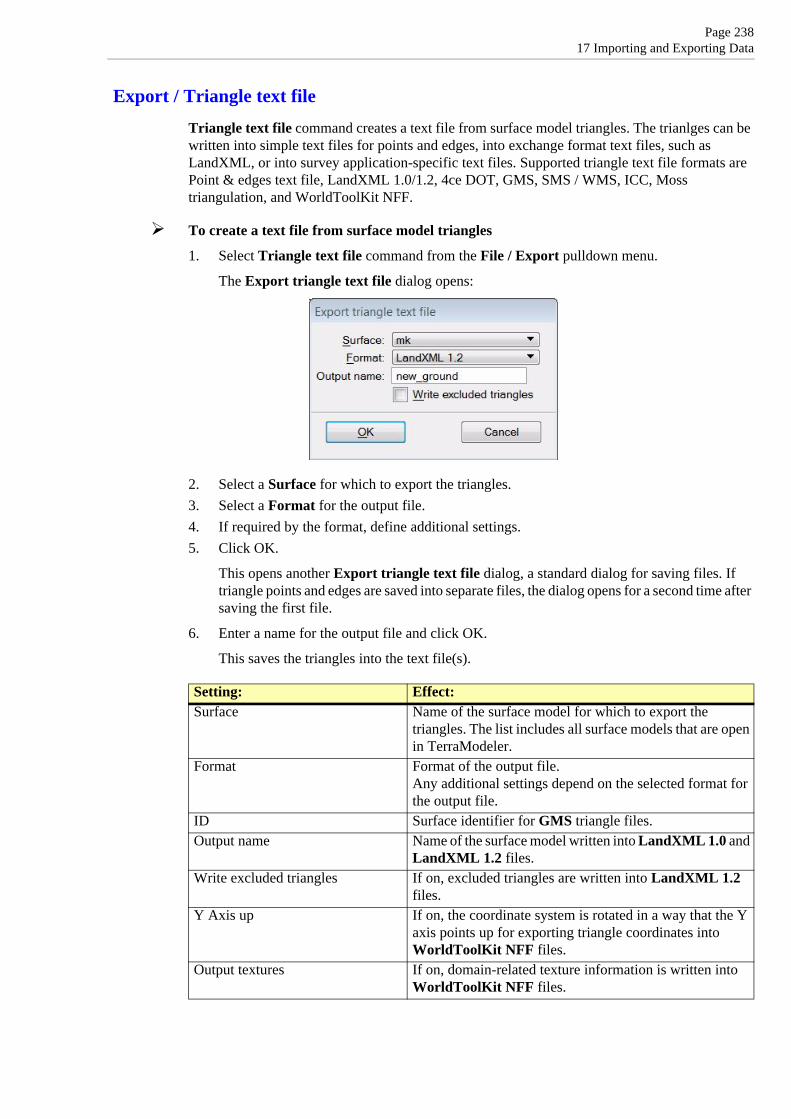
Page 23817 Importing and Exporting Data
Export / Triangle text file
Triangle text file command creates a text file from surface model triangles. The trianlges can be written into simple text files for points and edges, into exchange format text files, such as LandXML, or into survey application-specific text files. Supported triangle text file formats are Point & edges text file, LandXML 1.0/1.2, 4ce DOT, GMS, SMS / WMS, ICC, Moss triangulation, and WorldToolKit NFF.
To create a text file from surface model triangles
1. Select Triangle text file command from the File / Export pulldown menu.
The Export triangle text file dialog opens:
2. Select a Surface for which to export the triangles.3. Select a Format for the output file.4. If required by the format, define additional settings.5. Click OK.
This opens another Export triangle text file dialog, a standard dialog for saving files. If triangle points and edges are saved into separate files, the dialog opens for a second time after saving the first file.
6. Enter a name for the output file and click OK.
This saves the triangles into the text file(s).
Setting: Effect:Surface Name of the surface model for which to export the
triangles. The list includes all surface models that are open in TerraModeler.
Format Format of the output file.Any additional settings depend on the selected format for the output file.
ID Surface identifier for GMS triangle files.Output name Name of the surface model written into LandXML 1.0 and
LandXML 1.2 files.Write excluded triangles If on, excluded triangles are written into LandXML 1.2
files.Y Axis up If on, the coordinate system is rotated in a way that the Y
axis points up for exporting triangle coordinates into WorldToolKit NFF files.
Output textures If on, domain-related texture information is written into WorldToolKit NFF files.

Page 23917 Importing and Exporting Data
Export / Lattice fileNot Lite
Lattice file command creates a lattice model file from a surface model. Lattice models are representations of a surface using a grid structure of points. The lattice model files include regularly distributed points at constant intervals in both, X and Y directions. Common storage formats are text files, image files, or software-specific grid file formats.
The command can create lattice files for multiple selected rectangles in a batch process. This requires rectangles drawn in the design file that define the lattice file boundaries. In order to automate the file naming for the output files as well, a text element can be placed inside the rectangles. Both, the rectangles and the text elements must be selected in order to use them in the export process.
To create lattice model file(s) from a surface model:
1. (Optional) Draw and select rectangle(s) and text element(s) for defining the area of the output file(s).
2. Select Lattice file command from the File / Export pulldown menu.
This opens the Export lattice file dialog:
3. Define settings and click OK.4. If the area of the output file is not selected in step 1, define the export area by drawing a
rectangle with two data clicks in a top view.5. If the output file names are not defined by selected text elements, the Export grid file
dialog opens, a standard dialog for saving file.
Enter a name including the file extension for the output file and click OK.
The lattice file is created.
Setting: Effect:Surface Surface model for which to create the lattice file.

Page 24017 Importing and Exporting Data
Export Area covered by the output file:• Whole surface - the complete surface model is
exported.• Rectangle - the surface model area for export is defined
by a orthonormal rectangle.• Rotated rectangle - the surface model area for export
is defined by a rotated rectangle. This is only active if File format is set to Intergraph GRD.
• Selected rectangle(s) - the area defined by selected rectangle(s) is exported. This is only active if at least one retangular shape is selected.
Grid size Constant distance between points in the grid structure of the lattice model file.
Exclude outside fence If on, the surface points outside a fence are treated as outside points. This is only active if a MicroStation fence is drawn or if a shape element is selected.
File format Format of the output file. Available formats are:• ArcInfo Grid, Intergraph GRD• Disimp raster format• GeoTIFF formats, Shaded GeoTIFF• Japanese DMF and LEM• Raw image formats• Surfer ASCII and binary• XYZ text
Many of the additional settings for the lattice files depend on the selected format for the output files.
Values at Defines the exact location of the lattice point coordinates:• Cell center - the coordinates of the grid cell center are
stored.• Cell corner - the coordinates of the grid cell corner are
stored.For some output file formats only one option is available.
No data value Defines a constant value for grid cells inside the lattice model area where no elevation value can be derived from the source data. This can be, for example, a software-specific value.
Z unit Defines the elevation value unit for several raster formats.Create TFW files If on, external georeferencing files are created for
GeoTIFFs.Write coordinate block If on, positional information is written into the structure of
Intergraph GRD files.Byte order Defines the byte order for Raw image formats related to
the processor type: Intel or Motorola.Outside points Defines for Xyz text files how to handle grid points outside
the lattice model area where no elevation value can be derived from the source data:• Skip - outside grid points are not written into the text
file.• Output - outside grid points are written into the text file
using the constant value given in the Using Z field.
Setting: Effect:

Page 24117 Importing and Exporting Data
File naming Defines the file naming method if several output files are created:• Enter name for each - the software asks you to enter a
name for each lattice file that is created.• Selected text elements - the software uses a text
element placed and selected inside the rectangle(s) as file name.
This is only active if Export is set to Selected rectangle(s).
Directory Directory for storing the output file(s). This is only active if File naming is set to Selected text elements.
Extension File extension for the output file(s). This is only active if File naming is set to Selected text elements.
Setting: Effect:

Page 24217 Importing and Exporting Data
Export / Raster imageNot Lite
Raster image command creates image files from a surface model. It can either create an output file for the whole surface model or for the area defined by a selected rectangle. The coloring can be based on the elevation values of a surface model or on elevation differences between two surface models. The images can be created using color depths of 24 bit (true-color), 256 colors, or 8 bit (grey-scale).
To export a raster image:
1. (Optional) Draw and select a rectangle that defines the area of the output file.
1. (Optional) Select a surface model from the list in the Surfaces window.2. Select Raster image command from the File / Export menu.
This opens the Export Raster Image dialog:
3. Define settings and click OK.
TerraModeler computes the pixel colors and then opens another Export Raster Image dialog, a standard dialog for saving files.
4. Enter a name for the output file and click OK.
A raster image is created.
Setting: Effect:Export Area covered by the output file:
• Whole surface - the complete surface model is exported.• Selected rectangle - the area defined by a selected rectangle is
exported. This is only active if a retangular shape is selected.Format File format of the output file: Windows BMP or GeoTIFF.Color by Attribute used for coloring the output file:
• Elevation - coloring based on the elevation values of a surface model.• Vertical difference - coloring based on the vertical difference
between two surface models.• Shortest distance - coloring based on the shortest distance between
two surface models.• Shaded surface - coloring based on lightning conditions.

Page 24317 Importing and Exporting Data
Color scheme for raster image filesThe Color Scheme dialog lets you define a color scheme for the raster image export files. The dialog uses the RGB or the HSV color models. The software creates smooth transitions between the colors assigned to the color scheme.
The vertical bar on the left shows all the colors currently assigned in the scheme. Each color boundary has an elevation label displaying the elevation where a smooth color change occurs. The
Surface(s) Name of the surface(s) to be used for output file creation. If color by is set to Vertical difference or Shortest distance, two surfaces must be selected.
Step Size of each pixel in the output file.Attach as reference If on, the output file is attached as reference in MicroStation (not MicroStation
V8i).Colors Color depth of the ouput raster image:
• 24 Bit Color - true-color image.• 256 Colors - 256 colors image.• Grey scale - 8 bit grey scale image.
Scheme Type of coloring scheme:• Cold to hot - varies from blue color hues for low values to red color
hues for high values.• Hot to cold - varies from red color hues for low values to blue color
hues for high values.• Selected colors - you can define an own coloring scheme. Click on the
Define button in order to define the Color scheme for raster image files.
Degree Determines how the color hues are distributed in Cold to hot and Hot to cold color schemes:• Hot, Warm - color hues are shifted to the red-yellow color range.• Linear - color hues are linearly distributed.• Cool, Cold - color hues are shifted to the blue-green color range.
Setting: Effect:

Page 24417 Importing and Exporting Data
text label is black, if the elevation boundary is fixed. A white text indicates that the elevation boundary has not been fixed and is recalculated if you change the number of colors in the scheme.
From the coloring scheme dialog, you can save a coloring scheme file to a hard disk.
To assign a new color:
1. Define the Color model you want to use.2. Click in the color field on the right at the location of the color you want to add to the color
scheme.
OR
2. Define Red Green Blue or Hue Saturation Value values by typing a number or moving the slider. The RGB values can range from 0 to 255, the H value can range from 0 to 359, the SV values from 0 to 100.
This selects the color and adjusts the values in the RGB or HSV fields. The selected color is displayed in the Color field.
3. Click Add in order to add the selected color to the color scheme.
The color is added to the lower end of the bar, thus, the first selected color is assigned to the highest elevation values.
To fix an elevation boundary:
1. Click on the text label of the elevation boundary.
This opens the Color elevation dialog
2. Switch Fixed on and enter an Elevation value on which to fix the color transition.3. Click OK.
This recalculates the other elevation boundaries according to the fixed elevation value.
To create a new color scheme:
1. Select Remove all command from the Color pulldown menu in the Coloring scheme dialog.
This removes all assigned colors from the current color scheme.
2. Assign new colors to the color scheme as described above.3. (Optional) Save the color scheme as a file on a hard disk using the Save as command from
the File pulldown menu in the Color Scheme dialog.
Use menu item: To:File - Open Open a previously saved color scheme file.File - Save As Save the color scheme to a file.Color - Remove last Remove last color from the color scheme.Color - Remove all Remove all colors from the color scheme.

Page 24517 Importing and Exporting Data
Export / Graphical elements
Graphical elements command draws different types of surface model points and lines on given levels into the design file. Random and inferred points can be drawn as leveling text elements, as zero length lines (points), or as X character text elements. Breaklines, contours, hole boundaries, and outer boundaries are drawn as linear elements.
The text design of the leveling text elements for random and inferred points are defined in Elevation labels category of the TerraModeler Settings.
To draw surface model elements into the design file
1. Select Graphical elements command from the File / Export pulldown menu.
This opens the Export graphical elements dialog:
2. Select a Surface model for which to draw elements into the design file.3. Select the surface element to be drawn and define Level and Color settings.4. Define the element type for drawing random and inferred points.5. Click OK.
This draws the selected elements into the design file.
The command may prove useful if you want to modify the surface in a way TerraModeler does not provide any suitable tools for.
For example, TerraModeler does not include a tool for shifting a group of surface model elements horizontally. You can accomplish this by:
1. Export the surface model elements as graphical elements into the design file.2. Switch all other levels off in a view.3. Move the graphical elements using MicroStation tools.4. Delete the old surface model.5. Use Triangulate View tool to create a new surface model from the shifted graphical
elements.
Page 24618 Lattice Database
18 Lattice DatabaseNot Lite
A lattice database in TerraModeler is a collection of grid-based files placed in the same directory on a hard disk. The lattice files are typically produced by a national land survey organization that manages elevation data covering the whole country. This type of data provides an inexpensive way to create a small-scale surface model of large areas or a quick way to derive approximate elevation values for any location in the country.
TerraModeler offers some dedicated tools which can extract elevation values from a collection of lattice files. The tools search for lattice files in a directory that is specified in Lattice database category of the TerraModeler Settings . All tools require that the design file uses the same coordinate system as the lattice files were created with.
Supported lattice file formats include:
• Disimp - used by the National Land Survey of Finland.• Ordnance Survey NTF - used by the UK Ordnance Survey.• Intergraph GRD - have to be orthonormal.
To: Choose menu command:Draw boundaries for the lattice database area Lattice database / Draw boundariesView lattice database elevation values View Elevation toolDraw contours for lattice database files into the design file Lattice database / Draw contours
Triangulate lattice database points Lattice database / Import fence contents
Page 24718 Lattice Database
Lattice database / Draw boundariesNot Lite
Draw boundaries command draws the boundaries of all lattice files in the lattice file directory into the design file. The command can be used, for example, to check what areas are covered by the lattice database files. This may be the first thing you do before working with lattice database files.
The boundaries are drawn as shape elements using the active level and symbology settings in MicroStation. The name of each lattice file is placed as text element at the center of the corresponding rectangle using active text setting in MicroStation.
To draw lattice file boundaries into the design file:
1. Select Draw boundaries command in the Utility / Lattice database pulldown menu.
This scans through the lattice database and draws rectangular shapes and text elements into the design file showing the area covered by each file. An information dialog is displayed that shows for how many lattice files the boundaries are drawn.
Viewing lattice database elevationNot Lite
View Elevation tool can display lattice database elevation values. In the tool’s dialog, select Lattice database as the Surface to view. If you move the mouse pointer inside the lattice database area, TerraModeler determines the correct lattice file and displays the elevation value closest to the mouse pointer location.
Additionally, you can use the Point on surface lock to place elements on the elevation level of the lattice database files. This offers a simple way to place an element on the approximate ground elevation anywhere in the area covered by the lattice database files.

Page 24818 Lattice Database
Lattice database / Draw contoursNot Lite
Draw contours command draws contour lines, labels, and ticks for lattice database files.
To draw contours for lattice database files:
1. Select Draw contours command from the Utility / Lattice database pulldown menu.
This opens the Draw Grid Contours dialog, a standard dialog for opening files.
2. Select the lattice file(s) for drawing contours.
The Display contours dialog opens:
The dialog is a reduced version of the Display contours dialog described for the Display Contours tool. It provides the same options for drawing contour lines, labels, and ticks, and for saving and loading contour settings files.
3. Define settings and click OK.
This draws the contours into the design file.

Page 24918 Lattice Database
Lattice database / Import fence contentsNot Lite
Import fence contents command provides an option for creating a triangulated surface model from lattice database points inside a fence. The fence may overlap several individual lattice files. A triangulated surface model enables the addition of new elevation data, such as random points or breaklines. However, changes to the surface model can not be saved into the lattice database files.
A triangulated surface model requires a lot more memory than a lattice model file, if all the lattice points are used in the triangulation. Therefore, it might be necessary to leave out some of the lattice points. TerraModeler is capable of leaving out less relevant points and still building a triangulated network within a given tolerance of the original grid points.
To triangulate lattice database points:
1. Place a rectangular MicroStation fence.2. Select Import fence contents command from the Utility / Lattice database pulldown
menu.
This opens the Import Fence Contents dialog:
3. Define settings and click OK.
This opens the Surface settings dialog. Continue as described for File / New surface on page 193.
The software processes all lattice files inside the fence and creates a triangulated surface model from the points.
Setting: Effect:Surface Surface to be created from the lattice file. Always New
surface.Thin model If on, the software leaves out less relevant points from the
lattice file in order to reduce the file size of the surface model file.
Allow Z error Tolerance for leaving out points from the original lattice file. The software creates the final surface model file within the given tolerance value. This is only active if Thin model is switched on.

Page 25019 Flood Mapping
19 Flood Mapping
Flood Mapping tool boxNot Lite
The Flood Mapping tool box is used to generate validated river cross sections from Eeby survey files or from cross section elements drawn in the design file. There are also tools to output the river cross sections to calculation software, and display the results of flood calculations. The Flood Mapping tool box belongs to the TerraModeler Extensions and can be opened from the Tools pulldown menu in the Surfaces window.
To: Use:
Import surveyed river sections Import River Sections
Modify or extend river sections Edit River Sections
Output sections to calculation software Export River Sections
Import resulting water levels Input Water Elevations
Display the area covered by sections Draw River Section Boundaries
Display flood extents Display Flood

Page 25119 Flood Mapping
Import River SectionsNot Lite
Import River Sections tool reads in cross section survey files and draws these into the design file. The input survey files have to be in Eeby format.
TerraModeler displays the imported river sections in temporary mode and opens the River cross sections dialog. The dialog offers a number of tools for validating and modifying section information. After modifications, the sections can be drawn permanently into the design file.
The river cross sections can be drawn as cell elements into the design file. Each cell contains a line element representing the cross section and a text element as section label. The label includes the section name and description.
The settings for the import of river cross section files and the symbology of the section display can be defined in River sections / Coefficients category, River sections / Eeby files category, and River sections / Symbology category of the TerraModeler Settings.
To import river sections:
1. Select the Import River Sections tool.
This opens the Import river cross sections dialog, a standard dialog for opening files.
2. Add the desired file(s) to the list of files to process and click Done.
TerraModeler reads in the selected files, draws the cross sections in temporary mode and opens the River cross sections dialog.
3. Validate and modify the cross section information using the commands and buttons in the River cross sections dialog. See Section Edit River Sections on page 252 for detailed information.
When you close the dialog, another dialog appears which lets you confirm whether you want to draw the cross sections permanently into the design file or not.
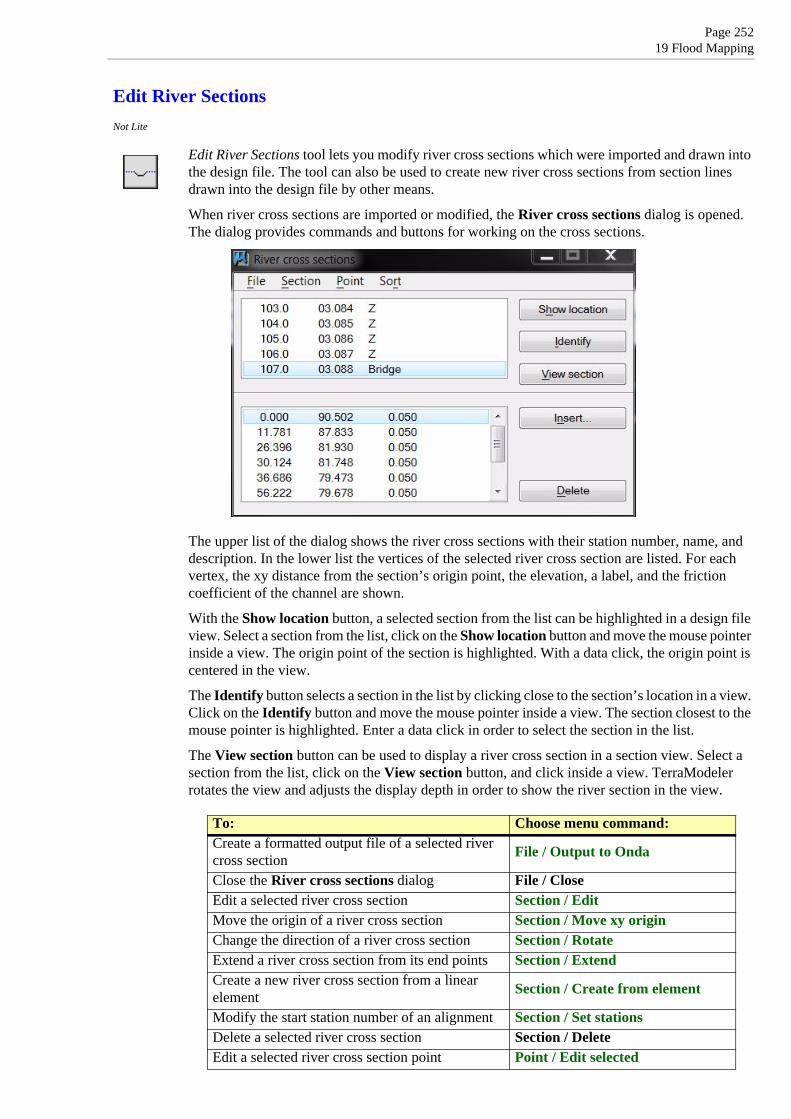
Page 25219 Flood Mapping
Edit River SectionsNot Lite
Edit River Sections tool lets you modify river cross sections which were imported and drawn into the design file. The tool can also be used to create new river cross sections from section lines drawn into the design file by other means.
When river cross sections are imported or modified, the River cross sections dialog is opened. The dialog provides commands and buttons for working on the cross sections.
The upper list of the dialog shows the river cross sections with their station number, name, and description. In the lower list the vertices of the selected river cross section are listed. For each vertex, the xy distance from the section’s origin point, the elevation, a label, and the friction coefficient of the channel are shown.
With the Show location button, a selected section from the list can be highlighted in a design file view. Select a section from the list, click on the Show location button and move the mouse pointer inside a view. The origin point of the section is highlighted. With a data click, the origin point is centered in the view.
The Identify button selects a section in the list by clicking close to the section’s location in a view. Click on the Identify button and move the mouse pointer inside a view. The section closest to the mouse pointer is highlighted. Enter a data click in order to select the section in the list.
The View section button can be used to display a river cross section in a section view. Select a section from the list, click on the View section button, and click inside a view. TerraModeler rotates the view and adjusts the display depth in order to show the river section in the view.
To: Choose menu command:Create a formatted output file of a selected river cross section File / Output to Onda
Close the River cross sections dialog File / CloseEdit a selected river cross section Section / EditMove the origin of a river cross section Section / Move xy originChange the direction of a river cross section Section / RotateExtend a river cross section from its end points Section / ExtendCreate a new river cross section from a linear element Section / Create from element
Modify the start station number of an alignment Section / Set stationsDelete a selected river cross section Section / DeleteEdit a selected river cross section point Point / Edit selected
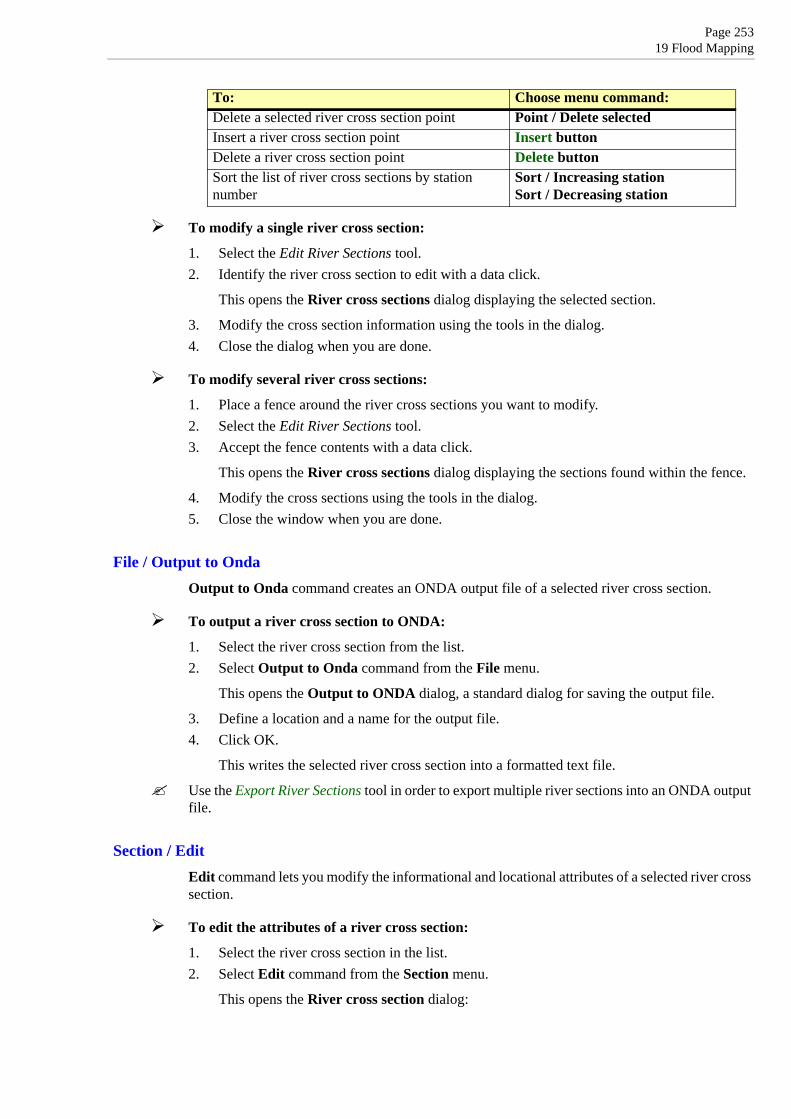
Page 25319 Flood Mapping
To modify a single river cross section:
1. Select the Edit River Sections tool.2. Identify the river cross section to edit with a data click.
This opens the River cross sections dialog displaying the selected section.
3. Modify the cross section information using the tools in the dialog.4. Close the dialog when you are done.
To modify several river cross sections:
1. Place a fence around the river cross sections you want to modify.2. Select the Edit River Sections tool.3. Accept the fence contents with a data click.
This opens the River cross sections dialog displaying the sections found within the fence.
4. Modify the cross sections using the tools in the dialog.5. Close the window when you are done.
File / Output to OndaOutput to Onda command creates an ONDA output file of a selected river cross section.
To output a river cross section to ONDA:
1. Select the river cross section from the list.2. Select Output to Onda command from the File menu.
This opens the Output to ONDA dialog, a standard dialog for saving the output file.
3. Define a location and a name for the output file.4. Click OK.
This writes the selected river cross section into a formatted text file.
Use the Export River Sections tool in order to export multiple river sections into an ONDA output file.
Section / EditEdit command lets you modify the informational and locational attributes of a selected river cross section.
To edit the attributes of a river cross section:
1. Select the river cross section in the list.2. Select Edit command from the Section menu.
This opens the River cross section dialog:
Delete a selected river cross section point Point / Delete selectedInsert a river cross section point Insert buttonDelete a river cross section point Delete buttonSort the list of river cross sections by station number
Sort / Increasing stationSort / Decreasing station
To: Choose menu command:

Page 25419 Flood Mapping
3. Modify the values for the attributes that need to be changed.4. Click OK.
Section / Move xy originMove xy origin command can be used to correct locational errors in the xy coordinates of a river cross section. A cross section is moved by its origin point.
To move a river cross section in xy:
1. Select a river cross section in the list.2. Select Move xy origin command from the Section menu.3. Move the mouse pointer inside a top view.
The new location of the section is displayed dynamically at the mouse pointer location.
4. Enter a data click in order to define the new origin point of the river vsection.
Section / RotateRotate command is used to modify the direction of a river cross section. The direction of a section is defined as angle clockwise off from north direction around the origin point.
Alternatively, the angle can be modified by adjusting its value in the River cross section dialog.
To modify a river cross section direction:
1. Select a river cross section in the list.2. Select Rotate command from the Section menu.3. Move the mouse pointer inside a top view.
Setting: Effect:Station Station number of the river cross section.Name Free text string used as name attribute of the river cross
section.Description Free descriptive text string.Bearing Direction angle of the river cross section. North direction
is zero and angles increase clockwise.Origin X, Y, Z Easting, northing, and elevation coordinates of the origin
point of the river cross section.

Page 25519 Flood Mapping
The new location of the section is displayed dynamically at the mouse pointer location.
4. Enter a data click in order to define the new section location.
OR
2. Select Edit command from the Section menu.
This opens the River cross section dialog.
3. Enter a new Bearing angle and click OK.
The river cross section is drawn in the new direction starting from its origin point.
Section / ExtendExtend command can be used to extend a river cross section based on a surface model of the ground. The command lets you insert points to either end of the section so that it accurately follows the ground surface elevations.
To extend a river cross section:
1. Select a river cross section in the list.2. Select Extend command from the Section menu.
This opens the Extend Section dialog:
3. Select a Surface model.4. Define additional settings.5. Enter a new end point for the river section.
You can continue with step 4 or click reset when you are done.
Points that are added as extension to a river cross section get the label “X” in the list of river cross section points.
Section / Create from elementCreate from element command creates a new river cross section from a linear element that represents the section. This can be used, for example, if no river cross section survey file is available or if not all cross sections are included in the survey file.
To create a new river cross section from a line element in the design file
1. Draw a cross section of a river as linear element into the design file.2. Select the Edit River Sections tool.
Setting: Effect:Surface Surface model used to adjust the elevations of the new
section points.Drape to follow surface If on, the section line between the new end point and the
previous end point of the section is draped to the surface model elevations.
Lock to section direction If on, the cross section can be extended only in the direction of the section.

Page 25619 Flood Mapping
This opens the River cross section dialog.
3. In the dialog, select Create from element command from the Section menu.4. Identify the linear element that represents the cross section.
This opens the River cross section dialog:
5. Define Station, Name, and Description for the cross section.6. (Optional) Correct the values for the Bearing angle and the coordinates of the Origin.7. Click OK.
You can continue with step 4.
The new cross section is added to the list in the River cross sections dialog and drawn into the design file. The cross section is drawn as cell element using level and symbology settings as defined in River sections / Symbology category of the TerraModeler Settings.
Section / Set stationsSet stations command sets the station number for the river cross sections according to distances along an alignment element. The aligment can be any linear element, for example, a river center line. The stations of the cross sections are calculated from the start point of the alignment. For example, if the first cross section crosses the alignment at a distance of 25 m from the start point, the station is set to 25.000.
To set stations of river cross sections along an alignment element:
1. Select the alignment element.2. Select Set stations command from the Section menu.
This opens the Set section stations dialog:
3. Define the station value at the Alignment start point.4. Click OK.
This calculates the station values for the river cross sections that cross the alignment. The station values are calculated as the distance along the alignment from the alignment’s start point to the cross section plus the alignment’s start point station value.

Page 25719 Flood Mapping
Point / Edit selectedEdit selected command lets you modify the attribute information of a river cross section point.
To edit a river cross section point:
1. Select a river section and a river section point in the lists.2. Select Edit selected command from the Point menu.
This opens the Section point dialog:
3. Define settings and click OK.
The attributes of the selected section point are changed.
InsertInsert button can be used to add intermediate river cross section points along the section line. The xy locations of the new points are defined by a data click. The elevation can be fixed to a given value or adjusted to a surface model.
To insert a new river cross section point:
1. Select a river cross section in the list.2. Click on the Insert button.
This opens the Insert section point dialog:
3. Define settings.4. Move the mouse pointer inside a view.
A preview of the inserted point is displayed at the mouse pointer location.
5. Define the location of the new section point with a data click.
Setting: Effect:Elevation Elevation value of the river cross section point.Label Label of the river cross section point.Coefficient Friction coefficient of the river cross section point.

Page 25819 Flood Mapping
You can continue with inserting new points for the selected cross section.
You can use the View Elevation tool with the Points on surface lock in order to insert new section points that are adjusted in elevation to a surface model.
DeleteDelete button can be used to remove river cross section points from the section line using the mouse.
To delete a river cross section point:
1. Select a river cross section in the list.2. Click on the Delete button.3. Move the mouse pointer inside a view.
The cross section point closest to the mouse pointer location is highlighted.
4. Define the section point to be deleted with a data click.
This removes the point from the section line.
Another option to delete cross section points is the Delete selected command from the Point pulldown menu. The command lets you delete a section point that is selected in the list.
Setting: Effect:Elevation If on, the elevation value of the inserted river cross section
point is fixed to the given elevation.Label Label of the river cross section point.Coefficient Friction coefficient of the river cross section point.

Page 25919 Flood Mapping
Export River SectionsNot Lite
Export River Sections tool creates an ONDA output file of river sections. You can output all cross sections drawn to the design file or use a fence to output only cross sections inside the fence area.
To output river sections to ONDA:
1. (Optional) Place a fence around the river sections you want to output.2. Select the Export River Sections tool.3. (Optional) Accept the fence contents with a data click.
This opens the Output to ONDA dialog, a standard dialog for saving the output file.
4. Define a location and a name for the output file.5. Click OK.
This writes the river cross sections into a formatted text file.

Page 26019 Flood Mapping
Input Water ElevationsNot Lite
Input Water Elevations tool defines water elevation values for river cross sections. It can read in water elevation data produced by ONDA. The data basically contains water elevation values for the river cross sections used in the calculation. TerraModeler tries to find a matching cross section in the design file for each elevation value. Alternatively, the water elevation values can be defined manually.
The tool draws a line string along the river cross section at the water elevation. The line strings can be used, for example, to create a surface model of the water elevations which might represent a certain flood level. If the elevation value is 0.0, no water elevation line is drawn for this section.
To define water elevation values for river cross sections:
1. (Optional) Place a fence around the river sections for which to define water elevations.2. Select the Input Water Elevations tool.3. (Optional) Accept the fence contents with a data click.
This opens the Input Water Elevations dialog:
4. Select Import results command from the File pulldown menu.
This opens the Import water elevation results dialog, a standard dialog for opening files.
5. Locate and select the ONDA file and click Open.
TerraModeler reads in the elevation data.
OR
4. Select a river cross section in the list.5. Define an elevation value in the Water field.6. Click the <Tab> key in order to apply the value for this section and to jump to the next
section.
When the Input Water Elevations dialog is closed with OK, the software draws the water elevation line strings along the respective river cross sections using active level and symbology settings.
You can use Triangulate View, Triangulate Elements, or Insert Random Elements tool to create a surface model of the water elevations.
Default exclusion logic does not work very well when creating a surface model from river cross sections. The Exclude outer boundaries field in the Triangulate surface dialog controls the exclusion logic. For river sections, you should select By key-in length option and enter a Maximum length value, such as 300.0 meters.

Page 26119 Flood Mapping
Draw River Section BoundariesNot Lite
Draw River Section Boundaries tool generates a 3D shape element around the area covered by river sections. The shape is drawn using active level and symbology settings in MicroStation.
To draw a shape around the river sections:
1. Select the Draw River Section Boundaries tool.
The boundary shape is drawn and an information dialog is displayed that shows the number of river cross sections enclosed by the shape.

Page 26219 Flood Mapping
Display FloodNot Lite
Display Flood tool computes and displays the extent of flooding. It can compare several flood models (5 year, 10 year, 25 year, …) with a ground surface model and display each using a specific color.
The calculation is based on a grid method. You can control the accuracy and speed of calculation by defining the grid size.
To display flood extents:
1. Place a fence or select a polygon around the area to compute.2. Select the Display Flood tool.
This opens the Display flood dialog:
3. Select a ground Surface model that is used as reference for the flood calculation.4. Define other settings and click OK.
TerraModeler compares each selected flood surface model with the ground surface model and draws the calculated grid according to the display settings.
Setting: Effect:Surface Name of the surface model to be used as reference for
calculating the flood extend.Mode Display method for presenting the calculation results
graphically in the design file:• Draw temporarily - (not MicroStation V8i) draws temporary
elements.• Write to file - draws permanent elements on the active
level.Draw as Elements that are drawn into the design file: Lines or
Filled shapesStep size Defines the grid size for the calculation. A small step
produces more accurate results but the calculation takes longer.
Draw If on, the selected flood surface model in the list on the left side of the dialog is displayed.
Color Color of the selected flood surface. Uses the active MicroStation color table.

Page 26319 Flood Mapping
Weight Line weight of the selected flood surface. Uses MicroStation line weights.
Style Line style of the selected flood surface. Uses MicroStation line styles.
Setting: Effect:
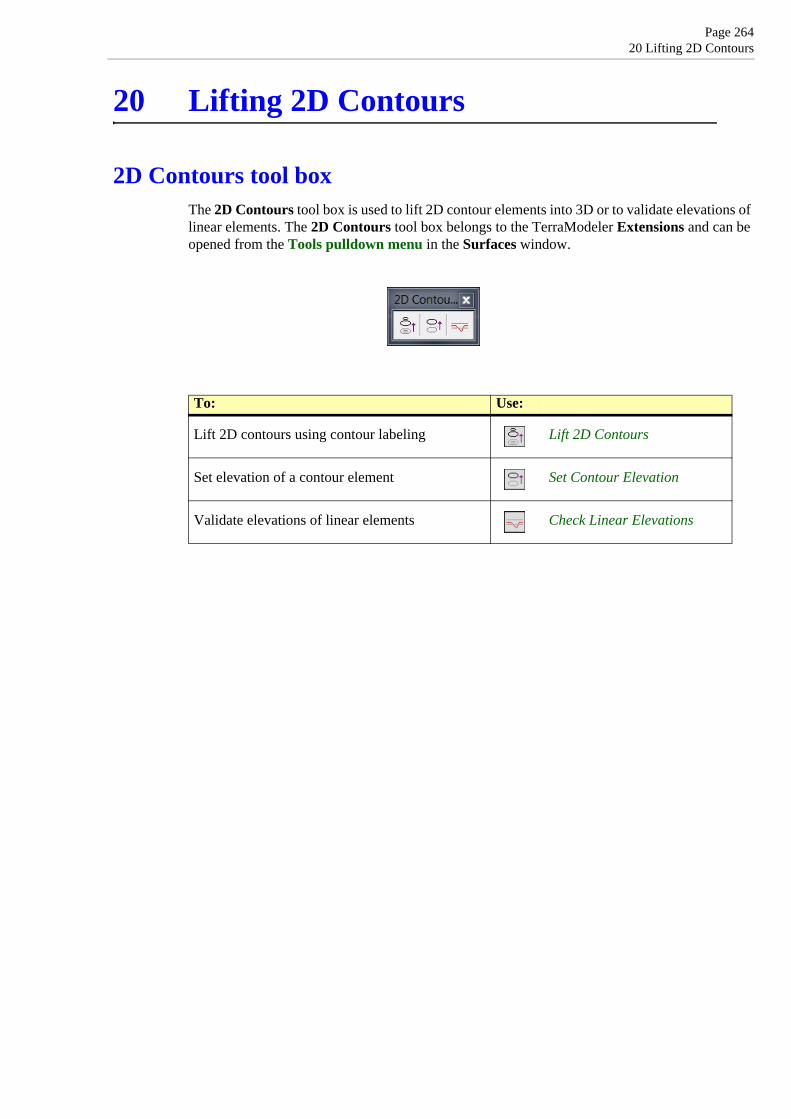
Page 26420 Lifting 2D Contours
20 Lifting 2D Contours
2D Contours tool boxThe 2D Contours tool box is used to lift 2D contour elements into 3D or to validate elevations of linear elements. The 2D Contours tool box belongs to the TerraModeler Extensions and can be opened from the Tools pulldown menu in the Surfaces window.
To: Use:
Lift 2D contours using contour labeling Lift 2D Contours
Set elevation of a contour element Set Contour Elevation
Validate elevations of linear elements Check Linear Elevations
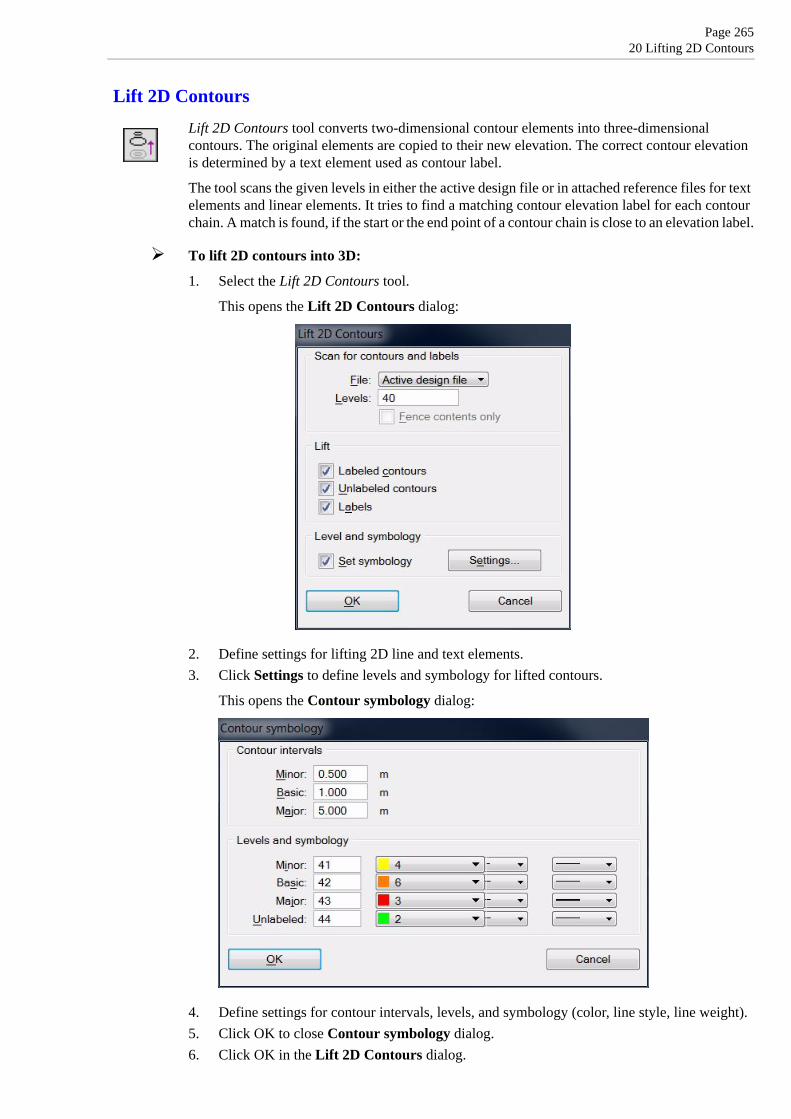
Page 26520 Lifting 2D Contours
Lift 2D Contours
Lift 2D Contours tool converts two-dimensional contour elements into three-dimensional contours. The original elements are copied to their new elevation. The correct contour elevation is determined by a text element used as contour label.
The tool scans the given levels in either the active design file or in attached reference files for text elements and linear elements. It tries to find a matching contour elevation label for each contour chain. A match is found, if the start or the end point of a contour chain is close to an elevation label.
To lift 2D contours into 3D:
1. Select the Lift 2D Contours tool.
This opens the Lift 2D Contours dialog:
2. Define settings for lifting 2D line and text elements.3. Click Settings to define levels and symbology for lifted contours.
This opens the Contour symbology dialog:
4. Define settings for contour intervals, levels, and symbology (color, line style, line weight).5. Click OK to close Contour symbology dialog.6. Click OK in the Lift 2D Contours dialog.

Page 26620 Lifting 2D Contours
TerraModeler scans the given levels in the specified files for text and linear elements. These are drawn at their new elevation in the active design file using the given contour symbology.
Setting: Effect:File Files from which to search for text and linear elements:
• Active design file - scan the active design file.• Reference files - scan all reference files with Locate setting on
in MicroStation Reference file manager.Levels List of levels from which to scan for elements. For example:
• 61 - scan level 61.• 15,21-24 - scan levels 15, 21, 22, 23 and 24.
Labeled contours If on, lift contours for which a matching label is available.Unlabeled contours If on, copy linear elements for which no elevation value is found.
The elements are copied to zero elevation.Labels If on, the contour label text elements are lifted with the contour
lines.Set symbology If on, modify the symbology of the lifted elements according to
settings defined using the Settings button.

Page 26720 Lifting 2D Contours
Set Contour Elevation
Set Contour Elevation tool lifts a linear element to a given elevation. It is designed to be used for lifting single two-dimensional contour elements to a correct elevation. It can be applied to line, shape, and text elements. The original elements are moved to their new elevation.
To set elevation of contour element(s):
1. Select the Set Contour Elevation tool.
The Set Contour Elevation dialog opens:
2. Set an elevation value in the Elevation field.3. Define additional settings. Click Settings to define level and symbology for the lifted
contour.
This opens the Contour symbology dialog:
4. Define settings for contour intervals, levels, and symbology (color, line style, line weight).5. Click OK to close Contour symbology dialog.6. Identify the element to lift.7. Accept the element.
The element is lifted to the given elevation. You can continue with steps 2, 3, or 6.
Setting: Effect:Elevation Elevation value for the lifted contour element. Use the
arrow buttons to change to a new elevation value in steps defined next to the arrow buttons.
Find connected elements If on, the application tries to find linear elements which connect exactly to the start or the end point of the identified line element. These connected elements are lifted as well.
Set level and symbology If on, modify the symbology of lifted elements according to settings defined using Settings button.

Page 26820 Lifting 2D Contours
Check Linear Elevations
Check Linear Elevations tool validates the elevations of linear elements defined by a fence. It marks invalid elements by modifying level and color of the elements.
To check elevations of linear elements:
1. Place a fence to define the area to process.2. Select the Check Linear Elevations tool.
This opens the Check Linear Elevations dialog:
3. Define settings.4. Accept the fence contents with a data click.
This modifies all elements defined by the fence mode that violate the given criteria.
Setting: Effect:Mark elements Defines invalid elements:
• Above elevation - mark elements which extend above a given elevation.
• Below elevation - mark elements which extend below a given elevation.
• With non-uniform elevations - mark elements which have vertices at more than one elevation.
Fence mode Determines what elements are validated. MicroStation fence modes are used:• Inside - only elements that are fully inside a fence.• Overlap - elements that overlap with a fence.• Clip - the part of an element that is overlapped by a fence, other
parts are not validated.• Void - only elements that are fully outside a fence.• Void overlap - elements that do not overlap with a fence .• Void clip - the part of an element that is not overlapped by a
fence, overlapped parts are not validated.Elevation Defines the elevation limit for valid elements. This is only active if
Mark elements is set to Above elevation or Below elevation.Find connected elements If on, the application tries to find linear elements which connect
exactly to the start or the end point of a line element. These connected elements are validated as well.
Level If on, move invalid elements to the given level. Color If on, set invalid elements to the given color. Uses the active color
table in MicroStation.

Page 26920 Lifting 2D Contours
Programming Interface

Page 27021 MDL Public Functions
21 MDL Public FunctionsTerraModeler has a number of functions that can be called by other MDL applications. A third party can write an application which obtains elevation values from a TerraModeler surface model or which drives operations that TerraModeler performs.
TerraModeler publishes public functions with mdlCExpression_symbolPublish(). This makes the functions available for any MDL applications.
Many Terra applications use this method of interaction between different modules. For example, TerraStreet calls FnSurfaceZ() when labeling a profile with surface elevations.

Page 27121 MDL Public Functions
Calling Method
The functions can be called with mdlCExpression_ getValue(). The code example below illustrates the method:
void Example( void){ char Expr[120] ; char Name[32] ; int Ret ;
if (TmCall( &Ret, "FnSurfaceCount()") > 0) mdlOutput_printf( MSG_PROMPT, “%d surfaces”, Ret) ; sprintf( Expr, "FnSurfaceName(%ld,%d)", (long) Name, 0) ; if (TmCall( &Ret, Expr) > 0) if (Ret) mdlOutput_printf( MSG_MESSAGE, “Name is %s”, Name) ;}
/*------------------------------------------------------------------- Call a function in TerraModeler. Store return value in *Ret.
Return 1 if successful. Return 0 if TMODEL not found. Return -1 if failed for another reason.*/
int TmCall( int *Ret, const char *Expr){ CExprValue Val ; CExprResult Res ; int Ok ;
if (!LoadApp( "TMODEL")) return (0) ;
Ok = mdlCExpression_getValue( &Val, &Res, Expr, VISIBILITY_CALCULATOR); if (Ok != SUCCESS) return (-1) ; if (Ret) *Ret = (int) Val.val.valLong ;
return (1) ;}
/*------------------------------------------------------------------- Load MDL application with Name (such as “TMODEL”).
Return 1 if succssful. Return 0 if application not found.*/
int LoadApp( char *Name){ void *Ptr ; int Ok ;
/* Is application already loaded? */
Ptr = mdlSystem_findMdlDesc( Name) ; if (Ptr) return (1) ;
/* Not loaded, attempt loading */
Ok = mdlSystem_loadMdlProgram( Name, NULL, "") ; if (Ok == SUCCESS) return (1) ;
return (0) ;}

Page 27221 MDL Public Functions
Function Prototypes/*------------------------------------------------------------------- Open a surface model with file location and name FileName.*/
int FnModelOpenSurface( char *FileName) ;
/*------------------------------------------------------------------- Close all open surface models.*/
int FnModelCloseSurfaces( void) ;
/*------------------------------------------------------------------- Return number of triangulated surface models.*/
int FnSurfaceCount( void) ;
/*------------------------------------------------------------------- Fill structure with information about triangulated surfaces. S points to a table of SurfInfo structures. Calling application should have allocated it to hold at least FnSurfaceCount() items.
Return number of items filled in the table (=FnSurfaceCount()).*/
int FnSurfaceList( SurfInfo *S) ;
typedef struct { int Id ; /* Id */ int DrawInProfile ; /* Draw in profiles? */ char Name[32] ; /* Name */ int Type ; /* Type id */ char Reserved[76] ; /* For future development - ignore now */} SurfInfo ;
/*------------------------------------------------------------------- Copy name of surface with id I into Str.
Return 1 if id I was valid. Return 0 if id was invalid.*/
int FnSurfaceName( char *Str, int I) ;
/*------------------------------------------------------------------- Return profile color of surface with id I. Return 0 if id was invalid.*/
int FnSurfaceColor( int I) ;
/*------------------------------------------------------------------- Compute bounding cube for surface with id I. Mn is set to be the minimum x,y,z of the surface model. Mx is set to be the maximum x,y,z of the surface model.
Return 1 if successful. Return 0 if failed.*/
int FnSurfaceMinMax( Dpoint3d *Mn, Dpoint3d *Mx, int I) ;

Page 27321 MDL Public Functions
/*------------------------------------------------------------------- Calculate elevation Pt->z at location Pt->x,Pt->y from surface with id I.
The elevation can not be calculated if: - the surface id is invalid - the surface is empty - the point is outside surface - the point is inside an excluded triangle
Return 1 if successful. Return 0 if the elevation could not be calculated.*/
int FnSurfaceZ( Dpoint3d *Pt, int I) ;
/*------------------------------------------------------------------- Calculate elevation for an array of x,y points from surface with id I.
Tbl is a pointer to an array of x,y points. Cnt is the number of points in the array.
The calling application should initialize the z values of the points to an invalid value such as -999999. If the elevation of a x,y point can not be calculated, the z value will remain unchanged.
Return 1 if successful. Return 0 if the surface is invalid.*/
int FnSurfaceArrayZ( Dpoint3d *Tbl, int Cnt, int I) ;
/*------------------------------------------------------------------- Drape an array of points over surface model with id I.
Tbl is a pointer to an array of x,y points. Cnt is the number of points in the array. I is the id of the surface model.
After the routine: *Pnt points to a table of generated points. *Val points to a table of characters which indicate what point intervals are valid. Val[0] indicates if point interval Pnt[0] - Pnt[1] is valid.
Return the number of points generated. Return 0 if failed.*/
int FnDrapeArray( Dpoint3d **Pnt, char **Val, const Dpoint3d *Tbl, int Cnt, int I) ;
/*------------------------------------------------------------------- Free the results from a call to FnDrapeArray().
Pnt points to a table of generated points. Val points to a table of characters.
Return 0.*/
int FnDrapeFree( Dpoint3d *Pnt, char *Val) ;

Page 27421 MDL Public Functions
/*------------------------------------------------------------------- Drape descriptor Dp over surface model with id I. FileNr is the file number of descriptor Dp. Method determines what is generated for places where the original descriptor is outside the surface. If Method is 0 : Outside part will remain unchanged. 1 : Outside part will be drawn with active symbology. 2 : Outside part will not be drawn, thus resulting in a gap.
Create new descriptor as *Pp (Dp is not changed in the process).
Return 1 if successful. Return 0 if failed.*/int FnDrapeDscr( MSElementDescr **Pp, MSElementDescr *Dp, int FileNr, int Method, int I) ;
/*------------------------------------------------------------------- Has surface with id I been triangulated?*/
int FnModelExists( int I) ;
/*------------------------------------------------------------------- Fill an option button with surface names. This function lets an external application create an option button for selecting a surface.
If P == 0, list all surfaces. If P == 1, list all triangulated surfaces.*/
int FnSurfaceOption( RawItemHdr *Raw, int P) ;
/*------------------------------------------------------------------- Fill option button with surface type names.
Return 1 always.*/
int FnSurfTypeOption( RawHdr *Raw) ;
/*------------------------------------------------------------------- Create a new empty surface model into which points can be added using FnAddPoints() or FnInsertPoints().
Type is the surface type as defined in Modeler user settings. Calling application should use zero (normally ground) or let the user select type from an option button (use FnSurfTypeOption).
Name is an optional name for the new surface. If Name == NULL, surface type name is retrieved for the surface model name.
Return ID of the new surface (0,1,...). Return -1 if failed (out of memory).*/
int FnCreateSurface( int Type, char *Name) ;

Page 27521 MDL Public Functions
/*------------------------------------------------------------------- Add random points to surface with id I. This routine can be used to insert points to an existing surface or to create a new surface. TerraModeler will always triangulate the surface during this function.
Tbl points to an array of Cnt points. Cnt is the number of points in Tbl. If AskSet is true, ask triangulation settings.
In a result of this call,
Return true if points were inserted. Return 0 if unsuccessful.*/
int FnInsertPoints( int I, int AskSet, Dpoint3d *Tbl, int Cnt) ;
/*------------------------------------------------------------------- Add points of type Type to surface with id I. TerraModeler will add these points to its point list but will not immediately triangulate the new points.
This routine can be used to insert points to an existing surface or to create a new surface.
Tbl points to an array of Cnt points. Cnt is the number of points in Tbl. Type is the point type: 1 = random 2 = breakline 3 = contour 10 = external 3D boundary 11 = external 2D boundary 20 = internal 3D boundary 21 = internal 2D boundary
Return true if points were inserted. Return 0 if unsuccessful.*/
int FnAddPoints( int I, Dpoint3d *Tbl, int Cnt, int Type) ;
/*------------------------------------------------------------------- Triangulate surface with id I. The calling application will typically call this function after calling FnAddPoints() a number of times.
If AskSet is true, ask triangulation settings.
Return 1 if triangulation was completed. Return 0 if unsuccessful.*/
int FnAddDone( int I, int AskSet) ;
/*------------------------------------------------------------------- Retriangulate surface with id I after calls to FnAddPoints().
Return 1 if triangulation was completed. Return 0 if unsuccessful.*/
int FnAddRetriangulate( int I) ;

Page 27621 MDL Public Functions
/*------------------------------------------------------------------- Add a linear element representing surface elevations to a profile descriptor. This routine can be called by an application creating a profile in which surface(s) are drawn as line string type elements.
This routine uses surface’s profile color and line style when adding elements to the descriptor.
Dp is descriptor where elements will be added. L defines the profile settings and the alignment.
Return 1 if drawn. Return 0 if failed. Return -1 if no need to draw: - surface is empty or - ‘Draw in profile’ setting is off*/
int FnProfileDscr( MSElementDescr *Dp, FnProf *L) ;
typedef struct { int SurfId ; /* Surface id or -3=all surfaces */ int Lvl ; /* Level to draw on */ Dscr *Align ; /* 2D alignment */ double AlignLen ; /* Length of the alignment */ double ExaggZ ; /* Horizontal scale / Vertical */ double RangeStart; /* Elevation range from */ double RangeEnd ; /* Elevation range to */ Dpoint3d Org ; /* Lower left corner of range*/ int Scale ; /* Horizontal scale */} FnProf ;
/*------------------------------------------------------------------- Find out grid elevation at location Pt->x, Pt->y. This function searches the lattice database for a grid file which covers the given location and reads the closest elevation value.
Return 1 if Pt->z was successfully set. Return 0 if point was outside grid data files. Return -1 if no grid files were found.*/
int FnGridZ( Dpoint3d *Pt) ;
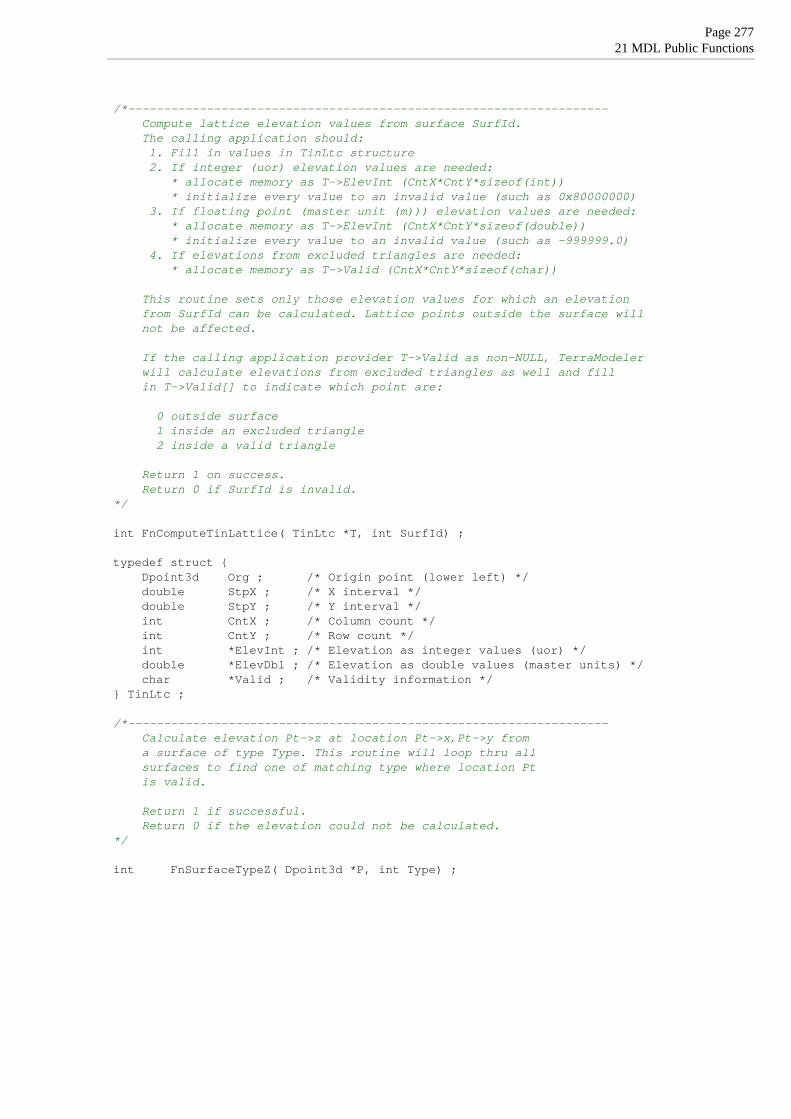
Page 27721 MDL Public Functions
/*------------------------------------------------------------------- Compute lattice elevation values from surface SurfId. The calling application should: 1. Fill in values in TinLtc structure 2. If integer (uor) elevation values are needed: * allocate memory as T->ElevInt (CntX*CntY*sizeof(int)) * initialize every value to an invalid value (such as 0x80000000) 3. If floating point (master unit (m))) elevation values are needed: * allocate memory as T->ElevInt (CntX*CntY*sizeof(double)) * initialize every value to an invalid value (such as -999999.0) 4. If elevations from excluded triangles are needed: * allocate memory as T->Valid (CntX*CntY*sizeof(char))
This routine sets only those elevation values for which an elevation from SurfId can be calculated. Lattice points outside the surface will not be affected.
If the calling application provider T->Valid as non-NULL, TerraModeler will calculate elevations from excluded triangles as well and fill in T->Valid[] to indicate which point are:
0 outside surface 1 inside an excluded triangle 2 inside a valid triangle
Return 1 on success. Return 0 if SurfId is invalid.*/
int FnComputeTinLattice( TinLtc *T, int SurfId) ;
typedef struct { Dpoint3d Org ; /* Origin point (lower left) */ double StpX ; /* X interval */ double StpY ; /* Y interval */ int CntX ; /* Column count */ int CntY ; /* Row count */ int *ElevInt ; /* Elevation as integer values (uor) */ double *ElevDbl ; /* Elevation as double values (master units) */ char *Valid ; /* Validity information */} TinLtc ;
/*------------------------------------------------------------------- Calculate elevation Pt->z at location Pt->x,Pt->y from a surface of type Type. This routine will loop thru all surfaces to find one of matching type where location Pt is valid.
Return 1 if successful. Return 0 if the elevation could not be calculated.*/
int FnSurfaceTypeZ( Dpoint3d *P, int Type) ;

Page 27821 MDL Public Functions
/*------------------------------------------------------------------- Compute elevation for each P->x,P->y point in table Tbl. Use first triangulated surface of type Type to compute the elevations.
Tbl is a pointer to an array of x,y points. Cnt is the number of points in the array.
The calling application should initialize the z values of the points to an invalid value such as -999999. If the elevation of a x,y point can not be calculated, the z value will remain unchanged.
Return 1 if a surface of Type exists. Return 0 if no surface.*/
int FnSurfTypeArrayZ( Dpoint3d *Tbl, int Cnt, int Type) ;
/*------------------------------------------------------------------- Open window for specifying how to display surfaces in profiles.
Return 0 always.*/
int FnAskProfSurfaces( void) ;
/*------------------------------------------------------------------- Compute slope end points starting from master alignment points Vrt[] using normal direction as defined by Nrm[].x and Nrm[].y. Find solution from first surface of type Typ where Prj[] is valid.
Make sure slope end points are at least Dst from master points. Store end points in Vrt[]. If slope can not be computed, compute vertex by offseting master point by at least Dst.
Return number of successfully computed points. Return -1 if no surface of type Typ.*/int FnSlopeVertices( Dp3d *Vrt, Dp3d *Nrm, int Cnt, double Rup, double Rdn, int Type, double Dst) ;
/*------------------------------------------------------------------- Display shaded surface of surface Idv in views Vwb. Vwb specifies views as a bit mask (bit 0 for view 1, ...).
This routine does not update views.
Return 1 on success. Return 0 if failed (I out of range).*/
int FnDisplayShaded( int Idv, int Vwb) ;

Page 27921 MDL Public Functions
/*------------------------------------------------------------------- Display contours for surface with id SurfId. Ap points to contour action settings. Sp points to contour settings. Sp may be NULL. Lp points to label settings. Lp may be NULL. Tp points to tick settings. Tp may be NULL.
Return 1 on success. Return 0 if failed (no surface or invalid Ap).*/
int FnDisplayContours( int SurfId, ContAct *Ap, ContSet *Sp, ContLbl *Lp, ContTck *Tp);
// Contour action for FnDisplayContours()
typedef struct { int Mode ; // 0=display only, 1=write to file, 2=preview int Type ; // 0=curves, 1=line strings, 2=soft line strings int DrawTicks ; // Draw contour ticks? int DrawLabels; // Draw contour labels? int Draw1 ; // Draw minor contours? int Draw2 ; // Draw basic contours? int Draw3 ; // Draw major contours? int Reserved1 ; double Every1 ; // Minor contour interval (master unit) double Every2 ; // Basic contour interval (master unit) double Every3 ; // Major contour interval (master unit) char Reserved2[80];} ContAct ;
// Contour settings for FnDisplayContours()
typedef struct { int ColorBy ; // Color by 0=contour type, 1=elevation int Lvl1 ; // Minor contour level int Lvl2 ; // Basic contour level int Lvl3 ; // Major contour level int Clr1 ; // Minor contour color 0-255 int Clr2 ; // Basic contour color 0-255 int Clr3 ; // Major contour color 0-255 int Sty1 ; // Minor contour style int Sty2 ; // Basic contour style int Sty3 ; // Major contour style int Wgt1 ; // Minor contour weight int Wgt2 ; // Basic contour weight int Wgt3 ; // Major contour weight int Reserved1 ; int ClrCnt ; // Number of scheme colors int Clrs[127]; // Scheme colors max 127 long ClrElev[128]; // Color elevations char ClrFix[128]; // Fixed flags for elevations int Domains ; // 0=all domains, 1=only selected domains int ElevLimit ; // 0=all elevations, 1=only ElevMin-ElevMax double ElevMin ; // - lowest elevation to draw double ElevMax ; // - highest elevation to draw int Smoothing ; // Smoothen contours? int AreaSkip ; // Skip small closed contours? double AreaMin ; // - min area (sq master units) int Complex ; // Build complex chains? int Thin ; // Thin contours? double ThinDst ; // - distance (master units) double ThinDev ; // - deviation (master units) double ThinAng ; // - turn angle (degrees) char Reserved2[80] ;} ContSet ;

Page 28021 MDL Public Functions
// Contour label settings for FnDisplayContours()
typedef struct { int LabelsOn ; // 0=major, 1=major&basic, 2=all int Pos ; // 0=above, 1=on, 2=below, 3=start point int UpHill ; // 0=label downhill, 1=uphill int Cut ; // Cut underlying contour? (if Pos == 1) double Every ; // Label interval (master units)
int Sty ; // Style int Wgt ; // Weight int OwnSymb ; // 0=contour level+color, 1=own level+color int Lvl ; // - own level int Clr ; // - own color
char Prefix[12]; // Prefix text char Suffix[12]; // Suffix text int Decim ; // Number of decimals 0,1,2 or 3 int Plus ; // Display plus? int Minus ; // Display minus? char Reserved1[80] ;} ContLbl ;
// Contour tick settings for FnDisplayContours()
typedef struct { double Every ; // Tick interval (master unit) int OnlyDepr ; // Only depressions? int Triangle ; // 0=draw line, 1=draw triangle int MaxUse ; // 0=all, 1=only closed contours < MaxArea double Length ; // Symbol length (master unit) double MaxArea ; // Maximum area (sq master unit)} ContTck ;

Page 28121 MDL Public Functions
Triangulate Survey
TerraModeler’s Triangulate Survey tool creates a surface model from survey elements. TerraModeler does not understand any details about survey elements or survey feature coding. TerraSurvey is responsible for deciding what elements and what feature codes can be used as valid information for the surface to be created.
TerraModeler scans the design file and calls a function in TerraSurvey for each element to find out if that element can be used in triangulation.
A similar calling sequence has been implemented for DigiCad, PRO600, and Espa applications. The example code below shows how an application should publish the functions for being called by TerraModeler.
#define PRO600_SYMBSET 250 /* Any value of your choice */char *ProSym = NULL ;ProSym = mdlCExpression_initializeSet( PRO600_SYMBSET, 0, 1);mdlCExpression_symbolPublish( ProSym, “Pro600StartTriMap”, SYMBOL_CLASS_FUNCTION, (CType *) &intType, Pro600StartTriMap);mdlCExpression_symbolPublish( ProSym, “Pro600AcceptTriMap”, SYMBOL_CLASS_FUNCTION, (CType *) &intType, Pro600AcceptTriMap);
/*------------------------------------------------------------------- PRO600 should use this function to add grid points to the surface model. This function enables PRO600 to add points which do not have corresponding design file elements.
Triangulate Survey command has been started for surface with id I.
PRO600 can make calls to FnAddPoints() to add points to the surface. PRO600 should not call FnAddDone() from within this routine.
Return 1 if Pro600AcceptTriMap should be called while scanning. Return 0 if Pro600AcceptTriMap does not need to be called.*/
int Pro600StartTriMap( int I) ;
/*------------------------------------------------------------------- TerraModeler calls this function for every design file descriptor if Pro600StartTriMap() returned 1.
Pro600 should return one of the following values: 0 : element is invalid for surface type Type or element is not a PRO600 element 1 : random point element 2 : breakline element 10 : external 3D boundary 11 : external 2D boundary 20 : internal 3D boundary 21 : internal 2D boundary*/
int Pro600AcceptTriMap( MSElementDescr *Dp, int FileNr, int Type) ;

Page 28221 MDL Public Functions
/*------------------------------------------------------------------- This function enables DigiCad to add points which do not have corresponding design file elements.
Triangulate Survey command has been started for surface with id value of I.
DigiCad can make calls to FnAddPoints() to add points to the surface. DigiCad should not call FnAddDone() from within this routine.
Return 1 if DigiAcceptTriMap should be called while scanning. Return 0 if DigiAcceptTriMap does not need to be called.*/
int DigiStartTriMap( int I) ;
/*------------------------------------------------------------------- TerraModeler calls this function for every design file descriptor if DigiStartTriMap() returned 1.
DigiCad can set the exact point in *Xyz (for leveling text elements where the position of the decimal point is not accurate).
DigiCad should return one of the following values: 0 : element is invalid for surface type T or element is not a DigiCad element 1 : random point element 2 : breakline element 10 : external 3D boundary 11 : external 2D boundary 20 : internal 3D boundary 21 : internal 2D boundary*/
int DigiAcceptTriMap( Dpoint3d *Xyz, MSElementDescr *Dp, int FileNr, int T) ;
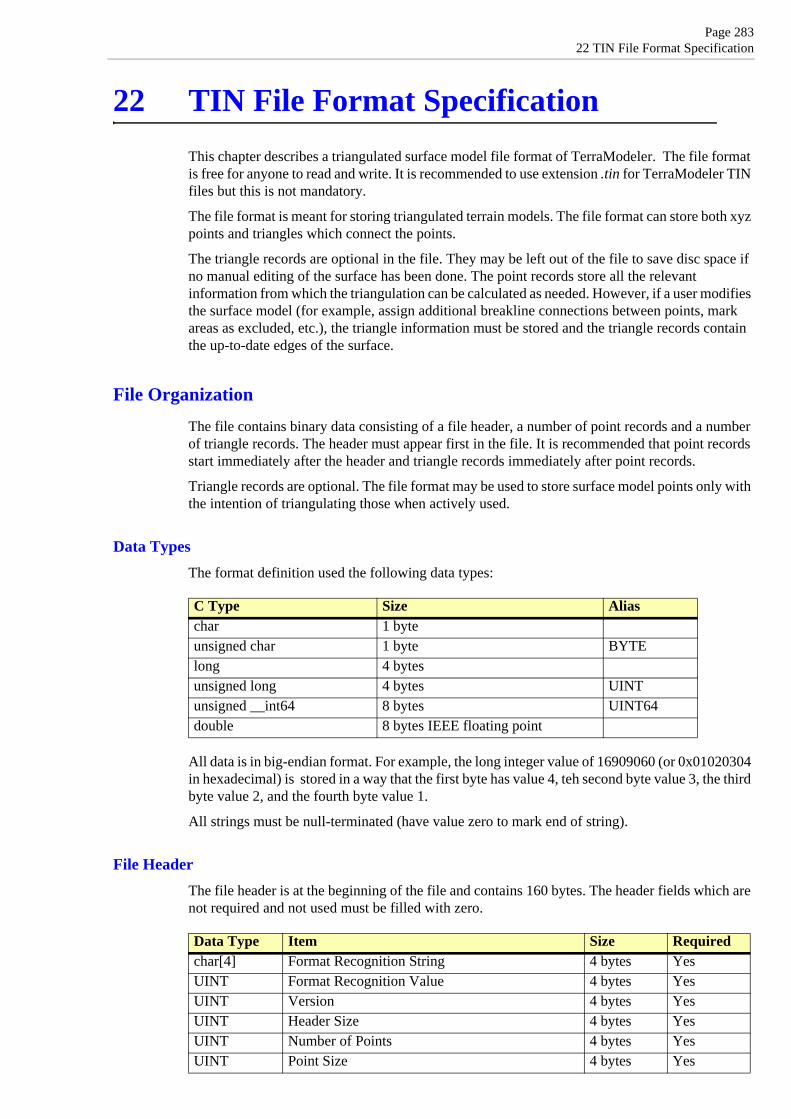
Page 28322 TIN File Format Specification
22 TIN File Format SpecificationThis chapter describes a triangulated surface model file format of TerraModeler. The file format is free for anyone to read and write. It is recommended to use extension .tin for TerraModeler TIN files but this is not mandatory.
The file format is meant for storing triangulated terrain models. The file format can store both xyz points and triangles which connect the points.
The triangle records are optional in the file. They may be left out of the file to save disc space if no manual editing of the surface has been done. The point records store all the relevant information from which the triangulation can be calculated as needed. However, if a user modifies the surface model (for example, assign additional breakline connections between points, mark areas as excluded, etc.), the triangle information must be stored and the triangle records contain the up-to-date edges of the surface.
File Organization
The file contains binary data consisting of a file header, a number of point records and a number of triangle records. The header must appear first in the file. It is recommended that point records start immediately after the header and triangle records immediately after point records.
Triangle records are optional. The file format may be used to store surface model points only with the intention of triangulating those when actively used.
Data TypesThe format definition used the following data types:
All data is in big-endian format. For example, the long integer value of 16909060 (or 0x01020304 in hexadecimal) is stored in a way that the first byte has value 4, teh second byte value 3, the third byte value 2, and the fourth byte value 1.
All strings must be null-terminated (have value zero to mark end of string).
File HeaderThe file header is at the beginning of the file and contains 160 bytes. The header fields which are not required and not used must be filled with zero.
C Type Size Aliaschar 1 byteunsigned char 1 byte BYTElong 4 bytesunsigned long 4 bytes UINTunsigned __int64 8 bytes UINT64double 8 bytes IEEE floating point
Data Type Item Size Requiredchar[4] Format Recognition String 4 bytes YesUINT Format Recognition Value 4 bytes YesUINT Version 4 bytes YesUINT Header Size 4 bytes YesUINT Number of Points 4 bytes YesUINT Point Size 4 bytes Yes

Page 28422 TIN File Format Specification
Header fields:
• Format Recognition String - must contain “TTIN”. Used for file recognition.• Format Recognition Value - must contain value 20101221. Used for file recognition.• Version - must contain value 1.• Header Size - normally set to value 160.• Number of Points - total number of point records in the file.• Point Size - size of each point record. Normally set to value 14.• Number of Triangles - total number of triangle records in the file.• Triangle Size - size of each triangle record. Normally set to value 26.• Surface Name - descriptive name for the surface such as “Ground”.• Software - software which generated the file. For example “TerraModeler”.• Surface Type - surface type which may be used to categorize models of sub soil layers or
other types of terrain surfaces. This is most often zero (= ground).• Coordinate Resolution - number of integer steps in a real world unit. If the real world unit is
meter and the coordinate resolution is 100, each integer step in point record x, y, and z fields corresponds to one centimeter.
• X, Y and Z Origin - center of the coordinate system in real world units.• Point Data Position - file position where the point records start. File position is relative to the
beginning of the file. This should normally be 160.• Triangle Data Position - file position where triangle records start.
Point RecordPoint records store information about the points from which the model is built.
Point record fields:
• X - X coordinate of the point.• Y - Y coordinate of the point.• Z - Z coordinate of the point.• Break - 0 if the point is a random point or the first point in a breakline sequence. 1 if point is
meant to be connected by a breakline edge with the previous point record.• Type - point type. See Point Types for more information.
UINT Number of Triangles 4 bytes YesUINT Triangle Size 4 bytes Yeschar[40] Surface Name 40 bytes Nochar[40] Software 40 bytes NoUINT Surface Type 4 bytes NoUINT Coordinate Resolution 4 bytes Yesdouble X Origin 8 bytes Yesdouble Y Origin 8 bytes Yesdouble Z Origin 8 bytes YesUINT64 Point Data Position 8 bytes YesUINT64 Triangle Data Position 8 bytes Yes
Data Type Item Sizelong X 4 byteslong Y 4 byteslong Z 4 bytesBYTE Break 1 byteBYTE Type 1 byte
Data Type Item Size Required

Page 28522 TIN File Format Specification
Each linear breakline feature appears as consecutive point records. The first point of a breakline should have Break = 0 and Type should be non-zero. All additional points of the same breakline should have Break = 1 and Type should be the same as for the first point.
Triangle RecordTriangle records store the actual triangulation and the neighbour relation of the triangles.
Triangle record fields:
• Vertex - three points in clockwise order. Value 0 refers to the first point record.• Neighbour - neighbouring triangles in clockwise order. Value 0 means no neighbouring
triangle. Value 1 refers to first triangle record. Neighbour[0] is the triangle on the other side of edge Vertex[0] - Vertex[1]. Neighbour[1] is the triangle on the other side of edge Vertex[1] - Vertex[2]. Neighbour[2] is the triangle on the other side of edge Vertex[2] - Vertex[0].
• Flags - active/excluded/deleted state of the triangle and edge types.• Domain - region or land type. 0 for undefined or default value.
The different bits in the Flags field have the following meaning:
• Bits 0-1 - triangle state: 0 = active, 1 = auto excluded, 2 = user excluded, 3 = deleted• Bits 2-3 - type of edge 0 (0 = normal, 1 = soft break, 2 = hard break, 3 = other break)• Bits 4-5 - type of edge 1.• Bits 6-7 - type of edge 2.
Coordinate ValuesThe X coordinate value is normally the same as easting.
The Y coordinate value is normally the same as northing.
The Z coordinate value is normally the same as elevation.
Point records store coordinate values as 32 bit integers to save disc space. To translate integer values into normal projection system coordinate values in meters or feet, the following equations have to be used:
WorldX = XOrigin + X / CoordinateResolutionWorldY = YOrigin + Y / CoordinateResolutionWorldZ = ZOrigin + Z / CoordinateResolution
Point TypesThe Type field in the point record indicates the point type. Valid point types are:
• 0 - random point.• 1 - point is part of a soft breakline element.• 2 - point is part of a hard breakline element.• 3 - point is part of a contour line.• 4 - point is an inferred point at the top of a hill or at the bottom of a depression. These points
may be automatically generated for hills and depressions when generating a surface from contours.
• 5 - point is part of an outer boundary. An outer boundary is defined by a clockwise polygon where the area outside the polygon is invalid. The last point record in the sequence has the
Data Type Item SizeUINT[3] Vertex 12 bytesUINT[3] Neighbour 12 bytesBYTE Flags 1 byteBYTE Domain 1 byte

Page 28622 TIN File Format Specification
same coordinates as the first point record in order to close the polygon. A surface model should not have more than one outer boundary.
• 6 - point is part of an inner boundary. An inner boundary is defined by a clockwise polygon where the area inside the polygon is invalid (“hole”). The last point record in the sequence has the same coordinates as the first point record in order to close the polygon.
C Structure Definitions
// TIN file header
typedef struct { char RecogStr[4] ; // Recognition "TTIN" UINT RecogVal ; // Recognition 20101221 UINT Version ; // Version 1 UINT HdrSize ; // Header size = sizeof(SurfHdr) UINT PntCnt ; // Number of points UINT PntSize ; // Size of each point 12 UINT TriCnt ; // Number of triangles UINT TriSize ; // Size of each triangle 28 char Desc[40] ; // Descriptive name for surface char Software[40] ; // Software which generated the file UINT Type ; // Surface type (0=ground,1=design,2=bedrock,..) UINT CoordSize ; // Number of integer steps per real world unit double OrgX ; // Origin of coordinate system double OrgY ; double OrgZ ; UINT64 PntPos ; // File position where point data starts UINT64 TriPos ; // File position where triangle data starts} TinHdr ;
// TIN file point record
typedef struct { long X ; long Y ; long Z ; BYTE Break ; // Break line edge with previous point BYTE Type ; // Point type TINPT_xxxx} TinPnt ;
// TIN file triangle record
typedef struct { UINT Vertex[3] ; // Triangle vertices in clockwise order UINT Neigbour[3]; // Neighbour triangle indexes BYTE Flags ; // Bits 0-1:excluded,2-3:edge0,4-5:edge1,6-7:edge2 BYTE Domain ; // Region or land type} TinTri ;
// Point types
#define TINPT_RANDOM 0#define TINPT_SOFTBRK 1#define TINPT_HARDBRK 2#define TINPT_CONTOUR 3#define TINPT_INFERRED 4#define TINPT_OUTBND 5#define TINPT_INTBND 6

Page 28722 TIN File Format Specification
Additional Information

Page 28823 Installation Directories
23 Installation DirectoriesTerraModeler shares the same directory structure with all Terra Applications. It is recommended that you install all Terra Applications in the same directory.
The list below shows a typical directory structure when TerraModeler has been installed in path C:\TERRA.
c:\terra directory where TerraModeler is installed
config for configuration files
tmodel.cfg defines environment variables
docs for documentation and online help
tmodel.pdf documentation in PDF format
example for example files used in the Tutorial
tmodel.dgn example design files
tmodel.clr example coloring scheme
license for user license files
tmodel.lic user license
ma for application files
tmodel.ma application
tmodel.dll library
seed for MicroStation seed files
tmodel for user preferences and settings

Page 28924 Configuration Variables
24 Configuration VariablesMicroStation is able to locate TerraModeler with the help of configuration variables. When you install TerraModeler, the installation program creates a configuration file TERRA.CFG which defines the required environment variables. This file is placed in MicroStation's CONFIG\APPL subdirectory.
For example, C:\...\MICROSTATION\CONFIG\APPL\TERRA.CFG may contain:
#-------------------------------------------------------## TERRA.CFG - Configuration for Terra Applications##-------------------------------------------------------
TERRADIR=c:/terra/TERRACFG=$(TERRADIR)config/
MS_MDLAPPS < $(TERRADIR)ma/MS_HELPPATH < $(TERRADIR)docs/
%if exists ($(TERRACFG)*.cfg)% include $(TERRACFG)*.cfg%endif
This configuration file includes the application-specific configuration files in C:\TERRA\CONFIG directory. TerraModeler's configuration file TMODEL.CFG may contain:
#-------------------------------------------------------## TMODEL.CFG - TerraModeler Configuration File##-------------------------------------------------------
# Directory for storing the user license file (TMODEL.LIC)
TMODEL_LICENSE=$(TERRADIR)license/
# Directory for application settings (TMODEL.INF)
TMODEL_SET=$(TERRADIR)/tmodel/
In a default configuration, MicroStation automatically includes these settings as configuration variables. You can use MicroStation's Configuration command from Workspace menu to check the values for these variables. In case these variables have not been defined correctly, you should define them manually.


![Formless: A User's Guide, [excerpt] A User's Guide to Entropy](https://img.dokumen.tips/doc/110x75/586b77ce1a28ab9c7d8bebd4/formless-a-users-guide-excerpt-a-users-guide-to-entropy-.jpg)