Embed Size (px)
Citation preview
Biogeosciences, 10, 1835–1847, 2013www.biogeosciences.net/10/1835/2013/doi:10.5194/bg-10-1835-2013© Author(s) 2013. CC Attribution 3.0 License.
EGU Journal Logos (RGB)
Advances in Geosciences
Open A
ccess
Natural Hazards and Earth System
Sciences
Open A
ccess
Annales Geophysicae
Open A
ccess
Nonlinear Processes in Geophysics
Open A
ccess
Atmospheric Chemistry
and Physics
Open A
ccess
Atmospheric Chemistry
and Physics
Open A
ccess
Discussions
Atmospheric Measurement
Techniques
Open A
ccess
Atmospheric Measurement
Techniques
Open A
ccess
Discussions
Biogeosciences
Open A
ccess
Open A
ccess
BiogeosciencesDiscussions
Climate of the Past
Open A
ccess
Open A
ccess
Climate of the Past
Discussions
Earth System Dynamics
Open A
ccess
Open A
ccess
Earth System Dynamics
Discussions
GeoscientificInstrumentation
Methods andData Systems
Open A
ccess
GeoscientificInstrumentation
Methods andData Systems
Open A
ccess
Discussions
GeoscientificModel Development
Open A
ccess
Open A
ccess
GeoscientificModel Development
Discussions
Hydrology and Earth System
Sciences
Open A
ccess
Hydrology and Earth System
Sciences
Open A
ccess
Discussions
Ocean Science
Open A
ccess
Open A
ccess
Ocean ScienceDiscussions
Solid Earth
Open A
ccess
Open A
ccess
Solid EarthDiscussions
The Cryosphere
Open A
ccess
Open A
ccess
The CryosphereDiscussions
Natural Hazards and Earth System
SciencesO
pen Access
Discussions
Technical Note: A mobile sea-going mesocosm system –new opportunities for ocean change research
U. Riebesell, J. Czerny, K. von Brockel, T. Boxhammer, J. Budenbender, M. Deckelnick, M. Fischer, D. Hoffmann,S. A. Krug, U. Lentz, A. Ludwig, R. Muche, and K. G. Schulz
GEOMAR Helmholtz-Zentrum fur Ozeanforschung Kiel, 24105 Kiel, Germany
Correspondence to:U. Riebesell ([email protected])
Received: 23 August 2012 – Published in Biogeosciences Discuss.: 19 September 2012Revised: 25 February 2013 – Accepted: 26 February 2013 – Published: 19 March 2013
Abstract. One of the great challenges in ocean change re-search is to understand and forecast the effects of envi-ronmental changes on pelagic communities and the associ-ated impacts on biogeochemical cycling. Mesocosms, exper-imental enclosures designed to approximate natural condi-tions, and in which environmental factors can be manipulatedand closely monitored, provide a powerful tool to close thegap between small-scale laboratory experiments and obser-vational and correlative approaches applied in field surveys.Existing pelagic mesocosm systems are stationary and/or re-stricted to well-protected waters. To allow mesocosm exper-imentation in a range of hydrographic conditions and in ar-eas considered most sensitive to ocean change, we developeda mobile sea-going mesocosm facility, the Kiel Off-ShoreMesocosms for Future Ocean Simulations (KOSMOS). TheKOSMOS platform, which can be transported and deployedby mid-sized research vessels, is designed for operation inmoored and free-floating mode under low to moderate waveconditions (up to 2.5 m wave heights). It encloses a watercolumn 2 m in diameter and 15 to 25 m deep (∼50–75 m3
in volume) without disrupting the vertical structure or dis-turbing the enclosed plankton community. Several new de-velopments in mesocosm design and operation were imple-mented to (i) minimize differences in starting conditions be-tween mesocosms, (ii) allow for extended experimental du-ration, (iii) precisely determine the mesocosm volume, (iv)determine air–sea gas exchange, and (v) perform mass bal-ance calculations. After multiple test runs in the Baltic Sea,which resulted in continuous improvement of the design andhandling, the KOSMOS platform successfully completed itsfirst full-scale experiment in the high Arctic off Svalbard(78◦56.2′ N, 11◦53.6′ E) in June/July 2010. The study, which
was conducted in the framework of the European Projecton Ocean Acidification (EPOCA), focused on the effects ofocean acidification on a natural plankton community and itsimpacts on biogeochemical cycling and air–sea exchange ofclimate-relevant gases. This manuscript describes the meso-cosm hardware, its deployment and handling, CO2 manipu-lation, sampling and cleaning, including some further mod-ifications conducted based on the experiences gained duringthis study.
1 Introduction
Of the more than 260 scientific papers published until nowon ocean acidification and its impacts on marine life lessthan 5 % have been conducted on communities or ecosys-tems, with the vast majority of studies performed on indi-vidual species (Gattuso and Hansson, 2011). Extrapolatingfrom organism-based effects to community and ecosystemimpacts is difficult, because the observed responses are typ-ically obtained in the absence of competition, trophic inter-actions, and with low or no genetic diversity (Riebesell andTortell, 2011). For the same reasons parameterizations of bi-ological processes in ecosystem and biogeochemical mod-els based on physiological responses of individual organismsare problematic. In benthic systems, natural high CO2 en-vironments, such as CO2-venting sites, provide a powerfultest bed to assess effects of ocean acidification at the com-munity and ecosystem level. Studies at volcanic CO2 ventshave revealed drastic changes in benthic community com-position and biodiversity when compared to adjacent areasnot exposed to high CO2 (Barry et al., 2011). Because of
Published by Copernicus Publications on behalf of the European Geosciences Union.
1836 U. Riebesell et al.: A mobile sea-going mesocosm system
lateral advection and mixing of water masses, CO2-ventingsites generally do not provide useful testing grounds to studyocean acidification impacts on pelagic communities (Riebe-sell, 2008). Oceanographic transects along natural CO2 gra-dients, e.g. from temperate to high-latitude waters (Char-alampopoulou et al., 2011) or from recently upwelled high-CO2 waters downstream towards lower-CO2 waters (Beau-fort et al., 2011), offer the opportunity for community-levelcomparisons. Because of the many other environmental fac-tors varying in concert with CO2, the interpretation of ob-served biotic differences along those gradients is complex.
For pelagic systems mesocosms provide a powerful ap-proach to maintain a natural community under close-to-natural self-sustaining conditions, taking into account rele-vant aspects from “the real world” such as indirect effects,biological compensation and recovery, and ecosystem re-silience, which commonly are not accounted for in small-scale laboratory experiments (Riebesell et al., 2010). Themesocosm approach is therefore often considered the exper-imental ecosystem closest to the “real world”, without losingthe advantage of reliable reference conditions and replication(Petersen et al., 2003). The main advantages unique to meso-cosm experimentation are as follows:
1. The ability to investigate community dynamics of threeor more levels for an extended period of time.
2. The ability to measure the pools and fluxes of bio-activeand particle reactive elements and compounds and toperform mass balance calculations in complex systems.
3. The ability to study interactions of ecosystem dynamicsand biogeochemical processes under experimental con-ditions.
4. The ability to bring together scientists from a varietyof disciplines, ranging from, e.g., molecular and evo-lutionary biology, ecophysiology, marine ecology andbiogeochemistry to marine and atmospheric chemistry.
It needs to be acknowledged, however, that some constraintsof enclosures are to be considered when extrapolating meso-cosm results to natural systems (see Riebesell et al., 2010,for a review). Enclosures of all kinds are inherently lim-ited in their ability to include higher trophic levels (e.g.fish, seabirds and mammals), and to approximate verticalmixing of water column and small-scale shear occurring innature (Menzel and Steele, 1978; Carpenter, 1996). Enclo-sure effects may also influence food web dynamics to vary-ing degrees, creating trophic interactions that can differ withmesocosm dimension and which may deviate from those ofthe natural system intended to be mimicked (Kuiper et al.,1983; French and Watts, 1989, Petersen et al., 2009). Despitethese difficulties and the intense debate they have spurredover the past decades (e.g. Pilson and Nixon, 1980; Brock-mann, 1990; Drenner and Mazumber, 1999), mesocosm en-closure studies still remain the most generally applicable
means to experimentally manipulate and repeatedly samplemulti-trophic planktonic communities.
Considering the wide range of topics in ocean change re-search where mesocosm experimentation could greatly ad-vance our science, there are surprisingly few marine meso-cosm facilities in operation. Moreover, existing facilities areeither stationary or confined to well-protected waters, lim-iting their scope of application. Here we describe a newlydeveloped sea-going mesocosm facility which can be usedin moored and free-floating mode under low to moderatewave conditions (up to 2.5 m wave heights). The new designin combination with new developments in mesocosm han-dling and sampling are intended to optimize mesocosm per-formance, prolong the duration of mesocosm experiments,and perform mass balance calculations by accounting for allrelevant pools and fluxes of elements and compounds of in-terest.
2 Material and methods
Most of the following description relates to the 2010 exper-iment off Svalbard. The corresponding sections are writtenin past tense. Some aspects of the mesocosm hardware andhandling used in 2010 were modified in subsequent experi-ments. To avoid providing detailed descriptions of the KOS-MOS approach for each new experiment, we have includeddescriptions of those modifications in this manuscript. Todistinguish between aspects specific for the 2010 experimentand those applicable to KOSMOS hardware and handling ingeneral, we will use past tense in the case of the former andpresent tense for the latter.
2.1 Mesocosm hardware
The Kiel Off-Shore Mesocosms for Future Ocean Simula-tions (KOSMOS) consist of 9 mesocosm units, which are op-erated independently. Each unit comprises a floatation frame,the mesocosm bag, a bottom shutter and sediment trap, adome-shaped hood on top of the floatation frame, weightsat the bottom of the floatation frame and the lower end of thebags to maintain an upright position when exposed to windand wave activity, and various ropes needed for mesocosmoperation. The total weight of each KOSMOS unit, includingall components described below, is approximately 1.7 tons.
2.2 Floatation frame
The KOSMOS floatation frame consists of six 7.5 m-long,30 cm-diameter closed glass fibre tubes which are fixed toa steel structure in the lower part and by a steel metal ringat the top end. Steel weights are attached to the horizontaljunctions at the bottom of the steel structure. The diameterof the glass fibre tubes, which generate the buoyancy, is re-duced at and above the waterline to lower the up- and down-ward movement of the floatation frame due to wave action.
Biogeosciences, 10, 1835–1847, 2013 www.biogeosciences.net/10/1835/2013/
U. Riebesell et al.: A mobile sea-going mesocosm system 1837
22
1
2
3 Fig. 1 4 Fig. 1.Drawing of floatation frame with steel structure (lower part),
glass fibre tubes for buoyancy, and steel ring at top, holding thedome-shaped PVC hoods. The tapering of the tubes in the above-surface section reduces buoyancy changes due to wave activity. Sizeindications in mm.
A dome-shaped roof made of polyvinyl chloride (PVC) cov-ered with metal spikes is mounted on top of the floatationframe to reduce precipitation into the mesocosms and pre-vent seabirds from landing on the frame and defecating intothe enclosures. The PCV foil has ca. 80 % light transparencyin the spectral range> 400 nm wavelength. Below 400 nmthe transparency strongly decreases, largely precluding thepenetration of UV light. A flashlight with light sensor, solarpanels and radar reflector is mounted on top of the frame, in-tended to alert passing ships. A set of clamps on either sideof the frame above the waterline serves to fix various ropesneeded to unfold, fix and operate the mesocosm enclosures(see mesocosm filling below). At the time of deployment themesocosm bag is folded in a pack positioned above the waterline (as displayed in Fig. 1).
2.3 Mesocosm bags
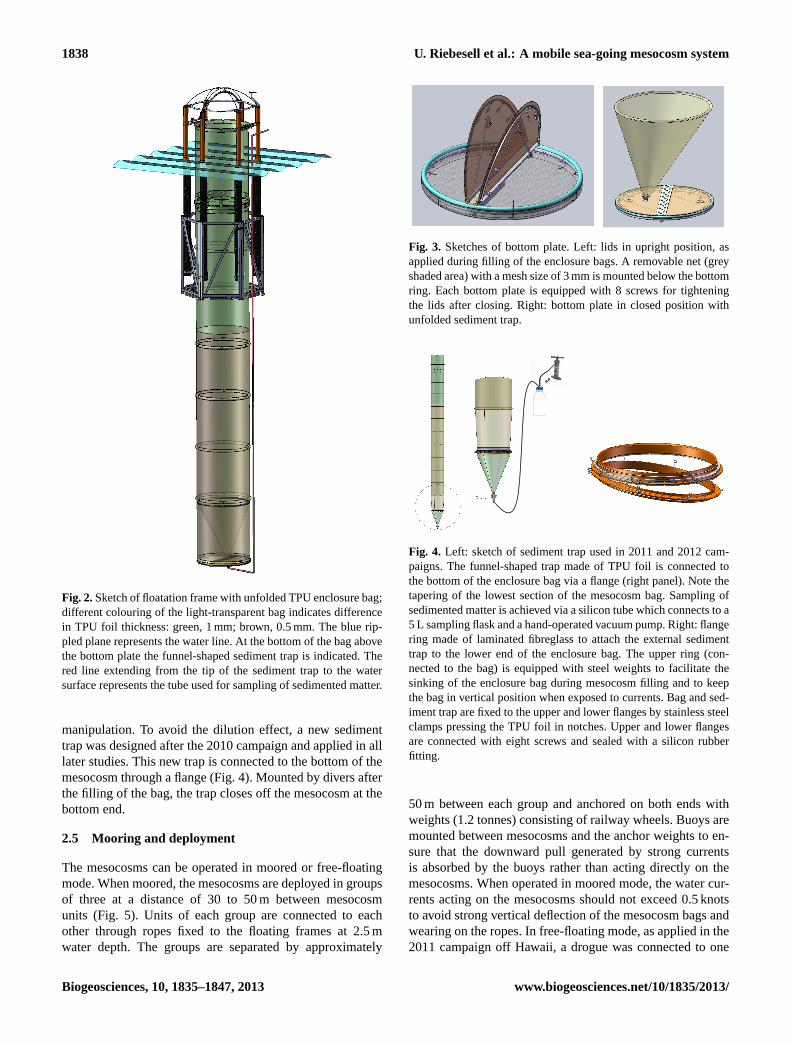
The enclosure bags are made of thermoplastic polyurethane(TPU) with a thickness of 1 mm in the upper 7 m and 0.5 mmbelow that. The bag diameter is 2 m. The length of the bagcan be selected according to the scientific question and theconditions at the deployment location. For the 2010 exper-iment a total length of 17 m, 2 m above and 15 m belowthe water line, with a volume of approximately 50 m3, waschosen. Follow-up experiments in the Raunefjord south ofBergen, Norway, in June/July 2011 used bag total lengths of25 m, and off Hawaii in November/December 2011 and in theFinnish archipelago off Tvarminne in June to August 201219 m bag lengths. To maintain an approximately cylindricalshape of the mesocosm bags, rings of 2 m inner diametermade of 4 cm polyethylene pipes are positioned every 2 m inring-shaped pockets made of TPU foil fixed onto the outsideof the enclosure bag by high-frequency welding (Fig. 2).
Measurements of light intensities taken in parallel insidethe mesocosms and outside in the fjord yielded similar sur-face layer light intensities and similar depth profiles in thePAR spectrum (see also Schulz et al., 2013). Light trans-parency measurements of the TPU foil revealed nearly 100 %absorbance of UV light. This together with the low lighttransparency below 400 nm of the PVC roof resulted in neg-ligible UV light intensities inside the mesocosms.
2.4 Bottom shutter and sediment trap
At the bottom of the enclosure bag a steel ring holds twosemi-circle plates made of 10 mm-thick Makrolon®. Theplates are in upright position to allow water to enter the meso-cosm bags during the lowering and unfolding of the bags(Fig. 3, left panel). A 2 m-long funnel-shaped sediment trapwith a mouth of the same diameter as the mesocosm bag isconnected to one of the bottom lids. It is tightly folded andattached between the bottom plates and unfolds and stretchesautomatically through an air-filled ring at the upper end of thefunnel immediately after the bottom plates are closed (Fig. 3,right panel). A silicon tube connects to the lower end of thefunnel from below the bottom lids and extends to the wa-ter surface on the outside of the mesocosms (Fig. 4). Mate-rial collected in the sediment trap is regularly sampled viathis tube, using a manual vacuum pump system. Process-ing of the samples included sub-sampling for zooplanktoncounting, followed by concentrating the residual sedimentmaterial, freeze-drying, grinding and homogenizing for sub-sequent chemical analysis.
The sediment trap as described here created a “dead vol-ume” underneath the funnel of approximately 8 % of theenclosure volume. Because this water gradually exchangedwith the rest of the enclosed water over one to two days,there was a dilution effect after experimental manipulationssuch as CO2 enrichment and nutrient addition. This com-plicated determining precisely the start value of the applied
www.biogeosciences.net/10/1835/2013/ Biogeosciences, 10, 1835–1847, 2013
1838 U. Riebesell et al.: A mobile sea-going mesocosm system
23
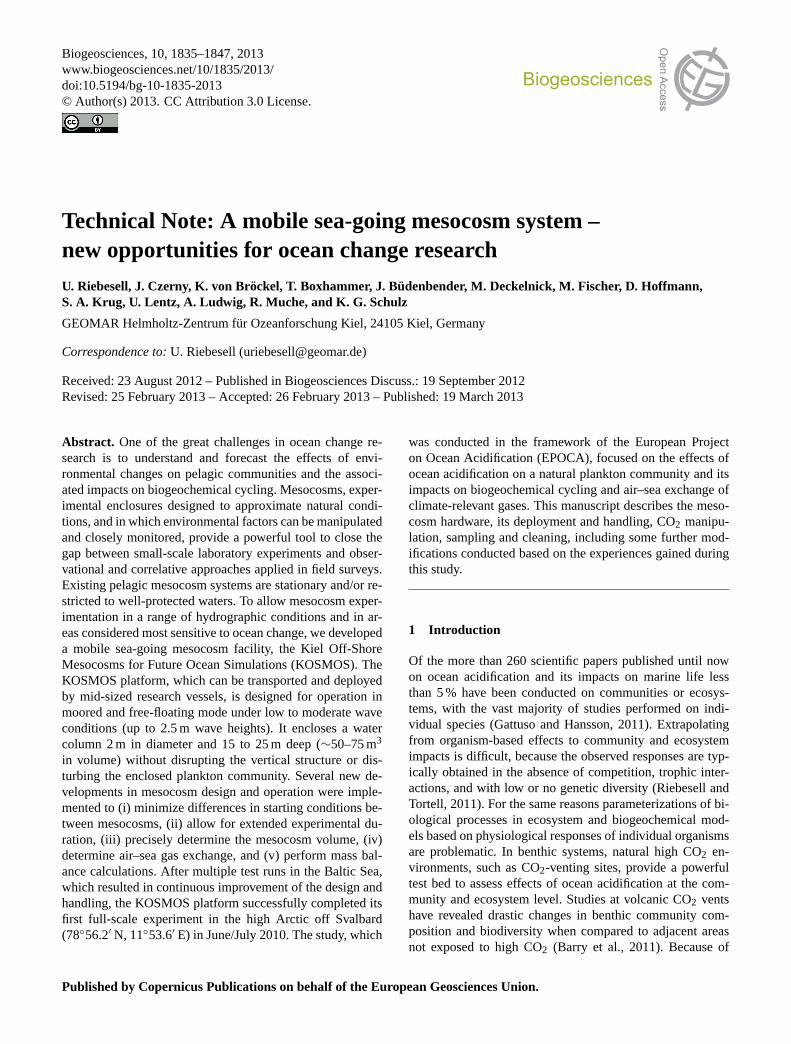
1 Fig. 2 2
3
Fig. 2.Sketch of floatation frame with unfolded TPU enclosure bag;different colouring of the light-transparent bag indicates differencein TPU foil thickness: green, 1 mm; brown, 0.5 mm. The blue rip-pled plane represents the water line. At the bottom of the bag abovethe bottom plate the funnel-shaped sediment trap is indicated. Thered line extending from the tip of the sediment trap to the watersurface represents the tube used for sampling of sedimented matter.
manipulation. To avoid the dilution effect, a new sedimenttrap was designed after the 2010 campaign and applied in alllater studies. This new trap is connected to the bottom of themesocosm through a flange (Fig. 4). Mounted by divers afterthe filling of the bag, the trap closes off the mesocosm at thebottom end.
2.5 Mooring and deployment
The mesocosms can be operated in moored or free-floatingmode. When moored, the mesocosms are deployed in groupsof three at a distance of 30 to 50 m between mesocosmunits (Fig. 5). Units of each group are connected to eachother through ropes fixed to the floating frames at 2.5 mwater depth. The groups are separated by approximately
24
1
Fig. 3 2
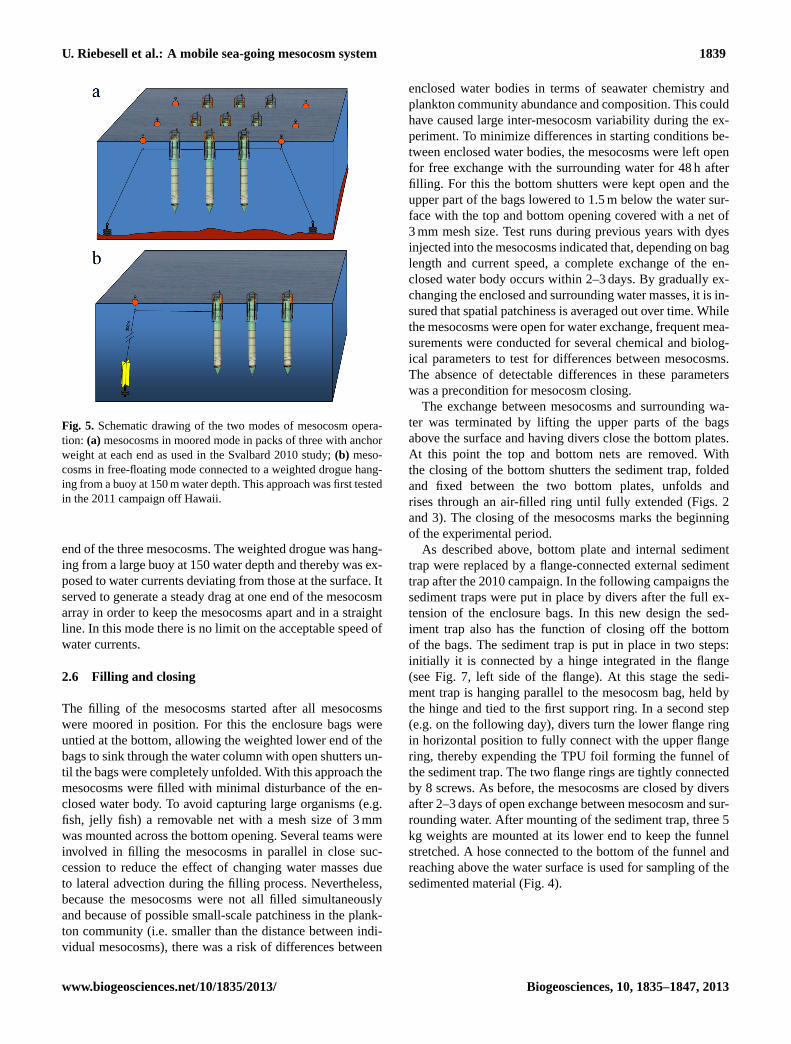
3 Fig. 3. Sketches of bottom plate. Left: lids in upright position, asapplied during filling of the enclosure bags. A removable net (greyshaded area) with a mesh size of 3 mm is mounted below the bottomring. Each bottom plate is equipped with 8 screws for tighteningthe lids after closing. Right: bottom plate in closed position withunfolded sediment trap.
25
1
2 Fig. 4 3
4 Fig. 4. Left: sketch of sediment trap used in 2011 and 2012 cam-paigns. The funnel-shaped trap made of TPU foil is connected tothe bottom of the enclosure bag via a flange (right panel). Note thetapering of the lowest section of the mesocosm bag. Sampling ofsedimented matter is achieved via a silicon tube which connects to a5 L sampling flask and a hand-operated vacuum pump. Right: flangering made of laminated fibreglass to attach the external sedimenttrap to the lower end of the enclosure bag. The upper ring (con-nected to the bag) is equipped with steel weights to facilitate thesinking of the enclosure bag during mesocosm filling and to keepthe bag in vertical position when exposed to currents. Bag and sed-iment trap are fixed to the upper and lower flanges by stainless steelclamps pressing the TPU foil in notches. Upper and lower flangesare connected with eight screws and sealed with a silicon rubberfitting.
50 m between each group and anchored on both ends withweights (1.2 tonnes) consisting of railway wheels. Buoys aremounted between mesocosms and the anchor weights to en-sure that the downward pull generated by strong currentsis absorbed by the buoys rather than acting directly on themesocosms. When operated in moored mode, the water cur-rents acting on the mesocosms should not exceed 0.5 knotsto avoid strong vertical deflection of the mesocosm bags andwearing on the ropes. In free-floating mode, as applied in the2011 campaign off Hawaii, a drogue was connected to one
Biogeosciences, 10, 1835–1847, 2013 www.biogeosciences.net/10/1835/2013/
U. Riebesell et al.: A mobile sea-going mesocosm system 1839
26
1 2 3 Fig. 5 4 Fig. 5. Schematic drawing of the two modes of mesocosm opera-
tion: (a) mesocosms in moored mode in packs of three with anchorweight at each end as used in the Svalbard 2010 study;(b) meso-cosms in free-floating mode connected to a weighted drogue hang-ing from a buoy at 150 m water depth. This approach was first testedin the 2011 campaign off Hawaii.
end of the three mesocosms. The weighted drogue was hang-ing from a large buoy at 150 water depth and thereby was ex-posed to water currents deviating from those at the surface. Itserved to generate a steady drag at one end of the mesocosmarray in order to keep the mesocosms apart and in a straightline. In this mode there is no limit on the acceptable speed ofwater currents.
2.6 Filling and closing
The filling of the mesocosms started after all mesocosmswere moored in position. For this the enclosure bags wereuntied at the bottom, allowing the weighted lower end of thebags to sink through the water column with open shutters un-til the bags were completely unfolded. With this approach themesocosms were filled with minimal disturbance of the en-closed water body. To avoid capturing large organisms (e.g.fish, jelly fish) a removable net with a mesh size of 3 mmwas mounted across the bottom opening. Several teams wereinvolved in filling the mesocosms in parallel in close suc-cession to reduce the effect of changing water masses dueto lateral advection during the filling process. Nevertheless,because the mesocosms were not all filled simultaneouslyand because of possible small-scale patchiness in the plank-ton community (i.e. smaller than the distance between indi-vidual mesocosms), there was a risk of differences between
enclosed water bodies in terms of seawater chemistry andplankton community abundance and composition. This couldhave caused large inter-mesocosm variability during the ex-periment. To minimize differences in starting conditions be-tween enclosed water bodies, the mesocosms were left openfor free exchange with the surrounding water for 48 h afterfilling. For this the bottom shutters were kept open and theupper part of the bags lowered to 1.5 m below the water sur-face with the top and bottom opening covered with a net of3 mm mesh size. Test runs during previous years with dyesinjected into the mesocosms indicated that, depending on baglength and current speed, a complete exchange of the en-closed water body occurs within 2–3 days. By gradually ex-changing the enclosed and surrounding water masses, it is in-sured that spatial patchiness is averaged out over time. Whilethe mesocosms were open for water exchange, frequent mea-surements were conducted for several chemical and biolog-ical parameters to test for differences between mesocosms.The absence of detectable differences in these parameterswas a precondition for mesocosm closing.
The exchange between mesocosms and surrounding wa-ter was terminated by lifting the upper parts of the bagsabove the surface and having divers close the bottom plates.At this point the top and bottom nets are removed. Withthe closing of the bottom shutters the sediment trap, foldedand fixed between the two bottom plates, unfolds andrises through an air-filled ring until fully extended (Figs. 2and 3). The closing of the mesocosms marks the beginningof the experimental period.
As described above, bottom plate and internal sedimenttrap were replaced by a flange-connected external sedimenttrap after the 2010 campaign. In the following campaigns thesediment traps were put in place by divers after the full ex-tension of the enclosure bags. In this new design the sed-iment trap also has the function of closing off the bottomof the bags. The sediment trap is put in place in two steps:initially it is connected by a hinge integrated in the flange(see Fig. 7, left side of the flange). At this stage the sedi-ment trap is hanging parallel to the mesocosm bag, held bythe hinge and tied to the first support ring. In a second step(e.g. on the following day), divers turn the lower flange ringin horizontal position to fully connect with the upper flangering, thereby expending the TPU foil forming the funnel ofthe sediment trap. The two flange rings are tightly connectedby 8 screws. As before, the mesocosms are closed by diversafter 2–3 days of open exchange between mesocosm and sur-rounding water. After mounting of the sediment trap, three 5kg weights are mounted at its lower end to keep the funnelstretched. A hose connected to the bottom of the funnel andreaching above the water surface is used for sampling of thesedimented material (Fig. 4).
www.biogeosciences.net/10/1835/2013/ Biogeosciences, 10, 1835–1847, 2013
1840 U. Riebesell et al.: A mobile sea-going mesocosm system
27
1
2 Fig. 6 3
4
a"
c"
b"
d"
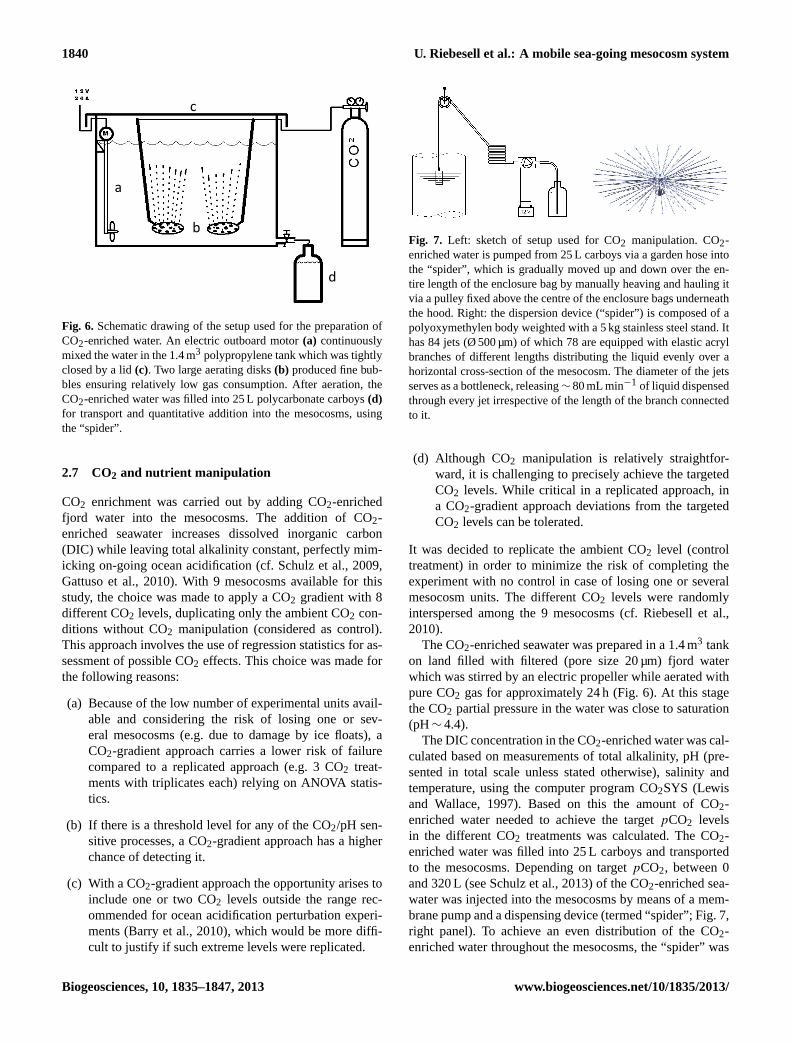
Fig. 6. Schematic drawing of the setup used for the preparation ofCO2-enriched water. An electric outboard motor(a) continuouslymixed the water in the 1.4 m3 polypropylene tank which was tightlyclosed by a lid(c). Two large aerating disks(b) produced fine bub-bles ensuring relatively low gas consumption. After aeration, theCO2-enriched water was filled into 25 L polycarbonate carboys(d)for transport and quantitative addition into the mesocosms, usingthe “spider”.
2.7 CO2 and nutrient manipulation
CO2 enrichment was carried out by adding CO2-enrichedfjord water into the mesocosms. The addition of CO2-enriched seawater increases dissolved inorganic carbon(DIC) while leaving total alkalinity constant, perfectly mim-icking on-going ocean acidification (cf. Schulz et al., 2009,Gattuso et al., 2010). With 9 mesocosms available for thisstudy, the choice was made to apply a CO2 gradient with 8different CO2 levels, duplicating only the ambient CO2 con-ditions without CO2 manipulation (considered as control).This approach involves the use of regression statistics for as-sessment of possible CO2 effects. This choice was made forthe following reasons:
(a) Because of the low number of experimental units avail-able and considering the risk of losing one or sev-eral mesocosms (e.g. due to damage by ice floats), aCO2-gradient approach carries a lower risk of failurecompared to a replicated approach (e.g. 3 CO2 treat-ments with triplicates each) relying on ANOVA statis-tics.
(b) If there is a threshold level for any of the CO2/pH sen-sitive processes, a CO2-gradient approach has a higherchance of detecting it.
(c) With a CO2-gradient approach the opportunity arises toinclude one or two CO2 levels outside the range rec-ommended for ocean acidification perturbation experi-ments (Barry et al., 2010), which would be more diffi-cult to justify if such extreme levels were replicated.
28
1 2
Fig. 7 3
4
Fig. 7. Left: sketch of setup used for CO2 manipulation. CO2-enriched water is pumped from 25 L carboys via a garden hose intothe “spider”, which is gradually moved up and down over the en-tire length of the enclosure bag by manually heaving and hauling itvia a pulley fixed above the centre of the enclosure bags underneaththe hood. Right: the dispersion device (“spider”) is composed of apolyoxymethylen body weighted with a 5 kg stainless steel stand. Ithas 84 jets (Ø 500 µm) of which 78 are equipped with elastic acrylbranches of different lengths distributing the liquid evenly over ahorizontal cross-section of the mesocosm. The diameter of the jetsserves as a bottleneck, releasing∼ 80 mL min−1 of liquid dispensedthrough every jet irrespective of the length of the branch connectedto it.
(d) Although CO2 manipulation is relatively straightfor-ward, it is challenging to precisely achieve the targetedCO2 levels. While critical in a replicated approach, ina CO2-gradient approach deviations from the targetedCO2 levels can be tolerated.
It was decided to replicate the ambient CO2 level (controltreatment) in order to minimize the risk of completing theexperiment with no control in case of losing one or severalmesocosm units. The different CO2 levels were randomlyinterspersed among the 9 mesocosms (cf. Riebesell et al.,2010).
The CO2-enriched seawater was prepared in a 1.4 m3 tankon land filled with filtered (pore size 20 µm) fjord waterwhich was stirred by an electric propeller while aerated withpure CO2 gas for approximately 24 h (Fig. 6). At this stagethe CO2 partial pressure in the water was close to saturation(pH∼ 4.4).
The DIC concentration in the CO2-enriched water was cal-culated based on measurements of total alkalinity, pH (pre-sented in total scale unless stated otherwise), salinity andtemperature, using the computer program CO2SYS (Lewisand Wallace, 1997). Based on this the amount of CO2-enriched water needed to achieve the targetpCO2 levelsin the different CO2 treatments was calculated. The CO2-enriched water was filled into 25 L carboys and transportedto the mesocosms. Depending on targetpCO2, between 0and 320 L (see Schulz et al., 2013) of the CO2-enriched sea-water was injected into the mesocosms by means of a mem-brane pump and a dispensing device (termed “spider”; Fig. 7,right panel). To achieve an even distribution of the CO2-enriched water throughout the mesocosms, the “spider” was
Biogeosciences, 10, 1835–1847, 2013 www.biogeosciences.net/10/1835/2013/
U. Riebesell et al.: A mobile sea-going mesocosm system 1841
slowly moved up and down during the injection over the en-tire length of the enclosure bags (Fig. 7, left panel). Verti-cal pH profiles were conducted after CO2 additions to checkwhether an even distribution was achieved.
The injection of CO2-enriched water was done in stepsover 4 consecutive days starting in the afternoon of 6 June(t-1). Two mesocosms served as controls, while 7 meso-cosms were manipulated to establish treatments of elevatedpCO2 with an initial range of 185–1420 µatm. Mean val-ues ofpCO2 during the experimental period ranged from175–1085 µatm (for details see Bellerby et al., 2012). Inmesocosms with no or low addition of CO2-enriched water,similar amounts of filtered fjord water were added in orderto apply the same physical perturbation to all mesocosms.Some fine-tuning to reach target CO2 levels was conductedon 11 June (t4), at which time the targetpCO2 levels wherereached with an offset generally smaller than±50 µatm. Af-ter this no further CO2 manipulation was done in any ofthe mesocosms. Because of the slow exchange of water inthe “dead volume” below the sediment trap with that in therest of the enclosure bag, there was a dilution of the ini-tial CO2 enrichment due to mixing of the CO2 manipulated(open bag) and non-manipulated (“dead volume”) water dur-ing the first couple of days. Budget calculations based on car-bonate chemistry measurements starting after CO2 manipu-lations needed to account for this dilution effect (Czerny etal., 2012a, 2013; de Kluijver et al., 2013; Silyakowa et al.,2013).
In the early morning of 20 June (t13), inorganic nutrientswere added using the same dispersion device as describedabove and shown in Fig. 7 at concentrations of 5 µmol L−1
NO3, 0.32 µmol L−1 PO4, and 2.5 µmol L−1 Si. The preciseamounts of inorganic nutrients added to each mesocosm werecalculated based on volume determinations conducted for allmesocosms through salt additions on 3 June (t4) and 11 June(t4). For a detailed description of the volume determinationsee Czerny et al. (2012b).
Approximately 200 live adult pteropods(Limacina helicina)sampled individually from the fjordwere added to each mesocosm during 11–13 June (t4–t6)to study their response to ocean acidification. For unknownreasons the pteropods rapidly disappeared from the watercolumn. Some pteropods were collected in the sedimenttraps; others were seen by divers accumulating in the deadvolume underneath the sediment traps. Very few specimensurvived the experiment.
2.8 Cleaning of the mesocosm walls
To estimate the contribution of wall growth to the overallproduction and accumulation of particular organic matter(POM) in the mesocosms, the inside of the enclosure bagswas cleaned with a ring-shaped brush on 7 July (t30). Var-ious biological parameters were determined on suspendedparticulate matter immediately before and after brushing of
29
1 Fig. 8 2
3
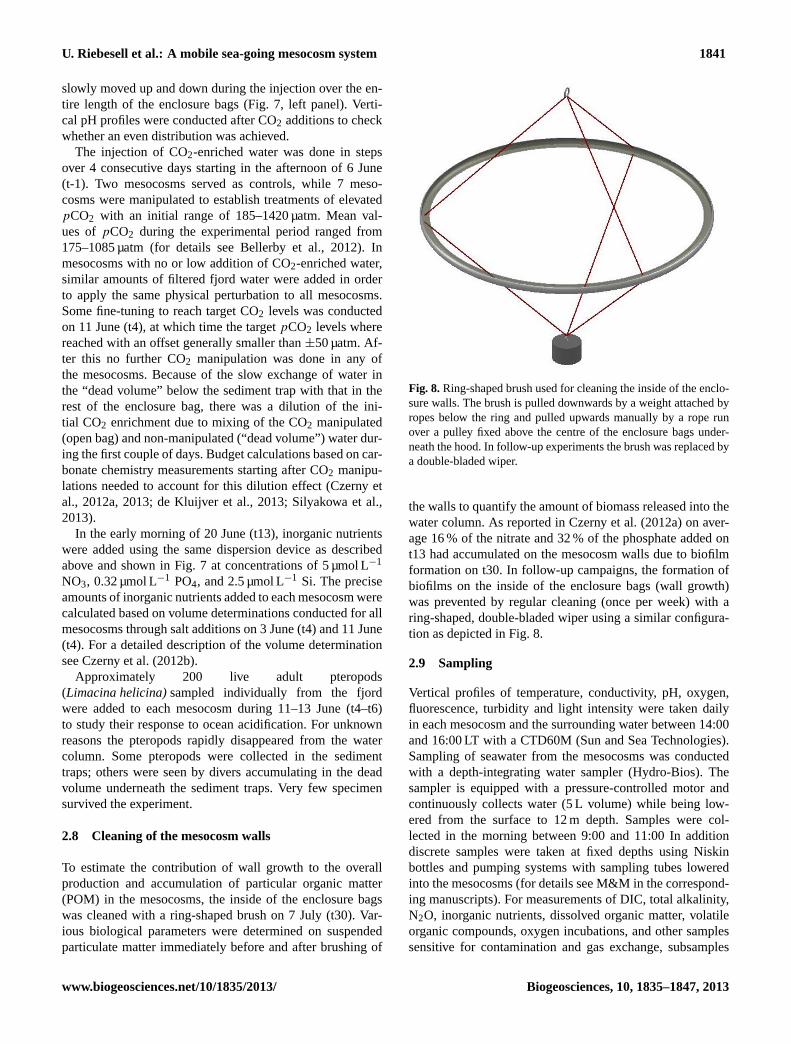
Fig. 8.Ring-shaped brush used for cleaning the inside of the enclo-sure walls. The brush is pulled downwards by a weight attached byropes below the ring and pulled upwards manually by a rope runover a pulley fixed above the centre of the enclosure bags under-neath the hood. In follow-up experiments the brush was replaced bya double-bladed wiper.
the walls to quantify the amount of biomass released into thewater column. As reported in Czerny et al. (2012a) on aver-age 16 % of the nitrate and 32 % of the phosphate added ont13 had accumulated on the mesocosm walls due to biofilmformation on t30. In follow-up campaigns, the formation ofbiofilms on the inside of the enclosure bags (wall growth)was prevented by regular cleaning (once per week) with aring-shaped, double-bladed wiper using a similar configura-tion as depicted in Fig. 8.
2.9 Sampling
Vertical profiles of temperature, conductivity, pH, oxygen,fluorescence, turbidity and light intensity were taken dailyin each mesocosm and the surrounding water between 14:00and 16:00 LT with a CTD60M (Sun and Sea Technologies).Sampling of seawater from the mesocosms was conductedwith a depth-integrating water sampler (Hydro-Bios). Thesampler is equipped with a pressure-controlled motor andcontinuously collects water (5 L volume) while being low-ered from the surface to 12 m depth. Samples were col-lected in the morning between 9:00 and 11:00 In additiondiscrete samples were taken at fixed depths using Niskinbottles and pumping systems with sampling tubes loweredinto the mesocosms (for details see M&M in the correspond-ing manuscripts). For measurements of DIC, total alkalinity,N2O, inorganic nutrients, dissolved organic matter, volatileorganic compounds, oxygen incubations, and other samplessensitive for contamination and gas exchange, subsamples
www.biogeosciences.net/10/1835/2013/ Biogeosciences, 10, 1835–1847, 2013
1842 U. Riebesell et al.: A mobile sea-going mesocosm system
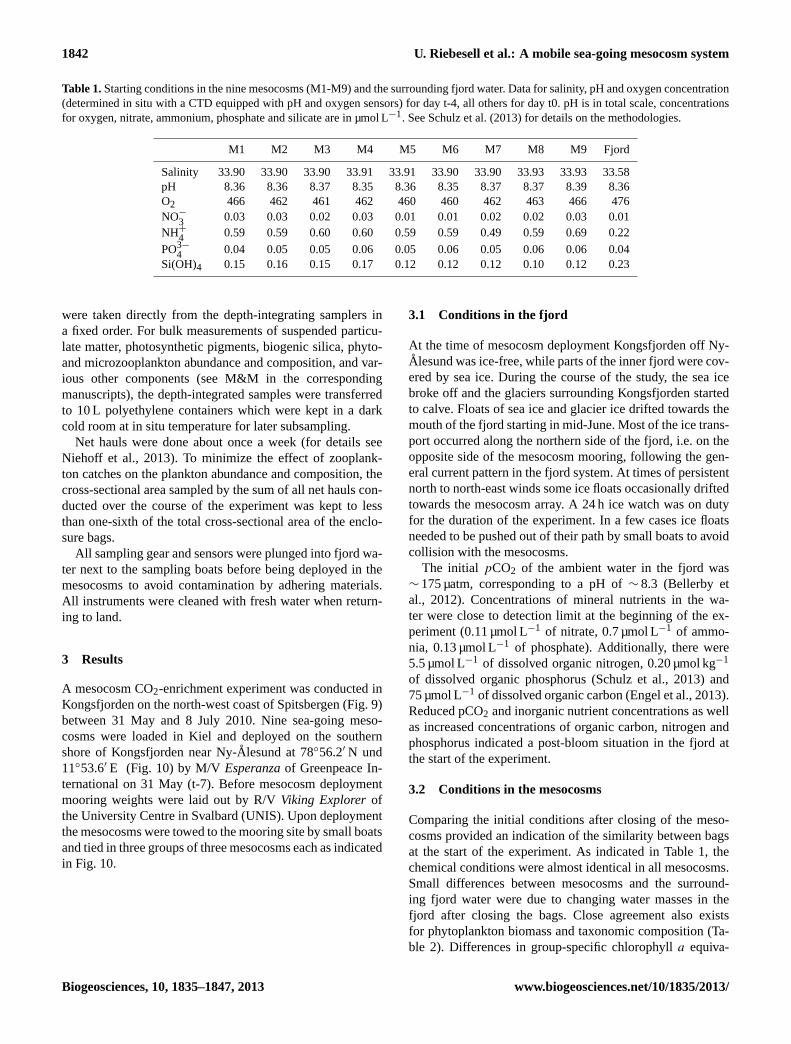
Table 1.Starting conditions in the nine mesocosms (M1-M9) and the surrounding fjord water. Data for salinity, pH and oxygen concentration(determined in situ with a CTD equipped with pH and oxygen sensors) for day t-4, all others for day t0. pH is in total scale, concentrationsfor oxygen, nitrate, ammonium, phosphate and silicate are in µmol L−1. See Schulz et al. (2013) for details on the methodologies.
M1 M2 M3 M4 M5 M6 M7 M8 M9 Fjord
Salinity 33.90 33.90 33.90 33.91 33.91 33.90 33.90 33.93 33.93 33.58pH 8.36 8.36 8.37 8.35 8.36 8.35 8.37 8.37 8.39 8.36O2 466 462 461 462 460 460 462 463 466 476NO−
3 0.03 0.03 0.02 0.03 0.01 0.01 0.02 0.02 0.03 0.01NH+
4 0.59 0.59 0.60 0.60 0.59 0.59 0.49 0.59 0.69 0.22
PO3−
4 0.04 0.05 0.05 0.06 0.05 0.06 0.05 0.06 0.06 0.04Si(OH)4 0.15 0.16 0.15 0.17 0.12 0.12 0.12 0.10 0.12 0.23
were taken directly from the depth-integrating samplers ina fixed order. For bulk measurements of suspended particu-late matter, photosynthetic pigments, biogenic silica, phyto-and microzooplankton abundance and composition, and var-ious other components (see M&M in the correspondingmanuscripts), the depth-integrated samples were transferredto 10 L polyethylene containers which were kept in a darkcold room at in situ temperature for later subsampling.
Net hauls were done about once a week (for details seeNiehoff et al., 2013). To minimize the effect of zooplank-ton catches on the plankton abundance and composition, thecross-sectional area sampled by the sum of all net hauls con-ducted over the course of the experiment was kept to lessthan one-sixth of the total cross-sectional area of the enclo-sure bags.
All sampling gear and sensors were plunged into fjord wa-ter next to the sampling boats before being deployed in themesocosms to avoid contamination by adhering materials.All instruments were cleaned with fresh water when return-ing to land.
3 Results
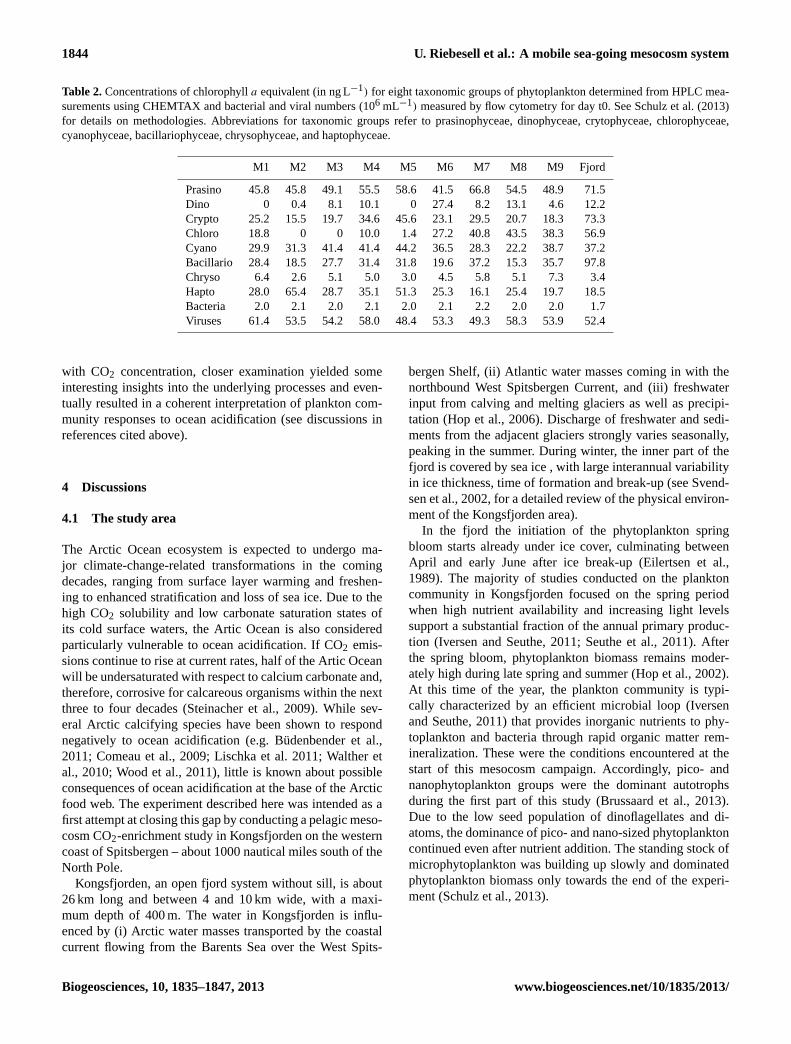
A mesocosm CO2-enrichment experiment was conducted inKongsfjorden on the north-west coast of Spitsbergen (Fig. 9)between 31 May and 8 July 2010. Nine sea-going meso-cosms were loaded in Kiel and deployed on the southernshore of Kongsfjorden near Ny-Alesund at 78◦56.2′ N und11◦53.6′ E (Fig. 10) by M/VEsperanzaof Greenpeace In-ternational on 31 May (t-7). Before mesocosm deploymentmooring weights were laid out by R/VViking Explorerofthe University Centre in Svalbard (UNIS). Upon deploymentthe mesocosms were towed to the mooring site by small boatsand tied in three groups of three mesocosms each as indicatedin Fig. 10.
3.1 Conditions in the fjord
At the time of mesocosm deployment Kongsfjorden off Ny-Alesund was ice-free, while parts of the inner fjord were cov-ered by sea ice. During the course of the study, the sea icebroke off and the glaciers surrounding Kongsfjorden startedto calve. Floats of sea ice and glacier ice drifted towards themouth of the fjord starting in mid-June. Most of the ice trans-port occurred along the northern side of the fjord, i.e. on theopposite side of the mesocosm mooring, following the gen-eral current pattern in the fjord system. At times of persistentnorth to north-east winds some ice floats occasionally driftedtowards the mesocosm array. A 24 h ice watch was on dutyfor the duration of the experiment. In a few cases ice floatsneeded to be pushed out of their path by small boats to avoidcollision with the mesocosms.
The initial pCO2 of the ambient water in the fjord was∼ 175 µatm, corresponding to a pH of∼ 8.3 (Bellerby etal., 2012). Concentrations of mineral nutrients in the wa-ter were close to detection limit at the beginning of the ex-periment (0.11 µmol L−1 of nitrate, 0.7 µmol L−1 of ammo-nia, 0.13 µmol L−1 of phosphate). Additionally, there were5.5 µmol L−1 of dissolved organic nitrogen, 0.20 µmol kg−1
of dissolved organic phosphorus (Schulz et al., 2013) and75 µmol L−1 of dissolved organic carbon (Engel et al., 2013).Reduced pCO2 and inorganic nutrient concentrations as wellas increased concentrations of organic carbon, nitrogen andphosphorus indicated a post-bloom situation in the fjord atthe start of the experiment.
3.2 Conditions in the mesocosms
Comparing the initial conditions after closing of the meso-cosms provided an indication of the similarity between bagsat the start of the experiment. As indicated in Table 1, thechemical conditions were almost identical in all mesocosms.Small differences between mesocosms and the surround-ing fjord water were due to changing water masses in thefjord after closing the bags. Close agreement also existsfor phytoplankton biomass and taxonomic composition (Ta-ble 2). Differences in group-specific chlorophylla equiva-
Biogeosciences, 10, 1835–1847, 2013 www.biogeosciences.net/10/1835/2013/
U. Riebesell et al.: A mobile sea-going mesocosm system 1843
30
1 2
Fig. 9 3
4
Ny-Ålesund
Svalbard
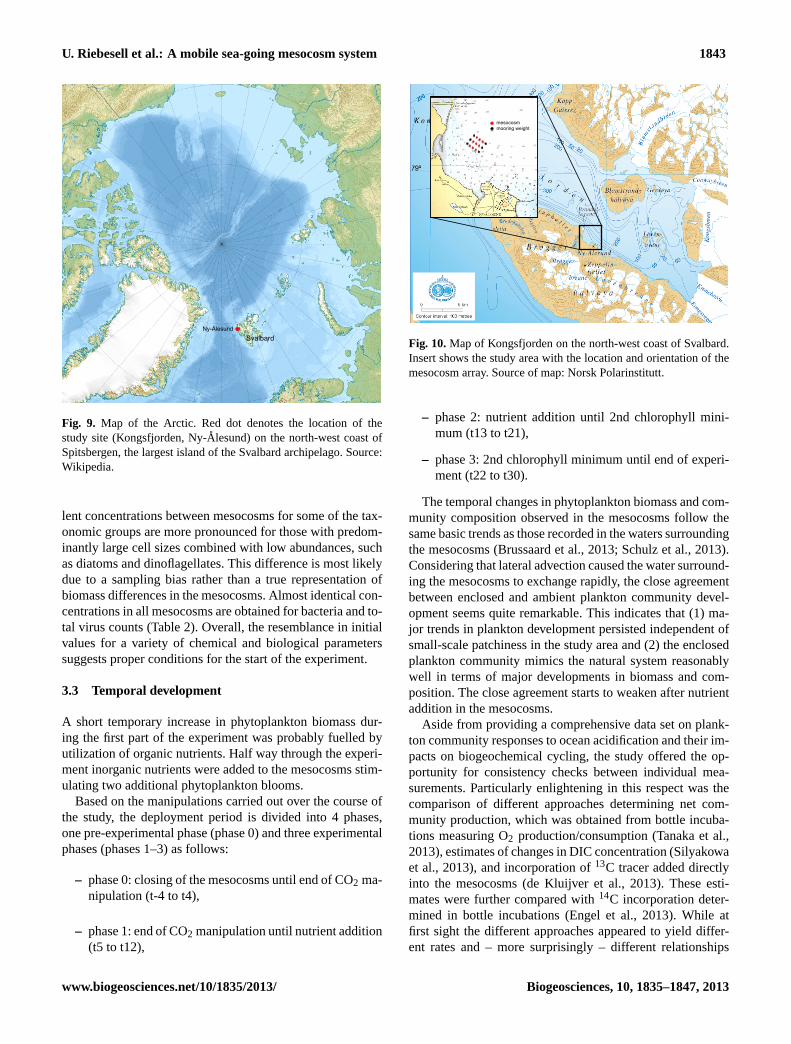
Fig. 9. Map of the Arctic. Red dot denotes the location of thestudy site (Kongsfjorden, Ny-Alesund) on the north-west coast ofSpitsbergen, the largest island of the Svalbard archipelago. Source:Wikipedia.
lent concentrations between mesocosms for some of the tax-onomic groups are more pronounced for those with predom-inantly large cell sizes combined with low abundances, suchas diatoms and dinoflagellates. This difference is most likelydue to a sampling bias rather than a true representation ofbiomass differences in the mesocosms. Almost identical con-centrations in all mesocosms are obtained for bacteria and to-tal virus counts (Table 2). Overall, the resemblance in initialvalues for a variety of chemical and biological parameterssuggests proper conditions for the start of the experiment.
3.3 Temporal development
A short temporary increase in phytoplankton biomass dur-ing the first part of the experiment was probably fuelled byutilization of organic nutrients. Half way through the experi-ment inorganic nutrients were added to the mesocosms stim-ulating two additional phytoplankton blooms.
Based on the manipulations carried out over the course ofthe study, the deployment period is divided into 4 phases,one pre-experimental phase (phase 0) and three experimentalphases (phases 1–3) as follows:
– phase 0: closing of the mesocosms until end of CO2 ma-nipulation (t-4 to t4),
– phase 1: end of CO2 manipulation until nutrient addition(t5 to t12),
31
1 2
Fig. 10 3
mesocosm mooring weight
Fig. 10.Map of Kongsfjorden on the north-west coast of Svalbard.Insert shows the study area with the location and orientation of themesocosm array. Source of map: Norsk Polarinstitutt.
– phase 2: nutrient addition until 2nd chlorophyll mini-mum (t13 to t21),
– phase 3: 2nd chlorophyll minimum until end of experi-ment (t22 to t30).
The temporal changes in phytoplankton biomass and com-munity composition observed in the mesocosms follow thesame basic trends as those recorded in the waters surroundingthe mesocosms (Brussaard et al., 2013; Schulz et al., 2013).Considering that lateral advection caused the water surround-ing the mesocosms to exchange rapidly, the close agreementbetween enclosed and ambient plankton community devel-opment seems quite remarkable. This indicates that (1) ma-jor trends in plankton development persisted independent ofsmall-scale patchiness in the study area and (2) the enclosedplankton community mimics the natural system reasonablywell in terms of major developments in biomass and com-position. The close agreement starts to weaken after nutrientaddition in the mesocosms.
Aside from providing a comprehensive data set on plank-ton community responses to ocean acidification and their im-pacts on biogeochemical cycling, the study offered the op-portunity for consistency checks between individual mea-surements. Particularly enlightening in this respect was thecomparison of different approaches determining net com-munity production, which was obtained from bottle incuba-tions measuring O2 production/consumption (Tanaka et al.,2013), estimates of changes in DIC concentration (Silyakowaet al., 2013), and incorporation of13C tracer added directlyinto the mesocosms (de Kluijver et al., 2013). These esti-mates were further compared with14C incorporation deter-mined in bottle incubations (Engel et al., 2013). While atfirst sight the different approaches appeared to yield differ-ent rates and – more surprisingly – different relationships
www.biogeosciences.net/10/1835/2013/ Biogeosciences, 10, 1835–1847, 2013
1844 U. Riebesell et al.: A mobile sea-going mesocosm system
Table 2.Concentrations of chlorophylla equivalent (in ng L−1) for eight taxonomic groups of phytoplankton determined from HPLC mea-surements using CHEMTAX and bacterial and viral numbers (106 mL−1) measured by flow cytometry for day t0. See Schulz et al. (2013)for details on methodologies. Abbreviations for taxonomic groups refer to prasinophyceae, dinophyceae, crytophyceae, chlorophyceae,cyanophyceae, bacillariophyceae, chrysophyceae, and haptophyceae.
M1 M2 M3 M4 M5 M6 M7 M8 M9 Fjord
Prasino 45.8 45.8 49.1 55.5 58.6 41.5 66.8 54.5 48.9 71.5Dino 0 0.4 8.1 10.1 0 27.4 8.2 13.1 4.6 12.2Crypto 25.2 15.5 19.7 34.6 45.6 23.1 29.5 20.7 18.3 73.3Chloro 18.8 0 0 10.0 1.4 27.2 40.8 43.5 38.3 56.9Cyano 29.9 31.3 41.4 41.4 44.2 36.5 28.3 22.2 38.7 37.2Bacillario 28.4 18.5 27.7 31.4 31.8 19.6 37.2 15.3 35.7 97.8Chryso 6.4 2.6 5.1 5.0 3.0 4.5 5.8 5.1 7.3 3.4Hapto 28.0 65.4 28.7 35.1 51.3 25.3 16.1 25.4 19.7 18.5Bacteria 2.0 2.1 2.0 2.1 2.0 2.1 2.2 2.0 2.0 1.7Viruses 61.4 53.5 54.2 58.0 48.4 53.3 49.3 58.3 53.9 52.4
with CO2 concentration, closer examination yielded someinteresting insights into the underlying processes and even-tually resulted in a coherent interpretation of plankton com-munity responses to ocean acidification (see discussions inreferences cited above).
4 Discussions
4.1 The study area
The Arctic Ocean ecosystem is expected to undergo ma-jor climate-change-related transformations in the comingdecades, ranging from surface layer warming and freshen-ing to enhanced stratification and loss of sea ice. Due to thehigh CO2 solubility and low carbonate saturation states ofits cold surface waters, the Artic Ocean is also consideredparticularly vulnerable to ocean acidification. If CO2 emis-sions continue to rise at current rates, half of the Artic Oceanwill be undersaturated with respect to calcium carbonate and,therefore, corrosive for calcareous organisms within the nextthree to four decades (Steinacher et al., 2009). While sev-eral Arctic calcifying species have been shown to respondnegatively to ocean acidification (e.g. Budenbender et al.,2011; Comeau et al., 2009; Lischka et al. 2011; Walther etal., 2010; Wood et al., 2011), little is known about possibleconsequences of ocean acidification at the base of the Arcticfood web. The experiment described here was intended as afirst attempt at closing this gap by conducting a pelagic meso-cosm CO2-enrichment study in Kongsfjorden on the westerncoast of Spitsbergen – about 1000 nautical miles south of theNorth Pole.
Kongsfjorden, an open fjord system without sill, is about26 km long and between 4 and 10 km wide, with a maxi-mum depth of 400 m. The water in Kongsfjorden is influ-enced by (i) Arctic water masses transported by the coastalcurrent flowing from the Barents Sea over the West Spits-
bergen Shelf, (ii) Atlantic water masses coming in with thenorthbound West Spitsbergen Current, and (iii) freshwaterinput from calving and melting glaciers as well as precipi-tation (Hop et al., 2006). Discharge of freshwater and sedi-ments from the adjacent glaciers strongly varies seasonally,peaking in the summer. During winter, the inner part of thefjord is covered by sea ice , with large interannual variabilityin ice thickness, time of formation and break-up (see Svend-sen et al., 2002, for a detailed review of the physical environ-ment of the Kongsfjorden area).
In the fjord the initiation of the phytoplankton springbloom starts already under ice cover, culminating betweenApril and early June after ice break-up (Eilertsen et al.,1989). The majority of studies conducted on the planktoncommunity in Kongsfjorden focused on the spring periodwhen high nutrient availability and increasing light levelssupport a substantial fraction of the annual primary produc-tion (Iversen and Seuthe, 2011; Seuthe et al., 2011). Afterthe spring bloom, phytoplankton biomass remains moder-ately high during late spring and summer (Hop et al., 2002).At this time of the year, the plankton community is typi-cally characterized by an efficient microbial loop (Iversenand Seuthe, 2011) that provides inorganic nutrients to phy-toplankton and bacteria through rapid organic matter rem-ineralization. These were the conditions encountered at thestart of this mesocosm campaign. Accordingly, pico- andnanophytoplankton groups were the dominant autotrophsduring the first part of this study (Brussaard et al., 2013).Due to the low seed population of dinoflagellates and di-atoms, the dominance of pico- and nano-sized phytoplanktoncontinued even after nutrient addition. The standing stock ofmicrophytoplankton was building up slowly and dominatedphytoplankton biomass only towards the end of the experi-ment (Schulz et al., 2013).
Biogeosciences, 10, 1835–1847, 2013 www.biogeosciences.net/10/1835/2013/
U. Riebesell et al.: A mobile sea-going mesocosm system 1845
4.2 KOSMOS experimental facility
After a sequence of test runs in free-floating mode con-ducted in the Baltic Sea in 2006, 2007, and 2008, whichled to considerable improvements in the mesocosm hardwareand handling, and a four-week trial run in moored mode in2009, which yielded some novel results on ocean acidifica-tion effects during a phytoplankton spring bloom (Schulzand Riebesell, 2012), the Svalbard 2010 campaign was thefirst full-scale experiment involving nine mesocosm unitsand covering a broad range of parameters over an extendedperiod of time. Building on the experience gained during thiscampaign, this new sea-going experimental platform opensup new opportunities for mesocosm experimentation undera variety of hydrographic conditions and geographical loca-tions. Important new features of this facility include
– the enclosure of large volumes (45–75 m3) with mini-mal disturbance of the enclosed water body and plank-ton community,
– controlled carbonate chemistry manipulation with min-imal agitation of the enclosed water,
– mass balance calculations through precise determina-tion of mesocosm volume by full accounting of all rel-evant pools and fluxes for key elements (carbon, nitro-gen, phosphorus, silica),
– extended experimental duration through routine clean-ing of mesocosm walls (preventing extensive wallgrowth) and regular sediment sampling (preventing re-lease of remineralization products from sedimentedmatter),
– operation in moored and free-floating mode under lowto moderate wave conditions allowing mesocosm ex-perimentation in areas previously not amendable to thiskind of experimentation.
This mesocosm campaign, which involved 35 scientistsfrom 12 institutes, provided the opportunity for a highly inte-grative, multidisciplinary study involving marine engineers,molecular and marine biologists, ecologists, biogeochemists,and marine and atmospheric chemists. By covering a widerange of parameters measured over 35 days (4 days prior toand 31 days after the start of CO2 manipulation), it pro-vided a comprehensive data set on pelagic community-levelresponses to ocean acidification and their impacts on nutrientcycling and air–sea exchange of climate-relevant gases.
Acknowledgements.The design, construction and field testing ofthe KOSMOS mesocosms was made possible through financial sup-port of GEOMAR and the integrated project SOPRAN (SurfaceOcean PRocesses in the ANthropocene) funded by the German
Ministry for Education and Research (BMBF). GEOMAR and SO-PRAN provided the KOSMOS facility for the Svalbard 2010 experi-ment and organized the logistics leading up to and during the exper-iment. GEOMAR was responsible for deploying the mesocosms,running the experiment and coordinating all scientific aspects be-fore, during and after the experiment. The scientific work is a con-tribution to the European Project on Ocean Acidification (EPOCA),which received funding from the European Community’s SeventhFramework Programme (FP7/2007–2013) under grant agreementno. 211384. Several participants of this study received funding fromthe European Community’s Seventh Framework Programme undergrant agreement no 228224, MESOAQUA. We gratefully acknowl-edge the logistical support of Greenpeace International for its assis-tance with the transport of the mesocosm facility from Kiel to Ny-Alesund and back to Kiel. We also thank the captains and crews ofM/V Esperanzaof Greenpeace and R/VViking Explorerof the Uni-versity Centre in Svalbard (UNIS) for assistance during mesocosmtransport and during deployment and recovery in Kongsfjorden. Wethank the staff of the French-German Arctic Research Base (AW-IPEV) at Ny-Alesund, in particular Marcus Schumacher, for on-sitelogistical support.
The service charges for this open access publicationhave been covered by a Research Centre of theHelmholtz Association.
Edited by: J. Middelburg
References
Barry, J. P., Widdicombe, S., and Hall-Spencer, J. M.: Effects ofocean acidification on marine biodiversity and ecosystem func-tion, in: Ocean acidification, edited by: Gattuso J.-P. and HanssonL., Oxford University Press, 192–209, 2010.
Barry, J. P., Tyrrell, T., Hansson, L., Plattner, G.-K., and Gattuso, J.-P.: Atmospheric CO2 targets for ocean acidification perturbationexperiments, in: Guide to best practices in ocean acidificationresearch and data reporting, edited by: Riebesell, U., Fabry, V.,Hansson, L., and Gattuso, J.-P., Office for Official Publicationsof the European Communities, Luxembourg, 53–66, 2011.
Beaufort, L., Probert, I., de Garidel-Thoron, T., Bendif, E. M., Ruiz-Pino, D., Metzl, N., Goyet, C., Buchet, N., Coupel, P., Grelaud,M., Rost, B., Rickaby, R. E. M., and de Vargas, C.: Sensitivity ofcoccolithophores to carbonate chemistry and ocean acidification,Nature 476, 80–83, 2011.
Bellerby, R. G. J., Silyakova, A., Nondal, G., Slagstad, D., Czerny,J., de Lange, T., and Ludwig, A.: Marine carbonate system evo-lution during the EPOCA Arctic pelagic ecosystem experimentin the context of simulated Arctic ocean acidification, Biogeo-sciences Discuss., 9, 15541–15565,doi:10.5194/bgd-9-15541-2012, 2012.
Brockmann, U.: Pelagic mesocosms: II. Process studies, in: En-closed experimental marine ecosystems: A review and recom-mendations, edited by: C. M. Lalli, Springer-Verlag, New York,81–108, 1990.
Brussaard, C. P. D., Noordeloos, A. A. M., Witte, H., Collenteur,M. C. J., Schulz, K., Ludwig, A., and Riebesell, U.: Arctic mi-crobial community dynamics influenced by elevated CO2 lev-
www.biogeosciences.net/10/1835/2013/ Biogeosciences, 10, 1835–1847, 2013
1846 U. Riebesell et al.: A mobile sea-going mesocosm system
els, Biogeosciences, 10, 719–731,doi:10.5194/bg-10-719-2013,2013.
Budenbender, J., Riebesell, U., and Form, A.: Calcification of theArctic coralline red algaeLithothamnion glacialein response toelevated CO2, Mar. Ecol. Progr. Ser., 441, 79–87, 2011.
Carpenter, S. R.: Microcosm experiments have limited relevance forcommunity and ecosystem ecology, Ecology, 77, 677–680, 1996.
Charalampopoulou, A., Poulton, A. J., Tyrrell, T., and Lucas, M. I.:Irradiance and pH affect coccolithophore community composi-tion on a transect between the North Sea and the Arctic Ocean,Mar. Ecol. Progr. Ser., 431, 25–43, 2011.
Comeau, S., Gorsky, G., Jeffree, R., Teyssie, J.-L., and Gattuso,J.-P.: Impact of ocean acidification on a key Arctic pelagicmollusc (Limacina helicina), Biogeosciences, 6, 1877–1882,doi:10.5194/bg-6-1877-2009, 2009.
Czerny, J., Schulz, K. G., Boxhammer, T., Bellerby, R. G. J.,Budenbender, J., Engel, A., Krug, S. A., Ludwig, A., Nachtigall,K., Nondal, G., Niehoff, B., Siljakova, A., and Riebesell, U.: El-ement budgets in an Arctic mesocosm CO2 perturbation study,Biogeosciences Discuss., 9, 11885–11924,doi:10.5194/bgd-9-11885-2012, 2012a.
Czerny, J., Schulz, K. G., Krug, S. A., Ludwig, A., and Riebesell,U.: Technical Note: On the determination of enclosed water vol-ume in large flexible-wall mesocosms, Biogeosciences Discuss.,9, 13019–13030,doi:10.5194/bgd-9-13019-2012, 2012b.
Czerny, J., Schulz, K. G., Ludwig, A., and Riebesell, U.: TechnicalNote: A simple method for air-sea gas exchange measurementsin mesocosms and its application in carbon budgeting, Biogeo-sciences, 10, 1379–1390,doi:10.5194/bg-10-1379-2013, 2013.
de Kluijver, A., Soetaert, K., Czerny, J., Schulz, K. G., Boxhammer,T., Riebesell, U., and Middelburg, J. J.: A13C labelling studyon carbon fluxes in Arctic plankton communities under elevatedCO2 levels, Biogeosciences, 10, 1425–1440,doi:10.5194/bg-10-1425-2013, 2013.
Drenner, R. W. and Mazumder, A.: Microcosm experiments havelimited relevance for community and ecosystem ecology, Ecol-ogy, 80, 1081–1085, 1999.
Eilertsen, H. C., Taasen, J. P., and Weslawski J. M.: Phyto- planktonstudies in the fjords of West Spitsbergen: physical environmentand production in spring and summer, J. Plankton Res. 11, 1245–1260, 1989.
Engel, A., Borchard, C., Piontek, J., Schulz, K. G., Riebesell, U.,and Bellerby, R.: CO2 increases14C primary production in anArctic plankton community, Biogeosciences, 10, 1291–1308,doi:10.5194/bg-10-1291-2013, 2013.
French, R. H. and Watts, R. J.: Performance of in situ microcosmscompared to actual reservoir behavior, J. Environ. Eng., 115,835–849, 1989.
Gattuso, J.-P. and Hansson, L.: Ocean acidification: background andhistory, in: Ocean acidification, Oxford, edited by: Gattuso, J.-P.and Hansson, L., Oxford University Press, Oxford, 1–20, 2011.
Gattuso, J.-P., Lee, K., Rost, B., and Schulz, K. G.: Approachesand tools to manipulate the carbonate chemistry, in: Guide tobest practices in ocean acidification research and data reporting,edited by: Riebesell, U., Fabry, V., Hansson, L., and Gattuso, J.-P., Office for Official Publications of the European Communities,Luxembourg, 41–52, 2010.
Hop, H., Pearson, T., Hegseth, E. N., Kovacs, K. M., Wiencke,C., Kwasniewski, S., Eiane, K., Mehlum, F., Gulliksen, B.,
Wlodarska-Kowalczuk, M., Lydersen, C., Weslawski, J. M.,Cochrane, S., Gabrielsen, G. W., Leaky, R. J. G., Lønne, O.J.,Zajaczkowski, M., Falk-Petersen, S., Kendall, M., Wangberg, S.-A., Bischof, K., Voronkov, A. Y., Kovaltchouk, N. A., Wiktor,J., Poltermann, M., di Prisco, G., Papucci, C., and Gerland, S.:The marine ecosystem of Kongsfjorden, Svalbard, Polar Res., 21,167–208, 2002.
Hop, H., Falk-Petersen, S., Svendson, H., Kwasniewski, S., Pavlov,V., Pavlova, O., and Søreide, J. E.: Physical and biological char-acteristics of the pelagic system across Fram Strait to Kongsfjor-den, Prog. Oceanogr., 71, 182–231, 2006.
Iversen, K. R. and Seuthe, L.: Seasonal microbial processes ina high-latitude fjord (Kongsfjorden, Svalbard): I. Heterotrophicbacteria, picoplankton and nanoflagellates, Polar. Biol., 34, 731–749, 2011.
Kuiper, J., Brockmann, U. H., van het Groenewoud, H., Hoornsman,G., and Hammer, K. D.: Influences of bag dimensions on thedevelopment of enclosed plankton communities during POSER,Mar. Ecol. Progr. Ser., 14, 9–17, 1983.
Lischka, S., Budenbender, J., Boxhammer, T., and Riebesell, U.:Impact of ocean acidification and elevated temperatures on earlyjuveniles of the polar shelled pteropod Limacina helicina: mor-tality, shell degradation, and shell growth, Biogeosciences, 8,919–932,doi:10.5194/bg-8-919-2011, 2011.
Lewis, E. and Wallace, D. W. R.: Program developed for CO2 sys-tem calculations. ORNL/CDIAC-105, Carbon Dioxide Informa-tion Center, Oak Ridge National Laboratory, US Department ofEnergy, Oak Ridge, Tennessee, 1998.
Menzel, D. W. and Steele, J. H.: The application of plastic enclo-sures to the study of pelagic marine biota, Rapp. P.-v. Reun.Cons. int. Explor. Mer., 173, 7–12, 1978.
Niehoff, B., Schmithusen, T., Knuppel, N., Daase, M., Czerny,J., and Boxhammer, T.: Mesozooplankton community develop-ment at elevated CO2 concentrations: results from a mesocosmexperiment in an Arctic fjord, Biogeosciences, 10, 1391–1406,doi:10.5194/bg-10-1391-2013, 2013.
Petersen, J. E., Kemp, W. M., Bartleson, R., Boynton, W. R., Chen,C.-C., Cornwell, J. C., Gardner, R. H., Hinkle, D. C., Houde,E. D., Malone, T. C., Mowitt, W. P., Murray, L. Sanford, L. P.,Stevenson, J. C., Sundberg, K. L., and Suttles, S. E.: Multiscaleexperiments in coastal ecology: Improving realism and advanc-ing theory, BioScience, 53, 1181–1197, 2003.
Petersen, J. E., Kennedy, V. S., Dennison, W. C., and Kemp, W. M.:Enclosed experimental ecosystems and scale: tools for under-standing and managing coastal ecosystems, Springer, New York,221 pp., 2009
Pilson, M. E. Q. and Nixon, S. W.: Marine microcosms in ecolog-ical research, In Microcosms in ecological research, DOE Sym-posium series 52, Technical information center, US Departmentof Energy, Washington, DC, 724–741, 1980.
Riebesell, U.: Acid test for marine biodiversity, Nature 454, 46–47,2008.
Riebesell, U. and Tortell, P.D.: Effects of Ocean Acidification onPelagic Organisms and Ecosystems, in: Ocean Acidification,edited by: Gattuso, J.-P., Hansson, L., Oxford University Press,99–121, 2011.
Riebesell, U., Lee, K., and Nejstgaard, J.C.: Pelagic mesocosms, in:Guide to best practices in ocean acidification research and datareporting, edited by: Riebesell, U., Fabry, V., Hansson, L., and
Biogeosciences, 10, 1835–1847, 2013 www.biogeosciences.net/10/1835/2013/
U. Riebesell et al.: A mobile sea-going mesocosm system 1847
Gattuso, J.-P., Office for Official Publications of the EuropeanCommunities, Luxembourg, 81–98, 2010.
Schulz, K. G. and Riebesell, U.: Diurnal changes in seawater car-bonate chemistry speciation at increasing atmospheric carbondioxide, Mar. Biol.,doi:10.1007/s00227-012-1965-y, 2012.
Schulz, K. G., Barcelos e Ramos, J., Zeebe, R. E., and Riebesell,U.: CO2 perturbation experiments: similarities and differencesbetween dissolved inorganic carbon and total alkalinity manipu-lations, Biogeosciences, 6, 2145–2153,doi:10.5194/bg-6-2145-2009, 2009.
Schulz, K. G., Bellerby, R. G. J., Brussaard, C. P. D., Budenbender,J., Czerny, J., Engel, A., Fischer, M., Koch-Klavsen, S., Krug,S. A., Lischka, S., Ludwig, A., Meyerhofer, M., Nondal, G.,Silyakova, A., Stuhr, A., and Riebesell, U.: Temporal biomassdynamics of an Arctic plankton bloom in response to increasinglevels of atmospheric carbon dioxide, Biogeosciences, 10, 161–180,doi:10.5194/bg-10-161-2013, 2013.
Seuthe, L., Iversen, R. K., and Narcy, F.: Microbial processes ina high-latitude fjord (Kongsfjorden, Svalbard): II. Ciliates anddinoflagellates, Polar. Biol., 34, 751–766, 2011.
Silyakova, A., Bellerby, R. G. J., Czerny, J., Schulz, K. G., Non-dal, G., Tanaka, T., Engel, A., De Lange, T., and Riebesell, U.:Net community production and stoichiometry of nutrient con-sumption in a pelagic ecosystem of a northern high latitude fjord:mesocosm CO2 perturbation study, Biogeosciences Discuss., 9,11705–11737,doi:10.5194/bgd-9-11705-2012, 2012.
Steinacher, M., Joos, F., Frolicher, T. L., Plattner, G.-K., and Doney,S. C.: Imminent ocean acidification in the Arctic projected withthe NCAR global coupled carbon cycle-climate model, Biogeo-sciences, 6, 515–533,doi:10.5194/bg-6-515-2009, 2009.
Svendsen, H., Beszczynska-Møller, A., Hagen, J.O., Lefauconnier,B., Tverberg, V., Gerland, S., Ørbæk, J. B., Bischof, K., Papucci,C., Zajaczkowski, M., Azzolini, R., Bruland, O., Wiencke, C.,Winther, J.-G., and Dallmann, W.: The physical environment ofKongsfjorden–Krossfjorden, an Arctic fjord system in Svalbard,Polar Res., 21, 133–166, 2002.
Tanaka, T., Alliouane, S., Bellerby, R. G. B., Czerny, J., de Klui-jver, A., Riebesell, U., Schulz, K. G., Silyakova, A., and Gattuso,J.-P.: Effect of increasedpCO2 on the planktonic metabolic bal-ance during a mesocosm experiment in an Arctic fjord, Biogeo-sciences, 10, 315–325,doi:10.5194/bg-10-315-2013, 2013.
Walther, K., Anger, K., and Portner, H. O.: Effects of ocean acidifi-cation and warming on the larval development of the spider crabHyas araneusfrom different latitudes (54◦ vs. 79◦ N), Mar. Ecol.Progr. Ser., 417, 159–170, 2010.
Wood, H. L., Spicer, J. I., Kendall, M. A., Lowe, D. M., and Widdi-combe, S.: Ocean warming and acidification; implications for theArtic brittlestarOphiocten sericeum, Polar Biol., 34, 1033–1044,doi:10.1007/s00300-011-0963-8, 2011.
www.biogeosciences.net/10/1835/2013/ Biogeosciences, 10, 1835–1847, 2013


![Chemical Engineering Journal · [23] Mesocosm Meat processing wastewater Glyceria maxima TN: 46–49 New Zealand [24] Mesocosm Nutrient solution Canna sp., Calamus sp. TN: 76.94;](https://img.dokumen.tips/doc/110x75/60948f4f85c3c96d7a4daeca/chemical-engineering-journal-23-mesocosm-meat-processing-wastewater-glyceria-maxima.jpg)