Embed Size (px)
Citation preview
Sedaru
168 E Arrow Hwy, Suite 101
San Dimas, CA 91773 sedaru.com
Office: 626.244.0700 [email protected]
Prepared for: Prepared by:
Technical Memorandum
Elizabeth George, Loma Rica, & Cascade Shores Systems
Hydraulic Model Update and Calibration
Nevada Irrigation District Final Technical Memorandum EG/LR/CS Model Update and Calibration
Nevada Irrigation District February 2019 Page i
Contents Contents…………………………………………………………………………………………..………………………………………………………i
Tables ............................................................................................................................................................ ii
Figures ........................................................................................................................................................... ii
1 Introduction ............................................................................................................................................... 4
2 Model Update from GIS and As‐builts ....................................................................................................... 4
2.1 Pipes ............................................................................................................................................ 4
2.2 Tanks ........................................................................................................................................... 7
2.3 Pressure Reducing Stations ......................................................................................................... 8
2.4 Pump Stations ........................................................................................................................... 11
3 Elevation Assignment ............................................................................................................................... 12
4 Demand Allocation ................................................................................................................................... 12
4.1 Existing Demands ...................................................................................................................... 12
5 Model Calibration .................................................................................................................................... 15
5.1 Steady‐State Model Calibration ................................................................................................ 15
5.2 Extended Period Simulation Model Calibration ........................................................................ 24
6 Evaluation of Operational Scenarios ........................................................................................................ 30
6.1 Evaluation Criteria ..................................................................................................................... 31
6.2 Baseline MDD ............................................................................................................................ 31
6.3 Water Transfer from EGeorge to Loma Rica System ................................................................ 34
6.4 Water Transfer from Loma Rica to EGeorge System ................................................................ 34
6.5 ADD EGeorge WTP Only ............................................................................................................ 34
7 Conclusions and Recommendations ........................................................................................................ 38
7.1 Conclusions ............................................................................................................................... 38
7.2 Recommendations .................................................................................................................... 38
Nevada Irrigation District Final Technical Memorandum EG/LR/CS Model Update and Calibration
Nevada Irrigation District February 2019 Page ii
Tables
Table 1 – Summary of Pipeline by Diameter and Material ......................................................................... 6
Table 2 – Summary of Tank Information for Cascade Shores/EGeorge/Loma Rica Systems ..................... 7
Table 3 – Summary of the PRV Station Information ...................................................................................9
Table 4 – Summary of Pump Station Information .................................................................................... 11
Table 5 – Summary of Water ADD Consumption by System .................................................................... 13
Table 6 – Total Demands by System ......................................................................................................... 14
Table 7 – Existing Modeled Demands by System ..................................................................................... 15
Table 8 – Steady‐State Calibration Criteria ............................................................................................... 19
Table 9 – Summary of Hydrant Flow Test Data and Calibration Results .................................................. 20
Table 10 – Current Model Initial Roughness Coefficient (C‐value) ............................................................. 23
Table 11 – Model Calibration Adjusted Roughness Coefficient (C‐value) .................................................. 23
Table 12 – EPS Calibration Criteria .............................................................................................................. 28
Table 13 – Summary of EPS Calibration Results ......................................................................................... 29
Table 14 – Summary of System Demand .................................................................................................... 31
Table 15 ‐ Evaluation Criteria ...................................................................................................................... 31
Figures
Figure 1 – 2018 Facility Updates ................................................................................................................... 5
Figure 2 – 2016 Monthly Water Treatment Plants Production .................................................................. 13
Figure 3 – Locations of Hydrant Tests ......................................................................................................... 17
Figure 4 – Pressure Comparison at Observation Hydrants ......................................................................... 21
Figure 5 – David Way Water Balance and Estimated “Typical Demand” ................................................... 26
Figure 6 – David Way Normalized Diurnal Pattern “Typical Demand” ....................................................... 27
Figure 7 – Upper Banner Tank Level ........................................................................................................... 29
Figure 8 – Peak Hydraulic Conditions Operational Scenario: Baseline EPS ................................................ 33
Nevada Irrigation District Final Technical Memorandum EG/LR/CS Model Update and Calibration
Nevada Irrigation District February 2019 Page iii
Figure 9 – Peak Hydraulic Conditions Operational Scenario: EGeorge to Loma Rica ............................... 34
Figure 10 – Peak Hydraulic Conditions Operational Scenario: Loma Rica to EGeorge ............................... 36
Figure 11 – ADD Operational Scenario: EGeorge to Loma Rica .................................................................. 37
Nevada Irrigation District Final Technical Memorandum EG/LR/CS Model Update and Calibration
Nevada Irrigation District February 2019 Page 4 of 39
1 Introduction
Sedaru (formerly IDModeling) has developed this technical memorandum to describe the model update and calibration for Nevada Irrigation District’s (NID or District) water model (Project). The goal of this Project was to update and calibrate the hydraulic model of the District’s water system and deliver within the Sedaru Modeling platform for the District’s use for performing fire flow analyses, development planning, operational “what‐if” scenarios, and numerous other applications. This document describes the model update and calibration process, summarizes the results of the steady‐state (SS) and extended period simulation (EPS) model calibration, and includes recommendations for future updates and calibration efforts.
2 Model Update from GIS and As‐builts
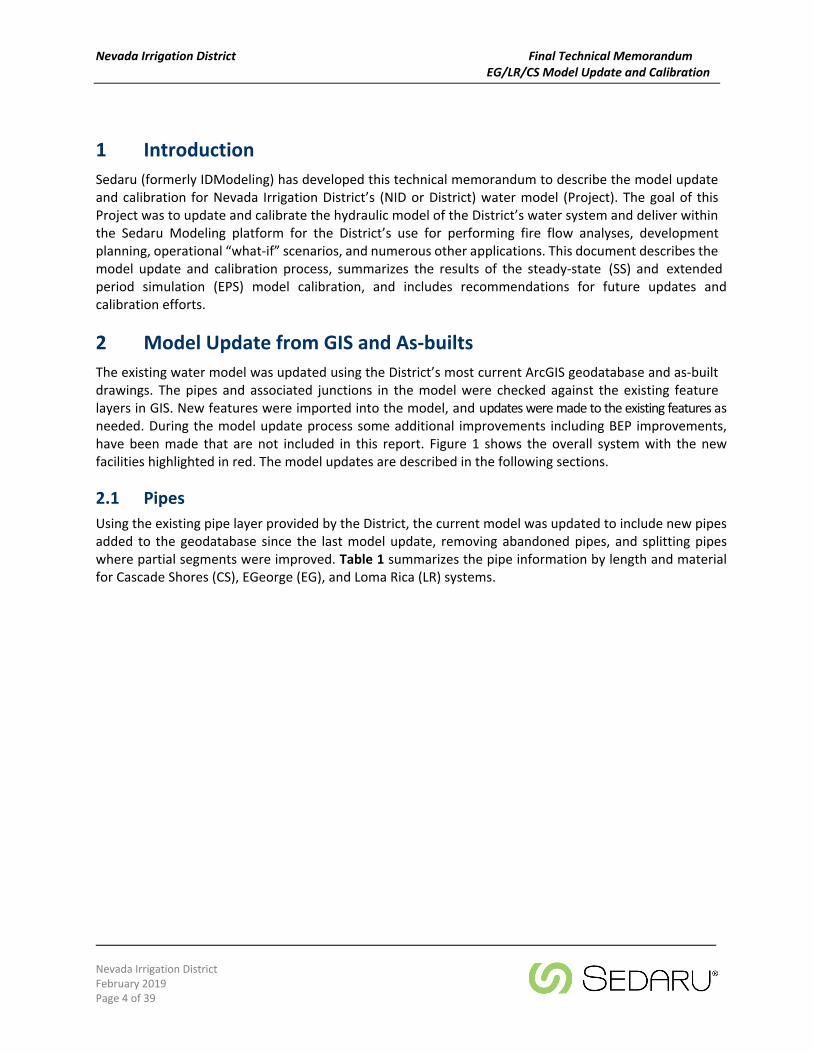
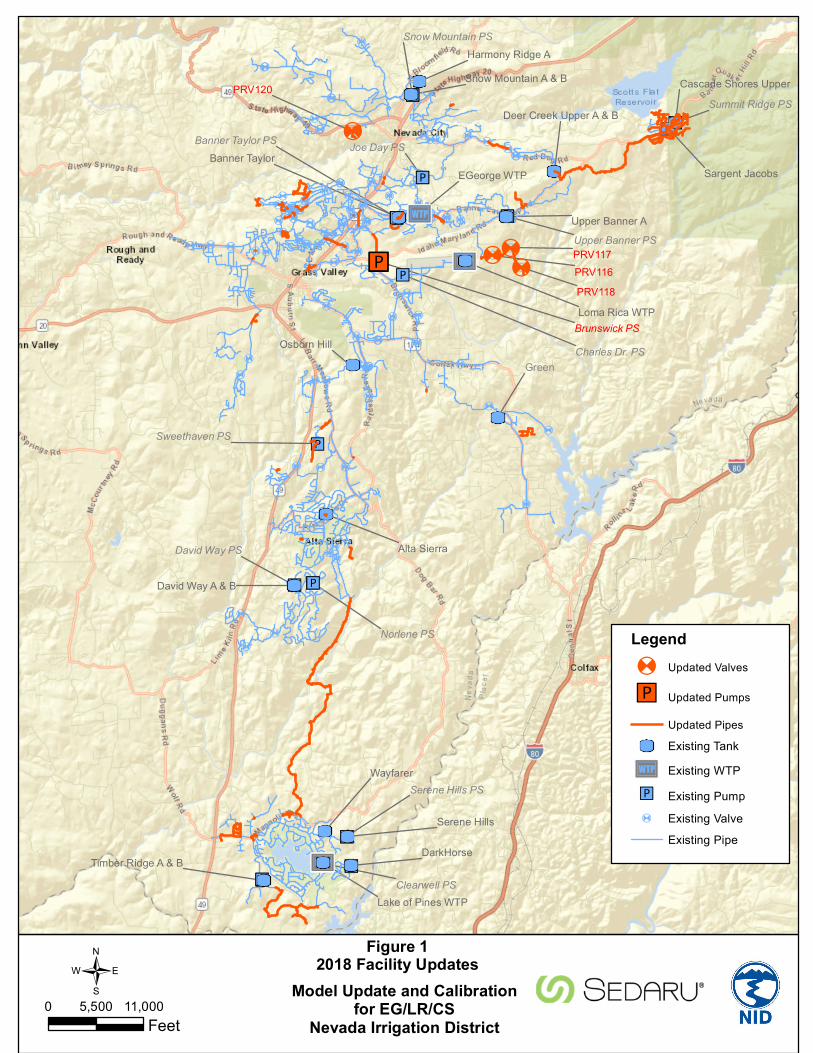
The existing water model was updated using the District’s most current ArcGIS geodatabase and as‐built drawings. The pipes and associated junctions in the model were checked against the existing feature layers in GIS. New features were imported into the model, and updates were made to the existing features as needed. During the model update process some additional improvements including BEP improvements, have been made that are not included in this report. Figure 1 shows the overall system with the new facilities highlighted in red. The model updates are described in the following sections.
2.1 Pipes
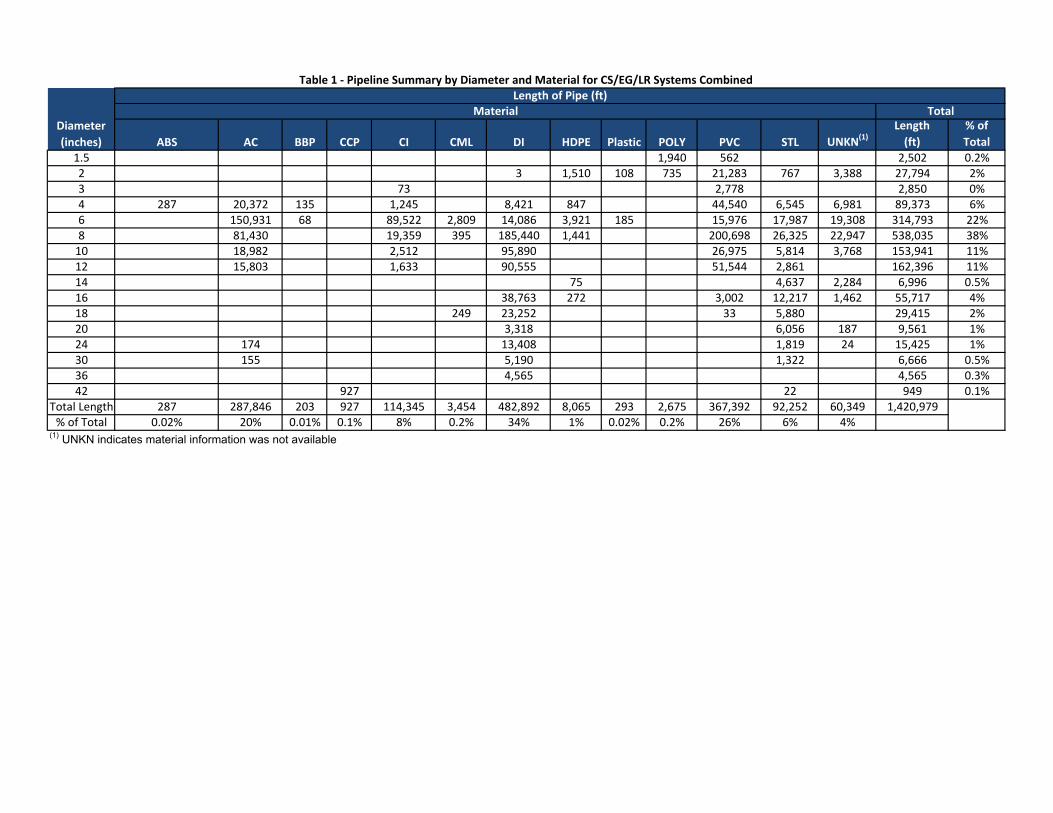
Using the existing pipe layer provided by the District, the current model was updated to include new pipes added to the geodatabase since the last model update, removing abandoned pipes, and splitting pipes where partial segments were improved. Table 1 summarizes the pipe information by length and material for Cascade Shores (CS), EGeorge (EG), and Loma Rica (LR) systems.
PRV117
PRV118
PRV120
PRV116
Charles Dr. PS
David Way PS
Norlene PS
Sweethaven PS
Banner Taylor PS Joe Day PS
Snow Mountain PS
Upper Banner PS
Summit Ridge PS
Serene Hills PS
Clearwell PS
Brunswick PSLoma Rica WTP
EGeorge WTP
Lake of Pines WTP
GreenOsborn Hill
David Way A & B
Alta Sierra
Harmony Ridge A
Upper Banner A
Snow Mountain A & B
Deer Creek Upper A & B
Banner TaylorSargent Jacobs
Cascade Shores Upper
DarkHorse
Serene Hills
Wayfarer
Timber Ridge A & B
AA
A AAA
A
A
A
A
A A A
A
A
AA A
A A
A
A
AAA
A
A
A
AAA
A
A
A
A
A
A
A
A
A
A
A
A AA
A
AA
A
A
A
A
A
AA
A
AA
A
A
AAAA
A
A
A
A A A
AA
AAA
A
A
A
A
A
AA
A
AAAA A
A
AAA
A
A
AA A A
A
A
A
AA
A
A
A
AA
A
A
A
A
A
A
A
AA
A
AA
A A
"M
"M "M"M
"M
"M"M"M"M
"M"M
"M"M
"M"M
"M"M"M
"M"M"M
"M"M"M"M"M"M
"M"M"M
"M"M"M 3Q
3Q
3Q
UT
UT
UT
UT
UT
UT
UT
UT
UT
UTUT
UT UT
UTUT
UT
UT
"M"M"M ' ''
'
Legend' Updated Valves
"M Updated Pumps
Updated PipesUT Existing Tank3Q Existing WTP"M Existing Pump
A Existing ValveExisting Pipe
Figure 12018 Facility Updates/ Model Update and Calibration
for EG/LR/CSNevada Irrigation District
0 11,0005,500Feet
ABS AC BBP CCP CI CML DI HDPE Plastic POLY PVC STL UNKN(1)Length
(ft)
% of
Total
1.5 1,940 562 2,502 0.2%2 3 1,510 108 735 21,283 767 3,388 27,794 2%3 73 2,778 2,850 0%4 287 20,372 135 1,245 8,421 847 44,540 6,545 6,981 89,373 6%6 150,931 68 89,522 2,809 14,086 3,921 185 15,976 17,987 19,308 314,793 22%8 81,430 19,359 395 185,440 1,441 200,698 26,325 22,947 538,035 38%10 18,982 2,512 95,890 26,975 5,814 3,768 153,941 11%12 15,803 1,633 90,555 51,544 2,861 162,396 11%14 75 4,637 2,284 6,996 0.5%16 38,763 272 3,002 12,217 1,462 55,717 4%18 249 23,252 33 5,880 29,415 2%20 3,318 6,056 187 9,561 1%24 174 13,408 1,819 24 15,425 1%30 155 5,190 1,322 6,666 0.5%36 4,565 4,565 0.3%42 927 22 949 0.1%
Total Length 287 287,846 203 927 114,345 3,454 482,892 8,065 293 2,675 367,392 92,252 60,349 1,420,979% of Total 0.02% 20% 0.01% 0.1% 8% 0.2% 34% 1% 0.02% 0.2% 26% 6% 4%
(1) UNKN indicates material information was not available
Table 1 ‐ Pipeline Summary by Diameter and Material for CS/EG/LR Systems Combined
Material TotalLength of Pipe (ft)
Diameter
(inches)
Nevada Irrigation District Final Technical Memorandum EG/LR/CS Model Update and Calibration
Nevada Irrigation District February 2019 Page 7 of 39
2.2 Tanks
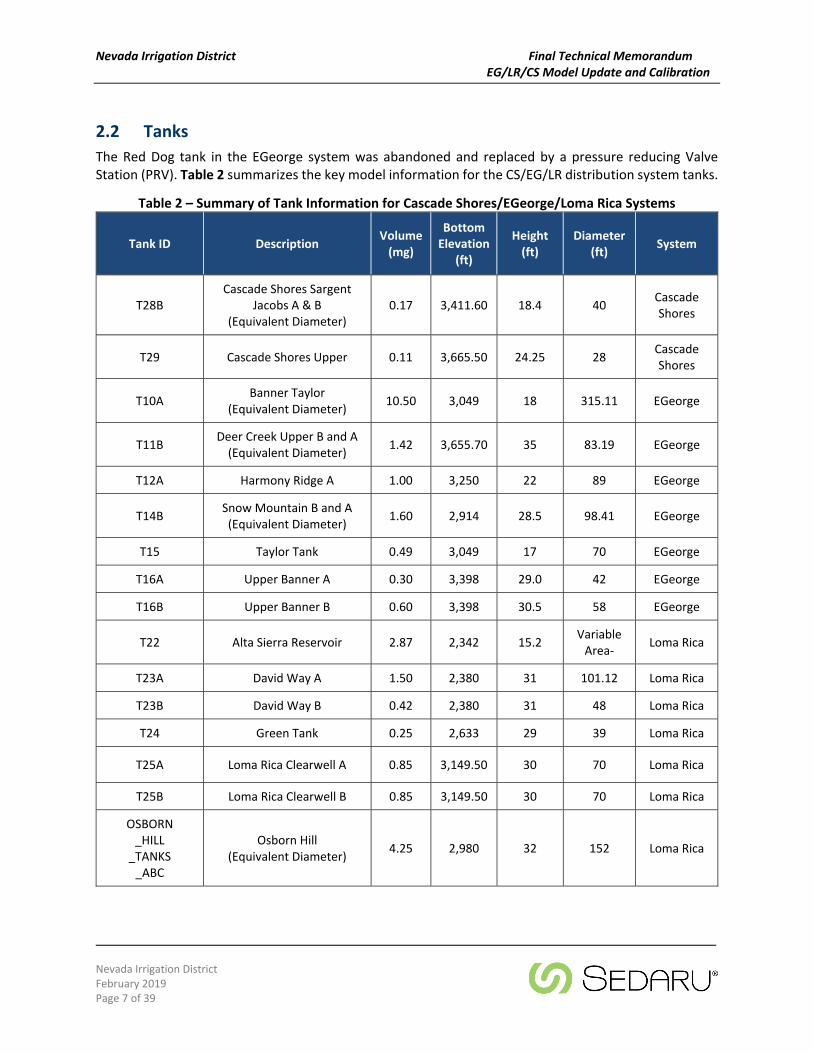
The Red Dog tank in the EGeorge system was abandoned and replaced by a pressure reducing Valve Station (PRV). Table 2 summarizes the key model information for the CS/EG/LR distribution system tanks.
Table 2 – Summary of Tank Information for Cascade Shores/EGeorge/Loma Rica Systems
Tank ID Description Volume (mg)
Bottom Elevation
(ft)
Height (ft)
Diameter (ft)
System
T28B Cascade Shores Sargent
Jacobs A & B (Equivalent Diameter)
0.17 3,411.60 18.4 40 Cascade Shores
T29 Cascade Shores Upper 0.11 3,665.50 24.25 28 Cascade Shores
T10A Banner Taylor
(Equivalent Diameter) 10.50 3,049 18 315.11 EGeorge
T11B Deer Creek Upper B and A (Equivalent Diameter)
1.42 3,655.70 35 83.19 EGeorge
T12A Harmony Ridge A 1.00 3,250 22 89 EGeorge
T14B Snow Mountain B and A (Equivalent Diameter)
1.60 2,914 28.5 98.41 EGeorge
T15 Taylor Tank 0.49 3,049 17 70 EGeorge
T16A Upper Banner A 0.30 3,398 29.0 42 EGeorge
T16B Upper Banner B 0.60 3,398 30.5 58 EGeorge
T22 Alta Sierra Reservoir 2.87 2,342 15.2 Variable Area‐
Loma Rica
T23A David Way A 1.50 2,380 31 101.12 Loma Rica
T23B David Way B 0.42 2,380 31 48 Loma Rica
T24 Green Tank 0.25 2,633 29 39 Loma Rica
T25A Loma Rica Clearwell A 0.85 3,149.50 30 70 Loma Rica
T25B Loma Rica Clearwell B 0.85 3,149.50 30 70 Loma Rica
OSBORN _HILL _TANKS _ABC
Osborn Hill (Equivalent Diameter)
4.25 2,980 32 152 Loma Rica
Nevada Irrigation District Final Technical Memorandum EG/LR/CS Model Update and Calibration
Nevada Irrigation District February 2019 Page 8 of 39
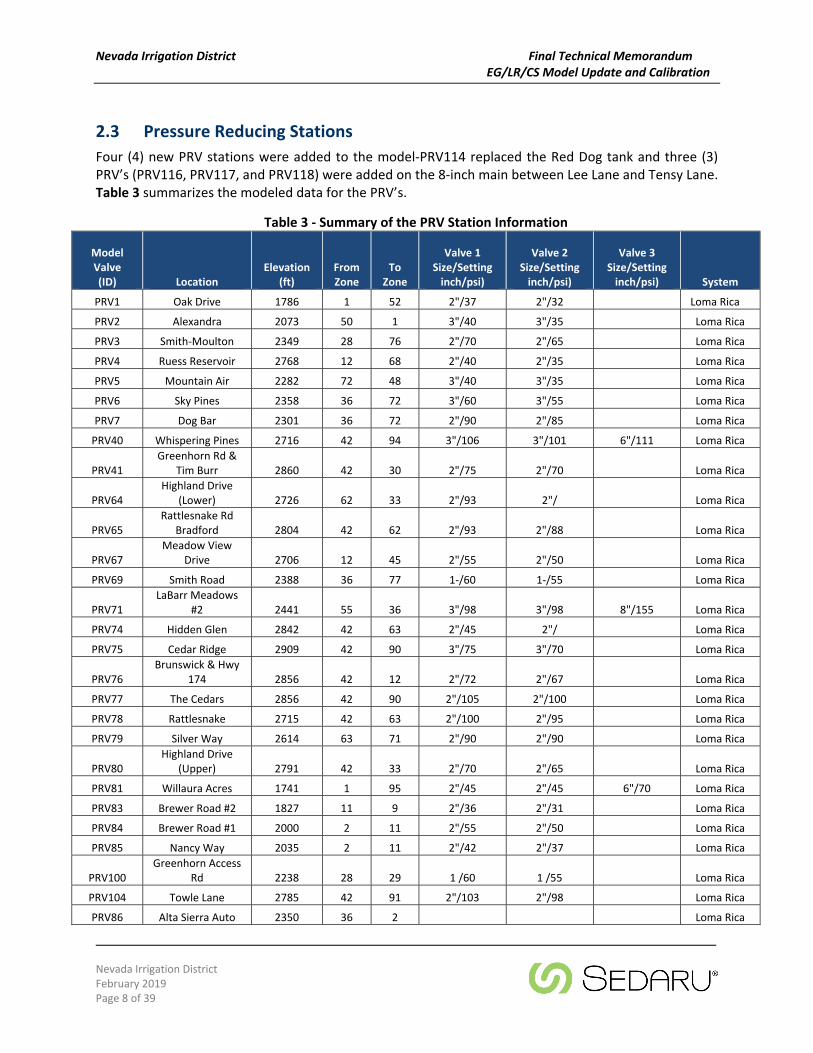
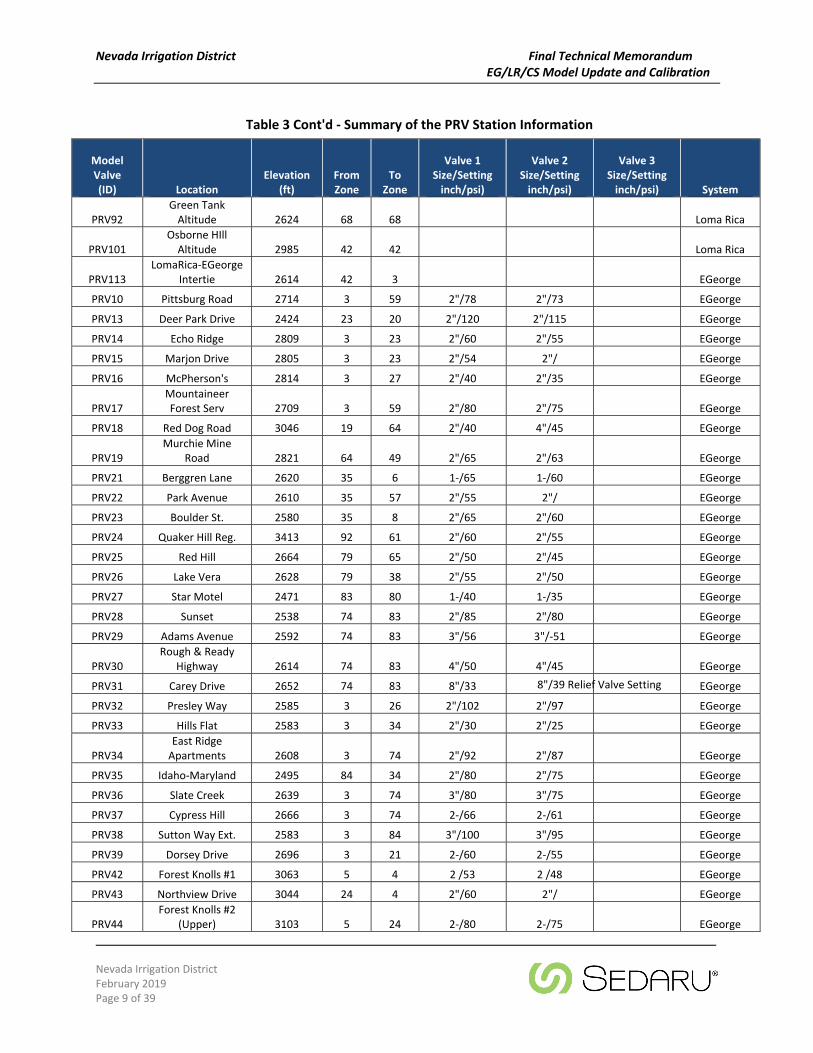
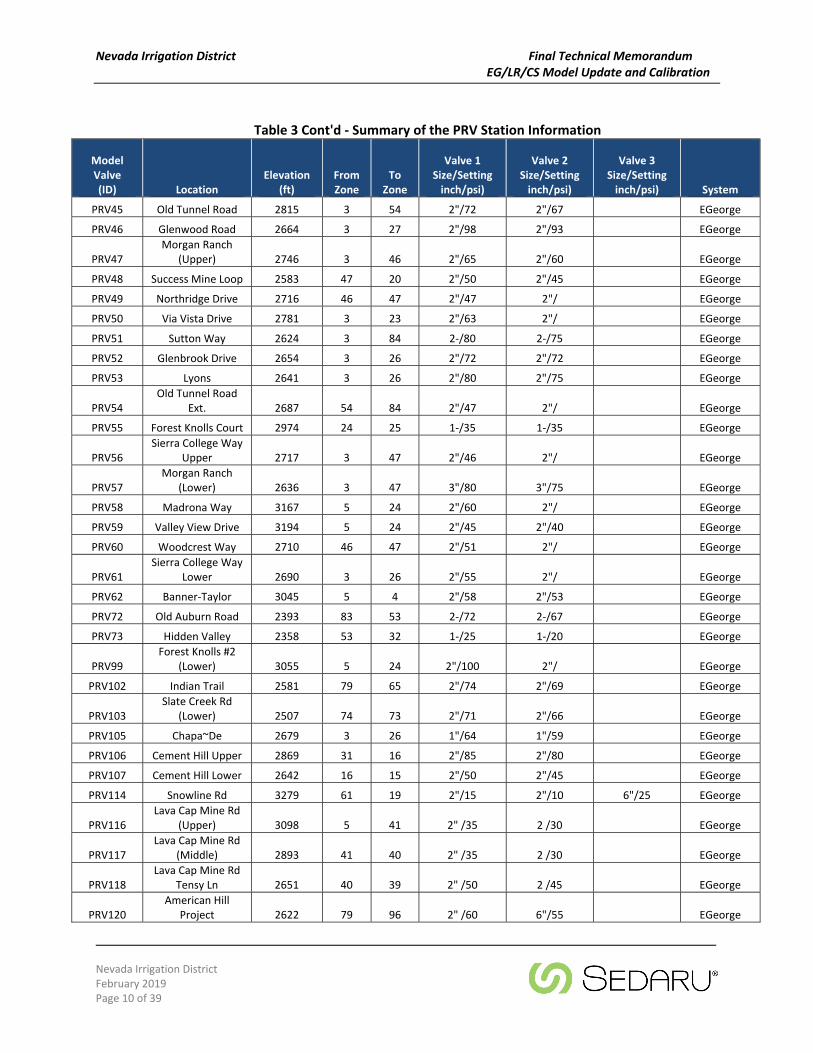
2.3 Pressure Reducing Stations
Four (4) new PRV stations were added to the model‐PRV114 replaced the Red Dog tank and three (3) PRV’s (PRV116, PRV117, and PRV118) were added on the 8‐inch main between Lee Lane and Tensy Lane. Table 3 summarizes the modeled data for the PRV’s.
Table 3 ‐ Summary of the PRV Station Information
Model Valve (ID) Location
Elevation (ft)
From Zone
To Zone
Valve 1 Size/Setting inch/psi)
Valve 2 Size/Setting inch/psi)
Valve 3 Size/Setting inch/psi) System
PRV1 Oak Drive 1786 1 52 2"/37 2"/32 Loma Rica
PRV2 Alexandra 2073 50 1 3"/40 3"/35 Loma Rica
PRV3 Smith‐Moulton 2349 28 76 2"/70 2"/65 Loma Rica
PRV4 Ruess Reservoir 2768 12 68 2"/40 2"/35 Loma Rica
PRV5 Mountain Air 2282 72 48 3"/40 3"/35 Loma Rica
PRV6 Sky Pines 2358 36 72 3"/60 3"/55 Loma Rica
PRV7 Dog Bar 2301 36 72 2"/90 2"/85 Loma Rica
PRV40 Whispering Pines 2716 42 94 3"/106 3"/101 6"/111 Loma Rica
PRV41 Greenhorn Rd &
Tim Burr 2860 42 30 2"/75 2"/70 Loma Rica
PRV64 Highland Drive
(Lower) 2726 62 33 2"/93 2"/ Loma Rica
PRV65 Rattlesnake Rd
Bradford 2804 42 62 2"/93 2"/88 Loma Rica
PRV67 Meadow View
Drive 2706 12 45 2"/55 2"/50 Loma Rica
PRV69 Smith Road 2388 36 77 1‐/60 1‐/55 Loma Rica
PRV71 LaBarr Meadows
#2 2441 55 36 3"/98 3"/98 8"/155 Loma Rica
PRV74 Hidden Glen 2842 42 63 2"/45 2"/ Loma Rica
PRV75 Cedar Ridge 2909 42 90 3"/75 3"/70 Loma Rica
PRV76 Brunswick & Hwy
174 2856 42 12 2"/72 2"/67 Loma Rica
PRV77 The Cedars 2856 42 90 2"/105 2"/100 Loma Rica
PRV78 Rattlesnake 2715 42 63 2"/100 2"/95 Loma Rica
PRV79 Silver Way 2614 63 71 2"/90 2"/90 Loma Rica
PRV80 Highland Drive
(Upper) 2791 42 33 2"/70 2"/65 Loma Rica
PRV81 Willaura Acres 1741 1 95 2"/45 2"/45 6"/70 Loma Rica
PRV83 Brewer Road #2 1827 11 9 2"/36 2"/31 Loma Rica
PRV84 Brewer Road #1 2000 2 11 2"/55 2"/50 Loma Rica
PRV85 Nancy Way 2035 2 11 2"/42 2"/37 Loma Rica
PRV100 Greenhorn Access
Rd 2238 28 29 1 /60 1 /55 Loma Rica
PRV104 Towle Lane 2785 42 91 2"/103 2"/98 Loma Rica
PRV86 Alta Sierra Auto 2350 36 2 Loma Rica
Nevada Irrigation District Final Technical Memorandum EG/LR/CS Model Update and Calibration
Nevada Irrigation District February 2019 Page 9 of 39
Table 3 Cont'd ‐ Summary of the PRV Station Information
Model Valve (ID) Location
Elevation (ft)
From Zone
To Zone
Valve 1 Size/Setting inch/psi)
Valve 2 Size/Setting inch/psi)
Valve 3 Size/Setting inch/psi) System
PRV92 Green Tank Altitude 2624 68 68 Loma Rica
PRV101 Osborne HIll Altitude 2985 42 42 Loma Rica
PRV113 LomaRica‐EGeorge
Intertie 2614 42 3 EGeorge
PRV10 Pittsburg Road 2714 3 59 2"/78 2"/73 EGeorge
PRV13 Deer Park Drive 2424 23 20 2"/120 2"/115 EGeorge
PRV14 Echo Ridge 2809 3 23 2"/60 2"/55 EGeorge
PRV15 Marjon Drive 2805 3 23 2"/54 2"/ EGeorge
PRV16 McPherson's 2814 3 27 2"/40 2"/35 EGeorge
PRV17 Mountaineer Forest Serv 2709 3 59 2"/80 2"/75 EGeorge
PRV18 Red Dog Road 3046 19 64 2"/40 4"/45 EGeorge
PRV19 Murchie Mine
Road 2821 64 49 2"/65 2"/63 EGeorge
PRV21 Berggren Lane 2620 35 6 1‐/65 1‐/60 EGeorge
PRV22 Park Avenue 2610 35 57 2"/55 2"/ EGeorge
PRV23 Boulder St. 2580 35 8 2"/65 2"/60 EGeorge
PRV24 Quaker Hill Reg. 3413 92 61 2"/60 2"/55 EGeorge
PRV25 Red Hill 2664 79 65 2"/50 2"/45 EGeorge
PRV26 Lake Vera 2628 79 38 2"/55 2"/50 EGeorge
PRV27 Star Motel 2471 83 80 1‐/40 1‐/35 EGeorge
PRV28 Sunset 2538 74 83 2"/85 2"/80 EGeorge
PRV29 Adams Avenue 2592 74 83 3"/56 3"/‐51 EGeorge
PRV30 Rough & Ready
Highway 2614 74 83 4"/50 4"/45 EGeorge
PRV31 Carey Drive 2652 74 83 8"/33 8"/39 Relief Valve Setting EGeorge
PRV32 Presley Way 2585 3 26 2"/102 2"/97 EGeorge
PRV33 Hills Flat 2583 3 34 2"/30 2"/25 EGeorge
PRV34 East Ridge Apartments 2608 3 74 2"/92 2"/87 EGeorge
PRV35 Idaho‐Maryland 2495 84 34 2"/80 2"/75 EGeorge
PRV36 Slate Creek 2639 3 74 3"/80 3"/75 EGeorge
PRV37 Cypress Hill 2666 3 74 2‐/66 2‐/61 EGeorge
PRV38 Sutton Way Ext. 2583 3 84 3"/100 3"/95 EGeorge
PRV39 Dorsey Drive 2696 3 21 2‐/60 2‐/55 EGeorge
PRV42 Forest Knolls #1 3063 5 4 2 /53 2 /48 EGeorge
PRV43 Northview Drive 3044 24 4 2"/60 2"/ EGeorge
PRV44 Forest Knolls #2
(Upper) 3103 5 24 2‐/80 2‐/75 EGeorge
Nevada Irrigation District Final Technical Memorandum EG/LR/CS Model Update and Calibration
Nevada Irrigation District February 2019 Page 10 of 39
Table 3 Cont'd ‐ Summary of the PRV Station Information
Model Valve (ID) Location
Elevation (ft)
From Zone
To Zone
Valve 1 Size/Setting inch/psi)
Valve 2 Size/Setting inch/psi)
Valve 3 Size/Setting inch/psi) System
PRV45 Old Tunnel Road 2815 3 54 2"/72 2"/67 EGeorge
PRV46 Glenwood Road 2664 3 27 2"/98 2"/93 EGeorge
PRV47 Morgan Ranch
(Upper) 2746 3 46 2"/65 2"/60 EGeorge
PRV48 Success Mine Loop 2583 47 20 2"/50 2"/45 EGeorge
PRV49 Northridge Drive 2716 46 47 2"/47 2"/ EGeorge
PRV50 Via Vista Drive 2781 3 23 2"/63 2"/ EGeorge
PRV51 Sutton Way 2624 3 84 2‐/80 2‐/75 EGeorge
PRV52 Glenbrook Drive 2654 3 26 2"/72 2"/72 EGeorge
PRV53 Lyons 2641 3 26 2"/80 2"/75 EGeorge
PRV54 Old Tunnel Road
Ext. 2687 54 84 2"/47 2"/ EGeorge
PRV55 Forest Knolls Court 2974 24 25 1‐/35 1‐/35 EGeorge
PRV56 Sierra College Way
Upper 2717 3 47 2"/46 2"/ EGeorge
PRV57 Morgan Ranch
(Lower) 2636 3 47 3"/80 3"/75 EGeorge
PRV58 Madrona Way 3167 5 24 2"/60 2"/ EGeorge
PRV59 Valley View Drive 3194 5 24 2"/45 2"/40 EGeorge
PRV60 Woodcrest Way 2710 46 47 2"/51 2"/ EGeorge
PRV61 Sierra College Way
Lower 2690 3 26 2"/55 2"/ EGeorge
PRV62 Banner‐Taylor 3045 5 4 2"/58 2"/53 EGeorge
PRV72 Old Auburn Road 2393 83 53 2‐/72 2‐/67 EGeorge
PRV73 Hidden Valley 2358 53 32 1‐/25 1‐/20 EGeorge
PRV99 Forest Knolls #2
(Lower) 3055 5 24 2"/100 2"/ EGeorge
PRV102 Indian Trail 2581 79 65 2"/74 2"/69 EGeorge
PRV103 Slate Creek Rd
(Lower) 2507 74 73 2"/71 2"/66 EGeorge
PRV105 Chapa~De 2679 3 26 1"/64 1"/59 EGeorge
PRV106 Cement Hill Upper 2869 31 16 2"/85 2"/80 EGeorge
PRV107 Cement Hill Lower 2642 16 15 2"/50 2"/45 EGeorge
PRV114 Snowline Rd 3279 61 19 2"/15 2"/10 6"/25 EGeorge
PRV116 Lava Cap Mine Rd
(Upper) 3098 5 41 2" /35 2 /30 EGeorge
PRV117 Lava Cap Mine Rd
(Middle) 2893 41 40 2" /35 2 /30 EGeorge
PRV118 Lava Cap Mine Rd
Tensy Ln 2651 40 39 2" /50 2 /45 EGeorge
PRV120 American Hill
Project 2622 79 96 2" /60 6"/55 EGeorge
Nevada Irrigation District Final Technical Memorandum EG/LR/CS Model Update and Calibration
Nevada Irrigation District February 2019 Page 11 of 39
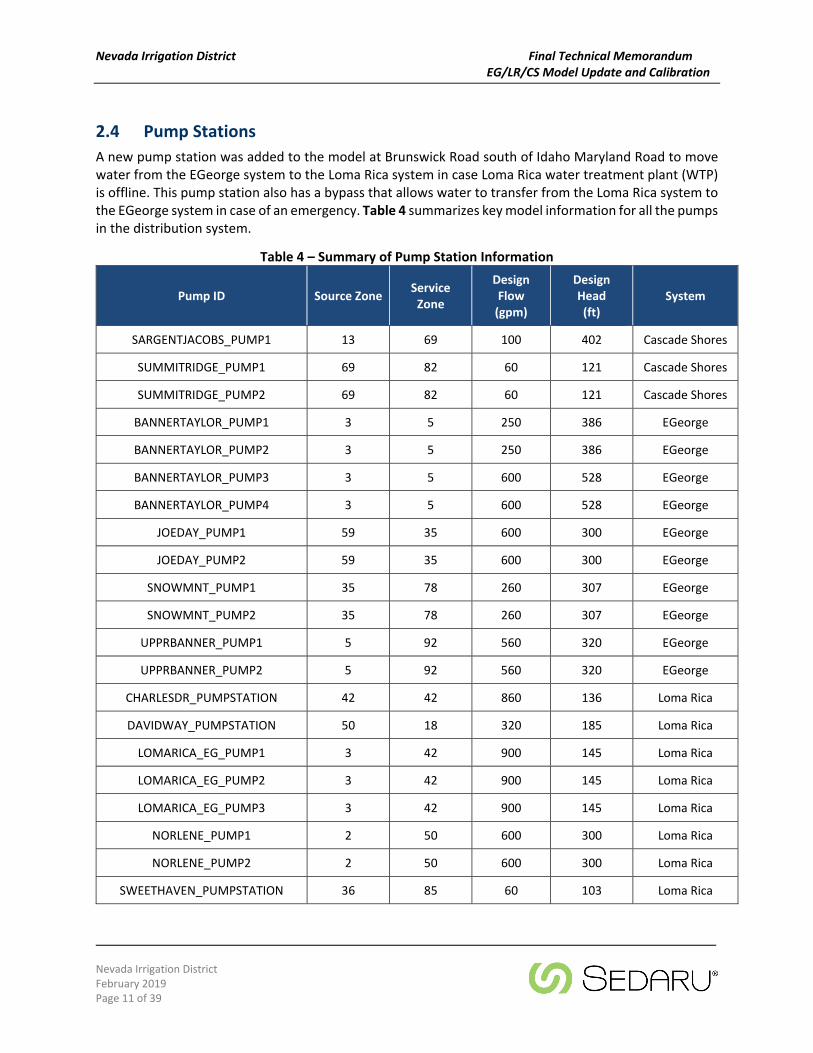
2.4 Pump Stations
A new pump station was added to the model at Brunswick Road south of Idaho Maryland Road to move water from the EGeorge system to the Loma Rica system in case Loma Rica water treatment plant (WTP) is offline. This pump station also has a bypass that allows water to transfer from the Loma Rica system to the EGeorge system in case of an emergency. Table 4 summarizes key model information for all the pumps in the distribution system.
Table 4 – Summary of Pump Station Information
Pump ID Source Zone Service Zone
Design Flow (gpm)
Design Head (ft)
System
SARGENTJACOBS_PUMP1 13 69 100 402 Cascade Shores
SUMMITRIDGE_PUMP1 69 82 60 121 Cascade Shores
SUMMITRIDGE_PUMP2 69 82 60 121 Cascade Shores
BANNERTAYLOR_PUMP1 3 5 250 386 EGeorge
BANNERTAYLOR_PUMP2 3 5 250 386 EGeorge
BANNERTAYLOR_PUMP3 3 5 600 528 EGeorge
BANNERTAYLOR_PUMP4 3 5 600 528 EGeorge
JOEDAY_PUMP1 59 35 600 300 EGeorge
JOEDAY_PUMP2 59 35 600 300 EGeorge
SNOWMNT_PUMP1 35 78 260 307 EGeorge
SNOWMNT_PUMP2 35 78 260 307 EGeorge
UPPRBANNER_PUMP1 5 92 560 320 EGeorge
UPPRBANNER_PUMP2 5 92 560 320 EGeorge
CHARLESDR_PUMPSTATION 42 42 860 136 Loma Rica
DAVIDWAY_PUMPSTATION 50 18 320 185 Loma Rica
LOMARICA_EG_PUMP1 3 42 900 145 Loma Rica
LOMARICA_EG_PUMP2 3 42 900 145 Loma Rica
LOMARICA_EG_PUMP3 3 42 900 145 Loma Rica
NORLENE_PUMP1 2 50 600 300 Loma Rica
NORLENE_PUMP2 2 50 600 300 Loma Rica
SWEETHAVEN_PUMPSTATION 36 85 60 103 Loma Rica
Nevada Irrigation District Final Technical Memorandum EG/LR/CS Model Update and Calibration
Nevada Irrigation District February 2019 Page 12 of 39
3 Elevation Assignment
The District provided three sources of elevation data including contour lines, Digital Elevation Model (DEM), and Digital Terrain Model (DTM). Below is a brief description of each source:
Contour lines are based on United State Geological Survey (USGS) with 40‐foot contour intervals
DEM is a representation of the elevation of the Earth’s surface above a certain datum (e.g. meansea level) in digital form. This is achieved by taking measurements at regular intervals (e.g. 50meters) or irregular spaced points (e.g. every 3 arc seconds) over the Earth’s surface. The DEMdata provided by the District was based on the 1/3 arc second resolution of 10 meters (~30 feet).
DTM is effectively a DEM that represents the elevation of the “bare earth” without taking intoaccount any overground features (e.g. trees, buildings) and augmented by elements such asbreaklines and observations other than the original data to correct for artifacts produced by usingonly the original data.
The three elevation data sources were evaluated and compared. As a result, the DTM data was used for updating the model node elevation because it is the most accurate.
4 Demand Allocation
Accurate demand allocation is one of the most important factors impacting model calibration. Model demands were developed and allocated based upon historical billing data and geocoded customer meter points provided by the District. Each customer point in GIS was given an “average” consumption in gallons per minute (gpm) based on 2016 historical billing data. This consumption data was spatially allocated to the hydraulic model junctions using GIS meter point data and the hydraulic model software functionality. This process provides high demand allocation accuracy which generally translates to better model calibration.
4.1 Existing Demands
Demand data was processed for each customer account to determine the individual and system (EG/LR/CS) average day demand (ADD) using 12 consecutive months of usage data provided by the District. The usage data contained the customer account and bi‐monthly meter readings. The bi‐monthly meter readings were averaged for the 2016 time period to create an ADD for each metered account. The individual demands were allocated to model junctions by first matching the individual customer ADD to the service meter feature class points in GIS. A total of 99.58 percent of the billing accounts was used in the demand allocation. There are 57 accounts in the consumption data with a total demand of 6.6 gpm that did not exist in GIS meter layer. Those accounts were located using the parcel number and allocated to the nearest node in the model. Table 5 summarizes the consumption data and ADD by system.
Nevada Irrigation District Final Technical Memorandum EG/LR/CS Model Update and Calibration
Nevada Irrigation District February 2019 Page 13 of 39
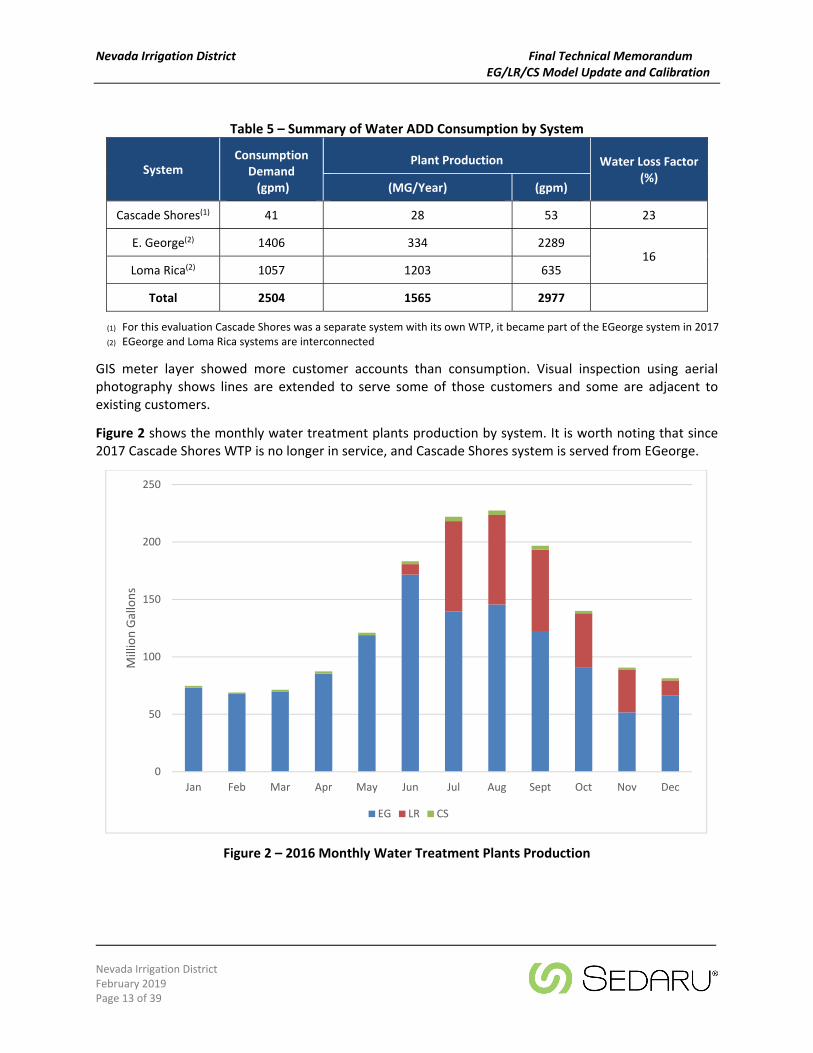
Table 5 – Summary of Water ADD Consumption by System
System Consumption
Demand (gpm)
Plant Production Water Loss Factor (%)
(MG/Year) (gpm)
Cascade Shores(1) 41 28 53 23
E. George(2) 1406 334 2289 16
Loma Rica(2) 1057 1203 635
Total 2504 1565 2977
(1) For this evaluation Cascade Shores was a separate system with its own WTP, it became part of the EGeorge system in 2017
(2) EGeorge and Loma Rica systems are interconnected
GIS meter layer showed more customer accounts than consumption. Visual inspection using aerial photography shows lines are extended to serve some of those customers and some are adjacent to existing customers.
Figure 2 shows the monthly water treatment plants production by system. It is worth noting that since 2017 Cascade Shores WTP is no longer in service, and Cascade Shores system is served from EGeorge.
Figure 2 – 2016 Monthly Water Treatment Plants Production
0
50
100
150
200
250
Jan Feb Mar Apr May Jun Jul Aug Sept Oct Nov Dec
Million Gallons
EG LR CS
Nevada Irrigation District Final Technical Memorandum EG/LR/CS Model Update and Calibration
Nevada Irrigation District February 2019 Page 14 of 39
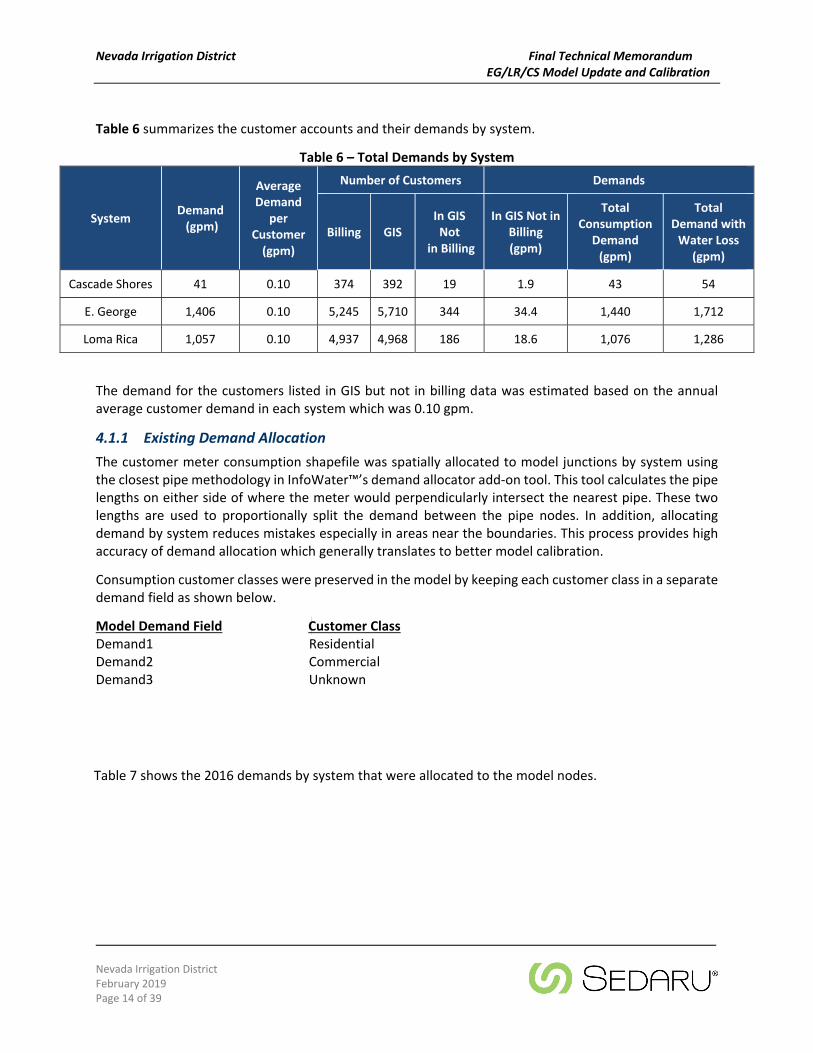
Table 6 summarizes the customer accounts and their demands by system.
Table 6 – Total Demands by System
System Demand (gpm)
Average Demand
per Customer (gpm)
Number of Customers Demands
Billing GIS In GIS Not
in Billing
In GIS Not in Billing (gpm)
Total Consumption
Demand (gpm)
Total Demand with Water Loss
(gpm)
Cascade Shores 41 0.10 374 392 19 1.9 43 54
E. George 1,406 0.10 5,245 5,710 344 34.4 1,440 1,712
Loma Rica 1,057 0.10 4,937 4,968 186 18.6 1,076 1,286
The demand for the customers listed in GIS but not in billing data was estimated based on the annual average customer demand in each system which was 0.10 gpm.
4.1.1 Existing Demand Allocation
The customer meter consumption shapefile was spatially allocated to model junctions by system using the closest pipe methodology in InfoWater™’s demand allocator add‐on tool. This tool calculates the pipe lengths on either side of where the meter would perpendicularly intersect the nearest pipe. These two lengths are used to proportionally split the demand between the pipe nodes. In addition, allocating demand by system reduces mistakes especially in areas near the boundaries. This process provides high accuracy of demand allocation which generally translates to better model calibration.
Consumption customer classes were preserved in the model by keeping each customer class in a separate demand field as shown below.
Model Demand Field Customer Class Demand1 Residential Demand2 Commercial Demand3 Unknown
Table 7 shows the 2016 demands by system that were allocated to the model nodes.
Nevada Irrigation District Final Technical Memorandum EG/LR/CS Model Update and Calibration
Nevada Irrigation District February 2019 Page 15 of 39
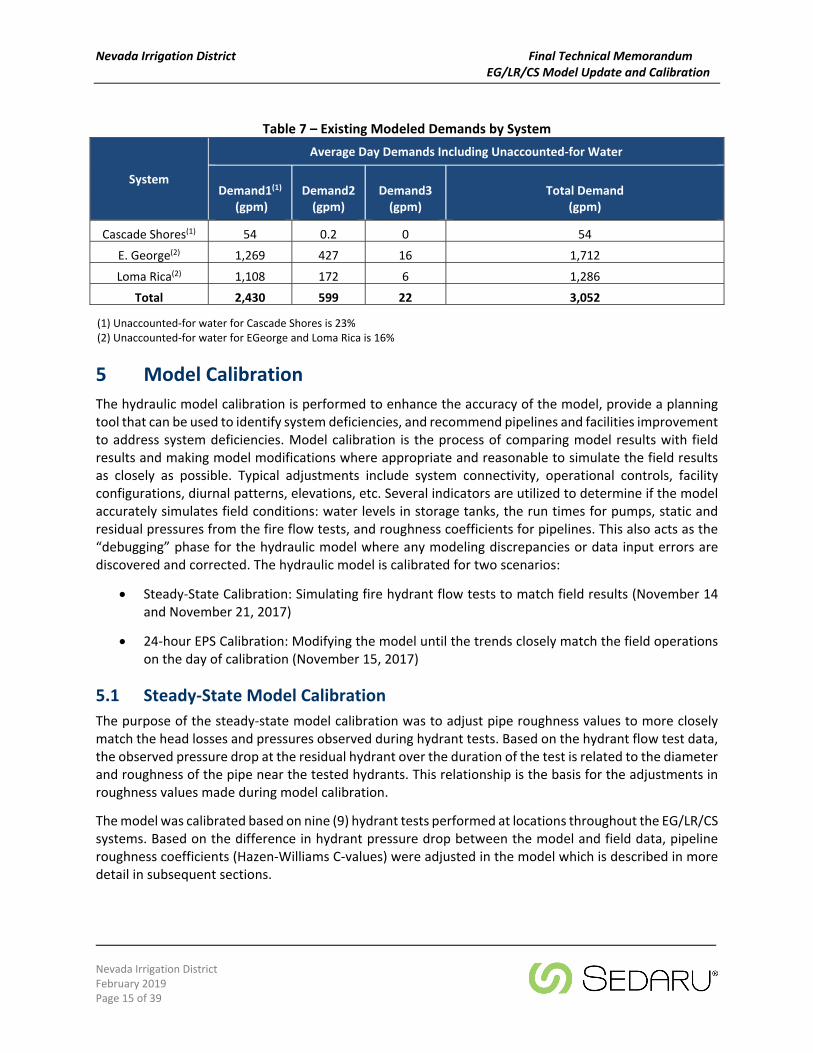
Table 7 – Existing Modeled Demands by System
System
Average Day Demands Including Unaccounted‐for Water
Demand1(1) (gpm)
Demand2 (gpm)
Demand3 (gpm)
Total Demand (gpm)
Cascade Shores(1) 54 0.2 0 54
E. George(2) 1,269 427 16 1,712
Loma Rica(2) 1,108 172 6 1,286
Total 2,430 599 22 3,052
(1) Unaccounted‐for water for Cascade Shores is 23%(2) Unaccounted‐for water for EGeorge and Loma Rica is 16%
5 Model Calibration
The hydraulic model calibration is performed to enhance the accuracy of the model, provide a planning tool that can be used to identify system deficiencies, and recommend pipelines and facilities improvement to address system deficiencies. Model calibration is the process of comparing model results with field results and making model modifications where appropriate and reasonable to simulate the field results as closely as possible. Typical adjustments include system connectivity, operational controls, facility configurations, diurnal patterns, elevations, etc. Several indicators are utilized to determine if the model accurately simulates field conditions: water levels in storage tanks, the run times for pumps, static and residual pressures from the fire flow tests, and roughness coefficients for pipelines. This also acts as the “debugging” phase for the hydraulic model where any modeling discrepancies or data input errors are discovered and corrected. The hydraulic model is calibrated for two scenarios:
Steady‐State Calibration: Simulating fire hydrant flow tests to match field results (November 14and November 21, 2017)
24‐hour EPS Calibration: Modifying the model until the trends closely match the field operationson the day of calibration (November 15, 2017)
5.1 Steady‐State Model Calibration
The purpose of the steady‐state model calibration was to adjust pipe roughness values to more closely match the head losses and pressures observed during hydrant tests. Based on the hydrant flow test data, the observed pressure drop at the residual hydrant over the duration of the test is related to the diameter and roughness of the pipe near the tested hydrants. This relationship is the basis for the adjustments in roughness values made during model calibration.
The model was calibrated based on nine (9) hydrant tests performed at locations throughout the EG/LR/CS systems. Based on the difference in hydrant pressure drop between the model and field data, pipeline roughness coefficients (Hazen‐Williams C‐values) were adjusted in the model which is described in more detail in subsequent sections.
Nevada Irrigation District Final Technical Memorandum EG/LR/CS Model Update and Calibration
Nevada Irrigation District February 2019 Page 16 of 39
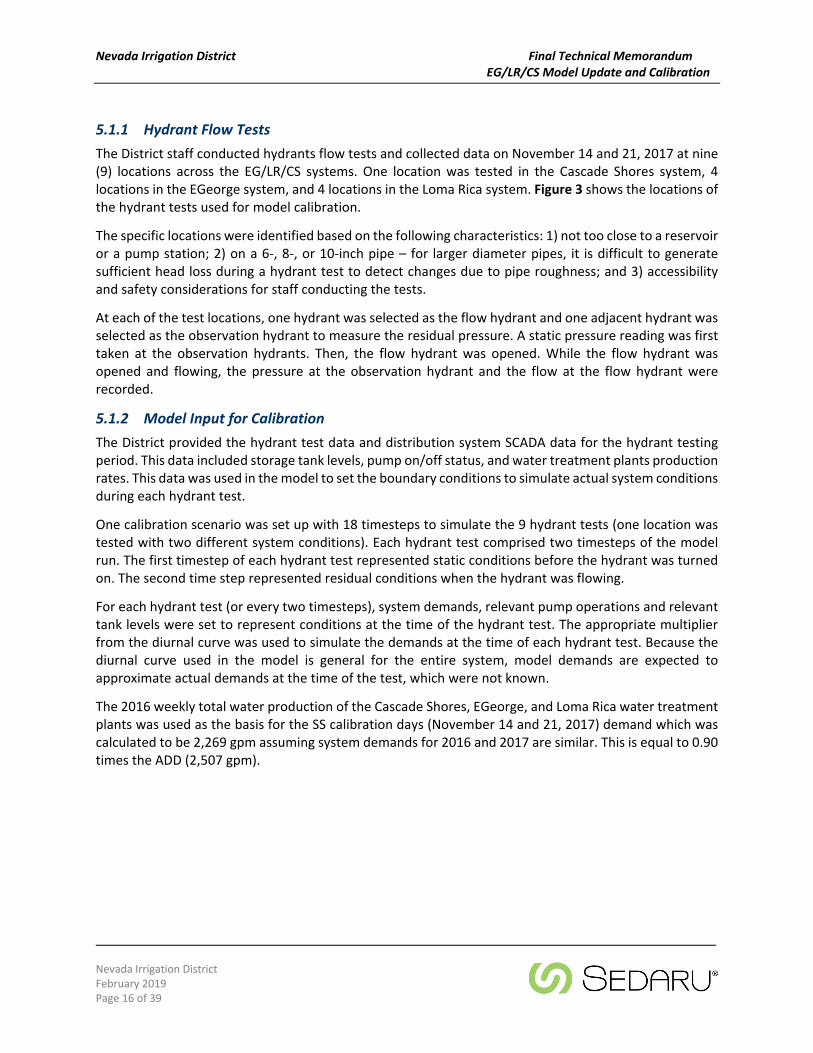
5.1.1 Hydrant Flow Tests
The District staff conducted hydrants flow tests and collected data on November 14 and 21, 2017 at nine (9) locations across the EG/LR/CS systems. One location was tested in the Cascade Shores system, 4locations in the EGeorge system, and 4 locations in the Loma Rica system. Figure 3 shows the locations ofthe hydrant tests used for model calibration.
The specific locations were identified based on the following characteristics: 1) not too close to a reservoir or a pump station; 2) on a 6‐, 8‐, or 10‐inch pipe – for larger diameter pipes, it is difficult to generate sufficient head loss during a hydrant test to detect changes due to pipe roughness; and 3) accessibility and safety considerations for staff conducting the tests.
At each of the test locations, one hydrant was selected as the flow hydrant and one adjacent hydrant was selected as the observation hydrant to measure the residual pressure. A static pressure reading was first taken at the observation hydrants. Then, the flow hydrant was opened. While the flow hydrant was opened and flowing, the pressure at the observation hydrant and the flow at the flow hydrant were recorded.
5.1.2 Model Input for Calibration
The District provided the hydrant test data and distribution system SCADA data for the hydrant testing period. This data included storage tank levels, pump on/off status, and water treatment plants production rates. This data was used in the model to set the boundary conditions to simulate actual system conditions during each hydrant test.
One calibration scenario was set up with 18 timesteps to simulate the 9 hydrant tests (one location was tested with two different system conditions). Each hydrant test comprised two timesteps of the model run. The first timestep of each hydrant test represented static conditions before the hydrant was turned on. The second time step represented residual conditions when the hydrant was flowing.
For each hydrant test (or every two timesteps), system demands, relevant pump operations and relevant tank levels were set to represent conditions at the time of the hydrant test. The appropriate multiplier from the diurnal curve was used to simulate the demands at the time of each hydrant test. Because the diurnal curve used in the model is general for the entire system, model demands are expected to approximate actual demands at the time of the test, which were not known.
The 2016 weekly total water production of the Cascade Shores, EGeorge, and Loma Rica water treatment plants was used as the basis for the SS calibration days (November 14 and 21, 2017) demand which was calculated to be 2,269 gpm assuming system demands for 2016 and 2017 are similar. This is equal to 0.90 times the ADD (2,507 gpm).
UT
UT
UT
UT
UT
UT
UT
UT
UT
UT
! (
! (
! (! (
! (! (
! (
! (
! (
! (
! ( ! ( ! (
! (
! (
! (
! ( ! (
! ( ! (
! (
! (
! (
! (
! (
! (
! (
! (
! (
! (
! (
! (
! (
! (
! (
! (
! (
! (
! (
! (
! (
! (
! (
! (
! (
! (
! (
! (
! (
! (
! (
! (
! (
! (
! (
! (! (
! (
! (
! (
! (
! (! (
! (
! (
! (
! (
! ( ! (
! (
! (! (
! (! (! (
! (
! (
! (
! (
! (
! (
! (
! (
! (
! (! (
! (
! (
! (
! (
! (
! (
! (
! (
! (
! (
! (
! (
! (
! (
! (
! (
! (
! (
! (
! (
! (
! (
! (
! (
! (! (
! (! (
! (
! (
! (
! (
!A
!A
"M
"M "M"M
"M
"M"M"M"M
"M"M
"M"M
"M"M
"M"M"M
¬«
¬«¬«
¬«
¬«
¬«
¬«
¬«
¬«
¬«
¬«
¬«
¬«¬«
¬«
¬«
LR-5/H376
LR-4_1/H35
LR-4/H2362
EG-5/H1454
LR-3/H2377
EG-1_1/H1480
EG-2/H2356
LR-5_1/H369
LR-3_1/H323
LR-1/H791
LR-1_1/H2500
EG-5_1/H1455
EG-3/H1381EG-3_1/H1382
EG-2_1/H2355EG-1/H
1482
Green
David Way A
Red Dog
Osborn Hill C
Upper Banner B
Harmony Ridge A
Alta Sierra Reservoir
Banner Taylor
LR Clearwell
Snow Mountains
Deer Creek Upper
Figure 3Hydrant Test Locations
0 5,000 10,000Feet
1 inch = 5,000 feet
/
Legend¬« Flow Hydrant
¬« Observation Hydrant"M Pump!A Well! ( Valve
UT TankDiameter (in)
<= 4
6
8
10
12
14 - 20
> 20
UT
UT
! (
"M
"M"M
G!.G!.
CS/H2555
CS-1/H1702
TEST_ID HYD_ID LOCATIONCS H2555 Gold Bug RdCS-1 H1702 Yuba ClosEG-1 H1482 Willow Valley Rd/Hill Creek DrEG-1_1 H1480 Coyote Ct & Willow Valley RdEG-2 H2356 Indian Trl & Woods Ravine CtEG-2_1 H2355 Indian Trl & Woods Ravine CtEG-3 H1381 Woodpecker WayEG-3_1 H1382 Woodpecker WayEG-5 H1454 Shangrila LnEG-5_1 H1455 Polaris DrLR-1 H791 Meadow Dr/High Sierra WayLR-1_1 H2500 Meadow Dr/Octagon LnLR-3 H2377 Alta Sierra Dr.LR-3_1 H323 Henson WayLR-4 H2362 Fay RdLR-4_1 H35 Fay Rd/Janet WayLR-5 H376 Geneva CtLR-5_1 H369 Willis Dr/Patricia Way
Cascade Shores
Model Update and Calibrationfor EG/LR/CS
Nevada Irrigation District
Nevada Irrigation District Final Technical Memorandum EG/LR/CS Model Update and Calibration
Nevada Irrigation District February 2019 Page 18 of 39
5.1.3 Calibration Method
Pipe roughness values in the model are represented by the Hazen‐Williams roughness coefficient, or C‐value, which is inversely proportional to head loss. High C‐values correspond to relatively smooth pipes with small head losses. Most pipelines in good condition or with interior linings have C‐values ranging from 120 to 140. Pipelines with extensive corrosion, such as unlined cast‐iron mains, could have C‐values as low as 70 or 80 which corresponds to relatively rough pipes with higher head losses. During the calibration process, in areas where modeled pressure drops were larger than observed pressure drops, the C‐values are increased, and vice versa.
The roughness factors in the current model were used as a starting point for the calibration process. Those factors (C‐values) were adjusted as needed during model calibration process described in the subsequent sections. The current (starting) and recommended (final) roughness factors based on the calibration findings are presented later in this memorandum.
Once the calibration model scenario was set up using system data provided by the District, each test location was analyzed for the following two conditions (two timesteps):
With no flow at the hydrant location to simulate closed hydrant or “static” conditions
With a demand equal to the hydrant flow applied at the hydrant location to simulate flowinghydrant conditions.
Modeled static pressures were also compared with actual (observed) static pressures. However, these comparisons were not used for calibration purposes because, under low flow conditions, modifying roughness values does not produce a large change in static pressure. An error in static pressure is most likely due to another source, such as errors in ground elevation or inaccurate field measurement.
Locations where large differences in static pressure were observed are noted as areas requiring potential future refinement (in the summary table of calibration results discussed later in this section).
Once model results were checked, the difference in pressure between the two runs (non‐flowing hydrant and flowing hydrant) was compared with the pressure drop observed during hydrant testing. By comparing the pressure drop rather than modeled and measured pressures, potential errors due to incorrect model elevations were eliminated.
In some instances, model results could not be adjusted to obtain results within ± 5 psi of observed values, without selecting unrealistic Hazen‐Williams C‐values. Some possible sources of error that may cause poor agreement between modeled and observed pressures include: errors or anomalies in physical model data, node elevation errors, uncertainties in estimated pipe roughness factors, not having complete information on system conditions during the field tests, and poorly calibrated measuring equipment. For locations with significant differences between modeled and observed pressures, the following steps were taken to investigate the source of differences:
Elevation verification – checked node and reservoir elevations in the model
Geometric verification – checked for missing pipes or incorrect diameters in the model
Nevada Irrigation District Final Technical Memorandum EG/LR/CS Model Update and Calibration
Nevada Irrigation District February 2019 Page 19 of 39
Distribution of supply from tanks and pumps was then investigated, to see whether the resultsmay have been affected by the way these sources are modeled
For tests where the pressure difference was still significant after conducting the above three steps, Sedaru recommends further field investigations or possibly repeat the hydrant test with calibrated equipment.
5.1.4 Calibration Criteria
The calibration process consisted of changing pipe roughness values until the difference between observed and modeled pressure drops reached a minimum or acceptably low value. The model was considered to be calibrated when the modeled pressure drop was within ± 5 psi of observed pressure drops at two or more observation locations. This is the AWWA Engineering Computer Applications Committee recommended criterion for model calibration for models to be used for planning applications1. Generally, roughness factor adjustments were made to groups of pipes based on pipe material and diameter. Table 8 summarizes the steady state calibration criteria.
Table 8 – Steady‐State Calibration Criteria
Pressure Drop (psi) Match
0 ‐ 3 Excellent
3 ‐ 5 Good
5 ‐ 10 Fair
5.1.5 Calibration Results
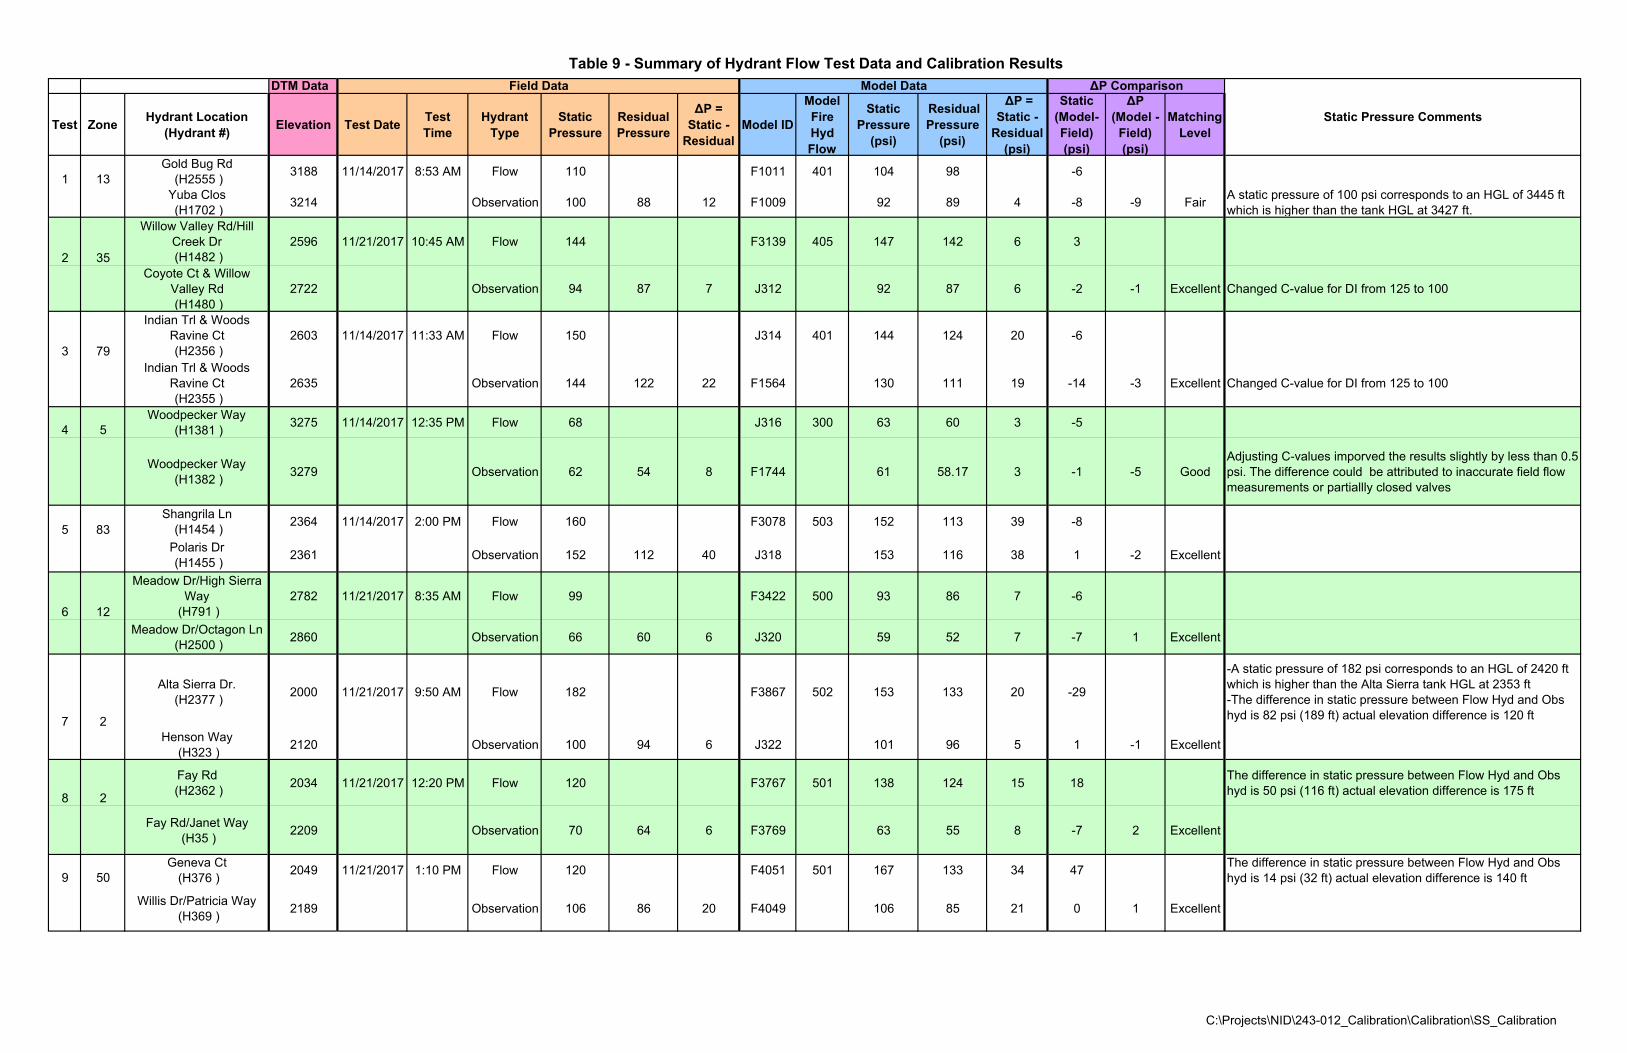
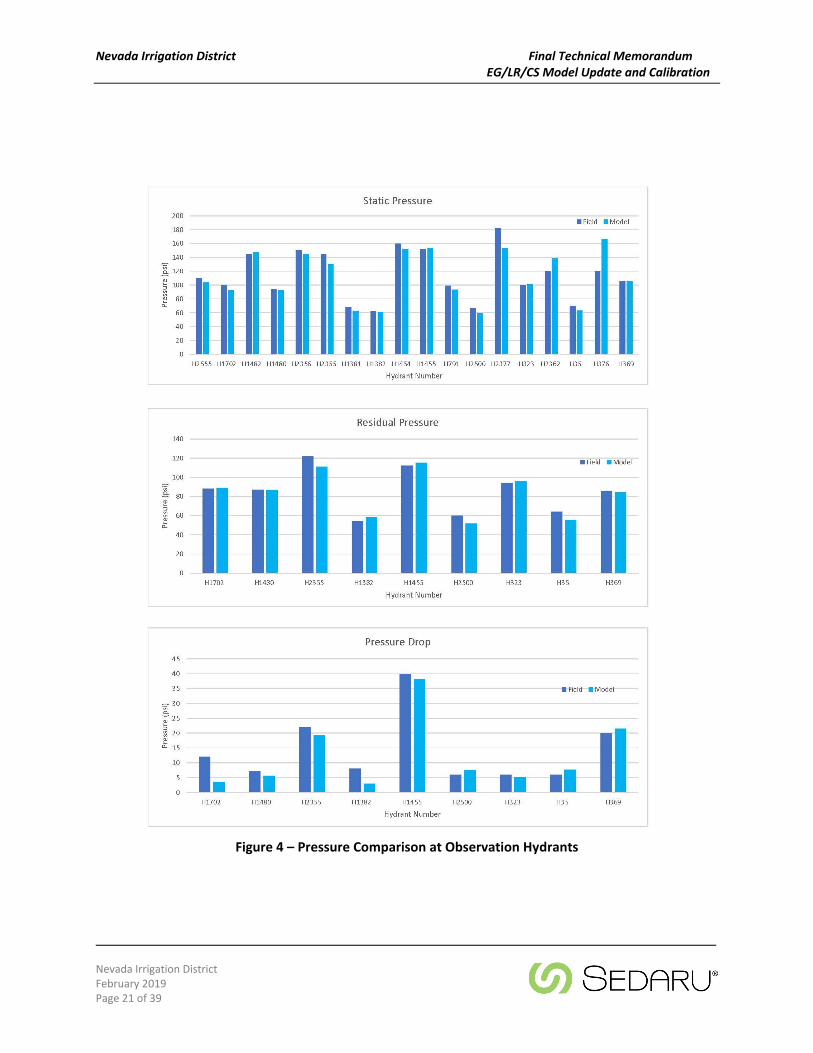
During the calibration process, revisions were made to the model as needed to adjust the pipe roughness factors to reasonable values. Table 9 summarizes the results from the calibration analysis after reasonable adjustments were made to the model. Figure 4 shows the pressure comparison at the observation hydrants.
Field information provided by the District listed in the table includes: test location, test date and time, hydrant outlet size, measured static pressure and measured residual pressure. The nearest model node was selected or a model node was added, if needed, to represent the hydrant location.
1 AWWA Engineering Computer Applications Committee, 1999. “Calibration Guidelines for Water” Distribution System Modeling ”1999 AWWA Information Management Technology Conference Proceedings”.
DTM Data
Test ZoneHydrant Location
(Hydrant #)Elevation Test Date
Test Time
Hydrant Type
Static Pressure
Residual Pressure
ΔP = Static -
ResidualModel ID
Model Fire Hyd Flow
Static Pressure
(psi)
Residual Pressure
(psi)
ΔP = Static -
Residual(psi)
Static (Model-Field)(psi)
ΔP (Model -
Field)(psi)
MatchingLevel
1 13Gold Bug Rd
(H2555 )3188 11/14/2017 8:53 AM Flow 110 F1011 401 104 98 -6
Yuba Clos (H1702 )
3214 Observation 100 88 12 F1009 92 89 4 -8 -9 FairA static pressure of 100 psi corresponds to an HGL of 3445 ft which is higher than the tank HGL at 3427 ft.
2 35
Willow Valley Rd/Hill Creek Dr (H1482 )
2596 11/21/2017 10:45 AM Flow 144 F3139 405 147 142 6 3
Coyote Ct & Willow Valley Rd (H1480 )
2722 Observation 94 87 7 J312 92 87 6 -2 -1 Excellent Changed C-value for DI from 125 to 100
3 79
Indian Trl & Woods Ravine Ct (H2356 )
2603 11/14/2017 11:33 AM Flow 150 J314 401 144 124 20 -6
Indian Trl & Woods Ravine Ct (H2355 )
2635 Observation 144 122 22 F1564 130 111 19 -14 -3 Excellent Changed C-value for DI from 125 to 100
4 5Woodpecker Way
(H1381 )3275 11/14/2017 12:35 PM Flow 68 J316 300 63 60 3 -5
Woodpecker Way (H1382 )
3279 Observation 62 54 8 F1744 61 58.17 3 -1 -5 GoodAdjusting C-values imporved the results slightly by less than 0.5 psi. The difference could be attributed to inaccurate field flow measurements or partiallly closed valves
5 83Shangrila Ln
(H1454 )2364 11/14/2017 2:00 PM Flow 160 F3078 503 152 113 39 -8
Polaris Dr (H1455 )
2361 Observation 152 112 40 J318 153 116 38 1 -2 Excellent
6 12
Meadow Dr/High Sierra Way
(H791 )2782 11/21/2017 8:35 AM Flow 99 F3422 500 93 86 7 -6
Meadow Dr/Octagon Ln (H2500 )
2860 Observation 66 60 6 J320 59 52 7 -7 1 Excellent
7 2
Alta Sierra Dr. (H2377 )
2000 11/21/2017 9:50 AM Flow 182 F3867 502 153 133 20 -29
-A static pressure of 182 psi corresponds to an HGL of 2420 ftwhich is higher than the Alta Sierra tank HGL at 2353 ft-The difference in static pressure between Flow Hyd and Obshyd is 82 psi (189 ft) actual elevation difference is 120 ft
Henson Way (H323 )
2120 Observation 100 94 6 J322 101 96 5 1 -1 Excellent
8 2
Fay Rd (H2362 )
2034 11/21/2017 12:20 PM Flow 120 F3767 501 138 124 15 18The difference in static pressure between Flow Hyd and Obs hyd is 50 psi (116 ft) actual elevation difference is 175 ft
Fay Rd/Janet Way (H35 )
2209 Observation 70 64 6 F3769 63 55 8 -7 2 Excellent
9 50Geneva Ct
(H376 )2049 11/21/2017 1:10 PM Flow 120 F4051 501 167 133 34 47
The difference in static pressure between Flow Hyd and Obs hyd is 14 psi (32 ft) actual elevation difference is 140 ft
Willis Dr/Patricia Way (H369 )
2189 Observation 106 86 20 F4049 106 85 21 0 1 Excellent
Static Pressure Comments
Field Data Model Data ΔP Comparison
Table 9 - Summary of Hydrant Flow Test Data and Calibration Results
C:\Projects\NID\243-012_Calibration\Calibration\SS_Calibration
Nevada Irrigation District Final Technical Memorandum EG/LR/CS Model Update and Calibration
Nevada Irrigation District February 2019 Page 21 of 39
Figure 4 – Pressure Comparison at Observation Hydrants
Nevada Irrigation District Final Technical Memorandum EG/LR/CS Model Update and Calibration
Nevada Irrigation District February 2019 Page 22 of 39
Table 9 also shows key model results for flows and pressures. The last two columns of the table present the comparison of the measured and modeled static pressure and the comparison of the measured and modeled residual pressure drops as well as the matching levels.
Model results were considered to match field data well if the field measured pressure drop and the modeled pressure drop were within 5 psi. The overall calibration results based on the available data indicate that the model is a reasonable representation of the system. Eight (8) out of nine (9) test locations were within 5 psi of the measured pressure drop. The two locations with discrepancies are discussed below in detail. The discrepancies may be due to inaccuracy of field measurements or lack of detailed information on system operations on the test day.
The additional information below addresses the issues identified in the initial calibration model runs:
Cascade Shores System
Hydrant H2555
Model results showed a smaller pressure drop than the field results at observation hydrant H1702 along Yuba Close at Gas Canyon Road. The measured pressure at this observation hydrant of 100 psi corresponds to a hydraulic grade line (HGL) of 3,445 ft which is higher than the HGL at Sargent Jacobs Tank of 3,427 ft. The observed pressure drop was 12 psi compared to 3 psi predicted by the model. The difference in pressure drop is 9 psi which is too high to be accounted for by adjusting C‐values. The higher pressure drop in the field could be attributed to partially closed valves, inaccurate flow measurement, or uncalibrated equipment.
EGeorge System
Hydrant H1381
Adjusting the C‐value of 4,680 feet of DI material from 125 to 100 along Banner Lava Cap Road improved the pressure only by 0.5 psi. At a hydrant flow of 300 gpm, the model is predicting a pressure drop of 3 psi compared to 8 psi field measured drop. The C‐value has to be very low and beyond reasonable limits to achieve a closer match. As a result, the difference is not due to C‐value, but most likely due to field conditions such as partially closed valves.
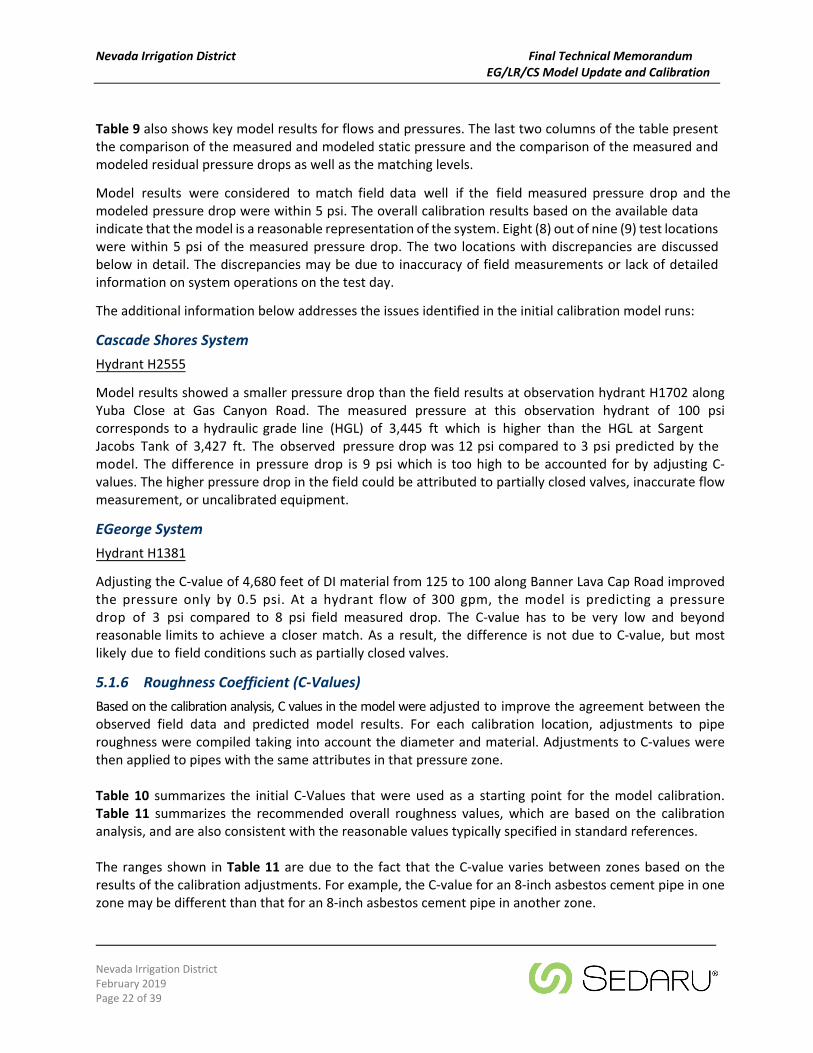
5.1.6 Roughness Coefficient (C‐Values)
Based on the calibration analysis, C values in the model were adjusted to improve the agreement between the observed field data and predicted model results. For each calibration location, adjustments to pipe roughness were compiled taking into account the diameter and material. Adjustments to C‐values were then applied to pipes with the same attributes in that pressure zone.
Table 10 summarizes the initial C‐Values that were used as a starting point for the model calibration. Table 11 summarizes the recommended overall roughness values, which are based on the calibration analysis, and are also consistent with the reasonable values typically specified in standard references.
The ranges shown in Table 11 are due to the fact that the C‐value varies between zones based on the results of the calibration adjustments. For example, the C‐value for an 8‐inch asbestos cement pipe in one zone may be different than that for an 8‐inch asbestos cement pipe in another zone.
1.5 2 3 4 6 8 10 12 14 16 18 20 24 30 36 42ABS ‐ ‐ ‐ 120 ‐ ‐ ‐ ‐ ‐ ‐ ‐ ‐ ‐ ‐ ‐ ‐AC ‐ ‐ ‐ 125 120‐130 120‐125 125 120‐125 ‐ ‐ ‐ ‐ 125 125 ‐ ‐BBP ‐ ‐ ‐ 120 120 ‐ ‐ ‐ ‐ ‐ ‐ ‐ ‐ ‐ ‐ ‐CCP ‐ ‐ ‐ ‐ ‐ ‐ ‐ ‐ ‐ ‐ ‐ ‐ ‐ ‐ ‐ 120CI ‐ ‐ 120 85 85 70‐85 85 85 ‐ ‐ ‐ ‐ ‐ ‐ ‐ ‐
CML ‐ ‐ ‐ ‐ 122 122 ‐ ‐ ‐ ‐ 122 ‐ ‐ ‐ ‐ ‐DI ‐ 130 ‐ 125‐130 120‐130 120‐130 50‐130 85‐130 ‐ 125 125 125 125 125 125 ‐
HDPE ‐ 120 ‐ 120 120 120 ‐ ‐ 120 125 ‐ ‐ ‐ ‐ ‐ ‐Plastic ‐ 120 ‐ ‐ 120 ‐ ‐ ‐ ‐ ‐ ‐ ‐ ‐ ‐ ‐ ‐POLY 120 120 ‐ ‐ ‐ ‐ ‐ ‐ ‐ ‐ ‐ ‐ ‐ ‐ ‐ ‐PVC 120 120 120‐125 70‐125 70‐125 70‐125 120‐125 85‐125 ‐ 120‐125 120 ‐ ‐ ‐ ‐ ‐STL ‐ 70 ‐ 70 70 70‐120 70 70 70 70 70 70 70 70‐120 ‐ 70
UNKN ‐ 120 ‐ 120 120 120 120 ‐ 120 120 ‐ 120 120 ‐ ‐ 71
1.5 2 3 4 6 8 10 12 14 16 18 20 24 30 36 42ABS ‐ ‐ ‐ 120 ‐ ‐ ‐ ‐ ‐ ‐ ‐ ‐ ‐ ‐ ‐ ‐AC ‐ ‐ ‐ 125 120‐130 100‐125 125 100‐125 ‐ ‐ ‐ ‐ 125 125 ‐ ‐BBP ‐ ‐ ‐ 120 120 ‐ ‐ ‐ ‐ ‐ ‐ ‐ ‐ ‐ ‐ ‐CCP ‐ ‐ ‐ ‐ ‐ ‐ ‐ ‐ ‐ ‐ ‐ ‐ ‐ ‐ ‐ 120CI ‐ ‐ 120 70‐85 85‐120 85‐120 85 85 ‐ ‐ ‐ ‐ ‐ ‐ ‐ ‐
CML ‐ ‐ ‐ ‐ 122 122 ‐ ‐ ‐ ‐ 122 ‐ ‐ ‐ ‐ ‐DI ‐ 130 ‐ 125‐130 100‐130 100‐130 100‐130 85‐130 ‐ 100‐125 125 125 125 125 125 ‐
HDPE ‐ 120 ‐ 120 120 120 ‐ ‐ 120 125 ‐ ‐ ‐ ‐ ‐ ‐Plastic ‐ 120 ‐ ‐ 120 ‐ ‐ ‐ ‐ ‐ ‐ ‐ ‐ ‐ ‐ ‐POLY 120 120 ‐ ‐ ‐ ‐ ‐ ‐ ‐ ‐ ‐ ‐ ‐ ‐ ‐ ‐PVC 120 120 120‐125 70‐125 70‐125 85‐125 120‐125 85‐125 ‐ 120‐125 120 ‐ ‐ ‐ ‐ ‐STL ‐ 70 ‐ 70 70 70‐120 70 70 70 70‐90 70 70‐100 70 70‐120 ‐ 70
UNKN ‐ 120 ‐ 120 120 120 120 ‐ 120 120 ‐ 120 120 ‐ ‐ 71Note: Red indicates adjusted Roughness Coefficient (C‐value)
Table 11 ‐ Adjusted Roughness Coefficient (C‐value) Based on Calibration Analysis
Material
Adjusted Roughness Coefficient (C‐value)Diameter (in)
Material
Current Model Initial Roughness Coefficient (C‐value)
Diameter (in)
Table ‐10 Initial Roughness Coefficient (C‐value)
Nevada Irrigation District Final Technical Memorandum EG/LR/CS Model Update and Calibration
Nevada Irrigation District February 2019 Page 24 of 39
5.2 Extended Period Simulation Model Calibration
The purpose of EPS calibration is to compare the model results with the actual field measurements over a specified time period, usually 24 – 48 hours. If the model is reasonably accurate, modeled pump station flows and suction and discharge pressures should match field measured flows and pressures, and modeled reservoir levels should track measured levels.
Depending on the data available, different levels of verification can be performed. Where detailed information is available (zone inflows, outflow and reservoir levels), it allows calculation of pressure zone demands, and hourly zone demands can be calculated. The model is then set up to reproduce both observed demands and operating conditions (pump starts/stops), and model results are reviewed to determine how well the model predicts zone operations (pump station flows, suction and discharge pressures, reservoir levels). Similarly, if pump station flow, suction and discharge pressure information is available, the pump total dynamic head and flow, based on measurements, can be compared with pump performance in the model, and model results adjusted to get the best fit of actual pump performance conditions.
Where system information is incomplete and a specific diurnal curve for the zone cannot be constructed, the model is run for a 24‐hour period with the daily system demand set to match actual daily demand, and model trends are reviewed for consistency with operating data, recognizing that hourly trends may differ from observed. Although this comparison is more qualitative, the model’s ability to represent observed conditions can still be assessed by evaluating parameters such as reservoir level operating ranges, and degree of cycling, to determine consistency with observed conditions.
Because flows are not recorded at all pump stations or regulating stations in the District’s system, the model calibration used the second approach discussed above. The calibrated static hydraulic model was run for EPS and compared with historical operating data. After data review, November 15, 2017 was selected as the calibration day due to the most complete data and more active facilities. The total demand for EG/LR/CS is 1,910 gpm based on the weekly plant productions. Historic operating conditions were simulated on that day using system data provided the District.
5.2.1 EPS Model Input for Calibration
The District provided system data for the selected day for use in the calibration. This field data included the following:
The weekly total water production of the Cascade Shores, EGeorge, and Loma Rica watertreatment plants was used as the basis for the EPS calibration day (November 15, 2017) demandwhich was calculated to be 1,910 gpm. This is equal to 0.76 times the ADD (2,507 gpm). Since nodaily plant production data was available, the demand for the EPS calibration day was establishedduring the calibration process to match SCADA data and was estimated to be 2,092 gpm (0.83times ADD).
For tanks where SCADA data was available, electronic files were provided showing water elevationdata. Electronic data was recorded at 15‐minute intervals.
For pump stations where SCADA data was available, electronic files were provided showing:
o Flow data – electronic data was recorded at 15‐minute intervals
Nevada Irrigation District Final Technical Memorandum EG/LR/CS Model Update and Calibration
Nevada Irrigation District February 2019 Page 25 of 39
o Current pressure settings at the PRV stations
o Normal booster pump station operational controls
5.2.2 Diurnal Pattern
A diurnal pattern is required for extended period simulations. A diurnal pattern shows the hourly variations in customer demand (hourly peaking factors) over a 24‐hour period. Diurnal patterns are typically developed from historic hourly flow data that is analyzed to determine variations in customer demands that have been adjusted to account for flows going into storage or passed through to other zones, i.e. during parts of the day, some flows in the system may be going to re‐fill storage rather than to meet customer demands.
Since there was no detailed system specific information available to develop a diurnal pattern by system, the SCADA tank level data and the estimated flow rates for Norlene Pump Station and David Way Pump Station provided by the District were reviewed to develop a diurnal curve.
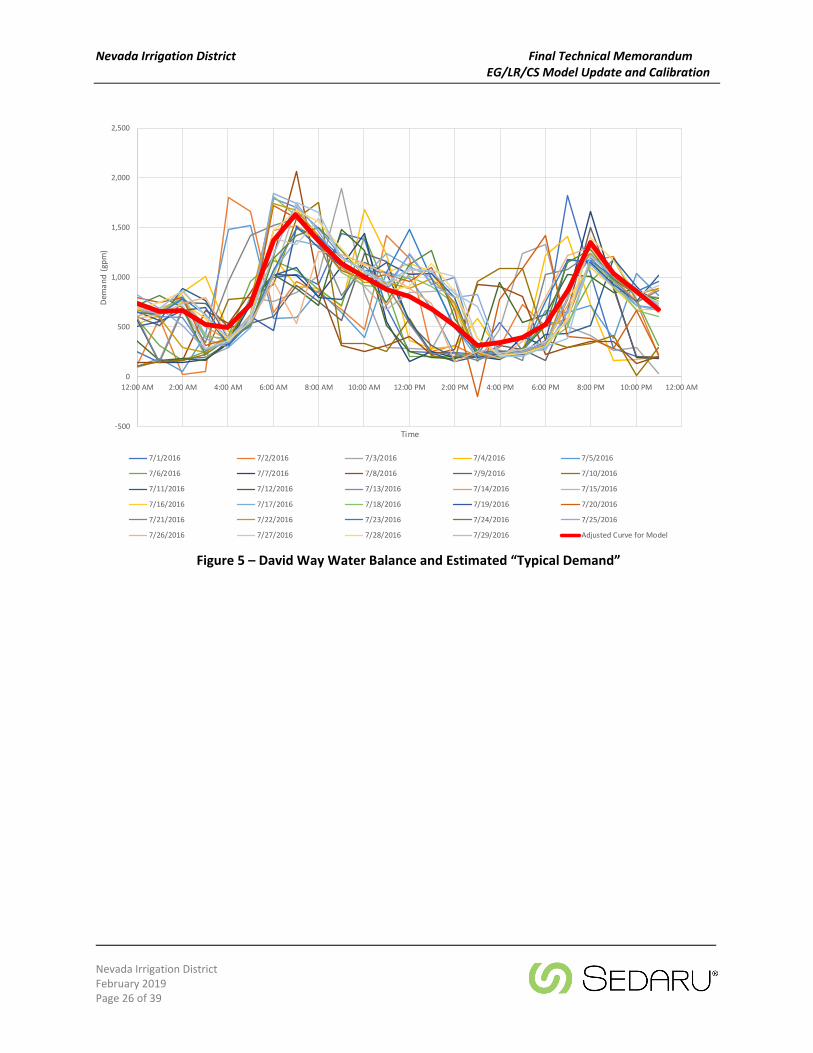
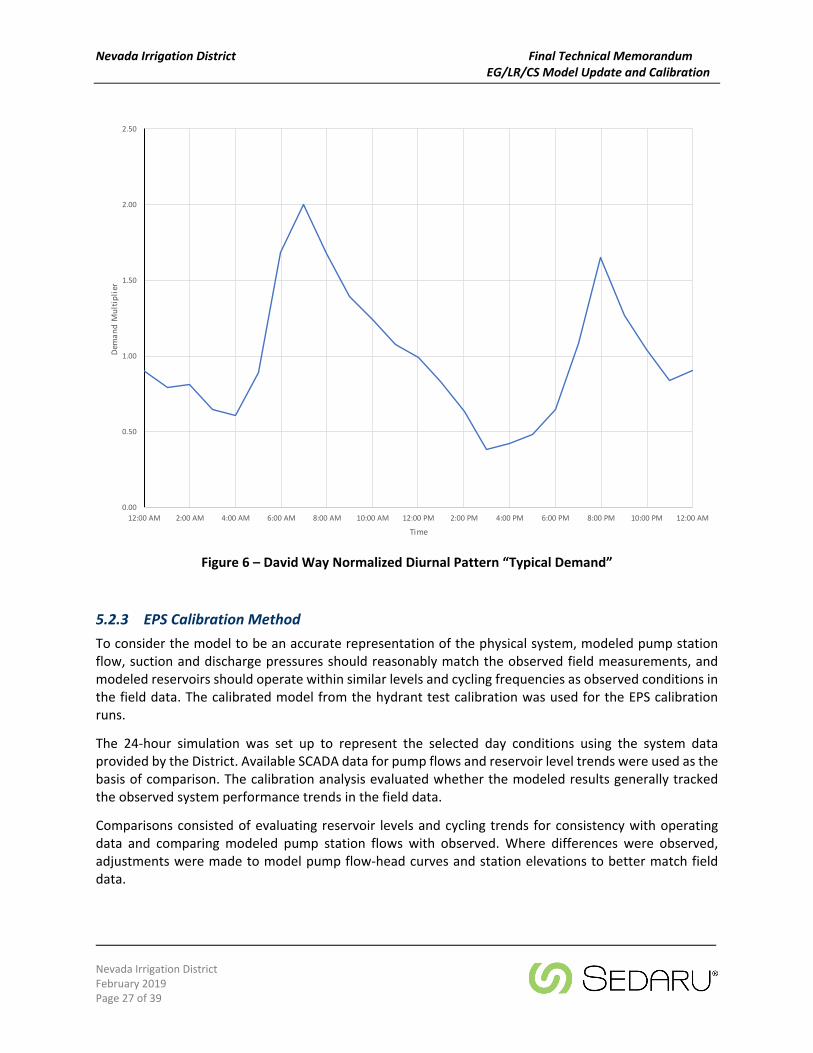
A water balance was completed for the David Way Zone to estimate the hourly demand multipliers by balancing flow in and out of the zone. By viewing the July 2016 water balance data with each day plotted on the same chart, a demand pattern was identified from the data. Figure 5 shows the demand curve estimated from viewing multiple days on the same graph. There is noise in the data, but a clear trend can be identified where multiple days experienced demands in similar magnitude at the same times. Figure 6 shows the demand curve normalized into demand multipliers which were applied to the model. The peak hour multiplier is 2.0 on the 24‐hour diurnal curve which is consistent with existing criteria established with the District.
Nevada Irrigation District Final Technical Memorandum EG/LR/CS Model Update and Calibration
Nevada Irrigation District February 2019 Page 26 of 39
Figure 5 – David Way Water Balance and Estimated “Typical Demand”
‐500
0
500
1,000
1,500
2,000
2,500
12:00 AM 2:00 AM 4:00 AM 6:00 AM 8:00 AM 10:00 AM 12:00 PM 2:00 PM 4:00 PM 6:00 PM 8:00 PM 10:00 PM 12:00 AM
Dem
and (gp
m)
Time
7/1/2016 7/2/2016 7/3/2016 7/4/2016 7/5/2016
7/6/2016 7/7/2016 7/8/2016 7/9/2016 7/10/2016
7/11/2016 7/12/2016 7/13/2016 7/14/2016 7/15/2016
7/16/2016 7/17/2016 7/18/2016 7/19/2016 7/20/2016
7/21/2016 7/22/2016 7/23/2016 7/24/2016 7/25/2016
7/26/2016 7/27/2016 7/28/2016 7/29/2016 Adjusted Curve for Model
Nevada Irrigation District Final Technical Memorandum EG/LR/CS Model Update and Calibration
Nevada Irrigation District February 2019 Page 27 of 39
Figure 6 – David Way Normalized Diurnal Pattern “Typical Demand”
5.2.3 EPS Calibration Method
To consider the model to be an accurate representation of the physical system, modeled pump station flow, suction and discharge pressures should reasonably match the observed field measurements, and modeled reservoirs should operate within similar levels and cycling frequencies as observed conditions in the field data. The calibrated model from the hydrant test calibration was used for the EPS calibration runs.
The 24‐hour simulation was set up to represent the selected day conditions using the system data provided by the District. Available SCADA data for pump flows and reservoir level trends were used as the basis of comparison. The calibration analysis evaluated whether the modeled results generally tracked the observed system performance trends in the field data.
Comparisons consisted of evaluating reservoir levels and cycling trends for consistency with operating data and comparing modeled pump station flows with observed. Where differences were observed, adjustments were made to model pump flow‐head curves and station elevations to better match field data.
0.00
0.50
1.00
1.50
2.00
2.50
12:00 AM 2:00 AM 4:00 AM 6:00 AM 8:00 AM 10:00 AM 12:00 PM 2:00 PM 4:00 PM 6:00 PM 8:00 PM 10:00 PM 12:00 AM
Dem
and M
ultiplier
Time
Nevada Irrigation District Final Technical Memorandum EG/LR/CS Model Update and Calibration
Nevada Irrigation District February 2019 Page 28 of 39
5.2.4 EPS Calibration Criteria
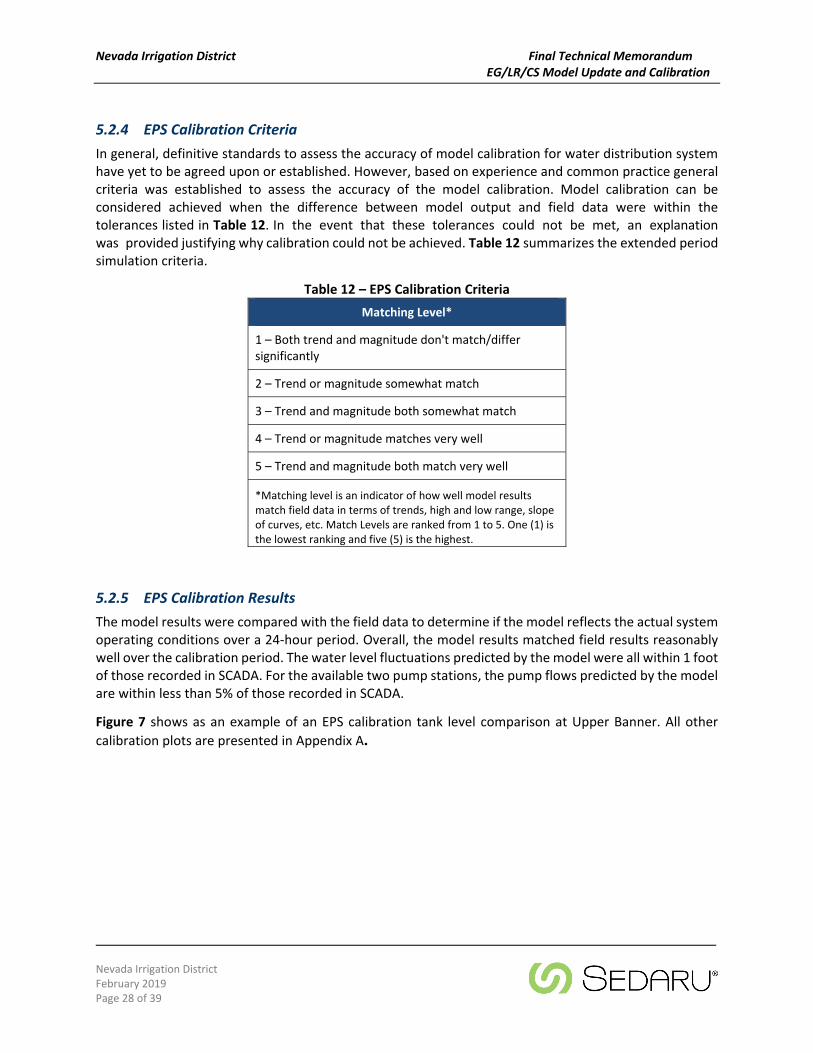
In general, definitive standards to assess the accuracy of model calibration for water distribution system have yet to be agreed upon or established. However, based on experience and common practice general criteria was established to assess the accuracy of the model calibration. Model calibration can be considered achieved when the difference between model output and field data were within the tolerances listed in Table 12. In the event that these tolerances could not be met, an explanation was provided justifying why calibration could not be achieved. Table 12 summarizes the extended period simulation criteria.
Table 12 – EPS Calibration Criteria
Matching Level*
1 – Both trend and magnitude don't match/differ significantly
2 – Trend or magnitude somewhat match
3 – Trend and magnitude both somewhat match
4 – Trend or magnitude matches very well
5 – Trend and magnitude both match very well
*Matching level is an indicator of how well model resultsmatch field data in terms of trends, high and low range, slopeof curves, etc. Match Levels are ranked from 1 to 5. One (1) isthe lowest ranking and five (5) is the highest.
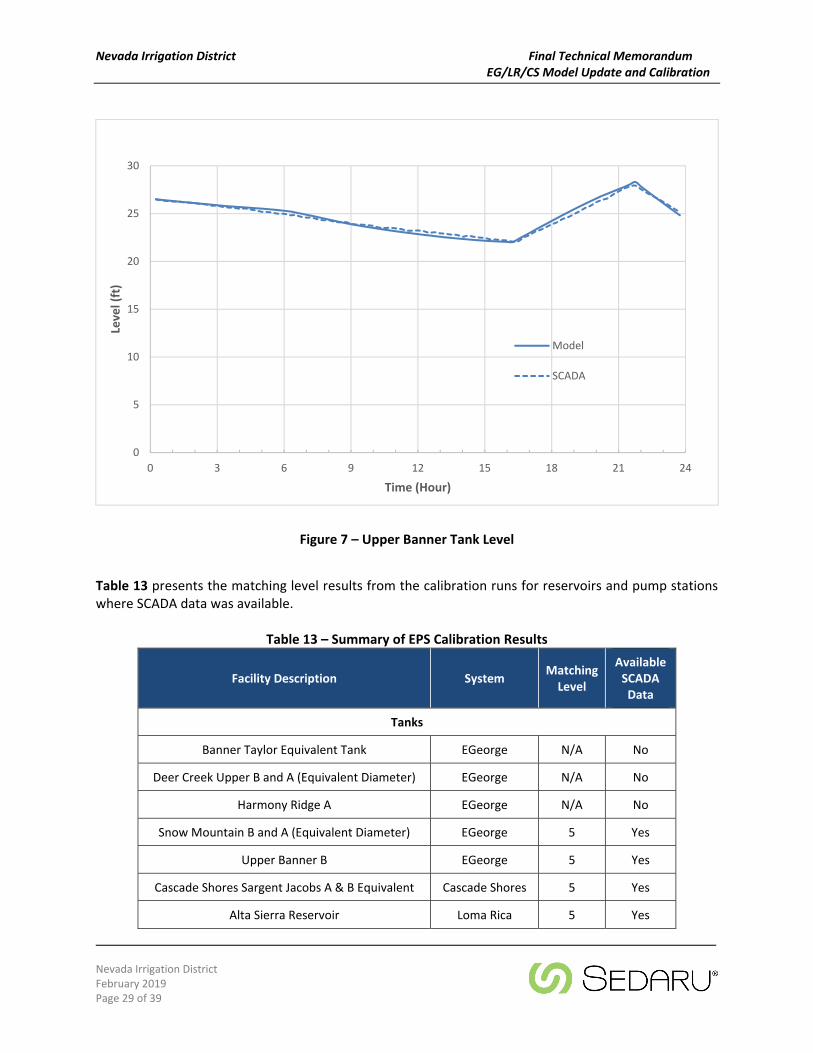
5.2.5 EPS Calibration Results
The model results were compared with the field data to determine if the model reflects the actual system operating conditions over a 24‐hour period. Overall, the model results matched field results reasonably well over the calibration period. The water level fluctuations predicted by the model were all within 1 foot of those recorded in SCADA. For the available two pump stations, the pump flows predicted by the model are within less than 5% of those recorded in SCADA.
Figure 7 shows as an example of an EPS calibration tank level comparison at Upper Banner. All other
calibration plots are presented in Appendix A.
Nevada Irrigation District Final Technical Memorandum EG/LR/CS Model Update and Calibration
Nevada Irrigation District February 2019 Page 29 of 39
Figure 7 – Upper Banner Tank Level
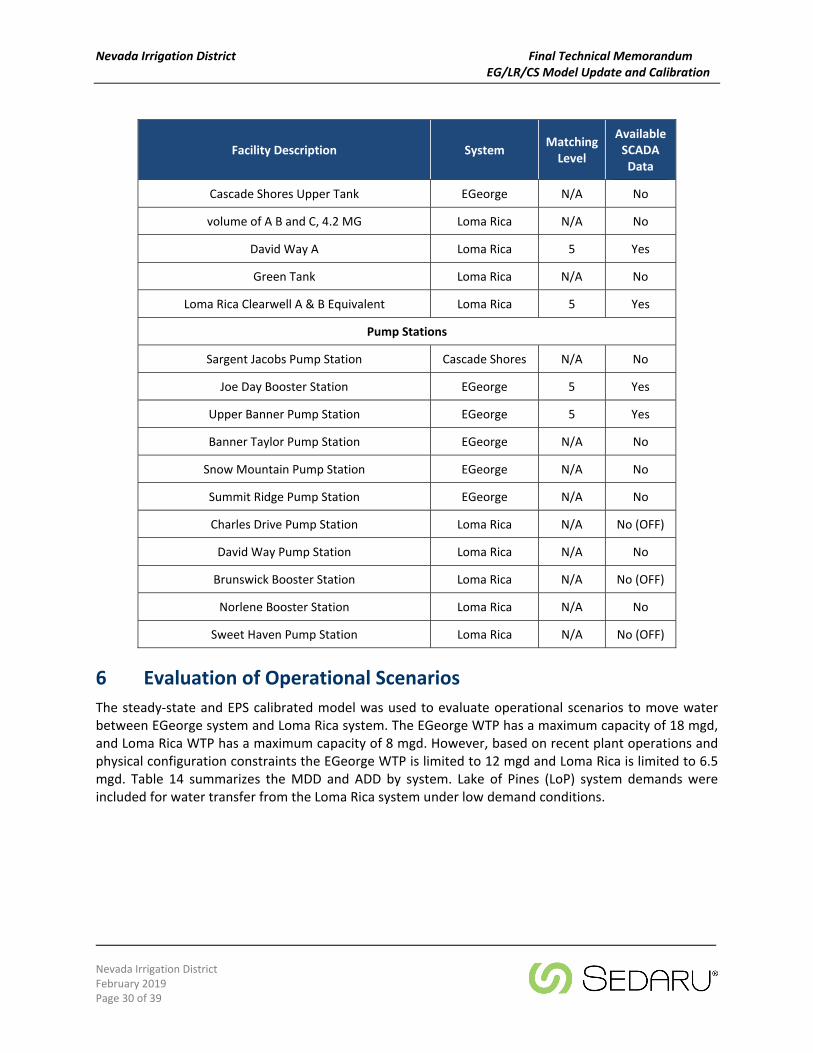
Table 13 presents the matching level results from the calibration runs for reservoirs and pump stations where SCADA data was available.
Table 13 – Summary of EPS Calibration Results
Facility Description System Matching Level
Available SCADA Data
Tanks
Banner Taylor Equivalent Tank EGeorge N/A No
Deer Creek Upper B and A (Equivalent Diameter) EGeorge N/A No
Harmony Ridge A EGeorge N/A No
Snow Mountain B and A (Equivalent Diameter) EGeorge 5 Yes
Upper Banner B EGeorge 5 Yes
Cascade Shores Sargent Jacobs A & B Equivalent Cascade Shores 5 Yes
Alta Sierra Reservoir Loma Rica 5 Yes
0
5
10
15
20
25
30
0 3 6 9 12 15 18 21 24
Leve
l (ft)
Time (Hour)
Model
SCADA
Nevada Irrigation District Final Technical Memorandum EG/LR/CS Model Update and Calibration
Nevada Irrigation District February 2019 Page 30 of 39
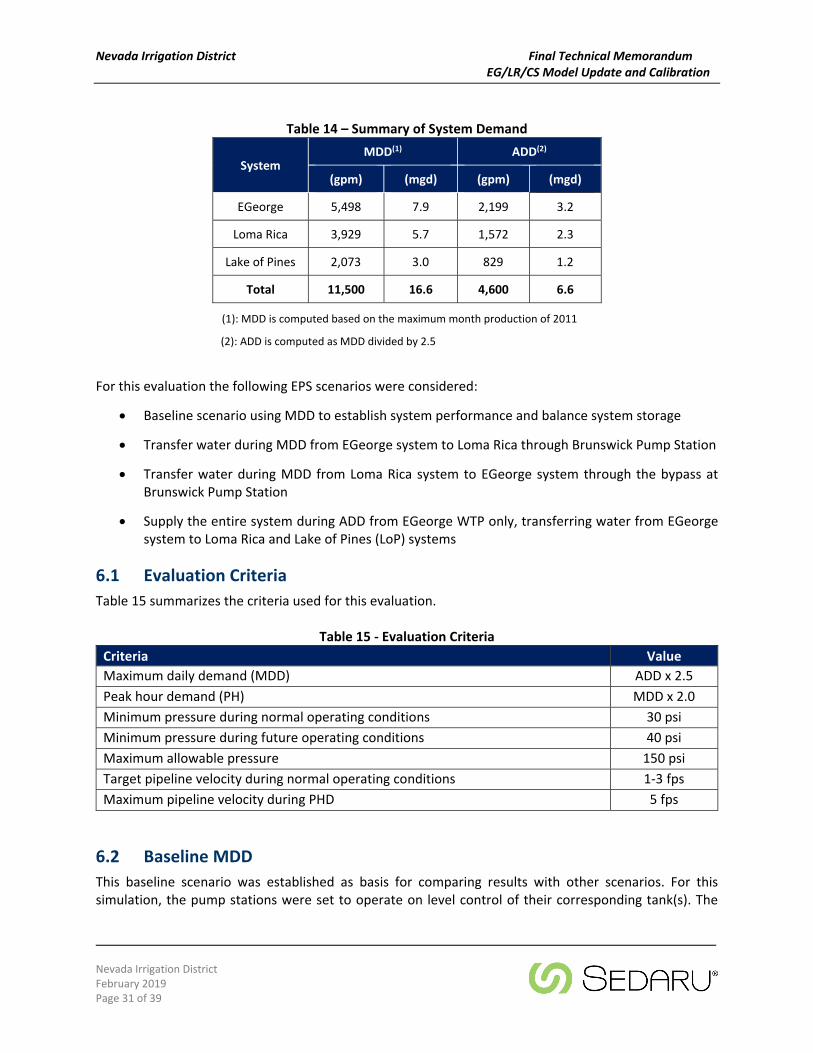
Facility Description System Matching Level
Available SCADA Data
Cascade Shores Upper Tank EGeorge N/A No
volume of A B and C, 4.2 MG Loma Rica N/A No
David Way A Loma Rica 5 Yes
Green Tank Loma Rica N/A No
Loma Rica Clearwell A & B Equivalent Loma Rica 5 Yes
Pump Stations
Sargent Jacobs Pump Station Cascade Shores N/A No
Joe Day Booster Station EGeorge 5 Yes
Upper Banner Pump Station EGeorge 5 Yes
Banner Taylor Pump Station EGeorge N/A No
Snow Mountain Pump Station EGeorge N/A No
Summit Ridge Pump Station EGeorge N/A No
Charles Drive Pump Station Loma Rica N/A No (OFF)
David Way Pump Station Loma Rica N/A No
Brunswick Booster Station Loma Rica N/A No (OFF)
Norlene Booster Station Loma Rica N/A No
Sweet Haven Pump Station Loma Rica N/A No (OFF)
6 Evaluation of Operational Scenarios
The steady‐state and EPS calibrated model was used to evaluate operational scenarios to move water between EGeorge system and Loma Rica system. The EGeorge WTP has a maximum capacity of 18 mgd, and Loma Rica WTP has a maximum capacity of 8 mgd. However, based on recent plant operations and physical configuration constraints the EGeorge WTP is limited to 12 mgd and Loma Rica is limited to 6.5 mgd. Table 14 summarizes the MDD and ADD by system. Lake of Pines (LoP) system demands were included for water transfer from the Loma Rica system under low demand conditions.
Nevada Irrigation District Final Technical Memorandum EG/LR/CS Model Update and Calibration
Nevada Irrigation District February 2019 Page 31 of 39
Table 14 – Summary of System Demand
System MDD(1) ADD(2)
(gpm) (mgd) (gpm) (mgd)
EGeorge 5,498 7.9 2,199 3.2
Loma Rica 3,929 5.7 1,572 2.3
Lake of Pines 2,073 3.0 829 1.2
Total 11,500 16.6 4,600 6.6
(1): MDD is computed based on the maximum month production of 2011
(2): ADD is computed as MDD divided by 2.5
For this evaluation the following EPS scenarios were considered:
Baseline scenario using MDD to establish system performance and balance system storage
Transfer water during MDD from EGeorge system to Loma Rica through Brunswick Pump Station
Transfer water during MDD from Loma Rica system to EGeorge system through the bypass atBrunswick Pump Station
Supply the entire system during ADD from EGeorge WTP only, transferring water from EGeorgesystem to Loma Rica and Lake of Pines (LoP) systems
6.1 Evaluation Criteria
Table 15 summarizes the criteria used for this evaluation.
Table 15 ‐ Evaluation Criteria
Criteria Value
Maximum daily demand (MDD) ADD x 2.5
Peak hour demand (PH) MDD x 2.0
Minimum pressure during normal operating conditions 30 psi
Minimum pressure during future operating conditions 40 psi
Maximum allowable pressure 150 psi
Target pipeline velocity during normal operating conditions 1‐3 fps
Maximum pipeline velocity during PHD 5 fps
6.2 Baseline MDD
This baseline scenario was established as basis for comparing results with other scenarios. For this simulation, the pump stations were set to operate on level control of their corresponding tank(s). The
Nevada Irrigation District Final Technical Memorandum EG/LR/CS Model Update and Calibration
Nevada Irrigation District February 2019 Page 32 of 39
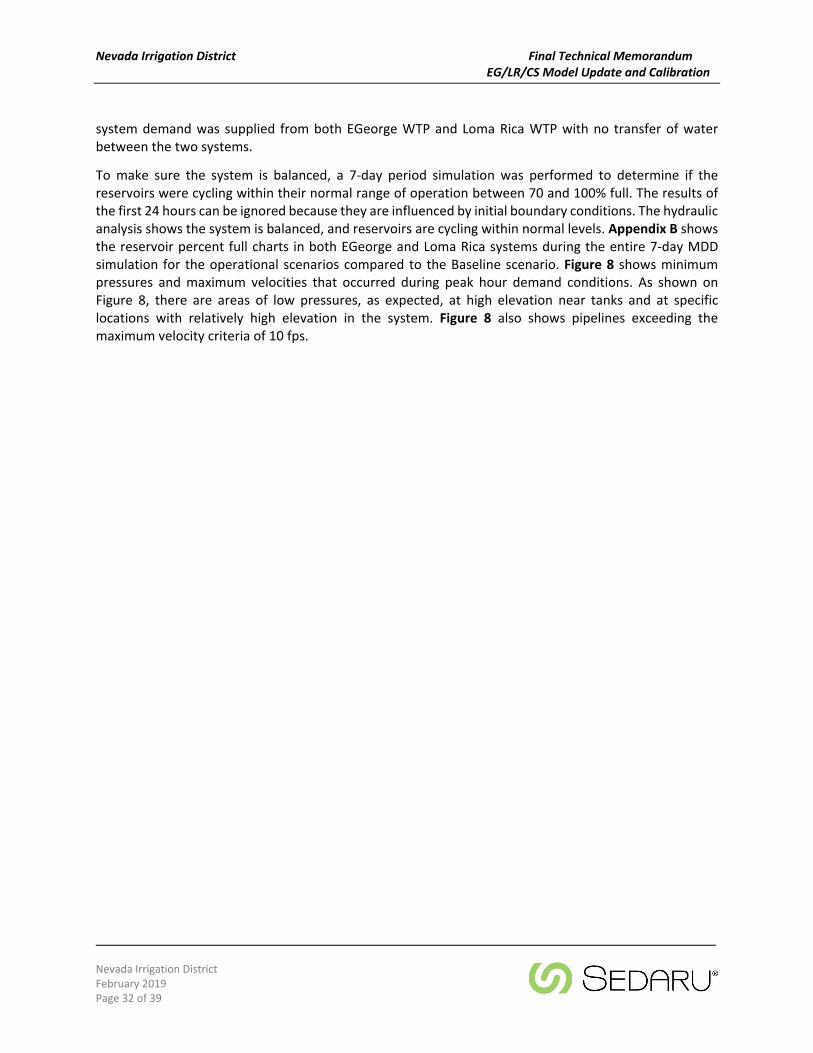
system demand was supplied from both EGeorge WTP and Loma Rica WTP with no transfer of water between the two systems.
To make sure the system is balanced, a 7‐day period simulation was performed to determine if the reservoirs were cycling within their normal range of operation between 70 and 100% full. The results of the first 24 hours can be ignored because they are influenced by initial boundary conditions. The hydraulic analysis shows the system is balanced, and reservoirs are cycling within normal levels. Appendix B shows the reservoir percent full charts in both EGeorge and Loma Rica systems during the entire 7‐day MDD simulation for the operational scenarios compared to the Baseline scenario. Figure 8 shows minimum pressures and maximum velocities that occurred during peak hour demand conditions. As shown on Figure 8, there are areas of low pressures, as expected, at high elevation near tanks and at specific locations with relatively high elevation in the system. Figure 8 also shows pipelines exceeding the maximum velocity criteria of 10 fps.
UT
UT
UT
UT
UT
UT
UT
UT
UT
UTUT
UT
! (
! (
! (! (
! (! (
! (
! (
! (
! (
! ( ! ( ! (
! (
! (
! (
! ( ! (
! ( ! (
! (
! (
! (
! (
! (
! (
! (
! (
! (
! (
! (
! (
! (
! (
! (
! (
! (
! (
! (
! (
! (
! (
! (
! (
! (
! (
! (
! (
! (! (
! (
! (
! (
! (
! (
! (! (
! (
! (
! (
! (! (! (
! (
! (
! (
! (
! ( ! ( ! (
! (! (
! (! (! (
! (
! (
! (
! (
! (
! (
! (
! (
! (! (! (
! (
! (
! (
! (
! (
! (
! (
! (
! (
! (
! ( ! (
! (
! (
! (
! (
! (
! (
! (
! (
! (
! (
! (
! (
! (! (
! (! (
! (
! (
! (
! (
! (
!A
!A
"M
"M "M"M
"M
"M"M"M"M
"M"M
"M"M
"M"M
"M"M"M
"M"M"M
Green
David Way A
Red Dog
Osborn Hill C
Upper Banner B
Harmony Ridge A
Alta Sierra Reservoir
Banner Taylor
CS Upper
LR Clearwell
CS Sargent Jacobs
Snow Mountains
Deer Creek Upper
Figure 8MDD Operation Scenario
Baseline EPS0 12,0006,000
Feet1 inch = 6,000 feet
/
Legend"M Pump!A Well! ( Valve
Min Pressure (psi)< 2020 -3030 - 4040 - 8080 - 125125 - 150> 150
UT TankMAX_VELOC
< 22 - 55 - 77 - 1010 - 15> 15
UT
UT
! (
"M
"M"M
Cascade Shores
Model Update and Calibrationfor EG/LR/CS
Nevada Irrigation District
Nevada Irrigation District Final Technical Memorandum EG/LR/CS Model Update and Calibration
Nevada Irrigation District February 2019 Page 34 of 39
6.3 Water Transfer from EGeorge to Loma Rica System
There are times when Loma Rica WTP is out of service or operating at lower capacity and the District would like to supply or supplement the Loma Rica system from the EGeorge system through the Brunswick pump station. This pump station has three pumps, each with a 900 gpm capacity at a TDH of 145 feet.
The Loma Rica System has a MDD of 5.7 mgd. This demand is met from Loma Rica WTP (4.2 mgd) and from Brunswick pump station (1.5 mgd). The hydraulic analysis shows the reservoirs in both EGeorge and Loma Rica system are balanced during the 7‐day period simulation and are operating within their operational range between 70 to 100% full. To evaluate the results of this operational scenario, Figure 9 was produced to show range of pressures and pipe velocities across the system under peak hour demand conditions. These results were similar to the Baseline scenario results which shows low pressures at high elevation near tanks and at specific locations with high elevation in the system. The EPS simulation results are also shown in Appendix B for comparison with the Baseline scenario. Figure 9 also shows pipelines exceeding the maximum velocity criteria of 5.0 fps similar to the Baseline scenario.
6.4 Water Transfer from Loma Rica to EGeorge System
This operational scenario evaluated the possibility of transferring water from the Loma Rica System to the EGeorge system during an emergency through the bypass at Brunswick pump station. The EGeorge system has a MDD of 7.9 mgd. This demand is met from EGeorge WTP (7.1 mgd) and from the bypass at Brunswick pump station (0.8 mgd).
The hydraulic analysis shows the reservoirs in both EGeorge and Loma Rica system are balanced during the 7‐day period simulation and are operating within their operational range between 70 to 100% full. Figure 10 shows the range of pressures and pipe velocities across the system under peak hour demand conditions. These results were similar to the Baseline scenario results which shows low pressures at high elevation near tanks and at specific locations with high elevation in the system. Figure 10 also shows pipelines exceeding the maximum velocity criteria of 5.0 fps similar to the Baseline scenario.
6.5 ADD EGeorge WTP Only
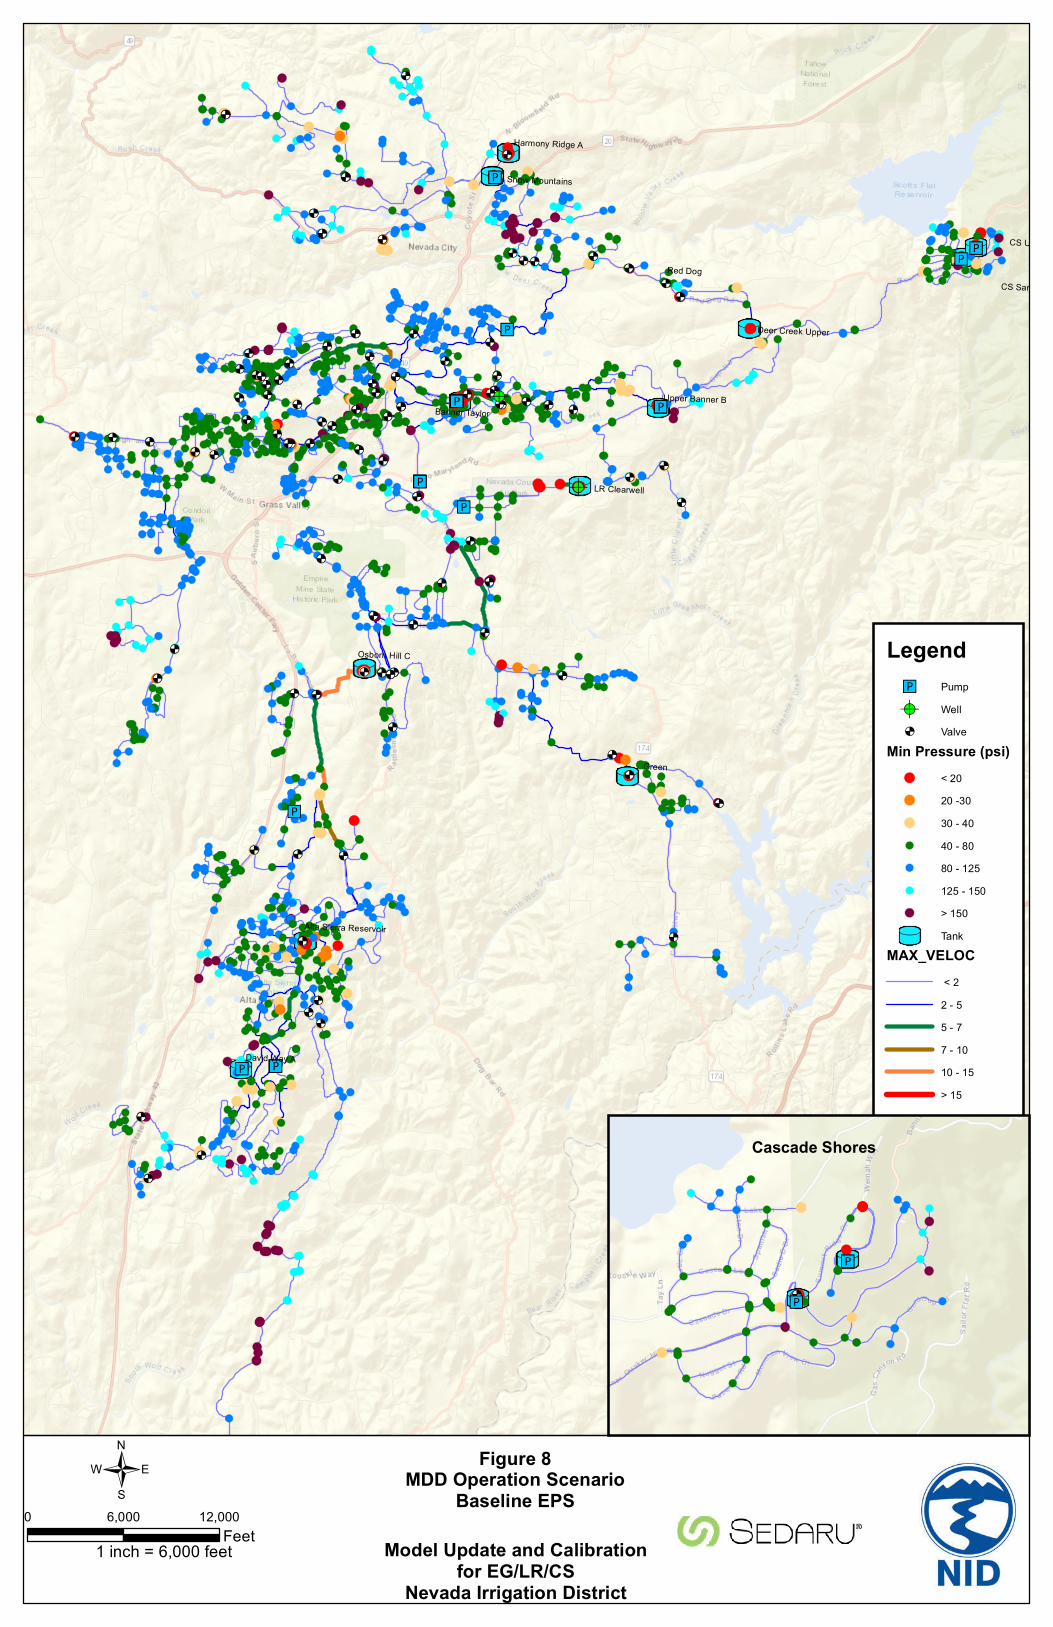
This operational scenario evaluated the system operation with supply provided only from the EGeorge WTP to meet the entire system ADD (6.6 mgd) including EGeorge, Loma Rica, and LoP systems. Loma Rica WTP is offline, and Brunswick pump station is supplying the Loma Rica system and the LoP system. The LoP system ADD (1.2 mgd) is assumed to be supplied through the Hacienda PRV station that is currently under construction.
The hydraulic analysis showed the reservoirs in both EGeorge and Loma Rica system are balanced during the 7‐day period simulation and are operating within their operational range between 70 to 100% full. Figure 11 shows the range of pressures and pipe velocities across the system under peak hour demand conditions. The results show the 12‐inch line in Brewer Road connecting to the LoP system is experiencing low pressures. This finding is consistent with previous evaluation where the maximum flow that can be transferred to the LoP system is limited to 250 gpm (0.36 mgd) without exacerbating the low pressure at Dennis Way. It’s worth noting this model has only existing facilities and does not have any facilities that are currently under construction such as Fay Road pipeline, Hacienda PRV Station or others.

UT
UT
UT
UT
UT
UT
UT
UT
UT
UTUT
UT
! (
! (
! (! (
! (! (
! (
! (
! (
! (
! ( ! ( ! (
! (
! (
! (
! ( ! (
! ( ! (
! (
! (
! (
! (
! (
! (
! (
! (
! (
! (
! (
! (
! (
! (
! (
! (
! (
! (
! (
! (
! (
! (
! (
! (
! (
! (
! (
! (
! (! (
! (
! (
! (
! (
! (
! (! (
! (
! (
! (
! (! (! (
! (
! (
! (
! (
! ( ! ( ! (
! (! (
! (! (! (
! (
! (
! (
! (
! (
! (
! (
! (
! (! (! (
! (
! (
! (
! (
! (
! (
! (
! (
! (
! (
! ( ! (
! (
! (
! (
! (
! (
! (
! (
! (
! (
! (
! (
! (
! (! (
! (! (
! (
! (
! (
! (
! (
!A
!A
"M
"M "M"M
"M
"M"M"M"M
"M"M
"M"M
"M"M
"M"M"M
"M"M"M
Green
David Way A
Red Dog
Osborn Hill C
Upper Banner B
Harmony Ridge A
Alta Sierra Reservoir
Banner Taylor
CS Upper
LR Clearwell
CS Sargent Jacobs
Snow Mountains
Deer Creek Upper
Figure 9MDD Operation ScenarioEGeorge to Loma Rica
0 12,0006,000Feet1 inch = 6,000 feet
/
Legend"M Pump!A Well! ( Valve
Min Pressure (psi)< 2020 -3030 - 4040 - 8080 - 125125 - 150> 150
UT TankMAX_VELOC
< 22 - 55 - 77 - 1010 - 15> 15
UT
UT
! (
"M
"M"M
Cascade Shores
Model Update and Calibrationfor EG/LR/CS
Nevada Irrigation District

UT
UT
UT
UT
UT
UT
UT
UT
UT
UTUT
UT
! (
! (
! (! (
! (! (
! (
! (
! (
! (
! ( ! ( ! (
! (
! (
! (
! ( ! (
! ( ! (
! (
! (
! (
! (
! (
! (
! (
! (
! (
! (
! (
! (
! (
! (
! (
! (
! (
! (
! (
! (
! (
! (
! (
! (
! (
! (
! (
! (
! (! (
! (
! (
! (
! (
! (
! (! (
! (
! (
! (
! (! (! (
! (
! (
! (
! (
! ( ! ( ! (
! (! (
! (! (! (
! (
! (
! (
! (
! (
! (
! (
! (
! (! (! (
! (
! (
! (
! (
! (
! (
! (
! (
! (
! (
! ( ! (
! (
! (
! (
! (
! (
! (
! (
! (
! (
! (
! (
! (
! (! (
! (! (
! (
! (
! (
! (
! (
!A
!A
"M
"M "M"M
"M
"M"M"M"M
"M"M
"M"M
"M"M
"M"M"M
"M"M"M
Green
David Way A
Red Dog
Osborn Hill C
Upper Banner B
Harmony Ridge A
Alta Sierra Reservoir
Banner Taylor
CS Upper
LR Clearwell
CS Sargent Jacobs
Snow Mountains
Deer Creek Upper
Figure 10MDD Operational Scenario
Loma Rica to EGeorge0 12,0006,000
Feet1 inch = 6,000 feet
/
Legend"M Pump!A Well! ( Valve
Min Pressure (psi)< 2020 -3030 - 4040 - 8080 - 125125 - 150> 150
UT TankMAX_VELOC
< 22 - 55 - 77 - 1010 - 15> 15
UT
UT
! (
"M
"M"M
Cascade Shores
Model Update and Calibrationfor EG/LR/CS
Nevada Irrigation District
UT
UT
UT
UT
UT
UT
UT
UT
UT
UTUT
UT
! (
! (
! (! (
! (! (
! (
! (
! (
! (
! ( ! ( ! (
! (
! (
! (
! ( ! (
! ( ! (
! (
! (
! (
! (
! (
! (
! (
! (
! (
! (
! (
! (
! (
! (
! (
! (
! (
! (
! (
! (
! (
! (
! (
! (
! (
! (
! (
! (
! (! (
! (
! (
! (
! (
! (
! (! (
! (
! (
! (
! (! (! (
! (
! (
! (
! (
! ( ! ( ! (
! (! (
! (! (! (
! (
! (
! (
! (
! (
! (
! (
! (
! (! (! (
! (
! (
! (
! (
! (
! (
! (
! (
! (
! (
! ( ! (
! (
! (
! (
! (
! (
! (
! (
! (
! (
! (
! (
! (
! (! (
! (! (
! (
! (
! (
! (
! (
!A
!A
"M
"M "M"M
"M
"M"M"M"M
"M"M
"M"M
"M"M
"M"M"M
"M"M"M
Green
David Way A
Red Dog
Osborn Hill C
Upper Banner B
Harmony Ridge A
Alta Sierra Reservoir
Banner Taylor
CS Upper
LR Clearwell
CS Sargent Jacobs
Snow Mountains
Deer Creek Upper
Figure 11ADD Operational Scenario
EGeorge to Loma Rica0 12,0006,000
Feet1 inch = 6,000 feet
/
Legend"M Pump!A Well! ( Valve
Min Pressure (psi)< 2020 -3030 - 4040 - 8080 - 125125 - 150> 150
UT TankMAX_VELOC
< 22 - 55 - 77 - 1010 - 15> 15
UT
UT
! (
"M
"M"M
Cascade Shores
Model Update and Calibrationfor EG/LR/CS
Nevada Irrigation District
Nevada Irrigation District Final Technical Memorandum EG/LR/CS Model Update and Calibration
Nevada Irrigation District February 2019 Page 38 of 39
7 Conclusions and Recommendations
7.1 Conclusions
Calibration
Overall, the model results matched field results reasonably well over the calibration period. As shown in Table 9, eight observation hydrants out of nine (89%) are within 5 psi and one (11%) is within 10 psi. Achieving the 5‐psi tolerance for most comparison points involved making adjustments to pipe C‐factors in the model. The water level fluctuations predicted by the model were all within 1 foot of those recorded in SCADA. For the available two pump stations, the pump flows predicted by the model are within less than 5% of those recorded in SCADA.
Based on the results of steady‐state and EPS calibration where model results and field measurements are matching very well, it can be concluded that the hydraulic model is calibrated and can be used with confidence as a planning tool to predict system performance under various demand conditions.
Evaluation
The results of the operational scenarios under PHD conditions shows pipes with velocitiesexceeding the 5.0 fps maximum criterion.
The water delivery to the LoP system is limited due to hydraulic constraints to maintain minimumpressure required in the vicinity of Dennis Way.
7.2 Recommendations
Based on findings from the steady‐state and EPS calibration and evaluations, the following items are recommended to improve and refine the predictive capability of the model in the future:
Install SCADA devices at all tanks in the system to collect water levels.
Install flow meters at the water treatment plants that are capable of collecting data at small timeintervals (i.e. 5 minutes or 15 minutes). Also install flow meters at the pump stations that do notalready have meters. Data should be relayed to SCADA. Having this data available, can be used toestablish flow balance and develop a specific diurnal curve for each pressure zone for betterrepresentation system hydraulic and improving model accuracy to predict results.
Install pressure loggers to capture at key points in the system such as suction and dischargepressure at the pump stations and pressure across the distribution system. Pressure at the loggershould be relayed to District’s SCADA system.
For the hydrant test in Cascade Shores where the modeled pressure did not reasonably matchthat of field measurements, redo the test by installing HPRs along the main path to monitorpressure drops which could be indicative of closed or partially closed valves.
Update or verify the hydraulic model including, but not limited to, facility modifications, PRVsettings, zone boundary valves, piping improvements, demands, etc. on a bi‐yearly basis, at aminimum.
Nevada Irrigation District Final Technical Memorandum EG/LR/CS Model Update and Calibration
Nevada Irrigation District February 2019 Page 39 of 39
Perform system capacity evaluation to identify deficient facilities across the system includingpipes, pump stations and storage tanks.
Establish a planning horizon demand scenario for sizing system improvements.
Update the hydraulic model regularly to reflect physical and operational system changes.
Perform a system‐wide calibration preferably every 5 years in response to demand or operationalchanges.
In addition, for any future updates to the District’s GIS, it is recommended that facility ID’s are not reused for pipes and other features. Creating unique ID’s for all newly installed pipes, appurtenances, and other facilities ensures the model can be updated without duplicating features and/or representing them in the incorrect location
Nevada Irrigation District Final Technical Memorandum EG/LR/CS Model Update and Calibration
Appendix A
EPS Model Calibration Charts
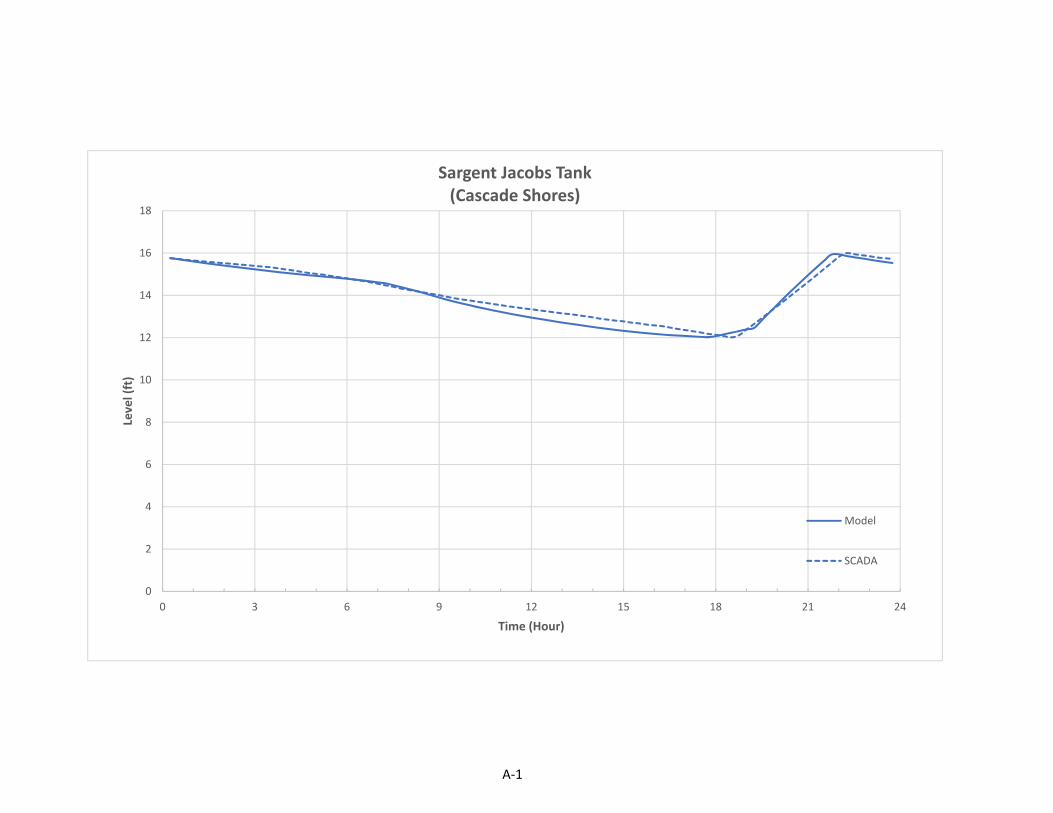
0
2
4
6
8
10
12
14
16
18
0 3 6 9 12 15 18 21 24
Leve
l (ft)
Time (Hour)
Sargent Jacobs Tank(Cascade Shores)
Model
SCADA
A-1
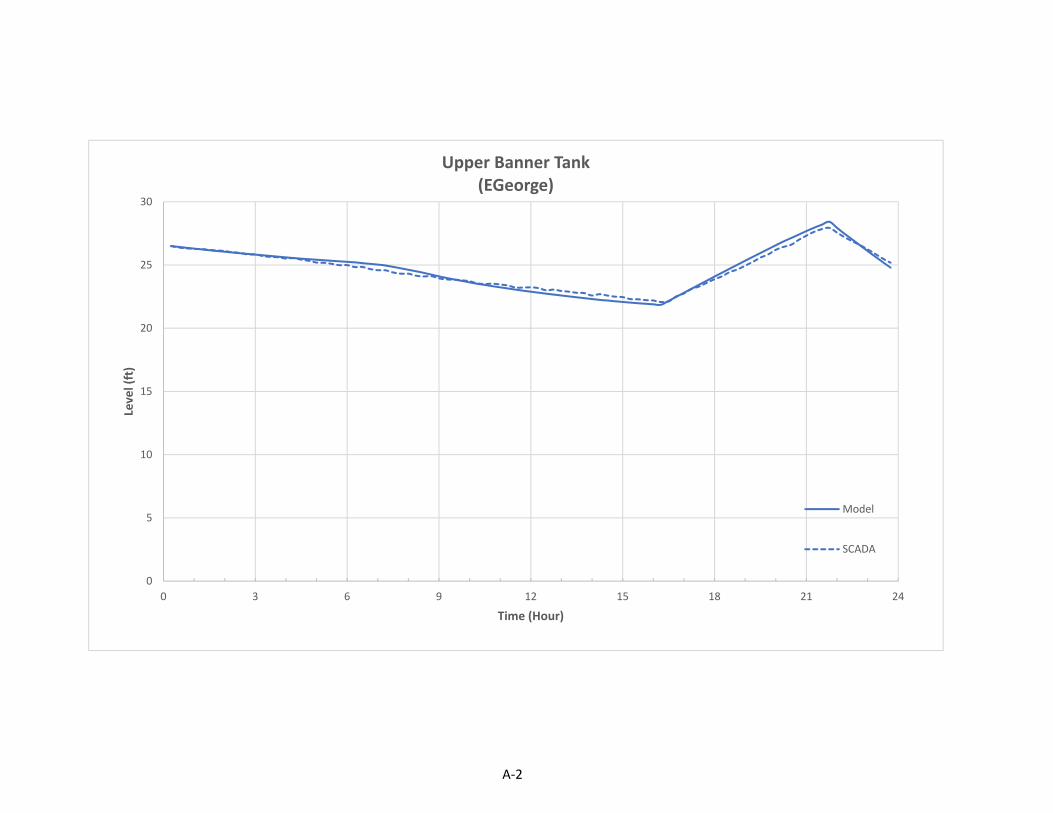
0
5
10
15
20
25
30
0 3 6 9 12 15 18 21 24
Leve
l (ft)
Time (Hour)
Upper Banner Tank(EGeorge)
Model
SCADA
A-2

0
5
10
15
20
25
30
0 3 6 9 12 15 18 21 24
Leve
l (ft)
Time (Hour)
Snow Mountain Tank(EGeorge)
Model
SCADA
A-3
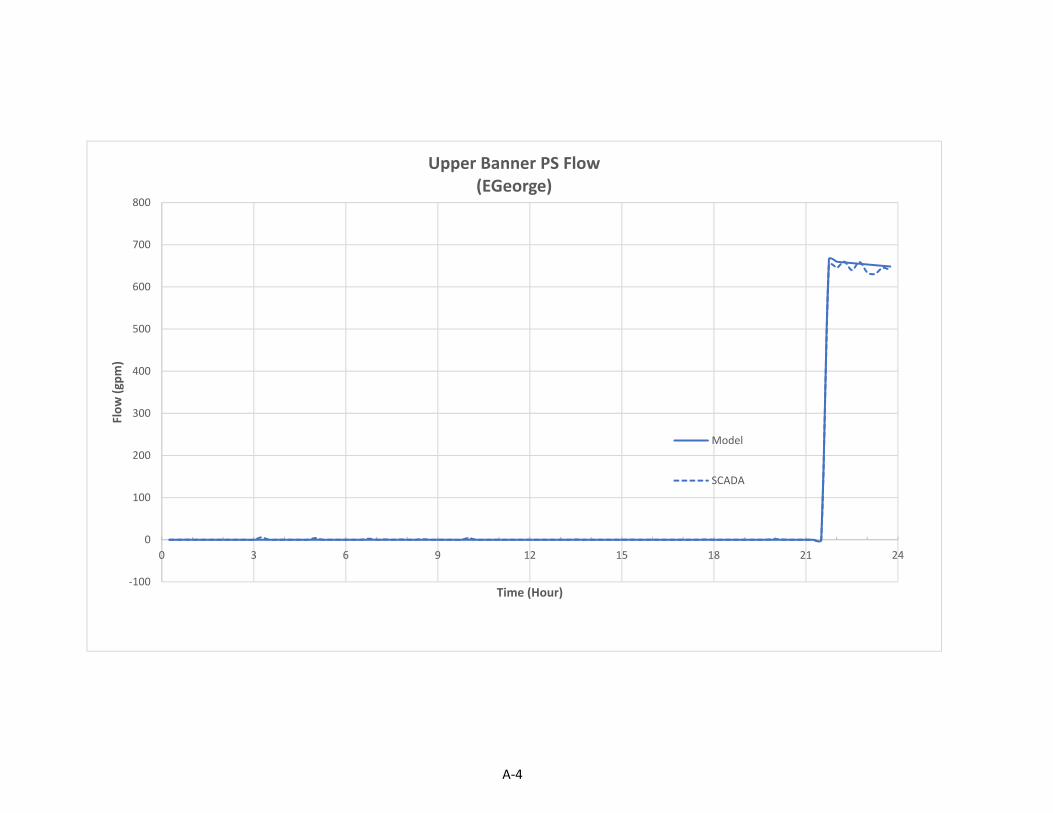
‐100
0
100
200
300
400
500
600
700
800
0 3 6 9 12 15 18 21 24
Flow (gp
m)
Time (Hour)
Upper Banner PS Flow(EGeorge)
Model
SCADA
A-4
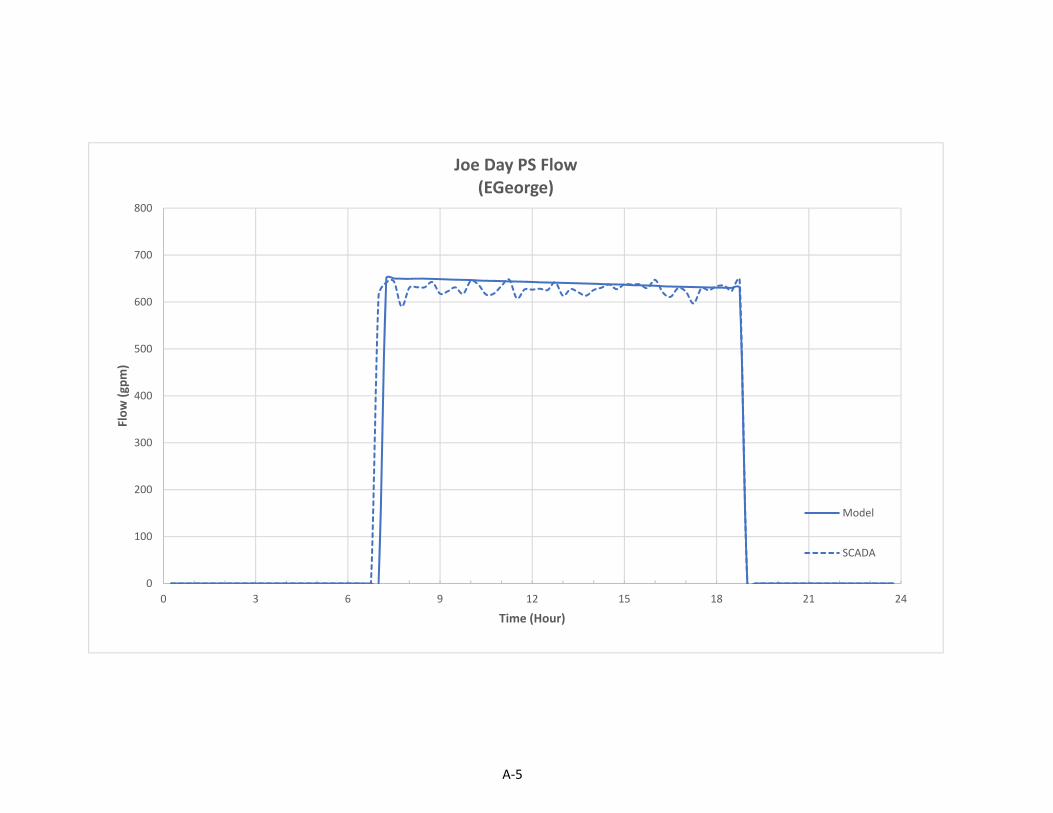
0
100
200
300
400
500
600
700
800
0 3 6 9 12 15 18 21 24
Flow (gp
m)
Time (Hour)
Joe Day PS Flow(EGeorge)
Model
SCADA
A-5
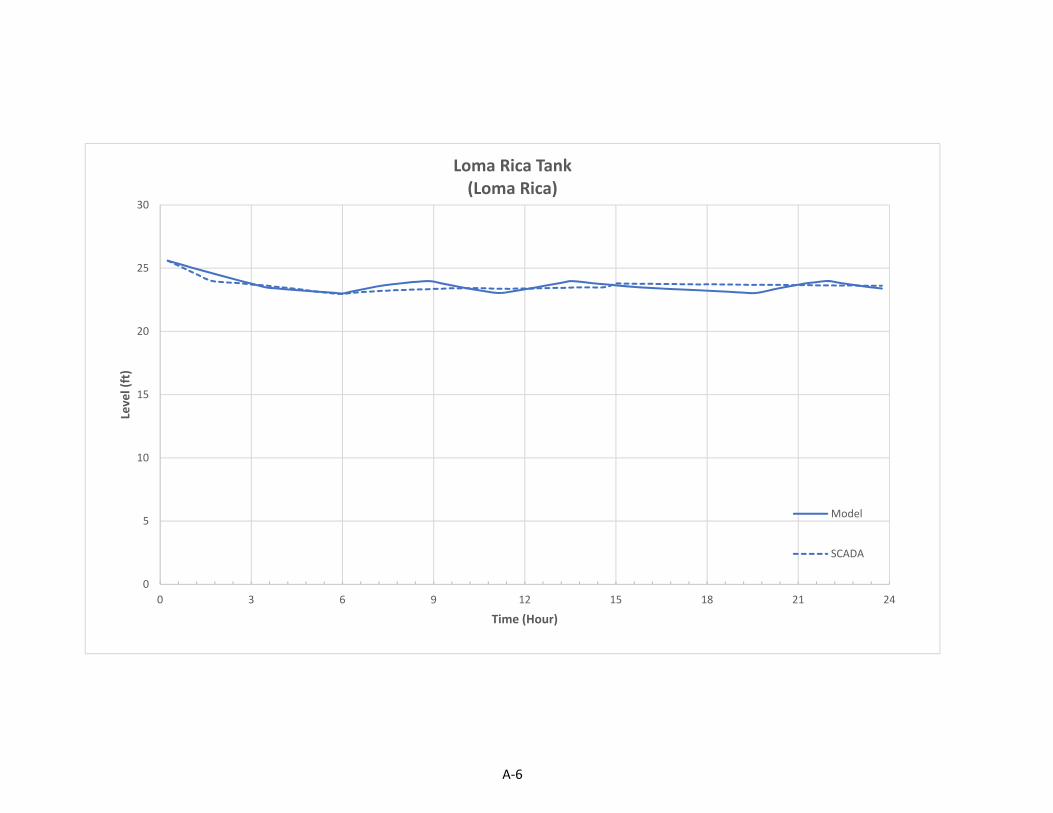
0
5
10
15
20
25
30
0 3 6 9 12 15 18 21 24
Leve
l (ft)
Time (Hour)
Loma Rica Tank(Loma Rica)
Model
SCADA
A-6
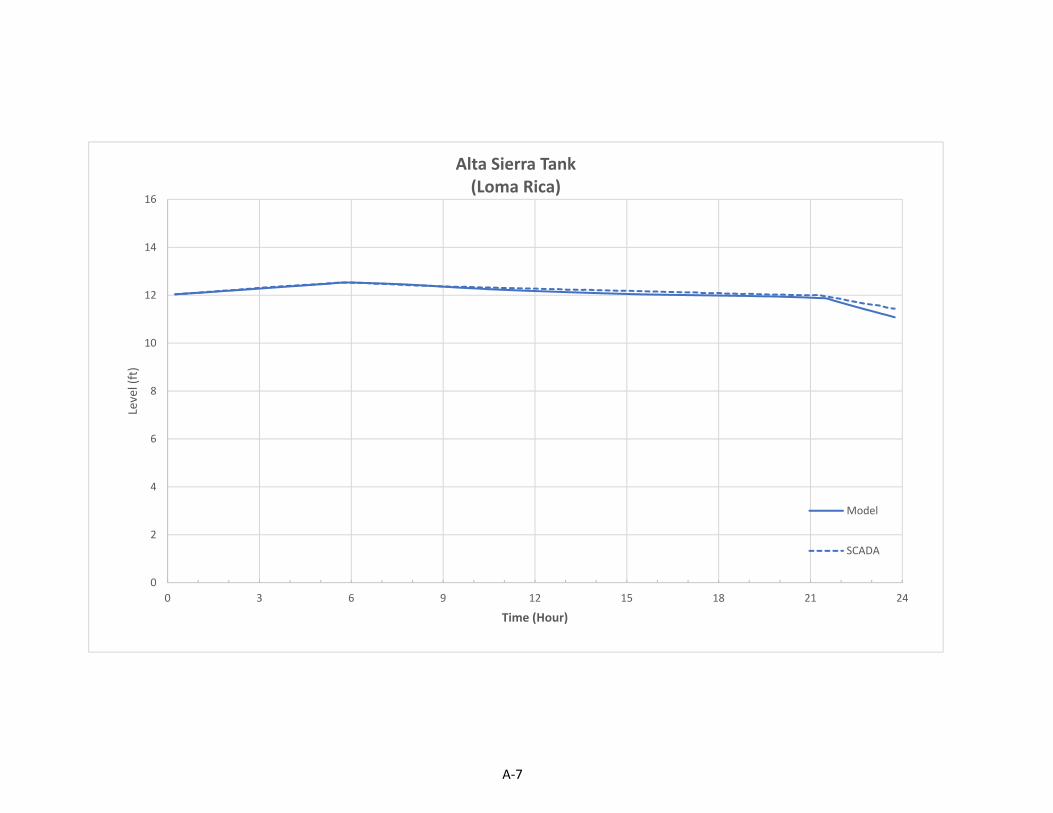
0
2
4
6
8
10
12
14
16
0 3 6 9 12 15 18 21 24
Level (ft)
Time (Hour)
Alta Sierra Tank(Loma Rica)
Model
SCADA
A-7
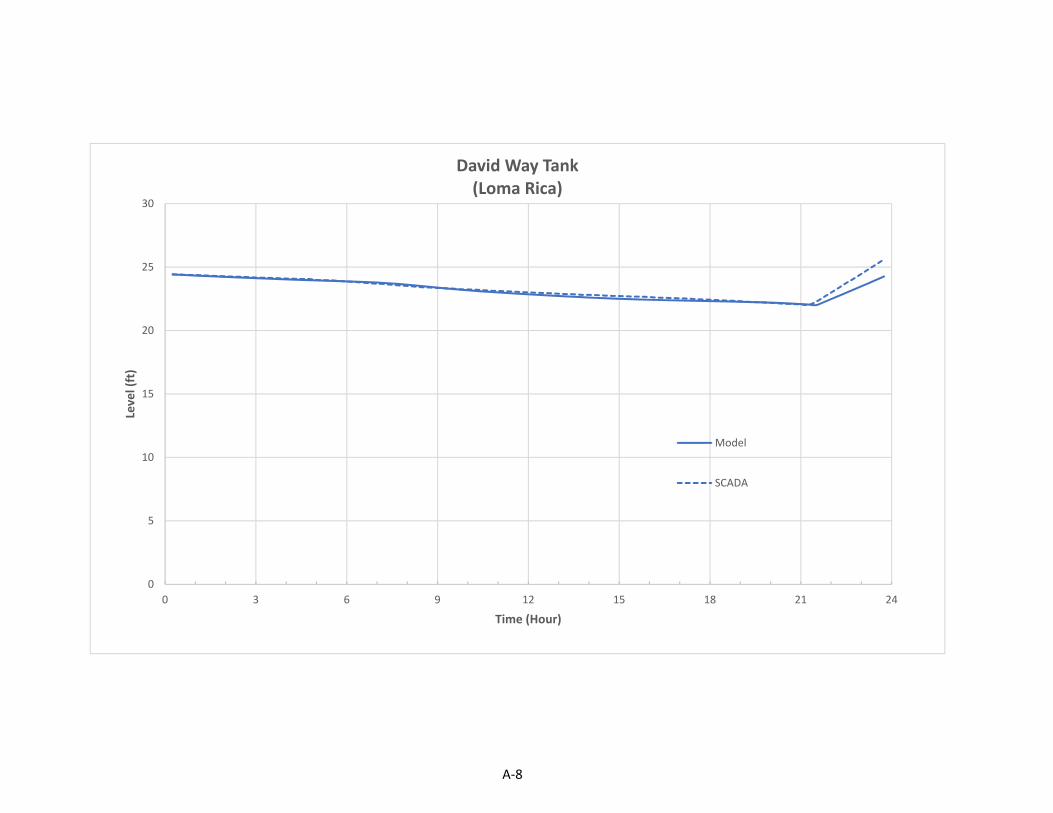
0
5
10
15
20
25
30
0 3 6 9 12 15 18 21 24
Leve
l (ft)
Time (Hour)
David Way Tank(Loma Rica)
Model
SCADA
A-8
Nevada Irrigation District Final Technical Memorandum EG/LR/CS Model Update and Calibration
Appendix B
Reservoirs EPS Percent Full Charts of Operational Scenarios Compared to the Baseline Scenario
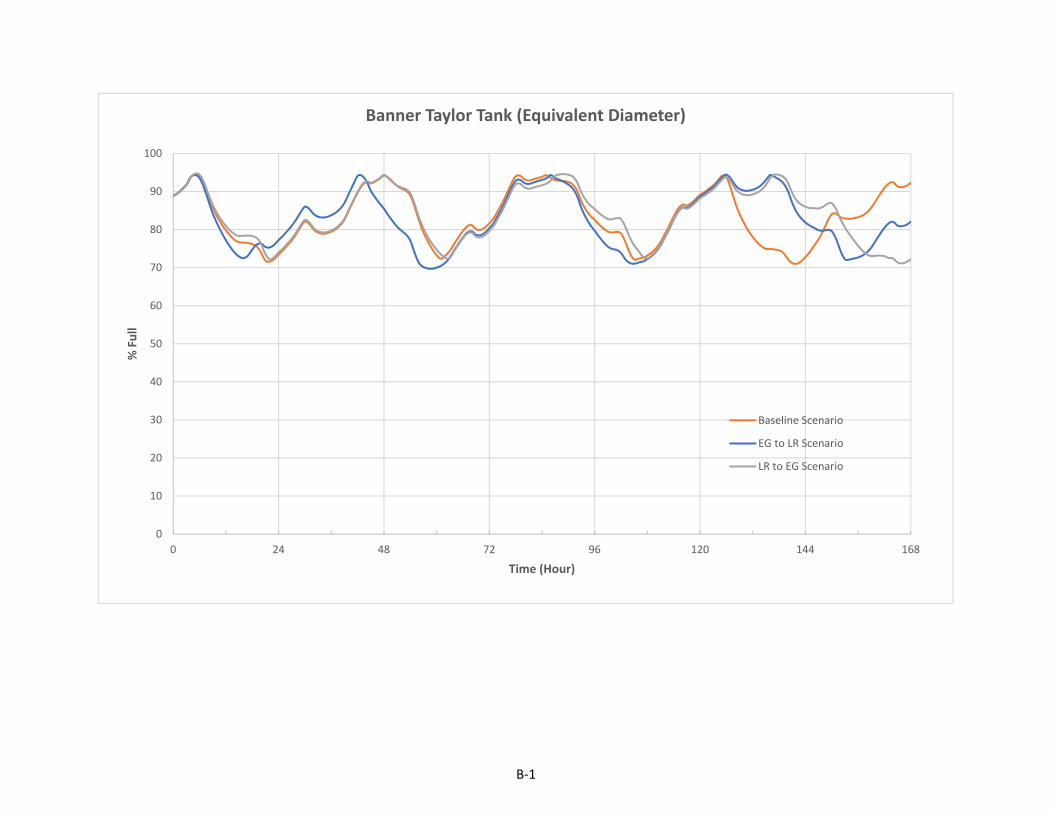
0
10
20
30
40
50
60
70
80
90
100
0 24 48 72 96 120 144 168
% Full
Time (Hour)
Banner Taylor Tank (Equivalent Diameter)
Baseline Scenario
EG to LR Scenario
LR to EG Scenario
B-1
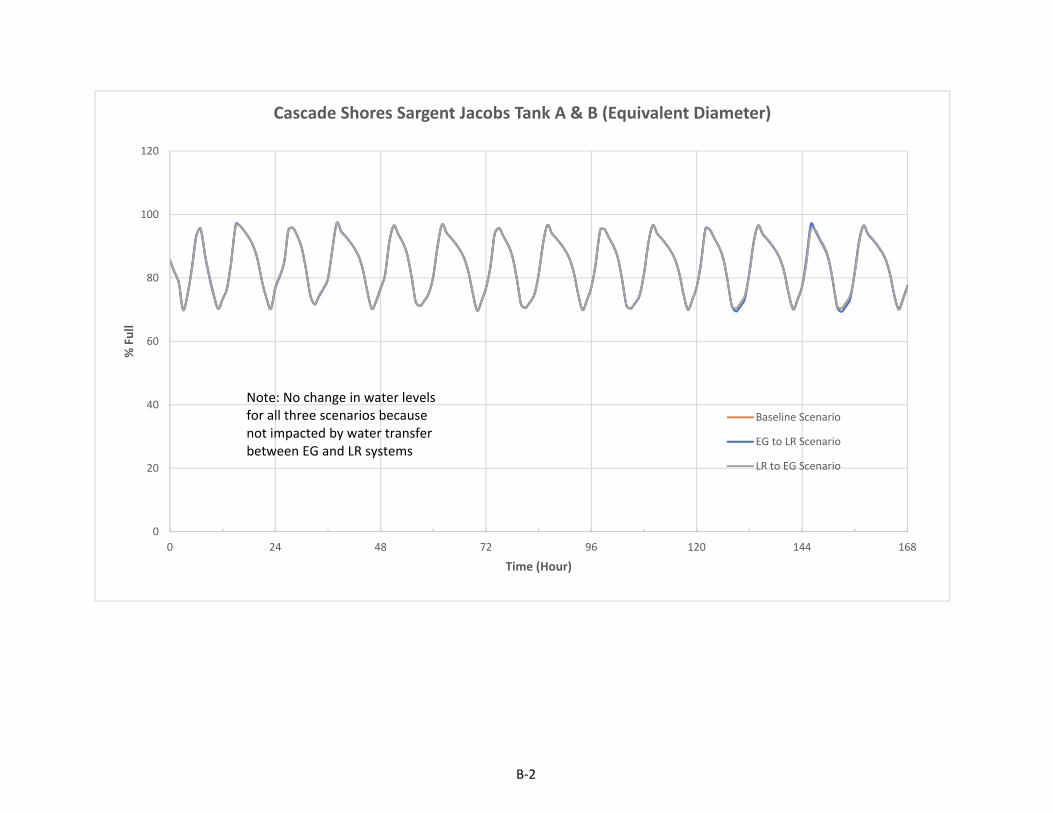
0
20
40
60
80
100
120
0 24 48 72 96 120 144 168
% Full
Time (Hour)
Cascade Shores Sargent Jacobs Tank A & B (Equivalent Diameter)
Baseline Scenario
EG to LR Scenario
LR to EG Scenario
Note: No change in water levelsfor all three scenarios because not impacted by water transfer between EG and LR systems
B-2
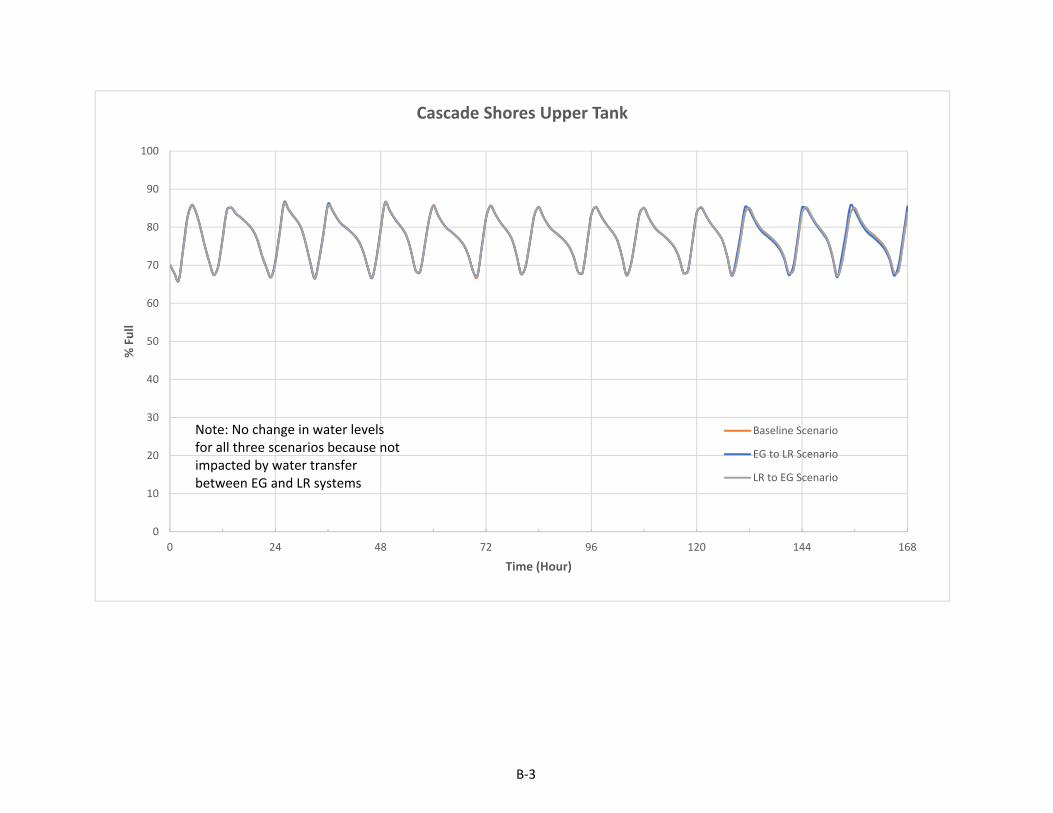
0
10
20
30
40
50
60
70
80
90
100
0 24 48 72 96 120 144 168
% Full
Time (Hour)
Cascade Shores Upper Tank
Baseline Scenario
EG to LR Scenario
LR to EG Scenario
Note: No change in water levelsfor all three scenarios because not impacted by water transfer between EG and LR systems
B-3
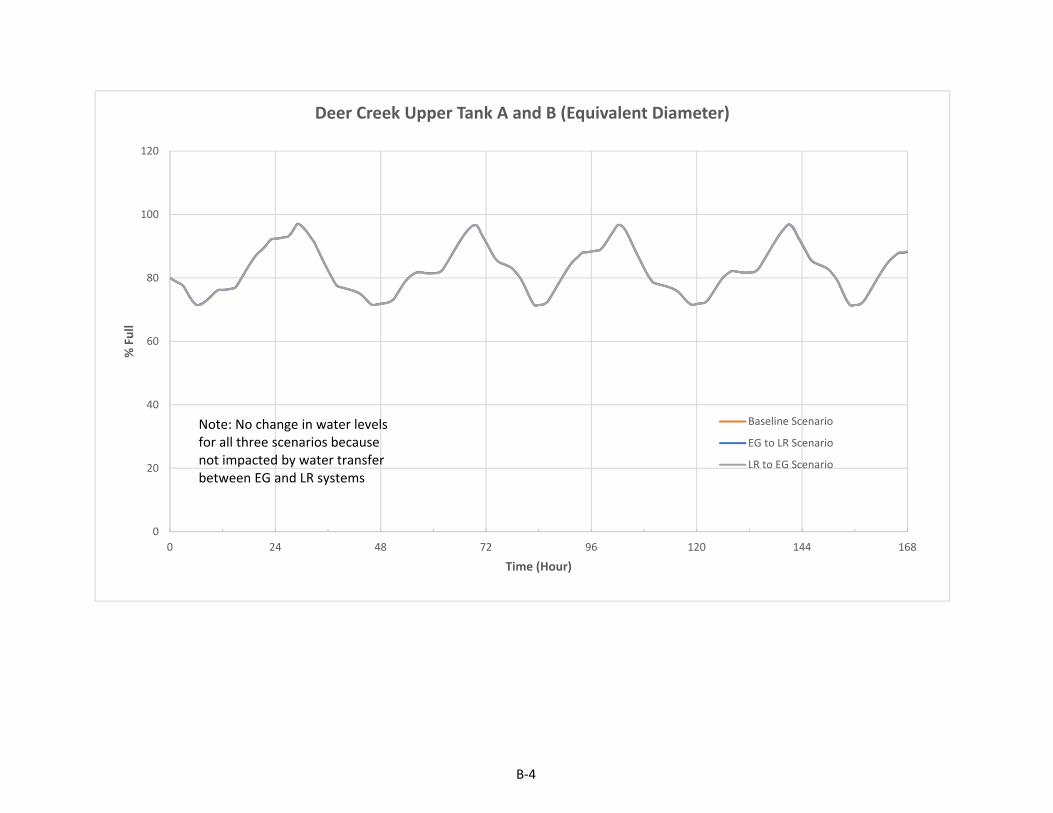
0
20
40
60
80
100
120
0 24 48 72 96 120 144 168
% Full
Time (Hour)
Deer Creek Upper Tank A and B (Equivalent Diameter)
Baseline Scenario
EG to LR Scenario
LR to EG Scenario
Note: No change in water levelsfor all three scenarios because not impacted by water transfer between EG and LR systems
B-4
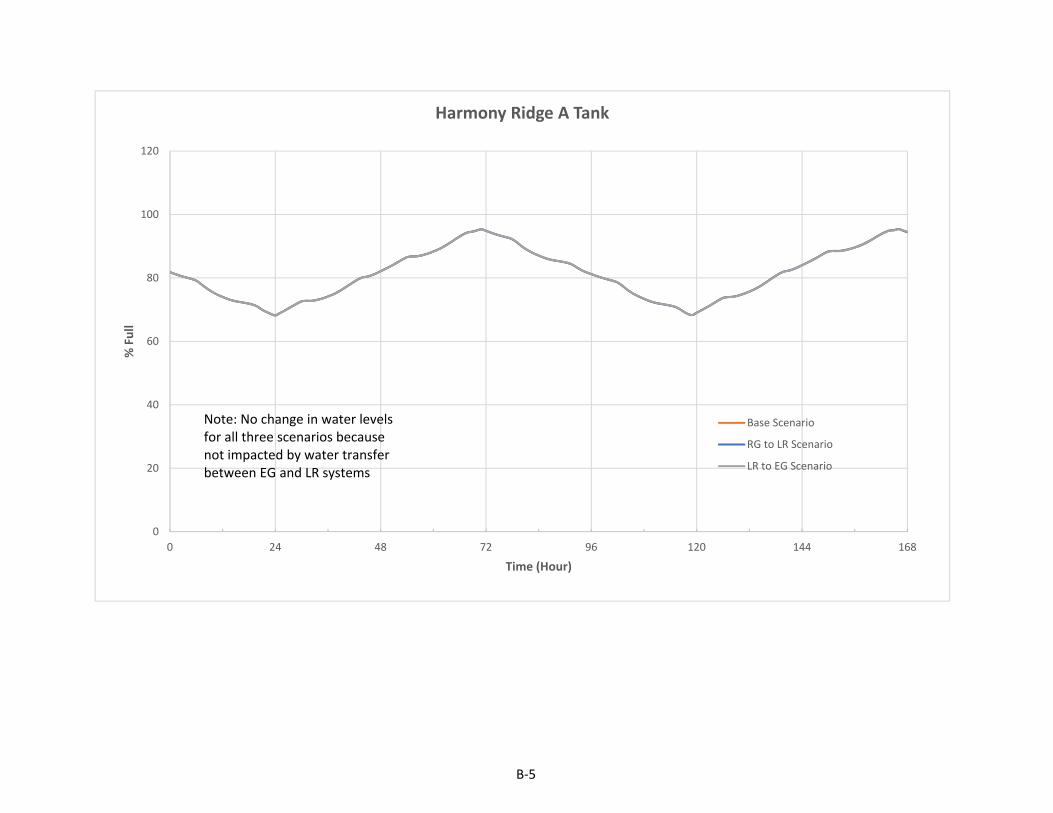
0
20
40
60
80
100
120
0 24 48 72 96 120 144 168
% Full
Time (Hour)
Harmony Ridge A Tank
Base Scenario
RG to LR Scenario
LR to EG Scenario
Note: No change in water levelsfor all three scenarios because not impacted by water transfer between EG and LR systems
B-5
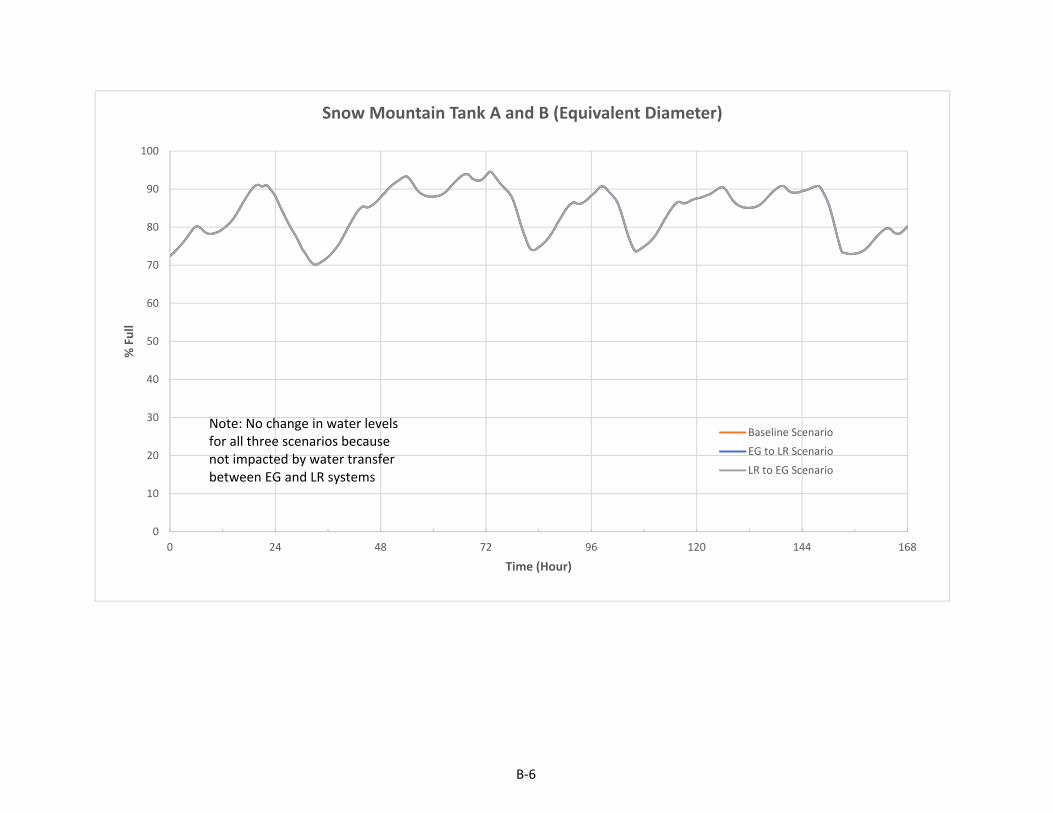
0
10
20
30
40
50
60
70
80
90
100
0 24 48 72 96 120 144 168
% Full
Time (Hour)
Snow Mountain Tank A and B (Equivalent Diameter)
Baseline Scenario
EG to LR Scenario
LR to EG Scenario
Note: No change in water levelsfor all three scenarios because not impacted by water transfer between EG and LR systems
B-6
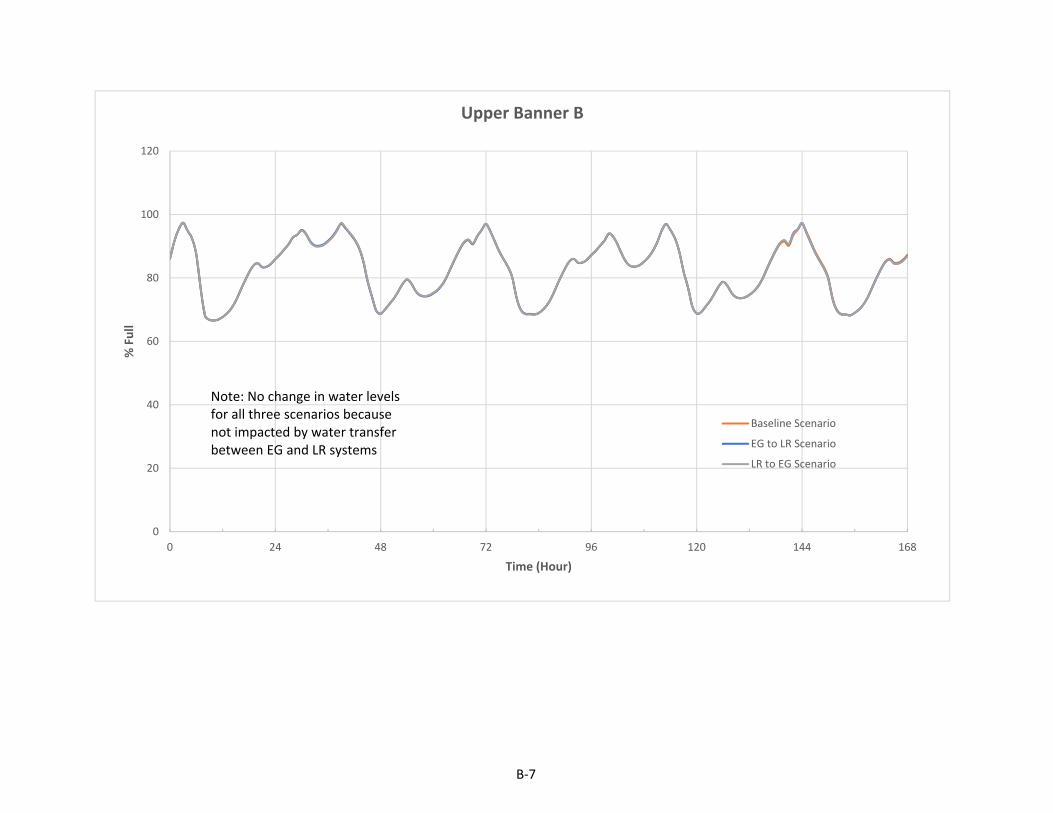
0
20
40
60
80
100
120
0 24 48 72 96 120 144 168
% Full
Time (Hour)
Upper Banner B
Baseline Scenario
EG to LR Scenario
LR to EG Scenario
Note: No change in water levelsfor all three scenarios because not impacted by water transfer between EG and LR systems
B-7
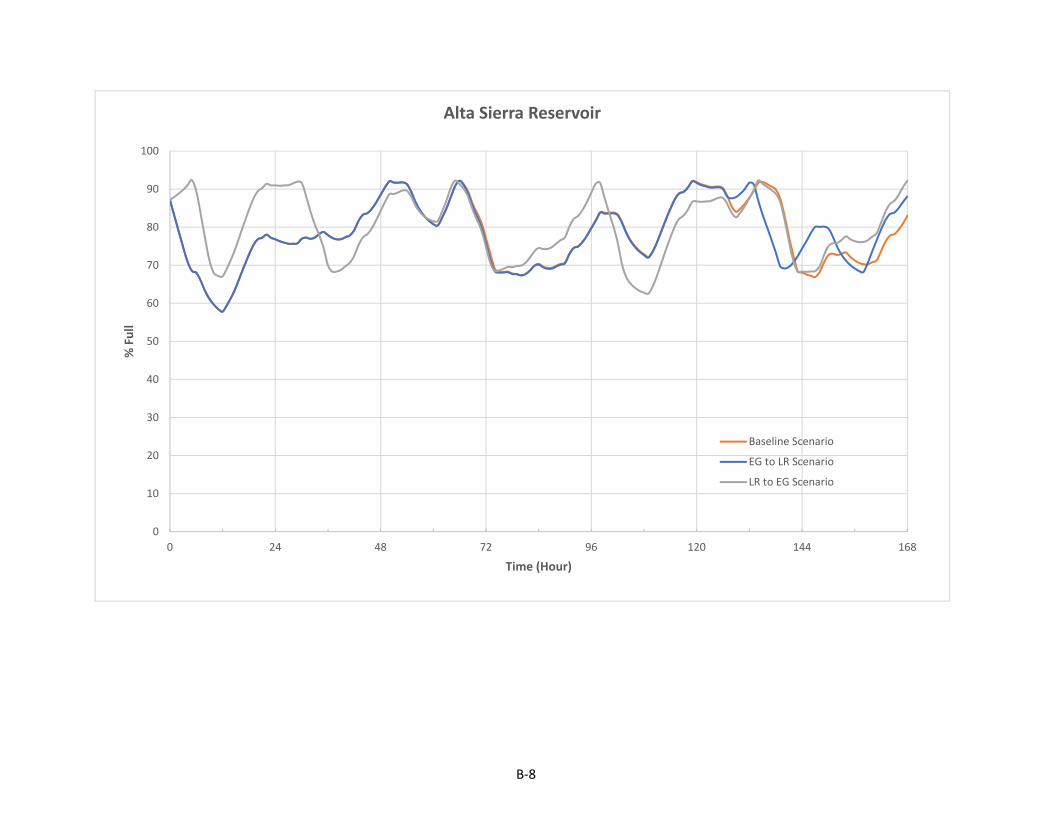
0
10
20
30
40
50
60
70
80
90
100
0 24 48 72 96 120 144 168
% Full
Time (Hour)
Alta Sierra Reservoir
Baseline Scenario
EG to LR Scenario
LR to EG Scenario
B-8
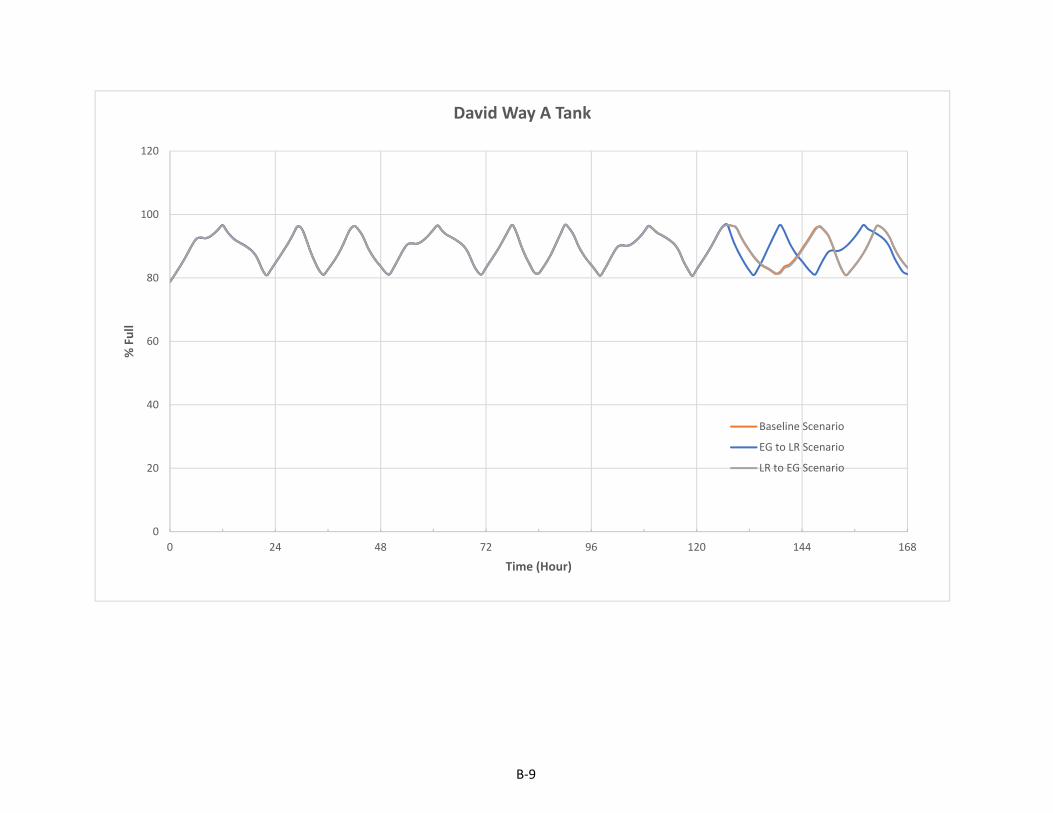
0
20
40
60
80
100
120
0 24 48 72 96 120 144 168
% Full
Time (Hour)
David Way A Tank
Baseline Scenario
EG to LR Scenario
LR to EG Scenario
B-9
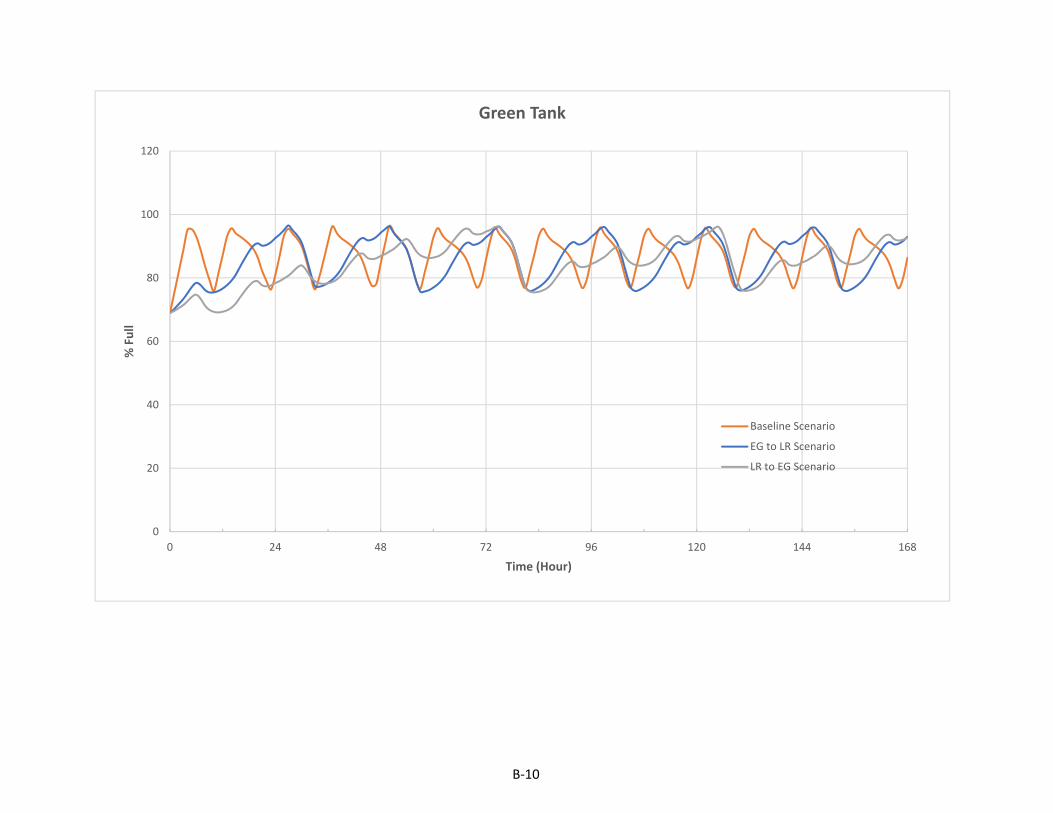
0
20
40
60
80
100
120
0 24 48 72 96 120 144 168
% Full
Time (Hour)
Green Tank
Baseline Scenario
EG to LR Scenario
LR to EG Scenario
B-10
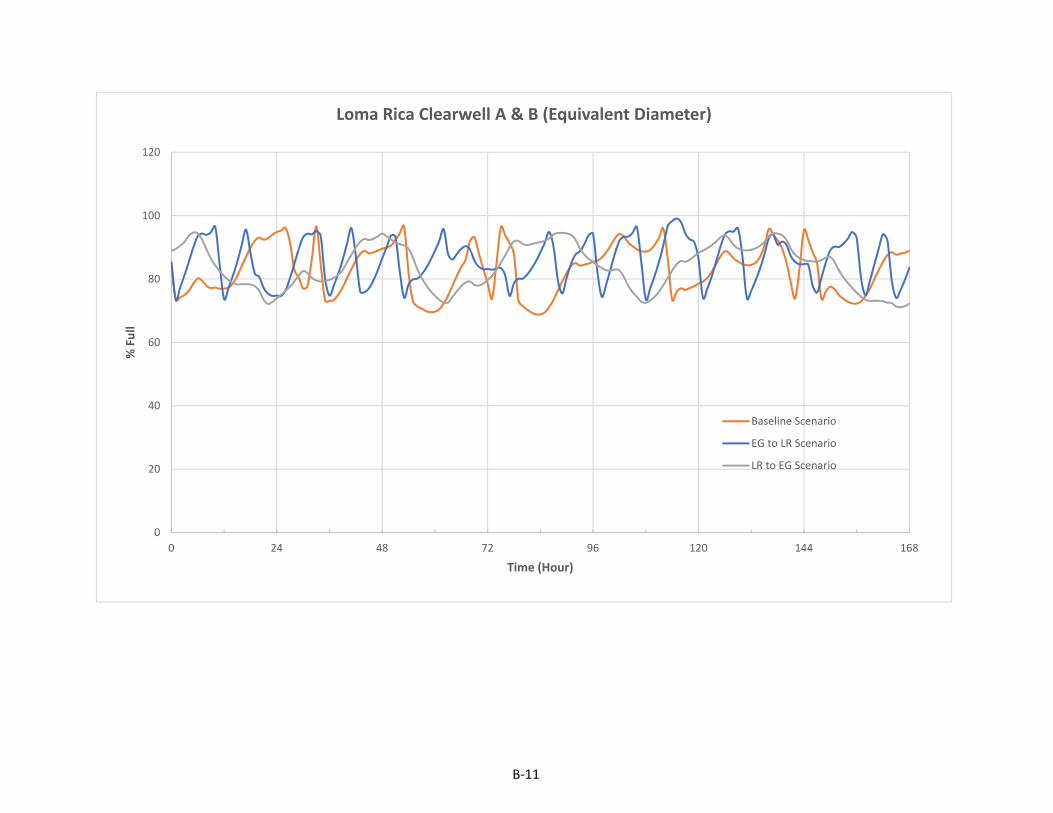
0
20
40
60
80
100
120
0 24 48 72 96 120 144 168
% Full
Time (Hour)
Loma Rica Clearwell A & B (Equivalent Diameter)
Baseline Scenario
EG to LR Scenario
LR to EG Scenario
B-11
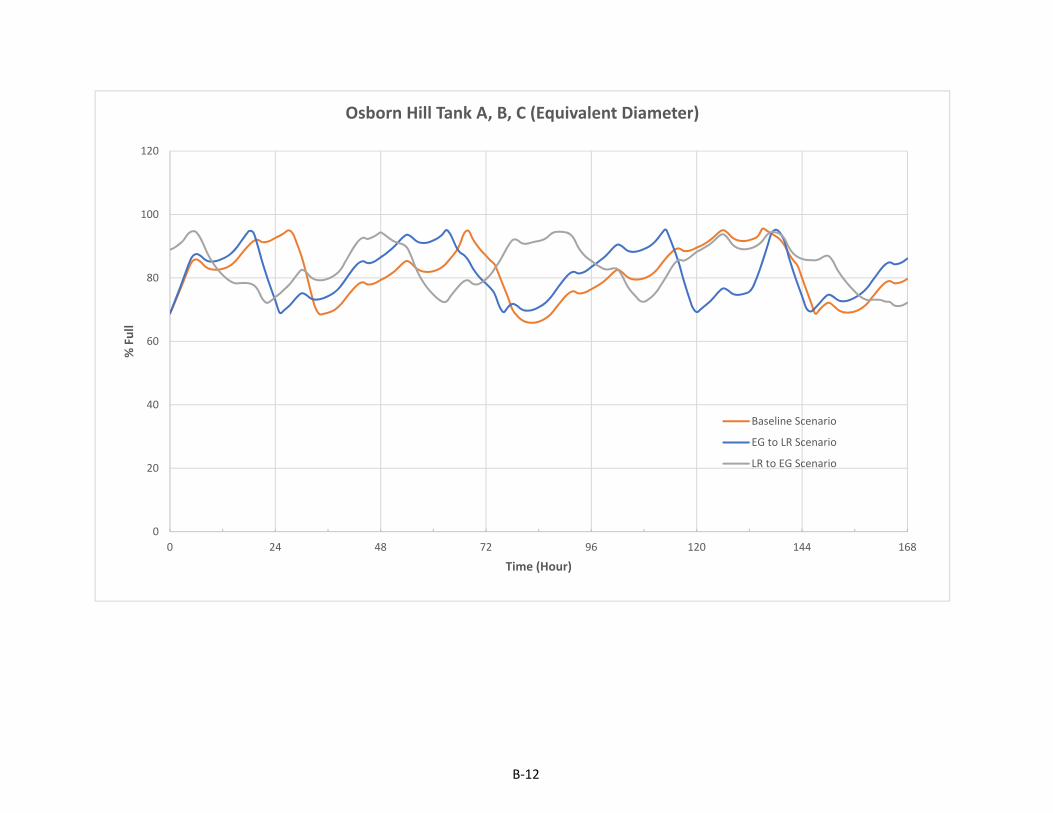
0
20
40
60
80
100
120
0 24 48 72 96 120 144 168
% Full
Time (Hour)
Osborn Hill Tank A, B, C (Equivalent Diameter)
Baseline Scenario
EG to LR Scenario
LR to EG Scenario
B-12