Embed Size (px)
Citation preview

8/6/2019 Tech Note #5
http://slidepdf.com/reader/full/tech-note-5 1/6Page 1 of 6 Quantitative Assessment of Surround Compatibility, 2011/05/11
Quantitative Assessment of Surround Compatibility
A completely new method of assessing downmix compatibility
has been developed by Qualis Audio. It yields quantitativemeasures and eliminates the need for users to interpret
graphical displays to assess program material. Its quantitative
nature allows pass/fail limits tests to be applied significantly
reducing the subjectivity previously involved in downmix
compatibility assessment. This document summarizes the
hazards in downmixing, prior methods of assessment and
describes the new approach invented by Qualis Audio. Its
practical implementation and the advantages are explained.
Introduction
The premier format for content production is surround. Whenmovies or prime-time television shows are produced today they
are usually mixed in surround. This provides the mix engineer
with the largest palette for creating artistic content. Most of the
effort is spent on making the surround presentation as good as
possible. However, when the production reaches the
consumer more than half of the viewers will reproduce it in
stereo or mono. Even in film there are theaters that do not
have proper surround playback facilities.
Unfortunately, what the stereo viewers hear will not necessarily
be what the surround equipped viewers hear. Surround mixes
are complex beasts, consisting of many audio feeds combined
into a coherent whole. These feeds may contain componentscommon to one another. If the feeds are independent (contain
no common information) they will retain their relative levels
after downmixing to stereo or mono. If the feeds contain any
common material, the relative levels after downmixing may
change. Level changes result when the common signals are
not in phase. Antiphase signals cancel when downmixed,
reducing level or disappearing completely. Mic-ing issues can
make a sound appear in two (or more) channels out of phase.
If this happens to an actor, dialog can become unintelligible,
viewers get upset.
Downmixing
Converting stereo programs to mono is generally done by
simply summing the two channels together.
M = L + R
To prevent the peak amplitude from exceeding that of the
original inputs the output is generally attenuated by 2 (-6 dB).
This is well accepted practice from the earliest days of stereo.
However, the conversion of surround programs to stereo
follows less uniform processes. Typically the LFE (low
frequency effects) channel is omitted from the downmix. The
remaining channels are mapped to the stereo pair based ontheir location in the surround mix. The left channels are
combined, the right channels are combined and the center
front (CF) is added to both the left and right channels.
For several reasons, the relative channel amplitudes are
changed when they are summed. The human auditory system
can separate sounds reproduced from different directions
even if they are at comparable levels. If these sounds are
reproduced from the same location masking effects will be
much larger. To enable the listener to understand the primary
content in the front channels the surrounds are attenuated
before summation. To maintain constant relative power when
the center front is reproduced from two speakers instead oone it is necessary to reduce its amplitude in each speaker.
Consequently downmixing 5.1 into 2.0 is typically done using
the following equations:
Lo = LF + 0.707 CF + 0.707 LS
Ro = RF + 0.707 CF + 0.707 RS
The factor of 0.707 represents a -3.0 dB attenuation of the
surrounds and center front. The overall gain of the stereo
channels is reduced by a factor of 1/(1+ 0.707 + 0.707) to keep
peaks from exceeding the system peak capacity. Though thecoefficients used above are the most common, others are
occasionally used.
In an effort to make downmixed programs compatible with thei
Pro-Logic decoders, Dolby championed an alternate
downmixing technique. It sums the surround channels into a
single mono surround which is then phase shifted by +/- 90
degrees and added to the stereo pair. Since the surround
content is oppositely phased in the stereo channels it is
possible to partially separate it from the remaining content and
send it to surround speakers on playback. The 90° phase
shifts reduce the likelihood of surround content cancelling with
that of the front channels. However, combining the surroundsinto a single channel makes any antiphase content disappea
in both stereo and mono reproduction. The antiphase
encoding (+90° - -90° = 180°) makes all surround conten
disappear in mono reproduction.
The pro-logic compatible downmix equations are:
S = LS + RS
Lt = LF + 0.707 CF + 0.707 S(+90°)
Rt = RF + 0.707 CF + 0.707 S(-90°)
#5
8/6/2019 Tech Note #5
http://slidepdf.com/reader/full/tech-note-5 2/6Page 2 of 6 Quantitative Assessment of Surround Compatibility, 2011/05/11
Dolby Digital and Dolby E metadata encodes downmix
coefficients to be used by the decoder when reproducing
surround content in stereo. Dolby E and the original Dolby
Digital format allowed three attenuation choices for surround
channels (0.707, 0.5 and 0), and three for the center front
channel (0.707, 0.596, 0,5) when the decoder was operating in
LoRo downmix mode. The metadata coefficients are ignored
in the LtRt mode, the decoder uses fixed 0.707 values instead.
The Dolby Digital Plus system (called Enhanced AC-3 in ATSC
A/52B) adds several more choices for downmix coefficients inmetadata and allows specification of LtRt downmix coefficients.
The coefficients may be specified independently for LoRo and
LtRt methods. The center downmix coefficient is allowed to
increase beyond -3 dB, up to as much as 3 dB of gain. This
allows dialog level to be increased above the content in the left
and right channels in an effort to improve intelligibility. The
surround downmix gain is given more resolution, allowing a
better balance between surround content being audible vs
interfering with intelligibility of content in the left and right
channels. The allowable downmix coefficients are shown in
the table below.
Allowable values for Center Mix Level
Values for Surround Mix Level
Gain 1.414 1.189 1.000 0.841 0.707 0.595 0.500 0.000
dB +3.0 +1.5 0.0 –1.5 –3.0 –4.5 –6.0 –inf
Phase Shift and Signal Cancellation
It is easy to calculate the level reduction
which occurs when two sinewaves of
differing phase are summed. The table at
right gives the loss vs the interchannel
phase. For example, a 160° phase
difference causes a 15 dB level reduction
compared to the in-phase case. Note thatalthough it takes a substantial phase shift
(90°) to get 3 dB of cancellation, larger loss
comes with progressively smaller additional
shifts.
There is a serious problem in implementing
an assessment system based on phase.
How is it to be measured? Measuring phase
is easy with sinewaves; they are simple and
consistent. Program material is far more
complex and transient in nature. Sinewave
measurements are generally performed with
an oscilloscope or meter. Both have serious limitations when
measuring complex dynamic signals like those arising in
program material.
Brief Review of Compatibility Assessment
The conversion of surround to stereo or of stereo to mono
involves combining channels together, algebraically summing
their waveforms. Antiphase signals will cancel when
combined, diminishing in level or disappearing completely.
This can happen when individual channels are accidently
inverted. However, the more insidious situation occurs when
just one component in a surround mix appears in multipl
channels but shifted in phase. This can easily happen when a
single source is picked up by multiple non-coinciden
microphones. When the outputs of these microphones are
combined there will be cancellations and the signal level will be
reduced. If this happens to an actor’s voice, dialog can
become unintelligible and viewers, sponsors and producers ge
very upset.
Stereo to mono compatibility
was traditionally monitoredwith a Lissajous display.
Implementation was simple,
the left and right channels
drive the vertical and
horizontal deflection of an
oscilloscope. The display was
preferably rotated counter-
clockwise by 45°. The
resulting display gives an
indication of average phase
relationships between the channels. A representative image is
shown in the figure.
Interpretation of such a display is moderately simple, a line o
ellipse tilted to the right is ok, a round fuzzy ball is generally
good and a line or ellipse tilted to the left is bad. Experience
and knowledge of audio mixing concepts, is required to
understand the characteristic shapes and spot the signs o
trouble. This also presumes the user is actually watching the
display when problems occur.
The size of a basic Lissajous display will change directly with
the signal amplitudes. A 2-channel automatic gain control with
a ganged control signal is often added ahead of the display to
make the image clearly visible independent of signa
amplitude.
Due to display space limitations or user demands for a simpler
display, correlation and phase meters have become a common
alternative to Lissajous displays. Correlation meters multiply
the left and right signals together and perform a short-term
running average of the result. Phase meters convert each
channel to a logic waveform using a simple zero-crossing
detector and drive the inputs of a set-reset flip-flop or an XOR
gate. Again, a short-term running average is performed. Thei
advantage is simplicity of interpretation, a positive value is
good, a negative value is bad. Unfortunately, the distillation o
information into a single number further hides important detaiand prevents problems being discovered.
Now consider the case of surround program monitoring using
Lissajous or correlation displays. The first problem in
monitoring surround audio compatibility with correlation o
Lissajous displays is the sheer number of channel pairs
involved. Ignoring the LFE channel, a 5.1 program contains 10
channel pairs. Many commercial products only analyze
neighboring pairs, others add the LF/RF channel pair. Even
with this simplification there are 5 or 6 channel pairs to display.
Loss Phase
(dB) (deg)
0 0
1 54
2 75
3 90
4 1025 112
6 120
7 127
8 133
9 138
10 143
11 147
12 151
13 154
14 157
15 160
20 169
Lissajous Display
8/6/2019 Tech Note #5
http://slidepdf.com/reader/full/tech-note-5 3/6Page 3 of 6 Quantitative Assessment of Surround Compatibility, 2011/05/11
The challenge facing the user is watching so many correlation
meters or Lissajous patterns at the same time. With one
exception, vendors of such tools have used various schemes
to pack these displays onto a single XY display. All of these
schemes take advantage of the redundancy evident in the four
quadrants of the Lissajous display. Since the lower halves
offer no additional information compared to the upper halves,
the display may be truncated or folded at the horizontal axis.
Packing 5 or more of these now truncated displays into a
single picture is where the inventive differences between
competing displays occur. Some manufacturers use color to
get the additional dimensionality required, others use
geometric transformations, and some use both.
Problems with Lissajous displays and phase meters
Lissajous displays show all signal components together. A
stereo tone at 45° interchannel phase makes an ellipse. A
stereo tone at 0° mixed with a different stereo tone at 180°
makes a shifting ellipse. With real content everything is always
moving. This makes discriminating between these two cases
difficult and requires considerable experience.
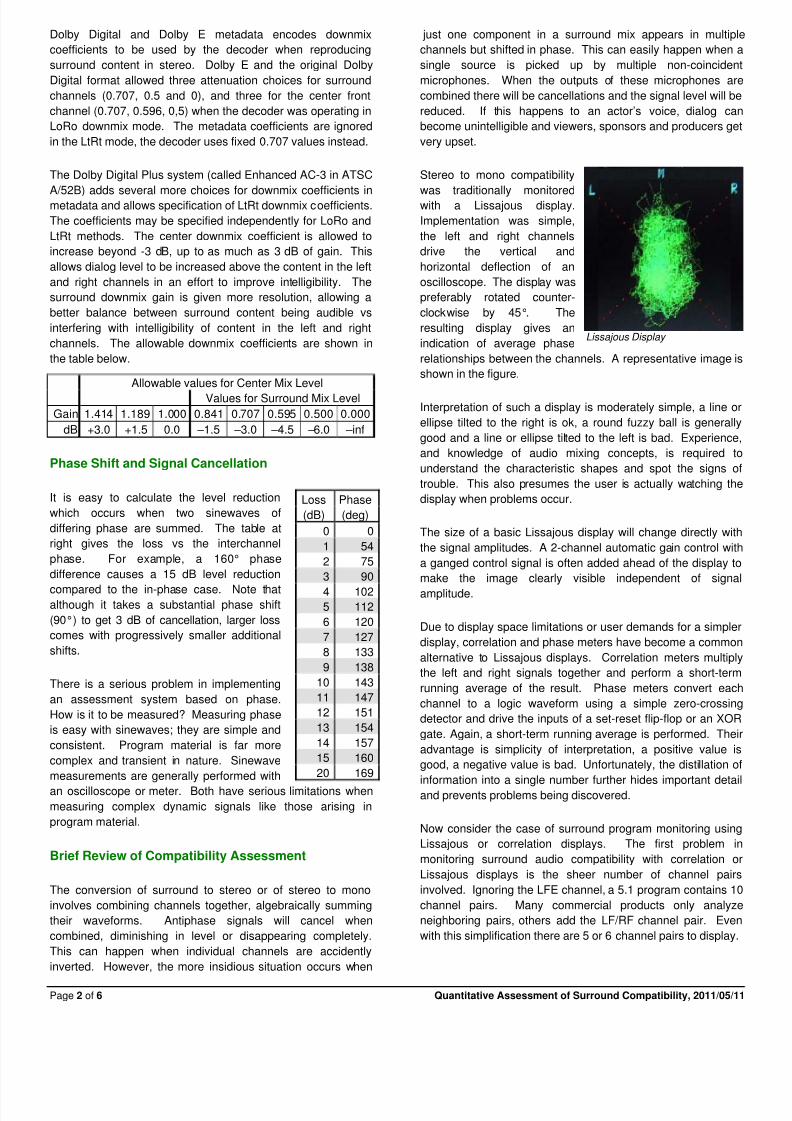
Consider the case illustrated in the figure below. The stereo
mix contains two properly phased elements: dialog from an
actress (shown in blue) and music (shown in green). The mix
also contains dialog from an actor, mixed in anti-phase (shown
in brown). A Lissajous display shows the vector sum of these
individual waveforms which, due to the preponderance of
properly phased material, will imply a compatible mix.
However, when this material is reproduced in mono the actors
dialog will disappear.
Limitations of Lissajous Displays
Phase and correlation meter approaches hide this even further.
The single number descriptor hides the subtle clues that give
an experience user an idea something may be wrong.
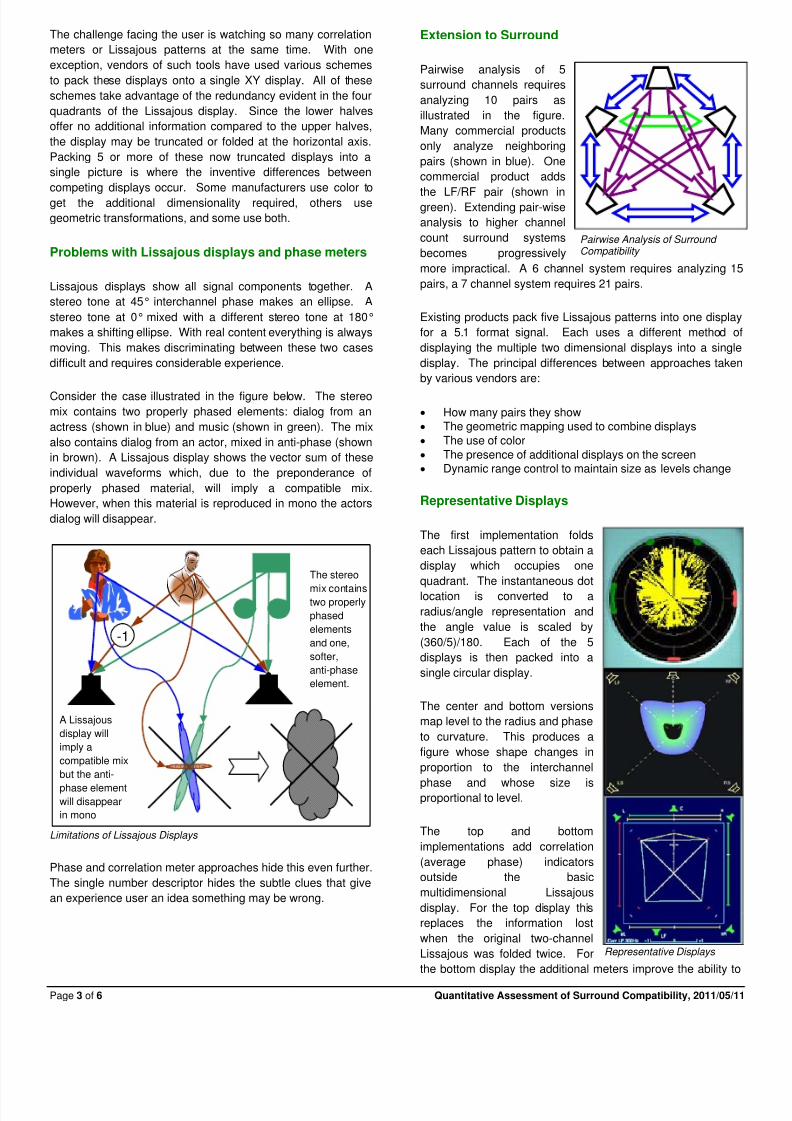
Extension to Surround
Pairwise analysis of 5
surround channels requires
analyzing 10 pairs as
illustrated in the figure.
Many commercial products
only analyze neighboring
pairs (shown in blue). One
commercial product adds
the LF/RF pair (shown ingreen). Extending pair-wise
analysis to higher channel
count surround systems
becomes progressively
more impractical. A 6 channel system requires analyzing 15
pairs, a 7 channel system requires 21 pairs.
Existing products pack five Lissajous patterns into one display
for a 5.1 format signal. Each uses a different method o
displaying the multiple two dimensional displays into a single
display. The principal differences between approaches taken
by various vendors are:
• How many pairs they show
• The geometric mapping used to combine displays
• The use of color
• The presence of additional displays on the screen
• Dynamic range control to maintain size as levels change
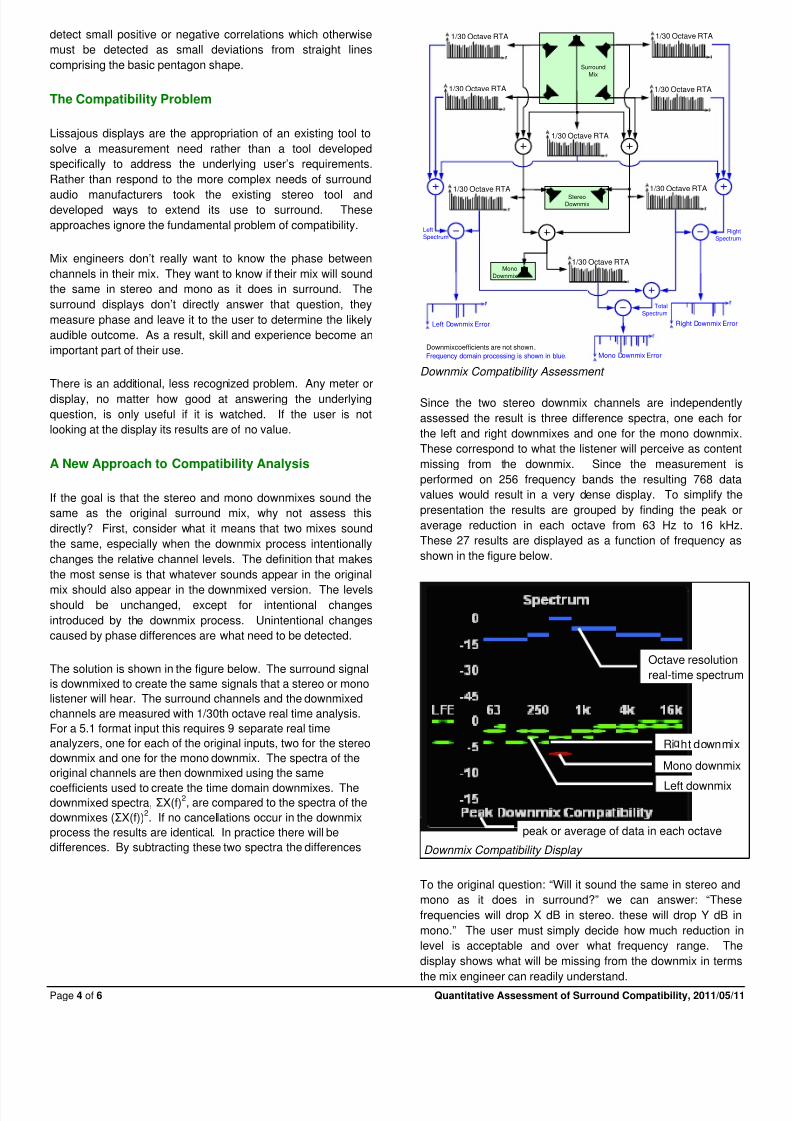
Representative Displays
The first implementation folds
each Lissajous pattern to obtain a
display which occupies one
quadrant. The instantaneous dot
location is converted to a
radius/angle representation and
the angle value is scaled by
(360/5)/180. Each of the 5
displays is then packed into a
single circular display.
The center and bottom versions
map level to the radius and phase
to curvature. This produces a
figure whose shape changes in
proportion to the interchannel
phase and whose size isproportional to level.
The top and bottom
implementations add correlation
(average phase) indicators
outside the basic
multidimensional Lissajous
display. For the top display this
replaces the information lost
when the original two-channel
Lissajous was folded twice. For
the bottom display the additional meters improve the ability to
Pairwise Analysis of Surround Compatibility
Representative Displays
-1
A Lissajous
display will
imply a
compatible mix
but the anti-
phase elementwill disappear
in mono.
The stereo
mix containstwo properly
phased
elements
and one,
softer,
anti-phase
element.
8/6/2019 Tech Note #5
http://slidepdf.com/reader/full/tech-note-5 4/6Page 4 of 6 Quantitative Assessment of Surround Compatibility, 2011/05/11
detect small positive or negative correlations which otherwise
must be detected as small deviations from straight lines
comprising the basic pentagon shape.
The Compatibility Problem
Lissajous displays are the appropriation of an existing tool to
solve a measurement need rather than a tool developed
specifically to address the underlying user’s requirements.
Rather than respond to the more complex needs of surround
audio manufacturers took the existing stereo tool anddeveloped ways to extend its use to surround. These
approaches ignore the fundamental problem of compatibility.
Mix engineers don’t really want to know the phase between
channels in their mix. They want to know if their mix will sound
the same in stereo and mono as it does in surround. The
surround displays don’t directly answer that question, they
measure phase and leave it to the user to determine the likely
audible outcome. As a result, skill and experience become an
important part of their use.
There is an additional, less recognized problem. Any meter or
display, no matter how good at answering the underlying
question, is only useful if it is watched. If the user is not
looking at the display its results are of no value.
A New Approach to Compatibility Analysis
If the goal is that the stereo and mono downmixes sound the
same as the original surround mix, why not assess this
directly? First, consider what it means that two mixes sound
the same, especially when the downmix process intentionally
changes the relative channel levels. The definition that makes
the most sense is that whatever sounds appear in the original
mix should also appear in the downmixed version. The levelsshould be unchanged, except for intentional changes
introduced by the downmix process. Unintentional changes
caused by phase differences are what need to be detected.
The solution is shown in the figure below. The surround signal
is downmixed to create the same signals that a stereo or mono
listener will hear. The surround channels and the downmixed
channels are measured with 1/30th octave real time analysis.
For a 5.1 format input this requires 9 separate real time
analyzers, one for each of the original inputs, two for the stereo
downmix and one for the mono downmix. The spectra of the
original channels are then downmixed using the same
coefficients used to create the time domain downmixes. Thedownmixed spectra, ΣX(f)
2, are compared to the spectra of the
downmixes (ΣX(f))2. If no cancellations occur in the downmix
process the results are identical. In practice there will be
differences. By subtracting these two spectra the differences
1/30 Octave RTA
Surround
Mix
1/30 Octave RTA
1/30 Octave RTA
1/30 Octave RTA1/30 Octave RTA
StereoDownmix
Mono
Downmix
Left Downmix Error
Mono Downmix Error
Right Downmix Error
1/30 Octave RTA
1/30 Octave RTA1/30 Octave RTA
Downmixcoefficients are not shown.Frequency domain processing is shown in blue.
LeftSpectrum
RightSpectrum
Total
Spectrum
Downmix Compatibility Assessment
Since the two stereo downmix channels are independently
assessed the result is three difference spectra, one each for
the left and right downmixes and one for the mono downmix
These correspond to what the listener will perceive as conten
missing from the downmix. Since the measurement is
performed on 256 frequency bands the resulting 768 data
values would result in a very dense display. To simplify the
presentation the results are grouped by finding the peak o
average reduction in each octave from 63 Hz to 16 kHz
These 27 results are displayed as a function of frequency as
shown in the figure below.
To the original question: “Will it sound the same in stereo and
mono as it does in surround?” we can answer: “These
frequencies will drop X dB in stereo. these will drop Y dB in
mono.” The user must simply decide how much reduction in
level is acceptable and over what frequency range. The
display shows what will be missing from the downmix in terms
the mix engineer can readily understand.
Octave resolution
real-time spectrum
Ri ht downmix
Mono downmix
peak or average of data in each octave
Left downmix
Downmix Compatibility Display
8/6/2019 Tech Note #5
http://slidepdf.com/reader/full/tech-note-5 5/6Page 5 of 6 Quantitative Assessment of Surround Compatibility, 2011/05/11
LFE Channel Issues
The system as implemented also assesses a largely
unrecognized problem in surround reproduction involving the
LFE channel. With the notable exception of cinemas, spaces
used to reproduce surround sound are small enough that the
surround and LFE channels sum linearly at the listening
location. The assumption of power summation is not valid at
the distances and frequencies involved.
Consequently, phasing issues between the LFE and thesurround channels will have a serious impact on low frequency
reproduction. If the LFE includes content which is present in
the surround channels its loudness when reproduced will
depend on the relative phases. It is possible for cancellations
to occur, resulting in reduced bass content when monitored in
surround. The tendency will be for the mix engineer to
increase the low frequency content to obtain the desired
balance.
Since stereo and mono downmixing excludes the LFE the
cancellation will not occur and the listener will perceive
excessive bass.
To warn of the potential for this to occur the system described
above also compares the spectrum of the mono downmix plus
the LFE with the sum of the spectra of these channels. If
cancellations occur when the LFE is included they are
displayed on a separate bar at the extreme left of the downmix
compatibility display.
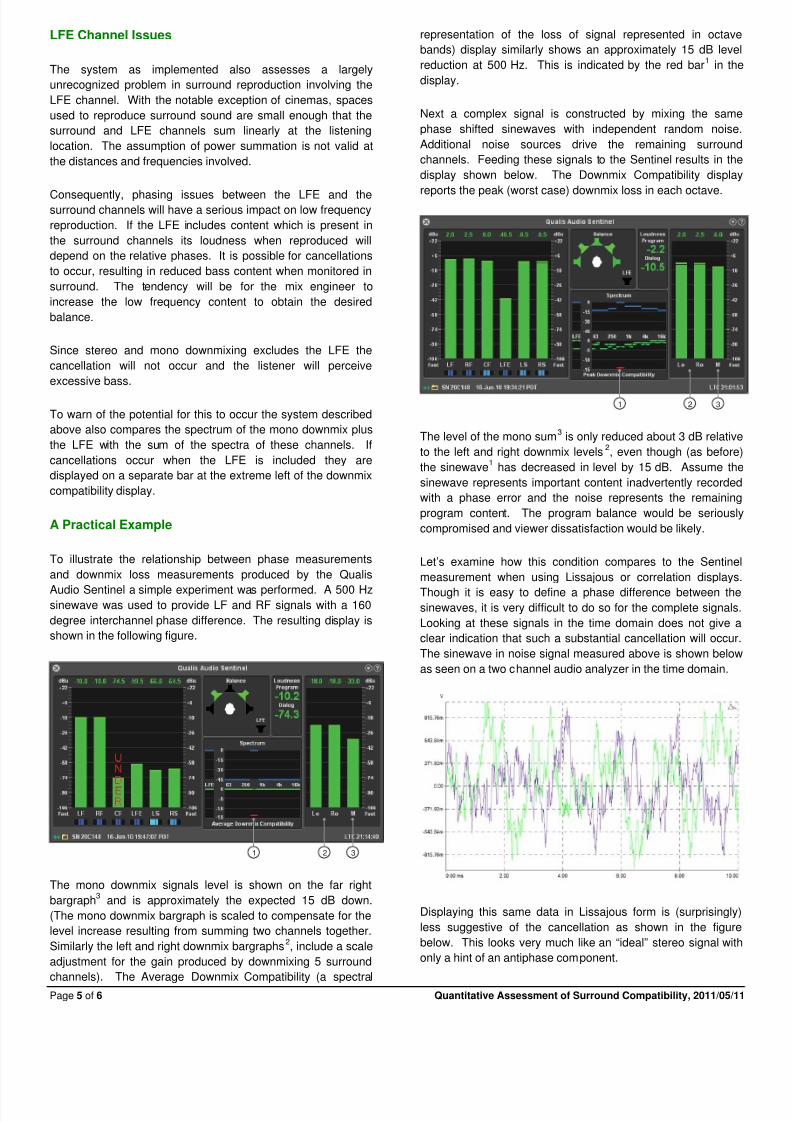
A Practical Example
To illustrate the relationship between phase measurements
and downmix loss measurements produced by the Qualis
Audio Sentinel a simple experiment was performed. A 500 Hzsinewave was used to provide LF and RF signals with a 160
degree interchannel phase difference. The resulting display is
shown in the following figure.
1 2 3
The mono downmix signals level is shown on the far right
bargraph3
and is approximately the expected 15 dB down.
(The mono downmix bargraph is scaled to compensate for the
level increase resulting from summing two channels together.
Similarly the left and right downmix bargraphs2, include a scale
adjustment for the gain produced by downmixing 5 surround
channels). The Average Downmix Compatibility (a spectral
representation of the loss of signal represented in octave
bands) display similarly shows an approximately 15 dB leve
reduction at 500 Hz. This is indicated by the red bar1
in the
display.
Next a complex signal is constructed by mixing the same
phase shifted sinewaves with independent random noise
Additional noise sources drive the remaining surround
channels. Feeding these signals to the Sentinel results in the
display shown below. The Downmix Compatibility display
reports the peak (worst case) downmix loss in each octave.
1 2 3
The level of the mono sum3
is only reduced about 3 dB relative
to the left and right downmix levels2, even though (as before
the sinewave1
has decreased in level by 15 dB. Assume the
sinewave represents important content inadvertently recorded
with a phase error and the noise represents the remaining
program content. The program balance would be seriously
compromised and viewer dissatisfaction would be likely.
Let’s examine how this condition compares to the Sentine
measurement when using Lissajous or correlation displays
Though it is easy to define a phase difference between thesinewaves, it is very difficult to do so for the complete signals
Looking at these signals in the time domain does not give a
clear indication that such a substantial cancellation will occur
The sinewave in noise signal measured above is shown below
as seen on a two channel audio analyzer in the time domain.
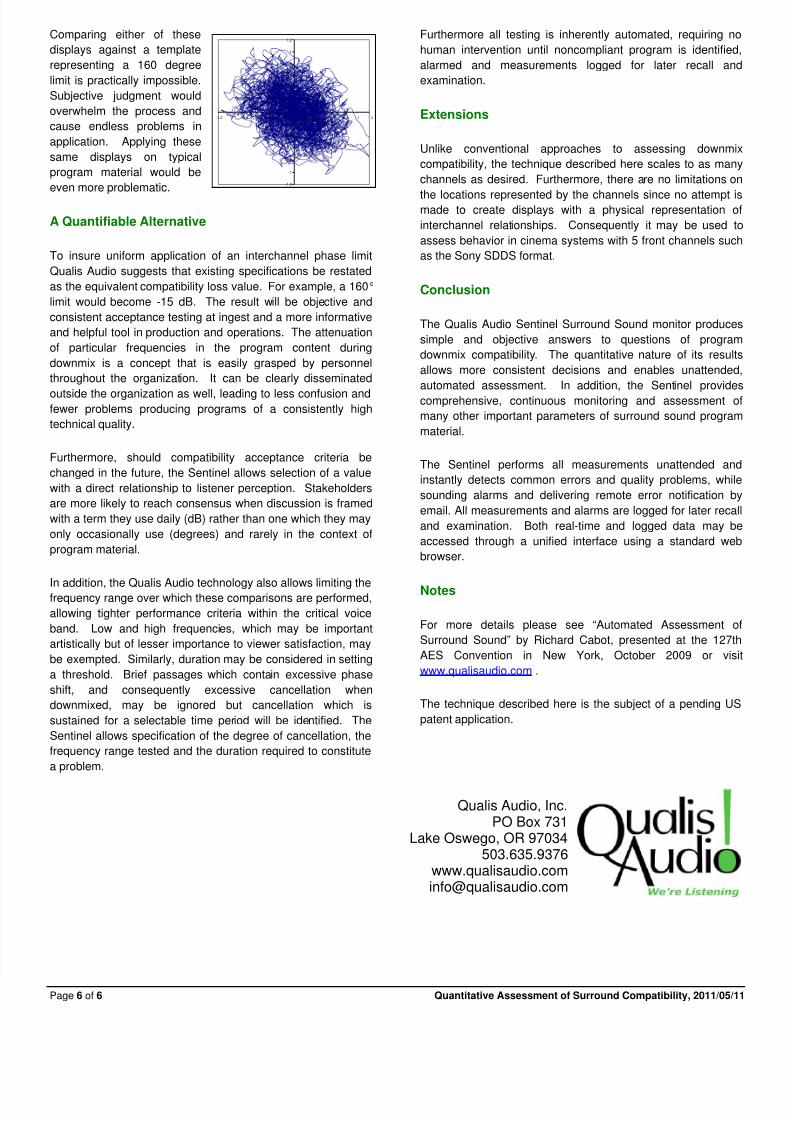
Displaying this same data in Lissajous form is (surprisingly)
less suggestive of the cancellation as shown in the figure
below. This looks very much like an “ideal” stereo signal with
only a hint of an antiphase component.
8/6/2019 Tech Note #5
http://slidepdf.com/reader/full/tech-note-5 6/6Page 6 of 6 Quantitative Assessment of Surround Compatibility, 2011/05/11
Comparing either of these
displays against a template
representing a 160 degree
limit is practically impossible.
Subjective judgment would
overwhelm the process and
cause endless problems in
application. Applying these
same displays on typical
program material would be
even more problematic.
A Quantifiable Alternative
To insure uniform application of an interchannel phase limit
Qualis Audio suggests that existing specifications be restated
as the equivalent compatibility loss value. For example, a 160°
limit would become -15 dB. The result will be objective and
consistent acceptance testing at ingest and a more informative
and helpful tool in production and operations. The attenuation
of particular frequencies in the program content during
downmix is a concept that is easily grasped by personnel
throughout the organization. It can be clearly disseminated
outside the organization as well, leading to less confusion andfewer problems producing programs of a consistently high
technical quality.
Furthermore, should compatibility acceptance criteria be
changed in the future, the Sentinel allows selection of a value
with a direct relationship to listener perception. Stakeholders
are more likely to reach consensus when discussion is framed
with a term they use daily (dB) rather than one which they may
only occasionally use (degrees) and rarely in the context of
program material.
In addition, the Qualis Audio technology also allows limiting the
frequency range over which these comparisons are performed,
allowing tighter performance criteria within the critical voice
band. Low and high frequencies, which may be important
artistically but of lesser importance to viewer satisfaction, may
be exempted. Similarly, duration may be considered in setting
a threshold. Brief passages which contain excessive phase
shift, and consequently excessive cancellation when
downmixed, may be ignored but cancellation which is
sustained for a selectable time period will be identified. The
Sentinel allows specification of the degree of cancellation, the
frequency range tested and the duration required to constitute
a problem.
Furthermore all testing is inherently automated, requiring no
human intervention until noncompliant program is identified
alarmed and measurements logged for later recall and
examination.
Extensions
Unlike conventional approaches to assessing downmix
compatibility, the technique described here scales to as many
channels as desired. Furthermore, there are no limitations on
the locations represented by the channels since no attempt ismade to create displays with a physical representation o
interchannel relationships. Consequently it may be used to
assess behavior in cinema systems with 5 front channels such
as the Sony SDDS format.
Conclusion
The Qualis Audio Sentinel Surround Sound monitor produces
simple and objective answers to questions of program
downmix compatibility. The quantitative nature of its results
allows more consistent decisions and enables unattended
automated assessment. In addition, the Sentinel provides
comprehensive, continuous monitoring and assessment o
many other important parameters of surround sound program
material.
The Sentinel performs all measurements unattended and
instantly detects common errors and quality problems, while
sounding alarms and delivering remote error notification by
email. All measurements and alarms are logged for later recal
and examination. Both real-time and logged data may be
accessed through a unified interface using a standard web
browser.
Notes
For more details please see “Automated Assessment of
Surround Sound” by Richard Cabot, presented at the 127th
AES Convention in New York, October 2009 or visi
www.qualisaudio.com .
The technique described here is the subject of a pending US
patent application.
Qualis Audio, Inc.PO Box 731
Lake Oswego, OR 97034503.635.9376
-1.2
-1
-0.8
-0.6
-0.4
-0.2
0
0.2
0.4
0.6
0.8
1
1.2
-1.2 -1 -0.8 -0.6 -0.4 -0.2 0 0.2 0.4 0.6 0.8 1 1.2