Embed Size (px)
Citation preview
Tech Boom, Interrupted?2020’s Impact on Tech Industry Hiring & Location Strategy
The technology sector is one of a handful of industries exhibiting greater resiliency than the U.S. economy overall during the COVID-19 pandemic and resulting recession. Tech companies entered the pandemic with strong balance sheets and record levels of investment. This favorable financial positioning combined with the greater adaptability of tech companies to remote work and, in some cases, an increase in business demand directly resulting from the pandemic have helped to buffer the tech industry from some of the harsher impacts seen in other sectors of the American economy.
However, a closer look at the current talent landscape, and specifically hiring demand among tech companies, reveals that tech is not going through the pandemic unscathed. The ongoing public health and economic calamity has accelerated some pre-existing, labor-related trends while also revealing new ones.
In this report, CBRE Labor Analytics explores the factors contributing to tech’s relative resiliency, with a focus on how the pandemic is altering the talent landscape for tech companies. We’ll also highlight potential strategies and opportunities for tech companies as they consider leveraging geography to allow them to hire and retain top talent, which will continue to be critical to their long-term success.
Specifically, this report seeks to answer the following questions:
• Which factors contributed to tech’s relative resiliency versus other industries–both before and during the pandemic?
• What impact is the pandemic having on tech hiring and employment levels?
• Which job roles are the most in-demand among tech companies since the onset of the pandemic?
• To what extent has tech turned to remote-only hiring since March 2020?
• How have different metro areas performed in terms of their tech company hiring activity?
• How have tech company salaries been impacted?
• How are geographic and real estate footprints shifting?
• Where do tech companies go from here? How can they approach their talent-based location strategy differently as we recover from the pandemic and enter the next stage?
M A R C H 2 0 2 1 | Tech Boom, Interrupted? | 2
IntroductionR E S I L I E N T I N D U S T R I E S I N A C H A N G I N G L A B O R L A N D S C A P E
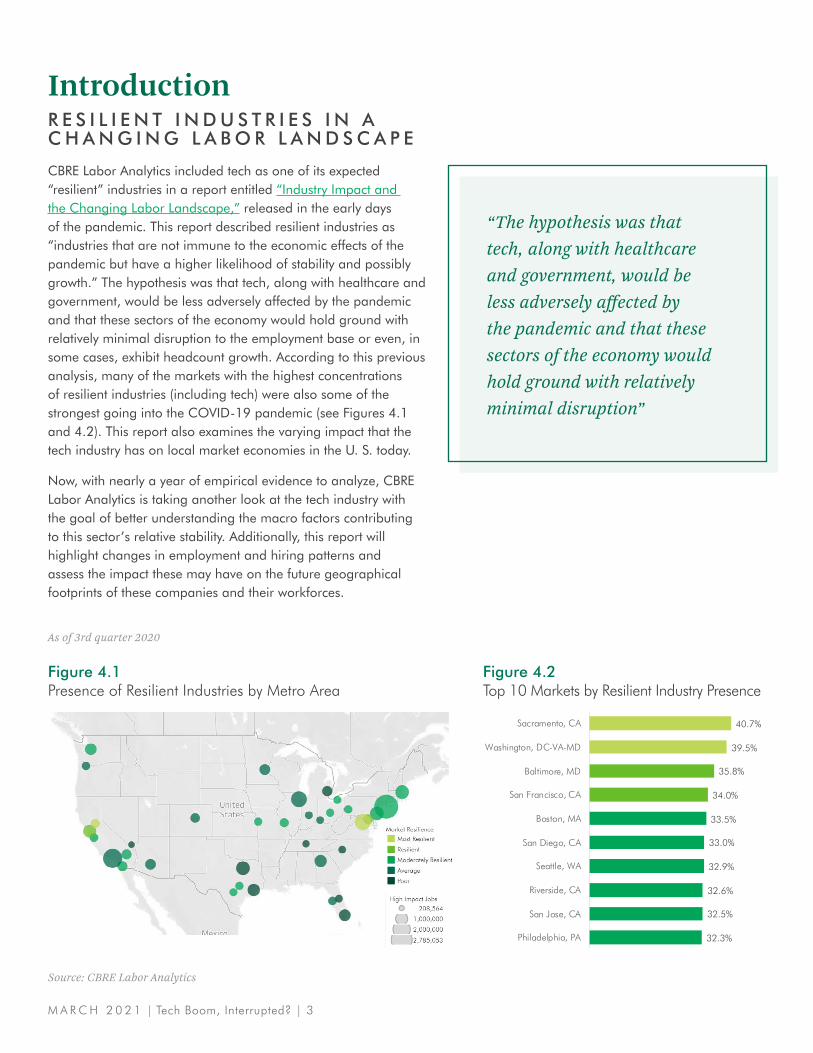
CBRE Labor Analytics included tech as one of its expected “resilient” industries in a report entitled “Industry Impact and the Changing Labor Landscape,” released in the early days of the pandemic. This report described resilient industries as “industries that are not immune to the economic effects of the pandemic but have a higher likelihood of stability and possibly growth.” The hypothesis was that tech, along with healthcare and government, would be less adversely affected by the pandemic and that these sectors of the economy would hold ground with relatively minimal disruption to the employment base or even, in some cases, exhibit headcount growth. According to this previous analysis, many of the markets with the highest concentrations of resilient industries (including tech) were also some of the strongest going into the COVID-19 pandemic (see Figures 4.1 and 4.2). This report also examines the varying impact that the tech industry has on local market economies in the U. S. today.
Now, with nearly a year of empirical evidence to analyze, CBRE Labor Analytics is taking another look at the tech industry with the goal of better understanding the macro factors contributing to this sector’s relative stability. Additionally, this report will highlight changes in employment and hiring patterns and assess the impact these may have on the future geographical footprints of these companies and their workforces.
As of 3rd quarter 2020
Figure 4.1Presence of Resilient Industries by Metro Area
40.7%
39.5%
35.8%
34.0%
33.5%
33.0%
32.9%
32.6%
32.5%
32.3%
Sacramento, CA
Washington, DC-VA-MD
Baltimore, MD
San Francisco, CA
Boston, MA
San Diego, CA
Seattle, WA
Riverside, CA
San Jose, CA
Philadelphia, PA
Figure 4.2Top 10 Markets by Resilient Industry Presence
Source: CBRE Labor Analytics
“The hypothesis was that tech, along with healthcare and government, would be less adversely affected by the pandemic and that these sectors of the economy would hold ground with relatively minimal disruption”
M A R C H 2 0 2 1 | Tech Boom, Interrupted? | 3
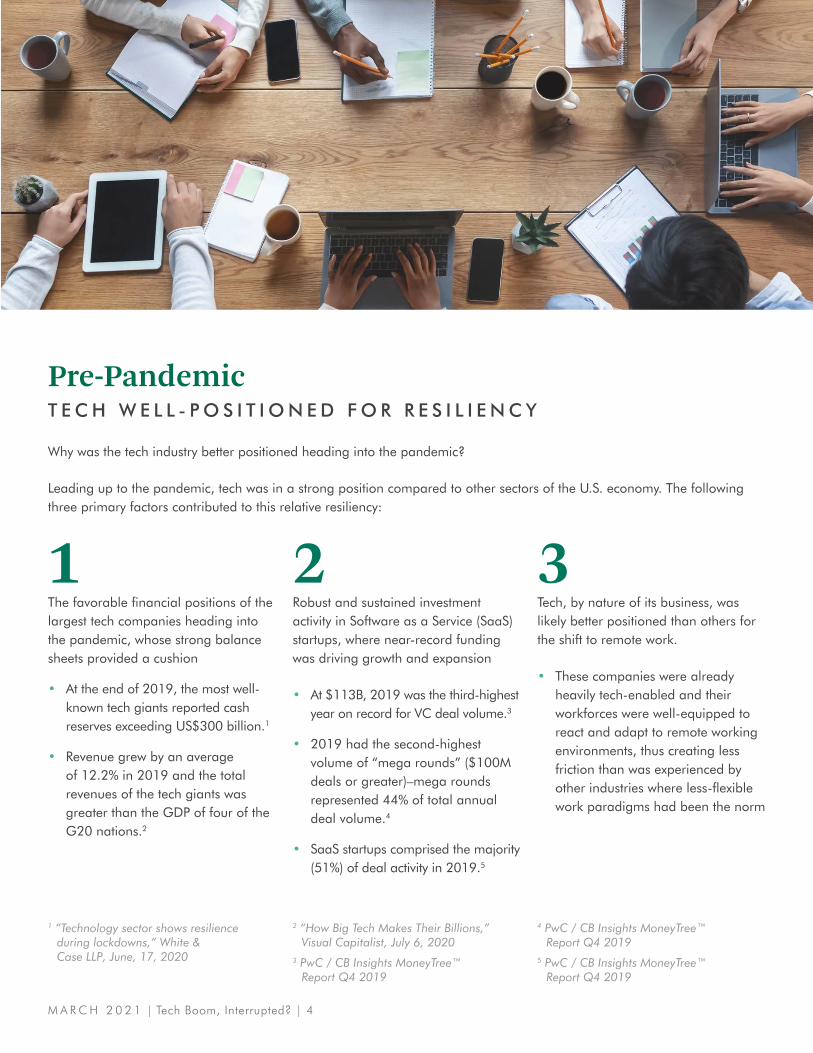
Pre-PandemicT E C H W E L L - P O S I T I O N E D F O R R E S I L I E N C Y
Why was the tech industry better positioned heading into the pandemic?
Leading up to the pandemic, tech was in a strong position compared to other sectors of the U.S. economy. The following three primary factors contributed to this relative resiliency:
1 “Technology sector shows resilience during lockdowns,” White & Case LLP, June, 17, 2020
2 “How Big Tech Makes Their Billions,” Visual Capitalist, July 6, 2020
3 PwC / CB Insights MoneyTree™ Report Q4 2019
4 PwC / CB Insights MoneyTree™ Report Q4 2019
5 PwC / CB Insights MoneyTree™ Report Q4 2019
The favorable financial positions of the largest tech companies heading into the pandemic, whose strong balance sheets provided a cushion
• At the end of 2019, the most well-known tech giants reported cash reserves exceeding US$300 billion.1
• Revenue grew by an average of 12.2% in 2019 and the total revenues of the tech giants was greater than the GDP of four of the G20 nations.2
Robust and sustained investment activity in Software as a Service (SaaS) startups, where near-record funding was driving growth and expansion
• At $113B, 2019 was the third-highest year on record for VC deal volume.3
• 2019 had the second-highest volume of “mega rounds” ($100M deals or greater)–mega rounds represented 44% of total annual deal volume.4
• SaaS startups comprised the majority (51%) of deal activity in 2019.5
Tech, by nature of its business, was likely better positioned than others for the shift to remote work.
• These companies were already heavily tech-enabled and their workforces were well-equipped to react and adapt to remote working environments, thus creating less friction than was experienced by other industries where less-flexible work paradigms had been the norm
1 2 3
M A R C H 2 0 2 1 | Tech Boom, Interrupted? | 4
During the PandemicT E C H D E M O N S T R AT E S I T S R E S I L I E N C Y
The stronger financial positioning and relative adaptability of the tech industry helped to cushion the severity of the impacts from the economic downturn that began in 2020. While no industry, including tech, was impervious to the global health crisis and resulting recession, the technology sector did continue to exhibit positive momentum over the past year, albeit at a more muted pace than in 2019 and the other preceding years of record expansion in the 2010s.
Four indicators suggest tech’s relative strength since the onset of the COVID-19 pandemic:
1. Revenue growth remained robust (especially among “Big Tech”). The immediate and widespread shift to remote work increased demand for many products and services provided by tech companies, which helped to limit impacts to the bottom line.
• The biggest tech companies posted revenue gains in 2020, with some surpassing a +37% increase, and other well-known firms reported increases between 10-25%.6
• Meanwhile, more heavily affected industries, like transportation, tourism, automotive, and oil and gas, have seen revenue declines of between 25% and 45% since the onset of the pandemic.7
2. 2020 was a record year for venture capital (VC) investment activity and initial public offerings (IPOs).
• VC investments hit an all-time high–U.S.-based, VC-backed companies raised nearly $130B in 2020, up 14% from 2019.8
• Mega-funding rounds set a record in 2020, with 318 rounds each worth $100M or greater.9
• IPO activity was up–147 U.S.-based, VC-backed tech companies exited in IPOs in 2020, up from 90 in 2019.10
• Record number of “Unicorns” (valued at $1B+)–at the end of 2020, there were 225 U.S.-based, VC-backed Unicorns, with a record 28 companies reaching Unicorn status in Q4 2020 alone.11
3. Tech companies leased more office space than any other industry sector in 2020.
• According to a CBRE report, tech companies accounted for 18 of the top 100 leases in 2020 and the most of any industry by square footage (6.8 million), largely in new leasing activity concentrated in New York and Seattle. Many of these leases were planned pre-pandemic.
• Despite this relative strength, leasing by tech companies was still down by more than half year-over-year, demonstrating a slowdown by even one of the more resilient industries.
4. Employment growth and hiring demand outpaced the national average in 2020, while wage growth was positive but below the average increase for all industries.
• Tech companies added new employees at a rate of 1.5% in 2020—down from recent historical rates but still outpacing the U.S. economy overall, which saw an annual decline in employment of 2.7%.
• Hiring in the tech industry has been slightly more resilient than the economy overall and significantly more resilient than the average for all “white collar” sectors. For the months of March to December 2020, the average annual change in active job postings in the tech industry was -13% compared to -15% for all industries and -27% for all “white collar” industries.
• Tech company wages continued to grow in 2020 but at the muted rate of 1.6% (down from 4.5% in 2019). This rate underperformed the rate of growth for the U.S. economy overall, which was 2.8%
6 Big Tech Continues Its Surge Ahead of the Rest of the Economy,” New York Times, October 29, 2020
7 McKinsey, “On Risk” Volume #10, January 20218 PwC / CB Insights MoneyTree™ Report Q4 20209 PwC / CB Insights MoneyTree™ Report Q4 202010 PwC / CB Insights MoneyTree™ Report Q4 202011 PwC / CB Insights MoneyTree™ Report Q4 2020
M A R C H 2 0 2 1 | Tech Boom, Interrupted? | 5
Pandemic Talent LandscapeT E C H H I R I N G S L O W S A N D S H I F T S
While tech industry hiring was not as adversely impacted as the U.S. economy overall, 2020 undoubtedly put the brakes on what had been a torrential period of headcount growth for tech companies in the United States. Hiring slowed dramatically in 2020, but interesting new patterns may have impacts on the tech company labor landscape that outlast the pandemic.
We looked at seven different areas to understand how the tech-industry talent environment is shifting and evolving since the onset of the pandemic:
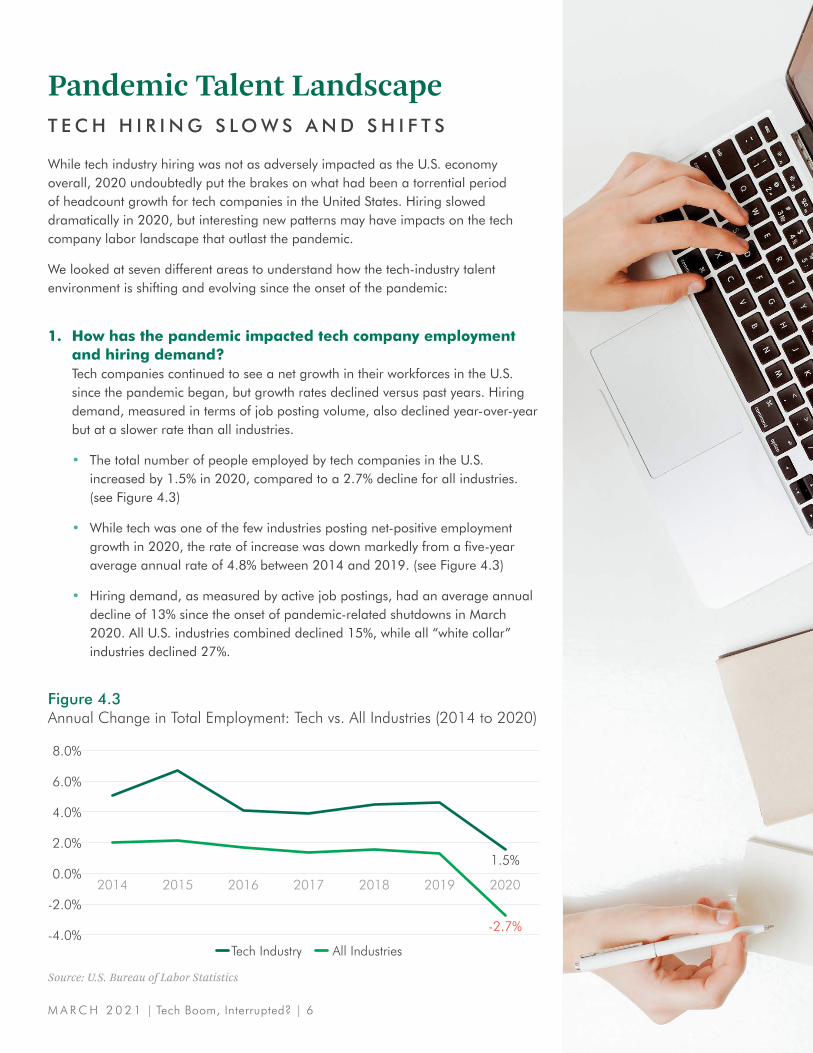
1. How has the pandemic impacted tech company employment and hiring demand? Tech companies continued to see a net growth in their workforces in the U.S. since the pandemic began, but growth rates declined versus past years. Hiring demand, measured in terms of job posting volume, also declined year-over-year but at a slower rate than all industries.
• The total number of people employed by tech companies in the U.S. increased by 1.5% in 2020, compared to a 2.7% decline for all industries. (see Figure 4.3)
• While tech was one of the few industries posting net-positive employment growth in 2020, the rate of increase was down markedly from a five-year average annual rate of 4.8% between 2014 and 2019. (see Figure 4.3)
• Hiring demand, as measured by active job postings, had an average annual decline of 13% since the onset of pandemic-related shutdowns in March 2020. All U.S. industries combined declined 15%, while all “white collar” industries declined 27%.
Figure 4.3Annual Change in Total Employment: Tech vs. All Industries (2014 to 2020)
2014
1.5%
-2.7%
8.0%
6.0%
4.0%
2.0%
0.0%
-2.0%
-4.0%
2016 20192015 20182017 2020
Source: U.S. Bureau of Labor Statistics
Tech Industry All Industries
M A R C H 2 0 2 1 | Tech Boom, Interrupted? | 6
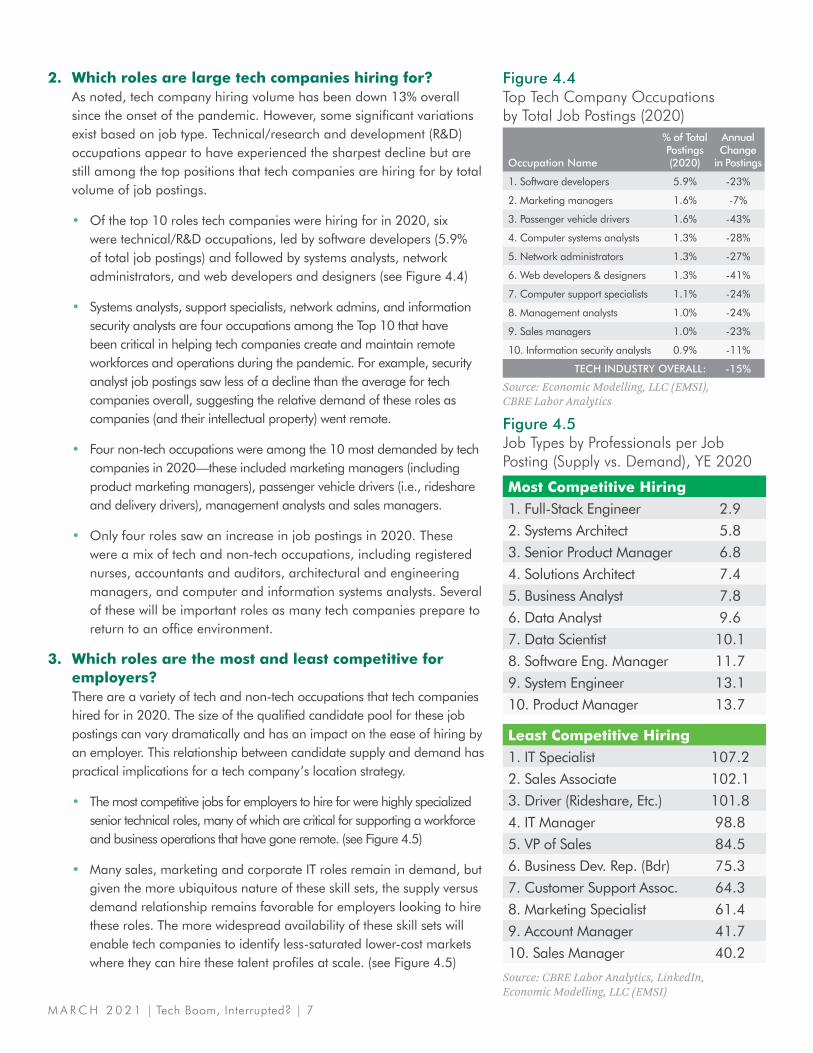
2. Which roles are large tech companies hiring for? As noted, tech company hiring volume has been down 13% overall since the onset of the pandemic. However, some significant variations exist based on job type. Technical/research and development (R&D) occupations appear to have experienced the sharpest decline but are still among the top positions that tech companies are hiring for by total volume of job postings.
• Of the top 10 roles tech companies were hiring for in 2020, six were technical/R&D occupations, led by software developers (5.9% of total job postings) and followed by systems analysts, network administrators, and web developers and designers (see Figure 4.4)
• Systems analysts, support specialists, network admins, and information security analysts are four occupations among the Top 10 that have been critical in helping tech companies create and maintain remote workforces and operations during the pandemic. For example, security analyst job postings saw less of a decline than the average for tech companies overall, suggesting the relative demand of these roles as companies (and their intellectual property) went remote.
• Four non-tech occupations were among the 10 most demanded by tech companies in 2020—these included marketing managers (including product marketing managers), passenger vehicle drivers (i.e., rideshare and delivery drivers), management analysts and sales managers.
• Only four roles saw an increase in job postings in 2020. These were a mix of tech and non-tech occupations, including registered nurses, accountants and auditors, architectural and engineering managers, and computer and information systems analysts. Several of these will be important roles as many tech companies prepare to return to an office environment.
3. Which roles are the most and least competitive for employers? There are a variety of tech and non-tech occupations that tech companies hired for in 2020. The size of the qualified candidate pool for these job postings can vary dramatically and has an impact on the ease of hiring by an employer. This relationship between candidate supply and demand has practical implications for a tech company’s location strategy.
• The most competitive jobs for employers to hire for were highly specialized senior technical roles, many of which are critical for supporting a workforce and business operations that have gone remote. (see Figure 4.5)
• Many sales, marketing and corporate IT roles remain in demand, but given the more ubiquitous nature of these skill sets, the supply versus demand relationship remains favorable for employers looking to hire these roles. The more widespread availability of these skill sets will enable tech companies to identify less-saturated lower-cost markets where they can hire these talent profiles at scale. (see Figure 4.5)
Occupation Name
% of Total Postings (2020)
Annual Change
in Postings
1. Software developers 5.9% -23%
2. Marketing managers 1.6% -7%
3. Passenger vehicle drivers 1.6% -43%
4. Computer systems analysts 1.3% -28%
5. Network administrators 1.3% -27%
6. Web developers & designers 1.3% -41%
7. Computer support specialists 1.1% -24%
8. Management analysts 1.0% -24%
9. Sales managers 1.0% -23%
10. Information security analysts 0.9% -11%
TECH INDUSTRY OVERALL: -15%
Figure 4.4Top Tech Company Occupations by Total Job Postings (2020)
Source: Economic Modelling, LLC (EMSI), CBRE Labor Analytics
Figure 4.5Job Types by Professionals per Job Posting (Supply vs. Demand), YE 2020
Source: CBRE Labor Analytics, LinkedIn, Economic Modelling, LLC (EMSI)
Most Competitive Hiring1. Full-Stack Engineer 2.92. Systems Architect 5.83. Senior Product Manager 6.84. Solutions Architect 7.45. Business Analyst 7.86. Data Analyst 9.67. Data Scientist 10.18. Software Eng. Manager 11.79. System Engineer 13.110. Product Manager 13.7
Least Competitive Hiring1. IT Specialist 107.22. Sales Associate 102.13. Driver (Rideshare, Etc.) 101.84. IT Manager 98.85. VP of Sales 84.56. Business Dev. Rep. (Bdr) 75.37. Customer Support Assoc. 64.38. Marketing Specialist 61.49. Account Manager 41.710. Sales Manager 40.2
M A R C H 2 0 2 1 | Tech Boom, Interrupted? | 7
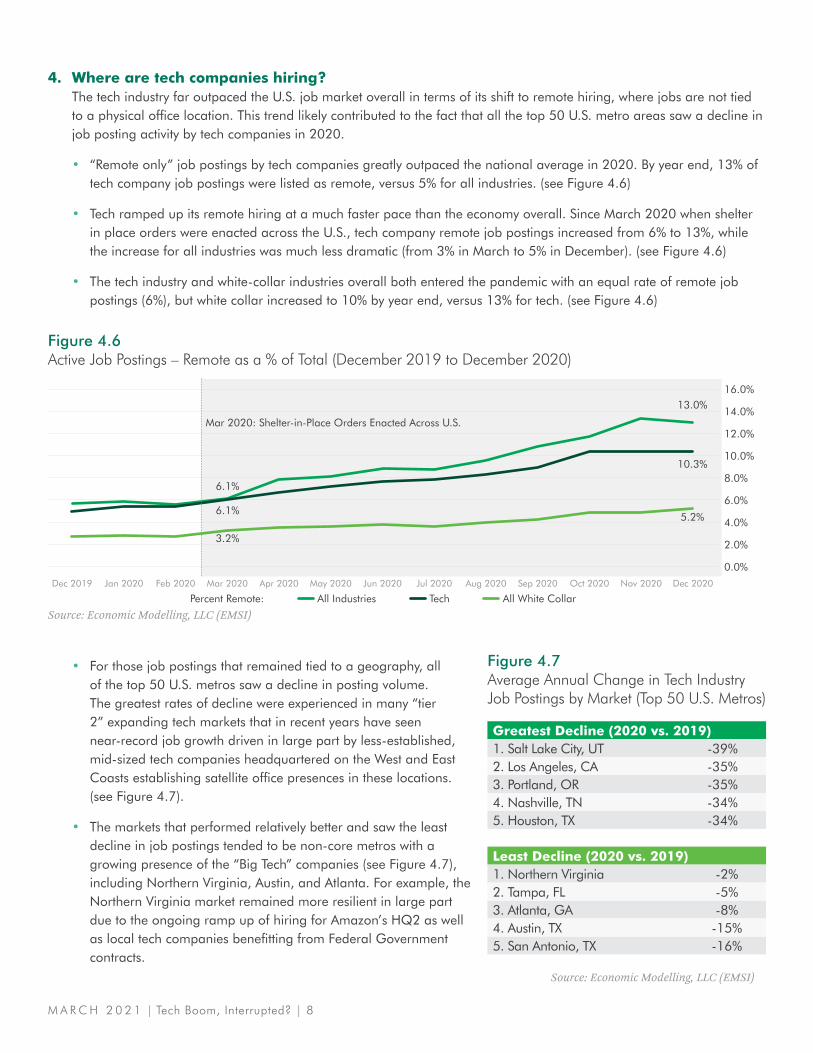
4. Where are tech companies hiring? The tech industry far outpaced the U.S. job market overall in terms of its shift to remote hiring, where jobs are not tied to a physical office location. This trend likely contributed to the fact that all the top 50 U.S. metro areas saw a decline in job posting activity by tech companies in 2020.
• “Remote only” job postings by tech companies greatly outpaced the national average in 2020. By year end, 13% of tech company job postings were listed as remote, versus 5% for all industries. (see Figure 4.6)
• Tech ramped up its remote hiring at a much faster pace than the economy overall. Since March 2020 when shelter in place orders were enacted across the U.S., tech company remote job postings increased from 6% to 13%, while the increase for all industries was much less dramatic (from 3% in March to 5% in December). (see Figure 4.6)
• The tech industry and white-collar industries overall both entered the pandemic with an equal rate of remote job postings (6%), but white collar increased to 10% by year end, versus 13% for tech. (see Figure 4.6)
• For those job postings that remained tied to a geography, all of the top 50 U.S. metros saw a decline in posting volume. The greatest rates of decline were experienced in many “tier 2” expanding tech markets that in recent years have seen near-record job growth driven in large part by less-established, mid-sized tech companies headquartered on the West and East Coasts establishing satellite office presences in these locations. (see Figure 4.7).
• The markets that performed relatively better and saw the least decline in job postings tended to be non-core metros with a growing presence of the “Big Tech” companies (see Figure 4.7), including Northern Virginia, Austin, and Atlanta. For example, the Northern Virginia market remained more resilient in large part due to the ongoing ramp up of hiring for Amazon’s HQ2 as well as local tech companies benefitting from Federal Government contracts.
Figure 4.6Active Job Postings – Remote as a % of Total (December 2019 to December 2020)
Source: Economic Modelling, LLC (EMSI)
16.0%
0.0%
2.0%
4.0%
6.0%
8.0%
10.0%
12.0%
14.0%
Dec 2019 Jan 2020 Feb 2020 Mar 2020 Apr 2020 Jun 2020May 2020 Jul 2020 Aug 2020 Oct 2020Sep 2020 Nov 2020 Dec 2020
6.1%
6.1%
3.2%
13.0%
10.3%
5.2%
Mar 2020: Shelter-in-Place Orders Enacted Across U.S.
Percent Remote: All Industries Tech All White Collar
Figure 4.7Average Annual Change in Tech Industry Job Postings by Market (Top 50 U.S. Metros)
Greatest Decline (2020 vs. 2019)1. Salt Lake City, UT -39%2. Los Angeles, CA -35%3. Portland, OR -35%4. Nashville, TN -34%5. Houston, TX -34%
Least Decline (2020 vs. 2019)1. Northern Virginia -2%2. Tampa, FL -5%3. Atlanta, GA -8%4. Austin, TX -15%5. San Antonio, TX -16%
Source: Economic Modelling, LLC (EMSI)
M A R C H 2 0 2 1 | Tech Boom, Interrupted? | 8
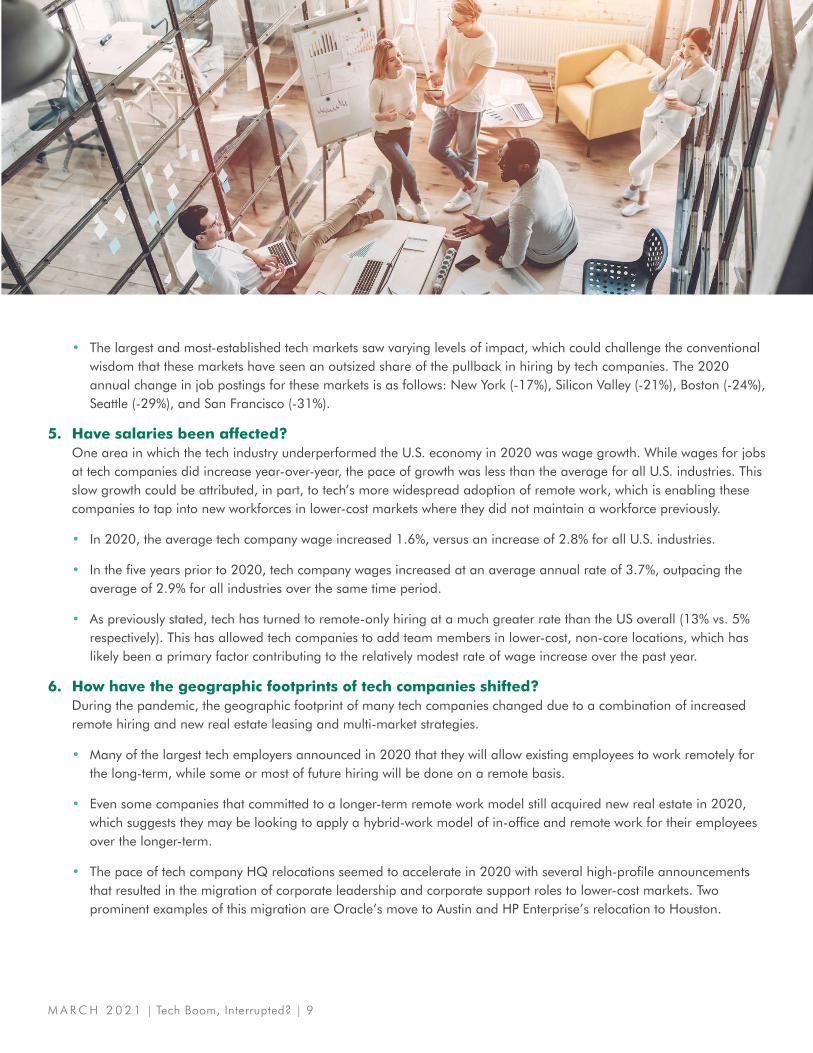
• The largest and most-established tech markets saw varying levels of impact, which could challenge the conventional wisdom that these markets have seen an outsized share of the pullback in hiring by tech companies. The 2020 annual change in job postings for these markets is as follows: New York (-17%), Silicon Valley (-21%), Boston (-24%), Seattle (-29%), and San Francisco (-31%).
5. Have salaries been affected? One area in which the tech industry underperformed the U.S. economy in 2020 was wage growth. While wages for jobs at tech companies did increase year-over-year, the pace of growth was less than the average for all U.S. industries. This slow growth could be attributed, in part, to tech’s more widespread adoption of remote work, which is enabling these companies to tap into new workforces in lower-cost markets where they did not maintain a workforce previously.
• In 2020, the average tech company wage increased 1.6%, versus an increase of 2.8% for all U.S. industries.
• In the five years prior to 2020, tech company wages increased at an average annual rate of 3.7%, outpacing the average of 2.9% for all industries over the same time period.
• As previously stated, tech has turned to remote-only hiring at a much greater rate than the US overall (13% vs. 5% respectively). This has allowed tech companies to add team members in lower-cost, non-core locations, which has likely been a primary factor contributing to the relatively modest rate of wage increase over the past year.
6. How have the geographic footprints of tech companies shifted? During the pandemic, the geographic footprint of many tech companies changed due to a combination of increased remote hiring and new real estate leasing and multi-market strategies.
• Many of the largest tech employers announced in 2020 that they will allow existing employees to work remotely for the long-term, while some or most of future hiring will be done on a remote basis.
• Even some companies that committed to a longer-term remote work model still acquired new real estate in 2020, which suggests they may be looking to apply a hybrid-work model of in-office and remote work for their employees over the longer-term.
• The pace of tech company HQ relocations seemed to accelerate in 2020 with several high-profile announcements that resulted in the migration of corporate leadership and corporate support roles to lower-cost markets. Two prominent examples of this migration are Oracle’s move to Austin and HP Enterprise’s relocation to Houston.
M A R C H 2 0 2 1 | Tech Boom, Interrupted? | 9
Post-PandemicP O T E N T I A L I M PA C T S O N T E C H L O C AT I O N S T R AT E G Y
Despite some sluggishness in 2020, the tech industry job market continues to outperform the U.S. economy, and tech companies find themselves in a labor market that remains candidate-favorable for many key job roles. Thus, the ability to effectively attract and retain top talent continues to be paramount for the success and growth of these companies. At this moment, the talent landscape is shifting quickly, and opportunities to develop a hiring strategy that uses geography to gain competitive advantage are omnipresent.
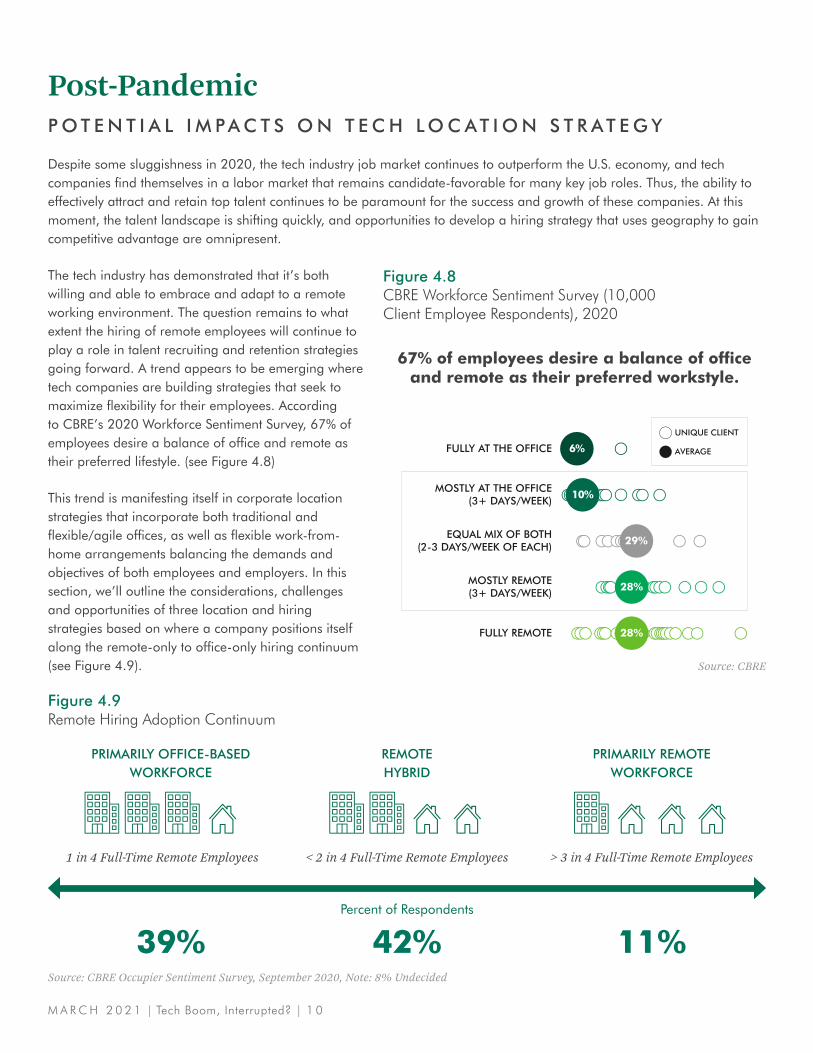
The tech industry has demonstrated that it’s both willing and able to embrace and adapt to a remote working environment. The question remains to what extent the hiring of remote employees will continue to play a role in talent recruiting and retention strategies going forward. A trend appears to be emerging where tech companies are building strategies that seek to maximize flexibility for their employees. According to CBRE’s 2020 Workforce Sentiment Survey, 67% of employees desire a balance of office and remote as their preferred lifestyle. (see Figure 4.8)
This trend is manifesting itself in corporate location strategies that incorporate both traditional and flexible/agile offices, as well as flexible work-from-home arrangements balancing the demands and objectives of both employees and employers. In this section, we’ll outline the considerations, challenges and opportunities of three location and hiring strategies based on where a company positions itself along the remote-only to office-only hiring continuum (see Figure 4.9). Source: CBRE
Figure 4.8CBRE Workforce Sentiment Survey (10,000 Client Employee Respondents), 2020
6%FULLY AT THE OFFICE
28%FULLY REMOTE
10%MOSTLY AT THE OFFICE(3+ DAYS/WEEK)
28%MOSTLY REMOTE(3+ DAYS/WEEK)
29%EQUAL MIX OF BOTH(2-3 DAYS/WEEK OF EACH)
UNIQUE CLIENT
AVERAGE
67% of employees desire a balance of office and remote as their preferred workstyle.
Source: CBRE Occupier Sentiment Survey, September 2020, Note: 8% Undecided
Figure 4.9Remote Hiring Adoption Continuum
PRIMARILY OFFICE-BASED WORKFORCE
1 in 4 Full-Time Remote Employees < 2 in 4 Full-Time Remote Employees > 3 in 4 Full-Time Remote Employees
PRIMARILY REMOTE WORKFORCE
REMOTE HYBRID
Percent of Respondents
39% 42% 11%
M A R C H 2 0 2 1 | Tech Boom, Interrupted? | 1 0
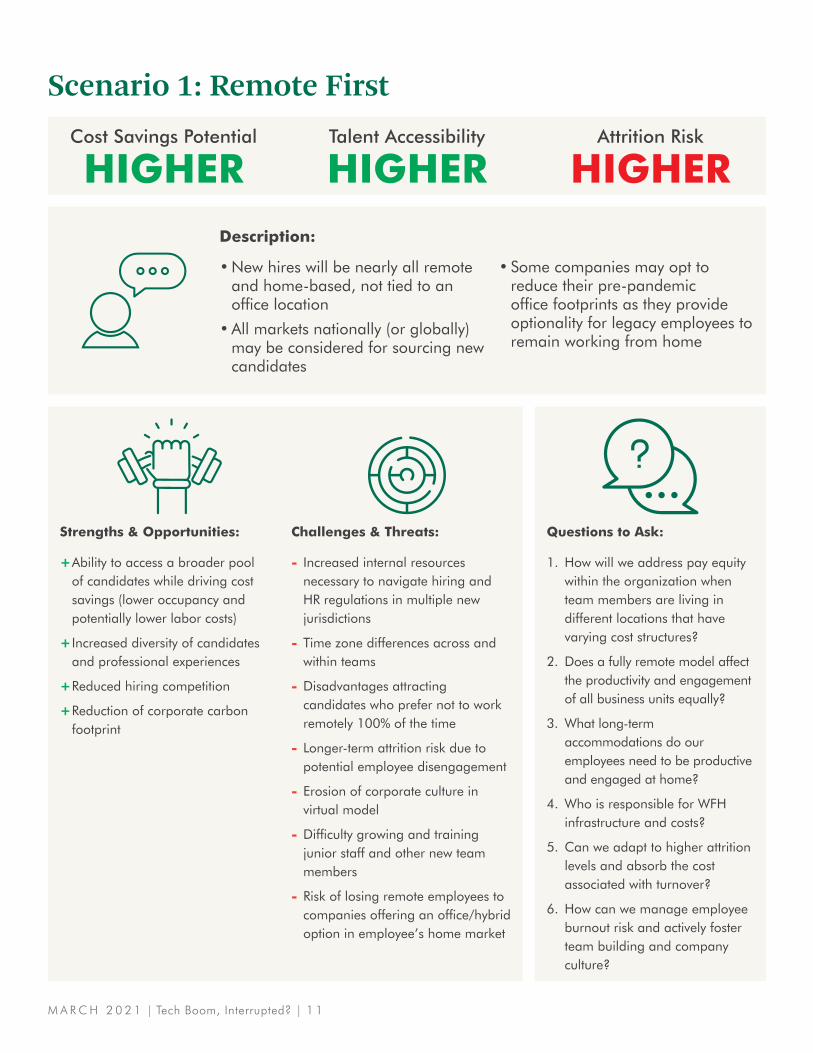
Scenario 1: Remote FirstTalent Accessibility
HIGHERAttrition Risk
HIGHERCost Savings Potential
HIGHER
Strengths & Opportunities:
+Ability to access a broader pool of candidates while driving cost savings (lower occupancy and potentially lower labor costs)
+Increased diversity of candidates and professional experiences
+Reduced hiring competition
+Reduction of corporate carbon footprint
Questions to Ask:
1. How will we address pay equity within the organization when team members are living in different locations that have varying cost structures?
2. Does a fully remote model affect the productivity and engagement of all business units equally?
3. What long-term accommodations do our employees need to be productive and engaged at home?
4. Who is responsible for WFH infrastructure and costs?
5. Can we adapt to higher attrition levels and absorb the cost associated with turnover?
6. How can we manage employee burnout risk and actively foster team building and company culture?
Challenges & Threats:
- Increased internal resources necessary to navigate hiring and HR regulations in multiple new jurisdictions
- Time zone differences across and within teams
- Disadvantages attracting candidates who prefer not to work remotely 100% of the time
- Longer-term attrition risk due to potential employee disengagement
- Erosion of corporate culture in virtual model
- Difficulty growing and training junior staff and other new team members
- Risk of losing remote employees to companies offering an office/hybrid option in employee’s home market
Description:
• New hires will be nearly all remote and home-based, not tied to an office location
• All markets nationally (or globally) may be considered for sourcing new candidates
• Some companies may opt to reduce their pre-pandemic office footprints as they provide optionality for legacy employees to remain working from home
M A R C H 2 0 2 1 | Tech Boom, Interrupted? | 1 1
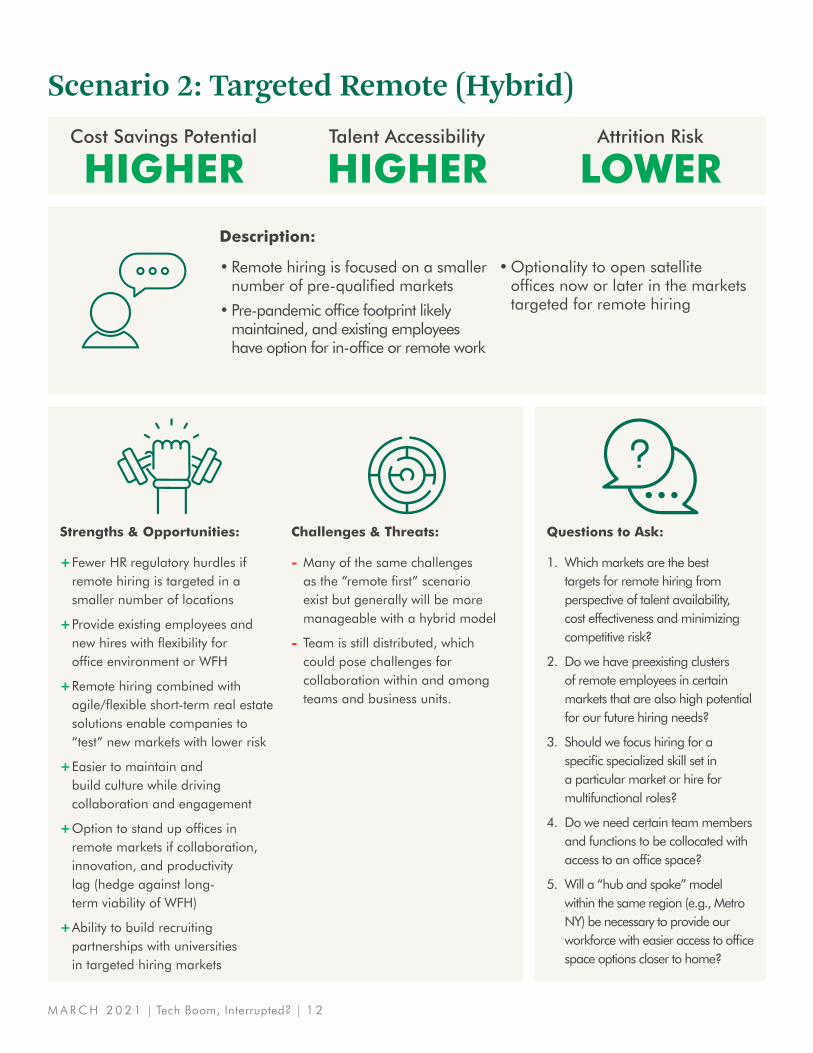
Talent Accessibility
HIGHERAttrition Risk
LOWERCost Savings Potential
HIGHER
Strengths & Opportunities:
+Fewer HR regulatory hurdles if remote hiring is targeted in a smaller number of locations
+Provide existing employees and new hires with flexibility for office environment or WFH
+Remote hiring combined with agile/flexible short-term real estate solutions enable companies to “test” new markets with lower risk
+Easier to maintain and build culture while driving collaboration and engagement
+Option to stand up offices in remote markets if collaboration, innovation, and productivity lag (hedge against long-term viability of WFH)
+Ability to build recruiting partnerships with universities in targeted hiring markets
Questions to Ask:
1. Which markets are the best targets for remote hiring from perspective of talent availability, cost effectiveness and minimizing competitive risk?
2. Do we have preexisting clusters of remote employees in certain markets that are also high potential for our future hiring needs?
3. Should we focus hiring for a specific specialized skill set in a particular market or hire for multifunctional roles?
4. Do we need certain team members and functions to be collocated with access to an office space?
5. Will a “hub and spoke” model within the same region (e.g., Metro NY) be necessary to provide our workforce with easier access to office space options closer to home?
Challenges & Threats:
- Many of the same challenges as the “remote first” scenario exist but generally will be more manageable with a hybrid model
- Team is still distributed, which could pose challenges for collaboration within and among teams and business units.
Scenario 2: Targeted Remote (Hybrid)
Description:
• Remote hiring is focused on a smaller number of pre-qualified markets
• Pre-pandemic office footprint likely maintained, and existing employees have option for in-office or remote work
• Optionality to open satellite offices now or later in the markets targeted for remote hiring
M A R C H 2 0 2 1 | Tech Boom, Interrupted? | 1 2
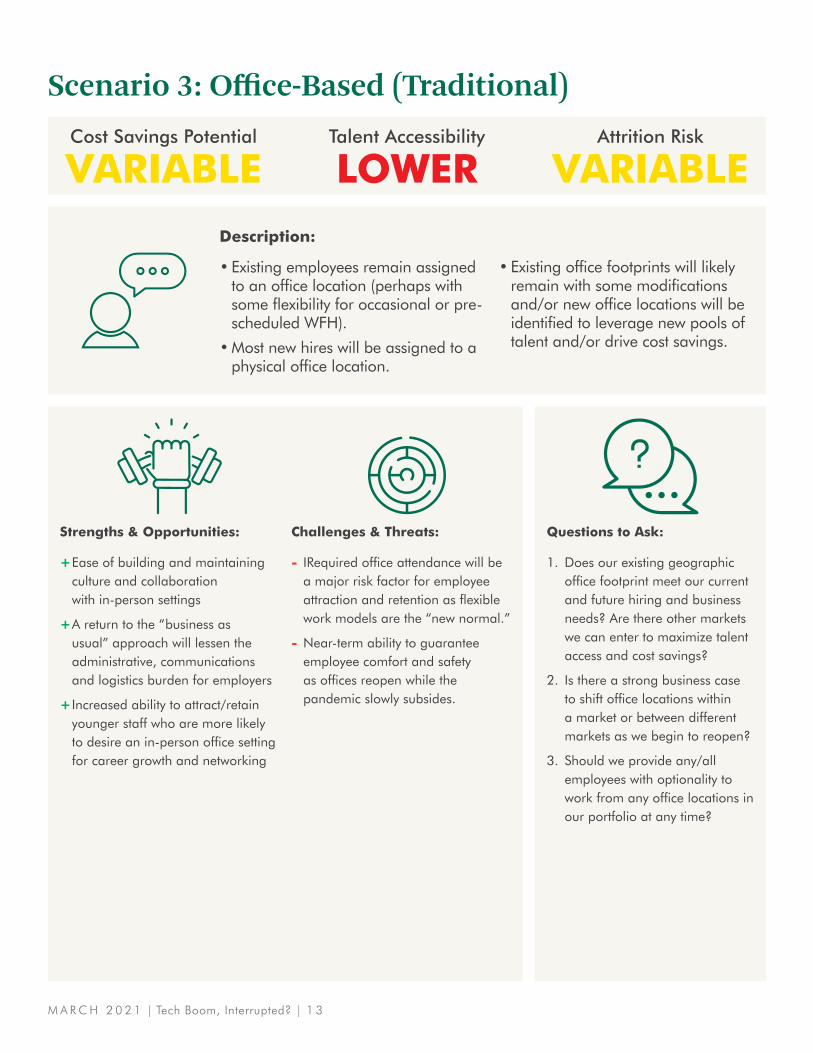
Talent Accessibility
LOWERAttrition Risk
VARIABLECost Savings Potential
VARIABLE
Strengths & Opportunities:
+Ease of building and maintaining culture and collaboration with in-person settings
+A return to the “business as usual” approach will lessen the administrative, communications and logistics burden for employers
+Increased ability to attract/retain younger staff who are more likely to desire an in-person office setting for career growth and networking
Questions to Ask:
1. Does our existing geographic office footprint meet our current and future hiring and business needs? Are there other markets we can enter to maximize talent access and cost savings?
2. Is there a strong business case to shift office locations within a market or between different markets as we begin to reopen?
3. Should we provide any/all employees with optionality to work from any office locations in our portfolio at any time?
Challenges & Threats:
- IRequired office attendance will be a major risk factor for employee attraction and retention as flexible work models are the “new normal.”
- Near-term ability to guarantee employee comfort and safety as offices reopen while the pandemic slowly subsides.
Scenario 3: Office-Based (Traditional)
Description:
• Existing employees remain assigned to an office location (perhaps with some flexibility for occasional or pre-scheduled WFH).
• Most new hires will be assigned to a physical office location.
• Existing office footprints will likely remain with some modifications and/or new office locations will be identified to leverage new pools of talent and/or drive cost savings.
M A R C H 2 0 2 1 | Tech Boom, Interrupted? | 1 3

Few tech companies are likely to choose either extreme on this continuum by implementing either 100% remote hiring/work from home or dictating that all employees are required to come to an office every day of the week. This is illustrated, in part, by tech leading the office-leasing market in the U.S. over the past year, which is a future indicator of office occupancy. The opportunity for occupiers lies in the ability to target hiring in certain high-potential geographies that will position companies as an “employer of choice,” allowing them to emerge from the pandemic with an enhanced competitive positioning within the new talent landscape.
The tech industry has weathered past economic downturns while finding innovative ways to emerge stronger each time. During the COVID-19 pandemic, tech has enabled people and companies to stay connected. Tech’s contributions and value will likely continue to increase as the public health crisis and recession recede. Companies that emerge from these challenging times with a thoughtful, talent-based location strategy reflective of the new working and hiring patterns will be best-positioned to attract and retain the best and brightest people who can help to propel the success of tech companies in the future.
“The tech industry has weathered past economic downturns while finding innovative ways to emerge stronger each time. During the COVID-19 pandemic, tech has enabled people and companies to stay connected.”
M A R C H 2 0 2 1 | Tech Boom, Interrupted? | 1 4

CHRIS VOLNEY
Senior Director
+1 415 772 0303
KEVIN MAJOR
Senior Director
+1 602 735 5317
VINCE GIOVANNINI
Data Scientist
+1 602 735 5659
MARK SEELEY
Executive Vice President
+1 602 735 5230
KRISTIN SEXTON
Senior Vice President
+1 602 735 5247
Learn more about CBRE’s Labor Analytics Research & Insights:
HTTPS://WWW.CBRE.US/REAL-ESTATE-SERVICES/OCCUPIER/
LABOR-ANALYTICS/LABOR-ANALYTICS-INSIGHTS