Embed Size (px)
Citation preview
Course 2
Teaching Mathematics withManipulatives
Manipulatives
Glencoe offers three types of kits to enhance the use of manipulatives in your Middle School Mathematics classroom.
• The Glencoe Mathematics Overhead Manipulative Resources contains translucentmanipulatives designed for use with an overhead projector.
• The Glencoe Mathematics Classroom Manipulative Kit contains classroom sets offrequently used manipulatives in algebra, geometry, measurement, probability, and statistics.
• The Glencoe Mathematics Student Manipulative Kit contains an individual set ofmanipulatives often used in Student Edition activities.
The manipulatives contained in each of these kits are listed on page vi of this booklet.
Each of these kits can be ordered from Glencoe by calling (800) 334-7344.
Glencoe Mathematics Overhead Manipulative Kit 0-07-830593-4Glencoe Mathematics Classroom Manipulative Kit 0-02-833116-8Glencoe Mathematics Student Manipulative Kit 0-02-833654-2
Copyright © by The McGraw-Hill Companies, Inc. All rights reserved. Permission is granted toreproduce the material contained herein on the condition that such materials be reproduced onlyfor classroom use; be provided to students, teachers, and families without charge; and be usedsolely in conjunction with the Glencoe Mathematics: Applications and Concepts, Course 2,program. Any other reproduction, for sale or other use, is expressly prohibited.
Send all inquiries to:Glencoe/McGraw-Hill8787 Orion PlaceColumbus, OH 43240-4027
ISBN: 0-07-860125-8 Teaching Mathematics with Manipulatives
Printed in the United States of America.
1 2 3 4 5 6 7 8 9 10 045 11 10 09 08 07 06 05 04 03
iii
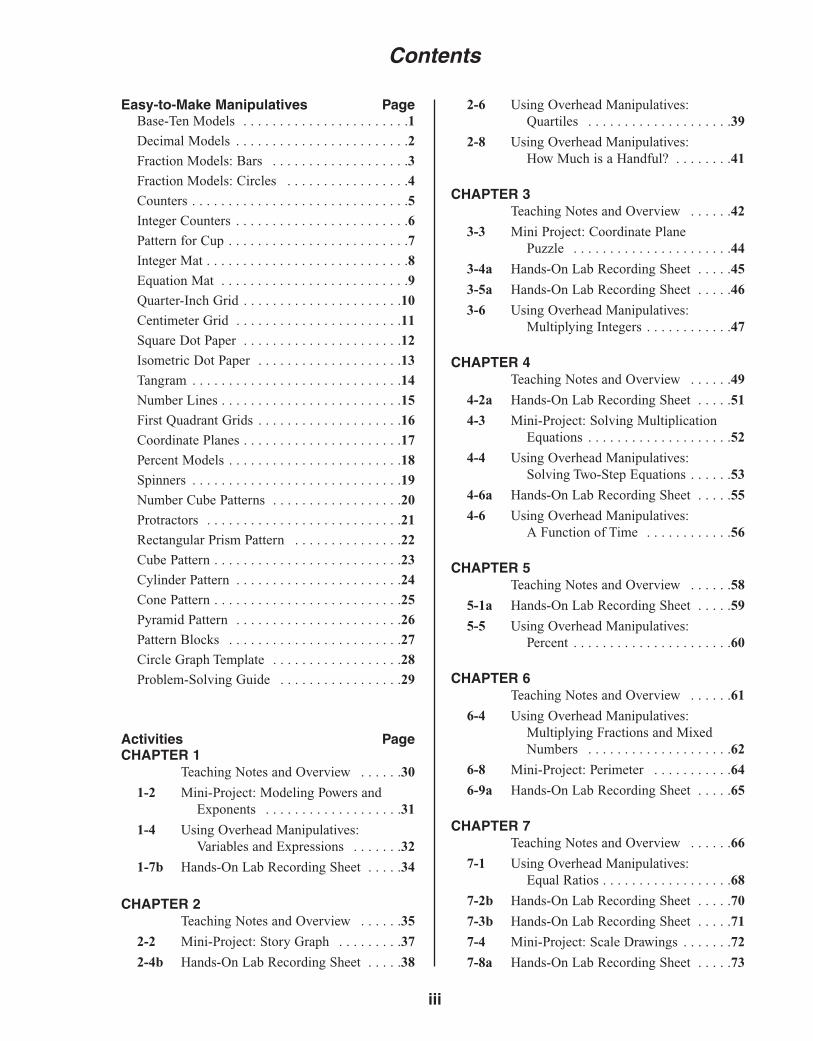
Contents
Easy-to-Make Manipulatives Page Base-Ten Models . . . . . . . . . . . . . . . . . . . . . . .1
Decimal Models . . . . . . . . . . . . . . . . . . . . . . . .2
Fraction Models: Bars . . . . . . . . . . . . . . . . . . .3
Fraction Models: Circles . . . . . . . . . . . . . . . . .4
Counters . . . . . . . . . . . . . . . . . . . . . . . . . . . . . .5
Integer Counters . . . . . . . . . . . . . . . . . . . . . . . .6
Pattern for Cup . . . . . . . . . . . . . . . . . . . . . . . . .7
Integer Mat . . . . . . . . . . . . . . . . . . . . . . . . . . . .8
Equation Mat . . . . . . . . . . . . . . . . . . . . . . . . . .9
Quarter-Inch Grid . . . . . . . . . . . . . . . . . . . . . .10
Centimeter Grid . . . . . . . . . . . . . . . . . . . . . . .11
Square Dot Paper . . . . . . . . . . . . . . . . . . . . . .12
Isometric Dot Paper . . . . . . . . . . . . . . . . . . . .13
Tangram . . . . . . . . . . . . . . . . . . . . . . . . . . . . .14
Number Lines . . . . . . . . . . . . . . . . . . . . . . . . .15
First Quadrant Grids . . . . . . . . . . . . . . . . . . . .16
Coordinate Planes . . . . . . . . . . . . . . . . . . . . . .17
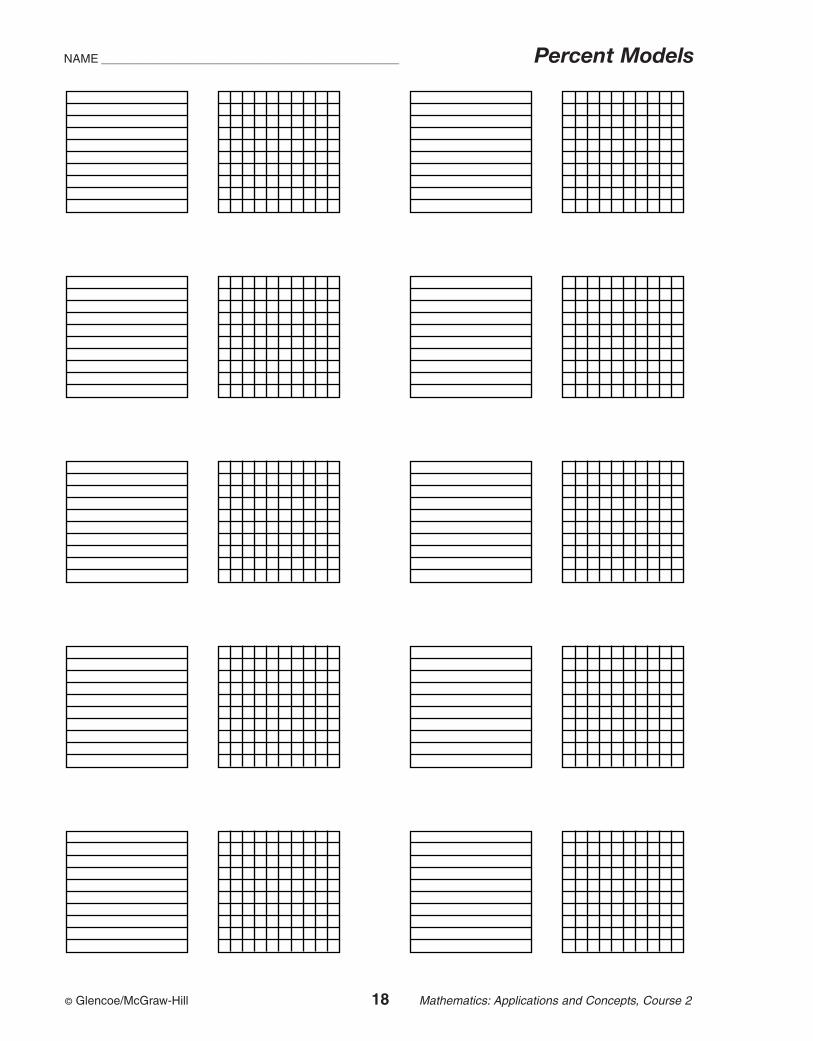
Percent Models . . . . . . . . . . . . . . . . . . . . . . . .18
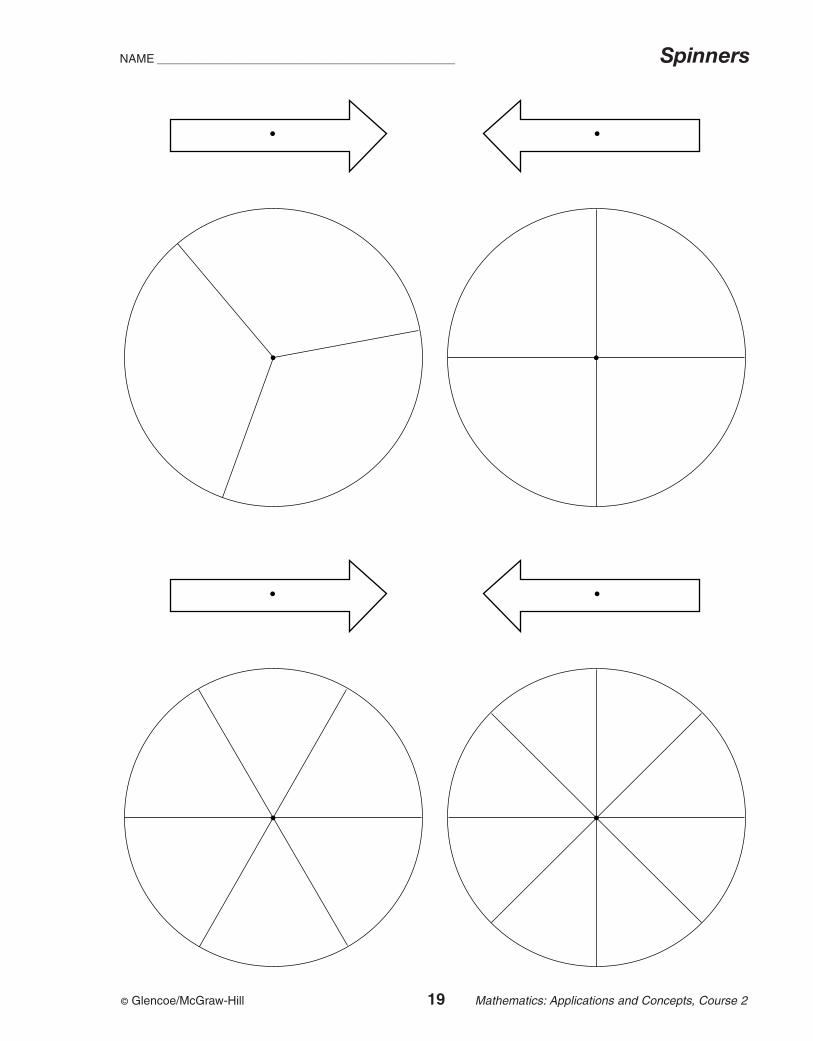
Spinners . . . . . . . . . . . . . . . . . . . . . . . . . . . . .19
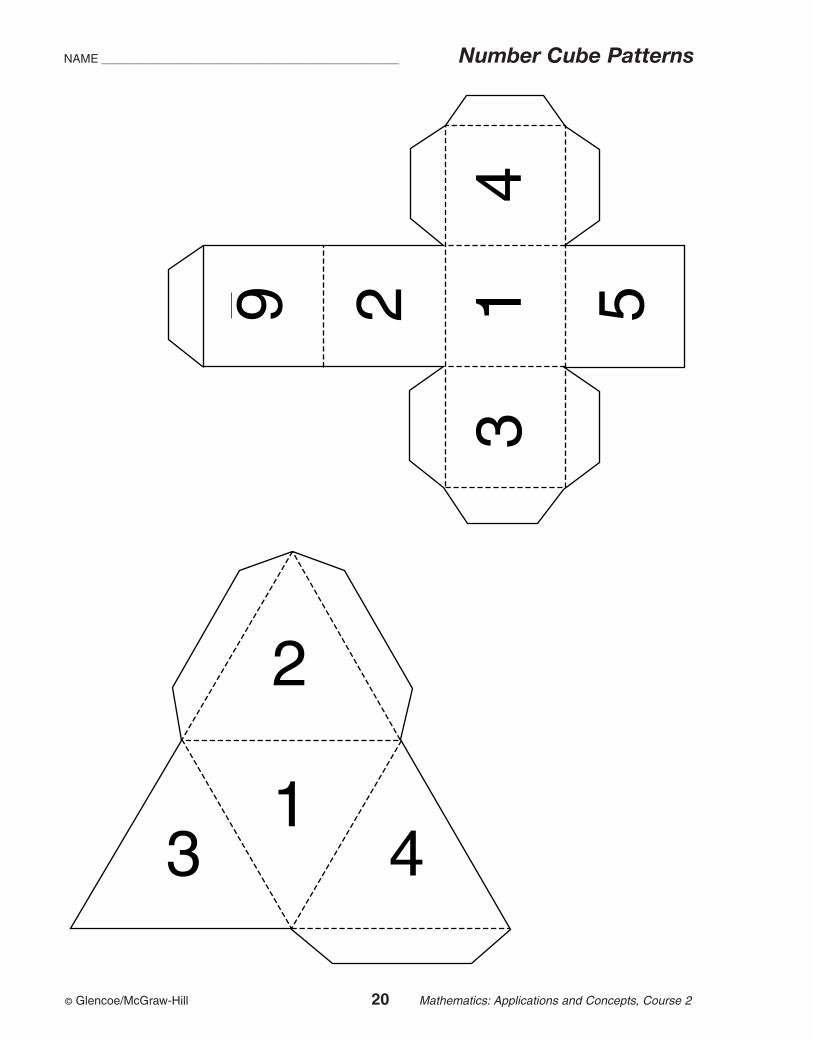
Number Cube Patterns . . . . . . . . . . . . . . . . . .20
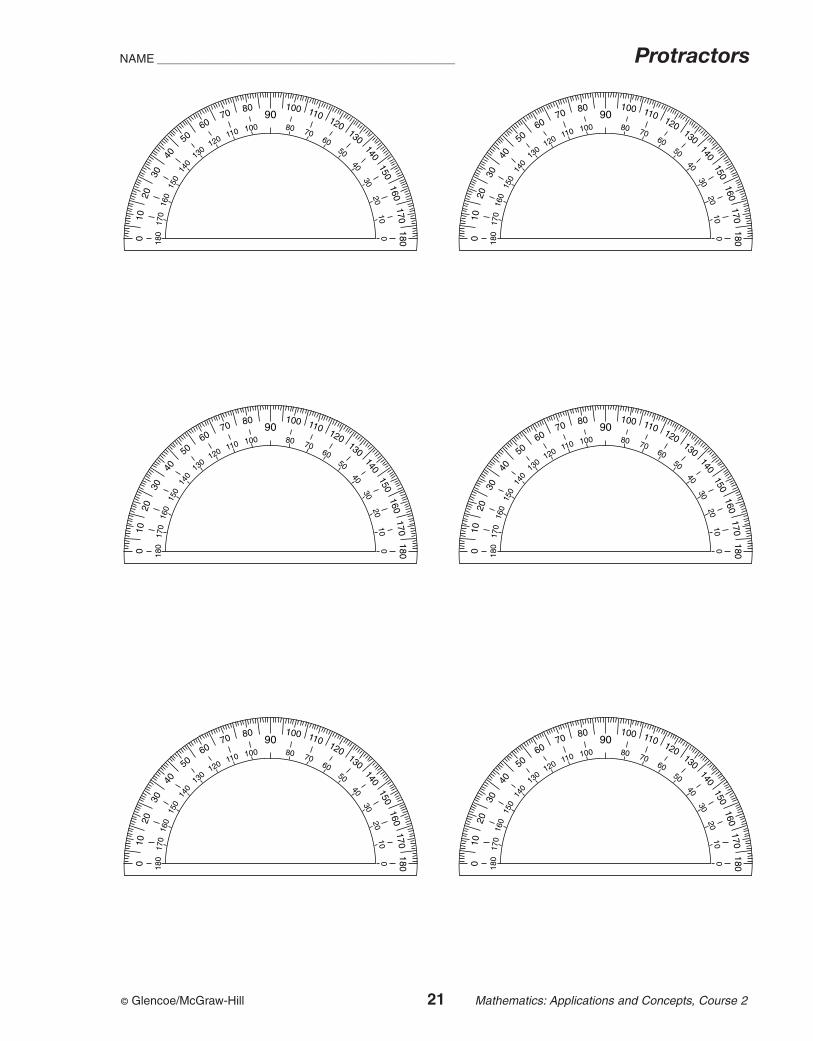
Protractors . . . . . . . . . . . . . . . . . . . . . . . . . . .21
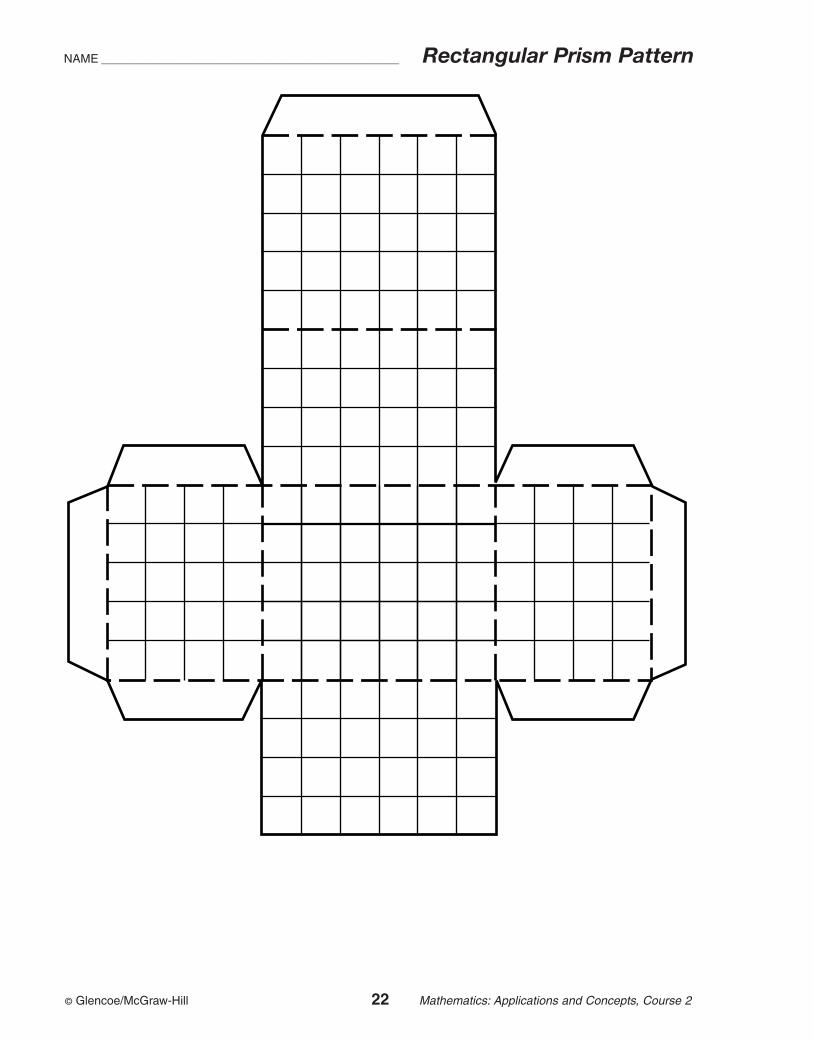
Rectangular Prism Pattern . . . . . . . . . . . . . . .22
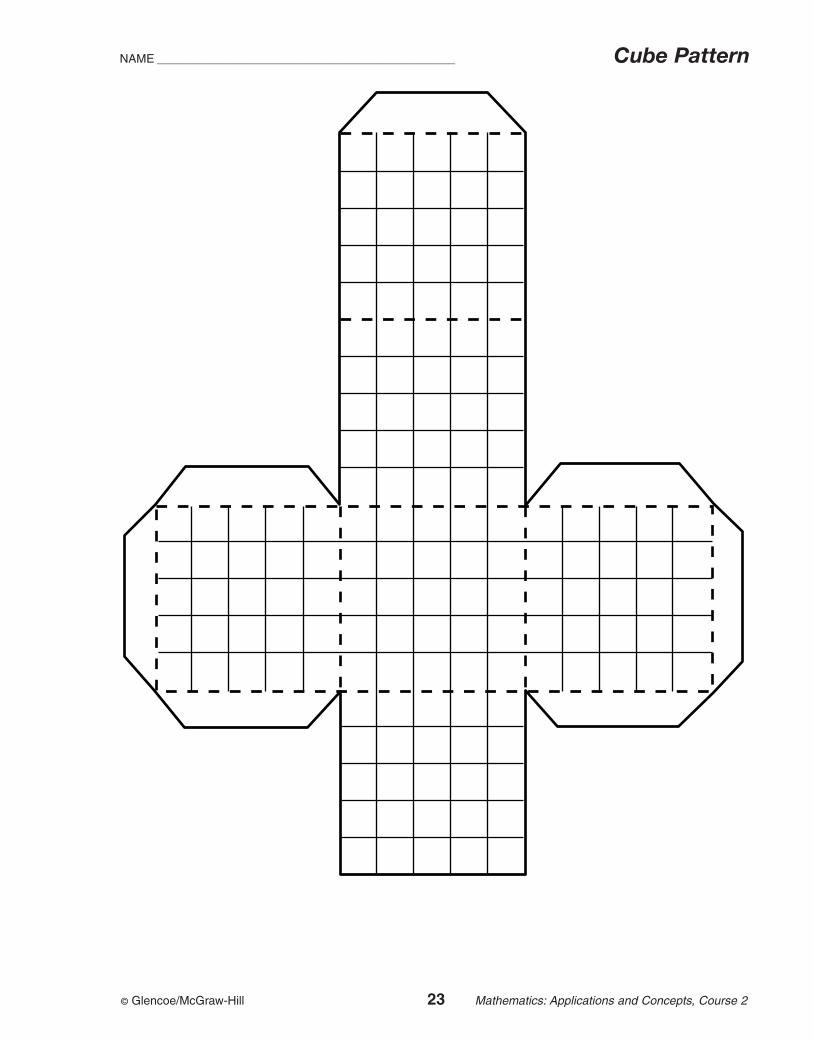
Cube Pattern . . . . . . . . . . . . . . . . . . . . . . . . . .23
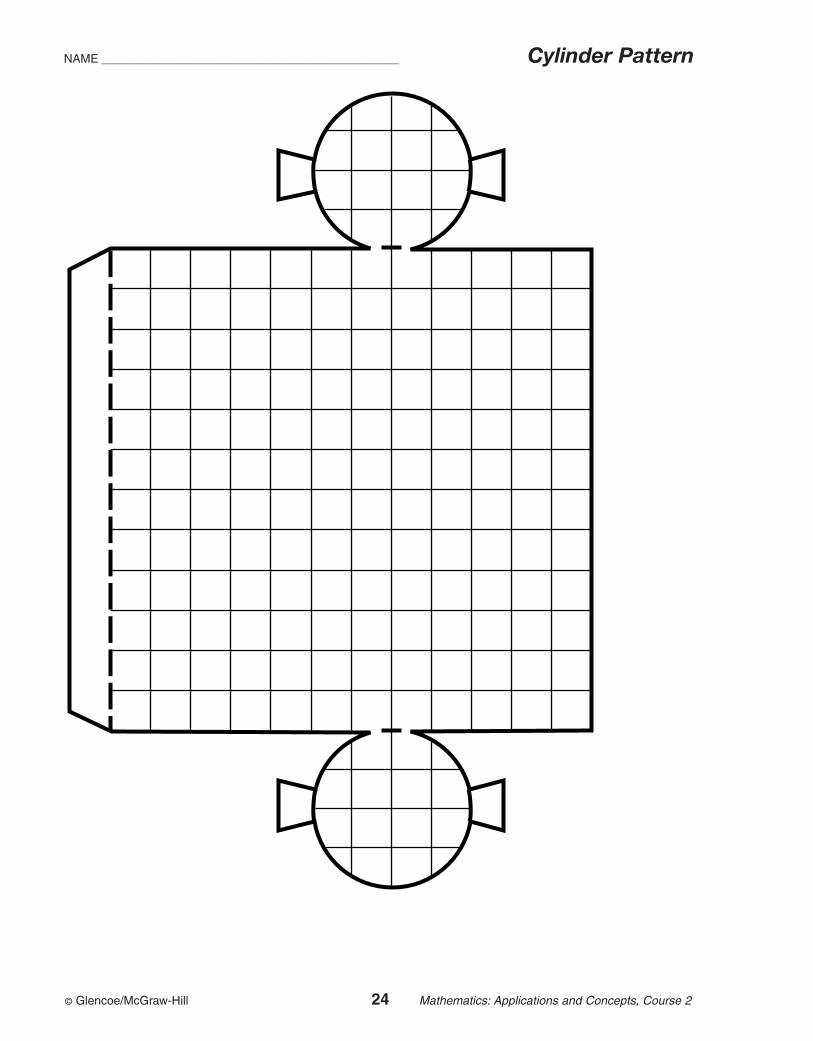
Cylinder Pattern . . . . . . . . . . . . . . . . . . . . . . .24
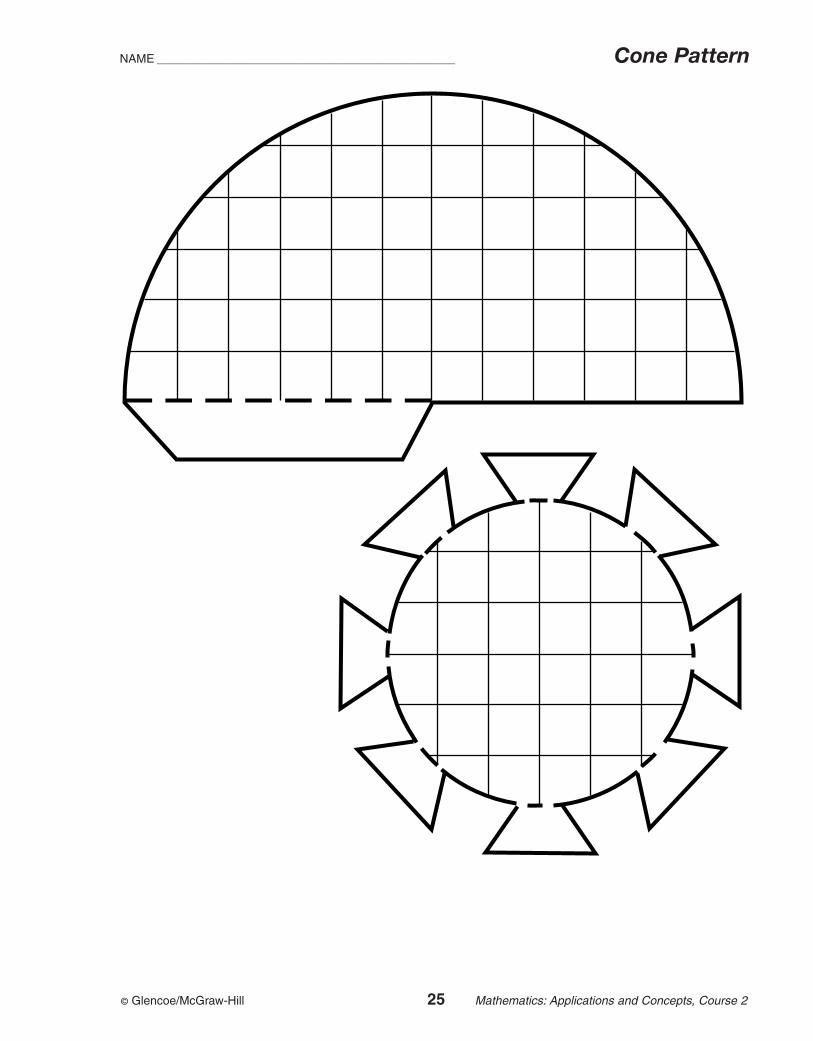
Cone Pattern . . . . . . . . . . . . . . . . . . . . . . . . . .25
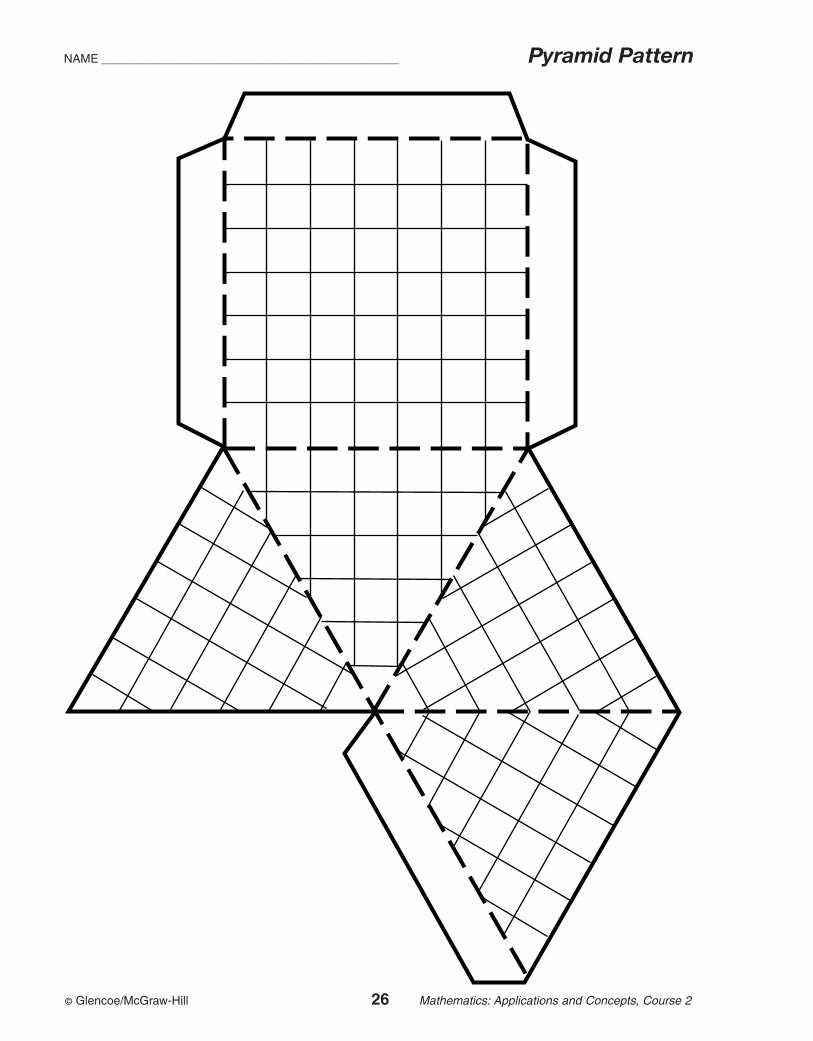
Pyramid Pattern . . . . . . . . . . . . . . . . . . . . . . .26
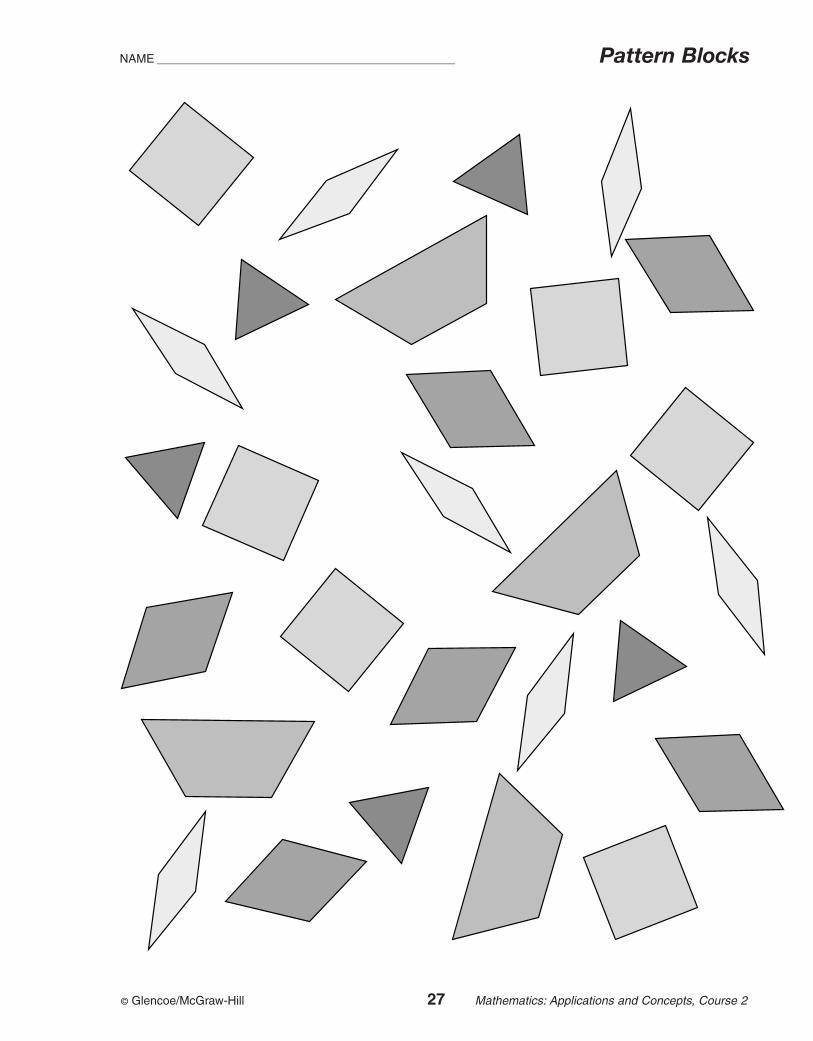
Pattern Blocks . . . . . . . . . . . . . . . . . . . . . . . .27
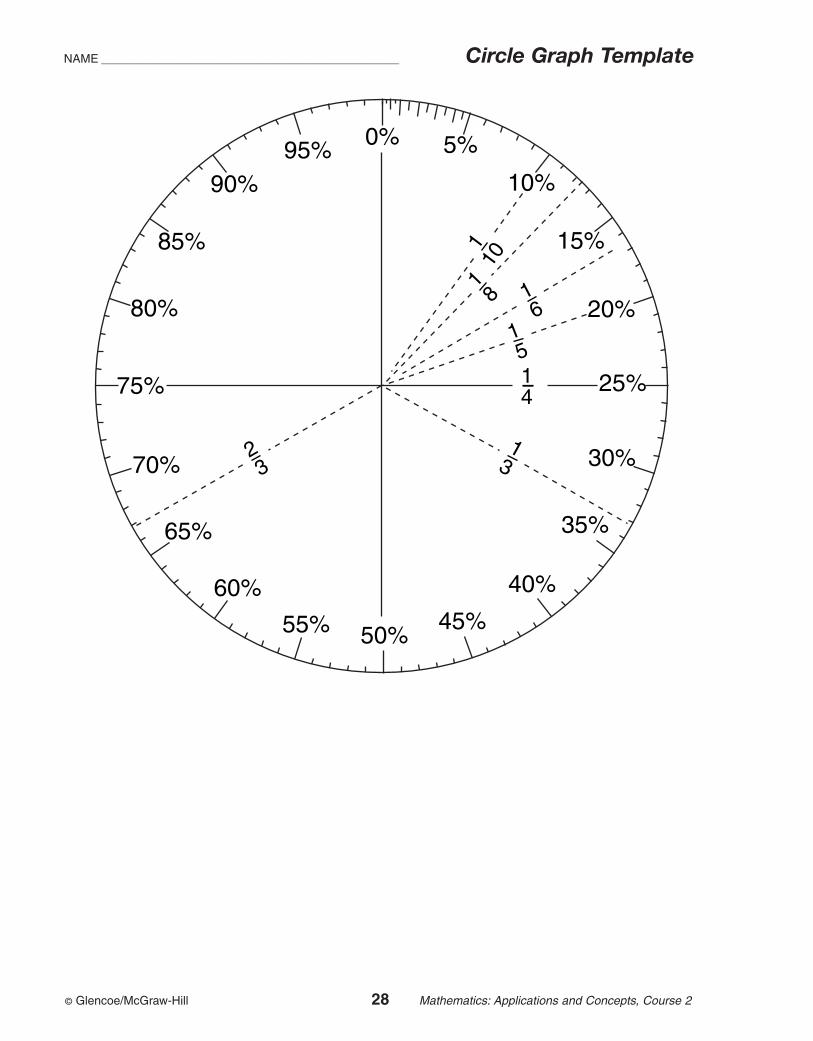
Circle Graph Template . . . . . . . . . . . . . . . . . .28
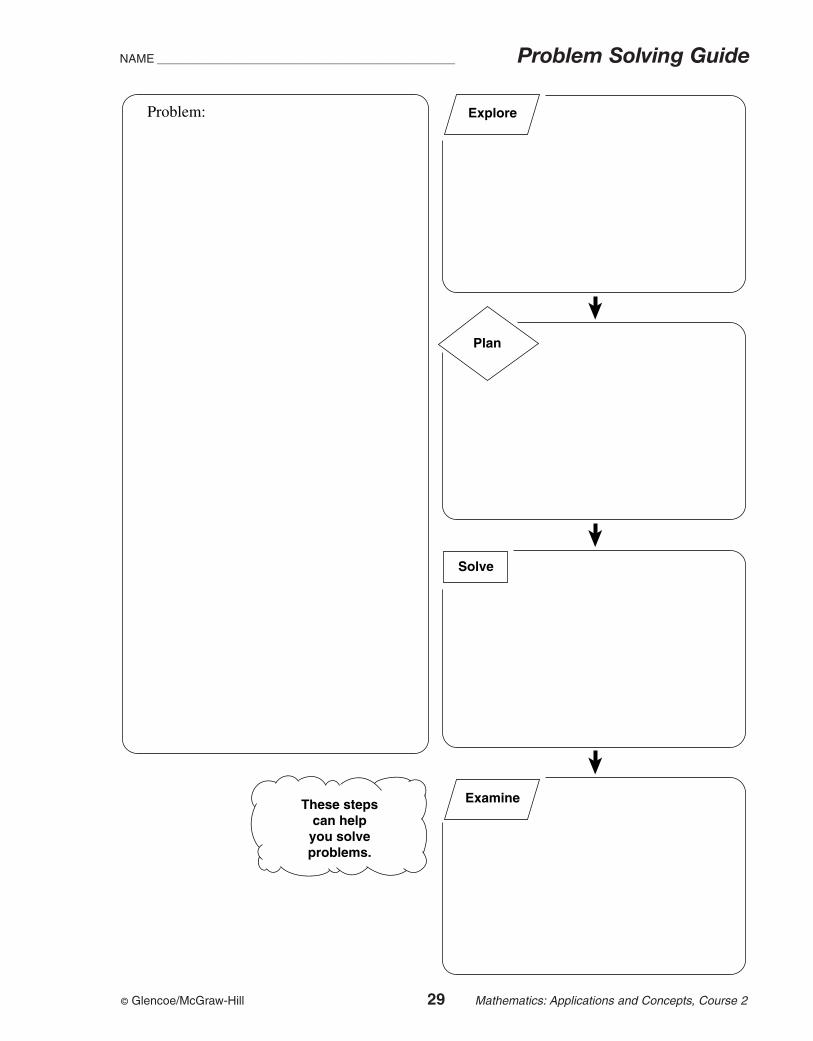
Problem-Solving Guide . . . . . . . . . . . . . . . . .29
Activities PageCHAPTER 1
Teaching Notes and Overview . . . . . .30
1-2 Mini-Project: Modeling Powers andExponents . . . . . . . . . . . . . . . . . . .31
1-4 Using Overhead Manipulatives: Variables and Expressions . . . . . . .32
1-7b Hands-On Lab Recording Sheet . . . . .34
CHAPTER 2Teaching Notes and Overview . . . . . .35
2-2 Mini-Project: Story Graph . . . . . . . . .37
2-4b Hands-On Lab Recording Sheet . . . . .38
2-6 Using Overhead Manipulatives: Quartiles . . . . . . . . . . . . . . . . . . . .39
2-8 Using Overhead Manipulatives: How Much is a Handful? . . . . . . . .41
CHAPTER 3Teaching Notes and Overview . . . . . .42
3-3 Mini Project: Coordinate Plane Puzzle . . . . . . . . . . . . . . . . . . . . . .44
3-4a Hands-On Lab Recording Sheet . . . . .45
3-5a Hands-On Lab Recording Sheet . . . . .46
3-6 Using Overhead Manipulatives: Multiplying Integers . . . . . . . . . . . .47
CHAPTER 4Teaching Notes and Overview . . . . . .49
4-2a Hands-On Lab Recording Sheet . . . . .51
4-3 Mini-Project: Solving MultiplicationEquations . . . . . . . . . . . . . . . . . . . .52
4-4 Using Overhead Manipulatives: Solving Two-Step Equations . . . . . .53
4-6a Hands-On Lab Recording Sheet . . . . .55
4-6 Using Overhead Manipulatives: A Function of Time . . . . . . . . . . . .56
CHAPTER 5Teaching Notes and Overview . . . . . .58
5-1a Hands-On Lab Recording Sheet . . . . .59
5-5 Using Overhead Manipulatives: Percent . . . . . . . . . . . . . . . . . . . . . .60
CHAPTER 6Teaching Notes and Overview . . . . . .61
6-4 Using Overhead Manipulatives: Multiplying Fractions and MixedNumbers . . . . . . . . . . . . . . . . . . . .62
6-8 Mini-Project: Perimeter . . . . . . . . . . .64
6-9a Hands-On Lab Recording Sheet . . . . .65
CHAPTER 7Teaching Notes and Overview . . . . . .66
7-1 Using Overhead Manipulatives: Equal Ratios . . . . . . . . . . . . . . . . . .68
7-2b Hands-On Lab Recording Sheet . . . . .70
7-3b Hands-On Lab Recording Sheet . . . . .71
7-4 Mini-Project: Scale Drawings . . . . . . .72
7-8a Hands-On Lab Recording Sheet . . . . .73
iv
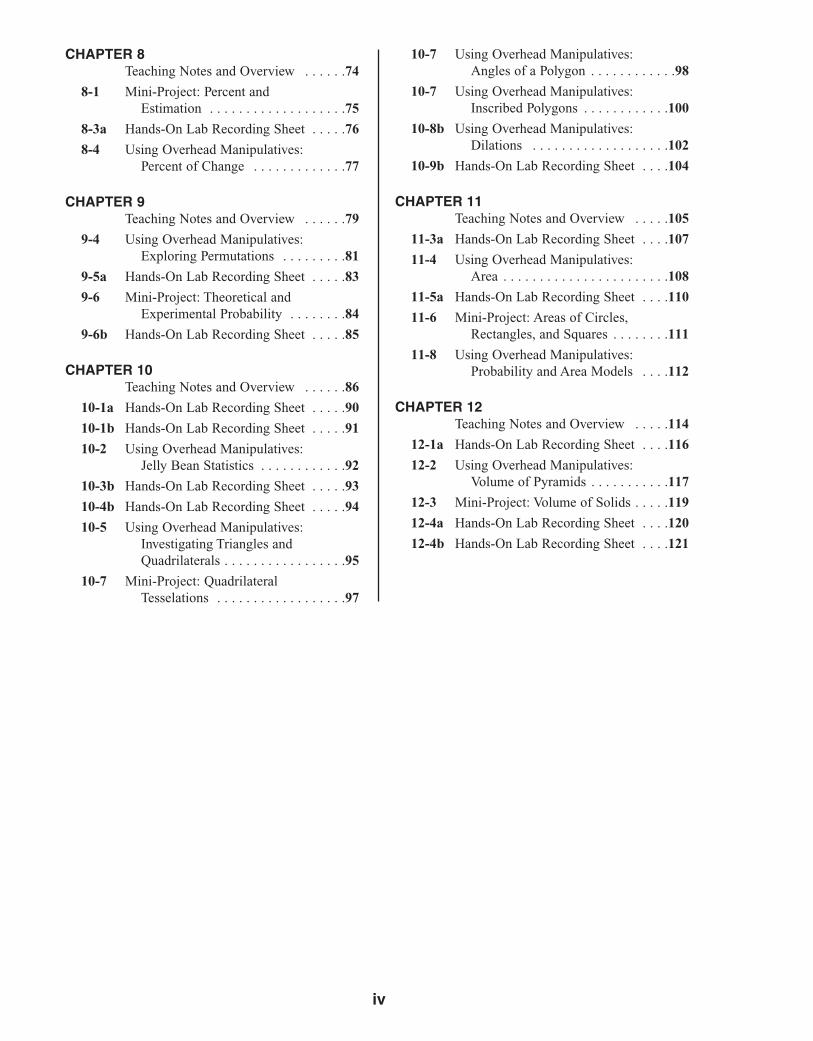
CHAPTER 8Teaching Notes and Overview . . . . . .74
8-1 Mini-Project: Percent and Estimation . . . . . . . . . . . . . . . . . . .75
8-3a Hands-On Lab Recording Sheet . . . . .76
8-4 Using Overhead Manipulatives: Percent of Change . . . . . . . . . . . . .77
CHAPTER 9Teaching Notes and Overview . . . . . .79
9-4 Using Overhead Manipulatives: Exploring Permutations . . . . . . . . .81
9-5a Hands-On Lab Recording Sheet . . . . .83
9-6 Mini-Project: Theoretical and Experimental Probability . . . . . . . .84
9-6b Hands-On Lab Recording Sheet . . . . .85
CHAPTER 10Teaching Notes and Overview . . . . . .86
10-1a Hands-On Lab Recording Sheet . . . . .90
10-1b Hands-On Lab Recording Sheet . . . . .91
10-2 Using Overhead Manipulatives: Jelly Bean Statistics . . . . . . . . . . . .92
10-3b Hands-On Lab Recording Sheet . . . . .93
10-4b Hands-On Lab Recording Sheet . . . . .94
10-5 Using Overhead Manipulatives: Investigating Triangles and Quadrilaterals . . . . . . . . . . . . . . . . .95
10-7 Mini-Project: Quadrilateral Tesselations . . . . . . . . . . . . . . . . . .97
10-7 Using Overhead Manipulatives:Angles of a Polygon . . . . . . . . . . . .98
10-7 Using Overhead Manipulatives: Inscribed Polygons . . . . . . . . . . . .100
10-8b Using Overhead Manipulatives: Dilations . . . . . . . . . . . . . . . . . . .102
10-9b Hands-On Lab Recording Sheet . . . .104
CHAPTER 11Teaching Notes and Overview . . . . .105
11-3a Hands-On Lab Recording Sheet . . . .107
11-4 Using Overhead Manipulatives: Area . . . . . . . . . . . . . . . . . . . . . . .108
11-5a Hands-On Lab Recording Sheet . . . .110
11-6 Mini-Project: Areas of Circles, Rectangles, and Squares . . . . . . . .111
11-8 Using Overhead Manipulatives: Probability and Area Models . . . .112
CHAPTER 12Teaching Notes and Overview . . . . .114
12-1a Hands-On Lab Recording Sheet . . . .116
12-2 Using Overhead Manipulatives: Volume of Pyramids . . . . . . . . . . .117
12-3 Mini-Project: Volume of Solids . . . . .119
12-4a Hands-On Lab Recording Sheet . . . .120
12-4b Hands-On Lab Recording Sheet . . . .121
v
Teacher’s Guide to Using Teaching Mathematics with Manipulatives
The book contains two sections of masters—Easy-to-Make Manipulatives and activities forMiddle School Mathematics. Tabs help you
locate the activities for each chapter. A complete list ofmanipulatives available in each of the three types ofGlencoe Mathematics Manipulative Kits appears on thenext page.
Easy-to-Make ManipulativesThe first section of this book contains masters formaking your own manipulatives. To make moredurable manipulatives, consider using card stock. Tomake algebra tiles similar to those shown in theStudent Edition, have students use markers to color thetiles appropriately or use colored card stock.
You can also make transparencies of frequently useditems such as grid paper and number lines.
Activity MastersEach chapter begins with Teaching Notes andOverview that summarizes the activities for the chapterand includes sample answers. There are three types ofmasters.
Mini-Projects are short projects that enable students toindependently investigate mathematical concepts.
Using Overhead Manipulatives provides instructionsfor the teacher to demonstrate an alternate approach tothe concepts of the lesson by using manipulatives onthe overhead projector.
Student Recording Sheets accompany the Hands-OnLab Activities found in the Student Edition. Studentscan easily record the results of the activity on preparedgrids, charts, and figures.
vi
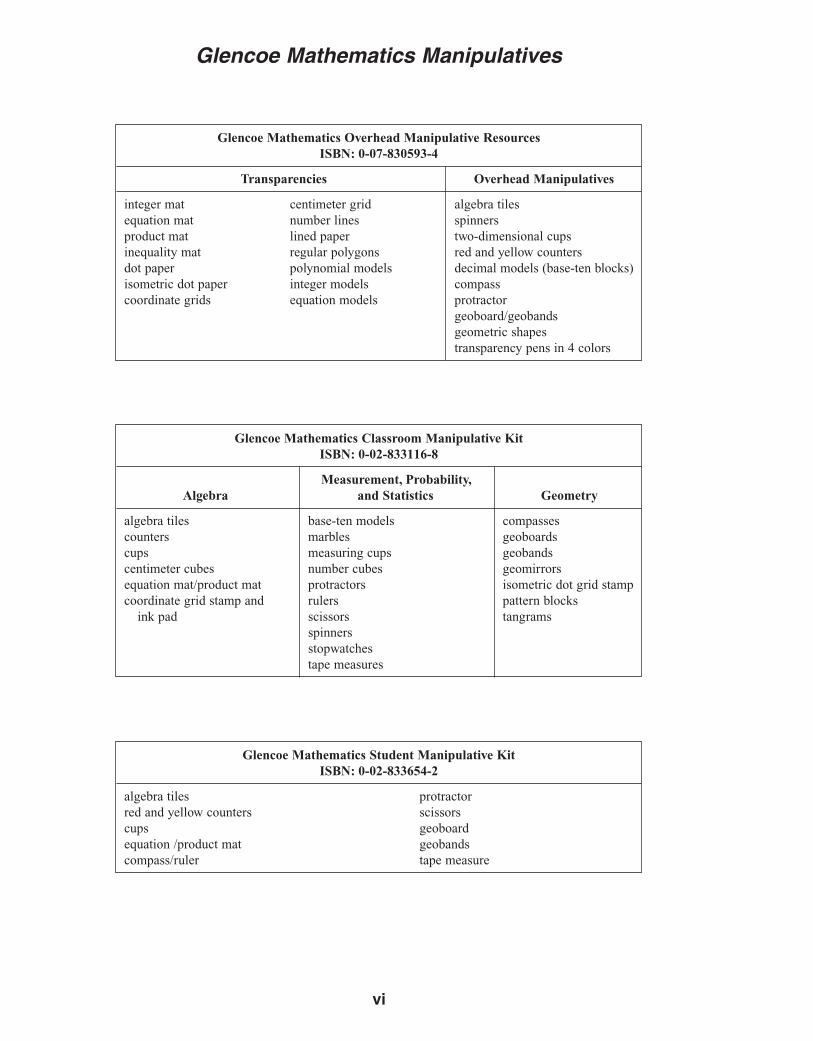
Glencoe Mathematics Manipulatives
Glencoe Mathematics Overhead Manipulative ResourcesISBN: 0-07-830593-4
Transparencies Overhead Manipulatives
integer mat centimeter grid algebra tilesequation mat number lines spinnersproduct mat lined paper two-dimensional cupsinequality mat regular polygons red and yellow countersdot paper polynomial models decimal models (base-ten blocks)isometric dot paper integer models compasscoordinate grids equation models protractor
geoboard/geobandsgeometric shapestransparency pens in 4 colors
Glencoe Mathematics Classroom Manipulative KitISBN: 0-02-833116-8
Measurement, Probability,Algebra and Statistics Geometry
algebra tiles base-ten models compassescounters marbles geoboardscups measuring cups geobandscentimeter cubes number cubes geomirrorsequation mat/product mat protractors isometric dot grid stampcoordinate grid stamp and rulers pattern blocks
ink pad scissors tangramsspinnersstopwatchestape measures
Glencoe Mathematics Student Manipulative KitISBN: 0-02-833654-2
algebra tiles protractorred and yellow counters scissorscups geoboardequation /product mat geobandscompass/ruler tape measure
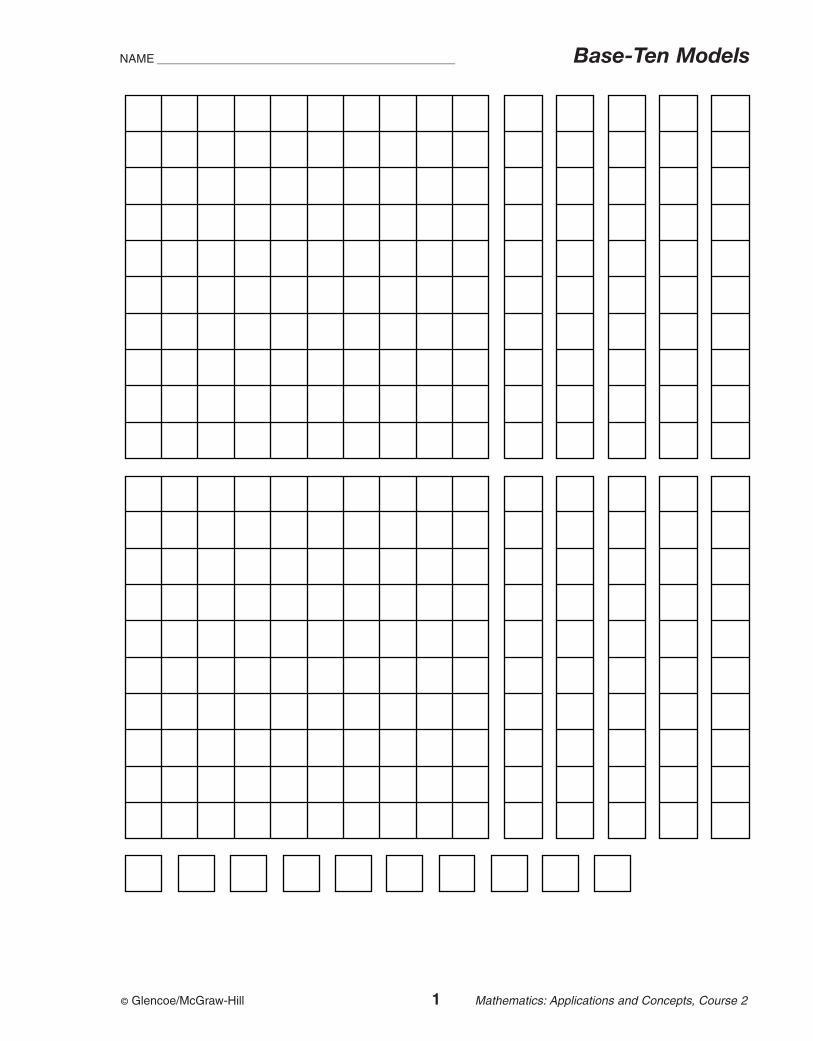
© Glencoe/McGraw-Hill 1 Mathematics: Applications and Concepts, Course 2
NAME ______________________________________________ Base-Ten Models
© Glencoe/McGraw-Hill 2 Mathematics: Applications and Concepts, Course 2
NAME ______________________________________________ Decimal Models
© Glencoe/McGraw-Hill 3 Mathematics: Applications and Concepts, Course 2
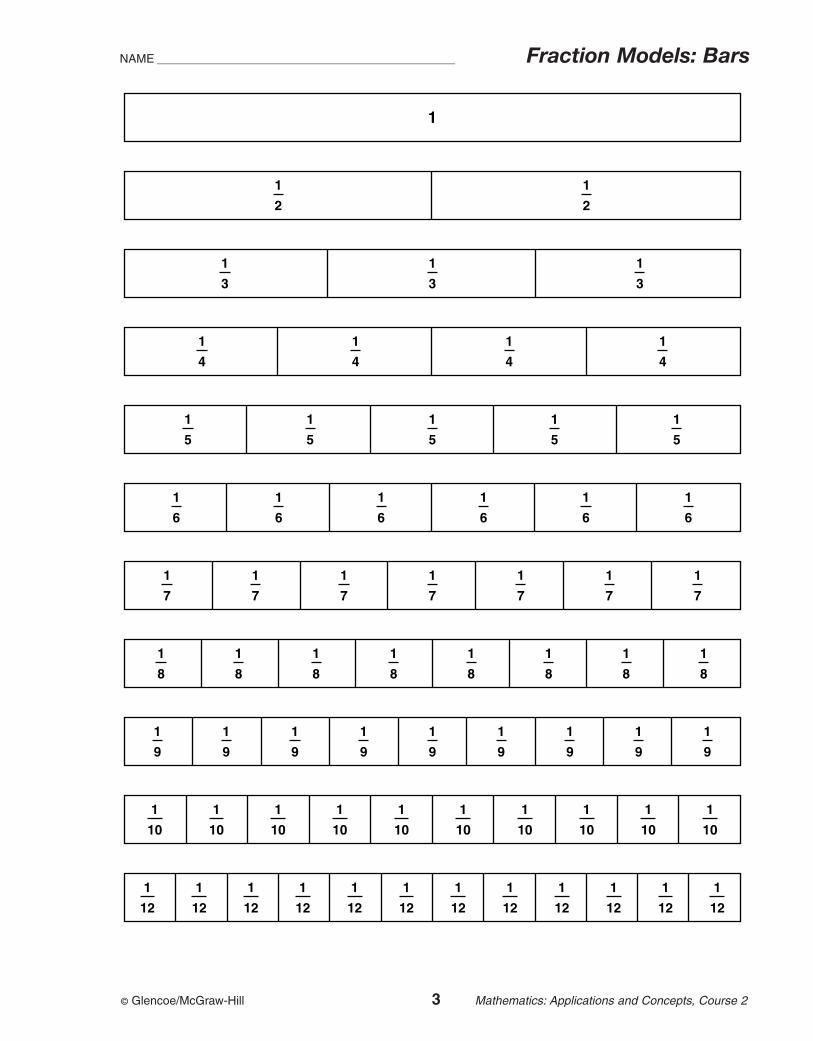
NAME ______________________________________________ Fraction Models: Bars
1
1
2
1
2
1
12
1
12
1
12
1
12
1
12
1
12
1
12
1
12
1
12
1
12
1
12
1
12
1
10
1
10
1
10
1
10
1
10
1
10
1
10
1
10
1
10
1
10
1
9
1
9
1
9
1
9
1
9
1
9
1
9
1
9
1
9
1
8
1
8
1
8
1
8
1
8
1
8
1
8
1
8
1
7
1
7
1
7
1
7
1
7
1
7
1
7
1
6
1
6
1
6
1
6
1
6
1
6
1
5
1
5
1
5
1
5
1
5
1
4
1
4
1
4
1
4
1
3
1
3
1
3
© Glencoe/McGraw-Hill 4 Mathematics: Applications and Concepts, Course 2
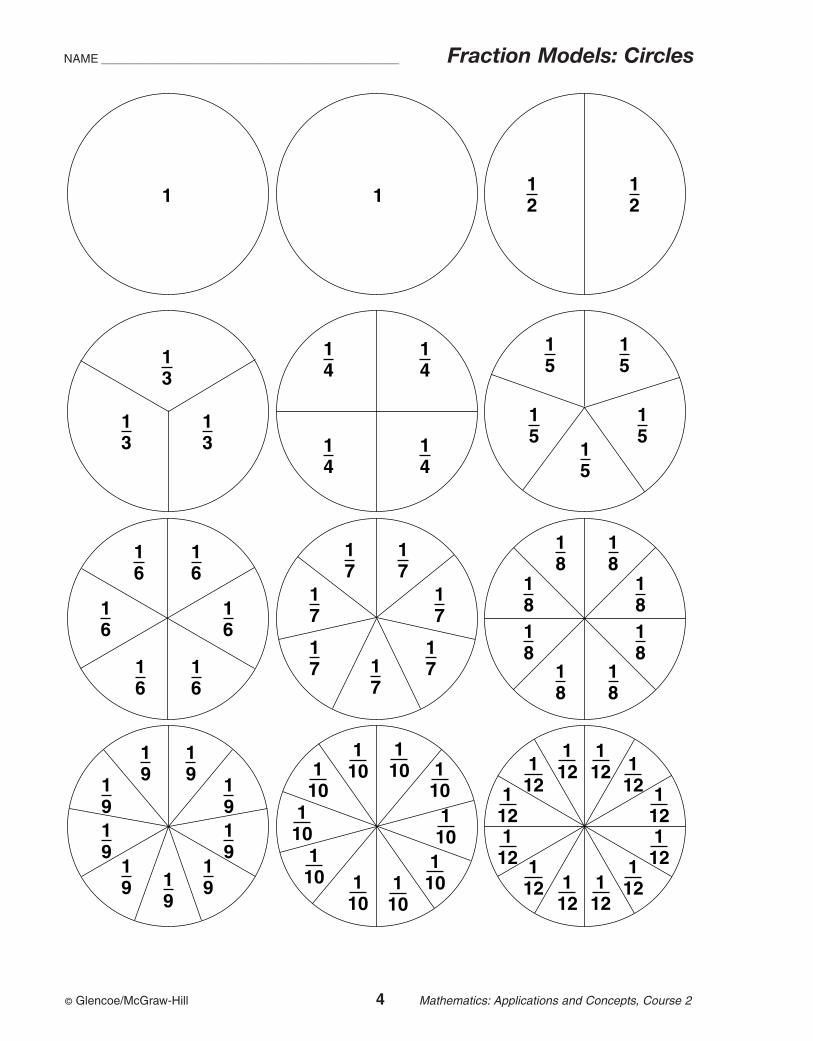
NAME ______________________________________________ Fraction Models: Circles
1 112
12
15
15
15
15
15
14
14
14
13
13
13
16
16
16
16
17
17
17
17 1
7
17
17
18
18
18
18
18
19
19
19
19
110
110
110
110
112
112
112
112
112 1
12112
112112
112
112
112
110
110 1
10110
110
1101
919 1
9
19
19
18
18
18
16
16
14
© Glencoe/McGraw-Hill 5 Mathematics: Applications and Concepts, Course 2
NAME ______________________________________________ Counters
© Glencoe/McGraw-Hill 6 Mathematics: Applications and Concepts, Course 2
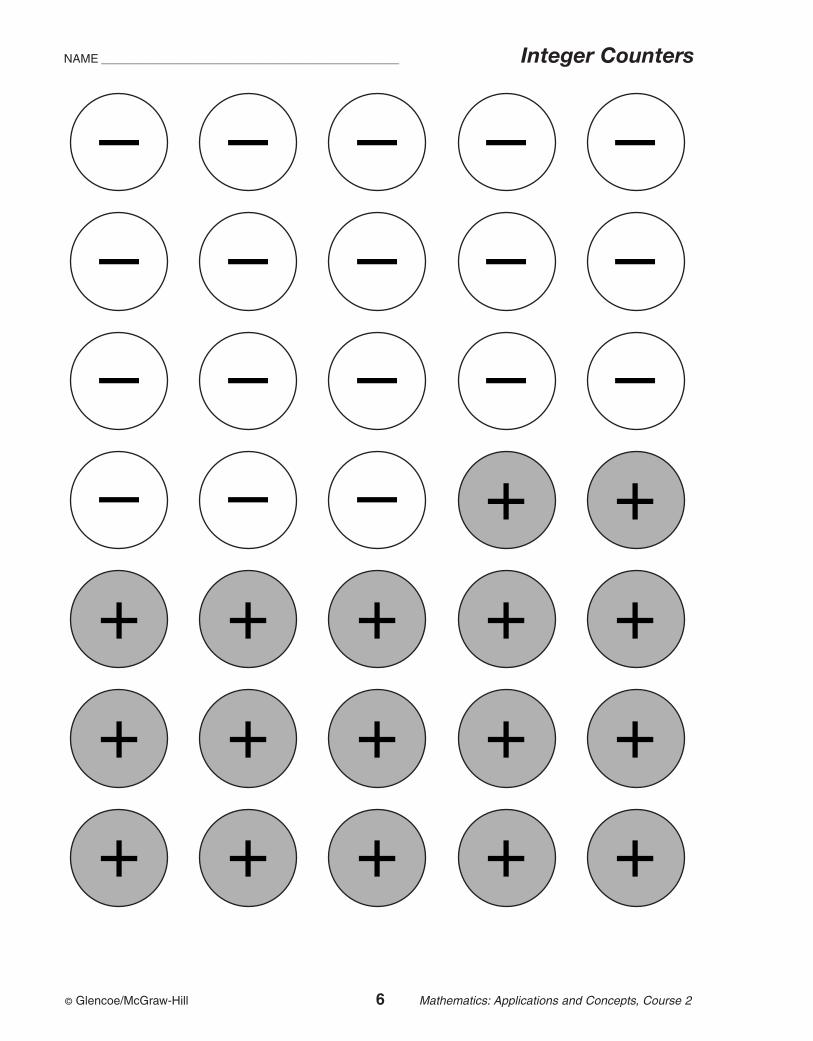
NAME ______________________________________________ Integer Counters
+++++
+++++
+++++
++–––
–––––
–––––
–––––
© Glencoe/McGraw-Hill 7 Mathematics: Applications and Concepts, Course 2
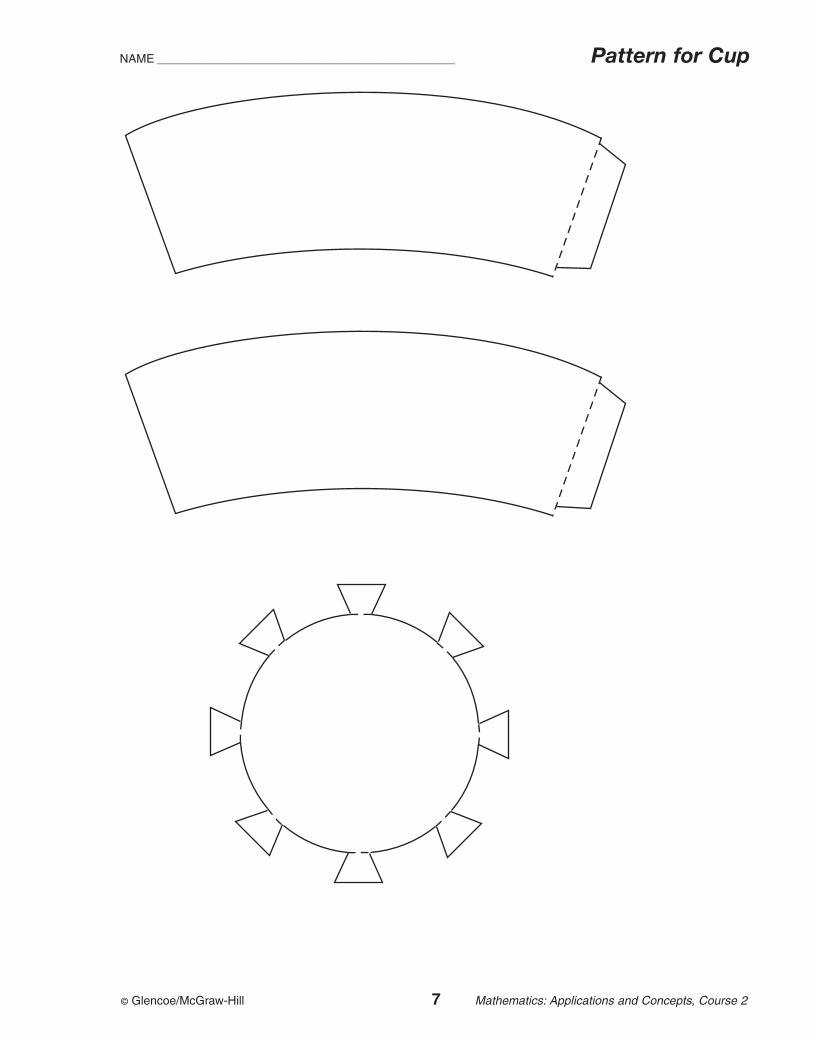
NAME ______________________________________________ Pattern for Cup
© Glencoe/McGraw-Hill 8 Mathematics: Applications and Concepts, Course 2
NAME ______________________________________________ Integer Mat
© Glencoe/McGraw-Hill 9 Mathematics: Applications and Concepts, Course 2
NAME ______________________________________________ Equation Mat
=
© Glencoe/McGraw-Hill 10 Mathematics: Applications and Concepts, Course 2
NAME ______________________________________________ Quarter-Inch Grid
© Glencoe/McGraw-Hill 11 Mathematics: Applications and Concepts, Course 2
NAME ______________________________________________ Centimeter Grid
© Glencoe/McGraw-Hill 12 Mathematics: Applications and Concepts, Course 2
NAME ______________________________________________ Square Dot Paper
© Glencoe/McGraw-Hill 13 Mathematics: Applications and Concepts, Course 2
NAME ______________________________________________ Isometric Dot Paper
© Glencoe/McGraw-Hill 14 Mathematics: Applications and Concepts, Course 2
NAME ______________________________________________ Tangram
© Glencoe/McGraw-Hill 15 Mathematics: Applications and Concepts, Course 2
NAME ______________________________________________ Number Lines
–11–10
–9–8
–7–6
–5–4
–3–2
–10
12
34
56
78
910
11
01
23
45
67
89
1011
1213
1415
1617
1819
2021
22
01
23
45
67
89
© Glencoe/McGraw-Hill 16 Mathematics: Applications and Concepts, Course 2
NAME ______________________________________________ First-Quadrant Grids
10
9
8
7
6
5
4
3
2
1
O 1 2 3 4 5 6 7 8 9 10
10
9
8
7
6
5
4
3
2
1
O 1 2 3 4 5 6 7 8 9 10
© Glencoe/McGraw-Hill 17 Mathematics: Applications and Concepts, Course 2
NAME ______________________________________________ Coordinate Planes
© Glencoe/McGraw-Hill 18 Mathematics: Applications and Concepts, Course 2
NAME ______________________________________________ Percent Models
© Glencoe/McGraw-Hill 19 Mathematics: Applications and Concepts, Course 2
NAME ______________________________________________ Spinners
© Glencoe/McGraw-Hill 20 Mathematics: Applications and Concepts, Course 2
NAME ______________________________________________ Number Cube Patterns
2
13 4
9 2 14
3
5
© Glencoe/McGraw-Hill 21 Mathematics: Applications and Concepts, Course 2
NAME ______________________________________________ Protractors
9080
100
100
80
110
70
120
60130
50
140
40 15030 16020
17010
1800
70
11060
12050
130
4014
0
30
150
20
160
10
170
0 180
9080
100
100
80
110
70
120
60130
50
140
40 15030 16020
17010
1800
70
11060
12050
130
4014
0
30
150
2010
170
0 180
9080
100
100
80
110
70
120
60130
50
140
40 15030 16020
17010
180070
11060
12050
130
4014
0
30
150
2010
170
0 180
9080
100
100
80
110
70
120
60130
50
140
40 15030 16020
17010
1800
70
11060
12050
130
4014
0
30
150
20
160
10
170
0 180
9080
100
100
80
110
70
120
60130
50
140
40 15030 16020
17010
1800
70
11060
12050
130
4014
0
30
150
2010
170
0 180
9080
100
100
80
110
70
120
60130
50
140
40 15030 16020
17010
1800
70
11060
12050
130
4014
0
30
150
2010
170
0 180
160
160
160
160
© Glencoe/McGraw-Hill 22 Mathematics: Applications and Concepts, Course 2
NAME ______________________________________________ Rectangular Prism Pattern
© Glencoe/McGraw-Hill 23 Mathematics: Applications and Concepts, Course 2
NAME ______________________________________________ Cube Pattern
© Glencoe/McGraw-Hill 24 Mathematics: Applications and Concepts, Course 2
NAME ______________________________________________ Cylinder Pattern
© Glencoe/McGraw-Hill 25 Mathematics: Applications and Concepts, Course 2
NAME ______________________________________________ Cone Pattern
© Glencoe/McGraw-Hill 26 Mathematics: Applications and Concepts, Course 2
NAME ______________________________________________ Pyramid Pattern
© Glencoe/McGraw-Hill 27 Mathematics: Applications and Concepts, Course 2
NAME ______________________________________________ Pattern Blocks
© Glencoe/McGraw-Hill 28 Mathematics: Applications and Concepts, Course 2
NAME ______________________________________________ Circle Graph Template
0%95%90%
85%
80%
75%
70%
65%
60%
55% 50%45%
40%
35%
30%
25%
20%
15%
10%
5%
14
23
13
15
16
18
110
© Glencoe/McGraw-Hill 29 Mathematics: Applications and Concepts, Course 2
NAME ______________________________________________ Problem Solving Guide
Problem: Explore
ExamineThese stepscan helpyou solveproblems.
Plan
Solve
© Glencoe/McGraw-Hill 30 Mathematics: Applications and Concepts, Course 2
Decimal Patterns and AlgebraTeaching Notes and Overview
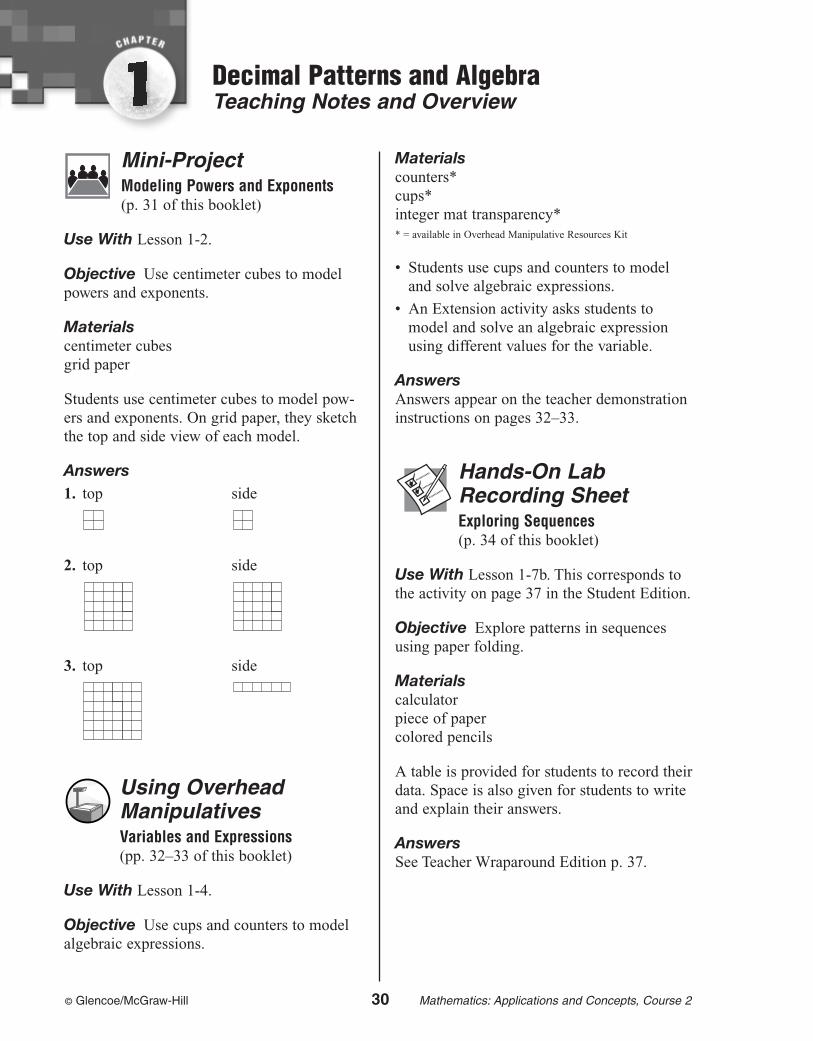
Mini-ProjectModeling Powers and Exponents(p. 31 of this booklet)
Use With Lesson 1-2.
Objective Use centimeter cubes to modelpowers and exponents.
Materials centimeter cubesgrid paper
Students use centimeter cubes to model pow-ers and exponents. On grid paper, they sketchthe top and side view of each model.
Answers1. top side
2. top side
3. top side
Using OverheadManipulativesVariables and Expressions(pp. 32–33 of this booklet)
Use With Lesson 1-4.
Objective Use cups and counters to modelalgebraic expressions.
Materialscounters*cups*integer mat transparency** = available in Overhead Manipulative Resources Kit
• Students use cups and counters to modeland solve algebraic expressions.
• An Extension activity asks students tomodel and solve an algebraic expressionusing different values for the variable.
AnswersAnswers appear on the teacher demonstrationinstructions on pages 32–33.
Hands-On LabRecording Sheet Exploring Sequences(p. 34 of this booklet)
Use With Lesson 1-7b. This corresponds tothe activity on page 37 in the Student Edition.
Objective Explore patterns in sequencesusing paper folding.
Materials calculatorpiece of papercolored pencils
A table is provided for students to record theirdata. Space is also given for students to writeand explain their answers.
AnswersSee Teacher Wraparound Edition p. 37.
© Glencoe/McGraw-Hill 31 Mathematics: Applications and Concepts, Course 2
Mini-Project(Use with Lesson 1-2)
NAME ______________________________________________ DATE ____________ PERIOD __________
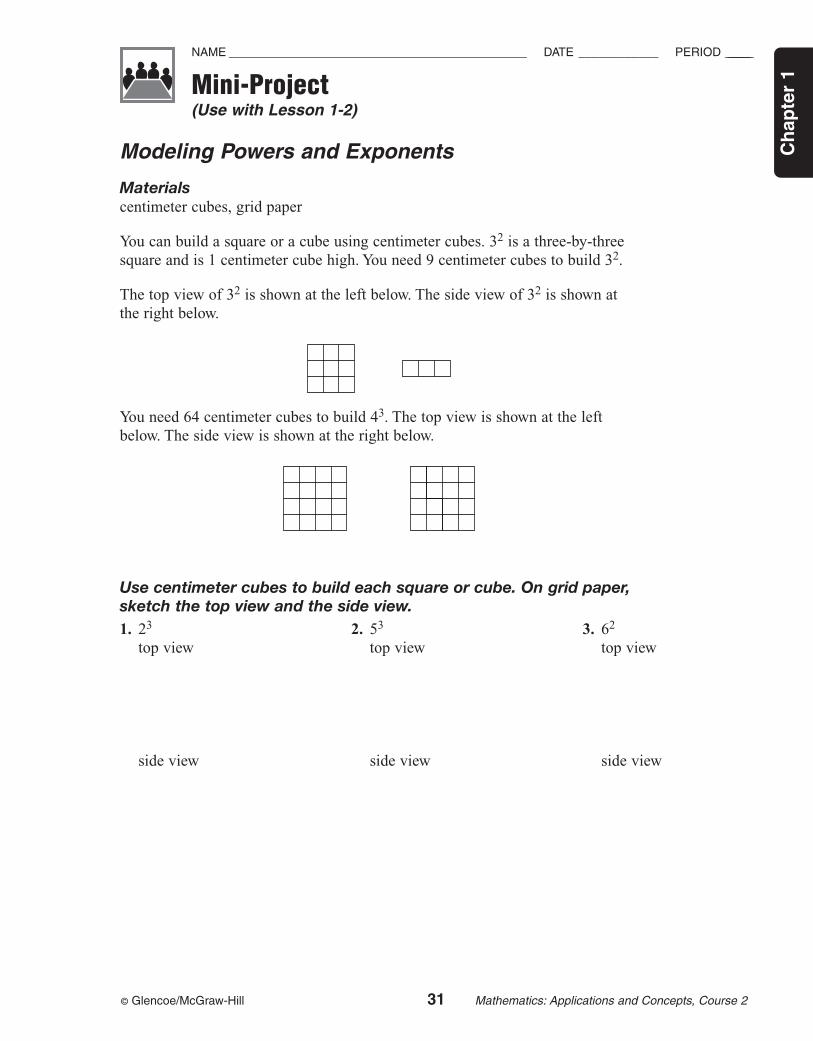
Use centimeter cubes to build each square or cube. On grid paper, sketch the top view and the side view.1. 23 2. 53 3. 62
top view top view top view
side view side view side view
Modeling Powers and Exponents
Materialscentimeter cubes, grid paper
You can build a square or a cube using centimeter cubes. 32 is a three-by-threesquare and is 1 centimeter cube high. You need 9 centimeter cubes to build 32.
The top view of 32 is shown at the left below. The side view of 32 is shown atthe right below.
You need 64 centimeter cubes to build 43. The top view is shown at the leftbelow. The side view is shown at the right below.
Ch
apte
r 1
© Glencoe/McGraw-Hill 32 Mathematics: Applications and Concepts, Course 2
Using Overhead Manipulatives(Use with Lesson 1-4)
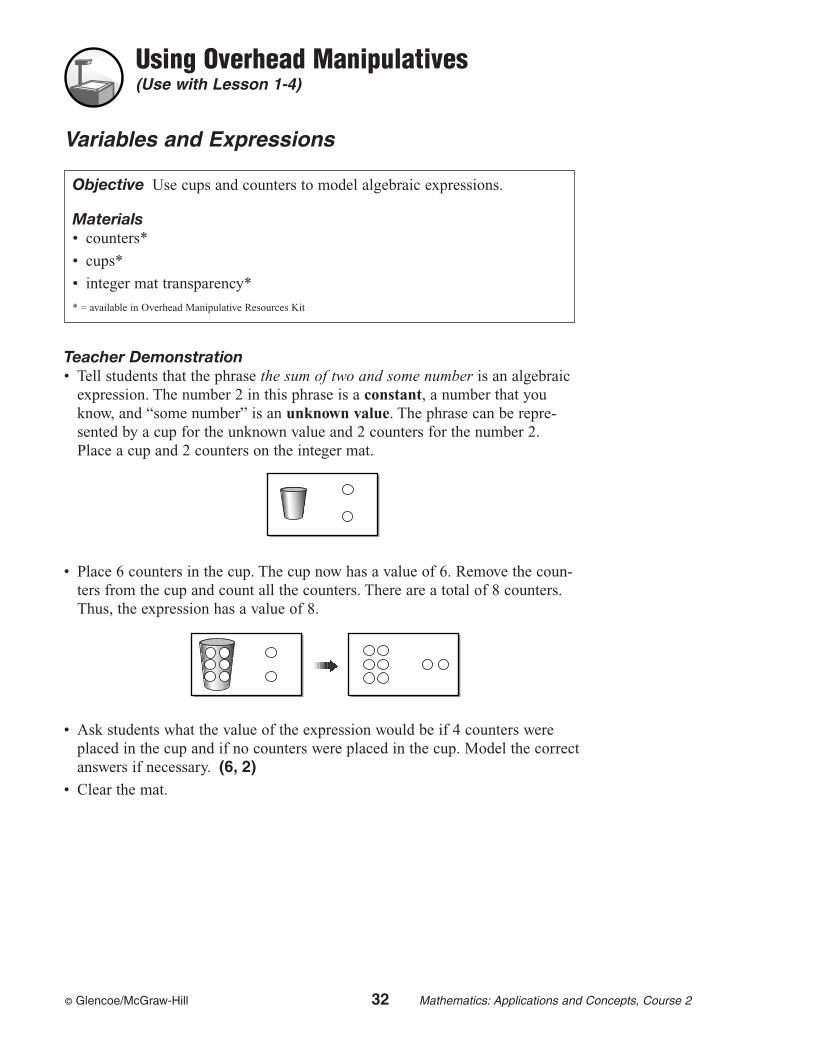
Variables and Expressions
Teacher Demonstration • Tell students that the phrase the sum of two and some number is an algebraic
expression. The number 2 in this phrase is a constant, a number that youknow, and “some number” is an unknown value. The phrase can be repre-sented by a cup for the unknown value and 2 counters for the number 2. Place a cup and 2 counters on the integer mat.
• Place 6 counters in the cup. The cup now has a value of 6. Remove the coun-ters from the cup and count all the counters. There are a total of 8 counters.Thus, the expression has a value of 8.
• Ask students what the value of the expression would be if 4 counters wereplaced in the cup and if no counters were placed in the cup. Model the correctanswers if necessary. (6, 2)
• Clear the mat.
Objective Use cups and counters to model algebraic expressions.
Materials• counters*
• cups*
• integer mat transparency*
* = available in Overhead Manipulative Resources Kit
© Glencoe/McGraw-Hill 33 Mathematics: Applications and Concepts, Course 2
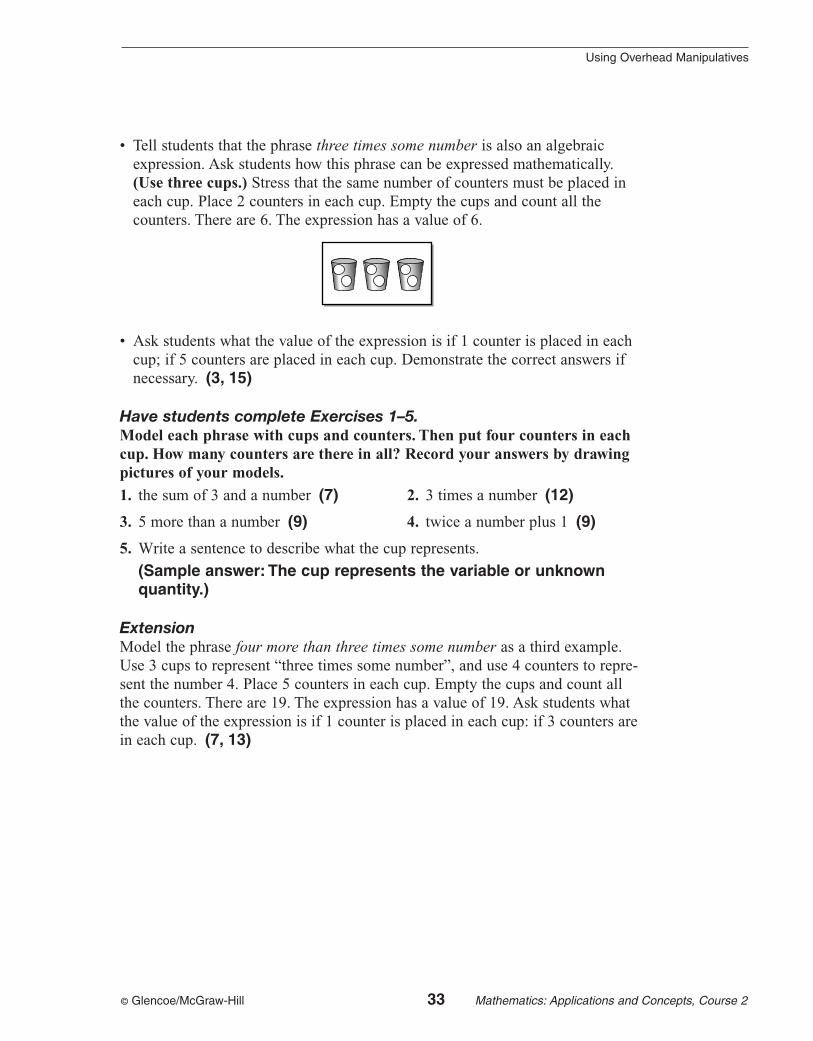
• Tell students that the phrase three times some number is also an algebraicexpression. Ask students how this phrase can be expressed mathematically.(Use three cups.) Stress that the same number of counters must be placed ineach cup. Place 2 counters in each cup. Empty the cups and count all thecounters. There are 6. The expression has a value of 6.
• Ask students what the value of the expression is if 1 counter is placed in eachcup; if 5 counters are placed in each cup. Demonstrate the correct answers ifnecessary. (3, 15)
Have students complete Exercises 1–5.Model each phrase with cups and counters. Then put four counters in eachcup. How many counters are there in all? Record your answers by drawingpictures of your models.
1. the sum of 3 and a number (7) 2. 3 times a number (12)
3. 5 more than a number (9) 4. twice a number plus 1 (9)
5. Write a sentence to describe what the cup represents.
(Sample answer: The cup represents the variable or unknownquantity.)
ExtensionModel the phrase four more than three times some number as a third example.Use 3 cups to represent “three times some number”, and use 4 counters to repre-sent the number 4. Place 5 counters in each cup. Empty the cups and count allthe counters. There are 19. The expression has a value of 19. Ask students whatthe value of the expression is if 1 counter is placed in each cup: if 3 counters arein each cup. (7, 13)
Using Overhead Manipulatives
© Glencoe/McGraw-Hill 34 Mathematics: Applications and Concepts, Course 2
Hands-On Lab Recording Sheet(Use with the activity on page 37 in Lesson 1-7b of the Student Edition)
NAME ______________________________________________ DATE ____________ PERIOD __________
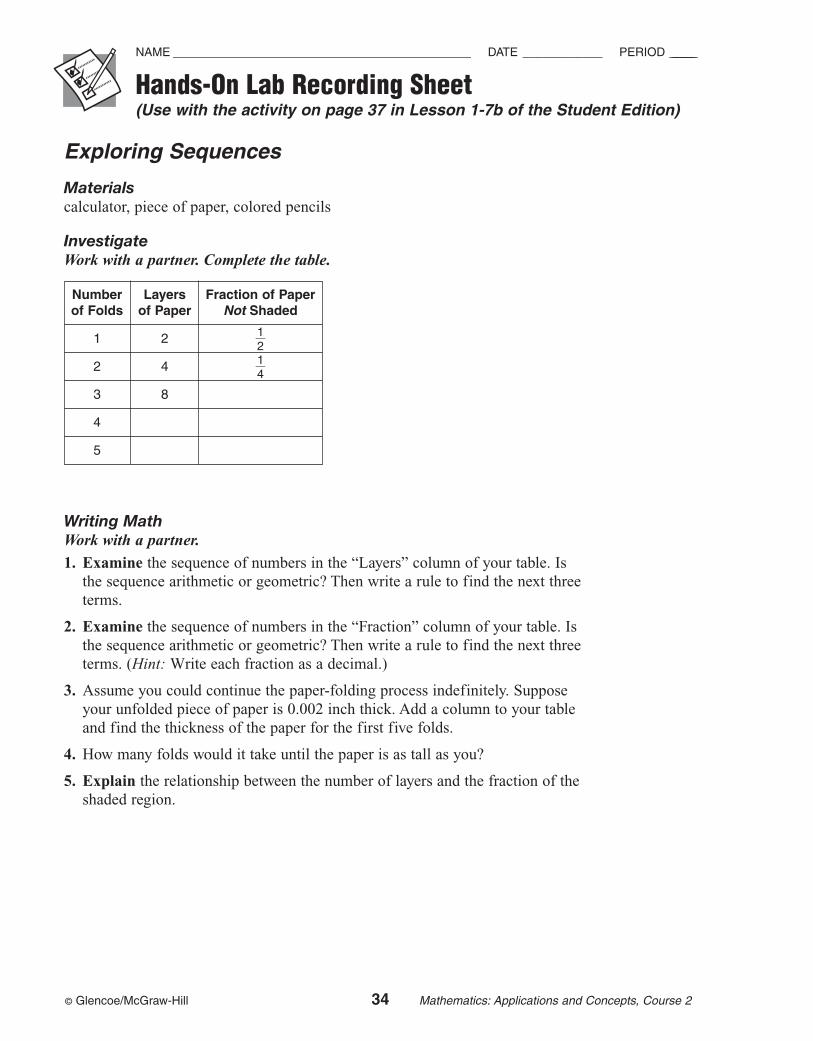
Exploring Sequences
Materialscalculator, piece of paper, colored pencils
InvestigateWork with a partner. Complete the table.
Writing MathWork with a partner.
1. Examine the sequence of numbers in the “Layers” column of your table. Isthe sequence arithmetic or geometric? Then write a rule to find the next threeterms.
2. Examine the sequence of numbers in the “Fraction” column of your table. Isthe sequence arithmetic or geometric? Then write a rule to find the next threeterms. (Hint: Write each fraction as a decimal.)
3. Assume you could continue the paper-folding process indefinitely. Supposeyour unfolded piece of paper is 0.002 inch thick. Add a column to your tableand find the thickness of the paper for the first five folds.
4. How many folds would it take until the paper is as tall as you?
5. Explain the relationship between the number of layers and the fraction of theshaded region.
Number Layers Fraction of Paperof Folds of Paper Not Shaded
1 2 �12
�
2 4 �14
�
3 8
4
5
© Glencoe/McGraw-Hill 35 Mathematics: Applications and Concepts, Course 2
Ch
apte
r 2
Statistics: Analyzing DataTeaching Notes and Overview
Mini-ProjectStory Graph(p. 37 of this booklet)
Use With Lesson 2-2.
Objective Interpret and describe a linegraph.
Materials none
Students interpret a given line graph anddescribe it by writing a story that fits the datashown.
Sample AnswerI left my house at 4:15 P.M. to go to the storefor Mom. She asked me to buy some milk andtortillas for dinner. I walked 5 minutes beforemeeting my friend, Lina. We talked for 5 min-utes. Then I continued walking to the store atthe same pace I had been walking. I arrived atthe store 10 minutes later. It took me 10 min-utes to buy milk and tortillas. On the wayhome, I walked a little faster because Momwanted the groceries by 5 P.M. I made it homein 10 minutes. I was early.
Hands-On Lab Recording Sheet Are You Average?(p. 38 of this booklet)
Use With Lesson 2-4b. This corresponds tothe activity on page 73 in the Student Edition.
Objective Use mean, median, mode, andrange to describe a set of data.
Materials markersruler
Students work in groups to collect data, createa frequency table, and create an appropriategraph to display their data. Students are askedto explain why they chose the type of graphthey did for their data.
AnswersSee Teacher Wraparound Edition p. 73.
Using OverheadManipulativesQuartiles(pp. 39–40 of this booklet)
Use With Lesson 2-6.
Objective Graph quartiles and determine theinterquartile range.
Materialsblank transparencies, prepared as described
belowtransparency pens** = available in Overhead Manipulative Resources Kit
• Students find and graph the upper andlower quartiles and the interquartile rangeof a given set of data.
• An Extension activity asks students to findand graph the upper and lower quartiles andthe interquartile range of a second set ofdata, then compare the two sets of data.
AnswersAnswers appear on the teacher demonstrationinstructions on pages 39–40.
© Glencoe/McGraw-Hill 36 Mathematics: Applications and Concepts, Course 2
Using OverheadManipulativesHow Much is a Handful?(p. 41 of this booklet)
Use With Lesson 2-8.
Objective Use data to make predictions.
Materialstransparency pens*11 blank transparencies40 counters** = available in Overhead Manipulative Resources Kit
• Students collect data by tracing their handson a transparency and counting the numberof counters it takes to cover the shape.
• Based on the data they have gathered, stu-dents then make predictions about the num-ber of counters needed to cover the hands ofother students and adults.
AnswersAnswers appear on the teacher demonstrationinstructions on page 41.
Chapter 2 Statistics: Analyzing Data
© Glencoe/McGraw-Hill 37 Mathematics: Applications and Concepts, Course 2
Mini-Project(Use with Lesson 2-2)
NAME ______________________________________________ DATE ____________ PERIOD __________
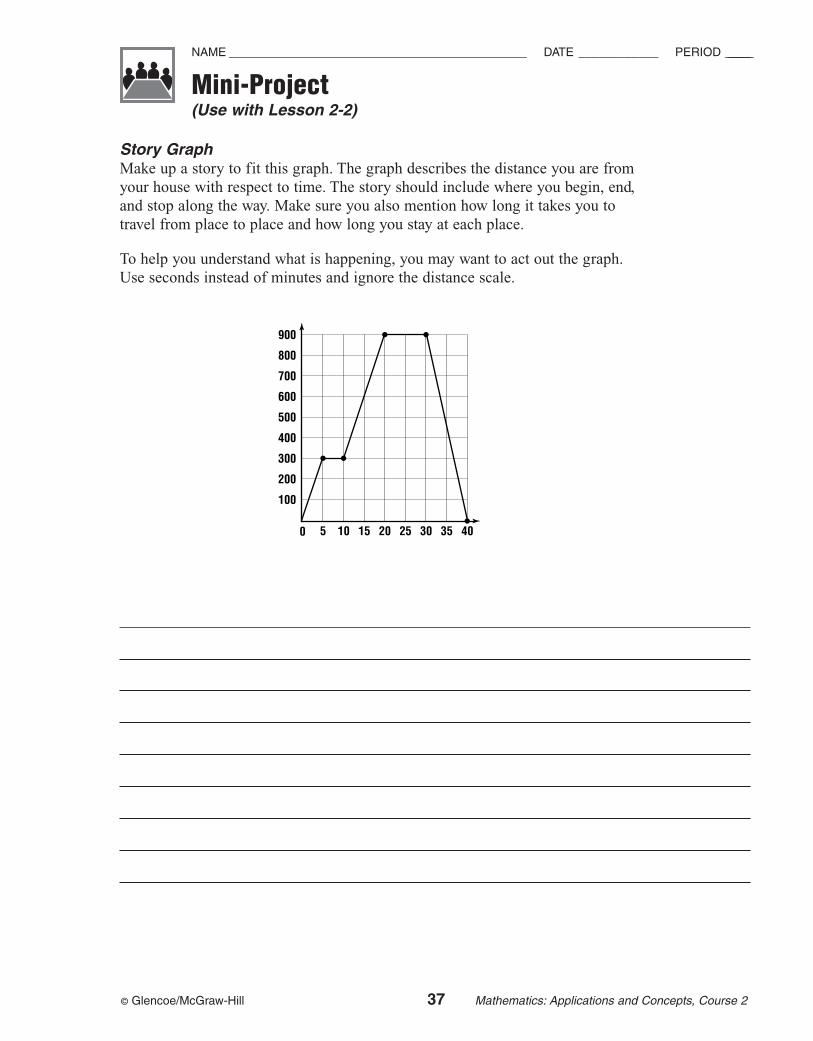
Story GraphMake up a story to fit this graph. The graph describes the distance you are fromyour house with respect to time. The story should include where you begin, end,and stop along the way. Make sure you also mention how long it takes you totravel from place to place and how long you stay at each place.
To help you understand what is happening, you may want to act out the graph.Use seconds instead of minutes and ignore the distance scale.
100
5 10 15 20 25 30 35 40
200
300
400
500
600
700
800
900
0
© Glencoe/McGraw-Hill 38 Mathematics: Applications and Concepts, Course 2
Hands-On Lab Recording Sheet(Use with the activity on page 73 in Lesson 2-4b of the Student Edition)
NAME ______________________________________________ DATE ____________ PERIOD __________
Are You Average?
Materialsmarkers, ruler
InvestigateWork in groups of four. Use the space provided below for your frequencytable.
• Find the mean, median, mode, and range of the data for each question ifappropriate. Which measure best describes each set of data? Justify youranswer.
• Create appropriate graphs to display your data from all ten questions. Eachgroup will present their graphs with a description of what the “average” stu-dent in your classroom is like.
Writing Math1. Explain why results may vary if you survey another class in your school.
2. Explain why your group selected the graph that you did to display your data.Could you have used another type of graph? Explain.
3. The word bias means to influence. Describe any factors that could haveunfairly influenced the responses given by your classmates. Is there a way tolimit bias in a survey?
Using Overhead Manipulatives(Use with Lesson 2-6)
Quartiles
Teacher Demonstration • Prepare blank transparencies with copies of the tables shown below and in the
Extension.
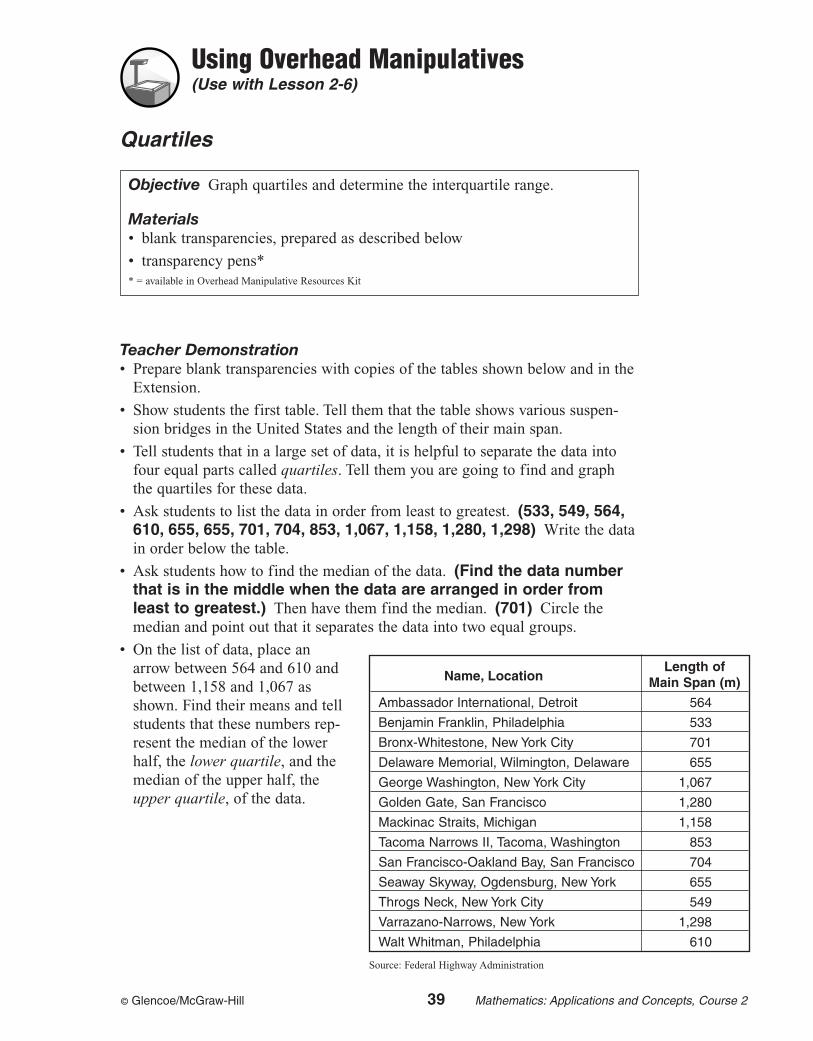
• Show students the first table. Tell them that the table shows various suspen-sion bridges in the United States and the length of their main span.
• Tell students that in a large set of data, it is helpful to separate the data intofour equal parts called quartiles. Tell them you are going to find and graphthe quartiles for these data.
• Ask students to list the data in order from least to greatest. (533, 549, 564,610, 655, 655, 701, 704, 853, 1,067, 1,158, 1,280, 1,298) Write the datain order below the table.
• Ask students how to find the median of the data. (Find the data numberthat is in the middle when the data are arranged in order fromleast to greatest.) Then have them find the median. (701) Circle themedian and point out that it separates the data into two equal groups.
• On the list of data, place anarrow between 564 and 610 andbetween 1,158 and 1,067 asshown. Find their means and tellstudents that these numbers rep-resent the median of the lowerhalf, the lower quartile, and themedian of the upper half, theupper quartile, of the data.
Objective Graph quartiles and determine the interquartile range.
Materials• blank transparencies, prepared as described below
• transparency pens** = available in Overhead Manipulative Resources Kit
Length ofName, Location Main Span (m)
Ambassador International, Detroit 564
Benjamin Franklin, Philadelphia 533
Bronx-Whitestone, New York City 701
Delaware Memorial, Wilmington, Delaware 655
George Washington, New York City 1,067
Golden Gate, San Francisco 1,280
Mackinac Straits, Michigan 1,158
Tacoma Narrows II, Tacoma, Washington 853
San Francisco-Oakland Bay, San Francisco 704
Seaway Skyway, Ogdensburg, New York 655
Throgs Neck, New York City 549
Varrazano-Narrows, New York 1,298
Walt Whitman, Philadelphia 610
Source: Federal Highway Administration
© Glencoe/McGraw-Hill 39 Mathematics: Applications and Concepts, Course 2
© Glencoe/McGraw-Hill 40 Mathematics: Applications and Concepts, Course 2
Using Overhead Manipulatives
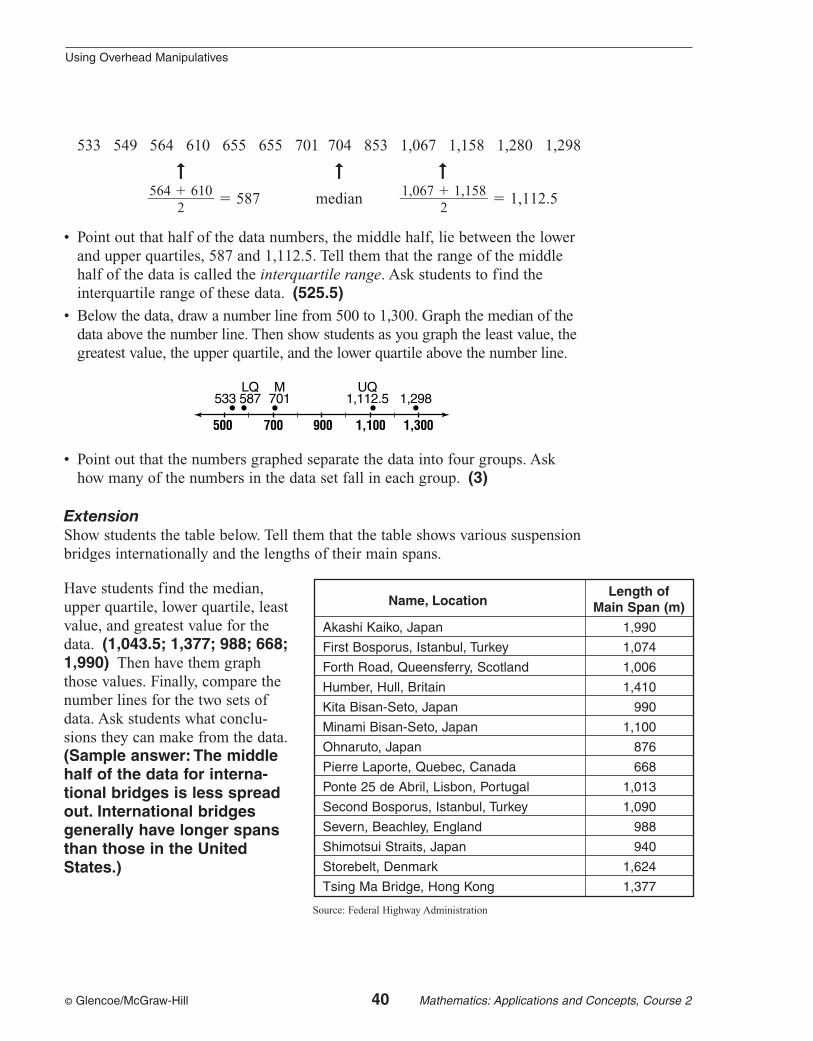
533 549 564 610 655 655 701 704 853 1,067 1,158 1,280 1,298
�564 �
2610
� � 587 median �1,067 �
21,158� � 1,112.5
• Point out that half of the data numbers, the middle half, lie between the lowerand upper quartiles, 587 and 1,112.5. Tell them that the range of the middlehalf of the data is called the interquartile range. Ask students to find theinterquartile range of these data. (525.5)
• Below the data, draw a number line from 500 to 1,300. Graph the median of thedata above the number line. Then show students as you graph the least value, thegreatest value, the upper quartile, and the lower quartile above the number line.
• Point out that the numbers graphed separate the data into four groups. Askhow many of the numbers in the data set fall in each group. (3)
ExtensionShow students the table below. Tell them that the table shows various suspensionbridges internationally and the lengths of their main spans.
Have students find the median,upper quartile, lower quartile, leastvalue, and greatest value for thedata. (1,043.5; 1,377; 988; 668;1,990) Then have them graphthose values. Finally, compare thenumber lines for the two sets ofdata. Ask students what conclu-sions they can make from the data.(Sample answer: The middlehalf of the data for interna-tional bridges is less spreadout. International bridgesgenerally have longer spansthan those in the UnitedStates.)
500 1,3001,100900700
LQ587533
M701
UQ1,112.5 1,298
➞ ➞ ➞
Length ofName, Location Main Span (m)
Akashi Kaiko, Japan 1,990
First Bosporus, Istanbul, Turkey 1,074
Forth Road, Queensferry, Scotland 1,006
Humber, Hull, Britain 1,410
Kita Bisan-Seto, Japan 990
Minami Bisan-Seto, Japan 1,100
Ohnaruto, Japan 876
Pierre Laporte, Quebec, Canada 668
Ponte 25 de Abril, Lisbon, Portugal 1,013
Second Bosporus, Istanbul, Turkey 1,090
Severn, Beachley, England 988
Shimotsui Straits, Japan 940
Storebelt, Denmark 1,624
Tsing Ma Bridge, Hong Kong 1,377
Source: Federal Highway Administration
© Glencoe/McGraw-Hill 41 Mathematics: Applications and Concepts, Course 2
Using Overhead Manipulatives(Use with Lesson 2-8)
How Much is a Handful?
Teacher Demonstration • Ask four volunteers to trace the outline of their hand on a transparency.
• Place one of the outlines on the overhead and cover the shape with counters.Count the counters used and record on a fifth transparency. Repeat the proce-dure for each of the three outlines.
• Find the mode, median, and mean of the data. Ask the students which of these“averages” is most representative of the data.
• Discuss the most effective way to present the data. Alternatives include thefrequency table, bar graph, line plot, or stem-and-leaf plot. Use the sixth blanktransparency to prepare the data in the agreed-upon manner.
• Ask students to predict how many counters would be needed to cover a handoutline for a student in the same grade but not in the class.
• Have students randomly choose four students who are not in your class andtrace the outline of their hands on a transparency. Record the counters neededto cover the shape. Have students compare the number of counters with theirprediction.
• Trace your own hand on a transparency and find the number of countersneeded to cover the shape. Ask how this number compares with the other data.(In most cases, it will be greater than the average of the studentdata.)
• Ask whether you could use the information about the teacher’s hand to predictabout how many counters would cover other adults’ hands. (Data from oneadult would not be sufficient to predict for other adults.)
Objective Use data to make predictions.
Materials• transparency pens*
• 11 blank transparencies
• 40 counters** = available in Overhead Manipulative Resources Kit
© Glencoe/McGraw-Hill 42 Mathematics: Applications and Concepts, Course 2
Algebra: IntegersTeaching Notes and Overview
Mini-ProjectCoordinate Plane Puzzle (p. 44 of this booklet)
Use With Lesson 3-3.
Objective Locate points for ordered pairs ona coordinate plane
Materials none
Given ordered pairs, students locate theappropriate points labeled on a coordinateplane. Students solve the puzzle by matchingeach point with the correct ordered pair.
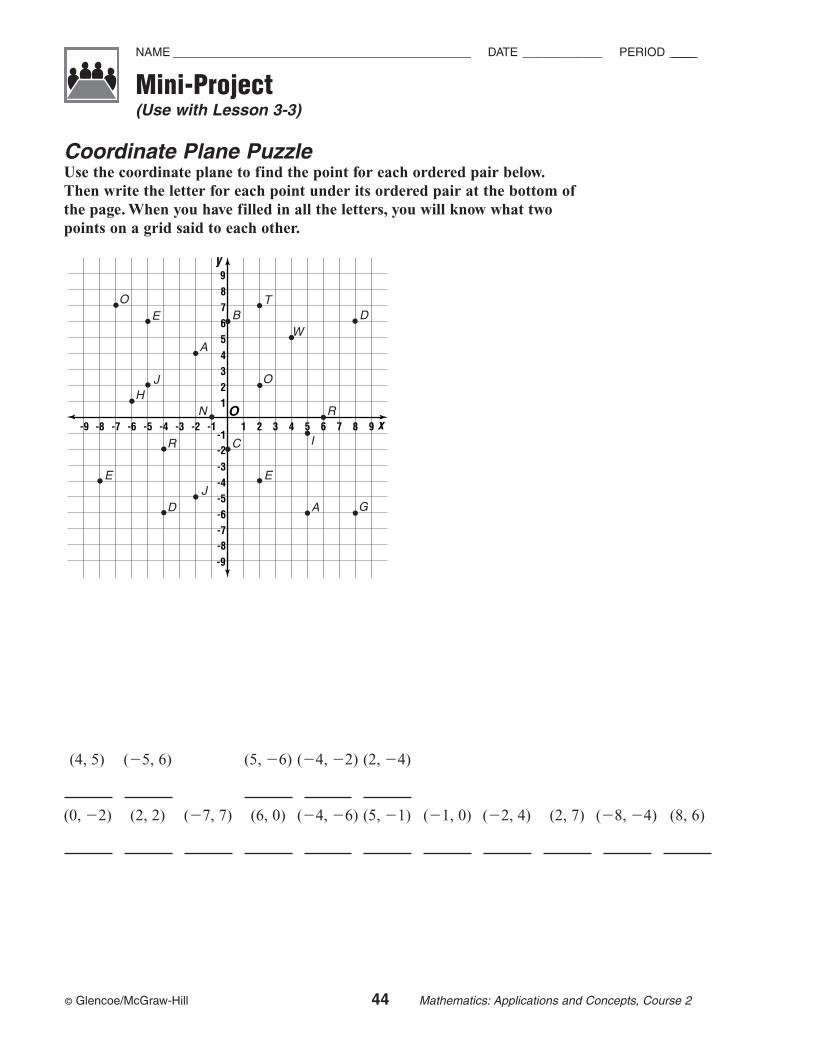
AnswerWE ARE COORDINATED!
Hands-On LabRecording Sheet Adding Integers (p. 45 of this booklet)
Use With Lesson 3-4a. This corresponds tothe activity on pages 118–119 in the StudentEdition.
Objective Use counters to model the addi-tion of integers.
Materials countersinteger mat
Students use counters to add integers. Spaceis provided for students to explain their work.They will write their own addition sentencesand draw conclusions on how to add integers.
AnswersSee Teacher Wraparound Edition pp. 118–119.
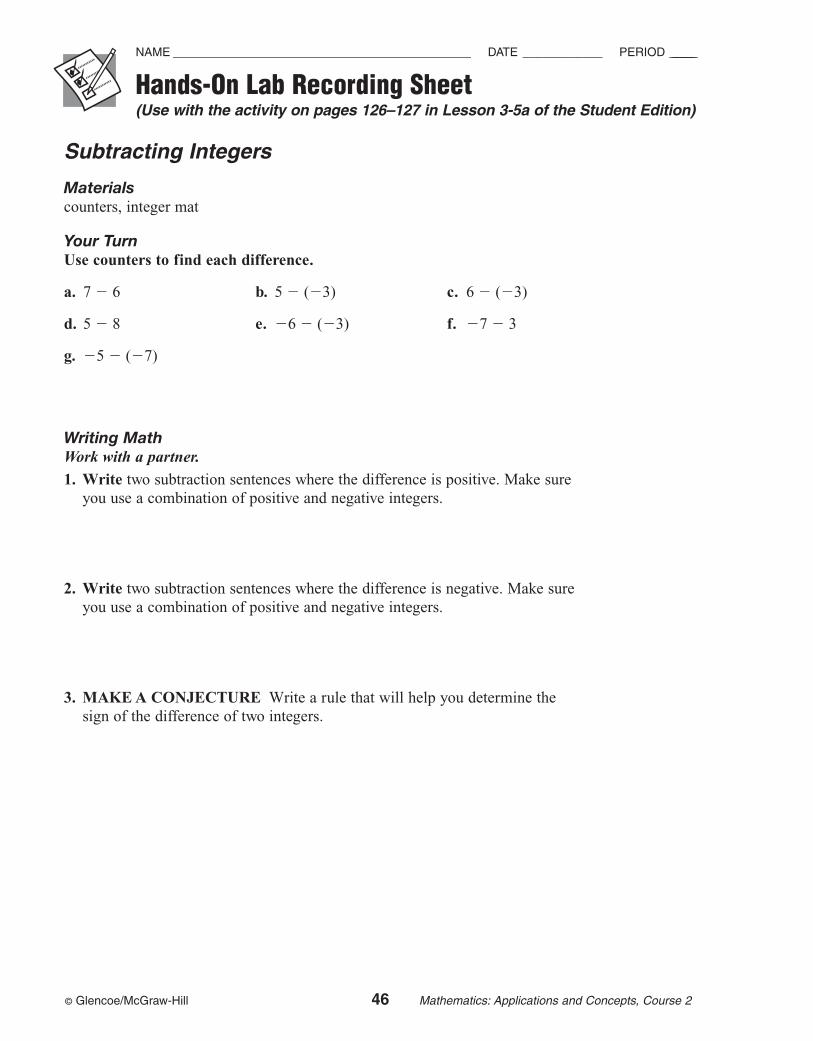
Hands-On LabRecording Sheet Subtracting Integers(p. 46 of this booklet)
Use With Lesson 3-5a. This corresponds tothe activity on pages 126–127 in the StudentEdition.
Objective Use counters to model the sub-traction of integers.
Materials countersinteger mat
Students use counters to subtract integers.Space is provided for students to explain theirwork. They will write their own subtractionsentences and draw conclusions on how tosubtract integers.
AnswersSee Teacher Wraparound Edition pp. 126–127.
© Glencoe/McGraw-Hill 43 Mathematics: Applications and Concepts, Course 2
Using OverheadManipulativesMultiplying Integers(pp. 47–48 of this booklet)
Use With Lesson 3-6.
Objective Multiply integers by usingmodels.
Materialscounters*integer mat transparency*transparency pen** = available in Overhead Manipulative Resources Kit
This demonstration contains two activities.• Demonstration 1 shows how to model the
multiplication of two positive integers or apositive and a negative integer.
• Demonstration 2 shows how to model themultiplication of two negative integers.
• Extension questions ask students to modeland solve integer multiplication problemsindependently.
AnswersAnswers appear on the teacher demonstrationinstructions on pages 47–48.
Chapter 3 Algebra: Integers
Ch
apte
r 3
© Glencoe/McGraw-Hill 44 Mathematics: Applications and Concepts, Course 2
Mini-Project(Use with Lesson 3-3)
NAME ______________________________________________ DATE ____________ PERIOD __________
(4, 5) (�5, 6) (5, �6) (�4, �2) (2, �4)
(0, �2) (2, 2) (�7, 7) (6, 0) (�4, �6) (5, �1) (�1, 0) (�2, 4) (2, 7) (�8, �4) (8, 6)
Coordinate Plane PuzzleUse the coordinate plane to find the point for each ordered pair below.Then write the letter for each point under its ordered pair at the bottom ofthe page. When you have filled in all the letters, you will know what twopoints on a grid said to each other.
x
y
O-8 -7 -6 -5 -4 -3 -1-2 1 2 3 4 5 6 7 8
-7-8
-6-5-4-3
-1-2
5678
1234
W
A
I
E
R
A
HJ
J
B
G
T
E
D
C
O
O
R
D
N
E
-9
9
9
-9
© Glencoe/McGraw-Hill 45 Mathematics: Applications and Concepts, Course 2
Hands-On Lab Recording Sheet(Use with the activity on pages 118–119 in Lesson 3-4a of the Student Edition)
NAME ______________________________________________ DATE ____________ PERIOD __________
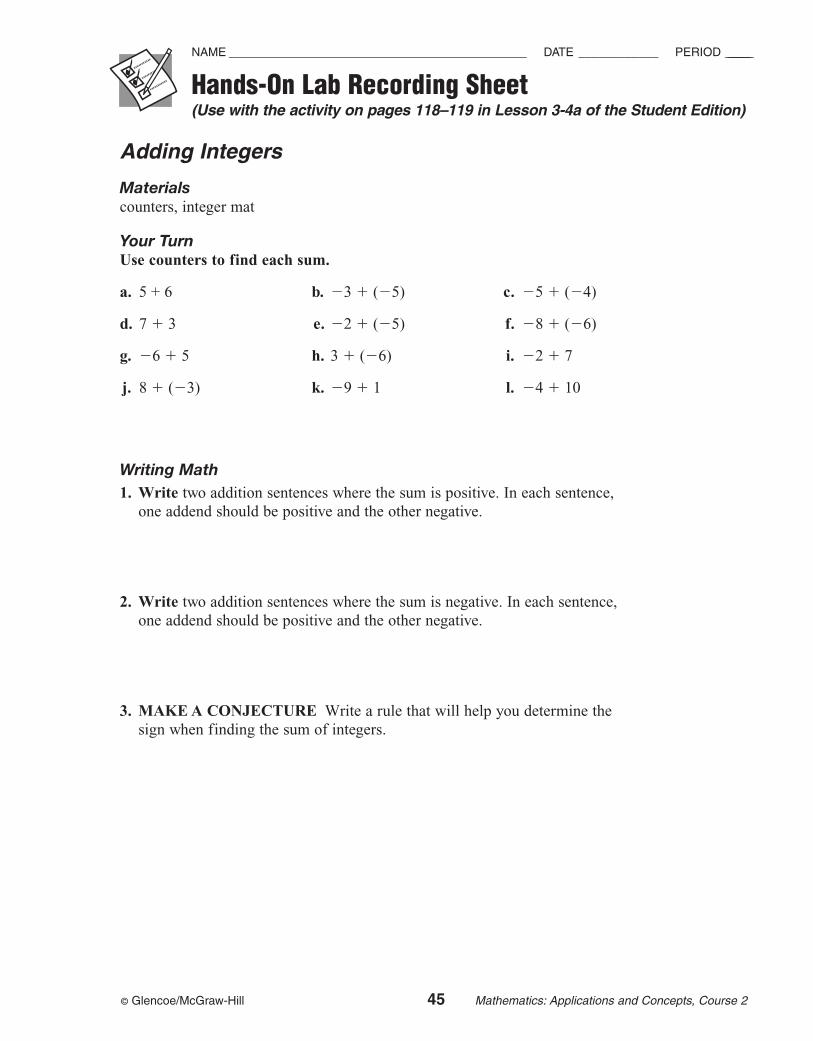
Adding Integers
Materials counters, integer mat
Your TurnUse counters to find each sum.
a. 5 + 6 b. �3 � (�5) c. �5 � (�4)
d. 7 � 3 e. �2 � (�5) f. �8 � (�6)
g. �6 � 5 h. 3 � (�6) i. �2 � 7
j. 8 � (�3) k. �9 � 1 l. �4 � 10
Writing Math1. Write two addition sentences where the sum is positive. In each sentence,
one addend should be positive and the other negative.
2. Write two addition sentences where the sum is negative. In each sentence,one addend should be positive and the other negative.
3. MAKE A CONJECTURE Write a rule that will help you determine thesign when finding the sum of integers.
© Glencoe/McGraw-Hill 46 Mathematics: Applications and Concepts, Course 2
Hands-On Lab Recording Sheet(Use with the activity on pages 126–127 in Lesson 3-5a of the Student Edition)
NAME ______________________________________________ DATE ____________ PERIOD __________
Subtracting Integers
Materialscounters, integer mat
Your TurnUse counters to find each difference.
a. 7 � 6 b. 5 � (�3) c. 6 � (�3)
d. 5 � 8 e. �6 � (�3) f. �7 � 3
g. �5 � (�7)
Writing MathWork with a partner.
1. Write two subtraction sentences where the difference is positive. Make sureyou use a combination of positive and negative integers.
2. Write two subtraction sentences where the difference is negative. Make sureyou use a combination of positive and negative integers.
3. MAKE A CONJECTURE Write a rule that will help you determine thesign of the difference of two integers.
© Glencoe/McGraw-Hill 47 Mathematics: Applications and Concepts, Course 2
Using Overhead Manipulatives(Use with Lesson 3-6)
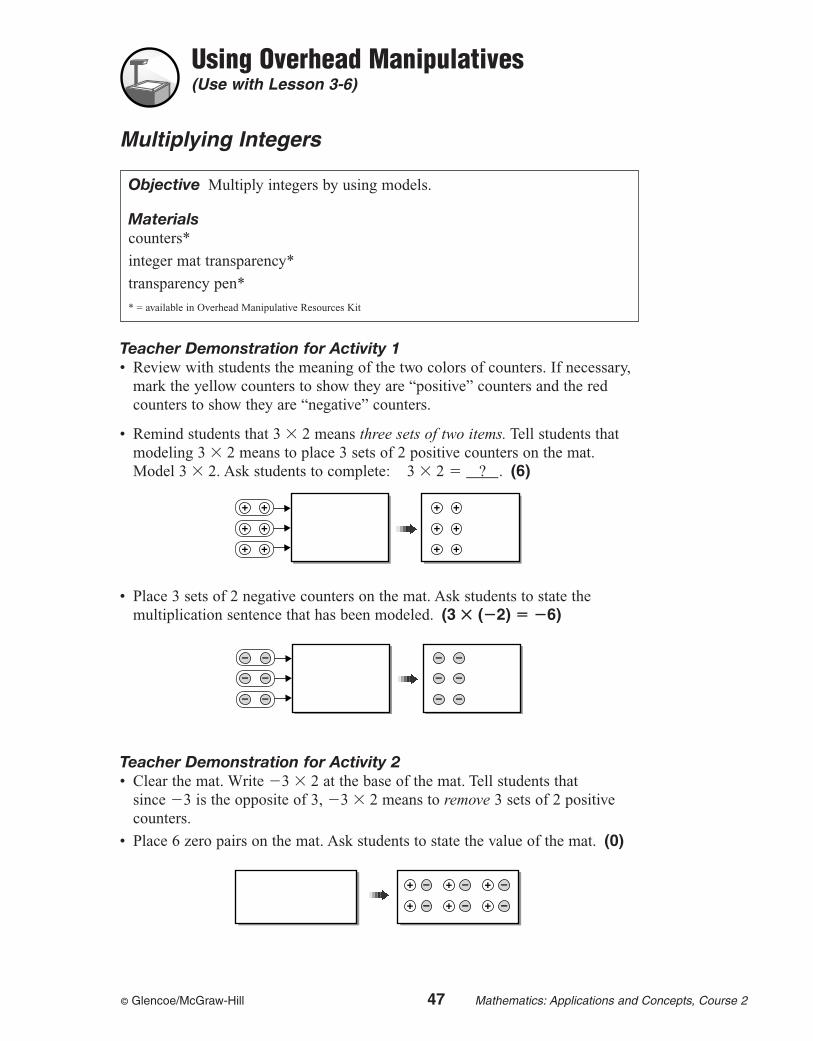
Multiplying Integers
Teacher Demonstration for Activity 1 • Review with students the meaning of the two colors of counters. If necessary,
mark the yellow counters to show they are “positive” counters and the redcounters to show they are “negative” counters.
• Remind students that 3 � 2 means three sets of two items. Tell students thatmodeling 3 � 2 means to place 3 sets of 2 positive counters on the mat.Model 3 � 2. Ask students to complete: 3 � 2 � ____? . (6)
• Place 3 sets of 2 negative counters on the mat. Ask students to state themultiplication sentence that has been modeled. (3 � (�2) � �6)
Teacher Demonstration for Activity 2• Clear the mat. Write �3 � 2 at the base of the mat. Tell students that
since �3 is the opposite of 3, �3 � 2 means to remove 3 sets of 2 positivecounters.
• Place 6 zero pairs on the mat. Ask students to state the value of the mat. (0)
–+ –+ –+
–+ –+ –+
––
––
––
––
––
––
++
++
++
++
++
++
Objective Multiply integers by using models.
Materialscounters*
integer mat transparency*
transparency pen*
* = available in Overhead Manipulative Resources Kit
© Glencoe/McGraw-Hill 48 Mathematics: Applications and Concepts, Course 2
Using Overhead Manipulatives
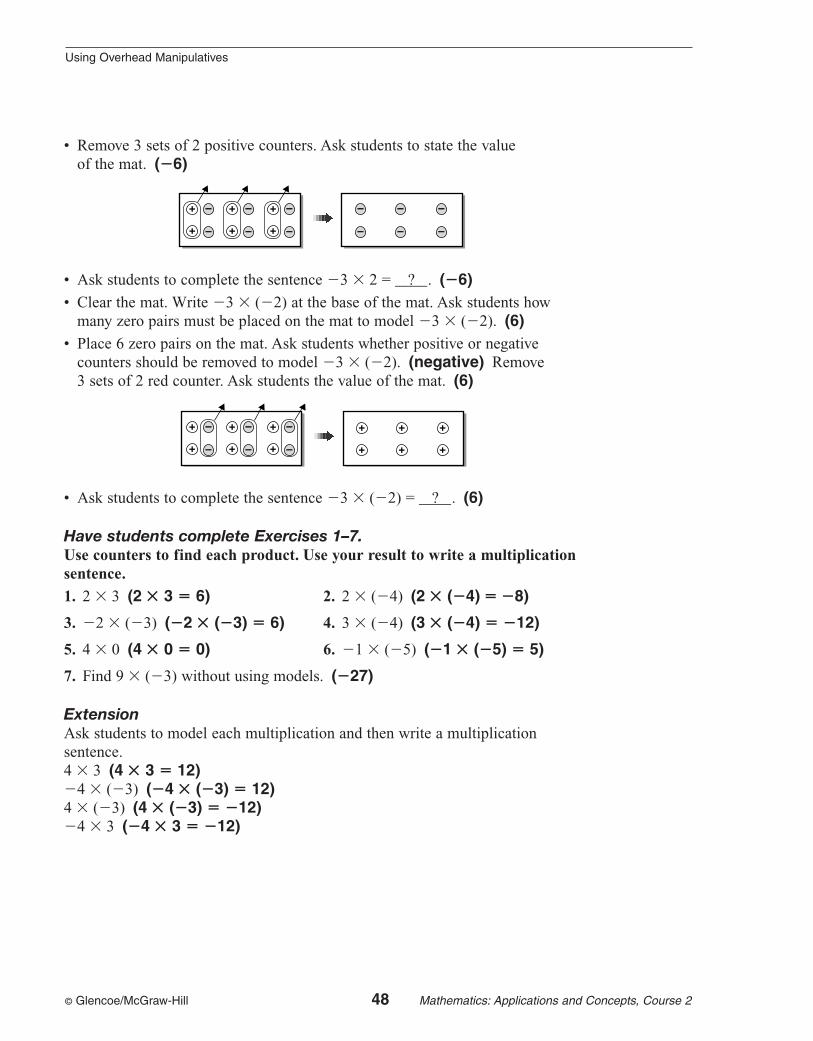
• Remove 3 sets of 2 positive counters. Ask students to state the value of the mat. (�6)
• Ask students to complete the sentence �3 � 2 = ____? . (�6)• Clear the mat. Write �3 � (�2) at the base of the mat. Ask students how
many zero pairs must be placed on the mat to model �3 � (�2). (6)• Place 6 zero pairs on the mat. Ask students whether positive or negative
counters should be removed to model �3 � (�2). (negative) Remove 3 sets of 2 red counter. Ask students the value of the mat. (6)
• Ask students to complete the sentence �3 � (�2) = ____? . (6)
Have students complete Exercises 1–7.Use counters to find each product. Use your result to write a multiplicationsentence.
1. 2 � 3 (2 � 3 � 6) 2. 2 � (�4) (2 � (�4) � �8)
3. �2 � (�3) (�2 � (�3) � 6) 4. 3 � (�4) (3 � (�4) � �12)
5. 4 � 0 (4 � 0 � 0) 6. �1 � (�5) (�1 � (�5) � 5)
7. Find 9 � (�3) without using models. (�27)
ExtensionAsk students to model each multiplication and then write a multiplicationsentence.4 � 3 (4 � 3 � 12)�4 � (�3) (�4 � (�3) � 12)4 � (�3) (4 � (�3) � �12)�4 � 3 (�4 � 3 � �12)
+
+
–
–
+
+
–
–
+
+
+
+
+
+
+
+
–
–
+
+
–
–
+
+
–
–
+
+
–
–
–
–
–
–
–
–
© Glencoe/McGraw-Hill 49 Mathematics: Applications and Concepts, Course 2
Ch
apte
r 4
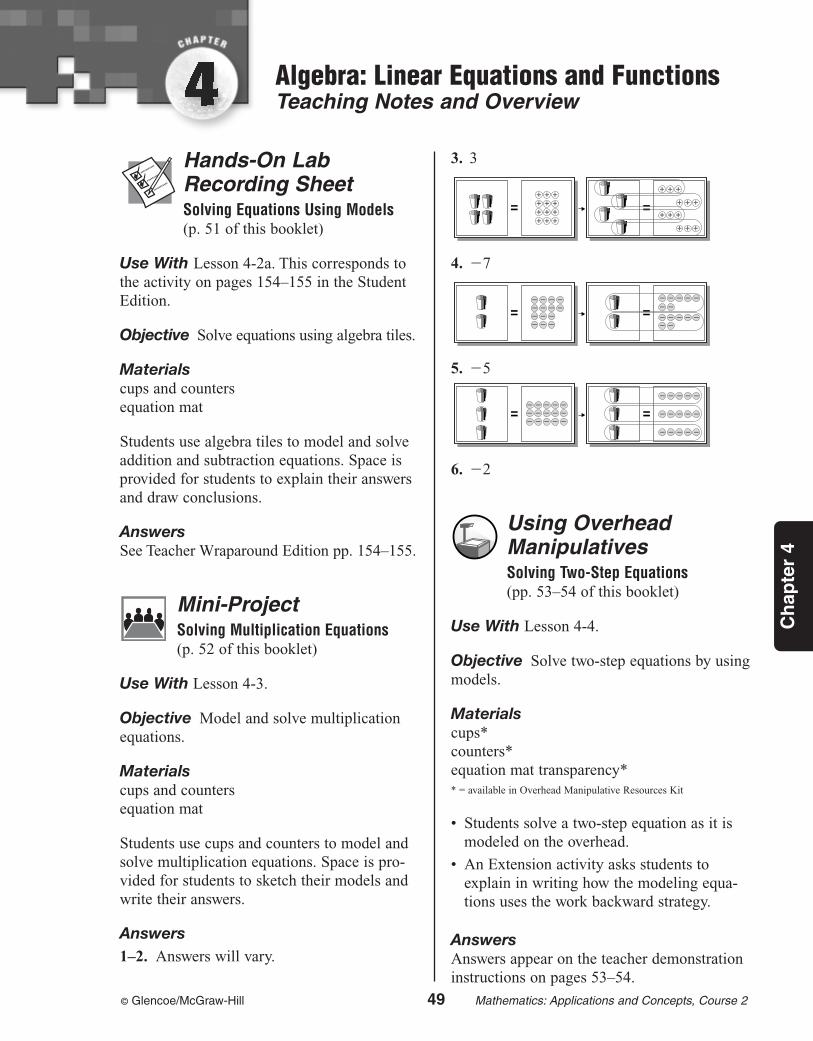
Algebra: Linear Equations and FunctionsTeaching Notes and Overview
Hands-On LabRecording Sheet Solving Equations Using Models(p. 51 of this booklet)
Use With Lesson 4-2a. This corresponds tothe activity on pages 154–155 in the StudentEdition.
Objective Solve equations using algebra tiles.
Materials cups and countersequation mat
Students use algebra tiles to model and solveaddition and subtraction equations. Space isprovided for students to explain their answersand draw conclusions.
AnswersSee Teacher Wraparound Edition pp. 154–155.
Mini-ProjectSolving Multiplication Equations (p. 52 of this booklet)
Use With Lesson 4-3.
Objective Model and solve multiplicationequations.
Materials cups and countersequation mat
Students use cups and counters to model andsolve multiplication equations. Space is pro-vided for students to sketch their models andwrite their answers.
Answers1–2. Answers will vary.
3. 3
4. �7
5. �5
6. �2
Using OverheadManipulativesSolving Two-Step Equations(pp. 53–54 of this booklet)
Use With Lesson 4-4.
Objective Solve two-step equations by usingmodels.
Materials cups*counters*equation mat transparency** = available in Overhead Manipulative Resources Kit
• Students solve a two-step equation as it ismodeled on the overhead.
• An Extension activity asks students toexplain in writing how the modeling equa-tions uses the work backward strategy.
AnswersAnswers appear on the teacher demonstrationinstructions on pages 53–54.
– – – – –– – – – –– – – – –
– – – – –
– – – – –
– – – – –
– – – –– – – –– – –– – –
– –– –
– – –
– –– – – – –
++++++++++++
+++
+++
+++
+++
© Glencoe/McGraw-Hill 50 Mathematics: Applications and Concepts, Course 2
Hands-On LabRecording Sheet Functions and Graphs(p. 55 of this booklet)
Use With Lesson 4-6a. This corresponds tothe activity on page 176 in the StudentEdition.
Objective Graph a function on a scatterplot.
Materials stop watchuncooked spaghetti
Students will perform the “wave” with variousnumbers of students in the class. They areprovided with a graph on which they canrecord their data. They use the graph to find apattern, make predictions, and explain theirreasoning.
AnswersSee Teacher Wraparound Edition p. 176.
Using OverheadManipulativesA Function of Time(pp. 56–57 of this booklet)
Use With Lesson 4-6.
Objective Use a function rule to find theoutput of a function.
Materials coordinate grid transparency*transparency pen*transparency prepared with the two tables
shown in the demonstration* = available in Overhead Manipulative Resources Kit
• Students use given data for the input valuesand the function rule to find the output val-ues of a function.
• Students then use the graph of the functionto make predictions.
• An Extension activity asks students to giveexamples of other functions of time.
AnswersAnswers appear on the teacher demonstrationinstructions on pages 56–57.
Chapter 4 Algebra: Linear Equations and Functions
© Glencoe/McGraw-Hill 51 Mathematics: Applications and Concepts, Course 2
Hands-On Lab Recording Sheet(Use with the activity on pages 154–155 in Lesson 4-2a of the StudentEdition)
NAME ______________________________________________ DATE ____________ PERIOD __________
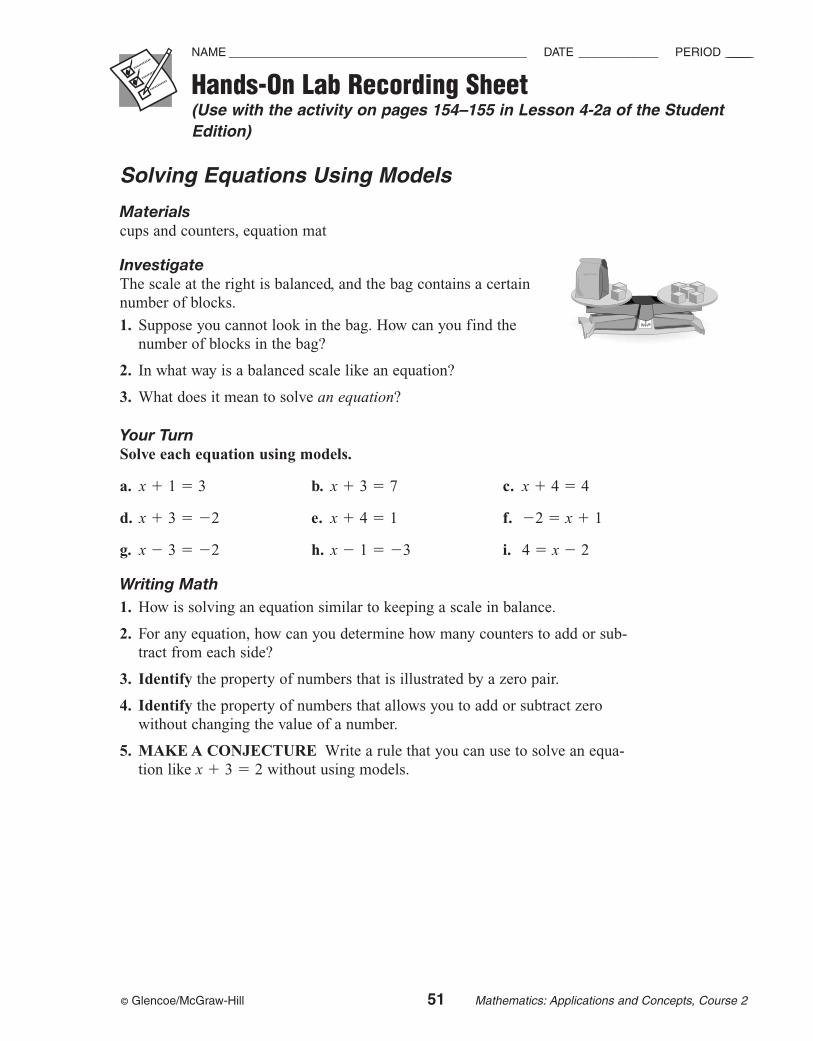
Solving Equations Using Models
Materialscups and counters, equation mat
InvestigateThe scale at the right is balanced, and the bag contains a certain number of blocks.
1. Suppose you cannot look in the bag. How can you find the number of blocks in the bag?
2. In what way is a balanced scale like an equation?
3. What does it mean to solve an equation?
Your TurnSolve each equation using models.
a. x � 1 � 3 b. x � 3 � 7 c. x � 4 � 4
d. x � 3 � �2 e. x � 4 � 1 f. �2 � x � 1
g. x � 3 � �2 h. x � 1 � �3 i. 4 � x � 2
Writing Math1. How is solving an equation similar to keeping a scale in balance.
2. For any equation, how can you determine how many counters to add or sub-tract from each side?
3. Identify the property of numbers that is illustrated by a zero pair.
4. Identify the property of numbers that allows you to add or subtract zerowithout changing the value of a number.
5. MAKE A CONJECTURE Write a rule that you can use to solve an equa-tion like x � 3 � 2 without using models.
© Glencoe/McGraw-Hill 52 Mathematics: Applications and Concepts, Course 2
Mini-Project(Use with Lesson 4-3)
NAME ______________________________________________ DATE ____________ PERIOD __________
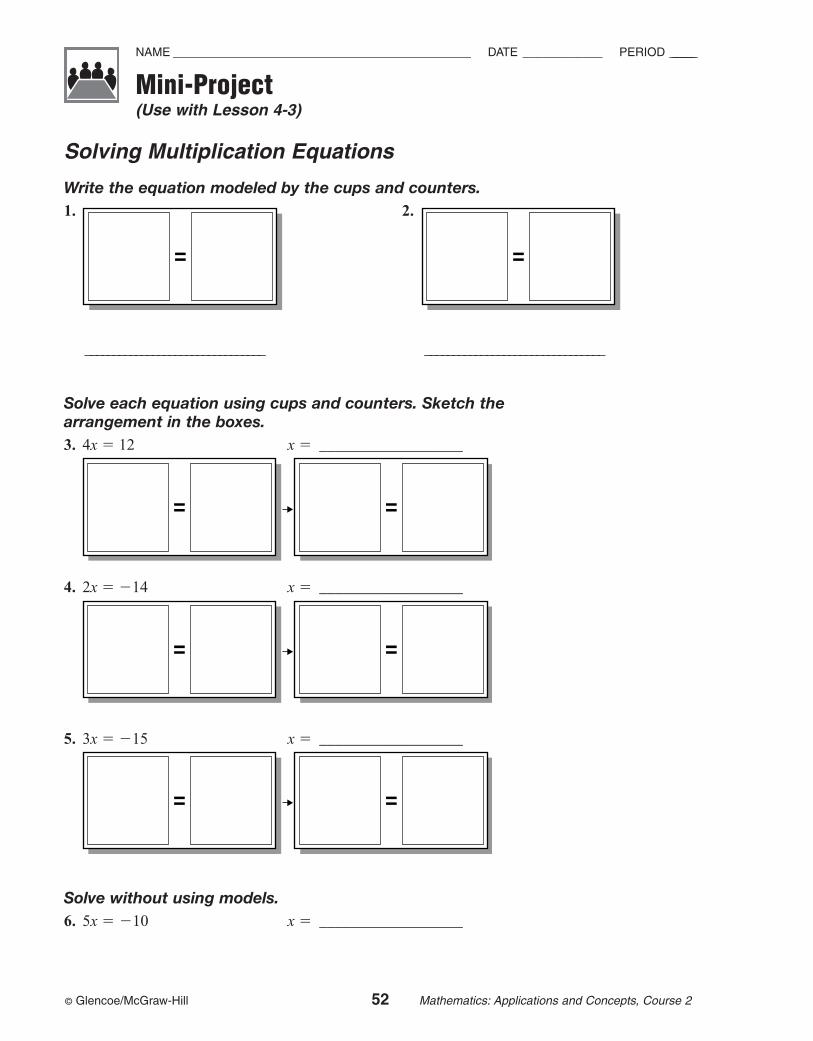
Solving Multiplication Equations
Write the equation modeled by the cups and counters.1. 2.
________________________________ ________________________________
Solve each equation using cups and counters. Sketch the arrangement in the boxes.3. 4x � 12 x � __________________
4. 2x � �14 x � __________________
5. 3x � �15 x � __________________
Solve without using models.6. 5x � �10 x � __________________
© Glencoe/McGraw-Hill 53 Mathematics: Applications and Concepts, Course 2
Using Overhead Manipulatives(Use with Lesson 4-4)
Solving Two-Step Equations
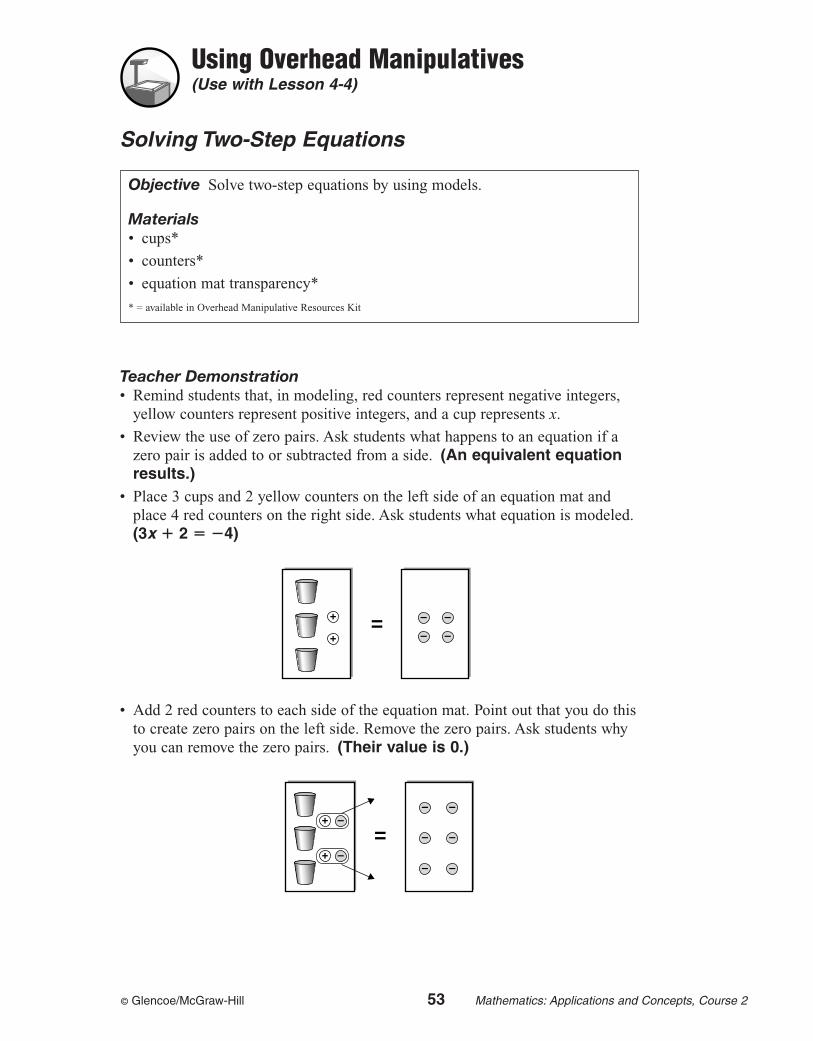
Teacher Demonstration • Remind students that, in modeling, red counters represent negative integers,
yellow counters represent positive integers, and a cup represents x.
• Review the use of zero pairs. Ask students what happens to an equation if azero pair is added to or subtracted from a side. (An equivalent equationresults.)
• Place 3 cups and 2 yellow counters on the left side of an equation mat andplace 4 red counters on the right side. Ask students what equation is modeled.(3x � 2 � �4)
• Add 2 red counters to each side of the equation mat. Point out that you do thisto create zero pairs on the left side. Remove the zero pairs. Ask students whyyou can remove the zero pairs. (Their value is 0.)
+ –– –
– –
– –+ –
+
+
–
–
–
–
Objective Solve two-step equations by using models.
Materials• cups*
• counters*
• equation mat transparency*
* = available in Overhead Manipulative Resources Kit
© Glencoe/McGraw-Hill 54 Mathematics: Applications and Concepts, Course 2
Using Overhead Manipulatives
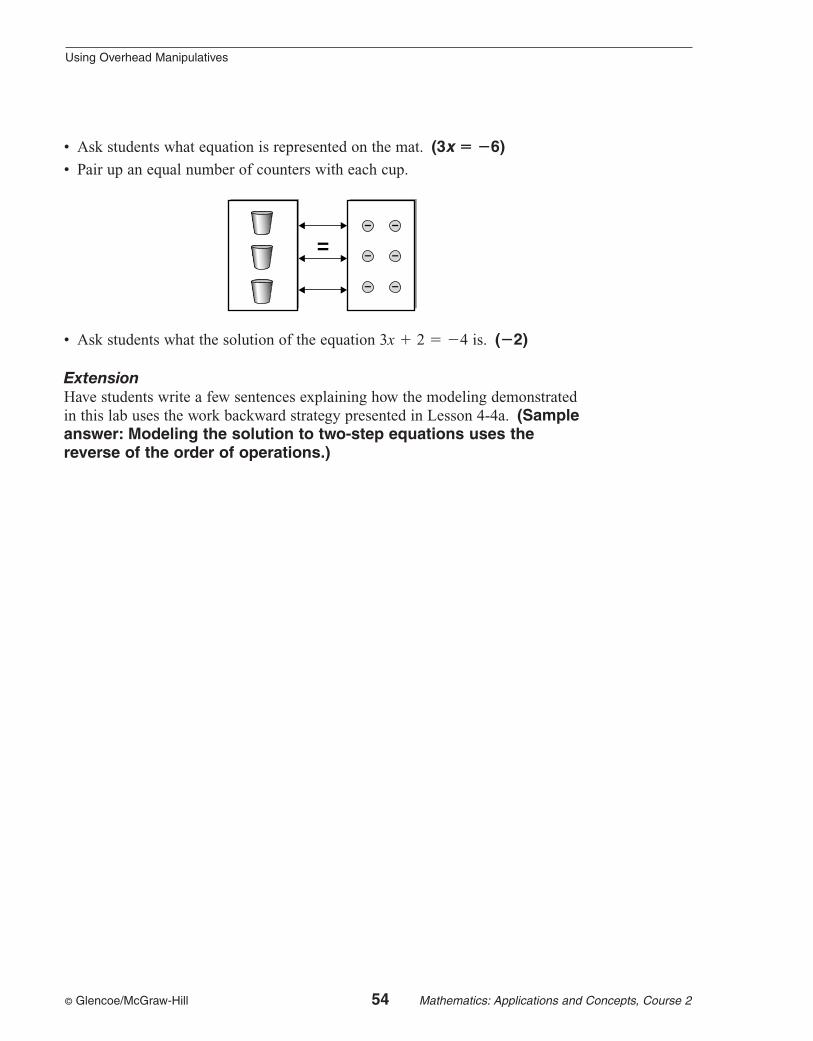
• Ask students what equation is represented on the mat. (3x � �6)• Pair up an equal number of counters with each cup.
• Ask students what the solution of the equation 3x � 2 � �4 is. (�2)
ExtensionHave students write a few sentences explaining how the modeling demonstratedin this lab uses the work backward strategy presented in Lesson 4-4a. (Sampleanswer: Modeling the solution to two-step equations uses thereverse of the order of operations.)
– –
– –
– –
© Glencoe/McGraw-Hill 55 Mathematics: Applications and Concepts, Course 2
Hands-On Lab Recording Sheet(Use with the activity on page 176 in Lesson 4-6a of the Student Edition)
NAME ______________________________________________ DATE ____________ PERIOD __________
Functions and Graphs
Materials stop watch, uncooked spaghetti
Writing MathWork with a partner.
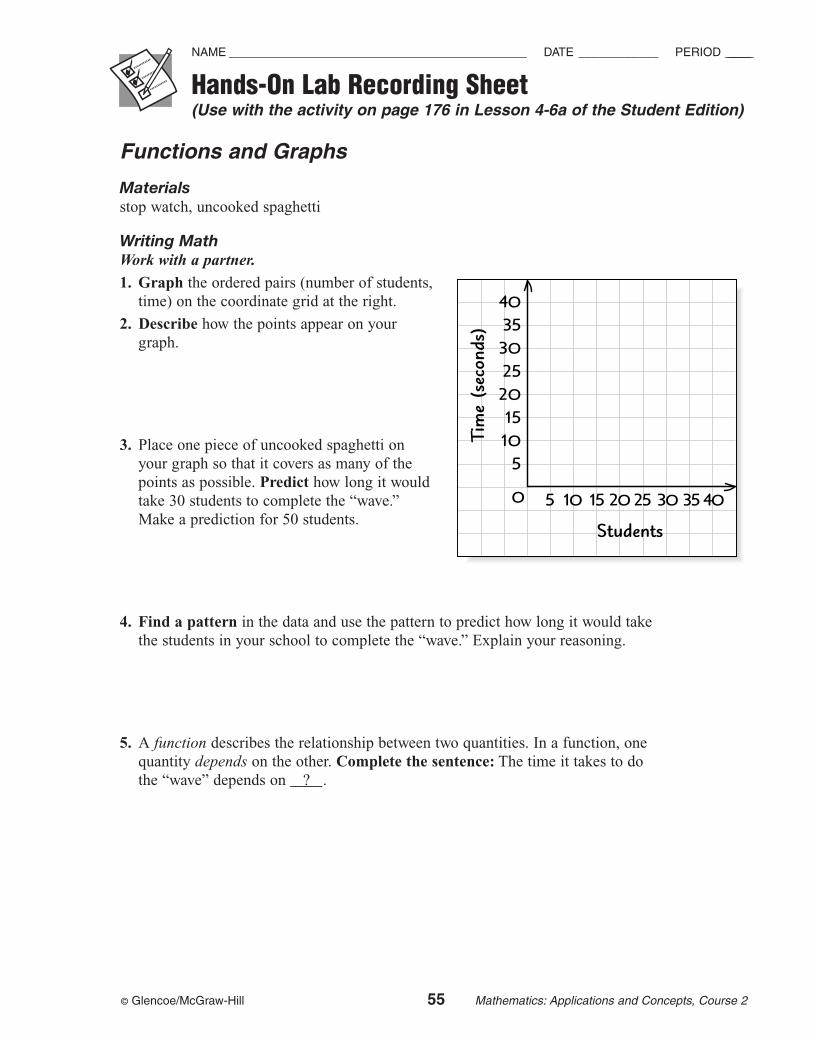
1. Graph the ordered pairs (number of students,time) on the coordinate grid at the right.
2. Describe how the points appear on yourgraph.
3. Place one piece of uncooked spaghetti onyour graph so that it covers as many of thepoints as possible. Predict how long it wouldtake 30 students to complete the “wave.”Make a prediction for 50 students.
4. Find a pattern in the data and use the pattern to predict how long it would takethe students in your school to complete the “wave.” Explain your reasoning.
5. A function describes the relationship between two quantities. In a function, onequantity depends on the other. Complete the sentence: The time it takes to dothe “wave” depends on ____? .
Tim
e (s
econ
ds)
Students
50
51015
2025303540
10 15 20 25 30 35 40
© Glencoe/McGraw-Hill 56 Mathematics: Applications and Concepts, Course 2
Using Overhead Manipulatives(Use with Lesson 4-6)
A Function of Time
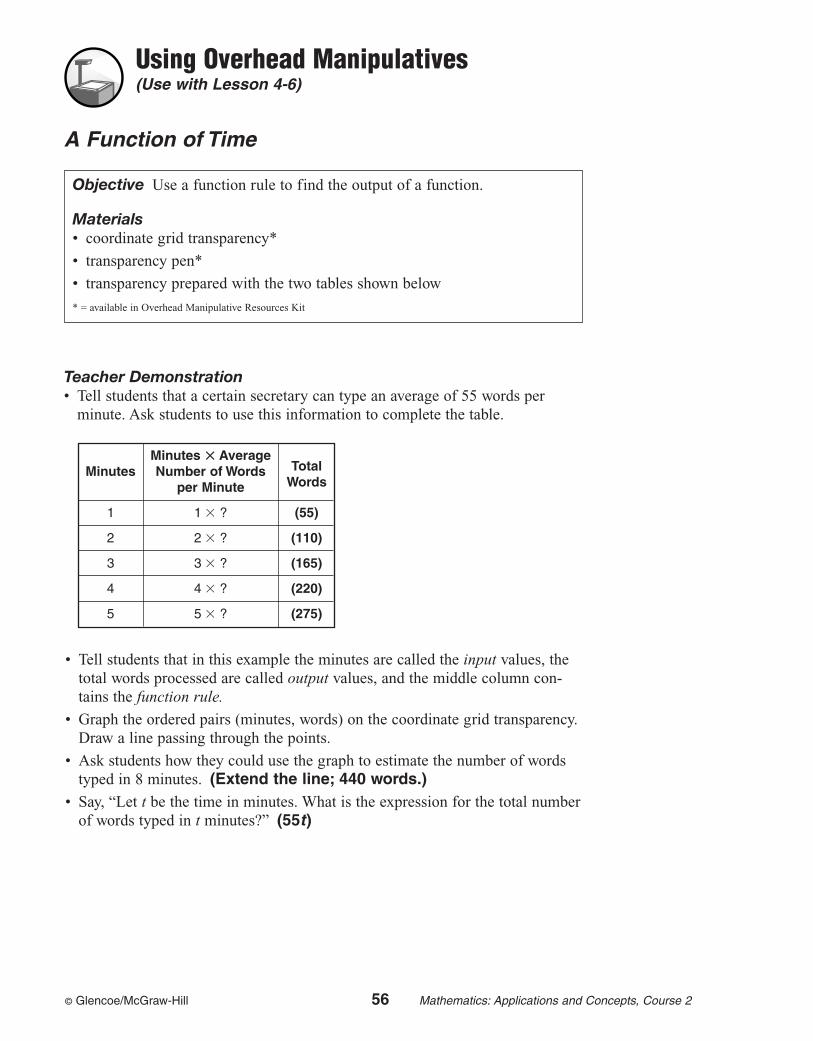
Teacher Demonstration • Tell students that a certain secretary can type an average of 55 words per
minute. Ask students to use this information to complete the table.
• Tell students that in this example the minutes are called the input values, thetotal words processed are called output values, and the middle column con-tains the function rule.
• Graph the ordered pairs (minutes, words) on the coordinate grid transparency.Draw a line passing through the points.
• Ask students how they could use the graph to estimate the number of wordstyped in 8 minutes. (Extend the line; 440 words.)
• Say, “Let t be the time in minutes. What is the expression for the total numberof words typed in t minutes?” (55t)
Objective Use a function rule to find the output of a function.
Materials• coordinate grid transparency*
• transparency pen*
• transparency prepared with the two tables shown below
* = available in Overhead Manipulative Resources Kit
Minutes � Average TotalMinutes Number of Words
Wordsper Minute
1 1 � ? (55)
2 2 � ? (110)
3 3 � ? (165)
4 4 � ? (220)
5 5 � ? (275)
© Glencoe/McGraw-Hill 57 Mathematics: Applications and Concepts, Course 2
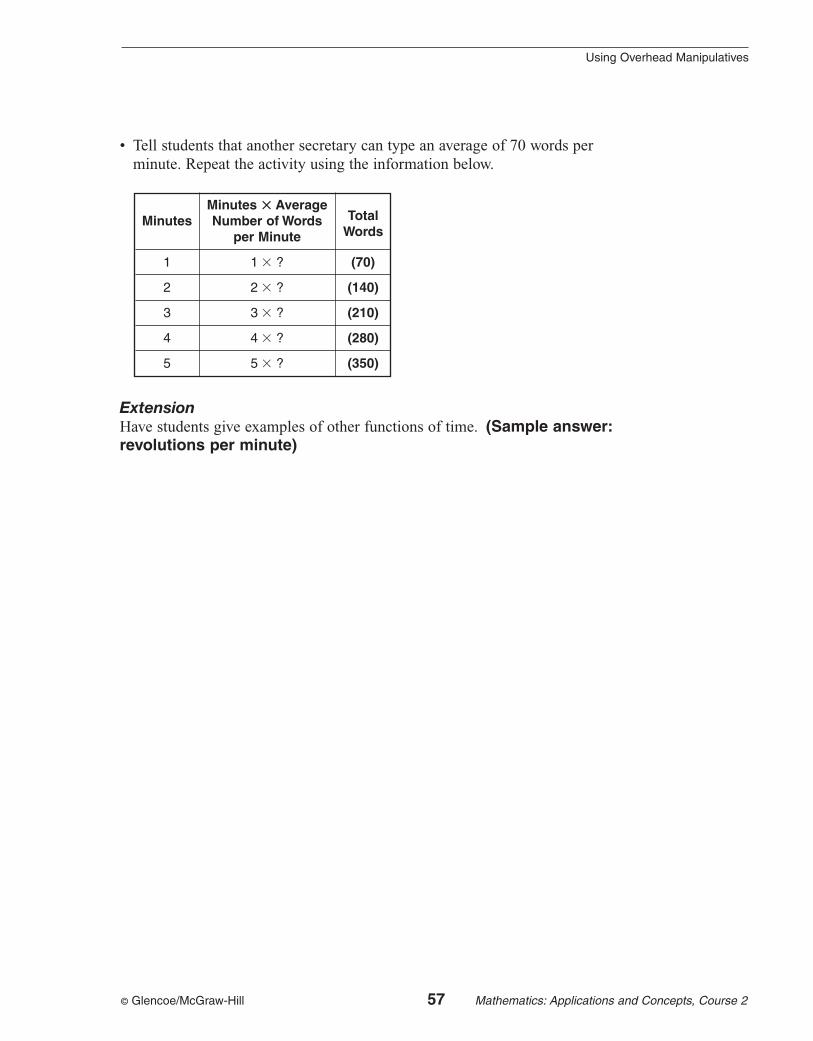
ExtensionHave students give examples of other functions of time. (Sample answer:revolutions per minute)
• Tell students that another secretary can type an average of 70 words perminute. Repeat the activity using the information below.
Using Overhead Manipulatives
Minutes � Average TotalMinutes Number of Words
Wordsper Minute
1 1 � ? (70)
2 2 � ? (140)
3 3 � ? (210)
4 4 � ? (280)
5 5 � ? (350)
© Glencoe/McGraw-Hill 58 Mathematics: Applications and Concepts, Course 2
Fractions, Decimals, and PercentsTeaching Notes and Overview
Hands-On LabRecording Sheet Exploring Factors (p. 59 of this booklet)
Use With Lesson 5-1a. This corresponds tothe activity on page 196 in the StudentEdition.
Objective Discover factors of whole numbers.
Materials 15 index cards cut in halfmarkers
Students work as a class to determine factorsof whole numbers by identifying patterns.Space is provided for students to explain theiranswers and make predictions.
AnswersSee Teacher Wraparound Edition p. 196.
Using OverheadManipulativesPercent(p. 60 of this booklet)
Use With Lesson 5-5.
Objective Illustrate the meaning of percentusing models.
Materialscentimeter grid transparency*transparency pens** = available in Overhead Manipulative Resources Kit
• Using a model on the centimeter grid trans-parency, students write a ratio of the num-ber of shaded squares to the total number ofsquares.
• Students make conclusions about the mean-ing of percent based on the model.
AnswersAnswers appear on the teacher demonstrationinstructions on page 60.
© Glencoe/McGraw-Hill 59 Mathematics: Applications and Concepts, Course 2
Hands-On Lab Recording Sheet(Use with the activity on page 196 in Lesson 5-1a of the Student Edition)
NAME ______________________________________________ DATE ____________ PERIOD __________
Exploring Factors
Materials15 index cards cut in half, markers
Writing Math Work as a class.
1. How many students are standing at the end of the activity? Which cards arethey holding?
2. LOOK FOR A PATTERN Suppose there were 100 students holding indexcards. Extend the pattern in Exercise 1 to predict the numbers that would beheld by students standing at the end of the activity.
3. Explain the relationship between the numbers on the front and the back ofthe cards.
4. Separate the cards into two groups: one group with exactly two numbers onthe back of the card and one group with more than two numbers. Describeany special characteristics of each group.
Ch
apte
r 5
© Glencoe/McGraw-Hill 60 Mathematics: Applications and Concepts, Course 2
Using Overhead Manipulatives(Use with Lesson 5-5)
Percent
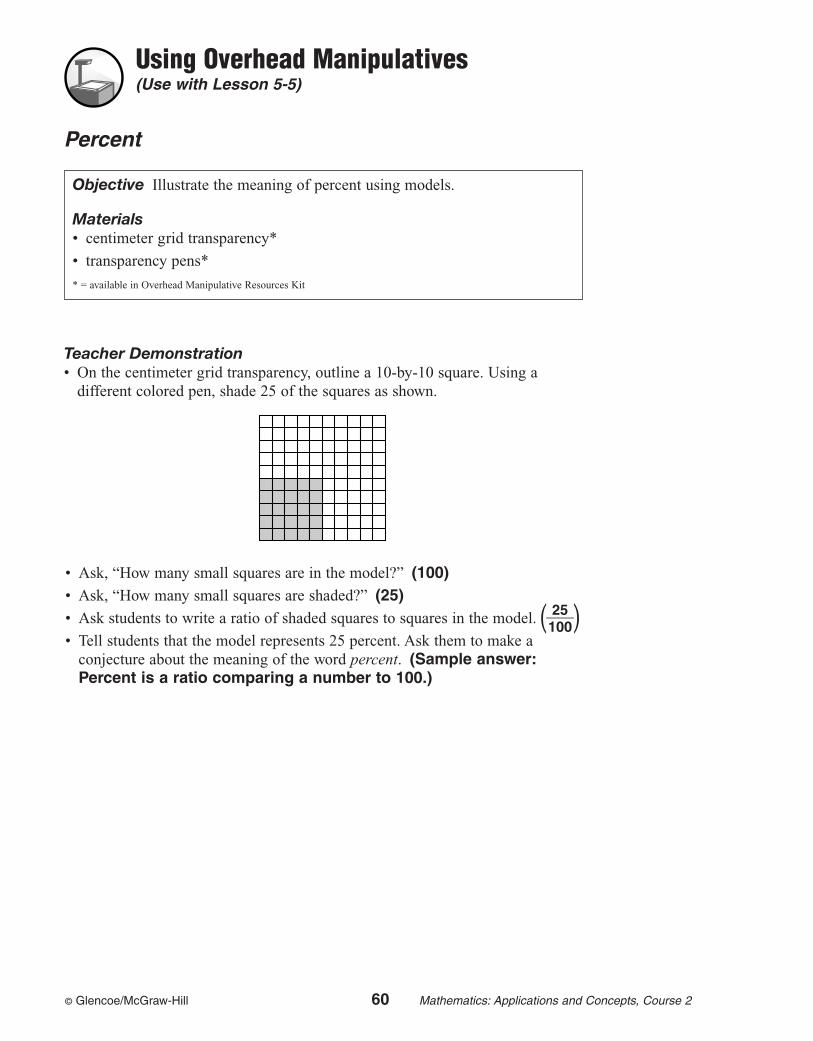
Teacher Demonstration • On the centimeter grid transparency, outline a 10-by-10 square. Using a
different colored pen, shade 25 of the squares as shown.
• Ask, “How many small squares are in the model?” (100)• Ask, “How many small squares are shaded?” (25)• Ask students to write a ratio of shaded squares to squares in the model. ��1
2050
��• Tell students that the model represents 25 percent. Ask them to make a
conjecture about the meaning of the word percent. (Sample answer:Percent is a ratio comparing a number to 100.)
Objective Illustrate the meaning of percent using models.
Materials• centimeter grid transparency*
• transparency pens*
* = available in Overhead Manipulative Resources Kit
© Glencoe/McGraw-Hill 61 Mathematics: Applications and Concepts, Course 2
Ch
apte
r 6
Applying FractionsTeaching Notes and Overview
Using OverheadManipulativesMultiplying Fractions and Mixed Numbers (pp. 62–63 of this booklet)
Use With Lesson 6-4.
Objective Use models to multiply fractionsand mixed numbers.
Materialsblank transparencyruler*transparency pens** = available in Overhead Manipulative Resources Kit
This demonstration contains three activities.• Demonstration 1 shows the multiplication
of two fractions. • Demonstration 2 shows the multiplication
of a whole number and a fraction.• Demonstration 3 shows the multiplication
of a fraction and a mixed number.• Students are asked to find products of frac-
tions and mixed numbers independently.• An Extension activity asks students to model
the multiplication of two mixed numbers.
AnswersAnswers appear on the teacher demonstrationinstructions on pages 62–63.
Mini-ProjectPerimeter (p. 64 of this booklet)
Use With Lesson 6-8.
Objective Measure the sides of figures andfind the perimeter.
Materials ruler
Given several figures, students measure thesides, label them, and then find the perimeter.
Answers1. P � 1�
14
� � 1�14
� � 1�14
� � 1�14
� � 5 in.
2. P � �34
� � 1�38
� � 2 � 1�78
� � 6 in.
3. P � 1�18
� � 1�18
� � 1�78
� � 1�18
� � 5�14
� in.
4. P � 1 � 1 � 1�14
� � 3�14
� in.
5. P � 1�18
� � �58
� � 1 � 1�18
� � 2�38
� � 6�14
� in.
6. P � �58
� � 1 � 1 � �58
� � �78
� � 1�14
� � �78
� � 6�14
� in.
Hands-On LabRecording Sheet Circumference (p. 65 of this booklet)
Use With Lesson 6-9a. This corresponds tothe activity on page 274 in the StudentEdition.
Objective Find a relationship betweencircumference and diameter.
Materials rulermeasuring tapecircular objects
Students find the diameter and circumferenceof various circular objects and record theirmeasurements in a table. A graph is providedfor students to graph their data, find the slopeof the line, and discover a relationshipbetween circumference and diameter.
AnswersSee Teacher Wraparound Edition p. 274.
© Glencoe/McGraw-Hill 62 Mathematics: Applications and Concepts, Course 2
Using Overhead Manipulatives(Use with Lesson 6-4)
Multiplying Fractions and Mixed Numbers
Objective Use models to multiply fractions and mixed numbers.
Materials• blank transparency
• ruler*
• transparency pens*
* = available in Overhead Manipulative Resources Kit
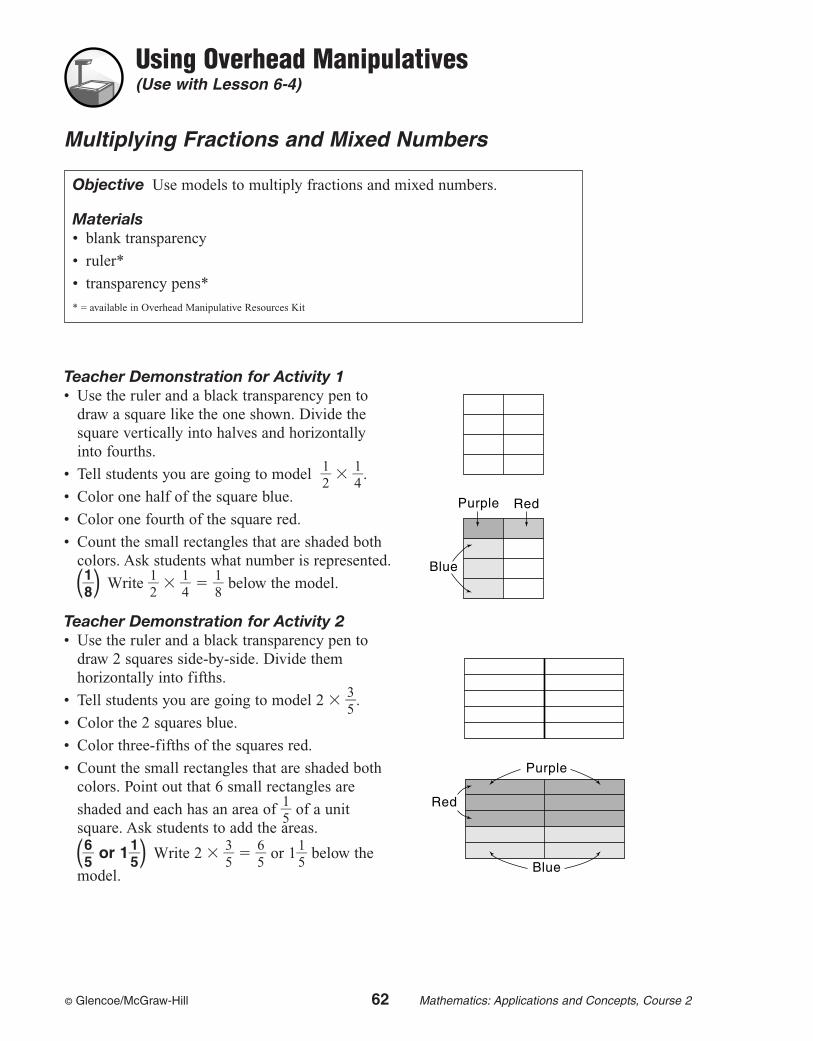
Teacher Demonstration for Activity 1 • Use the ruler and a black transparency pen to
draw a square like the one shown. Divide thesquare vertically into halves and horizontallyinto fourths.
• Tell students you are going to model �12
� � �14
�.
• Color one half of the square blue.
• Color one fourth of the square red.
• Count the small rectangles that are shaded bothcolors. Ask students what number is represented.
��18
�� Write �12
� � �14
� � �18
� below the model.
Teacher Demonstration for Activity 2• Use the ruler and a black transparency pen to
draw 2 squares side-by-side. Divide themhorizontally into fifths.
• Tell students you are going to model 2 � �35
�.
• Color the 2 squares blue.
• Color three-fifths of the squares red.
• Count the small rectangles that are shaded bothcolors. Point out that 6 small rectangles are
shaded and each has an area of �15
� of a unitsquare. Ask students to add the areas.
��65
� or 1�15
�� Write 2 � �35
� � �65
� or 1�15
� below the
model.
Purple Red
Blue
Purple
Blue
Red
© Glencoe/McGraw-Hill 63 Mathematics: Applications and Concepts, Course 2
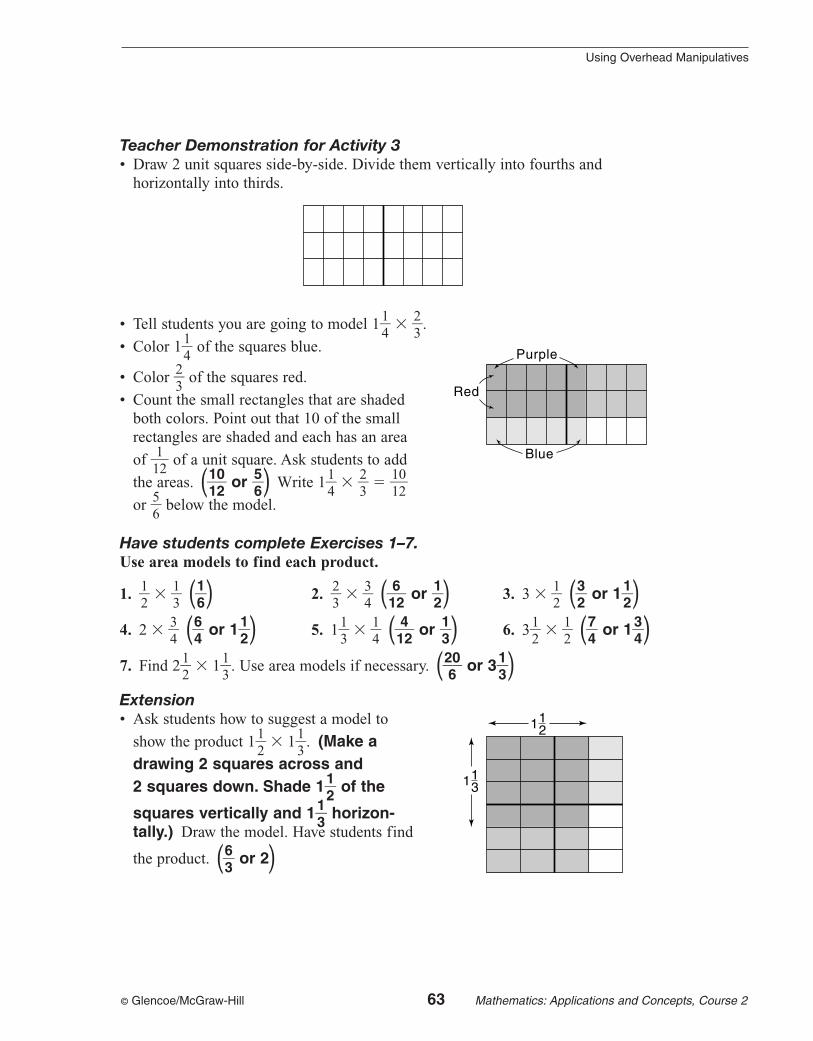
Teacher Demonstration for Activity 3• Draw 2 unit squares side-by-side. Divide them vertically into fourths and
horizontally into thirds.
• Tell students you are going to model 1�14
� � �23
�.
• Color 1�14
� of the squares blue.
• Color �23
� of the squares red.
• Count the small rectangles that are shadedboth colors. Point out that 10 of the smallrectangles are shaded and each has an area
of �112� of a unit square. Ask students to add
the areas. ��1102� or �
56
�� Write 1�14
� � �23
� � �1102�
or �56
� below the model.
Have students complete Exercises 1–7.Use area models to find each product.
1. �12
� � �13
� ��16
�� 2. �23
� � �34
� ��162� or �
12
�� 3. 3 � �12
� ��32
� or 1�12
��4. 2 � �
34
� ��64
� or 1�12
�� 5. 1�13
� � �14
� ��142� or �
13
�� 6. 3�12
� � �12
� ��74
� or 1�34
��7. Find 2�
12
� � 1�13
�. Use area models if necessary. ��260� or 3�
13
��Extension• Ask students how to suggest a model to
show the product 1�12
� � 1�13
�. (Make adrawing 2 squares across and 2 squares down. Shade 1�
12
� of the
squares vertically and 1�13
� horizon-tally.) Draw the model. Have students find
the product. ��63
� or 2�
Using Overhead Manipulatives
Purple
Blue
Red
113
112
© Glencoe/McGraw-Hill 64 Mathematics: Applications and Concepts, Course 2
Mini-Project(Use with Lesson 6-8)
NAME ______________________________________________ DATE ____________ PERIOD __________
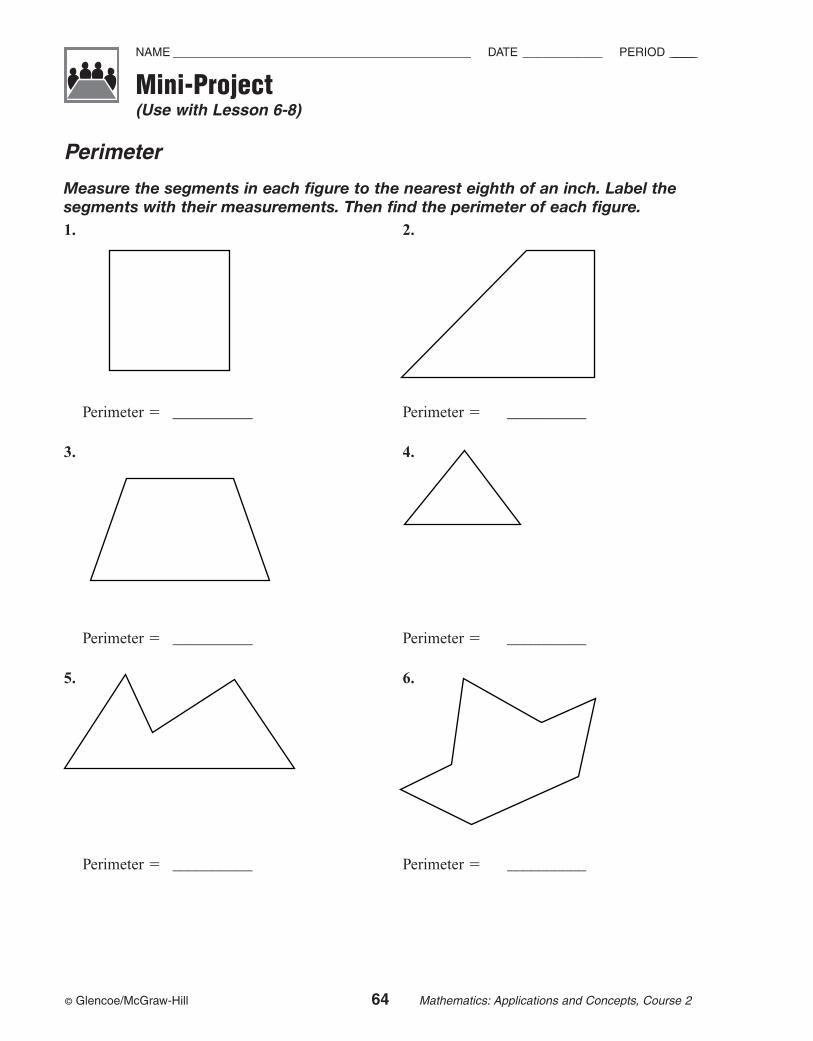
Perimeter
Measure the segments in each figure to the nearest eighth of an inch. Label thesegments with their measurements. Then find the perimeter of each figure.1. 2.
Perimeter � __________ Perimeter � __________
3. 4.
Perimeter � __________ Perimeter � __________
5. 6.
Perimeter � __________ Perimeter � __________
© Glencoe/McGraw-Hill 65 Mathematics: Applications and Concepts, Course 2
Hands-On Lab Recording Sheet(Use with the activity on page 274 in Lesson 6-9a of the Student Edition)
NAME ______________________________________________ DATE ____________ PERIOD __________
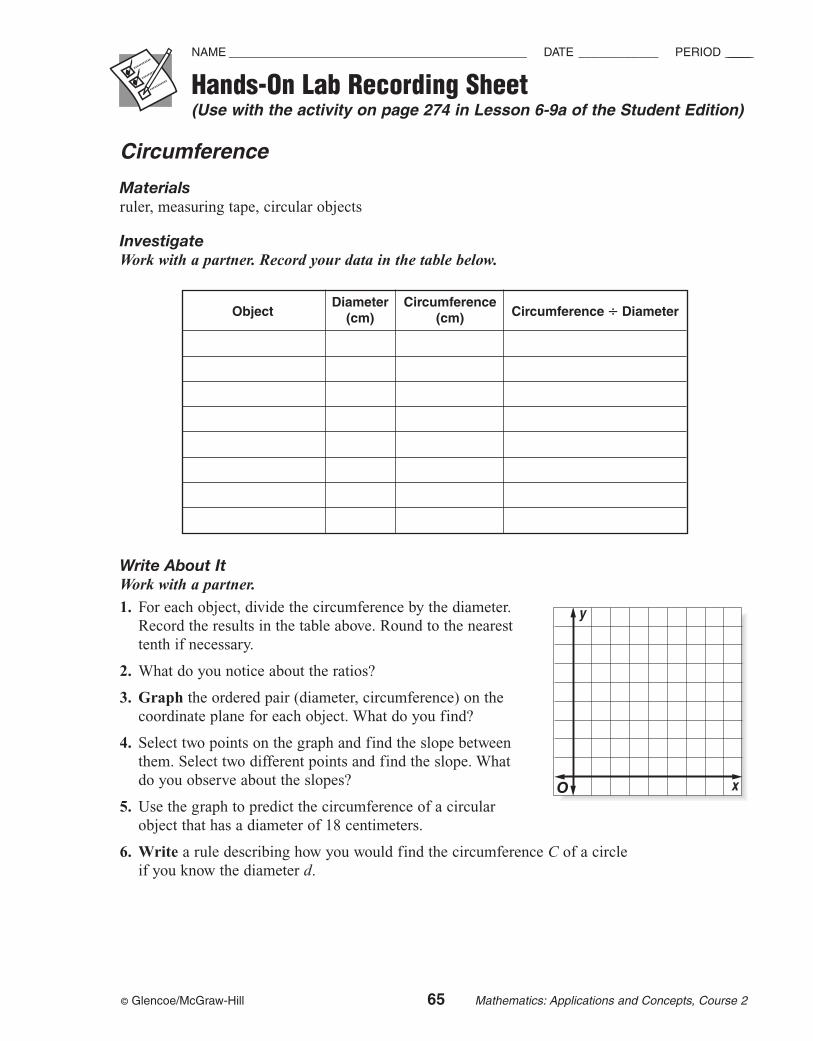
Circumference
Materialsruler, measuring tape, circular objects
InvestigateWork with a partner. Record your data in the table below.
Write About It Work with a partner.
1. For each object, divide the circumference by the diameter.Record the results in the table above. Round to the nearesttenth if necessary.
2. What do you notice about the ratios?
3. Graph the ordered pair (diameter, circumference) on thecoordinate plane for each object. What do you find?
4. Select two points on the graph and find the slope betweenthem. Select two different points and find the slope. Whatdo you observe about the slopes?
5. Use the graph to predict the circumference of a circularobject that has a diameter of 18 centimeters.
6. Write a rule describing how you would find the circumference C of a circleif you know the diameter d.
ObjectDiameter Circumference
Circumference � Diameter(cm) (cm)
y
xO
© Glencoe/McGraw-Hill 66 Mathematics: Applications and Concepts, Course 2
Ratios and ProportionsTeaching Notes and Overview
Using OverheadManipulativesEqual Ratios(pp. 68–69 of this booklet)
Use With Lesson 7-1.
Objective Explore the meaning of ratio andproportion.
Materials counters*blank transparencytransparency pen** = available in Overhead Manipulative Resources Kit
• Students use counters to model ratios byfinding equivalent fractions.
• An Extension activity asks students to workin pairs to find equivalent ratios.
AnswersAnswers appear on the teacher demonstrationinstructions on pages 68-69.
Hands-On LabRecording Sheet Rate of Change(p. 70 of this booklet)
Use With Lesson 7-2b. This corresponds tothe activity on page 296 in the StudentEdition.
Objective Investigate rate of change.
Materials square tiles
Students use tiles to build models and find theperimeter of each model. A table and coordi-nate plane is provided for students to recordand graph their data. Students explore rate ofchange by finding the slope of the graph.
AnswersSee Teacher Wraparound Edition p. 296.
Hands-On LabRecording Sheet Wildlife Sampling(p. 71 of this booklet)
Use With Lesson 7-3b. This corresponds tothe activity on page 301 in the StudentEdition.
Objective Use proportions to estimate.
Materials small bowldried beanspaper cup markers
Using dried beans in a bowl to represent deer in a forest, students model the capture-recapture technique used to estimate animalpopulations. A table is provided for studentsto record their data, as well as space for themto explain their results.
AnswersSee Teacher Wraparound Edition p. 301.
© Glencoe/McGraw-Hill 67 Mathematics: Applications and Concepts, Course 2
Mini-ProjectScale Drawings(p. 72 of this booklet)
Use With Lesson 7-4.
Objective Create a scale drawing.
Materials ruler
Using the grid provided, students create ascale drawing of a room they would like tobuild. The drawing includes everything theywish to include in the room drawn to scale.Students must label their drawing and list theobjects in the room and their actual size.
Answers1. See students’ work. Make sure drawings
are the correct scale based on this informa-tion and the scale of the grid.
2–3. Answers will vary.
Hands-On LabRecording Sheet Using a Percent Model(p. 73 of this booklet)
Use With Lesson 7-8a. This corresponds tothe activity on page 322 in the StudentEdition.
Objective Use a percent model to find apart.
Materials none
Grids are provided for students to drawmodels to find the percent of a number.
AnswersSee Teacher Wraparound Edition p. 322.
Chapter 7 Ratios and Proportions
Ch
apte
r 7
© Glencoe/McGraw-Hill 68 Mathematics: Applications and Concepts, Course 2
Using Overhead Manipulatives(Use with Lesson 7-1)
Equal Ratios
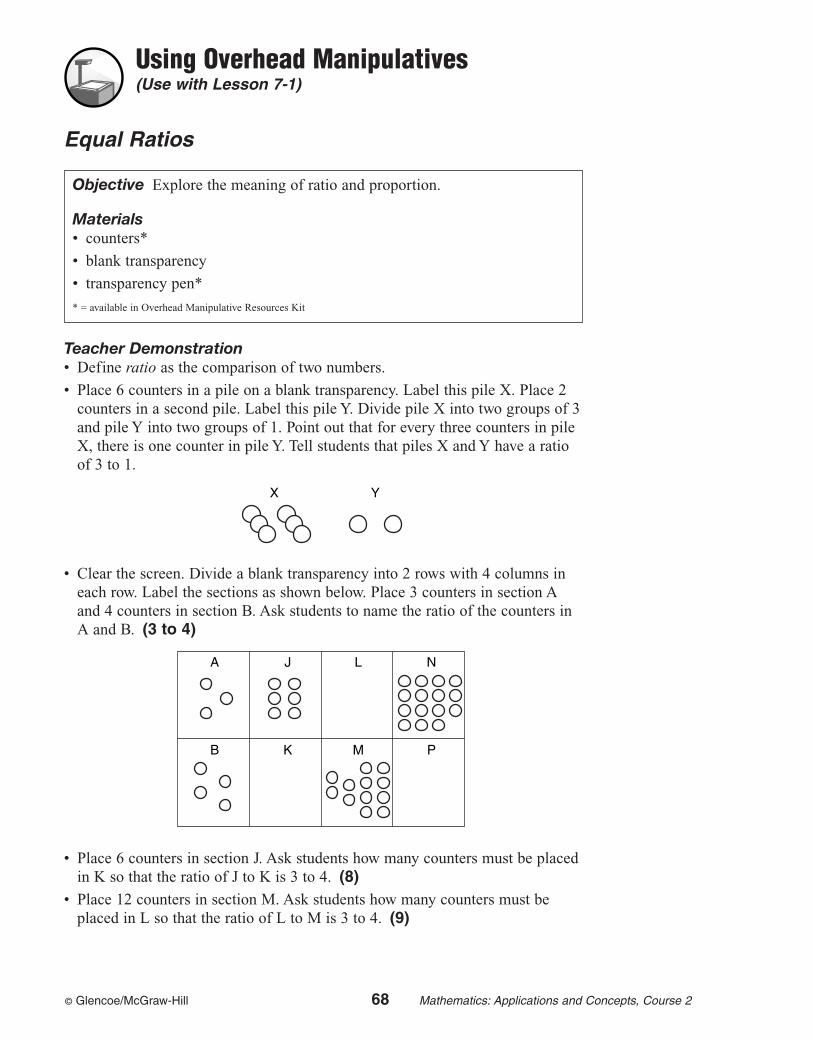
Teacher Demonstration • Define ratio as the comparison of two numbers.
• Place 6 counters in a pile on a blank transparency. Label this pile X. Place 2counters in a second pile. Label this pile Y. Divide pile X into two groups of 3and pile Y into two groups of 1. Point out that for every three counters in pileX, there is one counter in pile Y. Tell students that piles X and Y have a ratioof 3 to 1.
• Clear the screen. Divide a blank transparency into 2 rows with 4 columns ineach row. Label the sections as shown below. Place 3 counters in section Aand 4 counters in section B. Ask students to name the ratio of the counters inA and B. (3 to 4)
• Place 6 counters in section J. Ask students how many counters must be placedin K so that the ratio of J to K is 3 to 4. (8)
• Place 12 counters in section M. Ask students how many counters must beplaced in L so that the ratio of L to M is 3 to 4. (9)
A J L N
B K M P
X Y
Objective Explore the meaning of ratio and proportion.
Materials• counters*
• blank transparency
• transparency pen*
* = available in Overhead Manipulative Resources Kit
© Glencoe/McGraw-Hill 69 Mathematics: Applications and Concepts, Course 2
• Place 15 counters in section N. Ask students how many counters must beplaced in P so that the ratio of N to P is 3 to 4. (20)
• Ask students how they decided how many counters to place in sections K,
L, and P. (Sample answer: Write equivalent fractions. �34
� � �68
� �
�192� � �
1250�)
• Ask, “If there were 72 counters in section M, how many counters would beneeded in section L?” (54)
ExtensionIn pairs, have students work together asking how many counters should beplaced in sections K, L, and P as they change the number of counters in sectionsJ, M, and N.
Using Overhead Manipulatives
© Glencoe/McGraw-Hill 70 Mathematics: Applications and Concepts, Course 2
Hands-On Lab Recording Sheet(Use with the activity on page 296 in Lesson 7-2b of the Student Edition)
NAME ______________________________________________ DATE ____________ PERIOD __________
Rate of Change
Materialssquare tiles
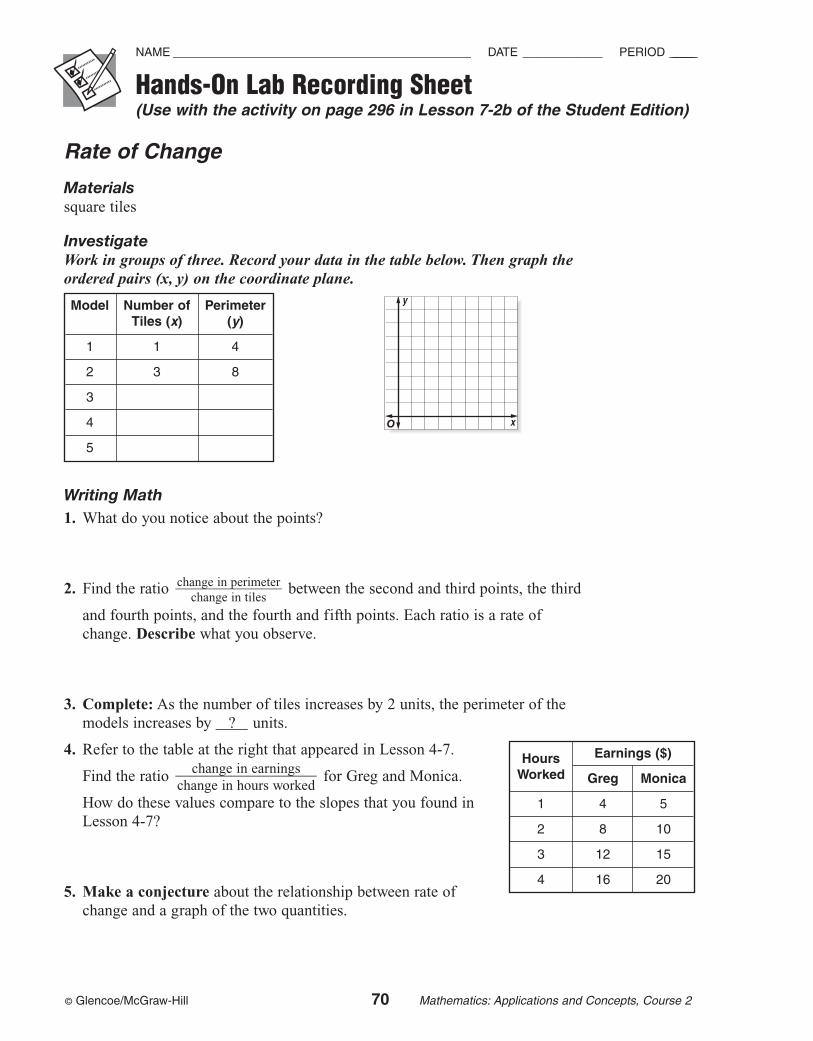
InvestigateWork in groups of three. Record your data in the table below. Then graph theordered pairs (x, y) on the coordinate plane.
Writing Math1. What do you notice about the points?
2. Find the ratio between the second and third points, the third
and fourth points, and the fourth and fifth points. Each ratio is a rate ofchange. Describe what you observe.
3. Complete: As the number of tiles increases by 2 units, the perimeter of themodels increases by ____? units.
4. Refer to the table at the right that appeared in Lesson 4-7.
Find the ratio for Greg and Monica.
How do these values compare to the slopes that you found inLesson 4-7?
5. Make a conjecture about the relationship between rate ofchange and a graph of the two quantities.
change in earnings���change in hours worked
change in perimeter���
change in tiles
y
xO
Model Number of PerimeterTiles (x) (y)
1 1 4
2 3 8
3
4
5
Hours Earnings ($)
Worked Greg Monica
1 4 5
2 8 10
3 12 15
4 16 20
© Glencoe/McGraw-Hill 71 Mathematics: Applications and Concepts, Course 2
Hands-On Lab Recording Sheet(Use with the activity on page 301 in Lesson 7-3b of the Student Edition)
NAME ______________________________________________ DATE ____________ PERIOD __________
Wildlife Sampling
Materialssmall bowl, dried beans, paper cup, markers
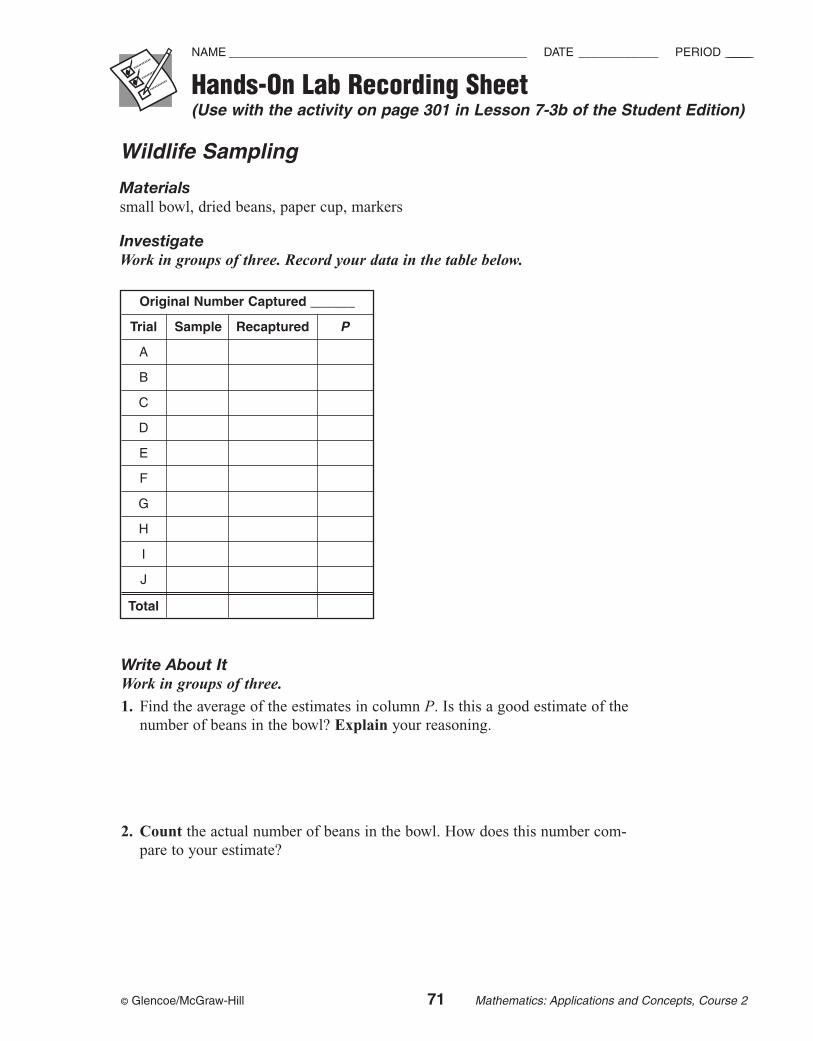
InvestigateWork in groups of three. Record your data in the table below.
Original Number Captured ______
Trial Sample Recaptured P
A
B
C
D
E
F
G
H
I
J
Total
Write About It Work in groups of three.
1. Find the average of the estimates in column P. Is this a good estimate of thenumber of beans in the bowl? Explain your reasoning.
2. Count the actual number of beans in the bowl. How does this number com-pare to your estimate?
© Glencoe/McGraw-Hill 72 Mathematics: Applications and Concepts, Course 2
Mini-Project(Use with Lesson 7-4)
NAME ______________________________________________ DATE ____________ PERIOD __________
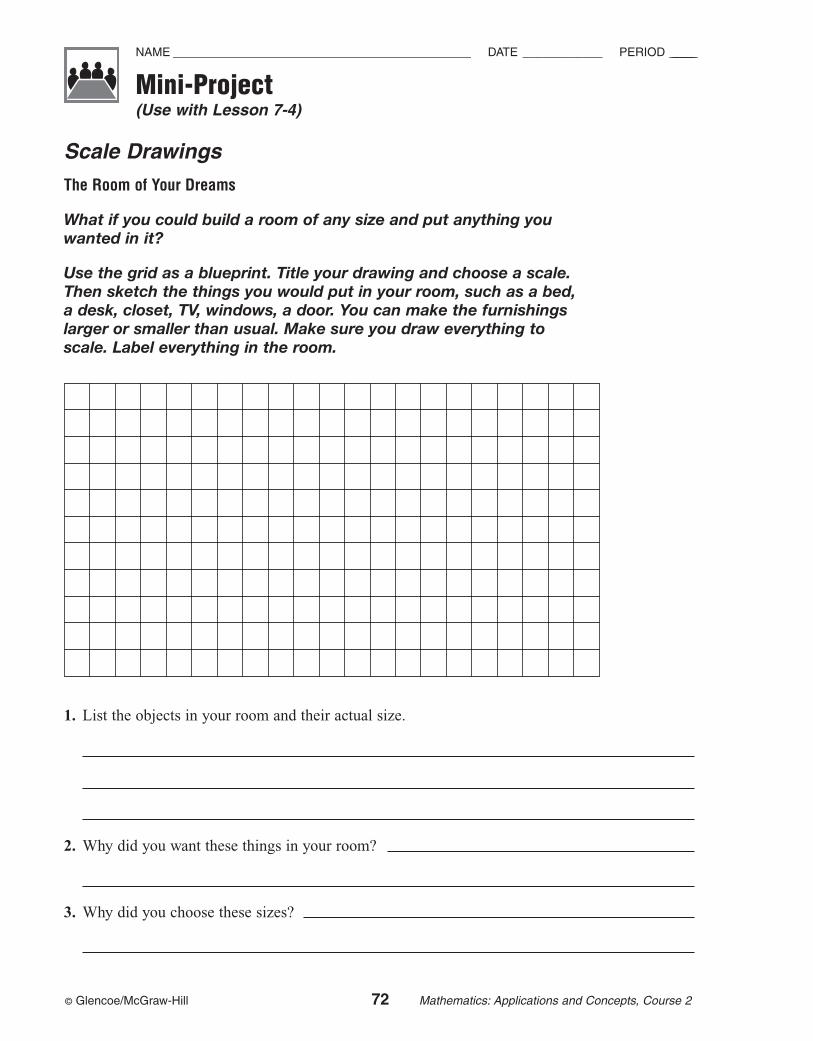
1. List the objects in your room and their actual size.
2. Why did you want these things in your room?
3. Why did you choose these sizes?
Scale Drawings
The Room of Your Dreams
What if you could build a room of any size and put anything youwanted in it?
Use the grid as a blueprint. Title your drawing and choose a scale.Then sketch the things you would put in your room, such as a bed,a desk, closet, TV, windows, a door. You can make the furnishingslarger or smaller than usual. Make sure you draw everything toscale. Label everything in the room.
© Glencoe/McGraw-Hill 73 Mathematics: Applications and Concepts, Course 2
Hands-On Lab Recording Sheet(Use with the activity on page 322 in Lesson 7-8a of the Student Edition)
NAME ______________________________________________ DATE ____________ PERIOD __________
Using a Percent Model
Materials: none
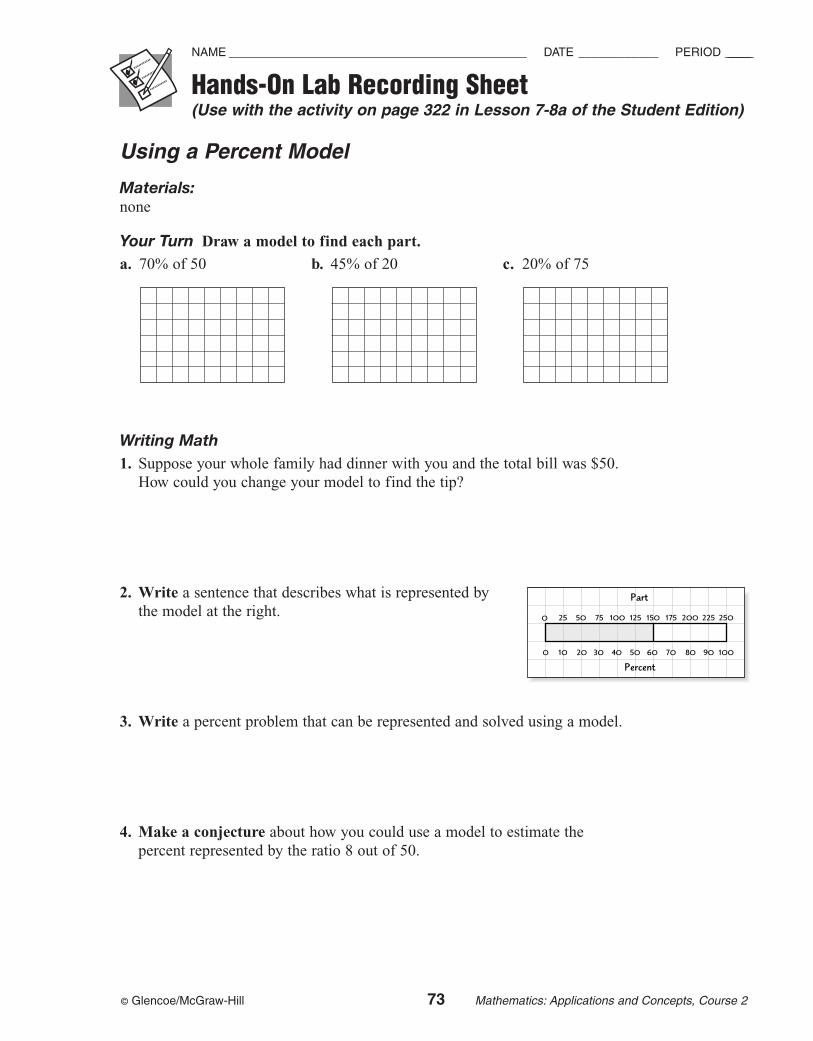
Your Turn Draw a model to find each part.
a. 70% of 50 b. 45% of 20 c. 20% of 75
Writing Math 1. Suppose your whole family had dinner with you and the total bill was $50.
How could you change your model to find the tip?
2. Write a sentence that describes what is represented bythe model at the right.
3. Write a percent problem that can be represented and solved using a model.
4. Make a conjecture about how you could use a model to estimate the percent represented by the ratio 8 out of 50.
0 5025 10075 125 175 225
10
150 200 250
60 70 80 90 100504030200
Part
Percent
Mini-ProjectPercent and Estimation(p. 75 of this booklet)
Use With Lesson 8-1.
Objective Create a scale drawing.
Materialsruler
Using the grid provided, students create ascale drawing of a room they would like tobuild. The drawing includes everything theywish to include in the room drawn to scale.Students must label their drawing and list theobjects in the room and their actual size.
Answers1. See students’ work. Make sure drawings
are the correct scale based on this informa-tion and the scale of the grid.
2–3. Answers will vary.
Hands-On Lab Recording Sheet Sampling(p. 76 of this booklet)
Use With Lesson 8-3a. This corresponds tothe activity on page 344 in the StudentEdition.
Objective Investigate rate of change.
Materialssquare tiles
Students use tiles to build models and find theperimeter of each model. A table and coordi-nate plane is provided for students to recordand graph their data. Students explore rate ofchange by finding the slope of the graph.
AnswersSee Teacher Wraparound Edition p. 344.
Using OverheadManipulativesPercent of Change(pp. 77–78 of this booklet)
Use With Lesson 8-4.
Objective Use dot paper to show percent ofincrease and percent of decrease.
Materialsrectangular dot paper transparency*transparency pens** � available in Overhead Manipulative Resources Kit
• Students use models on dot paper to showand find percent of increase and percent ofdecrease.
• An Extension activity asks students to use agiven figure to show an increase anddecrease of 33�
13
�%.
AnswersAnswers appear on the teacher demonstrationinstructions on pages 77–78.
© Glencoe/McGraw-Hill 74 Mathematics: Applications and Concepts, Course 2
Applying PercentTeaching Notes and Overview
© Glencoe/McGraw-Hill 75 Mathematics: Applications and Concepts, Course 2
Mini-Project(Lesson 8-1)
NAME ______________________________________________ DATE ____________ PERIOD __________
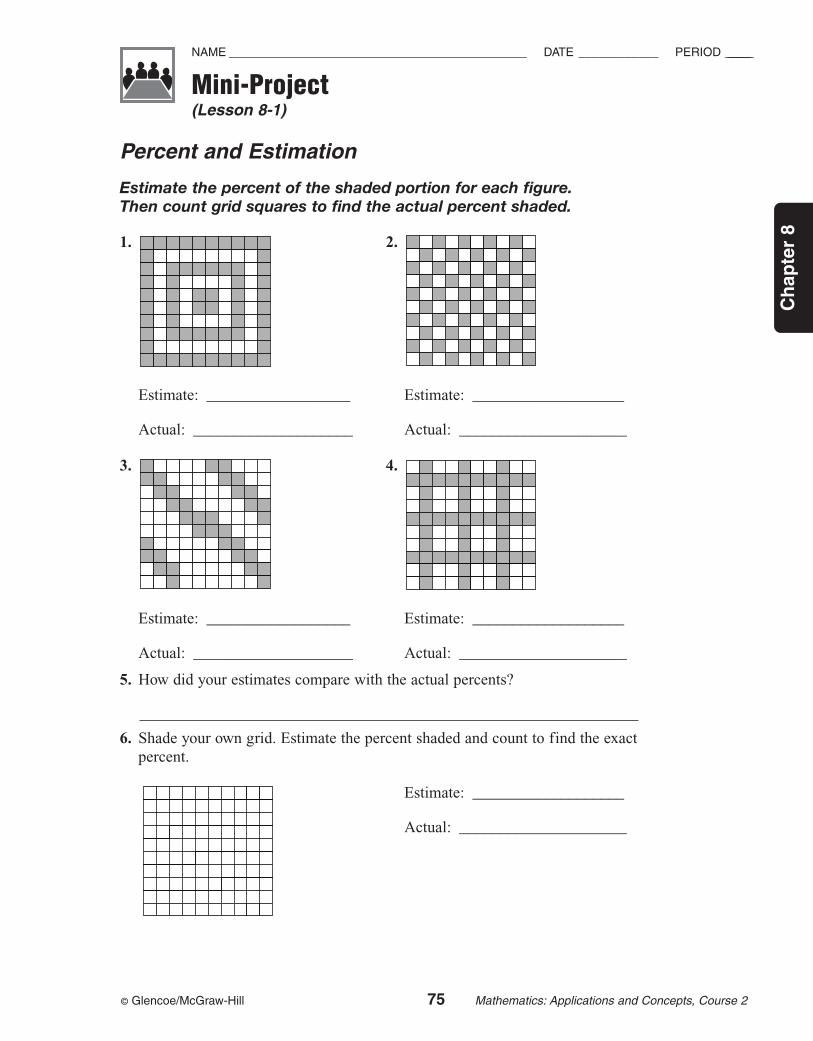
Percent and Estimation
Estimate the percent of the shaded portion for each figure.Then count grid squares to find the actual percent shaded.
1. 2.
Estimate: __________________ Estimate: ___________________
Actual: ____________________ Actual: _____________________
3. 4.
Estimate: __________________ Estimate: ___________________
Actual: ____________________ Actual: _____________________
5. How did your estimates compare with the actual percents?
6. Shade your own grid. Estimate the percent shaded and count to find the exactpercent.
Estimate: ___________________
Actual: _____________________
Ch
apte
r 8
© Glencoe/McGraw-Hill 76 Mathematics: Applications and Concepts, Course 2
Hands-On Lab Recording Sheet(Use with the activity on page 344 in Lesson 8-3a of the Student Edition)
NAME ______________________________________________ DATE ____________ PERIOD __________
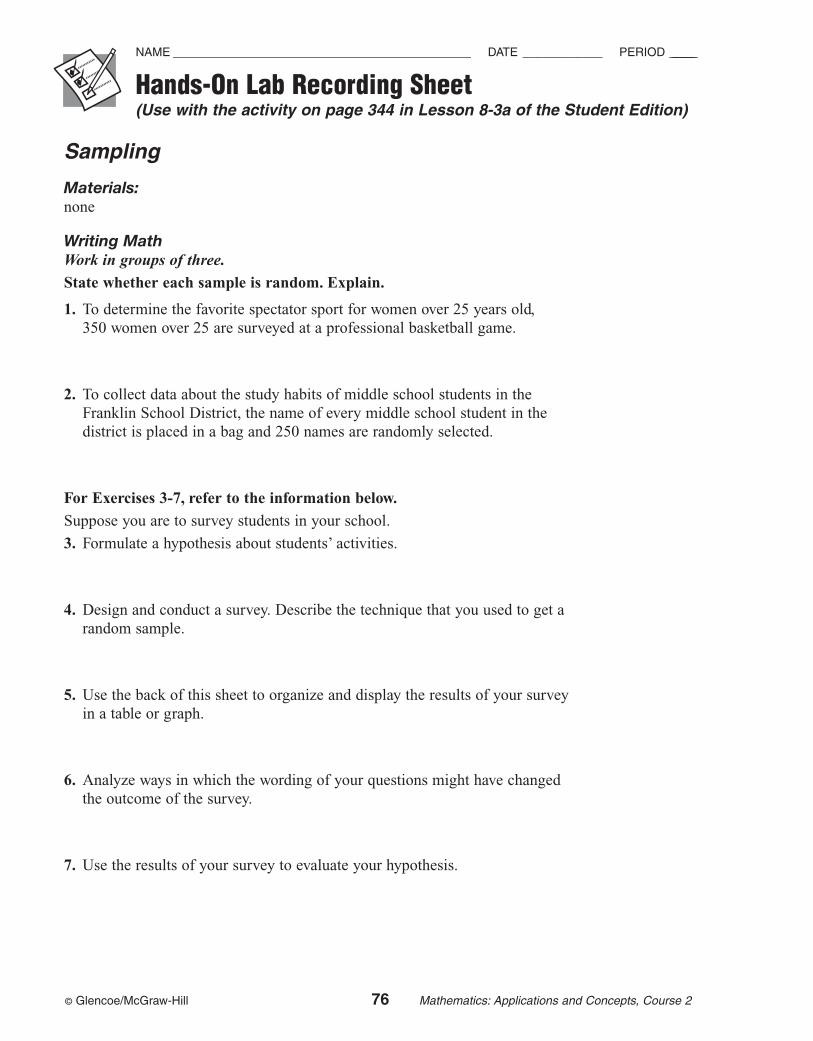
Sampling
Materials:none
Writing MathWork in groups of three.
State whether each sample is random. Explain.
1. To determine the favorite spectator sport for women over 25 years old, 350 women over 25 are surveyed at a professional basketball game.
2. To collect data about the study habits of middle school students in theFranklin School District, the name of every middle school student in the district is placed in a bag and 250 names are randomly selected.
For Exercises 3-7, refer to the information below.
Suppose you are to survey students in your school.
3. Formulate a hypothesis about students’ activities.
4. Design and conduct a survey. Describe the technique that you used to get arandom sample.
5. Use the back of this sheet to organize and display the results of your surveyin a table or graph.
6. Analyze ways in which the wording of your questions might have changedthe outcome of the survey.
7. Use the results of your survey to evaluate your hypothesis.
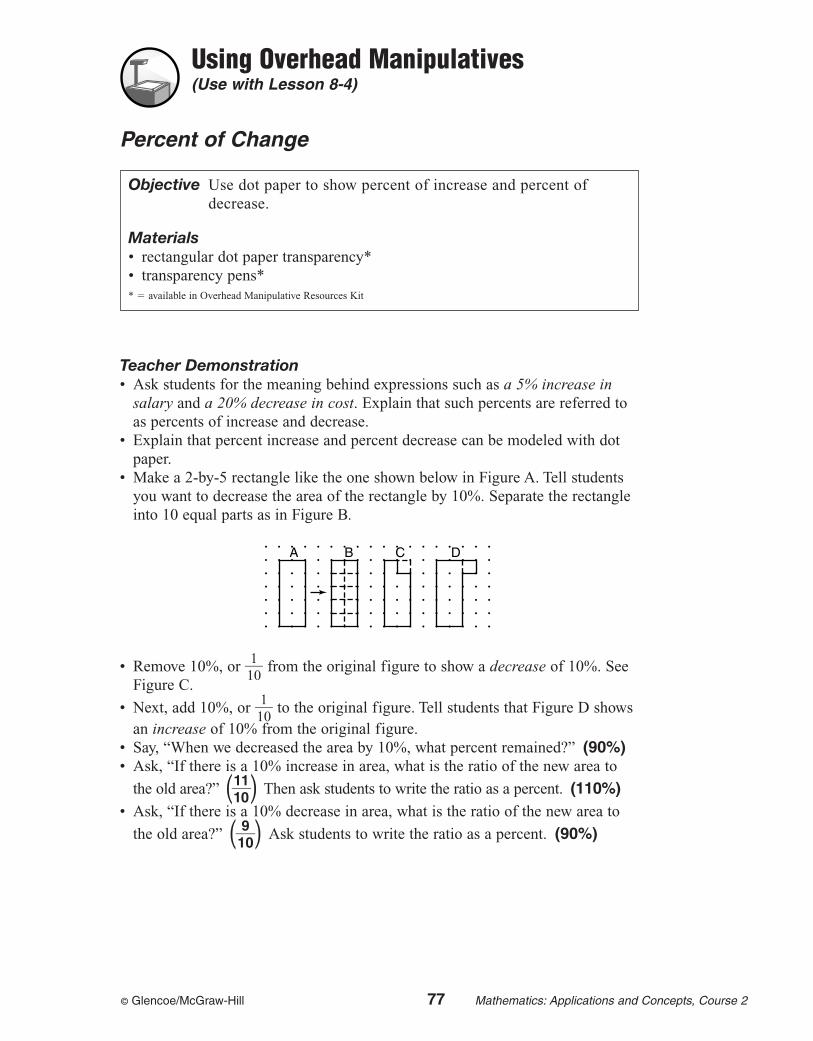
© Glencoe/McGraw-Hill 77 Mathematics: Applications and Concepts, Course 2
Using Overhead Manipulatives(Use with Lesson 8-4)
Percent of Change
Teacher Demonstration • Ask students for the meaning behind expressions such as a 5% increase in
salary and a 20% decrease in cost. Explain that such percents are referred toas percents of increase and decrease.
• Explain that percent increase and percent decrease can be modeled with dotpaper.
• Make a 2-by-5 rectangle like the one shown below in Figure A. Tell studentsyou want to decrease the area of the rectangle by 10%. Separate the rectangleinto 10 equal parts as in Figure B.
• Remove 10%, or �110� from the original figure to show a decrease of 10%. See
Figure C.
• Next, add 10%, or �110� to the original figure. Tell students that Figure D shows
an increase of 10% from the original figure.• Say, “When we decreased the area by 10%, what percent remained?” (90%)• Ask, “If there is a 10% increase in area, what is the ratio of the new area to
the old area?” ��1101�� Then ask students to write the ratio as a percent. (110%)
• Ask, “If there is a 10% decrease in area, what is the ratio of the new area to
the old area?” ��190�� Ask students to write the ratio as a percent. (90%)
A B C D
Objective Use dot paper to show percent of increase and percent ofdecrease.
Materials• rectangular dot paper transparency*• transparency pens** � available in Overhead Manipulative Resources Kit
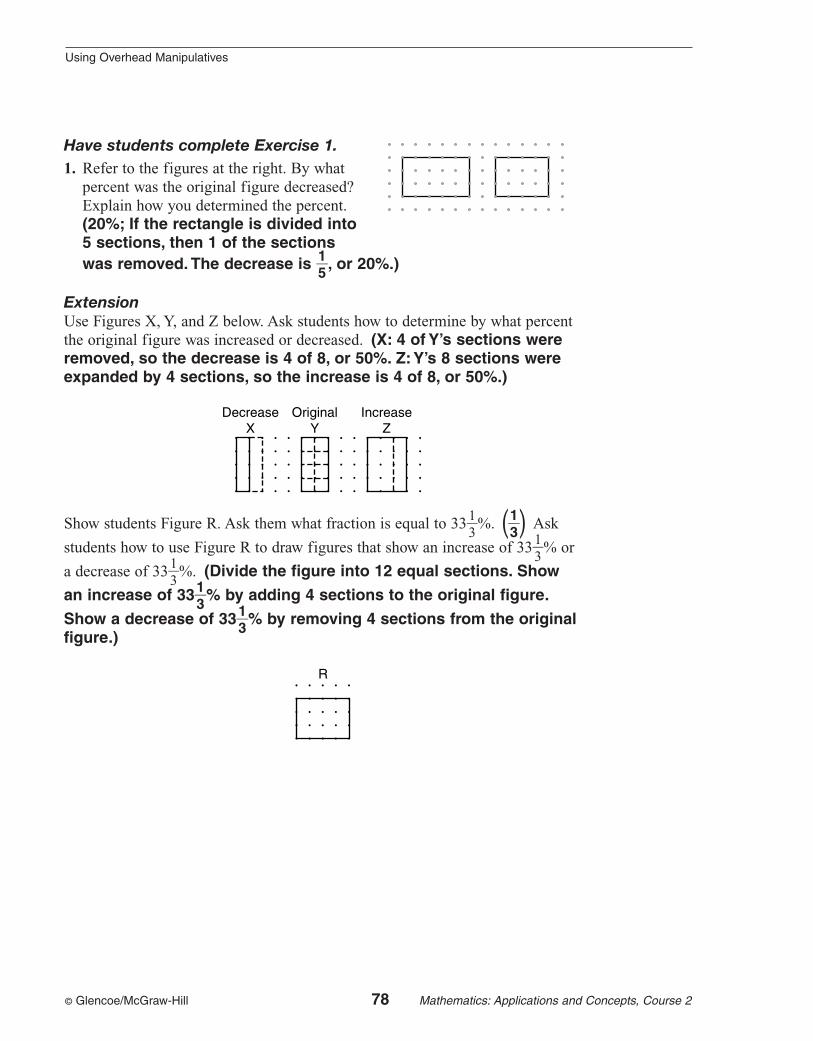
© Glencoe/McGraw-Hill 78 Mathematics: Applications and Concepts, Course 2
Using Overhead Manipulatives
Have students complete Exercise 1.1. Refer to the figures at the right. By what
percent was the original figure decreased?Explain how you determined the percent.(20%; If the rectangle is divided into 5 sections, then 1 of the sections was removed. The decrease is �
15
�, or 20%.)
ExtensionUse Figures X, Y, and Z below. Ask students how to determine by what percentthe original figure was increased or decreased. (X: 4 of Y’s sections wereremoved, so the decrease is 4 of 8, or 50%. Z: Y’s 8 sections wereexpanded by 4 sections, so the increase is 4 of 8, or 50%.)
Show students Figure R. Ask them what fraction is equal to 33�13
�%. ��13
�� Ask
students how to use Figure R to draw figures that show an increase of 33�13
�% or
a decrease of 33�13
�%. (Divide the figure into 12 equal sections. Show
an increase of 33�13
�% by adding 4 sections to the original figure.
Show a decrease of 33�13
�% by removing 4 sections from the originalfigure.)
R
DecreaseX
OriginalY
IncreaseZ
© Glencoe/McGraw-Hill 79 Mathematics: Applications and Concepts, Course 2
Ch
apte
r 9
ProbabilityTeaching Notes and Overview
Using OverheadManipulativesExploring Permutations
(pp. 81–82 of this booklet)
Use With Lesson 9-4.
Objective Explore permutations.
Materialstransparency pen*blank transparency cut into three rectangles2 blank transparencies* = available in Overhead Manipulative Resources Kit
This demonstration contains two activities.• Demonstration 1 shows how to list all the
possible arrangements of three subjects.
• Demonstration 2 shows how to use a tree diagram to show all the possiblearrangements of the three subjects.
• An Extension activity asks students to findthe total number of possible arrangementsof five classes.
AnswersAnswers appear on the teacher demonstrationinstructions on pages 81–82.
Hands-On LabRecording Sheet Exploring Combinations(p. 83 of this booklet)
Use With Lesson 9-5a. This corresponds to the activity on page 386 in the StudentEdition.
Objective Find combinations.
Materials 5 index cards
Using index cards labeled with sundaetoppings, students find combinations bychoosing toppings to make different sundaes.Students will compare and contrast acombination and a permutation, as well as make conclusions on how to find acombination given a permutation.
AnswersSee Teacher Wraparound Edition p. 386.
Mini-ProjectTheoretical and ExperimentalProbability(p. 84 of this booklet)
Use With Lesson 9-6.
Objective Find theoretical and experimentalprobability.
Materials coins
Students toss a coin several times and record the results. They find theoretical andexperimental probability, then compare andcontrast both probabilities.
AnswersSample data: T, T, T, H, T, T, H, T, H, T
1. Sample answer: 7
2. Sample answer: �170�
3. �12
�
4. Sample answer: No, in this case theexperimental probability is much larger.
5. Sample answer: 27
6. Sample answer: 25; I would expect thecoin to land tail side up half of the time.
© Glencoe/McGraw-Hill 80 Mathematics: Applications and Concepts, Course 2
7. Sample answer: �2570�
8. �12
�; They are the same.
9. Sample answer: No, but it is closer thanfor 10 tosses.
10. Sample answer: The experimentalprobability was not the same as thetheoretical probability. However, theexperimental probability of the secondexperiment was closer to the theoreticalprobability, suggesting that the more trialsyou have, the closer the experimentalprobability will be to the theoretical.
Hands-On LabRecording Sheet Experimental Probability(p. 85 of this booklet)
Use With Lesson 9-6b. This corresponds to the activity on page 397 in the StudentEdition.
Objective Investigate experimental probability.
Materials paperscissorsspinner arrows
Students work with a partner to create aspinner and record the results of 25 spins.They combine their results with four otherpairs of students to obtain the results of 100 spins. Using this data, students findexperimental probabilities written as percents.
AnswersSee Teacher Wraparound Edition p. 397.
Chapter 9 Probability
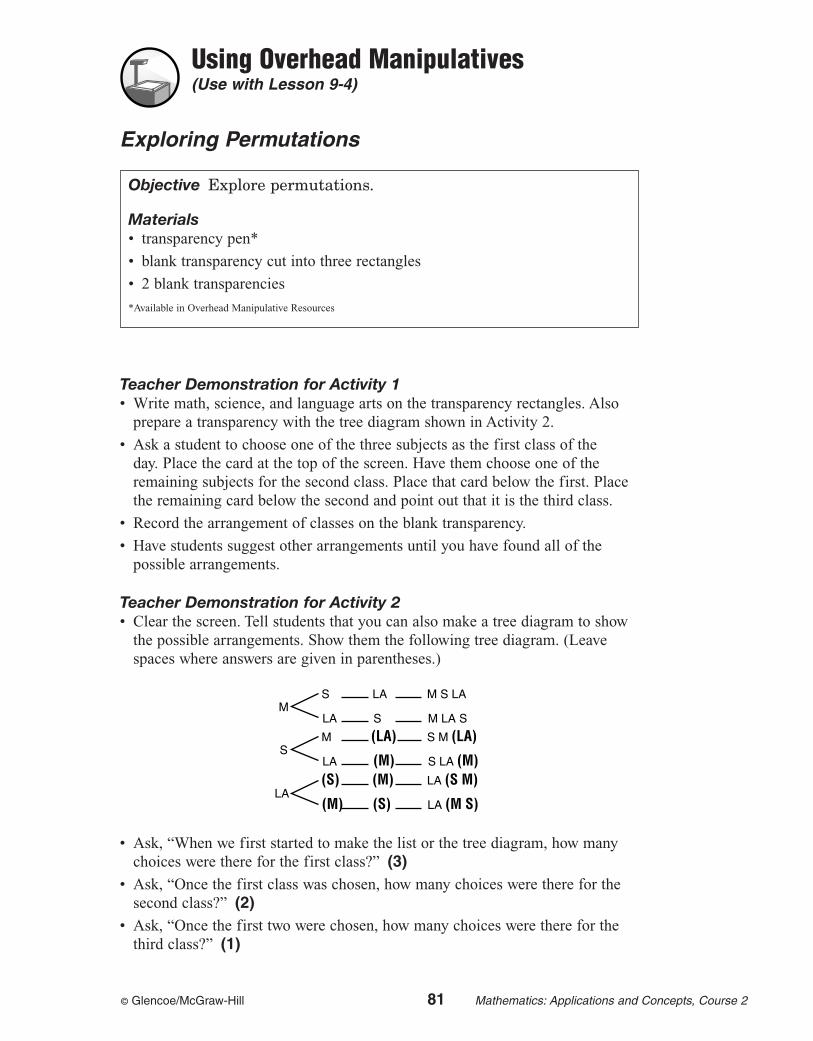
© Glencoe/McGraw-Hill 81 Mathematics: Applications and Concepts, Course 2
Using Overhead Manipulatives(Use with Lesson 9-4)
Exploring Permutations
Teacher Demonstration for Activity 1• Write math, science, and language arts on the transparency rectangles. Also
prepare a transparency with the tree diagram shown in Activity 2.
• Ask a student to choose one of the three subjects as the first class of the day. Place the card at the top of the screen. Have them choose one of theremaining subjects for the second class. Place that card below the first. Placethe remaining card below the second and point out that it is the third class.
• Record the arrangement of classes on the blank transparency.
• Have students suggest other arrangements until you have found all of thepossible arrangements.
Teacher Demonstration for Activity 2• Clear the screen. Tell students that you can also make a tree diagram to show
the possible arrangements. Show them the following tree diagram. (Leavespaces where answers are given in parentheses.)
• Ask, “When we first started to make the list or the tree diagram, how manychoices were there for the first class?” (3)
• Ask, “Once the first class was chosen, how many choices were there for thesecond class?” (2)
• Ask, “Once the first two were chosen, how many choices were there for thethird class?” (1)
S
LAM
(S)
(M)LA
M
LA
LA
S
(M)
(S)
(LA)
(M)
M S LA
M LA S
LA (S M)
LA (M S)
S M (LA)
S LA (M)S
Objective Explore permutations.
Materials• transparency pen*
• blank transparency cut into three rectangles
• 2 blank transparencies
*Available in Overhead Manipulative Resources
© Glencoe/McGraw-Hill 82 Mathematics: Applications and Concepts, Course 2
Using Overhead Manipulatives
• Ask how many arrangements were possible. (6 arrangements)• Ask students to explain how to use the Counting Principle to find the number
of arrangements. (3 � 2 � 1 � 6)• Say, “Suppose we added a fourth class. How many arrangements would be
possible?” (24 arrangements)
ExtensionHave students determine the total number of possible arrangements of fiveclasses. (120)
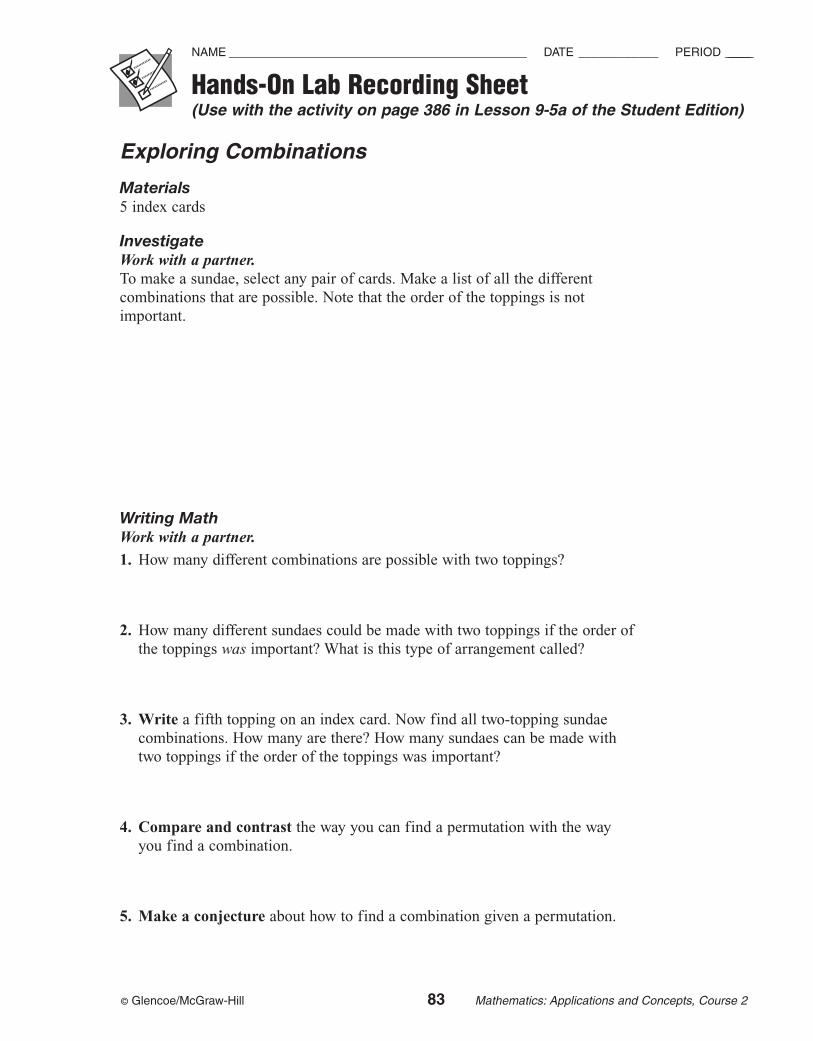
© Glencoe/McGraw-Hill 83 Mathematics: Applications and Concepts, Course 2
Hands-On Lab Recording Sheet(Use with the activity on page 386 in Lesson 9-5a of the Student Edition)
NAME ______________________________________________ DATE ____________ PERIOD __________
Exploring Combinations
Materials5 index cards
InvestigateWork with a partner.To make a sundae, select any pair of cards. Make a list of all the differentcombinations that are possible. Note that the order of the toppings is notimportant.
Writing MathWork with a partner.
1. How many different combinations are possible with two toppings?
2. How many different sundaes could be made with two toppings if the order ofthe toppings was important? What is this type of arrangement called?
3. Write a fifth topping on an index card. Now find all two-topping sundaecombinations. How many are there? How many sundaes can be made withtwo toppings if the order of the toppings was important?
4. Compare and contrast the way you can find a permutation with the wayyou find a combination.
5. Make a conjecture about how to find a combination given a permutation.
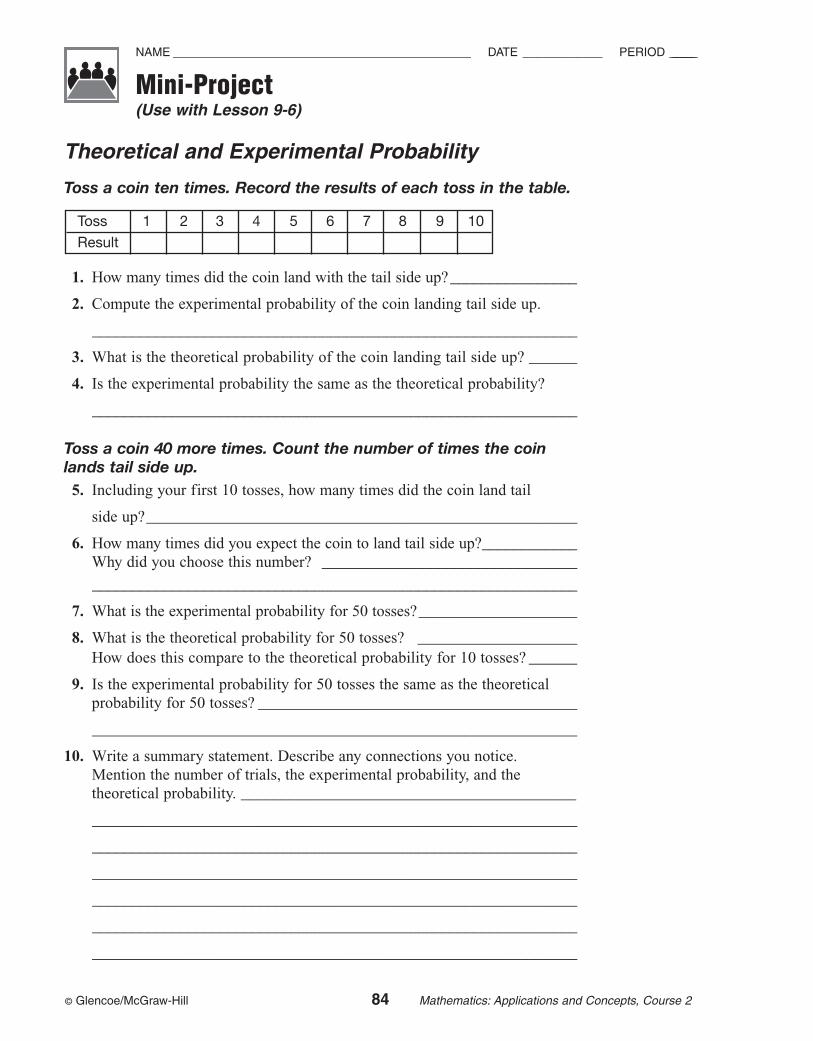
© Glencoe/McGraw-Hill 84 Mathematics: Applications and Concepts, Course 2
Mini-Project(Use with Lesson 9-6)
NAME ______________________________________________ DATE ____________ PERIOD __________
Theoretical and Experimental Probability
Toss a coin ten times. Record the results of each toss in the table.
1. How many times did the coin land with the tail side up?________________
2. Compute the experimental probability of the coin landing tail side up.
_____________________________________________________________
3. What is the theoretical probability of the coin landing tail side up? ______
4. Is the experimental probability the same as the theoretical probability?
_____________________________________________________________
Toss a coin 40 more times. Count the number of times the coinlands tail side up.5. Including your first 10 tosses, how many times did the coin land tail
side up?______________________________________________________
6. How many times did you expect the coin to land tail side up?____________Why did you choose this number? ________________________________
_____________________________________________________________
7. What is the experimental probability for 50 tosses?____________________
8. What is the theoretical probability for 50 tosses? ____________________How does this compare to the theoretical probability for 10 tosses? ______
9. Is the experimental probability for 50 tosses the same as the theoreticalprobability for 50 tosses? ________________________________________
_____________________________________________________________
10. Write a summary statement. Describe any connections you notice. Mention the number of trials, the experimental probability, and the theoretical probability. __________________________________________
_____________________________________________________________
_____________________________________________________________
_____________________________________________________________
_____________________________________________________________
_____________________________________________________________
_____________________________________________________________
Toss 1 2 3 4 5 6 7 8 9 10Result
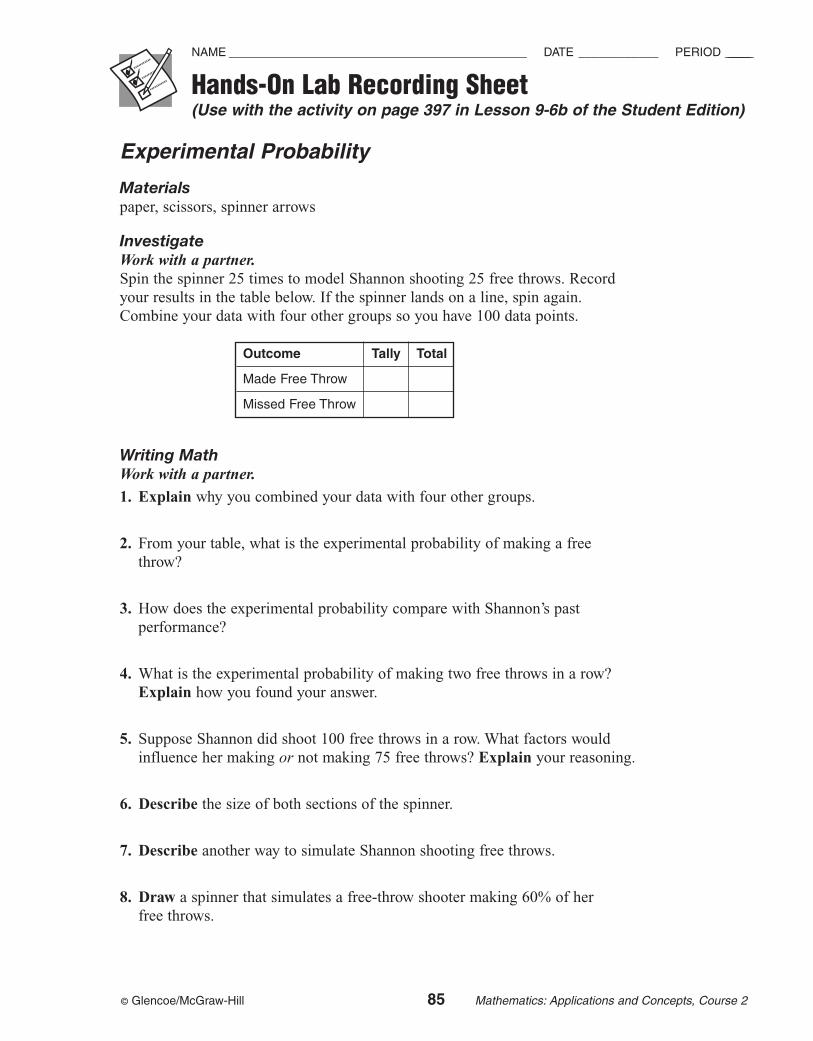
© Glencoe/McGraw-Hill 85 Mathematics: Applications and Concepts, Course 2
Hands-On Lab Recording Sheet(Use with the activity on page 397 in Lesson 9-6b of the Student Edition)
NAME ______________________________________________ DATE ____________ PERIOD __________
Experimental Probability
Materialspaper, scissors, spinner arrows
InvestigateWork with a partner.Spin the spinner 25 times to model Shannon shooting 25 free throws. Recordyour results in the table below. If the spinner lands on a line, spin again.Combine your data with four other groups so you have 100 data points.
Writing MathWork with a partner.
1. Explain why you combined your data with four other groups.
2. From your table, what is the experimental probability of making a freethrow?
3. How does the experimental probability compare with Shannon’s pastperformance?
4. What is the experimental probability of making two free throws in a row?Explain how you found your answer.
5. Suppose Shannon did shoot 100 free throws in a row. What factors wouldinfluence her making or not making 75 free throws? Explain your reasoning.
6. Describe the size of both sections of the spinner.
7. Describe another way to simulate Shannon shooting free throws.
8. Draw a spinner that simulates a free-throw shooter making 60% of her free throws.
Outcome Tally Total
Made Free Throw
Missed Free Throw
© Glencoe/McGraw-Hill 86 Mathematics: Applications and Concepts, Course 2
GeometryTeaching Notes and Overview
Hands-On LabRecording Sheet Measuring Angles(p. 90 of this booklet)
Use With Lesson 10-1a. This corresponds tothe activity on page 412 in the StudentEdition.
Objective Measure angles.
Materials protractor
Students will learn how to use a protractor tomeasure angles.
AnswersSee Teacher Wraparound Edition p. 412.
Hands-On LabRecording Sheet Constructing and Bisecting Angles(p. 91 of this booklet)
Use With Lesson 10-1b. This corresponds tothe activity on pages 416–417 in the StudentEdition.
Objective Construct and bisect angles.
Materialsstraightedgecompass
Students will use a protractor, straightedge,and compass to construct and bisect angles.
AnswersSee Teacher Wraparound Edition pp. 416–417.
Using OverheadManipulativesJelly Bean Statistics(p. 92 of this booklet)
Use With Lesson 10-2.
Objective Make a circle graph.
Materialstransparency pen*straightedge*compass*2 blank transparencies* � available in Overhead Manipulative Resources Kit
• This demonstration shows how to create afrequency table and circle graph using thestudents’ favorite colors.
• An Extension activity asks students to findthe number of degrees in each section of thecircle using the percents for each section.
AnswersAnswers appear on the teacher demonstrationinstructions on page 92.
Hands-On LabRecording Sheet Constructing Parallel Lines(p. 93 of this booklet)
Use With Lesson 10-3b. This corresponds tothe activity on pages 426–427 in the StudentEdition.
Objective Construct parallel lines, and findangle relationships.
© Glencoe/McGraw-Hill 87 Mathematics: Applications and Concepts, Course 2
Materialsstraightedgecompassprotractorcolored pencilsnotebook paper
Students work with a partner to construct par-allel lines and identify angle relationships.They also use angle relationships to find themeasures of unknown angles.
AnswersSee Teacher Wraparound Edition pp. 426–427.
Hands-On LabRecording Sheet Constructing Triangles(p. 94 of this booklet)
Use With Lesson 10-4b. This corresponds tothe activity on pages 432–433 in the StudentEdition.
Objective Construct equilateral and isosce-les triangles.
Materialsstraightedgecompassprotractorruler
Students work with a partner to construct anequilateral triangle and an isosceles triangle.Students use their drawings to make conclu-sions about the measure of the angles in anequilateral triangle and an isosceles triangle.
AnswersSee Teacher Wraparound Edition pp. 432–433.
Using OverheadManipulativesInvestigating Triangles andQuadrilaterals(pp. 95–96 of this booklet)
Use With Lesson 10-5.
Objective Discover characteristics of vari-ous kinds of triangles and quadrilaterals.
Materials4 � 6 index cardsscissorsbrass fastenersruler*protractor*blank transparency transparency pens** � available in Overhead Manipulative Resources Kit
This demonstration contains two activities.• Demonstration 1 shows the relationship
between the sides of a triangle and themeasures of its angles.
• Demonstration 2 shows the relationshipbetween the sides of a quadrilateral and themeasures of its angles.
• An Extension activity asks students to findexamples of the use of triangles to make ashape rigid.
AnswersAnswers appear on the teacher demonstrationinstructions on pages 95–96.
Mini-ProjectQuadrilateral Tessellations(p. 97 of this booklet)
Use With Lesson 10-7.
Objective Create a tessellation using quadrilaterals.
Chapter 10 Geometry
Ch
apte
r 10
© Glencoe/McGraw-Hill 88 Mathematics: Applications and Concepts, Course 2
Materialsprotractortracing paperscissors
Students draw a convex quadrilateral and useit to create a tessellation. Space is providedfor students to sketch their tessellation andmake conclusions based on their work.
Answers1-6. See students’ work.
7. 360°
8. Yes; the sum of the angles of a convexquadrilateral is 360°. This means the ver-tices can be put together so there are nogaps. This is what we need to make a tessellation.
Using OverheadManipulativesAngles of a Polygon(pp. 98–99 of this booklet)
Use With Lesson 10-7.
Objective Find the sum of the anglemeasures of polygons.
Materialsprotractor*straightedge*transparency pens*blank transparencyscissorsconstruction paper* � available in Overhead Manipulative Resources Kit
This demonstration contains two activities.• Demonstration 1 shows how to form a
straight angle using the three angles of anytriangle.
• Demonstration 2 shows the relationshipbetween the number of sides of a polygon tothe sum of the measures of its angles.
• Students are asked to find the sum of themeasures of the angles of polygons withvarious numbers of sides.
AnswersAnswers appear on the teacher demonstrationinstructions on pages 98–99.
Using OverheadManipulativesInscribed Polygons(pp. 100–101 of this booklet)
Use With Lesson 10-7.
Objective Inscribe triangles, squares, andhexagons in circles.
Materialscompass*straightedge*wax paperruler*transparency pens*protractor*scissors*� available in Overhead Manipulative Resources Kit
This demonstration contains three activities.• Demonstration 1 shows how to inscribe a
square in a circle by using paper folding.
• Demonstration 2 shows how to use a com-pass and a straightedge to inscribe a squarein a circle.
• Demonstration 3 shows how to inscribeother regular polygons in a circle using acompass and straightedge.
• Students will inscribe an equilateral trianglein a circle independently and explain thesteps they used.
Chapter 10 Geometry
© Glencoe/McGraw-Hill 89 Mathematics: Applications and Concepts, Course 2
AnswersAnswers appear on the teacher demonstrationinstructions on pages 100–101.
Using OverheadManipulativesDilations(pp. 102–103 of this booklet)
Use With Lesson 10-8b.
Objective Enlarge a figure on a coordinateplane.
Materialstransparency pens*straightedge*transparency of a simple picture or a small
cartooncentimeter grid transparency* � available in Overhead Manipulative Resources Kit
• This demonstration shows how to enlarge acartoon or picture using a centimeter gridtransparency.
• An Extension activity demonstrates how to reduce a cartoon or picture using acentimeter grid transparency.
AnswersAnswers appear on the teacher demonstrationinstructions on pages 102–103.
Hands-On LabRecording Sheet Rotations(p. 104 of this booklet)
Use With Lesson 10-9b. This corresponds tothe activity on pages 460–461 in the StudentEdition.
Objective Graph rotations on a coordinateplane.
Materials graph paperprotractorruler
Students will graph and describe rotations.They will also identify different types oftransformations.
AnswersSee Teacher Wraparound Edition pp. 460–461.
Chapter 10 Geometry
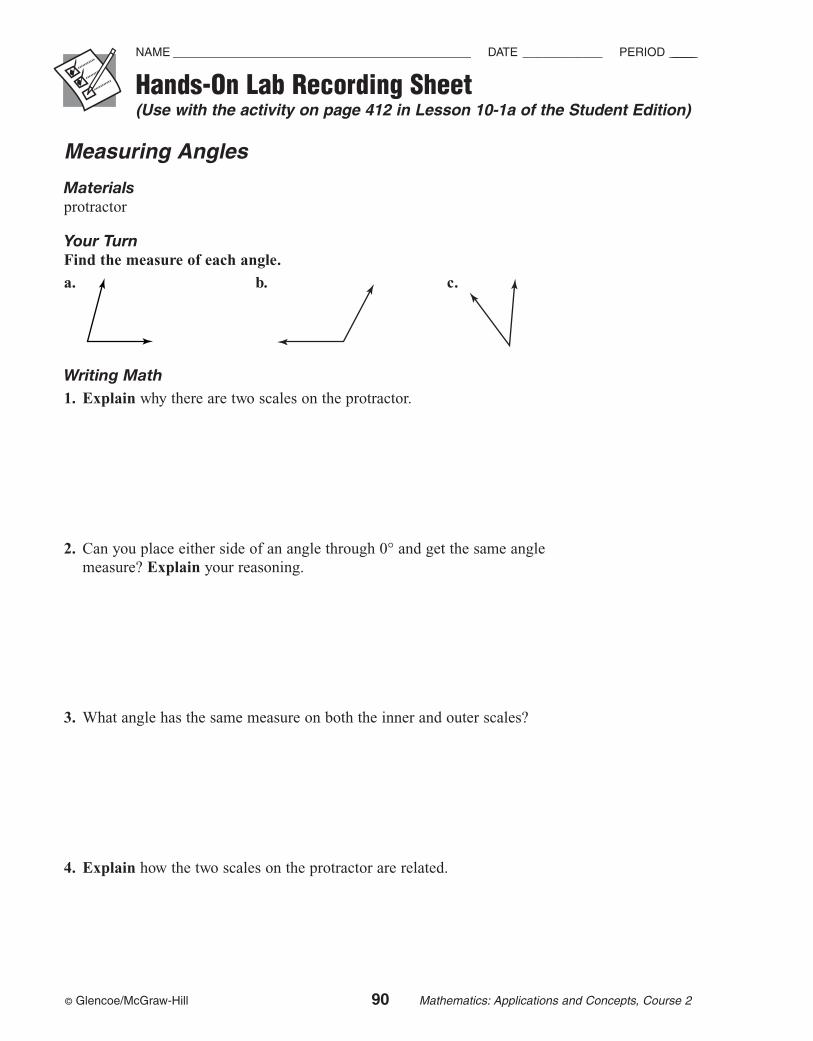
© Glencoe/McGraw-Hill 90 Mathematics: Applications and Concepts, Course 2
Hands-On Lab Recording Sheet(Use with the activity on page 412 in Lesson 10-1a of the Student Edition)
NAME ______________________________________________ DATE ____________ PERIOD __________
Measuring Angles
Materialsprotractor
Your TurnFind the measure of each angle.
a. b. c.
Writing Math1. Explain why there are two scales on the protractor.
2. Can you place either side of an angle through 0° and get the same anglemeasure? Explain your reasoning.
3. What angle has the same measure on both the inner and outer scales?
4. Explain how the two scales on the protractor are related.
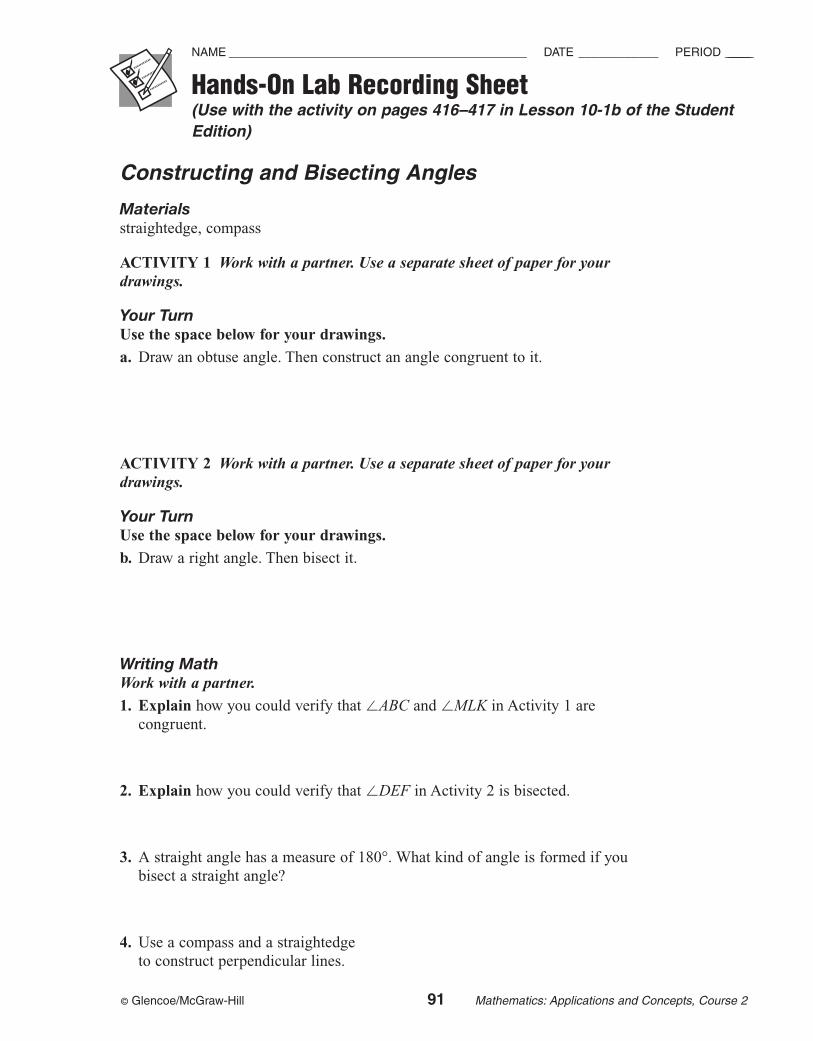
© Glencoe/McGraw-Hill 91 Mathematics: Applications and Concepts, Course 2
Hands-On Lab Recording Sheet(Use with the activity on pages 416–417 in Lesson 10-1b of the StudentEdition)
NAME ______________________________________________ DATE ____________ PERIOD __________
Constructing and Bisecting Angles
Materialsstraightedge, compass
ACTIVITY 1 Work with a partner. Use a separate sheet of paper for yourdrawings.
Your TurnUse the space below for your drawings.
a. Draw an obtuse angle. Then construct an angle congruent to it.
ACTIVITY 2 Work with a partner. Use a separate sheet of paper for yourdrawings.
Your TurnUse the space below for your drawings.
b. Draw a right angle. Then bisect it.
Writing MathWork with a partner.
1. Explain how you could verify that �ABC and �MLK in Activity 1 are congruent.
2. Explain how you could verify that �DEF in Activity 2 is bisected.
3. A straight angle has a measure of 180°. What kind of angle is formed if youbisect a straight angle?
4. Use a compass and a straightedge to construct perpendicular lines.
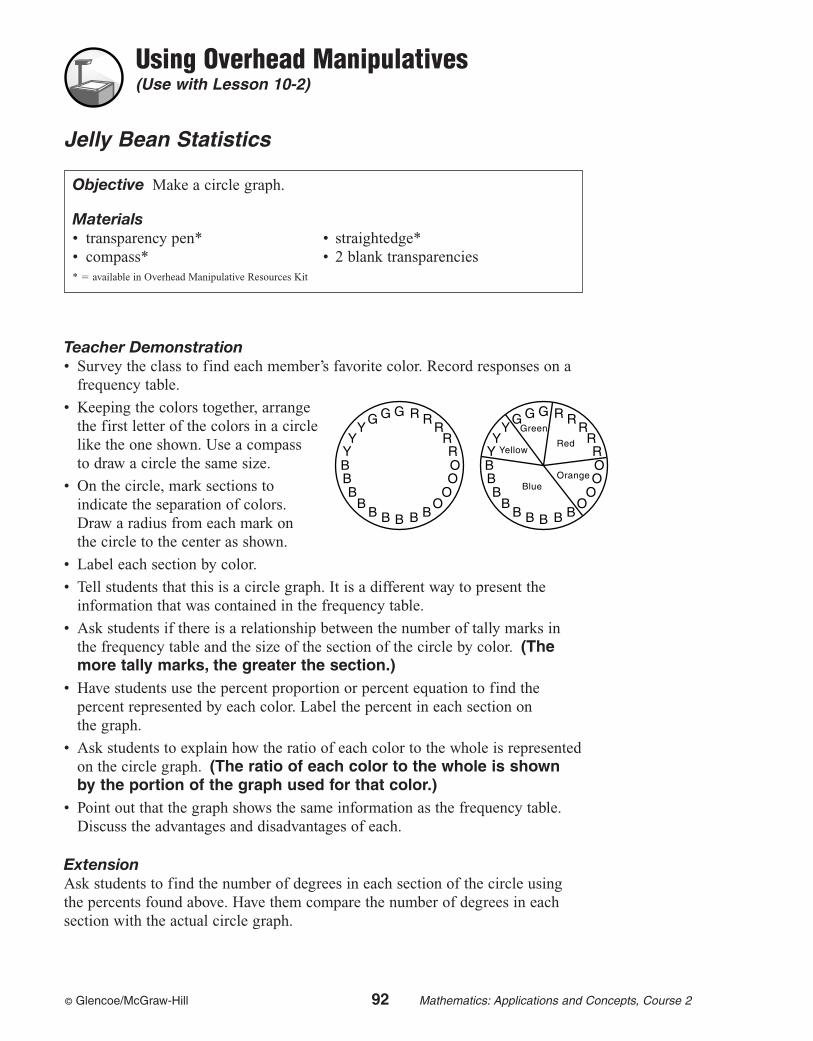
© Glencoe/McGraw-Hill 92 Mathematics: Applications and Concepts, Course 2
Using Overhead Manipulatives(Use with Lesson 10-2)
Jelly Bean Statistics
Teacher Demonstration • Survey the class to find each member’s favorite color. Record responses on a
frequency table.
• Keeping the colors together, arrange the first letter of the colors in a circle like the one shown. Use a compass to draw a circle the same size.
• On the circle, mark sections to indicate the separation of colors. Draw a radius from each mark on the circle to the center as shown.
• Label each section by color.
• Tell students that this is a circle graph. It is a different way to present theinformation that was contained in the frequency table.
• Ask students if there is a relationship between the number of tally marks inthe frequency table and the size of the section of the circle by color. (Themore tally marks, the greater the section.)
• Have students use the percent proportion or percent equation to find thepercent represented by each color. Label the percent in each section on the graph.
• Ask students to explain how the ratio of each color to the whole is representedon the circle graph. (The ratio of each color to the whole is shownby the portion of the graph used for that color.)
• Point out that the graph shows the same information as the frequency table.Discuss the advantages and disadvantages of each.
ExtensionAsk students to find the number of degrees in each section of the circle usingthe percents found above. Have them compare the number of degrees in eachsection with the actual circle graph.
Objective Make a circle graph.
Materials• transparency pen* • straightedge*• compass* • 2 blank transparencies* � available in Overhead Manipulative Resources Kit
G
B
G R
B B
G R
B B
Y R
B O
Y R
B O
Y R
B OB O
G
B
G R
B B
G R
Red
Green
Yellow
BlueOrange
B B
Y R
B O
Y R
B O
Y R
B OB O
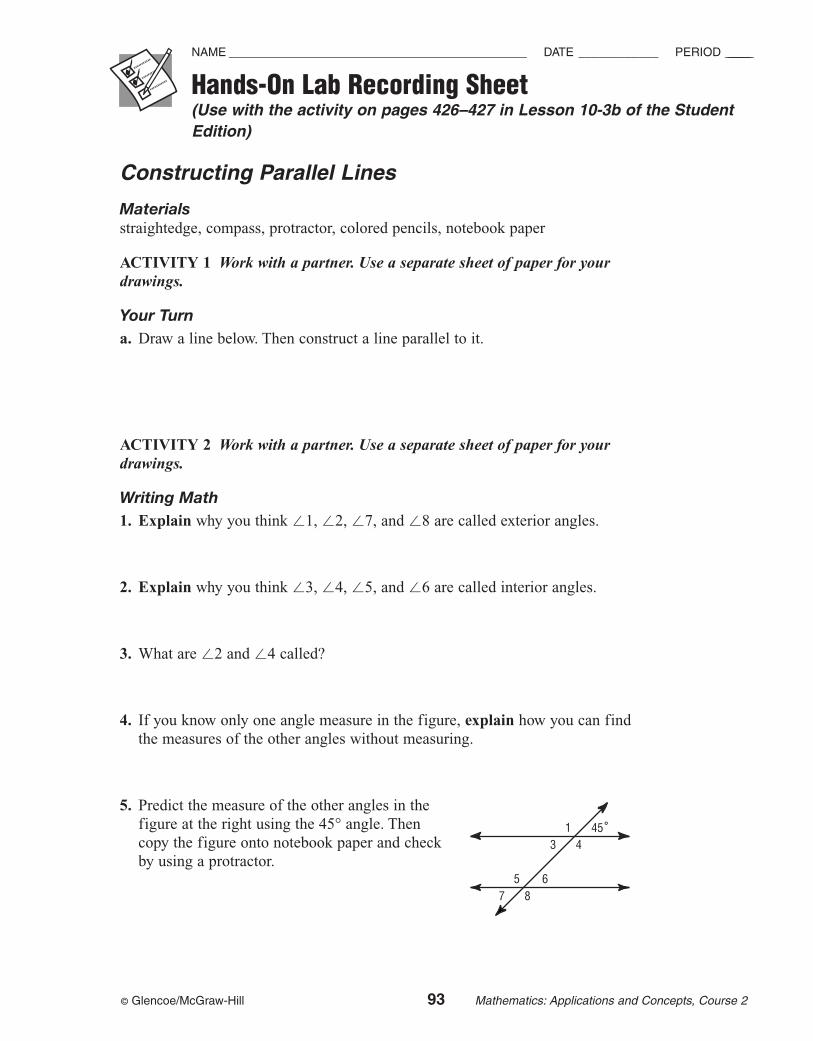
© Glencoe/McGraw-Hill 93 Mathematics: Applications and Concepts, Course 2
Hands-On Lab Recording Sheet(Use with the activity on pages 426–427 in Lesson 10-3b of the StudentEdition)
NAME ______________________________________________ DATE ____________ PERIOD __________
Constructing Parallel Lines
Materialsstraightedge, compass, protractor, colored pencils, notebook paper
ACTIVITY 1 Work with a partner. Use a separate sheet of paper for yourdrawings.
Your Turna. Draw a line below. Then construct a line parallel to it.
ACTIVITY 2 Work with a partner. Use a separate sheet of paper for yourdrawings.
Writing Math1. Explain why you think �1, �2, �7, and �8 are called exterior angles.
2. Explain why you think �3, �4, �5, and �6 are called interior angles.
3. What are �2 and �4 called?
4. If you know only one angle measure in the figure, explain how you can findthe measures of the other angles without measuring.
5. Predict the measure of the other angles in the figure at the right using the 45° angle. Then copy the figure onto notebook paper and check by using a protractor.
143
587
6
45˚
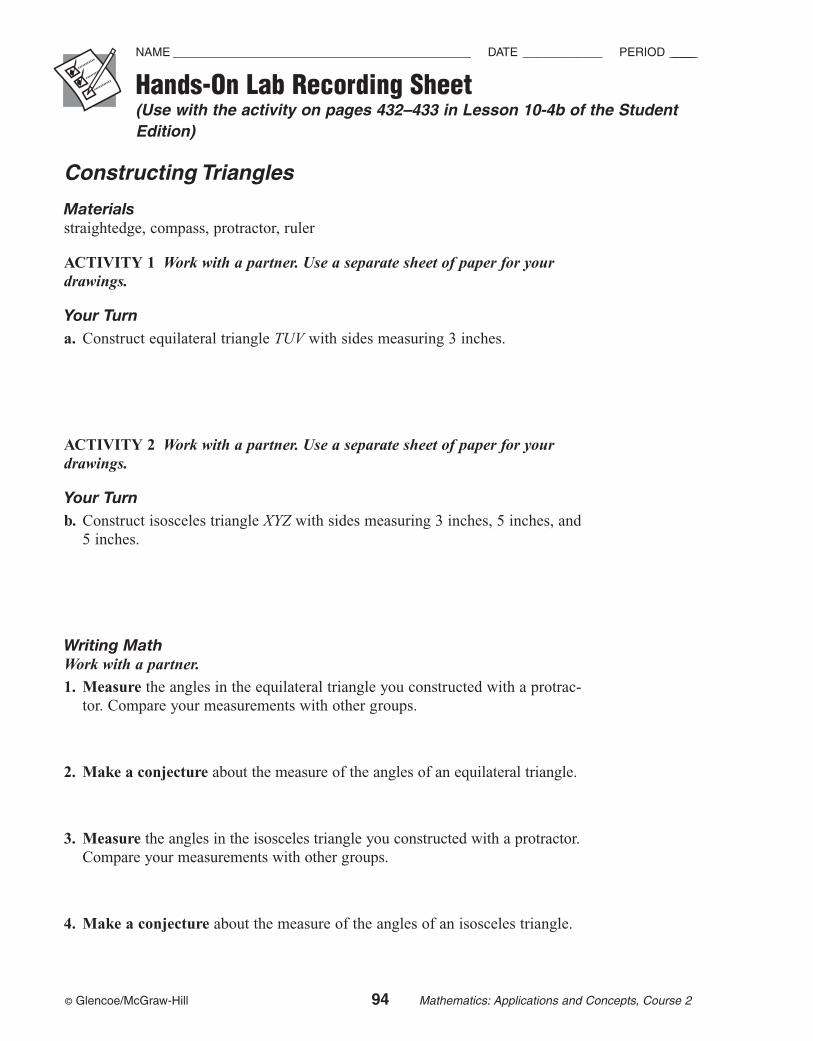
© Glencoe/McGraw-Hill 94 Mathematics: Applications and Concepts, Course 2
Hands-On Lab Recording Sheet(Use with the activity on pages 432–433 in Lesson 10-4b of the StudentEdition)
NAME ______________________________________________ DATE ____________ PERIOD __________
Constructing Triangles
Materialsstraightedge, compass, protractor, ruler
ACTIVITY 1 Work with a partner. Use a separate sheet of paper for yourdrawings.
Your Turna. Construct equilateral triangle TUV with sides measuring 3 inches.
ACTIVITY 2 Work with a partner. Use a separate sheet of paper for yourdrawings.
Your Turnb. Construct isosceles triangle XYZ with sides measuring 3 inches, 5 inches, and
5 inches.
Writing MathWork with a partner.
1. Measure the angles in the equilateral triangle you constructed with a protrac-tor. Compare your measurements with other groups.
2. Make a conjecture about the measure of the angles of an equilateral triangle.
3. Measure the angles in the isosceles triangle you constructed with a protractor.Compare your measurements with other groups.
4. Make a conjecture about the measure of the angles of an isosceles triangle.
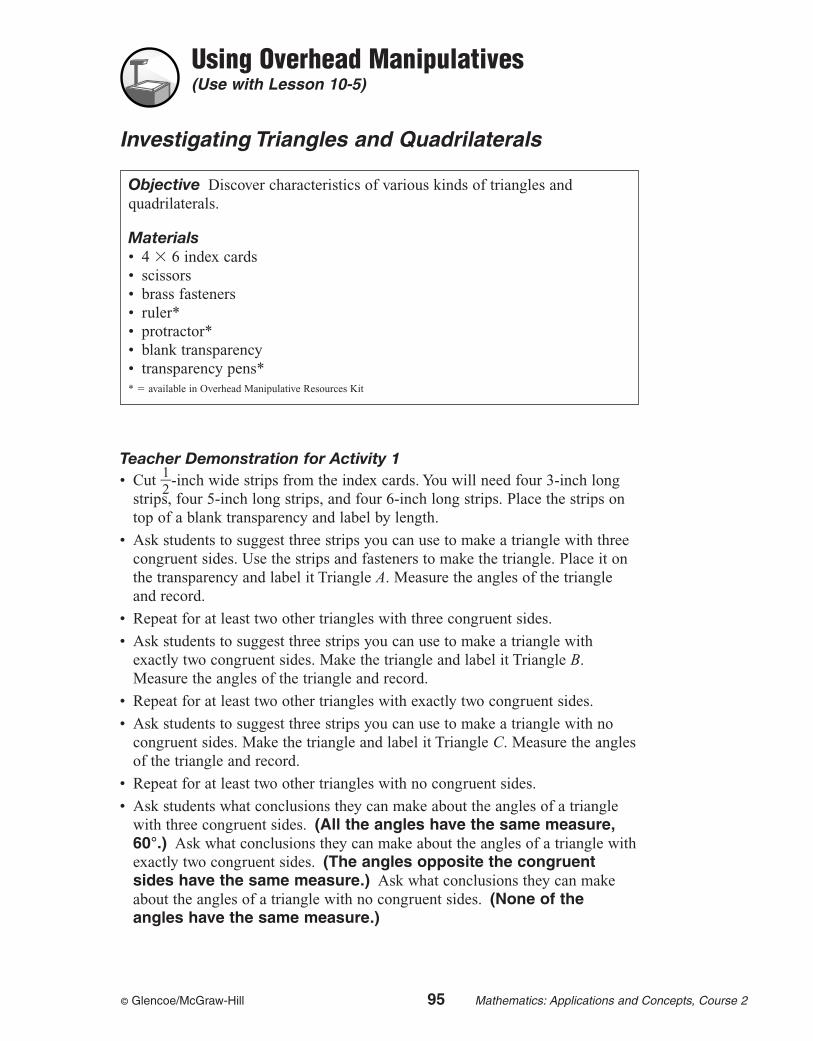
© Glencoe/McGraw-Hill 95 Mathematics: Applications and Concepts, Course 2
Using Overhead Manipulatives(Use with Lesson 10-5)
Investigating Triangles and Quadrilaterals
Teacher Demonstration for Activity 1• Cut �
12
�-inch wide strips from the index cards. You will need four 3-inch longstrips, four 5-inch long strips, and four 6-inch long strips. Place the strips ontop of a blank transparency and label by length.
• Ask students to suggest three strips you can use to make a triangle with threecongruent sides. Use the strips and fasteners to make the triangle. Place it onthe transparency and label it Triangle A. Measure the angles of the triangleand record.
• Repeat for at least two other triangles with three congruent sides.
• Ask students to suggest three strips you can use to make a triangle withexactly two congruent sides. Make the triangle and label it Triangle B.Measure the angles of the triangle and record.
• Repeat for at least two other triangles with exactly two congruent sides.
• Ask students to suggest three strips you can use to make a triangle with nocongruent sides. Make the triangle and label it Triangle C. Measure the anglesof the triangle and record.
• Repeat for at least two other triangles with no congruent sides.
• Ask students what conclusions they can make about the angles of a trianglewith three congruent sides. (All the angles have the same measure,60°.) Ask what conclusions they can make about the angles of a triangle withexactly two congruent sides. (The angles opposite the congruentsides have the same measure.) Ask what conclusions they can makeabout the angles of a triangle with no congruent sides. (None of theangles have the same measure.)
Objective Discover characteristics of various kinds of triangles and quadrilaterals.
Materials• 4 � 6 index cards• scissors• brass fasteners• ruler*• protractor*• blank transparency• transparency pens** � available in Overhead Manipulative Resources Kit
© Glencoe/McGraw-Hill 96 Mathematics: Applications and Concepts, Course 2
Using Overhead Manipulatives
Teacher Demonstration for Activity 2• Ask students to suggest four congruent strips you can use to make a quadrilat-
eral. Join them with brass fasteners to form a quadrilateral with four rightangles. Label it quadrilateral D. Record the measure of the angles and sides.
• Shift the figure into a different-shaped quadrilateral. Label it quadrilateral E.Have a student measure its angles. Record the angle measures. Ask studentswhat pattern they notice. (The two opposite angles have the samemeasure; the sum of adjacent angles is always 180°.)
• Have students suggest two sets of congruent strips. Use the strips to make aquadrilateral with four right angles. Label it quadrilateral F and record themeasures of its angles.
• Shift the figure into a different-shaped quadrilateral. Label it quadrilateral G.Have a student measure its angles. Record the angle measures. Ask studentswhat pattern they notice. (The two opposite angles have the samemeasure; the sum of adjacent angles is always 180°.)
• Repeat this activity using different strips. Have students compare the findingswith those above.
• Point out that you were able to shift the quadrilaterals so that the angleschanged. Ask students whether they think you can shift a triangle into a differ-ent triangle. Make several different triangles and demonstrate that they cannotbe shifted.
Have students complete Exercises 1–2.1. Suppose you were building a bookcase. The outside is in the shape of a
rectangle.
a. Would you expect the rectangle to be rigid or would you expect it to shift?(shift)
b. How could you make the bookcase more rigid? (Add a diagonal support, which makes two triangles.)
2. Make a conjecture about why triangles are often used in the construction ofbuildings. (Triangles are rigid shapes and do not shift.)
ExtensionHave students look for other examples of the use of triangles to make a shaperigid. (Sample answer: bridge construction)
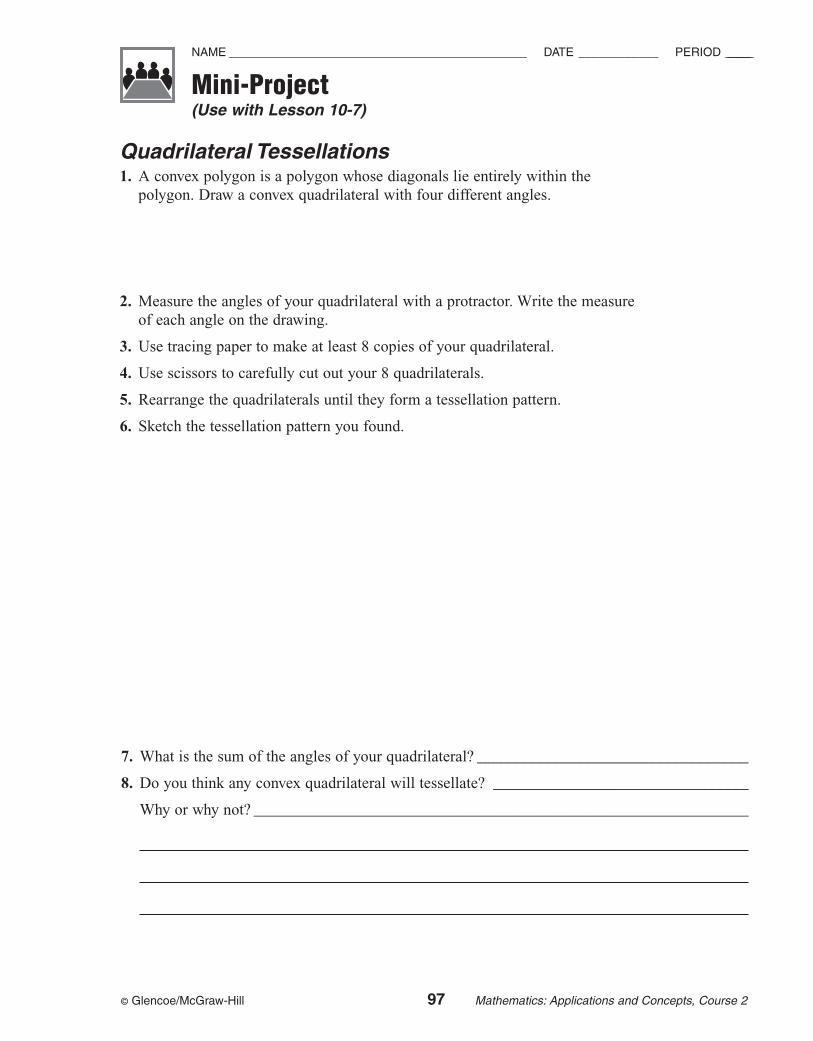
© Glencoe/McGraw-Hill 97 Mathematics: Applications and Concepts, Course 2
Mini-Project(Use with Lesson 10-7)
NAME ______________________________________________ DATE ____________ PERIOD __________
Quadrilateral Tessellations1. A convex polygon is a polygon whose diagonals lie entirely within the
polygon. Draw a convex quadrilateral with four different angles.
2. Measure the angles of your quadrilateral with a protractor. Write the measureof each angle on the drawing.
3. Use tracing paper to make at least 8 copies of your quadrilateral.
4. Use scissors to carefully cut out your 8 quadrilaterals.
5. Rearrange the quadrilaterals until they form a tessellation pattern.
6. Sketch the tessellation pattern you found.
7. What is the sum of the angles of your quadrilateral? __________________________________
8. Do you think any convex quadrilateral will tessellate? ________________________________
Why or why not? ______________________________________________________________
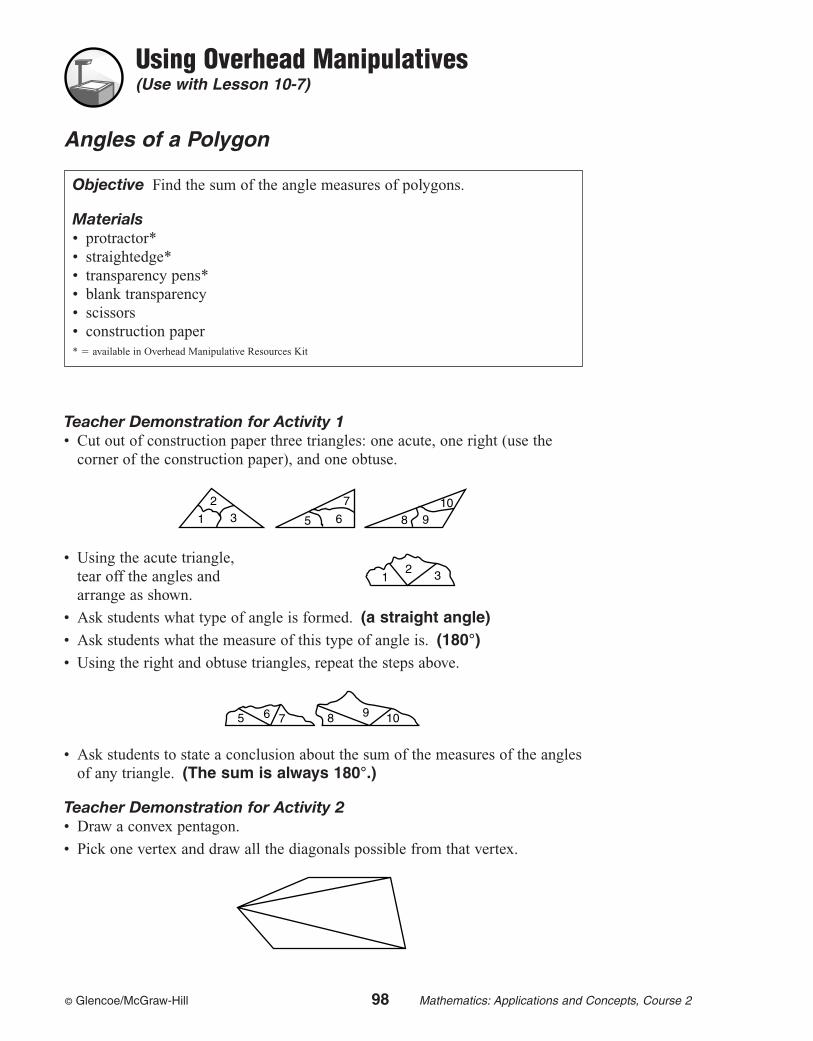
© Glencoe/McGraw-Hill 98 Mathematics: Applications and Concepts, Course 2
Using Overhead Manipulatives(Use with Lesson 10-7)
Angles of a Polygon
Objective Find the sum of the angle measures of polygons.
Materials• protractor*• straightedge*• transparency pens*• blank transparency• scissors• construction paper* � available in Overhead Manipulative Resources Kit
Teacher Demonstration for Activity 1• Cut out of construction paper three triangles: one acute, one right (use the
corner of the construction paper), and one obtuse.
• Using the acute triangle, tear off the angles and arrange as shown.
• Ask students what type of angle is formed. (a straight angle)• Ask students what the measure of this type of angle is. (180°)• Using the right and obtuse triangles, repeat the steps above.
• Ask students to state a conclusion about the sum of the measures of the anglesof any triangle. (The sum is always 180°.)
Teacher Demonstration for Activity 2• Draw a convex pentagon.
• Pick one vertex and draw all the diagonals possible from that vertex.
765 8 9 10
21 3
2
1 37
65 8 910
© Glencoe/McGraw-Hill 99 Mathematics: Applications and Concepts, Course 2
• Ask students how many triangles are formed. (3)• Ask students if the sum of the measures of the angles of the pentagon are
equal to the sum of the measures of the triangles formed. (yes)• Ask students to find the sum of the measures of the angles of the pentagon.
(540°)• Ask students to relate the number of sides of the pentagon with the sum of the
measures of the angles of the pentagon. (The sum of the measures ofthe angles of the pentagon is 180° times the difference betweenthe number of sides and two.)
Have students complete Exercises 1–2.1. Find the sum of the measures of the angles of a figure with the given number
of sides.
a. 5 (540°) b. 6 (720°) c. 8 (1,080°) d. 10 (1,440°)
2. If n is the number of sides of a figure, write an algebraic expression that tellsthe sum of the measures of the angles of the figure. (180(n � 2))
ExtensionAsk students to find the sum of the measures of the angles of a convex polygonif it has 15 sides; 22 sides; n sides. (2,340°; 3,600°; 180°(n � 2))
Using Overhead Manipulatives
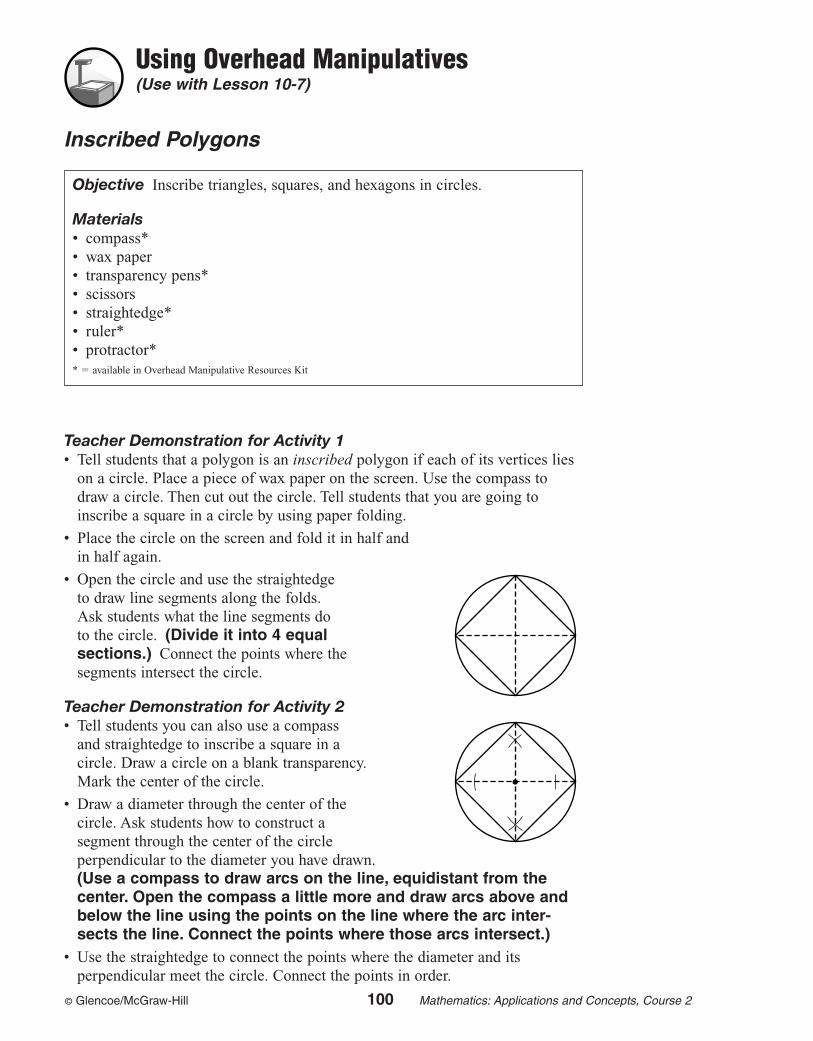
© Glencoe/McGraw-Hill 100 Mathematics: Applications and Concepts, Course 2
Using Overhead Manipulatives(Use with Lesson 10-7)
Inscribed Polygons
Teacher Demonstration for Activity 1• Tell students that a polygon is an inscribed polygon if each of its vertices lies
on a circle. Place a piece of wax paper on the screen. Use the compass todraw a circle. Then cut out the circle. Tell students that you are going toinscribe a square in a circle by using paper folding.
• Place the circle on the screen and fold it in half and in half again.
• Open the circle and use the straightedge to draw line segments along the folds. Ask students what the line segments do to the circle. (Divide it into 4 equal sections.) Connect the points where the segments intersect the circle.
Teacher Demonstration for Activity 2• Tell students you can also use a compass
and straightedge to inscribe a square in a circle. Draw a circle on a blank transparency. Mark the center of the circle.
• Draw a diameter through the center of the circle. Ask students how to construct a segment through the center of the circle perpendicular to the diameter you have drawn.(Use a compass to draw arcs on the line, equidistant from thecenter. Open the compass a little more and draw arcs above andbelow the line using the points on the line where the arc inter-sects the line. Connect the points where those arcs intersect.)
• Use the straightedge to connect the points where the diameter and itsperpendicular meet the circle. Connect the points in order.
Objective Inscribe triangles, squares, and hexagons in circles.
Materials• compass*• wax paper• transparency pens*• scissors• straightedge*• ruler*• protractor** � available in Overhead Manipulative Resources Kit
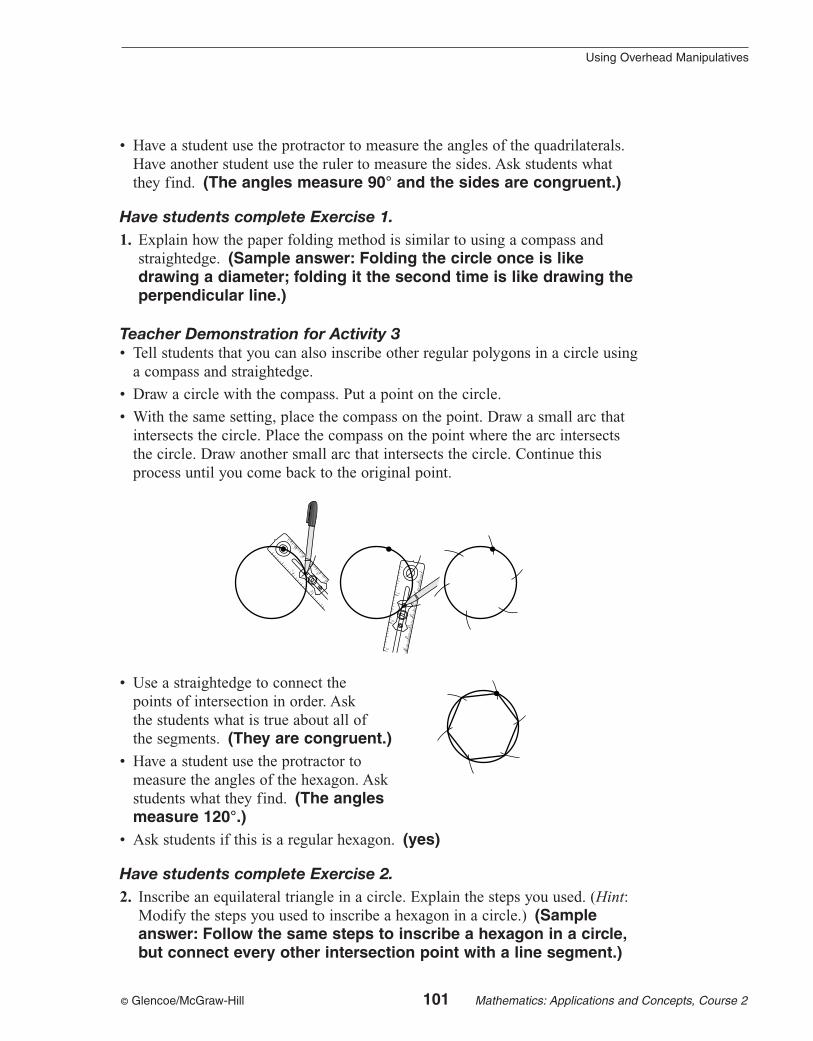
© Glencoe/McGraw-Hill 101 Mathematics: Applications and Concepts, Course 2
• Have a student use the protractor to measure the angles of the quadrilaterals.Have another student use the ruler to measure the sides. Ask students whatthey find. (The angles measure 90° and the sides are congruent.)
Have students complete Exercise 1.1. Explain how the paper folding method is similar to using a compass and
straightedge. (Sample answer: Folding the circle once is like drawing a diameter; folding it the second time is like drawing theperpendicular line.)
Teacher Demonstration for Activity 3• Tell students that you can also inscribe other regular polygons in a circle using
a compass and straightedge.
• Draw a circle with the compass. Put a point on the circle.
• With the same setting, place the compass on the point. Draw a small arc thatintersects the circle. Place the compass on the point where the arc intersectsthe circle. Draw another small arc that intersects the circle. Continue thisprocess until you come back to the original point.
• Use a straightedge to connect the points of intersection in order. Ask the students what is true about all of the segments. (They are congruent.)
• Have a student use the protractor to measure the angles of the hexagon. Ask students what they find. (The angles measure 120°.)
• Ask students if this is a regular hexagon. (yes)
Have students complete Exercise 2.2. Inscribe an equilateral triangle in a circle. Explain the steps you used. (Hint:
Modify the steps you used to inscribe a hexagon in a circle.) (Sampleanswer: Follow the same steps to inscribe a hexagon in a circle,but connect every other intersection point with a line segment.)
11
2
3
4
2
3
4
5
6
7
8
9
10
11
1
1
2
3
23
45
67
8
Using Overhead Manipulatives
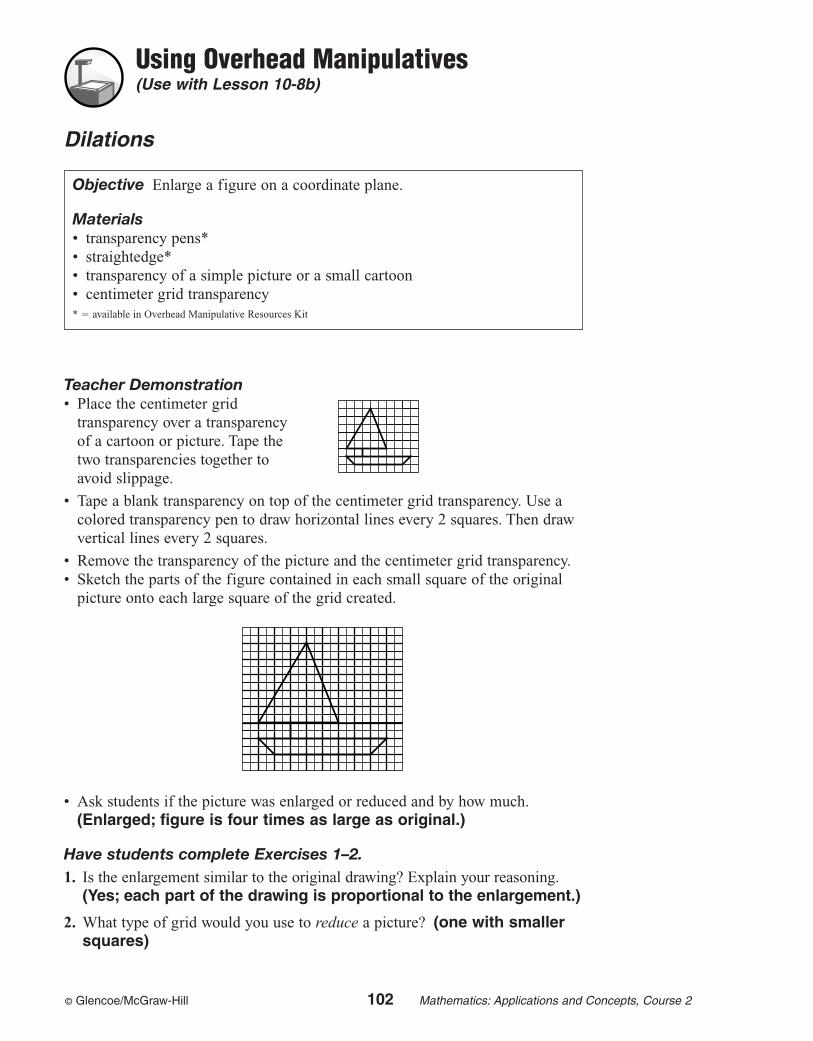
© Glencoe/McGraw-Hill 102 Mathematics: Applications and Concepts, Course 2
Using Overhead Manipulatives(Use with Lesson 10-8b)
Dilations
Teacher Demonstration• Place the centimeter grid
transparency over a transparency of a cartoon or picture. Tape the two transparencies together to avoid slippage.
• Tape a blank transparency on top of the centimeter grid transparency. Use acolored transparency pen to draw horizontal lines every 2 squares. Then drawvertical lines every 2 squares.
• Remove the transparency of the picture and the centimeter grid transparency.• Sketch the parts of the figure contained in each small square of the original
picture onto each large square of the grid created.
• Ask students if the picture was enlarged or reduced and by how much.(Enlarged; figure is four times as large as original.)
Have students complete Exercises 1–2.1. Is the enlargement similar to the original drawing? Explain your reasoning.
(Yes; each part of the drawing is proportional to the enlargement.)
2. What type of grid would you use to reduce a picture? (one with smallersquares)
Objective Enlarge a figure on a coordinate plane.
Materials• transparency pens*• straightedge*• transparency of a simple picture or a small cartoon• centimeter grid transparency * � available in Overhead Manipulative Resources Kit
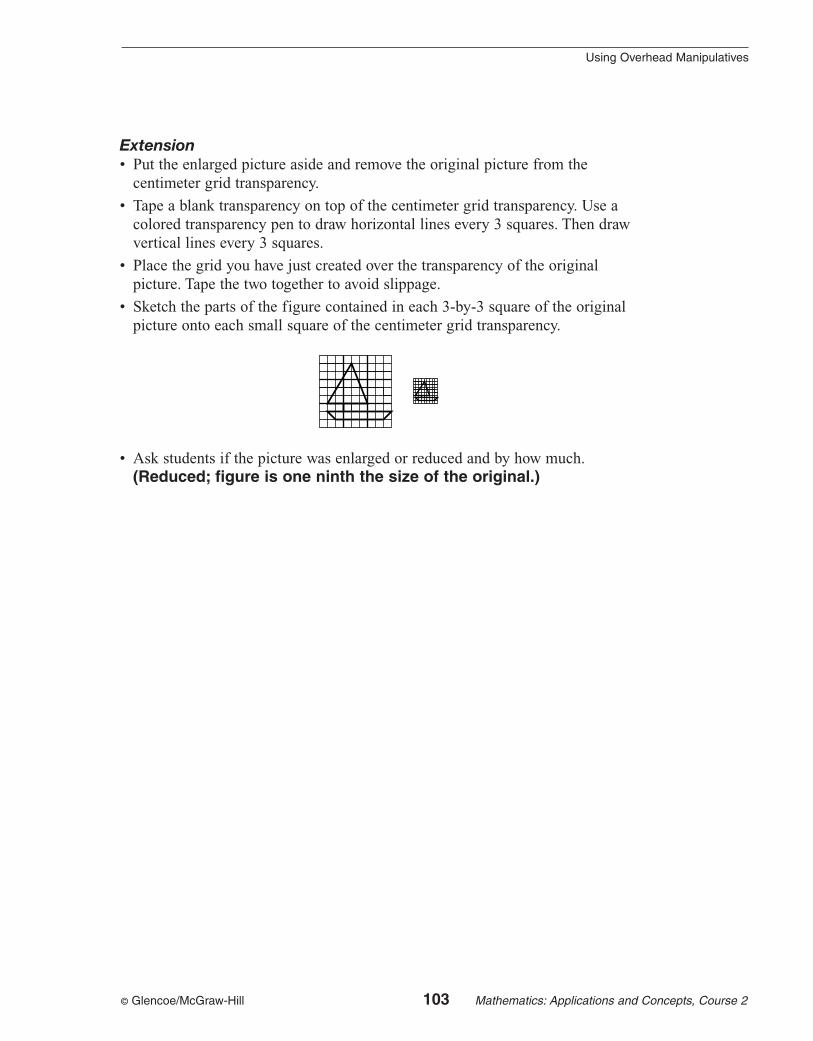
© Glencoe/McGraw-Hill 103 Mathematics: Applications and Concepts, Course 2
Extension• Put the enlarged picture aside and remove the original picture from the
centimeter grid transparency.
• Tape a blank transparency on top of the centimeter grid transparency. Use acolored transparency pen to draw horizontal lines every 3 squares. Then drawvertical lines every 3 squares.
• Place the grid you have just created over the transparency of the original picture. Tape the two together to avoid slippage.
• Sketch the parts of the figure contained in each 3-by-3 square of the originalpicture onto each small square of the centimeter grid transparency.
• Ask students if the picture was enlarged or reduced and by how much.(Reduced; figure is one ninth the size of the original.)
Using Overhead Manipulatives

© Glencoe/McGraw-Hill 104 Mathematics: Applications and Concepts, Course 2
Hands-On Lab Recording Sheet(Use with the activity on pages 460–461 in Lesson 10-9b of the StudentEdition)
NAME ______________________________________________ DATE ____________ PERIOD __________
Rotations
Materialsgraph paper, protractor, ruler
Your Turna. Rotate �DEF 90° counterclockwise about the
origin. Then graph �D�E�F�.
b. Rotate �D�E�F� from Part a above 90°counterclockwise about the origin. Then graph�D�E�F�.
Your TurnRefer to page 461. Identify the transformation as a translation, reflection, or rotation. Write your answers below.
c. d.
e. f.
Writing MathWork with a partner.
1. Rotate �DEF from Example 1a 180° counterclockwise. Compare yourrotated figure with your answer from Example 1b.
2. Make a conjecture about rotating figures 180°.
3. Without rotating �DEF 360°, make a conjecture about rotating figures360°. Describe the figure after a 360° rotation.
4. A 60° counterclockwise rotation is the same as a �300° clockwise rotation.Find an equivalent rotation of a 90° counterclockwise rotation.
5. Complete the following sentence. Since you can rotate figures in clockwiseor counterclockwise directions, a 270° counterclockwise rotation producesthe same result as a ? clockwise rotation.
y
xOF
DE
© Glencoe/McGraw-Hill 105 Mathematics: Applications and Concepts, Course 2
Ch
apte
r 11
Geometry: Measuring Two-Dimensional FiguresTeaching Notes and Overview
Hands-On LabRecording Sheet The Pythagorean Theorem(p. 107 of this booklet)
Use With Lesson 11-3a. This corresponds tothe activity on page 478 in the StudentEdition.
Objective Find the relationship among thesides of a right triangle.
Materials centimeter grid paperrulerscissors
Students will cut out a right triangle and threesquares with side lengths to correspond to thelengths of the sides of the triangle. Usingthese figures, students will find therelationship among the sides of a righttriangle. They will repeat the activity with twoother right triangles and summarize theirfindings.
AnswersSee Teacher Wraparound Edition p. 478.
Using OverheadManipulativesArea(pp. 108–109 of this booklet)
Use With Lesson 11-4.
Objective Use models to find the areas ofrectangles and parallelograms.
Materialscentimeter grid transparency*transparency pens*tracing paperscissors* = available in Overhead Manipulative Resources Kit
This demonstration contains two activities.• Demonstration 1 shows how to find the area
of a rectangle on a centimeter grid.
• Students will find the area of rectanglesindependently.
• Demonstration 2 shows how to find the areaof a parallelogram on a centimeter grid.
• Students will find the area ofparallelograms independently.
• An Extension activity asks students toexplain how the area of a parallelogramchanges if the measure of the base andheight are doubled.
AnswersAnswers appear on the teacher demonstrationinstructions on pages 108–109.
Hands-On LabRecording Sheet Triangles and Trapezoids(p. 110 of this booklet)
Use With Lesson 11-5a. This corresponds tothe activity on page 488 in the StudentEdition.
Objective Find the areas of triangles andtrapezoids.
© Glencoe/McGraw-Hill 106 Mathematics: Applications and Concepts, Course 2
Materials centimeter grid paperstraightedgescissorstape
Using two triangles to form a parallelogram,students develop the formula for the area of atriangle. Students then use two trapezoids toform a parallelogram to find the formula forthe area of a trapezoid.
AnswersSee Teacher Wraparound Edition p. 488.
Mini-Project Areas of Circles, Rectangles, andSquares(p. 111 of this booklet)
Use With Lesson 11-6.
Objective Find the area of shaded regionswithin inscribed figures.
Materials none
Students apply the formulas for the areas ofcircles, rectangles, and squares. Usingdiagrams of inscribed figures, they will findthe area of the shaded region.
Answers1. 30.54 ft2
2. 171.90 yd2
3. 97.10 cm2
4. 13.73 in2
Using OverheadManipulativesProbability and Area Models(pp. 112–113 of this booklet)
Use With Lesson 11-8.
Objective Estimate the area of a figure byusing probability.
Materials centimeter grid transparency*ruler*compass*counters*blank transparency transparency pen** = available in Overhead Manipulative Resources Kit
• The class collects data by dropping countersonto the grid transparency with a circle onit. The number of counters that fall insidethe circle each time is recorded in a table.
• Students use the probability of a counterlanding in the circle to estimate the area ofthe circle.
• Students complete the activityindependently using a triangle and atrapezoid, rather than a circle.
AnswersAnswers appear on the teacher demonstrationinstructions on pages 112–113.
Chapter 11 Geometry: Measuring Two-Dimensional Figures
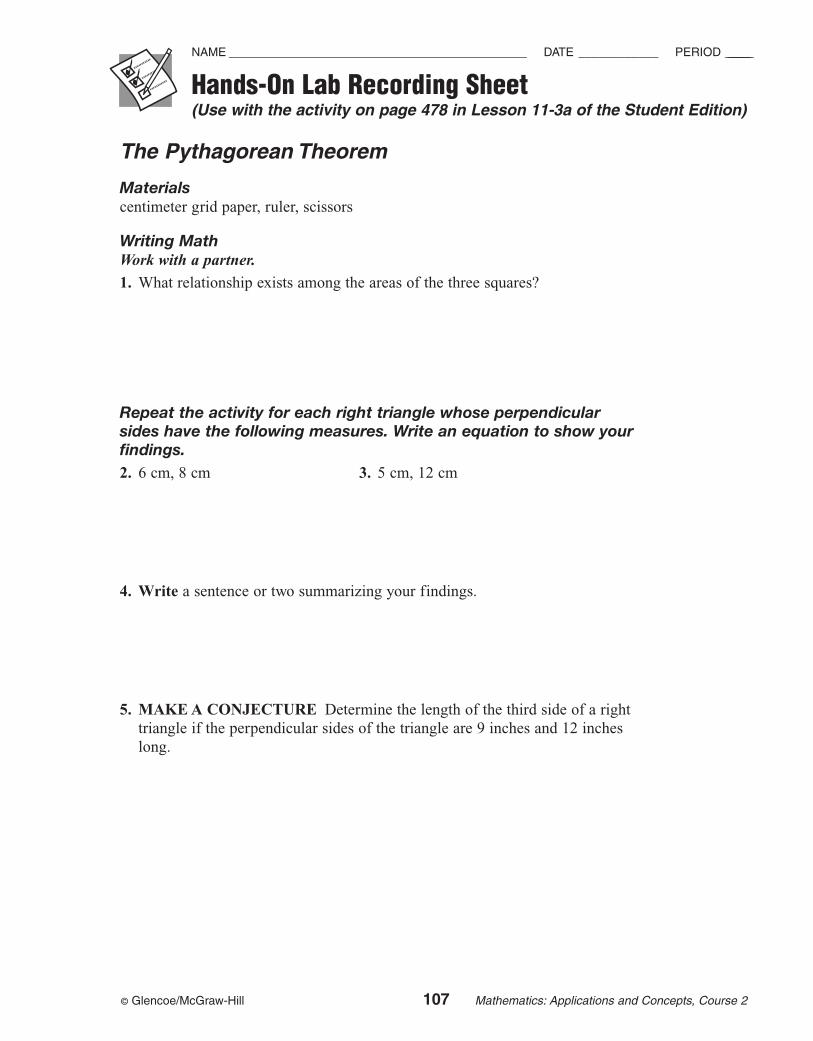
© Glencoe/McGraw-Hill 107 Mathematics: Applications and Concepts, Course 2
Hands-On Lab Recording Sheet(Use with the activity on page 478 in Lesson 11-3a of the Student Edition)
NAME ______________________________________________ DATE ____________ PERIOD __________
The Pythagorean Theorem
Materialscentimeter grid paper, ruler, scissors
Writing MathWork with a partner.
1. What relationship exists among the areas of the three squares?
Repeat the activity for each right triangle whose perpendicularsides have the following measures. Write an equation to show yourfindings.2. 6 cm, 8 cm 3. 5 cm, 12 cm
4. Write a sentence or two summarizing your findings.
5. MAKE A CONJECTURE Determine the length of the third side of a righttriangle if the perpendicular sides of the triangle are 9 inches and 12 incheslong.
© Glencoe/McGraw-Hill 108 Mathematics: Applications and Concepts, Course 2
Using Overhead Manipulatives(Use with Lesson 11-4)
Area
Teacher Demonstration for Activity 1• Define the area of a geometric figure as the number of square units needed to
cover the surface of the figure.
• On the centimeter grid transparency, draw a rectangle with a length of 7 unitsand width of 3 units.
• Ask students to count the number of squares contained within the boundariesof the rectangle. (21) Ask students what the area of the rectangle is.(21 square units)
Have students complete Exercises 1–7.Find the area of each rectangle. Draw rectangles if necessary.
1. length, 8; width, 3 (24 units2)
2. length, 5; width, 2 (10 units2)
3. length, 10; width, 8 (80 units2)
4. length, 9; width, 4 (36 units2)
5. length, 20; width, 10 (200 units2)
6. length, 15; width, 9 (135 units2)
7. Let � represent the length, w represent the width, and A represent the area ofa rectangle. Write an equation that shows how to find the area if you knowthe length and width. (A � �w)
Teacher Demonstration for Activity 2• Define a parallelogram as a four-sided figure whose opposite sides are
parallel.
• Define the base and height of a parallelogram. Draw aparallelogram with a base of 7 units and a height of 3 units. Use adifferent colored transparency pen to draw a line to represent theheight as shown. Ask students to find the measure of the base andheight of the parallelogram. (height: 3 units; base: 7 units)
Objective Use models to find the areas of rectangles and parallelograms.
Materials• centimeter grid transparency*
• transparency pens*
• tracing paper
• scissors
* = available in Overhead Manipulative Resources Kit
base
height
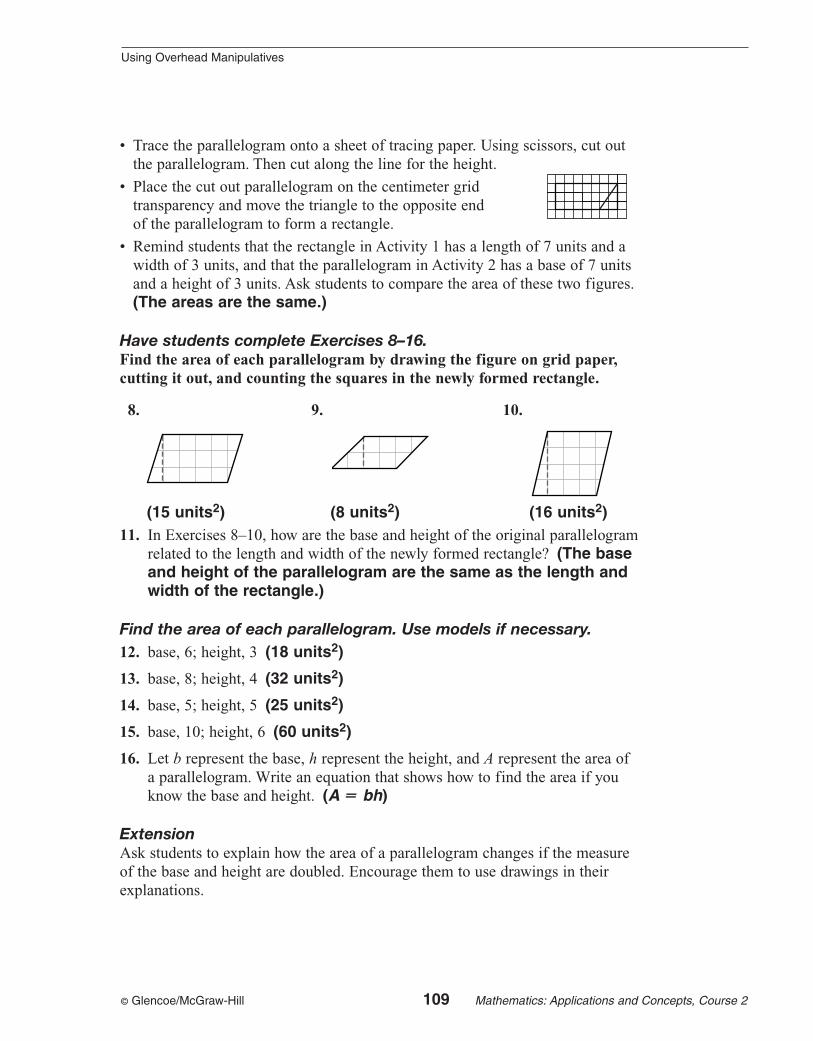
© Glencoe/McGraw-Hill 109 Mathematics: Applications and Concepts, Course 2
• Trace the parallelogram onto a sheet of tracing paper. Using scissors, cut outthe parallelogram. Then cut along the line for the height.
• Place the cut out parallelogram on the centimeter gridtransparency and move the triangle to the opposite endof the parallelogram to form a rectangle.
• Remind students that the rectangle in Activity 1 has a length of 7 units and awidth of 3 units, and that the parallelogram in Activity 2 has a base of 7 unitsand a height of 3 units. Ask students to compare the area of these two figures.(The areas are the same.)
Have students complete Exercises 8–16.Find the area of each parallelogram by drawing the figure on grid paper,cutting it out, and counting the squares in the newly formed rectangle.
8. 9. 10.
(15 units2) (8 units2) (16 units2)11. In Exercises 8–10, how are the base and height of the original parallelogram
related to the length and width of the newly formed rectangle? (The baseand height of the parallelogram are the same as the length andwidth of the rectangle.)
Find the area of each parallelogram. Use models if necessary.12. base, 6; height, 3 (18 units2)
13. base, 8; height, 4 (32 units2)
14. base, 5; height, 5 (25 units2)
15. base, 10; height, 6 (60 units2)
16. Let b represent the base, h represent the height, and A represent the area ofa parallelogram. Write an equation that shows how to find the area if youknow the base and height. (A � bh)
ExtensionAsk students to explain how the area of a parallelogram changes if the measureof the base and height are doubled. Encourage them to use drawings in theirexplanations.
Using Overhead Manipulatives
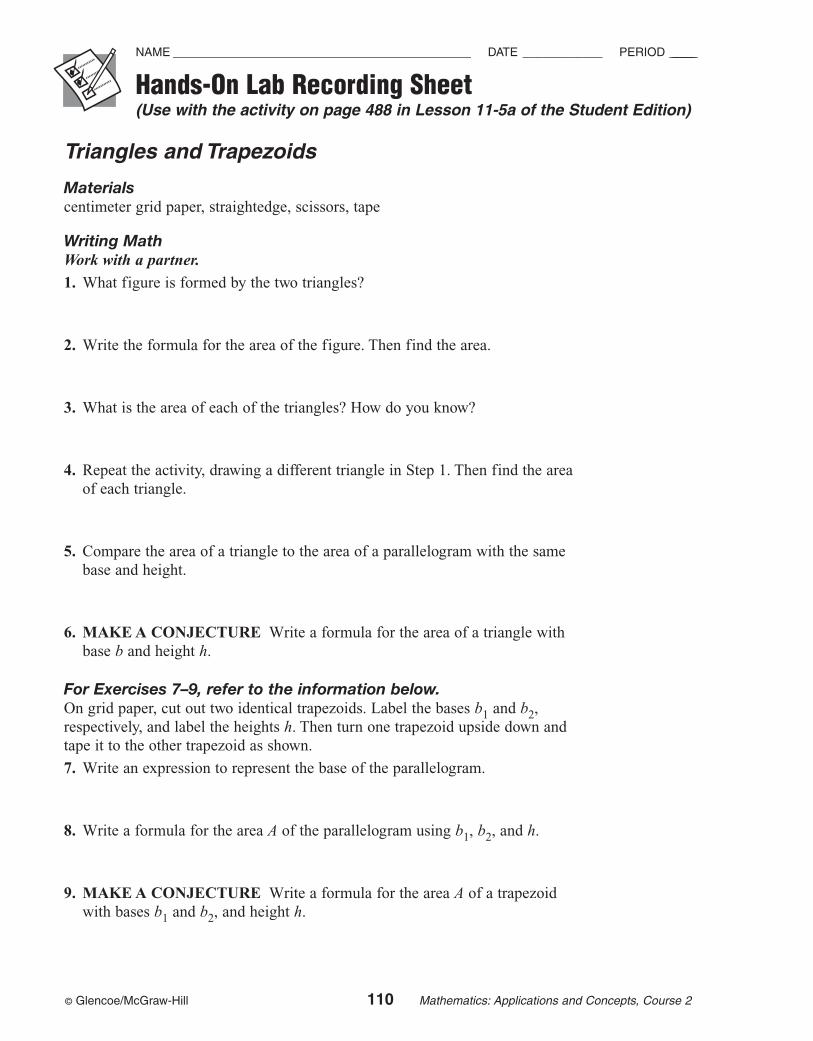
© Glencoe/McGraw-Hill 110 Mathematics: Applications and Concepts, Course 2
Hands-On Lab Recording Sheet(Use with the activity on page 488 in Lesson 11-5a of the Student Edition)
NAME ______________________________________________ DATE ____________ PERIOD __________
Triangles and Trapezoids
Materialscentimeter grid paper, straightedge, scissors, tape
Writing MathWork with a partner.
1. What figure is formed by the two triangles?
2. Write the formula for the area of the figure. Then find the area.
3. What is the area of each of the triangles? How do you know?
4. Repeat the activity, drawing a different triangle in Step 1. Then find the areaof each triangle.
5. Compare the area of a triangle to the area of a parallelogram with the samebase and height.
6. MAKE A CONJECTURE Write a formula for the area of a triangle withbase b and height h.
For Exercises 7–9, refer to the information below.On grid paper, cut out two identical trapezoids. Label the bases b1 and b2,respectively, and label the heights h. Then turn one trapezoid upside down andtape it to the other trapezoid as shown.
7. Write an expression to represent the base of the parallelogram.
8. Write a formula for the area A of the parallelogram using b1, b2, and h.
9. MAKE A CONJECTURE Write a formula for the area A of a trapezoidwith bases b1 and b2, and height h.
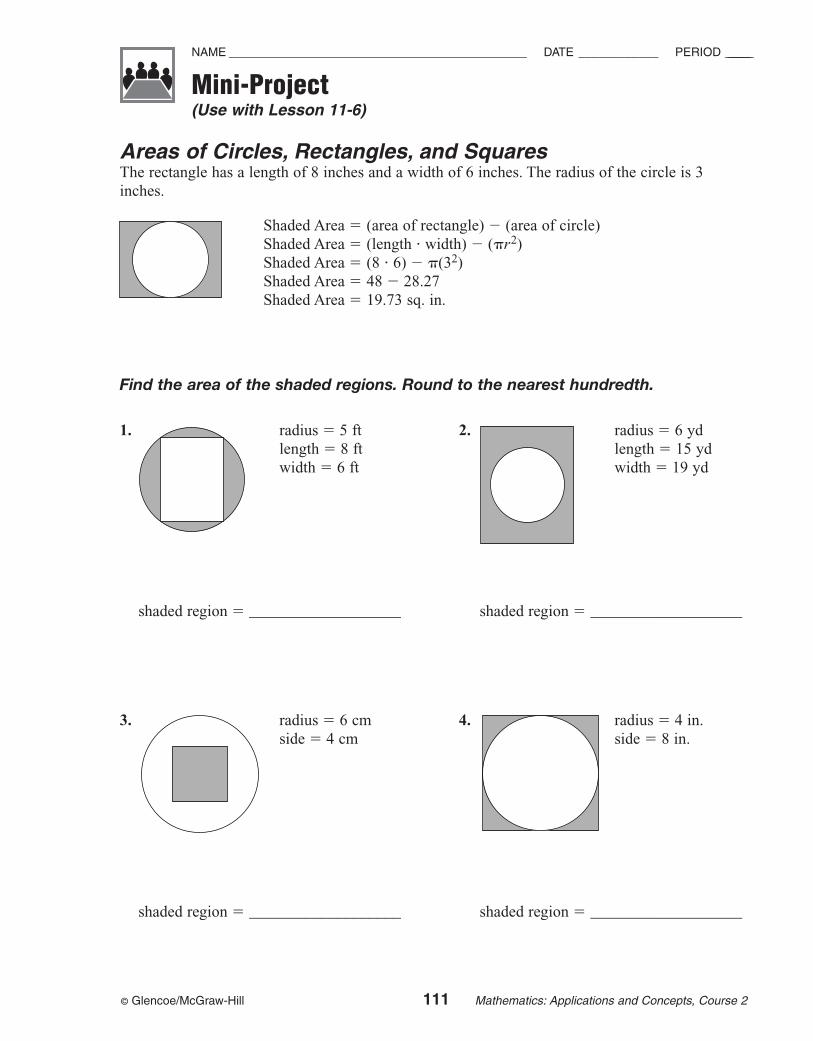
© Glencoe/McGraw-Hill 111 Mathematics: Applications and Concepts, Course 2
Mini-Project(Use with Lesson 11-6)
NAME ______________________________________________ DATE ____________ PERIOD __________
Areas of Circles, Rectangles, and SquaresThe rectangle has a length of 8 inches and a width of 6 inches. The radius of the circle is 3inches.
Shaded Area � (area of rectangle) � (area of circle)Shaded Area � (length � width) � (�r2)Shaded Area � (8 � 6) � �(32)Shaded Area � 48 � 28.27Shaded Area � 19.73 sq. in.
Find the area of the shaded regions. Round to the nearest hundredth.
1. radius � 5 ft 2. radius � 6 ydlength � 8 ft length � 15 ydwidth � 6 ft width � 19 yd
shaded region � ___________________ shaded region � ___________________
3. radius � 6 cm 4. radius � 4 in.side � 4 cm side � 8 in.
shaded region � ___________________ shaded region � ___________________
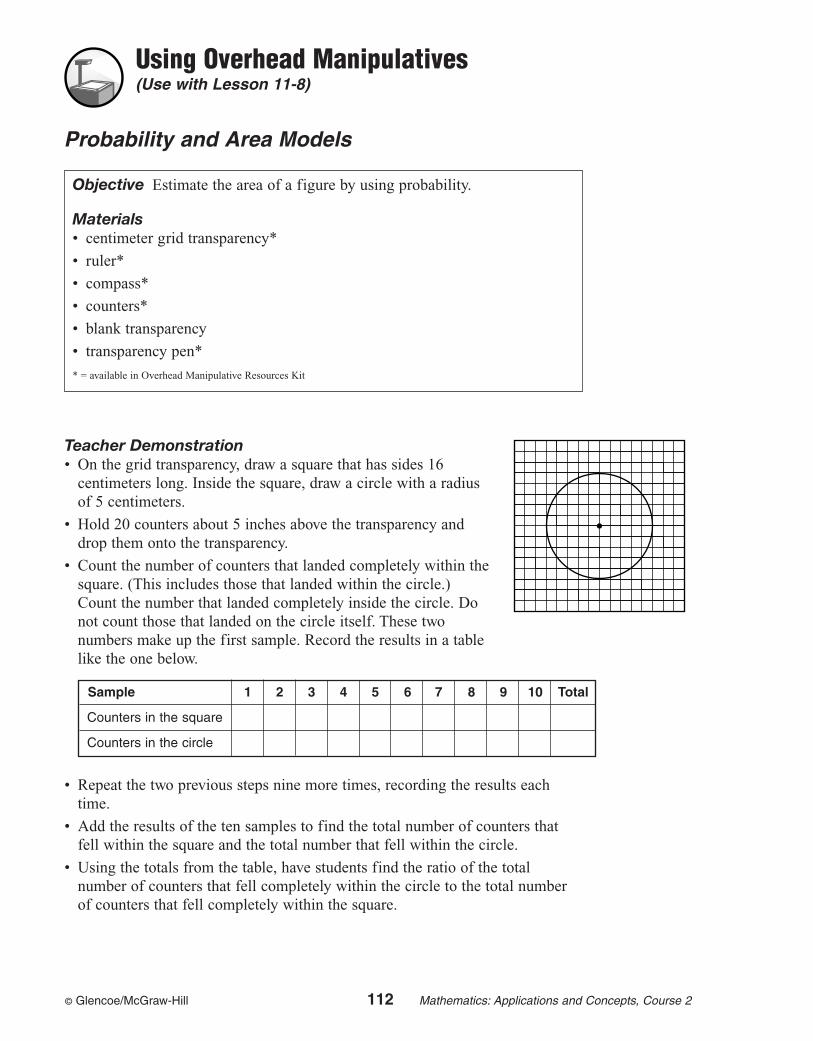
© Glencoe/McGraw-Hill 112 Mathematics: Applications and Concepts, Course 2
Using Overhead Manipulatives(Use with Lesson 11-8)
Probability and Area Models
Teacher Demonstration • On the grid transparency, draw a square that has sides 16
centimeters long. Inside the square, draw a circle with a radiusof 5 centimeters.
• Hold 20 counters about 5 inches above the transparency anddrop them onto the transparency.
• Count the number of counters that landed completely within thesquare. (This includes those that landed within the circle.)Count the number that landed completely inside the circle. Donot count those that landed on the circle itself. These twonumbers make up the first sample. Record the results in a tablelike the one below.
• Repeat the two previous steps nine more times, recording the results eachtime.
• Add the results of the ten samples to find the total number of counters thatfell within the square and the total number that fell within the circle.
• Using the totals from the table, have students find the ratio of the totalnumber of counters that fell completely within the circle to the total numberof counters that fell completely within the square.
Objective Estimate the area of a figure by using probability.
Materials• centimeter grid transparency*
• ruler*
• compass*
• counters*
• blank transparency
• transparency pen*
* = available in Overhead Manipulative Resources Kit
Sample 1 2 3 4 5 6 7 8 9 10 Total
Counters in the square
Counters in the circle
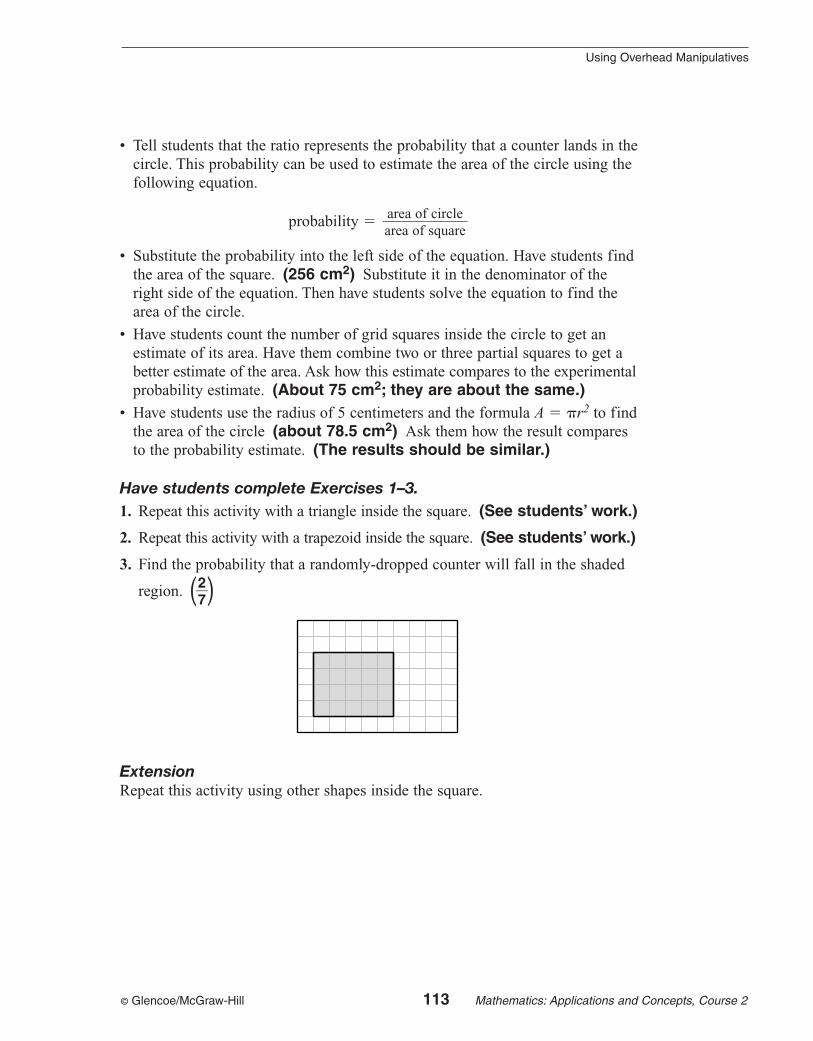
© Glencoe/McGraw-Hill 113 Mathematics: Applications and Concepts, Course 2
• Tell students that the ratio represents the probability that a counter lands in thecircle. This probability can be used to estimate the area of the circle using thefollowing equation.
probability �
• Substitute the probability into the left side of the equation. Have students findthe area of the square. (256 cm2) Substitute it in the denominator of theright side of the equation. Then have students solve the equation to find thearea of the circle.
• Have students count the number of grid squares inside the circle to get anestimate of its area. Have them combine two or three partial squares to get abetter estimate of the area. Ask how this estimate compares to the experimentalprobability estimate. (About 75 cm2; they are about the same.)
• Have students use the radius of 5 centimeters and the formula A � �r2 to findthe area of the circle (about 78.5 cm2) Ask them how the result comparesto the probability estimate. (The results should be similar.)
Have students complete Exercises 1–3.1. Repeat this activity with a triangle inside the square. (See students’ work.)
2. Repeat this activity with a trapezoid inside the square. (See students’ work.)
3. Find the probability that a randomly-dropped counter will fall in the shaded
region. ��27
��
ExtensionRepeat this activity using other shapes inside the square.
area of circle��area of square
Using Overhead Manipulatives
© Glencoe/McGraw-Hill 114 Mathematics: Applications and Concepts, Course 2
Geometry: Measuring Three-Dimensional FiguresTeaching Notes and Overview
Hands-On LabRecording Sheet Building Three-Dimensional Figures(p. 116 of this booklet)
Use With Lesson 12-1a. This corresponds tothe activity on pages 512–513 in the StudentEdition.
Objective Build three-dimensional figuresgiven the top, side, and front views.
Materials cubes
Students will use cubes to build three-dimensional figures given the top, side, andfront views. Space is provided for students to sketch their figures. Working with partners,students will create and exchange their owntop, side, and front views for their partner tobuild the appropriate figure.
AnswersSee Teacher Wraparound Edition pp. 512–513.
Using OverheadManipulativesVolume of Pyramids (pp. 117–118 of this booklet)
Use With Lesson 12-2.
Objective Compare the volume of apyramid with the volume of a prism.
Materialscentimeter grid transparency*centimeter grid papertransparency pens*ricescissorstape* = available in Overhead Manipulative Resources Kit
• This demonstration shows how to use netsto create a prism and a pyramid.
• By filling the prism and the pyramid withrice, students will compare their volumes.
• An Extension activity asks students torepeat the activity with a different base and height, then compare the results.
AnswersAnswers appear on the teacher demonstrationinstructions on pages 117–118.
Mini-Project Volume of Solids (p. 119 of this booklet)
Use With Lesson 12-3.
Objective Compare the volumes of solids.
Materials paperscissorstaperice
Students trace and cut out nets to createsolids. They fill the solids with rice tocompare their volumes.
© Glencoe/McGraw-Hill 115 Mathematics: Applications and Concepts, Course 2
Answers1. Sample answers: rectangular prism; cone;
rectangular prism, triangular prism,cylinder, pyramid, and cone
2. rectangular prism; cone; rectangular prism,cylinder, triangular prism, pyramid, andcone
3. Sample answers: Cylinder and triangularprism switched places; a little; Solids donot always have as much volume as theyappear to have.
Hands-On LabRecording Sheet Nets and Surface Area (p. 120 of this booklet)
Use With Lesson 12-4a. This corresponds tothe activity on pages 530–531 in the StudentEdition.
Objective Use nets to find the surface areaof rectangular prisms.
Materials rectangular dot paperscissors
Students will draw nets for given figures, findthe areas of the nets, and cut them out to buildthe figures. Students will derive and apply theformula for the surface area of a prism.
AnswersSee Teacher Wraparound Edition pp. 530–531.
Hands-On LabRecording Sheet Changes in Volume and SurfaceArea(p. 121 of this booklet)
Use With Lesson 12-4b. This corresponds tothe activity on pages 536–537 in the StudentEdition.
Objective Investigate changes in volumeand surface area.
Materials isometric dot paper
Students will change the dimensions of three-dimensional figures and record the volumesand surface areas. Students will use their datato make conclusions about how changing thedimensions of three-dimensional figuresaffects volume and surface area.
AnswersSee Teacher Wraparound Edition pp. 536–537.
Chapter 12 Geometry: Measuring Three-Dimensional Figures
Ch
apte
r 12
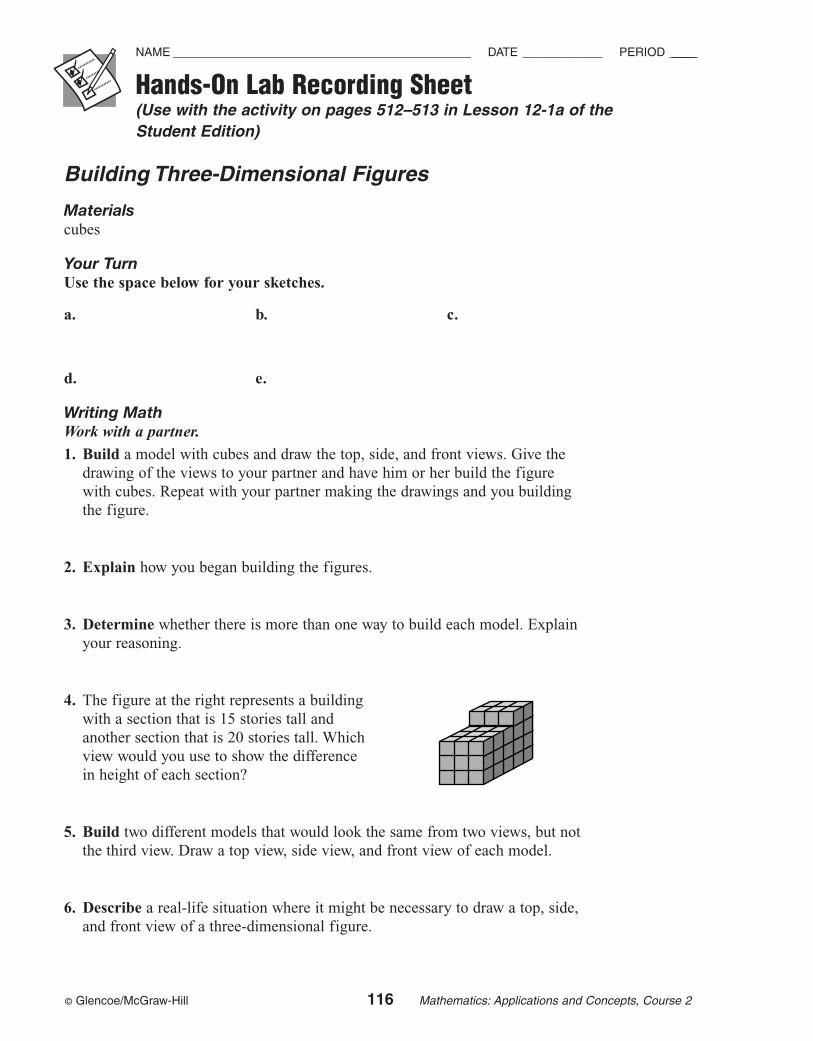
© Glencoe/McGraw-Hill 116 Mathematics: Applications and Concepts, Course 2
Hands-On Lab Recording Sheet(Use with the activity on pages 512–513 in Lesson 12-1a of the Student Edition)
NAME ______________________________________________ DATE ____________ PERIOD __________
Building Three-Dimensional Figures
Materialscubes
Your TurnUse the space below for your sketches.
a. b. c.
d. e.
Writing MathWork with a partner.
1. Build a model with cubes and draw the top, side, and front views. Give thedrawing of the views to your partner and have him or her build the figurewith cubes. Repeat with your partner making the drawings and you buildingthe figure.
2. Explain how you began building the figures.
3. Determine whether there is more than one way to build each model. Explainyour reasoning.
4. The figure at the right represents a building with a section that is 15 stories tall and another section that is 20 stories tall. Whichview would you use to show the difference in height of each section?
5. Build two different models that would look the same from two views, but notthe third view. Draw a top view, side view, and front view of each model.
6. Describe a real-life situation where it might be necessary to draw a top, side,and front view of a three-dimensional figure.
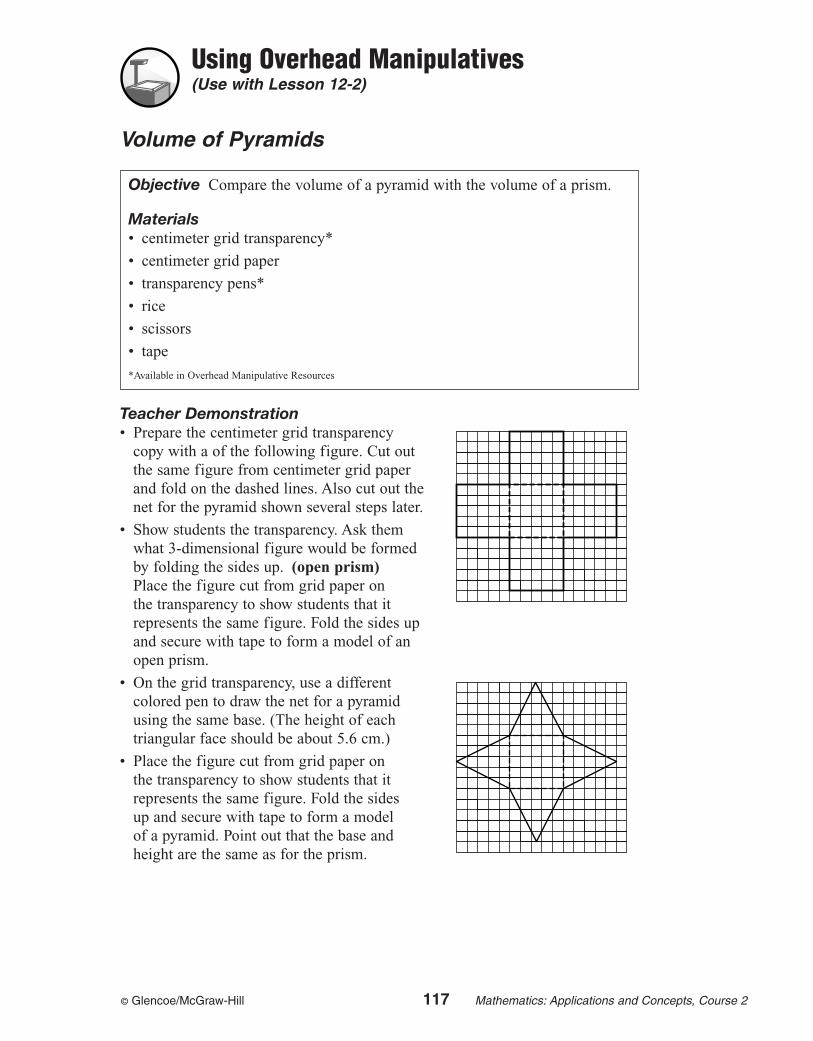
© Glencoe/McGraw-Hill 117 Mathematics: Applications and Concepts, Course 2
Using Overhead Manipulatives(Use with Lesson 12-2)
Volume of Pyramids
Teacher Demonstration• Prepare the centimeter grid transparency
copy with a of the following figure. Cut outthe same figure from centimeter grid paperand fold on the dashed lines. Also cut out thenet for the pyramid shown several steps later.
• Show students the transparency. Ask themwhat 3-dimensional figure would be formedby folding the sides up. (open prism)Place the figure cut from grid paper on the transparency to show students that itrepresents the same figure. Fold the sides up and secure with tape to form a model of an open prism.
• On the grid transparency, use a different colored pen to draw the net for a pyramidusing the same base. (The height of eachtriangular face should be about 5.6 cm.)
• Place the figure cut from grid paper on the transparency to show students that itrepresents the same figure. Fold the sidesup and secure with tape to form a model of a pyramid. Point out that the base andheight are the same as for the prism.
Objective Compare the volume of a pyramid with the volume of a prism.
Materials• centimeter grid transparency*
• centimeter grid paper
• transparency pens*
• rice
• scissors
• tape
*Available in Overhead Manipulative Resources
© Glencoe/McGraw-Hill 118 Mathematics: Applications and Concepts, Course 2
Using Overhead Manipulatives
• Ask students to estimate the ratio of the volume of the prism to the volume ofthe pyramid.
• Make an opening in the base of the pyramid. Fill the pyramid with rice. Thenpour the rice into the prism. Repeat until the prism is full.
Have students complete Exercises 1–5.1. How many pyramids of rice did it take to fill the prism?
(Sample answer: about 3)
2. Compare the heights of the prism and the pyramid.(They are equal.)
3. Compare the areas of the bases of each solid. (They are equal.)
4. Compare the volume of the prism and the pyramid.(The volume of the prism is three times the volume of thepyramid.)
5. Write a formula for the volume of a pyramid. (V � �13
��wh)
ExtensionRepeat the activity above with a different base and height. Have studentscompare the results. (The results are the same.)
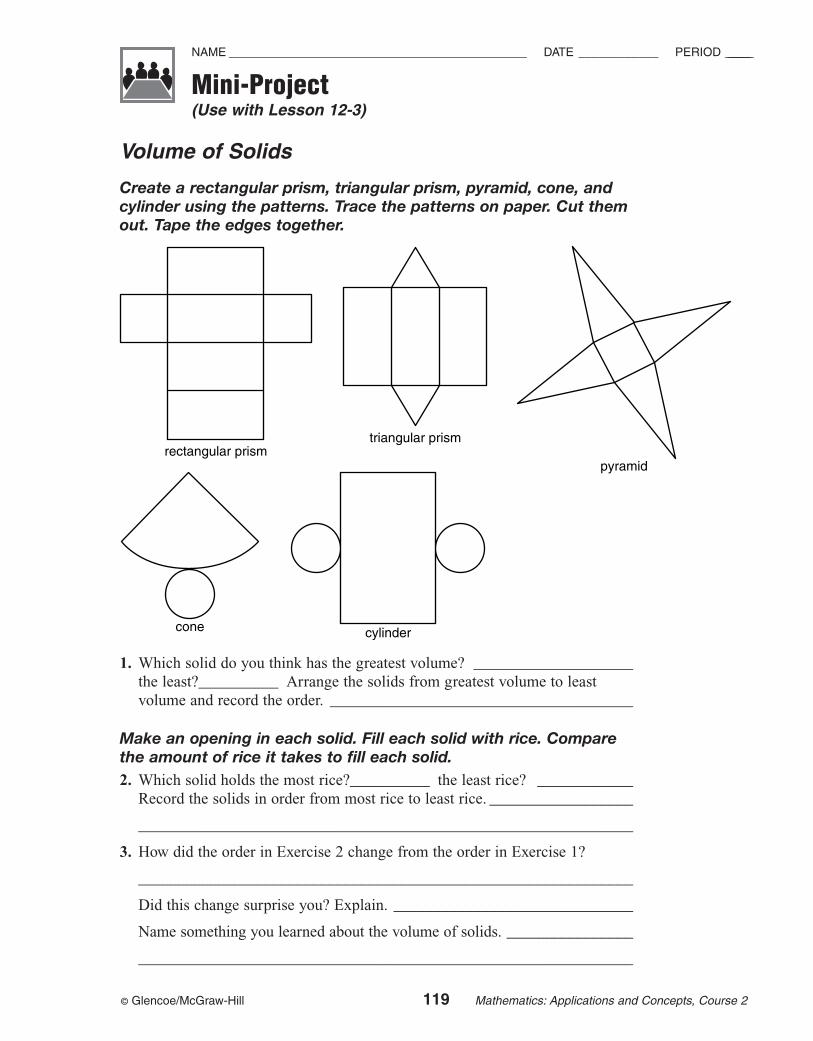
© Glencoe/McGraw-Hill 119 Mathematics: Applications and Concepts, Course 2
Mini-Project(Use with Lesson 12-3)
NAME ______________________________________________ DATE ____________ PERIOD __________
Volume of Solids
Create a rectangular prism, triangular prism, pyramid, cone, andcylinder using the patterns. Trace the patterns on paper. Cut themout. Tape the edges together.
1. Which solid do you think has the greatest volume? ____________________the least?__________ Arrange the solids from greatest volume to leastvolume and record the order. ______________________________________
Make an opening in each solid. Fill each solid with rice. Comparethe amount of rice it takes to fill each solid.2. Which solid holds the most rice?__________ the least rice? ____________
Record the solids in order from most rice to least rice. __________________
______________________________________________________________
3. How did the order in Exercise 2 change from the order in Exercise 1?
______________________________________________________________
Did this change surprise you? Explain. ______________________________
Name something you learned about the volume of solids. ________________
______________________________________________________________
rectangular prismtriangular prism
pyramid
cone cylinder
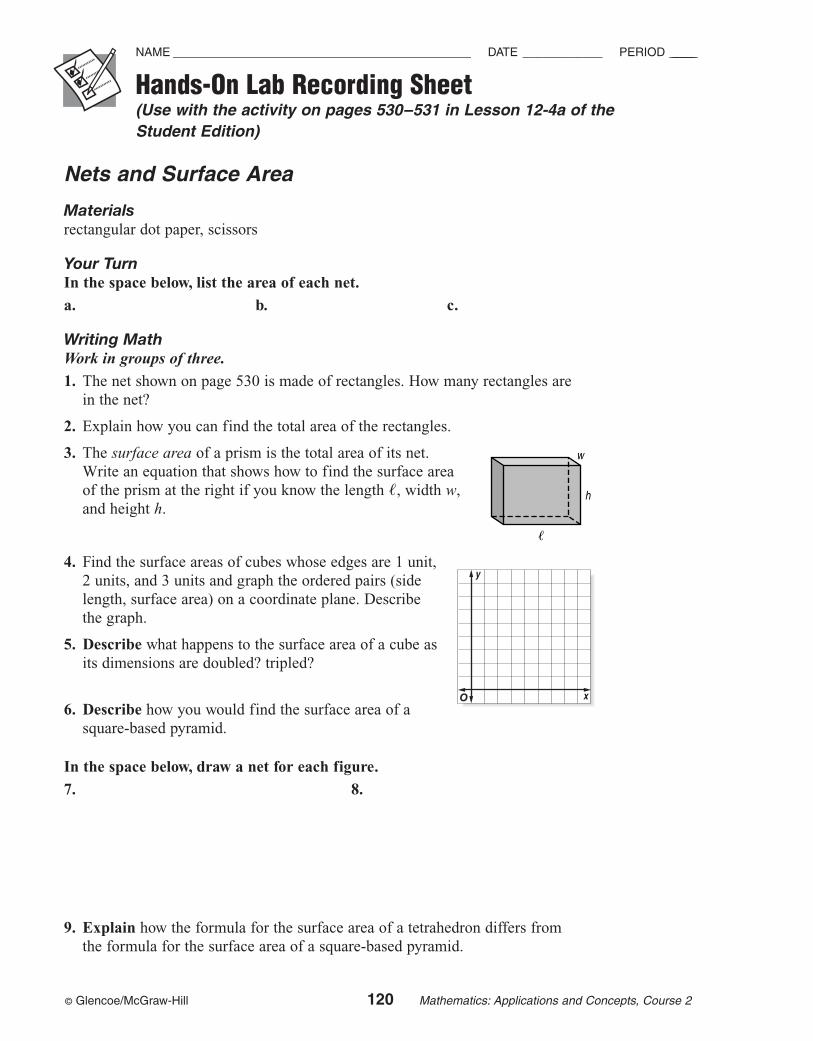
© Glencoe/McGraw-Hill 120 Mathematics: Applications and Concepts, Course 2
Hands-On Lab Recording Sheet(Use with the activity on pages 530–531 in Lesson 12-4a of the Student Edition)
NAME ______________________________________________ DATE ____________ PERIOD __________
Nets and Surface Area
Materialsrectangular dot paper, scissors
Your TurnIn the space below, list the area of each net.
a. b. c.
Writing Math Work in groups of three.
1. The net shown on page 530 is made of rectangles. How many rectangles arein the net?
2. Explain how you can find the total area of the rectangles.
3. The surface area of a prism is the total area of its net. Write an equation that shows how to find the surface areaof the prism at the right if you know the length �, width w,and height h.
4. Find the surface areas of cubes whose edges are 1 unit, 2 units, and 3 units and graph the ordered pairs (sidelength, surface area) on a coordinate plane. Describe the graph.
5. Describe what happens to the surface area of a cube asits dimensions are doubled? tripled?
6. Describe how you would find the surface area of asquare-based pyramid.
In the space below, draw a net for each figure.
7. 8.
9. Explain how the formula for the surface area of a tetrahedron differs fromthe formula for the surface area of a square-based pyramid.
w
h
�
y
xO
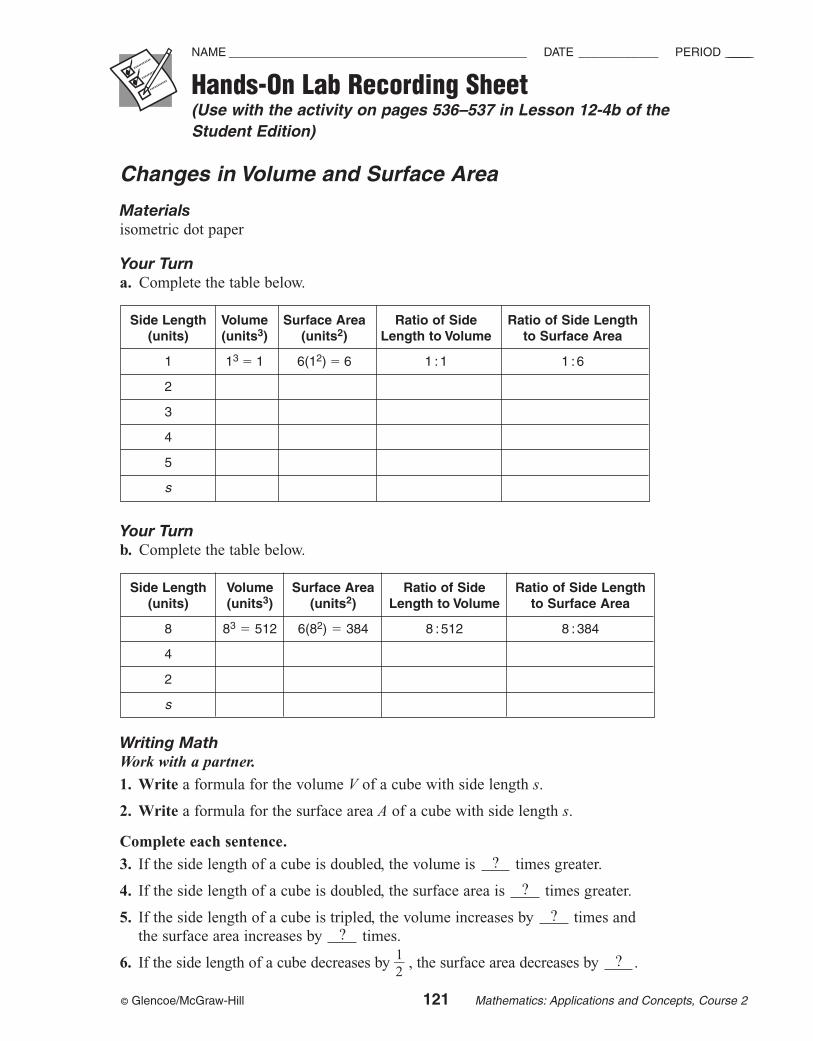
© Glencoe/McGraw-Hill 121 Mathematics: Applications and Concepts, Course 2
Hands-On Lab Recording Sheet(Use with the activity on pages 536–537 in Lesson 12-4b of the Student Edition)
NAME ______________________________________________ DATE ____________ PERIOD __________
Changes in Volume and Surface Area
Materialsisometric dot paper
Your Turna. Complete the table below.
Your Turnb. Complete the table below.
Writing Math Work with a partner.
1. Write a formula for the volume V of a cube with side length s.
2. Write a formula for the surface area A of a cube with side length s.
Complete each sentence.
3. If the side length of a cube is doubled, the volume is times greater.
4. If the side length of a cube is doubled, the surface area is times greater.
5. If the side length of a cube is tripled, the volume increases by times andthe surface area increases by times.
6. If the side length of a cube decreases by �12
� , the surface area decreases by .?
??
?
?
Side Length Volume Surface Area Ratio of Side Ratio of Side Length(units) (units3) (units2) Length to Volume to Surface Area
1 13 � 1 6(12) � 6 1 :1 1 :6
2
3
4
5
s
Side Length Volume Surface Area Ratio of Side Ratio of Side Length(units) (units3) (units2) Length to Volume to Surface Area
8 83 � 512 6(82) � 384 8 :512 8 :384
4
2
s

![MATHEMATICS] Provide a variety of manipulatives and materials in math centers.] Integrate mathematics throughout the day (for example, counting snacks, identifying shapes, …](https://img.dokumen.tips/doc/110x75/5f8854c3c4a5347a0a335635/mathematics-provide-a-variety-of-manipulatives-and-materials-in-math-centers.jpg)