Embed Size (px)
Citation preview

Stanford Center for Opportunity Policy in Education
oStanford Center for Opportunity Policy in Education
sc e
Teaching Around the World: What Can TALIS Tell Us?
Dion Burns & Linda Darling-Hammond

Stanford Center for Opportunity Policy in Educationhttp://edpolicy.stanford.edu
@scope_stanford
oStanford Center for Opportunity Policy in Education
sc e
Suggested citation: Burns, D. & Darling-Hammond, L., (2014). Teaching Around the World: What Can TALIS Tell Us? Stanford, CA: Stanford Center for Opportunity Policy in Education.
Portions of this document may be reprinted with permission from the Stanford Center for Opportunity Policy in Education (SCOPE). To reprint, please use the following language: “Printed with permission, Stanford Center for Opportunity Policy in Education. http://edpolicy.stanford.edu.” For more information, contact us at [email protected].
AcknowledgmentsThis report was commissioned by Education International and funded by Education International and the National Center for Education and the Economy’s Center for International Education Benchmarking. The authors gratefully acknowledge their support. The research was conducted independently by the Stanford Center for Opportunity Policy in Education and does not represent the views of the sponsors.
Cover photo: Shane T. McCoy

Table of ContentsExecutive Summary i
Introduction 1
What is TALIS? 1
What are the advantages and limitations of TALIS? 2
Teacher Supply and Demand: Who Teaches Where and Why? 3
The Teaching Workforce 3
Where do teachers want to work? 8
Teaching Conditions 10
Teaching’s value in society 11
Tangible working conditions 12
Teaching and planning time 14
Professional climate in schools 16
Teacher collaboration 18
Teacher Preparation and Development 20
Teacher preparation 21
Induction programs 23
Teacher professional development 25
Teaching Practices 28
‘Active’ teaching practices 29
Practices in classroom context 30
Use of student assessment 31
School Leadership and School Climate 32
Principals’ use of time 32
Instructional leadership practices 34
Leadership style and school climate 36
Appraisal and Feedback 37
Teacher feedback 37
Formal appraisal 39
Teachers perceptions of feedback and appraisal systems 41
Teacher Self-Efficacy 42
Self-efficacy domains 42
Self-efficacy across jurisdictions 43
Self-efficacy, teachers, and classrooms 43
Self-efficacy and collaborative school environments 44
Self-efficacy, job satisfaction, and school leadership 45
Conclusions and Policy Recommendations 46
References 49


Teaching Around the World: What Can TALIS Tell Us? i
Executive Summary
The Teaching and Learning International Survey of 2013 (TALIS) — representing the views of teachers and principals in lower secondary schools from 34 jurisdictions around the world — tells us a great deal about the conditions for teaching in different countries today and what these may mean for the future of the teaching force and the quality of teaching. Among the most salient findings are the following:
Teacher Supply
Perhaps in part as a function of recent economic downturns, shortages of personnel and materials are noticeable in many countries. On average:
• Thirty-eightpercentofteachersworkinschoolswheretheprincipalreports that a shortage of qualified or well-performing teachers hinders the school’s capacity to provide quality instruction. These rates were above 70% in Japan and the Netherlands. Across jurisdictions, reported shortages were particularly acute and widespread with respect to teach-ers of special needs students.
• Forty-sevenpercentofteachersworkedinschoolsinwhichtheirprincipals reported that a shortage of support personnel hinders the school’s capacity to provide quality instruction. This rate was above 50% in 13 of 34 jurisdictions and above 70% in Italy, Japan, and Spain.
• Morethanaquarterofteachersworkinschoolsinwhichprincipalsre-ported that a shortage or inadequacy of instructional materials hinders the school’s capacity to provide quality instruction. These rates were above 50% in Italy and Estonia, and above 75% in the Slovak Republic and Romania.
Equitable teacher distribution is also problematic in some countries. In 13 jurisdictions, experienced teachers were much less likely to work in schools with more disadvantaged students. The disparities were greatest in Alberta, Estonia, Flanders, Romania, and Sweden. In Sweden, for example, experienced teachers were half as likely as their inex-perienced colleagues to work in schools with more than 30% of students from socioeco-nomically disadvantaged homes. By contrast, in just four jurisdictions — Brazil, Latvia, Mexico, and the Netherlands — experienced teachers were more likely to work in more disadvantaged schools.
These differences may be influenced by policy. Despite a history of large inequalities, recent reforms in Brazil, for example, have helped increase funding and equalize educa-tional spending across states and municipalities; raised teacher salaries, particularly in the poorer sections of the country; and enacted teaching standards. All of these strate-gies help to support teachers and may increase retention in disadvantaged areas.

Stanford Center for Opportunity Policy in Educationii
Teaching Conditions
Teachers have traditionally reported that class size is one of the teaching conditions that matters to them in their efforts to meet the needs of their students. Class size varies considerably across jurisdictions, ranging from 17 students per classroom to more than 30, with an average of 24 students per class.
We found a significant relationship between class sizes and teacher shortages across countries. Jurisdictions in which principals reported very few shortages — such as Fin-land, Iceland, Denmark, and Poland — were also those with smaller average class sizes (below 20); whereas nations with high rates of shortages — such as Japan, Mexico, and Chile — had class sizes well above 30.
One of the most surprising findings from TALIS was that on average, less than a third of teachers (31%) indicated that the teaching profession is valued in their society. Teachers were most likely to report their profession is valued in Malaysia (at 84% of teachers), followed by Singapore, Abu Dhabi, and Korea, where two thirds of teachers agreed. At the other end of the scale, only 4% of teachers in the Slovak Republic and 5% in France and Sweden thought their profession was valued.
Societal value placed on teaching was found to be positively correlated with student achievement on the Program for International Student Assessment (PISA). Societ-ies express this regard in a range of ways. Social value placed on teaching is related to teachers’ salaries relative to other college educated workers and teachers’ involvement in professional decision making within schools. Social value placed on teaching is also related to the amount of time teachers have for collaboration, which in turn is signifi-cantly related to teachers’ views that the “advantages outweigh the disadvantages” of teaching — an indicator of job satisfaction.
Time for collaboration varies widely across countries. Around the world, teachers re-ported working an average of 38 hours a week, ranging from over 50 hours a week in Japan, to less than 30 hours in Chile and Italy. This time is structured very differently in terms of the amount that teachers work directly with students in relation to the time they have for planning, collaborating with their colleagues, grading papers, and meeting one-on-one with students or parents. On average, teachers taught classes an average of 19 hours per week, but teachers in the United States taught 40% more, at an average of 27 hours a week, while teachers in Norway taught only about 15 hours per week.
TALIS data show that lack of time proves to be a major barrier to professional learning for many teachers. In addition, TALIS data indicate teacher self-efficacy and job satis-faction are associated with the opportunities they have for collaboration, which vary widely. Part of the reason teacher collaboration is so valued is that teachers view it as enhancing their knowledge, skills, and efficacy, which in turn may make teaching less stressful and more satisfying.

Teaching Around the World: What Can TALIS Tell Us? iii
While more than 80% of teachers reported having engaged in some form of collabora-tive professional learning, only 63% had done so more than once in the previous 12 months. In some jurisdictions (e.g., Finland, the Slovak Republic, and Flanders) over 40% of teachers had not engaged in any collaborative learning activities.
Similarly, in some countries, opportunities for collaborative engagement were common-place. More than 80% of teachers in Japan reported observing other teachers’ classes and providing feedback at least twice a year, and over 50% of teachers in each of Mexi-co, the Slovak Republic, Denmark, Italy, and Japan reported teaching jointly in the same class at least five times a year.
However, 45% of teachers reported never observing another teacher’s class — a propor-tion that exceeded three-quarters in Brazil, France, Iceland, Flanders, and Spain. Simi-larly 42% reported never teaching jointly as a team in the same class. This indicates that in many countries, a significant proportion of teachers still teach largely in isolation and may be missing out on valuable opportunities to collaborate, receive feedback, and learn from their colleagues.
Teacher Preparation and Development
Across TALIS jurisdictions, the proportion of teachers who have completed a teacher education program is very high. On average, 90% of teachers had completed a program. However, the content of teacher education varies noticeably across (and sometimes within) jurisdictions. Many fewer teachers have had training in content, pedagogy, and supervised practice for the areas they teach. About two thirds of teachers have received training in each of these areas for all the subjects they teach. Only 57% of teachers had received formal teacher training in all of these areas — that is, content, pedagogy, and supervised practice — for all the subjects they teach. This proportion ranged from over 80% in Poland, Croatia, and Bulgaria to less than 40% in Alberta, Norway, Spain, and Italy.
Rates of teacher training were associated with higher levels of student achievement at the jurisdiction level. In addition, greater feelings of preparedness were significantly related to teachers’ satisfaction with their job performance and feelings of self-efficacy, particularly their ability to use a variety of assessment strategies, provide alternative explanations to students, and to help students think critically.
Not surprisingly, TALIS teachers tended to feel more prepared in terms of the content, pedagogy, and practice of the subjects they teach when they had received formal train-ing in these domains. Other research underscores that teachers tend to feel better pre-pared and more efficacious when they have had higher quality preparation and induc-tion, and that feelings of self-efficacy are related to teachers’ measured effectiveness in promoting student learning gains.

Stanford Center for Opportunity Policy in Educationiv
Despite its well-established benefits, induction for beginning teachers is not routinely available across jurisdictions. About two thirds of teachers work in schools where prin-cipals report access to formal induction programs for teachers new to the profession. This ranges from more than 95% in Singapore, England, Malaysia, and Australia to less than a quarter of teachers in Spain, Poland, and Portugal.
Despite principals’ reports of access to induction, only about half of teachers with less than three years of experience reported having participated in formal programs. Dif-ferences of greater than 30 percentage points between access and participation were noted for Finland, France, Japan, Serbia, and the Slovak Republic. This may be because of uneven implementation across schools, especially if specific funding and structures are not available to ensure that mentors have been selected and given time to support beginners, or that other aspects of the program (seminars, joint planning time) are made available in a school. Other school pressures, heavy teaching workloads, schedul-ing conflicts, or the absence of resources can all act as potential barriers to participation. This discrepancy deserves further exploration, given the importance of induction to teacher retention and effectiveness.
Participation in induction programs can also be influenced by teachers’ status as full- or part-time, or their contract status. In some jurisdictions, many teachers — especially beginners — are on short-term contracts. In some cases, these teachers are not eligible for formal induction programs that are made available to longer-term employees.
Access to different forms of professional development is also uneven. Although 88% of teachers indicated that they had taken part in some kind of professional development during the past twelve months, usually in the form of workshops or courses, there was wide variation in the amount of professional development teachers could access and the conditions under which they did so.
About two thirds of teachers did not pay for the professional development they under-took during the previous twelve months, but this ranged from 93% of teachers in Eng-land to just 25% in Korea. Similarly, the proportion of teachers who received scheduled time for professional development activities during working hours ranged from 88% in Malaysia to 15% in Portugal, with an average of 55% across countries. Time was a key variable: The most commonly reported barrier to participation in professional develop-ment was conflict with teachers’ working schedules, reported by just over half of teach-ers. Participation rates tended to be higher where there was scheduled time for profes-sional learning activities during regular work hours.
A significant proportion of teachers (39%) also reported that their participation was inhibited by a lack of relevant professional development offered. At the same time, TALIS identified a number of areas in which teachers expressed a desire for more pro-fessional development opportunities. The most prominent area was in teaching students with special needs, which was cited by 22% of teachers across jurisdictions. Other

Teaching Around the World: What Can TALIS Tell Us? v
data suggested that relatively few teachers had had access to such learning opportuni-ties. Teachers who had completed a teacher training program were much less likely to say that they felt a need for professional development in this area, suggesting that this need could be met either by ensuring greater access to more comprehensive pre-service preparation, or by organizing more in-service training.
Teachers in TALIS generally reported that professional development activities impacted their teaching. In each of the 14 content areas surveyed in TALIS, an average of at least three quarters of teachers who participated in specific kinds of professional develop-ment reported that it had a moderate or large impact on their teaching. In each case, a plurality of teachers designated the impact as “moderate,” rather than “large.”
These data do not reveal, however, whether the impact of professional development varied based on how it was designed and conducted. Other research shows that profes-sional development is most effective in improving teachers’ instructional practice and contributing to student learning when it is continuous and sustained, is closely con-nected to the work of teachers in the classroom, fosters teacher professional collabora-tion, and coherently relates to broader school reform efforts.
Teacher Collaboration
Perhaps the strongest set of findings in TALIS were those associated with teacher col-laboration, which appeared as an important element of learning, influence on practice, and influence on job satisfaction and self-efficacy, which are in turn related to teacher retention and effectiveness. More than any other policy area, actions that support col-laborative learning among teachers appear to hold promise for improving the quality of teaching and the long-term commitment of teachers.
TALIS analyses reinforce the findings of previous research with respect to teachers’ participation in collaborative forms of professional development. Professional collabora-tion was significantly and positively related to each of the following professional devel-opment activities: mentoring and/or peer observation and coaching (31 jurisdictions), individual or collaborative research on a topic of professional interest (30 jurisdictions), and participation in a network of teachers formed specifically for the professional devel-opment of teachers (26 jurisdictions).
However, relatively few teachers experienced these kinds of opportunities across juris-dictions. For example, only 37% had participated in a professional development net-work, which proves to be strongly related to teachers’ practices (see below).
Collaboration opportunities were also strongly related to teacher self-efficacy — teach-ers’ confidence in their abilities to plan, organize, and carry out activities that allow them to attain their educational goals. Self-efficacy is an attribute of particular interest, as it has been linked in many studies with increased instructional quality, the use of

Stanford Center for Opportunity Policy in Educationvi
innovative practices, and teacher contributions to student achievement gains. Greater teacher self-efficacy has also been linked with increased teacher job satisfaction and lower rates of burnout.
TALIS data show that frequent engagement in teacher professional collaboration — i.e., engaging in collaborative activities at least five times a year -- was positively associated with self-efficacy, which was heightened by all of the following:
• teamteaching,
• observingotherteachers’classesandprovidingfeedback,
• engaginginjointactivitiesacrossdifferentclassesandages,and
• participatingincollaborativeprofessionallearning.
The last of these — collaboration in professional learning opportunities — was associat-ed with greater self-efficacy across jurisdictions and was linked with greater teacher job satisfaction in 21 of these. This suggests that when teachers are engaged in collabora-tive practices that enhance their individual and collective teaching capabilities, they not only feel more confident in their abilities to teach, to engage students, and to manage class behaviour but also tend to find greater enjoyment in their work.
Given the power of teacher collaboration to transform practice (see below) and improve student learning, as well as to enhance teacher efficacy and satisfaction, collaborative professional learning opportunities such as mentoring, peer observation and coaching, collaborative research, and teacher networks should be encouraged. As the TALIS report noted, “If policy makers want to promote professional collaboration, these types of pro-fessional development activities, which are associated with this outcome, could be the focus of future policy efforts” (OECD, 2014b, p. 168).
Teaching Practices
Collaborative and effective professional learning opportunities were found to be as-sociated with teachers’ practices, especially with respect to those that encourage what are commonly referred to as “21st century skills” — problem solving, inquiry, critical thinking, and collaboration, for example.
The vast majority of teachers indicated that they agree with these goals for instruction: Over 90% agreed that their role is to “facilitate students’ own inquiry,” and over 80% of teachers agreed that thinking and reasoning are more important than content and that students learn best by finding solutions to problems on their own.
However, a minority of teachers reported that they frequently engage in practices con-sistent with these goals and views, including what TALIS called “active” teaching prac-tices, such as students working in small groups to come up with a joint solution to a

Teaching Around the World: What Can TALIS Tell Us? vii
problem or task; undertaking projects that require at least one week to complete; and conducting projects requiring students to work with information and communication technology.
While the use of such practices can certainly be influenced by national or state curricula and examination systems, they are also influenced by teachers’ initial preparation and later training. Teachers who reported they were well prepared by their teacher education program in pedagogy were much more likely to use small group problem-solving, for example. Participating in a network of teachers was also related to the increased use of small group work and the use of ICT. Teachers’ engagement in individual or collabora-tive research, in observation visits to other schools, in mentoring, and in peer observa-tion and coaching was also associated with greater use of active learning practices.
With respect to assessment practices, the TALIS data indicate that teachers (a) employ a wide range of assessment methods to guide their teaching and offer feedback to stu-dents, (b) commonly receive feedback both on their assessment methods and student outcomes, and (c) find greater confidence and satisfaction in their teaching when they receive feedback and appraisal linked to evidence of student learning.
Together, these findings suggest that teachers’ opportunities for collaboration and feed-back about what they are doing and what students are learning — both pre-service and in-service — can support the greater use of active teaching practices, foster attention to student learning, and enhance teachers’ satisfaction.
School Leadership and Climate
While most teachers agreed that they experienced “a collaborative school culture char-acterized by mutual support,” there were noticeable differences in the degree to which principals and teachers reported this kind of climate. For example, across TALIS juris-dictions, 95% of principals agreed with this statement (with responses ranging from 83% in France to 100% in Norway). However, the average for teachers was 79%, rang-ing from 66% of teachers in England to 93% of teachers in Norway.
Teachers were significantly more likely to indicate the existence of a collaborative school culture in jurisdictions where they also reported that staff had opportunities to participate in decision-making, suggesting a positive association between distributed leadership and a collaborative school climate. Teachers’ involvement in school decision-making was also linked with self-efficacy in most jurisdictions, and with job satisfaction (with very large effect sizes) in all jurisdictions.
However, teachers and principals differed in the extent to which they perceived op-portunities for staff decision-making, and there was no association between principals’ reporting of staff opportunities for decision-making and teachers’ perceptions that they experienced a collaborative culture. More than 90% of principals in each jurisdiction reported that teachers had opportunities to actively participate in school decisions,

Stanford Center for Opportunity Policy in Educationviii
as compared with 74% of teachers, an average difference of 24 percentage points. The greatest differences were found in England, where the average rate of agreement from teachers was below 60%, and principals’ and teachers’ reports were apart by 39 percent-age points.
TALIS data showed that principals’ leadership styles are related to the professional working climate for teachers. Where principals engaged in distributed leadership, they were more likely to report a school climate of mutual respect. Principals who employed distributed leadership practices were also more likely to report greater satisfaction with their jobs.
Schools were also more likely to have a mutually respectful climate when principals reported the use of instructional leadership practices. The data indicate that when prin-cipals spend a greater proportion of their time on curricula and teaching-related tasks, they are more likely to spend more time observing classroom instruction and to encour-age teacher cooperation and professional learning at both the individual and school levels.
In TALIS, instructional leadership was also associated with the use of teacher appraisal to develop staff capabilities. For example, instructional leaders were more likely to cre-ate a development plan for each teacher or appoint a teacher mentor to help improve teaching, or both, following formal teacher appraisal. By contrast, instructional leader-ship was rarely associated with non-renewal of teacher contracts or with changes in teachers’ salaries following appraisal. Instructional leaders seem more focused on using appraisal to support teacher learning than to apply rewards and sanctions.
School leadership research shows that instructional leadership is positively associated with student outcomes, with one study finding that “promoting and participating in teacher learning and development” had at least twice the effect size of other commonly used leadership practices (Robinson, Hohepa, & Lloyd, 2009).
Across TALIS jurisdictions there was a wide variety in the self-reported use of instruc-tional leadership practices among school principals. For example, 98% of principals in Malaysia reported that they “often” or “very often” took action to support cooperation among teachers to develop new teaching practices, compared with just 34% of princi-pals in Japan (OECD, 2014b, p. 296 Table 3.2).
Not all principals have had the opportunity to learn instructional leadership practices. While principals generally bring a great deal of experience as teachers to their role (21 years on average), fewer than half had undertaken principals’ training before taking on the role. Across all jurisdictions, an average of 22% of principals reported having re-ceived no instructional leadership training either before or after becoming a principal. Although nearly universal in the United States (98%), and above 90% in 11 jurisdic-tions, training in instructional leadership was below 60% in four jurisdictions.

Teaching Around the World: What Can TALIS Tell Us? ix
Supporting strong preparation before principals take on this important role and ensur-ing that pre- and in-service training include support for instructional leadership and distributed leadership are policy moves that could make a big difference in both teach-ers’ and principals’ learning, practice, self-efficacy, and job satisfaction.
Appraisal and Feedback
In recent years, a number of nations have placed more emphasis on teacher appraisal. Nearly all teachers in TALIS jurisdictions (93%) receive some kind of formal appraisal. An exception is Italy, where 70% of teachers indicated they are generally never formally appraised.
Most teachers receive feedback on their teaching through both formal and informal methods. However, practices vary widely. Classroom observations are nearly universal in England, the United States, Malaysia, and Poland, whereas fewer than half of teach-ers are observed in Finland, Spain, Italy, and Iceland. Teachers receive feedback from multiple sources, including school principals (54%), members of the school manage-ment team (49%) and other teachers in the school (42%), but these sources — and their influences — also differ significantly from one place to the next.
For example, in the United States, where teachers report high levels of feedback from principals (85%) and low levels of feedback from teachers (only 27%), teachers found feedback less useful than in many other countries where peers were more involved. This may be because the feedback that teachers receive from peers is more targeted and relevant for the specific students and curricular content being taught, or because it is aimed at improvement rather than personnel decisions.
The TALIS data show that most teachers feel the feedback they receive influences their work. On average, 62% of teachers indicated that feedback had a moderate or large positive influence on their teaching practice, and just over half of teachers reported positive impacts on their classroom management (56%), knowledge and understanding of subject matter (54%), and use of student assessments to improve learning (59%).
At the same time, about half of teachers agreed that appraisal and feedback are largely done for administrative purposes, and fewer than half agreed that appraisal and feed-back were based on a thorough assessment of their teaching. A significant proportion (43%) reported that appraisal and feedback systems in their school have little impact on classroom practice. Teachers’ job satisfaction was lower when teachers felt that appraisal was conducted for largely administrative purposes and higher when teachers felt it was useful for their teaching.
Together these findings suggest that teachers welcome feedback that enhances their teaching capabilities and is connected to students’ learning. Teacher appraisal systems are more likely to be effective when they lead to high-quality professional learning and

Stanford Center for Opportunity Policy in Educationx
are viewed as providing meaningful feedback to improve student learning. By contrast, systems of appraisal that serve largely administrative purposes or as focused primarily on high-stakes personnel decisions may serve to lower the desirability of teaching, as other research has suggested.
Recommendations
The data in TALIS 2013 provide important insights into the policies that can support and strengthen teaching and lead to high-quality learning for students. Among these policy implications are the following:
1. Communicate value for the profession of teaching by recognizing teachers’ professionalism and involving teachers in decision-making.
2. Ensure adequate and equitable resources to address current shortages of teachers, support personnel, and instructional materials.
3. Establish incentives to ensure an adequate supply of teachers for all fields and communities, including special education teachers and teachers in schools serving disadvantaged students.
4. Provide comprehensive, high-quality preparation in content, peda-gogy, and classroom practice to support active teaching strategies, teacher efficacy, and student achievement.
5. Support induction for novices with the funding and support struc-tures that can ensure mentoring, collaborative planning opportuni-ties, and learning supports.
6. Provide time for collaboration and professional learning so that teach-ers have opportunities to observe and receive feedback from peers and improve their instructional practices.
7. Encourage high-quality professional development relevant to teach-ers’ needs, which can promote collaborative school practices associ-ated with teacher self-efficacy and job satisfaction.
8. Identify potential leaders and provide them with training as instruc-tional leaders, so that they can promote improvement in teaching and a climate of mutual respect in schools.
9. Encourage distributed leadership and shared decision-making, which enhances collaborative practices and both principal and teacher job satisfaction.
10. Center teacher appraisal and feedback on improving teaching quality and link them to high-quality professional learning in order to en-hance teachers’ skills and self-efficacy.

Teaching Around the World: What Can TALIS Tell Us? xi
Educating students with the competencies required for the knowledge economies of the 21st century has increased the complexity of teaching. High-performing education systems tend to be those where the teaching profession is valued in society; that are able to attract high-quality individuals into teaching, train them well, and retain them in the profession by putting in place supports that address the working conditions in the schools they work; and support their ongoing professional learning. TALIS tells us that valuing teaching and teacher learning, restructuring the work of teaching to enable greater professional collaboration, and providing meaningful feedback to teachers to support their work can help create a more attractive and efficacious teaching workforce.


Teaching Around the World: What Can TALIS Tell Us? 1
TIntroduction
his report explores what the Teaching and Learning International Survey of 2013 (TALIS) — representing the views of teachers and principals from around the world — can tell us about the conditions for teaching in different countries today and
what these may mean for the future of the teaching force and the quality of teaching. The findings from TALIS provide important insights into the work and teaching condi-tions of teachers, offering implications for pedagogy and policy both for governments and for the teaching profession itself. TALIS also raises some important questions that deserve further research and study.
We place the TALIS results in the context of other research and data about teaching as we look at the following issues:
• Supplyanddemand:Whoteachesandwhere
• Teachingconditions
• Teacherpreparationanddevelopment
• Teachingpractices
• Schoolleadershipandclimate
• Appraisalandfeedback
• Teacherself-efficacy
What is TALIS?
Conducted by the Organization for Economic Cooperation and Development (OECD), TALIS 2013 surveyed teachers and principals in 34 jurisdictions internationally. Twenty-four of these were from the OECD, and 10 were from partner jurisdictions.1 The first TALIS was conducted in 2008 with 24 jurisdictions, 18 of which also appear in TALIS 2013.
Like the Program in International Student Assessment (PISA), TALIS focuses on lower secondary schools that serve 15-year-olds. TALIS asks teachers and principals about the schools in which they teach, their working conditions and use of time, and their educa-tion, training, and experience. It also surveys teachers about the amount and kind of induction, mentoring, and professional development they receive, the kinds of formal
1 In each jurisdiction, the intended sample size is 200 schools, with 20 teachers and one school leader from each school. The target participation rate is 75% of schools and 75% of teachers in each country. The United States did not meet the participation rate, and thus U.S. totals are not included in TALIS averages; however, U.S. results are reported separately for many of the analyses. “The U.S. response rate in 2013 was 44 percent of original schools (before substitution; weighted) and 74 percent after substitution (weighted). . . . [T]he TALIS Board of Participating Countries agreed that the U.S. response rate and quality of collected data were nonetheless of sufficiently high quality to report.” (National Center for Educational Statistics, 2014)

Stanford Center for Opportunity Policy in Education2
and informal feedback and appraisal they receive, and how these impact upon their teaching practice. The survey questions teachers about a range of collaborative and individual practices within the school, and teachers’ level of job satisfaction and self-efficacy. Finally, the TALIS 2013 report includes analyses that explore the relationships between each of these variables and generates policy recommendations based upon the aggregated data and analyses.
What are the advantages and limitations of TALIS?
TALIS 2013 is useful for a number of reasons. It surveys a large number of jurisdictions allowing for comparison across jurisdictions and across differing policy environments. Considering jurisdictions in international context can help illuminate potential areas of success or concern. In particular, because the study surveys teachers and principals, it represents their perceptions and how policies are experienced by those working closest to children in schools.
There are, however, several limitations to the study, which offer cautions in interpreting findings from the TALIS 2013 report. First, the findings in the TALIS report represent averages within jurisdictions; however, there may be considerable variation in edu-cational policies and contexts within a jurisdiction. In particular, where education is administered at a state or sub-jurisdictional level, this complicates the policy interpreta-tions that may be drawn from the findings.
Furthermore, the sample of teachers and principals in lower secondary schools, which is the main focus of TALIS, may not reflect the contexts and views of educators in pri-mary or upper secondary schools, where conditions may be different.2
Second, like any survey, the meaning of questions can be interpreted differently in dif-ferent contexts. Although teachers’ and principals’ reported experiences of policies and the schools in which they work are certainly valid, they nonetheless represent an ag-gregation of subjective data. Pairing these with additional data can help build a more complete picture of educational policies and how they are experienced.
Finally, the TALIS 2013 report allows for observation of the correlations between vari-ables, but this does not prove a causal relationship.3 Rather, significant correlations be-tween variables may be interpreted as highlighting relationships for further inquiry and investigation. The full TALIS dataset provides a rich resource for subsequent and more detailed analyses investigating the leads the country report provides.
2 A few countries did elect to also survey these teachers: six jurisdictions at primary level, and 10 at upper secondary school. Selected findings from these surveys appear in TALIS 2013 but are not discussed in this report.
3 A correlation may signal bi-directional relationships or may be influenced by a number of mediating factors and the potentially complex relationships among these.

Teaching Around the World: What Can TALIS Tell Us? 3
Teacher Supply and Demand: Who Teaches Where and Why?
The Teaching Workforce
aintaining a strong supply of high-quality teachers is an issue of critical impor-tance in all education systems. When not properly addressed, teacher shortages can increase pressure across educational systems and lead to suboptimal practices,
including raising the number of teachers required to teach ‘out-of-field’ (that is, in sub-ject disciplines for which they are not fully trained or qualified), increasing class sizes and teacher workloads, and cancelling courses or programs. Shortages can also lead to pressure to reduce entry standards for new teachers (McKenzie, Santiago, Sliwka, & Hiroyuki, 2005; Schleicher, 2012). All of these responses undermine the quality of teaching for children and can lead to experienced teachers leaving the profession, thus creating a vicious cycle (Stewart, 2012).
The TALIS 2013 report provided a snapshot of the teaching force, along with useful information on teacher shortages, distribution, and working conditions.
Who teaches?Gender
In most countries, teaching is still a highly feminized occupation. In all but one TALIS jurisdiction, more than 50% of lower secondary teachers are female. Japan was the sin-
Figure 1: The proporTion oF lower secondary Teachers aged 50 years or older
Source: OECD (2014), Talis 2013 Results: An International Perspective on Teaching and Learning, OECD Publishing.http://dx.doi.org/10.1787/9789264196261-en
Figure 1: The propor.on of lower secondary teachers aged 50 years or older.
0
10
20
30
40
50
60
Perc
neta
ge o
f tea
cher
s
Propor.on of teachers over age 50
50-‐59 years 60 years or more
M

Stanford Center for Opportunity Policy in Education4
gle exception to this pattern, where just 39.0% of teachers at the lower secondary level are female. Across participating TALIS countries on average, 68.1% of teachers surveyed were female, and in Latvia, Estonia, the Slovak Republic and Bulgaria, these rates were above 80% (OECD, 2014, p. 258 Table 2.1).
Age and experience
Across TALIS jurisdictions, the average age of lower secondary teachers was 43 years old, ranging from 36 years in Singapore to 49 years in Italy. The number of years of teaching experience was 16 years on average across TALIS jurisdictions, and ranged from 10 years in Singapore to 22 years in Latvia.
Of interest to policymakers will be the age distribution of the teaching workforce. Edu-cation systems need to ensure that the supply of trained teachers entering the profession is sufficient to account for teachers reaching retirement age and leaving the profession, and that there is sufficient availability of professional development to help teachers con-tinually develop their practice. Across TALIS jurisdictions, on average, 30.1% of teach-ers are aged 50 or older. However, the proportion of teachers over 50 is more than 40% in Latvia, Bulgaria, and Estonia and more than 50% in Italy.
Some countries should anticipate particularly large retirements imminently: around 1 in 6 teachers in Estonia (16.3%) and Norway (15.2%) are over the age of 60. On average, 6.3% of teachers are over 60 across all TALIS jurisdictions (OECD, 2014, p. 258 Table 2.1).
Figure 2: percenTage oF Teachers on Fixed-Term conTracTs oF one school year or less
Source: OECD (2014), Talis 2013 Results: An International Perspective on Teaching and Learning, OECD Publishing.http://dx.doi.org/10.1787/9789264196261-en
Figure 2: Percentage of teachers on fixed-‐term contracts of one school year or less
25.0
11.9
0.0
0
5
10
15
20
25
30
Perc
enta
ge (%
)
Fixed-‐term contract: One school year or less
Teaching Around the World: What Can TALIS Tell Us? 5
The effects of an aging teacher workforce have the potential to be particularly acute in countries that also experience shortages of qualified teachers (discussed below). Wheth-er teacher retirements trigger teacher shortages will depend on the number of high-cal-iber new entrants willing to enter teaching. This is influenced, in turn, by the extent to which teaching is an attractive career in all settings — generally a function of competi-tive salaries and positive working conditions. These factors both attract new entrants and lower attrition rates. This enhances supply, reduces demand, and allows employers to be more selective. Workforce planning in the context of a demographic shift should also take into account opportunities for high-quality teacher preparation, induction, mentoring and collaboration — all of which have been found to reduce teacher turn-over and enhance teacher expertise (Darling-Hammond, 2010).
Shortages can occur in subject matter areas where opportunities outside of teaching are better paid; often this is the case with fields such as mathematics, science, and special education. Shortages can also be associated with locations that are harder to staff be-cause of remoteness, community violence, or poor facilities.
Many of these factors are closely associated with educational equity as well. In some societies, school resources, educator salaries, and working conditions are comparable across all schools. In others, there are disparities in how funds are distributed that result in very different compensation and conditions that exacerbate shortages in some schools (Adamson & Darling-Hammond, 2012).
Contracts
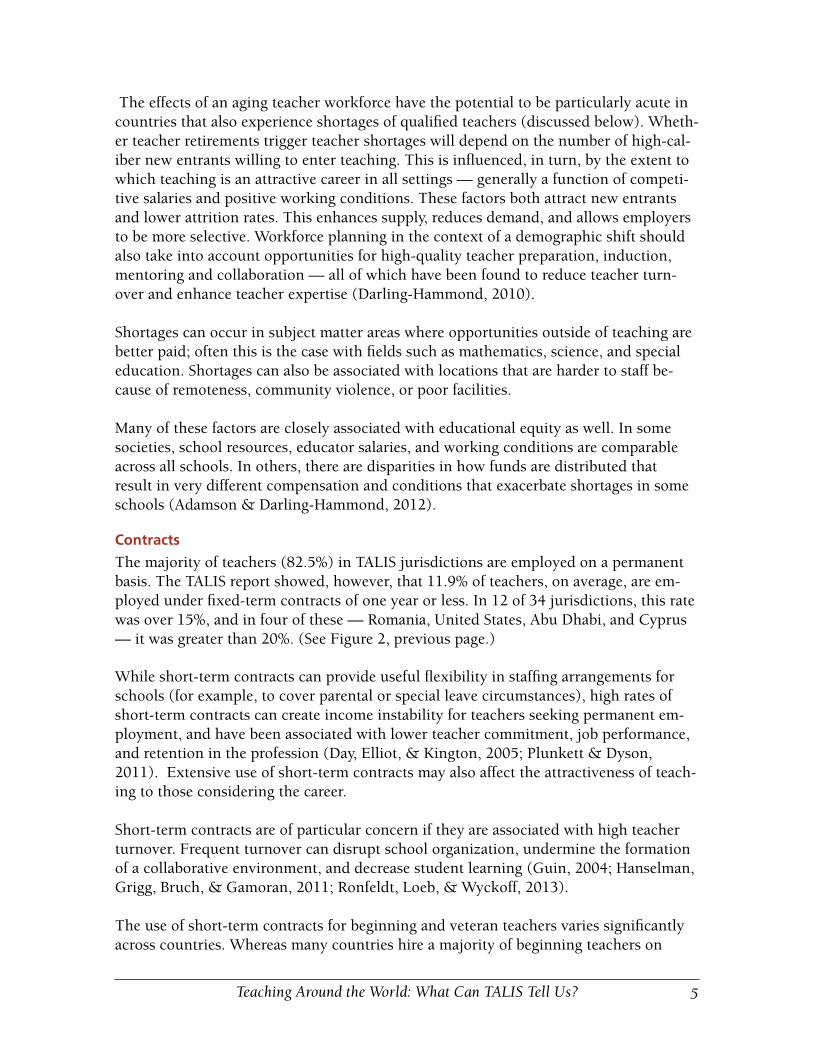
The majority of teachers (82.5%) in TALIS jurisdictions are employed on a permanent basis. The TALIS report showed, however, that 11.9% of teachers, on average, are em-ployed under fixed-term contracts of one year or less. In 12 of 34 jurisdictions, this rate was over 15%, and in four of these — Romania, United States, Abu Dhabi, and Cyprus — it was greater than 20%. (See Figure 2, previous page.)
While short-term contracts can provide useful flexibility in staffing arrangements for schools (for example, to cover parental or special leave circumstances), high rates of short-term contracts can create income instability for teachers seeking permanent em-ployment, and have been associated with lower teacher commitment, job performance, and retention in the profession (Day, Elliot, & Kington, 2005; Plunkett & Dyson, 2011). Extensive use of short-term contracts may also affect the attractiveness of teach-ing to those considering the career.
Short-term contracts are of particular concern if they are associated with high teacher turnover. Frequent turnover can disrupt school organization, undermine the formation of a collaborative environment, and decrease student learning (Guin, 2004; Hanselman, Grigg, Bruch, & Gamoran, 2011; Ronfeldt, Loeb, & Wyckoff, 2013).
The use of short-term contracts for beginning and veteran teachers varies significantly across countries. Whereas many countries hire a majority of beginning teachers on

Stanford Center for Opportunity Policy in Education6
Table 1: shorT-Term conTracTs by Teacher experience levels
Country name Proportion of all beginning teachers who are on short-term contracts
Proportion of all experienced teachers who are on short-term contracts
Australia 41.6 5.9
Brazil 48.4 12.6
Bulgaria 48.3 6.8
Chile 58.0 14.6
Croatia 22.9 2.5
Czech Republic 60.6 9.5
Denmark 30.4 1.7
Estonia 38.7 8.1
Finland 73.2 15.3
France 21.9 3.1
Israel 76.3 11.5
Italy 73.4 17.6
Japan 49.5 10.1
Korea 21.5 3.6
Latvia 7.3 2.7
Malaysia 0.0 0.0
Mexico 38.5 9.5
Netherlands 76.7 8.8
Norway 42.7 6.4
Poland 72.8 11.6
Portugal 54.4 15.2
Romania 74.1 21.7
Serbia 54.6 10.1
Singapore 1.8 3.0
Slovak Republic 59.1 11.3
Spain 57.1 15.1
Sweden 42.6 7.5
Abu Dhabi (UAE) 13.2 24.9
Alberta (Canada) 77.0 10.7
England (UK) 22.0 2.5
Flanders (Belgium) 71.5 7.8
United States 55.3 21.7
Source: OECD (2014), Teaching and Learning International Survey, Organisation for Economic Cooperation and Develop-ment. Retrieved from stats.oecd.org.

Teaching Around the World: What Can TALIS Tell Us? 7
short-term contracts, this is very rare in countries like Malaysia (0%) and Singapore (1.8%). Short-term contracts are given to less than one fourth of all beginners in Croa-tia, France, Korea, England, and Abu Dhabi.
Hiring experienced teachers on short-term contracts is quite unusual — generally well under 10% of the total — and is most prevalent in Abu Dhabi (25%), the United States (22%), and Romania (22%). (See Table 1, previous page.)4
In the United States, this trend has accompanied efforts to eliminate teacher tenure and long-term contracts in some states and has been accompanied by a rise in attrition in the profession. Currently, about 9% of all U.S. teachers leave the profession annually, a rate that is about 50% higher than the 6% attrition rate that was common for many years previously (Aud et al., 2011).
Many factors are associated with turnover, however. For example, in the US, annual at-trition is much greater for those working in high-poverty schools (20%), where work-ing conditions are generally more challenging. Attrition is also higher for early career teachers, with 13% leaving in their first year, and at least 30% leaving within five years of entry. Rates of attrition are about half as great for candidates who entered with full preparation including student teaching as for those who entered without this prepara-tion (Ingersoll, Merrill, & May, 2014). Thus, contract status may be only one factor among several that can create instability in the teaching force.
4 Beginning teachers are defined as those with less than three years’ experience.
Figure 3: The percenTage oF Teachers whose principals reporT ThaT a shorTage oF qualiFied and/or well-perForming Teachers hinders The school’s capaciTy To provide
qualiTy insTrucTion “a loT” or “To some exTenT.”
Source: OECD (2014), Talis 2013 Results: An International Perspective on Teaching and Learning, OECD Publishing.http://dx.doi.org/10.1787/9789264196261-en
79.7
38.4
12.7
0
10
20
30
40
50
60
70
80
90
Figure 3: The percentage of teachers whose principals report that a shortage of qualified and/or well-‐performing teachers hinders the school’s capacity to provide quality instruc.on “a lot” or “to some extent.”
Shortage of qualified and/or well-‐performing teachers
Stanford Center for Opportunity Policy in Education8
Where do teachers want to work?
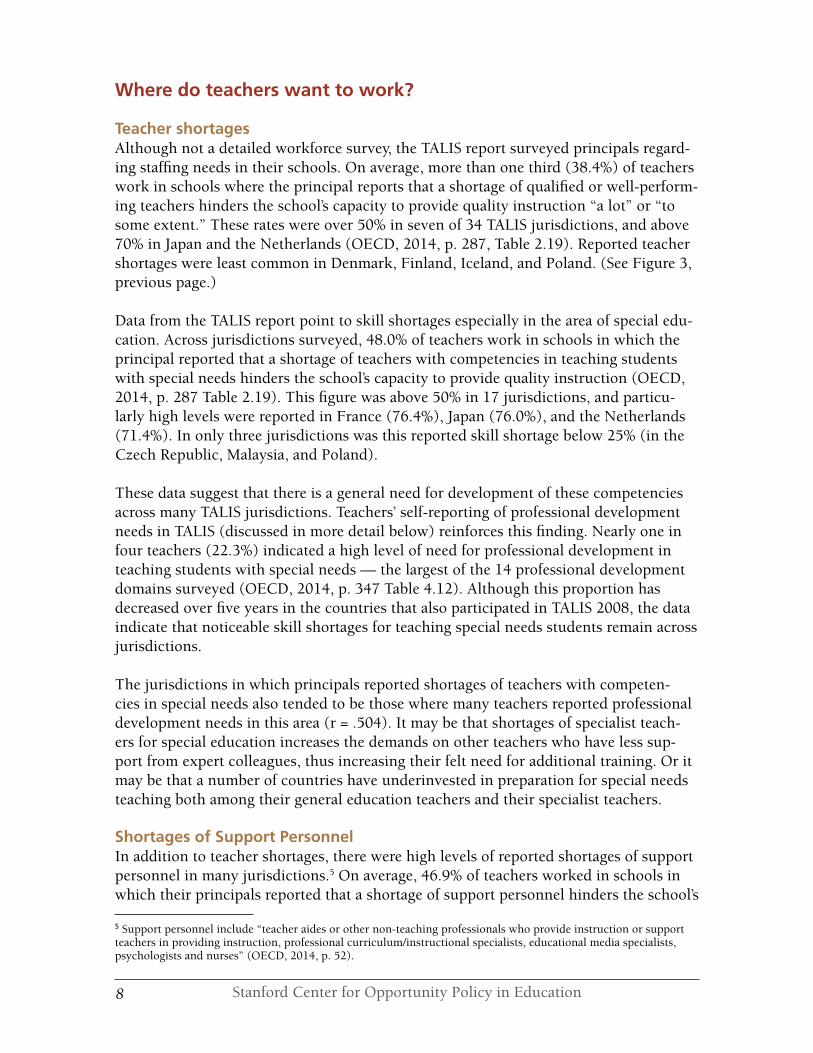
Teacher shortagesAlthough not a detailed workforce survey, the TALIS report surveyed principals regard-ing staffing needs in their schools. On average, more than one third (38.4%) of teachers work in schools where the principal reports that a shortage of qualified or well-perform-ing teachers hinders the school’s capacity to provide quality instruction “a lot” or “to some extent.” These rates were over 50% in seven of 34 TALIS jurisdictions, and above 70% in Japan and the Netherlands (OECD, 2014, p. 287, Table 2.19). Reported teacher shortages were least common in Denmark, Finland, Iceland, and Poland. (See Figure 3, previous page.)
Data from the TALIS report point to skill shortages especially in the area of special edu-cation. Across jurisdictions surveyed, 48.0% of teachers work in schools in which the principal reported that a shortage of teachers with competencies in teaching students with special needs hinders the school’s capacity to provide quality instruction (OECD, 2014, p. 287 Table 2.19). This figure was above 50% in 17 jurisdictions, and particu-larly high levels were reported in France (76.4%), Japan (76.0%), and the Netherlands (71.4%). In only three jurisdictions was this reported skill shortage below 25% (in the Czech Republic, Malaysia, and Poland).
These data suggest that there is a general need for development of these competencies across many TALIS jurisdictions. Teachers’ self-reporting of professional development needs in TALIS (discussed in more detail below) reinforces this finding. Nearly one in four teachers (22.3%) indicated a high level of need for professional development in teaching students with special needs — the largest of the 14 professional development domains surveyed (OECD, 2014, p. 347 Table 4.12). Although this proportion has decreased over five years in the countries that also participated in TALIS 2008, the data indicate that noticeable skill shortages for teaching special needs students remain across jurisdictions.
The jurisdictions in which principals reported shortages of teachers with competen-cies in special needs also tended to be those where many teachers reported professional development needs in this area (r = .504). It may be that shortages of specialist teach-ers for special education increases the demands on other teachers who have less sup-port from expert colleagues, thus increasing their felt need for additional training. Or it may be that a number of countries have underinvested in preparation for special needs teaching both among their general education teachers and their specialist teachers.
Shortages of Support PersonnelIn addition to teacher shortages, there were high levels of reported shortages of support personnel in many jurisdictions.5 On average, 46.9% of teachers worked in schools in which their principals reported that a shortage of support personnel hinders the school’s
5 Support personnel include “teacher aides or other non-teaching professionals who provide instruction or support teachers in providing instruction, professional curriculum/instructional specialists, educational media specialists, psychologists and nurses” (OECD, 2014, p. 52).

Teaching Around the World: What Can TALIS Tell Us? 9
capacity to provide quality instruction “a lot” or “to some extent.” This rate was above 50% in 13 of 34 jurisdictions and above 70% in Italy (77.5%), Japan (72.4%), and Spain (72.1%). Only two jurisdictions, England and Bulgaria, had rates below 20%.
Distribution of teachersA key theme raised in the 2014 International Summit on the Teaching Profession was the role of public education systems in providing “ladders of opportunity” for disad-vantaged learners (Stewart, 2014). An important component of this opportunity is the equitable distribution of teaching quality.
The TALIS 2013 report illustrates that providing such equitable opportunities is still a challenge in many countries. Many jurisdictions have large numbers of schools with concentrations of students from socioeconomically disadvantaged homes.6 The most pronounced concentrations of students in poverty were reported in the United States — where 65% of teachers reported they were from schools in which more than 30% of the students come from socioeconomically disadvantaged backgrounds — followed by Ma-laysia (58%) and Chile (55%), all considerably greater than the TALIS average of 19.6%. (See Figure 4.) The PISA 2012 report noted that socioeconomic status is a significant predictor of educational success in many countries, and that an inequitable distribution of teach-
6 “‘Socioeconomically disadvantaged homes’ refers to homes lacking the basic necessities or advantages of life, such as adequate housing, nutrition or medical care. They are those that receive or are eligible to receive subsidies or other welfare benefits” (OECD, 2014, p. 274).
Figure 4: percenTage oF Teachers working in schools wiTh more Than 30% oF sTudenTs From socioeconomically disadvanTaged homes
Source: OECD (2014), Talis 2013 Results: An International Perspective on Teaching and Learning, OECD Publishing.http://dx.doi.org/10.1787/9789264196261-en
Figure 4: Propor.on of teachers working in schools with more than 30% of students from socioeconomically disadvantaged homes
64.5
19.6
2.4
0
10
20
30
40
50
60
70
Propor.on of teachers working in schools with more than 30% of students from socioeconomically disadvantaged homes

Stanford Center for Opportunity Policy in Education10
ing experience means that many students may “face the double drawback of coming from a disadvantaged background and attending a school with lower-quality resources” (OECD, 2013b, p. 104).
Whereas in most countries, there was little difference in the distribution of more quali-fied and experienced teachers to more challenging schools, in 13 jurisdictions, teachers with more than five years of experience were much less likely to work in schools with more disadvantaged students. The disparities were greatest in Alberta, Estonia, Flan-ders, Romania, and Sweden. In Sweden, for example, experienced teachers were half as likely as their inexperienced colleagues to work in schools with more than 30% of students from socioeconomically disadvantaged homes. By contrast, in just four juris-dictions — Brazil, Latvia, Mexico, and the Netherlands — experienced teachers were more likely to work in more disadvantaged schools (OECD, 2014, p. 275 Table 2.12). In Brazil, experienced teachers were 50% more likely than their inexperienced counter-parts to work in schools with more disadvantaged students.
These differences may be influenced by policy. Although advantaged students in Brazil are in general more likely to have greater access to higher quality educational resources and smaller class sizes, enacted reforms have helped increase funding and equalize educational spending across states and municipalities; raised teacher salaries, particu-larly in the poorer northeast of the country; enacted teaching standards; and increased teacher training (Bruns, Evans, & Luque, 2011; OECD, 2013b). All of these strategies help to support teachers and may increase retention in disadvantaged areas. Sweden is seeking to address its current imbalances through the introduction of a career ladder for teachers and enacting reforms that will allow schools in disadvantaged areas to employ a higher proportion of more capable teachers (Stewart, 2014).
To ensure that students from disadvantaged backgrounds have access to the same educational opportunities as other students, countries need to address both the overall issue of teacher supply to avoid shortages and the distribution of teaching experience and quality across schools. This means considering the teaching conditions that pertain across schools, as well as the additional supports or incentives that may be needed to at-tract and retain teachers in those schools serving the highest need students. As we show in the next section, these can include both tangible working conditions and collabora-tive learning and planning time for teachers to build collective capacity (Schleicher, 2014a).
Teaching Conditions
he literature on teacher recruitment and retention has consistently found that sala-ries and occupational reputation are among the key determinants of attractions to teaching, while working conditions and opportunities for professional learning have
the greatest bearing on retention (Darling-Hammond, 2010; Ingersoll & Strong, 2011; Stewart, 2011). In this section we address teachers’ perceptions of how valued their pro-
T

Teaching Around the World: What Can TALIS Tell Us? 11
fession is by the society, as well as the conditions under which they work. In the next section, we take up the question of opportunities for professional learning.
Teaching’s value in society
One of the most surprising findings from TALIS was that on average less than a third of teachers (30.9%) indicated that they “agreed” or “strongly agreed” that the teaching profession was valued in society (OECD, 2014, p. 408 Table 7.2). Teachers were most likely to report their profession is highly valued in Malaysia (83.8% of teachers), fol-lowed by Singapore (67.6%), Abu Dhabi (66.5%), and Korea (66.5%). At the other end of the scale, only 4% of teachers in the Slovak Republic and 5% in France and Swe-den thought their profession was valued. That only 28% of teachers in Japan regarded teaching as valued in society is surprising given the historical cultural tradition of high regard for teachers.
Involvement in professional decision-making is related to teachers’ sense of professional respect. In 29 of 32 jurisdictions analyzed, teachers were more likely to report that the profession was valued in society when they also reported that their school provides staff with opportunities to actively participate in school decisions (OECD, 2014, p. 409 Table 7.3).7 This may be because societies that see teachers as valued professionals com-municate that respect in terms of how they organize schools as well as how they talk about and treat the profession.
7 Regression analyses controlled for the subject(s) taught and content, pedagogy and classroom practice elements of the subject(s) taught included in formal education or training.
Figure 5: Teachers’ salaries and socieTal value For The Teaching proFession.
Source: OECD (2013), Education at a Glance 2013: OECD Indicators, OECD Publishing.http://dx.doi.org/10.1787/eag-2013-en; OECD (2014), Talis 2013 Results: An International Perspective on Teaching and Learning, OECD Publishing. http://dx.doi.org/10.1787/9789264196261-en
FpoAustraliaChile
Czech Republic
DenmarkEstonia
Finland
France
Iceland
Israel
Italy
Korea
Netherlands
Norway
Poland
Portugal
Slovak RepublicSpainSweden
Alberta (Canada)
England (UK)
Flanders (Belgium)
United States
0
10
20
30
40
50
60
70
0.4 0.5 0.6 0.7 0.8 0.9 1 1.1 1.2 1.3 1.4
% o
f tea
cher
s who
thin
k th
at te
achi
ng is
val
ued
Ratio of salary to earnings for full-time, full-year workers with tertiary education aged 25 to 64
Relationship between teachers' perceptions of the teaching profession being valued in society and relative teacher salaries

Stanford Center for Opportunity Policy in Education12
Figure 6: Relationship between lower secondary teachers' views of the value of their profession in society and the country's share of top mathematics performers in PISA 2012
Australia
Brazil
Bulgaria
Chile
Croatia
Czech Republic
Denmark
Estonia Finland
FranceIceland
IsraelItaly
Japan
Korea
Latvia
MalaysiaMexico
Netherlands
Norway
Poland
Portugal
RomaniaSerbia
Singapore
Slovak Republic
SpainSweden
Alberta (Canada)
England (UK)
Flanders (Belgium)
United States
0.0
5.0
10.0
15.0
20.0
25.0
30.0
35.0
40.0
45.0
0.0 10.0 20.0 30.0 40.0 50.0 60.0 70.0 80.0 90.0
Shar
e of
mat
hem
atic
s to
p pe
rfor
mer
s on
PIS
A 2
012
Percentage of teachers who agree that teaching is valued in society
Additionally, using other OECD data, we found that teachers were more likely to report teaching as valued in society where they were better paid relative to other professions.8 (See Figure 5, previous page.)
Moreover, jurisdictions in which teachers reported the profession was more highly val-ued tended to be those with greater proportions of students scoring in the top bands on OECD PISA (Schleicher, 2014b). (See Figure 6.) This may indicate that the combina-tion of investments that accompany social value placed on teaching pay off in terms of school effectiveness.
Tangible working conditions
Tangible working conditions also matter to teachers’ retention and effectiveness. TALIS provides information about such factors as instructional materials, class size, and teacher time.
8 Pearson’s r = .417. Salary data are from Education at a Glance (OECD, 2013a), which does not include all TALIS jurisdictions.
Figure 6: sTudenT achievemenT in maThemaTics in relaTion To perceived value oF The Teaching proFession by socieTy
Source: Schleicher, A. (2014). Results from TALIS: Press briefing. Presented at the U.S. Release of the Teaching and Learn-ing International Survey (TALIS) results, Washington, DC.
Relationship between lower secondary teachers’ views of the value of their profession in society and the country’s share of top mathematics performers in PISA 2012

Teaching Around the World: What Can TALIS Tell Us? 13
Australia
Brazil
Bulgaria
Chile
CroatiaCyprusCzech RepublicDenmark
EstoniaFinland
France
Iceland
Israel
Italy
Japan
Korea
Latvia
MalaysiaMexico
Netherlands
NorwayPoland
PortugalRomaniaSerbia
Singapore
Slovak Republic
Spain
Sweden
Abu Dhabi (UAE)
Alberta (Canada)
England (UK)
Flanders (Belgium)
Average
15
20
25
30
35
40
10 20 30 40 50 60 70 80
Aver
age
clas
s si
ze
% of teachers in schools in which principals report shortage of teachers
The relationship between class size and teacher shortages
Figure 7: The relaTionship beTween class size and The percenTage oF Teachers in schools where The principal reporTed a shorTage oF qualiFied or well-perForming
Teachers hinders The school’s capaciTy To provide qualiTy insTrucTion
Source: OECD (2014), Talis 2013 Results: An International Perspective on Teaching and Learning, OECD Publishing.http://dx.doi.org/10.1787/9789264196261-en
Instructional Resources Adequate material resources are essential to providing a schooling environment con-ducive to effective teaching and learning. TALIS surveyed principals regarding instruc-tional materials (e.g., textbooks). More than a quarter of teachers across TALIS juris-dictions work in schools in which principals reported that a shortage or inadequacy of these materials hinders the school’s capacity to provide quality instruction. Only in Singapore was this rate below 10%. It is concerning that these rates were above 50% in Italy (56.4%) and Estonia (51.1%), and above 75% in the Slovak Republic (82.1%) and Romania (77.1%) where materials shortages appear to be very widespread (OECD, 2014, p. 287 Table 2.19).
Using salary data from another OECD report (OECD, 2013a), we found significant cor-relations between shortages of instructional resources and lower teacher salaries, sug-gesting that these are indicators of broader resource concerns.9
Class size Teachers have traditionally reported that class size is one of the teaching conditions that matters to them in their efforts to meet the needs of their students. This is a context factor that varies considerably across jurisdictions, ranging from only about 17 students
9 Pearson’s r between reported shortages of instructional materials and teacher salaries = -.585.
The relationship between class size and teacher shortages

Stanford Center for Opportunity Policy in Education14
per classroom in some places to more than 30 in others, with an average of 24.1 stu-dents per class.
Interestingly, we found a significant relationship between class sizes and teacher short-ages across countries. Jurisdictions in which principals reported few shortages were also those with smaller average class sizes. (See Figure 7, previous page.) For example, Fin-land (17.8), Iceland (19.6), Denmark (21.2), and Poland (21.4) all had very low rates of shortages along with small class sizes. All of the countries with low rates of shortage (where fewer than 30% of teachers were in schools with problematic shortages) had lower than average class sizes. On the other end of the spectrum, Japan’s high rates of shortage are associated with class sizes above 30, as are those in Mexico and Chile (OECD, 2014, p. 285 Table 2.18).
Class size is certainly not the only variable that matters. It may be one of a number of supportive conditions for teaching that co-occur and make it more probable that teachers will be easier to recruit and retain. For example, as noted above, we found that higher teacher salaries in a jurisdiction are also associated with more plentiful and widely available instructional resources, as measured on the TALIS survey. This suggests that jurisdictions that provide sufficient resources to their schools also pay their teach-ers well, conditions that would improve the overall attractions to teaching.
Teaching and planning time
Teachers’ capacities to do their jobs effectively without burning out have a great deal to do with how their time is structured. TALIS surveyed teachers’ use of time by asking how many hours teachers spent on each of several tasks during the most recent calen-dar week.10 Teachers reported working an average of 38.3 hours a week, ranging from over 50 hours a week in Japan to less than 30 hours in Chile and Italy. Equally important is how much time teachers work directly with students in relation to the time they have for planning, collaborating with their colleagues, grading papers, and meeting one-on-one with students or parents. On average, teachers taught classes an average of 19 hours per week, but teachers in the United States taught 40% more, at an average of 27 hours a week, while teachers in Norway taught only about 15 hours per week (OECD, 2014, p. 387 Table 6.12). (See Figure 8, following page.)
The majority of teachers’ working week is spent in instructional time (teaching), fol-lowed by lesson planning, grading students’ work, and general administrative tasks. Teamwork and dialogue with colleagues are comparatively less common, averaging just 2.9 hours per week. The largest number of weekly hours spent in teamwork is in Ma-
10 These data include both part- and full-time teachers.

Teaching Around the World: What Can TALIS Tell Us? 15
Figure 8: Number of weekly instruc.onal hours in TALIS jurisdic.ons.
27
19
15
0 5 10 15 20 25 30
United States Chile
Alberta (Canada) Brazil
Mexico Abu Dhabi (UAE)
Estonia Portugal Finland
Slovak Republic England (UK)
Croa.a Average
Latvia Flanders (Belgium)
Iceland Denmark
Korea Spain
Poland France
Australia Bulgaria
Serbia Israel
Czech Republic Japan
Sweden Italy
Singapore Malaysia
Netherlands Cyprus
Romania Norway
Hours spent on teaching Figure 8: number oF weekly insTrucTional hours in Talis jurisdicTions
Source: OECD (2014), Talis 2013 Results: An International Perspective on Teaching and Learning, OECD Publishing.http://dx.doi.org/10.1787/9789264196261-en
laysia (4.1 hours), while the fewest is in France (1.9 hours) (OECD, 2014, pp. 387–388 Table 6.12). (See Figure 9, following page.)
This time is important to teachers. We found that collaborative time is significantly re-lated both to teachers’ views that the “advantages outweigh the disadvantages” of teach-ing — an indicator of job satisfaction11 — and to teachers’ views that their profession is valued in society.12 We explore this significant aspect of teachers’ working conditions further in the next section, as part of the professional climate in schools.
Finally, high-quality teaching relies on planning — preferably with other teachers so that best practices are shared and the curriculum is more coherent across classrooms. A greater number of teaching hours typically meant less preparation time for each lesson. Teachers in jurisdictions reporting higher average weekly teaching hours showed sig-nificantly lower ratios of planning to teaching time.13 This ratio varied from an average
11 Pearson’s r = .354.
12 Pearson’s r = .361.
13 Pearson’s r = -.60.
Hours spent on teaching
11 Pearson’s r = .354.12 Pearson’s r = .361.13 Pearson’s r = -.60.

Stanford Center for Opportunity Policy in Education16
Figure 9: Number of weekly teamwork hours in TALIS jurisdic.ons.
1.9
2.9
4.1
0.0 0.5 1.0 1.5 2.0 2.5 3.0 3.5 4.0 4.5
France Estonia Finland Croa.a
Flanders (Belgium) Poland
Czech Republic Latvia
Slovak Republic Serbia
Mexico Bulgaria
Romania Spain
Cyprus Israel Chile
Average United States
Alberta (Canada) Netherlands
Italy Norway
Korea Iceland
England (UK) Brazil
Denmark Sweden
Australia Singapore
Portugal Abu Dhabi (UAE)
Japan Malaysia
Hours spent on team work and dialogue with colleagues within the school
of 30 minutes of preparation time per teaching hour in Croatia to 13 minutes in Chile.14 (See Figure 10, following page.)
Professional climate in schools
Principals in TALIS jurisdictions reported a positive professional climate in schools. An average of at least 90% of teachers worked in schools in which principals “agreed” or “strongly agreed” that there was a mutual respect for colleagues’ ideas, a culture of shar-ing success was present, and school staff discuss difficulties openly. In no country was this rate below 75%. A further 87.1% of teachers worked in schools in which principals reported that school staff share a common set of beliefs about schooling/learning. Principals were also surveyed as to whether there was a high degree of cooperation between the school and community. An average of 75% of teachers worked in schools in which principals reported strong cooperation. However, the much lower rates observed in Denmark (45.6%), Norway (40.8%), Sweden (33.5%), and the Netherlands (21.2%) may be cause for concern. Three of these countries — Denmark, Norway, and Sweden — also have below average levels of teachers feeling that their profession is valued in society.
14 Note that the TALIS data include reporting on time use from both full- and part-time teachers (OECD, 2014, p. 162).
Figure 9: number oF weekly Teamwork hours in Talis jurisdicTions
Source: OECD (2014), Talis 2013 Results: An International Perspective on Teaching and Learning, OECD Publishing.http://dx.doi.org/10.1787/9789264196261-en

Teaching Around the World: What Can TALIS Tell Us? 17
Figure 10: Planning minutes per teaching hour
13
22
30
0 5 10 15 20 25 30 35
Chile Finland
United States Mexico
Brazil Israel
Alberta (Canada) Italy
Poland Netherlands
Flanders (Belgium) Estonia Latvia Spain
Abu Dhabi (UAE) Average Malaysia
Slovak Republic Iceland Sweden
Australia England (UK)
France Portugal
Korea Denmark
Serbia Norway Bulgaria Cyprus
Czech Republic Singapore
Japan Romania CroaQa
Planning mins per teaching hour
There were differences in the degree to which principals and teachers reported that a positive professional climate manifests in collaborative and mutually supportive school cultures, with more variability in the conditions teachers reported experiencing across jurisdictions.
For example, across TALIS jurisdictions, both principals and teachers generally agreed there existed “a collaborative school culture characterized by mutual support.” How-ever, while 95% of principals agreed with this statement (with responses ranging from 100% in Norway to 83.1% in France), the average for teachers was 79%, ranging from 92.9% of teachers in Norway to 65.5% of teachers in England.
Teachers were significantly more likely to indicate the existence of a collaborative school culture in jurisdictions in which they also reported that staff had opportunities to participate in decision-making, suggesting a positive association between distributed leadership and a collaborative school climate.15 However, teachers and principals dif-fered in the extent to which they perceived opportunities for staff decision-making (see Figure 11, following page), and there was no association between principals’ reporting of staff opportunities for decision-making and teachers’ perceptions that they experi-enced a collaborative culture.
15 Pearson’s r = .637
Figure 10: planning minuTes per Teaching hour in Talis jurisdicTions
Source: OECD (2014), Talis 2013 Results: An International Perspective on Teaching and Learning, OECD Publishing.http://dx.doi.org/10.1787/9789264196261-en

Stanford Center for Opportunity Policy in Education18
On average, 98% of principals in each jurisdiction agreed or strongly agreed that teach-ers had opportunities to actively participate in school decisions, compared with 74% of teachers, an average difference of 24 percentage points. The greatest differences were found in Korea, Mexico and, especially, England, where the average response from teachers was below 60%, and principals’ and teachers’ responses were apart by 39.4 percentage points.
TALIS data showed that principals’ leadership style is related to the professional work-ing climate for teachers. Using regression analyses, the TALIS report showed that prin-cipals’ use of distributed leadership was positively associated with a school climate of mutual respect in 23 of the 32 jurisdictions analyzed (OECD, 2014, p. 304 Table 3.7).
Teacher collaboration
Analysis of the TALIS data confirms previous research which shows that teachers place significant value on collaborative practices and their relationships with their colleagues when they consider their teaching environment (Day, Sammons, Stobart, & Kington, 2007; Skaalvik & Skaalvik, 2011). Collaboration is linked to increased teacher self-efficacy and job satisfaction, topics discussed in further detail in a later section. Other research shows that teacher peer learning also has a positive impact on student learning outcomes, with greater effects in the case of beginning teachers (Jackson & Bruegmann, 2009).
TALIS surveyed the kinds of collaborative activities in which teachers engaged, differ-entiating in particular between two different forms of teacher cooperation — exchange and coordination, and professional collaboration. The former refers to the exchang-ing of educational materials, engaging in discussion about the learning development
Figure 11: disTribuTed leadership: sTaFF opporTuniTies To parTicipaTe in decision-making.
Source: OECD (2014), Talis 2013 Results: An International Perspective on Teaching and Learning, OECD Publishing.http://dx.doi.org/10.1787/9789264196261-en
Fpo
Figure 11: Distributed leadership—staff opportuni.es to par.cipate in decision-‐making
0
10
20
30
40
50
60
70
80
90
100
The school provides staff with opportuni.es to ac.vely par.cipate in school decisions
Teachers Difference between principals' and teachers' responses

Teaching Around the World: What Can TALIS Tell Us? 19
of students, working with other teachers to ensure common standards, and attending team conferences. The latter refers to activities that are understood to “emphasize the exchange of ideas at a deeper level” (OECD, 2014, p. 166): joint teaching in the same class, observing others’ classes and providing feedback, engaging in joint activities across classes and grades, and collaborative professional learning.
An average of over 80% of teachers have engaged in some form of collaborative profes-sional learning, with 62.8% reporting they had done so at least twice in the previous 12 months (OECD, 2014, Table 6.15 Web). However, the data showed that this was much less common in several jurisdictions, with over 40% of teachers in Finland, the Slovak Republic, and Flanders indicating they had not engaged in such activities.
In some countries, opportunities for collaborative engagement were commonplace. More than 80% of teachers in Japan reported observing other teachers’ classes and pro-viding feedback at least twice a year, and over 50% of teachers in each of Mexico, the Slovak Republic, Denmark, Italy, and Japan reported teaching jointly in the same class at least five times a year.
However, an average of 45% of teachers report never observing another teacher’s class — a proportion that exceeds three quarters in five jurisdictions (Brazil, France, Iceland, Flanders, and Spain) (OECD, 2014, p. 167 Figure 6.10). Similarly, 42% reported never teaching jointly as a team in the same class. This indicates that in many countries, a sig-nificant proportion of teachers still teach largely in isolation and may be missing out on
Source: OECD (2014), Talis 2013 Results: An International Perspective on Teaching and Learning, OECD Publishing.http://dx.doi.org/10.1787/9789264196261-en
Figure 12: proporTion oF Teachers who reporTed never engaging in joinT Teaching or peer observaTion.
Figure 12: Collabora.ve prac.ces: never engaged in joint teaching or peer observa.on
0
10
20
30
40
50
60
70
80
90
100
Never observe other teachers' classes and provide feedback Never teach jointly as a team in the same class

Stanford Center for Opportunity Policy in Education20
Figure 13: Frequency oF collaboraTive proFessional learning acTiviTies.
Fpo
valuable opportunities to collaborate, receive feedback, and learn from their colleagues. (See Figure 12, previous page.)
Collaborative professional learning was most frequent in Abu Dhabi and Israel. Over half of teachers in these jurisdictions, as well as the United States, Australia, Alberta, England, and Singapore, took part in collaborative professional learning activities at least five times a year. (See Figure 13.) Exploring these experiences further, it would be helpful to know how frequently teachers (a) have the time to collaborate with their col-leagues around curriculum planning, meeting the needs of students, school-wide prob-lem solving, and professional learning; (b) when and how that time is made available; and (c) what benefits teachers have found to be associated with these different kinds of opportunities, when they are available.
Part of the reason teacher collaboration is so valued is that it enhances teachers’ knowl-edge, skills, and efficacy, which in turn makes teaching less stressful and more satis-fying. In the next section, we examine other opportunities for professional learning experienced by teachers in different nations and how these influence teachers’ satisfac-tion and efficacy.
Teacher Preparation and Development
s we have noted, teachers’ opportunities to learn in pre-service preparation and through induction programs have been found to be strongly associated with teacher retention in the profession (Ingersoll & Strong, 2011; Darling-Ham-mond, 2010). In addition, when they are well designed, pre- and in-service ed-
ucation can have strong influences on teachers’ effectiveness (Boyd et al., 2009; Darling-
Figure 13: Frequency of collabora.ve professional learning
0 10 20 30 40 50 60 70 80 90 100
France Slovak Republic
Flanders (Belgium) Finland
Japan Croa.a Poland Korea
Portugal Latvia
Netherlands Cyprus
Denmark Italy
Serbia Malaysia Norway Sweden
Romania Estonia
Bulgaria Average
Brazil Iceland
Spain Mexico
Czech Republic Chile
England (UK) Alberta (Canada)
United States Australia
Singapore Israel
Abu Dhabi (UAE)
Never Once a year or less 2-‐4 .mes a year 5-‐10 .mes a year 1-‐3 .mes a month Once a week or more
Source: OECD (2014), Talis 2013 Results: An International Perspective on Teaching and Learning, OECD Publishing.http://dx.doi.org/10.1787/9789264196261-en
A

Teaching Around the World: What Can TALIS Tell Us? 21
Australia
Brazil
Bulgaria
Chile
Croatia
Cyprus
Czech Republic Denmark
EstoniaFinland
France Iceland
Israel
Italy
Japan
Korea
Latvia
MalaysiaMexico
Netherlands
Norway
Poland
Portugal
RomaniaSerbia
Singapore
Slovak Republic SpainSweden
Alberta (Canada)England (UK)
Flanders (Belgium)
350
400
450
500
550
600
60 65 70 75 80 85 90 95 100
PISA
201
2 M
athe
mat
ics
Percentage of teachers who completed teacher education programs
Relationship between PISA 2012 Mathematics 2012 and proportion of trained teachers
Source: OECD (2014), Talis 2013 Results: An International Perspective on Teaching and Learning, OECD Publishing.http://dx.doi.org/10.1787/9789264196261-en; OECD (2014), PISA 2012 Results: What Students Know and Can Do — Student Performance in Mathematics, Reading and Science (Volume I, Revised edition, February 2014), PISA, OECD Publishing. http://dx.doi.org/10.1787/9789264201118-en
Hammond, 2010; Wei, Darling-Hammond, Andree, Richardson, & Orphanos, 2009). Of course, effectiveness and retention are related, since teachers are more likely to stay in the profession when they feel they can be successful in promoting student learning.
TALIS provides some important information on these opportunities. There are also areas where future studies could seek to uncover more of the specific elements of teachers’ experiences that matter for their learning and efficacy.
Teacher preparation
Across TALIS jurisdictions, the proportion of teachers who have completed a teacher education or training program is very high. On average, 89.8% of teachers have com-pleted preparation, with rates above 80% in 29 of 34 jurisdictions. The lowest rate of completion was in Mexico, where just 61.5% of teachers reported having completed teacher training. We found that rates of teacher training are associated with higher lev-els of student achievement at the jurisdiction level.16 (See Figure 14.)
Content, pedagogy, and practice
Although most teachers have completed a preparation program, the content of these programs varies noticeably across jurisdictions. Many fewer teachers have had training in content, pedagogy, and supervised practice for the areas they teach.
16 Pearson’s r = .480.
Figure 14: relaTionship beTween Teacher preparaTion and sTudenT achievemenT.

Stanford Center for Opportunity Policy in Education22
Figure 15: Percentage of teachers whose formal training did not include classroom prac.ce in the subject(s) they teach.
1.6
10.9
52.2
0
10
20
30
40
50
60
Received no classroom prac.ce as part of teacher training
An average of 72.5% of teachers indicated that they received content training, and 69.6% received training in pedagogy, for all the subjects they teach. An average of 67.1% of teachers indicated they had experienced classroom practice as part of teacher training for all of the subjects they now teach.
However, only 57% had received training in content, pedagogy, and practice for all the subjects they teach as part of their formal teacher training. This proportion ranged from over 80% in Poland, Croatia, and Bulgaria, to less than 40% in Alberta, Norway, Spain, and Italy.
In some jurisdictions, rates of clinical preparation are much lower than the mean. More than 50% of teachers from Italy indicated having received no classroom practice in the subject that they teach as part of their teacher training program, and 15.5% having re-ceived no training in pedagogy in that subject. (See Figure 15.)
In studies of the effects of teacher preparation, several features of preparation appear to be related to teachers’ later effectiveness. These include adequate preparation in the content to be taught, along with specific coursework in content pedagogy, carefully planned and implemented student teaching, and connections between coursework and clinical work — for example, specific study of curriculum development and courses that provide tools and strategies that candidates can try out in the classroom during their clinical experiences (Boyd, Grossman, et al., 2009; Darling-Hammond, Hammer-ness, et al., 2005). Programs that are missing one or more of these elements are unlikely to be as effective as those that incorporate all of these components.
Figure 15: percenTage oF Teachers whose Formal Training did noT include classroom pracTice in The subjecT(s) They Teach.
Source: OECD (2014), Talis 2013 Results: An International Perspective on Teaching and Learning, OECD Publishing.http://dx.doi.org/10.1787/9789264196261-en

Teaching Around the World: What Can TALIS Tell Us? 23
Teachers’ feelings of preparednessTeachers in TALIS jurisdictions generally reported feeling well prepared for the subjects they teach. An average of 93% of teachers reported feeling well prepared in terms of the content they teach, and 89% felt well prepared in terms of the pedagogy (OECD, 2014, p. 37). However, more than 20 percent of teachers in Finland, France, Iceland, Japan, Korea, Mexico, and Singapore felt poorly prepared in terms of their practice in the sub-jects they taught (OECD, 2014, p. 265 Table 2.4).
These findings are surprising given that countries such as Finland, Japan, and Singa-pore are well regarded for the rigor of their pre-service teacher education (Darling-Hammond, Wei, & Andree, 2010; Sahlberg, 2012; Stewart, 2012). It will take additional research to find out whether this is related to differentials in the preparation teachers can access or in part because, when standards are high, teachers have higher standards about how much more they would like to know.
Not surprisingly, teachers tended to feel more prepared in terms of the content, peda-gogy, and practice of the subjects they teach when they had received formal training in these domains. Regression analyses in TALIS showed that teachers were more likely to feel prepared having received training in content, pedagogy, and practice in all, rather than some, of the subjects they presently teach (OECD, 2014, p. 266 Table 2.5). In ad-dition, there was a statistically significant correlation between jurisdictions in which teachers reported higher feelings of preparedness and those in which teachers reported greater satisfaction with their job performance, and greater feelings of self-efficacy, particularly their ability to use a variety of assessment strategies, to provide alternative explanations to students, and to help students think critically.17
Other research underscores that teachers tend to feel better prepared and more effica-cious when they have had higher quality preparation and induction (Boyd et al., 2009; Darling-Hammond, Chung, & Frelow, 2002; Ingersoll & Strong, 2011), and that feel-ings of self-efficacy are related to teachers’ measured effectiveness in promoting student learning gains. We address this research on self-efficacy in the last section of this report.
Induction programs
The literature on teacher induction programs indicates potential positive benefits for teacher retention and student achievement (Ingersoll & Strong, 2011). In TALIS, induc-tion programs were defined as “a range of structured activities at a school to support teachers’ introduction into the school (or into the teaching profession for new teach-ers)” (OECD 2014, 88).
Despite its well-established benefits, induction for beginning teachers is not routinely available across jurisdictions. About two thirds of teachers (65.8%) worked in schools
17 Pearson’s correlation coefficients ranged from r = .397 to r = .593.

Stanford Center for Opportunity Policy in Education24
Figure 16: Access to formal and informal induc.on programs (reproduced from (OECD, 2014b, p. 89 Figure 4.2).
100 80 60 40 20 0 20 40 60 80 100
Singapore
Malaysia
Flanders (Belgium)
Croa.a
Italy
Alberta (Canada)
Slovak Republic
Korea
France
Sweden
Norway
Finland
Estonia
Czech Republic
Mexico
Spain
Portugal
Formal induc.on accessible for all new teachers to the school
Formal induc.on accessible only for teachers new to teaching
Access to informal induc.on ac.vi.es (not part of an induc.on programme) for new teachers
Percentage of teachers whose school principal reports the existence of formal and informal induc.on programmes
where principals reported access to formal induction programs for teachers new to the profession (OECD, 2014, p. 89 Figure 4.2). However, the range in access is wide: In Singapore, England, Malaysia, and Australia, over 95% of teachers worked in schools with access to formal induction programs. At the other end of the scale, less than a quarter of teachers had such access in Spain, Poland, and Portugal. (See Figure 16.)
Informal induction activities may also provide supports for new teachers, particularly where formal induction programs may be less common. Across jurisdictions, an aver-age of 76.5% of teachers work in schools with informal induction activities that are not included as part of a formal program, and 85.7% have access to general and/or adminis-trative introduction to the school. However, we know little from the TALIS results about what these activities may provide for new teachers.
Of special concern though are jurisdictions in which formal induction programs are not supplemented by informal induction activities. In Spain, Brazil, and Mexico, low rates of access to formal induction programs (below 25%) are paired with rates of access
Figure 16: access To Formal and inFormal inducTion programs
Reproduced from OECD (2014), Talis 2013 Results: An International Perspective on Teaching and Learning, OECD Pub-lishing. http://dx.doi.org/10.1787/9789264196261-en, p. 89, Figure 4.2.

Teaching Around the World: What Can TALIS Tell Us? 25
to informal induction activities below 55% (OECD, 2014, p. 329 Table 4.1). This may indicate the absence of support for a significant proportion of new teachers in these jurisdictions.
An important finding from TALIS is the difference in access to induction programs reported by principals, and the levels of participation in induction programs reported by teachers. On average, 52% of teachers with less than three years of experience at their present school reported having participated in formal induction programs, while 70% of principals reported their availability.18 Differences of greater than 30 percentage points between availability and participation were noted for Finland, France, Japan, Serbia,and the Slovak Republic (OECD, 2014, Table 4.28.Web).
There are several possibilities as to why such differences might exist. It is of course pos-sible that some teachers may simply choose not to participate in induction programs despite their availability. However, if the programs include mentoring — the most im-portant factor for induction — this is unlikely, since new teachers routinely report their appreciation for mentoring when it is available.
It is not unusual for policies to be unevenly implemented across schools. Thus, even where formal induction programs have been created by a jurisdiction, they may not be well implemented in all schools, especially if specific funding and structures are not available to ensure, for example, that mentors have been selected and given time to sup-port beginners, or that other aspects of the program (seminars, joint planning time) are made available in a school. Other school pressures, heavy teaching workloads, schedul-ing conflicts, and the absence of resources can all act as potential barriers to participa-tion. This may particularly be the case where induction involves mentoring, peer ob-servation, or team teaching where funds may be needed for release time and substitute teachers.
Participation in induction programs can also be influenced by teachers’ status as full- or part-time, or their contract status. As we noted earlier, in some jurisdictions, many teachers — especially beginners — are on short-term contracts. In some cases, these teachers are not eligible for formal induction programs that are made available to longer term employees.
Teacher professional development
Participation in professional developmentThe TALIS data tell us that a large majority of teachers participate in some form of pro-fessional development during the course of a year. However, the data tell us much less about the nature, intensity, and quality of that professional development.
18 As principals were reporting on the present availability of induction programs, and teachers about their participa-tion when they were new teachers, the TALIS report looked only at those who participated in the past three years.

Stanford Center for Opportunity Policy in Education26
On average, 88% of teachers indicated that they had taken part in professional devel-opment during the past 12 months, a figure consistent with findings from TALIS 2008 (OECD, 2014, p. 97). There was some variation among countries, with rates above 95% in nine jurisdictions — Australia, Croatia, Latvia, Malaysia, Mexico, Singapore, Abu Dhabi, Alberta, and the United States — and below 80% in five — Finland, France, Italy, the Slovak Republic, and Chile. Courses and workshops were by far the most com-mon form of professional development (70.9% of teachers), followed by conferences and seminar (43.6%), and participation in a professional development network (36.9%).The data also show that the extent of support for professional development, both finan-cial and non-monetary, varies greatly across TALIS jurisdictions. While about two thirds (66.1%) of teachers indicated they did not have to pay for any of the professional devel-opment undertaken during the previous 12 months, this ranged from 92.7% of teachers in England to just 25.2% in Korea. Similarly, the proportion of teachers who received scheduled time for professional development activities during working hours ranged from 88.0% in Malaysia to 15.1% in Portugal, with an average of 54.5% across all juris-dictions (OECD, 2014, p. 345 Table 4.11).
The extent to which supports are available to teachers for professional development activities and relevancy of professional development activities to teachers’ work were shown in TALIS to be related to the level of participation. The most commonly reported barrier to participation in professional development was conflict with teachers’ work-ing schedules, reported by just over half of TALIS teachers (OECD, 2014, p. 353 Table 4.14). TALIS data show that participation rates tended to be higher in jurisdictions in which greater proportions of teachers reported receiving scheduled time for activities that took place during regular working hours19. A significant proportion of teachers (39.0%) also reported that their participation was inhibited by a lack of relevant professional development offered. These data suggest that administrators and school leaders may be able to increase uptake of professional development activities by seeing that they meet teachers’ and the school’s needs and are scheduled into work time when possible.
Intensity and impact of professional developmentTeachers in TALIS generally reported that professional development activities impacted their teaching. In each of the 14 content areas surveyed in TALIS, an average of at least three quarters of teachers who participated in specific kinds of professional develop-ment reported that it had a moderate or large impact on their teaching (OECD, 2014, pp. 342–344 Table 4.10). In each case, a plurality of teachers designated the impact as “moderate,” rather than “large.” (See Figure 17, following page.)
These data do not reveal, however, whether the impact of professional development varied based on how it was designed and conducted. An extensive research literature shows that professional development is most effective in improving teachers’ instruc-tional practice and contributing to student learning when it is continuous and sus-
19 Pearson’s r = .435

Teaching Around the World: What Can TALIS Tell Us? 27
Figure 17: Content and posi.ve impact of professional development ac.vi.es (reproduced from (OECD, 2014b, p. 106 Figure 4.12))
0 10 20 30 40 50 60 70 80
Teaching in a mul.cultural or mul.lingual selng School management and administra.on
Approaches to developing cross-‐occupa.onal competencies for future work Student career guidance and counselling
Teaching students with special needs Teaching cross-‐curricular skills (e.g. problem solving, learning-‐to-‐learn)
New technologies in the workplace Approaches to individual learning
Student behaviour and classroom management ICT skills for teaching
Knowledge of the curriculum Student evalua.on and assessment prac.ces
Pedagogical competencies in teaching subject field(s) Knowledge and understanding of subject field(s)
Percentage of teachers who par.cipated in professional development ac.vi.es
Content and posi.ve impact of professional development ac.vi.es
No
Small
Moderate
Large
tained, is closely connected to the work of teachers in the classroom, fosters teacher professional collaboration, and coherently relates to broader school reform efforts (Wei, Darling-Hammond, et al., 2009; Darling-Hammond & Richardson, 2009; Garet, Porter, Desimone, Birman, & Yoon, 2001; Elmore & Burney, 1997).
The extent of participation in professional development alone is therefore not sufficient to determine its effectiveness. For example, evidence from the United States’ Schools and Staffing Surveys (SASS) showed that, over the course of a decade when the federal No Child Left Behind statute was in effect, the percentage of teachers engaged in profes-sional development grew, but that growth was in the form of more 1-day workshops, while participation in more sustained and extended professional learning declined in nearly all domains. The extent to which teachers found the professional development useful was significantly related to how extensive and sustained that experience had been. This is not surprising given the already-established relationship between sus-tained professional development and improvements in teacher practice and student learning (Darling-Hammond, Wei, Adamson, & Orphanos, 2010).
TALIS analyses found that teachers’ participation in collaborative forms of professional development was associated with collaborative practices within schools. Regression analyses in TALIS showed that professional collaboration was statistically significantly and positively related with each of the following professional development activities: mentoring and/or peer observation and coaching (31 jurisdictions), individual or col-laborative research on a topic of professional interest (30 jurisdictions), and participa-tion in a network of teachers formed specifically for the professional development of teachers (26 jurisdictions) (OECD, 2014, p. 396 Table 6.16).20 This suggests that if
20 The professional collaboration index is comprised of responses to questions regarding joint teaching, observing other teachers’ classes and providing feedback, engaging in joint activities across different classes and age groups, and participating in collaborative professional learning. The regression analyses controlled for “teacher gender, years of experience, highest level of education and subject taught in the target class.” (OECD, 2014, p. 398 Table 6.16)
Figure 17: conTenT and posiTive impacT oF proFessional developmenT acTiviTies
Reproduced from OECD (2014), Talis 2013 Results: An International Perspective on Teaching and Learning, OECD Pub-lishing. http://dx.doi.org/10.1787/9789264196261-en, p. 106, Figure 4.12

Stanford Center for Opportunity Policy in Education28
professional collaborative practices are desirable behaviors to inculcate in teachers, then collaborative professional learning opportunities for teachers may be helpful in doing so. As the report noted:
Mentoring or coaching and participation in teacher networks are found to be consistently positive predictors across countries for co-operation behaviours, outcomes that are consistent with findings from the first cycle of TALIS (OECD, 2009). These findings suggest that participation in collaborative forms of professional development may help promote further collaborative behaviour in teachers. If policy makers want to pro-mote professional collaboration, these types of professional development activities, which are associated with this outcome, could be the focus of future policy efforts. (OECD, 2014, p. 168)
However, TALIS also identified a number of areas in which teachers’ professional devel-opment needs were not being met. Teachers reported having a high level of professional need in teaching students with special needs, 22% on average across jurisdictions.21 Teachers who had completed a teacher training program were significantly less likely to say that they felt a need for professional development in this area, suggesting that pre-service preparation can make a difference in teachers’ feelings of preparedness for teaching a wide range of students.22
Despite the self-identified needs, less than a third of teachers indicated they had un-dertaken professional development focusing on teaching students with special needs in the past 12 months, one of the lowest levels of participation among the 14 professional development activities surveyed. This likely indicates the fact that few jurisdictions are organizing enough professional development in this area.
Other areas of high professional development needs were ICT skills for teaching (19%), new technologies in the workplace (18%), student behavior and classroom management (13%), and teaching in a multicultural or multilingual setting (12%).
Teaching Practices
he TALIS data provide some information on teachers’ self-reported practices, survey-ing teachers about their classrooms, their views about different approaches to teach-ing, and the types of teaching practices they employ.
21 Defined as students who are “mentally, physically, or emotionally disadvantaged.” (OECD, 2014, pp. 346–347 Table 4.12)
22 There is a strong negative correlation between completion of a teacher training program and high need for profes-sional development for teaching special needs students (r = -.565).
T
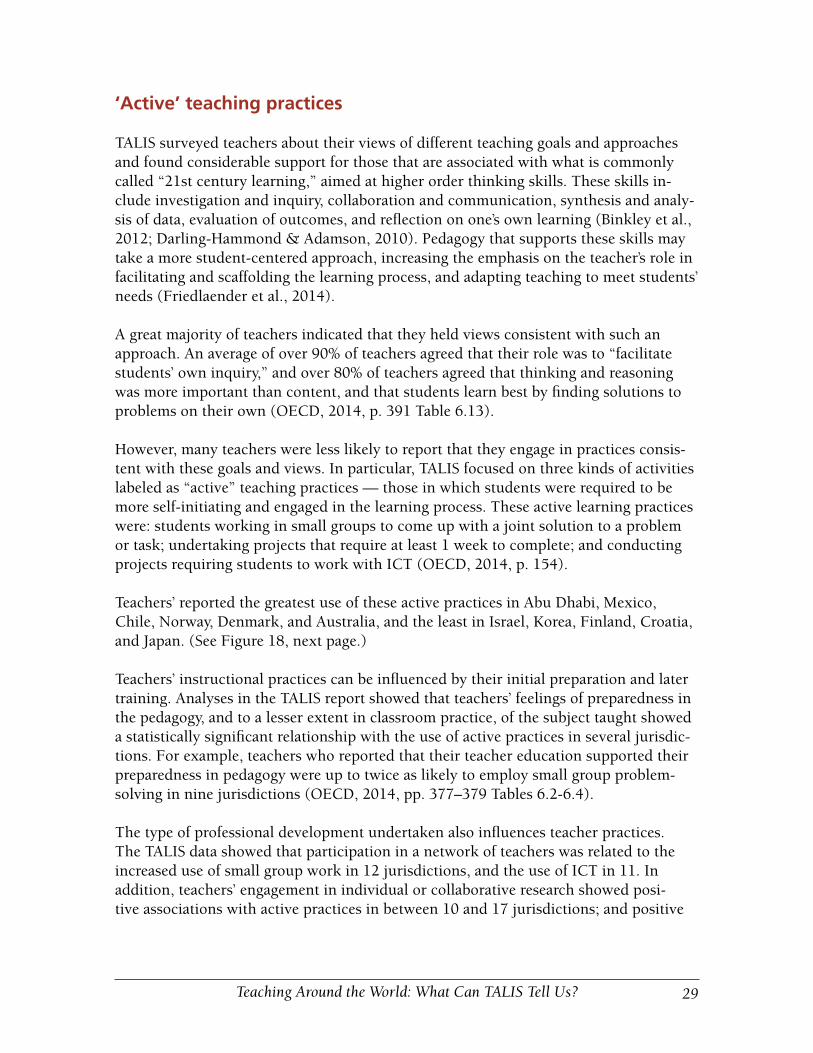
Teaching Around the World: What Can TALIS Tell Us? 29
‘Active’ teaching practices
TALIS surveyed teachers about their views of different teaching goals and approaches and found considerable support for those that are associated with what is commonly called “21st century learning,” aimed at higher order thinking skills. These skills in-clude investigation and inquiry, collaboration and communication, synthesis and analy-sis of data, evaluation of outcomes, and reflection on one’s own learning (Binkley et al., 2012; Darling-Hammond & Adamson, 2010). Pedagogy that supports these skills may take a more student-centered approach, increasing the emphasis on the teacher’s role in facilitating and scaffolding the learning process, and adapting teaching to meet students’ needs (Friedlaender et al., 2014).
A great majority of teachers indicated that they held views consistent with such an approach. An average of over 90% of teachers agreed that their role was to “facilitate students’ own inquiry,” and over 80% of teachers agreed that thinking and reasoning was more important than content, and that students learn best by finding solutions to problems on their own (OECD, 2014, p. 391 Table 6.13).
However, many teachers were less likely to report that they engage in practices consis-tent with these goals and views. In particular, TALIS focused on three kinds of activities labeled as “active” teaching practices — those in which students were required to be more self-initiating and engaged in the learning process. These active learning practices were: students working in small groups to come up with a joint solution to a problem or task; undertaking projects that require at least 1 week to complete; and conducting projects requiring students to work with ICT (OECD, 2014, p. 154).
Teachers’ reported the greatest use of these active practices in Abu Dhabi, Mexico, Chile, Norway, Denmark, and Australia, and the least in Israel, Korea, Finland, Croatia, and Japan. (See Figure 18, next page.)
Teachers’ instructional practices can be influenced by their initial preparation and later training. Analyses in the TALIS report showed that teachers’ feelings of preparedness in the pedagogy, and to a lesser extent in classroom practice, of the subject taught showed a statistically significant relationship with the use of active practices in several jurisdic-tions. For example, teachers who reported that their teacher education supported their preparedness in pedagogy were up to twice as likely to employ small group problem-solving in nine jurisdictions (OECD, 2014, pp. 377–379 Tables 6.2-6.4).
The type of professional development undertaken also influences teacher practices. The TALIS data showed that participation in a network of teachers was related to the increased use of small group work in 12 jurisdictions, and the use of ICT in 11. In addition, teachers’ engagement in individual or collaborative research showed posi-tive associations with active practices in between 10 and 17 jurisdictions; and positive

Stanford Center for Opportunity Policy in Education30
Figure 18: Teacher prac.ces by country: lower secondary teachers who reported using the following prac.ces “frequently” or “in nearly all lessons” (reproduced from (OECD, 2014b, p. 155 Figure 6.3).
0
10
20
30
40
50
60
70
80
90
100
Abu Dhabi (U
nited Arab
Emirates) M
exico
Chile
Norway
Denmark
Australia
Alberta (Canada)
Brazil
England (United Kingdom)
Sweden
Malaysia
Average
Netherlands
Slovak Republic
Portugal
Romania
Bulgaria
Iceland
Spain
Poland
Italy
Latvia
Singapore
Czech Republic
France
Estonia
Flanders (B
elgium
)
Serbia
Israel
Korea
Finland
CroaJa
Japan
Small Groups
ICT
Projects longer than 1 week
%
Cumula.ve percentage of the three teaching prac.ces is above
100%
Cumula.ve percentage of the three teaching
prac.ces is above 150%
Cumula.ve percentage of the three teaching prac.ces is below
100%
relationships were found in at least seven jurisdictions for observation visits to other schools (OECD, 2014, pp. 380–382 Tables 6.5–6.7). Positive associations were also found in several jurisdictions for mentorship and/or peer observation and coaching with the use of active teaching practices.
These forms of professional development also showed relatively large effects sizes in several jurisdictions. For example, teachers in Chile who participated in observation visits to other schools were 90% more likely to use projects of at least 1 week in length with their students, while teachers in Finland who engaged in individual or collabora-tive research were twice as likely to employ small group practices in their teaching.
Together these data indicate that in many jurisdictions teachers are more likely to em-ploy active teaching practices when they have had more training in pedagogy, greater exposure to others’ teaching, or received mentorship and feedback from peers on their own teaching. The findings suggest that fostering mentorship practices — both pre-ser-vice and in-service — as well as making time for participation in teacher collaborative practices and professional learning opportunities, may support the greater use of active teaching practices.
Practices in classroom context
Teaching practices are also influenced by other factors such as the subject matter and classroom context. Analyses in TALIS showed that, in nearly every jurisdiction, math-ematics and science teachers were less likely than their counterparts to incorporate ac-tive practices into their teaching. Exceptions were Abu Dhabi and Iceland, where math-ematics and science teachers were more likely to incorporate the use of small groups
Figure 18: Teacher pracTices by counTry: lower secondary Teachers who reporTed using The Following pracTices “FrequenTly” or “in nearly all lessons”
Source: Reproduced from OECD (2014), Talis 2013 Results: An International Perspective on Teaching and Learning, OECD Publishing. http://dx.doi.org/10.1787/9789264196261-en, p. 155, Figure 6.3.

Teaching Around the World: What Can TALIS Tell Us? 31
to achieve a joint solution, and Denmark and Norway, where teachers of these subjects were more likely to use ICT for projects or class work.
School and classroom factors can have an important influence on teachers’ practices. Overall teachers in TALIS reported positive school working environments. Over 95% of teachers and over 98% of principals agreed or strongly agreed that relations between teachers and students were generally good, with little variation across jurisdictions. On average, greater than 70% of teachers reported that students in their class took care to create a pleasant atmosphere. A positive classroom climate, without significant amounts of student disruption, was associated with a modest but significant increased likelihood of the use of active teaching practices in nearly all jurisdictions.
Use of student assessment
TALIS data showed that teachers use many forms of student assessment to support their students’ learning (OECD, 2014, p. 161). They appear to understand that multiple as-sessment methods can build a more complete picture of students’ capabilities, and avoid distortions associated with heavy usage of a single method (OECD, 2013d).
The TALIS data show that the most commonly used form of student assessment was ob-serving students in class and providing them with immediate feedback, used frequently by 80% of teachers. This was not the case in Japan and Korea, however, where fewer than half of teachers used this method frequently (OECD, 2014, p. 386 Table 6.11). Whether this difference is related to these countries’ large class sizes or other aspects of curriculum or instructional policies is not clear from these data.
Teachers also developed their own assessment tools, provided written feedback on student work, and had students answer questions in front of class. There is consider-able variation among jurisdictions in the use of each of these methods. For example, the extent to which teachers develop their own assessments varies from 93.4% in Brazil to 29.1% in Japan; the use of written feedback ranges from 82.0% in Abu Dhabi to 22.1% in Latvia; and asking students to answer questions in front of class from 79.8% in Italy to 5.2% in Iceland (OECD, 2014, p. 161). Standardized tests are less frequently used, as is student self-assessment. (See Figure 19, following page.)
TALIS data also showed that student performance and student assessment practices are commonly emphasized in feedback to teachers on their teaching (reported by 87.5% and 83.0% of teachers, respectively) (OECD, 2014, pp. 361–362 Table 5.6). In addi-tion, teachers’ self-efficacy and job satisfaction were positively related with feedback on students’ achievement in 24 and 17 jurisdictions, respectively.
Together these suggest that teachers employ a range of assessment methods, commonly receive feedback on both assessment methods and student outcomes, and find greater confidence and enjoyment in their teaching when they receive feedback and appraisal linked to evidence of student learning.

Stanford Center for Opportunity Policy in Education32
Figure 19: Teachers’ use of student assessment prac.ces (reproduced from OECD, 2014b, p. 161 Figure 6.6).
0 10 20 30 40 50 60 70 80 90 100
Observe students when working on par.cular tasks and provide immediate feedback
Develop and administer own assessment
Provide wrimen feedback on student work in addi.on to a mark, i.e. numeric score or lemer grade
Individual students answer ques.ons in front of the class
Administer a standardised test
Let students evaluate their own progress
In all or nearly all lessons
Frequently
Occasionally
Never or almost never
Percentage of teachers
Figure 19: Teachers’ use oF sTudenT assessmenT pracTices
Reproduced from OECD (2014), Talis 2013 Results: An International Perspective on Teaching and Learning, OECD Pub-lishing. http://dx.doi.org/10.1787/9789264196261-en, p. 161, Figure 6.6.
School Leadership and School Climate
key question about principals’ time, training, and practices is the extent to which these foster the development of high-quality teaching practice. As an oft-quoted McKinsey report about the highest performing nations noted:
The systems which seek to use their principals as drivers of reform expect them to be excellent instructors who spent most of their time coaching teachers. . . . Being a teacher is about helping children to learn. Being a principal is about helping adults to learn. (Barber & Mourshed, 2007, pp. 30–31)
TALIS includes some useful data on these issues as well as their influences on teachers.
Principals’ use of time
The business of teaching and learning — including curriculum development, teaching, classroom observations, student evaluation, mentoring teachers, and teacher profes-sional development — was not the greatest use of principals’ time. The data showed that principals’ work was dominated by administrative and leadership tasks and meet-ings, on average accounting for 41.4% of their time. (See Figure 20, following page.) Principals in the Netherlands spent the greatest proportion of their time on these duties (53.6%); the proportion was lowest in Chile (30.3%) and the United States (30.0%).
Instructional matters represented the second largest use of principals’ time, averaging 21.5% across jurisdictions. Instructional engagement accounted for greater than 25% of
A

Teaching Around the World: What Can TALIS Tell Us? 33
Figure 20: Uses of principals’ .me—TALIS average
41.4
21.5
15.0
11.2
6.9 4.0
Principals' use of .me
Administra.ve and leadership tasks and mee.ngs
Curriculum and teaching-‐related tasks and mee.ngs
Student interac.ons
Parents or guardian interac.ons
Interac.ons with local and regional community, business and industry
Other
principals’ time in four jurisdictions — Malaysia, Korea, Chile, and Japan — and was below 20% in 11 jurisdictions.
Principals’ preparation and experienceExperience and preparation for principals is important given the large range of respon-sibilities associated with school leaders’ work. Across TALIS jurisdictions, principals on average brought a great deal of prior experience to the role. The average level of work experience prior to taking up a position as principal was 29.5 years, with the greatest proportion comprised of experience as a teacher, 20.7 years on average, and ranging from 11.5 years in Abu Dhabi to 29.6 years in Japan.
While most principals indicated they had undertaken principals’ training, or a course in school administration — 84.8% of principals on average, and ranging from 100% in Poland and the United States, to less than 50% in Serbia and Croatia — a significant proportion of principals had not done so prior to their appointment to the position. On average, just 47.4% of principals had undertaken formal principal training (25.4% before, and 21.9% before and after) before taking on the role.
Of particular interest is principals’ formal training in instructional leadership. Although near universal in the United States (99.7%), and above 90% in 11 jurisdictions, training in instructional leadership was below 60% in four jurisdictions. Across all jurisdictions, an average of 22.2% of principals reported having received no instructional leadership
Figure 20: uses oF principals’ Time—Talis average.
Source: OECD (2014), Talis 2013 Results: An International Perspective on Teaching and Learning, OECD Publishing.http://dx.doi.org/10.1787/9789264196261-en

Stanford Center for Opportunity Policy in Education34
training. (See Figure 21.) The lowest level of instructional leadership training was in Poland (42.7%), a surprising finding given that all principals surveyed in this country indicated having undertaken a school administration or principal training program (OECD, 2014, p. 310 Table 3.10).
Instructional leadership practices
School leadership research shows that instructional leadership is positively associated with student outcomes, with one study finding that “promoting and participating in teacher learning and development” had at least twice the effect size of other commonly used leadership practices (Robinson, Hohepa, & Lloyd, 2009).
Instructional leadership in TALIS was assessed based on principals’ responses to ques-tions relating to supporting teacher cooperation to develop new practices, ensuring teachers take responsibility for the improving their skills, and seeing that teachers feel responsible for student learning outcomes (OECD, 2014, p. 215 Annex B).
Across TALIS jurisdictions there was a wide variety in the self-reported use of instruc-tional leadership practices among school principals. These practices were most com-mon in Malaysia, Abu Dhabi, Chile, Romania, and Bulgaria; they were least common in Sweden, Estonia, Norway, Denmark, Finland, Flanders, and Japan. For example, 97.9% of principals in Malaysia reported that they “often” or “very often” took action to sup-port cooperation among teachers to develop new teaching practices, compared with just 33.9% of principals in Japan (OECD, 2014, p. 296 Table 3.2).
Analyses in TALIS showed that in general, principals who reported the frequent use of instructional leadership practices were more likely to spend time observing instruc-
Figure 21: insTrucTional leadership preparaTion among principals
Source: OECD (2014), Talis 2013 Results: An International Perspective on Teaching and Learning, OECD Publishing.http://dx.doi.org/10.1787/9789264196261-en
Figure 21: Instruc.onal leadership prepara.on among principals
99.7
77.8
42.6
0
10
20
30
40
50
60
70
80
90
100
Instruc.onal leadership training or course

Teaching Around the World: What Can TALIS Tell Us? 35
Australia Brazil
BulgariaChile
Croatia
Cyprus
Czech Republic
DenmarkEstonia
Finland
France
Iceland
Israel
Italy
Japan
Korea
Latvia
Malaysia
Mexico
Netherlands
Norway
Poland
Portugal
Romania
SerbiaSingapore
Slovak Republic
Spain
Sweden
Abu Dhabi (UAE)
Alberta (Canada)
England (UK)
Flanders (Belgium)
United States
Average
30
40
50
60
70
80
90
100
0 10 20 30 40 50 60 70 80 90 100
Take
act
ion
to e
nsur
e th
at t
each
ers
take
res
pons
ibili
ty fo
r im
prov
ing
thei
r te
achi
ng s
kills
(%)
Observe instruction in the classroom (%)
Relationship between principals' engagement with teacher learning and classroom observation
tion in the classroom. This relationship was observed both within jurisdictions — with statistically significant associations in 20 of 32 countries analyzed (OECD, 2014, pp. 320–321 Table 3.16) — and across jurisdictions.23 (See Figure 22.)
Instructional leadership was also associated with the likelihood of the principal work-ing on a school professional development plan in 13 jurisdictions, and with appointing a mentor to help a teacher improve his/her practice following teacher appraisal in nine jurisdictions (OECD, 2014, p. 320 Table 3.16).24
In several jurisdictions, instructional leadership was associated with the use of teacher appraisal to develop staff capabilities. In 14 jurisdictions, greater use of instructional leadership was associated with the creation of a development plan for each teacher, or the appointment of a teacher mentor to help improve teaching, or both, following
23 Pearson’s r ranged from .627 to .784. The instructional leadership index is comprised of principals’ responses to questions relating to supporting teacher cooperation to develop new practices, ensuring teachers take responsibility for improving their skills, and seeing that teachers feel responsible for student learning outcomes (OECD, 2014b, p. 215 Annex B).”
24 Pearson’s r = .619. Regression analyses in TALIS controlled for principal gender, age, and educational attainment.
Figure 22: relaTionship beTween principals’ engagemenT wiTh Teacher learning and classroom observaTion.
Sourc: OECD (2014), Talis 2013 Results: An International Perspective on Teaching and Learning, OECD Publishing.http://dx.doi.org/10.1787/9789264196261-en

Stanford Center for Opportunity Policy in Education36
formal teacher appraisal. By contrast, instructional leadership was rarely associated with non-renewal of teacher contracts or with changes in teachers’ salaries following apprais-al (OECD, 2014, pp. 320–321 Table 3.16). Instructional leaders seem more focused on using appraisal to support teacher learning than to apply rewards and sanctions.
Thus the TALIS data provide an indication that in jurisdictions in which principals spend more time in the classroom observing lessons, they are also more likely to be engaged in facilitating an environment that encourages teachers’ professional learning, and in seeing that teachers take responsibility for improving their own practice and for student learning outcomes.
Leadership style and school climate
Analyses in TALIS showed that a principal’s leadership style is related to the working environment for teachers in the school. In 19 of 32 jurisdictions, principals’ reporting of the use of instructional leadership practices was positively associated with a school cli-mate of mutual respect (OECD, 2014, p. 322 Table 3.17). A mutually respectful work-ing climate was related to principals’ job satisfaction in a large majority of jurisdictions. Principals who employed distributed leadership practices were also more likely to report satisfaction with their jobs. By contrast, in 9 jurisdictions, principals were less satisfied with their jobs when there was a lack of shared leadership with other school staff members (OECD, 2014, p. 328 Table 3.23). Low job satisfaction was also related to high workloads in 14 jurisdictions, which could be in part a result of failure to share responsibilities with other staff members.
TALIS analyses do not allow us to attribute causality. They don’t, for example, tell us whether the existence of a respectful school climate provides the conditions in which principals feel more confident in sharing responsibilities, or whether the act of princi-pals sharing decision-making engenders a respectful working environment. In practice, these may be mutually supportive processes.
Taken together, however, the implications of these findings are that school leaders may be able to contribute to creating a more collaborative and mutually respectful working environment. The data indicate that when principals spend a greater proportion of their time on curriculum and teaching-related tasks, they are more likely to spend more time observing classroom instruction and encouraging teacher cooperation and professional learning. Likewise, when principals are able to share decision-making with teachers, it may contribute to a school climate in which teachers are able to have open discussions about difficulties, and principals report positive relations between teachers and stu-dents. Moreover, it appears to contribute to greater job satisfaction for principals, as it does for teachers.

Teaching Around the World: What Can TALIS Tell Us? 37
Appraisal and Feedback
he kinds of appraisal and feedback that teachers receive can inform their learning and create behavioral and career incentives. They can also shape teachers’ confi-dence and capabilities, all of which can affect student learning. TALIS investigated
these systems by asking principals about processes of formal appraisal in their school and asking teachers about the feedback they receive individually on their teaching as well as the systems of appraisal and feedback in the schools where they work.
Teacher feedback
TALIS defined feedback as “any communication teachers receive about their teaching, based on some form of interaction with their work (e.g., observing classrooms and the teaching of students, discussing teachers’ curriculum or the results of their students)” (OECD, 2014, p. 122).
One of the surprising findings from TALIS was the noticeable proportion of teachers (12.5%) who do not receive any feedback on their teaching in their current school. These proportions were greatest in Iceland (45.4%), Italy (42.8%), and Finland (36.9%). (See Figure 23, following page.) Given that a majority of teachers in Italy also reported not receiving any opportunities for clinical practice during their initial teacher educa-tion, this finding may signal that many Italian teachers have few opportunities either pre-service or in-service to get feedback on their practice.
Most teachers reported receiving feedback on their teaching from multiple sources. The most common method of feedback was through classroom observation, reported by 79% on average, but with considerable variation across jurisdictions. In England, the United States, Malaysia, and Poland, this was near universal, while in Finland, Spain, Italy, and Iceland, less than half of teachers reported feedback from observation. Feed-back was most likely to be received from school principals (54%), followed by members of the school management team (49%) and other teachers in the school (42%) (OECD, 2014, p. 357 Table 5.4). However, this ranged widely, with as many as 84% of teachers in Korea reporting receiving feedback from other teachers, more than 25 percentage points greater than the nearest jurisdiction, while just 30% received feedback from prin-cipals. (See Figure 24, following page.)
The feedback that teachers receive from peers is important for professional learning and developing teacher capability. Teaching peers may share common experiences and challenges in their day-to-day work, and may therefore be able to offer more targeted and relevant feedback regarding specific students or curricular content (Darling-Ham-mond, 2014). In countries such as the United States, where high levels of feedback from principals (85%) were coupled with low levels of reported feedback from teachers (only 27%), teachers reported finding feedback less useful than in many other countries where peers were more involved.
T

Stanford Center for Opportunity Policy in Education38
Although the TALIS data showed that feedback incorporating analysis of students’ test scores was fairly common (63.6% of teachers), there is no information offered about the kinds of assessments in use in different jurisdictions. Relatively few countries have external standardized tests at the lower secondary level, so respondents were likely referring to some mix of classroom and school tests in most jurisdictions. For example, 74% of teachers in Finland reported the use of students’ test scores for appraisal, even though Finland has no external standardized testing at the primary or lower secondary level at all.
Figure 23: Teachers who have noT received Feedback on Their classroom Teaching
Source: OECD (2014), Talis 2013 Results: An International Perspective on Teaching and Learning, OECD Publishing.http://dx.doi.org/10.1787/9789264196261-en
Source: OECD (2014), Talis 2013 Results: An International Perspective on Teaching and Learning, OECD Publishing.http://dx.doi.org/10.1787/9789264196261-en
FpoFigure 24: proporTion oF Teachers who received Feedback on Their Teaching From
oTher Teachers.
Figure 23: Teachers who have not received feedback on their classroom teaching.
0.9
12.5
45.4
0
5
10
15
20
25
30
35
40
45
50
Have never received feedback in their current school
Figure 24: Propor.on of teachers who received feedback on their teaching from other teachers.
84.4
41.9
19.7
0
10
20
30
40
50
60
70
80
90
Feedback received from other teachers
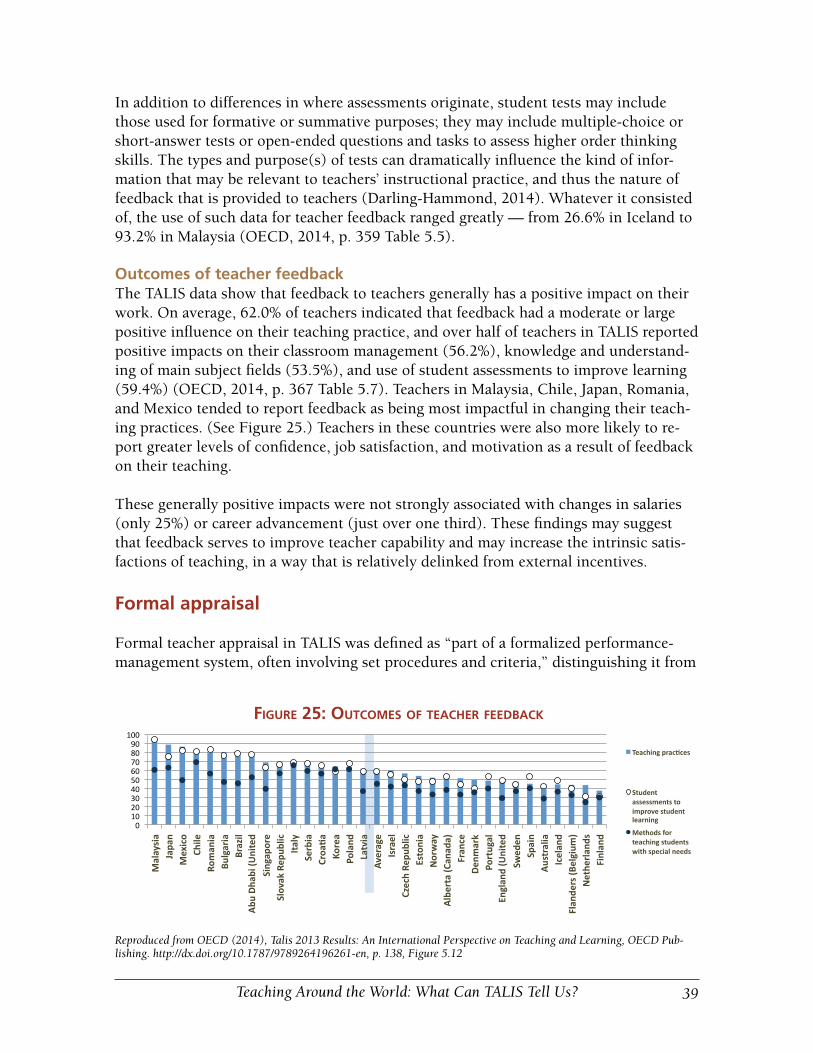
Teaching Around the World: What Can TALIS Tell Us? 39
In addition to differences in where assessments originate, student tests may include those used for formative or summative purposes; they may include multiple-choice or short-answer tests or open-ended questions and tasks to assess higher order thinking skills. The types and purpose(s) of tests can dramatically influence the kind of infor-mation that may be relevant to teachers’ instructional practice, and thus the nature of feedback that is provided to teachers (Darling-Hammond, 2014). Whatever it consisted of, the use of such data for teacher feedback ranged greatly — from 26.6% in Iceland to 93.2% in Malaysia (OECD, 2014, p. 359 Table 5.5).
Outcomes of teacher feedbackThe TALIS data show that feedback to teachers generally has a positive impact on their work. On average, 62.0% of teachers indicated that feedback had a moderate or large positive influence on their teaching practice, and over half of teachers in TALIS reported positive impacts on their classroom management (56.2%), knowledge and understand-ing of main subject fields (53.5%), and use of student assessments to improve learning (59.4%) (OECD, 2014, p. 367 Table 5.7). Teachers in Malaysia, Chile, Japan, Romania, and Mexico tended to report feedback as being most impactful in changing their teach-ing practices. (See Figure 25.) Teachers in these countries were also more likely to re-port greater levels of confidence, job satisfaction, and motivation as a result of feedback on their teaching.
These generally positive impacts were not strongly associated with changes in salaries (only 25%) or career advancement (just over one third). These findings may suggest that feedback serves to improve teacher capability and may increase the intrinsic satis-factions of teaching, in a way that is relatively delinked from external incentives.
Formal appraisal
Formal teacher appraisal in TALIS was defined as “part of a formalized performance-management system, often involving set procedures and criteria,” distinguishing it from
Figure 25. Outcomes of teacher feedback (reproduced from (OECD, 2014b, p. 138 Figure 5.12)).
0 10 20 30 40 50 60 70 80 90
100
Malaysia
Japan
Mexico
Chile
Romania
Bulgaria
Brazil
Abu Dhabi (U
nited
Arab Em
irates)
Singapore
Slovak Republic
Italy
Serbia
CroaJa
Korea
Poland
Latvia
Average
Israel
Czech Republic
Estonia
Norway
Alberta (Canada)
France
Denmark
Portugal
England (United
Kingdom)
Sweden
Spain
Australia
Iceland
Flanders (B
elgium
) Netherlands
Finland
Teaching pracJces
Student assessments to improve student learning
Methods for teaching students with special needs
Figure 25: ouTcomes oF Teacher Feedback
Reproduced from OECD (2014), Talis 2013 Results: An International Perspective on Teaching and Learning, OECD Pub-lishing. http://dx.doi.org/10.1787/9789264196261-en, p. 138, Figure 5.12

Stanford Center for Opportunity Policy in Education40
feedback, which can be either formal or informal (OECD, 2014, p. 122). Information on formal teacher appraisal was provided by principals.
Most teachers in TALIS jurisdictions (92.6%) received some kind of formal appraisal.A salient exception is Italy, where the data indicate that 70.1% of teachers are generally never formally appraised (OECD, 2014b, p. 354 Table 5.1). Appraisal is most com-monly conducted by school principals (86.2%) and/or by members of the school man-agement team (70.2%), but with considerable variation across countries. In the US, for example, the data showed nearly 99% of teachers were formally appraised by the school principal — 83.6% at least annually. In other countries, the school management team played a more significant role in appraisal. In Australia 92.9% (68.9% annually) and in Singapore 100% (97.5% annually) of teachers were formally appraised by the school management team (OECD, 2014b Table 5.1.Web).
Outcomes of formal appraisalFormal appraisal — often involving set criteria as part of a performance management process — appears to serve developmental purposes in most schools. Principals almost universally reported that measures to remedy weaknesses were discussed with teach-ers “sometimes,” “most of the time,” or “all of the time,” including 100% of principals in each of Australia, Finland, Singapore, and the United States. Similarly, principals in schools representing an average of 84.5% of teachers reported that teacher development or training plans at least sometimes follow formal appraisal, and 72.5% reported a men-tor is appointed to help improve teaching practice (OECD, 2014, p. 356 Table 5.3).
Looking more closely, the frequency of developmental practices varied significantly across TALIS jurisdictions. While principals representing greater than 98% of teachers in Japan, Korea, and Finland indicated that they at least sometimes took measures to remedy weaknesses in teaching, the consistency of this practice varied widely. In Japan 20% of principals reported that this occurred most or all of the time, while in Korea, the proportion was 36%, and in Finland 43% (OECD, 2014 Table 5.3 Web).
The appointment of a mentor followed appraisal “most of the time” for more than 75% of teachers in Singapore, but in less than 10% of cases in each of Mexico, Iceland, Por-tugal, Japan, Finland, and Spain. Likewise, the development of training plans for each teacher following formal appraisal occurred “most of the time” or “always” for more than 75% of teachers in Singapore, Abu Dhabi, Serbia, and England, but this occurred for less than 20% of teachers in Iceland, Portugal, Spain, France, Norway, and Japan. (See Figure 26, following page.)
The TALIS data showed that using formal appraisal to determine compensation was relatively uncommon. In just eight jurisdictions, formal appraisal led to changes in teachers’ salaries for a majority of teachers, with the largest rates reported in the Czech Republic, Bulgaria, and Singapore. This may be unsurprising, given the complexities of establishing evaluation procedures that capture the full range of professional expec-

Teaching Around the World: What Can TALIS Tell Us? 41
tations for teachers (Ingvarson, Kleinhenz, & Wilkinson, 2007), and recent evidence that merit pay has generally not been effective in raising student performance (Martins, 2010; Springer et al., 2011).
Singapore, England, and to a lesser extent Korea were jurisdictions in which high levels of ”developmental” outcomes of formal appraisal were combined with material incen-tives for performance. For example, principals representing 79% of teachers reported that “most of the time” or “always” formal appraisal resulted in the appointment of a mentor to help his/her teaching, and those representing 97% indicating that at least sometimes appraisal resulted in a change in the likelihood of career progression (OECD, 2014 Table 5.3 Web).
Teachers perceptions of feedback and appraisal systems
In addition to teachers’ reporting of feedback on their teaching, TALIS asked teachers to respond to questions regarding both appraisal and feedback systems in the school more generally. The data suggest that a significant proportion of teachers are at least skepti-cal about the efficacy of the appraisal and feedback systems operating in their schools. Around half of teachers in TALIS agreed or strongly agreed that appraisal and feedback were largely done for administrative purposes, and less than half of all teachers agreed that appraisal and feedback were based on a thorough assessment of their teaching. Additionally, while the findings above showed that around 60% of teachers reported they improved their teaching practice as a result of feedback they received personally, a significant proportion of teachers across TALIS jurisdictions (43.4%) reported that
Figure 26: A teacher development plan commonly follows formal appraisal (principals).
79.3
43.6
13.2
0
10
20
30
40
50
60
70
80
90
A development or training plan is developed for each teacher (Most of the .me/Always)
Figure 26: a Teacher developmenT plan commonly Follows Formal appraisal (principals).
Source: OECD (2014), Talis 2013 Results: An International Perspective on Teaching and Learning, OECD Publishing.http://dx.doi.org/10.1787/9789264196261-en

Stanford Center for Opportunity Policy in Education42
appraisal and feedback systems in their school in general have little impact on the way teachers teach in the classroom (OECD, 2014, p. 571 Table 5.8).
Teachers in almost all jurisdictions showed higher levels of job satisfaction when teacher appraisal impacted classroom teaching, and lower satisfaction when teachers felt that appraisal was conducted for largely administrative purposes (OECD, 2014, pp. 420–421 Tables 7.12, 7.13). Receiving feedback from at least two evaluators was associ-ated with greater teacher self-efficacy in 13 jurisdictions and greater job satisfaction in 23 jurisdictions.
Together these findings suggest that teachers welcome feedback that enhances their teaching capabilities and is connected to students’ learning. Teacher appraisal systems are more likely to be effective when they take a comprehensive approach to evaluating teachers’ work, lead to high-quality professional learning, and are viewed as provid-ing meaningful feedback to improve student learning. By contrast, systems of appraisal that are viewed as serving largely administrative purposes or as focused primarily on high-stakes personnel decisions may serve to lower the desirability of teaching, as other research has suggested (Lavigne, 2013; Schleicher, 2012).
Teacher Self-Efficacy
eacher self-efficacy — teachers’ confidence in their abilities to plan, organize, and carry out activities that allow them to attain their educational goals — is an attri-bute of particular interest, as it is associated with teacher contributions to student
achievement gains in a number of studies (Anderson, Greene, & Loewen, 1988; Cap-rara, Barbaranelli, Steca, & Malone, 2006; Goddard, Hoy, & Hoy, 2000; Ross, 1992; Tschannen-Moran, 2004). Research has also linked teacher self-efficacy to increased instructional quality (Holzberger, Philipp, & Kunter, 2013) and the use of innovative instructional practices (Ghaith & Yaghi, 1997). In addition, greater teacher self-efficacy has been linked with increased teacher job satisfaction and lower burnout (Skaalvik & Skaalvik, 2010).
Self-efficacy domains
Self-efficacy was explored in TALIS using four questions to create an index in each of three domains — classroom management, instruction, and student engagement — with questions such as: I can “control disruptive behavior in the classroom,” I can “imple-ment alternative instructional strategies in my classroom,” and I can “help students think critically.” A single index of self-efficacy was then created by summarizing across each of these three sub-indices (OECD, 2014, p. 216). Job satisfaction was constructed of two sub-indices — satisfaction with current work environment, and satisfaction with profession — each also comprising four questions (OECD, 2014, p. 215 Annex B).
T

Teaching Around the World: What Can TALIS Tell Us? 43
Self-efficacy across jurisdictions
Most teachers in TALIS showed fairly high levels of self-efficacy. In each of the three domains, the proportion of teachers who responded with “quite a bit” or “a lot” was in the range of 85% to 91% for classroom management, but slightly lower for instruction (77%–92%) and student engagement (70%–86%) (OECD, 2014, pp. 405–406 Table 7.1). Teacher self-efficacy in each of these domains was especially high in Portugal, Ro-mania, Denmark, Abu Dhabi, and Italy.
Within each of these domains, there were some results that may indicate concern. For example, just 22% of Japanese and 30% of Czech teachers reported they were able to “motivate students who show low interest in school work ‘quite a bit’ or ‘a lot.’” Japan scored lowest on all 12 measures of self-efficacy, with just 15.6% indicating that they felt able to “help students think critically” (OECD, 2014 Table 7.1 Web). These low scores, coupled with the low reporting of teaching as valued in society (discussed earlier), may raise red flags regarding the state and status of the teaching profession in Japan. They may also be associated with perceived constraints in terms of how teachers are expected to use the curriculum materials, such that teachers feel restricted in their ability to teach critical thinking.
Self-efficacy, teachers, and classrooms
Teachers with greater experience showed higher levels of self-efficacy. In particular, there was a significant differential in self-efficacy between those with less than or more than five years of experience (OECD, 2014, p. 189 Figure 7.4). This was true even after controlling for teacher gender and elements of formal teacher education (OECD, 2014, p. 410 Table 7.4). This finding supports other research indicating that teachers gain in effectiveness as they gain experience, and that the greater retention of teachers leads to a more efficacious and effective teaching workforce (Darling-Hammond, Frelow, & Chung, 2002).
Confirming a large body of previous research, analyses in TALIS showed that in all juris-dictions, self-efficacy and job satisfaction were mutually supportive (OECD, 2014, pp. 410–411 Tables 7.4, 7.5), suggesting that teachers who feel more confident and capable in their abilities to teach and engage students enjoy their teaching and work environ-ment more, and vice versa.
TALIS analyses showed that both teacher self-efficacy and job satisfaction were related to classroom composition. Statistically significant and negative relationships for self-efficacy and job satisfaction were found in 16 of 32 jurisdictions for classes in which greater than 10% of students were estimated to have behavioral problems. For classes in which greater than 10% of students were academically gifted, statistically significant and positive relationships were found with self-efficacy in 17 jurisdictions, and with job satisfaction in 23 jurisdictions (OECD, 2014, pp. 412–413 Tables 7.6-7.7).

Stanford Center for Opportunity Policy in Education44
Self-efficacy and collaborative school environments
TALIS data show that the effects of challenging classroom environments on teachers’ self-efficacy and job satisfaction may be offset by positive working relationships and positive climate. Regression analyses showed that indices of teacher cooperation and teacher-student relations were positively correlated with teacher self-efficacy in all, and with job satisfaction in all but one, of the jurisdictions analyzed.25 Teacher self-efficacy was more strongly associated with teacher-to-teacher relationships, while teacher job satisfaction was more strongly associated with teacher-student relationships (OECD, 2014, pp. 414–417 Tables 7.8-7.9). As the TALIS report notes:
[T]eachers’ reports of the quality of their relationships with other teach-ers in the school seem to be particularly important for teachers’ feelings of self-efficacy, while for teachers’ job satisfaction, their perception of the quality of the student-teacher relationships in the school appears to mat-ter most. (OECD, 2014, p. 193)
More specifically, frequent engagement in teacher professional collaboration was posi-tively associated with self-efficacy.26 Teachers who reported engaging in collaborative activities five times a year or more were associated with greater levels of self-efficacy than those who did not (OECD, 2014, p. 198). Teacher self-efficacy was also positively associated with each of several collaborative practices: teaching jointly in the same class (15 jurisdictions), observing other teachers’ classes and providing feedback (15 juris-dictions), and engaging in joint activities across different classes and ages (26 jurisdic-tions) (OECD, 2014, pp. 424–425 Tables 7.16–7.17).
Relationship building and fostering collaborative practices in schools, whether these be through collaborative professional development activi-ties, systems of peer feedback or collaborative teaching activities, are highly beneficial to teacher self-efficacy and job satisfaction. (OECD, 2014, p. 200)
The collaborative practice that showed the largest number of statistically significant and positive relationships was participation in collaborative professional learning, associated with greater self-efficacy in 30 of the 32 jurisdictions analyzed, and with greater teacher job satisfaction in 21 of these. This suggests that when teachers are engaged in collab-orative practices that enhance their individual and collective teaching capabilities, they
25 The index of teacher cooperation combined the two sub-indices of cooperation and teacher professional collabora-tion. The index of student-teacher cooperation is comprised from four question items: “teachers and students usually get on well with each other,” “most teachers in this school believe that students’ well-being is important,” “most teachers in this school are interested in what students have to say,” and “if a student from this school needs extra as-sistance, the school provides it” (OECD, 2014, p. 215 Annex B).
26 The index of teacher professional collaboration is comprised of questions regarding: joint teaching, observing other teachers’ classes, engaging in joint activities, and collaborative professional learning (OECD, 2014, p. 215 Annex B).

Teaching Around the World: What Can TALIS Tell Us? 45
not only feel more confident in their abilities to teach, to engage students, and to man-age class behaviour but also tend to find greater enjoyment in their work.
This is supported by other findings in TALIS that show that relationships within the school that are oriented towards teacher and student learning are associated with great-er self-efficacy. For example, participation in mentoring and/or peer observation and coaching as part of a formal school arrangement and participation in a formal induction program were each positively related to teacher self-efficacy in 14 jurisdictions. Interest-ingly, teachers tended to report the act of mentoring others as more closely related to self-efficacy than the act of being mentored (OECD, 2014, p. 194). Teachers have often reported that serving as a mentor is a powerful learning experience. It may also be par-ticularly satisfying to have the opportunity to pass on one’s learning to other teachers and to engage in the collaborative relationship that mentoring implies.
Self-efficacy, job satisfaction, and school leadership
TALIS analyses also indicated that teacher self-efficacy was enhanced not only by re-lationships with teachers but also with school leaders. Regression analyses in TALIS showed that teacher self-efficacy was greater in a majority of jurisdictions, and job satis-faction greater in all jurisdictions — and with very large effect sizes — when staff were provided with opportunities to actively participate in school decision-making27 (OECD, 2014, pp. 414–417 Tables 7.8, 7.9).
27 Effects sizes ranged from 0.66 in Mexico to 1.62 in Bulgaria, after accounting for: “teacher gender, experience, educational attainment, formal education or training on content, pedagogy and classroom practice for the subject(s) taught, class size, low academic achievers, students with behavioral problems, and gifted students.”

Stanford Center for Opportunity Policy in Education46
Conclusions and Policy Recommendations
he OECD Teaching and Learning International Survey (TALIS) provides a rich source of information on teaching, schools, and practices with data from teachers and principals. The findings indicate a range of practices related to the way teach-
ers are trained, supported, and prepared for the classroom; the working environments they face when they get there; the level of interaction they have with colleagues; the way they are formally appraised; their professional growth; and their levels of confi-dence in their abilities and satisfaction with their work.
Teachers are the most valuable resource available to schools. They are the most influ-ential in-school factor upon student learning, and also the greatest financial investment in terms of their training and ongoing compensation. Thus attracting high-quality individuals into the profession, providing them with the supports they need to make the transition from teacher candidate to experienced teacher, and retaining them in the profession are of critical importance to educational systems. Doing so requires policies that support teachers’ continual professional growth, including working with and learn-ing from colleagues, to ensure that teaching practice develops to meet the continually changing demands on the profession.
The data in TALIS 2013 provide important insights into the policies that can support and strengthen teaching and lead to high-quality learning for students. Among these policy implications are the following:
1. Communicate value for the profession of teaching: Student achieve-ment is higher in societies where teachers perceive their profession is valued. This value is communicated in a number of ways. For example, in jurisdictions where teachers perceive their profession is valued, teachers are more likely to have a role in decision-making, and they are better compensated.
2. Ensure adequate and equitable resources: A significant proportion of principals in a number of jurisdictions report that shortages of teach-ers, support personnel, and instructional materials hinder their ability to provide high-quality education for all students. Findings from the PISA 2013 study indicate that countries that have high and equitable learning outcomes tend to be those that allocate a larger proportion of educational resources to students that come from disadvantaged backgrounds.
3. Establish incentives that ensure an adequate supply of teachers for all fields and communities: Many jurisdictions experience widespread shortages of special education teachers, while others experience teach-er shortages in particular locations. A strong base of resources and a range of incentives are needed to recruit and prepare high-quality
T

Teaching Around the World: What Can TALIS Tell Us? 47
teachers for all schools and fields. A supportive working environment is needed to retain teachers in these schools.
4. Provide comprehensive, high-quality preparation in content, pedagogy, and classroom practice for all of the subjects teachers teach. Teachers who feel prepared in each of these areas are more likely to use active teaching strategies associated with higher order thinking skills. They also feel more efficacious and are more satisfied with their jobs. Teach-er preparation is related to student achievement across jurisdictions.
5. Support induction for novices: Induction and mentoring following training help link initial teacher education to ongoing professional learning and early career teacher retention. In some jurisdictions more attention to funding and support structures may be needed to help bridge the gap between the formal availability of, and actual participa-tion in, induction programs.
6. Provide time for collaboration and professional learning: Lack of scheduled time is the most commonly reported barrier to professional learning, and lack of time for collaboration impedes teachers from joint planning, observing, and receiving feedback from peers — all of which improve instructional practices, enhance self-efficacy, and enhance student achievement.
7. Encourage high-quality professional development relevant to teachers’ needs: Professional learning is most effective when it is ongoing and connected to teachers’ learning needs and contexts. Collegial profes-sional learning can promote collaborative school practices and is as-sociated with greater teacher self-efficacy and job satisfaction.
8. Identify potential leaders and provide them with training as instruc-tional leaders: TALIS showed that nearly half of principals have no formal school administration or principal training prior to taking on their role as principal. Of particular importance is increased access to instructional leadership training. Principals who engaged in instruc-tional leadership were more likely to observe teaching, work on school development plans, and assign mentors to help strengthen teaching practices. Instructional leadership was also associated with a climate of mutual respect in the school. Other research shows that instructional leadership is positively associated with student outcomes.
9. Encourage distributed leadership and shared decision-making: When leadership responsibilities are shared, both principal and teacher job satisfaction are greater. When teachers are involved in decision-making within the school, they tend to report a more collaborative working climate characterized by mutual respect.

Stanford Center for Opportunity Policy in Education48
10. Center teacher appraisal and feedback on improving teaching quality: TALIS data showed that teachers’ self-efficacy is greater when appraisal is connected to meaningful feedback, and their job satisfaction higher when they feel that appraisal and feedback impact upon their class-room teaching. Appraisal and feedback systems are more likely to be effective when linked to high-quality professional learning.
These policies hold the greatest potential when used in concert. For example, rigor-ous teacher training that prepares teachers for the classroom may be ineffective if not also supported by induction and mentorship that retains teachers in the profession to further develop their capabilities; teacher professional development is likely to be more effective when connected to school-wide goals through instructional leadership and shared decision-making. Taken together, these policies enhance the professionalization of the teaching workforce.
Educating students with the competencies required for the knowledge economies of the 21st century has increased the complexity of teaching. High-performing education systems tend to be those where the teaching profession is valued in society, that are able to attract high-quality individuals into teaching, train them well, retain them in the pro-fession by putting in place supports that address the working conditions in the schools, and support their ongoing professional learning. TALIS tells us that valuing teaching and teacher learning, restructuring the work of teaching to enable greater professional collaboration, and providing meaningful feedback to teachers to support their work can help create a more attractive and efficacious teaching workforce.

Teaching Around the World: What Can TALIS Tell Us? 49
References
Adamson, F., & Darling-Hammond, L. (2012). Funding disparities and the inequitable distribution of teachers: evaluating sources and solutions. Education Policy Analysis Archives, 20(37). Retrieved from http://epaa.asu.edu/ojs/article/view/1053
Anderson, R. N., Greene, M. L., & Loewen, P. S. (1988). Relationships among teachers’ and students’ thinking skills, sense of efficacy, and student achievement. Alberta Journal of Educational Research, 34(2), 148–165.
Aud, S., Hussar, W., Kena, G., Bianco, K., Frohlich, L., Kemp, J., & Tahan, K. (2011). The condition of education 2011 (No. NCES 2011-033). Washington, DC: National Center for Education Statistics. Retrieved from http://eric.ed.gov/?id=ED520001
Barber, M., & Mourshed, M. (2007, September). How the world’s best-performing school systems come out on top.
Binkley, M., Erstad, O., Herman, J., Raizen, S., Ripley, M., Miller-Ricci, M., & Rumble, M. (2012). Defining twenty-first century skills. In Assessment and Teaching of 21st Century Skills. Dondrecht: Springer.
Boyd, D. J., Grossman, P. L., Lankford, H., Loeb, S., & Wyckoff, J. (2009). Teacher preparation and student achievement. Educational Evaluation and Policy Analysis, 31(4), 416–440.
Bruns, B., Evans, D., & Luque, J. (2011). Achieving world-class education in Brazil: The next agenda. The World Bank. http://elibrary.worldbank.org/doi/book/10.1596/978-0-8213-8854-9
Caprara, G. V., Barbaranelli, C., Steca, P., & Malone, P. S. (2006). Teachers’ self-efficacy beliefs as determinants of job satisfaction and students’ academic achievement: A study at the school level. Journal of School Psychology, 44(6), 473–490. doi:10.1016/j.jsp.2006.09.001
Darling-Hammond, L. (2010). The flat world and education: How America’s commitment to equity will determine our future. New York: Teacher College, Columbia University.
Darling-Hammond, L. (2014, June 30). To close the achievement gap, we need to close the teaching gap. Huffington Post. Retrieved from http://www.huffingtonpost.com/linda-darlinghammond/to-close-the-achievement_b_5542614.html
Darling-Hammond, L., & Adamson, F. (2010). Beyond basic skills: The role of performance assessment in achieving 21st century standards of learning. Stanford Center for Opportunity Policy in Education (SCOPE), Stanford University, School of Education. Retrieved from https://edpolicy.stanford.edu/sites/default/files/beyond-basic-skills-role-performance-assessment-achieving-21st-century-standards-learning-report_0.pdf
Darling-Hammond, L., Chung, R., & Frelow, F. (2002). Variation in teacher preparation: How well do different pathways prepare teachers to teach? Journal of Teacher Education, 53(4), 286–302. doi:10.1177/0022487102053004002
Darling-Hammond, L., Chung Wei, R., Adamson, F., & Orphanos, S. (2010). Opportunities for teacher learning in the United States: What do the SASS data tell us? Presented at the Annual Conference of the American Educational Research Association, Denver, Colorado.

Stanford Center for Opportunity Policy in Education50
Darling-Hammond, L., Hammerness, K., Grossman, P., Rust, F., & Shulman, L. (2005). The design of teacher education programs. In L. Darling-Hammond & J. Bransford (Eds.), Preparing teachers for a changing world: What teachers should learn and be able to do (pp. 390-441). Jossey-Bass: San Francisco.
Darling-Hammond, L., & Richardson, N. (2009). Teacher learning: What matters. Research Review. Educational Leadership, 66(5), 46–53.
Darling-Hammond, L., Wei, R. C., & Andree, A. (2010). How high-achieving countries develop great teachers. Stanford, CA. Stanford Center for Opportunity Policy in Education.
Day, C., Elliot, B., & Kington, A. (2005). Reform, standards and teacher identity: Challenges of sustaining commitment. Teaching and Teacher Education, 21(5), 563–577.
Day, C., Sammons, P., Stobart, G., & Kington, A. (2007). Teachers matter: Connecting work, lives and effectiveness. McGraw-Hill International.
Elmore, R. F., & Burney, D. (1997). Investing in teacher learning: Staff development and instructional improvement in Community School District #2, New York City. Retrieved from http://eric.ed.gov/?id=ED416203
Friedlaender, D., Burns, D., Lewis-Charp, H., Cook-Harvey, C. M., Zheng, X., & Darling-Hammond, L. (2014). Student-centered schools: Closing the opportunity gap. Stanford, CA: Stanford Center for Opportunity Policy in Education.
Garet, M. S., Porter, A. C., Desimone, L., Birman, B. F., & Yoon, K. S. (2001). What Makes Professional Development Effective? Results From a National Sample of Teachers. American Educational Research Journal, 38(4), 915–945. doi:10.3102/00028312038004915
Ghaith, G., & Yaghi, H. (1997). Relationships among experience, teacher efficacy, and attitudes toward the implementation of instructional innovation. Teaching and Teacher Education, 13(4), 451–458. doi:10.1016/S0742-051X(96)00045-5
Goddard, R. D., Hoy, W. K., & Hoy, A. W. (2000). Collective teacher efficacy: Its meaning, measure, and impact on student achievement. American Educational Research Journal, 37(2), 479–507. doi:10.3102/00028312037002479
Guin, K. (2004). Chronic teacher turnover in urban elementary schools. Education Policy Analysis Archives, 12(42), n42.
Hammerness, K. (2013). Examining features of teacher education in Norway. Scandinavian Journal of Educational Research, 57(4), 400–419.
Hammerness, K., van Tartwijk, J., & Snoek, M. (2012). Teacher preparation in the Netherlands. In Teacher Education around the World (pp. 44–65). New York: Routledge.
Hanselman, P., Grigg, J., Bruch, S., & Gamoran, A. (2011). The consequences of principal and teacher turnover for school social resources. Working paper downloaded on December 11, 2011, from http://ssc.wisc.edu/~sbruch/pdf/Hanselman.et.al.2011.social.resources.pdf
Holzberger, D., Philipp, A., & Kunter, M. (2013). How teachers’ self-efficacy is related to instructional quality: A longitudinal analysis. Journal of Educational Psychology, 105(3), 774.
Ingersoll, R., Merrill, L., & May, H. (2014). What are the effects of teacher education and preparation on beginning teacher attrition? (No. RR-82). Philadelphia: Consortium for Policy Research in Education (CPRE).
Ingersoll, R. M., & Strong, M. (2011). The impact of induction and mentoring programs for beginning teachers: A critical review of the research. Review of Educational Research, 81(2), 201–233. doi:10.3102/0034654311403323
Ingvarson, L., Kleinhenz, E., & Wilkinson, J. (2007). Research on performance pay for teachers.

51Teaching Around the World: What Can TALIS Tell Us?
Jackson, C. K., & Bruegmann, E. (2009). Teaching students and teaching each other: The importance of peer learning for teachers. National Bureau of Economic Research. Retrieved from http://www.nber.org/papers/w15202
Lavigne, A. L. (2013). Exploring the intended and unintended consequences of high-stakes teacher evaluation on schools, teachers, and students. Teachers College Record, 116(1).
Martins, P. S. (2010). Individual teacher incentives, student achievement and grade inflation. London: Centre for the Economics of Education.
McKenzie, P., Santiago, P., Sliwka, P., & Hiroyuki, H. (2005). Teachers matter: Attracting, developing and retaining effective teachers. OECD.
National Center for Educational Statistics. (2014). Teaching and Learning International Survey (TALIS) — Welcome to TALIS 2013 results. Retrieved August 12, 2014, from http://nces.ed.gov/surveys/talis/talis2013/index.asp
OECD. (2013a). Education at a glance 2013: OECD Indicators. OECD Publishing. http://dx.doi.org/10.1787/eag-2013-en
OECD. (2013b). PISA 2012 results: Excellence through equity (Volume II). OECD Publishing. Retrieved from http://www.oecd-ilibrary.org/education/pisa-2012-results-excellence-through-equity-volume-ii_9789264201132-en
OECD. (2013c). PISA 2012 results: What makes schools successful (Volume IV). OECD Publishing. Retrieved from http://www.oecd-ilibrary.org/education/pisa-2012-results-what-makes-a-school-successful-volume-iv_9789264201156-en
OECD. (2013d). Synergies for better learning. OECD Publishing. Retrieved from http://www.oecd-ilibrary.org/education/synergies-for-better-learning-an-international-perspective-on-evaluation-and-assessment_9789264190658-en
OECD. (2014). TALIS 2013 results: An international perspective on teaching and learning. OECD Publishing. Retrieved from http://dx.doi.org/10.1787/9789264196261-en
Plunkett, M., & Dyson, M. (2011). Becoming a teacher and staying one: Examining the complex ecologies associated with educating and retaining new teachers in rural Australia? Australian Journal of Teacher Education, 36(1), 3.
Robinson, V. M., Hohepa, M. K., & Lloyd, C. (2009). School leadership and student outcomes: Identifying what works and why: Best evidence synthesis iteration [BES]. Wellington, N.Z.: Ministry of Education. Retrieved from http://www.educationcounts.govt.nz/__data/assets/pdf_file/0015/60180/BES-Leadership-Web.pdf
Ronfeldt, M., Loeb, S., & Wyckoff, J. (2013). How teacher turnover harms student achievement. American Educational Research Journal, 50(1), 4–36.
Ross, J. A. (1992). Teacher efficacy and the effects of coaching on student achievement. Canadian Journal of Education / Revue Canadienne de L’éducation, 17(1), 51–65. doi:10.2307/1495395
Sahlberg, P. (2012). The most wanted: Teachers and teacher education in Finland. In L. Darling-Hammond & A. Lieberman (Eds.), Teacher Education around the World: Changing policies and practices (pp. 1–22). Routledge.
Schleicher, A. (Ed.). (2012). Preparing teachers and developing school leaders for the 21st century: Lessons from around the world. Paris: OECD Publishing. Retrieved from http://dx.doi.org/10.1787/9789264174559-en
Schleicher, A. (2014a). Equity, excellence and inclusiveness in education: Policy lessons from around the world. Paris: OECD.
Schleicher, A. (2014b, June 27). Results from TALIS: Press briefing. Presented at the U.S. Release of the Teaching and Learning International Survey (TALIS) results, Washington, DC.
Skaalvik, E. M., & Skaalvik, S. (2010). Teacher self-efficacy and teacher burnout: A study of relations. Teaching and Teacher Education, 26(4), 1059–1069. doi:10.1016/j.tate.2009.11.001.

Stanford Center for Opportunity Policy in Education52
Skaalvik, E. M., & Skaalvik, S. (2011). Teacher job satisfaction and motivation to leave the teaching profession: Relations with school context, feeling of belonging, and emotional exhaustion. Teaching and Teacher Education, 27(6), 1029–1038. doi:10.1016/j.tate.2011.04.001
Springer, M. G., Ballou, D., Hamilton, L., Le, V.-N., Lockwood, J., McCaffrey, D. F., Stecher, B. M. (2011). Teacher pay for performance: Experimental evidence from the Project on Incentives in Teaching (POINT). Evanston, IL: Society for Research on Educational Effectiveness.
Stewart, V. (2011). Improving teaching quality around the world: The International Summit on the Teaching Profession. New York: Asia Society.
Stewart, V. (2012). Teaching and leadership for the Twenty-First Century: The 2012 International Summit on the Teaching Profession. New York: Asia Society.
Stewart, V. (2014). Excellence, equity and inclusiveness: High quality teaching for all. Presented at the The 2014 International Summit on the Teaching Profession. New York: Asia Society.
Tschannen-Moran, M., Barr, Marilyn,. (2004). Fostering student learning: The relationship of collective teacher efficacy and sudent achievement. Leadership and Policy in Schools, 3(3), 189–209.
Wei, R., Darling-Hammond, L., Andree, A., Richardson, N., & Orphanos, S. (2009). Professional learning in the learning profession: A status report on teacher development in the United States and abroad. Dallas, TX: National Staff Development Council.


Stanford Center for Opportunity Policy in Education
http://edpolicy.stanford.edu
@scope_stanford
oStanford Center for Opportunity Policy in Education
sc e