Embed Size (px)
Citation preview

This article was downloaded by: [University of Guelph]On: 27 September 2013, At: 10:51Publisher: RoutledgeInforma Ltd Registered in England and Wales Registered Number: 1072954 Registered office: Mortimer House,37-41 Mortimer Street, London W1T 3JH, UK
Roeper ReviewPublication details, including instructions for authors and subscription information:http://www.tandfonline.com/loi/uror20
Teachers' Beliefs About Culturally, Linguistically, andEconomically Diverse Gifted Students: A QuantitativeStudyCatharina F. de Wet & E. Jean GubbinsPublished online: 30 Mar 2011.
To cite this article: Catharina F. de Wet & E. Jean Gubbins (2011) Teachers' Beliefs About Culturally,Linguistically, and Economically Diverse Gifted Students: A Quantitative Study, Roeper Review, 33:2, 97-108, DOI:10.1080/02783193.2011.554157
To link to this article: http://dx.doi.org/10.1080/02783193.2011.554157
PLEASE SCROLL DOWN FOR ARTICLE
Taylor & Francis makes every effort to ensure the accuracy of all the information (the “Content”) containedin the publications on our platform. However, Taylor & Francis, our agents, and our licensors make norepresentations or warranties whatsoever as to the accuracy, completeness, or suitability for any purpose of theContent. Any opinions and views expressed in this publication are the opinions and views of the authors, andare not the views of or endorsed by Taylor & Francis. The accuracy of the Content should not be relied upon andshould be independently verified with primary sources of information. Taylor and Francis shall not be liable forany losses, actions, claims, proceedings, demands, costs, expenses, damages, and other liabilities whatsoeveror howsoever caused arising directly or indirectly in connection with, in relation to or arising out of the use ofthe Content.
This article may be used for research, teaching, and private study purposes. Any substantial or systematicreproduction, redistribution, reselling, loan, sub-licensing, systematic supply, or distribution in anyform to anyone is expressly forbidden. Terms & Conditions of access and use can be found at http://www.tandfonline.com/page/terms-and-conditions
Roeper Review, 33:97–108, 2011Copyright © The Roeper InstituteISSN: 0278-3193 print / 1940-865X onlineDOI: 10.1080/02783193.2011.554157
Teachers’ Beliefs About Culturally,Linguistically, and Economically Diverse Gifted
Students: A Quantitative Study
Catharina F. de Wet and E. Jean Gubbins
This study investigated teachers’ beliefs about culturally, linguistically, and economicallydiverse (CLED) gifted students. The newly developed Teachers’ Beliefs About Culturally,Linguistically, and Economically Diverse Gifted Students Survey was administered to a strat-ified, random sample of 4,000 teachers from eight states. Three hundred and eight responses(7.7% response rate) were received. Respondents believed that it would benefit gifted programsif CLED students were included and above-average abilities were found in all economic strataand cultural groups and that IQ and standardized tests do not accurately reflect the abilitiesof CLED students. Through multivariate analyses of variance, significant group differenceswere found on two factors of the survey based on whether respondents worked in states withmandates for gifted education or not.
Keywords: CLED, diverse, epistemology, gifted, gifted programming, identification, survey,teachers’ beliefs, underrepresentation
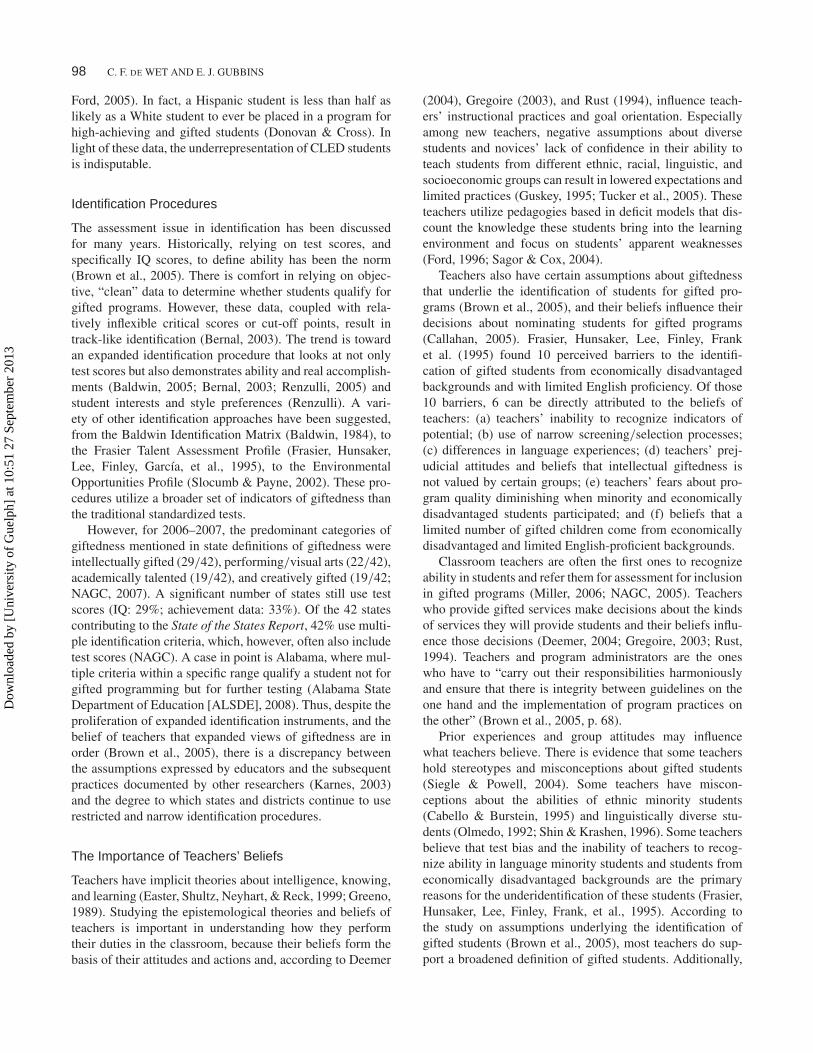
The purpose of this study was to understand what teach-ers believe about the ability of culturally, linguistically, andeconomically diverse (CLED) students, how they should beidentified, and whether and how gifted programs shouldbe changed to accommodate these students. Previous tothis study, there has been no baseline information aboutwhat teachers believe about the potential of CLED students.Studies have been conducted about various similar questions,but those studies targeted smaller groups of teachers and allwere in limited geographic areas, often single school dis-tricts. Other studies have looked at teachers’ conceptions ofgiftedness (Miller, 2006), identification issues (Brown et al.,2005; Siegle & Powell, 2003) or teachers’ beliefs about spe-cific ethnic groups. This study provides baseline informationabout the beliefs that teachers across the country hold aboutCLED gifted students.
Received 17 April 2009; accepted 30 June 2009.Address correspondence to E. Jean Gubbins, The National Research
Center on the Gifted and Talented, University of Connecticut, 2131Hillside Road, Unit 3007, Storrs, CT 06269-3007. E-mail: [email protected]
INCLUDING CLED GIFTED STUDENTSIN GIFTED PROGRAMS
Disparity
Most gifted programs serve students who are White, mid-dle class, and easily identifiable by objective means such asstandardized tests (Boutelle, 2008; Briggs, Reis, & Sullivan,2008; Frasier, Hunsaker, Lee, Finley, García, et al., 1995;Karnes, 2003). According to the State of the States Report(National Association of Gifted Children [NAGC], 2005),the average proportion of Caucasian students in states whoreported the identification of gifted students by cultur-ally diverse groups was 76%. Black and American Indianchildren are overrepresented in special education classes(Donovan & Cross, 2002). Black children, for example,comprise 17% of the total public-school enrollment but rep-resent 22% of children classified as belonging to one ofthe categories of disability as defined by law. In compari-son, only 8% of all public-school children are so classified(National Center for Educational Statistics [NCES], 2005).Conversely, minority students (with the exception of Asians)are less likely to be placed in gifted programs (Lohman,2005; Naglieri, 1997; Naglieri & Ford, 2003; Naglieri &
Dow
nloa
ded
by [
Uni
vers
ity o
f G
uelp
h] a
t 10:
51 2
7 Se
ptem
ber
2013
98 C. F. DE WET AND E. J. GUBBINS
Ford, 2005). In fact, a Hispanic student is less than half aslikely as a White student to ever be placed in a program forhigh-achieving and gifted students (Donovan & Cross). Inlight of these data, the underrepresentation of CLED studentsis indisputable.
Identification Procedures
The assessment issue in identification has been discussedfor many years. Historically, relying on test scores, andspecifically IQ scores, to define ability has been the norm(Brown et al., 2005). There is comfort in relying on objec-tive, “clean” data to determine whether students qualify forgifted programs. However, these data, coupled with rela-tively inflexible critical scores or cut-off points, result intrack-like identification (Bernal, 2003). The trend is towardan expanded identification procedure that looks at not onlytest scores but also demonstrates ability and real accomplish-ments (Baldwin, 2005; Bernal, 2003; Renzulli, 2005) andstudent interests and style preferences (Renzulli). A vari-ety of other identification approaches have been suggested,from the Baldwin Identification Matrix (Baldwin, 1984), tothe Frasier Talent Assessment Profile (Frasier, Hunsaker,Lee, Finley, García, et al., 1995), to the EnvironmentalOpportunities Profile (Slocumb & Payne, 2002). These pro-cedures utilize a broader set of indicators of giftedness thanthe traditional standardized tests.
However, for 2006–2007, the predominant categories ofgiftedness mentioned in state definitions of giftedness wereintellectually gifted (29/42), performing/visual arts (22/42),academically talented (19/42), and creatively gifted (19/42;NAGC, 2007). A significant number of states still use testscores (IQ: 29%; achievement data: 33%). Of the 42 statescontributing to the State of the States Report, 42% use multi-ple identification criteria, which, however, often also includetest scores (NAGC). A case in point is Alabama, where mul-tiple criteria within a specific range qualify a student not forgifted programming but for further testing (Alabama StateDepartment of Education [ALSDE], 2008). Thus, despite theproliferation of expanded identification instruments, and thebelief of teachers that expanded views of giftedness are inorder (Brown et al., 2005), there is a discrepancy betweenthe assumptions expressed by educators and the subsequentpractices documented by other researchers (Karnes, 2003)and the degree to which states and districts continue to userestricted and narrow identification procedures.
The Importance of Teachers’ Beliefs
Teachers have implicit theories about intelligence, knowing,and learning (Easter, Shultz, Neyhart, & Reck, 1999; Greeno,1989). Studying the epistemological theories and beliefs ofteachers is important in understanding how they performtheir duties in the classroom, because their beliefs form thebasis of their attitudes and actions and, according to Deemer
(2004), Gregoire (2003), and Rust (1994), influence teach-ers’ instructional practices and goal orientation. Especiallyamong new teachers, negative assumptions about diversestudents and novices’ lack of confidence in their ability toteach students from different ethnic, racial, linguistic, andsocioeconomic groups can result in lowered expectations andlimited practices (Guskey, 1995; Tucker et al., 2005). Theseteachers utilize pedagogies based in deficit models that dis-count the knowledge these students bring into the learningenvironment and focus on students’ apparent weaknesses(Ford, 1996; Sagor & Cox, 2004).
Teachers also have certain assumptions about giftednessthat underlie the identification of students for gifted pro-grams (Brown et al., 2005), and their beliefs influence theirdecisions about nominating students for gifted programs(Callahan, 2005). Frasier, Hunsaker, Lee, Finley, Franket al. (1995) found 10 perceived barriers to the identifi-cation of gifted students from economically disadvantagedbackgrounds and with limited English proficiency. Of those10 barriers, 6 can be directly attributed to the beliefs ofteachers: (a) teachers’ inability to recognize indicators ofpotential; (b) use of narrow screening/selection processes;(c) differences in language experiences; (d) teachers’ prej-udicial attitudes and beliefs that intellectual giftedness isnot valued by certain groups; (e) teachers’ fears about pro-gram quality diminishing when minority and economicallydisadvantaged students participated; and (f) beliefs that alimited number of gifted children come from economicallydisadvantaged and limited English-proficient backgrounds.
Classroom teachers are often the first ones to recognizeability in students and refer them for assessment for inclusionin gifted programs (Miller, 2006; NAGC, 2005). Teacherswho provide gifted services make decisions about the kindsof services they will provide students and their beliefs influ-ence those decisions (Deemer, 2004; Gregoire, 2003; Rust,1994). Teachers and program administrators are the oneswho have to “carry out their responsibilities harmoniouslyand ensure that there is integrity between guidelines on theone hand and the implementation of program practices onthe other” (Brown et al., 2005, p. 68).
Prior experiences and group attitudes may influencewhat teachers believe. There is evidence that some teachershold stereotypes and misconceptions about gifted students(Siegle & Powell, 2004). Some teachers have miscon-ceptions about the abilities of ethnic minority students(Cabello & Burstein, 1995) and linguistically diverse stu-dents (Olmedo, 1992; Shin & Krashen, 1996). Some teachersbelieve that test bias and the inability of teachers to recog-nize ability in language minority students and students fromeconomically disadvantaged backgrounds are the primaryreasons for the underidentification of these students (Frasier,Hunsaker, Lee, Finley, Frank, et al., 1995). According tothe study on assumptions underlying the identification ofgifted students (Brown et al., 2005), most teachers do sup-port a broadened definition of gifted students. Additionally,
Dow
nloa
ded
by [
Uni
vers
ity o
f G
uelp
h] a
t 10:
51 2
7 Se
ptem
ber
2013

TEACHERS’ BELIEFS ABOUT CLED GIFTED 99
“[t]hey favor the use of individual expression criteria, ongo-ing assessment, multiple criteria for identification, and con-sideration of contextual factors” (p. 68). It seems that somebeliefs might have changed since the 1995 study by Frasier,Hunsaker, Lee, Finley, Frank, et al. (1995), but whetherbeliefs have changed enough to influence a change in identi-fication procedures is still an open question.
There are several questions that need to be addressed:Why have identification procedures not significantlychanged? Why are there so few CLED students included ingifted programs? Do teachers believe that CLED studentshave the ability to perform at high academic achievementlevels? Should identification procedures change to includemore CLED gifted students? Should gifted programs changeto accommodate the strengths and needs of CLED gifted stu-dents? To answer these questions, this study was designed toprovide baseline data on a national scale that directly addressthese questions about what teachers believe about the poten-tial of CLED gifted students and their involvement in giftedprograms.
RESEARCH QUESTIONS
Teachers’ beliefs about culturally, linguistically, and eco-nomically diverse gifted students were studied by focusingon the following research questions:
1. What are teachers’ core beliefs about culturally, lin-guistically, and economically diverse (CLED) giftedstudents regarding their abilities, perspectives involv-ing CLED students in gifted programs, and benefits ofincluding CLED students in gifted programs?
2. Are the sample means the same or different for thescores on the dependent variables with respect tothe heterogeneity of the school population in whichresponding teachers serve (White or CLED), train-ing teachers have had (general classroom, bilingual,and/or gifted education), and existence of a mandatefor gifted education (with or without)?
METHODOLOGY
To answer these questions, the Teachers’ Beliefs AboutCulturally, Linguistically, and Economically Diverse GiftedStudents Survey (De Wet, 2005) was administered to a strat-ified random sample of 4,000 teachers from eight states. Thestates were selected by coloring a map of the country usingone color for states with mandates for gifted education andanother color for states with no mandate for gifted education.Four states in each color were purposefully selected from themap to obtain a relative geographic spread. Selected stateswere then checked for diversity so that respondents wouldhave some knowledge or experience base for answering the
questions. The states with a mandate were Florida, Georgia,Texas, and Virginia. The states without a mandate wereCalifornia, Colorado, Illinois, and Massachusetts.
The survey consisted of 21 demographic questions relat-ing to gender, ethnicity, and age information, as well as theexperience and training of participants. Section 2 containeda 30-item, 5-point Likert-scale survey, asking participants torespond on a scale of 1 (strongly disagree) to 5 (stronglyagree). A total of 308 responses was received. This consti-tutes a response rate of 7.7%. This is a low response ratecompared to the expectations of Dillman (2000) of 80%.Simsek and Veiga (2001) expect low to medium responserates for mail surveys. Reported response rates in educationalstudies for mail surveys range between 28% and 60% (Fiala,2004; Larson, 2005; Paolo, Bonaminio, Gibson, Partridge, &Kallail, 2000), although response rates as low as 2.56% havebeen reported (Balch, 2008). Several measures were takenin this study to maximize participant response. Respondentswere given two response options: returning the paper surveyin a self-addressed, postage-paid envelope, and the abilityto respond electronically to the survey online. Due to costconsiderations, respondents in this study were not offered anincentive, which has been shown to increase response rates. Itis generally accepted that multiple contacts and personaliza-tion increase response rates (Dillman). In the present study,surveys and follow-up postcards were sent to personal namesand addresses. Follow-up postcards were sent to all 4,000people one month after the surveys were mailed to thankthose respondents who had already replied and to remindthose who had not that they still had the opportunity to sendthe paper version back or complete the electronic version.
Why the response was low is difficult to determine, butthe low response rate for this study has implications for thegeneralizability of the study. Not responding might be dueto any number of factors but also due to inherent bias. It isdifficult to know how the nonrespondents were like or unlikethe respondents, except in comparing them with known dataon teacher characteristics.
Description of Demographic Characteristicsof Sample
Analysis of demographic information was based on N = 308.The demographic characteristics of the sample are similarto NCES (2005) data about the national teacher workforce.Table 1 compares the sample characteristics to the NCESteacher data.
An overwhelming number of respondents were White(83.8%) and female (90.3%). Teachers who responded tothis survey were mostly older, with the largest percentage(32.5%) in the age group between 51 and 60, with morethan a third having over 20 years of teaching experience,and more than 50% holding a master’s degree. They wereworking in third grade (20%), in fourth grade (23%), in fifth
Dow
nloa
ded
by [
Uni
vers
ity o
f G
uelp
h] a
t 10:
51 2
7 Se
ptem
ber
2013

100 C. F. DE WET AND E. J. GUBBINS
TABLE 1Comparison of National Teacher Characteristics and Study
Sample Characteristics
Characteristic NCES data 2003 Sample data (%)
GenderMale 21% 7.8Female 79% 90.3
EthnicityNon-Hispanic White 83% 83.8African American/Black 8% 5.5Hispanic 6% 6.5Average age in years 42.5
Age<22 .622–30 12.331–40 16.941–50 28.951–60 32.560+ 6.8Missing 1.9
grade (31%), as gifted specialists (28%), and as bilingual-education specialists (17%). A number of teachers had nospecialized training. Fifty-five (17.9%) teachers indicatedthat they had no gifted education training, 76 (24.7%) saidthat they had no bilingual education training, and 5% ofteachers had neither gifted nor bilingual training. There were80 teachers certified as bilingual teachers and the samenumber was certified in gifted education, and 12 teachers,or 4%, held certification as both gifted and bilingual educa-tion teachers. A summary of work-related characteristics ispresented in Table 2.
Similar numbers of teachers were from each of the eightstates (33–36), except Colorado (55). Respondents fromstates with a mandate for gifted education (142) were slightlyfewer than teachers from states without a mandate for giftededucation (156).
Exploratory Factor Analysis on Survey Data
The 30 items of the Teachers’ Beliefs About Culturally,Linguistically, and Economically Diverse Gifted StudentsSurvey (De Wet, 2005) were subjected to principal compo-nents analysis (PCA) in SPSS (SPSS for Windows, 13.0,SSPS Inc., Chicago, Illinois) with varimax rotation. Thenumber of responses (308) was adequate under this crite-rion. Secondly, Kaiser-Meyer-Olkin (KMO) and Bartlett’stest results were inspected. This analysis yielded a Kaiser-Meyer-Olkin measure of sampling adequacy of .894 and asignificant Bartlett’s test of sphericity value (χ2 = 2,971.251,df = 435, p < .001), indicating that the sample was indeedadequate for analysis.
Principal component analysis was used to describe thelinear relationships among variables and to extract a lim-ited number of factors. Once the results of the initial factoranalysis were rendered, a decision about how many factors
TABLE 2Description of Training and Work Characteristics
of the Sample (N = 308)
Characteristic N %
Work categoryThird-grade teacher 61 19.8Fourth-grade teacher 71 23.1Fifth-grade teacher 95 30.8Gifted specialist 86 27.9Bilingual specialist 53 17.2
Years of teaching experience1–2 years 7 2.33–5 years 37 12.06–10 years 54 17.511–15 years 54 17.516–20 years 35 11.420+ years 115 37.2Missing 6 1.9
Highest degree attainedBA/BS 107 34.7MA/MS 165 53.6Sixth-year/specialist 22 7.1PhD/EdD 9 2.9Missing 5 1.6
Gifted education traininga
No gifted training 55 17.9Gifted district in-service 149 48.4Workshop outside district 90 29.2Coursework in gifted education 110 35.7
Bilingual education traininga
No bilingual training 76 24.7Bilingual district in-service 139 45.1Workshop outside district 47 15.3Coursework in bilingual education 94 30.5Neither gifted nor bilingual training 17 5.5
CertificationGifted education 80 26Bilingual education 80 26Both 12 3.9
Note. aPercentages do not add up to 100% because respondents couldselect more than 1 answer.
should be extracted were made on the basis of the Kaiser cri-teria (Kaiser, 1960) and the screeplot (Cattell, 1966). In thisanalysis, six factors had eigenvalues over 1. The screeplotindicated that three factors might be retained.
Results of Factor Analysis
Items with factor loadings of .4 and above were retainedin factors (considered a strong loading by Pallant [2007]),and the items with multiple loadings of .4 and higher wereeliminated to obtain a clean factor structure (Hair, Anderson,Tatham, & Black, 1995). Item 4 had to be deleted due to alow communality (< .4). Two items (23 and 27) were deletedfrom the reliability analysis due to strong double loadings.The resulting three factors were (a) benefits of includingCLED students in gifted programs; (b) universality of abili-ties; and (c) assessment of abilities. These factors accounted
Dow
nloa
ded
by [
Uni
vers
ity o
f G
uelp
h] a
t 10:
51 2
7 Se
ptem
ber
2013

TEACHERS’ BELIEFS ABOUT CLED GIFTED 101
for 41.09% of the variance and were subjected to reliabilityanalysis.
Results of Reliability Analysis
Factor 1: Benefits of including CLED students in giftedprograms. This factor comprised 9 items andyielded a Cronbach’s alpha of .876. Item meanon the scale was 4.070 with a minimum of3.598 and a maximum value of 4.323.
Factor 2: Universality of abilities comprised 6 items andyielded a Cronbach’s alpha of .734. Item meanon the factor was 4.300 with a minimum of3.980 and a maximum value of 4.673.
Factor 3: Assessment of abilities were composed of 6items and yielded a Cronbach’s alpha of .717.Item mean on the factor was 3.791 with aminimum of 3.502 and a maximum of 4.181.
Scale scores were used in subsequent data analysis toanswer the research questions. Scale scores were computedby creating a new variable comprised of the sum scores.Table 3 gives item means and standard deviations for eachof the factor items.
RESEARCH QUESTION 1
“What are teachers’ beliefs about culturally, linguistically,and economically diverse (CLED) gifted students regardingtheir abilities, perspectives involving CLED students ingifted programs, and the benefits of including CLED stu-dents in gifted programs?” Teachers who responded to thissurvey were largely in agreement that CLED students havestrengths that can benefit gifted programs and gifted studentsalready in gifted programs. On the 5-point Likert scale usedin this survey, a value of 5.00 signified I strongly agree anda value of 1.00 signified I strongly disagree.
TABLE 3Item Means and Standard Deviations of Factor Items
Item M SD
Factor 1: Benefits of including CLED students in gifted programs (α = .876)6. Broader cultural experiences brought to the gifted classroom by CLED students will benefit
students already in gifted programs.4.27 .77
7. Gifted students already in gifted programs can benefit from the linguistic abilities of giftedCLED students.
4.25 .80
24. Modifying instruction to accommodate CLED students does not imply watering down thegifted program.
4.00 .97
9. Modifying curriculum to accommodate gifted CLED students will also benefit gifted studentsalready in gifted programs.
3.60 1.01
16. Attributes of CLED students like resilience and perseverance will benefit students already ingifted programs.
3.98 .82
5. It is essential that gifted programs include CLED students. 4.12 1.0126. Gifted CLED students may benefit from a curriculum that recognizes their cultural strengths. 4.32 .702Rev. Students already in gifted programs will (not) have fewer services if gifted programs are
changed to accommodate CLED students.3.91 1.05
29. Students who have experience in more than one culture have strengths that will help themsucceed in gifted programs.
3.97 .82
Factor 2: Universality of abilities (α = .743)25. Gifted students are found in all economic strata, cultural, and linguistic groups. 4.67 .6014. Above average abilities can be demonstrated in many different ways. 4.59 .6711. Identification procedures for gifted programs should be constructed in such a way that they
identify all students of high ability and potential to achieve.4.39 .85
18. CLED students possess the same range of abilities as other students. 4.12 .9422. Free or reduced lunch students have a similar range of potential abilities to other students. 4.05 .93
1. CLED students are able to perform as well as other students in advanced academic programs. 3.98 1.01Factor 3: Assessment of abilities (α = .717)
19Rev. Standardized tests administered in English can (not) accurately assess the abilities ofCLED students.
4.05 .86
21Rev. IQ tests are (not) accurate reflections of CLED students’ potential academic abilities. 3.57 .9423. CLED students often demonstrate their abilities in ways not measured by standardized tests. 4.18 .7817. Gifted CLED students have strengths that are not adequately assessed by current identification
procedures for gifted programs.3.65 .93
27Rev. Changing gifted programs to accommodate gifted CLED students is (not) too expensive. 3.79 .9030. CLED students demonstrate abilities in ways that are different from White, English speaking
students.3.50 .92
Note. On reverse-scored items, the negative in parentheses gives the statement with which respondents agreed.
Dow
nloa
ded
by [
Uni
vers
ity o
f G
uelp
h] a
t 10:
51 2
7 Se
ptem
ber
2013

102 C. F. DE WET AND E. J. GUBBINS
The Benefits of Including CLED Gifted Students
Teachers responding to this survey believed that “It isessential that gifted programs include CLED students”(M = 4.10; SD = 1.02). Only 2% of respondents stronglydisagreed with this statement. Those who agreed believedthat including gifted CLED students in gifted programswould benefit gifted students already in programs. For exam-ple, they responded positively (M = 4.25; SD = .79) to thestatement, “Gifted students already in gifted programs canbenefit from the linguistic abilities of gifted CLED stu-dents.” Only 4% of respondents disagreed. Those who agreedbelieved that “Attributes of CLED students like resilienceand perseverance will benefit students already in giftedprograms” (M = 3.98; SD = .82), with over 75% agreeing.They also believed that the changes needed to help CLEDgifted students succeed would not harm students alreadyin gifted programs but may benefit those students and oth-ers. “Modifying curriculum to accommodate gifted CLEDstudents will also benefit gifted students already in giftedprograms” (M = 3.59; SD = 1.01) garnered strong agree-ment, with about 60% agreeing. They also agreed with thestatement, “Other talented students who are not necessarilyhigh academic achievers will benefit from identificationprocedures that accommodate CLED students” (M = 3.71;SD = .93), with almost two thirds of respondents agree-ing. They did not believe that “Changing gifted programsto accommodate gifted CLED students is too expensive”(M = 2.21; SD = .90). Only 6% agreed with this statement.On the whole, teachers believed that it would be beneficial toinclude CLED students in gifted programs.
Abilities of CLED Students
Teachers believed that CLED students have the abilitiesnecessary to succeed in gifted programs. Only 9% of respon-dents agreed with the statement, “Few CLED studentswith abilities succeed in gifted programs” (M = 2.40 andSD = .95). Teachers overwhelmingly agreed that, “CLEDstudents possess the same range of abilities as other stu-dents” (M = 4.1; SD = .94). Only 10% of respondents dis-agreed, and over 80% of the respondents agreed. The highestpercentage of agreement was in response to “Above aver-age abilities can be demonstrated in many different ways”(M = 4.59; SD = .66), with 95% of respondents agreeing.Only 1% of respondents disagreed. The high mean andrelatively low standard deviation are further indications ofa high measure of agreement on this statement. Anotherstatement had even less disagreement. “Gifted students arefound in all economic strata, cultural, and linguistic groups”(M = 4.65; SD = .60). This was the lowest standard deviationin the survey, indicating very little disagreement, with 96%of respondents agreeing with the statement. Based on thesedata, teachers agree that CLED students can be gifted andhave abilities commensurate with other students.
Identification Procedures
Teachers had strongly defined opinions on identification pro-cedures currently in practice for gifted programs. Almost60% of respondents disagreed with the statement, “IQ testsare accurate reflections of CLED students’ potential aca-demic abilities” (M = 2.42; SD = .93). Most of the respon-dents believed that “CLED students demonstrate abilities inways that are different from White, English-speaking stu-dents” (M = 3.51; SD = .92), with 53% agreeing. A largenumber of respondents were neutral on this issue (31%).Teachers were split in their opinions on the statement,“Because of gaps in prior learning, gifted CLED students donot qualify for gifted services” (M = 2.99 and SD = 1.17).On this statement, 37% indicated disagreement, 23% wereneutral, and about 39% agreed. However, there was little dis-agreement on “Identification procedures for gifted programsshould be constructed in such a way that they identify allstudents of high ability and potential to achieve” (M = 4.39;SD = .85). Ninety-three percent agreed, with 58% stronglyagreeing with this statement.
Almost every item in the survey received answers from 1to 5, indicating a wide range of beliefs about CLED stu-dents and current practice in gifted programs. However, theresponses were for the most part overwhelmingly in favor ofincluding CLED students in gifted programs, with only smallpercentages of respondents against the notion.
RESEARCH QUESTION 2
“Are the sample means the same or different for the scoreson the dependent variables with respect to the heterogeneityof the school population in which responding teachers serve(White or CLED), training teachers have had (general class-room, bilingual, and/or gifted education), and existence of amandate for gifted education (with or without)?”
Construction of Heterogeneity Variable
To answer Question 2, independent variables had to beconstructed. Heterogeneity of schools had two levels: yes(diverse) and no (White). Respondents taught in schoolsthat were either considered to be diverse (25% or moreminority students) or White (75% or more White students).Even though heterogeneity is often used as a distinguish-ing term in the literature, few authors have defined the term.Heterogeneity is often described in terms of the Herfindahlindex of racial diversity where the higher the index,the greater the diversity (Campbell, 2005). The HooverInstitution defines racially heterogeneous schools as thosewith four or more racial subgroups (Kane, Staiger, &Geppert, 2002). What constitutes a racial subgroup differsfrom state to state. In California, to be numerically signifi-cant, a group must represent at least 15% of the student body
Dow
nloa
ded
by [
Uni
vers
ity o
f G
uelp
h] a
t 10:
51 2
7 Se
ptem
ber
2013
TEACHERS’ BELIEFS ABOUT CLED GIFTED 103
and contain more than 30 students or represent more than100 students regardless of their percentage. In Texas in theacademic year 1999–2000, a racial or ethnic subgroup wasrequired to represent at least 10% of the student body and 30students to count as a separate subgroup (Kane et al., 2002).Because there seems to be no agreement on what constitutesheterogeneity, researchers made the decision to use 25%as a cutoff point after discussions with several colleagueswho work with CLED gifted students. With this criterion,schools with 75% or more White students were classified ashomogeneous.
Published enrollment data of school districts were usedto calculate the heterogeneity of schools. Information aboutschool enrollment was checked on each state departmentwebsite when available and on the Great Schools infor-mational website (http://www.greatschools.org). Where adiscrepancy was found, the state department website infor-mation was used.
Multivariate Analysis of Variance
The dependent variables were the factors extracted by fac-tor analysis of the responses to the survey in this study.Wilks’ lambda was used to test for significant differencesbetween the groups, providing the assumptions for mul-tivariate analysis of variance were met. The alpha levelset for the multivariate analyses of variance (MANOVA)had to be adjusted because multiple analyses of varianceincrease the chances of committing Type I error (findingsignificance where there is none). Usually it is suggestedthat a Bonferroni adjustment should be made by dividingthe alpha (.05) by the number of analyses (Tabachnik &Fidell, 1996). For this study, using this Bonferroni adjust-ment resulted in an alpha value of .017. Despite the fact thata stringent alpha value increases the likelihood of commit-ting a Type II error (not finding significance when it doesexist), analysis proceeded at α = .017.
Sample size was adequate for one-way MANOVAs. Thereshould be more cases in each cell than there are dependentvariables (Pallant, 2005). We decided not to use a three-way MANOVA for analysis because cell sizes would becometoo small for analysis on the teacher training independentvariable.
Data Analysis
To further explore the nature of teachers’ beliefs about giftedCLED students in gifted programs, means of responsesas measured by benefits of including CLED students ingifted programs, universality of abilities, and assessment ofabilities were compared.
Heterogeneity of Schools
A one-way between-groups multivariate analysis ofvariance was conducted to assess whether there were
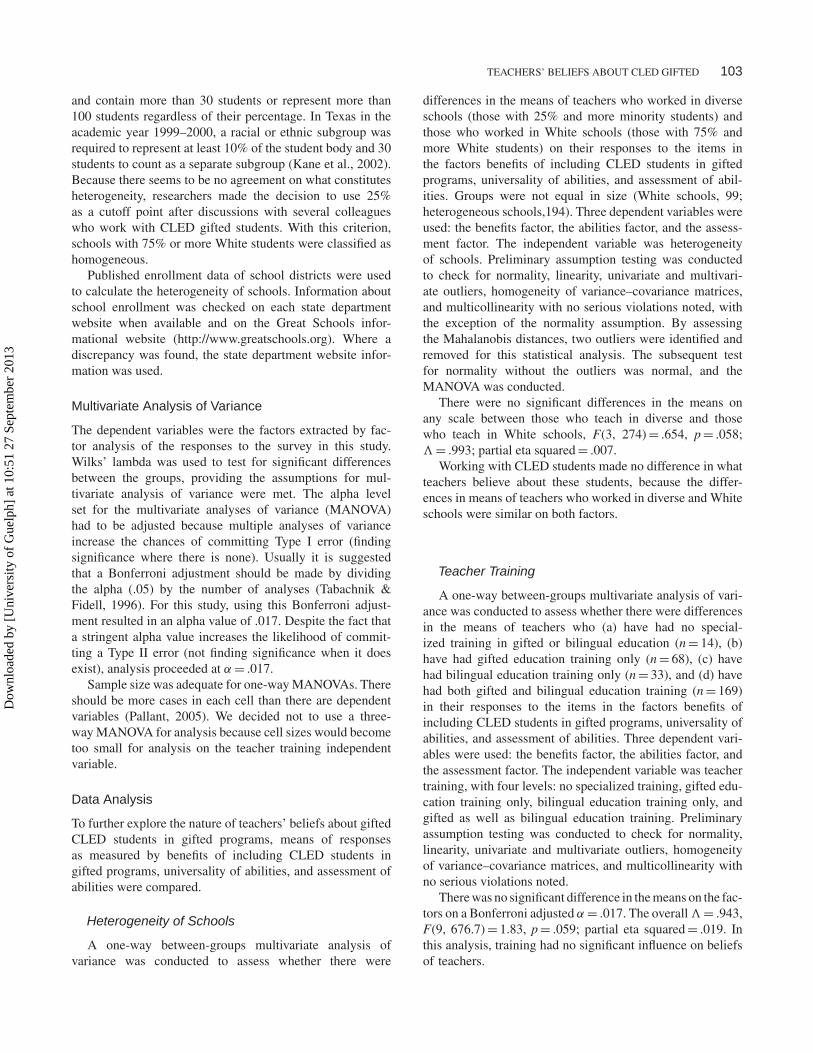
differences in the means of teachers who worked in diverseschools (those with 25% and more minority students) andthose who worked in White schools (those with 75% andmore White students) on their responses to the items inthe factors benefits of including CLED students in giftedprograms, universality of abilities, and assessment of abil-ities. Groups were not equal in size (White schools, 99;heterogeneous schools,194). Three dependent variables wereused: the benefits factor, the abilities factor, and the assess-ment factor. The independent variable was heterogeneityof schools. Preliminary assumption testing was conductedto check for normality, linearity, univariate and multivari-ate outliers, homogeneity of variance–covariance matrices,and multicollinearity with no serious violations noted, withthe exception of the normality assumption. By assessingthe Mahalanobis distances, two outliers were identified andremoved for this statistical analysis. The subsequent testfor normality without the outliers was normal, and theMANOVA was conducted.
There were no significant differences in the means onany scale between those who teach in diverse and thosewho teach in White schools, F(3, 274) = .654, p = .058;�= .993; partial eta squared = .007.
Working with CLED students made no difference in whatteachers believe about these students, because the differ-ences in means of teachers who worked in diverse and Whiteschools were similar on both factors.
Teacher Training
A one-way between-groups multivariate analysis of vari-ance was conducted to assess whether there were differencesin the means of teachers who (a) have had no special-ized training in gifted or bilingual education (n = 14), (b)have had gifted education training only (n = 68), (c) havehad bilingual education training only (n = 33), and (d) havehad both gifted and bilingual education training (n = 169)in their responses to the items in the factors benefits ofincluding CLED students in gifted programs, universality ofabilities, and assessment of abilities. Three dependent vari-ables were used: the benefits factor, the abilities factor, andthe assessment factor. The independent variable was teachertraining, with four levels: no specialized training, gifted edu-cation training only, bilingual education training only, andgifted as well as bilingual education training. Preliminaryassumption testing was conducted to check for normality,linearity, univariate and multivariate outliers, homogeneityof variance–covariance matrices, and multicollinearity withno serious violations noted.
There was no significant difference in the means on the fac-tors on a Bonferroni adjusted α = .017. The overall � = .943,F(9, 676.7) = 1.83, p = .059; partial eta squared = .019. Inthis analysis, training had no significant influence on beliefsof teachers.
Dow
nloa
ded
by [
Uni
vers
ity o
f G
uelp
h] a
t 10:
51 2
7 Se
ptem
ber
2013
104 C. F. DE WET AND E. J. GUBBINS
Mandate for Gifted Education
A one-way between-groups multivariate analysis of vari-ance was conducted to assess whether there were differencesin the mean scores of teachers who worked in states witha mandate for gifted education (n = 142) and those whoworked in states without a mandate for gifted education(n = 154) on their responses to the items on the three fac-tors benefits of including CLED students in gifted programs,universality of abilities, and assessment of abilities. Threedependent variables were used: the benefits factor, the abil-ities factor, and the assessment factor. The independentvariable was mandate. Preliminary assumption testing wasconducted to check for normality, linearity, univariate andmultivariate outliers, homogeneity of variance–covariancematrices, and multicollinearity with no serious violationsnoted.
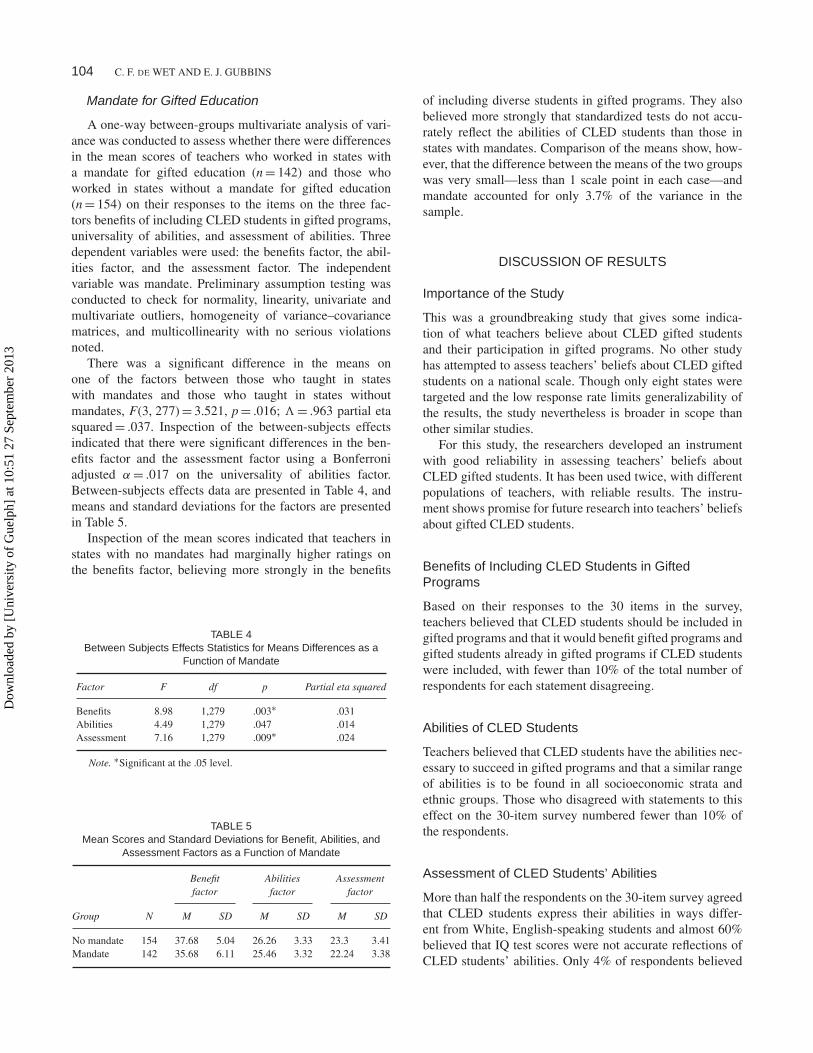
There was a significant difference in the means onone of the factors between those who taught in stateswith mandates and those who taught in states withoutmandates, F(3, 277) = 3.521, p = .016; � = .963 partial etasquared = .037. Inspection of the between-subjects effectsindicated that there were significant differences in the ben-efits factor and the assessment factor using a Bonferroniadjusted α = .017 on the universality of abilities factor.Between-subjects effects data are presented in Table 4, andmeans and standard deviations for the factors are presentedin Table 5.
Inspection of the mean scores indicated that teachers instates with no mandates had marginally higher ratings onthe benefits factor, believing more strongly in the benefits
TABLE 4Between Subjects Effects Statistics for Means Differences as a
Function of Mandate
Factor F df p Partial eta squared
Benefits 8.98 1,279 .003∗ .031Abilities 4.49 1,279 .047 .014Assessment 7.16 1,279 .009∗ .024
Note. ∗Significant at the .05 level.
TABLE 5Mean Scores and Standard Deviations for Benefit, Abilities, and
Assessment Factors as a Function of Mandate
Benefit Abilities Assessmentfactor factor factor
Group N M SD M SD M SD
No mandate 154 37.68 5.04 26.26 3.33 23.3 3.41Mandate 142 35.68 6.11 25.46 3.32 22.24 3.38
of including diverse students in gifted programs. They alsobelieved more strongly that standardized tests do not accu-rately reflect the abilities of CLED students than those instates with mandates. Comparison of the means show, how-ever, that the difference between the means of the two groupswas very small—less than 1 scale point in each case—andmandate accounted for only 3.7% of the variance in thesample.
DISCUSSION OF RESULTS
Importance of the Study
This was a groundbreaking study that gives some indica-tion of what teachers believe about CLED gifted studentsand their participation in gifted programs. No other studyhas attempted to assess teachers’ beliefs about CLED giftedstudents on a national scale. Though only eight states weretargeted and the low response rate limits generalizability ofthe results, the study nevertheless is broader in scope thanother similar studies.
For this study, the researchers developed an instrumentwith good reliability in assessing teachers’ beliefs aboutCLED gifted students. It has been used twice, with differentpopulations of teachers, with reliable results. The instru-ment shows promise for future research into teachers’ beliefsabout gifted CLED students.
Benefits of Including CLED Students in GiftedPrograms
Based on their responses to the 30 items in the survey,teachers believed that CLED students should be included ingifted programs and that it would benefit gifted programs andgifted students already in gifted programs if CLED studentswere included, with fewer than 10% of the total number ofrespondents for each statement disagreeing.
Abilities of CLED Students
Teachers believed that CLED students have the abilities nec-essary to succeed in gifted programs and that a similar rangeof abilities is to be found in all socioeconomic strata andethnic groups. Those who disagreed with statements to thiseffect on the 30-item survey numbered fewer than 10% ofthe respondents.
Assessment of CLED Students’ Abilities
More than half the respondents on the 30-item survey agreedthat CLED students express their abilities in ways differ-ent from White, English-speaking students and almost 60%believed that IQ test scores were not accurate reflections ofCLED students’ abilities. Only 4% of respondents believed
Dow
nloa
ded
by [
Uni
vers
ity o
f G
uelp
h] a
t 10:
51 2
7 Se
ptem
ber
2013

TEACHERS’ BELIEFS ABOUT CLED GIFTED 105
that identification procedures for gifted programs should notchange to accommodate CLED students.
The beliefs of teachers concerning the participation ofCLED students in gifted programs as described in this studylargely agrees with the assumptions of teachers about iden-tification for gifted programs as described by Brown et al.(2005). It remains curious that given the beliefs of teachersas described in this study, participation of CLED studentsin gifted programs has not significantly increased in the last10 years. Teachers and program administrators are the oneswho have to “carry out their responsibilities harmoniously”(Brown et al., p. 68) amidst rules that regulate who theyteach and what they teach them. Perhaps the emphasis onmeasurable, number-driven data in the era of No Child LeftBehind accountability causes school administrators to bemore cautious about implementing the messier, less objec-tive multiple-criteria identification systems. We have seenthat objective test scores prejudice identification systemsagainst CLED students. The drive toward standards-basedand highly controlled curriculum in preparation for stan-dardized tests also constrains the freedom of teachers andprogram administrators to provide services appropriate forthese students. There might be a disconnect between whatregulations require and what teachers believe should occur.
Heterogeniety of Schools
Research Question 2 addressed the issue of the effect ofthe heterogeneity of schools where respondents to this studyworked. A one-way MANOVA assessed respondents’ ratingson the three factors extracted in factor analysis and found nostatistically significant differences between the two groups(those teaching in diverse schools and those teaching in Whiteschools) on the benefits, abilities, and assessment factors.
This outcome might be due to one of two issues: Theremight not be a difference in how teachers’ beliefs are affectedby the school environment where they work, or there mightbe a measurement error. It might be that teachers’ beliefsare influenced by a profound experience with even a singleperson from a diverse background and that the numbers ofdiverse contacts are not important. The nonsignificant out-come might also be due to the way the heterogeneity variablewas constructed. There was very little guidance in the avail-able literature on what constitutes heterogeneity in schools.A two-level variable, with the cutoff point at 25%/75% wasused in this analysis. It is possible that constructing the vari-able differently might have yielded a different outcome. Adifferent way might be to use the Herfindahl index for diver-sity. The construction of the variable would be much morecomplex but conceivably might yield a different outcome.
Teacher Training
Based on the literature examined before the study, it wasexpected that training would make a difference in what
teachers believed about CLED students. Ford, Harris, Tyson,and Trotman (2002) suggested that a lack of preparation inand sensitivity to the characteristics of gifted students hin-der teachers’ abilities to make fair and equitable referrals.Goodenough (2000) studied how teachers’ beliefs about gift-edness changed as a result of taking an introductory coursein gifted education. By the end of the class, participants sawgiftedness as occurring in a greater variety of domains andbeing expressed in a greater variety of ways compared totheir beliefs at the beginning of the class.
The MANOVA assessing group differences betweenteachers with varying kinds of training yielded no significantdifferences in the means of the four groups on the benefits,abilities, and assessment factors. This result was somewhatsurprising, although it agrees with Miller’s (2006) findingsin her study on the teachers’ perceptions of giftedness. Thisresult may be due to a real nonsignificant effect of train-ing on teachers’ beliefs, or it might be due to measurementerror. The variable was constructed as having four levels,no specialized training, gifted education training only, bilin-gual education training only, and a combination of gifted andbilingual education training. Any respondent who indicatedthat he or she had some training in either bilingual or giftededucation was considered to have had training, with no dis-tinction between amount and types of training. Respondentswith district in-service, out-of-district workshops, and col-lege courses were considered to have had the same amountof training. Making further distinctions in type of trainingmay yield different results.
Mandate for Gifted Education
Whether teachers worked in a state with a mandate forgifted education or not made a significant difference in howthey responded to the benefits and assessment factors. Thestates with a mandate targeted in this study were Florida,Georgia, Texas, and Virginia. The states without a man-date were California, Colorado, Illinois, and Massachusetts.Inspection of the mean scores indicated that teachers instates with no mandates had higher ratings on the bene-fits factor, with these teachers believing more strongly thatthere were benefits to including CLED students in giftedprograms than those who worked in states with mandates.Significant differences were also found in teachers’ beliefsconcerning the efficacy of standardized tests in assessing theabilities of CLED gifted students. Teachers from no-mandatestates believed more strongly that standardized tests did notmeasure these students’ abilities adequately. This might bedue to the fact that teachers in states with a mandate forgifted education have more experience with including CLEDstudents in existing gifted programs and the concomitantdifficulties in assessment and services for those students.The difference may also be due to the fact that teacherswho worked in states with a mandate for gifted educationwere influenced by the constraints put on CLED students by
Dow
nloa
ded
by [
Uni
vers
ity o
f G
uelp
h] a
t 10:
51 2
7 Se
ptem
ber
2013
106 C. F. DE WET AND E. J. GUBBINS
existing identification procedures and programming options.Teachers from such states were more likely to have had train-ing in gifted education and therefore might be trained to bemore convinced of the efficacy and usefulness of existingidentification procedures.
LIMITATIONS OF THE STUDY
The stratified random sample of teachers targeted in thisstudy was designed to give a representative view of teachers’beliefs about gifted CLED students. The small return rate isa limitation. Only 7.7% of teachers to whom surveys weresent chose to respond. Although similar numbers of teachersfrom different work categories responded and the distribu-tion on ethnicity, the gender of teachers who responded tothe survey agrees with national trends, and similar numbersof teachers responded from the eight selected states, it can-not be assumed that this small sample is representative of thenational population of teachers.
People who have strong views on either side of an issueare apt to respond to such a survey. This may be a limita-tion, because the responses may be skewed in some way. Thedata were investigated for violations of the normal distribu-tion assumption for data analysis and outliers were removedbefore analysis in an effort to mitigate this limitation, but itcannot be assumed that the respondents represent the viewsof the national teacher corps.
Because we selected states with and without mandates forgifted education the sample may have been biased. Mandatesmay influence the availability of gifted programs, the dis-tribution of resources across socioeconomic groups, and thelevels and kinds of training teachers might have. However,because one of the research questions addressed these differ-ences, researchers were able to make inferences concerningthe effect of a mandate for gifted education on teachers’beliefs about gifted CLED students.
SUGGESTIONS FOR FUTURE RESEARCH
The information provided by this study should be inter-preted with caution given these limitations, but the studyprovides indications of trends and highlights issues for futureresearch. Other avenues for research might be the following:
● Exploring the relationship between professional devel-opment and teachers’ beliefs.
● Exploring the relationship between mandate andteachers’ beliefs. Baker and Friedman-Nimz (2001,2002, 2004) studied policy, funding, and opportunityprovided by state and federal mandates but not theinfluence that mandates have on teachers’ beliefs.
● Addressing teachers’ responses to suggested changes ingifted programs.
CONCLUSION
It is encouraging that changes in gifted education practices areoccurring, albeit slowly. Many states report growth in propor-tionality of gifted program enrollment, and there are reports ofmany gifted programs designed specifically for CLED giftedstudents. This study may serve to shine a light of understand-ing on the core beliefs of teachers regarding these students,so that adequate steps may be taken to change perceptionsand practices to the benefit of culturally, linguistically, andeconomically diverse gifted students.
AUTHOR NOTE
Dr. Catharina F. de Wet was a talented researcher and scholar.As her former doctoral advisor, colleague, and friend, Ialways treasured my opportunities to work with her onresearch studies for The National Research Center on theGifted and Talented at the University of Connecticut. Shesought the best educational opportunities for students of allages and with her creative spirit, Catharina was able to makelearning a joyful experience for everyone.
REFERENCES
Alabama State Department of Education. (2008). Help documents for newand updated gifted forms. Retrieved from ftp://ftp.alsde.edu/documents/65/Help%20Document%20July%202008.pdf
Baker, B. D., & Freidman-Nimz, R. (2001, March). State policies andequal opportunity: A national analysis of the distribution of gifted educa-tion programs. Paper presented at the Annual Meeting of the AmericanEducation Finance Association, Cincinnati, OH.
Baker, B. D., & Friedman-Nimz, R. (2002). Is a federal mandate the answer?If so, what was the question? Roeper Review, 25, 5–10.
Baker, B. D., & Friedman-Nimz, R. (2004). State policies and equal oppor-tunity: The example of gifted education. Educational Evaluation andPolicy Analysis, 26(1), 39–64.
Balch, T. C. (2008). Identification of key counseling skills for highly effectiveschool administrators (Unpublished doctoral dissertation). Indiana StateUniversity, Terre Haute, IN.
Baldwin, A. Y. (1984). Baldwin Identification Matrix 2 for the identificationof gifted and talented. New York, NY: Royal Fireworks.
Baldwin, A. Y. (2005). Identification concerns and promises for giftedstudents of diverse populations. Theory Into Practice, 41, 105–114.
Bernal, E. M. (2003). To no longer educate the gifted: Programming forgifted students beyond the era of inclusion. Gifted Child Quarterly, 47,183–191.
Boutelle, M. (2008). School-wide success builds on ‘ExCEL’lent program.Education Digest, 74(1), 26–28.
Briggs, C. J., Reis, S. M., & Sullivan, E. (2008). A national view of promisingprograms and practices for culturally, linguistically, and ethnically diversegifted and talented students. Gifted Child Quarterly, 52, 131–145.
Brown, S. W., Renzulli, J. S., Gubbins, E. J., Siegle, D., Zhang, W., &Chen, C. (2005). Assumptions underlying the identification of gifted andtalented students. Gifted Child Quarterly, 49, 68–79.
Cabello, B., & Burstein, N. D. (1995). Examining teachers’ beliefs aboutteaching in culturally diverse classrooms. Journal of Teacher Education,46, 285–294.
Dow
nloa
ded
by [
Uni
vers
ity o
f G
uelp
h] a
t 10:
51 2
7 Se
ptem
ber
2013
TEACHERS’ BELIEFS ABOUT CLED GIFTED 107
Callahan, C. M. (2005). Identifying gifted students from underrepresentedpopulations. Theory Into Practice, 44, 98–104.
Campbell, D. E. (2005). Voice in the classroom: How an open class-room environment facilitates adolescents’ civic development. Circleworking paper 28. Retrieved from http://www.civicyouth.org/PopUps/WorkingPapers/WP28campbell.pdf
Cattell, R. B. (1966). The Scree test for the number of factors. MultivariateBehavioral Research, 1, 245–276.
De Wet, C. F. (2005). The teachers’ beliefs about culturally, linguis-tically, and economically diverse gifted students survey. Unpublishedmanuscript, University of Connecticut, Storrs, CT.
De Wet, C. F., & Gubbins, E. J. (2009). The development of teachers’ beliefsabout culturally, linguistically, and economically diverse gifted students:A qualitative study. Manuscript in preparation.
Deemer, S. A. (2004). Classroom goal orientation in high school class-rooms: Revealing links between teacher beliefs and classroom environ-ments. Educational Research, 46, 73–90.
Dillman, D. A. (2000). Mail and Internet surveys: The tailored designmethod (2nd ed.). New York, NY: John Wiley.
Donovan, M. S., & Cross, C. T. (Eds.). (2002). Minority students in specialand gifted education. Washington, DC: National Academy Press.
Easter, L. M., Shultz, E. L., Neyhart, T. K., & Reck, U. M. (1999). Weightyperceptions: A study of the attitudes and beliefs of preservice teacher edu-cation students regarding diversity and urban education. Urban Review,31, 205–221.
Fiala, K. A. (2004). A comparison of characteristics and responses fornon-responding and responding certified athletic trainers to mail andweb-based surveys on continuing education units (Unpublished doctoraldissertation). University of Connecticut, Storrs, CT.
Ford, D. Y. (1996). Reversing underachievement among gifted Black stu-dents: Promising practices and programs. New York, NY: TeachersCollege Press.
Ford, D. Y., Harris, J. J., III, Tyson, C. A., & Trotman, M. F. (2002). Beyonddeficit thinking: Providing access for gifted African American students.Roeper Review, 24, 52–58.
Frasier, M. M., Hunsaker, S. L., Lee, J., Finley, V. S., Frank, E., Garcia,J. H., & Martin, D. (1995). Educators’ perceptions of barriers to the iden-tification of gifted children from economically disadvantaged and limitedEnglish proficient backgrounds (RM95126). Storrs, CT: University ofConnecticut, The National Research Center on the Gifted and Talented.
Frasier, M. M., Hunsaker, S. L., Lee, J., Finley, V. S., García, J. H.,Martin, D., & Frank, E. (1995). An exploratory study of the effective-ness of the staff development model and the research-based assessmentplan in improving the identification of gifted economically disadvantagedstudents (RM95224). The National Research Center on the Gifted andTalented, University of Connecticut, Storrs, CT.
Goodenough, K. (2000). Fostering liberal views of giftedness: A study ofthe beliefs of six undergraduate education students. Roeper Review, 23,89–90.
Gregoire, M. (2003). Is it a challenge or a threat? A dual-process modelof teachers’ cognition and appraisal processes during conceptual change.Educational Psychology Review, 15, 147–179.
Greeno, J. G. (1989). A perspective on thinking. American Psychologist,44(2), 131–141.
Guskey, T. R. (1995). Professional development in education: In search ofthe optimal mix. In T. Guskey & M. Huberman (Eds.), Professional devel-opment in education: New paradigms and practices (pp. 114–132). NewYork, NY: Teachers College Press.
Hair, J. F., Jr., Anderson, R. E., Tatham, R. L., & Black, W. C. (1995).Multivariate data analysis with reading (4th ed.). Englewood Cliffs, NJ:Prentice Hall.
Kaiser, H. F. (1960). The application of electronic computers to factoranalysis. Educational and Psychological Measurement, 20, 141–151.
Kane, T. J., & Staiger, D. O. (2002). Volatility in school test scores:Implications for test-based accountability systems. Brookings Papers onEducation Policy, 235–283. doi:10.1353/pep.2002.0010
Kane, T. J., Staiger, D. O., & Geppert, J. (2002). Randomly accountable.Education Next, 2(1), 56–61. Retrieved from http://www.educationnext.org/files/ednext20021_56.pdf
Karnes, F. (2003). State of the states: Gifted and talented education report,2001–2002 (Annual Report). Washington, DC: National Association forGifted Children.
Larson, P. D. (2005). A note no mail surveys and response rates in logisticsresearch. Journal of Business Logistics, 26, 211–223.
Lohman, D. F. (2005). Review of Naglieri and Ford (2003): Does theNaglieri Nonverbal Ability Test identify equal proportions of high-scoring White, Black, and Hispanic students. Gifted Child Quarterly, 49,19–28.
Miller, E. M. (2006). Characteristic centrality in the perceptions of gifted-ness as a predictor of the pattern of nomination of students for placementin gifted programming (Unpublished doctoral dissertation). University ofVirginia, Charlottesville, VA.
Naglieri, J. A. (1997). Naglieri Nonverbal Ability Test. San Antonio, TX:The Psychological Corporation.
Naglieri, J. A., & Ford, D. Y. (2003). Addressing underrepresentationof gifted minority children using the Naglieri Nonverbal Ability Test(NNAT). Gifted Child Quarterly, 7, 155–160.
Naglieri, J. A., & Ford, D. Y. (2005). Increasing minority children’s partic-ipation in gifted classes using the NNAT: A response to Lohman. GiftedChild Quarterly, 49, 29–36.
National Association of Gifted Children. (2005). State of the states: Giftedand talented education report, 2003–2004 (Annual Report). Washington,DC: National Association for Gifted Children.
National Association of Gifted Children. (2007). State of the states:Gifted and talented education report, 2005–2006 (Annual Report) [CD].Washington, DC: National Association for Gifted Children.
National Center for Educational Statistics. (2005). The condition of educa-tion. Washington, DC: Author.
Olmedo, I. M. (1992). Teacher expectations and the bilingual child. Actionin Teacher Education, 14(2), 1–7.
Pallant, J. (2005). SPSS survival manual: A step by step guide to data anal-ysis using SPSS for Windows (2nd Version 12). New York, NY: OpenUniversity Press.
Pallant, J. (2007). SPSS survival manual: A step by step guide to dataanalysis using SPSS for Windows (Version 15). New York, NY: OpenUniversity Press.
Paolo, A. M., Bonaminio, G. A., Gibson, C., Partridge, T., & Kallail, K.(2000). Response rate comparisons of e-mail and mail-distributed studentevaluations. Teaching and Learning in Medicine, 12(2), 81–84.
Renzulli, J. S. (2005). Equity, excellence, and economy in a system for iden-tifying students in gifted education programs: A guidebook (RM05208).Storrs, CT: University of Connecticut, The National Research Center onthe Gifted and Talented.
Rust, F. O. (1994). The first year of teaching: It’s not what expected. TeacherEducation, 10, 205–217.
Sagor, R., & Cox, J. (2004). At-risk students: Reaching and teaching them(2nd ed.). Larchmont, NY: Eye on Education.
Shin, F. H., & Krashen, S. (1996). Teacher attitudes toward the princi-ples of bilingual education and toward students’ participation in bilingualprograms: Same or different? Bilingual Research Journal, 20, 45–53.
Siegle, D., & Powell, T. (2004). Exploring teachers’ biases when nominatingstudents for gifted programs. Gifted Child Quarterly, 48, 21–29.
Simsek, Z., & Viega, J. F. (2001). A Primer on Internet organizationalsurveys. Organizational Research Methods, 4, 218–236.
Slocumb, P., & Payne, R. (2000). Removing the mask: Giftedness in poverty.Highlands, TX: aha! Process.
Tabachnik, B. G., & Fidell, L. S. (1996). Using multivariate statistics (3rded.). New York, NY: Harper Collins.
Tucker, C. M., Porter, T., Reinke, W. M., Herman, K. C., Ivery, P. D., Mack,C. E., & Jackson, E. S. (2005). Promoting teacher efficacy for work-ing with culturally diverse students. Preventing School Failure, 50(1),29–35
Dow
nloa
ded
by [
Uni
vers
ity o
f G
uelp
h] a
t 10:
51 2
7 Se
ptem
ber
2013
108 C. F. DE WET AND E. J. GUBBINS
AUTHOR BIOS
Catharina F. de Wet was Assistant Professor in Gifted and Talented Education at the University of Alabama. Herresearch interest include diverse gifted students, teachers’ epistemological beliefs, and curriculum development.
E. Jean Gubbins is Associate Professor of Educational Psychology at the University of Connecticut and theAssociate Director of the National Research Center on the Gifted and Talented (NRC/GT). She is currently imple-menting a mathematic research study in algebra, geometry and measurement, and graphing and data analysis withGrade 3 students in 17 states. The research study provides challenging mathematic curriculum to all students,including those identified as gifted and talented. E-mail: [email protected]
Dow
nloa
ded
by [
Uni
vers
ity o
f G
uelp
h] a
t 10:
51 2
7 Se
ptem
ber
2013