Embed Size (px)
Citation preview
Teacher Participation and Attitudes Toward Instructional Television
B R U C E H . W E S T L E Y a n d HARVEY K . JACOBSON
Bruce H. Westley is associate proJessor of journalism and research co- ordinator for the Division of Radio-Television Education at the Univer- sity oJ Wisconsin. Harvey K. Jacobson, a doctoral candidate in mass communications at Wisconsin, is director of news and public informa- tion at the University oJ North Dakota. This is their second* report of a study o] the effects on teachers and pupils of participation in two experimental mathematics courses broadcast to fourth and ninth grades.
D O E S PARTICIPATION IN A TELEVISION teaching situation affect the attitudes of classroom teachers toward instructional television? Little attention has been paid to this question, although there has been considerable investigation of the effects of participation on pupils' attitudes.
In a previous report, we presented the results of a factor analysis of a 55-item
*Errata: In reference to the first report, pub- lished in AV Communication Review 10:3 May-June 1962, a note to the editor signed by both authors, states: "Two computational errors have been discovered in Table 1, p. 182-83. The errors are in the means for two of the 55 items reported. The correct mean (X) for Item 30 is 2.44, not 3.56; the correct mean for Item 55 is 2.10, not 3.88. The authors, who are solely responsible for these errors, sincerely regret inconvenience to read- ers of this journal."
attitude questionnaire administered to 50 teachers in the public schools of Madison, Wis. (2). Its chief purpose was to identify significant dimensions of teachers' attitudes toward the intrusion of television in their classrooms. The
measure was administered after com-
pletion of exper imenta l mathemat ics
courses in two grades, the fourth and
ninth, developed under the aegis of the
Wisconsin Improvement Program and
broadcast over WHA-TV. 1 Completed
1Detailed acknowledgements are given in the earlier article. The University Research Committee made available the computational facilities of the Numerical Analysis Labora- tory, which is supported in part by the Na- tional Science Foundation and the Wisconsin Alumni Research Foundation.
[328]
ITV: TEACHER PARTICIPATION AND ATTITUDES 329
questionnaires were obtained from 33 participating teachers and 17 non-par- ticipating teachers. This report deals with differences in attitudes between these two groups.
Method Means and standard deviations for the
55 items for the 50 subject teachers were reported in the previous article. Circum- stances did not permit the usual before- after change experiment. Furthermore, the teachers involved in some degree had a choice whether to participate or not. Ordinarily, it would not be possible to infer change under these circumstances. We believe, however, that the data pre- sented here suggest that the differences observed between participating and non- participating teacher groups, although they may be in part a result of differ- ences in prior attitudes, can be inter- preted as largely an effect of participa- tion. The validity of this inference is based on three facts: the very marked consistency in the direction of these differences across the 55 items; the total lack of relationship between these atti- tudes and two demographic variables: the teacher's education and length of service; and the significant difference obtained between fourth and ninth grade teachers. Nevertheless, the results here must be qualified: it is possible that self- selection to participate may account for the observed differences, rather than the fact of participation.
between the two groups that are signifi- cant at the .05 level or beyond. All 14 were in the direction of greater approval of television in the classroom on the part of the participating group.
Of 46 items that could be definitely categorized as to direction (favorable or unfavorable to 1TV), all but four showed participating teachers holding more favorable attitudes toward ITV than non-participating teachers.
When the latter data were subjected to a sign test, the consistency of these differences (44q- , 4 - - ) proved to be far beyond the .0001 level of significance (1) 2 .
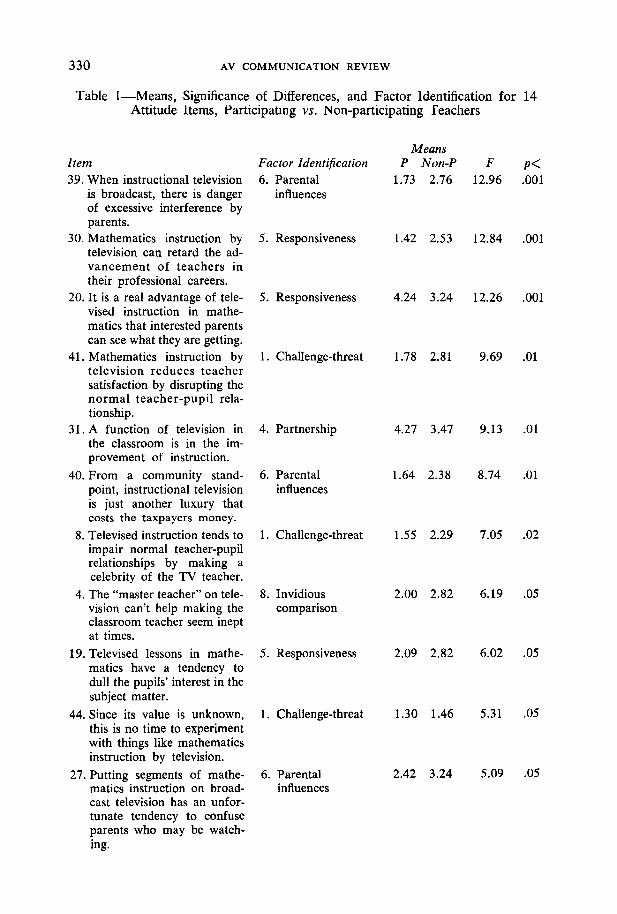
Data for the 14 items which yielded individually significant differences are shown in Table 1. Significance was com- puted by simple analysis of variance. The table also shows the factor on which the item had its highest loading. This was done to permit us to see whether certain of the factors identified in the previous art icle are more subject to change as a consequence of participation than are other factors. Since any other ordering is arbitrary, the items are shown in descending order of the magnitude of the variance ratio (F) .
As a further test of the magnitude of the difference, scores on all items which had an identifiable direction were com- bined into a single "favorability" index. 3 This index permitted an examination of the question whether self-selection had operated in accounting for the differ-
Results
For each of the 55 Likert-type items, scale positions were assigned--1 through 5 - - a nd means and standard errors were computed for each item for each of the two groups. Analysis of variance was performed for each item. Of the 55 items, 14 showed differences in attitude
The four "negative" items (i.e. those favor- able to ITV which participating teachers either accepted less or rejected more, or unfavorable items which participating teachers accepted more or rejected less) are Items 3, 11, 32 and 35. (See Table 1 of the previous article.) In no case did these differences approach sig- nificance.
~Items omitted from this analysis on grounds that their direction is not clear are these: 6, 9, 12, 17, 24, 30, 33, 50 and 55. (See previous article, Table 1.)
330 AV COMMUNICATION REVIEW
Table 1--Means, Significance of Differences, and Factor Identification for 14 Attitude Items, Participatmg vs. Non-participating Feachers
I tem
39. When instructional television is broadcast, there is danger of excessive interference by parents.
30. Mathematics instruction by television can retard the ad- vancement of teachers in their professional careers.
20. It is a real advantage of tele- vised instruction in mathe- matics that interested parents can see what they are getting.
41. Mathematics instruction by television reduces teacher satisfaction by disrupting the normal teacher-pupil rela- tionship.
31. A function of television in the classroom is in the im- provement of instruction.
40. From a community stand- point, instructional television is just another luxury that costs the taxpayers money.
8. Televised instruction tends to impair normal teacher-pupil relationships by making a celebrity of the TV teacher.
4. The "master teacher" on tele- vision can't help making the classroom teacher seem inept at times.
19. Televised lessons in mathe- matics have a tendency to dull the pupils' interest in the subject matter.
44. Since its value is unknown, this is no time to experiment with things like mathematics instruction by television.
27. Putting segments of mathe- matics instruction on broad- cast television has an unfor- tunate tendency to confuse parents who may be watch- ing.
Means Factor Identification P Non-P F p <
6. Parental 1.73 2.76 12.96 .001 influences
5. Responsiveness 1.42 2.53 12.84 .001
5. Responsiveness 4.24 3.24 12.26 .001
1. Challenge-threat 1.78 2.81 9.69 .01
4. Partnership 4.27 3.47 9.13 .01
6. Parental 1.64 2.38 8.74 .01 influences
1. Challenge-threat 1.55 2.29 7.05 .02
8. Invidious 2.00 2.82 6.19 .05 comparison
5. Responsiveness 2.09 2.82 6.02 .05
I. Challenge-threat 1.30 1.46 5.31 .05
6. Parental 2.42 3.24 5.09 .05 influences
ITV: TEACHER PARTICIPATION AND ATTITUDES 331
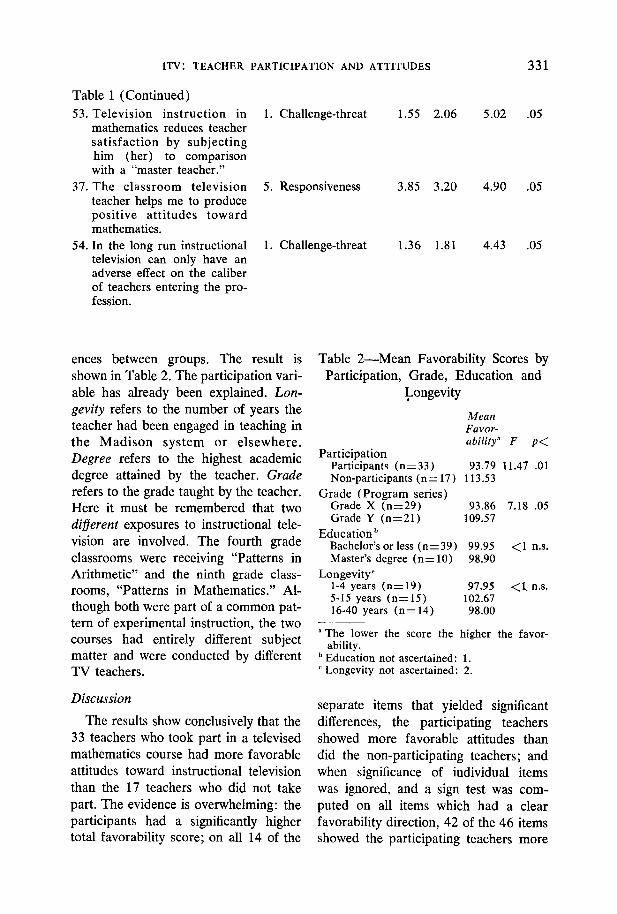
Table 1 (Continued)
53. Television instruction in mathematics reduces teacher satisfaction by subjecting him (her) to comparison with a "master teacher."
37. The classroom television teacher helps me to produce positive attitudes toward mathematics.
54. In the long run instructional television can only have an adverse effect on the caliber of teachers entering the pro- fession.
1. Challenge-threat 1.55 2.06 5.02 .05
5. Responsiveness 3.85 3.20 4.90 .05
1. Challenge-threat 1.36 1.81 4.43 .05
ences between groups. The result is shown in Table 2. The participation vari- able has already been explained. Lon- gevity refers to the number of years the teacher had been engaged in teaching in the Mad i son sys tem or e lsewhere . Degree refers to the highest academic degree attained by the teacher. Grade refers to the grade taught by the teacher. Here it must be remembered that two different exposures to instructional tele- vision are involved. The fourth grade classrooms were receiving "Patterns in Arithmetic" and the ninth grade class- rooms, "Patterns in Mathematics." Al- though both were part of a common pat- tern of experimental instruction, the two courses had entirely different subject matter and were conducted by different T V teachers.
Discussion
The results show conclusively that the 33 teachers who took part in a televised mathematics course had more favorable attitudes toward instructional television than the 17 teachers who did not take part. The evidence is overwhelming: the participants had a significantly higher total favorability score; on all 14 of the
Table 2 - - M e a n Favorability Scores by Participation, Grade, Education and
Longevity
Mean Favor- ability ~ F p (
Participation Participants (n= 33) 93.79 11.47 .01 Non-participants (n=17) 113.53
Grade (Program series) Grade X (n=29) 93.86 7.18 .05 Grade Y (n=21) 109.57
Education b Bachelor'sorless (n=39) 99.95 <1 n.s. Master's degree (n= 10) 98.90
Longevity ~ 1-4 years (n= 19) 97.95 <~1. n.s. 5-15 years (n=15) 102.67 16-40 years (n=14) 98.00
The lower the score the higher the favor- ability.
b Education not ascertained: 1. ~ Longevity not ascertained: 2.
separate items that yielded significant differences, the participating teachers showed more favorable attitudes than did the non-participating teachers; and when significance of individual items was ignored, and a sign test was com- puted on all items which had a clear favorability direction, 42 of the 46 items showed the participating teachers more
332 AV COMMUNICATION REVIEW
favorable than the non-participants.
Because this was not a before-after experiment and because to some degree the teachers volunteered to participate, the result may have been due either to the more favorable attitudes of the vol- unteers or to the effect of the participa- tion. When, however, we examine the evidence of an analysis of the relation- ship between favorability and three other variables, the inference that the result was an effect of participation appears to be more tenable.
If the difference was due to "volunteer bias," this fact should be reflected in other respects. For example, we might expect the volunteers to have higher educational attainment and we might ex- pect them to be younger teachers in point of service. On these points, the evidence is very clear: neither educa- t ional level nor longevity shows the slightest relationship to favorability of attitude toward ITV. On the other hand if participation were responsible for these differences, we might expect to find differences in attitude between two somewhat different experiences with in- structional television. We do in fact find such a difference between the fourth and ninth grade teachers (whose classrooms received different lessons from different teachers) ; however, this difference is not
as great as the difference between par- ticipating and non-participating teachers. For these reasons we are inclined to interpret these differences as an indica- tion of an effect of participation. 4
When we turn to the question of what dimensions of the attitude were most susceptible to the effect of experience with instructional television, the most
Teachers were also asked a question about prior participation in instructional television. Too few of the teachers had had any such experience to permit analysis of this item.
striking fact is that apparently the atti- tude changed massively and in all its dimensions. All but four of the direc- tional items showed change in the same direction, even though only 14 of them were individually significant. The four items that reversed the general trend do not cluster along any particular dimen- sion. Two had their highest loadings on different factors and two had no very high loadings.
However, there is one indication that certain dimensions of the attitude were more strongly influenced by participa- tion than were certain others. Among the 14 separate items that yielded sig- nificant differences, 12 are accounted for by three factors: challenge-threat 5, re- sponsiveness 4, and parental influences 3. We hesitate to put much stress on this point for two reasons. One of these fac- tors (challenge-threat) had a dispropor- tionately large number of items with highest loadings, probably because we included more challenge-threat items than any other kind. And since these are rather small Ns, a large number of individually significant items cannot be expected. That consistent differences were found for almost all items seems the more compelling fact to us.
The reader may also have noted that most of the significant items have low means. Since the teachers tended to have favorable attitudes, there was a greater tendency to get significant differences where questions were put in the negative form. Actually, we attempted to present each item in both a positive and a nega- tive form. We do not know why the negative items appear to be the more sensitive.
It was not our intention to develop a general test of attitude toward instruc- tional television. It appears, however, that what we have here may be made
ITV~ TEACHER PARTICIPATION AND ATTITUDES 333
into such a general test provided the items are adapted---either by substitut- ing another subject matter wherever they mention mathematics, or by eliminating all reference to subject matter. In this connection, what we are reporting here may be looked upon as an item valida- tion. By this reasoning the items which produced the largest variance ratios may be taken as the most valid items. If a brief measure is desired, the 15 items shown in Table 1 may serve. If the in- vestigator has a more diagnostic purpose in mind-- if , for example, he wishes to identify the dimensions of teachers' atti- tudes toward instructional television be- fore undertaking to change them he may wish to use all the items shown in the original article, perhaps eliminating the four negative items mentioned above. Or he might select from among the items with the highest loadings on each factor those which have the highest variance ratios?
5 After the items listed in Table 1, the high- est variance ratios were obtained from the following items (in descending order): Item 18, 4.00; 34, 3.82; 46, 3.17; 38, 2.76; 52, 2.54; 23, 2.40; 44, 1.88; 2, 1.84; 51. 1.70; 28, 1.54. All others were below 1.50. Items may be identified by number in Table 1 of the pre- vious article.
Summary and Conclusions
A 55-item test of attitude toward edu- cational television was administered to 50 teachers of fourth and ninth grades; 33 of these had just completed partici- pating in a broadcast course of instruc- tion in mathematics; 17 had not partici- pated. The participating teachers proved to have significantly more favorable attitudes toward instructional television, and the effect appears to spread across all dimensions of the attitude.
A significant difference in attitude was found between fourth and ninth grade teachers, but no relationship was found between the attitude-scores and either the teacher's educational attain- ment or length of service. This consid- eration suggests that participation was responsible for the difference, rather than "volunteer bias."
R E F E R E N C E S
1. Siegel, Sidney. Nonparametric Statistics. New York: McGraw-Hill Book Co., 1956.
2. Westley, Bruce H. and Jacobson, Har- vey K. "Dimensions of Teachers' Atti- tudes Toward Instructional Television." A V Communication Review 10:3 : 179- 85; May-June 1962.
N o Inheren t Mag ic
Basically, television is no more than an economical electronic medium simultaneously transmitting visual and audio experiences to large num- bers of people. When this system is applied to teaching, the gains in learning are not attributable to any subtle magic inherent in television. They are attributable to the fact that no other instructional medium o f f e r s . . , anything remotely approaching television's ability to provide teaching experiences of the highest impact and quality to large numbers of learners. This, of course, requires that well-planned high quality experiences must first be presented to the television cameras.
- - F r o m Television in Teaching, by Herbert R. Jensen, p. 4. Engle- wood Cliffs, New Jersey: Thompson Ramo Wooldridge, Inc. 1960. $1.50