Embed Size (px)
Citation preview
Economic Impacts of Aviation Activity in Tennessee
! 1!
This report was drafted by researchers at the University of Tennessee for the Tennessee Department of Transportation under contract RES2013-13. Primary authors are Christopher Cherry, Mark Burton, and Hunter McCracken; with contributions from Shahad Abdulrahman, Mark Nichols, and Megan Ryerson. This report benefited from feedback and contributions from Lissa Gay, with the University of Tennessee Center for Transportation Research, and Tennessee Department of Transportation Aeronautics Division staff Brian Caldwell and Jackie Hernandez. The results and findings presented here reflect work of the primary authors and all errors and omissions are attributable the them only and do not necessarily reflect the position or views of other contributors or the Tennessee Department of Transportation.
! 2!
TABLE OF CONTENTS One ............................................................................................................. 3
Introduction ....................................................................................................... 3 Organization and Methodology ........................................................................... 5 Aviation and the Economy .................................................................................. 7 A Preview of Statewide Results ........................................................................... 7 The Remainder of the Study Document ............................................................... 8
Two ............................................................................................................. 9 Methodology Overview ....................................................................................... 9 Measurement and Simulations .......................................................................... 11 The Current Study Methods ............................................................................... 12
DATA FROM EXISTING TENNESSEE AIRPORT STUDIES ................................................ 12 SITE VISITS ............................................................................................................................. 13 AIRPORT, USER, VENDOR, AND COMMUNITY SURVEYS ............................................... 14 EXISTING (NON-TENNESSEE) STUDIES ........................................................................... 22 MEASURING THE IMPACTS OF GENERAL AVIATION ..................................................... 23 TOURISM AND OTHER VISITOR-RELATED IMPACTS ..................................................... 24
Three ........................................................................................................ 26 A More Complete Look at Study Results ............................................................ 26
COMMERCIAL OPERATIONS AT PRIMARY AIRPORTS ................................................... 26 THE GENERAL AVIATION CONTRIBUTION ...................................................................... 27
By Comparison ................................................................................................. 30
Four .......................................................................................................... 33 Aviation Finance–Where State Policy Fits In .................................................... 33 Airport Funding–The National Picture ............................................................. 33 Airport Funding In Tennessee .......................................................................... 35
Five ............................................................................................................ 37 A Forward-Looking Policy for Tennessee .......................................................... 37
APPENDICES
Appendix A: Spatial Distribution of Tennessee’s Airports
Appendix B: Survey Instruments
! 3!
ONE INTRODUCTION!In a 21st century America, local and regional access to safe, affordable, and reliable aviation, in its many forms, is essential for regional prosperity and growth. Everyone knows this. In Tennessee, directly or indirectly, one in twelve jobs is tied to aviation. Consequently, policy-makers throughout the state and at all levels of government work continuously to improve aviation access; specifically, the ability of Tennessee residents and businesses to be in close proximity to safe and reliable airport infrastructure to support personal, recreational, and commercial travel. In doing so, they help Tennesseans realize the economic gains aviation can bring, and ensure that as many as possible enjoy the higher quality of life aviation access helps support.
Against this backdrop, Tennessee’s Department of Transportation (TDOT) has supported and helped guide a study of aviation’s current and future roles within the state economy.
This study has three goals. First is to clarify and organize the discussion of aviation in Tennessee.
Second is to quantify the economic impacts attributable to aviation activities in Tennessee, at both state and local levels. In most cases, this assessment is confined to typical economic measures–jobs, incomes, annual sales, and tax revenues. However, where useful, we include examples of business opportunities enabled by aviation. Because aviation is multifaceted, because it truly is everywhere, and because aviation access affects economies in so many different ways, our analysis must proceed carefully. We wish to ensure that relevant impacts are neither missed nor counted more than once.
Finally, this report quantifies and evaluates state programs and policies aimed at promoting aviation access and its use. Compared to most states, Tennessee is very active in its support of aviation, particularly through large investment by the Department of Transportation’s Aeronautics Division. Tennessee levies a 4.5% use tax on aviation fuel, coupled with a large amount of aviation activity. Those fuel sales, a large portion from FedEx freight activity, and associated state use tax revenue yield higher state

! 4!
investment than almost all other states1. State investment exceeded $40m from the aviation fuel tax revenue for the past several years. Even after the fuel use tax cap of $10.5m for any individual firm comes into full effect in 20182, the total fuel tax revenue should still exceed $20m, more than most states’ total dedicated revenue and still more on a per-capita basis. Accordingly, we provide metrics that will help compare outcomes in Tennessee to similar results observed elsewhere.
! !
!!!!!!!!!!!!!!!!!!!!!!!!!!!!!!!!!!!!!!!!!!!!!!!!!!!!!!!!!!!!!1 The Economic Impact of Civil Aviation on the US Economy. Federal Aviation Administration. January 2015. 2 Aviation Fuel Tax Cap HB 1147 and SB 0982 caps total fuel tax liability at $10.5m after 2018 for any single entity. FedEx is the only entity that this bill currently applies to.
! 5!
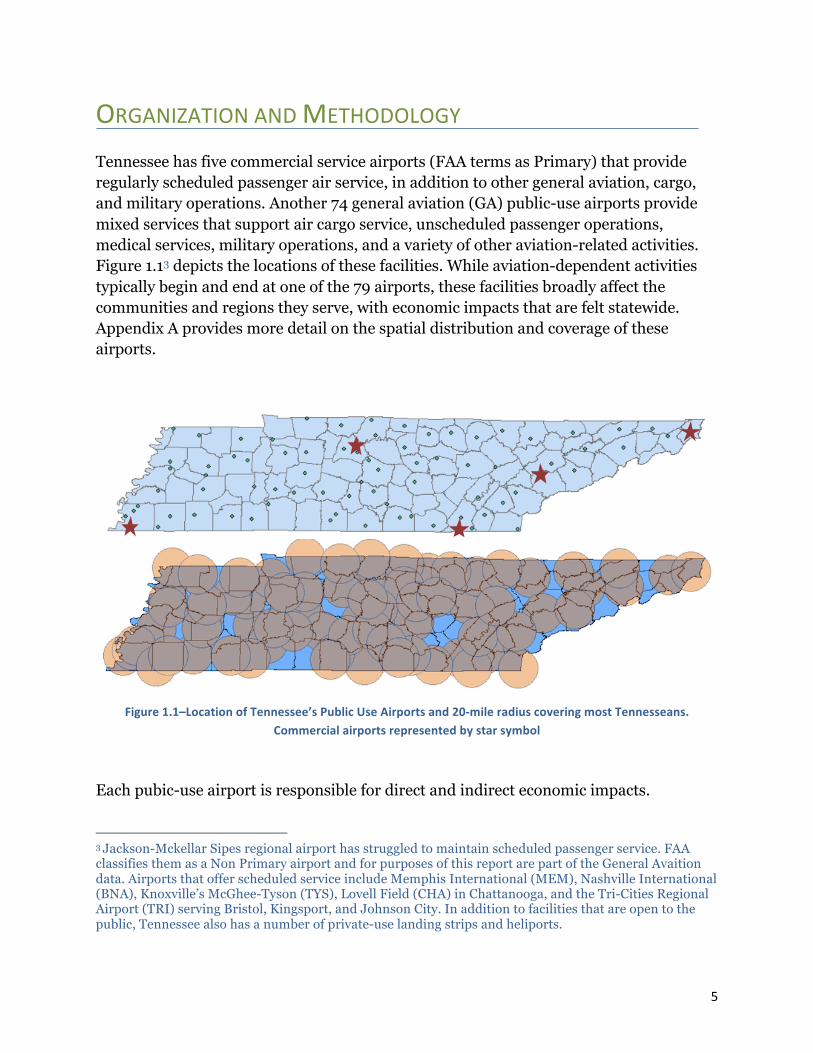
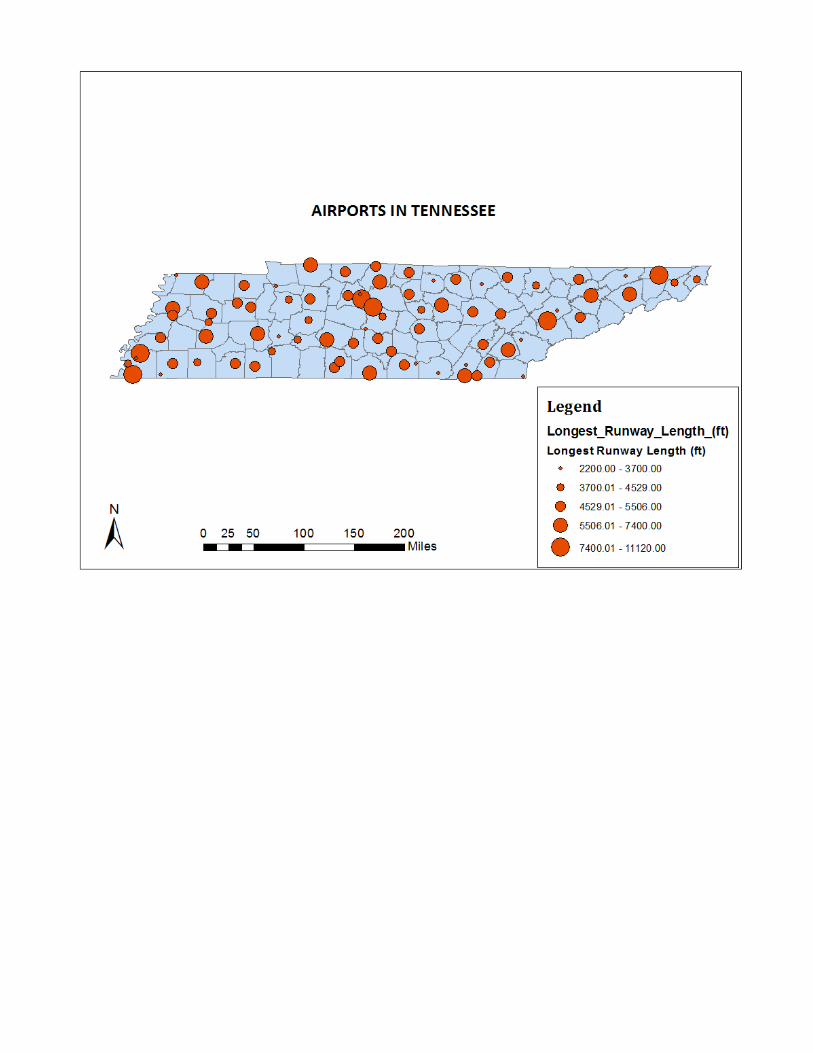
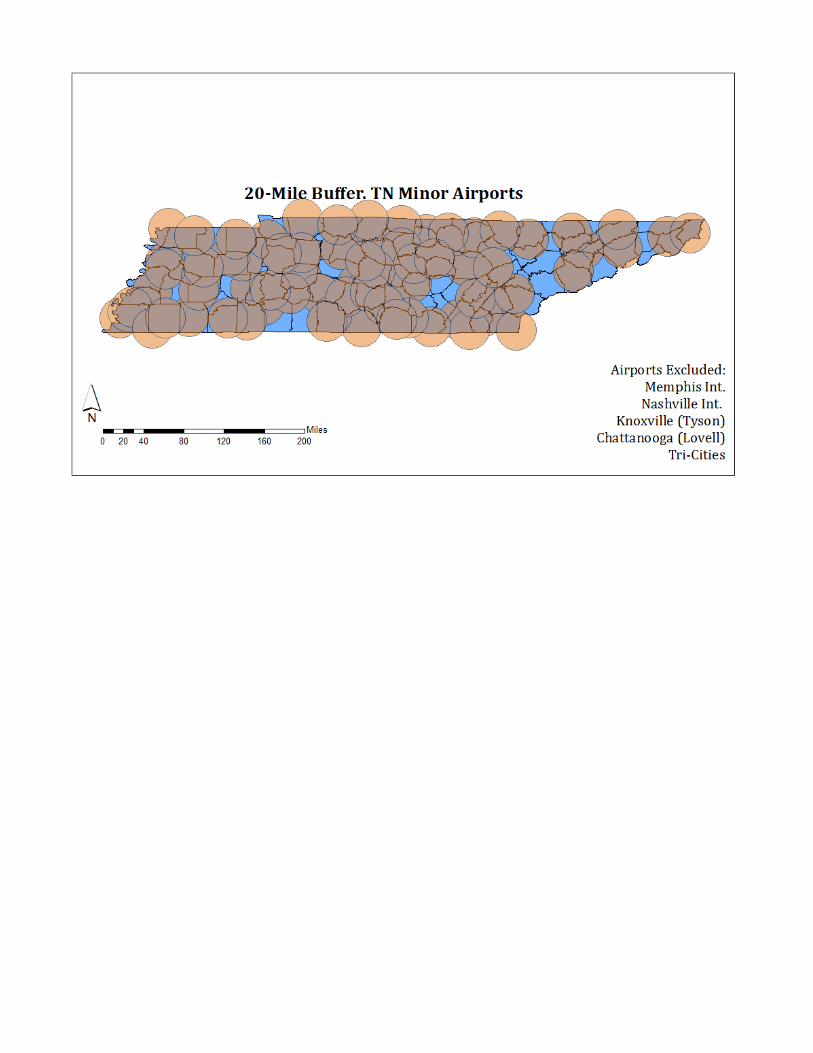
ORGANIZATION!AND!METHODOLOGY!Tennessee has five commercial service airports (FAA terms as Primary) that provide regularly scheduled passenger air service, in addition to other general aviation, cargo, and military operations. Another 74 general aviation (GA) public-use airports provide mixed services that support air cargo service, unscheduled passenger operations, medical services, military operations, and a variety of other aviation-related activities. Figure 1.13 depicts the locations of these facilities. While aviation-dependent activities typically begin and end at one of the 79 airports, these facilities broadly affect the communities and regions they serve, with economic impacts that are felt statewide. Appendix A provides more detail on the spatial distribution and coverage of these airports.
!
Figure!1.1–Location!of!Tennessee’s!Public!Use!Airports!and!20>mile!radius!covering!most!Tennesseans.!
Commercial!airports!represented!by!star!symbol!
Each pubic-use airport is responsible for direct and indirect economic impacts.
!!!!!!!!!!!!!!!!!!!!!!!!!!!!!!!!!!!!!!!!!!!!!!!!!!!!!!!!!!!!!3 Jackson-Mckellar Sipes regional airport has struggled to maintain scheduled passenger service. FAA classifies them as a Non Primary airport and for purposes of this report are part of the General Avaition data. Airports that offer scheduled service include Memphis International (MEM), Nashville International (BNA), Knoxville’s McGhee-Tyson (TYS), Lovell Field (CHA) in Chattanooga, and the Tri-Cities Regional Airport (TRI) serving Bristol, Kingsport, and Johnson City. In addition to facilities that are open to the public, Tennessee also has a number of private-use landing strips and heliports.
! 6!
Direct Impacts: Each airport directly generates economic activity. Even the smallest of the state’s general aviation airports provides employment and income through its operation and upkeep. Virtually all airports sell aviation fuels and even among the smaller airports, most rent hanger or aircraft tie-down space and many feature fixed-based operators (FBOs) that offer aircraft, pilot, and aviation services. Among larger GA airports, it is also common to find maintenance facilities that provide various airframe and power plant (A&P) services and avionics facilities. Finally, the five primary commercial airports–Memphis, Nashville, Knoxville, Chattanooga, and Tri-Cities–support a wide array of on-field activities for air travelers, commercial passenger providers, dedicated airfreight carriers, general aviation, and the U.S. military.
Moving leisure travelers to Tennessee destinations and home again is a critical need that is, at least, partially met through available aviation. In 2014, stateside direct tourist expenditures totaled more than $17.7 billion, with corresponding local and state sales tax revenues of more than $1.5 billion.4
Indirect Impacts: A short distance from airport properties exists a second tier of commercial activity that is also aviation-dependent. This includes off-field lodging and food establishments, rental car facilities, off-field freight handling and sorting facilities, and a broad collection of wholesale distribution operations that depend on airfreight services for both the inbound and outbound transportation of time-sensitive cargo.
The impacts of available aviation services spread rapidly throughout the communities and regions served by each airport, often in ways that go unseen. Nearly all of Tennessee’s 79 public-use airports provide regular access to business travelers whose business activities may, otherwise, have nothing to do with aviation, i.e. without aviation their business would suffer. Access to aviation trickles through virtually all sectors of the economy. Similarly, even GA airports often provide critical access for the movement of time-sensitive equipment, parts, or materials.
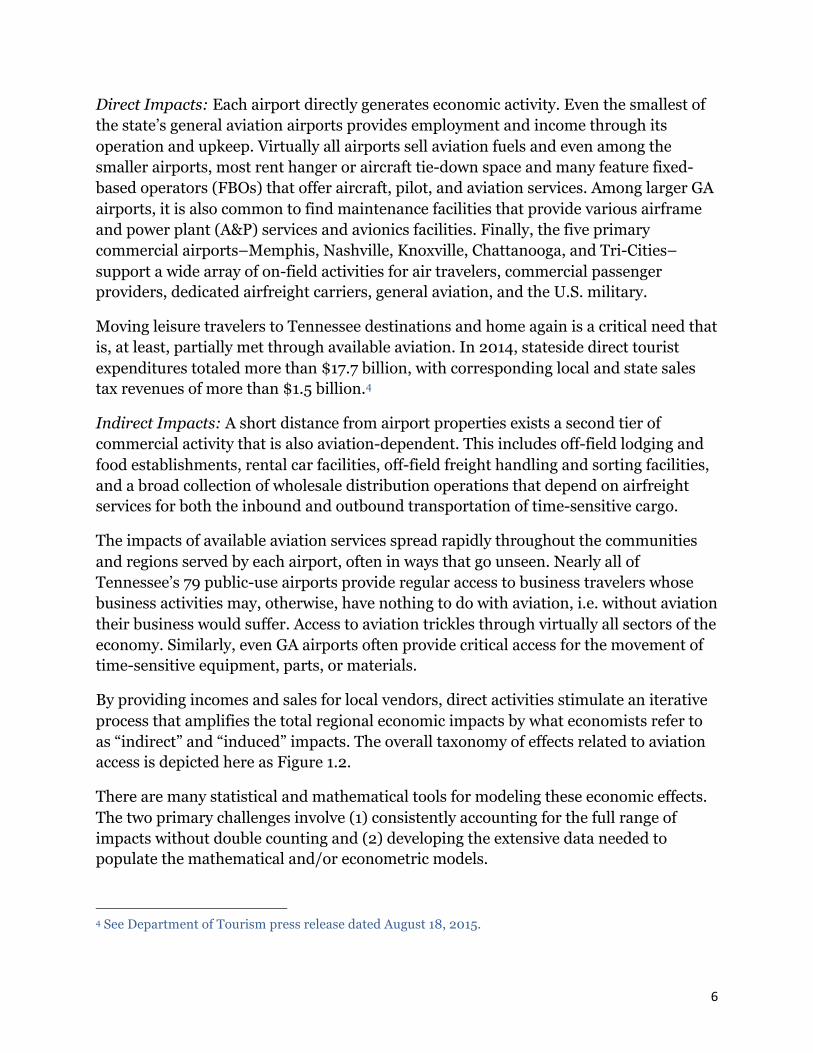
By providing incomes and sales for local vendors, direct activities stimulate an iterative process that amplifies the total regional economic impacts by what economists refer to as “indirect” and “induced” impacts. The overall taxonomy of effects related to aviation access is depicted here as Figure 1.2.
There are many statistical and mathematical tools for modeling these economic effects. The two primary challenges involve (1) consistently accounting for the full range of impacts without double counting and (2) developing the extensive data needed to populate the mathematical and/or econometric models.
!!!!!!!!!!!!!!!!!!!!!!!!!!!!!!!!!!!!!!!!!!!!!!!!!!!!!!!!!!!!!4 See Department of Tourism press release dated August 18, 2015.
! 7!
The methodology through which we developed the current results is summarized below in Section 2. Generally, these results reflect the careful combination of Tennessee-specific data collected from the state’s 79 public-use airports, data for four of Tennessee’s five primary airports made available through earlier studies, data from similar analyses conducted in 21 other states, and state-level impact information made available through a series of studies conducted on behalf of the Federal Aviation Administration (FAA).
AVIATION!AND!THE!ECONOMY!Facilities!and!Operations!Facilities!Operations!Air!Travel!Air!Freight!General!Aviation!OnJField!Services!Military!Operations!
Supported!Commerce!AviationJManufacturing!&!Services!Tourism!&!Travel!Supply!Chain!&!Distribution!General!Commerce!
!
Figure!1.2–Taxonomy!of!Aviation>Related!Economic!Impacts!
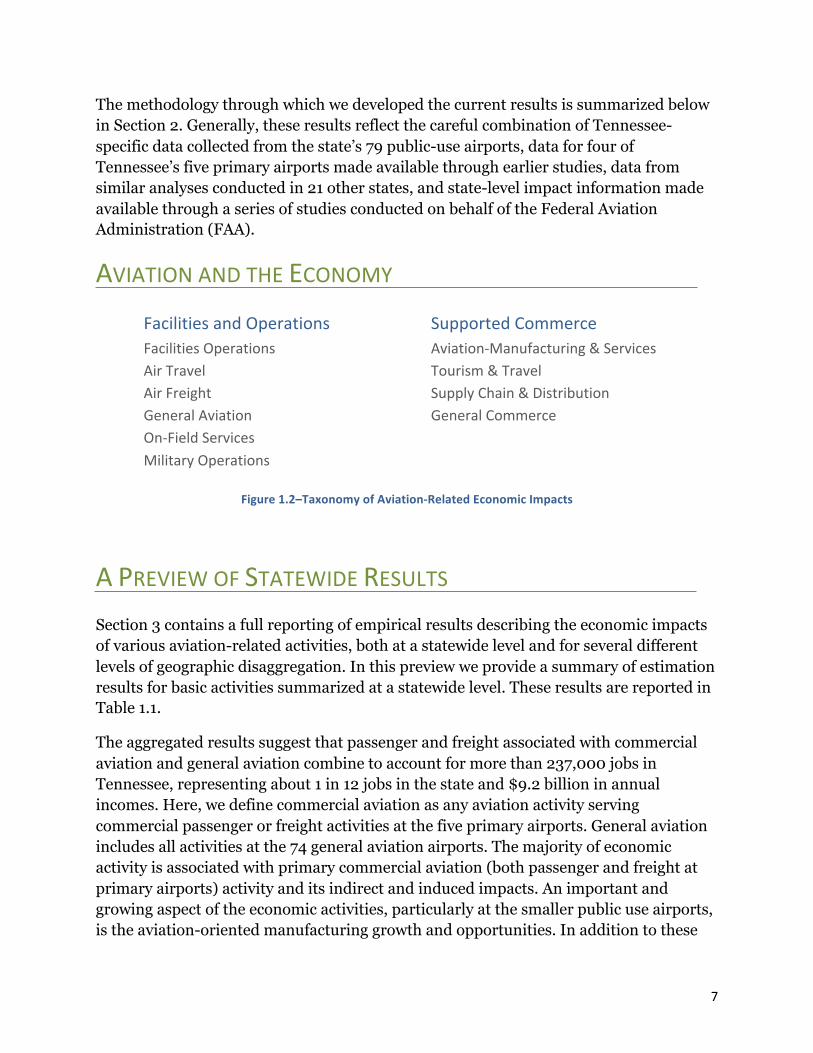
!A!PREVIEW!OF!STATEWIDE!RESULTS!Section 3 contains a full reporting of empirical results describing the economic impacts of various aviation-related activities, both at a statewide level and for several different levels of geographic disaggregation. In this preview we provide a summary of estimation results for basic activities summarized at a statewide level. These results are reported in Table 1.1.
The aggregated results suggest that passenger and freight associated with commercial aviation and general aviation combine to account for more than 237,000 jobs in Tennessee, representing about 1 in 12 jobs in the state and $9.2 billion in annual incomes. Here, we define commercial aviation as any aviation activity serving commercial passenger or freight activities at the five primary airports. General aviation includes all activities at the 74 general aviation airports. The majority of economic activity is associated with primary commercial aviation (both passenger and freight at primary airports) activity and its indirect and induced impacts. An important and growing aspect of the economic activities, particularly at the smaller public use airports, is the aviation-oriented manufacturing growth and opportunities. In addition to these
! 8!
figures, aviation on the whole adds roughly $31 billion in total economic activity (sales) to the Tennessee economy, with associated annual tax revenues of $888 million.
Table!1.1–Summary!of!Statewide!Results!
Impact!Category! Tennessee! U.S.!Total!
PRIMARY!COMMERCIAL!AVIATION!
Total!AviationJRelated!Output!($Billion)! $29.575! $1,150.404!Total!AviationJRelated!Employment!(Thousand)! 229.755! 8936.865!
Total!AviationJRelated!Earnings!($Billion)! $8.896! $346.034!
GENERAL!AVIATION!
Total!AviationJRelated!Output!($Billion)! $1.043! $50.696!Total!AviationJRelated!Employment!(Thousand)! 8.100! 393.828!
Total!AviationJRelated!Earnings!($Billion)! $0.314! $15.249!
AVIATION!TOTAL!
Total!AviationJRelated!Output!($Billion)! $30.618! $1,201.100!Total!AviationJRelated!Employment!(Thousand)! 237.854! 9,330.693!
Total!AviationJRelated!Earnings!($Billion)! $9.210! $361.283!Estimated!State!Tax!Revenues!($Billion)! $0.888!
!
THE!REMAINDER!OF!THE!STUDY!DOCUMENT!The remainder of the study document is organized as follows: Section 2 contains a summary of the data and methodology used to produce the current set of impact estimates. Actual estimates are provided and analyzed in Section 3. Section 4 includes a review of state aviation policies both from historical and forward-looking perspectives. Final observations are provided in Section 5. Also, as indicated above this current volume is accompanied by a set of appendixes that fully describe data, methods, and results.
! 9!
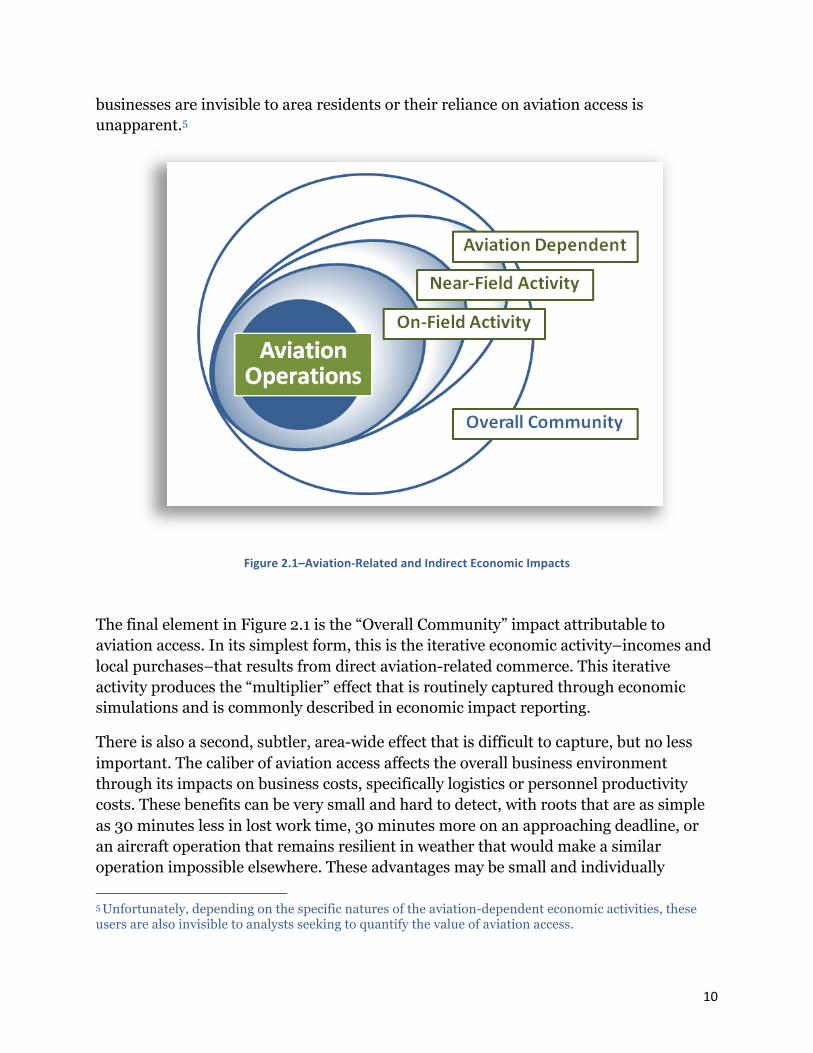
TWO METHODOLOGY!OVERVIEW!Directly or indirectly, nearly everyone in every community is affected by the availability, affordability, and quality of aviation-related services. Nonetheless, the nature and extent of these impacts vary widely across stakeholder groups. These relationships were discussed briefly in Section One (Figure 1.2), but are depicted somewhat differently in Figure 2.1.
At the center of every discussion is the actual operation of aircraft to and from Tennessee’s airports. Most other impacts are traceable to this direct activity, which we account for here. The direct economic effects of aircraft operations include the wages and salaries paid to locally-based flight crews; ground, maintenance, service, and supervisory personnel, including air traffic controllers or other public sector employees and the various local expenditures these employees must make in order to do their jobs. In addition to these ongoing direct effects, the impacts associated with aircraft operations also include the transient effects of periodic airport construction activities.
A second set of direct (and directly observable) economic impacts owe to the commercial activity that is not related to operating aircraft, but is nonetheless located on airport facilities. In Figure 2.1, this activity is labeled “On-Field” and primarily includes passenger-related commerce like food and beverage vendors, on-field retailers, lodgings, car rental facilities, etc. These on-field activities are often mirrored by a similar set of commercial activities provided off of, but very near the airports. Within figure 2.1, these are indicated as “Near-Field” commerce.
Figure 2.1 also references “Aviation-Dependent” economic activities. This refers to businesses that do not provide or support aviation services, but which could not exist without continuous, affordable and reliable access to those services. Depending on the airport size and nature of the local economy, these businesses can include some portion of leisure and tourist-related commerce, product distributors, freight forwarders, manufacturers who require time-sensitive or fragile, higher-valued inputs or that produce outputs with these same characteristics, or firms with very active corporate aviation needs. Sometimes, these aviation-dependent firms are located on airport properties; other times they may be some distance away. Moreover, many of these
! 10!
businesses are invisible to area residents or their reliance on aviation access is unapparent.5
Figure!2.1–Aviation>Related!and!Indirect!Economic!Impacts!!
The final element in Figure 2.1 is the “Overall Community” impact attributable to aviation access. In its simplest form, this is the iterative economic activity–incomes and local purchases–that results from direct aviation-related commerce. This iterative activity produces the “multiplier” effect that is routinely captured through economic simulations and is commonly described in economic impact reporting.
There is also a second, subtler, area-wide effect that is difficult to capture, but no less important. The caliber of aviation access affects the overall business environment through its impacts on business costs, specifically logistics or personnel productivity costs. These benefits can be very small and hard to detect, with roots that are as simple as 30 minutes less in lost work time, 30 minutes more on an approaching deadline, or an aircraft operation that remains resilient in weather that would make a similar operation impossible elsewhere. These advantages may be small and individually !!!!!!!!!!!!!!!!!!!!!!!!!!!!!!!!!!!!!!!!!!!!!!!!!!!!!!!!!!!!!5 Unfortunately, depending on the specific natures of the aviation-dependent economic activities, these users are also invisible to analysts seeking to quantify the value of aviation access.
! 11!
infrequent, but if they are recurrent, their cumulative impacts can confer a discernible advantage to a community. Reliable and ubiquitous aviation, in part, enables robust and reliable economic performance of businesses.
MEASUREMENT!AND!SIMULATIONS!The process for estimating economic impacts of aviation is well-established. It involves measuring the direct effects associated with a subject activity–in this case ground access to aviation facilities–then using those measurements as inputs in region-wide simulations, based on the economic interactions that reflect the region’s specific characteristics. These characteristics include the endowment of locally available raw materials and energy, the variety of other businesses located in the region and their capacities to supply needed goods and services, the characteristics and productivity of the regional workforce, the costs of getting goods and services to and from vendors located outside the region, and the fiscal environment, including the availability of publicly provided goods and services and the amount and form of taxes levied to support those services.
Theoretically, in the current context, the availability of this methodology makes it possible to simulate regional outcomes such as employment, incomes, regional sales, or state and local tax revenues under an infinite number of scenarios where aviation access is made a little better or a little worse through public policy decisions or private sector activities.
Unfortunately, our ability to pursue the many interesting scenarios that can emerge is limited by our inability to collect reliable data describing (1) existing airport operations, (2) the other important direct, on and off-field activity related to an airport’s operation, and, in particular, (3) how these direct effects would change under any given scenario.
Because the data available to simulate small, incremental changes within an economy is either imprecise or altogether unavailable, it is far more common to use a “bigger hammer.” Specifically, rather than
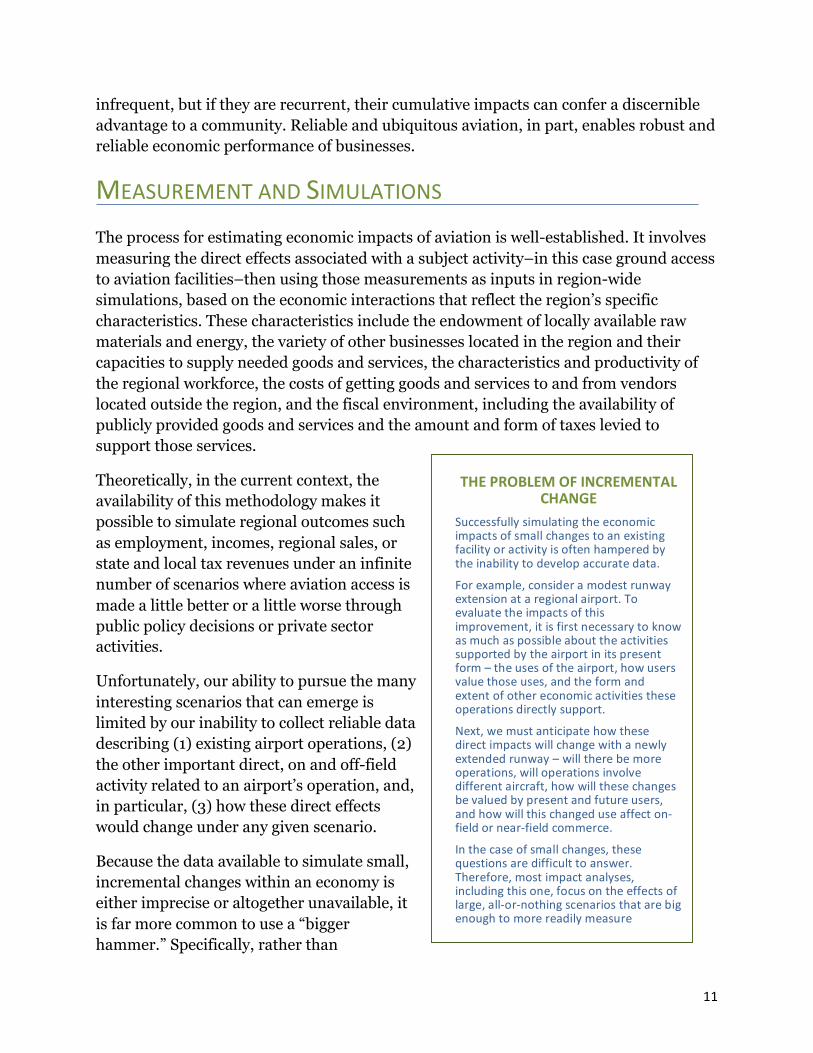
!THE!PROBLEM!OF!INCREMENTAL!
CHANGE!
Successfully!simulating!the!economic!impacts!of!small!changes!to!an!existing!facility!or!activity!is!often!hampered!by!the!inability!to!develop!accurate!data.!For!example,!consider!a!modest!runway!extension!at!a!regional!airport.!To!evaluate!the!impacts!of!this!improvement,!it!is!first!necessary!to!know!as!much!as!possible!about!the!activities!supported!by!the!airport!in!its!present!form!–!the!uses!of!the!airport,!how!users!value!those!uses,!and!the!form!and!extent!of!other!economic!activities!these!operations!directly!support.!Next,!we!must!anticipate!how!these!direct!impacts!will!change!with!a!newly!extended!runway!–!will!there!be!more!operations,!will!operations!involve!different!aircraft,!how!will!these!changes!be!valued!by!present!and!future!users,!and!how!will!this!changed!use!affect!onJfield!or!nearJfield!commerce.!!In!the!case!of!small!changes,!these!questions!are!difficult!to!answer.!Therefore,!most!impact!analyses,!including!this!one,!focus!on!the!effects!of!large,!allJorJnothing!scenarios!that!are!big!enough!to!more!readily!measure!
!
! 12!
considering the impacts of small changes, analysts and policy-makers often adopt an all-or-nothing approach under which an existing facility or activity is entirely abandoned, or the effects of an altogether new activity are estimated. This latter approach has been used consistently to evaluate aviation access at airports across the U.S., and it is the approach we adopt here. This enables consistent comparisons and harmony with larger, aggregate studies conducted by the Federal Aviation Administration (FAA). Consequently, the impacts we describe are generated by simulating the short-run effects of eliminating a particular airport and evaluating the local economic disruption this would cause.6
THE!CURRENT!STUDY!METHODS!The current UT analysis relies on information from four distinct sources that were combined to provide a synthesis. Data sources included:
•! Data from Existing Tennessee Studies •! Site Visits to both Primary and GA Airports
•! Survey Information from Tennessee Airport Operating Authorities and Users
•! State-Specific Data from Existing National Studies
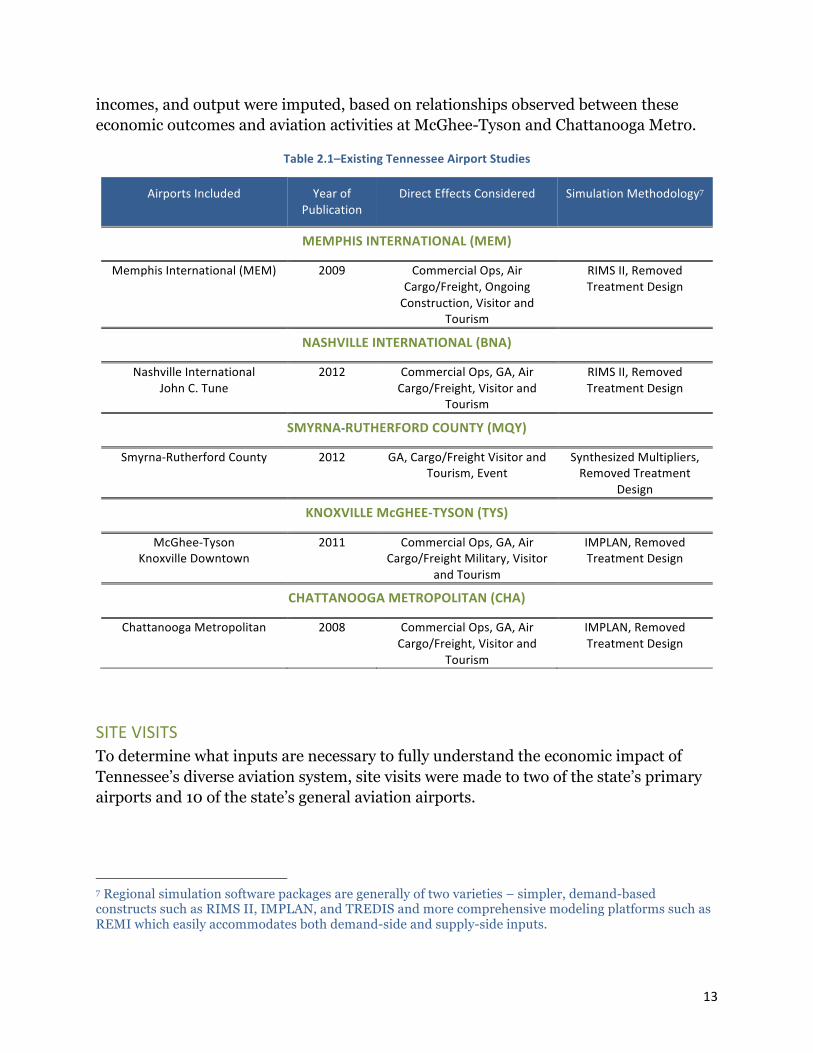
!DATA!FROM!EXISTING!TENNESSEE!AIRPORT!STUDIES!Four of Tennessee’s five primary service airports - Memphis, Nashville, Knoxville, and Chattanooga - have commissioned and published economic impact analyses within the past decade. Additionally, the Nashville study also includes data describing the economic effects of the John C. Tune Airport. The Knoxville study incorporates similar information for Knoxville’s downtown airport and there are independent documents for the GA facilities at both Smyrna and Murfreesboro. The characteristics of these studies are summarized in Table 2.1.
Information from these studies was used to develop estimates of economic impacts for Tennessee’s primary airports and its larger general aviation airports. Income and output figures from each study were indexed to attain current dollar values and study contents were refined to reconciled variations in direct impacts. Finally, in the case of Tri-Cities, where no independently published study was available, values for employment, !!!!!!!!!!!!!!!!!!!!!!!!!!!!!!!!!!!!!!!!!!!!!!!!!!!!!!!!!!!!!6 As noted, the models used to simulate economic impacts depict the characteristics or structure of the current economy. Thus, the economic impacts described below reflect the effects of terminating existing activities at an existing airport – a methodology the Chattanooga study (described below) refers to as a “removed treatment design”. In the long-run, however, the loss of the airport would lead firms to respond by seeking alternative access or by abandoning the community. Either way, the underlying structure of the community would change, so that the long-run impacts of an airport closure could be quite different than those estimated under current methods.
! 13!
incomes, and output were imputed, based on relationships observed between these economic outcomes and aviation activities at McGhee-Tyson and Chattanooga Metro.
Table!2.1–Existing!Tennessee!Airport!Studies!
Airports!Included! Year!of!Publication!
Direct!Effects!Considered! Simulation!Methodology7!
MEMPHIS!INTERNATIONAL!(MEM)!
Memphis!International!(MEM)! 2009! Commercial!Ops,!Air!Cargo/Freight,!Ongoing!Construction,!Visitor!and!
Tourism!
RIMS!II,!Removed!Treatment!Design!
NASHVILLE!INTERNATIONAL!(BNA)!
Nashville!International!John!C.!Tune!
2012! Commercial!Ops,!GA,!Air!Cargo/Freight,!Visitor!and!
Tourism!
RIMS!II,!Removed!Treatment!Design!
SMYRNA>RUTHERFORD!COUNTY!(MQY)!
SmyrnaJRutherford!County! 2012! GA,!Cargo/Freight!Visitor!and!Tourism,!Event!
Synthesized!Multipliers,!Removed!Treatment!
Design!
KNOXVILLE!McGHEE>TYSON!(TYS)!
McGheeJTyson!Knoxville!Downtown!
2011! Commercial!Ops,!GA,!Air!Cargo/Freight!Military,!Visitor!
and!Tourism!
IMPLAN,!Removed!Treatment!Design!
CHATTANOOGA!METROPOLITAN!(CHA)!
Chattanooga!Metropolitan! 2008! Commercial!Ops,!GA,!Air!Cargo/Freight,!Visitor!and!
Tourism!
IMPLAN,!Removed!Treatment!Design!
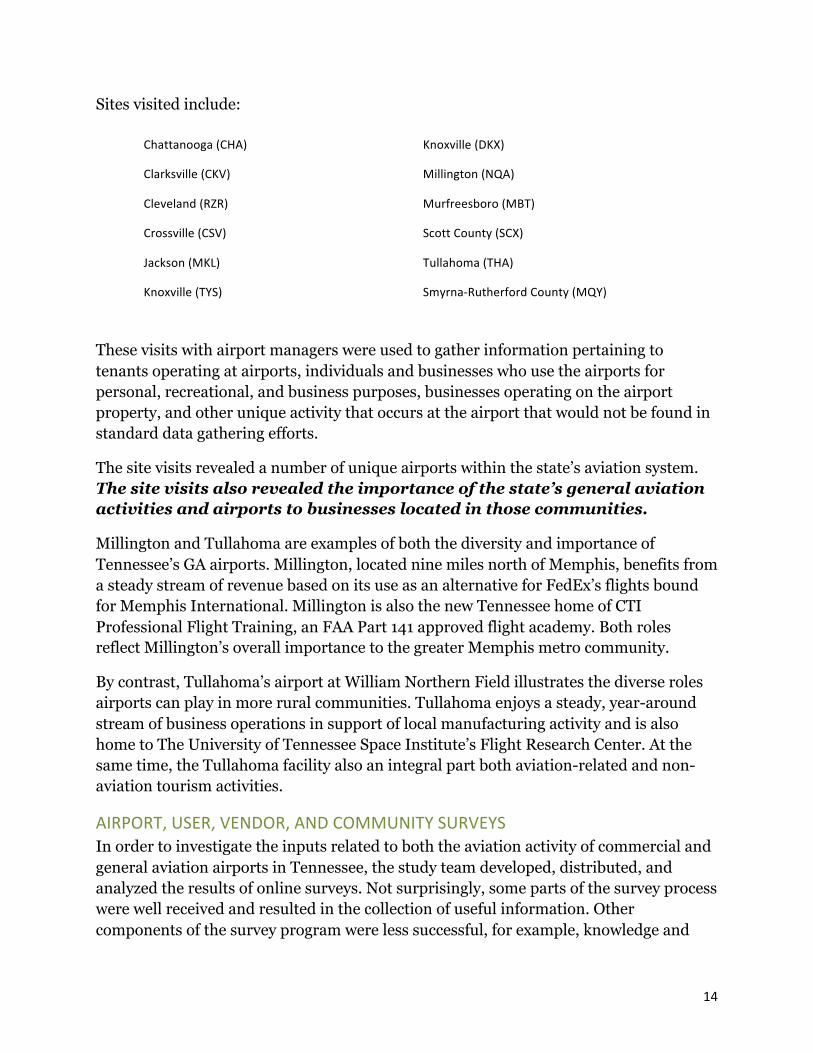
!!SITE!VISITS!To determine what inputs are necessary to fully understand the economic impact of Tennessee’s diverse aviation system, site visits were made to two of the state’s primary airports and 10 of the state’s general aviation airports.
!!!!!!!!!!!!!!!!!!!!!!!!!!!!!!!!!!!!!!!!!!!!!!!!!!!!!!!!!!!!!7 Regional simulation software packages are generally of two varieties – simpler, demand-based constructs such as RIMS II, IMPLAN, and TREDIS and more comprehensive modeling platforms such as REMI which easily accommodates both demand-side and supply-side inputs.
! 14!
Sites visited include:
Chattanooga!(CHA)! Knoxville!(DKX)!
Clarksville!(CKV)! Millington!(NQA)!
Cleveland!(RZR)! Murfreesboro!(MBT)!
Crossville!(CSV)! Scott!County!(SCX)!
Jackson!(MKL)! Tullahoma!(THA)!
Knoxville!(TYS)! SmyrnaJRutherford!County!(MQY)!!
These visits with airport managers were used to gather information pertaining to tenants operating at airports, individuals and businesses who use the airports for personal, recreational, and business purposes, businesses operating on the airport property, and other unique activity that occurs at the airport that would not be found in standard data gathering efforts.
The site visits revealed a number of unique airports within the state’s aviation system. The site visits also revealed the importance of the state’s general aviation activities and airports to businesses located in those communities.
Millington and Tullahoma are examples of both the diversity and importance of Tennessee’s GA airports. Millington, located nine miles north of Memphis, benefits from a steady stream of revenue based on its use as an alternative for FedEx’s flights bound for Memphis International. Millington is also the new Tennessee home of CTI Professional Flight Training, an FAA Part 141 approved flight academy. Both roles reflect Millington’s overall importance to the greater Memphis metro community.
By contrast, Tullahoma’s airport at William Northern Field illustrates the diverse roles airports can play in more rural communities. Tullahoma enjoys a steady, year-around stream of business operations in support of local manufacturing activity and is also home to The University of Tennessee Space Institute’s Flight Research Center. At the same time, the Tullahoma facility also an integral part both aviation-related and non-aviation tourism activities.
AIRPORT,!USER,!VENDOR,!AND!COMMUNITY!SURVEYS!In order to investigate the inputs related to both the aviation activity of commercial and general aviation airports in Tennessee, the study team developed, distributed, and analyzed the results of online surveys. Not surprisingly, some parts of the survey process were well received and resulted in the collection of useful information. Other components of the survey program were less successful, for example, knowledge and
! 15!
reporting of available developable land on and around the airport property. Similarly, airports were reluctant to report lists of tenants or frequent users of the airport, either to maintain privacy or because they simply did not have that data easily available. Copies of survey instruments and extended summaries of survey results are provided in Appendix B.
Survey!Development!and!Distribution!The surveys used to collect data from both primary and secondary airports in Tennessee were developed using Qualtrics online survey software. Two separate instruments were created for distribution to either the commercial or general aviation airports. Surveys were distributed electronically and respondents were also provided a means for immediate electronic response. Additionally, the survey introduction page also included a link for participants to access a PDF copy of the survey to complete offline if desired.
The survey focused on economic indicators of the airport. Questions focused on employment, wages, and value of capital investment by different agencies, private capital investment, operating costs, revenue, tenant inventories, based aircraft, and land development potential. There were some slight variations on the types of questions asked of primary and secondary airports.
At the conclusion of the survey, participants were given the opportunity to provide additional information pertaining to activities at their airport that would be pertinent to the study that the survey questions would not reveal. Participants were also given the option to forgo text entry on the Qualtrics online survey form and email their responses to the project’s email address.
Prior to the survey distribution, prospective participants were made aware of the pending survey through announcements at industry meetings and through TDOT newsletters. These announcements included information pertaining to the importance of their participation, contact information should any questions arise, and an indication of how their responses would be used.
The surveys were distributed to the appropriate participant email addresses that were collected prior to survey development. The email addresses were sent from the project’s email address and each email was uniquely addressed for each airport. The emails provided further instruction on how to complete the surveys, the importance of their participation, and information on how their responses would be used.
At the completion of the survey, the responses of participants who chose electronic submission were automatically recorded in the online software database. The format allowed the respondent to stop and start the survey without losing their work.
! 16!
Two weeks after the surveys were distributed to the airport officials, follow-up emails were sent to the same email addresses used to initially distribute the surveys. The follow-up emails reminded the participants of the importance of their participation and instructions on how to access the survey for the first time or on how to access their uncompleted survey form.
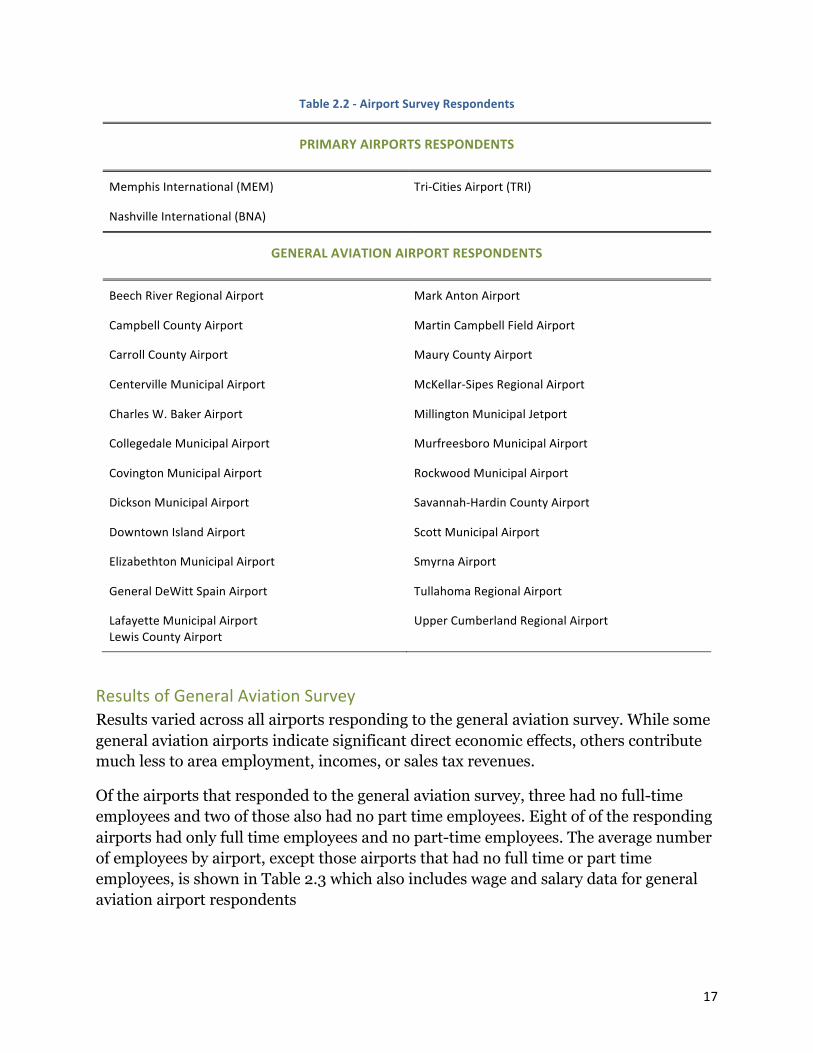
Survey!Results!!Because of the length and detail of the survey the response rate was relatively low. The survey of general aviation and commercial airports in Tennessee garnered a response from 28 out of the state’s 79 public-use airports. Of the airports that completed a survey, three were from primary airports and 25 were from secondary airports. All responding airports are indicated in Table 2.2.
Three of the five primary airports completed the survey, including Tri-Cities Regional Airport (TRI) in Blountville, Memphis International Airport (MEM) in Memphis, and Nashville International Airport (BNA) in Nashville. No survey was received from Chattanooga Metropolitan Airport (CHA) or McGee-Tyson Airport (TYS) in Knoxville. For the purpose of this study, McKellar-Sipes Regional Airport in Jackson was regarded as a general aviation airport despite the periodic commercial service it has supported. However, the the large majority of its activity does not include commercial aviation activities.
! !
! 17!
Table!2.2!>!Airport!Survey!Respondents!
PRIMARY!AIRPORTS!RESPONDENTS!
Memphis!International!(MEM)! TriJCities!Airport!(TRI)!
Nashville!International!(BNA)! !
GENERAL!AVIATION!AIRPORT!RESPONDENTS!
Beech!River!Regional!Airport! Mark!Anton!Airport!
Campbell!County!Airport! Martin!Campbell!Field!Airport!
Carroll!County!Airport! Maury!County!Airport!
Centerville!Municipal!Airport! McKellarJSipes!Regional!Airport!
Charles!W.!Baker!Airport! Millington!Municipal!Jetport!
Collegedale!Municipal!Airport! Murfreesboro!Municipal!Airport!
Covington!Municipal!Airport! Rockwood!Municipal!Airport!
Dickson!Municipal!Airport! SavannahJHardin!County!Airport!
Downtown!Island!Airport! Scott!Municipal!Airport!
Elizabethton!Municipal!Airport! Smyrna!Airport!
General!DeWitt!Spain!Airport! Tullahoma!Regional!Airport!
Lafayette!Municipal!Airport!Lewis!County!Airport!
Upper!Cumberland!Regional!Airport!!
Results!of!General!Aviation!Survey!Results varied across all airports responding to the general aviation survey. While some general aviation airports indicate significant direct economic effects, others contribute much less to area employment, incomes, or sales tax revenues.
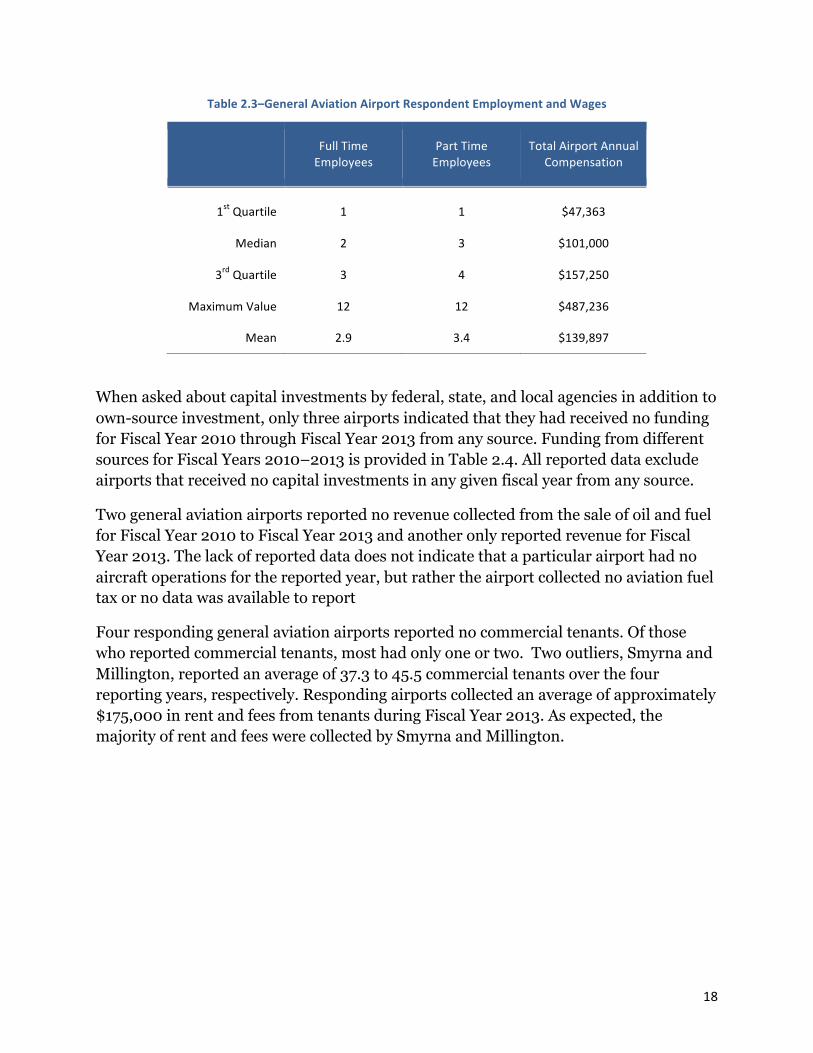
Of the airports that responded to the general aviation survey, three had no full-time employees and two of those also had no part time employees. Eight of of the responding airports had only full time employees and no part-time employees. The average number of employees by airport, except those airports that had no full time or part time employees, is shown in Table 2.3 which also includes wage and salary data for general aviation airport respondents
! !
! 18!
Table!2.3–General!Aviation!Airport!Respondent!Employment!and!Wages!
! Full!Time!Employees!
Part!Time!Employees!
Total!Airport!Annual!Compensation!
1st!Quartile! 1! 1! $47,363!
Median! 2! 3! $101,000!
3rd!Quartile! 3! 4! $157,250!
Maximum!Value! 12! 12! $487,236!
Mean! 2.9! 3.4! $139,897!
!
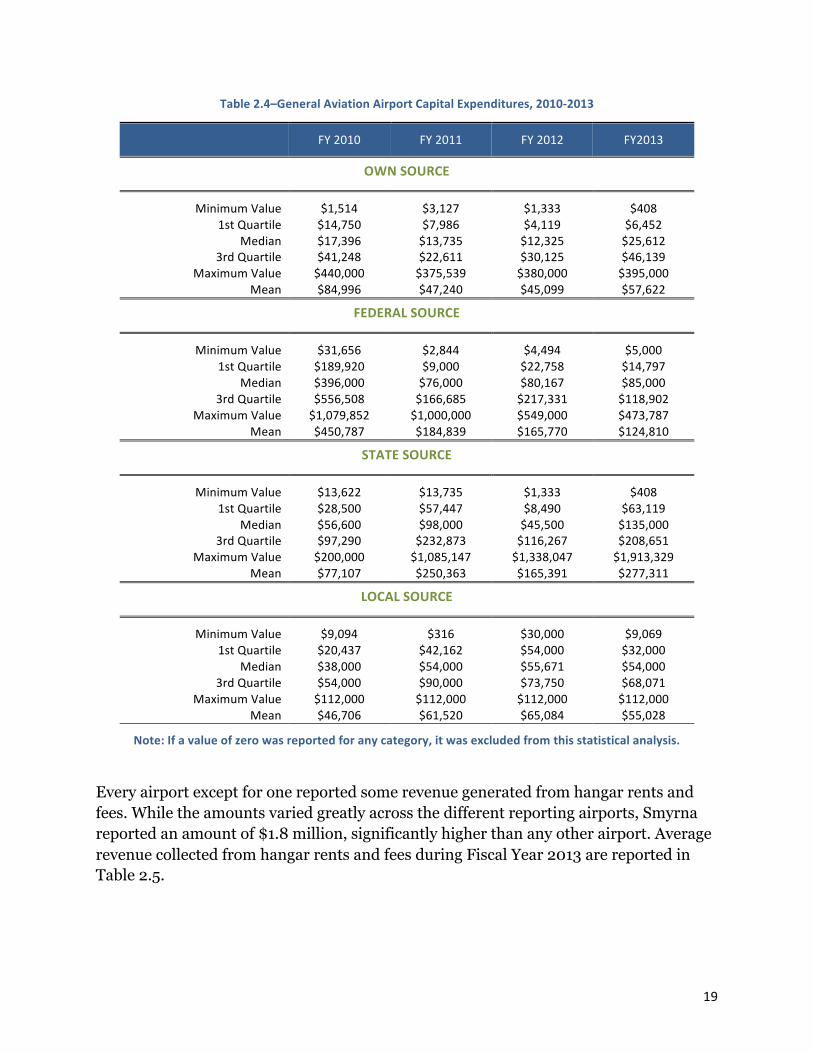
When asked about capital investments by federal, state, and local agencies in addition to own-source investment, only three airports indicated that they had received no funding for Fiscal Year 2010 through Fiscal Year 2013 from any source. Funding from different sources for Fiscal Years 2010–2013 is provided in Table 2.4. All reported data exclude airports that received no capital investments in any given fiscal year from any source.
Two general aviation airports reported no revenue collected from the sale of oil and fuel for Fiscal Year 2010 to Fiscal Year 2013 and another only reported revenue for Fiscal Year 2013. The lack of reported data does not indicate that a particular airport had no aircraft operations for the reported year, but rather the airport collected no aviation fuel tax or no data was available to report
Four responding general aviation airports reported no commercial tenants. Of those who reported commercial tenants, most had only one or two. Two outliers, Smyrna and Millington, reported an average of 37.3 to 45.5 commercial tenants over the four reporting years, respectively. Responding airports collected an average of approximately $175,000 in rent and fees from tenants during Fiscal Year 2013. As expected, the majority of rent and fees were collected by Smyrna and Millington.
! !
! 19!
Table!2.4–General!Aviation!Airport!Capital!Expenditures,!2010>2013!
!
FY!2010! FY!2011! FY!2012! FY2013!
OWN!SOURCE!
Minimum!Value! $1,514!! $3,127!! $1,333!! $408!!1st!Quartile! $14,750!! $7,986!! $4,119!! $6,452!!
Median! $17,396!! $13,735!! $12,325!! $25,612!!3rd!Quartile! $41,248!! $22,611!! $30,125!! $46,139!!
Maximum!Value! $440,000!! $375,539!! $380,000!! $395,000!!Mean! $84,996!! $47,240!! $45,099!! $57,622!!
FEDERAL!SOURCE!
Minimum!Value! $31,656!! $2,844!! $4,494!! $5,000!!1st!Quartile! $189,920!! $9,000!! $22,758!! $14,797!!
Median! $396,000!! $76,000!! $80,167!! $85,000!!3rd!Quartile! $556,508!! $166,685!! $217,331!! $118,902!!
Maximum!Value! $1,079,852!! $1,000,000!! $549,000!! $473,787!!Mean! $450,787!! $184,839!! $165,770!! $124,810!!
STATE!SOURCE!
Minimum!Value! $13,622!! $13,735!! $1,333!! $408!!1st!Quartile! $28,500!! $57,447!! $8,490!! $63,119!!
Median! $56,600!! $98,000!! $45,500!! $135,000!!3rd!Quartile! $97,290!! $232,873!! $116,267!! $208,651!!
Maximum!Value! $200,000!! $1,085,147!! $1,338,047!! $1,913,329!!Mean! $77,107!! $250,363!! $165,391!! $277,311!!
LOCAL!SOURCE!
Minimum!Value! $9,094!! $316!! $30,000!! $9,069!!1st!Quartile! $20,437!! $42,162!! $54,000!! $32,000!!
Median! $38,000!! $54,000!! $55,671!! $54,000!!3rd!Quartile! $54,000!! $90,000!! $73,750!! $68,071!!
Maximum!Value! $112,000!! $112,000!! $112,000!! $112,000!!Mean! $46,706!! $61,520!! $65,084!! $55,028!!
Note:!If!a!value!of!zero!was!reported!for!any!category,!it!was!excluded!from!this!statistical!analysis.!
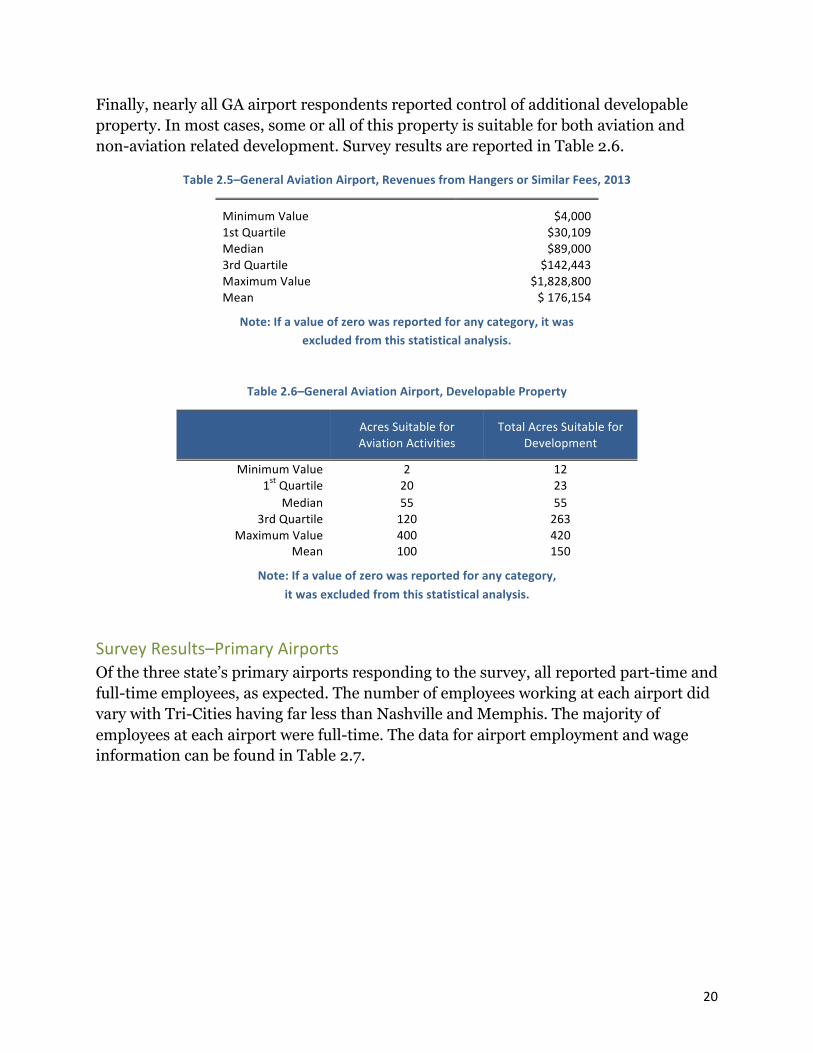
Every airport except for one reported some revenue generated from hangar rents and fees. While the amounts varied greatly across the different reporting airports, Smyrna reported an amount of $1.8 million, significantly higher than any other airport. Average revenue collected from hangar rents and fees during Fiscal Year 2013 are reported in Table 2.5.
! 20!
Finally, nearly all GA airport respondents reported control of additional developable property. In most cases, some or all of this property is suitable for both aviation and non-aviation related development. Survey results are reported in Table 2.6.
Table!2.5–General!Aviation!Airport,!Revenues!from!Hangers!or!Similar!Fees,!2013!
Minimum!Value! $4,000!1st!Quartile! $30,109!Median! $89,000!3rd!Quartile! $142,443!Maximum!Value! $1,828,800!Mean! $!176,154!
Note:!If!a!value!of!zero!was!reported!for!any!category,!it!was!
excluded!from!this!statistical!analysis.
Table!2.6–General!Aviation!Airport,!Developable!Property!
!
Acres!Suitable!for!Aviation!Activities!
Total!Acres!Suitable!for!Development!
Minimum!Value! 2! 12!1st!Quartile! 20! 23!
Median! 55! 55!3rd!Quartile! 120! 263!
Maximum!Value! 400! 420!Mean! 100! 150!
Note:!If!a!value!of!zero!was!reported!for!any!category,!!
it!was!excluded!from!this!statistical!analysis.!
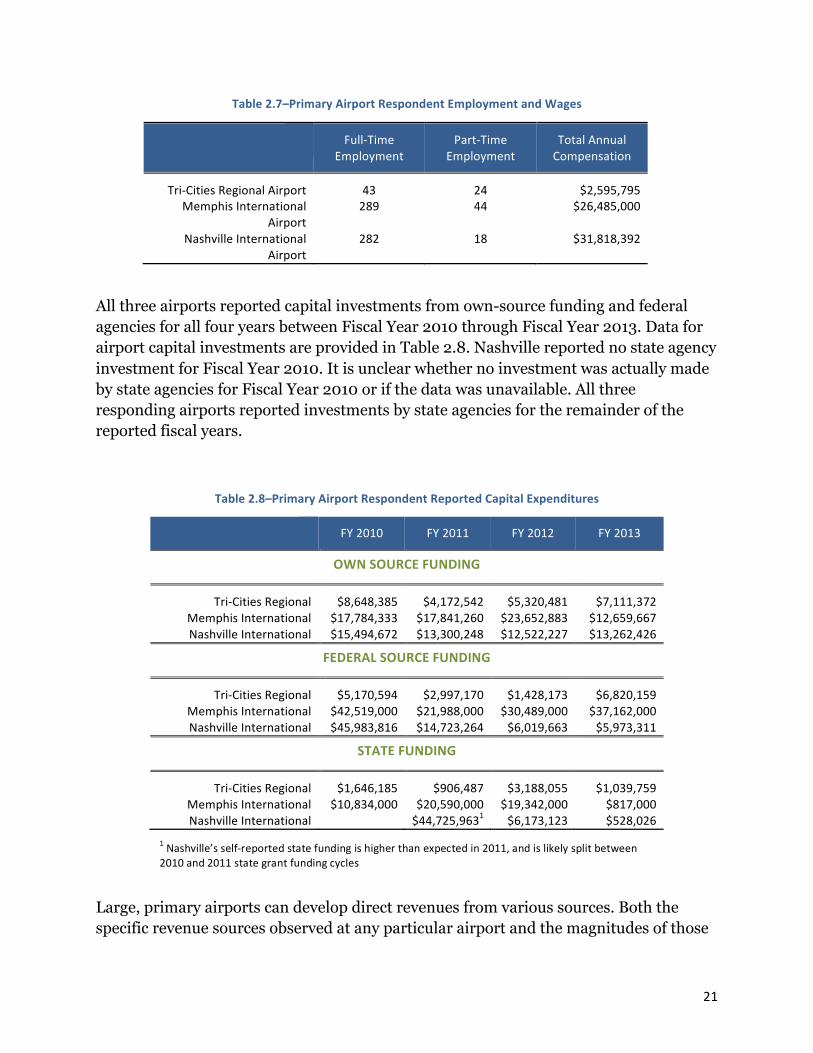
Survey!Results–Primary!Airports!Of the three state’s primary airports responding to the survey, all reported part-time and full-time employees, as expected. The number of employees working at each airport did vary with Tri-Cities having far less than Nashville and Memphis. The majority of employees at each airport were full-time. The data for airport employment and wage information can be found in Table 2.7.
!
! !
! 21!
Table!2.7–Primary!Airport!Respondent!Employment!and!Wages!
! FullJTime!Employment!
PartJTime!Employment!
Total!Annual!Compensation!
TriJCities!Regional!Airport! 43! 24! !$2,595,795!Memphis!International!
Airport!289! 44! !$26,485,000!
Nashville!International!Airport!
282! 18! !$31,818,392!
All three airports reported capital investments from own-source funding and federal agencies for all four years between Fiscal Year 2010 through Fiscal Year 2013. Data for airport capital investments are provided in Table 2.8. Nashville reported no state agency investment for Fiscal Year 2010. It is unclear whether no investment was actually made by state agencies for Fiscal Year 2010 or if the data was unavailable. All three responding airports reported investments by state agencies for the remainder of the reported fiscal years.
Table!2.8–Primary!Airport!Respondent!Reported!Capital!Expenditures!
! FY!2010! FY!2011! FY!2012! FY!2013!
OWN!SOURCE!FUNDING!
TriJCities!Regional! $8,648,385!! $4,172,542!! $5,320,481!! $7,111,372!!Memphis!International! $17,784,333!! $17,841,260!! $23,652,883!! $12,659,667!!Nashville!International!! $15,494,672!! $13,300,248!! $12,522,227!! $13,262,426!!
FEDERAL!SOURCE!FUNDING!
TriJCities!Regional! $5,170,594! $2,997,170! $1,428,173! $6,820,159!Memphis!International! $42,519,000! $21,988,000! $30,489,000! $37,162,000!Nashville!International! $45,983,816! $14,723,264! $6,019,663! $5,973,311!
STATE!FUNDING!
TriJCities!Regional! $1,646,185!! $906,487!! $3,188,055!! $1,039,759!!Memphis!International! $10,834,000!! $20,590,000!! $19,342,000!! $817,000!!Nashville!International!! ! $44,725,9631!! $6,173,123!! $528,026!!
Large, primary airports can develop direct revenues from various sources. Both the specific revenue sources observed at any particular airport and the magnitudes of those
1!Nashville’s!selfJreported!state!funding!is!higher!than!expected!in!2011,!and!is!likely!split!between!2010!and!2011!state!grant!funding!cycles!
! 22!
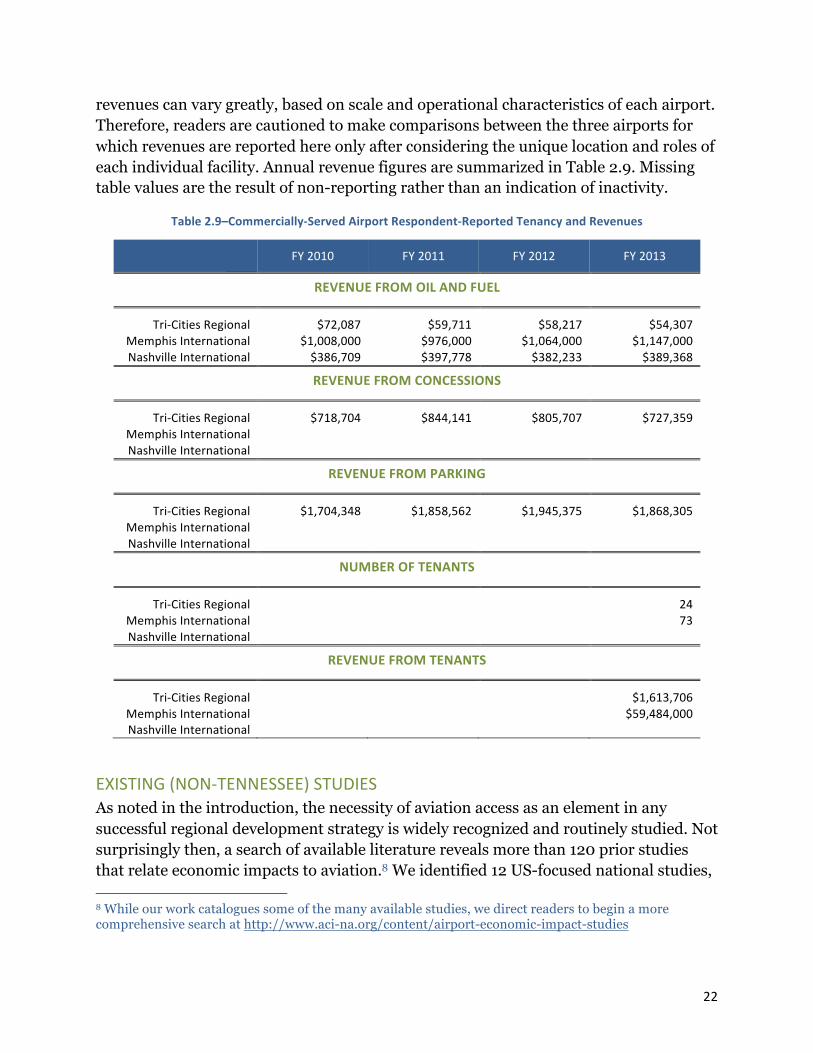
revenues can vary greatly, based on scale and operational characteristics of each airport. Therefore, readers are cautioned to make comparisons between the three airports for which revenues are reported here only after considering the unique location and roles of each individual facility. Annual revenue figures are summarized in Table 2.9. Missing table values are the result of non-reporting rather than an indication of inactivity.
Table!2.9–Commercially>Served!Airport!Respondent>Reported!Tenancy!and!Revenues!
!FY!2010! FY!2011! FY!2012! FY!2013!
REVENUE!FROM!OIL!AND!FUEL!
TriJCities!Regional! $72,087! $59,711! $58,217! $54,307!Memphis!International! $1,008,000! $976,000! $1,064,000! $1,147,000!Nashville!International! $386,709! $397,778! $382,233! $389,368!
REVENUE!FROM!CONCESSIONS!
TriJCities!Regional! $718,704! $844,141! $805,707! $727,359!Memphis!International! ! ! ! !Nashville!International! ! ! ! !
REVENUE!FROM!PARKING!
TriJCities!Regional! $1,704,348! $1,858,562! $1,945,375! $1,868,305!Memphis!International! ! ! ! !Nashville!International! ! ! ! !
NUMBER!OF!TENANTS!
TriJCities!Regional! ! ! ! 24!Memphis!International! ! ! ! 73!Nashville!International! ! ! ! !
REVENUE!FROM!TENANTS!
TriJCities!Regional! ! ! ! $1,613,706!Memphis!International! ! ! ! $59,484,000!Nashville!International! ! ! ! !
EXISTING!(NONJTENNESSEE)!STUDIES!As noted in the introduction, the necessity of aviation access as an element in any successful regional development strategy is widely recognized and routinely studied. Not surprisingly then, a search of available literature reveals more than 120 prior studies that relate economic impacts to aviation.8 We identified 12 US-focused national studies, !!!!!!!!!!!!!!!!!!!!!!!!!!!!!!!!!!!!!!!!!!!!!!!!!!!!!!!!!!!!!8 While our work catalogues some of the many available studies, we direct readers to begin a more comprehensive search at http://www.aci-na.org/content/airport-economic-impact-studies
! 23!
many of which contain state-specific estimates; there are, at least, 38 relatively recent state-sponsored studies; and this search also located more than 70 airport-specific studies.9 Collectively, these studies provided a wealth of information for our Tennessee work.
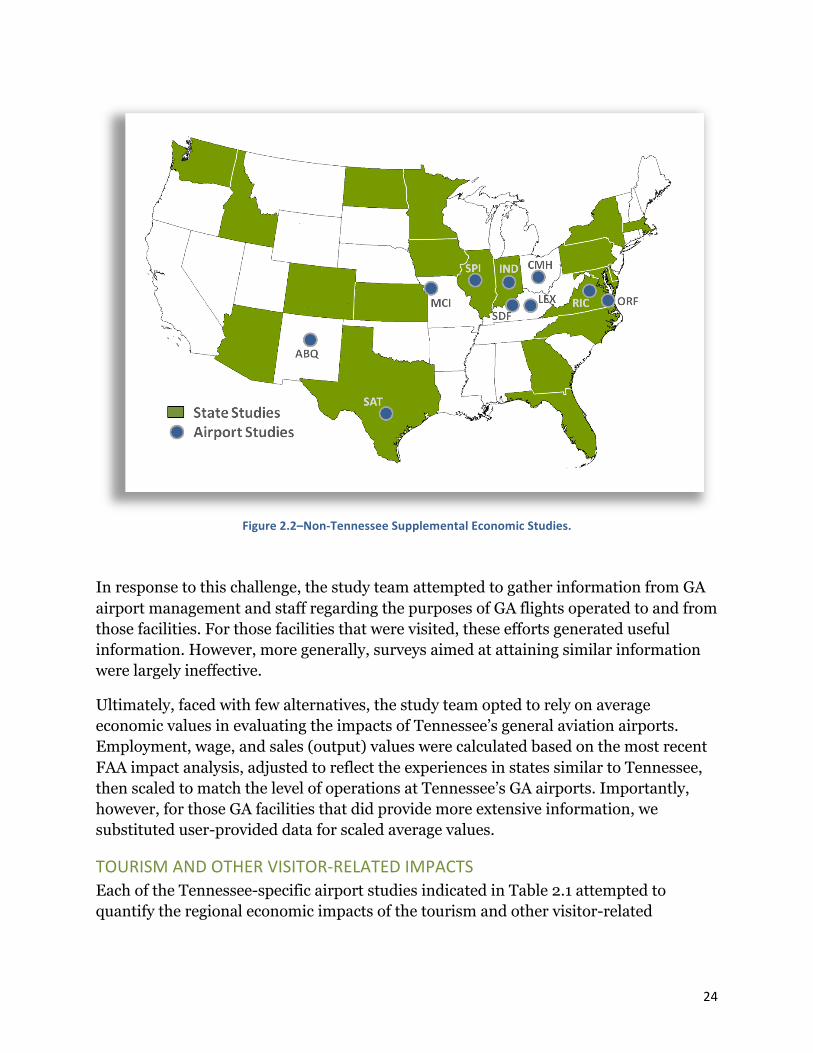
Of the many alternatives, the study team selected 20 state studies and 10 airport-specific studies to uses as supplemental data sources, a means of validating Tennessee estimates, and a vehicle for overall comparisons. These states and airports are depicted in Figure 2.2.
MEASURING!THE!IMPACTS!OF!GENERAL!AVIATION!Scheduled passenger operations and dedicated air freight activities are well-documented through FAA records. However, while there are records of GA operations, those records provide incomplete data regarding the purpose of logged flights.10 Thus, beyond the immediate demands that GA operations create at airports (fuel, maintenance, FBO services, instruction, etc.), it is extremely difficult to identify and evaluate the economic effects attributable to general aviation.
!!!!!!!!!!!!!!!!!!!!!!!!!!!!!!!!!!!!!!!!!!!!!!!!!!!!!!!!!!!!!9 We also identified 19 studies that focus on the economic impact of aviation at around Canadian airports, but because of institutional differences, these studies were excluded from consideration here. 10 Records do sometimes provide information regarding charter flights, dedicated air cargo services, or medical flights, but this information is not always collected, nor is it particularly accurate.
! 24!
Figure!2.2–Non>Tennessee!Supplemental!Economic!Studies.!
In response to this challenge, the study team attempted to gather information from GA airport management and staff regarding the purposes of GA flights operated to and from those facilities. For those facilities that were visited, these efforts generated useful information. However, more generally, surveys aimed at attaining similar information were largely ineffective.
Ultimately, faced with few alternatives, the study team opted to rely on average economic values in evaluating the impacts of Tennessee’s general aviation airports. Employment, wage, and sales (output) values were calculated based on the most recent FAA impact analysis, adjusted to reflect the experiences in states similar to Tennessee, then scaled to match the level of operations at Tennessee’s GA airports. Importantly, however, for those GA facilities that did provide more extensive information, we substituted user-provided data for scaled average values.
TOURISM!AND!OTHER!VISITORJRELATED!IMPACTS!Each of the Tennessee-specific airport studies indicated in Table 2.1 attempted to quantify the regional economic impacts of the tourism and other visitor-related

! 25!
expenditures that are supported by a particular airport’s scheduled or charter passenger operations.
While not entirely precise, there is an accepted method for making this assessment. The first step is to segregate arriving and departing passengers in resident and non-resident groupings. This is accomplished by acquiring and applying proprietary information or through statistical modeling. The next step is to determine how a lack of air transport would affect the travel decisions of non-resident travelers. For some, the parameters of their stays would not change at all. For others, the lack of commercial airline access would preclude travel to the study region altogether. Finally, for many travelers, a lack of aviation access would not preclude their trip, but would shorten their stay in the study region.
Ultimately, the goal is to determine the net difference in visitor days that would result from improved or degraded aviation access then apply mean daily visitor expenditure values to that difference in order to calculate the direct economic impacts of available aviation. These monetized direct visitor-related effects are then used as seeds within the economic simulations described above.
The process for evaluating the economic impacts of aviation events, like air shows is similar except that regional residents who attend these events are included in the calculation of impacts if there is credible evidence that they would not have spent similar amounts in the study region for other purposes had the event not been held.
! 26!
THREE A!MORE!COMPLETE!LOOK!AT!STUDY!RESULTS!In a 21st century America, local and regional access to safe, affordable, and reliable aviation is essential. Moreover, the analytical results summarized in Table 1 confirm that this is certainly true in Tennessee. In the section that follows we revisit these results in several ways. First, we disaggregate the analytical results and discuss their implications, both in terms of the state’s geography and as they relate to specific aviation functions. This is followed by a selective comparison of aviation availability and its economic importance in which Tennessee aviation outcomes are placed side-to-side with aviation-related impacts elsewhere. Finally, we take a qualitative look at some of the intangible aspects of aviation access that, while hard to quantify, remain important to overall regional prosperity.
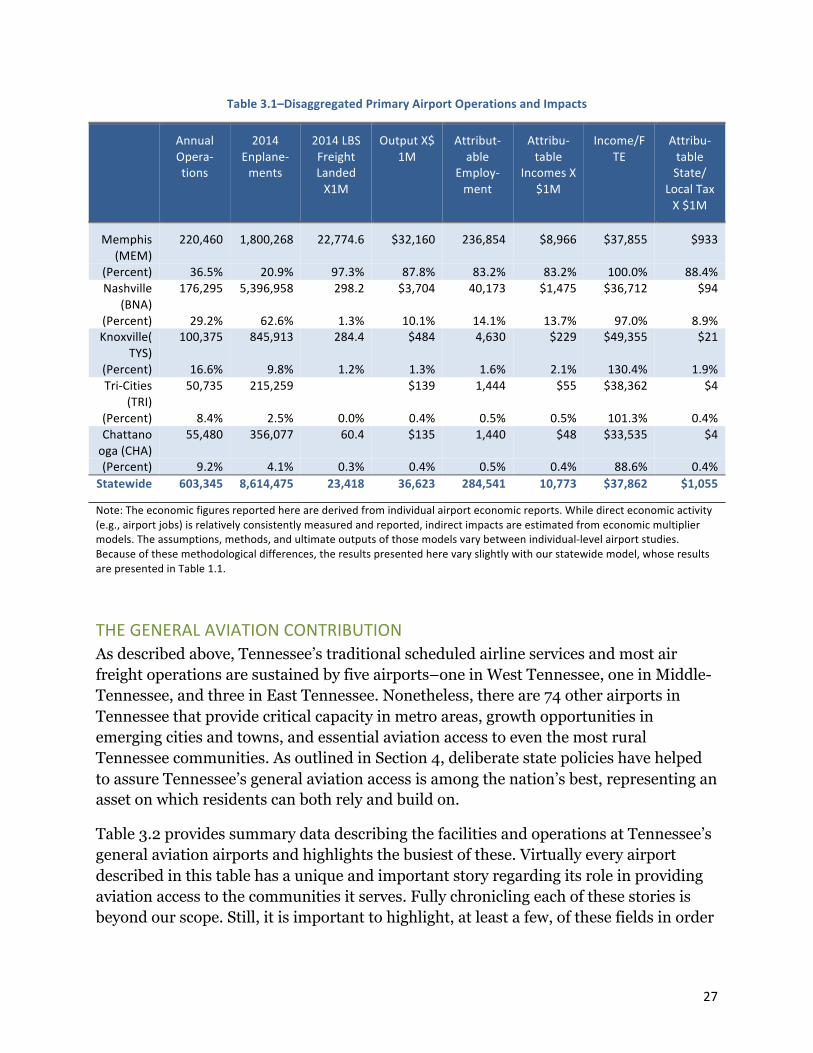
COMMERCIAL!OPERATIONS!AT!PRIMARY!AIRPORTS!!The commercial aviation airport results are presented here as Table 3.1. These results are drawn from individual airport reports. Of note, these results differ from our statewide results because of different methods. However, the overall character of these results are consistent and not surprising – the estimated magnitudes certainly underscore the relative economic importance of Memphis and Nashville International Airports. The comparisons provided below further describe the extent, but in terms of economic importance, MEM and BNA are overwhelming, albeit in different ways. Memphis International is without parallel–anywhere–in terms of the volume of freight landed on an annual basis. However, from a passenger perspective, Nashville International is truly the doorway to and from Tennessee, accounting for nearly two-thirds of all passenger enplanements in 2014. In West Tennessee, Memphis is the main source of commercial aviation access and is responsible for roughly 21 percent of 2014 statewide enplanements. Over time, Memphis’ commercial service has diminished while FedEx freight service has increased. However, commercial aviation activity in East Tennessee is split between the region’s three commercial airports–Knoxville, Chattanooga, and Tri-Cities, which together claimed 16.4 percent of enplanements. One factor not made immediately obvious in Table 3.1 is that both TYS and CHA also support measurable military operations. In fact, at McGhee-Tyson, nearly one-quarter (24 percent) of all landings and take-offs are related to military activity. Memphis, Jackson and Nashville also serve significant military aviation activity.
! 27!
Table!3.1–Disaggregated!Primary!Airport!Operations!and!Impacts!
!! Annual!OperaJtions!
2014!EnplaneJments!
2014!LBS!Freight!Landed!X1M!
Output!X$!1M!
AttributJable!
EmployJment!
AttribuJtable!
Incomes!X!$1M!
Income/FTE!
AttribuJtable!State/!
Local!Tax!X!$1M!
Memphis!(MEM)!
220,460! 1,800,268! 22,774.6! $32,160! 236,854! $8,966! $37,855! $933!
(Percent)! 36.5%! 20.9%! 97.3%! 87.8%! 83.2%! 83.2%! 100.0%! 88.4%!Nashville!
(BNA)!176,295! 5,396,958! 298.2! $3,704! 40,173! $1,475! $36,712! $94!
(Percent)! 29.2%! 62.6%! 1.3%! 10.1%! 14.1%! 13.7%! 97.0%! 8.9%!Knoxville(
TYS)!100,375! 845,913! 284.4! $484! 4,630! $229! $49,355! $21!
(Percent)! 16.6%! 9.8%! 1.2%! 1.3%! 1.6%! 2.1%! 130.4%! 1.9%!TriJCities!
(TRI)!50,735! 215,259! ! $139! 1,444! $55! $38,362! $4!
(Percent)! 8.4%! 2.5%! 0.0%! 0.4%! 0.5%! 0.5%! 101.3%! 0.4%!Chattanooga!(CHA)!
55,480! 356,077! 60.4! $135! 1,440! $48! $33,535! $4!
(Percent)! 9.2%! 4.1%! 0.3%! 0.4%! 0.5%! 0.4%! 88.6%! 0.4%!Statewide! 603,345! 8,614,475! 23,418! 36,623! 284,541! 10,773! $37,862! $1,055!
Note:!The!economic!figures!reported!here!are!derived!from!individual!airport!economic!reports.!While!direct!economic!activity!(e.g.,!airport!jobs)!is!relatively!consistently!measured!and!reported,!indirect!impacts!are!estimated!from!economic!multiplier!models.!The!assumptions,!methods,!and!ultimate!outputs!of!those!models!vary!between!individualJlevel!airport!studies.!Because!of!these!methodological!differences,!the!results!presented!here!vary!slightly!with!our!statewide!model,!whose!results!are!presented!in!Table!1.1.!
THE!GENERAL!AVIATION!CONTRIBUTION!As described above, Tennessee’s traditional scheduled airline services and most air freight operations are sustained by five airports–one in West Tennessee, one in Middle-Tennessee, and three in East Tennessee. Nonetheless, there are 74 other airports in Tennessee that provide critical capacity in metro areas, growth opportunities in emerging cities and towns, and essential aviation access to even the most rural Tennessee communities. As outlined in Section 4, deliberate state policies have helped to assure Tennessee’s general aviation access is among the nation’s best, representing an asset on which residents can both rely and build on.
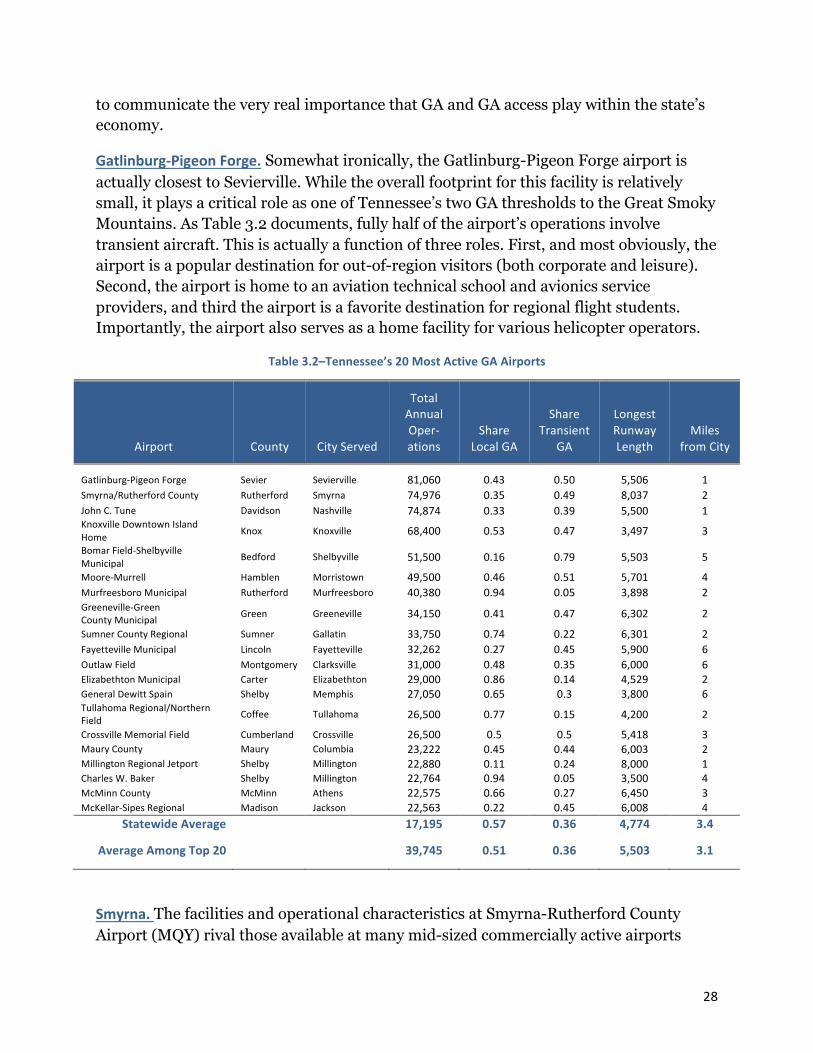
Table 3.2 provides summary data describing the facilities and operations at Tennessee’s general aviation airports and highlights the busiest of these. Virtually every airport described in this table has a unique and important story regarding its role in providing aviation access to the communities it serves. Fully chronicling each of these stories is beyond our scope. Still, it is important to highlight, at least a few, of these fields in order
! 28!
to communicate the very real importance that GA and GA access play within the state’s economy.
Gatlinburg>Pigeon!Forge. Somewhat ironically, the Gatlinburg-Pigeon Forge airport is actually closest to Sevierville. While the overall footprint for this facility is relatively small, it plays a critical role as one of Tennessee’s two GA thresholds to the Great Smoky Mountains. As Table 3.2 documents, fully half of the airport’s operations involve transient aircraft. This is actually a function of three roles. First, and most obviously, the airport is a popular destination for out-of-region visitors (both corporate and leisure). Second, the airport is home to an aviation technical school and avionics service providers, and third the airport is a favorite destination for regional flight students. Importantly, the airport also serves as a home facility for various helicopter operators.
Table!3.2–Tennessee’s!20!Most!Active!GA!Airports!
Airport! County! City!Served!
Total!Annual!OperJations!
!
Share!Local!GA!
Share!Transient!
GA!
Longest!Runway!Length!
Miles!from!City!
GatlinburgJPigeon!Forge! Sevier! Sevierville! 81,060! 0.43! 0.50! 5,506! 1!Smyrna/Rutherford!County! Rutherford! Smyrna! 74,976! 0.35! 0.49! 8,037! 2!John!C.!Tune! Davidson! Nashville! 74,874! 0.33! 0.39! 5,500! 1!Knoxville!Downtown!Island!Home! Knox! Knoxville! 68,400! 0.53! 0.47! 3,497! 3!Bomar!FieldJShelbyville!Municipal! Bedford! Shelbyville! 51,500! 0.16! 0.79! 5,503! 5!
MooreJMurrell! Hamblen! Morristown! 49,500! 0.46! 0.51! 5,701! 4!Murfreesboro!Municipal! Rutherford! Murfreesboro! 40,380! 0.94! 0.05! 3,898! 2!GreenevilleJGreen!!County!Municipal! Green! Greeneville! 34,150! 0.41! 0.47! 6,302! 2!
Sumner!County!Regional! Sumner! Gallatin! 33,750! 0.74! 0.22! 6,301! 2!Fayetteville!Municipal! Lincoln! Fayetteville! 32,262! 0.27! 0.45! 5,900! 6!Outlaw!Field! Montgomery! Clarksville! 31,000! 0.48! 0.35! 6,000! 6!Elizabethton!Municipal! Carter! Elizabethton! 29,000! 0.86! 0.14! 4,529! 2!General!Dewitt!Spain! Shelby! Memphis! 27,050! 0.65! 0.3! 3,800! 6!Tullahoma!Regional/Northern!Field! Coffee! Tullahoma! 26,500! 0.77! 0.15! 4,200! 2!
Crossville!Memorial!Field! Cumberland! Crossville! 26,500! 0.5! 0.5! 5,418! 3!Maury!County! Maury! Columbia! 23,222! 0.45! 0.44! 6,003! 2!Millington!Regional!Jetport! Shelby! Millington! 22,880! 0.11! 0.24! 8,000! 1!Charles!W.!Baker! Shelby! Millington! 22,764! 0.94! 0.05! 3,500! 4!McMinn!County! McMinn! Athens! 22,575! 0.66! 0.27! 6,450! 3!McKellarJSipes!Regional! Madison! Jackson! 22,563! 0.22! 0.45! 6,008! 4!
Statewide!Average!
! !
17,195! 0.57! 0.36! 4,774! 3.4!
Average!Among!Top!20!
! !
39,745! 0.51! 0.36! 5,503! 3.1!
Smyrna.!The facilities and operational characteristics at Smyrna-Rutherford County Airport (MQY) rival those available at many mid-sized commercially active airports
! 29!
across the U.S. Moreover, while the Smyrna facility is 23 miles from Nashville, it is only 10.3 (nautical, direct) miles from BNA and is one of two GA airports serving the metro-Nashville area (the other is John C. Tune described next). It is the second busiest GA airport in Tennessee. Based on its characteristics and location, MQY is proving to be an ideal location for large corporate users with space requirements that exceed what is readily available at other Nashville area fields, in part because of its proximity to Nashville and it’s 8000’ runway. Moreover, Smyrna hosts a large blimp facility with long-term blimp tenants.
John!C.!Tune. Located just 8 miles from Nashville’s city center, John C. Tune (JWN) is a busy GA facility that one would expect to find at the core of a vibrant, growing metro area like Nashville. Nonetheless, Tune’s single 6000 x 100 runway (2/20) does preclude the airport’s use in some settings, particularly large aircraft and situations where the single runway does not provide adequate capacity to meet all demand. However, this airport’s complementary nature among the trio of metro-Nashville airports (BNA and MQY) allows JWN to provide high accessibility to GA customers in Nashville. Taken together, these three Nashville airports cumulatively support more operations than any other urban system of airports in Tennessee, even exceeding Memphis area airports (MEM and NQA).
Tullahoma!Regional. While GA aviation access is critical to Tennessee’s metropolitan areas, it is equally important to the economic vitality of smaller communities. The relationship between Tullahoma Regional / William Northern Field (THA) and the Coffee County communities of Tullahoma and Manchester exemplifies this importance. None of the functions served by this airport are, by themselves, unique. Instead, the airport is made remarkable by the number and variety of its roles and the success with which these roles are executed. To begin, the field is a home to a considerable amount of essential corporate aviation, hosting operations for locally based aviation equipment manufacturers, the region’s rather famous distillers, and other regional businesses. Additionally, Tullahoma is the home to the Beechcraft Heritage Museum, which is a regular host to national and international “fly-in” events. Finally, for a few days each June, Tullahoma sees a surge in operations associated with the Bonnaroo music and outdoor festival held near Manchester.
Millington!Jetport.!The Millington Jetport (NQA) is perhaps the state’s most enigmatic general aviation facility where monolithic and somewhat melancholy reminders of aviation’s past are blended with forward-looking 21st century capacity and operations to form an environment that is unarguably unique. The Jetport is a repurposed Naval air station with a runway (4/22) that is more than 8000 in length and 200 feet wide. Under agreement and through support for FedEx its tower is staffed 24 hours each day. In addition to FedEx and on-field corporate users, each year, the airport is host to various fire-suppression and other emergency responder training exercise. Finally, within the
! 30!
past 18 months, the jetport has become the home of Crew Training International’s (CTI) newest flight training facility. Even with this array of activities, Millington has ample space and operational capacity. Its relatively aggressive management team envisions the jetport’s current roles as only a benchmark against which their future successes will be measured.
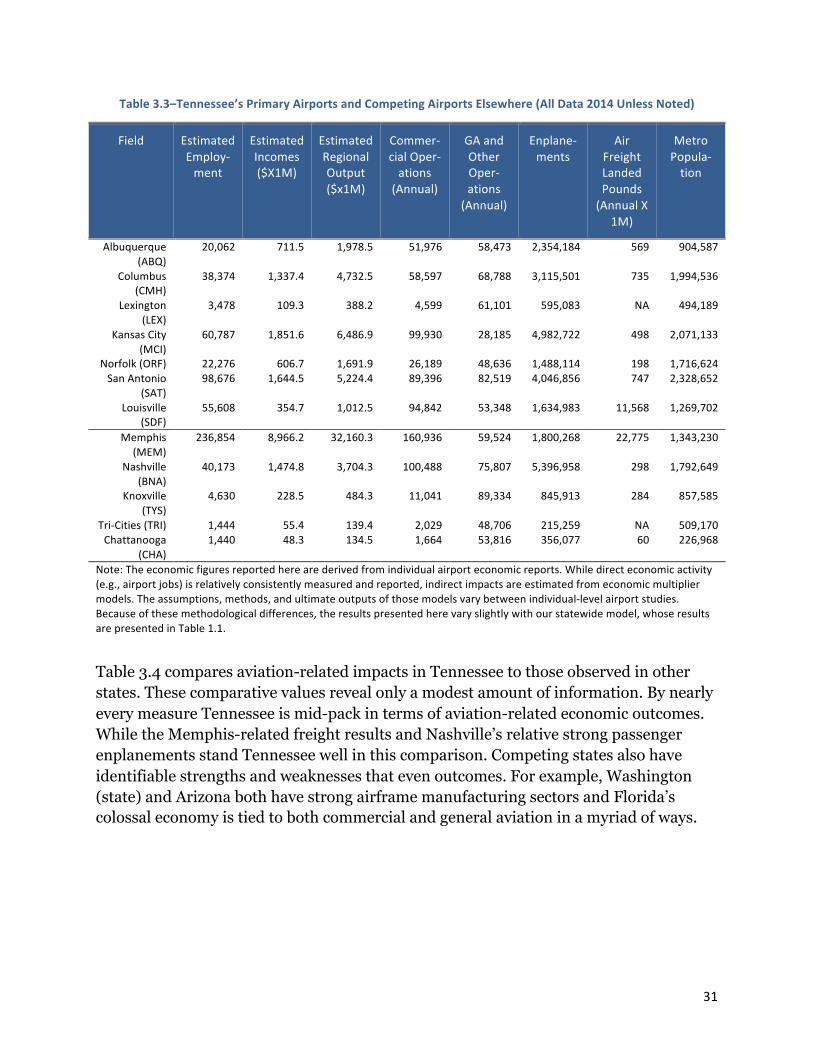
BY!COMPARISON!In a 21st century America, local and regional access to safe, affordable, and reliable aviation is essential and it is, therefore, also highly competitive. A region’s aviation services and related-commerce both bolster and also reflect that region’s broader regional prosperity. Consequently, assessing the success of Tennessee’s aviation community and programs suggests comparing results here with those observed elsewhere. Accordingly, Table 3.3 compares Tennessee’s five primary airports with specific operations elsewhere and Table 3.4, provides a comparison of aggregate statewide aviation outcomes across a number of states.
The selection of airports depicted in Table 3.3 was based on three criteria–regional proximity, the economic characteristics of the host community, and availability of airport-specific economic impact estimates. In the case of air freight, this comparison quantifies results that were expected. Whether based on the simple total or based on per-capita values, Memphis International dwarfs any would-be competitor even though the comparison group includes Louisville, where UPS operates a major air freight hub.
No less impressive, but perhaps unexpectedly, Nashville International boast passenger traffic that is far more robust than other airports in the comparison group. Of the 12 airports for which data is reported, BNA had the largest number of passenger enplanements even though metro Kansas City, San Antonio, and Columbus each have measurably larger populations.
! !
! 31!
Table!3.3–Tennessee’s!Primary!Airports!and!Competing!Airports!Elsewhere!(All!Data!2014!Unless!Noted)!
Field! Estimated!EmployJment!
Estimated!Incomes!($X1M)!
Estimated!Regional!Output!($x1M)!
CommerJcial!OperJations!(Annual)!
GA!and!Other!OperJations!(Annual)!
EnplaneJments!
Air!Freight!Landed!Pounds!(Annual!X!
1M)!
Metro!PopulaJtion!
Albuquerque!(ABQ)!
20,062! 711.5! 1,978.5! 51,976! 58,473! 2,354,184! 569! 904,587!
Columbus!(CMH)!
38,374! 1,337.4! 4,732.5! 58,597! 68,788! 3,115,501! 735! 1,994,536!
Lexington!(LEX)!
3,478! 109.3! 388.2! 4,599! 61,101! 595,083! NA! 494,189!
Kansas!City!(MCI)!
60,787! 1,851.6! 6,486.9! 99,930! 28,185! 4,982,722! 498! 2,071,133!
Norfolk!(ORF)! 22,276! 606.7! 1,691.9! 26,189! 48,636! 1,488,114! 198! 1,716,624!San!Antonio!
(SAT)!98,676! 1,644.5! 5,224.4! 89,396! 82,519! 4,046,856! 747! 2,328,652!
Louisville!(SDF)!
55,608! 354.7! 1,012.5! 94,842! 53,348! 1,634,983! 11,568! 1,269,702!
Memphis!(MEM)!
236,854! 8,966.2! 32,160.3! 160,936! 59,524! 1,800,268! 22,775! 1,343,230!
Nashville!(BNA)!
40,173! 1,474.8! 3,704.3! 100,488! 75,807! 5,396,958! 298! 1,792,649!
Knoxville!(TYS)!
4,630! 228.5! 484.3! 11,041! 89,334! 845,913! 284! 857,585!
TriJCities!(TRI)! 1,444! 55.4! 139.4! 2,029! 48,706! 215,259! NA! 509,170!Chattanooga!
(CHA)!1,440! 48.3! 134.5! 1,664! 53,816! 356,077! 60! 226,968!
Note:!The!economic!figures!reported!here!are!derived!from!individual!airport!economic!reports.!While!direct!economic!activity!(e.g.,!airport!jobs)!is!relatively!consistently!measured!and!reported,!indirect!impacts!are!estimated!from!economic!multiplier!models.!The!assumptions,!methods,!and!ultimate!outputs!of!those!models!vary!between!individualJlevel!airport!studies.!Because!of!these!methodological!differences,!the!results!presented!here!vary!slightly!with!our!statewide!model,!whose!results!are!presented!in!Table!1.1.!!
!
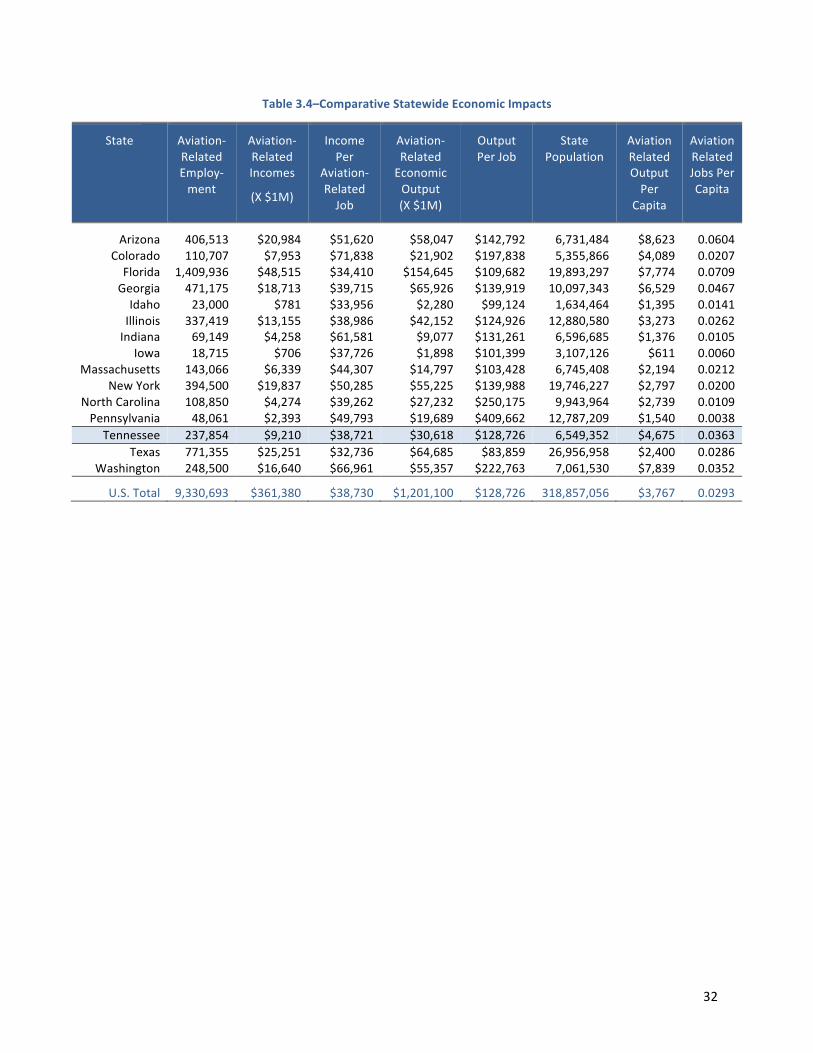
Table 3.4 compares aviation-related impacts in Tennessee to those observed in other states. These comparative values reveal only a modest amount of information. By nearly every measure Tennessee is mid-pack in terms of aviation-related economic outcomes. While the Memphis-related freight results and Nashville’s relative strong passenger enplanements stand Tennessee well in this comparison. Competing states also have identifiable strengths and weaknesses that even outcomes. For example, Washington (state) and Arizona both have strong airframe manufacturing sectors and Florida’s colossal economy is tied to both commercial and general aviation in a myriad of ways.
!
! !
! 32!
Table!3.4–Comparative!Statewide!Economic!Impacts!
State! AviationJRelated!EmployJment!
AviationJRelated!Incomes!
(X!$1M)!
Income!Per!
AviationJRelated!Job!
AviationJRelated!Economic!Output!!(X!$1M)!
Output!Per!Job!
State!Population!
Aviation!Related!Output!Per!
Capita!
Aviation!Related!Jobs!Per!Capita!
Arizona! 406,513! $20,984! $51,620! $58,047! $142,792! 6,731,484! $8,623! 0.0604!Colorado! 110,707! $7,953! $71,838! $21,902! $197,838! 5,355,866! $4,089! 0.0207!Florida! 1,409,936! $48,515! $34,410! $154,645! $109,682! 19,893,297! $7,774! 0.0709!Georgia! 471,175! $18,713! $39,715! $65,926! $139,919! 10,097,343! $6,529! 0.0467!Idaho! 23,000! $781! $33,956! $2,280! $99,124! 1,634,464! $1,395! 0.0141!Illinois! 337,419! $13,155! $38,986! $42,152! $124,926! 12,880,580! $3,273! 0.0262!Indiana! 69,149! $4,258! $61,581! $9,077! $131,261! 6,596,685! $1,376! 0.0105!
Iowa! 18,715! $706! $37,726! $1,898! $101,399! 3,107,126! $611! 0.0060!Massachusetts! 143,066! $6,339! $44,307! $14,797! $103,428! 6,745,408! $2,194! 0.0212!
New!York! 394,500! $19,837! $50,285! $55,225! $139,988! 19,746,227! $2,797! 0.0200!North!Carolina! 108,850! $4,274! $39,262! $27,232! $250,175! 9,943,964! $2,739! 0.0109!Pennsylvania! 48,061! $2,393! $49,793! $19,689! $409,662! 12,787,209! $1,540! 0.0038!Tennessee! 237,854! $9,210! $38,721! $30,618! $128,726! 6,549,352! $4,675! 0.0363!
Texas! 771,355! $25,251! $32,736! $64,685! $83,859! 26,956,958! $2,400! 0.0286!Washington! 248,500! $16,640! $66,961! $55,357! $222,763! 7,061,530! $7,839! 0.0352!
U.S.!Total! 9,330,693! $361,380! $38,730! $1,201,100! $128,726! 318,857,056! $3,767! 0.0293!
! 33!
FOUR AVIATION!FINANCE–WHERE!STATE!POLICY!FITS!IN!The infrastructure that supports aviation takes three forms: (1) the federal facilities that support air traffic control (ATC), (2) airports, both large and small, and (3) the land-side surface transportation networks that provide access to and from airports–primarily roadway systems. Individual states have neither jurisdiction nor financial responsibility for ATC. On the other hand, the surface transportation networks that support aviation-related activities are only one component in a much larger set of infrastructures integrated within community and state-level planning. As a consequence, here, we focus exclusively on state-level capital support used in the construction, expansion, and modernization of airports.
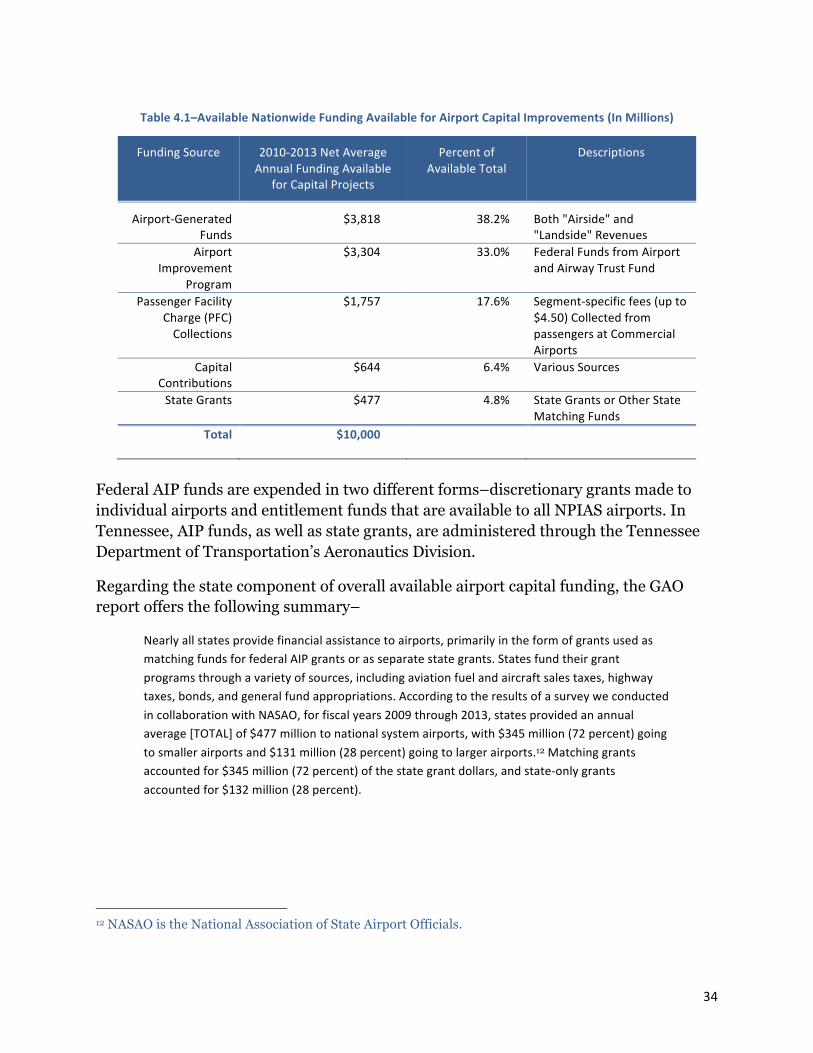
AIRPORT!FUNDING–THE!NATIONAL!PICTURE!A 2015 GAO report to Congress provides a splendid description of overall airport funding that is both detailed and clear.11 This report describes a system of roughly 3,500 public-use airports that are included in the federal government’s National Plan of Integrated Airport Systems (NPIAS). On an annual basis, airports within this system have a total of roughly $10 billion available for new airport construction or other aviation-related capital improvements. These funds are attributable to five sources. These sources and their relative importance are summarized here in Table 4.1.
At least at a national level, these funding sources are not divided uniformly across larger, primary airports and smaller, usually general aviation airports. General aviation airports do not generate Passenger Facility Charges (PFCs) and they are also less capable of self-generating revenues for capital investments. As a consequence, most GA airport capital spending is through Airport Improvement Program (AIP) funds, or state grants used either for direct capital expenditures or as required match for federal funds. Indeed, the GAO report concludes that roughly 71% of AIP funds (or $2.3 B annually) are used for improvements at GA airports.
!!!!!!!!!!!!!!!!!!!!!!!!!!!!!!!!!!!!!!!!!!!!!!!!!!!!!!!!!!!!!11 See United States Government Accountability Office, “Airport Finance: Information on Funding Sources and Planned Capital Development,” GAO-15306, April 2015.
! 34!
!Table!4.1–Available!Nationwide!Funding!Available!for!Airport!Capital!Improvements!(In!Millions)!
Funding!Source! 2010J2013!Net!Average!Annual!Funding!Available!
for!Capital!Projects!
Percent!of!Available!Total!
Descriptions!
AirportJGenerated!Funds!
$3,818! 38.2%! Both!"Airside"!and!"Landside"!Revenues!
Airport!Improvement!
Program!
$3,304! 33.0%! Federal!Funds!from!Airport!and!Airway!Trust!Fund!
Passenger!Facility!Charge!(PFC)!Collections!
$1,757! 17.6%! SegmentJspecific!fees!(up!to!$4.50)!Collected!from!passengers!at!Commercial!Airports!
Capital!Contributions!
$644! 6.4%! Various!Sources!
State!Grants! $477! 4.8%! State!Grants!or!Other!State!Matching!Funds!
Total! $10,000!!
! !
Federal AIP funds are expended in two different forms–discretionary grants made to individual airports and entitlement funds that are available to all NPIAS airports. In Tennessee, AIP funds, as well as state grants, are administered through the Tennessee Department of Transportation’s Aeronautics Division.
Regarding the state component of overall available airport capital funding, the GAO report offers the following summary–
Nearly!all!states!provide!financial!assistance!to!airports,!primarily!in!the!form!of!grants!used!as!matching!funds!for!federal!AIP!grants!or!as!separate!state!grants.!States!fund!their!grant!programs!through!a!variety!of!sources,!including!aviation!fuel!and!aircraft!sales!taxes,!highway!taxes,!bonds,!and!general!fund!appropriations.!According!to!the!results!of!a!survey!we!conducted!in!collaboration!with!NASAO,!for!fiscal!years!2009!through!2013,!states!provided!an!annual!average![TOTAL]!of!$477!million!to!national!system!airports,!with!$345!million!(72!percent)!going!to!smaller!airports!and!$131!million!(28!percent)!going!to!larger!airports.12!Matching!grants!accounted!for!$345!million!(72!percent)!of!the!state!grant!dollars,!and!stateJonly!grants!accounted!for!$132!million!(28!percent).
!!!!!!!!!!!!!!!!!!!!!!!!!!!!!!!!!!!!!!!!!!!!!!!!!!!!!!!!!!!!!12 NASAO is the National Association of State Airport Officials.
! 35!
AIRPORT!FUNDING!IN!TENNESSEE!The 2015 GAO report to Congress referenced above does not provide state-specific values for state grants made in support of airports. However, an allocation based on population suggests that, nationally, state spending per capita in support of airport capital programs averages roughly $1.50 or roughly one-fifth of the $7.27 spent by Tennessee in the current fiscal year. In this regard, the GAO report states, “According to FAA airports officials, states vary significantly from one another, with some states able to provide significant support to airports, while others are not due to a variety of factors.” Very probably one such “factor” is state’s ability to generate funds for use as aviation support. As such, Tennessee’s airports are generally well maintained and it’s AIP is able to sustain funding to critical maintenance and capital projects. Tennessee airports’ composite pavement quality index is rated 76, higher than most southern states 13. Moreover, the American Society of Civil Engineers (ASCE) grades Tennessee’s aviation infrastructure as “B-minus” compared to a national grade of “D”. While there is room for improvement, ASCE describes the state’s aviation infrastructure as “The overall condition of Tennessee airport facilities infrastructure overall is stable and relatively safe.”14
State-level aviation expenditures in Tennessee are largely afforded by the state’s Transportation Equity Fund (TEF). Aviation’s share of this fund is generated by a sales and use tax on the consumption, distribution, and storage of all aviation fuel sold in Tennessee.
While Tennessee is not unique in relying on a fuel-based tax to generate revenues for aviation, the magnitude of those revenues is made unique by the presence of FedEx which operates a “SuperHub” at Memphis International. Relying heavily on Memphis, FedEx Corporation ranks as the largest freight-carrying airline in the world and is the world’s fourth largest airline measured by fleet size, operating 647 aircraft in 2015. FedEx fueling activities at Memphis and its consequent TEF payments are sizable. Approximately 66 percent of the $48 million in revenue collected from the aviation fuel tax and distributed through the TEF’s during Fiscal Year 2014 (roughly $32 million) was attributable to FedEx fuel purchases at Memphis.
With this noted, future FedEx-related TEF revenues will not be as large as in the past. Last year, faced with the prospect that FedEx might relocate its aircraft fueling operations and, with it, some portion of its Memphis-based labor force, the Tennessee !!!!!!!!!!!!!!!!!!!!!!!!!!!!!!!!!!!!!!!!!!!!!!!!!!!!!!!!!!!!!13 TDOT Airport Pavement Management System Summary Report. TDOT report prepared by Atkins North America Inc. June 2015 14 ASCE Tennessee Infrastructure Report Card. Tennessee Section of ASCE. March 2009.

! 36!
legislature voted to cap the amount of aviation fuel taxes to be remitted by any one contributor.15 Importantly, however, even with the enacted cap in place, Tennessee’s TEF still provides the ability to provide airport capital funding at levels that exceed the nation’s average.
!!
!!!!!!!!!!!!!!!!!!!!!!!!!!!!!!!!!!!!!!!!!!!!!!!!!!!!!!!!!!!!!15 . The proposed bill will gradually lower the maximum amount that can be paid, starting at $21,375,000 for Fiscal Year 2016 and ultimately concluding with a cap of $10,500,000 on or after July 1, 2018.!!!
! 37!
FIVE A!FORWARDJLOOKING!POLICY!FOR!TENNESSEE!It is important segregate discussions of large-scale, aviation-related economic development and associated benefits from the benefits of general aviation access that is a part of everyday community and commercial life. For example, had Boeing decided to locate its 787 Dreamliner production facilities in Tennessee rather than South Carolina, the state’s economic development professionals would have likely found a way to help provide the necessary infrastructure. Seeking ways to leverage aviation access in pursuit of specific economic opportunities is not a state DOT mission nor is it the focus of the current study effort. Instead, we have concerned our work with understanding and measuring the economic value of more general access to routine aviation services.
Next, much like highways, access to safe, affordable, and predictable aviation is an essential element for almost any community, but also like highways, aviation access, by itself, guarantees no real advantage. Aviation access matters most if other elements necessary to a thriving community are also present–elements like an able and educated workforce, reliable ground-side roadways, and other desirable community attributes. Generally, few people in Tennessee are more than 90 minutes from an airport with scheduled commercial service or more than 30 minutes from a general aviation airport with a 5,000-foot runway and other capabilities that assure reliable service. Good airports are important and Tennessee has outstanding facilities that are largely the result of a relatively aggressive program of state support. In the face of diminished state aviation funding, it’s important to maintain the existing advantage that Tennessee’s aviation system has relative to other states and leverage that advantage to promote further economic development through close collaboration between Tennessee Department of Transportation and Tennessee Department of Economic and Community Development.
APPENDIX A Spatial'Distribution'of'Tennessee’s'Airports''!
!!!!!!!!!!!!!!!!!!!!!!
!!
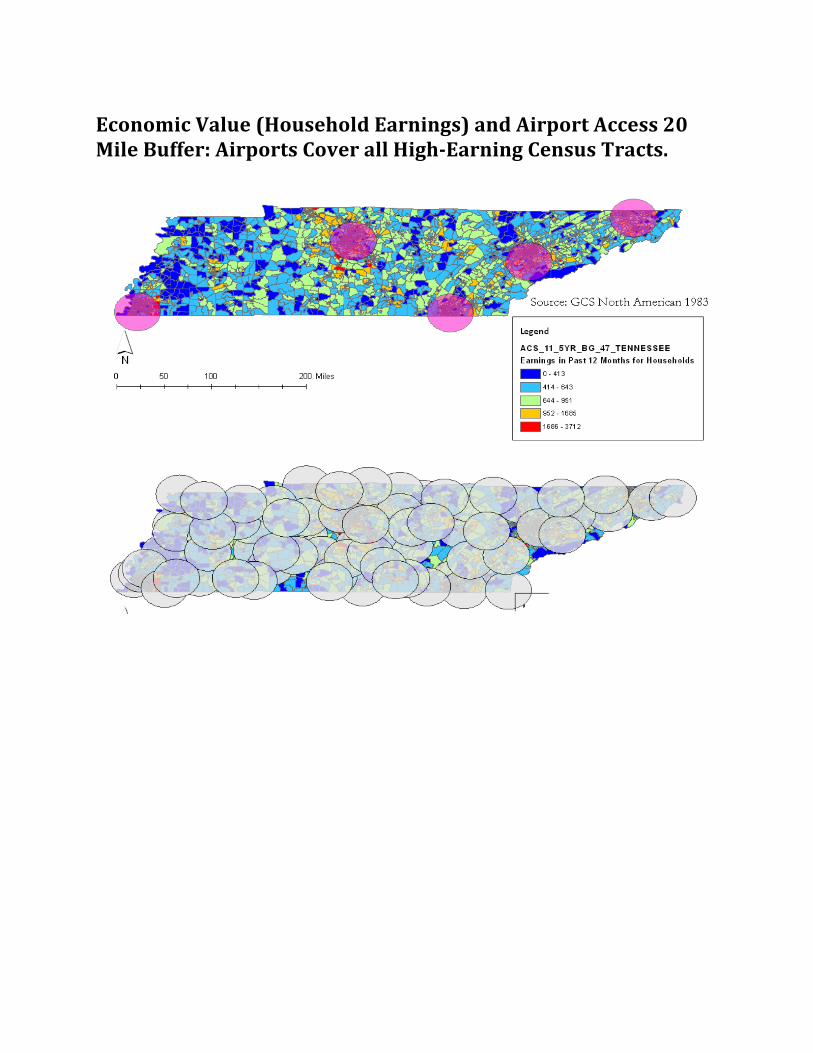
Economic'Value'(Household'Earnings)'and'Airport'Access'20'Mile'Buffer:'Airports'Cover'all'High@Earning'Census'Tracts.''
!!
!!
APPENDIX B Survey'Instruments'for'Primary'Commercial'and'General'Aviation'Airports''!
GA/Reliever Airport Survey
Thank you for your time and participation in this survey. Your full completion of thesurvey is greatly appreciated. We kindly ask that the survey be completed no more than 14days after receipt.
It is estimated that this survey will require 60 minutes for completion.
While the accuracy of survey responses are important, if information is not available forcertain questions, estimate to the best of your knowledge.
If the answer to a survey question is zero, input a "0" into the response box. Leaving a boxblank will prompt an error message.
If you are unable to complete the survey and need to return at a later time, exiting out ofthe survey will automatically save your responses. You can return to your saved surveyform by following the link used to initially access the survey.
If you manage more than one airport, please complete a separate survey for each airportunder your management.
To begin, please provide us with your information. A proper understanding of youraffiliation with aerospace activity in Tennessee is essential to ensuring a thriving andfunctional aviation system for years to come. Your information and responses areconfidential and your privacy is our foremost concern.
Name
Qualtrics Survey Software https://utk.co1.qualtrics.com/ControlPanel/Ajax.php?action=Ge...
1 of 9 1/27/15, 1:00 PM
Mailing Address
Email Address
Phone Number
Which Tennessee airport are you affiliated with?
What is your affiliation with the airport listed above?
Please answer the following questions to the best of your ability. If you are not sure of acertain answer, either make a rough estimation or leave the question blank. As mentionedabove, your responses are confidential and will only be used for research purposes.
Qualtrics Survey Software https://utk.co1.qualtrics.com/ControlPanel/Ajax.php?action=Ge...
2 of 9 1/27/15, 1:00 PM
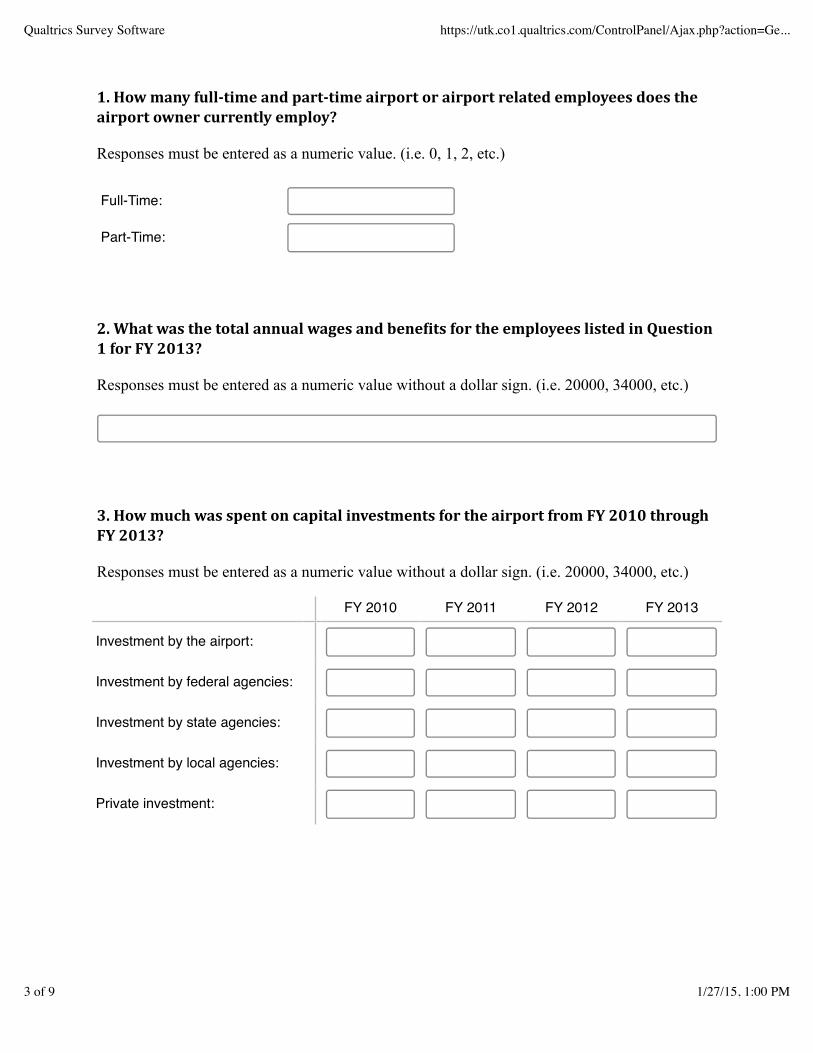
1.#How#many#full.time#and#part.time#airport#or#airport#related#employees#does#the#airport'owner'currently'employ? Responses must be entered as a numeric value. (i.e. 0, 1, 2, etc.)
Full-Time:
Part-Time:
2.#What#was#the#total#annual#wages#and#bene2its#for#the#employees#listed#in#Question#1"for"FY"2013? Responses must be entered as a numeric value without a dollar sign. (i.e. 20000, 34000, etc.)
3.#How#much#was#spent#on#capital#investments#for#the#airport#from#FY#2010#through#FY#2013?# Responses must be entered as a numeric value without a dollar sign. (i.e. 20000, 34000, etc.)
FY 2010 FY 2011 FY 2012 FY 2013
Investment by the airport:
Investment by federal agencies:
Investment by state agencies:
Investment by local agencies:
Private investment:
Qualtrics Survey Software https://utk.co1.qualtrics.com/ControlPanel/Ajax.php?action=Ge...
3 of 9 1/27/15, 1:00 PM
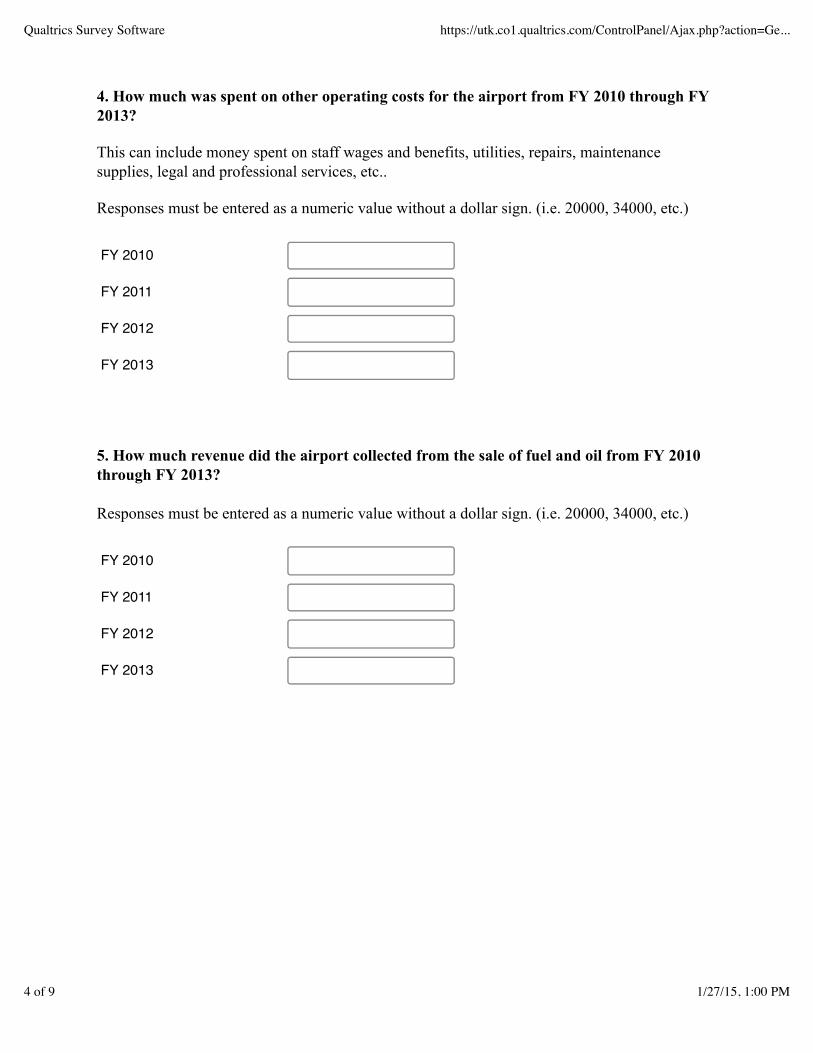
4. How much was spent on other operating costs for the airport from FY 2010 through FY 2013? This can include money spent on staff wages and benefits, utilities, repairs, maintenance supplies, legal and professional services, etc.. Responses must be entered as a numeric value without a dollar sign. (i.e. 20000, 34000, etc.)
FY 2010
FY 2011
FY 2012
FY 2013
5. How much revenue did the airport collected from the sale of fuel and oil from FY 2010through FY 2013?
Responses must be entered as a numeric value without a dollar sign. (i.e. 20000, 34000, etc.)
FY 2010
FY 2011
FY 2012
FY 2013
Qualtrics Survey Software https://utk.co1.qualtrics.com/ControlPanel/Ajax.php?action=Ge...
4 of 9 1/27/15, 1:00 PM
8. How many business or commercial tenants currently operate at the airport? Responses must be entered as a numeric value. (i.e. 0, 1, 2, 3, etc.)
FY 2010
FY 2011
FY 2012
FY 2013
8.1 How much did business and commercial tenants pay the airport in facility rents andfees for FY 2013?
Responses must be entered as a numeric value without a dollar sign. (i.e. 20000, 34000, etc.)
8.2 Please provide a list of business and commercial tenants currently operating at theairport and a point of contact for each tenant. If convenient, this list can be emailed to [email protected].
9. Are there any military tenants currently operating at the airport?
9.1 Please provide a list of military tenants operating at the airport and a point of contactfor each military tenant.
Qualtrics Survey Software https://utk.co1.qualtrics.com/ControlPanel/Ajax.php?action=Ge...
5 of 9 1/27/15, 1:00 PM
If convenient, this list can be emailed to [email protected].
10.$Estimate$the$number$of$aircraft$operations$for$calendar$year$2013.
Responses must be entered as a numeric value. (i.e. 0, 1, 2, 3, etc.)
Local:
Non-local (Itinerant):
Military:
11.#Estimate#the#tonnage#of#cargo#landed#in#calendar#year#2013.
Responses must be entered as a numeric value. (i.e. 0, 1, 2, 3, etc.)
12. How many aircraft are currently based on the airport's field?
Responses must be entered as a numeric value. (i.e. 0, 1, 2, 3, etc.)
Private Public (Military, Government, etc.)
Jet Aircraft
Single-Engine Propeller
Multi-Engine Propeller
Rotorcraft
Qualtrics Survey Software https://utk.co1.qualtrics.com/ControlPanel/Ajax.php?action=Ge...
6 of 9 1/27/15, 1:00 PM
12.1 How much revenue did the airport collect from hangar rents and other fees associatedwith the aircraft based on the airport's field in FY 2013?
Responses must be entered as a numeric value without a dollar sign. (i.e. 20000, 34000, etc.)
13.$Estimate$the$developable$acreage$at$the$airport. (i.e.%How%many%acres%does%the%airport%own%that%are%not%currently%developed%but%could%be%developed'in'the'future?)'
Land usable for non-aviation activities includes developable acreage for businesses relocating toairport property, business parks, etc..
Land usable for aviation related activities include developable acreage for runway expansions,hangar expansions, etc..
Responses must be entered as a numeric value. (i.e. 0, 1, 2, 3, etc.)
Land usable for aviationactivities:
Land usable for non-aviationactivities:
14.$Can$the$airport$facilitate$larger$passenger$and$cargo$aircraft$than$it$currently$does?
14.1 What is the largest passenger and cargo aircraft that the airport could possiblyfacilitate in terms of maximum taxi and takeoff weight?
Qualtrics Survey Software https://utk.co1.qualtrics.com/ControlPanel/Ajax.php?action=Ge...
7 of 9 1/27/15, 1:00 PM
15. Was the airport required to pay property taxes in 2013?
15.1 How much did the airport pay in property tax in 2013? Responses must be entered as a numeric value without a dollar sign. (i.e. 20000, 24000, etc.)
16. Please provide any necessary clarification to your responses below.
Also, please provide us with any other information that may prove pertinent to helping usfully understand the economic impact of your airport on the local or state economy. Thiscan include any unique or interesting aviation activity taking place in and around yourairport.
Qualtrics Survey Software https://utk.co1.qualtrics.com/ControlPanel/Ajax.php?action=Ge...
8 of 9 1/27/15, 1:00 PM

Survey Powered By Qualtrics
Qualtrics Survey Software https://utk.co1.qualtrics.com/ControlPanel/Ajax.php?action=Ge...
9 of 9 1/27/15, 1:00 PM
Primary Airport Survey
Thank you for your time and participation in this survey. Your full completion of thesurvey is greatly appreciated. We kindly ask that the survey be completed no more than 14days after receipt.
It is estimated that this survey will require 60 minutes for completion. While the accuracy of survey responses are important, if information is not available forcertain questions, estimate to the best of your knowledge.
If the answer to a survey question is zero, input a "0" into the response box. Leaving a boxblank will prompt an error message.
If you are unable to complete the survey and need to return at a later time, exiting out ofthe survey will automatically save your responses. You can return to your saved surveyform by following the link used to initially access the survey.
If you manage more than one airport, please complete a separate survey for each airportunder your management.
To begin, please provide us with your information. A proper understanding of youraffiliation with aerospace activity in Tennessee is essential to ensuring a thriving andfunctional aviation system for years to come. Your information and responses areconfidential and your privacy is our foremost concern.
Name
Qualtrics Survey Software https://utk.co1.qualtrics.com/ControlPanel/Ajax.php?action=Ge...
1 of 9 1/27/15, 1:03 PM

Mailing Address
Email Address
Phone Number
Which Tennessee airport are you affiliated with?
What is your affiliation with the airport listed above?
Please answer the following questions to the best of your ability. If you are not sure of acertain answer, either make a rough estimation or leave the question blank. As mentionedabove, your responses are confidential and will only be used for research purposes.
Qualtrics Survey Software https://utk.co1.qualtrics.com/ControlPanel/Ajax.php?action=Ge...
2 of 9 1/27/15, 1:03 PM
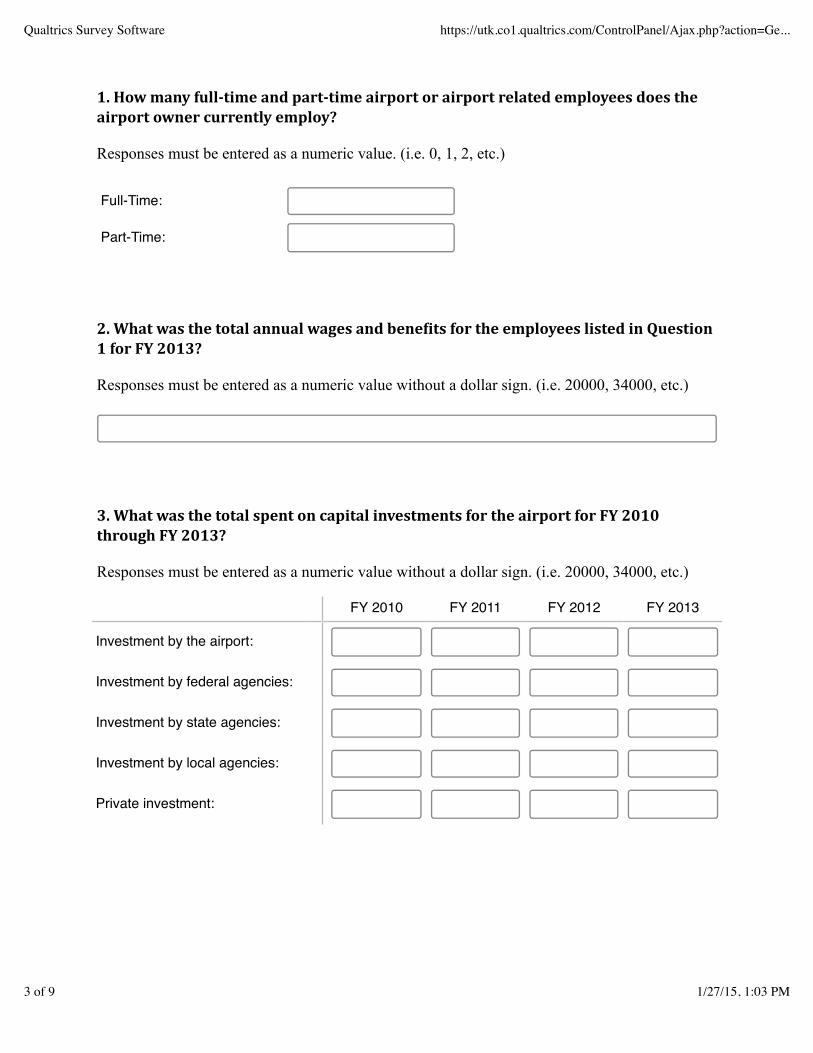
1.#How#many#full.time#and#part.time#airport#or#airport#related#employees#does#the#airport'owner'currently'employ?
Responses must be entered as a numeric value. (i.e. 0, 1, 2, etc.)
Full-Time:
Part-Time:
2.#What#was#the#total#annual#wages#and#bene2its#for#the#employees#listed#in#Question#1"for"FY"2013? Responses must be entered as a numeric value without a dollar sign. (i.e. 20000, 34000, etc.)
3.#What#was#the#total#spent#on#capital#investments#for#the#airport#for#FY#2010#through'FY'2013?'
Responses must be entered as a numeric value without a dollar sign. (i.e. 20000, 34000, etc.)
FY 2010 FY 2011 FY 2012 FY 2013
Investment by the airport:
Investment by federal agencies:
Investment by state agencies:
Investment by local agencies:
Private investment:
Qualtrics Survey Software https://utk.co1.qualtrics.com/ControlPanel/Ajax.php?action=Ge...
3 of 9 1/27/15, 1:03 PM
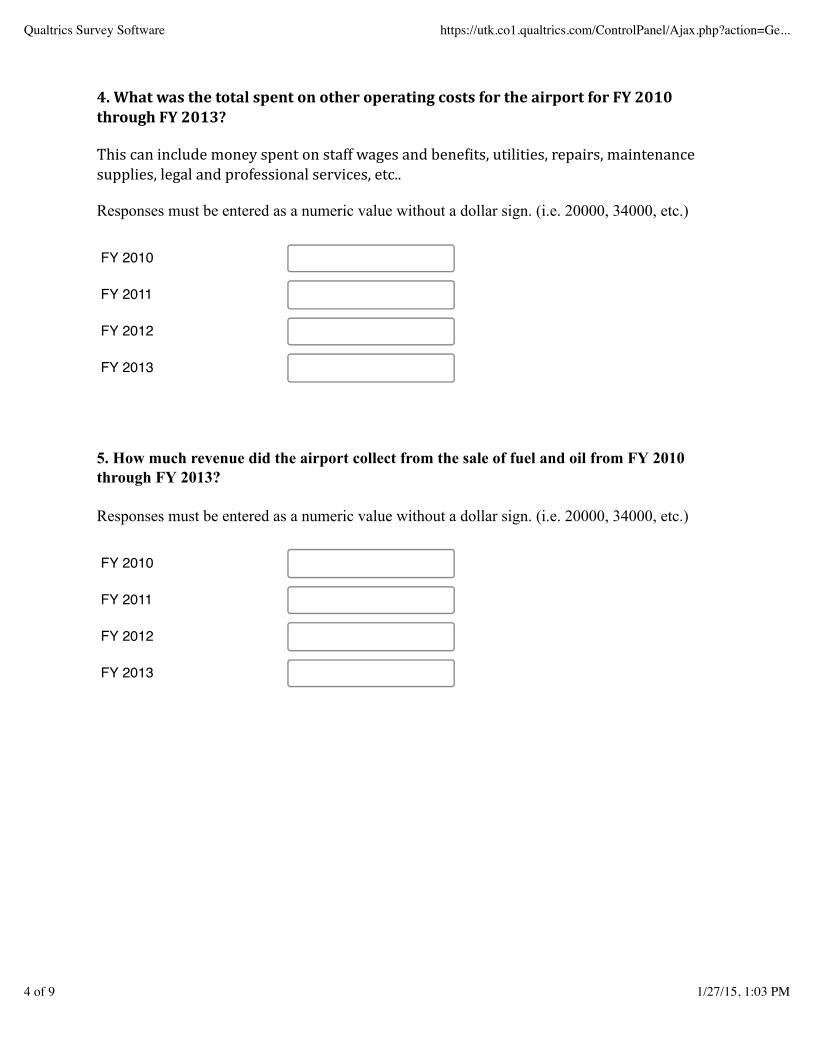
4.#What#was#the#total#spent#on#other#operating#costs#for#the#airport#for#FY#2010#through'FY'2013?' This%can%include%money%spent%on%staff%wages%and%bene6its,%utilities,%repairs,%maintenance%supplies,(legal(and(professional(services,(etc..
Responses must be entered as a numeric value without a dollar sign. (i.e. 20000, 34000, etc.)
FY 2010
FY 2011
FY 2012
FY 2013
5. How much revenue did the airport collect from the sale of fuel and oil from FY 2010through FY 2013?
Responses must be entered as a numeric value without a dollar sign. (i.e. 20000, 34000, etc.)
FY 2010
FY 2011
FY 2012
FY 2013
Qualtrics Survey Software https://utk.co1.qualtrics.com/ControlPanel/Ajax.php?action=Ge...
4 of 9 1/27/15, 1:03 PM
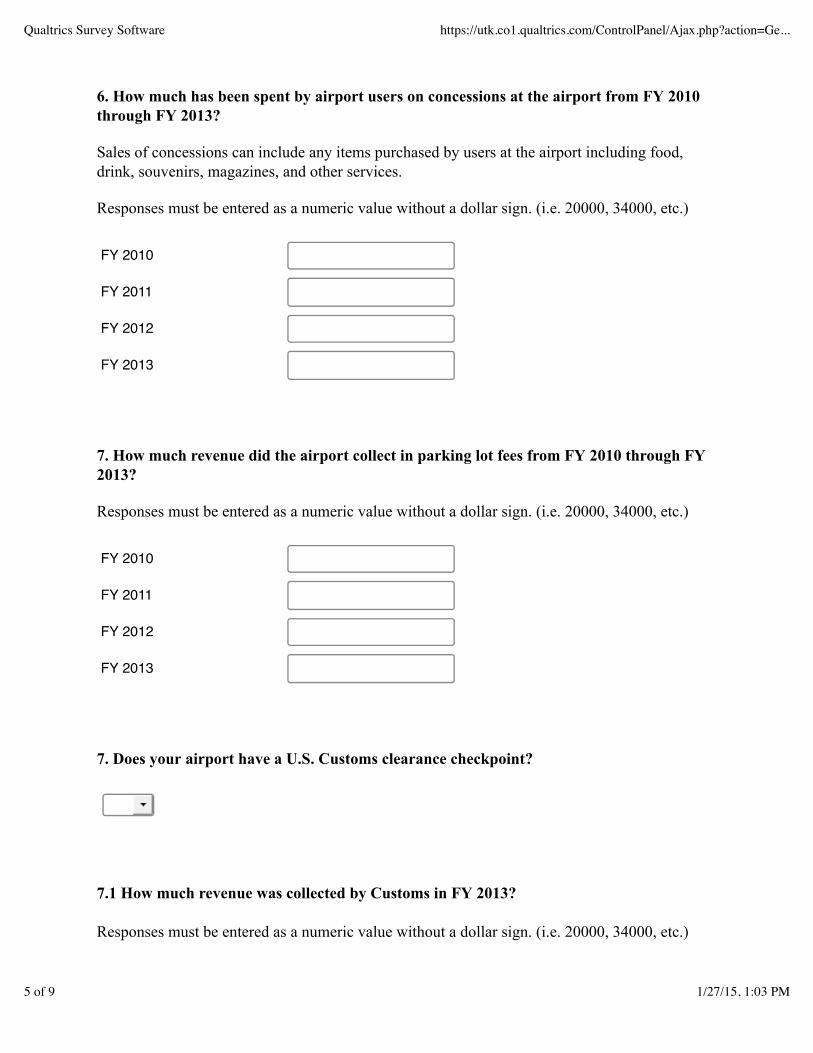
6. How much has been spent by airport users on concessions at the airport from FY 2010through FY 2013?
Sales of concessions can include any items purchased by users at the airport including food,drink, souvenirs, magazines, and other services. Responses must be entered as a numeric value without a dollar sign. (i.e. 20000, 34000, etc.)
FY 2010
FY 2011
FY 2012
FY 2013
7. How much revenue did the airport collect in parking lot fees from FY 2010 through FY2013? Responses must be entered as a numeric value without a dollar sign. (i.e. 20000, 34000, etc.)
FY 2010
FY 2011
FY 2012
FY 2013
7. Does your airport have a U.S. Customs clearance checkpoint?
7.1 How much revenue was collected by Customs in FY 2013?
Responses must be entered as a numeric value without a dollar sign. (i.e. 20000, 34000, etc.)
Qualtrics Survey Software https://utk.co1.qualtrics.com/ControlPanel/Ajax.php?action=Ge...
5 of 9 1/27/15, 1:03 PM
8. How many business or commercial tenants currently operate at the airport? Responses must be entered as a numeric value. (i.e. 0, 1, 2, 3, etc.)
8.1 How much did business and commercial tenants pay the airport in facility rents andfees for FY 2013?
Responses must be entered as a numeric value without a dollar sign. (i.e. 20000, 34000, etc.)
8.2 Please provide a list of business or commercial tenants currently operating at theairport in addition to a point of contact for each tenant. If convenient, this list can be emailed to [email protected].
9. Are there any military tenants currently operating at the airport?
9.1 Please provide a list of military tenants currently operating at the airport in addition toa point of contact for each military tenant. If convenient, this list can be emailed to [email protected].
Qualtrics Survey Software https://utk.co1.qualtrics.com/ControlPanel/Ajax.php?action=Ge...
6 of 9 1/27/15, 1:03 PM
10.$Estimate$passenger$enplanements$and$arrivals$for$calendar$year$2013.
Responses must be entered as a numeric value. (i.e. 0, 1, 2, 3, etc.)
Enplanements:
Arrivals:
11.#Estimate#the#tonnage#of#cargo#landed#in#calendar#year#2013.
Responses must be entered as a numeric value. (i.e. 0, 1, 2, 3, etc.)
12. How many aircraft are currently based on the airport's field? Responses must be entered as a numeric value. (i.e. 0, 1, 2, 3, etc.)
Private Commercial
Jet Airplanes
Single-Engine Propeller
Multi-Engine Propeller
Rotorcraft
12.1 How much revenue did the airport collect from hangar rents and other fees associatedwith the aircraft based on the airport's field in FY 2013?
Qualtrics Survey Software https://utk.co1.qualtrics.com/ControlPanel/Ajax.php?action=Ge...
7 of 9 1/27/15, 1:03 PM
Responses must be entered as a numeric value without a dollar sign. (i.e. 20000, 34000, etc.)
13.$Estimate$the$developable$acreage$at$the$airport. (i.e.%How%many%acres%does%the%airport%own%that%are%not%currently%developed%but%could%be%developed'in'the'future?)'
Land usable for non-aviation activities includes developable acreage for businesses relocating toairport property, business parks, etc..
Land usable for aviation related activities include developable acreage for runway expansions,hangar expansions, etc..
Responses must be entered as a numeric value. (i.e. 0, 1, 2, 3, etc.)
Land usable for aviationactivities:
Land usable for non-aviationactivities:
14. Was the airport required to pay property taxes in 2013?
14.1 How much did the airport pay in property tax in 2013? Responses must be entered as a numeric value without a dollar sign. (i.e. 20000, 34000, etc.)
15. Please provide any necessary clarification to your responses below.
Qualtrics Survey Software https://utk.co1.qualtrics.com/ControlPanel/Ajax.php?action=Ge...
8 of 9 1/27/15, 1:03 PM

Survey Powered By Qualtrics
Also, please provide us with any other information that may prove pertinent to helping usfully understand the economic impact of your airport on the local or state economy. Thiscan include any unique or interesting aviation activity taking place in and around yourairport.
Qualtrics Survey Software https://utk.co1.qualtrics.com/ControlPanel/Ajax.php?action=Ge...
9 of 9 1/27/15, 1:03 PM