Embed Size (px)
Citation preview

July 2016
TD Love & Money
2
Internal
Overview
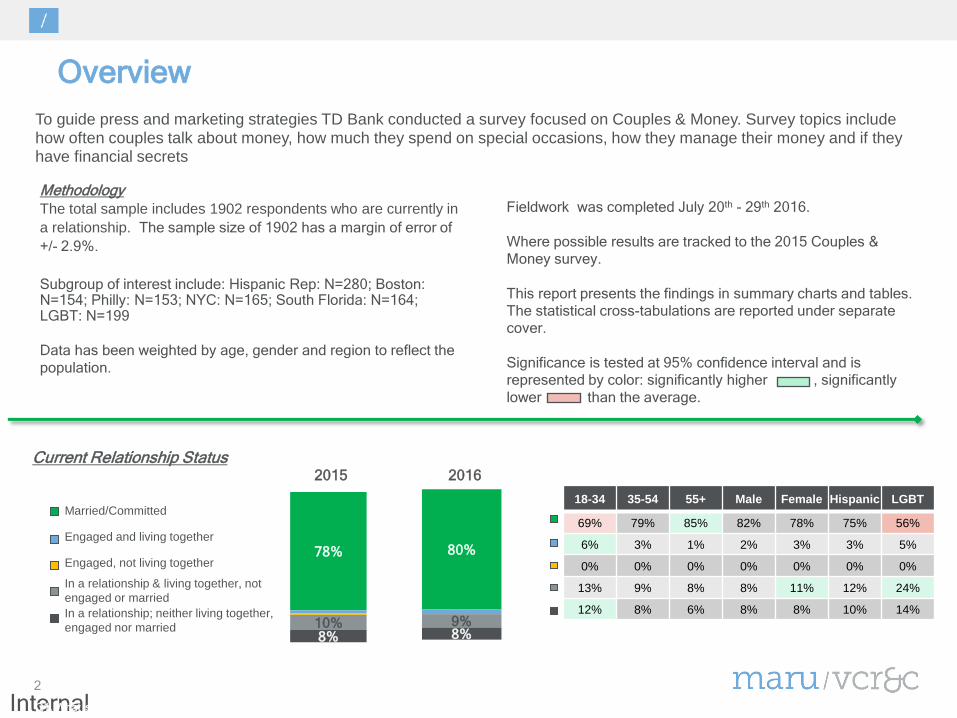
Fieldwork was completed July 20th - 29th 2016.
Where possible results are tracked to the 2015 Couples &
Money survey.
This report presents the findings in summary charts and tables.
The statistical cross-tabulations are reported under separate
cover.
Significance is tested at 95% confidence interval and is
represented by color: significantly higher , significantly
lower than the average.
To guide press and marketing strategies TD Bank conducted a survey focused on Couples & Money. Survey topics include how often couples talk about money, how much they spend on special occasions, how they manage their money and if they have financial secrets
Methodology
The total sample includes 1902 respondents who are currently in
a relationship. The sample size of 1902 has a margin of error of
+/- 2.9%.
Subgroup of interest include: Hispanic Rep: N=280; Boston: N=154; Philly: N=153; NYC: N=165; South Florida: N=164; LGBT: N=199
Data has been weighted by age, gender and region to reflect the
population.
80%
9% 8%
Q1. What is your current relationship status?
Current Relationship Status
18-34 35-54 55+ Male Female Hispanic LGBT
69% 79% 85% 82% 78% 75% 56%
6% 3% 1% 2% 3% 3% 5%
0% 0% 0% 0% 0% 0% 0%
13% 9% 8% 8% 11% 12% 24%
12% 8% 6% 8% 8% 10% 14%
Married/Committed
Engaged and living together
Engaged, not living together
In a relationship & living together, not
engaged or married
In a relationship; neither living together,
engaged nor married
78%
10% 8%
2015 2016
3
Internal
Happiness & Commitment
Q1. What is your current relationship status?
42%
33%
20%
5%
Q3. How would you describe your level of happiness with your significant other?
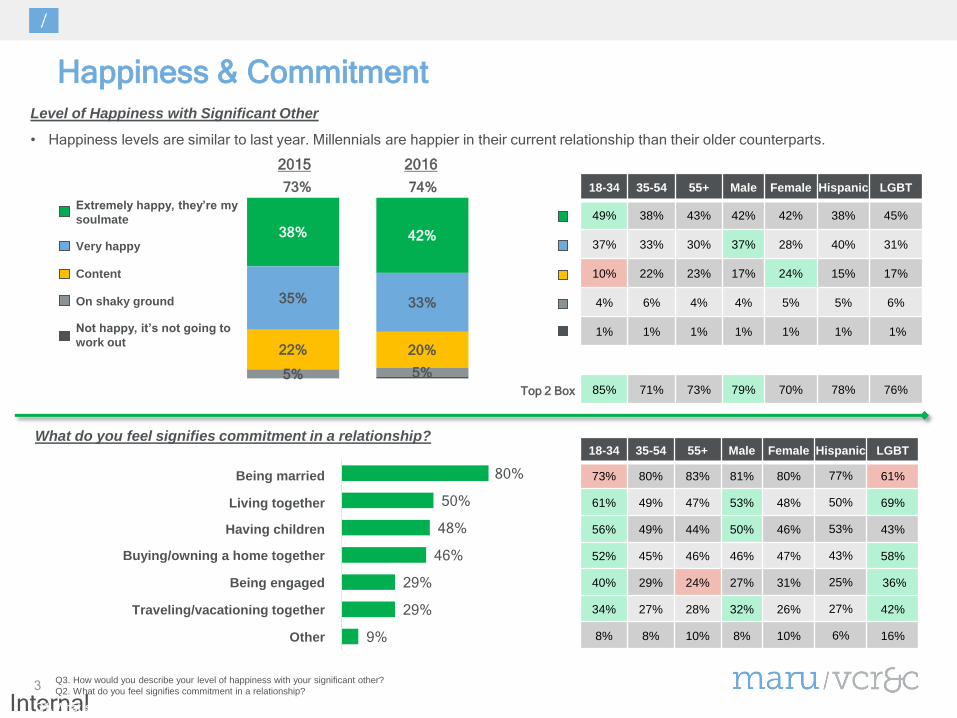
Q2. What do you feel signifies commitment in a relationship?
18-34 35-54 55+ Male Female Hispanic LGBT
49% 38% 43% 42% 42% 38% 45%
37% 33% 30% 37% 28% 40% 31%
10% 22% 23% 17% 24% 15% 17%
4% 6% 4% 4% 5% 5% 6%
1% 1% 1% 1% 1% 1% 1%
85% 71% 73% 79% 70% 78% 76%
Extremely happy, they’re my
soulmate
Very happy
Content
On shaky ground
Not happy, it’s not going to
work out
38%
35%
22%
5%
2015 2016
73% 74%
Top 2 Box
• Happiness levels are similar to last year. Millennials are happier in their current relationship than their older counterparts.
Being married
Living together
Having children
Buying/owning a home together
Being engaged
Traveling/vacationing together
Other
80%
50%
48%
46%
29%
29%
9%
Level of Happiness with Significant Other
What do you feel signifies commitment in a relationship? 18-34 35-54 55+ Male Female Hispanic LGBT
73% 80% 83% 81% 80% 77% 61%
61% 49% 47% 53% 48% 50% 69%
56% 49% 44% 50% 46% 53% 43%
52% 45% 46% 46% 47% 43% 58%
40% 29% 24% 27% 31% 25% 36%
34% 27% 28% 32% 26% 27% 42%
8% 8% 10% 8% 10% 6% 16%
4
Internal
Communication Habits
Q1. What is your current relationship status?
5% 9% 10% 6%
14% 5%
24%
27%
5% 10% 9% 7%
13% 4%
26%
24%
19%
43%
17%
10% 6% 4%
18-34 35-54 55+ Male Female Hispanic LGBT
10% 5% 2% 5% 5% 10% 9%
14% 11% 5% 12% 7% 18% 10%
13% 12% 5% 10% 9% 14% 7%
8% 7% 5% 7% 6% 7% 6%
15% 14% 12% 12% 15% 9% 13%
5% 6% 5% 6% 4% 5% 4%
18% 22% 29% 22% 26% 22% 24%
17% 23% 37% 26% 29% 14% 26%
24% 16% 7% 17% 11% 28% 19%
45% 35% 17% 34% 26% 49% 32%
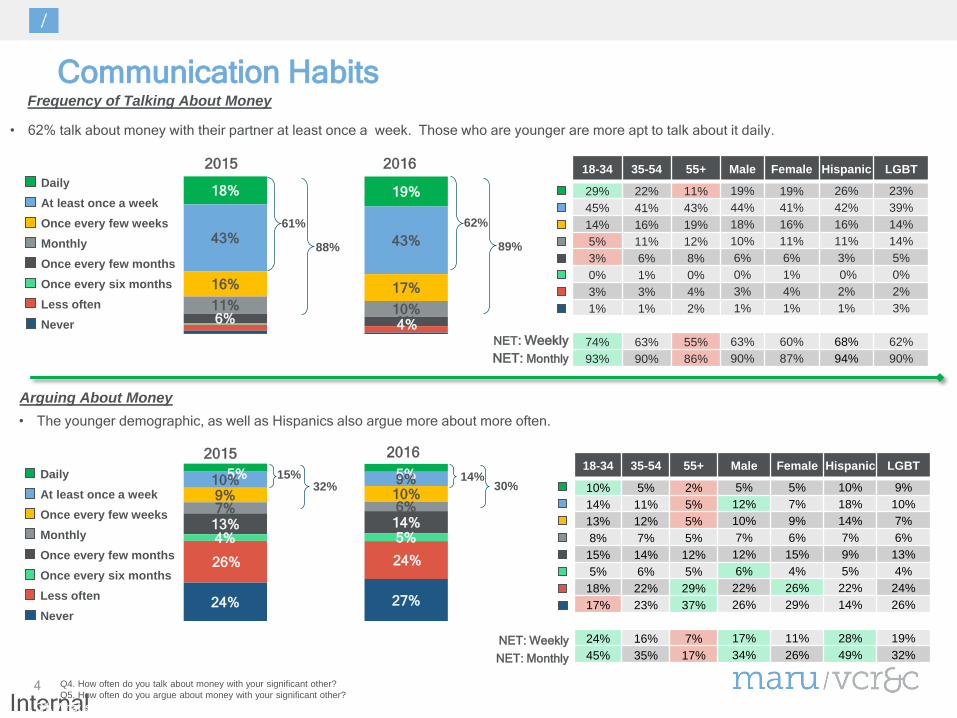
• 62% talk about money with their partner at least once a week. Those who are younger are more apt to talk about it daily.
Frequency of Talking About Money
Q4. How often do you talk about money with your significant other?
Q5. How often do you argue about money with your significant other?
18%
43%
16%
11% 6%
Daily
At least once a week
Once every few weeks
Monthly
Once every few months
Once every six months
Less often
Never
18-34 35-54 55+ Male Female Hispanic LGBT
29% 22% 11% 19% 19% 26% 23%
45% 41% 43% 44% 41% 42% 39%
14% 16% 19% 18% 16% 16% 14%
5% 11% 12% 10% 11% 11% 14%
3% 6% 8% 6% 6% 3% 5%
0% 1% 0% 0% 1% 0% 0%
3% 3% 4% 3% 4% 2% 2%
1% 1% 2% 1% 1% 1% 3%
74% 63% 55% 63% 60% 68% 62%
93% 90% 86% 90% 87% 94% 90%
NET: Weekly
NET: Monthly
61%
88%
Arguing About Money
• The younger demographic, as well as Hispanics also argue more about more often.
NET: Weekly
NET: Monthly
15% 32%
2015 2016
2015 2016
14% 30%
62%
89%
Daily
At least once a week
Once every few weeks
Monthly
Once every few months
Once every six months
Less often
Never
5
Internal
Happiness & Communication
Q1. What is your current relationship status?
42%
32%
20%
5%
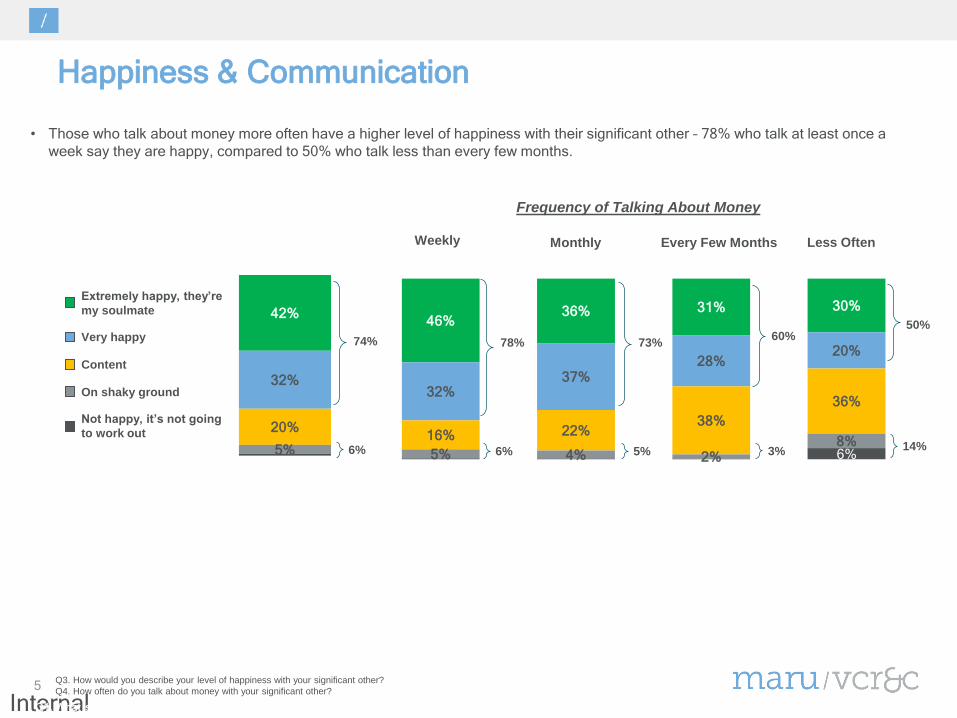
Q3. How would you describe your level of happiness with your significant other?
Q4. How often do you talk about money with your significant other?
Extremely happy, they’re
my soulmate
Very happy
Content
On shaky ground
Not happy, it’s not going
to work out
• Those who talk about money more often have a higher level of happiness with their significant other – 78% who talk at least once a
week say they are happy, compared to 50% who talk less than every few months.
46% 36% 31% 30%
32% 37%
28% 20%
16% 22% 38%
36%
5% 4% 2% 8% 6%
Frequency of Talking About Money
Weekly Monthly Every Few Months Less Often
74%
6%
78%
6%
73%
5%
60%
3%
50%
14%
6
Internal
Digital Dating
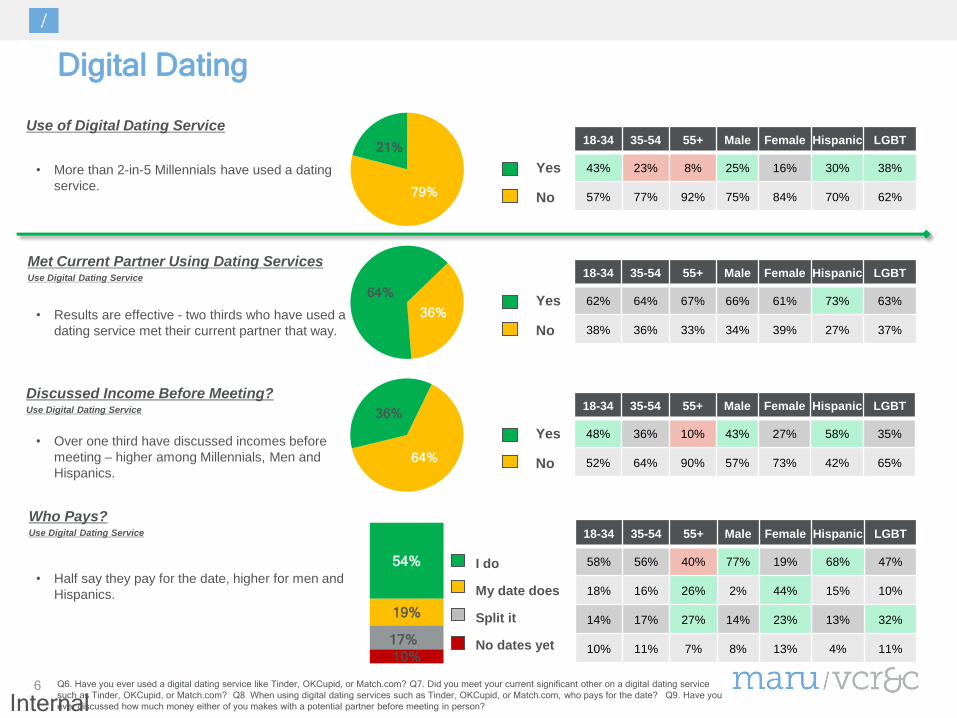
Use of Digital Dating Service
Q6. Have you ever used a digital dating service like Tinder, OKCupid, or Match.com? Q7. Did you meet your current significant other on a digital dating service
such as Tinder, OKCupid, or Match.com? Q8 When using digital dating services such as Tinder, OKCupid, or Match.com, who pays for the date? Q9. Have you
ever discussed how much money either of you makes with a potential partner before meeting in person?
79%
21%
Yes
No
18-34 35-54 55+ Male Female Hispanic LGBT
43% 23% 8% 25% 16% 30% 38%
57% 77% 92% 75% 84% 70% 62%
Met Current Partner Using Dating Services Use Digital Dating Service
36%
64% Yes
No
18-34 35-54 55+ Male Female Hispanic LGBT
62% 64% 67% 66% 61% 73% 63%
38% 36% 33% 34% 39% 27% 37%
64%
36%
Yes
No
18-34 35-54 55+ Male Female Hispanic LGBT
48% 36% 10% 43% 27% 58% 35%
52% 64% 90% 57% 73% 42% 65%
Discussed Income Before Meeting? Use Digital Dating Service
54%
19%
10%
17%
I do
My date does
Split it
No dates yet
Who Pays? Use Digital Dating Service
18-34 35-54 55+ Male Female Hispanic LGBT
58% 56% 40% 77% 19% 68% 47%
18% 16% 26% 2% 44% 15% 10%
14% 17% 27% 14% 23% 13% 32%
10% 11% 7% 8% 13% 4% 11%
• More than 2-in-5 Millennials have used a dating
service.
• Results are effective - two thirds who have used a
dating service met their current partner that way.
• Over one third have discussed incomes before
meeting – higher among Millennials, Men and
Hispanics.
• Half say they pay for the date, higher for men and
Hispanics.

7
Internal
Making & Following Budgets
62%
58%
51%
41%
41%
39%
18-34 35-54 55+ Male Female Hispanic LGBT
73% 65% 53% 63% 60% 73% 63%
68% 61% 52% 62% 55% 68% 65%
67% 55% 40% 53% 49% 68% 54%
62% 45% 28% 44% 38% 60% 47%
55% 46% 31% 43% 40% 53% 47%
53% 40% 31% 44% 34% 54% 46%
Groceries/alcohol
Savings/unexpected expenses
Eating out
Entertainment
Clothing/personal items
Travel
Budgeted Items
Q10. [YES Summary] For which of the following, if any, do you and your partner have a monthly budget?
Q11. And how often do you and your partner follow your monthly budget?
62%
58%
51%
41%
41%
39%
Groceries/alcohol
Savings/unexpected expenses
Eating out
Entertainment
Clothing/personal items
Travel 38%
36%
38%
28%
37%
33%
42%
42%
44%
47%
43%
49%
15%
18%
15%
19%
16%
14%
4%
3%
2%
4%
4%
3%
Always Most of the time Sometimes Rarely Never
Frequency of Following Budgets
• Millennials and Hispanic couples are budgeting all around.
• The monthly Eating Out budget is the first to go.
8
Internal
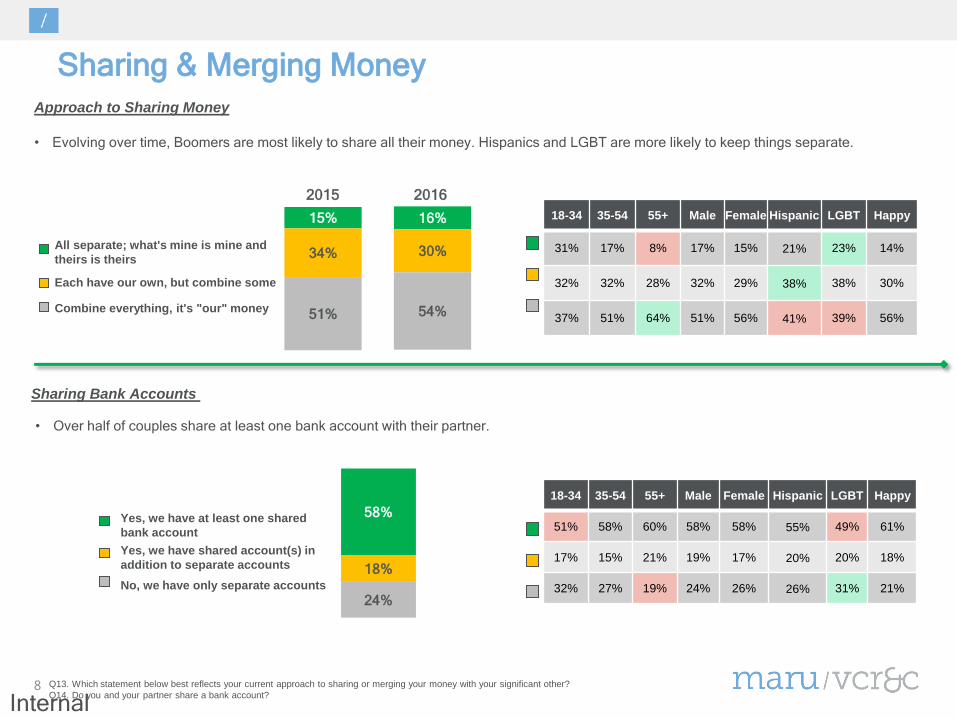
Sharing & Merging Money
Q13. Which statement below best reflects your current approach to sharing or merging your money with your significant other?
Q14. Do you and your partner share a bank account?
All separate; what's mine is mine and
theirs is theirs
Each have our own, but combine some
Combine everything, it's "our" money
• Evolving over time, Boomers are most likely to share all their money. Hispanics and LGBT are more likely to keep things separate.
15%
34%
51%
18-34 35-54 55+ Male Female Hispanic LGBT Happy
31% 17% 8% 17% 15% 21% 23% 14%
32% 32% 28% 32% 29% 38% 38% 30%
37% 51% 64% 51% 56% 41% 39% 56%
16%
30%
54%
2015 2016
Approach to Sharing Money
18-34 35-54 55+ Male Female Hispanic LGBT Happy
51% 58% 60% 58% 58% 55% 49% 61%
17% 15% 21% 19% 17% 20% 20% 18%
32% 27% 19% 24% 26% 26% 31% 21%
Yes, we have at least one shared
bank account
Yes, we have shared account(s) in
addition to separate accounts
No, we have only separate accounts
58%
18%
24%
Sharing Bank Accounts
• Over half of couples share at least one bank account with their partner.
9
Internal
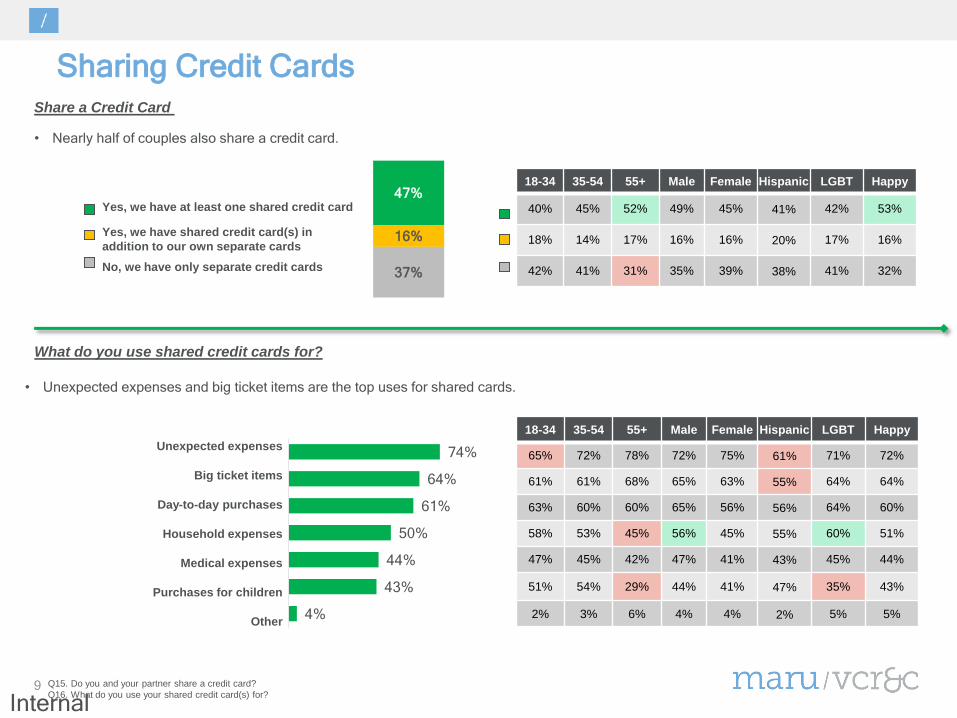
Sharing Credit Cards
18-34 35-54 55+ Male Female Hispanic LGBT Happy
65% 72% 78% 72% 75% 61% 71% 72%
61% 61% 68% 65% 63% 55% 64% 64%
63% 60% 60% 65% 56% 56% 64% 60%
58% 53% 45% 56% 45% 55% 60% 51%
47% 45% 42% 47% 41% 43% 45% 44%
51% 54% 29% 44% 41% 47% 35% 43%
2% 3% 6% 4% 4% 2% 5% 5%
• Unexpected expenses and big ticket items are the top uses for shared cards.
• Nearly half of couples also share a credit card.
What do you use shared credit cards for?
Q15. Do you and your partner share a credit card?
Q16. What do you use your shared credit card(s) for?
18-34 35-54 55+ Male Female Hispanic LGBT Happy
40% 45% 52% 49% 45% 41% 42% 53%
18% 14% 17% 16% 16% 20% 17% 16%
42% 41% 31% 35% 39% 38% 41% 32%
47%
16%
37%
Yes, we have at least one shared credit card
Yes, we have shared credit card(s) in
addition to our own separate cards
No, we have only separate credit cards
Unexpected expenses
Big ticket items
Day-to-day purchases
Household expenses
Medical expenses
Purchases for children
Other
74%
64%
61%
50%
44%
43%
4%
Share a Credit Card

10
Internal
Special Occasion Spending
• Holiday spend on children doubles
birthday spend. Spend on children is
higher then spend on partners.
• Holidays attract the most spend.
Birthdays are a big deal to
Millennials.
Amount Spent on Children
18-34 35-54 55+ Male Female Hispanic LGBT Happy
$145 $166 $129 $173 $123 $138 $160 $157
$95 $83 $62 $104 $50 $90 $79 $86
$114 $91 $71 $104 $71 $101 $95 $95
$63 $50 $28 $58 $29 $59 $42 $49
Amount Spent on Significant Other
$148
$77
$87
$43
Holidays
Anniversary
Birthday
Valentine's Day
Q17. Thinking about special occasions, how much do you typically spend on your significant other? Q18. Thinking about special occasions as a couple, how much
do you typically spend on your children? Q19. Thinking about special occasions, how much do you typically spend on friends/family other than your significant
other? Q20. As a couple, how much do you, or would you, typically spend on a wedding gift for the following people?
$244
$119
$29
Holidays
Birthday
Valentine's Day
18-34 35-54 55+ Male Female Hispanic LGBT Happy
$209 $271 $224 $255 $234 $226 $224 $241
$134 $125 $103 $124 $113 $134 $108 $118
$54 $34 $11 $40 $19 $43 $43 $32
$112
$51
$14
Holidays
Birthday
Valentine's Day
$110 $118 $107 $119 $106 $112 $120 $109
$69 $53 $41 $59 $43 $65 $47 $52
$32 $17 $4 $22 $6 $24 $17 $17
• Celebrating friends and family is
important.
Amount Spent on Friends & Family
$112
$67
$38
Family
Friends
Co-workers
$120 $107 $115 $122 $103 $103 $80 $104
$83 $69 $57 $74 $60 $65 $60 $56
$55 $43 $25 $43 $33 $40 $33 $37
• For weddings, Millennial couples are
outspending their older counterparts.
Amount Spent on Wedding Gifts

11
Internal
Paying for Gifts
Q21. How do you typically pay for gifts?
22%
4% 9%
25%
36%
4%
We specifically save up/budget
We use a financial windfall
We forgo other expenses
We use a credit card, worry later
We always have enough set aside
Other
• Over one third (36%) have enough saved away for gifts; while 31% specifically need to save up (22%) or forgo other expenses (9%).
• One quarter worry about it later and use a credit card.
18-34 35-54 55+ Male Female Hispanic LGBT Happy
26% 25% 17% 19% 26% 29% 20% 24%
8% 4% 1% 4% 3% 4% 4% 4%
11% 9% 8% 8% 10% 10% 11% 9%
23% 26% 25% 28% 23% 24% 30% 23%
31% 31% 43% 38% 33% 28% 33% 37%
2% 4% 6% 3% 6% 5% 2% 3%
12
Internal
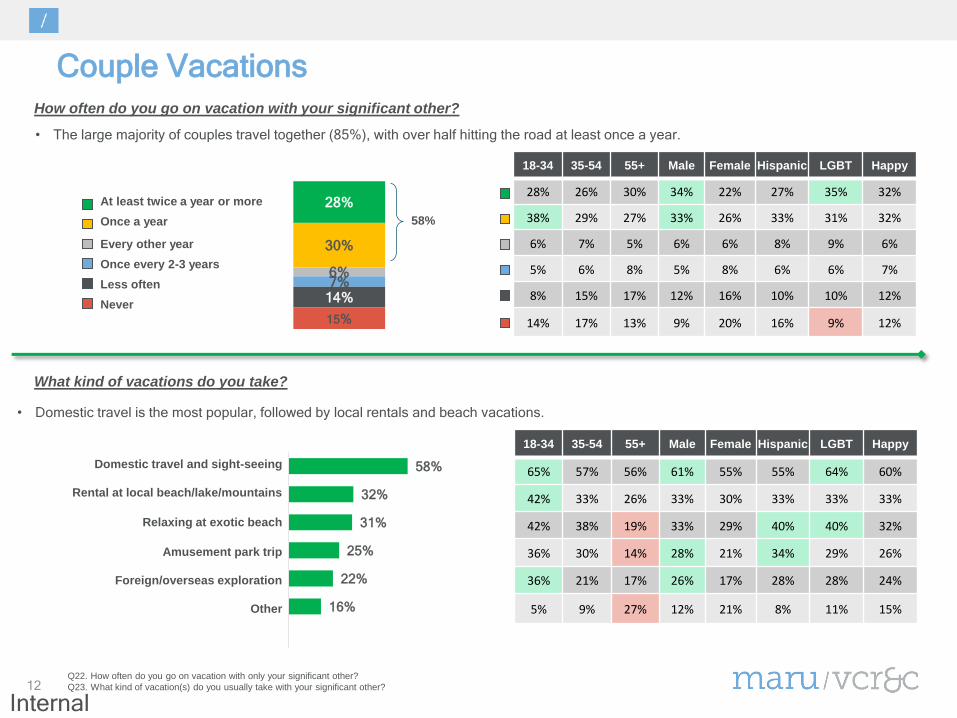
Couple Vacations
• The large majority of couples travel together (85%), with over half hitting the road at least once a year.
How often do you go on vacation with your significant other?
Q22. How often do you go on vacation with only your significant other?
Q23. What kind of vacation(s) do you usually take with your significant other?
28%
30%
6% 7%
14%
15%
At least twice a year or more
Once a year
Every other year
Once every 2-3 years
Less often
Never
18-34 35-54 55+ Male Female Hispanic LGBT Happy
28% 26% 30% 34% 22% 27% 35% 32%
38% 29% 27% 33% 26% 33% 31% 32%
6% 7% 5% 6% 6% 8% 9% 6%
5% 6% 8% 5% 8% 6% 6% 7%
8% 15% 17% 12% 16% 10% 10% 12%
14% 17% 13% 9% 20% 16% 9% 12%
58%
32%
31%
25%
22%
16%
• Domestic travel is the most popular, followed by local rentals and beach vacations.
What kind of vacations do you take?
Domestic travel and sight-seeing
Rental at local beach/lake/mountains
Relaxing at exotic beach
Amusement park trip
Foreign/overseas exploration
Other
18-34 35-54 55+ Male Female Hispanic LGBT Happy
65% 57% 56% 61% 55% 55% 64% 60%
42% 33% 26% 33% 30% 33% 33% 33%
42% 38% 19% 33% 29% 40% 40% 32%
36% 30% 14% 28% 21% 34% 29% 26%
36% 21% 17% 26% 17% 28% 28% 24%
5% 9% 27% 12% 21% 8% 11% 15%
58%
13
Internal
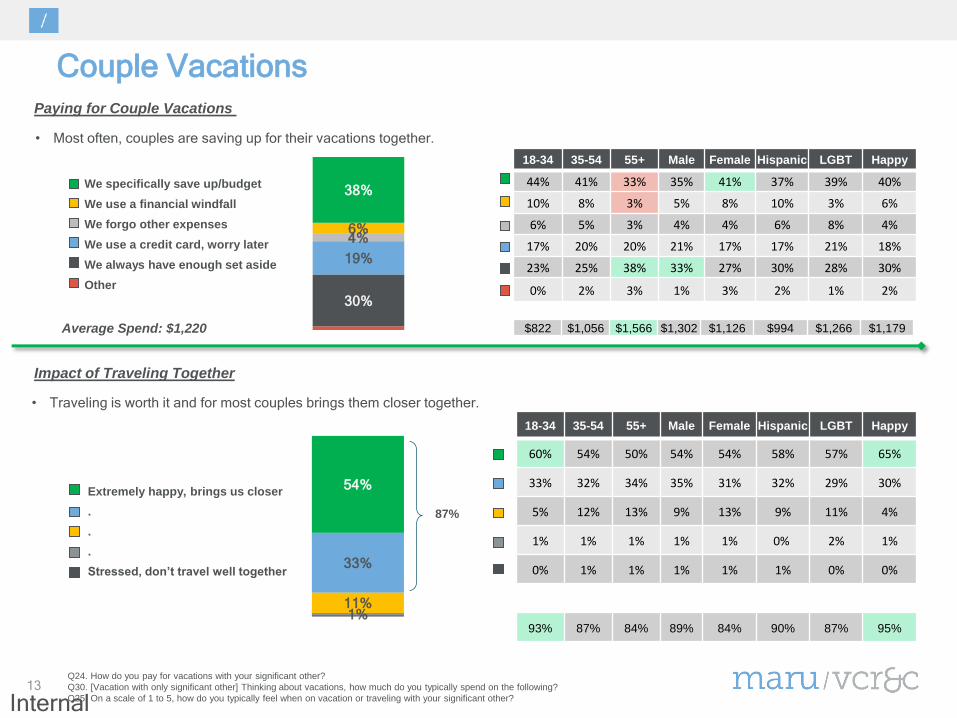
Couple Vacations
• Most often, couples are saving up for their vacations together.
Paying for Couple Vacations
Q24. How do you pay for vacations with your significant other?
Q30. [Vacation with only significant other] Thinking about vacations, how much do you typically spend on the following?
Q25. On a scale of 1 to 5, how do you typically feel when on vacation or traveling with your significant other?
Impact of Traveling Together
38%
6% 4%
19%
30%
We specifically save up/budget
We use a financial windfall
We forgo other expenses
We use a credit card, worry later
We always have enough set aside
Other
18-34 35-54 55+ Male Female Hispanic LGBT Happy
44% 41% 33% 35% 41% 37% 39% 40%
10% 8% 3% 5% 8% 10% 3% 6%
6% 5% 3% 4% 4% 6% 8% 4%
17% 20% 20% 21% 17% 17% 21% 18%
23% 25% 38% 33% 27% 30% 28% 30%
0% 2% 3% 1% 3% 2% 1% 2%
54%
33%
11% 1%
18-34 35-54 55+ Male Female Hispanic LGBT Happy
60% 54% 50% 54% 54% 58% 57% 65%
33% 32% 34% 35% 31% 32% 29% 30%
5% 12% 13% 9% 13% 9% 11% 4%
1% 1% 1% 1% 1% 0% 2% 1%
0% 1% 1% 1% 1% 1% 0% 0%
93% 87% 84% 89% 84% 90% 87% 95%
Extremely happy, brings us closer
.
.
.
Stressed, don’t travel well together
87%
$822 $1,056 $1,566 $1,302 $1,126 $994 $1,266 $1,179 Average Spend: $1,220
• Traveling is worth it and for most couples brings them closer together.

14
Internal
Family Vacations
53%
48%
38%
24%
14%
9%
• Domestic travel and amusement parks are most popular for families.
What kind of vacation do you take?
How often do you go on vacation with your entire family?
Q26. How often do you go on vacation with your entire family, including children?
Q27. What kind of vacation(s) do you usually take with your entire family, including children?
19%
35%
8% 7%
16%
15%
At least twice a year or more
Once a year
Every other year
Once every 2-3 years
Less often
Never
Domestic travel and sight-seeing
Amusement park trip
Rental at local beach/lake/mountains
Relaxing at exotic beach
Foreign/overseas exploration
Other
18-34 35-54 55+ Male Female Hispanic LGBT Happy
33% 24% 6% 21% 17% 24% 29% 20%
46% 40% 23% 41% 29% 39% 35% 37%
8% 8% 8% 7% 8% 11% 10% 8%
3% 7% 8% 5% 8% 4% 7% 6%
4% 13% 25% 12% 19% 11% 8% 14%
7% 9% 30% 13% 18% 11% 11% 15%
18-34 35-54 55+ Male Female Hispanic LGBT Happy
62% 57% 40% 58% 48% 58% 59% 55%
58% 51% 34% 47% 48% 57% 59% 50%
42% 38% 37% 38% 39% 30% 44% 39%
37% 25% 14% 29% 19% 40% 41% 26%
25% 13% 8% 16% 11% 20% 20% 15%
3% 8% 15% 6% 12% 2% 2% 8%
54%
• Over one half of families travel at least once a year.

15
Internal
Family Vacations Paying for Family Vacations
Q28. How do you pay for vacations with your entire family, including children?
Q30. [Vacation with entire family (including children)] Thinking about vacations, how much do you typically spend on the following?
Q29. On a scale of 1 to 5, how do you typically feel when on vacation or traveling with your family, including the children?
Impact of Traveling As A Family
40%
9% 5%
17%
27%
We specifically save up/budget
We use a financial windfall
We forgo other expenses
We use a credit card, worry later
We always have enough set aside
Other
18-34 35-54 55+ Male Female Hispanic LGBT Happy
42% 40% 39% 34% 46% 40% 34% 40%
17% 10% 3% 9% 9% 9% 13% 10%
9% 5% 2% 6% 4% 9% 7% 4%
13% 17% 20% 21% 13% 13% 15% 17%
18% 27% 32% 29% 24% 28% 30% 26%
1% 1% 4% 1% 3% 1% 0% 2%
47%
37%
12% 3%
18-34 35-54 55+ Male Female Hispanic LGBT Happy
54% 47% 42% 46% 48% 56% 50% 53%
32% 37% 40% 39% 34% 31% 30% 35%
10% 12% 14% 11% 13% 9% 12% 9%
3% 3% 3% 4% 3% 3% 5% 2%
0% 1% 1% 0% 2% 1% 2% 1%
87% 83% 82% 85% 82% 88% 80% 88%
Extremely happy, brings us closer
.
.
.
Stressed, its hard to relax
83%
$1,064 $1,790 $2,018 $1,705 $1,741 $1,559 $1,236 $1,660 Average Spend: $1,722
• Most often, families are saving up for their vacations. Younger families are more likely to use a financial windfall such as a bonus or tax
refund.
• While slightly less so than couples alone, travelling together brings families closer together.

16
Internal
Money Mistakes
• About one-half don’t feel they have made a big money mistake in a relationship. The biggest mistake is waiting too long to discuss money –
communication is key.
Biggest Money Mistake
Q31. Which of the below is the biggest money mistake you have made in a relationship?
Q35. Would you consider breaking up with your partner if you discovered a financial secret such as hidden debt or a bad credit score?
5%
24%
11% 5% 9%
46%
18-34 35-54 55+ Male Female Hispanic LGBT Happy
10% 5% 3% 6% 4% 8% 6% 5%
20% 27% 21% 23% 24% 22% 21% 20%
14% 12% 9% 11% 11% 16% 11% 11%
7% 6% 2% 5% 5% 9% 5% 8%
14% 10% 7% 9% 10% 11% 9% 10%
34% 39% 59% 46% 46% 35% 47% 45%
Talking about money too early
Waiting too long to discuss money
Keeping a financial secret
Sharing details about my partner’s
finances with a friend/family member
Not being supportive of my partner's
budget/financial situation
None
54%
66% 61% 41% 54% 54% 65% 53% 55%
Made Mistake:
Consider Breaking Up if Uncovered a Financial Secret
89%
11% Yes
No
18-34 35-54 55+ Male Female Hispanic LGBT Happy
21% 12% 6% 11% 11% 19% 16% 10%
79% 88% 94% 89% 89% 81% 84% 90%
Yes
No
• One-in-ten would consider breaking up with someone if they discovered a financial secret. One-in-five among Millennials.

17
Internal
Financial Secrets
Type of Secrets
Q32. Are you currently keeping a financial secret from your partner?
Q33. What are your financial secrets?
Q34 When do you plan to tell your partner about your financial secret?
A bank account
Significant credit card debt
Bad credit score
Bankruptcy
Unpaid student loans
Child support payments/alimony
Other
48%
37%
32%
27%
26%
26%
16%
Currently Keeping a Financial Secret
90%
10% Yes
No
18-34 35-54 55+ Male Female Hispanic LGBT Happy
22% 11% 4% 10% 10% 22% 17% 10%
78% 89% 96% 90% 90% 78% 83% 90%
Yes
No
Separate
Money
Combined
Money
Used Dating
Service
Not Used
Dating
Service
Talk $
Weekly
Argue $
Weekly <$100k HHI $100k+ HHI
32% 4% 29% 5% 12% 33% 10% 17%
68% 96% 71% 95% 88% 67% 90% 83%
Yes
No
• One-in-ten are keeping a financial secret from their partner. Secrets are more prevalent among Millennials, Hispanics and LGBT, as well as
couples who have used a dating service, couples who keep their money separate and those who regularly argue about money.
In the next year
In the next five years
When we move in together
When we get engaged
When we get engaged
I don't plan to tell my partner about
my secret
48%
28%
6%
2%
1%
15%
Planning to Come Clean
18
Internal
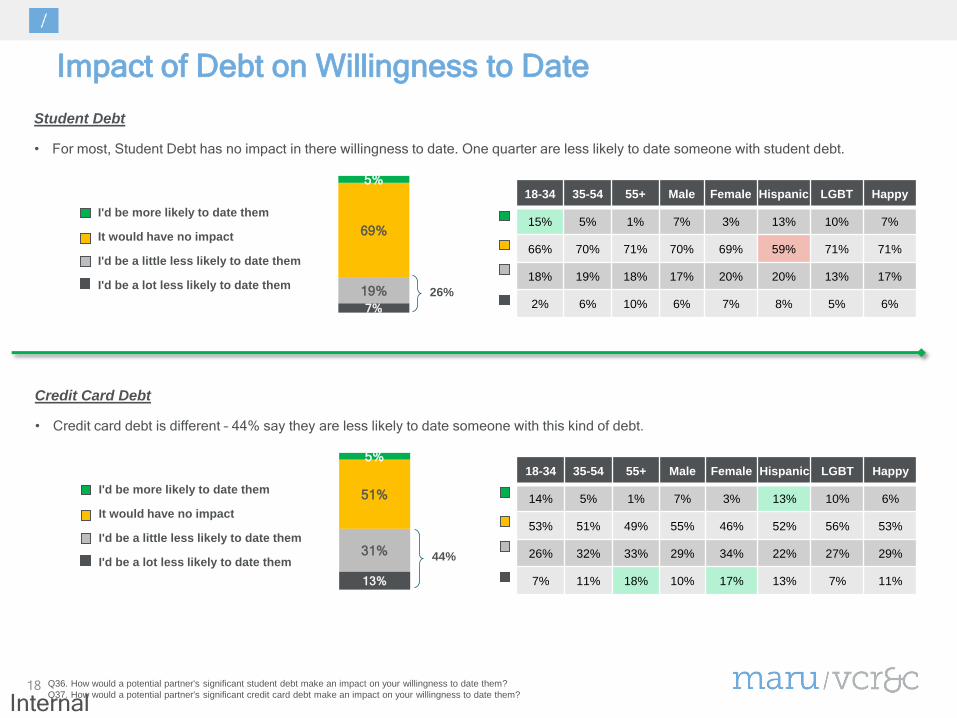
Impact of Debt on Willingness to Date
• For most, Student Debt has no impact in there willingness to date. One quarter are less likely to date someone with student debt.
Q36. How would a potential partner's significant student debt make an impact on your willingness to date them?
Q37. How would a potential partner's significant credit card debt make an impact on your willingness to date them?
18-34 35-54 55+ Male Female Hispanic LGBT Happy
15% 5% 1% 7% 3% 13% 10% 7%
66% 70% 71% 70% 69% 59% 71% 71%
18% 19% 18% 17% 20% 20% 13% 17%
2% 6% 10% 6% 7% 8% 5% 6%
5%
69%
19%
7%
I'd be more likely to date them
It would have no impact
I'd be a little less likely to date them
I'd be a lot less likely to date them
Student Debt
• Credit card debt is different – 44% say they are less likely to date someone with this kind of debt.
18-34 35-54 55+ Male Female Hispanic LGBT Happy
14% 5% 1% 7% 3% 13% 10% 6%
53% 51% 49% 55% 46% 52% 56% 53%
26% 32% 33% 29% 34% 22% 27% 29%
7% 11% 18% 10% 17% 13% 7% 11%
5%
51%
31%
13%
I'd be more likely to date them
It would have no impact
I'd be a little less likely to date them
I'd be a lot less likely to date them
Credit Card Debt
26%
44%

19
Internal
Financial Stability / Independence Indicators
• Owning a home is the biggest indicator of ones own financial stability or independence.
Q39. What milestone has most indicated or will most indicate your own personal financial stability or independence?
Q40. What milestone has most indicated or will most indicate financial stability or independence in your partner?
In You
• Owning a home is also the biggest indicator of ones partner’s financial stability or independence.
In Your Partner
51%
25%
8%
6%
2%
18-34 35-54 55+ Male Female Hispanic LGBT Happy
43% 55% 50% 55% 47% 49% 42% 51%
21% 22% 28% 22% 27% 22% 26% 23%
16% 7% 4% 7% 8% 12% 9% 8%
16% 7% 2% 7% 6% 10% 13% 7%
2% 2% 1% 2% 2% 1% 1% 2%
Own a home
Minimal credit card debt
No longer live with parents
Student loans are paid off
No longer live with a roommate
46%
27%
8%
7%
2%
18-34 35-54 55+ Male Female Hispanic LGBT Happy
43% 49% 43% 46% 46% 47% 42% 45%
22% 24% 33% 26% 29% 23% 26% 24%
14% 8% 5% 8% 8% 10% 9% 8%
13% 9% 3% 10% 4% 10% 9% 13%
5% 3% 1% 2% 3% 3% 3% 5%
Own a home
Minimal credit card debt
No longer live with parents
Student loans are paid off
No longer live with a roommate