Embed Size (px)
Citation preview
TD Economics
@TD_Economicshttp://economics.td.com
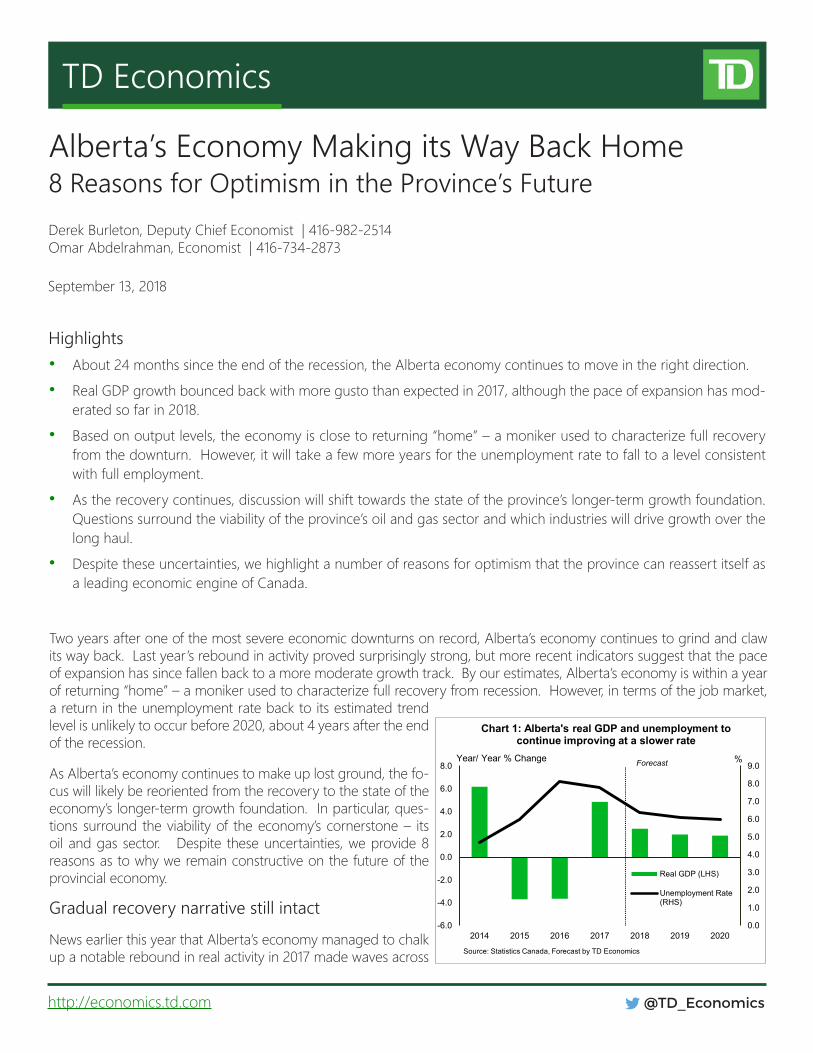
Two years after one of the most severe economic downturns on record, Alberta’s economy continues to grind and claw its way back. Last year’s rebound in activity proved surprisingly strong, but more recent indicators suggest that the pace of expansion has since fallen back to a more moderate growth track. By our estimates, Alberta’s economy is within a year of returning “home” – a moniker used to characterize full recovery from recession. However, in terms of the job market, a return in the unemployment rate back to its estimated trend level is unlikely to occur before 2020, about 4 years after the end of the recession.
As Alberta’s economy continues to make up lost ground, the fo-cus will likely be reoriented from the recovery to the state of the economy’s longer-term growth foundation. In particular, ques-tions surround the viability of the economy’s cornerstone – its oil and gas sector. Despite these uncertainties, we provide 8 reasons as to why we remain constructive on the future of the provincial economy.
Gradual recovery narrative still intact
News earlier this year that Alberta’s economy managed to chalk up a notable rebound in real activity in 2017 made waves across
Alberta’s Economy Making its Way Back Home
Highlights • About 24 months since the end of the recession, the Alberta economy continues to move in the right direction.
• Real GDP growth bounced back with more gusto than expected in 2017, although the pace of expansion has mod-erated so far in 2018.
• Based on output levels, the economy is close to returning “home” – a moniker used to characterize full recovery from the downturn. However, it will take a few more years for the unemployment rate to fall to a level consistent with full employment.
• As the recovery continues, discussion will shift towards the state of the province’s longer-term growth foundation. Questions surround the viability of the province’s oil and gas sector and which industries will drive growth over the long haul.
• Despite these uncertainties, we highlight a number of reasons for optimism that the province can reassert itself as a leading economic engine of Canada.
Derek Burleton, Deputy Chief Economist | 416-982-2514Omar Abdelrahman, Economist | 416-734-2873
September 13, 2018
8 Reasons for Optimism in the Province’s Future
0.0
1.0
2.0
3.0
4.0
5.0
6.0
7.0
8.0
9.0
-6.0
-4.0
-2.0
0.0
2.0
4.0
6.0
8.0
2014 2015 2016 2017 2018 2019 2020
Chart 1: Alberta's real GDP and unemployment to continue improving at a slower rate
Real GDP (LHS)
Unemployment Rate(RHS)
Source: Statistics Canada, Forecast by TD Economics
Year/ Year % Change Forecast %
2
@TD_Economicshttp://economics.td.com
Canada. Heading into last year, the consensus of fore-casters was for economic growth in the province to re-sume but at a measured rate of 2-2.5%. The pace of ex-pansion ultimately tipped the scale at double that pace (4.9%). Other provinces fared well in terms of growth last year, but only B.C. came within a percentage point of Al-berta’s turnout. The message in Canadian media circles was that Alberta’s economy was not only bouncing back, but with punch.
Yet the response of Albertans to the same news was gen-erally restrained, since it didn’t change the perception of a drawn out economic recovery from one of the deep-est recessions on record. Final tallies on the depth of the 2015-16 downturn point to a cumulative contraction in real GDP of approximately 7.2% in 2015-16. As such, last year’s bounce-back, though welcome, still left the prov-ince in an economic hole. Moreover, part of last year’s rebound – and by extension the economic decline the prior year – was exacerbated by the 2016’s devastating wildfiresandresultingreconstructionefforts inFortMc-Murray. With those impacts since starting to wane, and with the recovery in the province’s energy sector tapering off,therateofexpansionappearstobesimmeringdownto a more sustainable rate of about 2.5% in 2018. In per capita terms, this year’s level of activity is still expected to fall slightly short of that that prevailed in 2014.
The accompanying tables provide some additional con-text around the evolution of Alberta’s recession and the recovery now underway. In some respects, this current
cycle is unusual relative to those past. First is the degree to which the impact of the downturn was concentrated in the business sector, whereas most household-sector indi-cators have shown surprising resilience compared to past swings. And, second, to the extent that some underlying factorshelpedtocushiontheblow(includingfiscalstimu-lus and near-zero interest rates), there is less potential for the economy to follow the typical V-shaped pattern as in past cycles.
2015-16 a business-led downturn
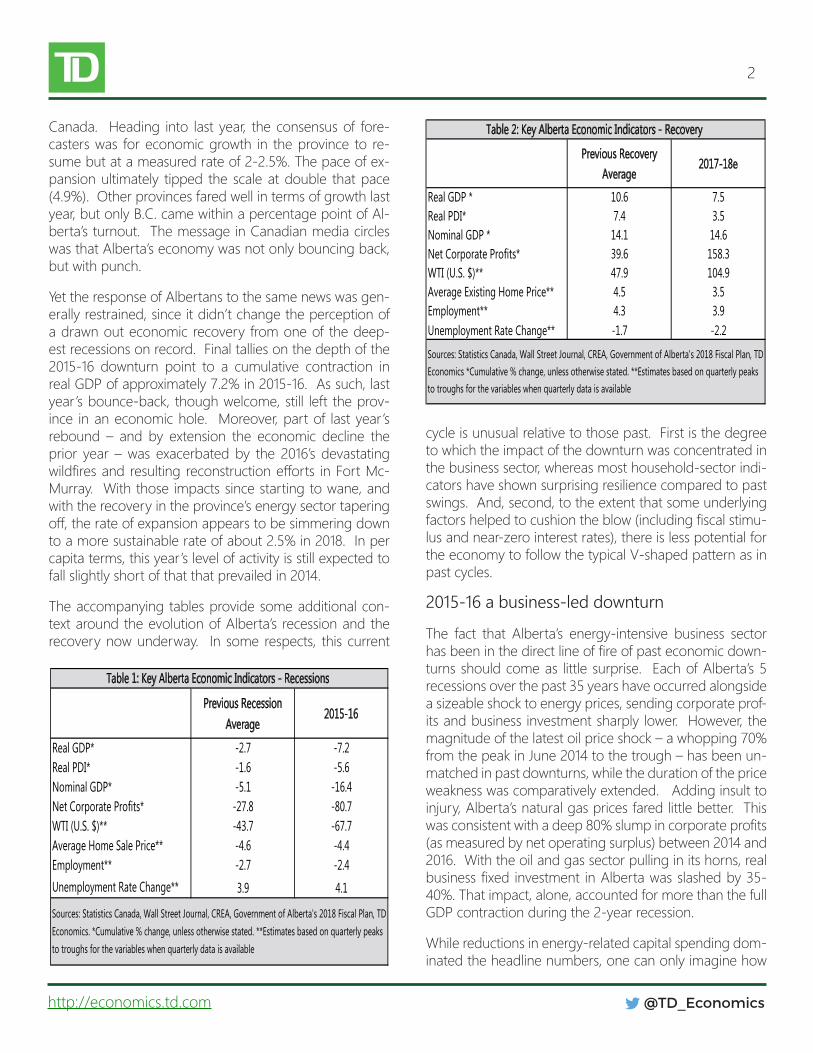
The fact that Alberta’s energy-intensive business sector hasbeeninthedirectlineoffireofpasteconomicdown-turns should come as little surprise. Each of Alberta’s 5 recessions over the past 35 years have occurred alongside a sizeable shock to energy prices, sending corporate prof-its and business investment sharply lower. However, the magnitude of the latest oil price shock – a whopping 70% from the peak in June 2014 to the trough – has been un-matched in past downturns, while the duration of the price weakness was comparatively extended. Adding insult to injury, Alberta’s natural gas prices fared little better. This wasconsistentwithadeep80%slumpincorporateprofits(as measured by net operating surplus) between 2014 and 2016. With the oil and gas sector pulling in its horns, real businessfixedinvestment inAlbertawasslashedby35-40%. That impact, alone, accounted for more than the full GDP contraction during the 2-year recession.
While reductions in energy-related capital spending dom-inated the headline numbers, one can only imagine how
Previous Recovery
Average 2017-18e
Real GDP * 10.6 7.5Real PDI* 7.4 3.5Nominal GDP * 14.1 14.6Net Corporate Profits* 39.6 158.3WTI (U.S. $)** 47.9 104.9Average Existing Home Price** 4.5 3.5Employment** 4.3 3.9Unemployment Rate Change** -1.7 -2.2
Table 2: Key Alberta Economic Indicators - Recovery
Sources: Statistics Canada, Wall Street Journal, CREA, Government of Alberta's 2018 Fiscal Plan, TD
Economics *Cumulative % change, unless otherwise stated. **Estimates based on quarterly peaks
to troughs for the variables when quarterly data is available
Previous Recession
Average 2015-16
Real GDP* -2.7 -7.2Real PDI* -1.6 -5.6Nominal GDP* -5.1 -16.4Net Corporate Profits* -27.8 -80.7WTI (U.S. $)** -43.7 -67.7Average Home Sale Price** -4.6 -4.4Employment** -2.7 -2.4
Unemployment Rate Change** 3.9 4.1
Table 1: Key Alberta Economic Indicators - Recessions
Sources: Statistics Canada, Wall Street Journal, CREA, Government of Alberta's 2018 Fiscal Plan, TD
Economics. *Cumulative % change, unless otherwise stated. **Estimates based on quarterly peaks
to troughs for the variables when quarterly data is available
3
@TD_Economicshttp://economics.td.com
far the economy would have fallen in 2015-16 had it not forsomeoffsettingpocketsofsectoralgrowth.Insharpcontrast to investment in the energy sector, oil production continued to expand through the recessionary period, thus mitigating the impact on overall energy-sector activ-ity.Thisdevelopmentreflectstheshiftintheoilindustryover time from conventional plays with shorter investment cycles towards longer-term oil sands projects, where out-put was either started or ramped up in the 2015-16 period. Traditionally, oil extraction has followed investment lower during periods of contraction.
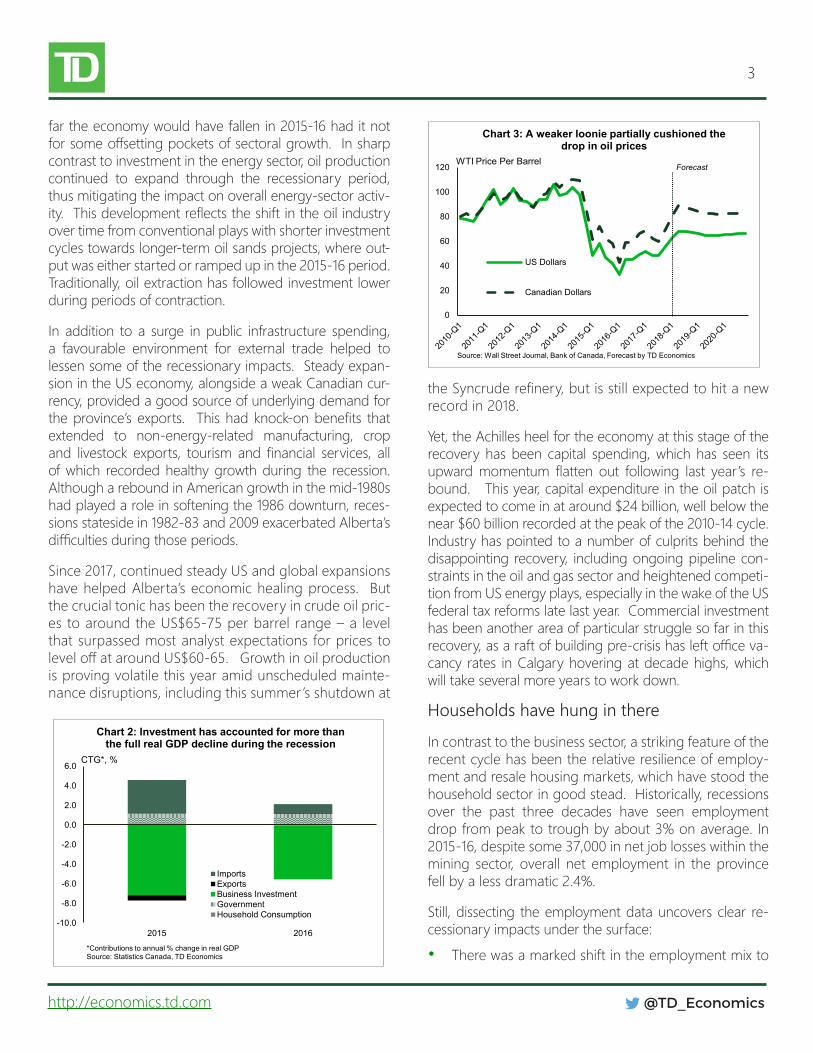
In addition to a surge in public infrastructure spending, a favourable environment for external trade helped to lessen some of the recessionary impacts. Steady expan-sion in the US economy, alongside a weak Canadian cur-rency, provided a good source of underlying demand for theprovince’sexports. Thishadknock-onbenefits thatextended to non-energy-related manufacturing, crop and livestock exports, tourism and financial services, allof which recorded healthy growth during the recession. Although a rebound in American growth in the mid-1980s had played a role in softening the 1986 downturn, reces-sions stateside in 1982-83 and 2009 exacerbated Alberta’s difficultiesduringthoseperiods.
Since 2017, continued steady US and global expansions have helped Alberta’s economic healing process. But the crucial tonic has been the recovery in crude oil pric-es to around the US$65-75 per barrel range – a level that surpassed most analyst expectations for prices to leveloffataroundUS$60-65.Growthinoilproductionis proving volatile this year amid unscheduled mainte-nance disruptions, including this summer’s shutdown at
theSyncruderefinery,butisstillexpectedtohitanewrecord in 2018.
Yet, the Achilles heel for the economy at this stage of the recovery has been capital spending, which has seen its upwardmomentum flatten out following last year’s re-bound. This year, capital expenditure in the oil patch is expected to come in at around $24 billion, well below the near $60 billion recorded at the peak of the 2010-14 cycle. Industry has pointed to a number of culprits behind the disappointing recovery, including ongoing pipeline con-straints in the oil and gas sector and heightened competi-tion from US energy plays, especially in the wake of the US federal tax reforms late last year. Commercial investment has been another area of particular struggle so far in this recovery,asaraftofbuildingpre-crisishasleftofficeva-cancy rates in Calgary hovering at decade highs, which will take several more years to work down.
Households have hung in there
In contrast to the business sector, a striking feature of the recent cycle has been the relative resilience of employ-ment and resale housing markets, which have stood the household sector in good stead. Historically, recessions over the past three decades have seen employment drop from peak to trough by about 3% on average. In 2015-16, despite some 37,000 in net job losses within the mining sector, overall net employment in the province fell by a less dramatic 2.4%.
Still, dissecting the employment data uncovers clear re-cessionary impacts under the surface:
• There was a marked shift in the employment mix to
-10.0
-8.0
-6.0
-4.0
-2.0
0.0
2.0
4.0
6.0
2015 2016
Chart 2: Investment has accounted for more than the full real GDP decline during the recession
ImportsExportsBusiness InvestmentGovernmentHousehold Consumption
*Contributions to annual % change in real GDPSource: Statistics Canada, TD Economics
CTG*, %
0
20
40
60
80
100
120
Chart 3: A weaker loonie partially cushioned the drop in oil prices
US Dollars
Canadian Dollars
Source: Wall Street Journal, Bank of Canada, Forecast by TD Economics
WTI Price Per BarrelForecast
4
@TD_Economicshttp://economics.td.com
part-time work, as further evidenced by a sharp de-cline in total hours worked over the 2015-16 period.
• The headline employment performance also con-cealed the strong counterbalancing force from governmentfiscal stimulusandgovernmenthiring,particularly within the health and education sectors. In addition to ratcheting up infrastructure spending, public sector employment rose at near double-digit clip during the downturn. Stripping away this im-pact, net private sector jobs fell a much sharper 5% during the recession. Not surprisingly, Edmonton’s higher concentration in public sector jobs meant that it was less adversely affected in 2015-16 thanCalgary and other urban markets with a higher oil and gas presence.
• Above all, the sharp 4 percentage point increase in the unemployment rate (from its trough in 2014 to its peak in 2016) was also more in line with the aver-age of past recessions. However, no downturn in Alberta’s recent memory came close to the nearly 8 percentage point spike in the jobless rate in the early 1980s.Thatexperience,whichreflectedmassivejobcutsandhistoricallylargeoutflowsofmigrants,wasespecially painful on the household sector.
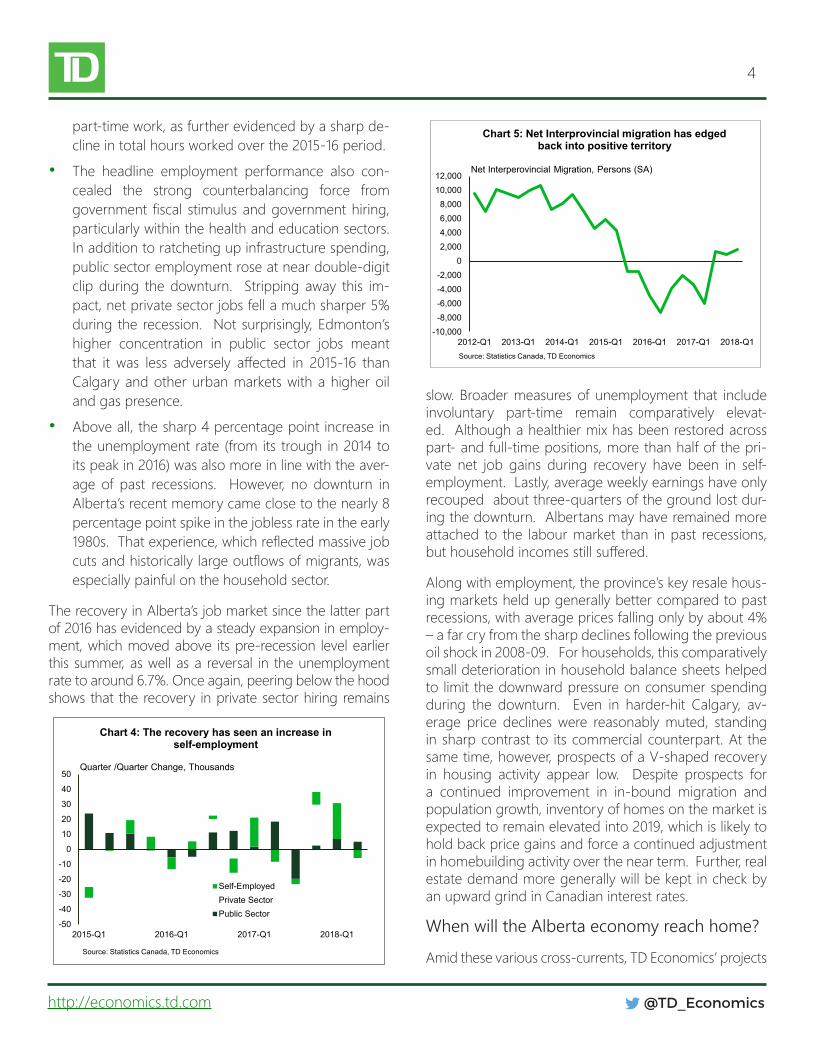
The recovery in Alberta’s job market since the latter part of 2016 has evidenced by a steady expansion in employ-ment, which moved above its pre-recession level earlier this summer, as well as a reversal in the unemployment rate to around 6.7%. Once again, peering below the hood shows that the recovery in private sector hiring remains
slow. Broader measures of unemployment that include involuntary part-time remain comparatively elevat-ed. Although a healthier mix has been restored across part- and full-time positions, more than half of the pri-vate net job gains during recovery have been in self-employment. Lastly, average weekly earnings have only recouped about three-quarters of the ground lost dur-ing the downturn. Albertans may have remained more attached to the labour market than in past recessions, buthouseholdincomesstillsuffered.
Along with employment, the province’s key resale hous-ing markets held up generally better compared to past recessions, with average prices falling only by about 4% – a far cry from the sharp declines following the previous oil shock in 2008-09. For households, this comparatively small deterioration in household balance sheets helped to limit the downward pressure on consumer spending during the downturn. Even in harder-hit Calgary, av-erage price declines were reasonably muted, standing in sharp contrast to its commercial counterpart. At the same time, however, prospects of a V-shaped recovery in housing activity appear low. Despite prospects for a continued improvement in in-bound migration and population growth, inventory of homes on the market is expected to remain elevated into 2019, which is likely to hold back price gains and force a continued adjustment in homebuilding activity over the near term. Further, real estate demand more generally will be kept in check by an upward grind in Canadian interest rates.
When will the Alberta economy reach home?
Amid these various cross-currents, TD Economics’ projects
-10,000-8,000-6,000-4,000-2,000
02,0004,0006,0008,000
10,00012,000
2012-Q1 2013-Q1 2014-Q1 2015-Q1 2016-Q1 2017-Q1 2018-Q1
Chart 5: Net Interprovincial migration has edged back into positive territory
Source: Statistics Canada, TD Economics
Net Interperovincial Migration, Persons (SA)
-50
-40
-30
-20
-10
0
10
20
30
40
50
2015-Q1 2016-Q1 2017-Q1 2018-Q1
Chart 4: The recovery has seen an increase in self-employment
Self-EmployedPrivate SectorPublic Sector
Quarter /Quarter Change, Thousands
Source: Statistics Canada, TD Economics
5
@TD_Economicshttp://economics.td.com
a continuation of this year’s relatively moderate rate of around 2-2.5% per year in both 2019 and 2020. Our pro-jection is predicated on benchmark energy prices holding at close to their current levels and for further though more moderate expansion in the US and globally. We see the risks around our baseline forecast as generally balanced. On the upside, global excess production capacity is run-ning relatively thin, so any unanticipated rise in demand could send global oil price benchmarks up sharply. On the downside, the possibility of growing pipeline con-straints in Alberta next year might further expand heavy oil price discounts. Other downside risks relate to the prospect of an escalating trade war, which could prompt asignificantglobaleconomicslowdownanddrivedownenergy prices. Moreover, with the US expansion long in the tooth and both the Fed and the Bank of Canada em-barkingon tightening cycles, there is a not-insignificantrisk of a continent-wide recession by 2020.
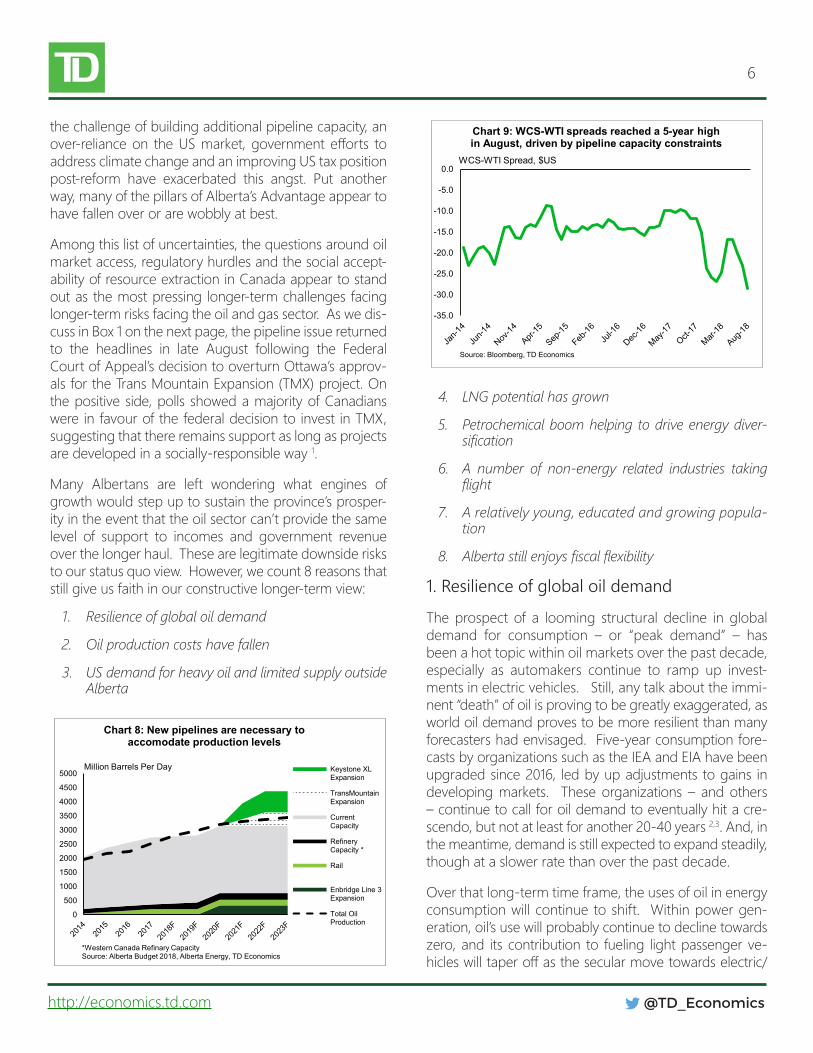
Our baseline growth outlook is consistent with Alberta making a full recovery in terms of output by late 2017 or early 2018. In terms of the job market, progress is slower. One guidepost is when the unemployment rate moves back to a level consistent with full employment, which ad-mittedly is unobservable and somewhat arbitrary to esti-mate. We estimate this rate in a range of 5 ¼-6%, placing it above the 4.4% trough of the recent economic boom, when the economy was almost certainly in a position of excess demand. With job creation expected to only out-pace labour force growth by a modest margin over the next few years, Alberta’s unemployment rate is not ex-pected to move into that range until 2020.
Regardless, of when Alberta’s economy manages to get
fullybackon its feet, therewill be somenotablediffer-ences in economic structure relative to that heading into 2015-16 recession. For one, the goods sector share of to-tal employment will likely pale in comparison to its peak in 2014. While the mining share of GDP will hold up quite well,itreflectsgrowingoilproductionandrelatedserviceactivities that are more automated/less labour intensive than in the past. With only a slow recovery projected in residential and non-residential building activity, the con-struction sector’s share is expected to remain relatively low in terms of both GDP and employment. The corollary is that the service sector will remain more prominent than it has historically, particularly as a driver of employment.
Will Alberta re-emerge as a growth leader?
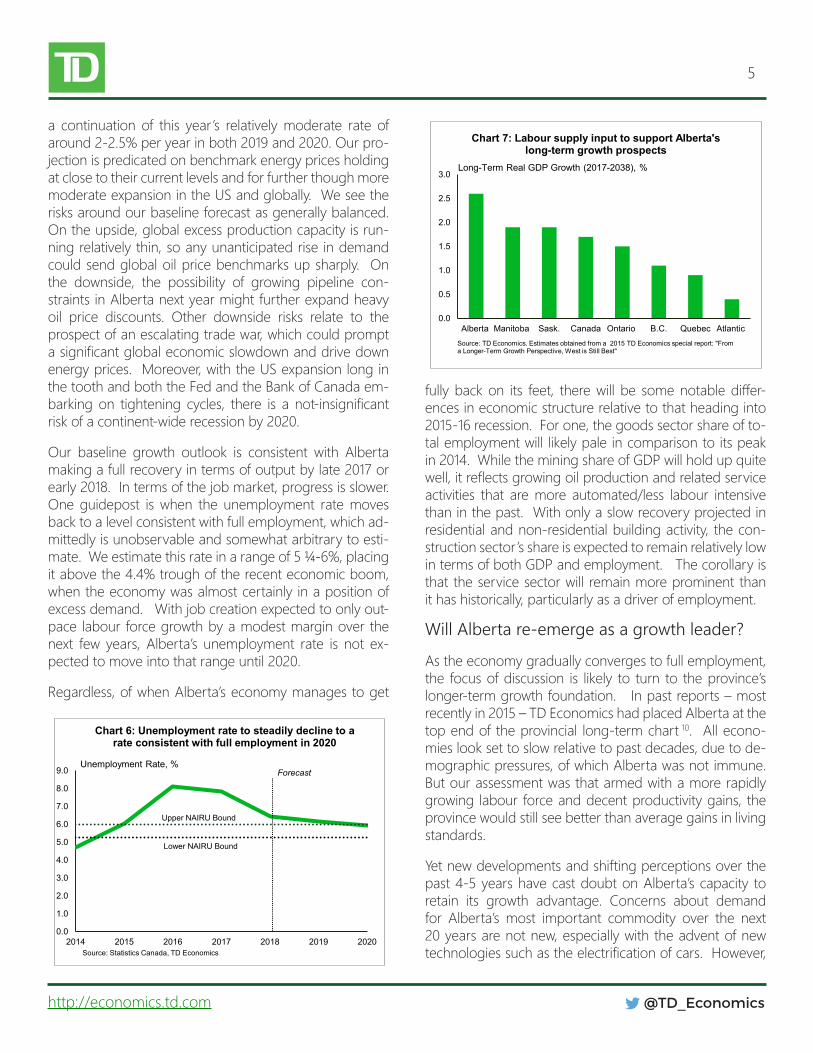
As the economy gradually converges to full employment, the focus of discussion is likely to turn to the province’s longer-term growth foundation. In past reports – most recently in 2015 – TD Economics had placed Alberta at the top end of the provincial long-term chart 10. All econo-mies look set to slow relative to past decades, due to de-mographic pressures, of which Alberta was not immune. But our assessment was that armed with a more rapidly growing labour force and decent productivity gains, the province would still see better than average gains in living standards.
Yet new developments and shifting perceptions over the past 4-5 years have cast doubt on Alberta’s capacity to retain its growth advantage. Concerns about demand for Alberta’s most important commodity over the next 20 years are not new, especially with the advent of new technologiessuchastheelectrificationofcars.However,
0.0
1.0
2.0
3.0
4.0
5.0
6.0
7.0
8.0
9.0
2014 2015 2016 2017 2018 2019 2020Source: Statistics Canada, TD Economics
Unemployment Rate, %Forecast
Upper NAIRU Bound
Lower NAIRU Bound
Chart 6: Unemployment rate to steadily decline to a rate consistent with full employment in 2020
0.0
0.5
1.0
1.5
2.0
2.5
3.0
Alberta Manitoba Sask. Canada Ontario B.C. Quebec Atlantic
Chart 7: Labour supply input to support Alberta's long-term growth prospects
Source: TD Economics. Estimates obtained from a 2015 TD Economics special report: "From a Longer-Term Growth Perspective, West is Still Best"
Long-Term Real GDP Growth (2017-2038), %
6
@TD_Economicshttp://economics.td.com
the challenge of building additional pipeline capacity, an over-relianceon theUSmarket,governmentefforts toaddress climate change and an improving US tax position post-reform have exacerbated this angst. Put another way, many of the pillars of Alberta’s Advantage appear to have fallen over or are wobbly at best.
Among this list of uncertainties, the questions around oil market access, regulatory hurdles and the social accept-ability of resource extraction in Canada appear to stand out as the most pressing longer-term challenges facing longer-term risks facing the oil and gas sector. As we dis-cuss in Box 1 on the next page, the pipeline issue returned to the headlines in late August following the Federal Court of Appeal’s decision to overturn Ottawa’s approv-als for the Trans Mountain Expansion (TMX) project. On the positive side, polls showed a majority of Canadians were in favour of the federal decision to invest in TMX, suggesting that there remains support as long as projects are developed in a socially-responsible way 1.
Many Albertans are left wondering what engines of growth would step up to sustain the province’s prosper-ity in the event that the oil sector can’t provide the same level of support to incomes and government revenue over the longer haul. These are legitimate downside risks to our status quo view. However, we count 8 reasons that still give us faith in our constructive longer-term view:
1. Resilience of global oil demand
2. Oil production costs have fallen
3. US demand for heavy oil and limited supply outside Alberta
4. LNG potential has grown
5. Petrochemical boom helping to drive energy diver-sification
6. A number of non-energy related industries taking flight
7. A relatively young, educated and growing popula-tion
8. Alberta still enjoys fiscal flexibility
1. Resilience of global oil demand
The prospect of a looming structural decline in global demand for consumption – or “peak demand” – has been a hot topic within oil markets over the past decade, especially as automakers continue to ramp up invest-ments in electric vehicles. Still, any talk about the immi-nent “death” of oil is proving to be greatly exaggerated, as world oil demand proves to be more resilient than many forecasters had envisaged. Five-year consumption fore-casts by organizations such as the IEA and EIA have been upgraded since 2016, led by up adjustments to gains in developing markets. These organizations – and others – continue to call for oil demand to eventually hit a cre-scendo, but not at least for another 20-40 years 2,3. And, in the meantime, demand is still expected to expand steadily, though at a slower rate than over the past decade.
Over that long-term time frame, the uses of oil in energy consumption will continue to shift. Within power gen-eration, oil’s use will probably continue to decline towards zero, and its contribution to fueling light passenger ve-hicleswilltaperoffasthesecularmovetowardselectric/
0
500
1000
1500
2000
2500
3000
3500
4000
4500
5000
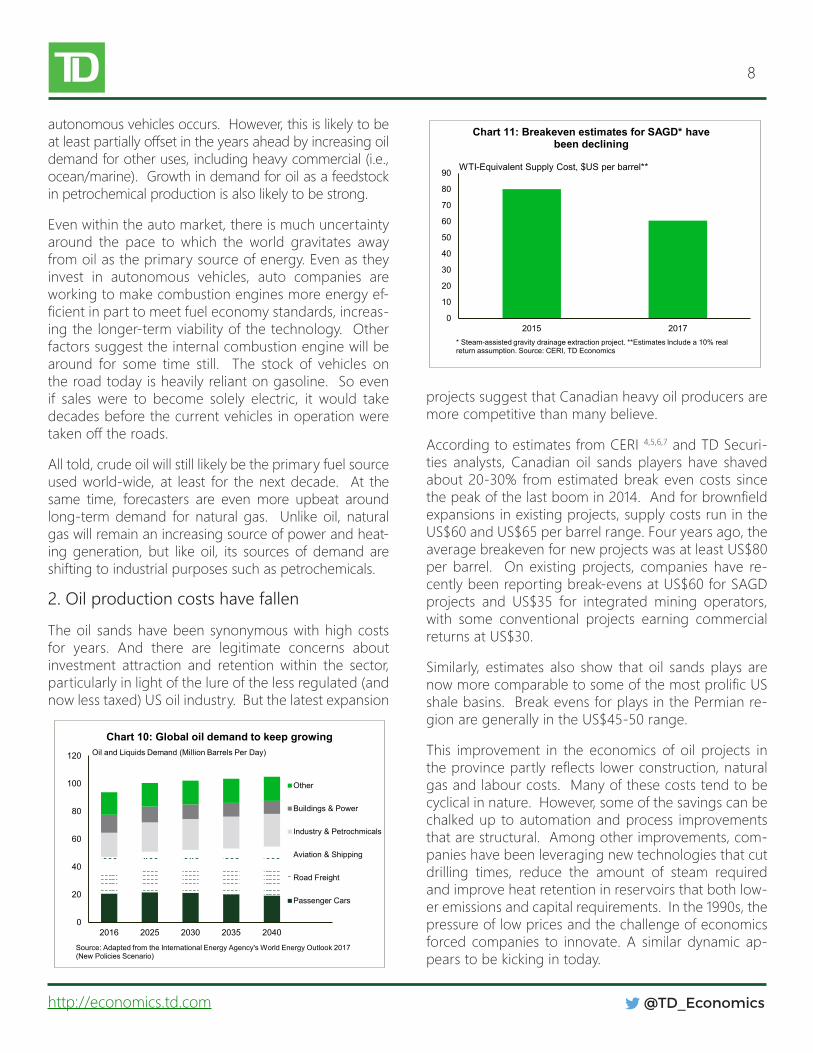
Chart 8: New pipelines are necessary to accomodate production levels
Keystone XLExpansion
TransMountainExpansion
CurrentCapacity
RefineryCapacity *
Rail
Enbridge Line 3Expansion
Total OilProduction
*Western Canada Refinary CapacitySource: Alberta Budget 2018, Alberta Energy, TD Economics
Million Barrels Per Day
-35.0
-30.0
-25.0
-20.0
-15.0
-10.0
-5.0
0.0
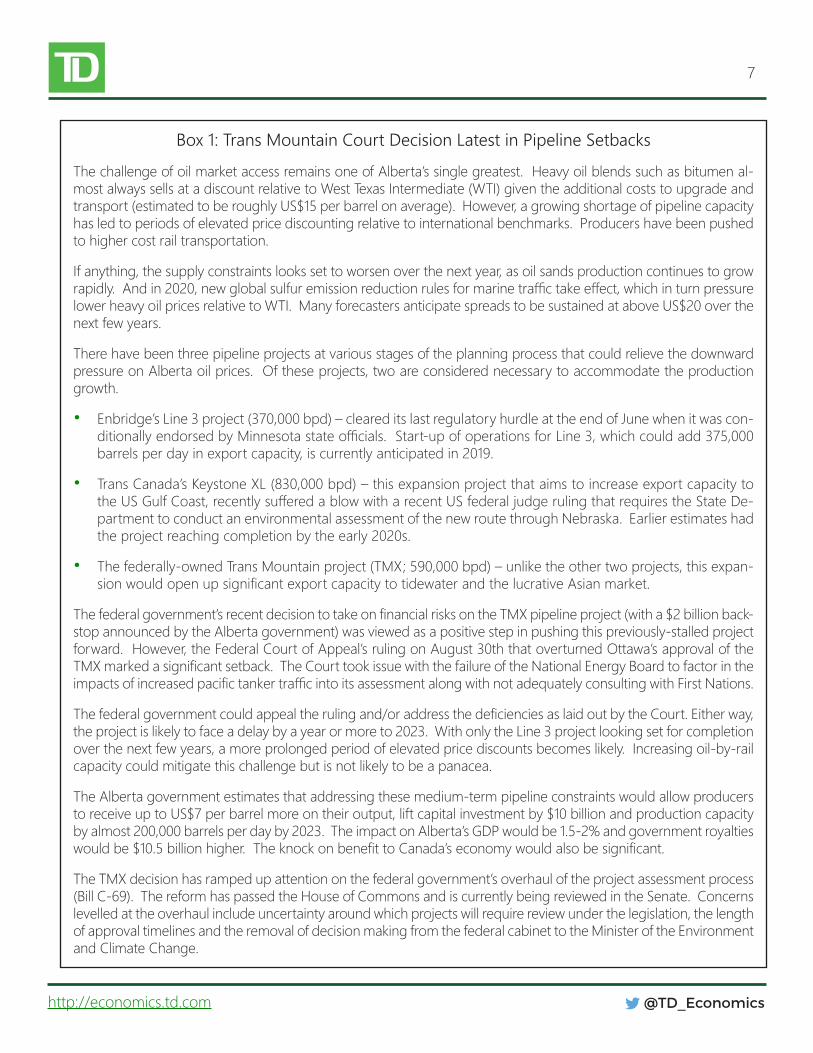
Chart 9: WCS-WTI spreads reached a 5-year high in August, driven by pipeline capacity constraints
Source: Bloomberg, TD Economics
WCS-WTI Spread, $US
7
@TD_Economicshttp://economics.td.com
Box 1: Trans Mountain Court Decision Latest in Pipeline Setbacks
The challenge of oil market access remains one of Alberta’s single greatest. Heavy oil blends such as bitumen al-most always sells at a discount relative to West Texas Intermediate (WTI) given the additional costs to upgrade and transport (estimated to be roughly US$15 per barrel on average). However, a growing shortage of pipeline capacity has led to periods of elevated price discounting relative to international benchmarks. Producers have been pushed to higher cost rail transportation.
If anything, the supply constraints looks set to worsen over the next year, as oil sands production continues to grow rapidly.Andin2020,newglobalsulfuremissionreductionrulesformarinetraffictakeeffect,whichinturnpressurelower heavy oil prices relative to WTI. Many forecasters anticipate spreads to be sustained at above US$20 over the next few years.
There have been three pipeline projects at various stages of the planning process that could relieve the downward pressure on Alberta oil prices. Of these projects, two are considered necessary to accommodate the production growth.
• Enbridge’s Line 3 project (370,000 bpd) – cleared its last regulatory hurdle at the end of June when it was con-ditionallyendorsedbyMinnesotastateofficials.Start-upofoperationsforLine3,whichcouldadd375,000barrels per day in export capacity, is currently anticipated in 2019.
• Trans Canada’s Keystone XL (830,000 bpd) – this expansion project that aims to increase export capacity to theUSGulfCoast,recentlysufferedablowwitharecentUSfederaljudgerulingthatrequirestheStateDe-partment to conduct an environmental assessment of the new route through Nebraska. Earlier estimates had the project reaching completion by the early 2020s.
• The federally-owned Trans Mountain project (TMX; 590,000 bpd) – unlike the other two projects, this expan-sionwouldopenupsignificantexportcapacitytotidewaterandthelucrativeAsianmarket.
Thefederalgovernment’srecentdecisiontotakeonfinancialrisksontheTMXpipelineproject(witha$2billionback-stop announced by the Alberta government) was viewed as a positive step in pushing this previously-stalled project forward. However, the Federal Court of Appeal’s ruling on August 30th that overturned Ottawa’s approval of the TMXmarkedasignificantsetback.TheCourttookissuewiththefailureoftheNationalEnergyBoardtofactorintheimpactsofincreasedpacifictankertrafficintoitsassessmentalongwithnotadequatelyconsultingwithFirstNations.
Thefederalgovernmentcouldappealtherulingand/oraddressthedeficienciesaslaidoutbytheCourt.Eitherway,the project is likely to face a delay by a year or more to 2023. With only the Line 3 project looking set for completion over the next few years, a more prolonged period of elevated price discounts becomes likely. Increasing oil-by-rail capacity could mitigate this challenge but is not likely to be a panacea.
The Alberta government estimates that addressing these medium-term pipeline constraints would allow producers to receive up to US$7 per barrel more on their output, lift capital investment by $10 billion and production capacity by almost 200,000 barrels per day by 2023. The impact on Alberta’s GDP would be 1.5-2% and government royalties wouldbe$10.5billionhigher.TheknockonbenefittoCanada’seconomywouldalsobesignificant.
The TMX decision has ramped up attention on the federal government’s overhaul of the project assessment process (Bill C-69). The reform has passed the House of Commons and is currently being reviewed in the Senate. Concerns levelled at the overhaul include uncertainty around which projects will require review under the legislation, the length of approval timelines and the removal of decision making from the federal cabinet to the Minister of the Environment and Climate Change.
8
@TD_Economicshttp://economics.td.com
autonomous vehicles occurs. However, this is likely to be atleastpartiallyoffsetintheyearsaheadbyincreasingoildemand for other uses, including heavy commercial (i.e., ocean/marine). Growth in demand for oil as a feedstock in petrochemical production is also likely to be strong.
Even within the auto market, there is much uncertainty around the pace to which the world gravitates away from oil as the primary source of energy. Even as they invest in autonomous vehicles, auto companies are working to make combustion engines more energy ef-ficientinparttomeetfueleconomystandards,increas-ing the longer-term viability of the technology. Other factors suggest the internal combustion engine will be around for some time still. The stock of vehicles on the road today is heavily reliant on gasoline. So even if sales were to become solely electric, it would take decades before the current vehicles in operation were takenofftheroads.
All told, crude oil will still likely be the primary fuel source used world-wide, at least for the next decade. At the same time, forecasters are even more upbeat around long-term demand for natural gas. Unlike oil, natural gas will remain an increasing source of power and heat-ing generation, but like oil, its sources of demand are shifting to industrial purposes such as petrochemicals.
2. Oil production costs have fallen
The oil sands have been synonymous with high costs for years. And there are legitimate concerns about investment attraction and retention within the sector, particularly in light of the lure of the less regulated (and now less taxed) US oil industry. But the latest expansion
projects suggest that Canadian heavy oil producers are more competitive than many believe.
According to estimates from CERI 4,5,6,7 and TD Securi-ties analysts, Canadian oil sands players have shaved about 20-30% from estimated break even costs since thepeakofthelastboomin2014.Andforbrownfieldexpansions in existing projects, supply costs run in the US$60 and US$65 per barrel range. Four years ago, the average breakeven for new projects was at least US$80 per barrel. On existing projects, companies have re-cently been reporting break-evens at US$60 for SAGD projects and US$35 for integrated mining operators, with some conventional projects earning commercial returns at US$30.
Similarly, estimates also show that oil sands plays are nowmorecomparabletosomeofthemostprolificUSshale basins. Break evens for plays in the Permian re-gion are generally in the US$45-50 range.
This improvement in the economics of oil projects in theprovincepartlyreflectslowerconstruction,naturalgas and labour costs. Many of these costs tend to be cyclical in nature. However, some of the savings can be chalked up to automation and process improvements that are structural. Among other improvements, com-panies have been leveraging new technologies that cut drilling times, reduce the amount of steam required and improve heat retention in reservoirs that both low-er emissions and capital requirements. In the 1990s, the pressure of low prices and the challenge of economics forced companies to innovate. A similar dynamic ap-pears to be kicking in today.
0
20
40
60
80
100
120
2016 2025 2030 2035 2040
Chart 10: Global oil demand to keep growing
Other
Buildings & Power
Industry & Petrochmicals
Aviation & Shipping
Road Freight
Passenger Cars
Source: Adapted from the International Energy Agency's World Energy Outlook 2017(New Policies Scenario)
Oil and Liquids Demand (Million Barrels Per Day)
0
10
20
30
40
50
60
70
80
90
2015 2017
Chart 11: Breakeven estimates for SAGD* have been declining
* Steam-assisted gravity drainage extraction project. **Estimates Include a 10% real return assumption. Source: CERI, TD Economics
WTI-Equivalent Supply Cost, $US per barrel**
9
@TD_Economicshttp://economics.td.com
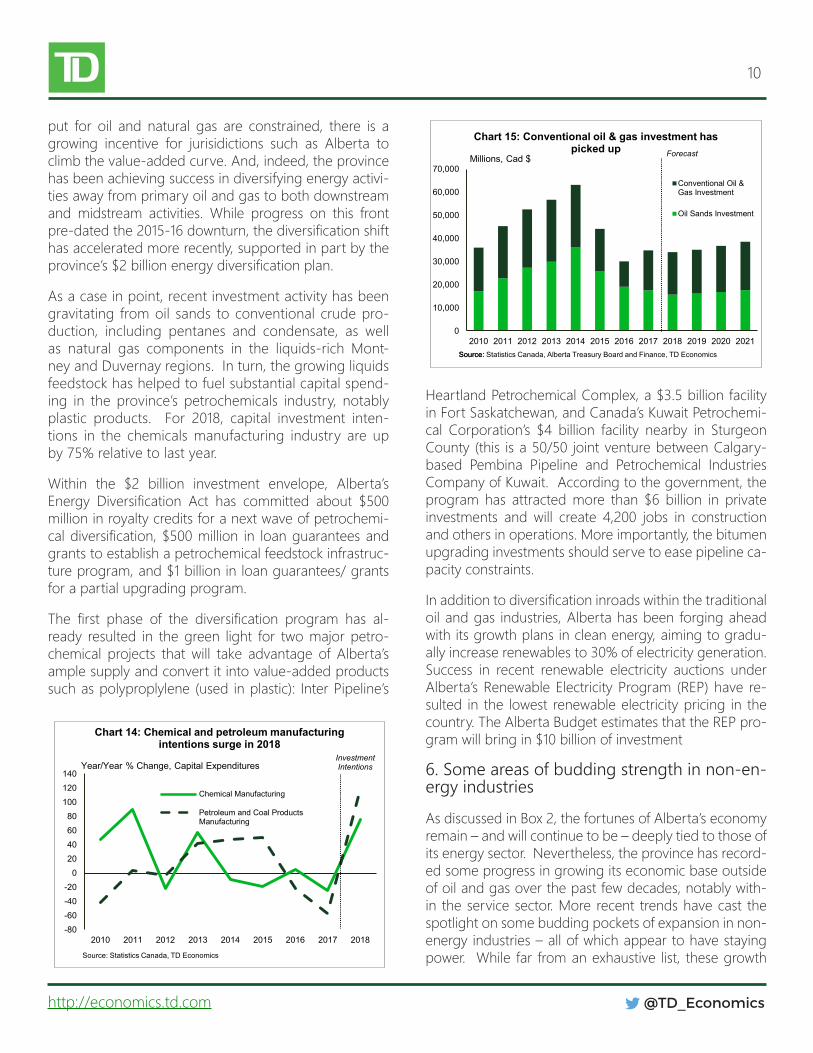
3. US demand for Alberta’s heavy oil and lim-ited supply outside of Alberta
Alberta has something that will continue to be demand-ed over the foreseeable future: its large bounty of heavy crudebitumen.Theprovincehasbeenaddingtorefin-ing capacity in recent years: currently home to four re-fineriesthatprocessheavieroilgrades,withafifthoneprojected to begin operations in 2018 (i.e., Sturgeon re-finery).Nonetheless, themostcaptivemarket forbitu-men remains the US Gulf coast, which along with China is the largest supplierofheavyoil refiningproducts inthe world.
These Gulf Coast refineries have been specially con-structed to process heavy oil molecules, partly to take advantage of their discounted price. Processing other, higher-quality crude types generate poorer quality and/or weaker yields. As such, cost constraints limit the abil-ityofrefineriestoeasilyswitchacrosscrudetypes.
The challenge facing US refineries that require heavyfeedstock is that alternative sources for heavy oil – no-tably Venezuela and Mexico – have been experienc-ing production declines due to political uncertainty, US sanctions and other factors. Indeed, earlier this year – forthefirsttimeonrecord,USGulfCoastrefinershavebeen importing more heavy oil from Alberta than from Venezuela. These production setbacks could eventually ebb, while upcoming new marine fuel standards in 2020 could cut into demand for heavy sour crude. Never-theless, the ongoing strength of US refinery demandshould at least provide a solid demand underpinning for oil sands output in the years ahead.
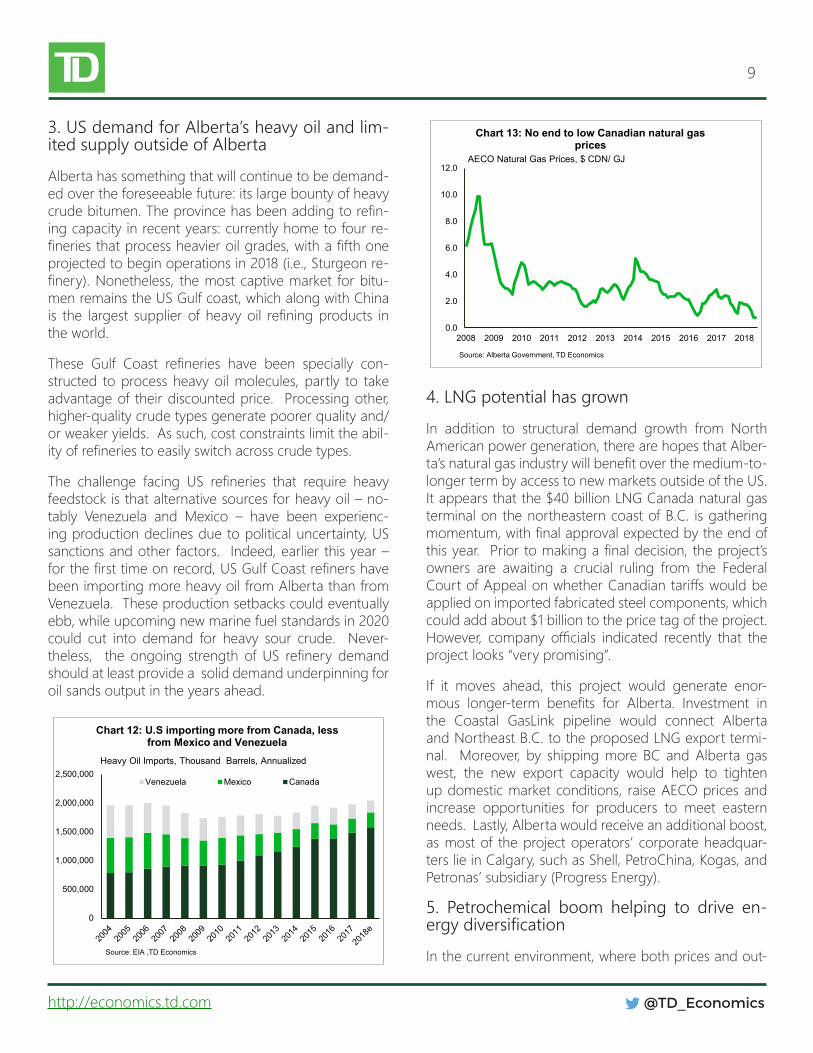
4. LNG potential has grown
In addition to structural demand growth from North American power generation, there are hopes that Alber-ta’snaturalgasindustrywillbenefitoverthemedium-to-longer term by access to new markets outside of the US. It appears that the $40 billion LNG Canada natural gas terminal on the northeastern coast of B.C. is gathering momentum,withfinalapprovalexpectedbytheendofthisyear.Priortomakingafinaldecision,theproject’sowners are awaiting a crucial ruling from the Federal CourtofAppealonwhetherCanadiantariffswouldbeapplied on imported fabricated steel components, which could add about $1 billion to the price tag of the project. However, company officials indicated recently that theproject looks “very promising”.
If it moves ahead, this project would generate enor-mous longer-term benefits for Alberta. Investment inthe Coastal GasLink pipeline would connect Alberta and Northeast B.C. to the proposed LNG export termi-nal. Moreover, by shipping more BC and Alberta gas west, the new export capacity would help to tighten up domestic market conditions, raise AECO prices and increase opportunities for producers to meet eastern needs. Lastly, Alberta would receive an additional boost, as most of the project operators’ corporate headquar-ters lie in Calgary, such as Shell, PetroChina, Kogas, and Petronas’ subsidiary (Progress Energy).
5. Petrochemical boom helping to drive en-ergy diversification
In the current environment, where both prices and out-
0
500,000
1,000,000
1,500,000
2,000,000
2,500,000
Chart 12: U.S importing more from Canada, less from Mexico and Venezuela
Venezuela Mexico Canada
Source: EIA ,TD Economics
Heavy Oil Imports, Thousand Barrels, Annualized
0.0
2.0
4.0
6.0
8.0
10.0
12.0
2008 2009 2010 2011 2012 2013 2014 2015 2016 2017 2018
Chart 13: No end to low Canadian natural gas prices
Source: Alberta Government, TD Economics
AECO Natural Gas Prices, $ CDN/ GJ
10
@TD_Economicshttp://economics.td.com
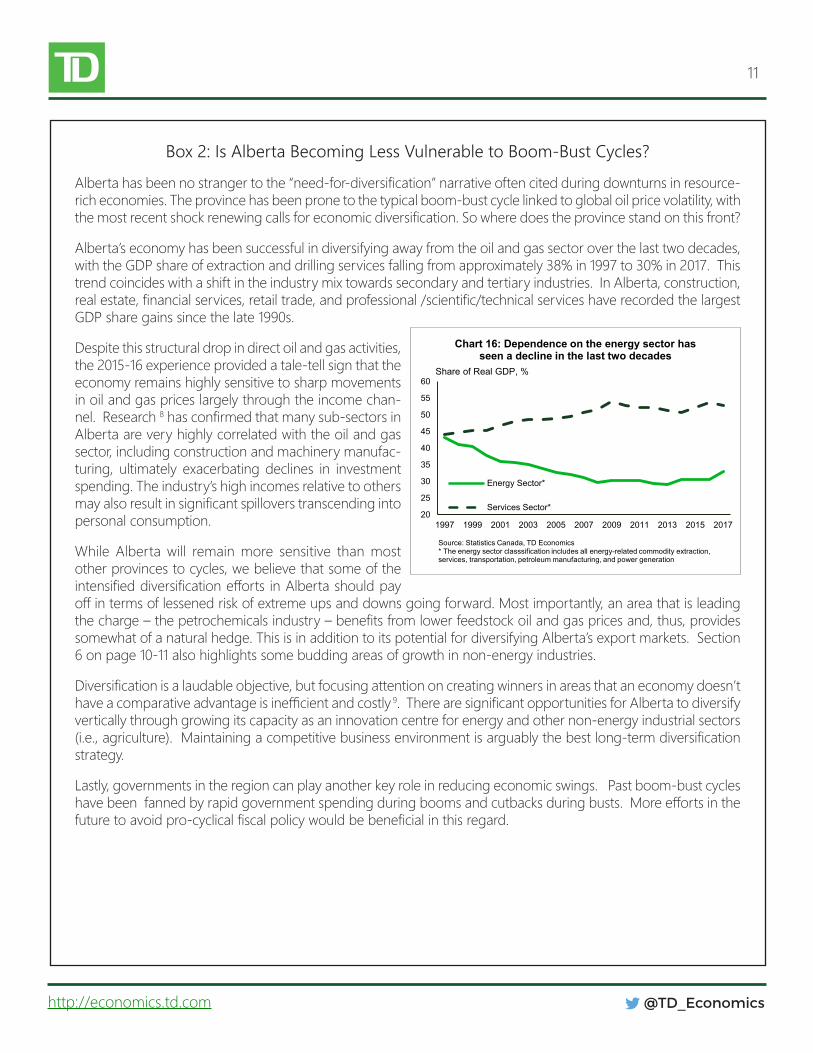
put for oil and natural gas are constrained, there is a growing incentive for jurisidictions such as Alberta to climb the value-added curve. And, indeed, the province has been achieving success in diversifying energy activi-ties away from primary oil and gas to both downstream and midstream activities. While progress on this front pre-datedthe2015-16downturn,thediversificationshifthas accelerated more recently, supported in part by the province’s$2billionenergydiversificationplan.
As a case in point, recent investment activity has been gravitating from oil sands to conventional crude pro-duction, including pentanes and condensate, as well as natural gas components in the liquids-rich Mont-ney and Duvernay regions. In turn, the growing liquids feedstock has helped to fuel substantial capital spend-ing in the province’s petrochemicals industry, notably plastic products. For 2018, capital investment inten-tions in the chemicals manufacturing industry are up by 75% relative to last year.
Within the $2 billion investment envelope, Alberta’s Energy Diversification Act has committed about $500million in royalty credits for a next wave of petrochemi-caldiversification,$500million in loanguaranteesandgrants to establish a petrochemical feedstock infrastruc-ture program, and $1 billion in loan guarantees/ grants for a partial upgrading program.
The first phase of the diversification program has al-ready resulted in the green light for two major petro-chemical projects that will take advantage of Alberta’s ample supply and convert it into value-added products such as polyproplylene (used in plastic): Inter Pipeline’s
Heartland Petrochemical Complex, a $3.5 billion facility in Fort Saskatchewan, and Canada’s Kuwait Petrochemi-cal Corporation’s $4 billion facility nearby in Sturgeon County (this is a 50/50 joint venture between Calgary-based Pembina Pipeline and Petrochemical Industries Company of Kuwait. According to the government, the program has attracted more than $6 billion in private investments and will create 4,200 jobs in construction and others in operations. More importantly, the bitumen upgrading investments should serve to ease pipeline ca-pacity constraints.
Inadditiontodiversificationinroadswithinthetraditionaloil and gas industries, Alberta has been forging ahead with its growth plans in clean energy, aiming to gradu-ally increase renewables to 30% of electricity generation. Success in recent renewable electricity auctions under Alberta’s Renewable Electricity Program (REP) have re-sulted in the lowest renewable electricity pricing in the country. The Alberta Budget estimates that the REP pro-gram will bring in $10 billion of investment
6. Some areas of budding strength in non-en-ergy industries
As discussed in Box 2, the fortunes of Alberta’s economy remain – and will continue to be – deeply tied to those of its energy sector. Nevertheless, the province has record-ed some progress in growing its economic base outside of oil and gas over the past few decades, notably with-in the service sector. More recent trends have cast the spotlight on some budding pockets of expansion in non-energy industries – all of which appear to have staying power. While far from an exhaustive list, these growth
-80-60-40-20
020406080
100120140
2010 2011 2012 2013 2014 2015 2016 2017 2018
Chart 14: Chemical and petroleum manufacturing intentions surge in 2018
Chemical Manufacturing
Petroleum and Coal ProductsManufacturing
Source: Statistics Canada, TD Economics
Year/Year % Change, Capital ExpendituresInvestment Intentions
0
10,000
20,000
30,000
40,000
50,000
60,000
70,000
2010 2011 2012 2013 2014 2015 2016 2017 2018 2019 2020 2021
Chart 15: Conventional oil & gas investment has picked up
Conventional Oil &Gas Investment
Oil Sands Investment
Source: Statistics Canada, Alberta Treasury Board and Finance, TD Economics
Millions, Cad $
Source:
Forecast
11
@TD_Economicshttp://economics.td.com
Box 2: Is Alberta Becoming Less Vulnerable to Boom-Bust Cycles?
Albertahasbeennostrangertothe“need-for-diversification”narrativeoftencitedduringdownturnsinresource-rich economies. The province has been prone to the typical boom-bust cycle linked to global oil price volatility, with themostrecentshockrenewingcallsforeconomicdiversification.Sowheredoestheprovincestandonthisfront?
Alberta’s economy has been successful in diversifying away from the oil and gas sector over the last two decades, with the GDP share of extraction and drilling services falling from approximately 38% in 1997 to 30% in 2017. This trend coincides with a shift in the industry mix towards secondary and tertiary industries. In Alberta, construction, realestate,financialservices,retailtrade,andprofessional/scientific/technicalserviceshaverecordedthelargestGDP share gains since the late 1990s.
Despite this structural drop in direct oil and gas activities, the 2015-16 experience provided a tale-tell sign that the economy remains highly sensitive to sharp movements in oil and gas prices largely through the income chan-nel. Research 8hasconfirmedthatmanysub-sectorsinAlberta are very highly correlated with the oil and gas sector, including construction and machinery manufac-turing, ultimately exacerbating declines in investment spending. The industry’s high incomes relative to others mayalsoresultinsignificantspilloverstranscendingintopersonal consumption.
While Alberta will remain more sensitive than most other provinces to cycles, we believe that some of the intensifieddiversificationeffortsinAlbertashouldpayoffintermsoflessenedriskofextremeupsanddownsgoingforward.Mostimportantly,anareathatisleadingthecharge–thepetrochemicalsindustry–benefitsfromlowerfeedstockoilandgaspricesand,thus,providessomewhat of a natural hedge. This is in addition to its potential for diversifying Alberta’s export markets. Section 6 on page 10-11 also highlights some budding areas of growth in non-energy industries.
Diversificationisalaudableobjective,butfocusingattentiononcreatingwinnersinareasthataneconomydoesn’thaveacomparativeadvantageisinefficientandcostly 9.TherearesignificantopportunitiesforAlbertatodiversifyvertically through growing its capacity as an innovation centre for energy and other non-energy industrial sectors (i.e.,agriculture).Maintainingacompetitivebusinessenvironmentisarguablythebestlong-termdiversificationstrategy.
Lastly, governments in the region can play another key role in reducing economic swings. Past boom-bust cycles havebeenfannedbyrapidgovernmentspendingduringboomsandcutbacksduringbusts.Moreeffortsinthefuturetoavoidpro-cyclicalfiscalpolicywouldbebeneficialinthisregard.
20
25
30
35
40
45
50
55
60
1997 1999 2001 2003 2005 2007 2009 2011 2013 2015 2017
Chart 16: Dependence on the energy sector has seen a decline in the last two decades
Energy Sector*
Services Sector*
Source: Statistics Canada, TD Economics* The energy sector classsification includes all energy-related commodity extraction, services, transportation, petroleum manufacturing, and power generation
Share of Real GDP, %
12
@TD_Economicshttp://economics.td.com
engines include tourism and food products manufactur-ing. What’s more, its geographic location is driving the province’s growing presence as an inland port and lo-gistics hub.
Within the high-tech sector, Alberta is considered one of the leaders in AI and ML research in Canada, with a strong research department in the University of Alberta, consideredapioneerinthefieldofreinforcementlearn-ing. DeepMind, a subsidiary of Google, chose to open itsfirstinternationalofficeinthecityofEdmonton.Addi-tionally, UofA was selected last year as one of the recipi-entsofa$125millionplanforaPan-CanadianArtificialIntelligence Strategy (together with other universities). Finally, the provincial government has been proactive in funding AI initiatives, most notably through its Alberta Innovates program.
7. A relatively young, educated and growing population
Alberta’s relatively young and growing population adds to the economy’s longer-term growth potential. Indeed, the province’s median age and dependency ratio con-tinues to run well below that of Canada, while its more youthful disposition contributes to its nation leading em-ployment and labour force participation rates.
The province’s in-migration and overall population growth rate suffered during the economic downturn,but is showing signs of re-accelerating. While Alberta is unlikely to be immune to the aging and slowing popula-tion trends being observed across the advanced world, long-term projections remain supportive. Case in point,
the most recent 25-year population forecast by Statistics Canadain2017placedAlbertafirstamongtheprovincesin virtually all scenarios.
Earlier this year, the Alberta government issued a fore-cast that anticipates annual average population gains of about 1.4% annually through 2046. While this pace is slower than the 2% annual rate chalked up between 1992-2017 it is still strong by any measure. The govern-ment is careful to point out that the forecast is heavily dependent on the outlook for migration, and notably in-ternational migrants, which account for about two-thirds of the gains.
Remaining an attractive destination for migrants is ex-pected to slow but not reverse the trends towards an aging population. Alberta’s forecast projects an increase in the average age to 41.6 years. At the same time, the population is expected to become more diverse and more concentrated in urban centres, especially along the Calgary-Edmonton corridor.
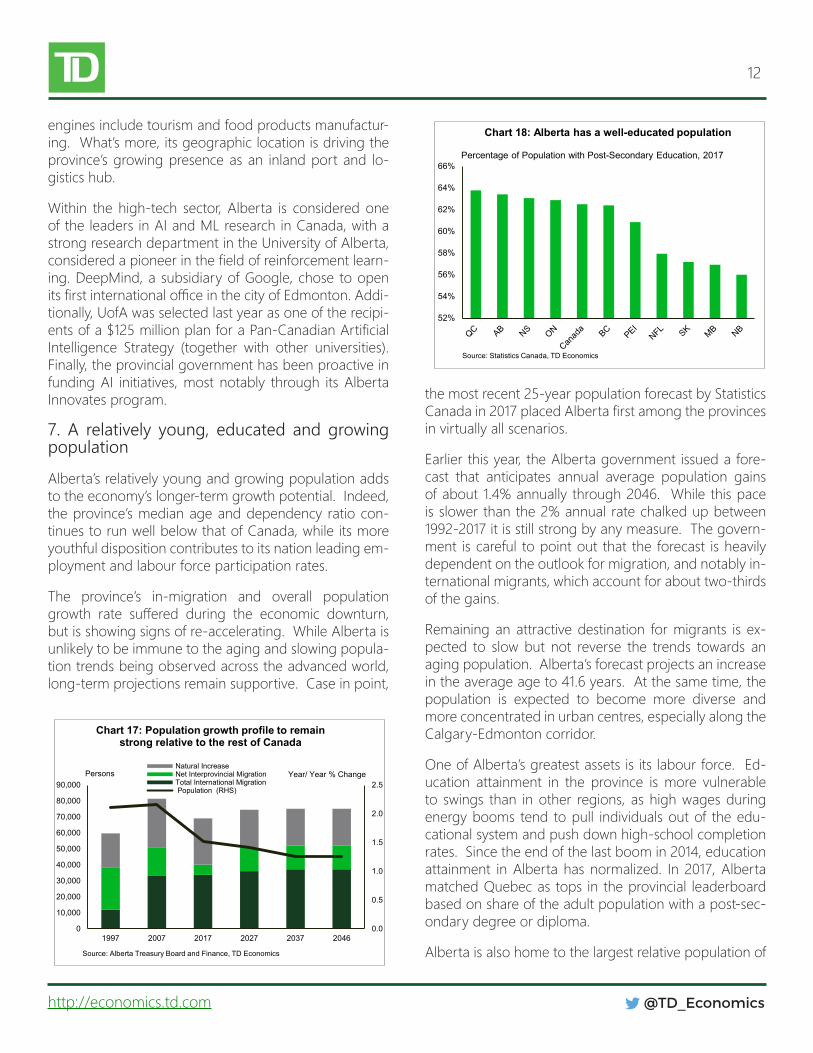
One of Alberta’s greatest assets is its labour force. Ed-ucation attainment in the province is more vulnerable to swings than in other regions, as high wages during energy booms tend to pull individuals out of the edu-cational system and push down high-school completion rates. Since the end of the last boom in 2014, education attainment in Alberta has normalized. In 2017, Alberta matched Quebec as tops in the provincial leaderboard based on share of the adult population with a post-sec-ondary degree or diploma.
Alberta is also home to the largest relative population of
0.0
0.5
1.0
1.5
2.0
2.5
0
10,000
20,000
30,000
40,000
50,000
60,000
70,000
80,000
90,000
1997 2007 2017 2027 2037 2046
Chart 17: Population growth profile to remain strong relative to the rest of Canada
Natural IncreaseNet Interprovincial MigrationTotal International Migration Population (RHS)
Source: Alberta Treasury Board and Finance, TD Economics
Persons Year/ Year % Change
52%
54%
56%
58%
60%
62%
64%
66%
Chart 18: Alberta has a well-educated population
Source: Statistics Canada, TD Economics
Percentage of Population with Post-Secondary Education, 2017
13
@TD_Economicshttp://economics.td.com
science and engineering graduates, many of whom cut their teeth in the oil and gas sector. While the slow re-covery in oil and gas employment has presented a chal-lenge for many of these individuals, their heavy math and science focus allows for transferability of their skill sets. For example, an oil and gas engineer can train to become a software engineer with only minimal ad-ditional formal education requirements.
Alberta’s high labour productivity ranking can be largely attributed to the large share of capital-intensive indus-tries, including oil and gas extraction and the petro-chemical manufacturing sectors. However, this produc-tivity outperformance extends to several non-energy sectors. For one, Alberta has the highest non-residential construction productivity and the second highest resi-dential construction productivity in the country.
8. Alberta still enjoys fiscal flexibility
A factor that has dampened some of the optimism with-in Alberta during the recovery is the abrupt negative swingintheprovince’sfiscalposition.Itwasn’tlongagothat the discussion was around how large the surplus would be and whether to spend or save the bounty from the rapidly-growing oil and gas sector. The province is nowrunningasizeablebudgetdeficitandtappingdebtmarkets for about $9 billion annually in net borrowing requirements.Moreover,topreventevenhigherdeficitsthe government has raised tax rates on corporations and higher-income individuals.
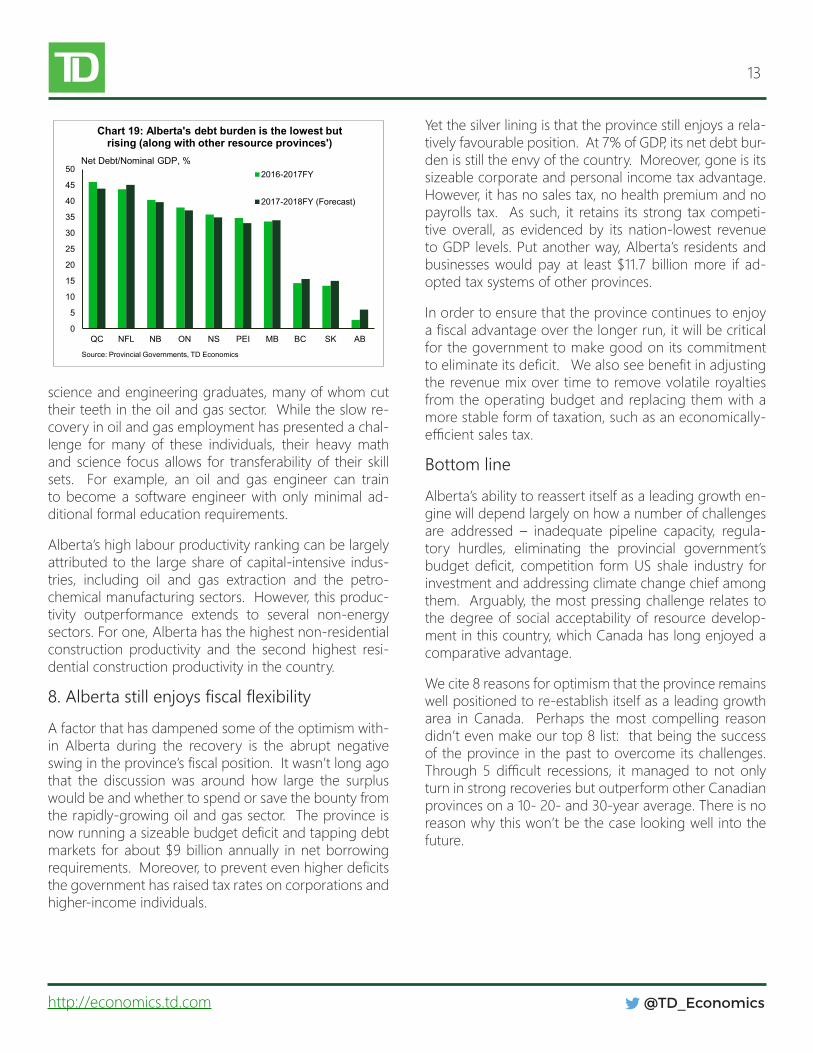
Yet the silver lining is that the province still enjoys a rela-tively favourable position. At 7% of GDP, its net debt bur-den is still the envy of the country. Moreover, gone is its sizeable corporate and personal income tax advantage. However, it has no sales tax, no health premium and no payrolls tax. As such, it retains its strong tax competi-tive overall, as evidenced by its nation-lowest revenue to GDP levels. Put another way, Alberta’s residents and businesses would pay at least $11.7 billion more if ad-opted tax systems of other provinces.
In order to ensure that the province continues to enjoy afiscaladvantageoverthelongerrun,itwillbecriticalfor the government to make good on its commitment toeliminateitsdeficit.Wealsoseebenefitinadjustingthe revenue mix over time to remove volatile royalties from the operating budget and replacing them with a more stable form of taxation, such as an economically-efficientsalestax.
Bottom line
Alberta’s ability to reassert itself as a leading growth en-gine will depend largely on how a number of challenges are addressed – inadequate pipeline capacity, regula-tory hurdles, eliminating the provincial government’s budgetdeficit, competition formUS shale industry forinvestment and addressing climate change chief among them. Arguably, the most pressing challenge relates to the degree of social acceptability of resource develop-ment in this country, which Canada has long enjoyed a comparative advantage.
We cite 8 reasons for optimism that the province remains well positioned to re-establish itself as a leading growth area in Canada. Perhaps the most compelling reason didn’t even make our top 8 list: that being the success of the province in the past to overcome its challenges. Through5difficult recessions, itmanaged to not onlyturn in strong recoveries but outperform other Canadian provinces on a 10- 20- and 30-year average. There is no reason why this won’t be the case looking well into the future.
0
5
10
15
20
25
30
35
40
45
50
QC NFL NB ON NS PEI MB BC SK AB
Chart 19: Alberta's debt burden is the lowest but rising (along with other resource provinces')
2016-2017FY
2017-2018FY (Forecast)
Source: Provincial Governments, TD Economics
Net Debt/Nominal GDP, %
14
@TD_Economicshttp://economics.td.com
1. https://www.ipsos.com/en-ca/news-polls/Kinder-Morgan-Trans-Mountain-Pipeline-Expansion-Poll-May-3-2018 2. http://www.iea.org/media/weowebsite/2017/Chap1_WEO2017.pdf3. https://www.iea.org/weo/4. https://www.ceri.ca/assets/files/Study_163_Full_Report.pdf5. https://www.ceri.ca/assets/files/Study_170_Full_Report.pdf6. https://www.ceri.ca/assets/files/Study_159_Full_Report.pdf7. https://www.ceri.ca/assets/files/Study_152_Full_Report.pdf8. Dahlby, Bev & Khanal, Mukesh. Alberta's Changing Industrial Structure: Implications for Output and Income Volatility. Univer-
sity of Calgary SPP Research Paper, Volume 11:3. January 2018. https://www.policyschool.ca/wp-content/uploads/2018/01/AB-Industrial-Structure-Dahlby-Khanal.pdf
9. Mansell, Robert&Tombe, Trevor. If itMatters,Measure it:UnpackingDiversification inCanada.University ofCalgary SPPResearch Paper, Volume 9:36. November 2016. https://www.policyschool.ca/wp-content/uploads/2016/02/Diversification-in-Canada-Tombe-Mansell.pdf
10. https://www.td.com/document/PDF/economics/special/LongtermGrowthPerspective.pdf
Endnotes
DisclaimerThis report is provided by TD Economics. It is for informational and educational purposes only as of the date of writing, and may not be appro-priate for other purposes. The views and opinions expressed may change at any time based on market or other conditions and may not come to pass. This material is not intended to be relied upon as investment advice or recommendations, does not constitute a solicitation to buy or sellsecuritiesandshouldnotbeconsideredspecificlegal,investmentortaxadvice.ThereportdoesnotprovidematerialinformationaboutthebusinessandaffairsofTDBankGroupandthemembersofTDEconomicsarenotspokespersonsforTDBankGroupwithrespecttoitsbusinessandaffairs.Theinformationcontainedinthisreporthasbeendrawnfromsourcesbelievedtobereliable,butisnotguaranteedtobeaccurateorcomplete.Thisreportcontainseconomicanalysisandviews,includingaboutfutureeconomicandfinancialmarketsperformance.Thesearebasedoncertainassumptionsandotherfactors,andaresubjecttoinherentrisksanduncertainties.Theactualoutcomemaybemateriallydiffer-ent.TheToronto-DominionBankanditsaffiliatesandrelatedentitiesthatcomprisetheTDBankGrouparenotliableforanyerrorsoromissionsintheinformation,analysisorviewscontainedinthisreport,orforanylossordamagesuffered.