Embed Size (px)
Citation preview

This is an electronic reprint of the original article.This reprint may differ from the original in pagination and typographic detail.
Powered by TCPDF (www.tcpdf.org)
This material is protected by copyright and other intellectual property rights, and duplication or sale of all or part of any of the repository collections is not permitted, except that material may be duplicated by you for your research use or educational purposes in electronic or print form. You must obtain permission for any other use. Electronic or print copies may not be offered, whether for sale or otherwise to anyone who is not an authorised user.
Khawaldeh, Saed; Pervaiz, Usama; Elsharnoby, Mohammed; Alchalabi, Alaa Eddin; Al-Zubi,NayelTaxonomic classification for living organisms using convolutional neural networks
Published in:Genes
DOI:10.3390/genes8110326
Published: 17/11/2017
Document VersionPublisher's PDF, also known as Version of record
Please cite the original version:Khawaldeh, S., Pervaiz, U., Elsharnoby, M., Alchalabi, A. E., & Al-Zubi, N. (2017). Taxonomic classification forliving organisms using convolutional neural networks. Genes, 8(11), [326].https://doi.org/10.3390/genes8110326

genesG C A T
T A C G
G C A T
Article
Taxonomic Classification for Living Organisms UsingConvolutional Neural Networks
Saed Khawaldeh 1,2,3,4,6,* ID , Usama Pervaiz 1,2,3, Mohammed Elsharnoby 4,Alaa Eddin Alchalabi 4 and Nayel Al-Zubi 5
1 Erasmus+ Joint Master Program in Medical Imaging and Applications, University of Burgundy, 21000 Dijon,France; [email protected]
2 Erasmus+ Joint Master Program in Medical Imaging and Applications, UNICLAM, 03043 Cassino FR, Italy3 Erasmus+ Joint Master Program in Medical Imaging and Applications, University of Girona,
17004 Girona, Spain4 Graduate School of Natural and Applied Sciences, Istanbul Sehir University, 34865 Kartal/Istanbul, Turkey;
[email protected] (M.E.); [email protected] (A.E.A.)5 Department of Computer Engineering, Al-Balqa’ Applied University, 19117 Al-Salt, Jordan;
[email protected] Department of Electrical Engineering and Automation, Aalto University, 02150 Espoo, Finland* Correspondence: [email protected]
Received: 11 September 2017; Accepted: 14 November 2017; Published: 17 November 2017
Abstract: Taxonomic classification has a wide-range of applications such as finding out moreabout evolutionary history. Compared to the estimated number of organisms that nature harbors,humanity does not have a thorough comprehension of to which specific classes they belong.The classification of living organisms can be done in many machine learning techniques. However,in this study, this is performed using convolutional neural networks. Moreover, a DNA encodingtechnique is incorporated in the algorithm to increase performance and avoid misclassifications.The algorithm proposed outperformed the state of the art algorithms in terms of accuracy andsensitivity, which illustrates a high potential for using it in many other applications in genome analysis.
Keywords: DNA; genes; taxonomic classification; convolutional neural networks; encoding
1. Introduction
Taxonomy is the biological area that recognizes, reports, classifies and names the discovered andundiscovered species and other taxa. Recently, species’ taxonomy became a difficult task, as it requiresfull integration of new theories, methods and data from all areas that study the origin, limits andevolution of species [1,2]. Classification is one of the data mining techniques that is used to categorizesamples into different classes based on supervised learning [3].
Taxonomic classification is a hierarchical system used to categorize organisms to the specieslevel, as is shown in Figure 1. The higher classifications are by domain and kingdom levels; however,the deepest and the most detailed classification is to genus and species levels. The hierarchical levelsin between include phylum, subphylum, class, family and order [4]. DNA classification can alterhumans’ understanding of the relationships between the different species, help understanding how theclassification changes over years and boost the understanding of how the entire kingdom of life systemworks [5]. Animal and plant classification was based only on morphological characteristics since thebeginning of living creatures’ classifications [6]. However, due to the development of DNA sequencingtechnology and the availability of high computational power—multicore central processing units(CPUs) and graphical processing units (GPUs)—required to process DNA sequences and interpretuseful information about them, a radical shift to DNA-based classification started taking place [7].
Genes 2017, 8, 326; doi:10.3390/genes8110326 www.mdpi.com/journal/genes

Genes 2017, 8, 326 2 of 11
Because of the shift to the DNA-based classification and analysis, various genome analysis toolswere developed by researchers for DNA, RNA and protein sequence analysis and processing. Some ofthese tools incorporated traditional machine learning techniques such as support vector machine(SVM), neural networks and k-nearest neighbor (KNN). In [8], the authors developed a Pythonpackage called “repDNA” to produce the features representing physicochemical properties andthe sequence-order effects of DNAs and nucleotides. Fifteen types of features built from DNAsequences can be calculated using the repDNA package. These computed features can be categorizedinto three different categories: nucleic acid composition, autocorrelation and pseudo-nucleotidecomposition. The repDNA internal algorithms were evaluated by generating many test DNA sequences,then the generated output was compared with the ground truths of these sequences to ensure having anerror-free implementation. The package incorporates several traditional machine learning algorithmsto be used with the generated features. In [9], the authors developed a web server called “repRNA”,which can produce eleven modes of feature vectors. It also enables users to choose any set of featuresout of 22 built-in physicochemical properties. Moreover, repRNA gives the option to visualize thegenerated feature vectors through a built-in visualizer incorporated in the web server. repRNA makesit easy for users to perform any in-depth genome analysis as it can easily incorporate machine learningalgorithms such as SVM and KNN, which were not capable of handling anything except vectors backthen. In [10], the authors developed a Python package called “Pse-Analysis”, which can automaticallyperform feature extraction and selection, parameter tuning, model training, cross-validation andevaluation for any biological sequences. The training in Pse-Analysis uses the SVM machine learningmodel; also, the package provides a powerful multi-core CPU implementation, which efficientlydecreases the running time compared to the one-core CPU implantation. In [11], the authors developeda web server called “Pse-in-One”, which can reproduce almost every possible feature vector based ona set of properties defined by the user for DNA, RNA and protein sequences. The web server providesan easy way to combine the vectors with different machine learning techniques such as SVM andneural networks. Pse-in-One, the first developed platform of its kind, includes 148, 22 and 547 built-inphysicochemical properties, which can be defined by users before generating the DNA, RNA andprotein sequences.
The ensemble learning approach is a common method used to acquire better performance throughusing multiple learning techniques. In [12], the authors multiply used three random forest classifiers asan ensemble classifier to find out the location of the DNase I Hypersensitive Site (DHS) in the humangenome, which gives critical information to determine the functionality of noncoding genomic regions.In [13], the authors were interested in studying the mechanism of meiotic recombination and genomeevolution; therefore, they developed a classifier through combining various modes of Pseudo K-tupleNucleotide Composition (PseKNC) and the mode of Dinucleotide-based Auto-Cross-Covariance(DACC) to ensemble a clustering technique. Both algorithms in [12,13] outperformed the state of the artalgorithms such as [14–17], respectively, which illustrates the strength of ensemble learning solutions.
Inspired by the success of applying some popular text classification methods to the barcode andDNA analysis domain such as the naive Bayes method in [18], probabilistic topic modelling in [19],character-based methods in [20] and its counterparts in Natural Language Processing (NLP) in [21,22],convolutional neural networks (CNNs) started to be considered as a model for DNA barcode analysis,which led to integrating them with several genome analysis tools and platforms. In [23], the authorswanted to provide an in-depth understanding of how to select the CNN architecture that matches thetask that they wanted to implement. Furthermore, they have performed a systematic exploration ofthe performance of different CNN architectures for the fundamental genomic task of characterizing thebinding affinity of transcription factors to the DNA sequence in 690 different ChIP-seq experiments.Results showed that for both tasks performed (motif discovery and motif occupancy), classificationperformance increases with increasing the number of convolution kernels. They observed as well thatthe use of local pooling or more convolutional layers has only a small, even sometimes a negative,effect on the performance.

Genes 2017, 8, 326 3 of 11
In [24], the authors introduced a new method to classify DNA sequences by considering themas text. They used the CNN technique to perfume the classification. The concept “one-hot vector”,which saves the position records of each nucleotide in DNA sequences, was used. By applying the samerepresentation technique of text, they obtained a two-dimensional numerical matrix, which containedinformation about the specific position of each nucleotide in the sequence. Then, this matrix was finallyused as input to the CNN model to perform the classification of the DNA sequences into differentclasses. To show the efficiency of their classification method, they selected the 10 datasets that wereused in [25], then they applied the proposed algorithm on them to compare the results obtained by theiralgorithm with the results obtained by other methods such as using n-mer features as the representationof sequences and SVM as the classifier. The lowest improvement they obtained was nearly 1% foraccuracy, and the highest improvement was over 6% for accuracy. These improvements were quitehigh in comparison with other approaches such as finding good representations for sequences orfeature selection that were applied before. Results showed that features extracted by CNNs were veryuseful for the classifier to classify sequences into their different classes. In [26], the authors investigatedhow good they can represent biological functions using only the examination of a raw sequence.To perform their experiment, they used a large corpus of labelled protein sequences, then they learntdense vector representations for amino acid sequences using the co-occurrence statistics of shortfragments. Afterwards, using vector representation, they experimented with several neural networkarchitectures to train the proposed classifiers for protein family identification. The proposed methodillustrated a good performance for multi-class prediction with 589 protein family classes. Their resultsshowed that neural network classifiers give better performance than the tuned SVM baseline on thesame UniProt dataset; particularly Gated Recurrent neural networks (GRU) outperformed their SVMbaseline by almost 7%. In comparison to the SVM in [27], which trained many single-class classifiers,the neural network (NN) architectures of the multi-class protein performed well relatively, even if beingmore complicated. In [28], the authors investigated the reliability of Frequency Chaos Game sequenceRepresentation (FCGR) for the classification of genomic sequences. They chose a CNN to solve theclassification problem, and the obtained results were very good, especially for the full-length sequences,which were recognized with a very high accuracy. In [29], the authors presented a new method for theprediction of protein disorders based on sequence information. Their approach used deep networksto make predictions. In a 10-fold cross-validation procedure on a dataset composed of 723 proteins,the method achieved an accuracy of 82% and an area under the receiver operating characteristic(ROC) curve of 90%. In [30], the authors used Bidirectional Long Short-Term Memory (BLSTM) tolook for powerful features from pseudo-proteins; moreover, they proposed the “ProDec-BLSTM”classifier, which contains an input layer, BLSTM, a time distributed layer and, finally, an outputlayer. This designed architecture could automatically extract features through using the BLSTMand the time distributed dense layer. The ProDec-BLSTM classifier outperformed methods reportedin [31–37] in terms of mean ROC and mean ROC50 scores, which were 96.9% and 84.9%, respectively.In [38], the authors proposed a classifier based on deep learning for the estimation of human proteinsubcellular localization. For the implementation of the proposed algorithm, the authors utilized GPUsand CUDA software (nVidia Corp., Santa Clara, CA, USA) to tune the designed network parametersand effectively train them. Moreover, it was reported that the used architecture could automaticallylearn the high-level features that represent the human proteins by going over the polynomial relationsbetween the sparse subcellular locations. The dataset used in their study contained 13,978 samplesbelonging to 10 different classes representing the subcellular locations. The algorithm acquired a totalaccuracy of 37.4% of correct predictions for the 10 classes, which means that it could correctly predict5226 samples out of the total number of samples available in the dataset.
In this work, we propose a convolutional neural network-based approach to classify DNAsequences of living organisms. The proposed methodology achieved the highest classification accuracycompared to the state of the art techniques presented in the literature. We propose an efficientsolution for the low performance encountered when analyzing the DNA data without involving

Genes 2017, 8, 326 4 of 11
any pre-processing step. The proposed solution includes encoding the DNA sequences to reducesimilarities between the different sequences that cause misclassification in the test set.
Problem Definition
Classifying each DNA sequence to which taxonomy (class, order, family, etc.) it belongs isthe problem this work addresses. Figure 1 presents the different levels in the taxonomy hierarchy.The modern human species is taken as an example to show the names of the different levels to whichmodern humans belong. DNA sequences are represented as a string that contains {’A’, ’C’, ’G’, ’T’, ’-’}characters. More specifically, this paper presents a deep learning-based approach to identify thetaxonomy based on DNA sequences collected from different species. CNN is the machine learningtechnique used to tackle the taxonomic classification problem in this work. The inputs of the CNNs arethe species’ DNA sequence fragments, while the output is the class label to which the DNA sequencefragment belongs.
Genes 2017, 8, 326 4 of 11
involving any pre-processing step. The proposed solution includes encoding the DNA sequences to reduce similarities between the different sequences that cause misclassification in the test set.
1.1. Problem Definition
Classifying each DNA sequence to which taxonomy (class, order, family, etc.) it belongs is the problem this work addresses. Figure 1 presents the different levels in the taxonomy hierarchy. The modern human species is taken as an example to show the names of the different levels to which modern humans belong. DNA sequences are represented as a string that contains {’A’, ’C’, ’G’, ’T’, ’-’} characters. More specifically, this paper presents a deep learning-based approach to identify the taxonomy based on DNA sequences collected from different species. CNN is the machine learning technique used to tackle the taxonomic classification problem in this work. The inputs of the CNNs are the species’ DNA sequence fragments, while the output is the class label to which the DNA sequence fragment belongs.
Figure 1. Taxonomy Hierarchy of Modern Human.
Figure 2 shows an example that illustrates the difference between the DNA sequences for Cytochrome C in three different species: human, chimpanzee and mouse, respectively.
Figure 2. Samples represent DNA sequences for Cytochrome C in human, chimpanzee and mouse.
Figure 1. Taxonomy Hierarchy of Modern Human.
Figure 2 shows an example that illustrates the difference between the DNA sequences forCytochrome C in three different species: human, chimpanzee and mouse, respectively.
Genes 2017, 8, 326 4 of 11
involving any pre-processing step. The proposed solution includes encoding the DNA sequences to reduce similarities between the different sequences that cause misclassification in the test set.
1.1. Problem Definition
Classifying each DNA sequence to which taxonomy (class, order, family, etc.) it belongs is the problem this work addresses. Figure 1 presents the different levels in the taxonomy hierarchy. The modern human species is taken as an example to show the names of the different levels to which modern humans belong. DNA sequences are represented as a string that contains {’A’, ’C’, ’G’, ’T’, ’-’} characters. More specifically, this paper presents a deep learning-based approach to identify the taxonomy based on DNA sequences collected from different species. CNN is the machine learning technique used to tackle the taxonomic classification problem in this work. The inputs of the CNNs are the species’ DNA sequence fragments, while the output is the class label to which the DNA sequence fragment belongs.
Figure 1. Taxonomy Hierarchy of Modern Human.
Figure 2 shows an example that illustrates the difference between the DNA sequences for Cytochrome C in three different species: human, chimpanzee and mouse, respectively.
Figure 2. Samples represent DNA sequences for Cytochrome C in human, chimpanzee and mouse.
Figure 2. Samples represent DNA sequences for Cytochrome C in human, chimpanzee and mouse.

Genes 2017, 8, 326 5 of 11
2. Materials and Methods
2.1. Methodology
Figure 3 shows a modified version of the CNNs model in [20] that was designed to understandtext using deep learning. In the understanding text problem, the inputs were quantized characters;however, for taxonomic classification, the inputs are DNA sequences, which only have five characters{’A’, ’C’, ’G’, ’T’, ’-’}. In the understanding text problem, the outputs were the abstract properties of thetext; however, for taxonomic classification, the output is the taxonomy label.
Genes 2017, 8, 326 5 of 11
2. Materials and Methods
2.1. Methodology
Figure 3 shows a modified version of the CNNs model in [20] that was designed to understand text using deep learning. In the understanding text problem, the inputs were quantized characters; however, for taxonomic classification, the inputs are DNA sequences, which only have five characters {’A’, ’C’, ’G’, ’T’, ’-’}. In the understanding text problem, the outputs were the abstract properties of the text; however, for taxonomic classification, the output is the taxonomy label.
Figure 3. Illustration of the convoluted neural network (CNN) model used.
The model’s main component is the temporal convolutional module, which computes the 1D convolution between the input g(x) and the kernel f(x) to generate the output h(y), as is shown in Equation (1); where c represents the offset constant. ℎ = × × − + (1)
The model uses the same spatial max-pooling module that is used in computer vision, as in [39]; however, it is in 1D in our case; where g(x) represents the input function and h(y) represents the max-pooling function. See Equation (2) below. ℎ = × − + (2)
2.2. Implementation and Experimentation
The Torch7 platform was used to implement the CNN model for this work. The reason for selecting Torch7 is because it provides the maximum possible flexibility and speed in building the scientific algorithms including the different machine learning techniques [40]. Crepe is the name of the code that was implemented using Torch7 for text classification from the character-level dataset using CNNs [41], and it has been used to produce the results in [20]. Crepe contains the following components:
1. Data preprocessing scripts that can be used to convert csv format to a Torch 7 binary format (t7b) that can be used by the training program directly: This component contains a tool called csv2t7b.lua; it is used to convert the datasets of csv format to t7b format, which can be fed to Crepe’s training component. This data preprocessing component contains two command-line parameters as shown in Table A1 in the Appendix A. The dataset t7b format can be loaded using the regular torch calls. The variable train has three members as shown in Table A2 in the Appendix A.
2. The training program is a code used to process the data representing the DNA sequences: Originally, this code processed text and classified it into different classes representing the topic to which the text belongs; however, for the DNA taxonomic classification, we modified it to process DNA sequences. The reason for pursuing a nearly similar approach for processing both
Figure 3. Illustration of the convoluted neural network (CNN) model used.
The model’s main component is the temporal convolutional module, which computes the 1Dconvolution between the input g(x) and the kernel f (x) to generate the output h(y), as is shown inEquation (1); where c represents the offset constant.
h(y) =k
∑x=1
f (x)× g(y × d − x + c) (1)
The model uses the same spatial max-pooling module that is used in computer vision, as in [39];however, it is in 1D in our case; where g(x) represents the input function and h(y) represents themax-pooling function. See Equation (2) below.
h(y) = maxkx=1 g(y × d − x + c) (2)
2.2. Implementation and Experimentation
The Torch7 platform was used to implement the CNN model for this work. The reason forselecting Torch7 is because it provides the maximum possible flexibility and speed in building thescientific algorithms including the different machine learning techniques [40]. Crepe is the name ofthe code that was implemented using Torch7 for text classification from the character-level datasetusing CNNs [41], and it has been used to produce the results in [20]. Crepe contains the followingcomponents:
1. Data preprocessing scripts that can be used to convert csv format to a Torch 7 binary format(t7b) that can be used by the training program directly: This component contains a tool calledcsv2t7b.lua; it is used to convert the datasets of csv format to t7b format, which can be fed toCrepe’s training component. This data preprocessing component contains two command-lineparameters as shown in Table A1 in the Appendix A. The dataset t7b format can be loadedusing the regular torch calls. The variable train has three members as shown in Table A2 in theAppendix A.

Genes 2017, 8, 326 6 of 11
2. The training program is a code used to process the data representing the DNA sequences:Originally, this code processed text and classified it into different classes representing the topic towhich the text belongs; however, for the DNA taxonomic classification, we modified it to processDNA sequences. The reason for pursuing a nearly similar approach for processing both text andDNA data is that the two types of data are highly similar. The training subsets are fed first tothe training component program in Crepe to train the classifier. Then, the model accuracy isevaluated on the remaining subsets, which were spared for testing. Table A3 shows the differenttraining programs in Crepe.
The data used in this project were obtained from the Barcode of Life Data Systems (BOLD) WebServices, which provides the ability to download specimen, sequence, and trace data from the PublicData Portal [42]. Nine orders have been selected and downloaded from the BOLD Web Serviceswebsite. Order names were replaced with number labels for simplicity. Table 1 below shows the nineclasses available in the dataset that we used in our experiments.
Table 1. Labels used for different classes in the dataset.
Order Name Label
Chaetothyriomycetes 1Diptera 2
Echinoida 3Forcipulatida 4Lepidoptera 5Onygenales 6
Pezizomycetes 7Scleractinia 8Valvatida 9
This dataset obtained from BOLD Web Services was merged, then transformed from fas format(the original format of the data) to csv format (the format that we feed to our model), then it wasdivided into two subsets:
1. Training subset: including approximately 78.72% of the original dataset.2. Test subset: including approximately 21.28% of the original dataset (11.45% was used for
cross-validation and 9.83% for testing).
The two subsets were transformed from csv format to t7b format using the Crepe dataprocessing script described above. In the total dataset formed, 31,068 DNA sequences were available;each sequence has its corresponding class label provided by the BOLD website. In the training subset,we had 24,455 samples, while we had 6613 samples in the test subset (3558 samples for cross-validationand 3055 samples for testing). The samples in each data division were randomly selected from themain dataset, which contained the 31,068 DNA sequences.
Two types of experiments were performed after preparing the different data subsets asexplained earlier.
• Experiment 1: feeding the DNA sequences to our CNN model without making any changes tothem. Each DNA sequence is represented by a string, containing {’A’, ’C’, ’G’, ’T’, ’-’} charactersand a label that shows to which class this DNA sequence belongs.
• Experiment 2: Encoding the DNA sequences by creating unique labels. Each unique labelrepresents three characters in the original DNA sequence. A dictionary was generated to guideencoding the DNA sequences. The purpose of this encoding process is to ensure having a datasetsimilar in complexity and variety to the one used in the text classification problem.
Applying encoding is expected to help the CNN model perform better as more differences areintroduced between the various DNA sequences in the dataset. Figure 4 below shows the beginning of

Genes 2017, 8, 326 7 of 11
a randomly-selected sample from an encoded DNA sequence that belongs to the “Valvatida” class.More details about the “3-1” encoding used in this project are available in the Supplementary Materials.Genes 2017, 8, 326 7 of 11
ppvhu7362jqolo2poo6arqvj53eu2wzjppovzdxmd4r5pedmruq624hm . . . .
Figure 4. Encoded DNA sample from Class 9.
3. Results and Discussion
In Experiment 1, our CNN model did not learn well; thus, the accuracy obtained on the test subsets was very low (around 40%). The reason for this poor performance is that the model was originally designed for the text classification problem, so the input was expected to be a set of characters that includes letters, number, and special characters. As for our dataset on which we ran our CNN model, each sample had only {’A’, ’C’, ’G’, ’T’, ’-’} characters, so the CNN model did not find many differences between the different DNA samples belonging to different classes. This led to many misclassifications, causing a very poor performance.
In Experiment 2, the “3-1” encoding was performed on our dataset. Then, we trained the CNN model on the new encoded training subset and validated and tested it on the encoded test subset. The data division for both experiments was identical to what was explained previously. However, this time, the results obtained showed a significant improvement (accuracy refers to the closeness of a measured value to a standard or known value; also, it is defined as the number of true predictions divided by the total number of predictions; in our case, the overall accuracy was 99.574%). The recall (or sensitivity) is defined as the fraction of relevant samples that have been retrieved over all relevant ones; while the precision is defined as the fraction of relevant samples among the retrieved ones. In our case, the average recall and precision for all the classes were 99.24% and 99.30%, respectively. All the values of the performance measures were calculated using [43] based on the confusion matrix shown in Figure 5 below. For more details about the performance measures, see Figure A1 in the Appendix A.
Figure 5. Confusion Matrix
The results above show a very high potential for using our approach, which incorporates CNN model and DNA encoding, for the various applications in the DNA classification domain. The high values of accuracy, recall and precision that our approach reported outperform the state of the art approaches reported in the literature. For instance, in [38], the authors used deep learning for human protein subcellular localization; however, they did not perform encoding, and they obtained an overall accuracy of 37% for the 10-class problem, which they have addressed in their work. In addition, the authors in [30] did not use accuracy as a performance measure to evaluate the performance of BLSTM; nevertheless, they reported mean ROC and ROC50 values of 96.9% and 84.9%, respectively, which is still considered lower than the archived performance measures in our proposal. Several other papers in the literature addressed also genome analysis, such as [8–11]; nevertheless, none of them incorporated deep learning nor DNA encoding, but instead, they incorporated traditional machine learning techniques such as k-means, SVM and traditional neural networks. Additionally, they were primarily for DNA, RNA and protein feature vector generation and processing, unlike our proposal, which integrates deep learning and encoding for DNA sequence classification. Even though the ensemble learning approach in [12,13] outperformed some of the state
Figure 4. Encoded DNA sample from Class 9.
3. Results and Discussion
In Experiment 1, our CNN model did not learn well; thus, the accuracy obtained on the test subsetswas very low (around 40%). The reason for this poor performance is that the model was originallydesigned for the text classification problem, so the input was expected to be a set of characters thatincludes letters, number, and special characters. As for our dataset on which we ran our CNN model,each sample had only {’A’, ’C’, ’G’, ’T’, ’-’} characters, so the CNN model did not find many differencesbetween the different DNA samples belonging to different classes. This led to many misclassifications,causing a very poor performance.
In Experiment 2, the “3-1” encoding was performed on our dataset. Then, we trained the CNNmodel on the new encoded training subset and validated and tested it on the encoded test subset.The data division for both experiments was identical to what was explained previously. However,this time, the results obtained showed a significant improvement (accuracy refers to the closeness ofa measured value to a standard or known value; also, it is defined as the number of true predictionsdivided by the total number of predictions; in our case, the overall accuracy was 99.574%). The recall(or sensitivity) is defined as the fraction of relevant samples that have been retrieved over all relevantones; while the precision is defined as the fraction of relevant samples among the retrieved ones. In ourcase, the average recall and precision for all the classes were 99.24% and 99.30%, respectively. All thevalues of the performance measures were calculated using [43] based on the confusion matrix shownin Figure 5 below. For more details about the performance measures, see Figure A1 in the Appendix A.
Genes 2017, 8, 326 7 of 11
ppvhu7362jqolo2poo6arqvj53eu2wzjppovzdxmd4r5pedmruq624hm . . . .
Figure 4. Encoded DNA sample from Class 9.
3. Results and Discussion
In Experiment 1, our CNN model did not learn well; thus, the accuracy obtained on the test subsets was very low (around 40%). The reason for this poor performance is that the model was originally designed for the text classification problem, so the input was expected to be a set of characters that includes letters, number, and special characters. As for our dataset on which we ran our CNN model, each sample had only {’A’, ’C’, ’G’, ’T’, ’-’} characters, so the CNN model did not find many differences between the different DNA samples belonging to different classes. This led to many misclassifications, causing a very poor performance.
In Experiment 2, the “3-1” encoding was performed on our dataset. Then, we trained the CNN model on the new encoded training subset and validated and tested it on the encoded test subset. The data division for both experiments was identical to what was explained previously. However, this time, the results obtained showed a significant improvement (accuracy refers to the closeness of a measured value to a standard or known value; also, it is defined as the number of true predictions divided by the total number of predictions; in our case, the overall accuracy was 99.574%). The recall (or sensitivity) is defined as the fraction of relevant samples that have been retrieved over all relevant ones; while the precision is defined as the fraction of relevant samples among the retrieved ones. In our case, the average recall and precision for all the classes were 99.24% and 99.30%, respectively. All the values of the performance measures were calculated using [43] based on the confusion matrix shown in Figure 5 below. For more details about the performance measures, see Figure A1 in the Appendix A.
Figure 5. Confusion Matrix
The results above show a very high potential for using our approach, which incorporates CNN model and DNA encoding, for the various applications in the DNA classification domain. The high values of accuracy, recall and precision that our approach reported outperform the state of the art approaches reported in the literature. For instance, in [38], the authors used deep learning for human protein subcellular localization; however, they did not perform encoding, and they obtained an overall accuracy of 37% for the 10-class problem, which they have addressed in their work. In addition, the authors in [30] did not use accuracy as a performance measure to evaluate the performance of BLSTM; nevertheless, they reported mean ROC and ROC50 values of 96.9% and 84.9%, respectively, which is still considered lower than the archived performance measures in our proposal. Several other papers in the literature addressed also genome analysis, such as [8–11]; nevertheless, none of them incorporated deep learning nor DNA encoding, but instead, they incorporated traditional machine learning techniques such as k-means, SVM and traditional neural networks. Additionally, they were primarily for DNA, RNA and protein feature vector generation and processing, unlike our proposal, which integrates deep learning and encoding for DNA sequence classification. Even though the ensemble learning approach in [12,13] outperformed some of the state
Figure 5. Confusion Matrix.
The results above show a very high potential for using our approach, which incorporates CNNmodel and DNA encoding, for the various applications in the DNA classification domain. The highvalues of accuracy, recall and precision that our approach reported outperform the state of the artapproaches reported in the literature. For instance, in [38], the authors used deep learning for humanprotein subcellular localization; however, they did not perform encoding, and they obtained an overallaccuracy of 37% for the 10-class problem, which they have addressed in their work. In addition,the authors in [30] did not use accuracy as a performance measure to evaluate the performance ofBLSTM; nevertheless, they reported mean ROC and ROC50 values of 96.9% and 84.9%, respectively,which is still considered lower than the archived performance measures in our proposal. Several otherpapers in the literature addressed also genome analysis, such as [8–11]; nevertheless, none of themincorporated deep learning nor DNA encoding, but instead, they incorporated traditional machine
Genes 2017, 8, 326 8 of 11
learning techniques such as k-means, SVM and traditional neural networks. Additionally, they wereprimarily for DNA, RNA and protein feature vector generation and processing, unlike our proposal,which integrates deep learning and encoding for DNA sequence classification. Even though theensemble learning approach in [12,13] outperformed some of the state of the art algorithms by obtainingan overall accuracy of 86.14% and 82.65%, respectively, still, our algorithm has a higher accuracythan them.
4. Conclusions
To the best of our knowledge, this study is the first one utilizing the CNN model designed fortext classification for taxonomic classification of living organisms. The DNA sequences were firstencoded, then fed to the modified CNNs for training, then testing. The results obtained show a highpotential in pursuing this approach to solve more complicated problems like classification of DNAsequences to deeper levels in taxonomy hierarchy. Performing more experiments while followinga similar procedure to the one presented in this work, increasing the number of samples and classes inthe dataset and changing the taxonomy level up/down surely will further help with obtaining a morecomprehensive conclusion about the efficiency of the approach in tackling more complicated genomicanalysis problems.
Additionally, our proposed algorithm can be considered to capture local conservation andsequence-order information from Position-Specific Scoring Matrices (PSSMs) [44], as the performance ofthe current state of the art machine learning techniques that address this problem is still unsatisfactory.Furthermore, it can be used to predict the protein methylation sites accurately, which is critical forfinding out more about the molecular mechanisms undergoing methylation. Our algorithm willpotentially help increase the prediction accuracy, as all other machine learning algorithms, such as [45],cannot completely avoid the accuracy limitation, which is reported in many state of the art algorithmsin the literature. Finally, our algorithm can be considered also for finding the location of DHS inthe human genome or studying the mechanism of meiotic recombination and genome evolution,which were addressed in [12,13].
Supplementary Materials: The following are available online at www.mdpi.com/2073-4425/8/11/326/s1.Supplemental file 1: Python scripts that developed to encode the DNA sequences as reported in the paper.DNAtoCharsMappers.pyc and encoder_3_1.pkl.
Acknowledgments: This paper is an extended work to a semester project for the Machine Learning course atIstanbul Sehir University. The authors thank Professor Ali Cakmak and Professor Mehmet Serkan Apaydin fortheir guidance and support. In addition, the authors thank Mohamedi Vetel and Gihad N. Sohsah for their help inprogramming. Furthermore, correspondence author thanks a lot F.Ö. for the help in editing and writing partsof the paper. Finally, the authors thank Tajwar Aleef, Vu Minh and Yeman Hagos for the discussion regardingamending the paper.
Author Contributions: S.K. designed and supervised the study. S.K., U.P., M.E. and A.E.A. collected and preparedthe dataset. S.K. and M.E. programmed the model. S.K., U.P. and M.E. performed the experiments. S.K., U.P.,M.E., A.E.A. and N.A. analyzed the results. S.K. wrote the manuscript. S.K., U.P. and N.A. revised the manuscript.All authors read and approved the final manuscript.
Conflicts of Interest: The authors declare no conflict of interest.
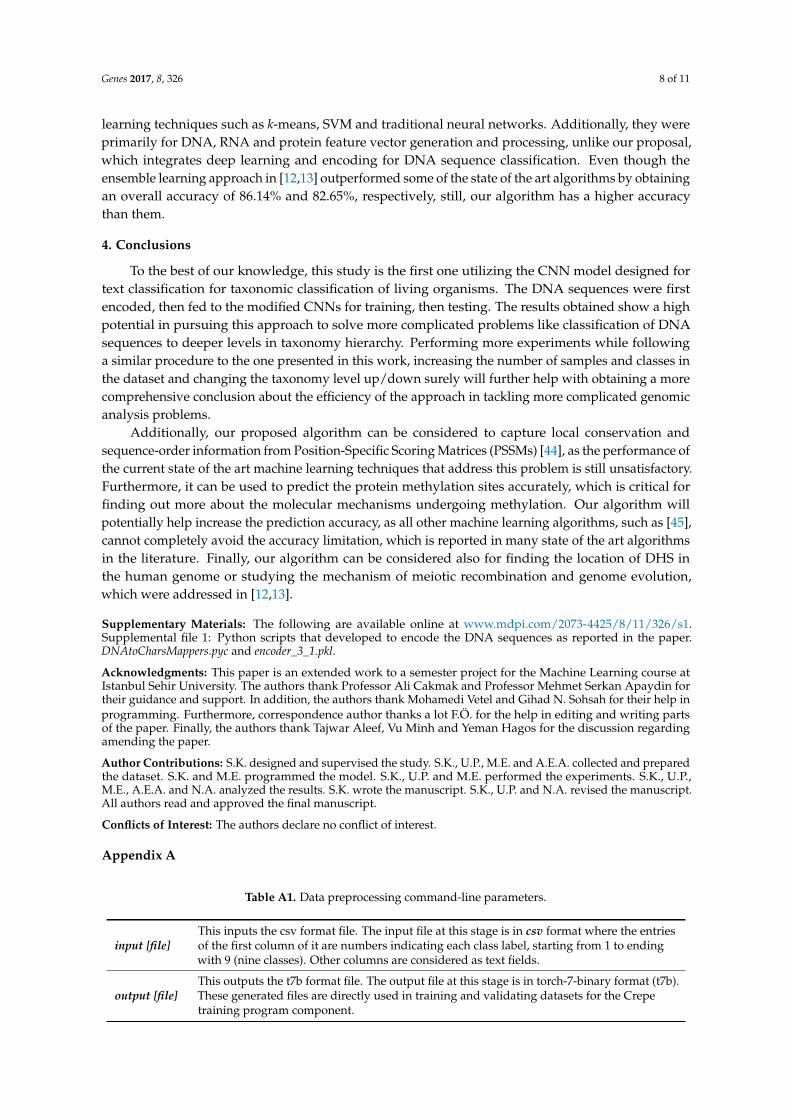
Appendix A
Table A1. Data preprocessing command-line parameters.
input [file]This inputs the csv format file. The input file at this stage is in csv format where the entriesof the first column of it are numbers indicating each class label, starting from 1 to endingwith 9 (nine classes). Other columns are considered as text fields.
output [file]This outputs the t7b format file. The output file at this stage is in torch-7-binary format (t7b).These generated files are directly used in training and validating datasets for the Crepetraining program component.

Genes 2017, 8, 326 9 of 11
Table A2. Members of the variable train.
train.content A torch.ByteTensor that stores concatenated string data. Each string is ended with NULL (0).
train.index A lua table for which train.index[i] is a 2D torch.LongTensor. The train.index[i][j][k]indicates the offset in train.content for the string in class i, j-th sample and k-th field.
train.lengthA lua table for which train.length[i] is a 2D torch.LongTensor. The train.length[i][j][k]indicates the length for the string in class i, j-th sample and k-th field. The length does notcount the ending NULL.
Table A3. Training programs for Crepe.
config.lua A unified file for all configurations for the dataset, model, trainer, tester and GUI
data.lua Provides a Data class; both training and validating datasets are instances of this class
main.lua The main driver program
model.lua Provides a Model class; it handles model creation, randomization and transformationsduring training
mui.lua Provides a Mui class; uses the Scroll class to draw an nn.Sequential model in Qt
scroll.lua Provides a Scroll class that starts a scrollable Qt window to draw text or images
scroll.ui A Qt designer UI file corresponding to the scrollable Qt window
test.lua Provides a Test class; handles testing, giving you losses, errors and confusion matrices
train.lua Provides a Train class; handles training with Stochastic Gradient Descent (SGD) andsupports things like momentum and weight decay
Genes 2017, 8, 326 9 of 11
Table A2. Members of the variable train.
train.content A torch.ByteTensor that stores concatenated string data. Each string is ended with NULL (0).
train.index A lua table for which train.index[i] is a 2D torch.LongTensor. The train.index[i][j][k] indicates the offset in train.content for the string in class i, j-th sample and k-th field.
train.length A lua table for which train.length[i] is a 2D torch.LongTensor. The train.length[i][j][k] indicates the length for the string in class i, j-th sample and k-th field. The length does not count the ending NULL.
Table A3. Training programs for Crepe.
config.lua A unified file for all configurations for the dataset, model, trainer, tester and GUI data.lua Provides a Data class; both training and validating datasets are instances of this class main.lua The main driver program model.lua Provides a Model class; it handles model creation, randomization and transformations during training mui.lua Provides a Mui class; uses the Scroll class to draw an nn.Sequential model in Qt scroll.lua Provides a Scroll class that starts a scrollable Qt window to draw text or images scroll.ui A Qt designer UI file corresponding to the scrollable Qt window test.lua Provides a Test class; handles testing, giving you losses, errors and confusion matrices
train.lua Provides a Train class; handles training with Stochastic Gradient Descent (SGD) and supports things like momentum and weight decay
Figure A1. Confusion matrix, precision, and recall values for all classes.
References
1. Zhang, Z.-Q. Contributing to the progress of descriptive taxonomy. Zootaxa 2008, 1968, 65–68. 2. Padial, J.M.; Miralles, A.; De la Riva, I.; Vences, M. The integrative future of taxonomy. Front. Zool. 2010, 7,
16, doi:10.1186/1742-9994-7-16. 3. Fernando, S.G.S.; Perera, S.N. Empirical Analysis of Data Mining Techniques for Social Network Websites.
Compusoft 2014, 3, 582. 4. Huston, M.A. Biological Diversity: The Coexistence of Species; Cambridge University Press: Cambridge, UK,
1994. 5. Goodman, M.; Porter, C.A.; Czelusniak, J.; Page, S.L.; Schneider, H.; Shoshani, J.; Groves, C.P. Toward a
phylogenetic classification of primates based on DNA evidence complemented by fossil evidence. Mol. Phylogenet. Evol. 1998, 9, 585–598.
6. Chen, B.; Zhong, D.; Monteiro, A. Comparative genomics and evolution of the HSP90 family of genes across all kingdoms of organisms. BMC Genom. 2006, 7, 156, doi:10.1186/1471-2164-7-156.
7. Hebert, P.D.; Gregory, T.R. The promise of DNA barcoding for taxonomy. Systematic Biology 2005, 54, 852–859.
8. Liu, B.; Liu, F.; Fang, L.; Wang, X.; Chou, K.C. repDNA: A Python package to generate various modes of feature vectors for DNA sequences by incorporating user-defined physicochemical properties and sequence-order effects. Bioinformatics 2014, 31, 1307–1309.
Figure A1. Confusion matrix, precision, and recall values for all classes.
References
1. Zhang, Z.-Q. Contributing to the progress of descriptive taxonomy. Zootaxa 2008, 1968, 65–68.2. Padial, J.M.; Miralles, A.; De la Riva, I.; Vences, M. The integrative future of taxonomy. Front. Zool. 2010,
7, 16. [CrossRef] [PubMed]3. Fernando, S.G.S.; Perera, S.N. Empirical Analysis of Data Mining Techniques for Social Network Websites.
Compusoft 2014, 3, 582.4. Huston, M.A. Biological Diversity: The Coexistence of Species; Cambridge University Press: Cambridge,
UK, 1994.

Genes 2017, 8, 326 10 of 11
5. Goodman, M.; Porter, C.A.; Czelusniak, J.; Page, S.L.; Schneider, H.; Shoshani, J.; Groves, C.P. Towarda phylogenetic classification of primates based on DNA evidence complemented by fossil evidence.Mol. Phylogenet. Evol. 1998, 9, 585–598. [CrossRef] [PubMed]
6. Chen, B.; Zhong, D.; Monteiro, A. Comparative genomics and evolution of the HSP90 family of genes acrossall kingdoms of organisms. BMC Genom. 2006, 7, 156. [CrossRef]
7. Hebert, P.D.; Gregory, T.R. The promise of DNA barcoding for taxonomy. Systematic Biology 2005, 54, 852–859.[CrossRef] [PubMed]
8. Liu, B.; Liu, F.; Fang, L.; Wang, X.; Chou, K.C. repDNA: A Python package to generate various modesof feature vectors for DNA sequences by incorporating user-defined physicochemical properties andsequence-order effects. Bioinformatics 2014, 31, 1307–1309. [CrossRef] [PubMed]
9. Liu, B.; Liu, F.; Fang, L.; Wang, X.; Chou, K.C. repRNA: A web server for generating various feature vectorsof RNA sequences. Mol. Genet. Genom. 2016, 291, 473–481. [CrossRef] [PubMed]
10. Liu, B.; Wu, H.; Zhang, D.; Wang, X.; Chou, K.C. Pse-Analysis: A python package for DNA/RNA andprotein/peptide sequence analysis based on pseudo components and kernel methods. Oncotarget 2017,8, 13338. [CrossRef] [PubMed]
11. Liu, B.; Liu, F.; Wang, X.; Chen, J.; Fang, L.; Chou, K.C. Pse-in-One: A web server for generating variousmodes of pseudo components of DNA, RNA, and protein sequences. Nucleic Acids Res. 2015, 43, W65–W71.[CrossRef] [PubMed]
12. Liu, B.; Long, R.; Chou, K.C. iDHS-EL: Identifying DNase I hypersensitive sites by fusing three differentmodes of pseudo nucleotide composition into an ensemble learning framework. Bioinformatics 2016, 32,2411–2418. [CrossRef] [PubMed]
13. Liu, B.; Wang, S.; Long, R.; Chou, K.C. iRSpot-EL: Identify recombination spots with an ensemble learningapproach. Bioinformatics 2016, 33, 35–41. [CrossRef] [PubMed]
14. Noble, W.S.; Kuehn, S.; Thurman, R.; Yu, M.; Stamatoyannopoulos, J. Predicting the in vivo signature ofhuman gene regulatory sequences. Bioinformatics 2005, 21, i338–i343. [CrossRef] [PubMed]
15. Feng, P.; Jiang, N.; Liu, N. Prediction of DNase I Hypersensitive sites by using pseudo nucleotidecompositions. Sci. World J. 2014, 2014, 740506. [CrossRef] [PubMed]
16. Qiu, W.R.; Xiao, X.; Chou, K.C. iRSpot-TNCPseAAC: Identify recombination spots with trinucleotidecomposition and pseudo amino acid components. Int. J. Mol. Sci. 2014, 15, 1746–1766. [CrossRef] [PubMed]
17. Chen, W.; Feng, P.M.; Lin, H.; Chou, K.C. iRSpot-PseDNC: Identify recombination spots with pseudodinucleotide composition. Nucleic Acids Res. 2013, 41, e68. [CrossRef] [PubMed]
18. Weitschek, E.; Fiscon, G.; Felici, G. Supervised DNA Barcodes species classification: Analysis, comparisonsand results. BioData Min. 2014, 7, 4. [CrossRef] [PubMed]
19. La Rosa, M.; Fiannaca, A.; Rizzo, R.; Urso, A. Probabilistic topic modeling for the analysis and classificationof genomic sequences. BMC Bioinform. 2015, 16 (Suppl. 6), S2. [CrossRef] [PubMed]
20. Bertolazzi, P.; Felici, G.; Weitschek, E. Learning to classify species with barcodes. BMC Bioinform. 2009,10 (Suppl. 14), S7. [CrossRef] [PubMed]
21. Zhang, X.; Zhao, J.; LeCun, Y. Character-level convolutional networks for text classification. In Advances inNeural Information Processing Systems; MIT Press: Cambridge, UK, 2015.
22. Zhang, X.; LeCun, Y. Text Understanding from Scratch. arXiv 2015, arXiv:1502.01710.23. Zeng, H.; Edwards, M.D.; Liu, G.; Gifford, D.K. Convolutional neural network architectures for predicting
DNA–protein binding. Bioinformatics 2016, 32, i121–i127. [CrossRef] [PubMed]24. Nguyen, N.G.; Tran, V.A.; Ngo, D.L.; Phan, D.; Lumbanraja, F.R.; Faisal, M.R.; Satou, K. DNA sequence
classification by convolutional neural network. J. Biomed. Sci. Eng. 2016, 9, 280–286. [CrossRef]25. Higashihara, M.; Rebolledo-Mendez, J.D.; Yamada, Y.; Satou, K. application of a feature selection method to
nucleosome data: accuracy improvement and comparison with other methods. WSEAS Trans. Biol. Biomed.2008, 5, 153–162.
26. Lee, T.K.; Nguyen, T. Protein Family Classification with Neural Networks. Stanford University. 2016.Available online: https://cs224d.stanford.edu/reports/LeeNguyen.pdf (accessed on 10 August 2017).
27. Asgari, E.; Mofrad, M.R. Continuous distributed representation of biological sequences for deep proteomicsand genomics. PLoS ONE 2015, 10, e0141287. [CrossRef] [PubMed]

Genes 2017, 8, 326 11 of 11
28. Rizzo, R.; Fiannaca, A.; La Rosa, M.; Urso, A. Classification experiments of DNA sequences by using a deepneural network and chaos game representation. In Proceedings of the 17th International Conference onComputer Systems and Technologies 2016, Palermo, Italy, 23–24 June 2016; ACM: New York, NY, USA, 2016.
29. Eickholt, J.; Cheng, J. DNdisorder: Predicting protein disorder using boosting and deep networks.BMC Bioinform. 2013, 14, 88. [CrossRef] [PubMed]
30. Li, S.; Chen, J.; Liu, B. Protein remote homology detection based on bidirectional long short-term memory.BMC Bioinform. 2017, 18, 443. [CrossRef] [PubMed]
31. Leslie, C.S.; Eskin, E.; Cohen, A.; Weston, J.; Noble, W.S. Mismatch string kernels for discriminative proteinclassification. Bioinformatics 2004, 20, 467–476. [CrossRef] [PubMed]
32. Håndstad, T.; Hestnes, A.J.; Sætrom, P. Motif kernel generated by genetic programming improves remotehomology and fold detection. BMC Bioinform. 2007, 8, 23. [CrossRef] [PubMed]
33. Saigo, H.; Vert, J.P.; Ueda, N.; Akutsu, T. Protein homology detection using string alignment kernels.Bioinformatics 2004, 20, 1682–1689. [CrossRef] [PubMed]
34. Zou, Q.; Hu, Q.; Guo, M.; Wang, G. HAlign: Fast Multiple Similar DNA/RNA Sequence Alignment Based onthe Centre Star Strategy. Bioinformatics 2015, 31, 2475–2481. [CrossRef] [PubMed]
35. Liao, L.; Noble, W.S. Combining pairwise sequence similarity and support vector machines for detectingremote protein evolutionary and structural relationships. J. Comput. Biol. 2003, 10, 857–868. [CrossRef][PubMed]
36. Hochreiter, S.; Heusel, M.; Obermayer, K. Fast model-based protein homology detection without alignment.Bioinformatics 2007, 23, 1728–1736. [CrossRef] [PubMed]
37. Ben-Hur, A.; Brutlag, D. Remote homology detection: A motif based approach. Bioinformatics 2003, 19 (Suppl. 1),i26–i33. [CrossRef] [PubMed]
38. Wei, L.; Ding, Y.; Su, R.; Tang, J.; Zou, Q. Prediction of human protein subcellular localization using deeplearning. J. Parallel Distrib. Comput. 2017, in press. [CrossRef]
39. Boureau, Y.L.; Bach, F.; LeCun, Y.; Ponce, J. Learning mid-level features for recognition. In Proceedings ofthe 2010 IEEE Conference on Computer Vision and Pattern Recognition (CVPR), San Francisco, CA, USA,13–18 June 2010; IEEE: Piscataway, NJ, USA, 2010; pp. 2559–2566.
40. Torch | Scientific Computing for LuaJIT. Available online: http://torch.ch/ (accessed on 6 December 2016).41. GitHub-zhangxiangxiao/Crepe: Character-Level Convolutional Networks for Text Classification.
Available online: https://github.com/zhangxiangxiao/Crepe (accessed on 24 November 2016).42. BOLD Systems v3. Available online: http://www.boldsystems.org/ (accessed on 10 December 2016).43. Landis, J.R.; Koch, G.G. The measurement of observer agreement for categorical data. Biometrics 1977, 33,
159–174. [CrossRef] [PubMed]44. Wei, L.; Tang, J.; Zou, Q. Local-DPP: An improved DNA-binding protein prediction method by exploringg
local evolutionary information. Inf. Sci. 2017, 384, 135–144. [CrossRef]45. Wei, L.; Xing, P.; Shi, G.; Ji, Z.L.; Zou, Q. Fast prediction of protein methylation sites using a sequence-based
feature selection technique. IEEE/ACM Trans. Comput. Biol. Bioinform. 2017. [CrossRef] [PubMed]
© 2017 by the authors. Licensee MDPI, Basel, Switzerland. This article is an open accessarticle distributed under the terms and conditions of the Creative Commons Attribution(CC BY) license (http://creativecommons.org/licenses/by/4.0/).


![Untitled-1 [] · taxonomic characters. Zoological Nomenclature, origin of code, ICZN. UNIT V : Taxonomic Records And Publications Taxonomic keys, Taxonomic characters description,](https://img.dokumen.tips/doc/110x75/5e60819b810ee55ab507dd7d/untitled-1-taxonomic-characters-zoological-nomenclature-origin-of-code-iczn.jpg)