Embed Size (px)
Citation preview
8/2/2019 Tax Avoidance and Geographic Earnings Disclosure
http://slidepdf.com/reader/full/tax-avoidance-and-geographic-earnings-disclosure 1/49Electronic copy available at: http://ssrn.com/abstract=2021157
Tax Avoidance and Geographic Earnings Disclosure
Ole-Kristian HopeRotman School of Management
University of [email protected]
Mark (Shuai) MaMichael F. Price College of Business
University of [email protected]
Wayne B. Thomas
Michael F. Price College of BusinessUniversity of Oklahoma
March 13, 2012
We are thankful for comments received from Mary Barth, Brad Blaylock, Charles Christian,Alex Edwards, Fabrizio Ferri, Susan Gyeszly, Michelle Hanlon, Trevor Harris, Shane Heitzman,Don Herrmann, Tony Kang, Bob Lipe, George Plesko, Sugata Roychowdhury, Tom Schultz,Jake Thomas, Frank Zhang, and workshop participants at Boston College, Columbia University,University of Oklahoma, the 2011 Yale Accounting Research Conference, the 2012 FinancialAccounting Reporting Section Midyear Meeting (Chicago), University of Maryland, and the2012 International Accounting Section Midyear Meeting (Phoenix) for helpful comments andsuggestions. Hope acknowledges the financial support of the Deloitte Professorship.
8/2/2019 Tax Avoidance and Geographic Earnings Disclosure
http://slidepdf.com/reader/full/tax-avoidance-and-geographic-earnings-disclosure 2/49Electronic copy available at: http://ssrn.com/abstract=2021157
Tax Avoidance and Geographic Earnings Disclosure
Abstract
This study tests the relation between corporate tax avoidance and disclosure of
geographic earnings for U.S. multinational companies. We find that after the adoption of
Statement of Financial Accounting Standards No. 131 in 1998, firms opting to discontinue
disclosure of geographic earnings in their financial reports experience a decrease in their
worldwide effective tax rates through reduced foreign tax rates. These results are consistent with
non-disclosure of geographic earnings making it easier (i.e., less transparent) for firms to shift
income to lower-tax foreign operations without detection by financial statement users and tax
authorities. However, the relation between tax avoidance and non-disclosure exists only until
implementation of Schedule M-3 in the annual corporate tax filing beginning in 2004. Schedule
M-3 requires a detailed reconciliation of book income to tax income. Part of that reconciliation
includes reporting the profitability of each foreign entity that is part of the consolidated financial
group but whose net income is excluded from consolidated taxable income. Thus, Schedule M-3
aims to make firms’ tax avoidance activities associated with shifting profits to lower-tax foreign
jurisdictions more apparent to the IRS, and our results confirm that it has this effect. This study
contributes to our understanding of the interaction between financial reporting behavior and tax
reporting behavior.
Key words: Tax Avoidance, Geographic Earnings Disclosure, SFAS 131, Schedule M-3
8/2/2019 Tax Avoidance and Geographic Earnings Disclosure
http://slidepdf.com/reader/full/tax-avoidance-and-geographic-earnings-disclosure 3/49
1
Tax Avoidance and Geographic Earnings Disclosure
1. Introduction
Multinational firms can avoid taxes through structured transactions among different
jurisdictions (e.g., Rego 2003), such as reallocating taxable income from high-tax jurisdictions to
low-tax ones (Collins et al. 1998). This type of income shifting significantly reduces tax
revenues of governments in high-tax jurisdictions and potentially hinders domestic economic
growth and other social benefits (e.g., GAO 2008; U.S. Senate 2006). Policy makers around the
world, including the United States, European Union, and Canada, have either enacted or are
considering regulations related to multinational firms’ cross-jurisdictional income shifting and
tax avoidance behavior.1 However, relatively little is known about multinational corporate tax
avoidance behavior (Hanlon and Heitzman 2010), though such knowledge provides a basis for
making and enforcing related rules.2 This study investigates how geographic earnings disclosure
in firms’ financial reports relates to multinational firms’ tax avoidance behavior.
We predict that non-disclosure of geographic earnings relates positively to firms’ tax
avoidance behavior. Tax avoidance activities (even if legal) are generally not viewed positively
by tax authorities, policy makers, and society in general. Disclosing abnormally high geographic
earnings in low-tax jurisdictions potentially increases the likelihood of an IRS audit (Sullivan
2004; Christian and Schultz 2005), imposes reputational damage on the firm (e.g., Chen et al.
2010; Rego and Wilson 2012), attracts criticism from policy makers (e.g., Houlder 2010; World
Bank 2010), angers citizen groups (e.g., Publish What You Pay 2010; Tax Justice Network 2003;
1 Some examples are the tax holidays provided by American Jobs Creation Act of 2004 (AJCA) and the foundationof a profit consolidation system for multinational firms in the European Union.2 We use the term “tax avoidance” in this paper as it is the most widely used term in recent research. Alternativeterms with varying definitions could be “tax management” or “tax planning” or “tax minimization.” To date, thedefinition of tax avoidance is still an unsettled issue. In this study, the implied means of tax avoidance is firms’(legal or illegal) shifting of income from higher-tax (domestic or foreign) segments to lower-tax foreign segments.
8/2/2019 Tax Avoidance and Geographic Earnings Disclosure
http://slidepdf.com/reader/full/tax-avoidance-and-geographic-earnings-disclosure 4/49
2
Shaheen 2011), and could also generate scrutiny from foreign tax authorities (e.g., Drucker
2010). While U.S. tax authorities may have access to additional disclosures related to firms’
foreign operations (e.g., Form 5471), these tax disclosures may not fully reveal firms’ tax
avoidance behavior, and perhaps more importantly, they are not available to other financial
statement users or foreign tax authorities. In fact, it is quite possible that IRS audits are initiated
by discoveries and complaints by financial statement users.3 To the extent managers believe that
non-disclosure of geographic earnings reduces the firm’s probability of being audited by
domestic tax authorities, prevents additional sanctions or penalties by foreign tax authorities, or
deflects public criticism from citizen groups, policy makers, and consumers, they will be more
likely to engage in tax avoidance activities.4
Two recent U.S. regulations provide natural experiments for testing our prediction. First,
we examine U.S. firms’ decisions of whether to disclose geographic earnings in their financial
reports following adoption of Statement of Financial Accounting Standards No. 131 (SFAS 131).
SFAS 131 regulates multinational companies’ geographic segment reporting. Prior to SFAS 131,
all multinational firms were required to disclose sales, total assets, and earnings for each
geographic segment. After implementation of SFAS 131, disclosure of geographic sales,
identifiable long-lived assets, and earnings is still required if the firm defines primary operating
segments by geographic area. However, for most firms that define primary segments by any
3 As one example, consider the IRS’ willingness to garner direction from the general public through itsWhistleblower program, formally enacted by the Tax Relief and Health Care Act of 2006. Monetary incentives areprovided to those who reveal tax underpayments. In addition, the IRS is certainly aware of high-profile business
articles which criticize specific companies’ tax practices, as well as lists generated by groups such as the Citizens forTax Justice and Institute of Taxation and Economic Policy that identify “corporate tax dodgers”(http://www.ctj.org/corporatetaxdodgers/CorporateTaxDodgersReport.pdf ). These parties do not have direct accessto tax reports so they must rely on financial disclosures in firms’ published financial statements to assess firms’ taxavoidance activities.4 Studies have shown that in some instances the firm’s own shareholders may view tax avoidance activitiesnegatively (e.g., Desai and Dharmapala 2004, 2006; Scholes, Wolfson, Erickson, Maydew, and Shevlin 2005; Desai,Dyck, and Zingales 2007; Hanlon and Slemrod 2009; Kim, Li, and Zhang 2011). This would provide managers anadditional incentive for not disclosing geographic earnings in public financial reports, although the relation betweentax avoidance and shareholder value is debated in the literature (e.g., Blaylock 2011).
8/2/2019 Tax Avoidance and Geographic Earnings Disclosure
http://slidepdf.com/reader/full/tax-avoidance-and-geographic-earnings-disclosure 5/49
3
other means (e.g., industry), only disclosure of geographic sales and identifiable long-lived assets
is required; disclosure of geographic earnings is voluntary. Given that the vast majority of firms
report operating segments by industry classification, disclosure of geographic earnings is
voluntary for most firms, and most firms choose to no longer disclose (Herrmann and Thomas
2000). We expect that managers perceive reduced transparency associated with non-disclosure of
geographic segment earnings as a means to engage in greater tax avoidance behavior.
The other natural experiment is implementation of Schedule M-3 in 2004 in the annual
corporate tax report. Aimed at curtailing tax avoidance behavior, Schedule M-3 requires
significant additional tax reporting requirements, including information related to the
profitability of foreign entities that are included in financial net income but excluded from
taxable net income. Donohoe and McGill (2011, 36) describe Schedule M-3 as “one of the most
important new sources of information for the U.S. Treasury and IRS in the last 40 years.” The
information provided in the Schedule M-3 is filed with the firm’s corporate tax return and plays
an important role in determining which firms will be audited (Boynton, DeFilippes, and Legel
2008). Thus, beginning in 2004, firms’ ability to hide profits in low-tax geographic regions
should be substantially reduced by the additional reporting requirements of Schedule M-3.
Accordingly, we expect that the relation between tax avoidance and non-disclosure of
geographic earnings in the financial report will exist only prior to implementation of Schedule
M-3. See Appendix I for an illustration of the three reporting regimes examined in this study.
Using a sample of 13,831 firm-year observations for the 16 years surrounding the
adoption of SFAS 131 and Schedule M-3 (1993-2008), we compare effective tax rates in the pre-
SFAS 131 period (January 1993 to November 1998), post-SFAS 131 period (December 1998 to
November 2004), and post-M-3 period (December 2004 to December 2008) to test our
8/2/2019 Tax Avoidance and Geographic Earnings Disclosure
http://slidepdf.com/reader/full/tax-avoidance-and-geographic-earnings-disclosure 6/49
4
predictions.5 We find that firms no longer disclosing geographic earnings in the post-SFAS 131
period have effective tax rates (cash effective tax rates) that are 4.1 (5.2) percentage points lower
than do firms that continue to disclose geographic earnings, controlling for many firm-level
factors and fixed effects for year and industry. However, prior to implementation of SFAS 131
(when all firms were required to disclose geographic earnings in financial reports), eventual non-
disclosers’ effective tax rates were not significantly different from those that will continue to
disclose geographic earnings. Overall, the results are consistent with managers perceiving non-
disclosure of geographic earnings as making their firms’ tax avoidance behavior less transparent.
We further find that, after implementation of Schedule M-3 (when all firms were required
to detail the profitability of foreign entities not included in the consolidated tax group), non-
disclosers’ effective tax rates were not significantly different from those of disclosers. This
finding is consistent with increases in tax reporting requirements mitigating deficiencies in
financial reporting (i.e., non-disclosure of geographic earnings in the financial report). These
conclusions are robust to controlling for a number of firm characteristics, employing matched-
sample designs, using a constant sample of firms between the different reporting regimes,
validating the impact of non-disclosure using predicted values of effective tax rates, assessing
long-term effective tax rates as alternative measures of tax avoidance, and controlling for
differences in foreign and domestic pretax profit margins. We also find that the relation between
non-disclosure of geographic earnings and tax avoidance is less pronounced for firms with a
higher probability of an IRS audit.
5 To be clear, SFAS 131 remains in effect so the post-SFAS 131 period technically includes any period afterDecember 1998 to the present. However, for simplicity in labeling reporting regimes, we refer to the post-SFAS 131period as beginning in December 1998 and ending in November 2004. The post-M-3 period begins in December2004 and extends to the end of our sample period.
8/2/2019 Tax Avoidance and Geographic Earnings Disclosure
http://slidepdf.com/reader/full/tax-avoidance-and-geographic-earnings-disclosure 7/49
5
We provide further supportive evidence by using foreign and domestic effective tax rates
as a within-firm control. To the extent that a firm operates in multiple foreign jurisdictions,
shifting income either (1) from domestic operations to a lower-tax foreign segment or (2) from a
higher-tax foreign jurisdiction to a lower-tax one has no effect on the domestic tax rate but
lowers the foreign effective tax rate. Testing for relations between tax avoidance and domestic
effective tax rates across reporting regimes allows for a within-firm control for changes in
business operations which could naturally affect firms’ effective tax rates. Thus, the ability to
split the worldwide effective tax rate into its domestic and foreign components allows for more
reliable conclusions regarding firms’ tax avoidance behavior. Supporting these arguments, we
find that non-disclosure of geographic earnings is not associated with differences in domestic
effective tax rates but is associated with lower foreign effective tax rates. In the post-SFAS 131
period, non-disclosers’ foreign effective tax rate is 4.0 percentage points lower than disclosers’,
but the difference in domestic effective tax rates is not significant. These findings further validate
the effect of geographic earnings disclosure on corporate tax avoidance behavior.
This study makes several contributions. First, it responds to calls for research on the
interaction between financial reporting behavior and tax reporting behavior by Shackelford and
Shevlin (2001) and Hanlon and Heitzman (2010). Our results suggest that firms take advantage
of non-disclosure of geographic earnings in financial reports under SFAS 131 to avoid taxes.
However, increases in tax reporting requirements under Schedule M-3 mitigate these financial
reporting deficiencies.
Second, the literature includes a large number of studies in a variety of contexts to
explain firms’ disclosure quality (see Beyer, Cohen, Lys, and Walther 2010 for a comprehensive
review). We add to this research. For example, studies show that disclosure quality increases
8/2/2019 Tax Avoidance and Geographic Earnings Disclosure
http://slidepdf.com/reader/full/tax-avoidance-and-geographic-earnings-disclosure 8/49
6
when firms seek external financing (Land and Lundholm 1993, 2000; Healy, Palepu, and
Sweeney 1999), the CEO’s wealth is tied more closely to stock-based compensation (Nagar,
Nanda, and Wysocki 2003), and the firm operates in a less litigious environment (Baginski,
Hassell, and Kimbrough 2002). Specifically related to segment reporting, disclosure quality
varies inversely with proprietary costs (Bens, Berger, and Monahan 2011), agency problems
(Berger and Hann 2007), and propensity to empire build (Hope and Thomas 2008). We show
that firms’ disclosure/non-disclosure can also be used as a tool by managers in their attempts to
conceal their firms’ tax avoidance behavior. In our study, we measure disclosure quality using
firms’ decision on whether to disclose geographic earnings in their financial reports.
Third, this research has potential implications for policy makers around the world. Our
findings suggest that geographic earnings disclosure can potentially be used to regulate
multinationals’ tax reporting behavior, and the effect on multinationals’ tax reporting behavior
should be considered in future regulatory proposals related to geographic earnings disclosure by
tax authorities. In the U.S., there is a debate over the benefits of requiring Schedule M-3 versus
the costs associated with the extensive preparation effort (e.g., AICPA 2011). Our findings imply
that Schedule M-3 reduces the impact of financial disclosure quality (i.e., non-disclosure of
geographic earnings) on firms’ income-shifting behavior. Tax authorities may want to carefully
consider any future proposals to ease filing requirements of Schedule M-3.
The next section reviews the relevant literature and develops the hypotheses. Section 3
presents the research design and sample selection. Section 4 discusses the main empirical
findings and corroborative findings. Section 5 shows additional findings. Finally, Section 6
concludes the paper.
8/2/2019 Tax Avoidance and Geographic Earnings Disclosure
http://slidepdf.com/reader/full/tax-avoidance-and-geographic-earnings-disclosure 9/49
7
2. Prior Literature and Hypotheses Development
2.1 Multinational Corporate Tax Avoidance and U.S. Tax Law
Tax avoidance is the downward management of taxes through tax planning activities
(Hanlon and Heitzman 2010), and tax avoidance by multinational firms has been discussed
extensively in the academic literature and business press (e.g., Collins and Shackelford 1999;
Rego 2003). Multinational firms’ tax avoidance most notably occurs by reallocating taxable
income from high-tax to low-tax segments. This reallocation occurs through structuring
transactions between segments, such as royalty payments, dividend repatriations, and intrafirm
debt (Dyreng and Lindsey 2009; Dharmapala and Hines 2009), or through transfer pricing,
which refers to strategically adjusting prices charged by one segment of the firm for products and
services provided to another segment of the firm. In transactions between high-tax segments and
low-tax segments, multinational firms gain tax benefits by reducing (increasing) prices of
products or services provided by (to) the high-tax segments. For example, in the pharmaceutical
industry, it may be common for U.S. companies to send “low” cost chemicals overseas to low-
tax jurisdictions, and then for the subsidiary to send the drug back to the U.S. in pill form at a
“high” price (Faulkender and Petersen 2011). Though most governments require firms to use
transfer prices that would be used in similar transactions with unrelated parties, it is difficult to
enforce this requirement, particularly when the transactions relate to products or services without
active markets, such as patent rights (Dharmapala and Hines 2009).
To minimize the tax impact of income shifting, the U.S. government collects taxes on
U.S. multinationals’ worldwide earnings. Specifically, U.S. multinationals are required to pay
tax for earnings of their foreign subsidiaries when foreign earnings are repatriated. For example,
U.S. multinationals operating in a jurisdiction with a foreign tax rate of 25% will pay taxes of
8/2/2019 Tax Avoidance and Geographic Earnings Disclosure
http://slidepdf.com/reader/full/tax-avoidance-and-geographic-earnings-disclosure 10/49
8
25% to the foreign government and, if those earnings are repatriated to the U.S., an additional
10% to the IRS (assuming a 35% U.S. tax rate). Thus, the firm obtains no tax benefit through
income shifting. If, however, those foreign earnings are not repatriated, then the 10% U.S. tax
payment is deferred. In this case, U.S. multinationals gain tax benefits by shifting income from
the U.S. to foreign segments through structured transactions, transfer pricing, and other methods
(e.g., Harris et al. 1993; Hines and Rice 1994; Dharmapala and Riedel 2011).6,7
2.2 SFAS 131
Beginning in 1977, SFAS 14 required disclosure of sales, assets, and earnings for each
industry and geographic segment of the firm. Then, the FASB issued SFAS 131 (effective for
fiscal years beginning December 15, 1997), which created a two-tiered segment reporting
structure. SFAS 131 maintains the disclosure of sales, assets, and earnings for each primary
segment, but for secondary segments, disclosure of only sales and identifiable long-lived assets
is mandatory; disclosure of earnings for secondary segments is voluntary. Herrmann and Thomas
(2000) show that nearly all firms that operate in multiple industries and geographic areas choose
industry segments as their primary segments. Thus, disclosure of earnings for geographic
(secondary) segments has become voluntary for most firms, and most firms choose to no longer
disclose this information.8
6 When the foreign tax rate is greater than the U.S. tax rate, the company does not receive an immediate domestic
tax deduction or benefit for the difference unless those earnings are repatriated.7 Graham, Hanlon, and Shevlin (2010) attempt to understand the important economic consequences of non-repatriation of foreign earnings by surveying tax executives’ response to the one-time dividends received deductionin the American Jobs Creation Act of 2004. They found that most of the repatriated funds during this period camefrom overseas cash holdings, suggesting that many firms are willing to hold large cash balances overseas to avoidtaxes. In addition, companies were willing to incur significant costs to avoid repatriation prior to the Act. Thesecosts include issuing debt in the U.S. (rather than using those foreign sources of cash) and investing in foreign assetswith rates of return lower than those in the U.S.8 Herrmann and Thomas (2000) also provide an analysis of the number and scope of geographic segment reportingunder SFAS 14 and SFAS 131. They report wide variation across companies. Some firms changed their regional-
8/2/2019 Tax Avoidance and Geographic Earnings Disclosure
http://slidepdf.com/reader/full/tax-avoidance-and-geographic-earnings-disclosure 11/49
9
Prior studies suggest that disclosure of segment earnings has both benefits and costs to
firms. On one hand, geographic earnings disclosure under SFAS 131 can benefit firms by
helping investors monitor managerial behavior. When not monitored well, managers may pursue
their own objectives at the expense of shareholders. Berger and Hann (2007) argue that managers
may hide segment information to avoid revealing underlying agency problems associated with
suboptimal cross-segment transfer of resources. Hope and Thomas (2008) find that managers
conceal geographic earnings information to grow foreign operations in order to expand the total
size of the “empires” they manage. On the other hand, disclosure of segment information can
result in significant proprietary costs of providing sensitive information to competitors (Hayes
and Lundholm 1996; Harris 1998; Botosan and Stanford 2005; Bens, Berger, and Monahan
2011).
Multinational firms’ tax avoidance and income shifting behavior are partially revealed
through reported geographic earnings.9 As multinational firms shift taxable income across
different segments, the reported earnings for each segment changes. Thus, the distribution of
earnings across geographic areas (at least partially) informs financial statement users about
firms’ cross-segment income shifting (Collins et al. 1998; Berger and Hann 2007). For example,
in response to a request from the U.S. Senate Committee on Finance, the Government
level disclosures under SFAS 14 to country-level disclosures under SFAS 131 (e.g., Dupont, RJR Nabisco Holdings,Texaco, and Exxon). For example, Dupont provided a Europe segment and an Other segment under SFAS 14 andthen disclosed 12 individual countries and four Other regions under SFAS 131. Others firms had no change ingeographic segment definitions, choosing to keep regional disclosures (e.g., Bristol Myers Squibb, Kimberly-Clark,
and Arrow Electronics). Some firms indicate that because certain individual countries are immaterial, even regionaldisclosures can be further aggregated under the requirements of SFAS 131, resulting in even coarser geographicdisclosures (e.g., Goodyear and PepsiCo). For example, PepsiCo went from disclosing sales, assets, and operatingprofit for Europe, Canada, Mexico, the United Kingdom, and Other to reporting sales and identifiable long-livedassets for a single “International” segment only. All of the companies identified above disclosed earnings underSFAS 14 but none of them disclosed geographic earnings under SFAS 131. Future research may want to furtherinvestigate how geographic segment definitions potentially relate to tax avoidance behavior.9 Several studies support the usefulness of geographic segment earnings data in a variety of contexts (e.g.,Boatsman, Behn, and Patz 1993; Thomas 2000; Behn, Nichols, and Street 2002; Hope, Kang, Thomas, and Vasvari2009; Hope, Thomas, and Winterbotham 2009).
8/2/2019 Tax Avoidance and Geographic Earnings Disclosure
http://slidepdf.com/reader/full/tax-avoidance-and-geographic-earnings-disclosure 12/49
10
Accountability Office (2008, 2) states, “Reporting of the geographic sources of income is
susceptible to manipulation for tax planning purposes and appears to be influenced by
differences in tax rates across countries. Most of the countries studied with relatively low
effective tax rates have income shares significantly larger than their shares of the business
measures least likely to be affected by income shifting practices.” This statement suggests that
firms’ worldwide earnings are susceptible to manipulation for the purpose of avoiding taxes, and
that this type of manipulation manifests itself in “high” pretax income being reported in low-tax
jurisdictions. Therefore, non-disclosure of geographic earnings under SFAS 131 potentially
lowers the visibility of multinational firms’ tax avoidance behavior.
Similar views have been raised outside the U.S. For example, the World Bank and the
OECD, as well as several public interest groups, have lobbied for more disaggregated geographic
segment disclosures (including geographic earnings) to help make international tax avoidance
more transparent (see, e.g., Association for Accountancy and Business Affairs Limited 2003;
Tax Justice Network 2003; Publish What You Pay 2010; World Bank 2010; Werdigier 2011).
Focusing on reporting practices by extractive companies, the European Parliament has urged the
International Accounting Standards Board to move beyond voluntary guidelines and require
country-by-country earnings reporting (e.g., Financial Task Force 2011).
While U.S. tax authorities potentially have access to other sources of information on
firms’ foreign operations (i.e., Form 5471), information about the profitability of foreign entities
did not appear on the firm’s corporate tax return prior to Schedule M-3, potentially making it
more difficult for IRS agents to identify tax avoidance behavior through income shifting.10 In
10 Several commentaries are offered on the general reporting deficiencies with the Schedule M-1 (predecessor toSchedule M-3) and the difficulty for the IRS in determining whether book-tax differences were naturally occurringor the result of questionable tax behavior (e.g., Boynton, DeFilippes, Lisowsky, and Mills 2004; Boynton and Mills2004). Boynton and Wilson (2006, 2) write, “In the case of large corporations, this aggregation by taxpayers [on
8/2/2019 Tax Avoidance and Geographic Earnings Disclosure
http://slidepdf.com/reader/full/tax-avoidance-and-geographic-earnings-disclosure 13/49
11
addition, U.S. tax-related information is not available to policy makers, foreign tax authorities,
and the general public. Numerous business articles and formal reports by citizen groups (e.g.,
Citizens for Tax Justice and the Institute on Taxation and Economic Policy 2011) actively
identify firms suspected of aggressive tax avoidance and petition policy makers and the IRS to
curtail such practices. Given the limited resources of the IRS to police all firms, complaints by
these groups could be especially useful to the IRS in helping to decide which firms should be
audited, and these groups typically have access only to disclosures in firms’ public financial
reports. To the extent managers believe that non-disclosure of geographic earnings in financial
reports reduces the firm’s probability of being audited by domestic tax authorities, prevents
additional sanctions or penalties by foreign tax authorities, and deflects public criticism from
citizen groups and policy makers, they will be more likely to engage in tax avoidance activities.
2.3 Schedule M-3
Motivated in part by recommendations of Mills and Plesko (2003), the IRS put forth
Schedule M-3. Most publicly traded and privately held firms with assets of at least $10 million
are required to adopt Schedule M-3 for tax years ending on or after December 2004. Schedule
M-3 is an attachment to Form 1120. “The goal of the Schedule M-3 is greater transparency and
uniform organization in book-tax data at the time of return filing so that the data may be used to
determine what returns will and will not be audited and to determine what issues will and will
not be examined on the returns selected for audit” (Boynton et al. 2008, 944). Donohoe and
McGill (2011) provide extensive discussion of the changes mandated by Schedule M-3. The
benefits include a standardized and detailed reconciliation of book income to taxable income
Schedule M-1] and the lack of specific detail required by the instructions to Schedule M-1 rendered the schedulenearly useless as an analytical tool for purposes of determining audit risk. Most of the detail was contained inschedules to the summary Schedule M-1 that would be seen only if and when a return was chosen for examination.”
8/2/2019 Tax Avoidance and Geographic Earnings Disclosure
http://slidepdf.com/reader/full/tax-avoidance-and-geographic-earnings-disclosure 14/49
12
directly on the corporate federal tax return for more than 90 line items. Each of these items is
categorized as a permanent or temporary book-tax difference.
Directly related to this study, Schedule M-3 requires firms to provide information about
specific foreign entities that are included in consolidated net income but excluded from taxable
income. This information includes items such as the entity’s name, net income, total assets, and
total liabilities. Schedule M-3 also requires specific details on intercompany transactions
between entities included in taxable income and those excluded from taxable income, such as the
name of the excluded entity and the nature and amount of the intercompany transaction. Thus,
after implementation of Schedule M-3, the IRS has considerably more information about
multinational firms’ geographic performance.
2.4 Hypotheses
We argue that managers of firms that discontinue disclosing geographic earnings
following SFAS 131 perceive reduced costs associated with engaging in tax avoidance activities.
If disclosed, abnormally high geographic earnings in low-tax jurisdictions potentially increase
the probability of an IRS inspection, attract the attention of foreign tax authorities, garner
negative publicity by policy makers and citizens, and possibly damage the firm’s reputation. This
expectation is based on the argument that geographic earnings information helps both U.S. tax
authorities and other financial information users detect tax-motivated income shifting behavior.
For example, using a sample from the pre-SFAS 131 period, Collins et al. (1998) find that
investors recognize firms’ tax-motivated income shifting behavior by analyzing geographic
earnings information. Further, in a study to assist the IRS in its effort to quantify the compliance
problem caused by the income shifting activities of U.S. multinational corporations, Christian
8/2/2019 Tax Avoidance and Geographic Earnings Disclosure
http://slidepdf.com/reader/full/tax-avoidance-and-geographic-earnings-disclosure 15/49
13
and Schultz (2005) view abnormally high geographic earnings in low-tax jurisdictions as
indicators to identify potential income shifters. Sullivan (2004) also employs geographic
earnings to estimate the amount of earnings that U.S. firms shifted to low-tax jurisdictions.
Based on the discussion above, we formally state the first hypothesis as:
H1: After adoption of SFAS 131 and before implementation of Schedule M-3, firms that
no longer provide geographic earnings disclosure engage in greater tax avoidance
behavior than do firms that provide such disclosure.
After the adoption of Schedule M-3, the IRS has considerably more information related
to foreign entities excluded from taxable income and the permanent versus transitory nature of
book-tax differences. Therefore, the prediction of a positive relation between non-disclosure of
geographic earnings under SFAS 131 and tax avoidance will be reduced after the adoption of
Schedule M-3. The second hypothesis is formally stated as:
H2: After implementation of Schedule M-3, the relation between tax avoidance and non-
disclosure of geographic earnings under SFAS 131 diminishes.
3. Research Design and Sample
3.1 Model Specification
To test the hypotheses, we use the following empirical model (see Appendix II for
variable definitions).
8/2/2019 Tax Avoidance and Geographic Earnings Disclosure
http://slidepdf.com/reader/full/tax-avoidance-and-geographic-earnings-disclosure 16/49
14
t ii,t 12
i,t 11i,t 10i,t 9i,t 8i,t 7 i,t 6
i,t 5i,t 4i,t 3i,t 2i,t 10
xedEffects IndustryFi ffectsYearFixedE Intang+ α
EqIncα RDαPPE αFI α NI α ∆ NOLα
NOLα MBα Lev LnMV α NoDiscαα ETRi,t
,
ε
α
+++
++++++
+++++=
(1)
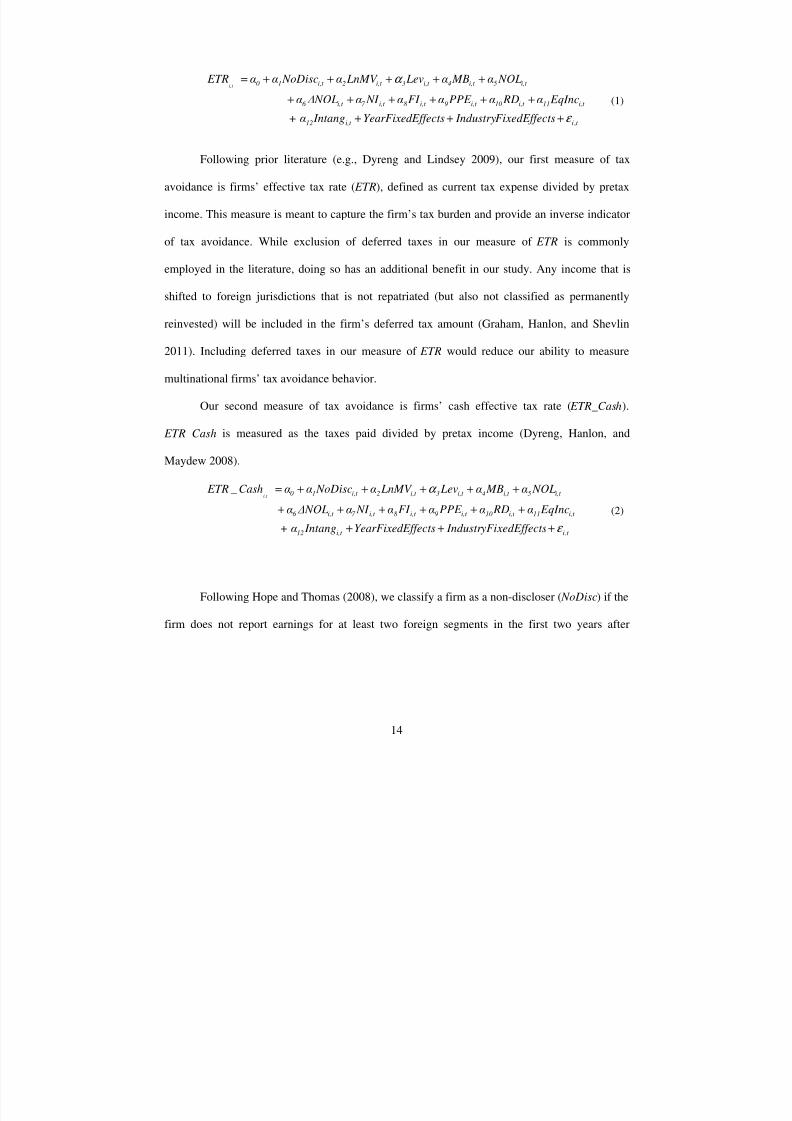
Following prior literature (e.g., Dyreng and Lindsey 2009), our first measure of tax
avoidance is firms’ effective tax rate ( ETR), defined as current tax expense divided by pretax
income. This measure is meant to capture the firm’s tax burden and provide an inverse indicator
of tax avoidance. While exclusion of deferred taxes in our measure of ETR is commonly
employed in the literature, doing so has an additional benefit in our study. Any income that is
shifted to foreign jurisdictions that is not repatriated (but also not classified as permanently
reinvested) will be included in the firm’s deferred tax amount (Graham, Hanlon, and Shevlin
2011). Including deferred taxes in our measure of ETR would reduce our ability to measure
multinational firms’ tax avoidance behavior.
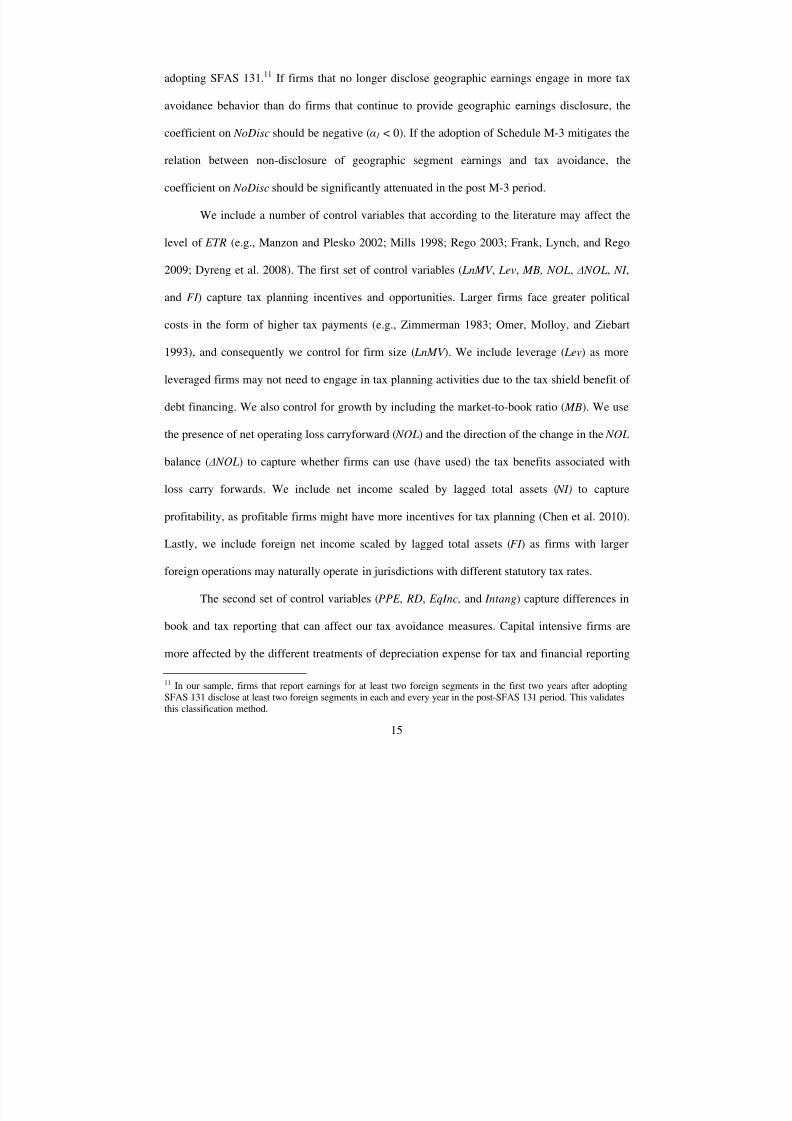
Our second measure of tax avoidance is firms’ cash effective tax rate ( ETR_Cash).
ETR_Cash is measured as the taxes paid divided by pretax income (Dyreng, Hanlon, and
Maydew 2008).
t ii,t 12
i,t 11i,t 10i,t 9i,t 8i,t 7 i,t 6
i,t 5i,t 4i,t 3i,t 2i,t 10
xedEffects IndustryFi ffectsYearFixedE Intang+ α
EqIncα RDαPPE αFI α NI α ∆ NOLα
NOLα MBα Lev LnMV α NoDiscααCash ETRi,t
,
_
ε
α
+++
++++++
+++++=
(2)
Following Hope and Thomas (2008), we classify a firm as a non-discloser ( NoDisc) if the
firm does not report earnings for at least two foreign segments in the first two years after
8/2/2019 Tax Avoidance and Geographic Earnings Disclosure
http://slidepdf.com/reader/full/tax-avoidance-and-geographic-earnings-disclosure 17/49
15
adopting SFAS 131.11 If firms that no longer disclose geographic earnings engage in more tax
avoidance behavior than do firms that continue to provide geographic earnings disclosure, the
coefficient on NoDisc should be negative (α1 < 0). If the adoption of Schedule M-3 mitigates the
relation between non-disclosure of geographic segment earnings and tax avoidance, the
coefficient on NoDisc should be significantly attenuated in the post M-3 period.
We include a number of control variables that according to the literature may affect the
level of ETR (e.g., Manzon and Plesko 2002; Mills 1998; Rego 2003; Frank, Lynch, and Rego
2009; Dyreng et al. 2008). The first set of control variables ( LnMV , Lev, MB, NOL, ∆ NOL, NI ,
and FI ) capture tax planning incentives and opportunities. Larger firms face greater political
costs in the form of higher tax payments (e.g., Zimmerman 1983; Omer, Molloy, and Ziebart
1993), and consequently we control for firm size ( LnMV ). We include leverage ( Lev) as more
leveraged firms may not need to engage in tax planning activities due to the tax shield benefit of
debt financing. We also control for growth by including the market-to-book ratio ( MB). We use
the presence of net operating loss carryforward ( NOL) and the direction of the change in the NOL
balance ( ∆ NOL) to capture whether firms can use (have used) the tax benefits associated with
loss carry forwards. We include net income scaled by lagged total assets ( NI) to capture
profitability, as profitable firms might have more incentives for tax planning (Chen et al. 2010).
Lastly, we include foreign net income scaled by lagged total assets (FI ) as firms with larger
foreign operations may naturally operate in jurisdictions with different statutory tax rates.
The second set of control variables (PPE , RD, EqInc, and Intang) capture differences in
book and tax reporting that can affect our tax avoidance measures. Capital intensive firms are
more affected by the different treatments of depreciation expense for tax and financial reporting
11 In our sample, firms that report earnings for at least two foreign segments in the first two years after adoptingSFAS 131 disclose at least two foreign segments in each and every year in the post-SFAS 131 period. This validatesthis classification method.
8/2/2019 Tax Avoidance and Geographic Earnings Disclosure
http://slidepdf.com/reader/full/tax-avoidance-and-geographic-earnings-disclosure 18/49
16
purposes, so we include PPE . We include research and development expense ( RD), equity in
earnings ( EqInc), and intangible assets ( Intang) in the regressions to control for the differential
book and tax treatments of intangible assets and consolidated earnings accounted for using the
equity method. Finally, year and industry fixed effects are included to control for macro-
economic conditions and changes in tax laws that differ across years and across industries.
3.2 Sample Selection
All data are from Compustat . We focus on the 16 years surrounding the adoption of
SFAS 131 and Schedule M-3 (1993-2008). To ensure that firms in our sample have sufficient
foreign operations, we require availability of domestic and foreign performance measures in the
current and previous year.12 We also require that each sample firm have the necessary data to
estimate our model. Then, we delete firms with total assets less than $10 million, negative pretax
income, or negative effective tax rates. Following prior studies (e.g., Dyreng et al. 2010), we
further winsorize effective tax rates greater than one to equal one. All the other continuous
variables are winsorized at the 1st and 99th percentiles.13 The final sample includes 13,831 firm-
year observations. In the pre-SFAS 131 period, there are a total 4,121 firm-year observations. All
of these observations disclose geographic earnings in the pre-SFAS 131 period, but 3,572 of
them will eventually choose not to disclose geographic earnings after implementation of SFAS
131. The post-SFAS 131 period consists of 4,545 observations, of which 3,755 represent firms
that do not disclose geographic earnings. In the post-M-3 period, 4,547 of 5,165 observations
come from firms that do not disclose geographic earnings in the post-SFAS 131 period.
12 SEC Regulation §210.4-08(h) requires firms to report total foreign and domestic earnings.13 Results are not sensitive to truncating the sample at the 1st and 99th percentiles for the continuous variables.
8/2/2019 Tax Avoidance and Geographic Earnings Disclosure
http://slidepdf.com/reader/full/tax-avoidance-and-geographic-earnings-disclosure 19/49
17
3.3 Descriptive statistics
Table 1 presents univariate statistics separately for disclosers and non-disclosers in the
three reporting regimes. To be clear, all firms were required to disclose geographic earnings in
the pre-SFAS 131 period (Herrmann and Thomas 2000). Thus, firms classified as “non-
disclosers” in the pre-SFAS 131 period did disclose geographic earnings at that time but they
chose not to disclose in the post-SFAS 131 period. To better identify firm characteristics of
eventual non-disclosers versus continued disclosers, we report univariate statistics separately for
the two groups in the pre-SFAS 131 period (Panel A). Eventual non-disclosers have an ETR of
0.32. This is similar to the ETR of those that will continue to disclose under SFAS 131 (0.33).
However, in the post-SFAS 131 period (Panel B), we find noticeable differences; non-disclosers’
ETR (0.30) is lower than disclosers’ ETR (0.35). In Panel C, which uses the subsample of the
post-M-3 period, the ETRs of the two groups begin to once again converge (0.29 versus 0.32) but
remain lower for non-disclosers. Similar differences are observed for ETR_Cash. In addition,
non-disclosers tend to have lower market value of equity ( LnMV ), lower market-to-book ratio
( MB), fewer net operating losses ( NOL), and lower profitability ( NI). The distributions for the
other variables are generally similar for the two subsamples.
Table 2 presents correlations between the variables. The top half of the table shows the
Pearson correlations; the bottom half shows the Spearman correlations. ETR is significantly
negatively correlated with non-disclosure of geographic earnings ( NoDisc). In untabulated
analyses, the Pearson correlation between ETR and NoDisc in the pre-SFAS 131 (post-SFAS
131) [post-M-3] period is −0.005 (−0.081) [−0.037]. The Pearson correlation between ETR_Cash
and NoDisc in the pre-SFAS 131 (post-SFAS 131) [post-M-3] period is 0.015 (−0.088) [−0.021].
Non-disclosure of geographic earnings is most significantly related to lower effective tax rates in
8/2/2019 Tax Avoidance and Geographic Earnings Disclosure
http://slidepdf.com/reader/full/tax-avoidance-and-geographic-earnings-disclosure 20/49
18
the post-SFAS 131 period (and is attenuated in the post-M-3 period).14 The simple descriptive
statistics reported in Tables 1 and 2 do not control for a number of firm-specific variables
expected to relate to ETR and ETR_Cash so we base our conclusions on the multiple regression
tests reported below.
4. Primary Empirical Results
4.1 Regression Analyses
Panel A of Table 3 shows the estimation results for model (1) using ETR.15 We provide
results separately for each period: pre-SFAS 131 period (January 1993 to November 1998), post-
SFAS 131 period (December 1998 to November 2004), and post-M-3 period (December 2004 to
December 2008). For each period, we test whether ETR differs between disclosers and non-
disclosers by testing whether the coefficient on NoDisc is significantly different from zero. For
the pre-SFAS 131 period and the post-M-3 period, we also test whether the coefficient on
NoDisc differs from that in the post-SFAS 131 period. This provides our “difference-in-
differences” research design which we use to test our hypotheses. The first column uses
observations from the pre-SFAS 131 period; the second column uses observations from the post-
SFAS 131 period; the third column uses observations from the post-M-3 period. For the control
variables, ETR is significantly positively associated with LnMV , NI , FI , and Intang, but
negatively related to MB, NOL, NOL, PPE , RD, and EqInc. These findings are consistent with
general expectations.
14 We test the Variance Inflation Factors (VIF) for all regressions. The maximum VIF is 5, relieving concerns aboutmulticollinearity.15 We use robust standard errors clustered by firm. No inferences are impacted if we instead cluster by year or byyear and firm.
8/2/2019 Tax Avoidance and Geographic Earnings Disclosure
http://slidepdf.com/reader/full/tax-avoidance-and-geographic-earnings-disclosure 21/49
19
We first discuss the results for the post-SFAS 131 period (second column). The
coefficient on NoDisc is negative and significant (−0.041; t-statistic = −3.49). This result can be
interpreted to mean that, controlling for other firm characteristics and fixed effects for year and
industry, non-disclosers’ effective tax rates are 4.1 percentage points lower than those of
disclosers in the post-SFAS 131 period. These results are consistent with H1. Firms that no
longer provide geographic earnings disclosure engage in more tax avoidance behavior than do
firms that provide such segment disclosure. In other words, firms utilize non-disclosure of
geographic segment earnings to conceal their tax avoidance behavior. Importantly, in the pre-
SFAS 131 period (first column), we do not observe the same relation between NoDisc and ETR.
The coefficient on NoDisc is insignificant (0.005, t-statistic = 0.40). Furthermore, the
coefficients on NoDisc in the pre-SFAS 131 period is significantly less negative (t-statistic =
3.80) than the coefficient on NoDisc in the post-SFAS 131 period (see “Test for NoDisc” near
the bottom of Table 3). This difference-in-differences test provides evidence consistent with
greater tax avoidance behavior in a reporting regime that allows non-disclosure of geographic
earnings.
With respect to H2, for the post-M-3 period (third column) the coefficient on NoDisc is
insignificant (−0.015, t-statistic = −1.24) and significantly less negative (t-statistic = 2.18) than
the coefficient on NoDisc in the post-SFAS 131 period. These results support H2 and are
consistent with the idea that IRS monitoring through greater access to firms’ foreign operations
reduces the ability of non-disclosure of geographic earnings in the financial reports to hide firms’
tax avoidance behavior. This was one of the explicit purposes in mandating Schedule M-3.16
16 We also consider the coefficient on NoDisc in annual regressions. When using ETR as the dependent variable, thecoefficient on NoDisc averages −0.045 for 1999-2004 and is negative in each year. The coefficient averages 0.004for the 1993-1998 period and is negative in three of the six years. The coefficient is negative each year for the 2005-2008 period but averages only −0.011.
8/2/2019 Tax Avoidance and Geographic Earnings Disclosure
http://slidepdf.com/reader/full/tax-avoidance-and-geographic-earnings-disclosure 22/49
20
In Panel B of Table 3, we provide the same tests using ETR_Cash. We find similar
results. In the post-SFAS 131 period, the coefficient on NoDisc is negative and significant
(−0.052; t-statistic = −4.13). Importantly, in the pre-SFAS 131 period and in the post-M-3
period, we do not observe the same relation between NoDisc and ETR_Cash. The coefficient on
NoDisc is insignificant in the pre-SFAS 131 period (0.006, t-statistic = 0.52) and insignificant in
the post-M-3 period (−0.013, t-statistic = −1.18). The coefficients on NoDisc in the pre-SFAS
131 period and the post-M-3 period are significantly less negative than the coefficient on NoDisc
in the post-SFAS 131 period. The results support H1 and H2.17,18
4.2 Matched-Sample Analyses and Constant Sample Analyses
As noted, our conclusions hold when we include controls to account for cross-sectional
differences in ETR (or ETR_Cash) between disclosers and non-disclosers (Table 3) and when we
exclude controls (Tables 1 and 2). Nevertheless, to provide additional control for the effects of
firm, industry, and time-period effects, we perform matched-firm analyses. We first do this using
Propensity Score Matching (PSM). For PSM, the first stage involves a logit model to predict the
propensity of non-disclosure. Then, based on year, industry (Fama-French 48 industry
17 As one possible means to assess the economic importance of our findings, we consider the tax consequencesassociated with non-disclosers. The 3,755 non-disclosers in the post-SFAS 131 period had an average pretax incomeof $309 million. Finding a lower ETR of 4.1 percentage points implies that these firms’ total tax savings were$47,572 million (= 3,755 × $309 million × 4.1%). In the post-M-3 period, the difference in ETR is only −1.5percentage points, indicating a relative increase of 2.6 percentage points from the post-SFAS 131 period for non-disclosers. The 4,547 non-disclosers had an average pretax income of $537 million in the post-M-3 period, so thesefirms paid additional taxes of $63,485 million (= 4,547 × $537 million × 2.6%). Corresponding amounts for
ETR_Cash are tax savings of $ 54,597 million (= $307 million × 5.2% × 3,420) in the post-SFAS 131 period andadditional taxes of $ 87,277 million (= $535 million × 3.8% × 4,293) in the post-M-3 period.18 In untabulated analyses, we consider an alternative difference-in-differences test by comparing the change in ETR for non-disclosers (treatment group) to the change in ETR for disclosers (control group) from the pre-SFAS 131period to the post-SFAS 131 period. We include in the model indicator variables for non-disclosers ( NoDisc) and thepost-SFAS 131 period (Post131), as well as their interaction (and control for the same firm characteristics and fixedeffects). The interaction provides our difference-in-differences test for H1. For H2, a similar analysis is provided bycomparing changes in ETR from the post-SFAS 131 period to the post-M-3 period for each group. We find thatthese alternative difference-in-differences tests offer the same conclusion as do our tabulated results, and point todifferences being attributed to changes in ETR of the treatment group (i.e., non-disclosers).
8/2/2019 Tax Avoidance and Geographic Earnings Disclosure
http://slidepdf.com/reader/full/tax-avoidance-and-geographic-earnings-disclosure 23/49
21
classification), and the propensity score (predicted value from the first stage), we match each
discloser with one or two non-disclosers. The matching criterion requires a difference in
propensity scores of less than 0.025, which equals 20% of the standard deviation of the
propensity score (Austin 2011). In the second stage, the matched sample is used to tests the
relation between effective tax rates ( ETR and ETR_Cash) and non-disclosure of geographic
earnings ( NoDisc).
As shown in Table 4 using the post-SFAS 131 period, results are similar to those reported
in Table 3. For our matched samples, we continue to find evidence that the relation between ETR
[ ETR_Cash] and NoDisc is significantly negative (t-statistic = −2.45) [t-statistic= −2.16].
19
Untabulated results show a t-statistic of −2.91 [−3.07] when instead employing a one-to-two
matching methodology.20
We next provide analysis of attribute matching based on year, industry, and size. Industry
matching is based on Fama-French 48 industry classification, and firm size requires matched
firms to have an absolute difference in LnMV less than one. For the post-SFAS 131 period, we
find a match for 1,420 observations (i.e., 710 disclosers and 710 non-disclosers). In an
untabulated regression of ETR on NoDisc and control variables, the coefficient on NoDisc is
negative and significant (−0.035, t-statistic = −2.58). When instead using a one-to-two matching
procedure we have a sample of 1,986 observations and the estimated coefficient on NoDisc is
−0.038 (t-statistic = −2.94). For ETR_Cash, the coefficients on NoDisc are −0.050 and −0.054
and both are significant (t-statistics = −3.54 and −3.47).
19 Untabulated tests show that in the pre-SFAS 131 period and in the post-M-3 period, neither ETR nor ETR_Cash
relates to NoDisc.20 A one-to-two match is recommended over one-to-one matching by Cram, Karan, and Stuart (2009) as it mayreduce noise in the matched sample.
8/2/2019 Tax Avoidance and Geographic Earnings Disclosure
http://slidepdf.com/reader/full/tax-avoidance-and-geographic-earnings-disclosure 24/49
22
As an additional (untabulated) test, we rerun the analyses using a constant sample when
comparing the pre- versus post-SFAS 131 periods and when comparing the post-SFAS 131
versus post-M-3 periods. With this approach, any concerns over correlated omitted variables that
are not addressed otherwise in our research design are further alleviated. The disadvantages of
using a constant sample are that we impose survivorship bias and that we potentially lower the
power of our tests due to the much smaller sample size.21 Using the smaller constant samples, the
inferences remain unchanged. The coefficient on NoDisc remains significantly negative in the
post-SFAS 131 period and is not significantly different from zero in either the pre-SFAS 131
period or in the post-M-3 period. These results mitigate concerns that our conclusions are driven
by correlated omitted variables.
4.3. Within-Firm Control Using Foreign versus Domestic Tax Rates
The results to this point are consistent with non-disclosers shifting more income from
higher-tax jurisdictions (such as the U.S. or other foreign operations) to lower-tax foreign
jurisdictions in the post-SFAS 131 period. To provide further evidence of this behavior, we
consider differences in firms’ domestic effective tax rates ( ETR_Dom) and differences in foreign
effective tax rates ( ETR_For ). Our first prediction is that when a firm shifts income from
domestic operations to foreign operations, the firm’s ETR_Dom should not change.22 If,
however, we observe a negative relation between NoDisc and ETR_Dom, then it is more likely
the case that the lower worldwide ETR for non-disclosers in the post-SFAS 131 period is being
21 Specifically, we do not require that all sample firms be present over the entire sample period (from the beginningof the pre-SFAS 131 period to the end of the post-M-3 period), as this would unduly reduce the sample size withoutoffering any benefits. Instead, we require that firms to have data for at least (1) 11 years throughout the pre- andpost-SFAS 131 periods or (2) 10 years throughout the post-131 and post-M-3 periods. For test (1) using ETR wehave 1,622 firm-year observations and for test (2) we have 2,920 observations.22 Simplified, the U.S. tax code has a corporate income tax rate structure that produces a flat 34% tax rate onincomes from $335,000 to $10,000,000, gradually increasing to a flat rate of 35% on incomes above $18,333,333. Inpractice the tax rate is quite flat over a wide range of incomes applicable to our sample.
8/2/2019 Tax Avoidance and Geographic Earnings Disclosure
http://slidepdf.com/reader/full/tax-avoidance-and-geographic-earnings-disclosure 25/49
23
caused by factors not controlled for in the model. Thus, testing the relation between NoDisc and
ETR_Dom provides a within-firm control for changes in effective tax rates that could occur for
natural changes in business operations across reporting regimes.
Our second prediction relates to ETR_For . When a multinational firm operates in at least
two foreign jurisdictions, with one having a higher tax rate than the other, shifting income either
(1) from domestic operations to the lower-tax foreign jurisdiction or (2) from the higher-tax
foreign jurisdiction to the lower-tax one causes ETR_For to decline.23 Observing a reduction in
the ETR_For for non-disclosers during the post-SFAS 131 period makes it more likely the case
that firms utilize non-disclosure of geographic earnings to shift income to lower-tax foreign
jurisdictions.
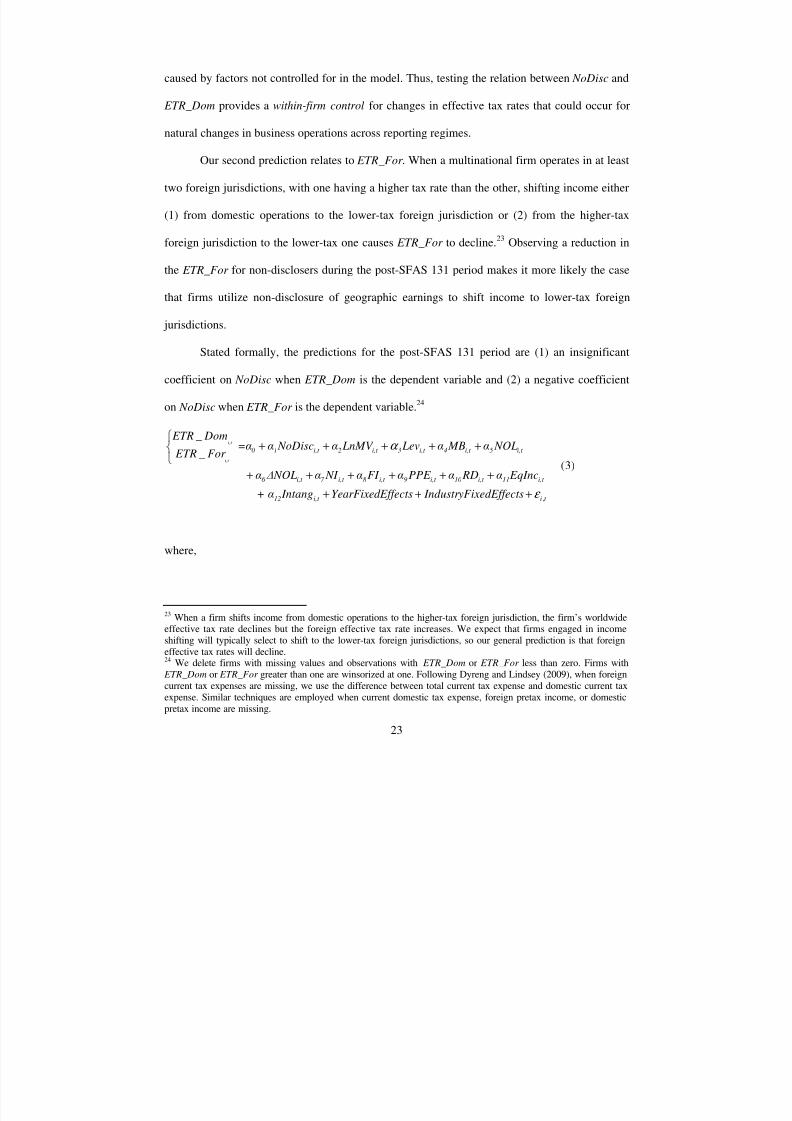
Stated formally, the predictions for the post-SFAS 131 period are (1) an insignificant
coefficient on NoDisc when ETR_Dom is the dependent variable and (2) a negative coefficient
on NoDisc when ETR_For is the dependent variable.24
t ii,t 12
i,t 11i,t 10i,t 9i,t 8i,t 7 i,t 6
i,t 5i,t 4i,t 3i,t 2i,t 10
xedEffects IndustryFi ffectsYearFixedE Intang+ α
EqIncα RDαPPE αFI α NI α ∆ NOLα
NOLα MBα Lev LnMV α NoDiscα=α
For ETR
Dom ETR
i,t
i,t
,
_
_
ε
α
+++
++++++
+++++
)3(
where,
23 When a firm shifts income from domestic operations to the higher-tax foreign jurisdiction, the firm’s worldwideeffective tax rate declines but the foreign effective tax rate increases. We expect that firms engaged in incomeshifting will typically select to shift to the lower-tax foreign jurisdictions, so our general prediction is that foreigneffective tax rates will decline.24 We delete firms with missing values and observations with ETR_Dom or ETR_For less than zero. Firms with
ETR_Dom or ETR_For greater than one are winsorized at one. Following Dyreng and Lindsey (2009), when foreigncurrent tax expenses are missing, we use the difference between total current tax expense and domestic current taxexpense. Similar techniques are employed when current domestic tax expense, foreign pretax income, or domesticpretax income are missing.
8/2/2019 Tax Avoidance and Geographic Earnings Disclosure
http://slidepdf.com/reader/full/tax-avoidance-and-geographic-earnings-disclosure 26/49
24
ETR_Dom = Domestic effective tax rate, measured as current domestic tax expense/domesticpretax income
ETR_For = Foreign effective tax rate, measured as current foreign tax expense/foreignpretax income
Table 5 shows the estimation results for model (3). The sample is from the post-SFAS
131 period (December 1998 to November 2004). The first column uses domestic effective tax
rates ( ETR_Dom) as the dependent variable, and the second column uses foreign effective tax
rates ( ETR_For ) as the dependent variable. Consistent with expectations, we find an insignificant
coefficient on NoDisc when ETR_Dom is the dependent variable (−0.005, t-statistic = −0.036)
and a negative coefficient on NoDisc when ETR_For is the dependent variable (−0.052, t-
statistic = −3.68). This finding suggests that after adoption of SFAS 131 differences in
worldwide ETR documented in Table 3 are less likely to be caused by differences in underlying
business operations (i.e., there is no association between NoDisc and ETR_Dom). However,
firms that no longer provide geographic earnings disclosure engage in greater tax avoidance by
shifting income to lower-tax foreign segments.25
5. Additional Tests (Untabulated)
5.1 Alternative Measures of Tax Avoidance
The main analyses use ETR and ETR_Cash in the current year as a measure of tax
avoidance. Because current year measures are potentially volatile, this subsection considers long-
run average corporate tax rates ( ETR_Long and ETR_Cash_Long) as alternative measures of tax
avoidance. ETR_ Long and ETR_Cash_ Long are motivated by Dyreng, Hanlon, and Maydew
25 Untabulated tests show that the relation between ETR_Dom and NoDisc does not vary across reporting regime,but the relation between ETR_For and NoDisc remains significantly more negative in the post-SFAS 131 period.Unfortunately, data limitations prevent us from providing corresponding tests using domestic and foreign
ETR_Cash.
8/2/2019 Tax Avoidance and Geographic Earnings Disclosure
http://slidepdf.com/reader/full/tax-avoidance-and-geographic-earnings-disclosure 27/49
25
(2008) and are measured as the firm’s average ETR and ETR_Cash, respectively, during each
reporting regime. For tests using ETR_Long and ETR_Cash_Long we also use the average values
within the reporting regime for control variables. Results are similar to those reported in Table 3.
Consistent with H1 and H2, the findings using long-run effective tax rates suggest that after
adopting SFAS 131 and before adopting Schedule M-3, firms that no longer provide geographic
earnings disclosure engage in more tax avoidance behavior than do firms that provide such
segment disclosure. The coefficient on NoDisc is significantly negative for both ETR_Long
(−0.058, t-statistic = −3.40) and ETR_Cash_Long (−0.033, t-statistic = −1.88).
5.2 Cross Validation Using Predicted ETR
We also validate the impact of NoDisc on our conclusions by estimating the predicted
values of ETR for disclosers and non-disclosers in the post-SFAS 131 period. Specifically, we
estimate equation (1) in the pre-SFAS 131 period after eliminating NoDisc from the model.
Doing so allows us to estimate the normal relation between ETR effective tax rates and firm
characteristics expected to relate to the level of ETR. Using the parameter estimates from the pre-
SFAS 131 model, we then calculate the predicted values of ETR using firms’ post-SFAS 131
data. Thus, this approach obtains predicted values of ETR without the effect of our hypothesized
variable ( NoDisc).
As expected, without the impact of NoDisc, we find that the difference in predicted
values of disclosers’ and non-disclosers’ ETR in the post-SFAS 131 period is minor (0.5
percentage points) compared with the difference previously reported for actual ETR in Table 3
(4.1 percentage points). These results suggest that the difference in actual ETR between
disclosers and non-disclosers in the post-SFAS 131 period could not have been predicted based
8/2/2019 Tax Avoidance and Geographic Earnings Disclosure
http://slidepdf.com/reader/full/tax-avoidance-and-geographic-earnings-disclosure 28/49
26
on changes in our control variables from the pre-SFAS 131 period. This test validates the impact
that non-disclosure of geographic earnings ( NoDisc) has on the difference in actual ETR in the
post-SFAS 131 period. We repeat the procedure above using ETR_Cash and once again find
little evidence that differences in ETR_Cash could have been predicted (0.4 percentage points).
5.3 Other Robustness Tests
5.3.1 Control for Alternative Disclosure of Geographic Earnings.
To ensure that our non-disclosing firms do not provide geographic earnings information
elsewhere in the annual report, we select a random sample of 30 firms and examine their annual
reports in detail. We find no instance in which our non-disclosing firms discussed geographic
earnings, suggesting that non-disclosure in the segment notes means non-disclosure in the annual
report. All of these firms report geographic sales and identifiable long-lived assets as required by
SFAS 131 in the segment note.
5.3.2 Control for Possible Mandatory Disclosers
As discussed above, firms that define their primary segments along geographic lines are
required to disclose geographic earnings. Note that whether geographic earnings are disclosed
voluntarily (secondary segments) or by mandate (primary segments) is not crucial to our research
design. Disclosure allows tax authorities and other external parties to monitor the activities of
managers. Non-disclosure reduces this monitoring role. Thus, we are concerned only with the
disclosure/non-disclosure distinction for all sample firms. Nevertheless, in untabulated analyses
8/2/2019 Tax Avoidance and Geographic Earnings Disclosure
http://slidepdf.com/reader/full/tax-avoidance-and-geographic-earnings-disclosure 29/49
27
we find that our results remain robust to excluding those firms that are required to disclose
geographic earnings.26
5.3.3 Control for the American Jobs Creation Act (AJCA) of 2004
A significant tax event that occurs around the implementation of Schedule M-3 is the
AJCA. This Act provided a number of tax rule changes. Most relevant to our study, the Act
provided a one-time tax holiday to U.S. companies by allowing them to repatriate earnings from
their foreign subsidiaries at a reduced tax rate (Albring, Dzuranin, and Mills 2005). Firms could
elect to have this reduced rate in either 2004 or 2005. To be certain that the provisions of this Act
do not affect our conclusions, we eliminate the years 2004 and 2005 from our post-SFAS 131
sample and post-M-3 sample. After excluding these years, we find results similar to those
reported in Table 3. For ETR, the coefficient on NoDisc in the post-SFAS 131 period is negative
and significant (−0.044; t-stat = −3.62), and the coefficient on NoDisc in the post-M-3 period is
not significant (−0.010; t-stat = −0.66). For ETR_Cash, the coefficient on NoDisc in the post-
SFAS 131 period is negative and significant (−0.059; t-stat = −4.37), and the coefficient on
NoDisc in the post-M-3 period is not significant (−0.008; t-stat = −0.53).
5.3.4 Control for differences in foreign and domestic pretax profit margins
As discussed previously, firms that choose to no longer disclose geographic earnings
after implementation of SFAS 131 must still disclose total foreign earnings (SEC Regulation
§210.4-08(h)) and foreign sales (SFAS 131). Thus, it is possible that public disclosure of total
pretax foreign profit margins and domestic pretax profit margins could reveal managers’ tax
avoidance strategies. H1 and H2 are based on the idea that it is firms’ geographic earnings
26 Specifically, we remove 137 observations from the post-SFAS 131 period.
8/2/2019 Tax Avoidance and Geographic Earnings Disclosure
http://slidepdf.com/reader/full/tax-avoidance-and-geographic-earnings-disclosure 30/49
28
disclosures that are especially revealing of managers’ tax avoidance behavior. If this is the case,
tax avoidance behavior should be associated with NoDisc beyond any measure of differences in
foreign and domestic profit margins.
To test the incremental effect of NoDisc beyond differences in foreign and domestic
profit margins, we create an indicator variable ( High_For ) equal to 1 when the firm’s foreign
pretax profit margin is greater than its domestic pretax profit market, and the domestic pretax
profit margin is positive, 0 otherwise. We include this indicator variable to see whether NoDisc
continues to have incremental explanatory power for ETR.27 We find robust evidence that this is
the case. After controlling for High_For , the coefficient on NoDisc in the post-SFAS 131 period
is significantly negative (−0.042; t-statistic = −3.57). Furthermore, we find no significant relation
between High_For and ETR (−0.013; t-statistic = −1.46). Similar results are obtained for
ETR_Cash. The coefficient on NoDisc in the post-SFAS 131 period is significantly negative
(−0.051; t-statistic = −4.06) while the coefficient on High_For is much lower (−0.015; t-statistic
= −1.71).Thus, from our model’s perspective, non-disclosure of geographic earnings provides a
clearer indicator of firms’ tax avoidance behavior than does the difference in foreign and
domestic profit margins.
5.3.5 Control for probability of an IRS audit
Prior studies find that a higher threat of an IRS audit reduces tax avoidance behavior
(Hoopes, Mescall, and Pittman 2011), increases financial reporting quality (Hanlon, Hoopes, and
Shroff 2011), and lowers the cost of equity and debt financing (e.g., Guedhami and Pittman
2008; Ghoul, Guedhami, and Pittman 2011). We predict that better monitoring through higher
27 Only firms with positive domestic pretax income would be willing to further shift domestic income overseas. Weadmit that this measure is preliminary and could be refined in other ways by future research.
8/2/2019 Tax Avoidance and Geographic Earnings Disclosure
http://slidepdf.com/reader/full/tax-avoidance-and-geographic-earnings-disclosure 31/49
29
probability of an IRS audit will reduce the association between tax avoidance behavior and non-
disclosure of geographic earnings.
We separate firms into high versus low probability of receiving an IRS audit.28 For the
post-SFAS 131 period, the relation between ETR and NoDisc remains significantly negative for
firms with a low probability of an IRS audit (−0.049; t-statistic = −2.59). This relation
diminishes when there is a high probability of IRS audit (−0.025; t-statistic = −0.82). For
ETR_Cash the coefficient on NoDisc is significantly negative (−0.044; t-statistic = −2.32) for
firms with a low probability of an IRS audit but insignificant for firms with a high probability of
IRS audit (−0.033; t-statistic = −0.97), although the difference in coefficients between the two
groups is not significant. Overall, we conclude that the results support the expectations that firms
more closely monitored by the IRS are less likely to have a relation between tax avoidance and
non-disclosure of geographic segment earnings.
6. Concluding Remarks
Corporate tax avoidance has attracted considerable attention from financial scholars.
However, the relation between tax avoidance behavior and a firm’s financial reporting behavior
is largely unexplored. We argue that firms reduce the quality of disclosures in an attempt to mask
their tax avoidance behavior. Specifically, we consider that many multinational firms may wish
to shift income to low-tax foreign jurisdictions to avoid taxes, and thus they would prefer to
reduce their transparency related to foreign operations to make such tax avoidance behavior
more difficult to detect by U.S. and foreign tax authorities, policymakers, and the general public.
28 In these studies, firms are classified as having a high probability of receiving an IRS audit if they have total assetsgreater than $250 million and operate in any of the following industries: Natural Resources, Construction, HeavyManufacturing, and Transportation (two digit SIC : 07-09, 12-17, 34, 37, 45 and 47). For further details, see dataprovided by Transactional Records Access Clearinghouse (2007a, 2007b).
8/2/2019 Tax Avoidance and Geographic Earnings Disclosure
http://slidepdf.com/reader/full/tax-avoidance-and-geographic-earnings-disclosure 32/49
30
We test our hypothesis using natural experiments provided by two recent U.S.
regulations. First, after implementation of SFAS 131 in December 1998, most firms can
voluntarily decide whether to disclose geographic earnings and most firms choose not to
disclose. Second, after the adoption of Schedule M-3 in December 2004, multinational firms are
required to provide a detailed reconciliation of book-tax differences, including detailed
information on each foreign entity included in financial net income but excluded from taxable
net income. Thus, after implementation of Schedule M-3, non-disclosure of geographic earnings
in the financial reports has less of an impact in concealing the profitability of firms’ foreign
operations from the IRS.
Using a sample of 13,831 firm-year observations for the 16 years (1993-2008)
surrounding the adoption of SFAS 131 and Schedule M-3, we compare effective tax rates in the
pre-SFAS 131 period (January 1993 to November 1998), post-SFAS 131 period (December 1998
to November 2004), and post-M-3 period (December 2004 to December 2008) to test our
predictions. We find that firms no longer disclosing geographic earnings in the post-SFAS 131
period have effective tax rates (cash effective tax rates) that are 4.1 (5.2) percentage points lower
than those of firms that continue to disclose geographic earnings. However, prior to
implementation of SFAS 131 (when all firms were required to disclose geographic earnings in
segment reports), eventual non-disclosers’ effective tax rates were not materially different from
those of continual disclosers. After implementation of Schedule M-3 (when all firms were
required to disclose detailed foreign profits to the IRS), disclosers’ and non-disclosers’ effective
tax rates were again not significantly different. These results are robust to several firm-level
control variables and several other tests. Collectively, our findings are consistent with mangers
being more willing (and able) to engage in tax avoidance activities when they perceive the costs
8/2/2019 Tax Avoidance and Geographic Earnings Disclosure
http://slidepdf.com/reader/full/tax-avoidance-and-geographic-earnings-disclosure 33/49
31
of doing so to be lower because of reduced transparency associated with non-disclosure of
geographic earnings.
We acknowledge that our study has limitations, and we emphasize the following facts.
First, the validity of our inferences depends on the reliability of our measure for tax avoidance.
In the main analyses, we use the annual effective tax rate and annual cash effective tax rate.
These measures have been widely used as a proxy for tax avoidance in the literature. To provide
additional comfort, we also use long-run effective tax rates as alternative measures of tax
avoidance and find consistent results. Second, it is possible that other events around the
adoptions of SFAS 131 and Schedule M-3 could explain the results (e.g., SOX and AJCA).
However, we have no reason to expect these other events to differentially affect disclosers’ and
non-disclosers’ effective tax rates, as hypothesized by SFAS 131 and Schedule M-3.
Furthermore, in an attempt to control for these potentially unobservable variables, our study
employs a difference-in-differences approach to compare disclosers’ and non-disclosers’ tax
avoidance activity before and after adoptions of SFAS 131 and Schedule M-3. We also employ a
matched-sample design, a constant-sample design, and cross validation using predicted values of
effective tax rates to ensure the robustness of our conclusions. To further improve the power of
our analyses, we decompose the effective tax rate into foreign tax rates and domestic tax rates,
and this design makes the underlying relations between geographic earnings disclosure and tax
avoidance more transparent.
8/2/2019 Tax Avoidance and Geographic Earnings Disclosure
http://slidepdf.com/reader/full/tax-avoidance-and-geographic-earnings-disclosure 34/49
32
References
Albring S., A. Dzuranin, and L. Mills. 2005. Tax savings on repatriations of foreign earnings under theAmerican Jobs Creation Act of 2004. Tax Notes 108 (7): 655–669.
American Institute of Certified Public Accountants (AICPA). 2011. Comments on Schedule M-3 with theobjective of reducing burden and duplication. April 27.
Association for Accountancy and Business Affairs Limited. 2003. A Proposed International AccountingStandard. Reporting Turnover and Tax by Location.http://visar.csustan.edu/aaba/ProposedAccstd.pdf .
Austin, P. 2011. Optimal caliper widths for propensity-score matching when estimating differences inmeans and differences in proportions in observational studies. Pharmaceutical Statistics 10 (2):150-161.
Baginski, S. P., Hassell, J. M. Kimbrough, M. D. 2002. The effect of legal environment on voluntarydisclosure: Evidence from management earnings forecasts issued in U.S. and Canadian markets.The Accounting Review 77. 25-50.
Behn, B., N. Nichols, and D. Street. 2002. The predictive ability of geographic segment disclosures byU.S. companies: SFAS No. 131 vs. SFAS No. 14. Journal of International Accounting Research 1: 31-44.
Bens, D., P. Berger, and S. Monahan. 2011. Discretionary Disclosure in Financial Reporting: AnExamination Comparing Internal Firm Data to Externally Reported Segment Data. The
Accounting Review 86 (2): 417-49.Berger, P.G., and R. Hann. 2007. Segment Profitability and the Proprietary and Agency Costs of
Disclosure. The Accounting Review 82: 869-906.Beyer, A., D.A. Cohen, T.Z. Lys, and B. R. Walther. 2010. The financial reporting environment: Review
of the recent literature. Journal of Accounting and Economics 50: 296-343.Blaylock, B. 2011. Do managers extract economically significant rents through tax aggressive
transactions? Working paper, Oklahoma State University.Boatsman, J., B. Behn, and D. Patz. 1993. A test of the use of geographical segment disclosures. Journal
of Accounting Research 31 (Supplement): 46-64.Botosan, C. and M. Stanford. 2005. Managers’ motives to withhold segment disclosures and the effect of
SFAS No. 131 on analysts’ information environment. The Accounting Review 80: 751-771.Boynton, C., P. DeFilippes, and E. Legel. 2008. A first look at 2005 Schedule M-3 corporate reporting.Tax Notes: 564-573.
Boynton, C., P. DeFilippes, P. Lisowsky, and L. Mills. 2004. Consolidation Anomalies in Form 1120Corporate Tax Return Data.’ Tax Notes 104 (4): 405-417.
Boynton, C., and L. Mills. 2004. The Evolving Schedule M-3: A New Era of Corporate Show and Tell? National Tax Journal 57 (33): 757-772.
Boynton, C., and W. Wilson. 2006. A Review of Schedule M-3: The Internal Revenue Service’s NewBook-Tax Reconciliation Tool. Petroleum Accounting and Financial Management Journal 25(1): 1-16.
Chen, S., X. Chen, Q. Cheng and T. Shevlin. 2010. Are family firms more tax aggressive than non-familyfirms? Journal of Financial Economics 95: 41-61.
Christian, C. and T. Schultz. 2005. ROA based estimates of income shifting by U.S. multinationalcorporations. Available at http://www.irs.gov/pub/irs-soi/05christian.pdf Citizens for Tax Justice and the Institute on Taxation and Economic Policy, 2011, Corporate Taxpayers &
Corporate Tax Dodgers 2008-10. Available athttp://www.ctj.org/corporatetaxdodgers/CorporateTaxDodgersReport.pdf
Collins, J., D. Kemsley, and M. Lang. 1998. Cross-jurisdictional income shifting and earnings valuation. Journal of Accounting Research 36: 209-229.
Collins, J. H. and D. A. Shackelford. 1999. Taxes and Cross-Border Investments: The EmpiricalEvidence. Tax Notes 4: 131-134.
8/2/2019 Tax Avoidance and Geographic Earnings Disclosure
http://slidepdf.com/reader/full/tax-avoidance-and-geographic-earnings-disclosure 35/49
33
Cram, D.P., V. Karan, and I. Stuart. 2009. Three Threats to Validity of Choice-based and Matched-Sample Studies in Accounting Research. Contemporary Accounting Research 26 (2): 477-516.
Desai, M., and D. Dharmapala. 2004. Earnings management and corporate tax shelters. Working paper,Harvard University.
Desai, M., and D. Dharmapala. 2006. Corporate tax avoidance and high-powered incentives. Journal of
Financial Economics 79:145-179.
Desai, M., A. Dyck, and L. Zingales. 2007. Theft and taxes. Journal of Financial Economics, 84: 591-623.
Dharmapala, D., and J. Hines. 2009. Which countries become tax havens? Journal of Public Economics
93: 1058-1068Dharmapala, D., and N. Riedel. 2011. Earnings shocks and tax-motivated income-shifting: Evidence from
European multinationals. 5th Annual Conference on Empirical Legal Studies Paper; IllinoisProgram in Law, Behavior and Social Science Paper No. LBSS11-09.
Donohoe, M., and G. McGill. 2011. The Effects of Increased Book-Tax Difference Tax ReturnDisclosures on Firm Valuation and Behavior. Journal of the American Taxation Association 33(2): 35-65.
Drucker, J. 2010. Google 2.4% Rate Shows How $60 Billion Lost to Tax Loopholes. Bloomberg (October21, 2010).
Dyreng, S., M. Hanlon, and E. Maydew. 2008. Long-run corporate tax avoidance. The Accounting Review 83: 61–82.
Dyreng, S., M. Hanlon, and E. Maydew. 2010. The Effects of Executives on Corporate Tax Avoidance.
The Accounting Review 85: 1163-1189. Dyreng, S., and B. Lindsey. 2009. Using financial accounting data to examine the effect of foreign
operations located in tax havens and other countries on US multinational firms’ tax rates. Journal
of Accounting Research 47: 1238-1316.Faulkender, M., and M. Petersen. 2011. Investment and Capital Constraints: Repatriations Under the
American Jobs Creation Act. Working paper, University of Maryland and NorthwesternUniversity.
Financial Accounting Standards Board (FASB). 1997. Statement of Financial Accounting Standards No.
131, Disclosures about Segments of an Enterprise and Related Information. Norwalk, CT:
Financial Accounting Standards Board.Financial Task Force. 2011. Country-by-Country Reporting.
http://www.financialtaskforce.org/issues/country-by-country-reporting.Frank, M., L. Lynch, and S. Rego. 2009. Tax reporting aggressiveness and its relation to aggressive
financial reporting. The Accounting Review 84: 467–496.Ghoul, S., O. Guedhami, and J. Pittman. 2011. The role of IRS monitoring in equity pricing in public
firms. Contemporary Accounting Research 28 (2): 643-674.Graham, J., M. Hanlon, and T. Shevlin. 2010. Barriers to mobility: The lockout effect of U.S. taxation of
worldwide corporate profits. National Tax Journal 63: 1111–1144.Graham, J., M. Hanlon, and T. Shevlin. 2011. Real Effects of Accounting Rules: Evidence from
Multinational Firms’ Investment Location and Profit Repatriation Decisions. Journal of
Accounting Research 49: 137–185.
Guedhami, O., and J. Pittman. 2008. The importance of IRS monitoring to debt pricing in private firms. Journal of Financial Economics 90 (1): 38-58.
Hanlon, M. and S. Heitzman. 2010. A review of tax research. Journal of Accounting and Economics 50:127-178.
Hanlon, M., J. Hoopes, and N. Shroff. 2011. The effect of tax authority monitoring and enforcement onfinancial reporting quality. Working paper, MIT and University of Michigan.
Hanlon, M., and J. Slemrod. 2009. What does tax aggressiveness signal? Evidence from stock pricereactions to news about tax shelter involvement. Journal of Public Economics 93: 126-141.
8/2/2019 Tax Avoidance and Geographic Earnings Disclosure
http://slidepdf.com/reader/full/tax-avoidance-and-geographic-earnings-disclosure 36/49
34
Harris, D., M., J. Slemrod, and B. Yeung. 1993. Income shifting in U.S. multinational corporations. In:Giovannini, A., R. Hubbard, and J. Slemrod, (Eds.), Studies in International Taxation. Chicago:University of Chicago Press.
Harris, M. 1998. The association between competition and manager’ business segment reporting choices. Journal of Accounting Research 36:111-128.
Hayes, R., and R. Lundholm. 1996. Segment reporting to the capital market in the presence of a
competitor. Journal of Accounting Research 34:261-279.Healy, P. M., Palepu, K. G., Sweeney, A. H. 1999. Stock performance and intermediation changes
surrounding sustained increases in disclosure. Contemporary Accounting Research 16. 485-520.Herrmann, D., and W.B. Thomas. 2000. An analysis of segment disclosures under SFAS No. 131 and
SFAS No. 14. Accounting Horizons 14: 287-302.Hines, J., and R. Eric. 1994. Fiscal paradise: Foreign tax havens and American business. The Quarterly
Journal of Economics 109 (1):149-82.Hoopes, J.L., D. Mescall, and J. Pittman. 2011. Do IRS Audits Deter Corporate Tax Avoidance? Working
paper, University of Michigan, University of Saskatchewan, and Memorial University of Newfoundland.
Hope, O.-K., and W.B. Thomas 2008. Managerial empire building and firm disclosure, Journal of
Accounting Research 46: 591-626.
Hope, O.-K., T. Kang, W.B. Thomas, and F. Vasvari. 2009. The effects of SFAS 131 geographic segmentdisclosures by U.S. multinational companies on the valuation of foreign earnings. Journal of
International Business Studies 40: 421–443.Hope, O.-K., W.B. Thomas, and G. Winterbotham. 2009. Geographic earnings disclosure and trading
volume. Journal of Accounting and Public Policy 28: 167–188.Houlder, V. 2010. Tax Claims Hit Reputation as well as Coffers. The Financial Times (November 9,
2010).Kim, J., Y. Li, and L. Zhang. 2011. Corporate Tax Avoidance and Stock Price Crash Risk: Firm-Level
Analysis. Journal of Financial Economics 100: 639-662.Lang, M., Lundholm, R. 1993. Cross-sectional determinants of analyst ratings of corporate disclosures.
Journal of Accounting Research 31: 246-271.Lang, M., Lundholm, R. 2000. Voluntary disclosure and equity offerings: Reducing information
asymmetry or hyping the stock? Contemporary Accounting Research 17. 623-663.Manzon, G., and G. Plesko. 2002. The relation between financial and tax reporting measures of income.
Tax Law Review 55:175–214.Mills, L. 1998. Book-tax differences and internal revenue service adjustments. Journal of Accounting
Research 36, 343–356.Mills, L., and G. Plesko. 2003. Bridging the gap: A proposal for more informative reconciling of book
and tax income. National Tax Journal 56: 865-893.Nagar, V., Nanda, D., Wysocki, P. 2003. Discretionary disclosure and stock-based incentives. Journal of
Accounting and Economics 34. 283-309.Omer, T., K. Molloy and D. Ziebart. 1993. An investigation of the firm size - effective tax rate relation in
the 1980s. Journal of Accounting, Auditing, and Finance 8 167-182.Publish What You Pay. 2010. Campaign for a country by country reporting standard.
http://www.publishwhatyoupay.org/country-by-country-reporting.Rego, S. 2003. Tax avoidance activities of U.S. multinational corporations. Contemporary Accounting
Research 20, 805-833.Rego, S., and R. Wilson. 2012. Equity Risk Incentives and Corporate Tax Aggressiveness. Forthcoming,
Journal of Accounting Research.Scholes, M., M. Wolfson, M. Erickson, E. Maydew and T. Shevlin. 2005. Taxes and business strategy: A
planning approach. 3rd edition, Pearson Prentice Hall, Upper Saddle River, NJ.Shackelford, D., and T. Shevlin. 2001. Empirical tax research in accounting. Journal of Accounting and
Economics 31: 321-387.

8/2/2019 Tax Avoidance and Geographic Earnings Disclosure
http://slidepdf.com/reader/full/tax-avoidance-and-geographic-earnings-disclosure 37/49
35
Shaheen, S. 2011. Why should taxpayers support country-by-country reporting? International Tax Review (October 10, 2011).
Shivdasani, A. 1993. Board composition, ownership structure, and hostile takeovers. Journal of
Accounting and Economics 16: 167-198.Sullivan, M. 2004. Data shows dramatic shift of profits to tax havens, Tax Notes 13: 1190-1200.Tax Justice Network. 2003. Why is Country-by-Country financial reporting by Multinational Companies
so important? Available from www.taxjustice.net.Thomas, W. 2000. The value-relevance of geographic segment earnings disclosures under SFAS 14.
Journal of International Financial Management and Accounting 11: 133-155.Transactional Records Access Clearinghouse. 2007a. IRS face-to-face audits of federal income tax returns
filed by corporations. http://trac.syr.edu/tracirs/trends/v10/corporations.html.Transactional Records Access Clearinghouse. 2007b. Audit rates for large corporations with assets of
$250 million or more. http://trac.syr.edu/tracirs/trends/v10/audindustry.html.United States Government Accountability Office. 2008. U.S. Multinational Corporations. Effective Tax
Rates are Correlated with Where Income is Reported. http://www.gao.gov/assets/280/279648.pdf .United States Senate (Permanent Subcommittee on Investigations). 2006. Tax Haven Abuses: The
Enablers, the Tools, and Secrecy. http://www.gpo.gov/fdsys/pkg/CHRG-109shrg29760/html/CHRG-109shrg29760.htm.
Werdigier, J. 2011. Tax Evaders Face Greater Scrutiny as National Debts Pile Up. The New York Times (November 2, 2011; Special Report: Global Economy).
World Bank. 2010. Comment Letter to the International Accounting Standards Board (July 30, 2010).http://www.ifrs.org/NR/rdonlyres/7FAC2D52-A064-41BD-8BA8-445245232E0B/0/CL55.pdf
Zimmerman, J. 1983. Taxes and firm size. Journal of Accounting and Economics 5: 119-149.
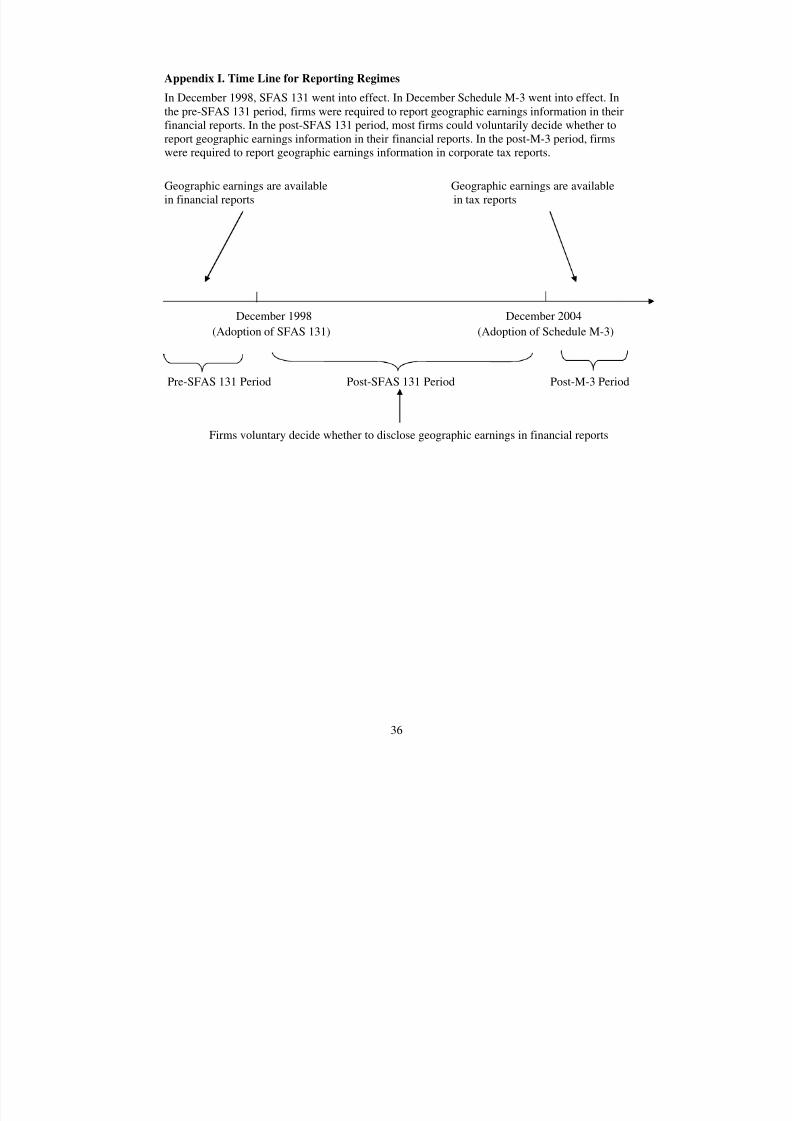
8/2/2019 Tax Avoidance and Geographic Earnings Disclosure
http://slidepdf.com/reader/full/tax-avoidance-and-geographic-earnings-disclosure 38/49
36
Appendix I. Time Line for Reporting Regimes
In December 1998, SFAS 131 went into effect. In December Schedule M-3 went into effect. Inthe pre-SFAS 131 period, firms were required to report geographic earnings information in theirfinancial reports. In the post-SFAS 131 period, most firms could voluntarily decide whether toreport geographic earnings information in their financial reports. In the post-M-3 period, firms
were required to report geographic earnings information in corporate tax reports.
Geographic earnings are available Geographic earnings are availablein financial reports in tax reports
December 1998 December 2004
(Adoption of SFAS 131) (Adoption of Schedule M-3)
Pre-SFAS 131 Period Post-SFAS 131 Period Post-M-3 Period
Firms voluntary decide whether to disclose geographic earnings in financial reports
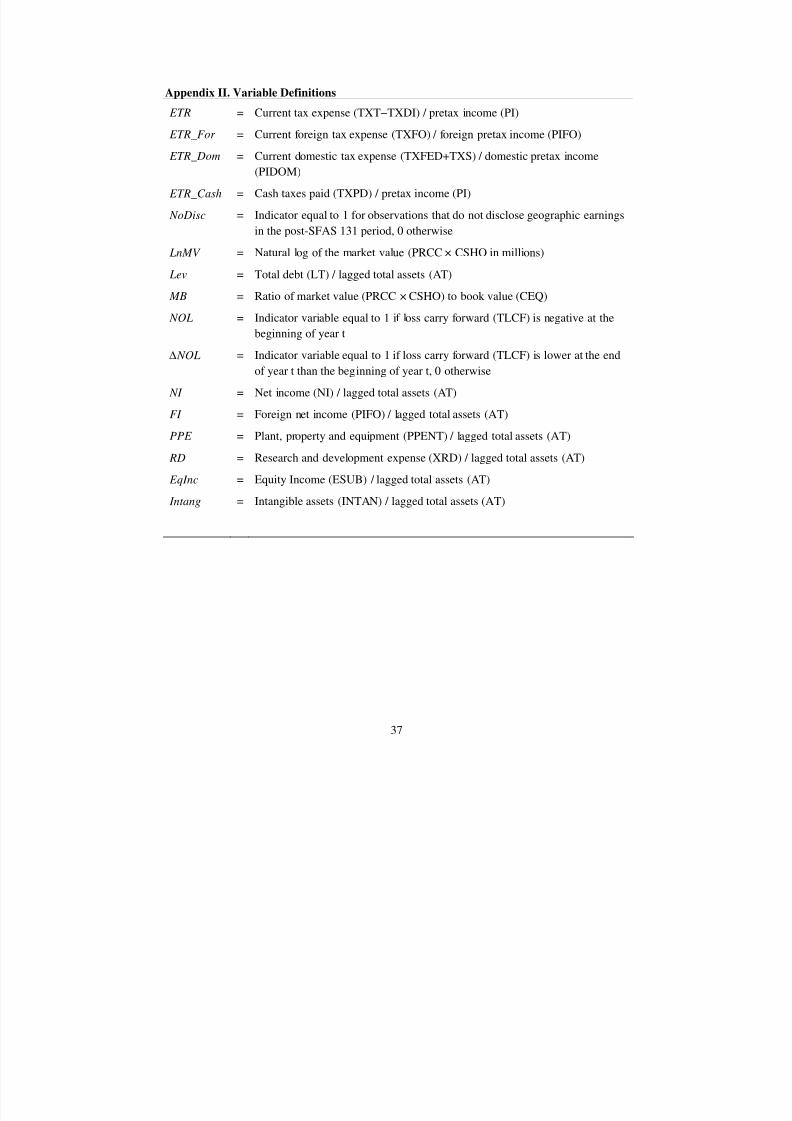
8/2/2019 Tax Avoidance and Geographic Earnings Disclosure
http://slidepdf.com/reader/full/tax-avoidance-and-geographic-earnings-disclosure 39/49
37
Appendix II. Variable Definitions
ETR = Current tax expense (TXT−TXDI) / pretax income (PI)
ETR_For = Current foreign tax expense (TXFO) / foreign pretax income (PIFO)
ETR_Dom = Current domestic tax expense (TXFED+TXS) / domestic pretax income
(PIDOM)
ETR_Cash = Cash taxes paid (TXPD) / pretax income (PI)
NoDisc = Indicator equal to 1 for observations that do not disclose geographic earnings
in the post-SFAS 131 period, 0 otherwise
LnMV = Natural log of the market value (PRCC × CSHO in millions)
Lev = Total debt (LT) / lagged total assets (AT)
MB = Ratio of market value (PRCC × CSHO) to book value (CEQ)
NOL = Indicator variable equal to 1 if loss carry forward (TLCF) is negative at the
beginning of year t
NOL = Indicator variable equal to 1 if loss carry forward (TLCF) is lower at the end
of year t than the beginning of year t, 0 otherwise
NI = Net income (NI) / lagged total assets (AT)
FI = Foreign net income (PIFO) / lagged total assets (AT)
PPE = Plant, property and equipment (PPENT) / lagged total assets (AT)
RD = Research and development expense (XRD) / lagged total assets (AT)
EqInc = Equity Income (ESUB) / lagged total assets (AT)
Intang = Intangible assets (INTAN) / lagged total assets (AT)
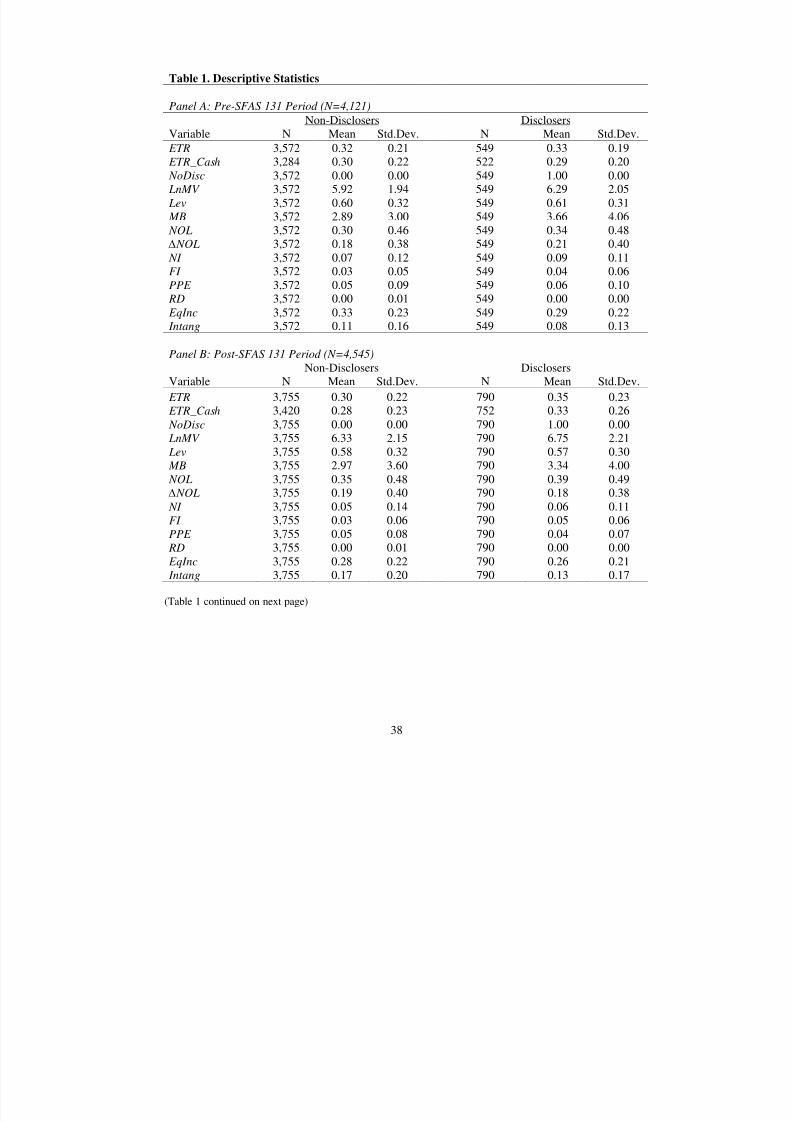
8/2/2019 Tax Avoidance and Geographic Earnings Disclosure
http://slidepdf.com/reader/full/tax-avoidance-and-geographic-earnings-disclosure 40/49
38
Table 1. Descriptive Statistics
Panel A: Pre-SFAS 131 Period (N=4,121)
Non-Disclosers DisclosersVariable N Mean Std.Dev. N Mean Std.Dev.
ETR 3,572 0.32 0.21 549 0.33 0.19 ETR_Cash 3,284 0.30 0.22 522 0.29 0.20 NoDisc 3,572 0.00 0.00 549 1.00 0.00 LnMV 3,572 5.92 1.94 549 6.29 2.05 Lev 3,572 0.60 0.32 549 0.61 0.31 MB 3,572 2.89 3.00 549 3.66 4.06 NOL 3,572 0.30 0.46 549 0.34 0.48 NOL 3,572 0.18 0.38 549 0.21 0.40 NI 3,572 0.07 0.12 549 0.09 0.11FI 3,572 0.03 0.05 549 0.04 0.06PPE 3,572 0.05 0.09 549 0.06 0.10
RD 3,572 0.00 0.01 549 0.00 0.00 EqInc 3,572 0.33 0.23 549 0.29 0.22 Intang 3,572 0.11 0.16 549 0.08 0.13
Panel B: Post-SFAS 131 Period (N=4,545)
Non-Disclosers DisclosersVariable N Mean Std.Dev. N Mean Std.Dev.
ETR 3,755 0.30 0.22 790 0.35 0.23 ETR_Cash 3,420 0.28 0.23 752 0.33 0.26 NoDisc 3,755 0.00 0.00 790 1.00 0.00 LnMV 3,755 6.33 2.15 790 6.75 2.21
Lev 3,755 0.58 0.32 790 0.57 0.30 MB 3,755 2.97 3.60 790 3.34 4.00 NOL 3,755 0.35 0.48 790 0.39 0.49 NOL 3,755 0.19 0.40 790 0.18 0.38 NI 3,755 0.05 0.14 790 0.06 0.11FI 3,755 0.03 0.06 790 0.05 0.06PPE 3,755 0.05 0.08 790 0.04 0.07 RD 3,755 0.00 0.01 790 0.00 0.00 EqInc 3,755 0.28 0.22 790 0.26 0.21 Intang 3,755 0.17 0.20 790 0.13 0.17
(Table 1 continued on next page)
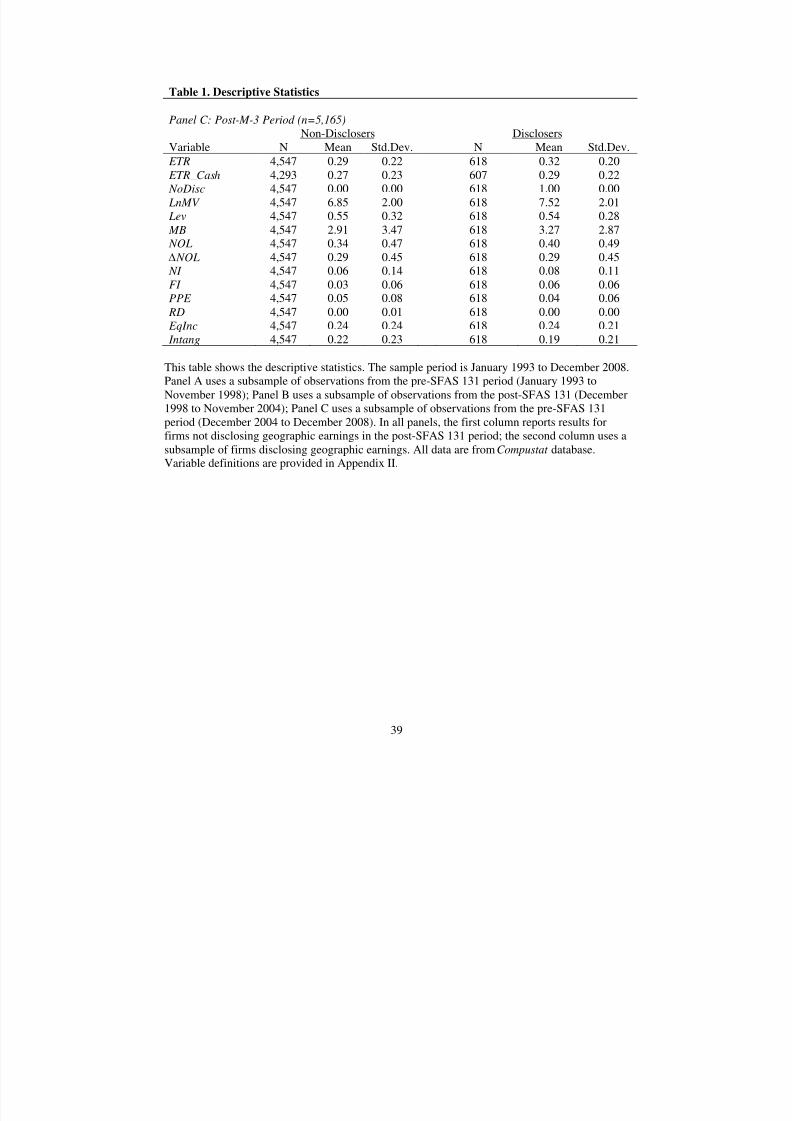
8/2/2019 Tax Avoidance and Geographic Earnings Disclosure
http://slidepdf.com/reader/full/tax-avoidance-and-geographic-earnings-disclosure 41/49
39
Table 1. Descriptive Statistics
Panel C: Post-M-3 Period (n=5,165)
Non-Disclosers Disclosers
Variable N Mean Std.Dev. N Mean Std.Dev. ETR 4,547 0.29 0.22 618 0.32 0.20 ETR_Cash 4,293 0.27 0.23 607 0.29 0.22 NoDisc 4,547 0.00 0.00 618 1.00 0.00 LnMV 4,547 6.85 2.00 618 7.52 2.01 Lev 4,547 0.55 0.32 618 0.54 0.28 MB 4,547 2.91 3.47 618 3.27 2.87 NOL 4,547 0.34 0.47 618 0.40 0.49 NOL 4,547 0.29 0.45 618 0.29 0.45 NI 4,547 0.06 0.14 618 0.08 0.11FI 4,547 0.03 0.06 618 0.06 0.06
PPE 4,547 0.05 0.08 618 0.04 0.06 RD 4,547 0.00 0.01 618 0.00 0.00 EqInc 4,547 0.24 0.24 618 0.24 0.21 Intang 4,547 0.22 0.23 618 0.19 0.21
This table shows the descriptive statistics. The sample period is January 1993 to December 2008.Panel A uses a subsample of observations from the pre-SFAS 131 period (January 1993 toNovember 1998); Panel B uses a subsample of observations from the post-SFAS 131 (December1998 to November 2004); Panel C uses a subsample of observations from the pre-SFAS 131period (December 2004 to December 2008). In all panels, the first column reports results forfirms not disclosing geographic earnings in the post-SFAS 131 period; the second column uses a
subsample of firms disclosing geographic earnings. All data are from Compustat database.Variable definitions are provided in Appendix II.
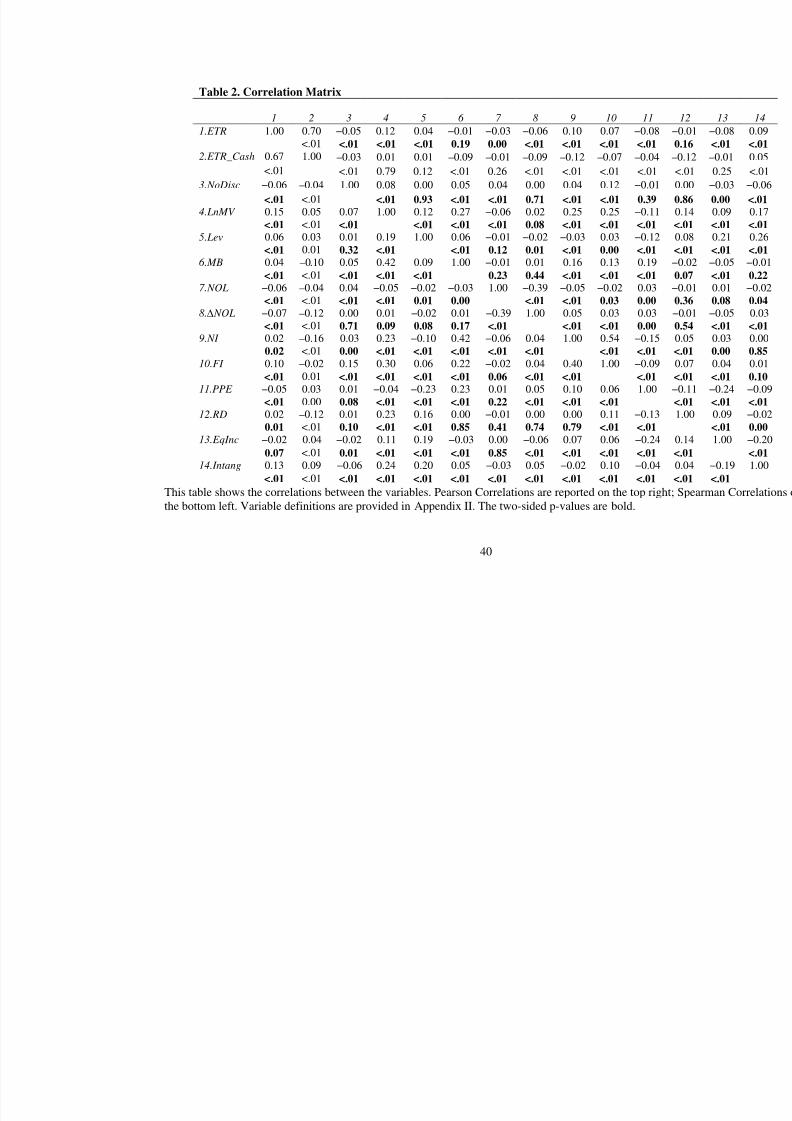
8/2/2019 Tax Avoidance and Geographic Earnings Disclosure
http://slidepdf.com/reader/full/tax-avoidance-and-geographic-earnings-disclosure 42/49
40
Table 2. Correlation Matrix
1 2 3 4 5 6 7 8 9 10 11
1.ETR 1.00 0.70 −0.05 0.12 0.04 −0.01 −0.03 −0.06 0.10 0.07 −0.08 <.01 <.01 <.01 <.01 0.19 0.00 <.01 <.01 <.01 <.01
2.ETR_Cash 0.67 1.00 –0.03 0.01 0.01 –0.09 –0.01 –0.09 –0.12 –0.07 –0.04
<.01 <.01 0.79 0.12 <.01 0.26 <.01 <.01 <.01 <.01
3.NoDisc −0.06 –0.04 1.00 0.08 0.00 0.05 0.04 0.00 0.04 0.12 −0.01
<.01 <.01 <.01 0.93 <.01 <.01 0.71 <.01 <.01 0.39 4.LnMV 0.15 0.05 0.07 1.00 0.12 0.27 −0.06 0.02 0.25 0.25 −0.11
<.01 <.01 <.01 <.01 <.01 <.01 0.08 <.01 <.01 <.01 5.Lev 0.06 0.03 0.01 0.19 1.00 0.06 −0.01 −0.02 −0.03 0.03 −0.12
<.01 0.01 0.32 <.01 <.01 0.12 0.01 <.01 0.00 <.01 6.MB 0.04 –0.10 0.05 0.42 0.09 1.00 −0.01 0.01 0.16 0.13 0.19
<.01 <.01 <.01 <.01 <.01 0.23 0.44 <.01 <.01 <.01 7.NOL −0.06 –0.04 0.04 −0.05 −0.02 −0.03 1.00 −0.39 −0.05 −0.02 0.03
<.01 <.01 <.01 <.01 0.01 0.00 <.01 <.01 0.03 0.00 8. NOL −0.07 –0.12 0.00 0.01 −0.02 0.01 −0.39 1.00 0.05 0.03 0.03
<.01 <.01 0.71 0.09 0.08 0.17 <.01 <.01 <.01 0.00 9.NI 0.02 –0.16 0.03 0.23 −0.10 0.42 −0.06 0.04 1.00 0.54 −0.15
0.02 <.01 0.00 <.01 <.01 <.01 <.01 <.01 <.01 <.01 10.FI 0.10 –0.02 0.15 0.30 0.06 0.22 −0.02 0.04 0.40 1.00 −0.09
<.01 0.01 <.01 <.01 <.01 <.01 0.06 <.01 <.01 <.01 11.PPE −0.05 0.03 0.01 −0.04 −0.23 0.23 0.01 0.05 0.10 0.06 1.00
<.01 0.00 0.08 <.01 <.01 <.01 0.22 <.01 <.01 <.01 12.RD 0.02 –0.12 0.01 0.23 0.16 0.00 −0.01 0.00 0.00 0.11 −0.13
0.01 <.01 0.10 <.01 <.01 0.85 0.41 0.74 0.79 <.01 <.01 13.EqInc −0.02 0.04 −0.02 0.11 0.19 −0.03 0.00 −0.06 0.07 0.06 −0.24
0.07 <.01 0.01 <.01 <.01 <.01 0.85 <.01 <.01 <.01 <.01 14.Intang 0.13 0.09 −0.06 0.24 0.20 0.05 −0.03 0.05 −0.02 0.10 −0.04
<.01 <.01 <.01 <.01 <.01 <.01 <.01 <.01 <.01 <.01 <.01
This table shows the correlations between the variables. Pearson Correlations are reported on the top righthe bottom left. Variable definitions are provided in Appendix II. The two-sided p-values are bold.
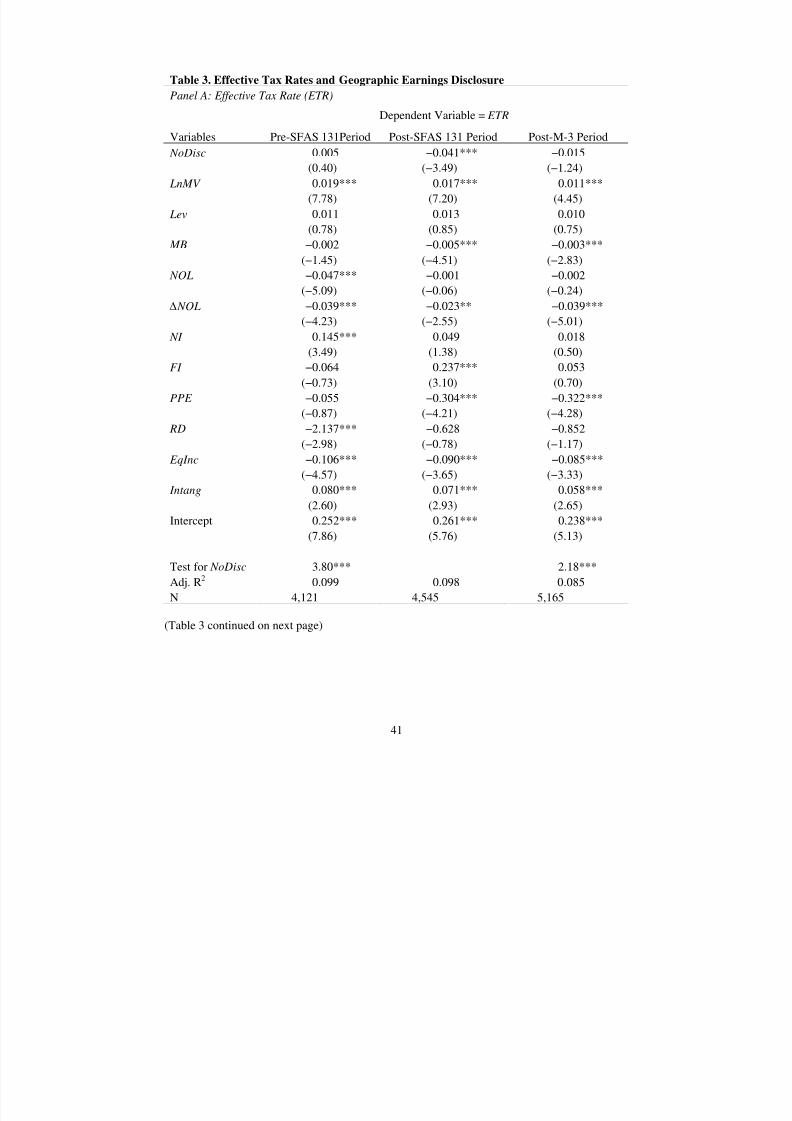
8/2/2019 Tax Avoidance and Geographic Earnings Disclosure
http://slidepdf.com/reader/full/tax-avoidance-and-geographic-earnings-disclosure 43/49
41
Table 3. Effective Tax Rates and Geographic Earnings Disclosure
Panel A: Effective Tax Rate (ETR)
Dependent Variable = ETR
Variables Pre-SFAS 131Period Post-SFAS 131 Period Post-M-3 Period
NoDisc 0.005 −0.041*** −0.015(0.40) (−3.49) (−1.24)
LnMV 0.019*** 0.017*** 0.011***
(7.78) (7.20) (4.45)
Lev 0.011 0.013 0.010
(0.78) (0.85) (0.75)
MB −0.002 −0.005*** −0.003***
(−1.45) (−4.51) (−2.83)
NOL −0.047*** −0.001 −0.002
(−5.09) (−0.06) (−0.24)
NOL −0.039*** −0.023** −0.039***(−4.23) (−2.55) (−5.01)
NI 0.145*** 0.049 0.018
(3.49) (1.38) (0.50)
FI −0.064 0.237*** 0.053
(−0.73) (3.10) (0.70)
PPE −0.055 −0.304*** −0.322***
(−0.87) (−4.21) (−4.28)
RD −2.137*** −0.628 −0.852
(−2.98) (−0.78) (−1.17)
EqInc −0.106*** −0.090*** −0.085***
(−4.57) (−3.65) (−3.33)
Intang 0.080*** 0.071*** 0.058***
(2.60) (2.93) (2.65)
Intercept 0.252*** 0.261*** 0.238***
(7.86) (5.76) (5.13)
Test for NoDisc 3.80*** 2.18***
Adj. R2 0.099 0.098 0.085
N 4,121 4,545 5,165
(Table 3 continued on next page)
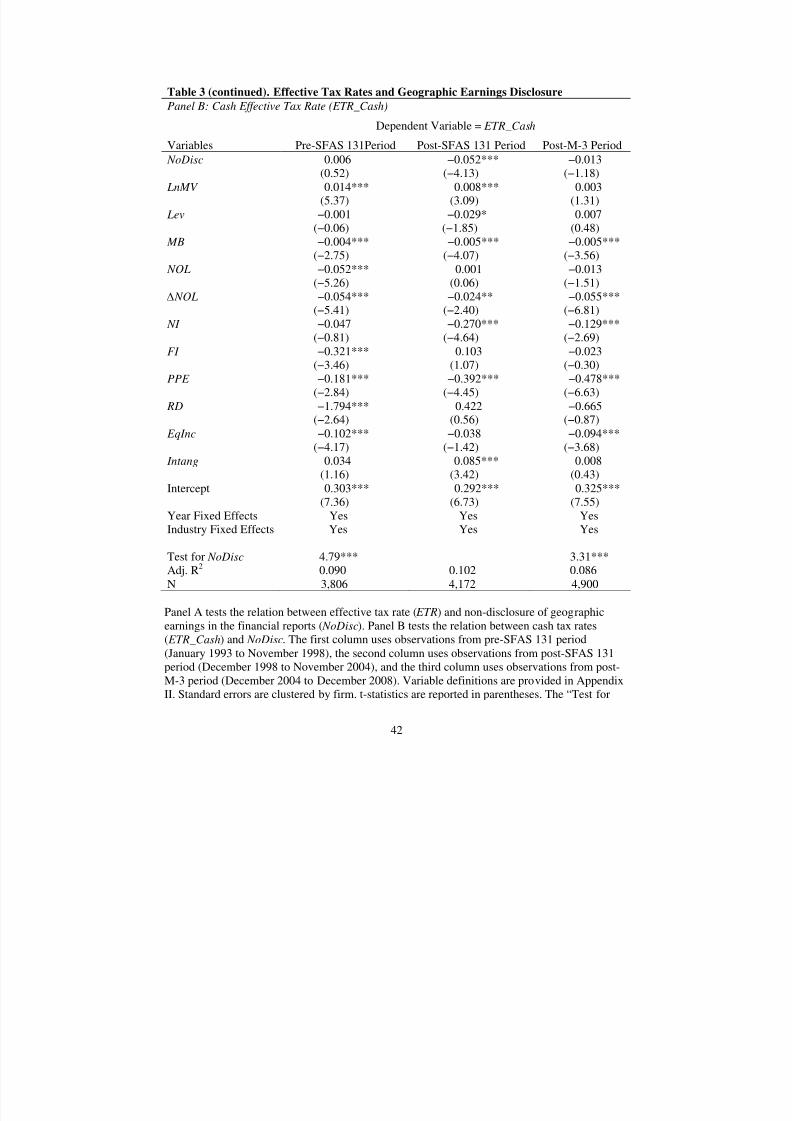
8/2/2019 Tax Avoidance and Geographic Earnings Disclosure
http://slidepdf.com/reader/full/tax-avoidance-and-geographic-earnings-disclosure 44/49
42
Table 3 (continued). Effective Tax Rates and Geographic Earnings Disclosure
Panel B: Cash Effective Tax Rate (ETR_Cash)
Dependent Variable = ETR_Cash
Variables Pre-SFAS 131Period Post-SFAS 131 Period Post-M-3 Period NoDisc 0.006 −0.052*** −0.013(0.52) (−4.13) (−1.18)
LnMV 0.014*** 0.008*** 0.003(5.37) (3.09) (1.31)
Lev −0.001 −0.029* 0.007(−0.06) (−1.85) (0.48)
MB −0.004*** −0.005*** −0.005***(−2.75) (−4.07) (−3.56)
NOL −0.052*** 0.001 −0.013(−5.26) (0.06) (−1.51)
NOL −0.054*** −0.024** −0.055***(−5.41) (−2.40) (−6.81)
NI −0.047 −0.270*** −0.129***(−0.81) (−4.64) (−2.69)
FI −0.321*** 0.103 −0.023(−3.46) (1.07) (−0.30)
PPE −0.181*** −0.392*** −0.478***(−2.84) (−4.45) (−6.63)
RD −1.794*** 0.422 −0.665(−2.64) (0.56) (−0.87)
EqInc −0.102*** −0.038 −0.094***(−4.17) (−1.42) (−3.68)
Intang 0.034 0.085*** 0.008(1.16) (3.42) (0.43)
Intercept 0.303*** 0.292*** 0.325***(7.36) (6.73) (7.55)
Year Fixed Effects Yes Yes YesIndustry Fixed Effects Yes Yes Yes
Test for NoDisc 4.79*** 3.31***Adj. R2 0.090 0.102 0.086N 3,806 4,172 4,900
Panel A tests the relation between effective tax rate ( ETR) and non-disclosure of geographicearnings in the financial reports ( NoDisc). Panel B tests the relation between cash tax rates( ETR_Cash) and NoDisc. The first column uses observations from pre-SFAS 131 period(January 1993 to November 1998), the second column uses observations from post-SFAS 131period (December 1998 to November 2004), and the third column uses observations from post-M-3 period (December 2004 to December 2008). Variable definitions are provided in AppendixII. Standard errors are clustered by firm. t-statistics are reported in parentheses. The “Test for

8/2/2019 Tax Avoidance and Geographic Earnings Disclosure
http://slidepdf.com/reader/full/tax-avoidance-and-geographic-earnings-disclosure 45/49
43
NoDisc” is a t-test of whether the coefficient on NoDisc differs from that in the post-SFAS 131period. ***, ** and * refer to significance at the 0.01, 0.05 and 0.10 level (two-sided test),respectively.
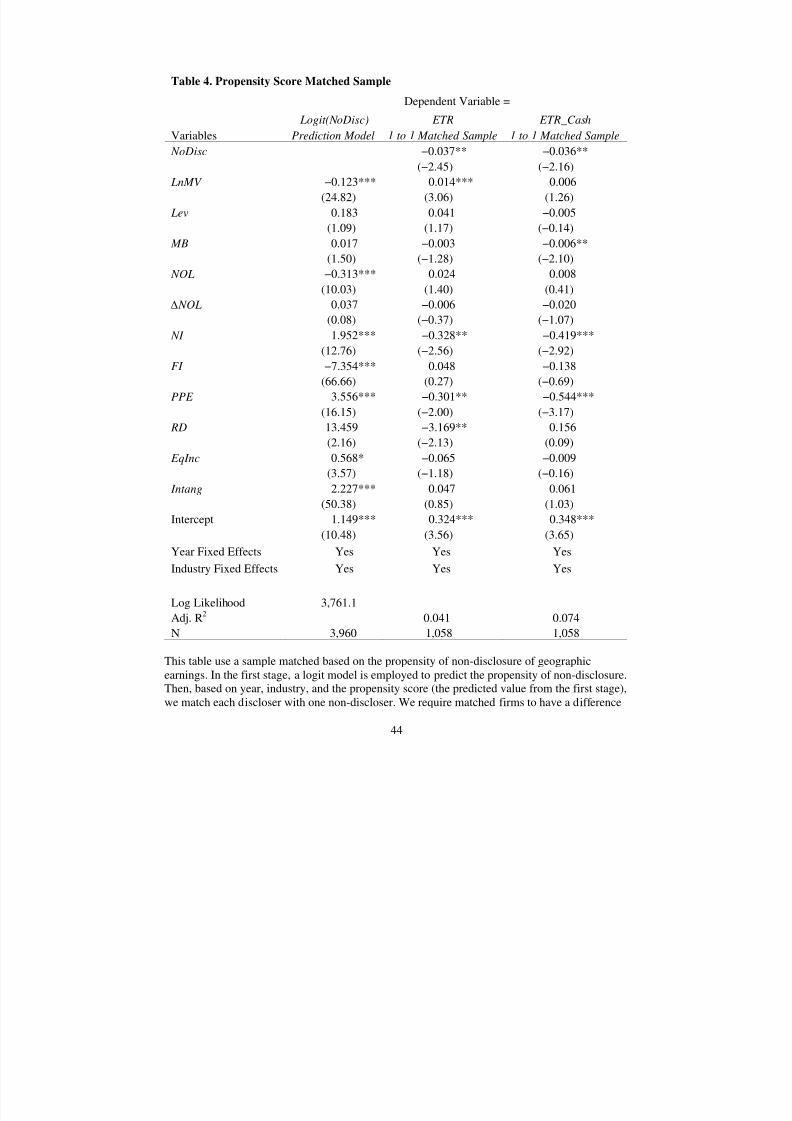
8/2/2019 Tax Avoidance and Geographic Earnings Disclosure
http://slidepdf.com/reader/full/tax-avoidance-and-geographic-earnings-disclosure 46/49
44
Table 4. Propensity Score Matched Sample
Dependent Variable =
Logit(NoDisc) ETR ETR_Cash
Variables Prediction Model 1 to 1 Matched Sample 1 to 1 Matched Sample
NoDisc −0.037** −0.036**(−2.45) (−2.16)
LnMV −0.123*** 0.014*** 0.006
(24.82) (3.06) (1.26)
Lev 0.183 0.041 −0.005
(1.09) (1.17) (−0.14)
MB 0.017 −0.003 −0.006**
(1.50) (−1.28) (−2.10)
NOL −0.313*** 0.024 0.008
(10.03) (1.40) (0.41)
NOL 0.037 −0.006 −0.020(0.08) (−0.37) (−1.07)
NI 1.952*** −0.328** −0.419***
(12.76) (−2.56) (−2.92)
FI −7.354*** 0.048 −0.138
(66.66) (0.27) (−0.69)
PPE 3.556*** −0.301** −0.544***
(16.15) (−2.00) (−3.17)
RD 13.459 −3.169** 0.156
(2.16) (−2.13) (0.09)
EqInc 0.568* −0.065 −0.009(3.57) (−1.18) (−0.16)
Intang 2.227*** 0.047 0.061
(50.38) (0.85) (1.03)
Intercept 1.149*** 0.324*** 0.348***
(10.48) (3.56) (3.65)
Year Fixed Effects Yes Yes Yes
Industry Fixed Effects Yes Yes Yes
Log Likelihood 3,761.1Adj. R2 0.041 0.074
N 3,960 1,058 1,058
This table use a sample matched based on the propensity of non-disclosure of geographicearnings. In the first stage, a logit model is employed to predict the propensity of non-disclosure.Then, based on year, industry, and the propensity score (the predicted value from the first stage),we match each discloser with one non-discloser. We require matched firms to have a difference

8/2/2019 Tax Avoidance and Geographic Earnings Disclosure
http://slidepdf.com/reader/full/tax-avoidance-and-geographic-earnings-disclosure 47/49
45
in propensity scores of less than 0.025. In the second stage, the matched sample is used to teststhe relation between effective tax rates ( ETR) and non-disclosure of geographic earnings( NoDisc), after controlling for the propensity score. The test uses observations from the post-SFAS 131 period (December 1998 to November 2004). Standard errors are clustered by firm.For the prediction model, chi-squares are reported in parentheses, and, for the other models, t-
statistics are reported in parentheses. ***, ** and * refer to significance at the 0.01, 0.05 and0.10 level (two-sided test), respectively.
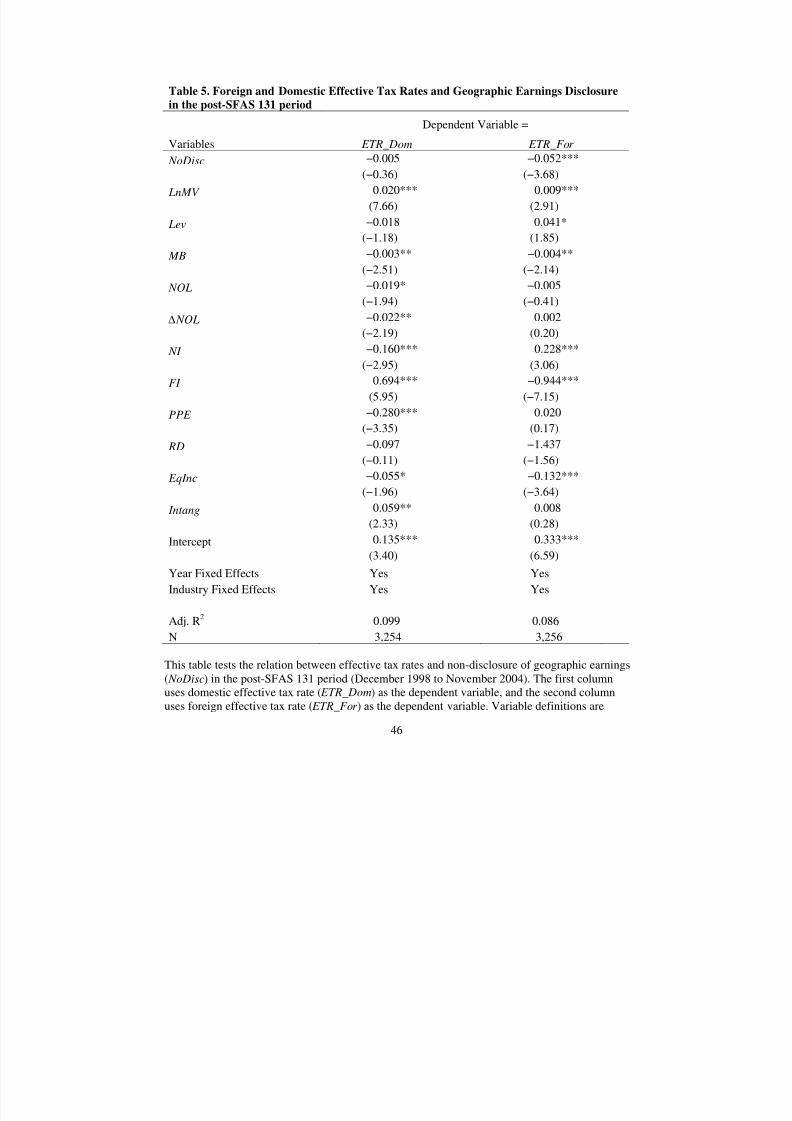
8/2/2019 Tax Avoidance and Geographic Earnings Disclosure
http://slidepdf.com/reader/full/tax-avoidance-and-geographic-earnings-disclosure 48/49
46
Table 5. Foreign and Domestic Effective Tax Rates and Geographic Earnings Disclosure
in the post-SFAS 131 period Dependent Variable =
Variables ETR_Dom ETR_For
NoDisc −0.005 −0.052***
(−0.36) (−3.68)
LnMV 0.020*** 0.009***
(7.66) (2.91)
Lev −0.018 0.041*
(−1.18) (1.85)
MB −0.003** −0.004**
(−2.51) (−2.14)
NOL −0.019* −0.005
(−1.94) (−0.41) NOL −0.022** 0.002
(−2.19) (0.20)
NI −0.160*** 0.228***
(−2.95) (3.06)
FI 0.694*** −0.944***
(5.95) (−7.15)
PPE −0.280*** 0.020
(−3.35) (0.17)
RD −0.097 −1.437
(−0.11) (−1.56)
EqInc −0.055* −0.132***
(−1.96) (−3.64)
Intang 0.059** 0.008
(2.33) (0.28)
Intercept 0.135*** 0.333***
(3.40) (6.59)
Year Fixed Effects Yes Yes
Industry Fixed Effects Yes Yes
Adj. R2 0.099 0.086
N 3,254 3,256
This table tests the relation between effective tax rates and non-disclosure of geographic earnings( NoDisc) in the post-SFAS 131 period (December 1998 to November 2004). The first columnuses domestic effective tax rate ( ETR_Dom) as the dependent variable, and the second columnuses foreign effective tax rate ( ETR_For ) as the dependent variable. Variable definitions are

8/2/2019 Tax Avoidance and Geographic Earnings Disclosure
http://slidepdf.com/reader/full/tax-avoidance-and-geographic-earnings-disclosure 49/49
provided in Appendix II. All models include both year and industry fixed effect, and standarderrors are clustered by firm. t-statistics are reported in parentheses. ***, ** and * refer tosignificance at the 0.01, 0.05 and 0.10 level (two-sided test), respectively.