Embed Size (px)
Citation preview
TALIS 2013: Working Conditions, Teacher Job Satisfaction and Retention Statistical working paper
November 2017
Sam Sims, Education Datalab
2
Contents List of figures 3
List of tables 4
Acknowledgements 5
Executive Summary 6
1. Introduction 8
2. Definitions and Data 10
3. International Analysis 14
4. England-Only Analysis 17
Conclusion 23
Appendix 1: The TALIS Sample 25
Appendix 2: TALIS Country Codes 26
Appendix 3: Job Satisfaction and Desire to Move School 27
Appendix 4: England-Only Questions 28
Appendix 5: Exploratory Factor Analysis 29
References 34
3
List of figures Figure 1: Ranking Average Teacher Job Satisfaction 13
Figure 2: Ranking Proportion of Teachers Who Strongly Agree They Want to Move School 13
Figure 3: Teacher Workload by Whether Teachers Judge Workload Unmanageable (England Only) 21
Figure 4: Eigenvalues for Each Marginal Factor in the EFA (England Only) 30
4
List of tables Table 1: Population-Level Conditional Associations Between Working Conditions 15
Table 2: Population-Level Conditional Associations of Working Conditions with Job Satisfaction and Desire to Move School (England Only) 18
Table 3: School System Codes 26
Table 4: Components of the Teacher Job Satisfaction Score 27
Table 5: England-Specific Variables Included in the England-Only Analysis 28
Table 6: Factors Loadings of the Different Variables (England Only) 30
Table 7: Wording of Questions for Each Factor 32
5
Acknowledgements Thanks go to Dr. John Jerrim, Dr. Rebecca Allen, Frances Forsyth (DfE), Dr. Mark Craigie (DfE), Leslie Rutskowski, participants at an NfER seminar and a number of others who have made useful comments on this report. Any remaining errors are the responsibility of the author.

6
Executive Summary High teacher turnover in schools is associated with reduced pupil attainment (Ronfeldt et al 2013; Atteberry et al 2016). High turnover also has an effect on equity, since it tends to be concentrated in schools with deprived intakes (Allen et al 2012). A good deal of research has attributed higher levels of teacher turnover in such schools to the challenges involved in teaching disadvantaged pupils. However, a recent review of the literature suggests that working conditions in schools may be a more important reason for high turnover (Simon & Johnson 2015).
This research provides new evidence on this point by using the 2013 Teaching and Learning International Survey (TALIS) to test for and quantify the relationships between different aspects of working conditions in schools, and both teachers’ job satisfaction and desire to move to another school.
The research shows that job satisfaction among teachers in England is below that of comparable TALIS nations.1 This difference is statistically significant at the 95% level. The proportion of teachers in England who ‘strongly agree’2 that they would like to move to another school if possible (8.2%) is also higher than other comparable TALIS nations (6.4%), but this difference is not statistically significant (Section 2).
Using data on over 50,000 teachers from 34 different countries, and controlling for the effects of teacher age, gender, qualifications and experience, the research shows that more cooperation between teachers and more effective professional development is associated with increased teacher job satisfaction.3 Increased teacher cooperation is also associated with reduced odds4 that teachers want to move school (Section 3).
By utilising more detailed measures of working conditions which are only available for teachers in England (n=953), the second part of this analysis is able to control for the effects of a wider range of teacher and school characteristics including Ofsted grade, characteristics of the pupil intake and academy status. To allow the results to be compared, they are presented in terms of standard deviations:5
1 Job satisfaction is lower in England than in Australia, Alberta (Canada), New Zealand and the USA. For an explanation of why these countries are used for the comparison, see Section 2. 2 Teachers were asked whether the agreed with the statement “I would like to change to another school if that were possible” on a four point scale from Strongly Disagree to Strongly Agree. 3 For definitions of cooperation and effective professional development readers are referred to Knoll, S. & Koršnáková, P. (2014). 4 Odds are the probability that something does happen over the probability that it does not. For example, the odds of flipping tails on a coin is 0.5/0.5 = 1. To see how this differs to probability notice that the probability of flipping a tails = 0.5. 5 Standard deviation (SD) is a measure of how ‘spread out’ values of a variable are. In a normally distributed variable, 68% of values lie within one SD of the mean. Height is a normally distributed variable,
7
• Better school leadership is strongly associated with higher teacher job satisfaction and a reduction in the odds that a teacher wants to move school. More specifically, a one standard deviation (SD) improvement in the quality of leadership is associated with a large, 0.49 SD increase in teacher job satisfaction and a 64% reduction in the odds that a teacher strongly agrees that they want to move to another school.
• Teacher cooperation and scope for progression have the next strongest relationships with increased job satisfaction. A one SD increase in each is associated with a 0.22 and 0.23 SD increase in job satisfaction, respectively.
• Feedback, effective professional development and discipline are also positively associated with job satisfaction, although the relationships are weaker.
• Increased levels of effective professional development are associated with a reduced desire for teachers to move schools. More specifically, a one SD improvement in effective professional development is associated with a large, 63% reduction in the odds that a teacher wants to move to another school. This is almost as strong as the association with leadership quality.
• Whether teachers feel prepared for the teaching assignments they have been given and the scope for career progression in their school are also associated with reduced odds that a teacher strongly agrees that they want to move school.
• The number of hours worked and frequency of marking and feedback reported by teachers does not have a statistically significant relationship with job satisfaction. However, teachers’ who report their workload as unmanageable do have lower levels of job satisfaction.
Taken together, these findings highlight the importance of the more interpersonal aspects of working conditions, such as school leadership and teacher cooperation, for helping to reduce turnover. Moreover, once working conditions have been controlled for, neither the disadvantage of a school’s intake nor its Ofsted grade have a statistically significant association with teachers’ desire to leave their school. This suggests that all schools should be able to sustain a stable, experienced body of teaching staff by improving working conditions, even if they are working in challenging circumstances.
which means 68% of people have a height within (plus or minus) one SD of the mean height. By the same logic, somebody of average height (50% along the height distribution) who then grew by one SD (32% of people have a height within one SD above the mean) would just make it into the top 16% of tallest people (50 + 34 = 84 and 100 – 84 = 16). SD is used here because saying that, for example, job satisfaction increases by 0.5 would be meaningless, as there is no natural scale for intepreting what this means. However, by thinking about the analogy with height, a one SD increase in job satisfaction can be made meaningful. This also allows comparison of changes in variables measured in different units.
8
1. Introduction High teacher turnover is associated with reduced pupil attainment, both because the teachers that leave tend to be replaced by teachers who are initially less effective and because of the wider disruption caused by having to hire replacements (Ronfeldt et al 2013; Atteberry et al 2016). High levels of teacher turnover can also create acute staffing challenges for schools. When faced with teacher shortages, school leaders tend to either make increased use of temporary teachers, lower recruitment standards, or increase class sizes (Smithers & Robinson 2000), all of which have been linked with reduced pupil attainment (Mocetti 2012; Fredriksson et al 2013; Schanzenbach 2006).6 Understanding the determinants of teacher job satisfaction and turnover is therefore important.
Studies using administrative data (information routinely collected by government for the purposes of managing the education system), generally attribute higher levels of teacher turnover in certain schools to the challenges of teaching disadvantaged pupils. However, Simon and Johnson (2015, p10) point out that in six studies in which efforts were made to control for the quality of teachers’ working environment (information which is often not recorded in administrative datasets), “all or most” of the relationship between pupil characteristics and teacher turnover was explained away. This has important implications for policy since it means there is potential for improving teacher retention, even in schools with disadvantaged intakes, by improving working conditions.
However, despite recent advances in our understanding, there is currently very little research quantifying the effects of working conditions on retention using data on schools from outside the USA.7 In order to address this gap in the literature, this research uses the Teaching and Learning International Survey 2013 (TALIS) to investigate the associations between working conditions and teacher turnover in 34 countries, including England. TALIS is a useful dataset for answering this question because it includes over 40 different variables measuring working conditions and more than 50,000 full-time teachers. By testing for and quantifying the relationships between different working conditions and teacher job satisfaction and desire to move school, this analysis has the potential to inform the practice of school leaders, especially those facing staffing difficulties.
A number of reports have been published analysing bivariate (pairwise) relationships between working conditions and teacher turnover intentions using the 2013 TALIS data (see, for example: Micklewright et al 2014; Sellen 2016). Other research (Duyar et al 2013; Fackler & Malmberg 2016) has used data from TALIS 2008 to model teacher job
6 Research generally shows that changes in class size have to be fairly large to have an effect on attainment. 7 For one exception, see Lynch et al (2016)
9
satisfaction and self-efficacy. This report goes beyond the existing research to simultaneously model the influence of a rich set of working conditions on both job satisfaction and desire to move schools, as well as linking the TALIS survey data to school-level administrative data, including objective measures of pupil deprivation. It also makes a novel contribution to the literature by using exploratory factor analysis (EFA) to develop a new way of categorising and quantifying the working conditions measures in the TALIS survey.8
8 Readers are referred to Appendix 5 for more information on EFA.
10
2. Definitions and Data TALIS is an international teacher survey which has been conducted once every five years since 2008. It collects information on teaching practices, teachers’ beliefs and working conditions in schools and aims to be representative of all teachers in the participating school systems. England first participated in TALIS in 2013 and for this reason the analysis here is restricted to the 2013 data. The teacher questionnaire for the 2013 survey contains 50 groups of questions covering teacher and school characteristics, professional development, feedback, pedagogy, attitudes to teaching, school climate and job satisfaction. Although TALIS 2013 included the option to survey ISCED Level 1 (primary school) teachers and ISCED Level 3 (upper secondary school) teachers, England only participated in the ISCED Level 2 (lower secondary, or Key Stage 3) survey. This analysis is therefore restricted to ISCED Level 2 teachers. Appendix 1 contains more information on the sampling methods and the weights employed in this analysis. Appendix 2 includes a list of participating countries.
Data are available for 34 different school systems, some of which are national and some of which are sub-national. In order to take advantage of this large sample size (117,876 respondents), all 34 countries in the ISCED 2 dataset for TALIS 2013 are used in the first part of the analysis. In later stages of the analysis, additional information from the School Workforce Census (SWC) is also linked in.9 This allows consideration of a wider range of factors influencing teacher job satisfaction and desire to move school, but at the cost of a smaller sample consisting only of teachers in England.
Cross-national surveys such as TALIS are often subject to concerns that responses cannot be compared across respondents who read and respond to the survey in different languages and may interpret the questions through different cultural lenses (Rutkowski & Svetina 2014). Ideally, international surveys will display measurement invariance, meaning that the questions have been shown to be interpreted in a similar way across countries. The TALIS 2013 data has been subjected to extensive empirical testing for invariance (Desa et al 2014; Desa 2016) and these tests have generally shown that the data do display “weak invariance”, which allow the sort of cross-country regression analysis employed in this paper. However, the same tests generally shown that the data does not show “strong invariance” meaning average scores cannot be compared across different linguistic and cultural groups.10 It is also worth noting that not all the question items have been tested and concerns about measurement invariance cannot therefore
9 The School Workforce Census is a government dataset containing demographic and work-related information on all teachers in England, which has been collected every year since 2010. 10 Strictly speaking, the tests have established metric invariance for many of the variables but have not established scalar invariance.
11
be discounted entirely. The final stage of the analysis is therefore restricted to teachers in England, partly in order to circumvent this problem.
Workload is an important component of working conditions, which has been shown to affect turnover (Smith & Ingersoll 2004; Ladd 2011). However, workload is hard to meaningfully compare across full-time and part-time teachers, which raises questions as to how the latter should be treated in the analysis. One option would be to deflate the number of hours worked based on teachers’ responses to another question in the TALIS survey, which asks whether they are full-time or part-time, measured on a four-point scale. However, the response categories for this question are broad, with the lowest including anything less than 50% of full-time. Deflating the hours worked in this way would therefore be very imprecise. It would also likely be inaccurate for deflating teachers answers about how much time they spend on specific activities (e.g. general administrative work), since part-time teachers may spend disproportionate amounts of time on certain activities. Analysing part-time teachers separately would be subject to the same problems, since there is a great deal of variation in total hours worked within the group of part-time teachers. For this reason, part-time teachers are not included in the analysis in this report, which leaves 75,794 full-time teachers.11 12
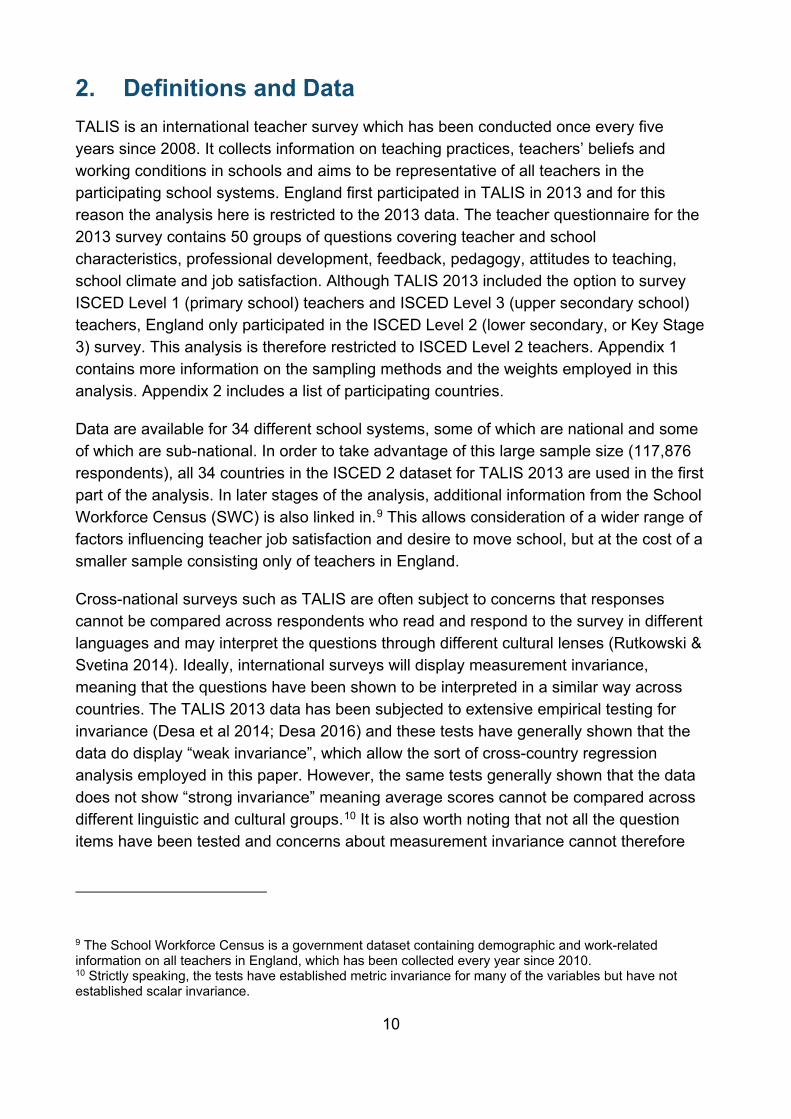
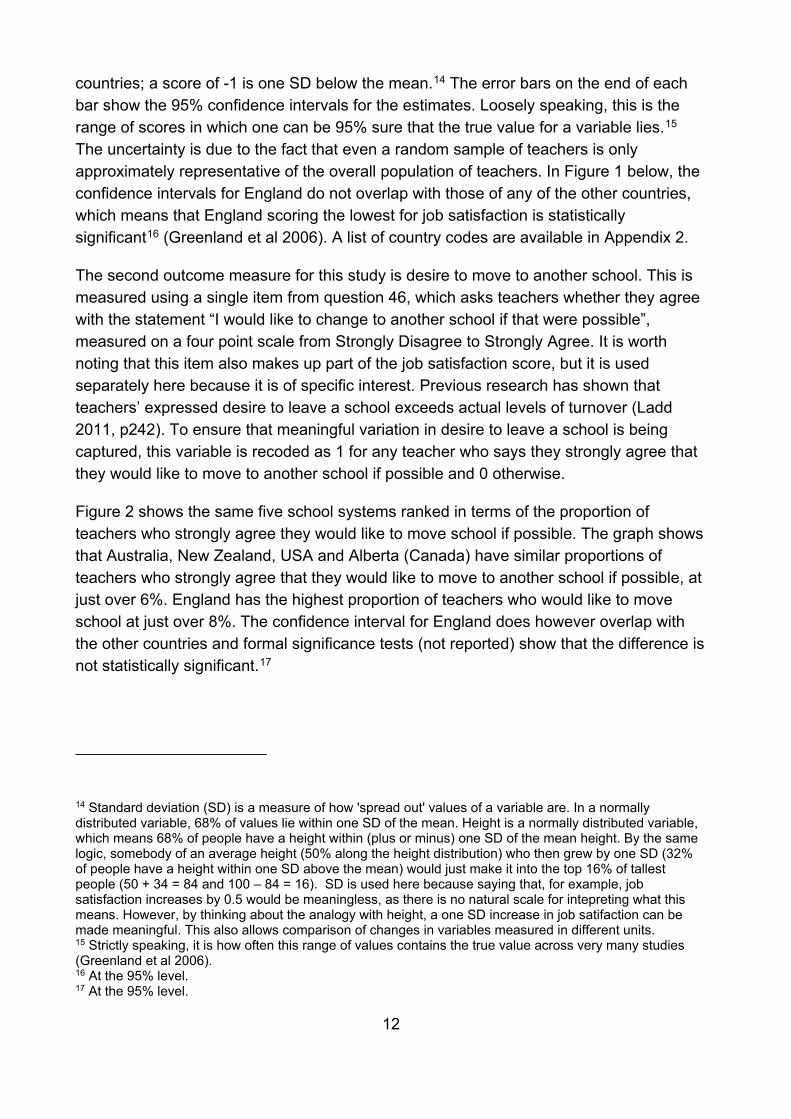
There are two outcome variables for this study: teacher job satisfaction and teacher desire to move school. The job satisfaction variable in the TALIS dataset is a composite measure made up of eight different items from question 46, all relating to teachers’ evaluations of their job (see Appendix 3 for details). A higher score represents higher job satisfaction. As discussed, mean scores cannot generally be compared across different linguistic and cultural groups. Given this, Figure 1 ranks the mean job satisfaction scores for the five school systems that administered the survey in the English language (Becker et al 2014, p142) and belong to the so-called Anglo cultural group (Gupta et al 2002).13 The teacher job satisfaction score has been standardized across this group of countries. This means that a country with a score of 0 has the same level of job satisfaction as the average teacher across this group of countries. A country with a score of one has average teacher job satisfaction one SD above that of the average teacher across these
11 All teachers who do not identify themselves as full-time are dropped, which amounts to 25,488 teachers. In addition, all teachers who reported that their total working hours in the most recent full week were below 30 hours a week - which is the conventional cut-off for part-time work in several countries included in TALIS including Canada, Finland and New Zealand - are dropped. This amounts to 16,634 teachers. 12 A number of variables had high levels of missing values. One option for dealing with this would be to use multiple imputation (MI). However, MI is not compatible with some of the other STATA commands used elsewhere in the analysis, such as creating the polychoric correlation matrix. Where variables had higher than 10% missingness they were dropped from the analysis, on the grounds that leaving them in would cause a significant drop in the number of observations used in the modelling. 13 The five schools systems are: Alberta (Canada; CAB); USA; New Zealand (NZL); Australia (AUS); and England (ENG).
12
countries; a score of -1 is one SD below the mean.14 The error bars on the end of each bar show the 95% confidence intervals for the estimates. Loosely speaking, this is the range of scores in which one can be 95% sure that the true value for a variable lies.15 The uncertainty is due to the fact that even a random sample of teachers is only approximately representative of the overall population of teachers. In Figure 1 below, the confidence intervals for England do not overlap with those of any of the other countries, which means that England scoring the lowest for job satisfaction is statistically significant16 (Greenland et al 2006). A list of country codes are available in Appendix 2.
The second outcome measure for this study is desire to move to another school. This is measured using a single item from question 46, which asks teachers whether they agree with the statement “I would like to change to another school if that were possible”, measured on a four point scale from Strongly Disagree to Strongly Agree. It is worth noting that this item also makes up part of the job satisfaction score, but it is used separately here because it is of specific interest. Previous research has shown that teachers’ expressed desire to leave a school exceeds actual levels of turnover (Ladd 2011, p242). To ensure that meaningful variation in desire to leave a school is being captured, this variable is recoded as 1 for any teacher who says they strongly agree that they would like to move to another school if possible and 0 otherwise.
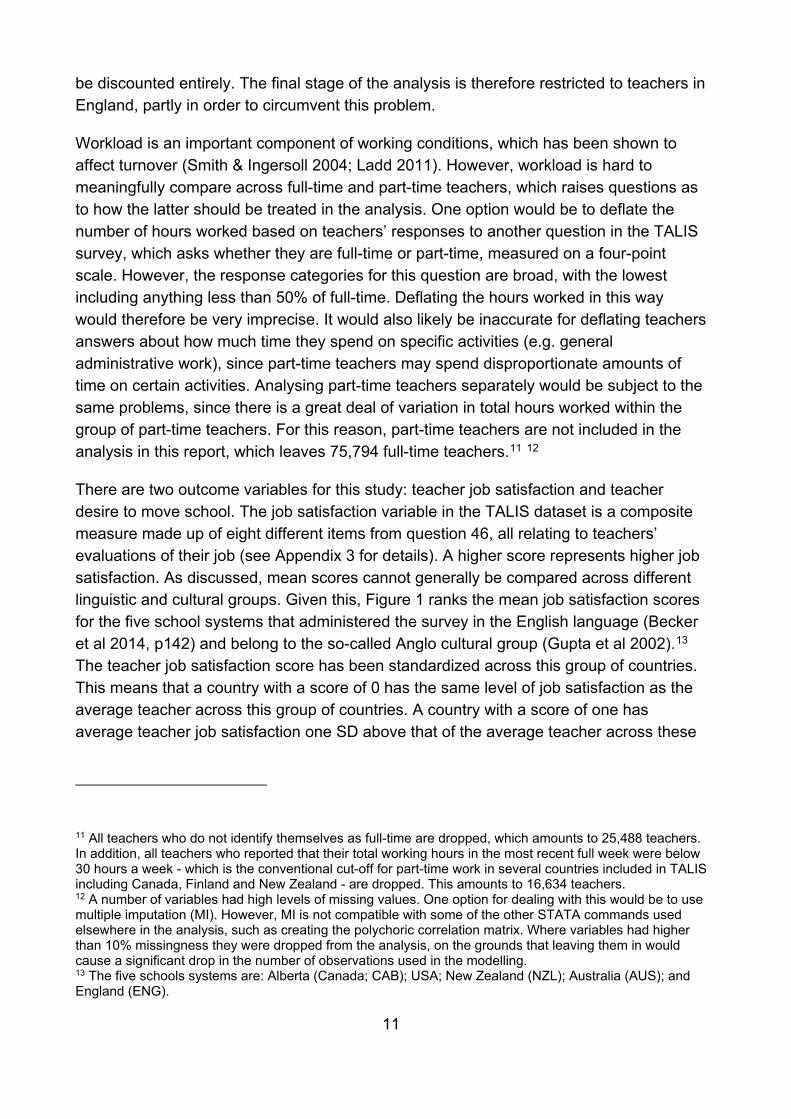
Figure 2 shows the same five school systems ranked in terms of the proportion of teachers who strongly agree they would like to move school if possible. The graph shows that Australia, New Zealand, USA and Alberta (Canada) have similar proportions of teachers who strongly agree that they would like to move to another school if possible, at just over 6%. England has the highest proportion of teachers who would like to move school at just over 8%. The confidence interval for England does however overlap with the other countries and formal significance tests (not reported) show that the difference is not statistically significant.17
14 Standard deviation (SD) is a measure of how 'spread out' values of a variable are. In a normally distributed variable, 68% of values lie within one SD of the mean. Height is a normally distributed variable, which means 68% of people have a height within (plus or minus) one SD of the mean height. By the same logic, somebody of an average height (50% along the height distribution) who then grew by one SD (32% of people have a height within one SD above the mean) would just make it into the top 16% of tallest people (50 + 34 = 84 and 100 – 84 = 16). SD is used here because saying that, for example, job satisfaction increases by 0.5 would be meaningless, as there is no natural scale for intepreting what this means. However, by thinking about the analogy with height, a one SD increase in job satifaction can be made meaningful. This also allows comparison of changes in variables measured in different units. 15 Strictly speaking, it is how often this range of values contains the true value across very many studies (Greenland et al 2006). 16 At the 95% level. 17 At the 95% level.
13
Figure 1: Ranking Average Teacher Job Satisfaction
Figure 2: Ranking Proportion of Teachers Who Strongly Agree They Want to Move School
Source: TALIS 2013.
ENG
AUS
NZL
USA
CAB
-.3 -.2 -.1 0 .1 .2
AUS
USA
NZL
CAB
ENG
5 6 7 8 9 101 2 3 4% Strongly Agree
14
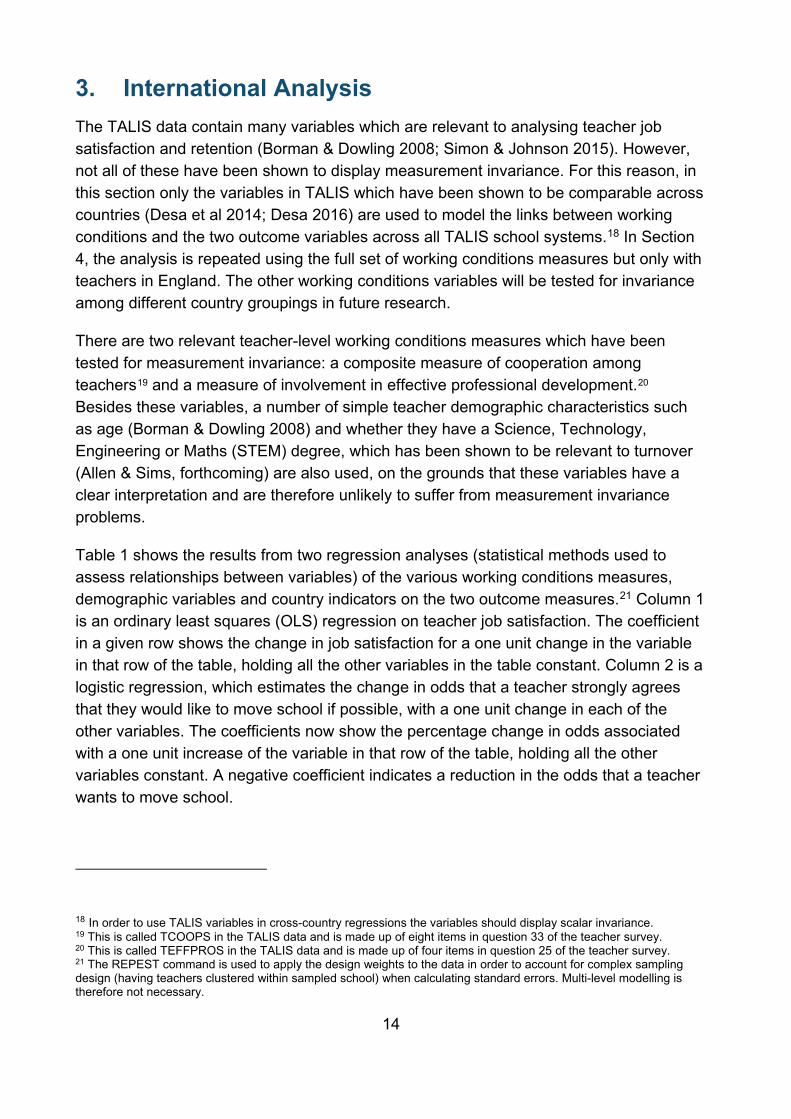
3. International Analysis The TALIS data contain many variables which are relevant to analysing teacher job satisfaction and retention (Borman & Dowling 2008; Simon & Johnson 2015). However, not all of these have been shown to display measurement invariance. For this reason, in this section only the variables in TALIS which have been shown to be comparable across countries (Desa et al 2014; Desa 2016) are used to model the links between working conditions and the two outcome variables across all TALIS school systems.18 In Section 4, the analysis is repeated using the full set of working conditions measures but only with teachers in England. The other working conditions variables will be tested for invariance among different country groupings in future research.
There are two relevant teacher-level working conditions measures which have been tested for measurement invariance: a composite measure of cooperation among teachers19 and a measure of involvement in effective professional development.20 Besides these variables, a number of simple teacher demographic characteristics such as age (Borman & Dowling 2008) and whether they have a Science, Technology, Engineering or Maths (STEM) degree, which has been shown to be relevant to turnover (Allen & Sims, forthcoming) are also used, on the grounds that these variables have a clear interpretation and are therefore unlikely to suffer from measurement invariance problems.
Table 1 shows the results from two regression analyses (statistical methods used to assess relationships between variables) of the various working conditions measures, demographic variables and country indicators on the two outcome measures.21 Column 1 is an ordinary least squares (OLS) regression on teacher job satisfaction. The coefficient in a given row shows the change in job satisfaction for a one unit change in the variable in that row of the table, holding all the other variables in the table constant. Column 2 is a logistic regression, which estimates the change in odds that a teacher strongly agrees that they would like to move school if possible, with a one unit change in each of the other variables. The coefficients now show the percentage change in odds associated with a one unit increase of the variable in that row of the table, holding all the other variables constant. A negative coefficient indicates a reduction in the odds that a teacher wants to move school.
18 In order to use TALIS variables in cross-country regressions the variables should display scalar invariance. 19 This is called TCOOPS in the TALIS data and is made up of eight items in question 33 of the teacher survey. 20 This is called TEFFPROS in the TALIS data and is made up of four items in question 25 of the teacher survey. 21 The REPEST command is used to apply the design weights to the data in order to account for complex sampling design (having teachers clustered within sampled school) when calculating standard errors. Multi-level modelling is therefore not necessary.
15
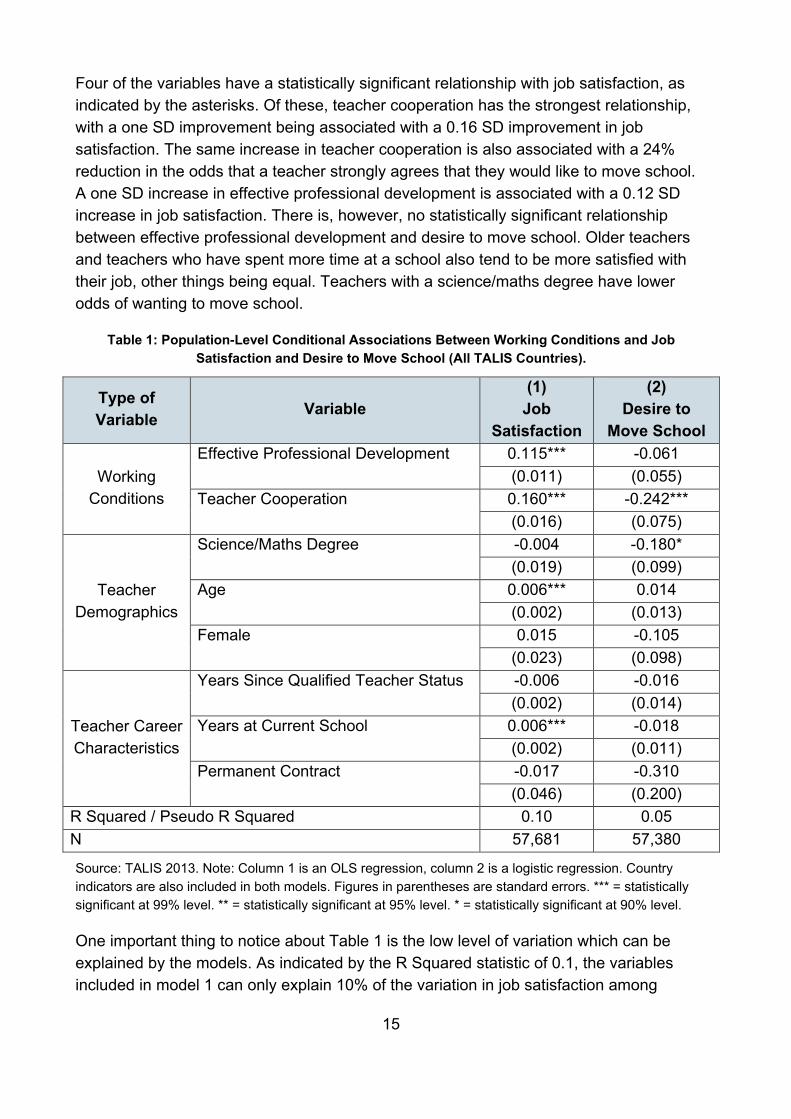
Four of the variables have a statistically significant relationship with job satisfaction, as indicated by the asterisks. Of these, teacher cooperation has the strongest relationship, with a one SD improvement being associated with a 0.16 SD improvement in job satisfaction. The same increase in teacher cooperation is also associated with a 24% reduction in the odds that a teacher strongly agrees that they would like to move school. A one SD increase in effective professional development is associated with a 0.12 SD increase in job satisfaction. There is, however, no statistically significant relationship between effective professional development and desire to move school. Older teachers and teachers who have spent more time at a school also tend to be more satisfied with their job, other things being equal. Teachers with a science/maths degree have lower odds of wanting to move school.
Table 1: Population-Level Conditional Associations Between Working Conditions and Job Satisfaction and Desire to Move School (All TALIS Countries).
Type of Variable Variable
(1) Job
Satisfaction
(2) Desire to
Move School
Working Conditions
Effective Professional Development 0.115*** -0.061 (0.011) (0.055)
Teacher Cooperation 0.160*** -0.242*** (0.016) (0.075)
Teacher Demographics
Science/Maths Degree -0.004 -0.180* (0.019) (0.099)
Age 0.006*** 0.014 (0.002) (0.013)
Female 0.015 -0.105 (0.023) (0.098)
Teacher Career Characteristics
Years Since Qualified Teacher Status -0.006 -0.016 (0.002) (0.014)
Years at Current School 0.006*** -0.018 (0.002) (0.011)
Permanent Contract -0.017 -0.310 (0.046) (0.200)
R Squared / Pseudo R Squared 0.10 0.05 N 57,681 57,380
Source: TALIS 2013. Note: Column 1 is an OLS regression, column 2 is a logistic regression. Country indicators are also included in both models. Figures in parentheses are standard errors. *** = statistically significant at 99% level. ** = statistically significant at 95% level. * = statistically significant at 90% level.
One important thing to notice about Table 1 is the low level of variation which can be explained by the models. As indicated by the R Squared statistic of 0.1, the variables included in model 1 can only explain 10% of the variation in job satisfaction among

16
teachers. Ideally this statistic would have a higher value, which would indicate that the model is able to explain more of the variation in job satisfaction. The Pseudo R Squared for model 2 is also low, at 0.05. In the next section a number of changes are made to the analysis in order to improve the explanatory power of the models.
17
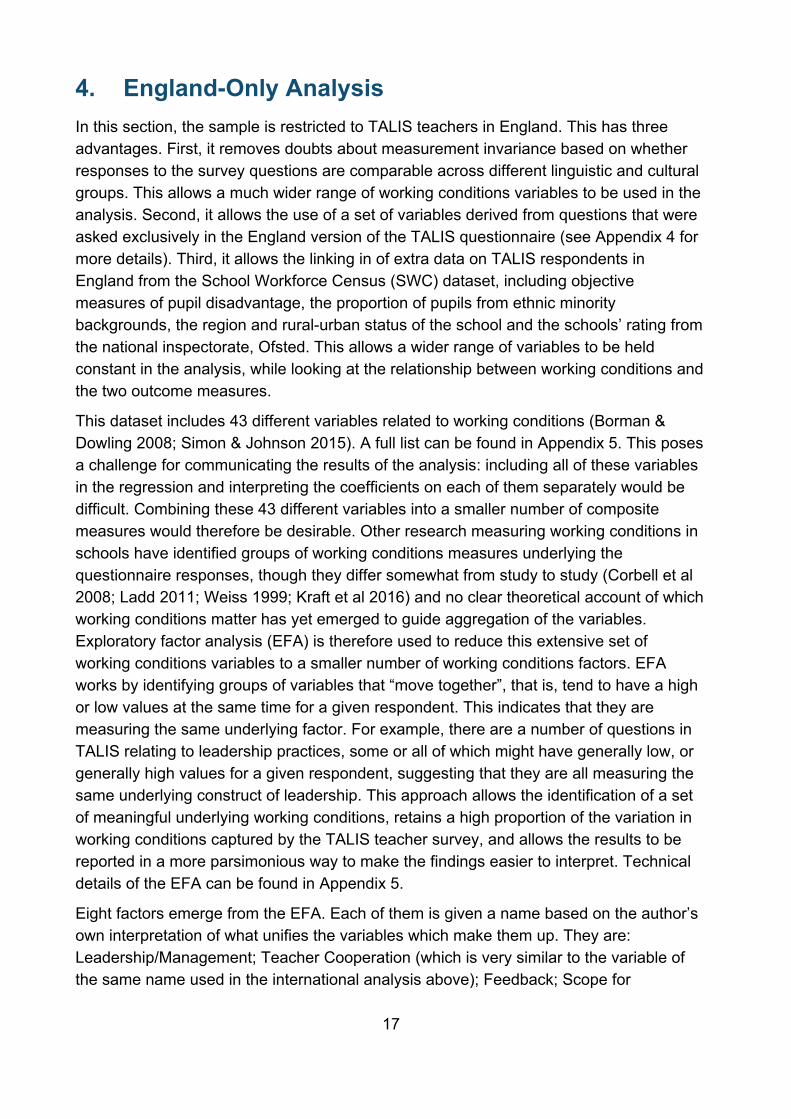
4. England-Only Analysis In this section, the sample is restricted to TALIS teachers in England. This has three advantages. First, it removes doubts about measurement invariance based on whether responses to the survey questions are comparable across different linguistic and cultural groups. This allows a much wider range of working conditions variables to be used in the analysis. Second, it allows the use of a set of variables derived from questions that were asked exclusively in the England version of the TALIS questionnaire (see Appendix 4 for more details). Third, it allows the linking in of extra data on TALIS respondents in England from the School Workforce Census (SWC) dataset, including objective measures of pupil disadvantage, the proportion of pupils from ethnic minority backgrounds, the region and rural-urban status of the school and the schools’ rating from the national inspectorate, Ofsted. This allows a wider range of variables to be held constant in the analysis, while looking at the relationship between working conditions and the two outcome measures.
This dataset includes 43 different variables related to working conditions (Borman & Dowling 2008; Simon & Johnson 2015). A full list can be found in Appendix 5. This poses a challenge for communicating the results of the analysis: including all of these variables in the regression and interpreting the coefficients on each of them separately would be difficult. Combining these 43 different variables into a smaller number of composite measures would therefore be desirable. Other research measuring working conditions in schools have identified groups of working conditions measures underlying the questionnaire responses, though they differ somewhat from study to study (Corbell et al 2008; Ladd 2011; Weiss 1999; Kraft et al 2016) and no clear theoretical account of which working conditions matter has yet emerged to guide aggregation of the variables. Exploratory factor analysis (EFA) is therefore used to reduce this extensive set of working conditions variables to a smaller number of working conditions factors. EFA works by identifying groups of variables that “move together”, that is, tend to have a high or low values at the same time for a given respondent. This indicates that they are measuring the same underlying factor. For example, there are a number of questions in TALIS relating to leadership practices, some or all of which might have generally low, or generally high values for a given respondent, suggesting that they are all measuring the same underlying construct of leadership. This approach allows the identification of a set of meaningful underlying working conditions, retains a high proportion of the variation in working conditions captured by the TALIS teacher survey, and allows the results to be reported in a more parsimonious way to make the findings easier to interpret. Technical details of the EFA can be found in Appendix 5.
Eight factors emerge from the EFA. Each of them is given a name based on the author’s own interpretation of what unifies the variables which make them up. They are: Leadership/Management; Teacher Cooperation (which is very similar to the variable of the same name used in the international analysis above); Feedback; Scope for
18
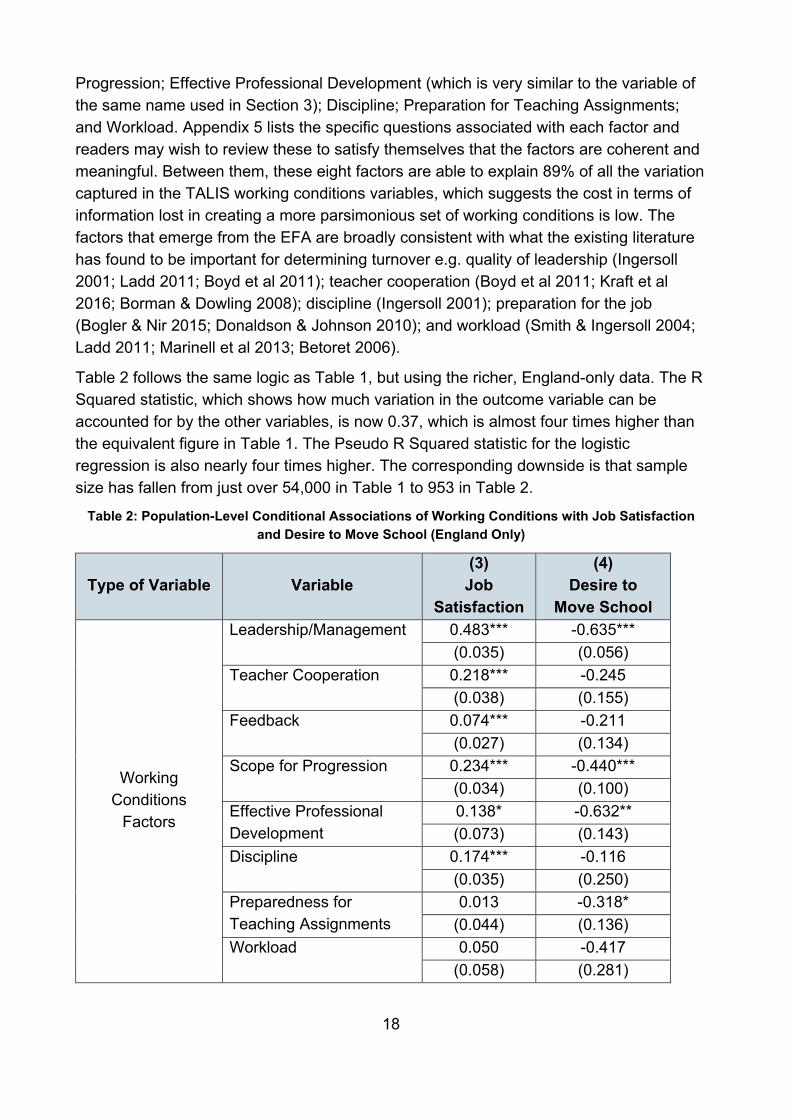
Progression; Effective Professional Development (which is very similar to the variable of the same name used in Section 3); Discipline; Preparation for Teaching Assignments; and Workload. Appendix 5 lists the specific questions associated with each factor and readers may wish to review these to satisfy themselves that the factors are coherent and meaningful. Between them, these eight factors are able to explain 89% of all the variation captured in the TALIS working conditions variables, which suggests the cost in terms of information lost in creating a more parsimonious set of working conditions is low. The factors that emerge from the EFA are broadly consistent with what the existing literature has found to be important for determining turnover e.g. quality of leadership (Ingersoll 2001; Ladd 2011; Boyd et al 2011); teacher cooperation (Boyd et al 2011; Kraft et al 2016; Borman & Dowling 2008); discipline (Ingersoll 2001); preparation for the job (Bogler & Nir 2015; Donaldson & Johnson 2010); and workload (Smith & Ingersoll 2004; Ladd 2011; Marinell et al 2013; Betoret 2006).
Table 2 follows the same logic as Table 1, but using the richer, England-only data. The R Squared statistic, which shows how much variation in the outcome variable can be accounted for by the other variables, is now 0.37, which is almost four times higher than the equivalent figure in Table 1. The Pseudo R Squared statistic for the logistic regression is also nearly four times higher. The corresponding downside is that sample size has fallen from just over 54,000 in Table 1 to 953 in Table 2.
Table 2: Population-Level Conditional Associations of Working Conditions with Job Satisfaction and Desire to Move School (England Only)
Type of Variable Variable (3) Job
Satisfaction
(4) Desire to
Move School
Working Conditions
Factors
Leadership/Management 0.483*** -0.635*** (0.035) (0.056)
Teacher Cooperation 0.218*** -0.245 (0.038) (0.155)
Feedback 0.074*** -0.211 (0.027) (0.134)
Scope for Progression 0.234*** -0.440*** (0.034) (0.100)
Effective Professional Development
0.138* -0.632** (0.073) (0.143)
Discipline 0.174*** -0.116 (0.035) (0.250)
Preparedness for Teaching Assignments
0.013 -0.318* (0.044) (0.136)
Workload 0.050 -0.417 (0.058) (0.281)
19
Type of Variable Variable (3) Job
Satisfaction
(4) Desire to
Move School
Demographic Characteristics
Age 0.003 -0.001 (0.004) (0.017)
Female -0.084 -0.065 (0.060) (0.311)
Years Since Qualified Teacher Status
0.000 -0.040 (0.008) (0.028)
Years at Current School
-0.007 -0.018 (0.007) (0.031)
Permanent Contract -0.068 2.154 (0.103) (4.428)
School Characteristics
% Pupils Female -0.003 0.009* (0.002) (0.005)
% Pupils Free School Meals
-0.003 -0.036** (0.003) (0.015)
% Pupils Ethnic Minority -0.002 0.017*** (0.001) (0.006)
School Ofsted Grade -0.013 0.205 (0.041) (0.202)
Academy -0.039 -0.006 (0.059) (0.308)
R Squared / Pseudo R Squared 0.37 0.22 N 953 953
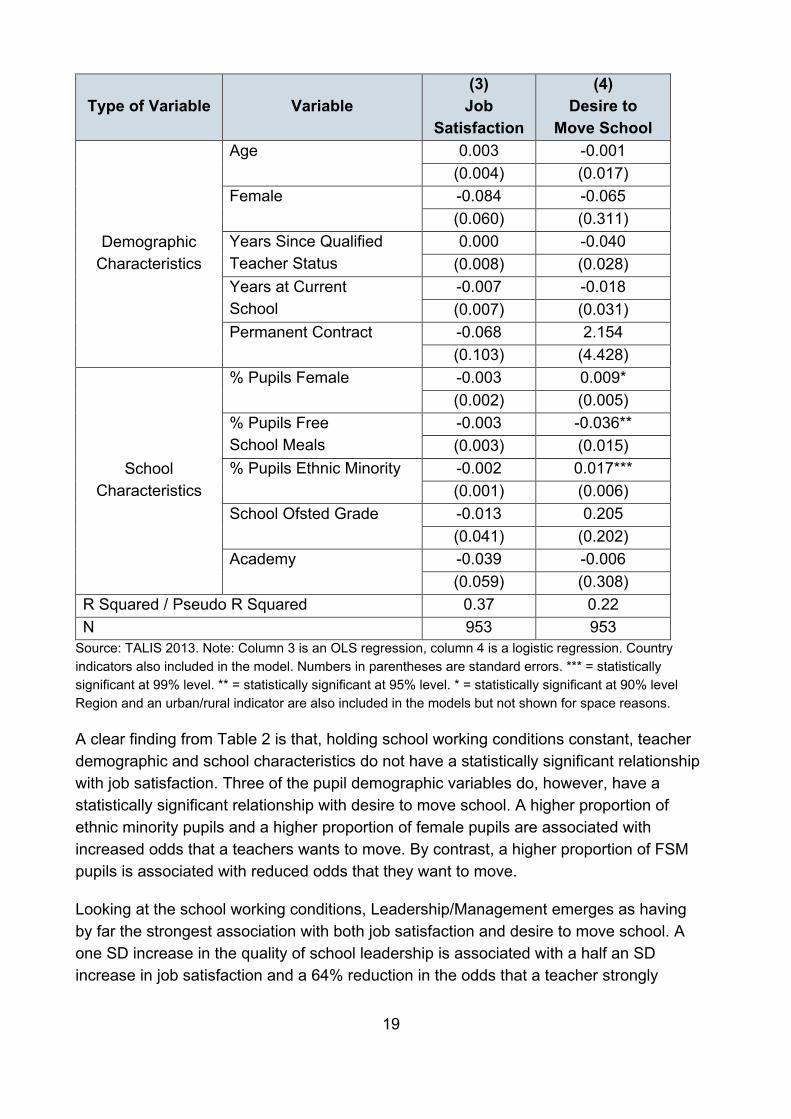
Source: TALIS 2013. Note: Column 3 is an OLS regression, column 4 is a logistic regression. Country indicators also included in the model. Numbers in parentheses are standard errors. *** = statistically significant at 99% level. ** = statistically significant at 95% level. * = statistically significant at 90% level Region and an urban/rural indicator are also included in the models but not shown for space reasons.
A clear finding from Table 2 is that, holding school working conditions constant, teacher demographic and school characteristics do not have a statistically significant relationship with job satisfaction. Three of the pupil demographic variables do, however, have a statistically significant relationship with desire to move school. A higher proportion of ethnic minority pupils and a higher proportion of female pupils are associated with increased odds that a teachers wants to move. By contrast, a higher proportion of FSM pupils is associated with reduced odds that they want to move.
Looking at the school working conditions, Leadership/Management emerges as having by far the strongest association with both job satisfaction and desire to move school. A one SD increase in the quality of school leadership is associated with a half an SD increase in job satisfaction and a 64% reduction in the odds that a teacher strongly
20
agrees they would like to move school if possible. These are very strong associations, highlighting the critical importance of school leadership for teacher retention. Teacher cooperation also has a positive relationship with job satisfaction, with a one SD increase in cooperation being associated with a 0.22 increase in satisfaction. The relationship between cooperation and desire to move school is however not statistically significant. The third working condition in Table 2, feedback, also has small positive relationship with satisfaction but no statistically significant relationship with desire to move. Scope for progression is shown to have strong, statistically significant relationship with both satisfaction and retention, with a one SD increase being associated with a 0.23 increase in satisfaction and a 44% reduction in desire to move schools. Effective professional development, has a small positive relationship with job satisfaction (a one SD increase is associated with a 0.14 SD increase in job satisfaction) and is also associated with a decrease (0.63%) in the odds that a teacher strongly agrees they want to move school. Discipline has a positive relationship with job satisfaction (a one SD increase is associated with a 0.17 SD increase) but does not have a statistically significant correlation with desire to move. By contrast, increased preparedness for teaching assignments reduces the odds a teacher wants to move schools (a one SD increase is associated with a 31% reduction in the odds that teacher wants to move school) but does not have a statistically significant relationship with job satisfaction.
Workload, as measured in this report, does not have a statistically significant relationship with either job satisfaction or desire to leave. This is perhaps surprising given that recent surveys (Higton et al 2017) show that over three quarters of teachers are dissatisfied with the hours they usually work, and previous work using TALIS (Sellen 2016) shows that teachers who agree with the statement that their workload is unmanageable tend to also to express dissatisfaction with their job. What explains this discrepancy? The workload factor used in this analysis is made up of three questions which measure the number of hours teachers spend on different activities, and two further questions which measure the frequency with which they check pupil’s books and provide written feedback. Checks for how the variables that make up the workload factor had been cleaned and coded revealed there were no errors. In further checks, the workload factor in Model 3 and 4 of Table 2 was replaced with more specific measures of workload: number of hours worked, number of non-teaching hours and whether or not teachers agree with the statement “my workload is unmanageable”. Only one of these six different specifications revealed a statistically significant relationship: agreeing or strongly agreeing that workload was unmanageable was associated with job satisfaction being 0.39 SD lower, conditional on all the other variables in the model. So it appears that the number of hours worked and frequency of marking and feedback is not related to job satisfaction, but teachers’ assessment of whether their workload is manageable is related to job satisfaction.
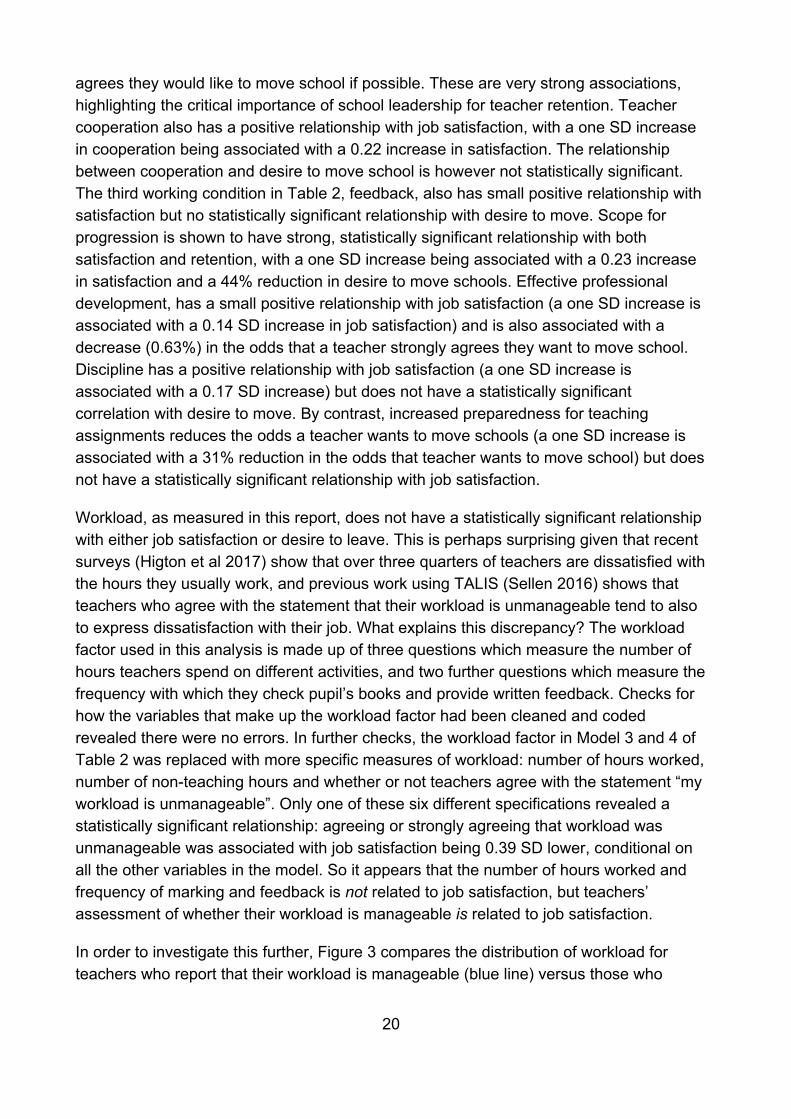
In order to investigate this further, Figure 3 compares the distribution of workload for teachers who report that their workload is manageable (blue line) versus those who
21
report that it is unmanageable (red line). Workload is measured on the horizontal axis, with a score of zero representing average workload for teachers in England and a score of one representing workload one SD above the mean. The height of the line shows how many teachers in each group have that level of workload. As can be seen from the graph, there is a high degree of overlap between teachers’ reported level of workload and whether they report their workload is manageable or not. Given that this measure of workload also accounts for the type of activities being done, this suggests that teachers’ evaluation of whether their workload is manageable depends on other factors, in addition to the work that they are doing.
Figure 3: Teacher Workload by Whether Teachers Judge Workload Unmanageable (England Only)
Source: TALIS 2013.
The Job Demands-Resource Model (JDR) (Demorouti et al 2001) is a theory from psychology which can help make sense of this apparently paradoxical finding. The theory states that the demands of a high workload are manageable, as long as the resources (or support) provided by the organisation to employees are sufficiently high to help them cope. When resources fall short of demands however, workers experience a depletion of energy and eventually become burned out. The JDR model has been shown to explain data in a range of contexts (Crawford et al 2010), including among teachers (Hakanen et al 2006). Returning to Figure 3, it may therefore be the case that teachers with similar levels of workload differ in their assessment of whether this workload is manageable, depending on the level of support available to them and whether they have already
010
020
030
040
0N
umbe
r of T
each
ers
-2 0 2 4< Lower Workload Higher Workload >
Workload is Managable Workload is Unmanagable
22
become burned out. This would also explain why there is no consistent correlation between the number of hours worked by teachers and job satisfaction, but there is a relationship between whether teachers’ feel their workload is unmanageable and job satisfaction. Testing this would require longitudinal data following the same teachers over time.
23
Conclusion This research has shown that teacher job satisfaction in England is below that of other English speaking countries that participate in the TALIS survey. Teachers in English schools are also more likely to want to move school than teachers in other English-speaking participating countries, though the difference is not statistically significant.
Consistent with research from the USA (Simon & Johnson 2015), the results show that a schools’ inspection grade and the disadvantage of its intake do not have a negative association with either teacher job satisfaction or turnover intentions, once working conditions have been controlled for. This suggests that all schools should be able to achieve a stable body of experienced teaching staff by improving working conditions, even when they are working in challenging circumstances.
Which aspects of working conditions are most important? The quality of leadership has a particularly strong association with both satisfaction and desire to leave, suggesting the central importance of school leaders in improving retention. This is consistent with findings from research using other datasets (Ingersoll 2001; Ladd 2011; Boyd et al 2011). Teacher cooperation has a fairly strong positive association with job satisfaction in both the international and England-only analyses presented here. Again, this is consistent with findings from other research (Boyd et al 2011; Kraft et al 2016; Borman & Dowling 2008). Workload is another potentially important aspect of working conditions (Higton et al 2017; Sellen 2016). This analysis shows that while number of hours worked and frequency of marking and feedback are not related to job satisfaction, conditional on other working conditions and demographic factors, teachers’ assessment of whether their workload is manageable is related to job satisfaction.
As well as replicating these findings, this research has identified a number of new correlates of improved teacher job satisfaction including feedback, discipline, scope for career progression and effective professional development. Teachers being assigned to teach classes and subjects for which they feel well prepared is also strongly associated with reduced desire to move school.
How can these findings be used to guide change in schools? Appendix 5 contains a detailed breakdown of how all of these concepts were measured, which may be of interest to school leaders looking for ways to implement change in their schools. For example, it is important to bear in mind that it is the quality of professional development, rather than the quantity, which matters.
Further research should attempt to link survey data on working conditions with administrative datasets containing information on the number of teachers actually leaving their school and/or the profession each year, which would provide more credible estimates of these relationships. In addition, research using longitudinal data would help
24
to understand why teachers doing the same amount of work differ in whether they see their workload as unmanageable. Experimental or quasi-experimental research is also required to move beyond the conditional associations identified here and test for causal relationships.22
22 Conditional associations show how one variable covaries with another, holding the other variables constant. Causal relationships show how one real world phenomenon affects another in a given context.
25
Appendix 1: The TALIS Sample TALIS aims to collect data that is representative of all eligible teachers in participating school systems. In theory, the simplest way of doing this would be to collect a simple random sample in which all teachers in the country had an equal chance of being asked to respond. However, this would be expensive and logistically demanding because teachers would be scattered in very many schools across the country. So, in order to reduce the costs of collecting the TALIS data, teachers in each of the participating school systems were instead sampled using a stratified, two-stage sampling design (Dumais & LaRoche 2014). In the first stage, schools teaching the relevant ISCED level were sampled with probability proportional to size, with some countries also employing stratification at this stage. This reduces the number of schools that have to be contacted and coordinated with in order to collect the data from individual teachers. In the second stage, teachers delivering instruction at the relevant ISCED level in these schools were randomly sampled. Using a clustered, stratified design means that the data has to be weighted at the analysis stage in order to make it representative of the population of eligible teachers. This effectively means that the “type” of teachers who end up being under-represented in the final sample count for more in the final analysis. Weighting also allows the data to be adjusted in order to account for non-response. The TALIS data is supplied with these weights already calculated and are applied to all estimates in this research using the repest command in the STATA software (Avvisati & Keslair 2016), which uses balanced repeated replication (Kish & Frankel 1970) to estimate the standard errors. This accounts for the clustering of teachers within schools. The weighting method used here means that larger countries such as Japan and the US contribute proportionally more information to the results.
26
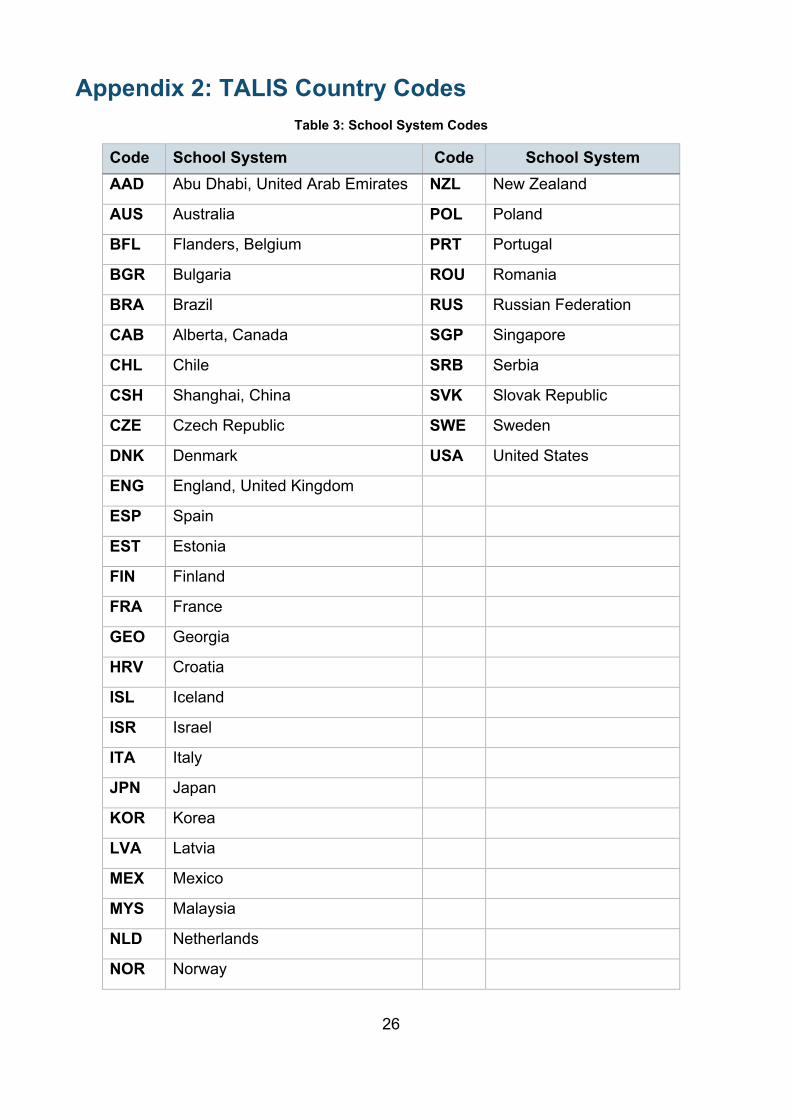
Appendix 2: TALIS Country Codes Table 3: School System Codes
Code School System Code School System AAD Abu Dhabi, United Arab Emirates NZL New Zealand
AUS Australia POL Poland
BFL Flanders, Belgium PRT Portugal
BGR Bulgaria ROU Romania
BRA Brazil RUS Russian Federation
CAB Alberta, Canada SGP Singapore
CHL Chile SRB Serbia
CSH Shanghai, China SVK Slovak Republic
CZE Czech Republic SWE Sweden
DNK Denmark USA United States
ENG England, United Kingdom
ESP Spain
EST Estonia
FIN Finland
FRA France
GEO Georgia
HRV Croatia
ISL Iceland
ISR Israel
ITA Italy
JPN Japan
KOR Korea
LVA Latvia
MEX Mexico
MYS Malaysia
NLD Netherlands
NOR Norway
27
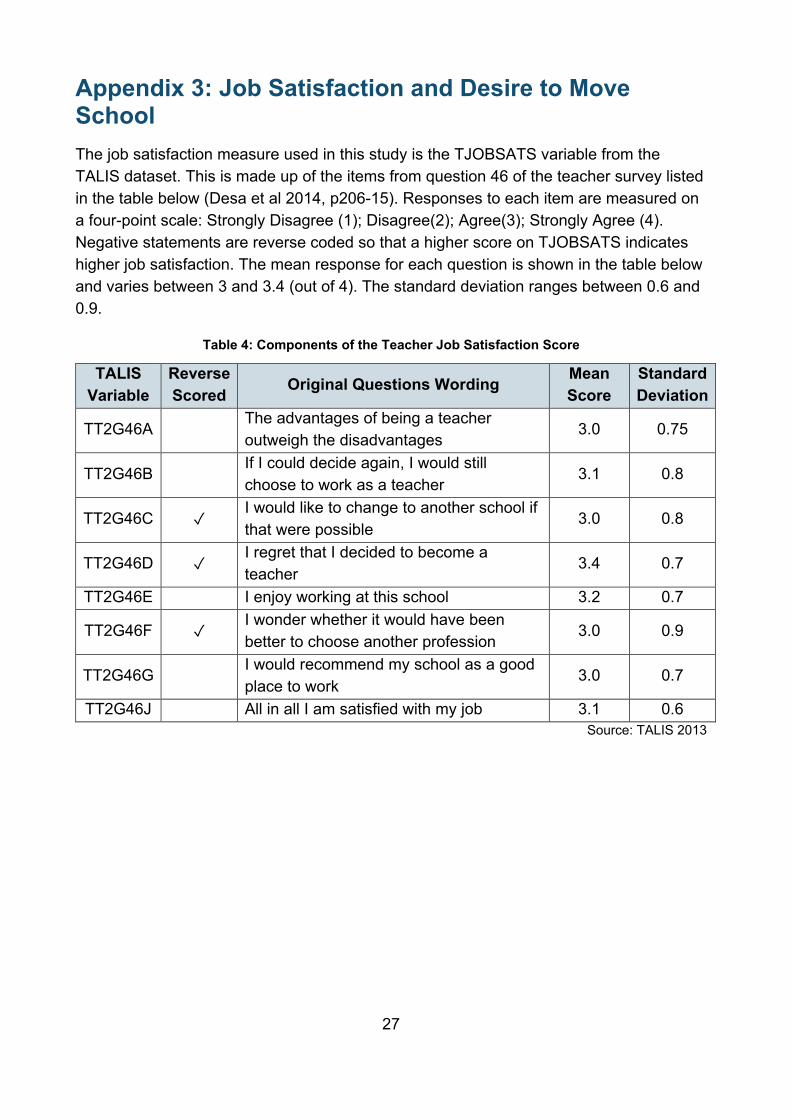
Appendix 3: Job Satisfaction and Desire to Move School The job satisfaction measure used in this study is the TJOBSATS variable from the TALIS dataset. This is made up of the items from question 46 of the teacher survey listed in the table below (Desa et al 2014, p206-15). Responses to each item are measured on a four-point scale: Strongly Disagree (1); Disagree(2); Agree(3); Strongly Agree (4). Negative statements are reverse coded so that a higher score on TJOBSATS indicates higher job satisfaction. The mean response for each question is shown in the table below and varies between 3 and 3.4 (out of 4). The standard deviation ranges between 0.6 and 0.9.
Table 4: Components of the Teacher Job Satisfaction Score
TALIS Variable
Reverse Scored Original Questions Wording Mean
Score Standard Deviation
TT2G46A The advantages of being a teacher outweigh the disadvantages
3.0 0.75
TT2G46B If I could decide again, I would still choose to work as a teacher
3.1 0.8
TT2G46C ✓ I would like to change to another school if that were possible
3.0 0.8
TT2G46D ✓ I regret that I decided to become a teacher
3.4 0.7
TT2G46E I enjoy working at this school 3.2 0.7
TT2G46F ✓ I wonder whether it would have been better to choose another profession
3.0 0.9
TT2G46G I would recommend my school as a good place to work
3.0 0.7
TT2G46J All in all I am satisfied with my job 3.1 0.6 Source: TALIS 2013
28
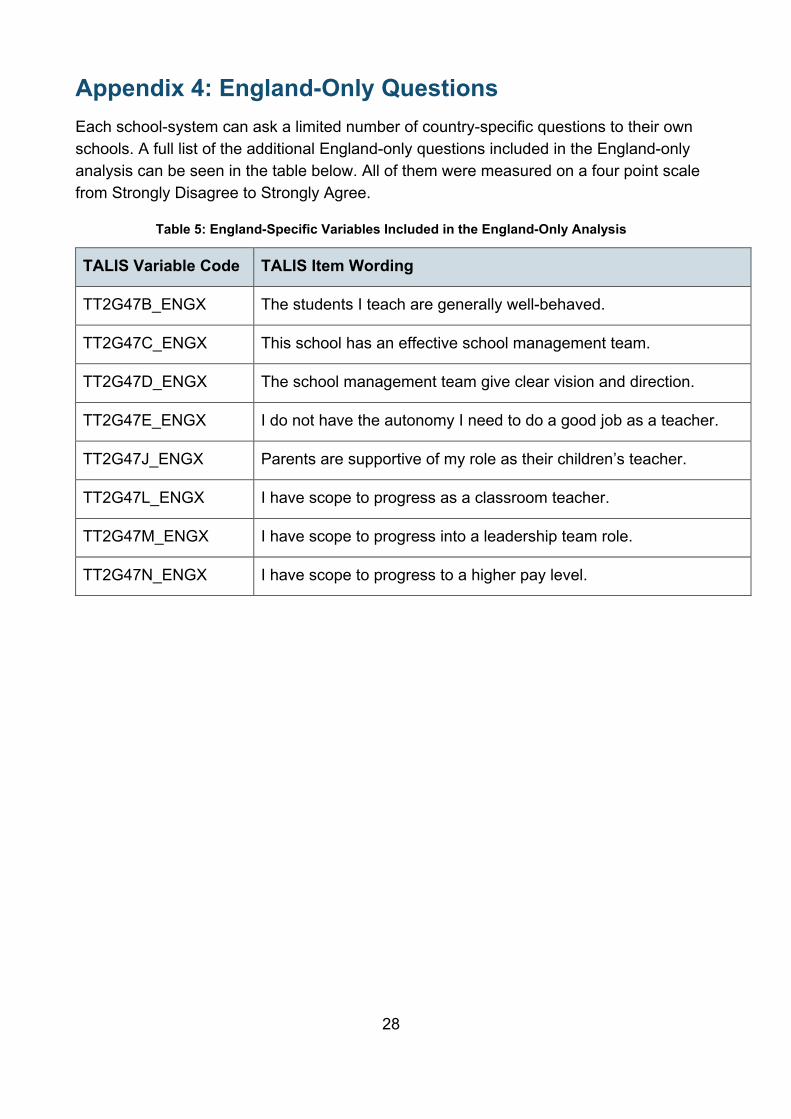
Appendix 4: England-Only Questions Each school-system can ask a limited number of country-specific questions to their own schools. A full list of the additional England-only questions included in the England-only analysis can be seen in the table below. All of them were measured on a four point scale from Strongly Disagree to Strongly Agree.
Table 5: England-Specific Variables Included in the England-Only Analysis
TALIS Variable Code TALIS Item Wording
TT2G47B_ENGX The students I teach are generally well-behaved.
TT2G47C_ENGX This school has an effective school management team.
TT2G47D_ENGX The school management team give clear vision and direction.
TT2G47E_ENGX I do not have the autonomy I need to do a good job as a teacher.
TT2G47J_ENGX Parents are supportive of my role as their children’s teacher.
TT2G47L_ENGX I have scope to progress as a classroom teacher.
TT2G47M_ENGX I have scope to progress into a leadership team role.
TT2G47N_ENGX I have scope to progress to a higher pay level.
29
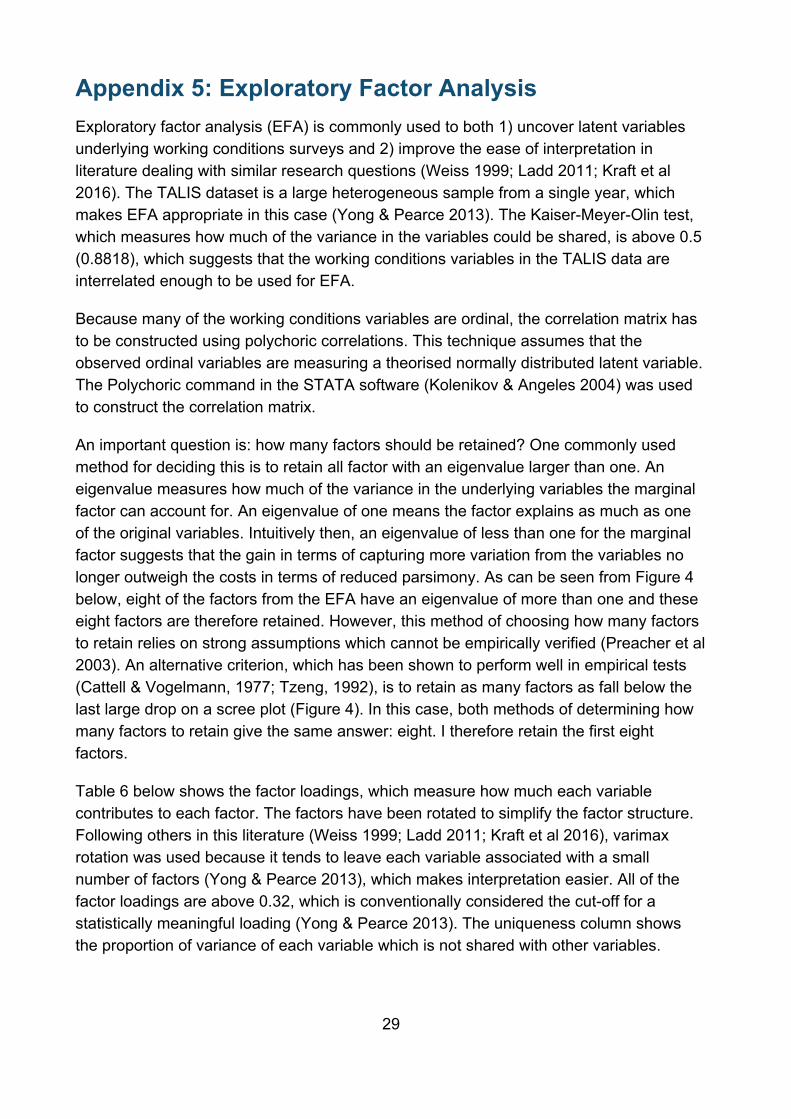
Appendix 5: Exploratory Factor Analysis Exploratory factor analysis (EFA) is commonly used to both 1) uncover latent variables underlying working conditions surveys and 2) improve the ease of interpretation in literature dealing with similar research questions (Weiss 1999; Ladd 2011; Kraft et al 2016). The TALIS dataset is a large heterogeneous sample from a single year, which makes EFA appropriate in this case (Yong & Pearce 2013). The Kaiser-Meyer-Olin test, which measures how much of the variance in the variables could be shared, is above 0.5 (0.8818), which suggests that the working conditions variables in the TALIS data are interrelated enough to be used for EFA.
Because many of the working conditions variables are ordinal, the correlation matrix has to be constructed using polychoric correlations. This technique assumes that the observed ordinal variables are measuring a theorised normally distributed latent variable. The Polychoric command in the STATA software (Kolenikov & Angeles 2004) was used to construct the correlation matrix.
An important question is: how many factors should be retained? One commonly used method for deciding this is to retain all factor with an eigenvalue larger than one. An eigenvalue measures how much of the variance in the underlying variables the marginal factor can account for. An eigenvalue of one means the factor explains as much as one of the original variables. Intuitively then, an eigenvalue of less than one for the marginal factor suggests that the gain in terms of capturing more variation from the variables no longer outweigh the costs in terms of reduced parsimony. As can be seen from Figure 4 below, eight of the factors from the EFA have an eigenvalue of more than one and these eight factors are therefore retained. However, this method of choosing how many factors to retain relies on strong assumptions which cannot be empirically verified (Preacher et al 2003). An alternative criterion, which has been shown to perform well in empirical tests (Cattell & Vogelmann, 1977; Tzeng, 1992), is to retain as many factors as fall below the last large drop on a scree plot (Figure 4). In this case, both methods of determining how many factors to retain give the same answer: eight. I therefore retain the first eight factors.
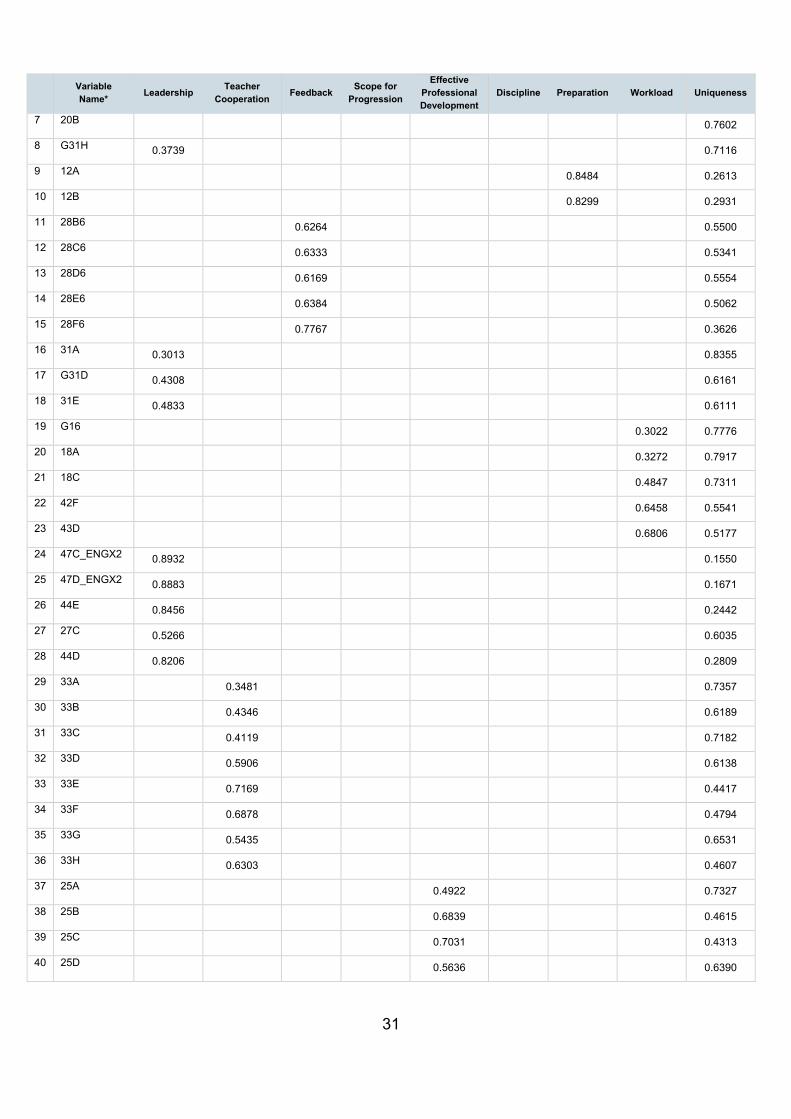
Table 6 below shows the factor loadings, which measure how much each variable contributes to each factor. The factors have been rotated to simplify the factor structure. Following others in this literature (Weiss 1999; Ladd 2011; Kraft et al 2016), varimax rotation was used because it tends to leave each variable associated with a small number of factors (Yong & Pearce 2013), which makes interpretation easier. All of the factor loadings are above 0.32, which is conventionally considered the cut-off for a statistically meaningful loading (Yong & Pearce 2013). The uniqueness column shows the proportion of variance of each variable which is not shared with other variables.

30
The information from the EFA was then used to calculate the factor scores by estimating their value for each teacher based on their individual responses to the 43 working conditions variables. The resulting eight factors are then standardized, using the weighted mean and standard deviation, to allow comparison of their relative influence on job satisfaction and desire to move school in a common metric.
Figure 4: Eigenvalues for Each Marginal Factor in the EFA (England Only)
Source: TALIS 2013. Note: The red line indicates an eigenvalue of one.
Table 6: Factors Loadings of the Different Variables (England Only)
Variable Name* Leadership Teacher
Cooperation Feedback Scope for Progression
Effective Professional Development
Discipline Preparation Workload Uniqueness
1 44A 0.7913 0.3103
2 47E_ENGX2 0.3939 0.7472
3 34D 0.8194 0.3096
4 34H 0.8286 0.2885
5 47B_ENGX2 0.3524 0.3125 0.7251
6 20A 0.8598
02
46
8Ei
genv
alue
s
0 10 20 30 40Number of Factors
31
Variable Name* Leadership Teacher
Cooperation Feedback Scope for Progression
Effective Professional Development
Discipline Preparation Workload Uniqueness
7 20B 0.7602
8 G31H 0.3739 0.7116
9 12A 0.8484 0.2613
10 12B 0.8299 0.2931
11 28B6 0.6264 0.5500
12 28C6 0.6333 0.5341
13 28D6 0.6169 0.5554
14 28E6 0.6384 0.5062
15 28F6 0.7767 0.3626
16 31A 0.3013 0.8355
17 G31D 0.4308 0.6161
18 31E 0.4833 0.6111
19 G16 0.3022 0.7776
20 18A 0.3272 0.7917
21 18C 0.4847 0.7311
22 42F 0.6458 0.5541
23 43D 0.6806 0.5177
24 47C_ENGX2 0.8932 0.1550
25 47D_ENGX2 0.8883 0.1671
26 44E 0.8456 0.2442
27 27C 0.5266 0.6035
28 44D 0.8206 0.2809
29 33A 0.3481 0.7357
30 33B 0.4346 0.6189
31 33C 0.4119 0.7182
32 33D 0.5906 0.6138
33 33E 0.7169 0.4417
34 33F 0.6878 0.4794
35 33G 0.5435 0.6531
36 33H 0.6303 0.4607
37 25A 0.4922 0.7327
38 25B 0.6839 0.4615
39 25C 0.7031 0.4313
40 25D 0.5636 0.6390
32
Variable Name* Leadership Teacher
Cooperation Feedback Scope for Progression
Effective Professional Development
Discipline Preparation Workload Uniqueness
41 47N_ENGX2 0.8292 0.2373
42 47M_ENGX2 0.3561 0.8357 0.1656
43 47L_ENGX2 0.3071 0.6849 0.3820
Note: The second column contains the variable code from the ISCED 2 TALIS teacher survey with the standard TT2G prefix removed. Factor loadings below an absolute value of 0.3 are blanked out. This shows loadings after varimax rotation. *Readers wishing to look up the exact wording of each question can find them in the 2013 questionnaire.
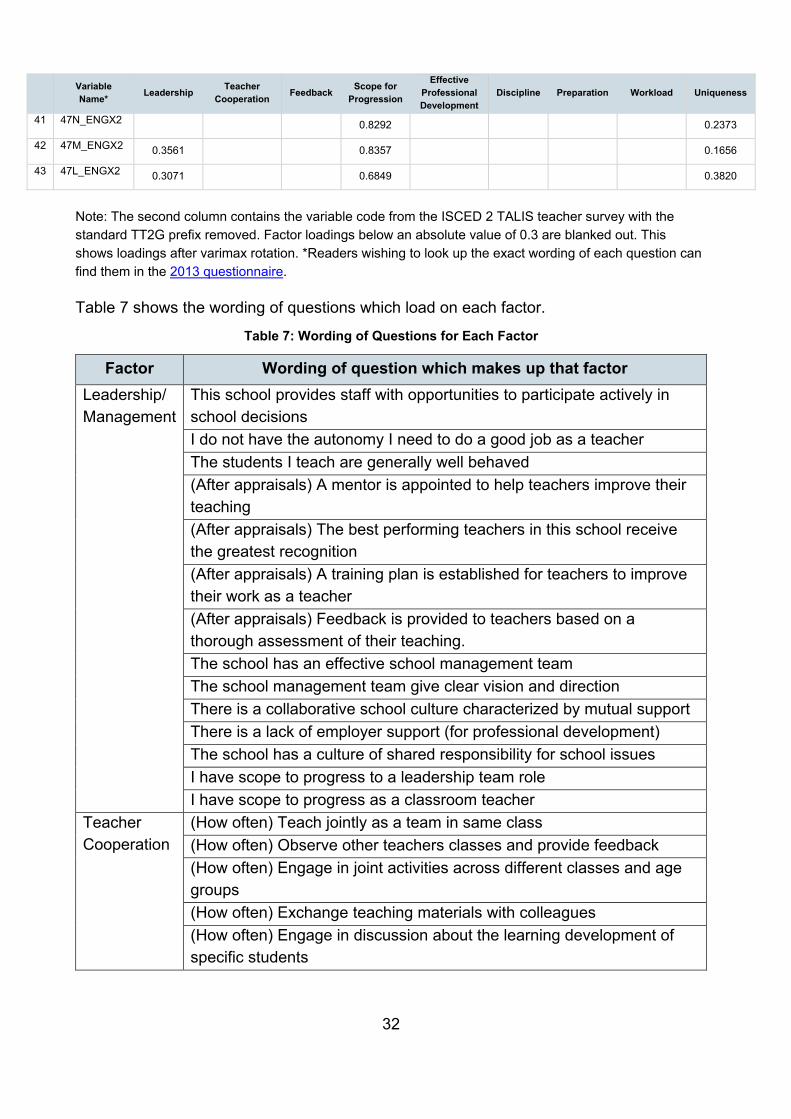
Table 7 shows the wording of questions which load on each factor.
Table 7: Wording of Questions for Each Factor
Factor Wording of question which makes up that factor Leadership/ Management
This school provides staff with opportunities to participate actively in school decisions I do not have the autonomy I need to do a good job as a teacher The students I teach are generally well behaved (After appraisals) A mentor is appointed to help teachers improve their teaching (After appraisals) The best performing teachers in this school receive the greatest recognition (After appraisals) A training plan is established for teachers to improve their work as a teacher (After appraisals) Feedback is provided to teachers based on a thorough assessment of their teaching. The school has an effective school management team The school management team give clear vision and direction There is a collaborative school culture characterized by mutual support There is a lack of employer support (for professional development) The school has a culture of shared responsibility for school issues I have scope to progress to a leadership team role I have scope to progress as a classroom teacher
Teacher Cooperation
(How often) Teach jointly as a team in same class (How often) Observe other teachers classes and provide feedback (How often) Engage in joint activities across different classes and age groups (How often) Exchange teaching materials with colleagues (How often) Engage in discussion about the learning development of specific students
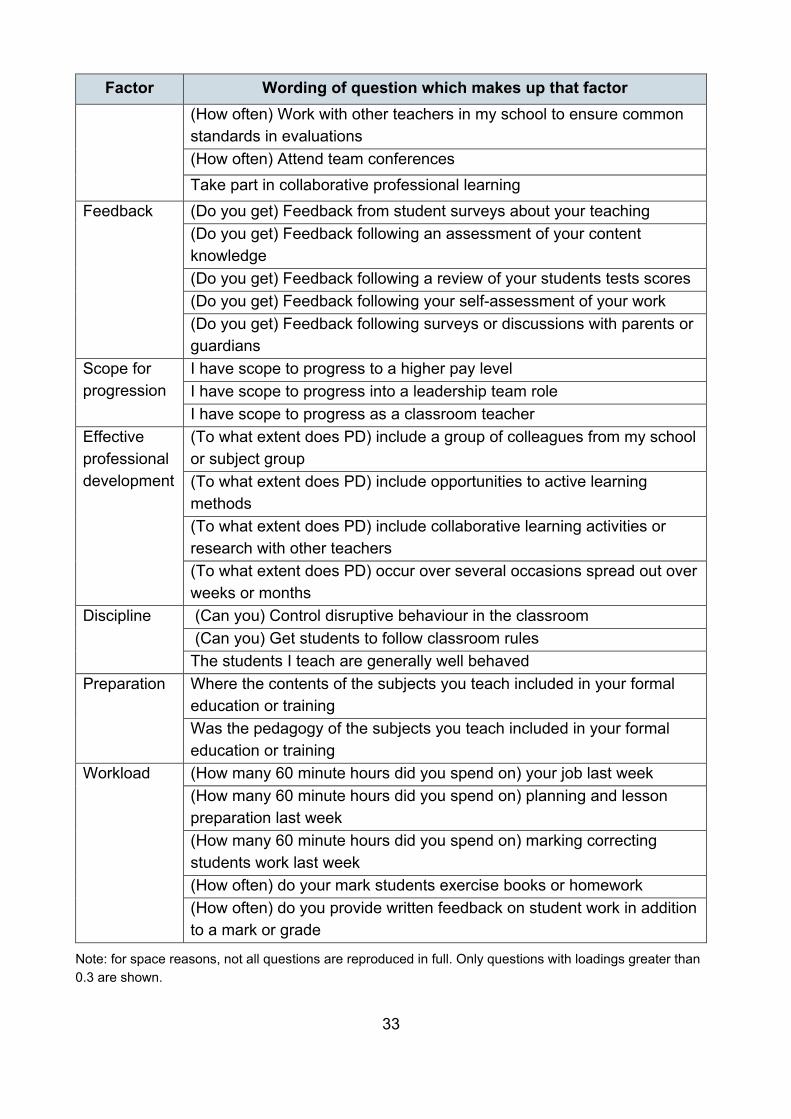
33
Factor Wording of question which makes up that factor (How often) Work with other teachers in my school to ensure common standards in evaluations (How often) Attend team conferences Take part in collaborative professional learning
Feedback (Do you get) Feedback from student surveys about your teaching (Do you get) Feedback following an assessment of your content knowledge (Do you get) Feedback following a review of your students tests scores (Do you get) Feedback following your self-assessment of your work (Do you get) Feedback following surveys or discussions with parents or guardians
Scope for progression
I have scope to progress to a higher pay level I have scope to progress into a leadership team role I have scope to progress as a classroom teacher
Effective professional development
(To what extent does PD) include a group of colleagues from my school or subject group (To what extent does PD) include opportunities to active learning methods (To what extent does PD) include collaborative learning activities or research with other teachers (To what extent does PD) occur over several occasions spread out over weeks or months
Discipline (Can you) Control disruptive behaviour in the classroom (Can you) Get students to follow classroom rules The students I teach are generally well behaved
Preparation Where the contents of the subjects you teach included in your formal education or training Was the pedagogy of the subjects you teach included in your formal education or training
Workload (How many 60 minute hours did you spend on) your job last week (How many 60 minute hours did you spend on) planning and lesson preparation last week (How many 60 minute hours did you spend on) marking correcting students work last week (How often) do your mark students exercise books or homework (How often) do you provide written feedback on student work in addition to a mark or grade
Note: for space reasons, not all questions are reproduced in full. Only questions with loadings greater than 0.3 are shown.
34
References Allen, R., Burgess, S. and Mayo, J., 2012. The teacher labour market, teacher turnover and disadvantaged schools: new evidence for England. Working Paper No. 12/294.
Allen, R. and Sims, S., Forthcoming. What is Distinctive about Science Teacher Retention? Unpublished Manuscript.
Allen, S., Sims, S., Knibbs, S., Mollidor, C. and Lindley, L., Forthcoming. High Potential Middle Leaders (Secondary) Programme: an Evaluation. Unpublished Manuscript.
Atteberry, A., Loeb, S. and Wyckoff, J., 2016. Teacher Churning Reassignment Rates and Implications for Student Achievement. Educational Evaluation and Policy Analysis, 20(10), pp.1-28.
Becker, E. ed. (2014) TALIS: Used Guide for the International Dataset. OECD.
Betoret, F., 2006. Stressors, self‐efficacy, coping resources, and burnout among secondary school teachers in Spain. Educational Psychology, 26(4), pp.519-539.
Bogler, R. and Nir, A., 2015. The contribution of perceived fit between job demands and abilities to teachers’ commitment and job satisfaction. Educational Management Administration & Leadership, 43(4), pp.541-560.
Borman, G. and Dowling, N., 2008. Teacher attrition and retention: A meta-analytic and narrative review of the research. Review of Educational Research, 78(3), pp.367-409.
Boyd, D., Grossman, P., Ing, M., Lankford, H., Loeb, S. and Wyckoff, J., 2011. The influence of school administrators on teacher retention decisions. American Educational Research Journal, 48(2), pp.303-333.
Cattell, R.B. and Vogelmann, S., 1977. A comprehensive trial of the scree and KG criteria for determining the number of factors. Multivariate Behavioral Research, 12(3), pp.289-325.
Corbell, K. A., Reiman, A. J., & Nietfeld, J. L. (2008). The perceptions of success inventory for beginning teachers: Measuring its psychometric properties. Teaching and Teacher Education, 24(6), 1551-1563.
Crawford, E. R., Lepine, J. A., & Rich, B. L. (2010). Linking Job Demands and Resources to Employee Engagement and Burnout : A Theoretical Extension and Meta-Analytic Test, 95(5), 834–848.
Demerouti, E., Bakker, A. B., Nachreiner, F., & Schaufeli, W. B., 2001. The job demands-resources model of burnout. Journal of Applied Psychology, 86, 499–512.

35
Desa, D., 2016. Understanding non-linear modelling of measurement invariance in heterogeneous populations. Advances in Data Analysis and Classification, pp.1-25.
Desa, D., Gonzalez, E. and Mirazchiyski, P., 2014. Construction of Scales and Indices. In: Belanger, J., Normandeau, S. and Larrakoetxea, E. ed. TALIS 2013 Technical Report. OECD, pp.145-295.
Donaldson, M. and Johnson, S., 2010. The price of misassignment: The role of teaching assignments in Teach for America teachers’ exit from low-income schools and the teaching profession. Educational Evaluation and Policy Analysis, 32(2), pp.299-323.
Dumais, J. and LaRoche, S. 2014. Sampling Design. In: Belanger, J., Normandeau, S. and Larrakoetxea, E. ed. TALIS 2013 Technical Report. OECD, pp.73-84.
Duyar, I., Gumus, S. and Sukru Bellibas, M., 2013. Multilevel analysis of teacher work attitudes: The influence of principal leadership and teacher collaboration. International Journal of Educational Management, 27(7), pp.700-719.
Fackler, S., & Malmberg, L., 2016. Teachers' self-efficacy in 14 OECD countries: Teacher, student group, school and leadership effects. Teaching and Teacher Education, 56, 185-195.
Fredriksson, P., Öckert, B. and Oosterbeek, H., 2013. Long-term effects of class size. The Quarterly Journal of Economics, 128(1), pp.249-285.
Greenland, S., Senn, S.J., Rothman, K.J., Carlin, J.B., Poole, C., Goodman, S.N. and Altman, D.G., 2016. Statistical tests, P values, confidence intervals and power: a guide to misinterpretations. European Journal of Epidemiology, 31(4), pp.337-350.
Gupta, V., Hanges, P.J. and Dorfman, P., 2002. Cultural clusters: Methodology and findings. Journal of World Business, 37(1), pp.11-15.
Hakanen, J. J., Bakker, A. B., & Schaufeli, W. B. (2006). Burnout and work engagement among teachers, 43, 495–513.
Higton, J., Leonardi, S., Richards, N., Choudhoury, Sofroniou, N. and Owen, D. 2017. Teacher Workload Survey 2016. Department for Education.
Ingersoll, R., 2001. Teacher turnover and teacher shortages: An organizational analysis. American Educational Research Journal, 38(3), pp.499-534.
Kish, L., & Frankel, M. R. (1970). Balanced repeated replications for standard errors. Journal of the American Statistical Association, 65(331), 1071-1094.
36
Knoll, S. and Koršnáková, P. 2014. In: Belanger, J., Normandeau, S. and Larrakoetxea, E. ed. TALIS 2013 Technical Report. OECD.
Kolenikov, S. and Angeles, G., 2004. The use of discrete data in PCA: theory, simulations, and applications to socioeconomic indices. Chapel Hill: Carolina Population Center, University of North Carolina, pp.1-59.
Kraft, M., Marinell, W. and Shen-Wei Yee, D., 2016. School organizational contexts, teacher turnover, and student achievement: Evidence from panel data. American Educational Research Journal, 53(5), pp.1411-1449.
Ladd, H., 2011. Teachers’ perceptions of their working conditions: How predictive of planned and actual teacher movement? Educational Evaluation and Policy Analysis, 33(2), pp.235-261.
Lynch, S., Worth, J., Bamford, S. and Wespieser, K., 2016. Engaging Teachers: NFER Analysis of Teacher Retention. National Foundation for Educational Research.
Marinell, W. and Coca, V., 2013. Who Stays and Who Leaves? Findings from a Three-Part Study of Teacher Turnover in NYC Middle Schools. Research Alliance for New York City Schools.
Menon, M. and Saitis, C., 2006. Satisfaction of pre-service and in-service teachers with primary school organization: Evidence from Greece. Educational Management Administration & Leadership, 34(3), pp.345-363.
Micklewright, J., Jerrim, J., Vignoles, A., Jenkins, A., Allen, R., Ilie, S., Bellarbre, E., Barrera, F. and Hein, C., 2014. Teachers in England’s secondary schools: evidence from TALIS 2013. Department for Education.
Preacher, K.J. and MacCallum, R.C., 2003. Repairing Tom Swift's electric factor analysis machine. Understanding statistics: Statistical issues in psychology, education, and the social sciences, 2(1), pp.13-43.
Mocetti, S., 2012. Educational choices and the selection process: before and after compulsory schooling. Education Economics, 20(2), pp.189-209.
Ronfeldt, M., Loeb, S. and Wyckoff, J., 2013. How teacher turnover harms student achievement. American Educational Research Journal, 50(1), pp.4-36.
Rutkowski, L. and Svetina, D., 2014. Assessing the hypothesis of measurement invariance in the context of large-scale international surveys. Educational and Psychological Measurement, 74(1), pp.31-57.

37
Schanzenbach, D., 2006. What have researchers learned from Project STAR? Brookings Papers on Education Policy, (9), pp.205-228.
Sellen, P., 2016. Teacher workload and professional development in England’s secondary schools: insights from TALIS. Education Policy Institute.
Simon, N. and Johnson, S., 2015. Teacher turnover in high-poverty schools: What we know and can do. Teachers College Record, 117(3), pp.1-36.
Smith, T. and Ingersoll, R., 2004. What are the effects of induction and mentoring on beginning teacher turnover? American educational research journal, 41(3), pp.681-714.
Smithers, A. and Robinson, P., 2000. Coping with teacher shortages. Centre for Education and Employment Research.
Tzeng, O.C., 1992. On reliability and number of principal components: Joinder with Cliff and Kaiser. Perceptual and motor skills, 75(3), pp.929-930.
Weiss, E., 1999. Perceived workplace conditions and first-year teachers’ morale, career choice commitment, and planned retention: A secondary analysis. Teaching and Teacher Education, 15(8), pp.861-879.
You, S. and Conley, S., 2015. Workplace predictors of secondary school teachers’ intention to leave: An exploration of career stages. Educational Management Administration & Leadership, 43(4), pp.561-581.
38
You may re-use this document/publication (not including logos) free of charge in any format or medium, under the terms of the Open Government Licence v2.0. To view this licence, visit www.nationalarchives.gov.uk/doc/open-government-licence/version/2 or email: [email protected].
Where we have identified any third party copyright information you will need to obtain permission from the copyright holders concerned.
The views expressed in this report are the authors’ and do not necessarily reflect those of the Department for Education.
Reference: DFE-RR730
ISBN: 978-1-78105-825-1
The views expressed in this report are the authors’ and do not necessarily reflect those of the Department for Education.
Any enquiries regarding this publication should be sent to us at: [email protected] or www.education.gov.uk/contactus
This document is available for download at www.gov.uk/government/publications