Embed Size (px)
Citation preview
Taklimat Laporan Tahunan 2017 danLaporan Kestabilan Kewangandan Sistem Pembayaran 2017
Bank Negara Malaysia
28 Mac 2018
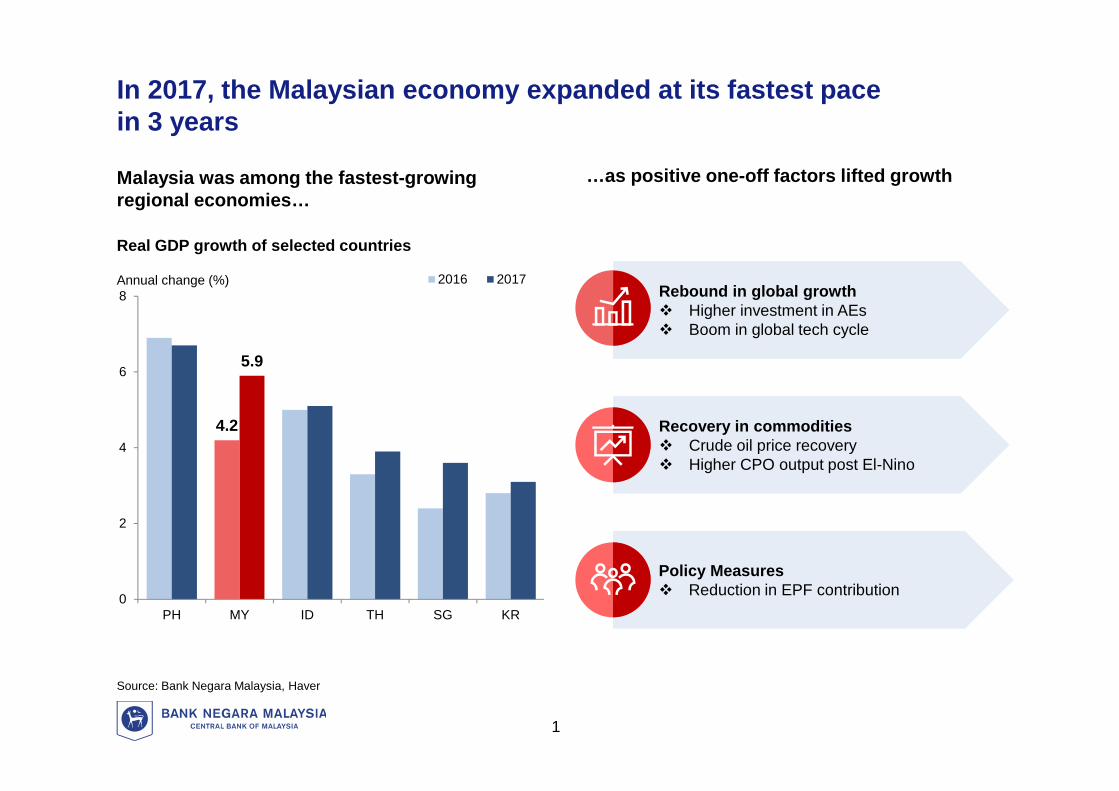
Policy Measures Reduction in EPF contribution
Recovery in commodities Crude oil price recovery Higher CPO output post El-Nino
In 2017, the Malaysian economy expanded at its fastest pacein 3 years
Malaysia was among the fastest-growingregional economies…
…as positive one-off factors lifted growth
Real GDP growth of selected countries
Source: Bank Negara Malaysia, Haver
4.2
5.9
0
2
4
6
8
PH MY ID TH SG KR
2016 2017Annual change (%)Rebound in global growth Higher investment in AEs Boom in global tech cycle
1
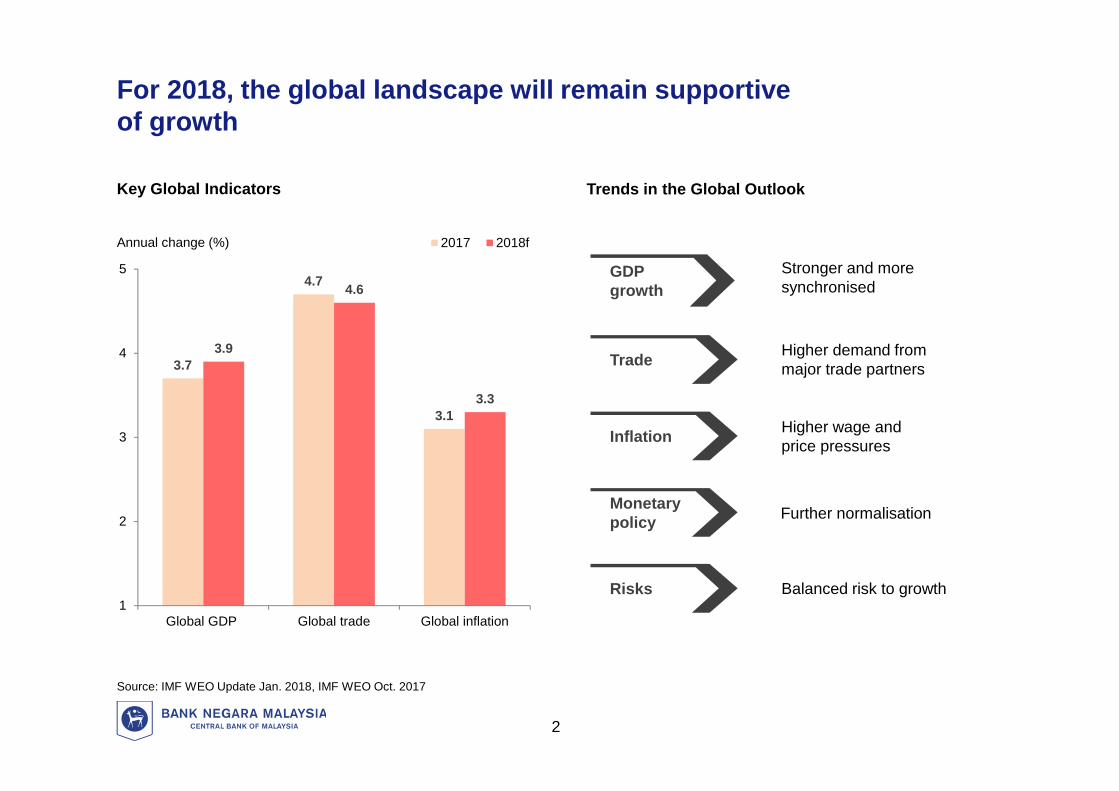
Trends in the Global Outlook
3.7
4.7
3.1
3.9
4.6
3.3
1
2
3
4
5
Global GDP Global trade Global inflation
2017 2018fAnnual change (%)
Source: IMF WEO Update Jan. 2018, IMF WEO Oct. 2017
Stronger and moresynchronised
Higher demand frommajor trade partners
Higher wage andprice pressures
Further normalisation
Balanced risk to growth
GDPgrowth
Trade
Inflation
Monetarypolicy
Risks
Key Global Indicators
For 2018, the global landscape will remain supportiveof growth
2
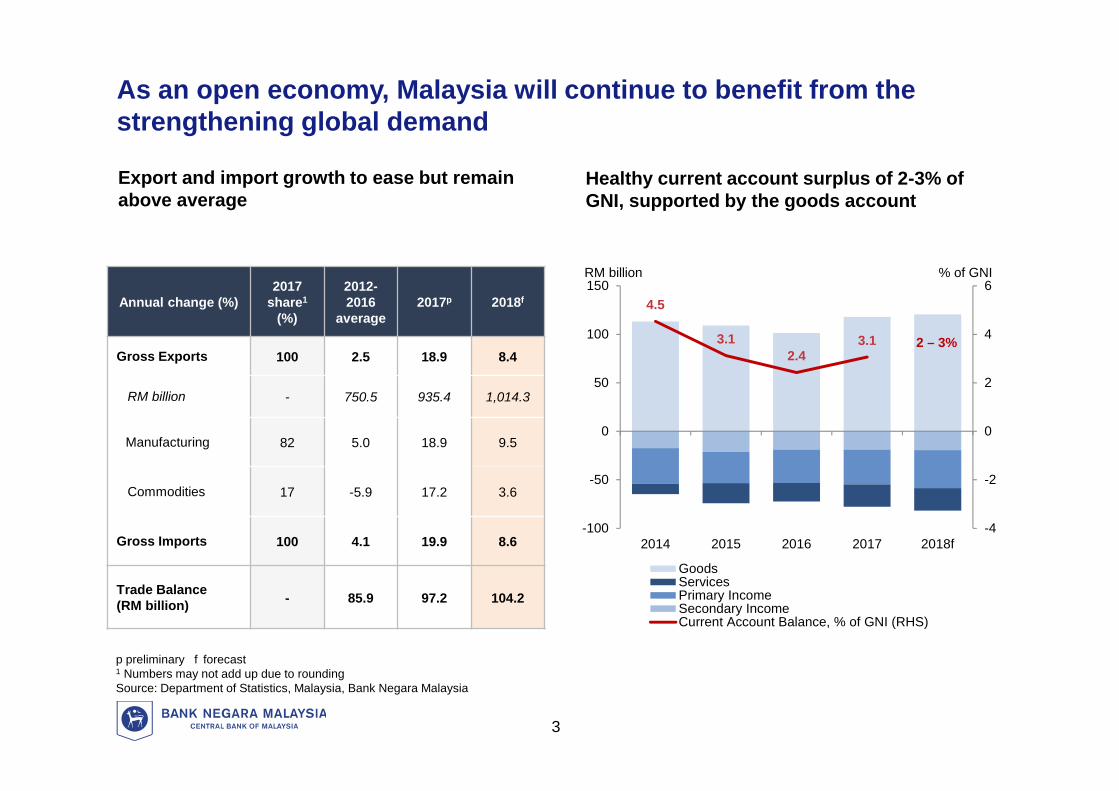
As an open economy, Malaysia will continue to benefit from thestrengthening global demand
Healthy current account surplus of 2-3% ofGNI, supported by the goods account
p preliminary f forecast1 Numbers may not add up due to roundingSource: Department of Statistics, Malaysia, Bank Negara Malaysia
Export and import growth to ease but remainabove average
Annual change (%)2017
share1
(%)
2012-2016
average2017p 2018f
Gross Exports 100 2.5 18.9 8.4
RM billion - 750.5 935.4 1,014.3
Manufacturing 82 5.0 18.9 9.5
Commodities 17 -5.9 17.2 3.6
Gross Imports 100 4.1 19.9 8.6
Trade Balance(RM billion) - 85.9 97.2 104.2
4.5
3.12.4
3.1
-4
-2
0
2
4
6
-100
-50
0
50
100
150
2014 2015 2016 2017 2018f
GoodsServicesPrimary IncomeSecondary IncomeCurrent Account Balance, % of GNI (RHS)
RM billion % of GNI
2 – 3%
3
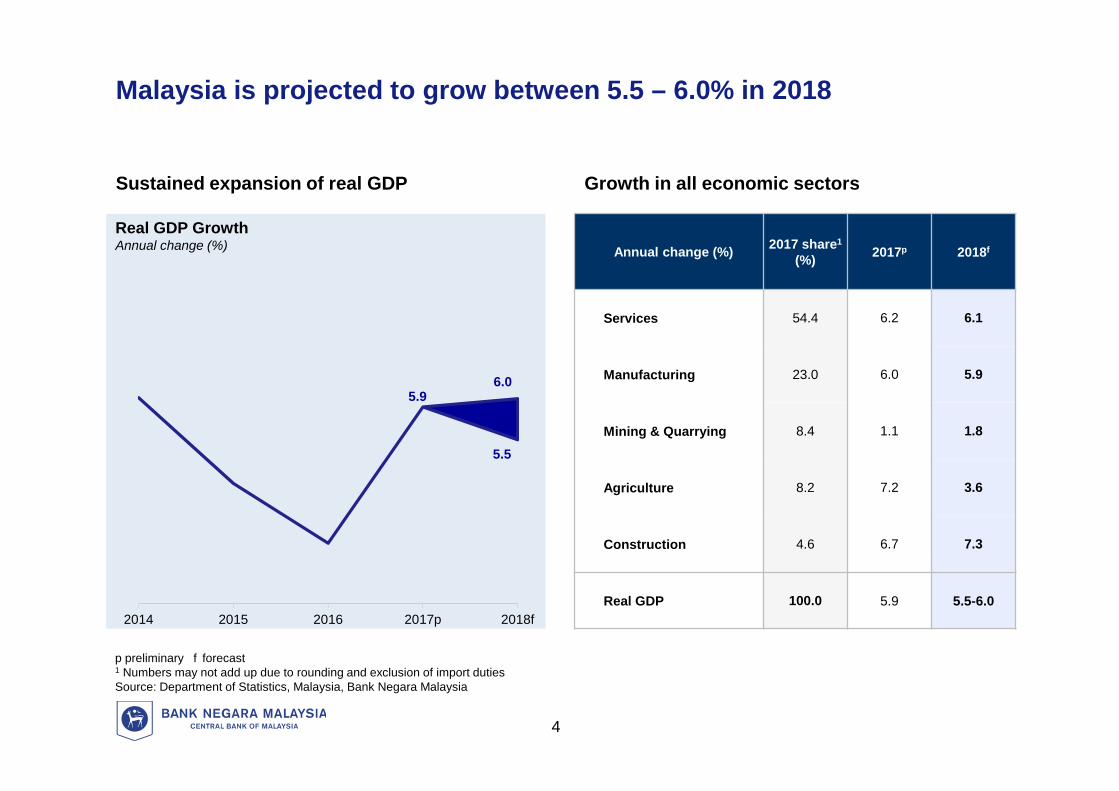
5.9
2014 2015 2016 2017p 2018f
Annual change (%) 2017 share1
(%) 2017p 2018f
Services 54.4 6.2 6.1
Manufacturing 23.0 6.0 5.9
Mining & Quarrying 8.4 1.1 1.8
Agriculture 8.2 7.2 3.6
Construction 4.6 6.7 7.3
Real GDP 100.0 5.9 5.5-6.0
p preliminary f forecast1 Numbers may not add up due to rounding and exclusion of import dutiesSource: Department of Statistics, Malaysia, Bank Negara Malaysia
10
Updated
Growth in all economic sectors
Malaysia is projected to grow between 5.5 – 6.0% in 2018
Real GDP GrowthAnnual change (%)
6.0
5.5
Sustained expansion of real GDP
4
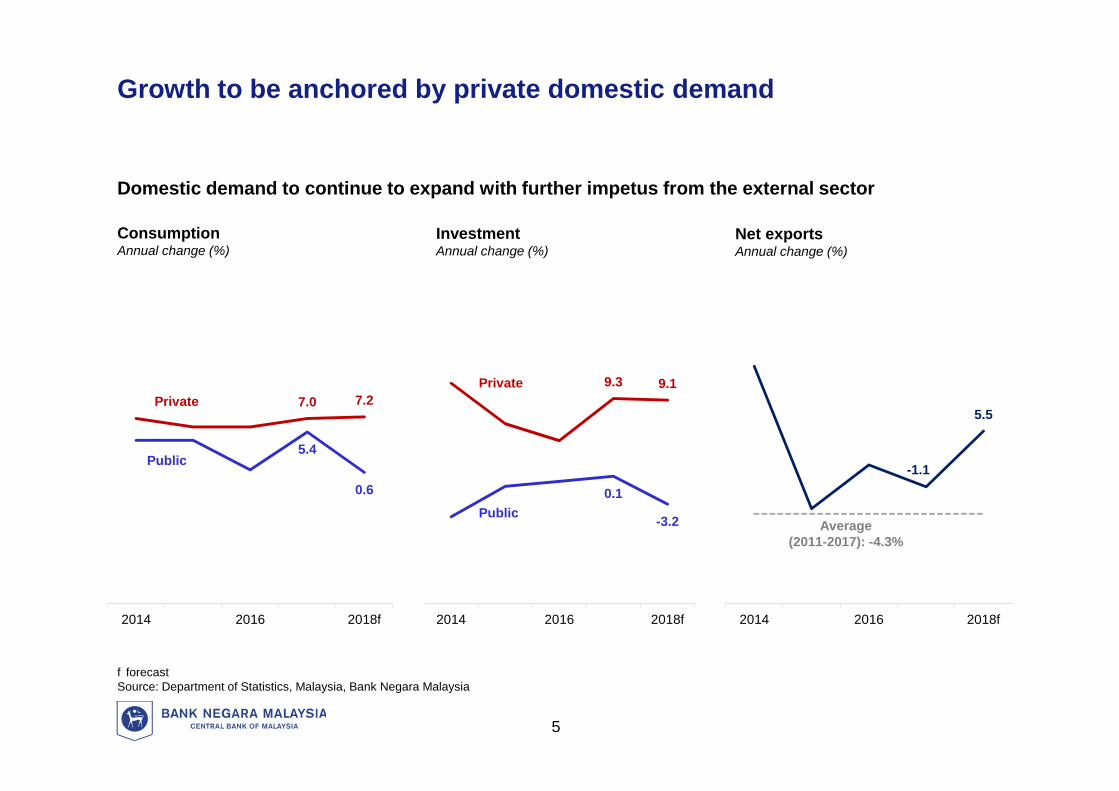
-1.1
5.5
2014 2016 2018f
9.3 9.1
0.1
-3.2
2014 2016 2018f
7.0 7.2
5.4
0.6
2014 2016 2018f
LGrowth to be anchored by private domestic demand
Domestic demand to continue to expand with further impetus from the external sector
ConsumptionAnnual change (%)
InvestmentAnnual change (%)
Net exportsAnnual change (%)
Private
Public
Private
Public
5
Average(2011-2017): -4.3%
f forecastSource: Department of Statistics, Malaysia, Bank Negara Malaysia
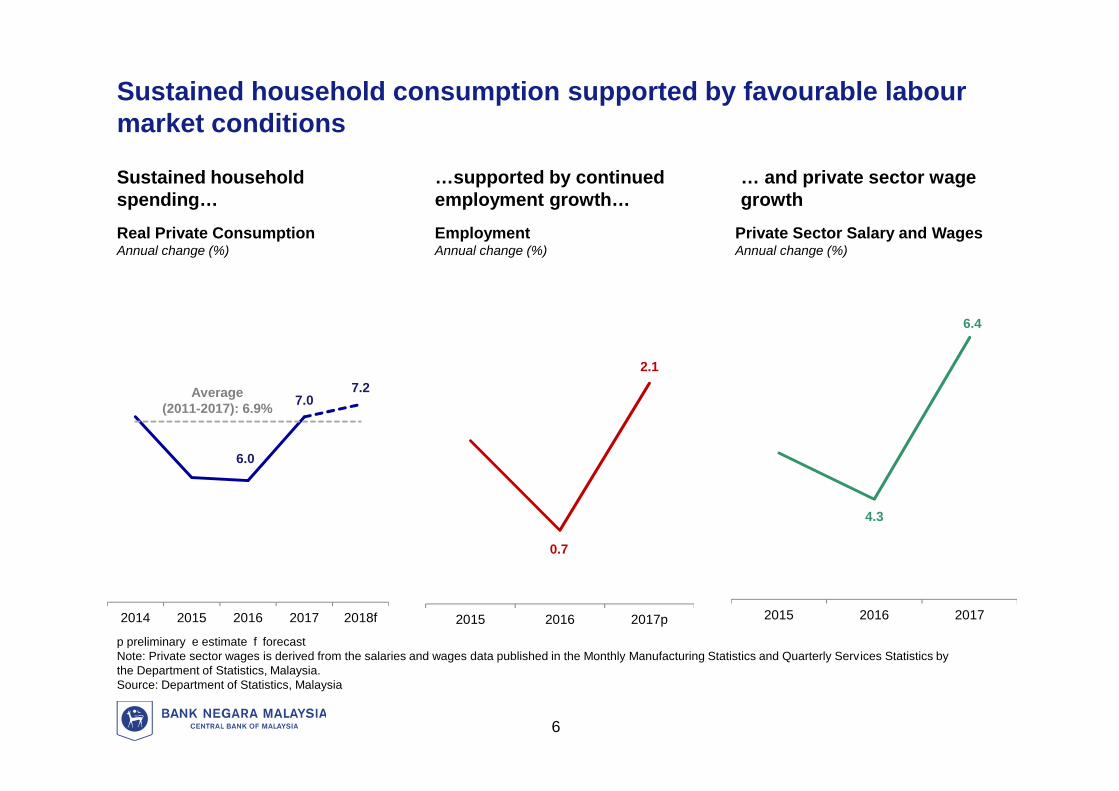
0.7
2.1
2015 2016 2017p
Sustained household consumption supported by favourable labourmarket conditions
Sustained householdspending…
6.0
7.07.2
2014 2015 2016 2017 2018f
… and private sector wagegrowth
…supported by continuedemployment growth…
4.3
6.4
2015 2016 2017
Real Private ConsumptionAnnual change (%)
EmploymentAnnual change (%)
Private Sector Salary and WagesAnnual change (%)
6
Average(2011-2017): 6.9%
p preliminary e estimate f forecastNote: Private sector wages is derived from the salaries and wages data published in the Monthly Manufacturing Statistics and Quarterly Services Statistics bythe Department of Statistics, Malaysia.Source: Department of Statistics, Malaysia
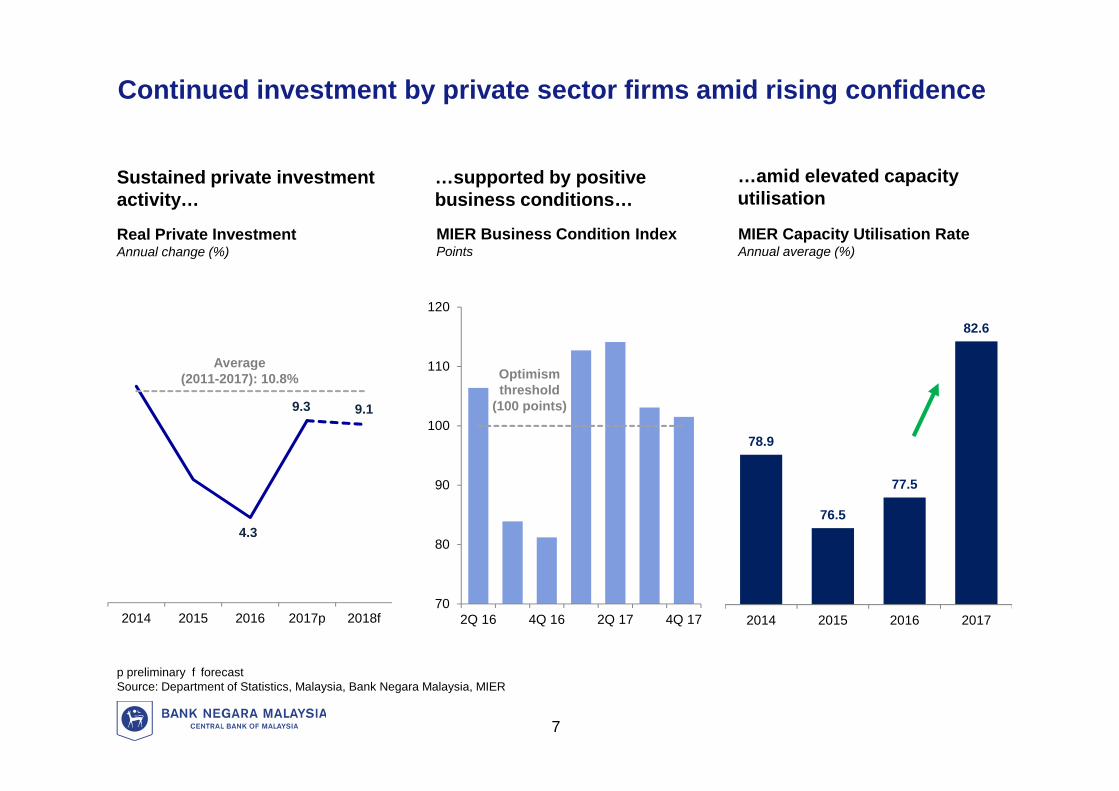
MIER Business Condition IndexPoints
4.3
9.3 9.1
2014 2015 2016 2017p 2018f
13
70
80
90
100
110
120
2Q 16 4Q 16 2Q 17 4Q 17
Optimismthreshold
(100 points)
Continued investment by private sector firms amid rising confidence
Sustained private investmentactivity…
…supported by positivebusiness conditions…
…amid elevated capacityutilisation
Real Private InvestmentAnnual change (%)
7
Average(2011-2017): 10.8%
p preliminary f forecastSource: Department of Statistics, Malaysia, Bank Negara Malaysia, MIER
78.9
76.5
77.5
82.6
2014 2015 2016 2017
MIER Capacity Utilisation RateAnnual average (%)
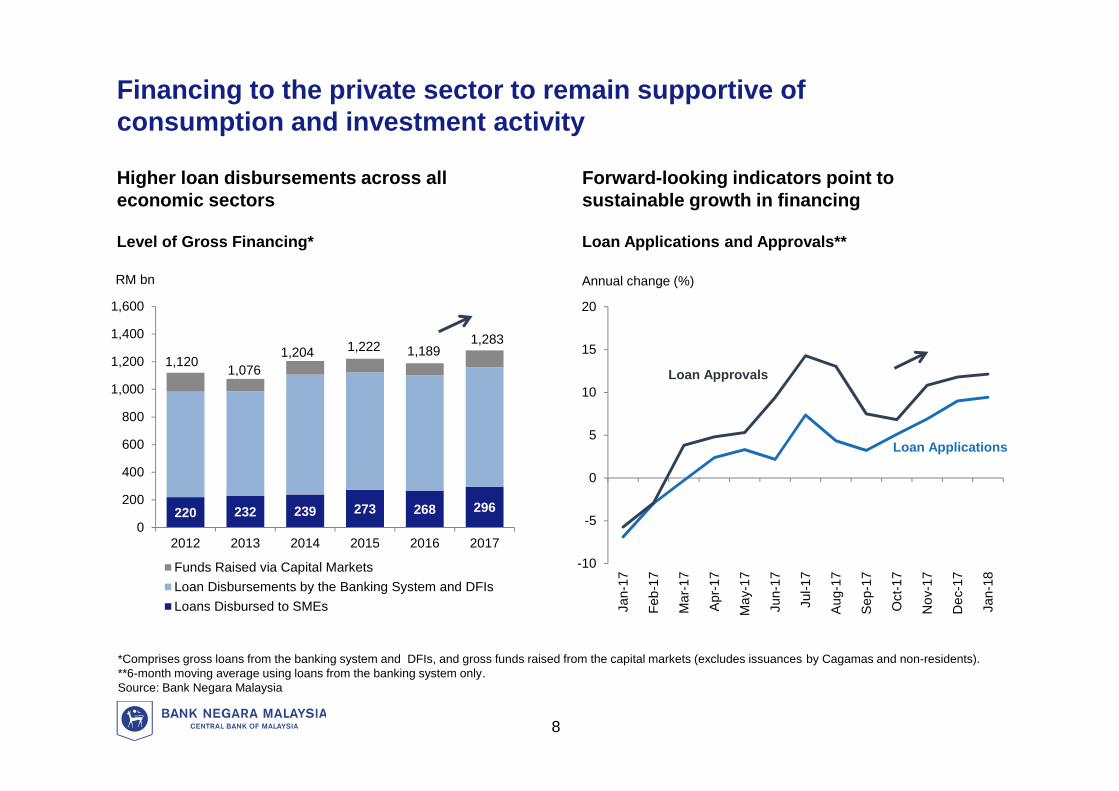
Financing to the private sector to remain supportive ofconsumption and investment activity
Loan Applications and Approvals**
*Comprises gross loans from the banking system and DFIs, and gross funds raised from the capital markets (excludes issuances by Cagamas and non-residents).**6-month moving average using loans from the banking system only.Source: Bank Negara Malaysia
8
220 232 239 273 268 296
1,120 1,0761,204 1,222 1,189
1,283
0
200
400
600
800
1,000
1,200
1,400
1,600
2012 2013 2014 2015 2016 2017
Funds Raised via Capital MarketsLoan Disbursements by the Banking System and DFIsLoans Disbursed to SMEs
RM bn
Level of Gross Financing*
-10
-5
0
5
10
15
20
Jan-
17
Feb-
17
Mar
-17
Apr
-17
May
-17
Jun-
17
Jul-1
7
Aug
-17
Sep
-17
Oct
-17
Nov
-17
Dec
-17
Jan-
18
Annual change (%)
Loan Approvals
Loan Applications
Higher loan disbursements across alleconomic sectors
Forward-looking indicators point tosustainable growth in financing
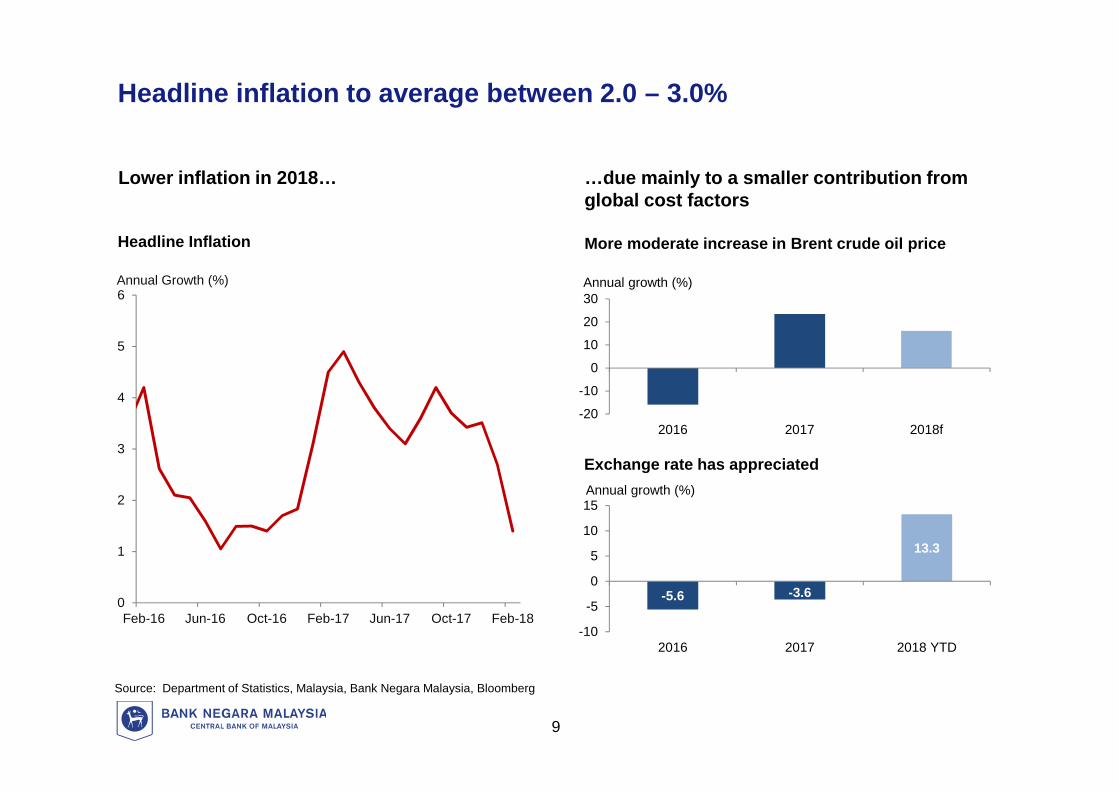
Lower inflation in 2018…
0
1
2
3
4
5
6
Feb-16 Jun-16 Oct-16 Feb-17 Jun-17 Oct-17 Feb-18
Annual Growth (%)
Source: Department of Statistics, Malaysia, Bank Negara Malaysia, Bloomberg
23
Headline inflation to average between 2.0 – 3.0%
-20
-10
0
10
20
30
2016 2017 2018f
Annual growth (%)
-5.6 -3.6
13.3
-10
-5
0
5
10
15
2016 2017 2018 YTD
Annual growth (%)
…due mainly to a smaller contribution fromglobal cost factors
More moderate increase in Brent crude oil price
Exchange rate has appreciated
9
Headline Inflation
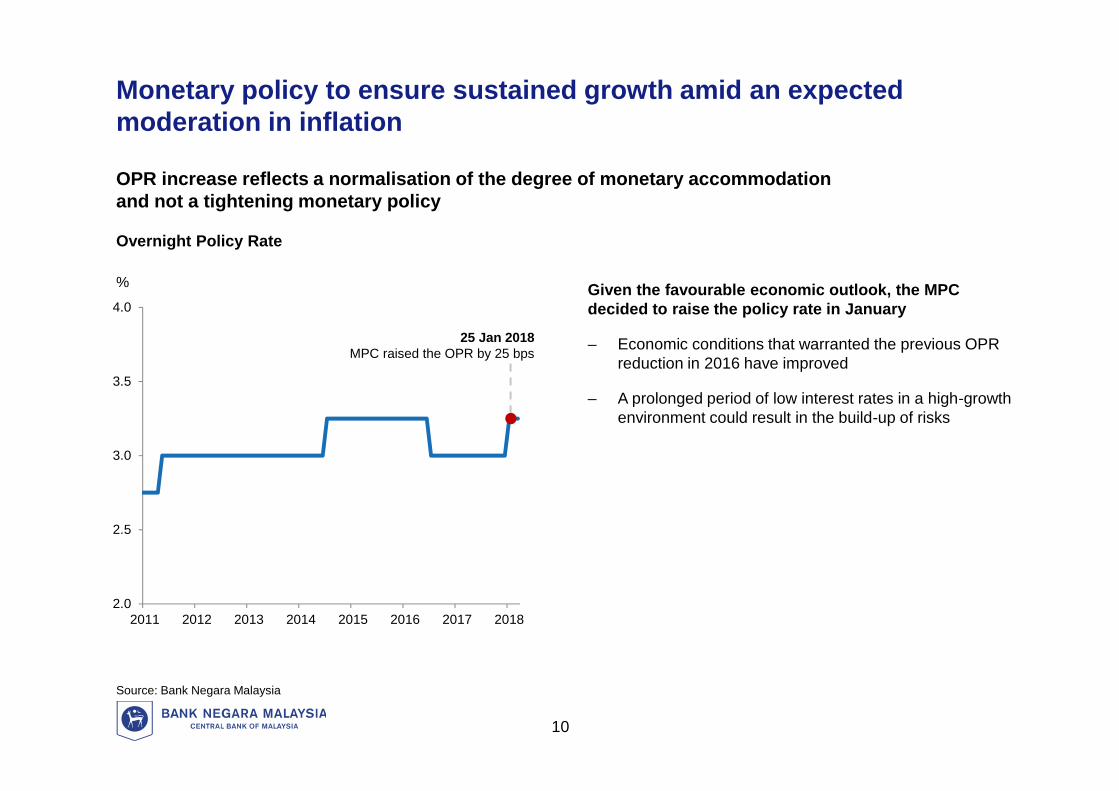
Monetary policy to ensure sustained growth amid an expectedmoderation in inflation
Given the favourable economic outlook, the MPCdecided to raise the policy rate in January
‒ Economic conditions that warranted the previous OPRreduction in 2016 have improved
‒ A prolonged period of low interest rates in a high-growthenvironment could result in the build-up of risks
OPR increase reflects a normalisation of the degree of monetary accommodationand not a tightening monetary policy
Source: Bank Negara Malaysia
%
Overnight Policy Rate
2.0
2.5
3.0
3.5
4.0
2011 2012 2013 2014 2015 2016 2017 2018
25 Jan 2018MPC raised the OPR by 25 bps
10
3.8
3.9
4.0
4.1
4.2
4.3
4.4
4.5
Jan-17 Apr-17 Jul-17 Oct-17 Jan-1899
101
103
105
107
109
111
113
115
117
MYR/USD
Regional Average(RHS)
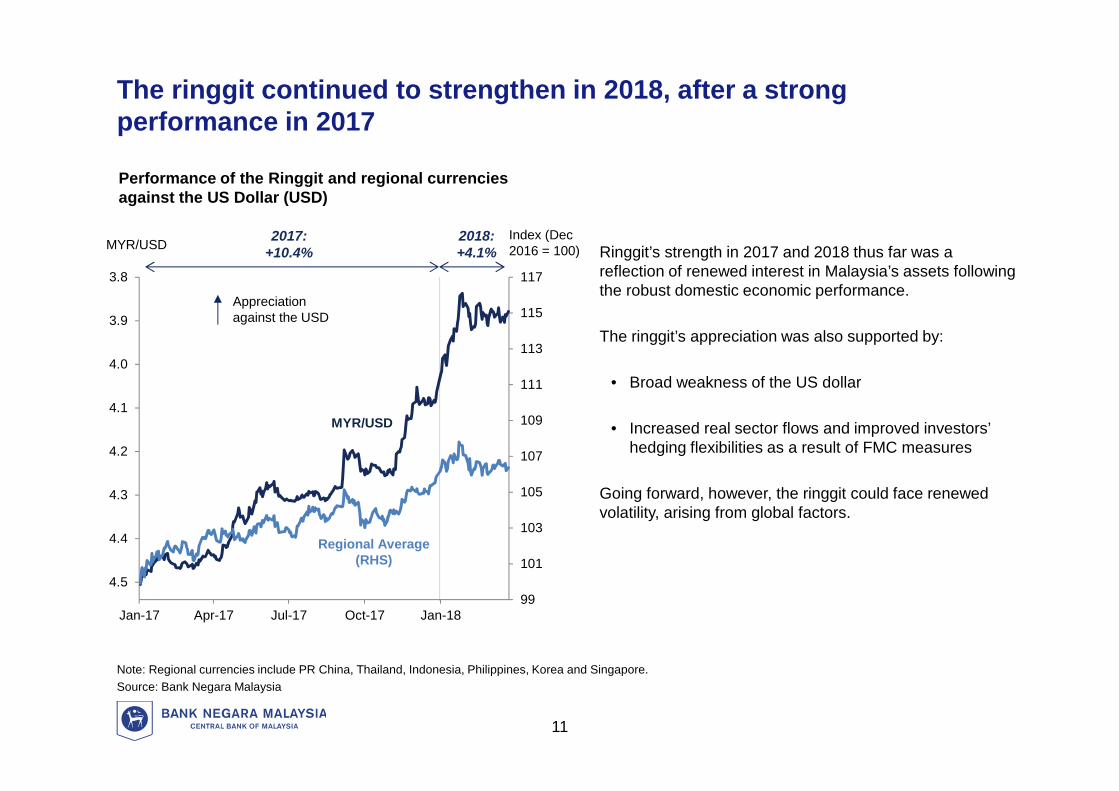
The ringgit continued to strengthen in 2018, after a strongperformance in 2017
Note: Regional currencies include PR China, Thailand, Indonesia, Philippines, Korea and Singapore.Source: Bank Negara Malaysia
MYR/USDIndex (Dec2016 = 100) Ringgit’s strength in 2017 and 2018 thus far was a
reflection of renewed interest in Malaysia’s assets followingthe robust domestic economic performance.
The ringgit’s appreciation was also supported by:
• Broad weakness of the US dollar
• Increased real sector flows and improved investors’hedging flexibilities as a result of FMC measures
Going forward, however, the ringgit could face renewedvolatility, arising from global factors.
Performance of the Ringgit and regional currenciesagainst the US Dollar (USD)
Appreciationagainst the USD
2018:+4.1%
2017:+10.4%
11
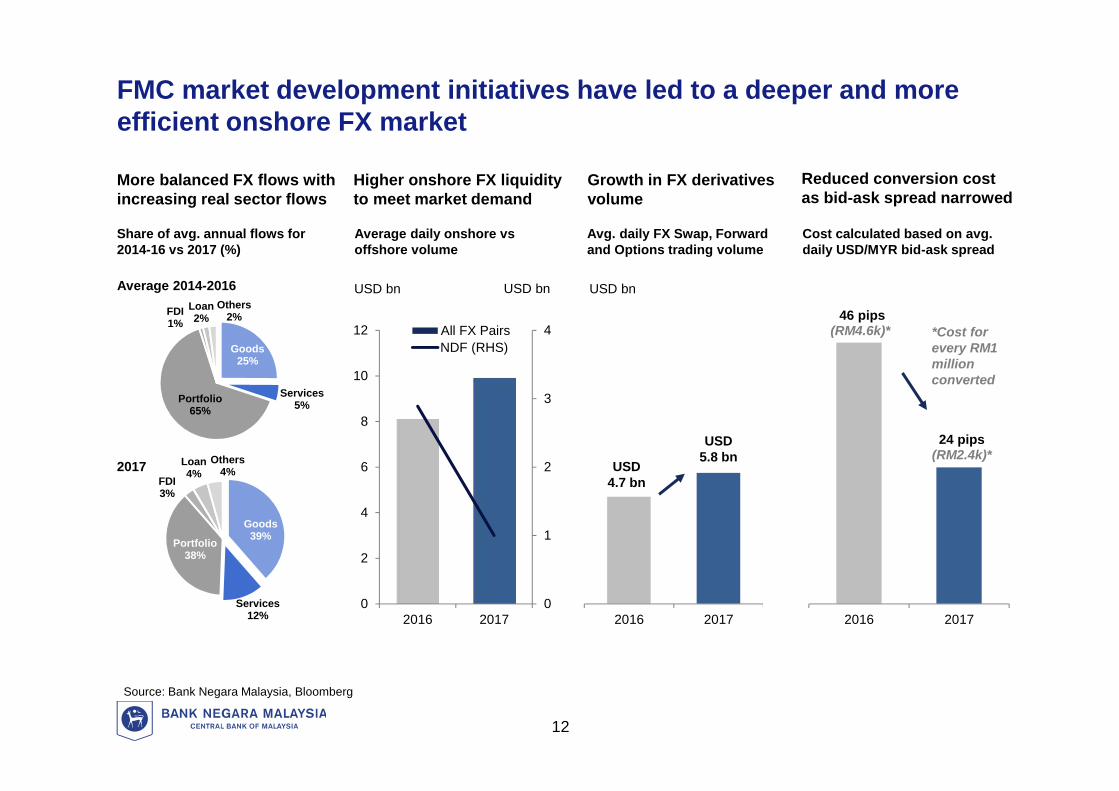
2016 2017
Average daily onshore vsoffshore volume
Avg. daily FX Swap, Forwardand Options trading volume
USD bn USD bn USD bn
More balanced FX flows withincreasing real sector flows
Higher onshore FX liquidityto meet market demand
Growth in FX derivativesvolume
Share of avg. annual flows for2014-16 vs 2017 (%)
Source: Bank Negara Malaysia, Bloomberg
FMC market development initiatives have led to a deeper and moreefficient onshore FX market
Reduced conversion costas bid-ask spread narrowed
Cost calculated based on avg.daily USD/MYR bid-ask spread
2017
Average 2014-2016
0
1
2
3
4
0
2
4
6
8
10
12
2016 2017
All FX PairsNDFGoods
25%
Services5%Portfolio
65%
FDI1%
Loan2%
Others2%
Goods39%
Services12%
Portfolio38%
FDI3%
Loan4%
Others4%
NDF (RHS)
46 pips(RM4.6k)*
24 pips(RM2.4k)*
2016 2017
*Cost forevery RM1millionconverted
12
USD4.7 bn
USD5.8 bn
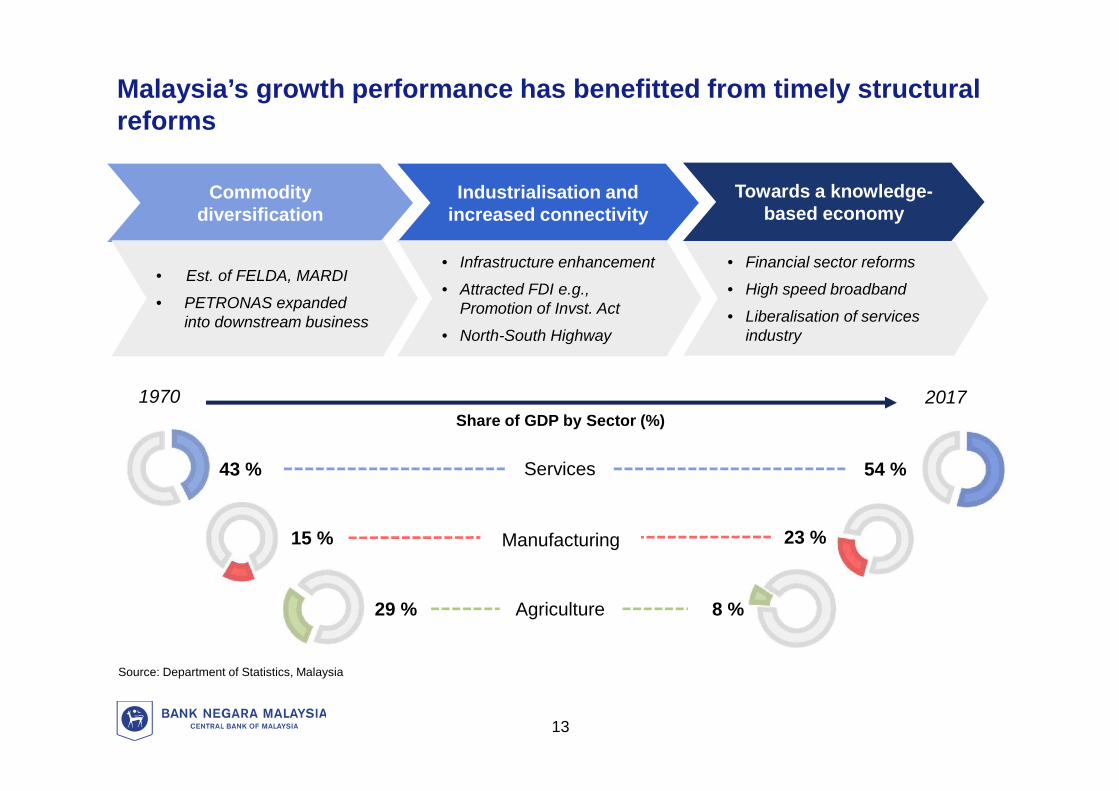
Malaysia’s growth performance has benefitted from timely structuralreforms
Commoditydiversification
Share of GDP by Sector (%)
Services43 % 54 %
Agriculture29 % 8 %
20171970
Manufacturing15 % 23 %
Source: Department of Statistics, Malaysia
• Est. of FELDA, MARDI
• PETRONAS expandedinto downstream business
Industrialisation andincreased connectivity
• Infrastructure enhancement
• Attracted FDI e.g.,Promotion of Invst. Act
• North-South Highway
Towards a knowledge-based economy
• Financial sector reforms
• High speed broadband
• Liberalisation of servicesindustry
13
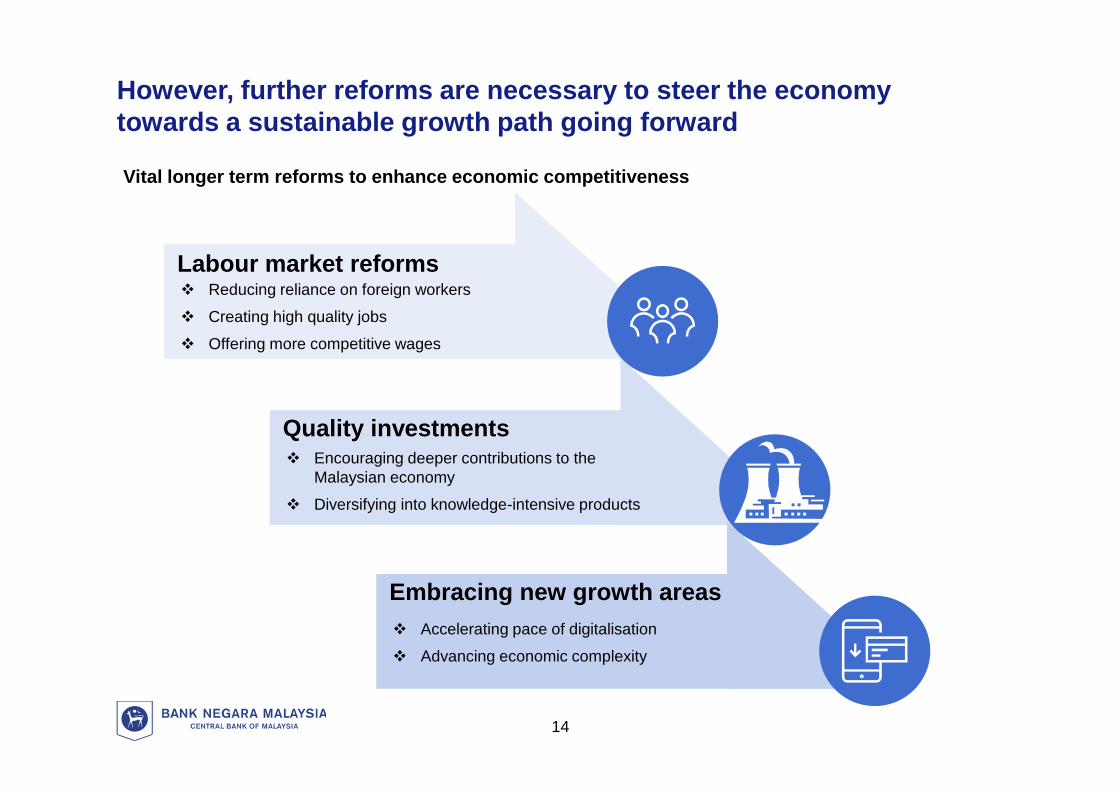
However, further reforms are necessary to steer the economytowards a sustainable growth path going forward
Vital longer term reforms to enhance economic competitiveness
Labour market reforms Reducing reliance on foreign workers
Creating high quality jobs
Offering more competitive wages
Quality investments Encouraging deeper contributions to the
Malaysian economy
Diversifying into knowledge-intensive products
Embracing new growth areas Accelerating pace of digitalisation
Advancing economic complexity
14
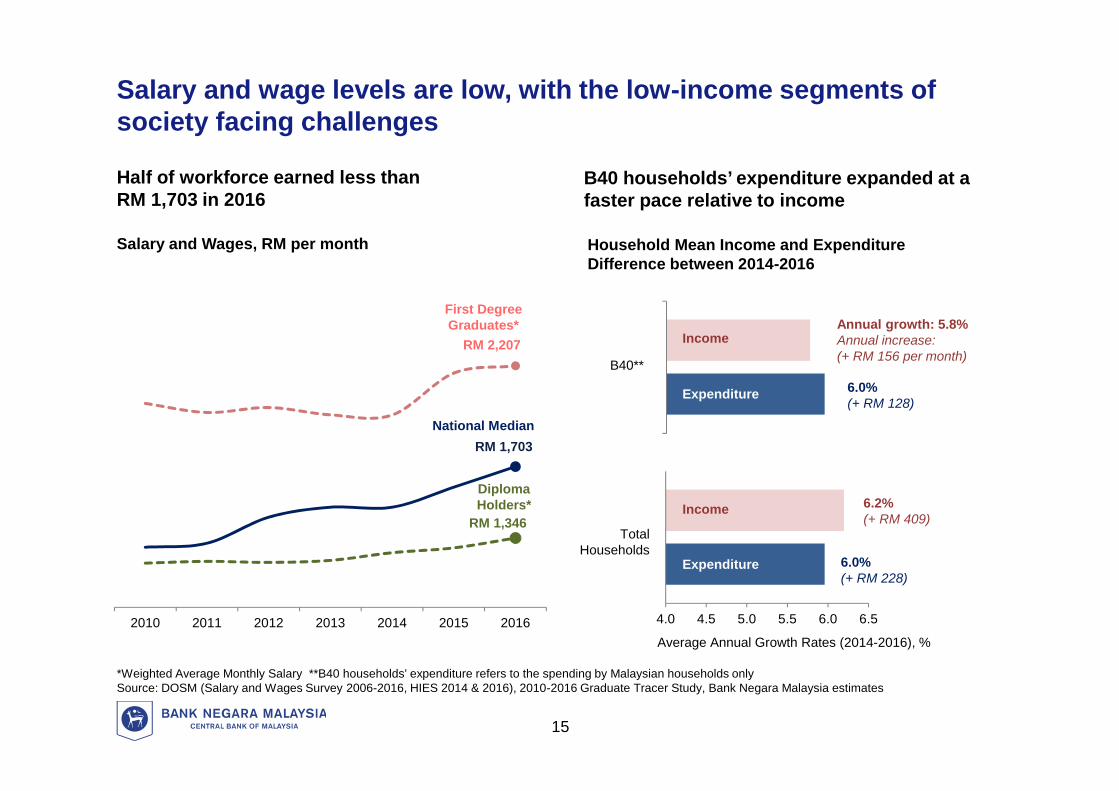
Salary and wage levels are low, with the low-income segments ofsociety facing challenges
Half of workforce earned less thanRM 1,703 in 2016
B40 households’ expenditure expanded at afaster pace relative to income
2010 2011 2012 2013 2014 2015 2016
RM 1,346
RM 1,703
RM 2,207
National Median
First DegreeGraduates*
DiplomaHolders*
15
Household Mean Income and ExpenditureDifference between 2014-2016
Salary and Wages, RM per month
Income
Expenditure
4.0 4.5 5.0 5.5 6.0 6.5
Income
Expenditure
Annual growth: 5.8%Annual increase:(+ RM 156 per month)
Average Annual Growth Rates (2014-2016), %
6.0%(+ RM 128)
6.2%(+ RM 409)
6.0%(+ RM 228)
B40**
TotalHouseholds
*Weighted Average Monthly Salary **B40 households’ expenditure refers to the spending by Malaysian households onlySource: DOSM (Salary and Wages Survey 2006-2016, HIES 2014 & 2016), 2010-2016 Graduate Tracer Study, Bank Negara Malaysia estimates
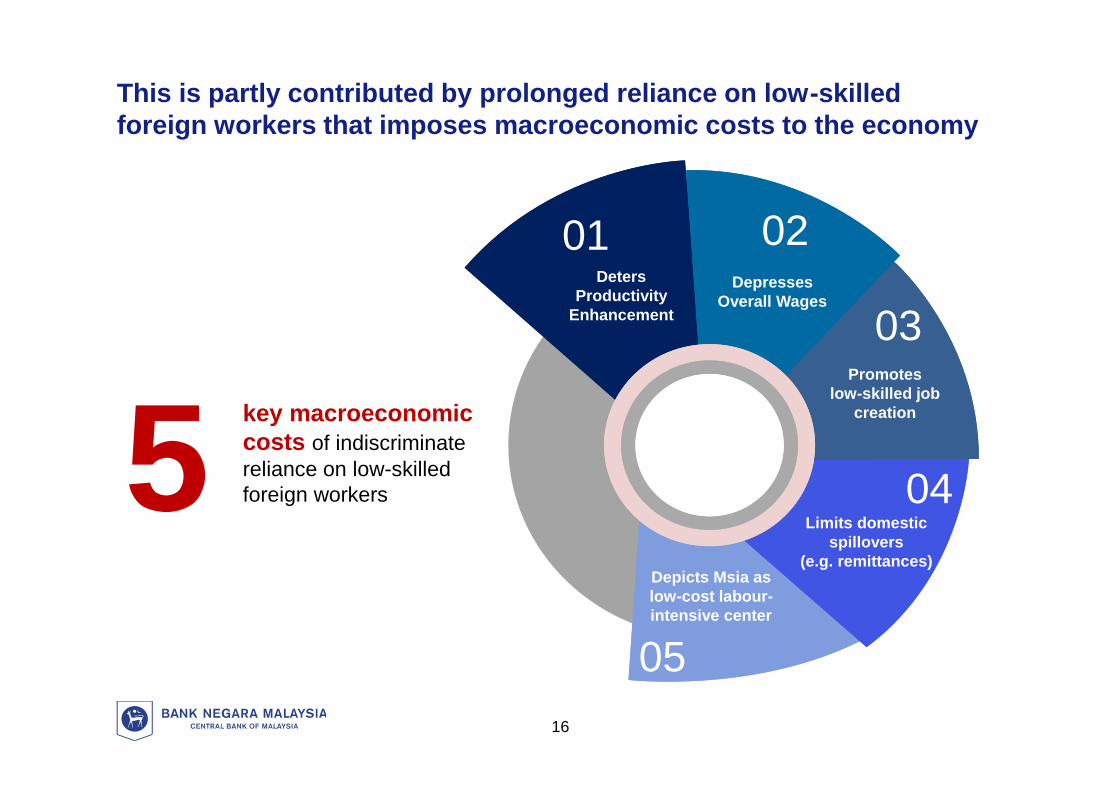
This is partly contributed by prolonged reliance on low-skilledforeign workers that imposes macroeconomic costs to the economy
DepressesOverall Wages
Limits domesticspillovers
(e.g. remittances)
03
04
05
0201Deters
ProductivityEnhancement
key macroeconomiccosts of indiscriminatereliance on low-skilledforeign workers5
16
Depicts Msia aslow-cost labour-intensive center
Promoteslow-skilled job
creation
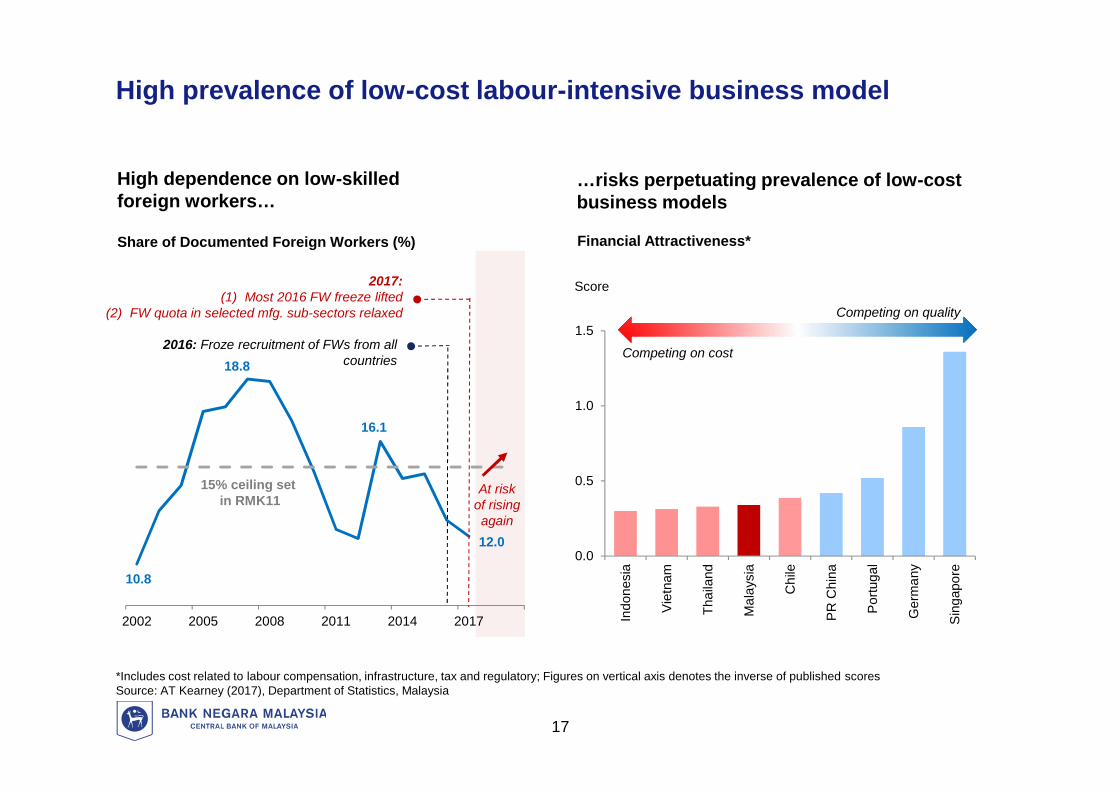
High prevalence of low-cost labour-intensive business model
*Includes cost related to labour compensation, infrastructure, tax and regulatory; Figures on vertical axis denotes the inverse of published scoresSource: AT Kearney (2017), Department of Statistics, Malaysia
Share of Documented Foreign Workers (%)
High dependence on low-skilledforeign workers…
17
10.8
18.8
16.1
12.0
2002 2005 2008 2011 2014 2017
15% ceiling setin RMK11
2016: Froze recruitment of FWs from allcountries
2017:(1) Most 2016 FW freeze lifted
(2) FW quota in selected mfg. sub-sectors relaxed
At riskof risingagain
Indo
nesi
a
Vie
tnam
Thai
land
Mal
aysi
a
Chi
le
PR
Chi
na
Por
tuga
l
Ger
man
y
Sin
gapo
re
0.0
0.5
1.0
1.5
Competing on cost
Competing on quality
Score
Financial Attractiveness*
…risks perpetuating prevalence of low-costbusiness models
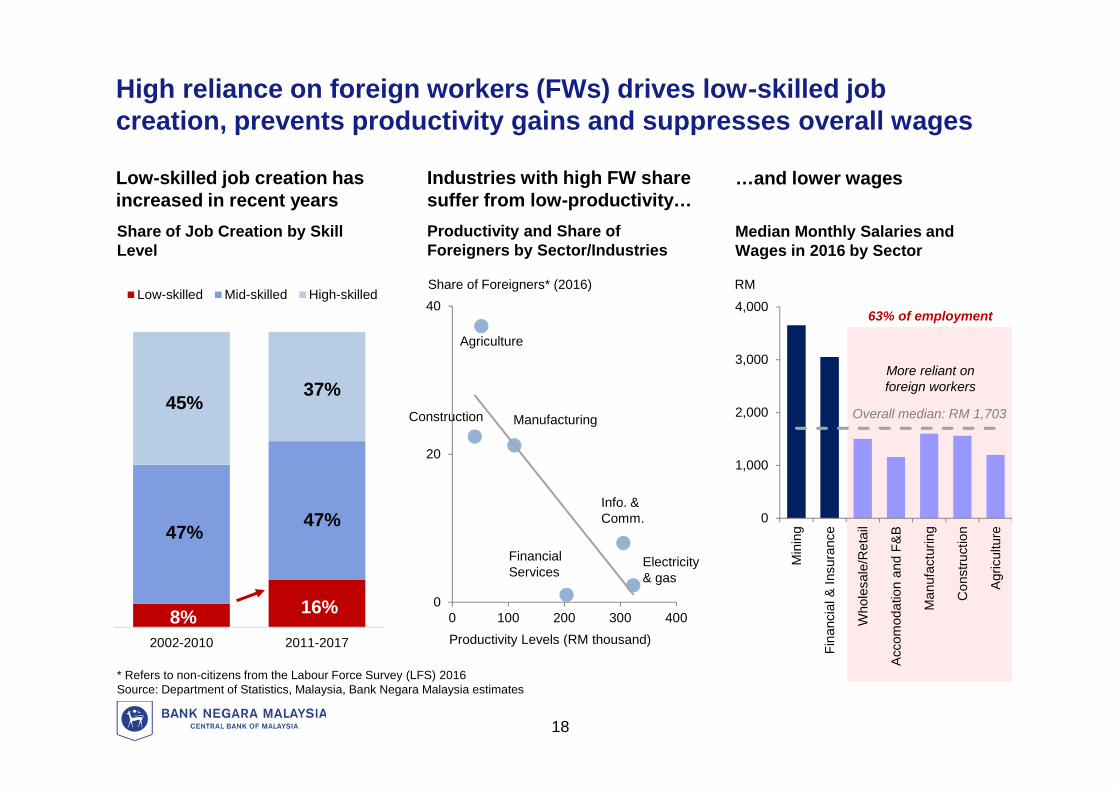
High reliance on foreign workers (FWs) drives low-skilled jobcreation, prevents productivity gains and suppresses overall wages
* Refers to non-citizens from the Labour Force Survey (LFS) 2016Source: Department of Statistics, Malaysia, Bank Negara Malaysia estimates
Productivity and Share ofForeigners by Sector/Industries
Median Monthly Salaries andWages in 2016 by Sector
Low-skilled job creation hasincreased in recent years
Industries with high FW sharesuffer from low-productivity…
…and lower wages
Share of Job Creation by SkillLevel
Min
ing
Fina
ncia
l & In
sura
nce
Who
lesa
le/R
etai
l
Acc
omod
atio
n an
d F&
B
Man
ufac
turin
g
Con
stru
ctio
n
Agr
icul
ture
0
1,000
2,000
3,000
4,00063% of employment
More reliant onforeign workers
Overall median: RM 1,703
0
20
40
0 100 200 300 400
Agriculture
Manufacturing
Info. &Comm.
FinancialServices
Share of Foreigners* (2016)
Productivity Levels (RM thousand)
Electricity& gas
18
Construction
RM
2002-2010 2011-2017
Low-skilled Mid-skilled High-skilled
45%37%
47% 47%
8% 16%
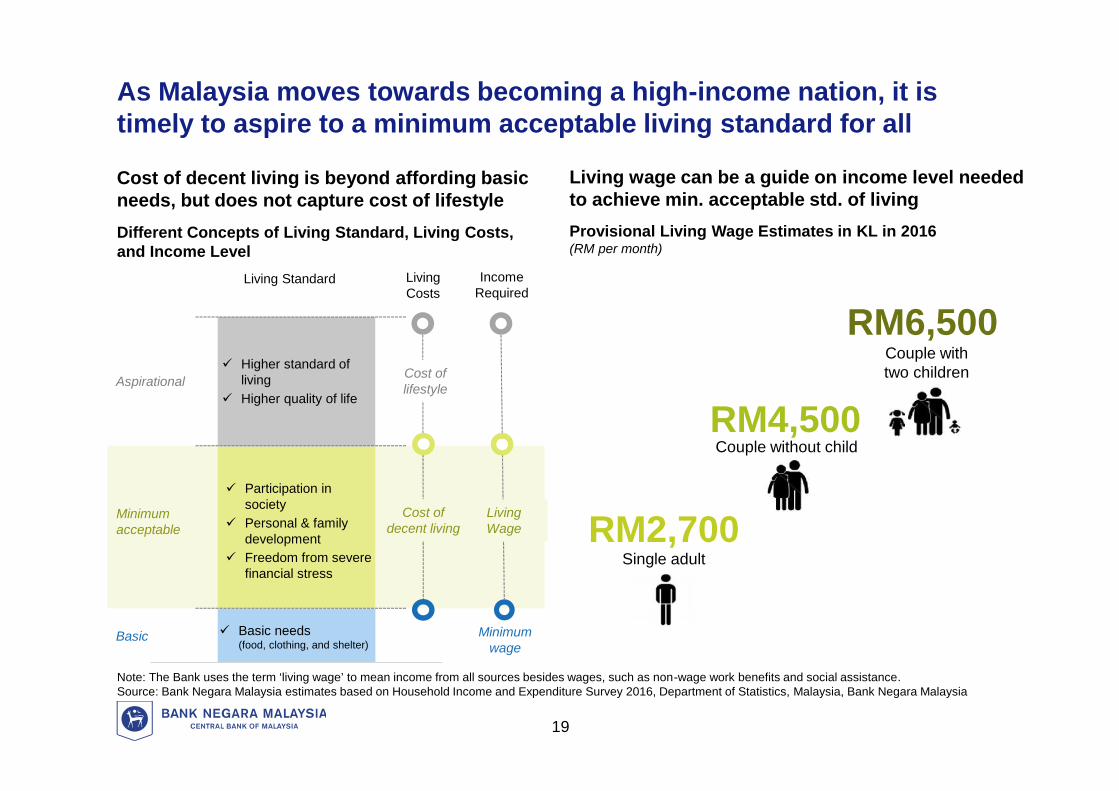
As Malaysia moves towards becoming a high-income nation, it istimely to aspire to a minimum acceptable living standard for all
Cost of decent living is beyond affording basicneeds, but does not capture cost of lifestyle
Note: The Bank uses the term ‘living wage’ to mean income from all sources besides wages, such as non-wage work benefits and social assistance.Source: Bank Negara Malaysia estimates based on Household Income and Expenditure Survey 2016, Department of Statistics, Malaysia, Bank Negara Malaysia
Living wage can be a guide on income level neededto achieve min. acceptable std. of living
Different Concepts of Living Standard, Living Costs,and Income Level
Provisional Living Wage Estimates in KL in 2016(RM per month)
Minimumacceptable
Basic
Aspirational Higher standard of
living Higher quality of life
Participation insociety
Personal & familydevelopment
Freedom from severefinancial stress
Basic needs(food, clothing, and shelter)
Living Standard IncomeRequired
LivingWage
Minimumwage
LivingCosts
Cost ofdecent living
Cost oflifestyle
19
Single adultRM2,700
Couple without childRM4,500
Couple withtwo children
RM6,500
0
2
4
6
8
10
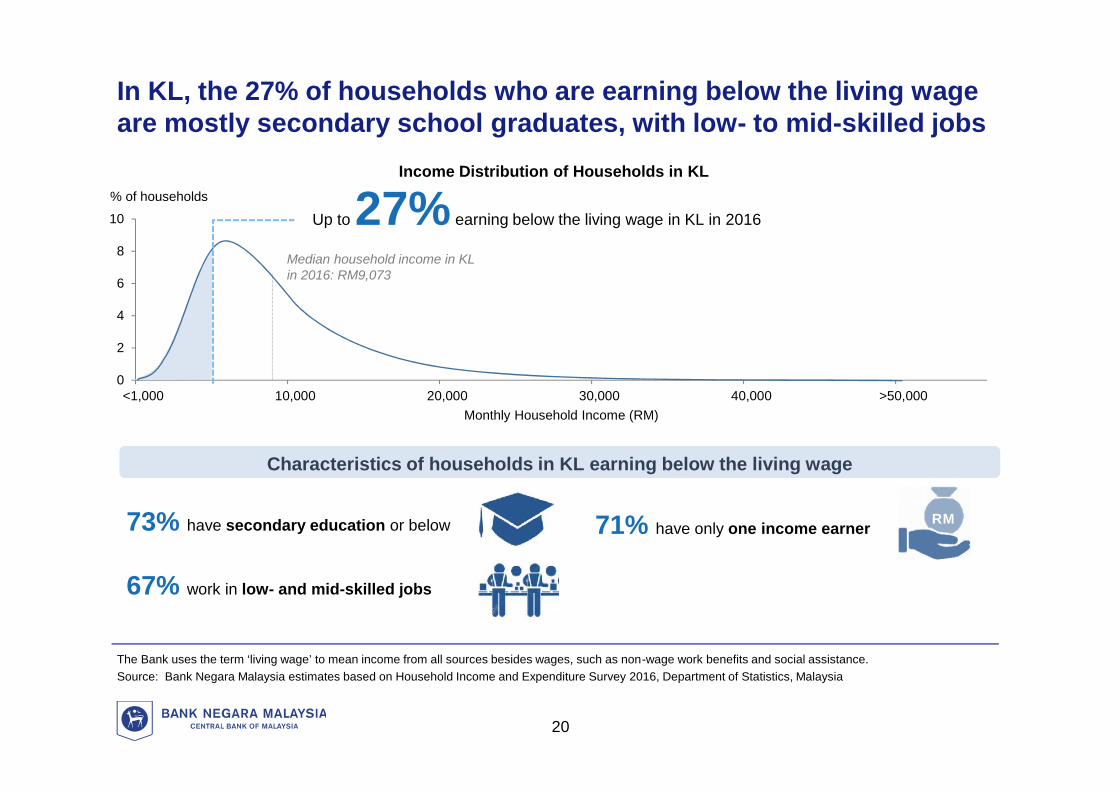
<1,000 10,000 20,000 30,000 40,000 >50,000Monthly Household Income (RM)
Median household income in KLin 2016: RM9,073
Up to 27% earning below the living wage in KL in 2016
73% have secondary education or below
67% work in low- and mid-skilled jobs
Income Distribution of Households in KL
71% have only one income earner RM
% of households
In KL, the 27% of households who are earning below the living wageare mostly secondary school graduates, with low- to mid-skilled jobs
The Bank uses the term ‘living wage’ to mean income from all sources besides wages, such as non-wage work benefits and social assistance.Source: Bank Negara Malaysia estimates based on Household Income and Expenditure Survey 2016, Department of Statistics, Malaysia
20
Characteristics of households in KL earning below the living wage
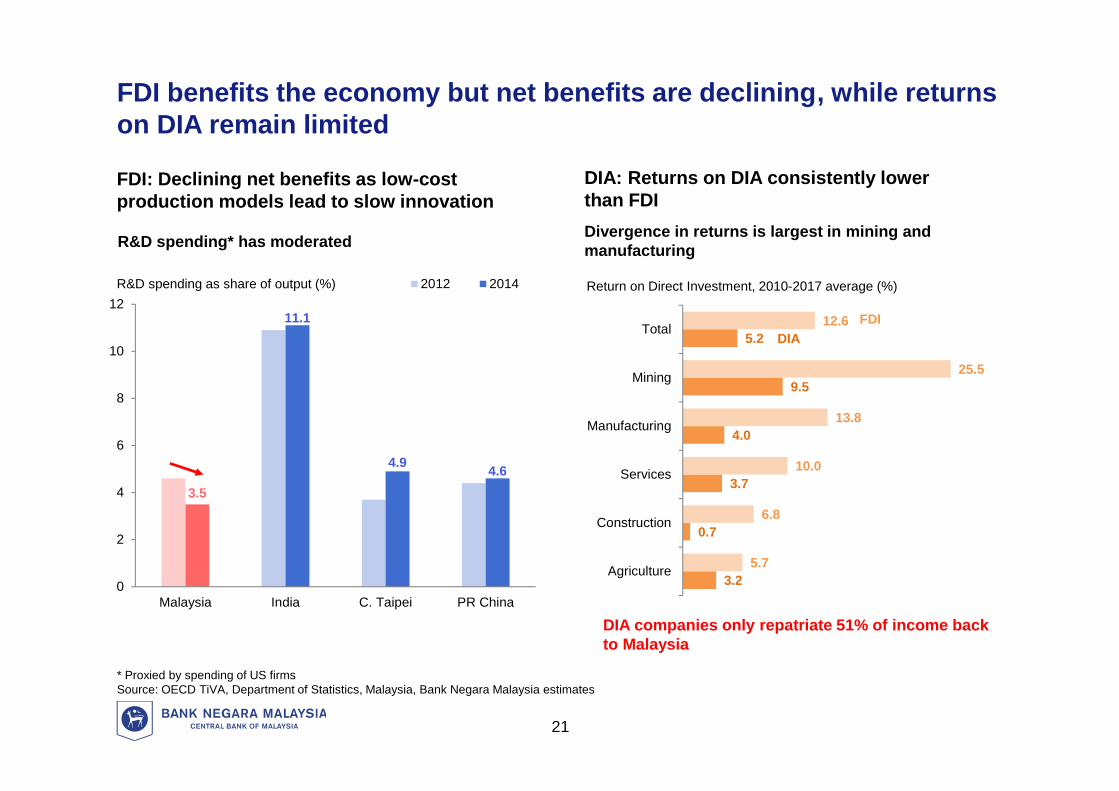
3.5
11.1
4.9 4.6
0
2
4
6
8
10
12
Malaysia India C. Taipei PR China
2012 2014R&D spending as share of output (%)
R&D spending* has moderated
FDI benefits the economy but net benefits are declining, while returnson DIA remain limited
FDI: Declining net benefits as low-costproduction models lead to slow innovation
* Proxied by spending of US firmsSource: OECD TiVA, Department of Statistics, Malaysia, Bank Negara Malaysia estimates
DIA: Returns on DIA consistently lowerthan FDI
21
3.2
0.7
3.7
4.0
9.5
5.2
5.7
6.8
10.0
13.8
25.5
12.6
Agriculture
Construction
Services
Manufacturing
Mining
TotalDIA
FDI
Return on Direct Investment, 2010-2017 average (%)
Divergence in returns is largest in mining andmanufacturing
DIA companies only repatriate 51% of income backto Malaysia
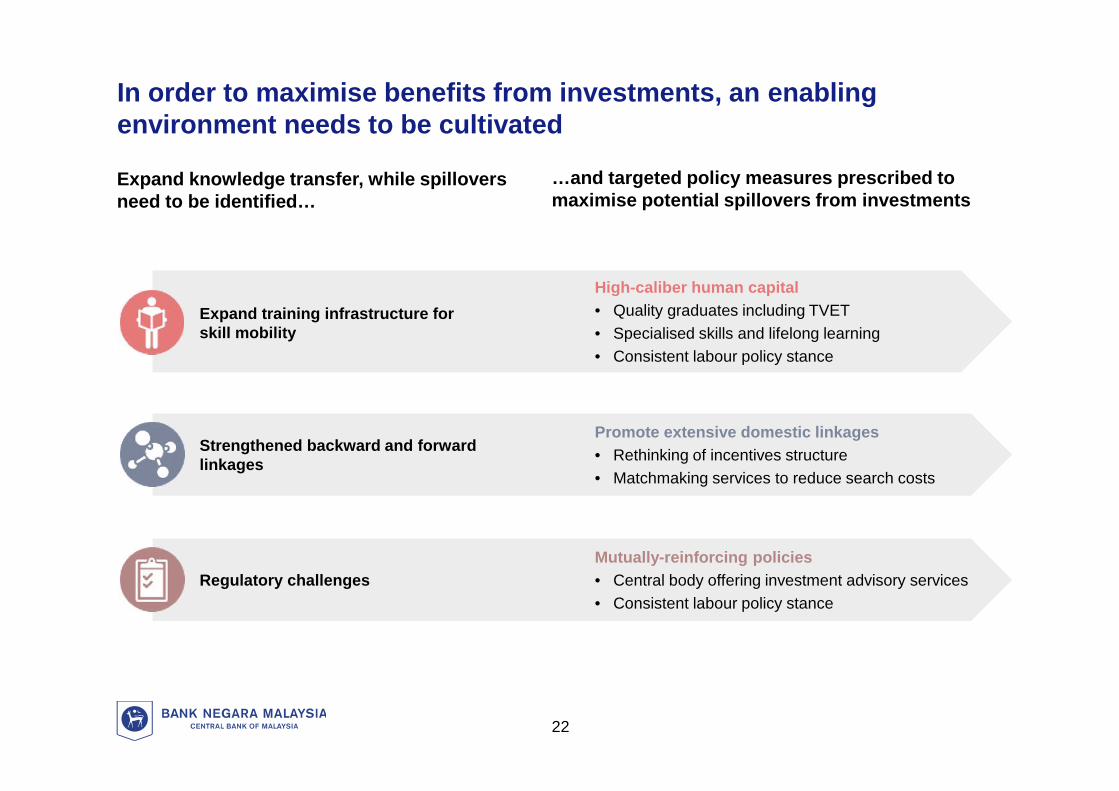
Mutually-reinforcing policies• Central body offering investment advisory services• Consistent labour policy stance
Promote extensive domestic linkages• Rethinking of incentives structure• Matchmaking services to reduce search costs
High-caliber human capital• Quality graduates including TVET• Specialised skills and lifelong learning• Consistent labour policy stance
In order to maximise benefits from investments, an enablingenvironment needs to be cultivated
Expand knowledge transfer, while spilloversneed to be identified…
…and targeted policy measures prescribed tomaximise potential spillovers from investments
Expand training infrastructure forskill mobility
Strengthened backward and forwardlinkages
Regulatory challenges
22
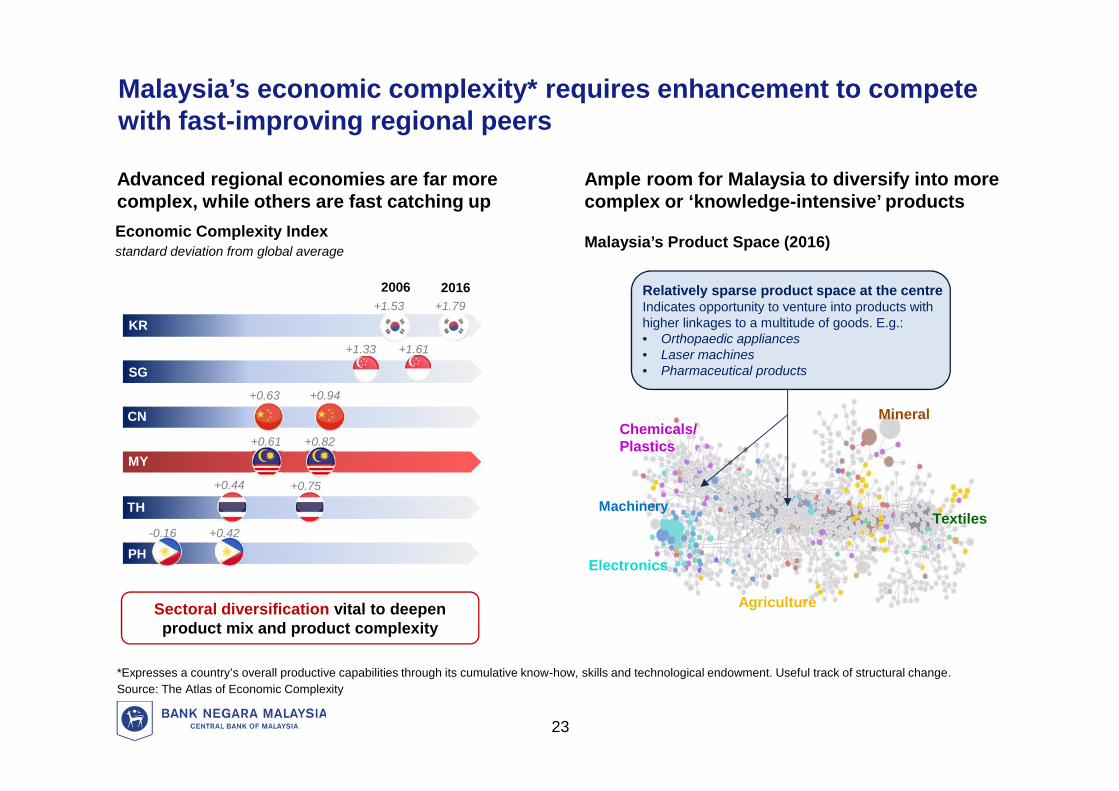
Malaysia’s economic complexity* requires enhancement to competewith fast-improving regional peers
Updated
Economic Complexity Indexstandard deviation from global average
Advanced regional economies are far morecomplex, while others are fast catching up
Sectoral diversification vital to deepenproduct mix and product complexity
Malaysia’s Product Space (2016)
Ample room for Malaysia to diversify into morecomplex or ‘knowledge-intensive’ products
Relatively sparse product space at the centreIndicates opportunity to venture into products withhigher linkages to a multitude of goods. E.g.:• Orthopaedic appliances• Laser machines• Pharmaceutical products
Machinery
Electronics
Chemicals/Plastics
Textiles
Mineral
Agriculture
*Expresses a country’s overall productive capabilities through its cumulative know-how, skills and technological endowment. Useful track of structural change.Source: The Atlas of Economic Complexity
+1.79+1.53
+0.61 +0.82
+0.94+0.63
+0.75+0.44
+0.42-0.16
+1.61+1.33
KR
SG
CN
MY
TH
2006 2016
23
PH
KR
SG
JP
USEE
0.3
0.4
0.5
0.6
0.7
0.8
0.9
1.0
0.3 0.5 0.7 0.9 1.1Digital Adoption Index Score
Adopter
Laggard
Malaysia
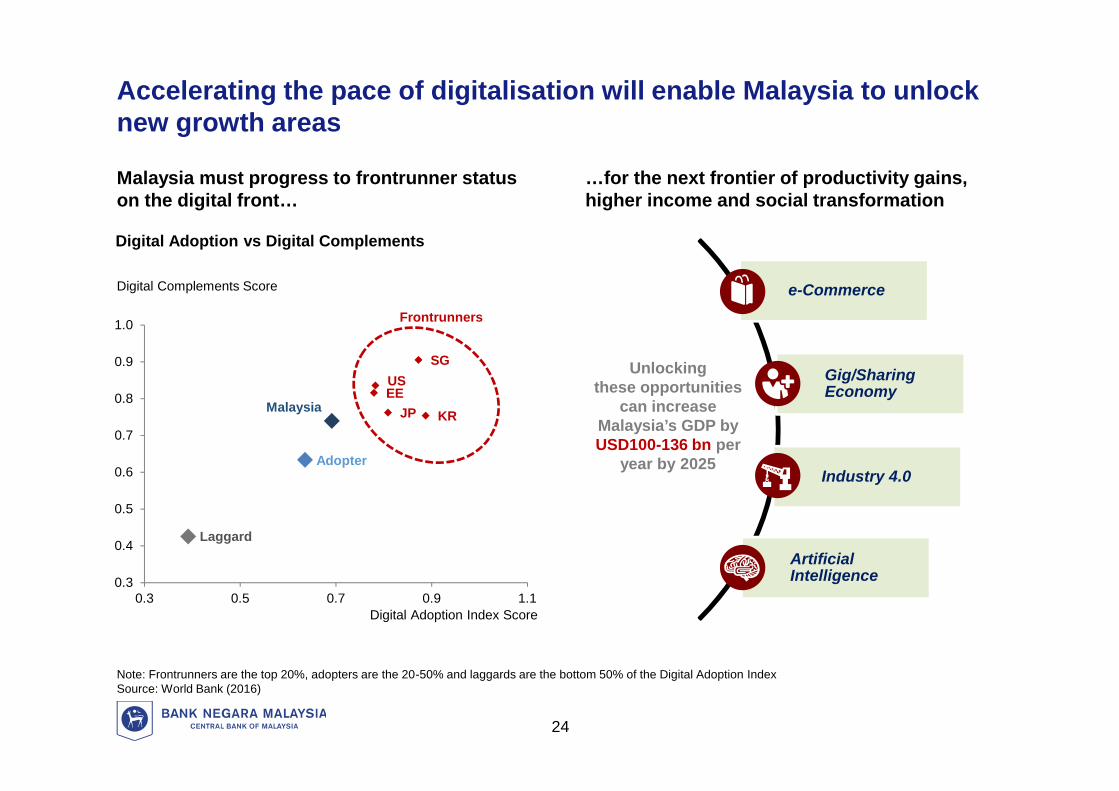
Accelerating the pace of digitalisation will enable Malaysia to unlocknew growth areas
Malaysia must progress to frontrunner statuson the digital front…
…for the next frontier of productivity gains,higher income and social transformation
Digital Complements Score
Frontrunners
e-Commerce
Gig/SharingEconomy
Industry 4.0
ArtificialIntelligence
Unlockingthese opportunities
can increaseMalaysia’s GDP byUSD100-136 bn per
year by 2025
Digital Adoption vs Digital Complements
Note: Frontrunners are the top 20%, adopters are the 20-50% and laggards are the bottom 50% of the Digital Adoption IndexSource: World Bank (2016)
24
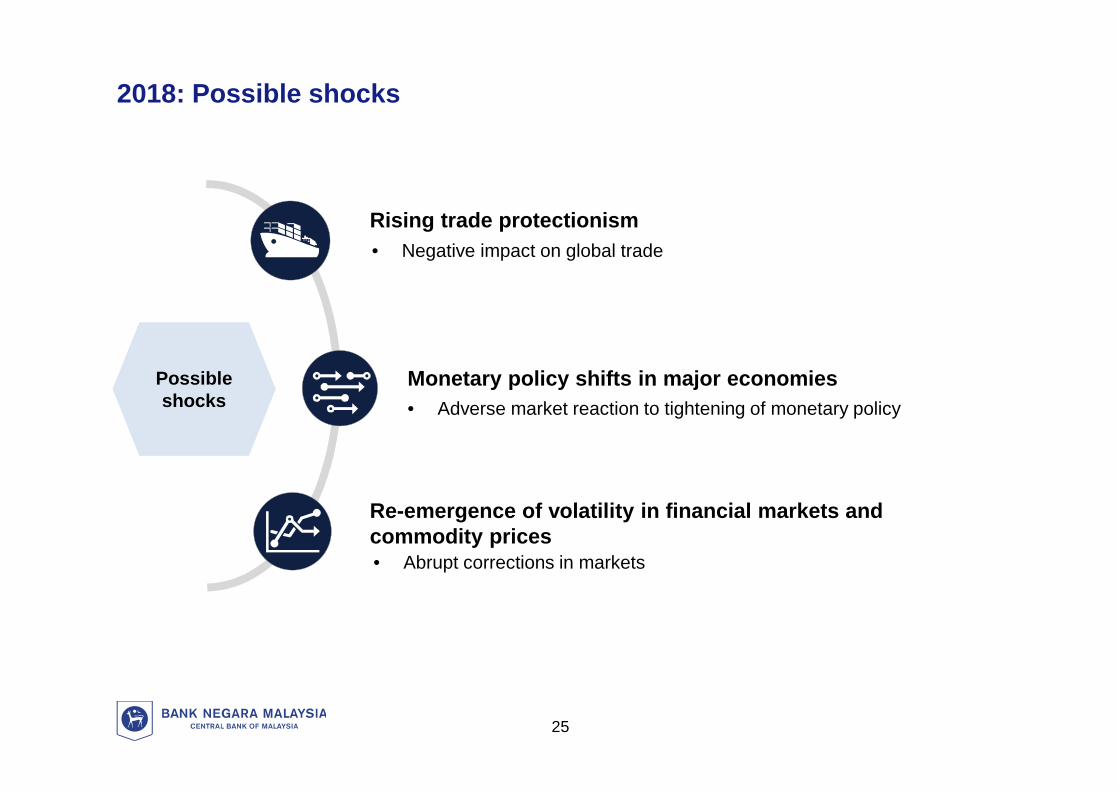
2018: Possible shocks
Rising trade protectionism
Monetary policy shifts in major economies
Re-emergence of volatility in financial markets andcommodity prices
• Adverse market reaction to tightening of monetary policy
• Abrupt corrections in markets
Possibleshocks
25
• Negative impact on global trade
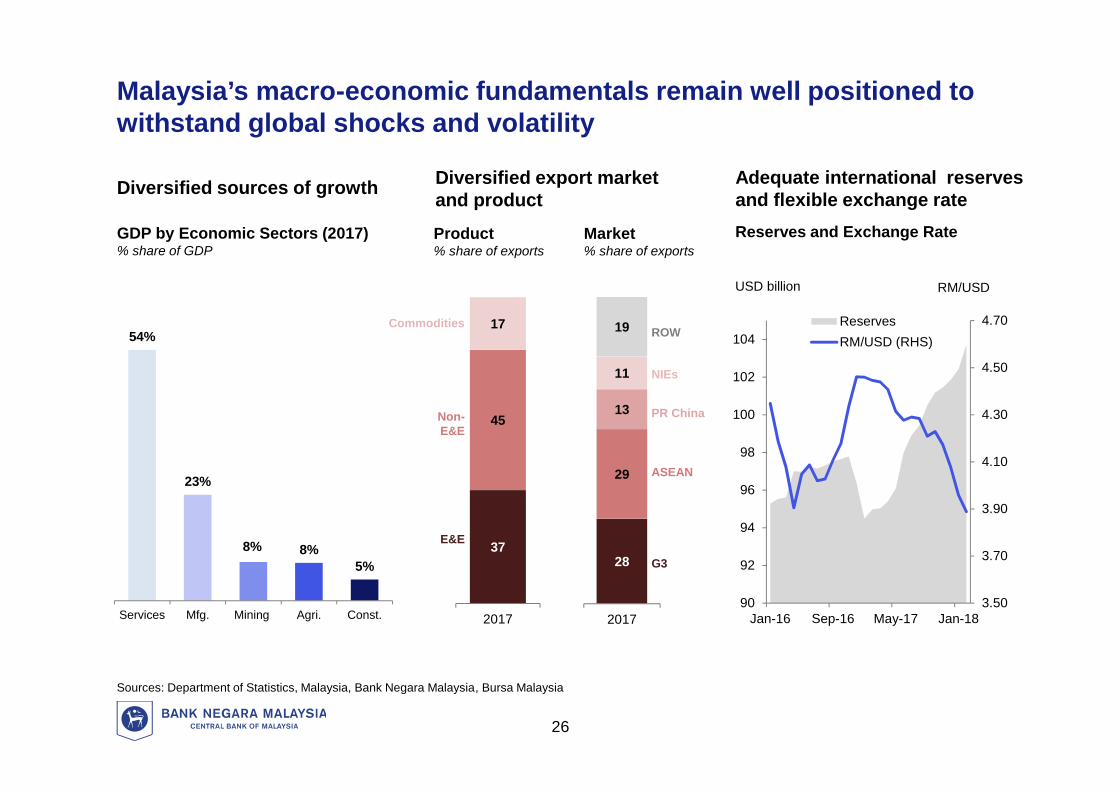
GDP by Economic Sectors (2017)% share of GDP
Reserves and Exchange Rate
Sources: Department of Statistics, Malaysia, Bank Negara Malaysia, Bursa Malaysia
Diversified sources of growth Diversified export marketand product
Market% share of exports
Product% share of exports
Adequate international reservesand flexible exchange rate
26
Malaysia’s macro-economic fundamentals remain well positioned towithstand global shocks and volatility
54%
23%
8% 8%5%
Services Mfg. Mining Agri. Const.
37
45
17
2017
28
29
13
11
19
2017
E&E
Non-E&E
Commodities
G3
ASEAN
PR China
NIEs
ROW
3.50
3.70
3.90
4.10
4.30
4.50
4.70
90
92
94
96
98
100
102
104
Jan-16 Sep-16 May-17 Jan-18
ReservesRM/USD (RHS)
USD billion RM/USD
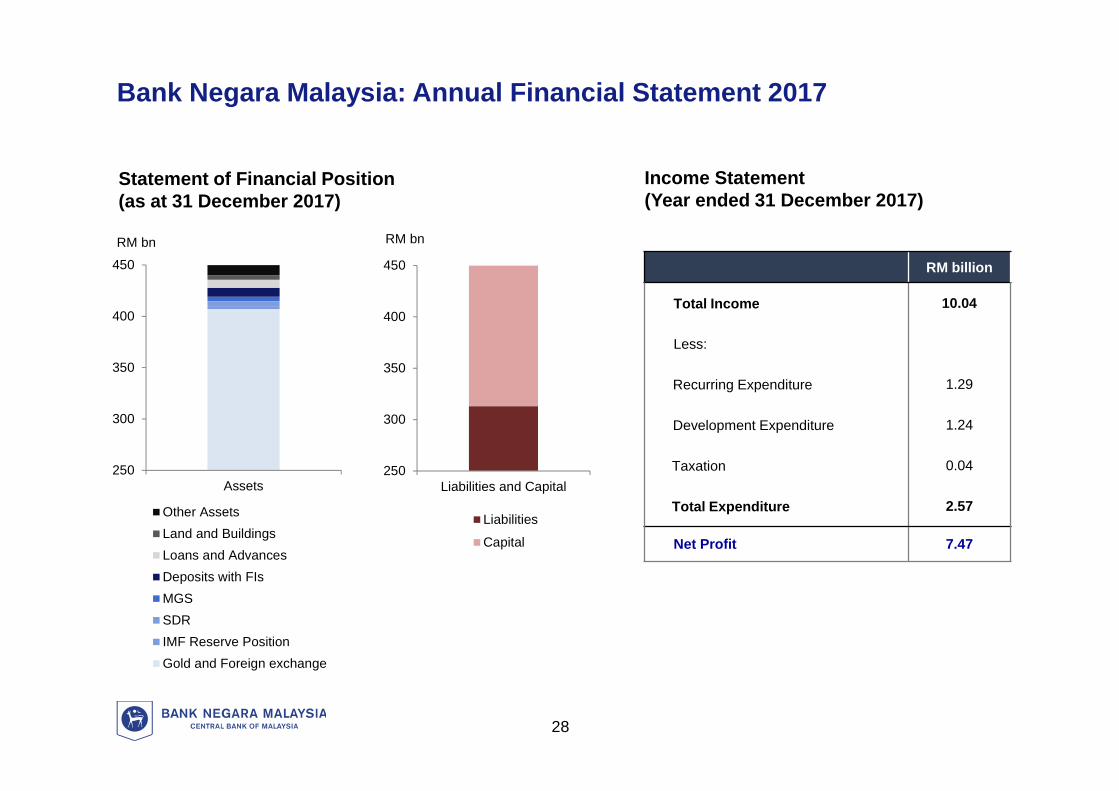
Bank Negara Malaysia: Annual Financial Statement 2017
Financial position remained strong in 2017:
• Total assets of BNM amounted to RM449.85 billion
• Net profit of RM7.47 billion
• 2017 dividend of RM2.5 billion paid to the Government
27
33
Income Statement(Year ended 31 December 2017)
Statement of Financial Position(as at 31 December 2017)
250
300
350
400
450
Assets
Other AssetsLand and BuildingsLoans and AdvancesDeposits with FIsMGSSDRIMF Reserve PositionGold and Foreign exchange
RM bn
250
300
350
400
450
Liabilities and Capital
Liabilities
Capital
RM bn
RM billion
Total Income 10.04
Less:
Recurring Expenditure 1.29
Development Expenditure 1.24
Taxation 0.04
Total Expenditure 2.57
Net Profit 7.47
Bank Negara Malaysia: Annual Financial Statement 2017
28
Laporan Kestabilan Kewangandan Sistem Pembayaran 2017
Bank Negara Malaysia
28 Mac 2018
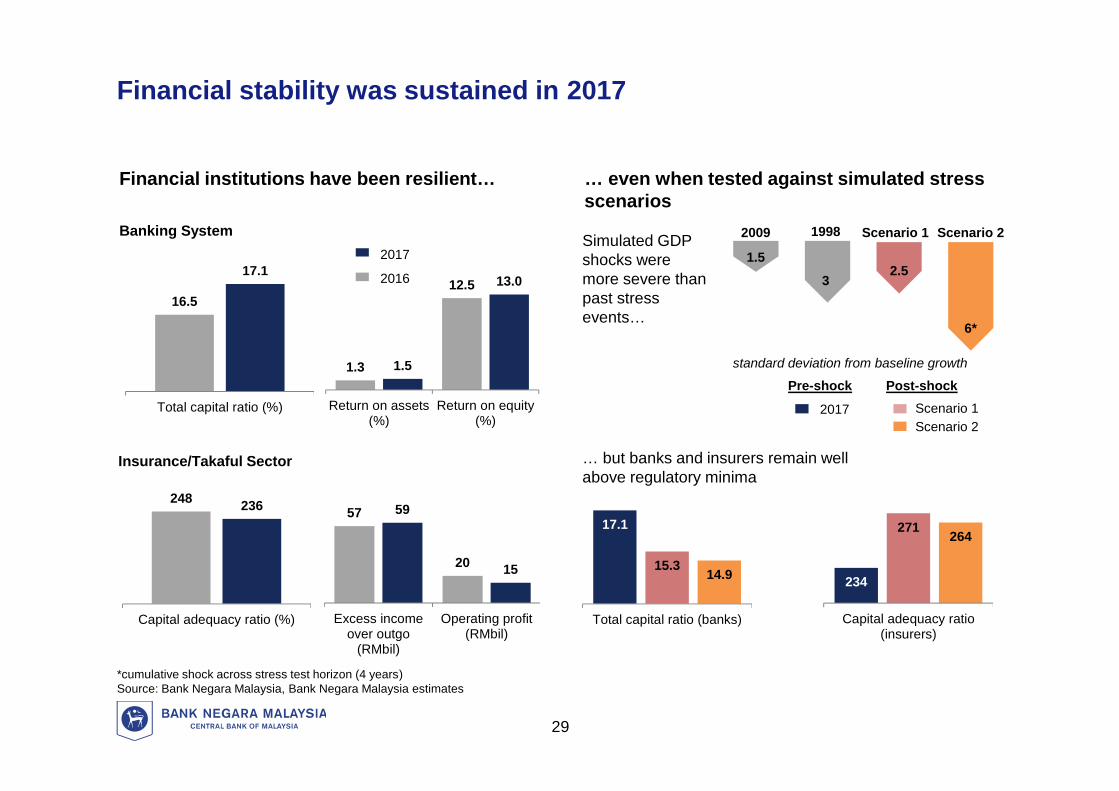
Financial stability was sustained in 2017
*cumulative shock across stress test horizon (4 years)Source: Bank Negara Malaysia, Bank Negara Malaysia estimates
Financial institutions have been resilient… … even when tested against simulated stressscenarios
Simulated GDPshocks weremore severe thanpast stressevents…
Insurance/Takaful Sector
standard deviation from baseline growth
2009
1.5
1998
32.5
Scenario 1
6*
Scenario 2
… but banks and insurers remain wellabove regulatory minima
17.1
15.3 14.9
Total capital ratio (banks)
234
271 264
Capital adequacy ratio(insurers)
16.5
17.1
Total capital ratio (%)
1.3
12.5
1.5
13.0
Return on assets(%)
Return on equity(%)
2017
2016
2017 Scenario 1Scenario 2
Post-shockPre-shock
248 236
Capital adequacy ratio (%)
57
20
59
15
Excess incomeover outgo
(RMbil)
Operating profit(RMbil)
Banking System
29
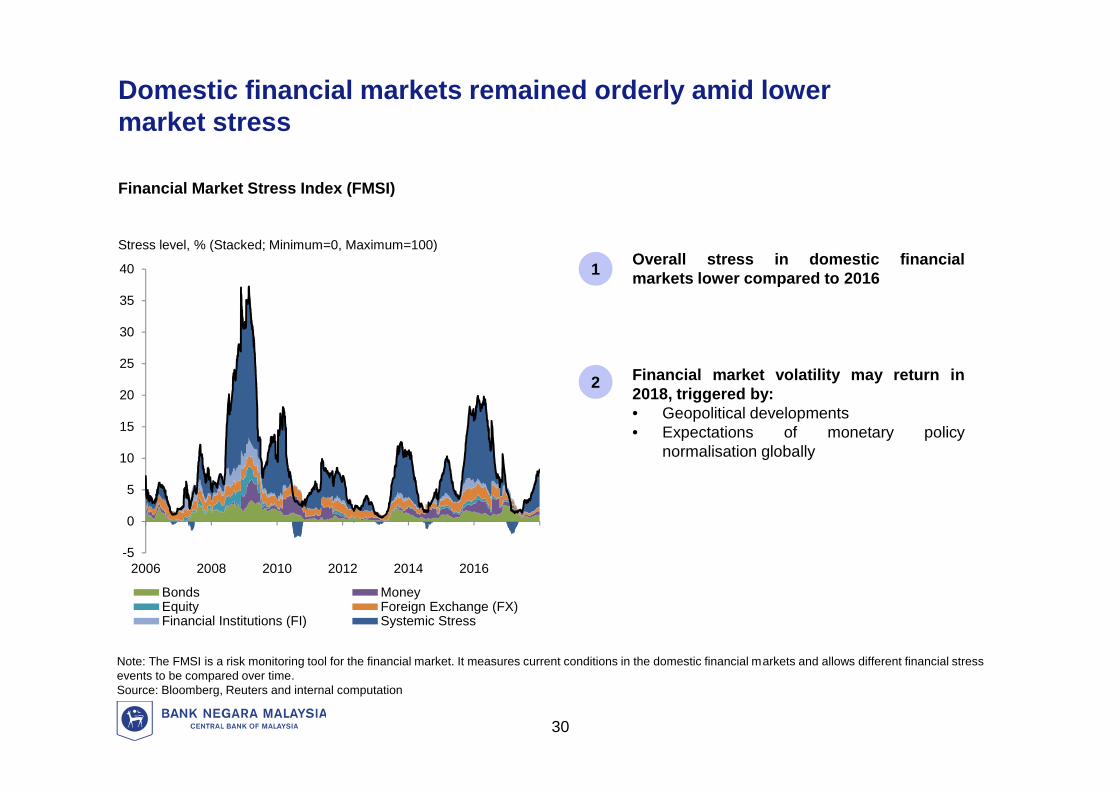
Domestic financial markets remained orderly amid lowermarket stress
Note: The FMSI is a risk monitoring tool for the financial market. It measures current conditions in the domestic financial markets and allows different financial stressevents to be compared over time.Source: Bloomberg, Reuters and internal computation
Stress level, % (Stacked; Minimum=0, Maximum=100)
Financial Market Stress Index (FMSI)
-5
0
5
10
15
20
25
30
35
40
2006 2008 2010 2012 2014 2016
Bonds MoneyEquity Foreign Exchange (FX)Financial Institutions (FI) Systemic Stress
Overall stress in domestic financialmarkets lower compared to 20161
Financial market volatility may return in2018, triggered by:• Geopolitical developments• Expectations of monetary policy
normalisation globally
2
30
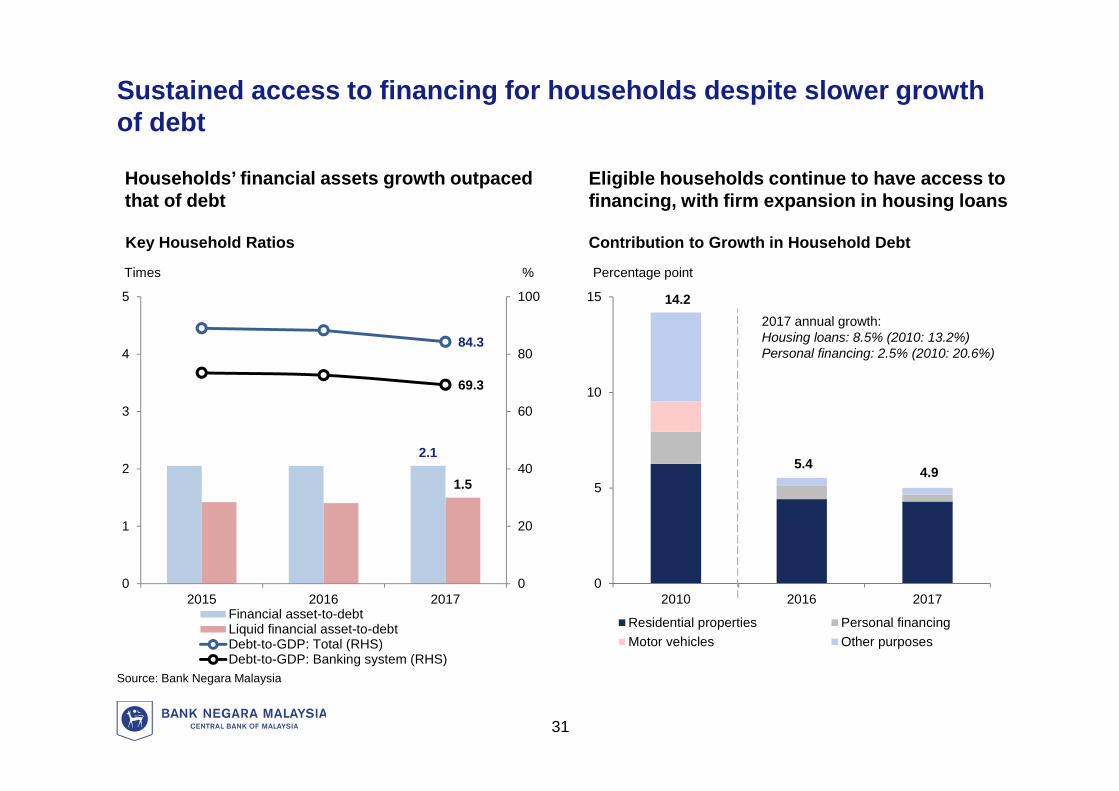
Sustained access to financing for households despite slower growthof debt
Households’ financial assets growth outpacedthat of debt
Key Household Ratios
Source: Bank Negara Malaysia
31
2.1
1.5
84.3
69.3
0
20
40
60
80
100
0
1
2
3
4
5
2015 2016 2017Financial asset-to-debtLiquid financial asset-to-debtDebt-to-GDP: Total (RHS)Debt-to-GDP: Banking system (RHS)
Times %
Eligible households continue to have access tofinancing, with firm expansion in housing loans
Percentage point
Contribution to Growth in Household Debt
14.2
5.4 4.9
0
5
10
15
2010 2016 2017
Residential properties Personal financingMotor vehicles Other purposes
2017 annual growth:Housing loans: 8.5% (2010: 13.2%)Personal financing: 2.5% (2010: 20.6%)
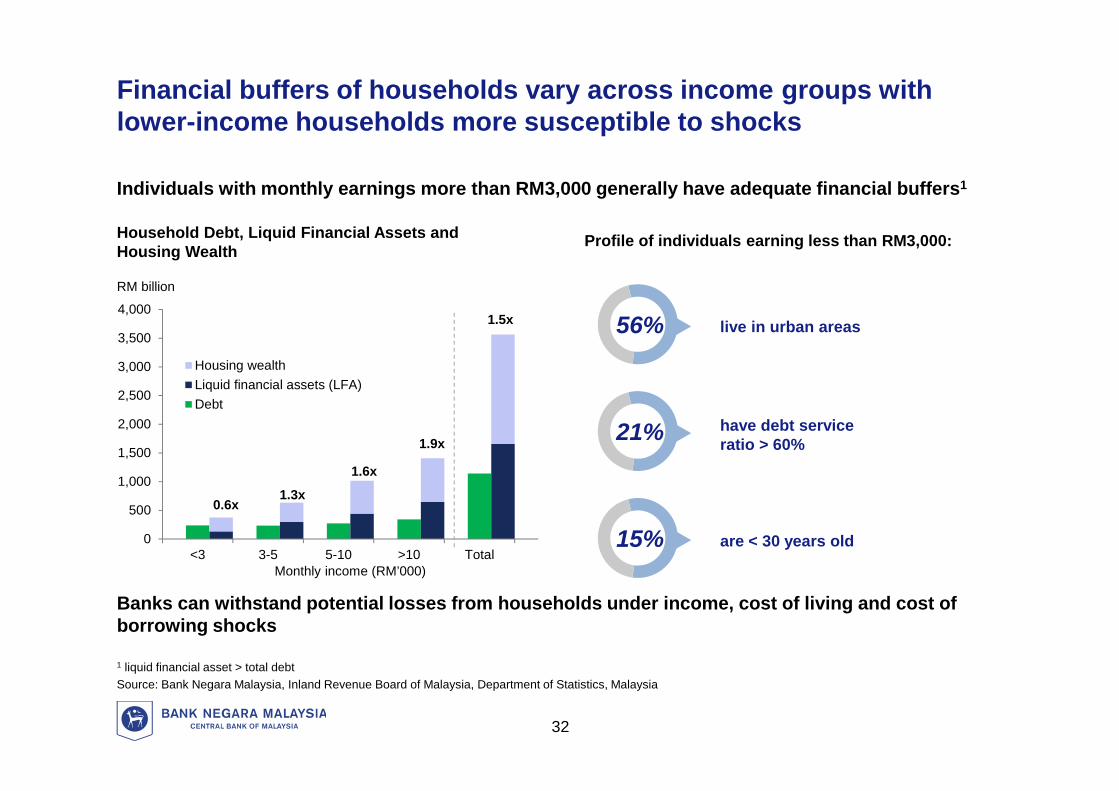
Financial buffers of households vary across income groups withlower-income households more susceptible to shocks
Individuals with monthly earnings more than RM3,000 generally have adequate financial buffers1
1 liquid financial asset > total debtSource: Bank Negara Malaysia, Inland Revenue Board of Malaysia, Department of Statistics, Malaysia
RM billion
Household Debt, Liquid Financial Assets andHousing Wealth
are < 30 years old
56% live in urban areas
have debt serviceratio > 60%
Banks can withstand potential losses from households under income, cost of living and cost ofborrowing shocks
0
500
1,000
1,500
2,000
2,500
3,000
3,500
4,000
<3 3-5 5-10 >10 TotalMonthly income (RM’000)
Housing wealthLiquid financial assets (LFA)Debt
0.6x1.3x
1.6x
1.9x
1.5x
32
Profile of individuals earning less than RM3,000:
21%
15%
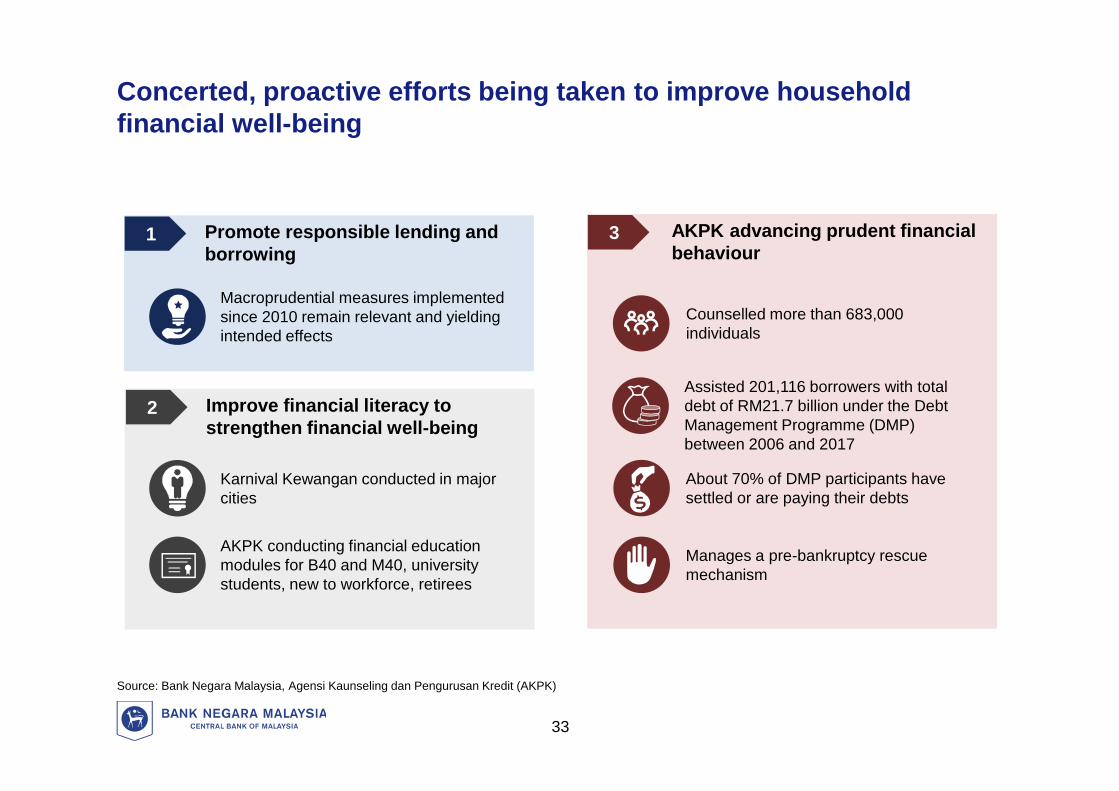
Concerted, proactive efforts being taken to improve householdfinancial well-being
Source: Bank Negara Malaysia, Agensi Kaunseling dan Pengurusan Kredit (AKPK)
1 Promote responsible lending andborrowing
2 Improve financial literacy tostrengthen financial well-being
3 AKPK advancing prudent financialbehaviour
Counselled more than 683,000individuals
Assisted 201,116 borrowers with totaldebt of RM21.7 billion under the DebtManagement Programme (DMP)between 2006 and 2017
About 70% of DMP participants havesettled or are paying their debts
Manages a pre-bankruptcy rescuemechanism
AKPK conducting financial educationmodules for B40 and M40, universitystudents, new to workforce, retirees
Karnival Kewangan conducted in majorcities
Macroprudential measures implementedsince 2010 remain relevant and yieldingintended effects
33
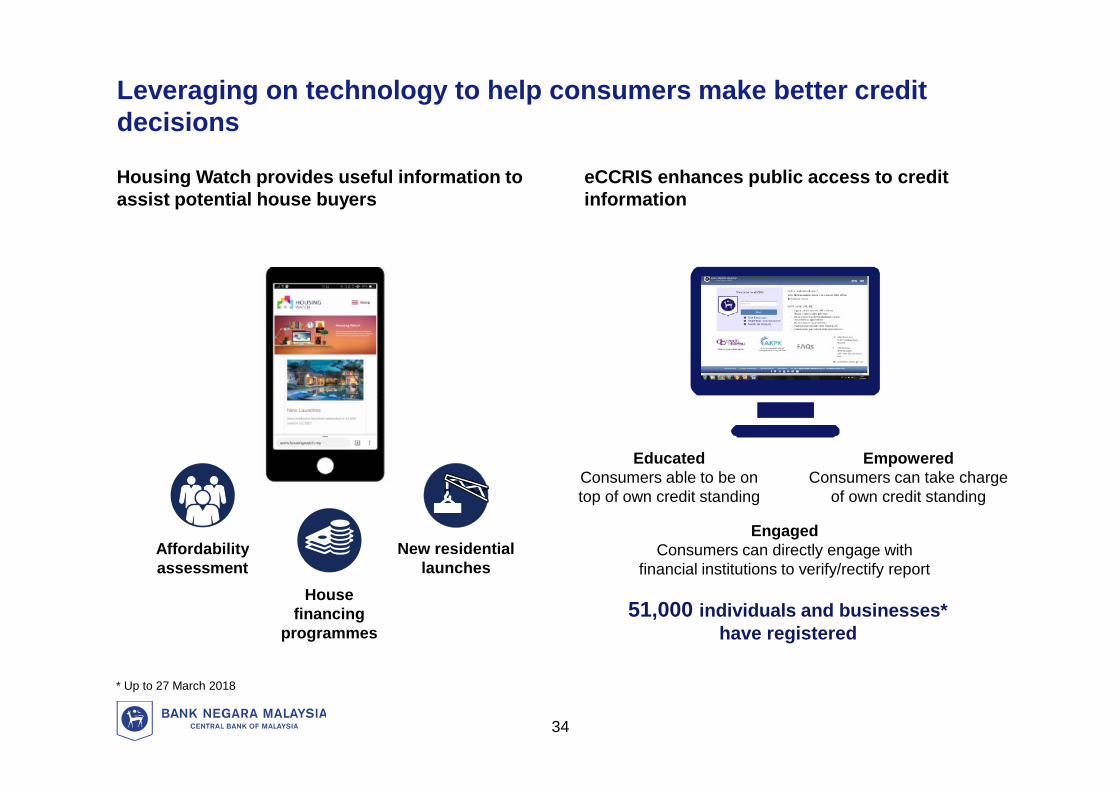
Leveraging on technology to help consumers make better creditdecisions
Housing Watch provides useful information toassist potential house buyers
* Up to 27 March 2018
eCCRIS enhances public access to creditinformation
51,000 individuals and businesses*have registered
Affordabilityassessment
Housefinancing
programmes
New residentiallaunches
34
EducatedConsumers able to be ontop of own credit standing
EmpoweredConsumers can take charge
of own credit standing
EngagedConsumers can directly engage with
financial institutions to verify/rectify report
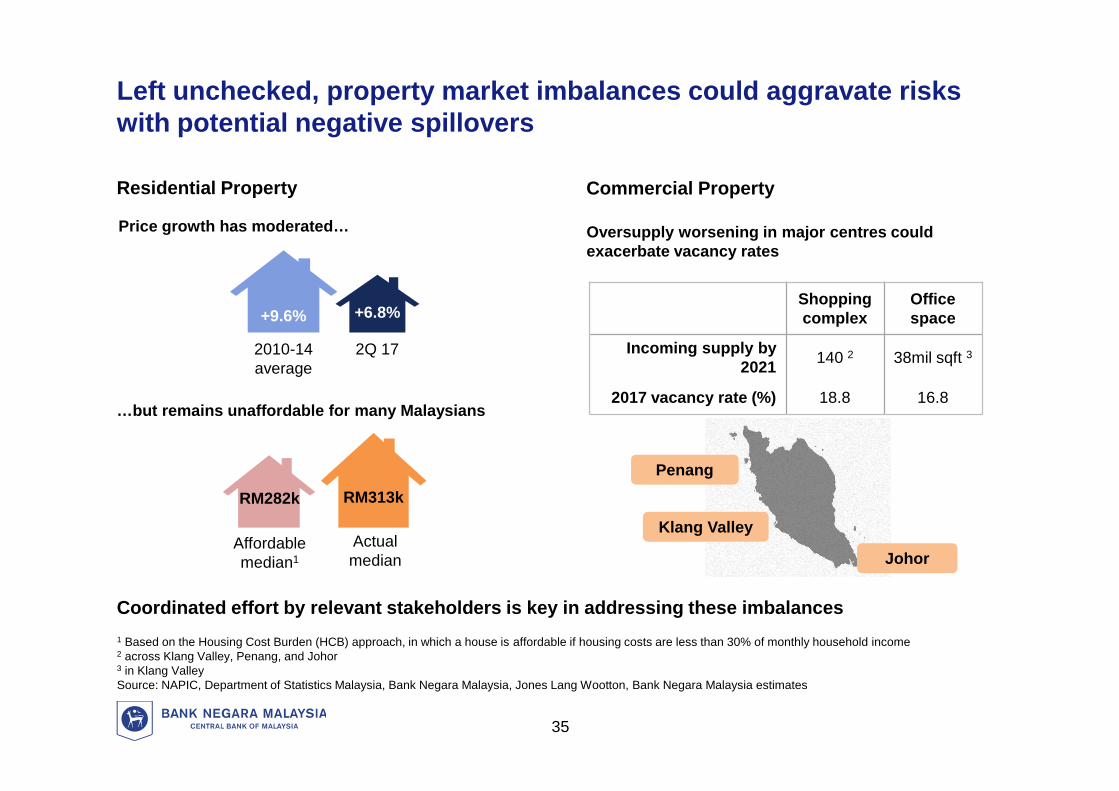
Left unchecked, property market imbalances could aggravate riskswith potential negative spillovers
1 Based on the Housing Cost Burden (HCB) approach, in which a house is affordable if housing costs are less than 30% of monthly household income2 across Klang Valley, Penang, and Johor3 in Klang ValleySource: NAPIC, Department of Statistics Malaysia, Bank Negara Malaysia, Jones Lang Wootton, Bank Negara Malaysia estimates
Coordinated effort by relevant stakeholders is key in addressing these imbalances
Price growth has moderated… Oversupply worsening in major centres couldexacerbate vacancy rates
…but remains unaffordable for many Malaysians
35
Residential Property Commercial Property
Shoppingcomplex
Officespace
Incoming supply by2021 140 2 38mil sqft 3
2017 vacancy rate (%) 18.8 16.8
Johor
Klang Valley
Penang
+6.8%
2Q 17
+9.6%
2010-14average
RM313k
Actualmedian
Affordablemedian1
RM282k
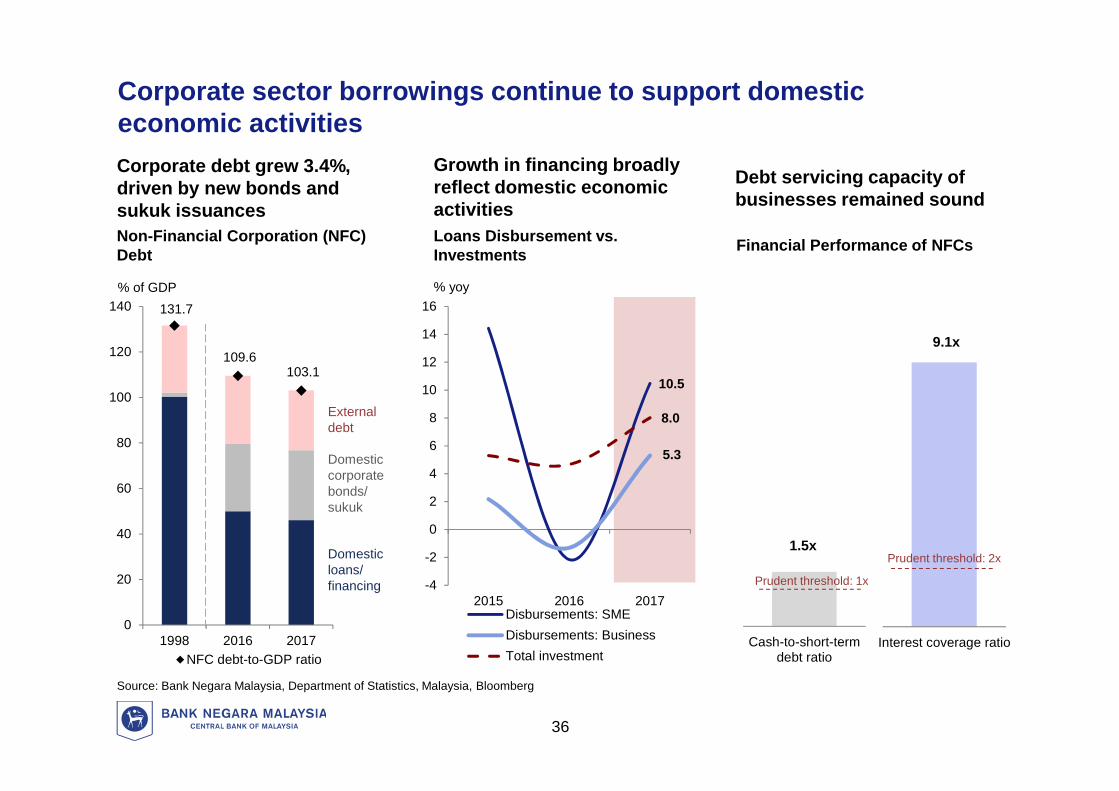
Corporate sector borrowings continue to support domesticeconomic activities
% of GDP
Loans Disbursement vs.Investments
% yoy
Corporate debt grew 3.4%,driven by new bonds andsukuk issuances
Growth in financing broadlyreflect domestic economicactivities
Debt servicing capacity ofbusinesses remained sound
Non-Financial Corporation (NFC)Debt
131.7
109.6103.1
0
20
40
60
80
100
120
140
1998 2016 2017NFC debt-to-GDP ratio
Externaldebt
Domesticcorporatebonds/sukuk
Domesticloans/financing
Financial Performance of NFCs
Interest coverage ratio
Prudent threshold: 2x
Cash-to-short-termdebt ratio
Prudent threshold: 1x
10.5
5.3
8.0
-4
-2
0
2
4
6
8
10
12
14
16
2015 2016 2017Disbursements: SMEDisbursements: BusinessTotal investment
Source: Bank Negara Malaysia, Department of Statistics, Malaysia, Bloomberg
36
9.1x
1.5x
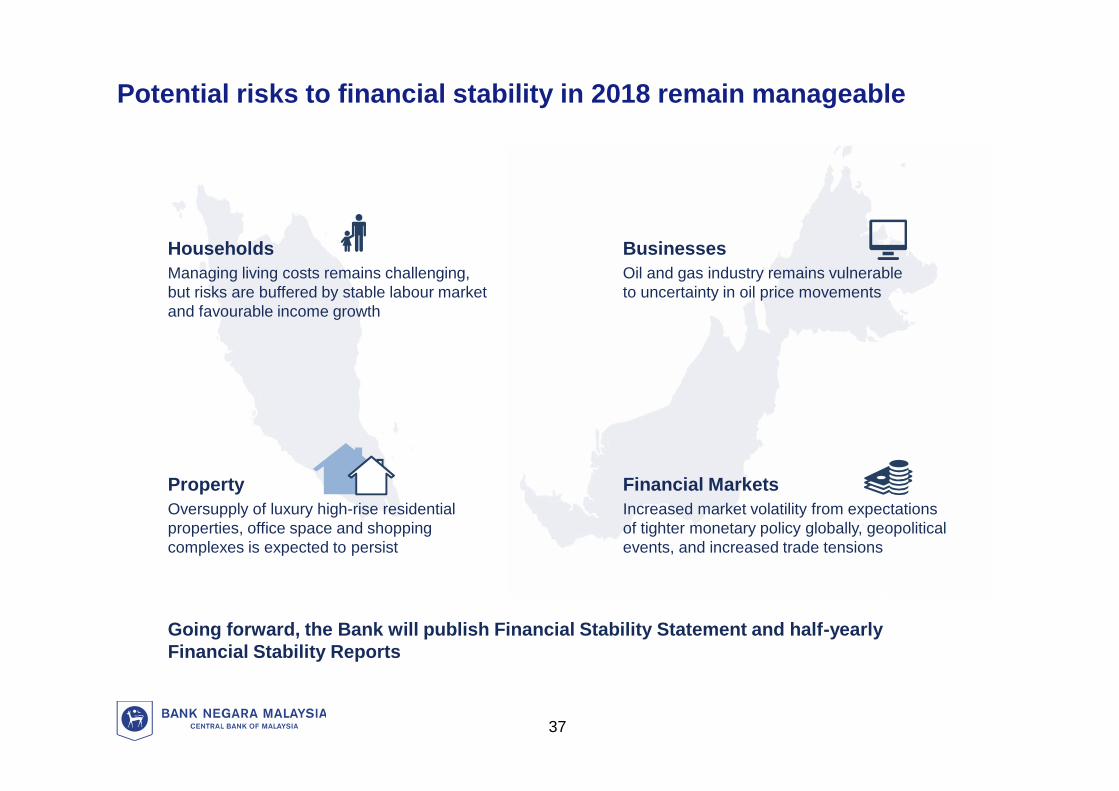
Potential risks to financial stability in 2018 remain manageable
HouseholdsManaging living costs remains challenging,but risks are buffered by stable labour marketand favourable income growth
PropertyOversupply of luxury high-rise residentialproperties, office space and shoppingcomplexes is expected to persist
BusinessesOil and gas industry remains vulnerableto uncertainty in oil price movements
Financial MarketsIncreased market volatility from expectationsof tighter monetary policy globally, geopoliticalevents, and increased trade tensions
37
Going forward, the Bank will publish Financial Stability Statement and half-yearlyFinancial Stability Reports
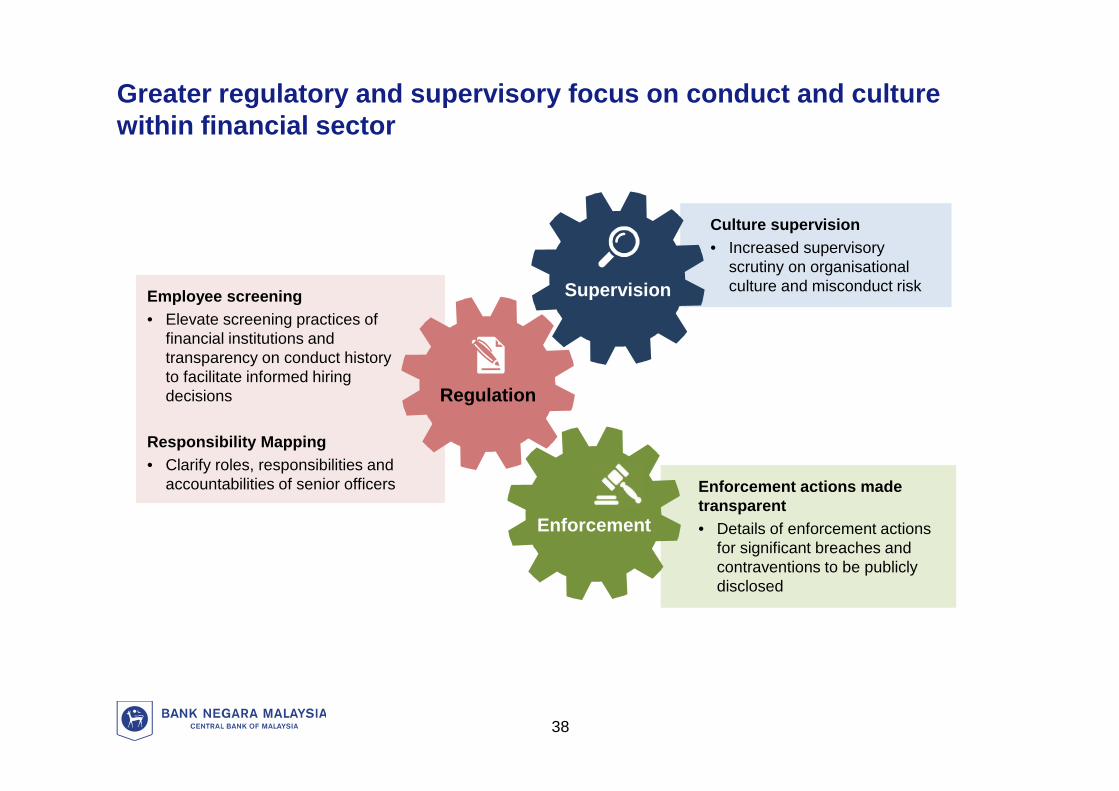
Greater regulatory and supervisory focus on conduct and culturewithin financial sector
Employee screening• Elevate screening practices of
financial institutions andtransparency on conduct historyto facilitate informed hiringdecisions
Responsibility Mapping• Clarify roles, responsibilities and
accountabilities of senior officers
Culture supervision• Increased supervisory
scrutiny on organisationalculture and misconduct risk
Enforcement actions madetransparent• Details of enforcement actions
for significant breaches andcontraventions to be publiclydisclosed
Supervision
Regulation
Enforcement
38
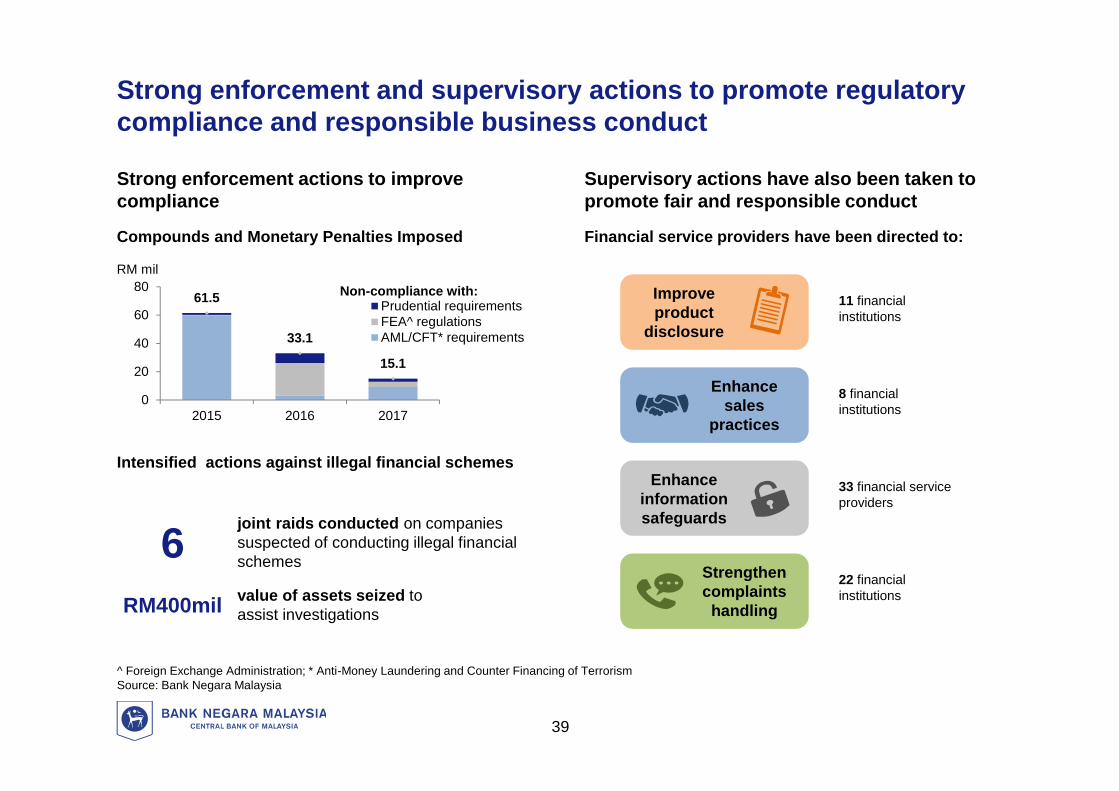
Strong enforcement and supervisory actions to promote regulatorycompliance and responsible business conduct
^ Foreign Exchange Administration; * Anti-Money Laundering and Counter Financing of TerrorismSource: Bank Negara Malaysia
RM mil
Supervisory actions have also been taken topromote fair and responsible conduct
Intensified actions against illegal financial schemes
Compounds and Monetary Penalties Imposed
Strong enforcement actions to improvecompliance
61.5
33.1
15.1
0
20
40
60
80
2015 2016 2017
Prudential requirementsFEA^ regulationsAML/CFT* requirements
Non-compliance with:
joint raids conducted on companiessuspected of conducting illegal financialschemes6
RM400mil value of assets seized toassist investigations
Financial service providers have been directed to:
Improveproduct
disclosure
11 financialinstitutions
Enhancesales
practices
8 financialinstitutions
Enhanceinformationsafeguards
33 financial serviceproviders
Strengthencomplaints
handling
22 financialinstitutions
39
*The financial sector comprises banking institutions, development financial institutions, insurers and takaful operators
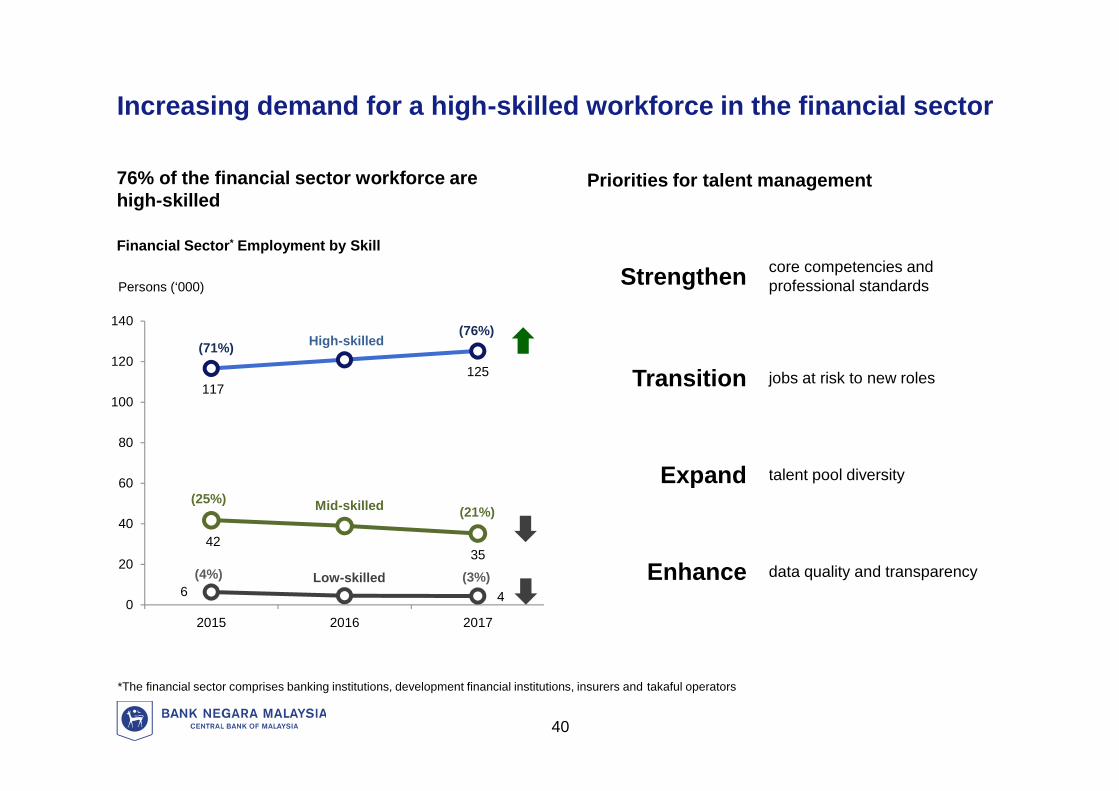
Persons (‘000)
Increasing demand for a high-skilled workforce in the financial sector
76% of the financial sector workforce arehigh-skilled
Financial Sector* Employment by Skill
117125
4235
6 40
20
40
60
80
100
120
140
2015 2016 2017
High-skilled
Mid-skilled
Low-skilled
(71%)(76%)
(25%)(21%)
(4%) (3%)
Priorities for talent management
40
Strengthen core competencies andprofessional standards
Transition jobs at risk to new roles
Expand talent pool diversity
Enhance data quality and transparency
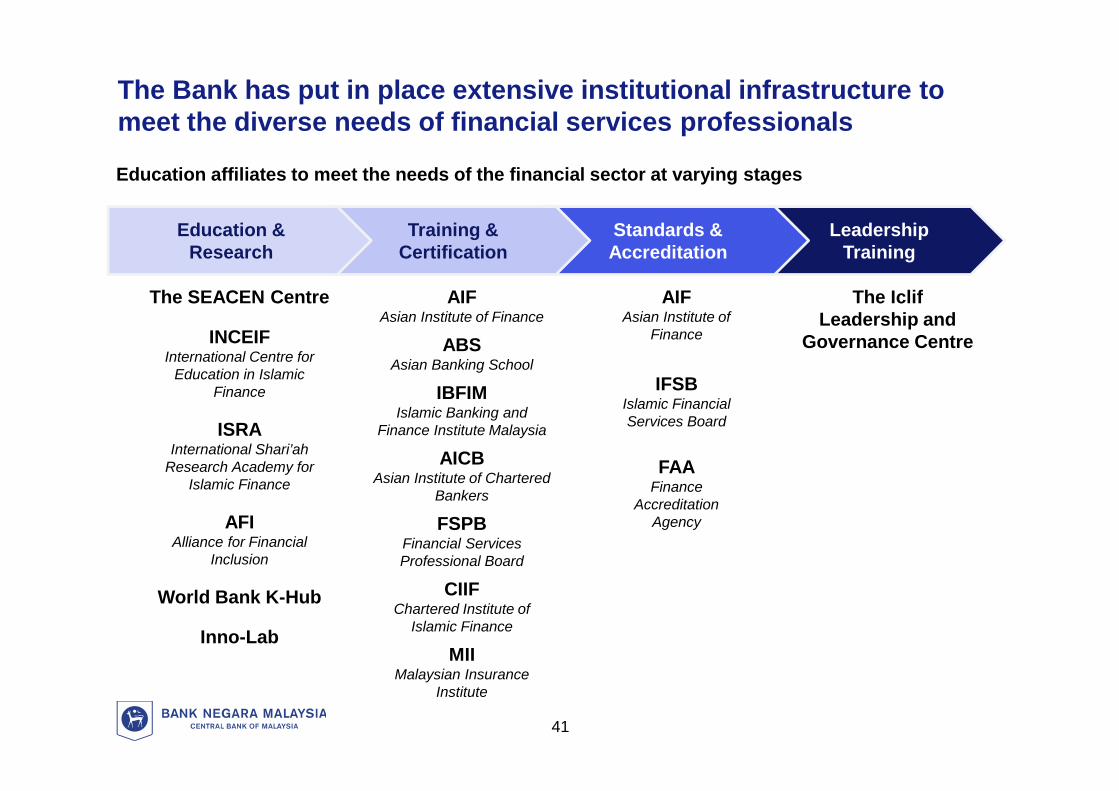
The Bank has put in place extensive institutional infrastructure tomeet the diverse needs of financial services professionals
Education affiliates to meet the needs of the financial sector at varying stages
LeadershipTraining
Standards &Accreditation
Training &Certification
Education &Research
The SEACEN Centre
INCEIFInternational Centre for
Education in IslamicFinance
ISRAInternational Shari’ah
Research Academy forIslamic Finance
AFIAlliance for Financial
Inclusion
World Bank K-Hub
Inno-Lab
AIFAsian Institute of Finance
ABSAsian Banking School
IBFIMIslamic Banking and
Finance Institute Malaysia
AICBAsian Institute of Chartered
Bankers
FSPBFinancial ServicesProfessional Board
CIIFChartered Institute of
Islamic Finance
MIIMalaysian Insurance
Institute
AIFAsian Institute of
Finance
IFSBIslamic FinancialServices Board
FAAFinance
AccreditationAgency
The IclifLeadership and
Governance Centre
41
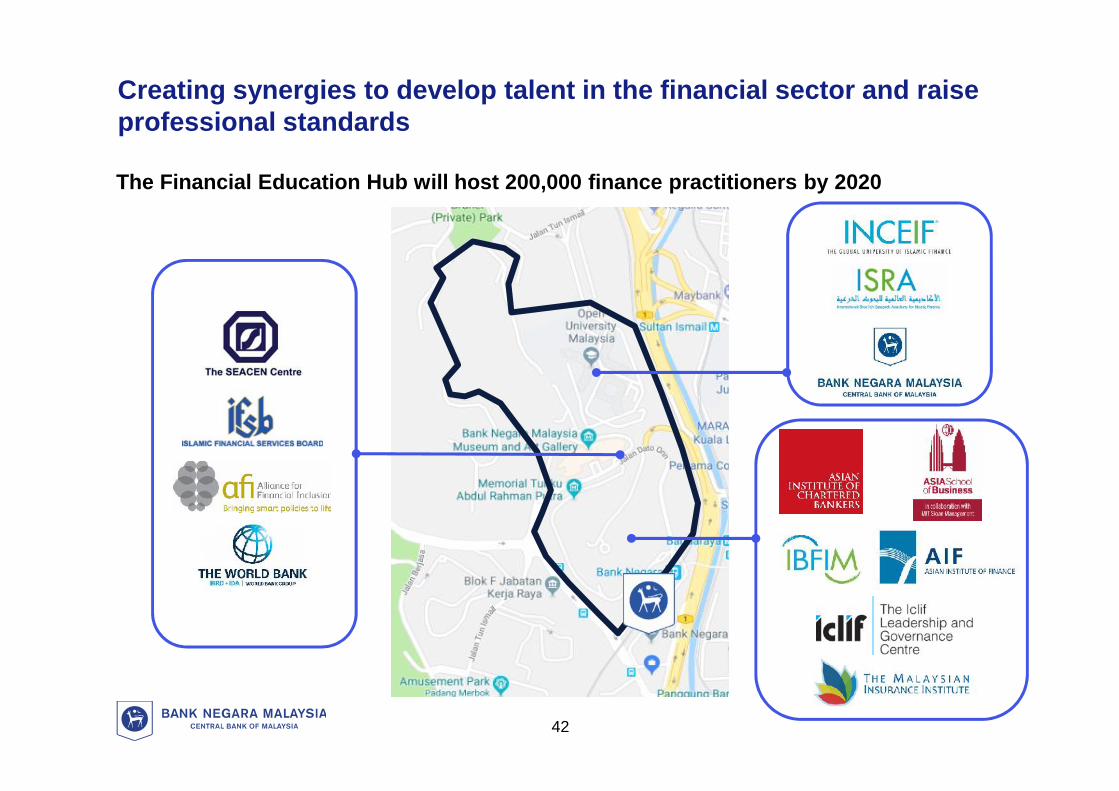
Creating synergies to develop talent in the financial sector and raiseprofessional standards
The Financial Education Hub will host 200,000 finance practitioners by 2020
42
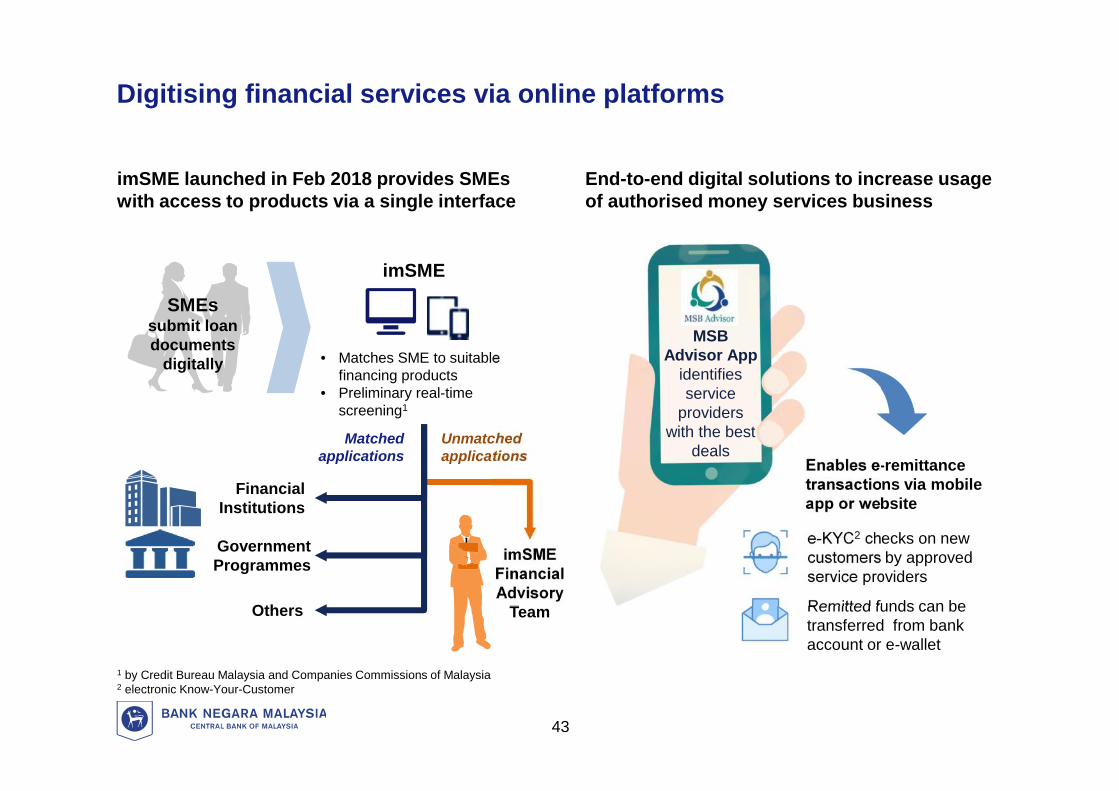
Digitising financial services via online platforms
imSME launched in Feb 2018 provides SMEswith access to products via a single interface
1 by Credit Bureau Malaysia and Companies Commissions of Malaysia2 electronic Know-Your-Customer
End-to-end digital solutions to increase usageof authorised money services business
SMEssubmit loandocuments
digitally
imSME
• Matches SME to suitablefinancing products
• Preliminary real-timescreening1
FinancialInstitutions
Others
Matchedapplications
Unmatchedapplications
imSMEFinancialAdvisory
Team
Enables e-remittancetransactions via mobileapp or website
e-KYC2 checks on newcustomers by approvedservice providers
Remitted funds can betransferred from bankaccount or e-wallet
GovernmentProgrammes
43
MSBAdvisor App
identifiesservice
providerswith the best
deals
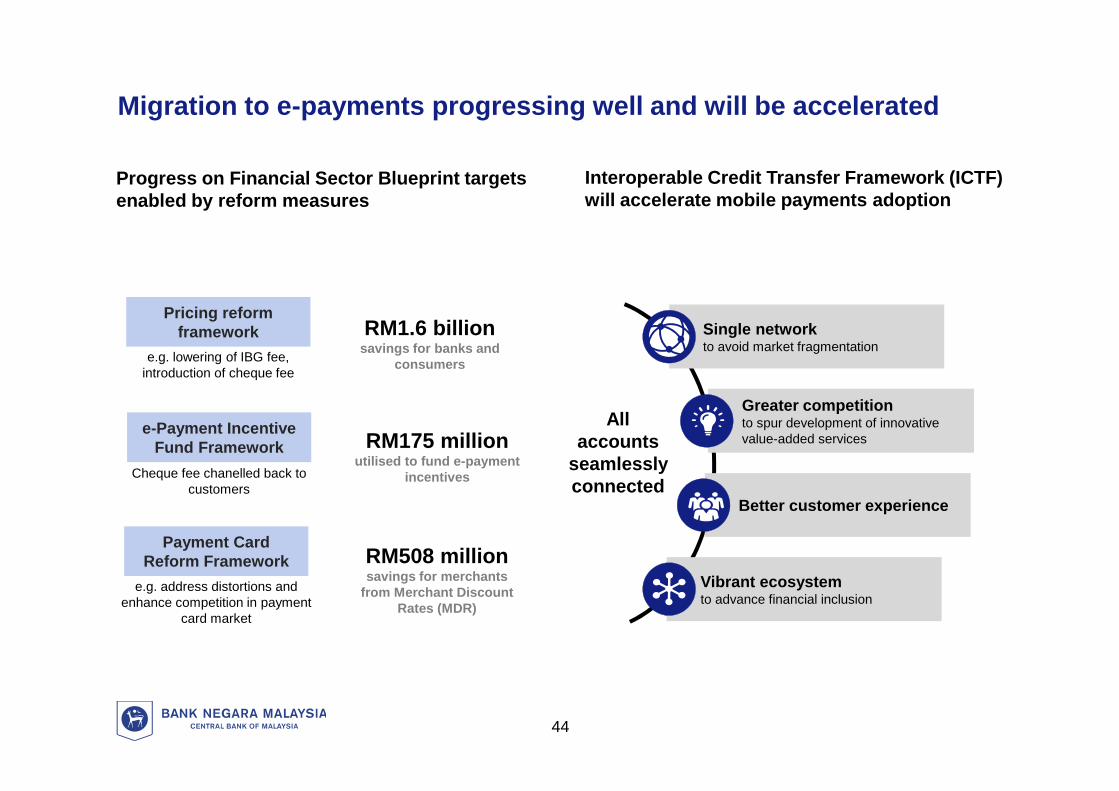
Migration to e-payments progressing well and will be accelerated
Progress on Financial Sector Blueprint targetsenabled by reform measures
Interoperable Credit Transfer Framework (ICTF)will accelerate mobile payments adoption
RM1.6 billionsavings for banks and
consumers
RM175 millionutilised to fund e-payment
incentives
RM508 millionsavings for merchants
from Merchant DiscountRates (MDR)
e-Payment IncentiveFund Framework
Cheque fee chanelled back tocustomers
Allaccounts
seamlesslyconnected
Single networkto avoid market fragmentation
Greater competitionto spur development of innovativevalue-added services
Vibrant ecosystemto advance financial inclusion
44
e.g. address distortions andenhance competition in payment
card market
Payment CardReform Framework
e.g. lowering of IBG fee,introduction of cheque fee
Pricing reformframework
Better customer experience
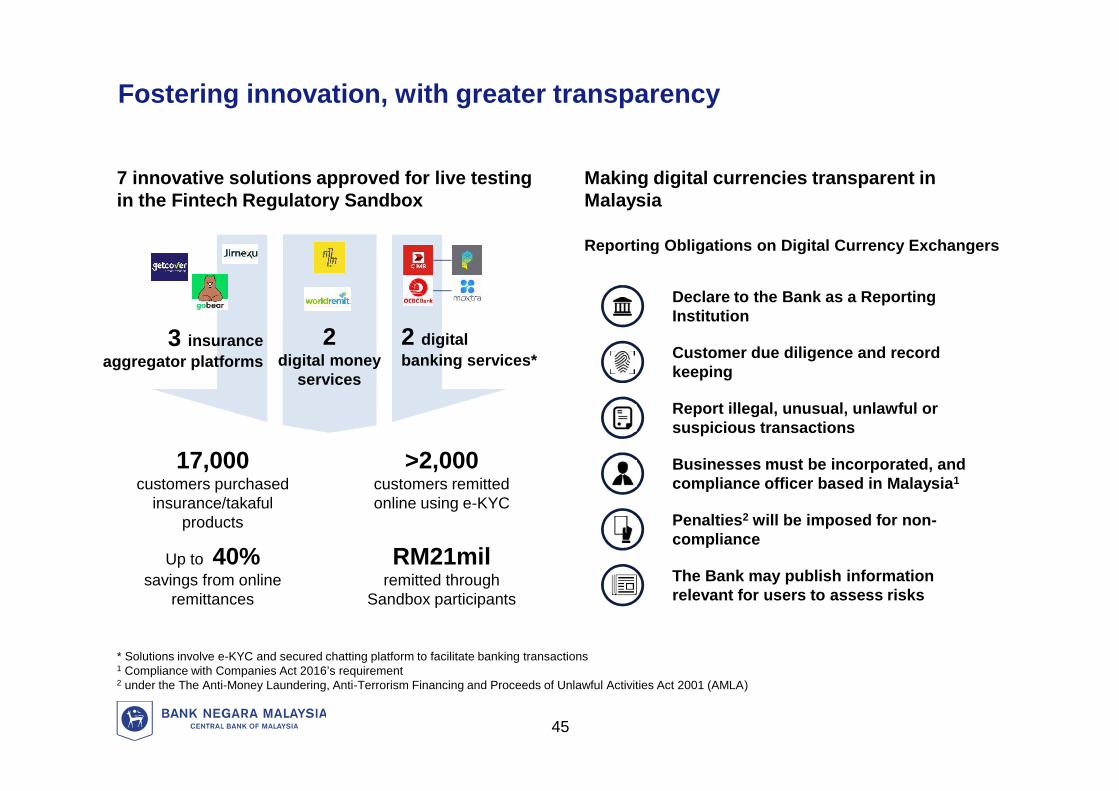
Fostering innovation, with greater transparency
7 innovative solutions approved for live testingin the Fintech Regulatory Sandbox
* Solutions involve e-KYC and secured chatting platform to facilitate banking transactions1 Compliance with Companies Act 2016’s requirement2 under the The Anti-Money Laundering, Anti-Terrorism Financing and Proceeds of Unlawful Activities Act 2001 (AMLA)
Making digital currencies transparent inMalaysia
Reporting Obligations on Digital Currency Exchangers
Declare to the Bank as a ReportingInstitution
Report illegal, unusual, unlawful orsuspicious transactions
Businesses must be incorporated, andcompliance officer based in Malaysia1
Customer due diligence and recordkeeping
The Bank may publish informationrelevant for users to assess risks
Penalties2 will be imposed for non-compliance
3 insuranceaggregator platforms
2digital money
services
2 digitalbanking services*
17,000customers purchased
insurance/takafulproducts
RM21milremitted through
Sandbox participants
>2,000customers remittedonline using e-KYC
Up to 40%savings from online
remittances
45
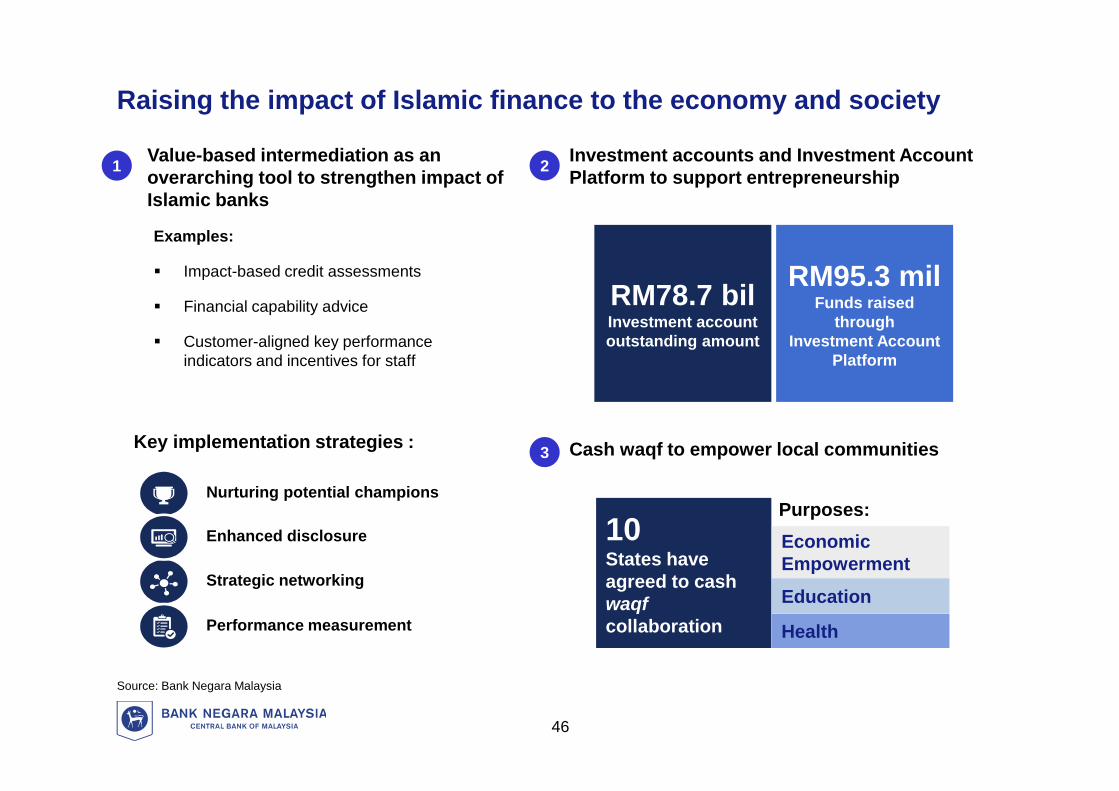
Raising the impact of Islamic finance to the economy and society
Source: Bank Negara Malaysia
Examples:
Impact-based credit assessments
Financial capability advice
Customer-aligned key performanceindicators and incentives for staff
1 Value-based intermediation as anoverarching tool to strengthen impact ofIslamic banks
Key implementation strategies :
Nurturing potential champions
Performance measurement
Enhanced disclosure
Strategic networking
2 Investment accounts and Investment AccountPlatform to support entrepreneurship
3 Cash waqf to empower local communities
RM78.7 bilInvestment accountoutstanding amount
RM95.3 milFunds raised
throughInvestment Account
Platform
10States haveagreed to cashwaqfcollaboration
EconomicEmpowerment
Education
Health
Purposes:
46
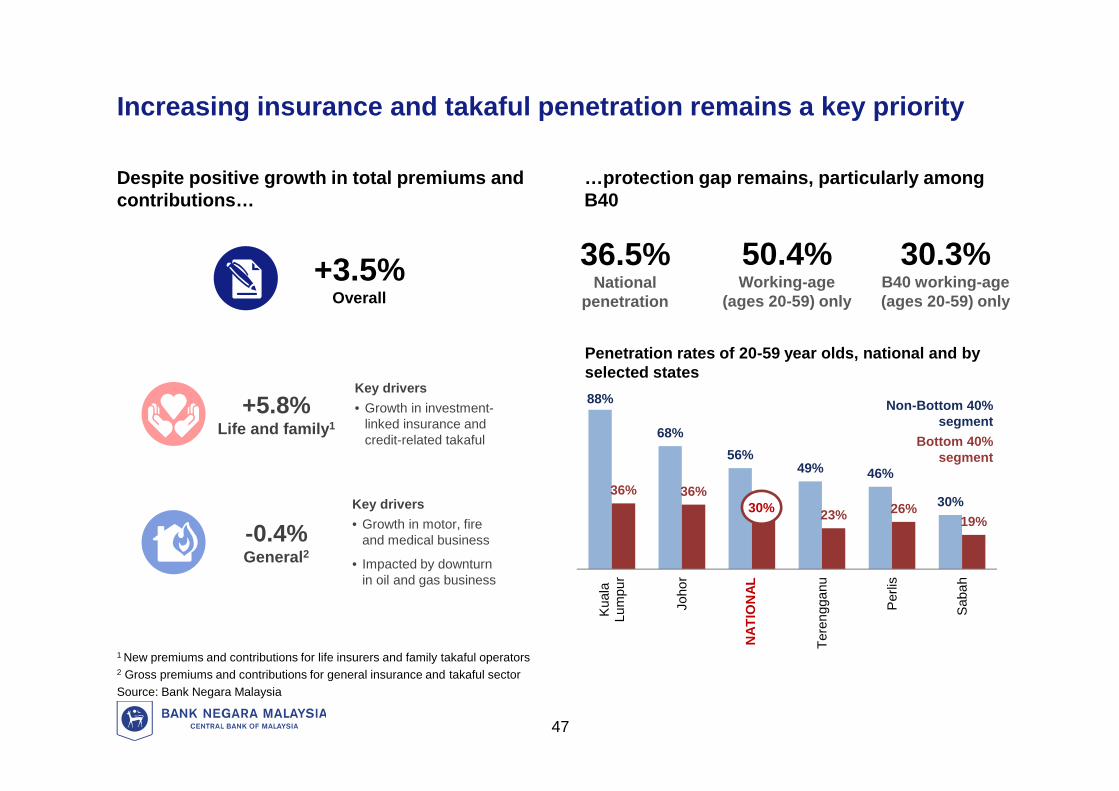
Increasing insurance and takaful penetration remains a key priority
Despite positive growth in total premiums andcontributions…
1 New premiums and contributions for life insurers and family takaful operators2 Gross premiums and contributions for general insurance and takaful sectorSource: Bank Negara Malaysia
…protection gap remains, particularly amongB40
Penetration rates of 20-59 year olds, national and byselected states88%
68%56%
49% 46%
30%36% 36%
30%23% 26%
19%
Kua
laLu
mpu
r
Joho
r
NA
TIO
NAL
Tere
ngga
nu
Per
lis
Sab
ah
Non-Bottom 40%segment
Bottom 40%segment
NAT
ION
AL
30%
Key drivers• Growth in investment-
linked insurance andcredit-related takaful
+5.8%Life and family1
+3.5%Overall
-0.4%General2
Key drivers• Growth in motor, fire
and medical business
• Impacted by downturnin oil and gas business
47
50.4%Working-age
(ages 20-59) only
36.5%National
penetration
30.3%B40 working-age(ages 20-59) only
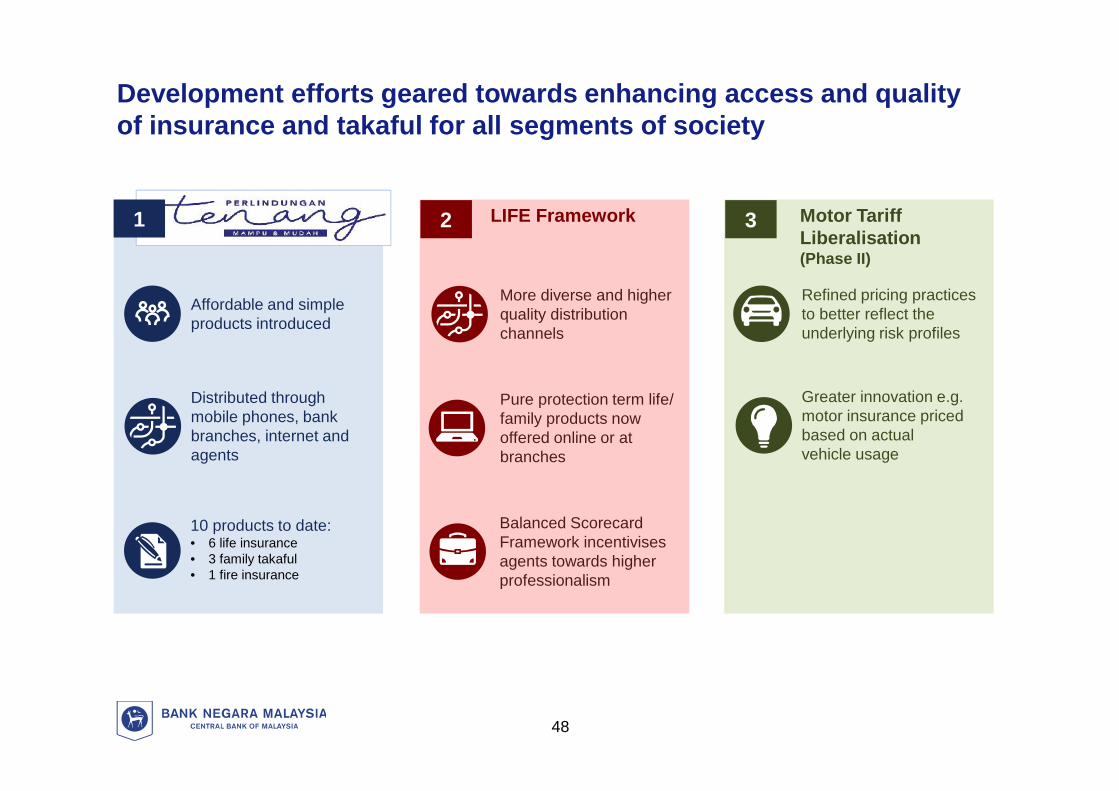
Development efforts geared towards enhancing access and qualityof insurance and takaful for all segments of society
2 3Perlindungan Tenang LIFE Framework Motor TariffLiberalisation(Phase II)
Distributed throughmobile phones, bankbranches, internet andagents
Affordable and simpleproducts introduced
10 products to date:• 6 life insurance• 3 family takaful• 1 fire insurance
More diverse and higherquality distributionchannels
Pure protection term life/family products nowoffered online or atbranches
Balanced ScorecardFramework incentivisesagents towards higherprofessionalism
Greater innovation e.g.motor insurance pricedbased on actualvehicle usage
Refined pricing practicesto better reflect theunderlying risk profiles
48
1
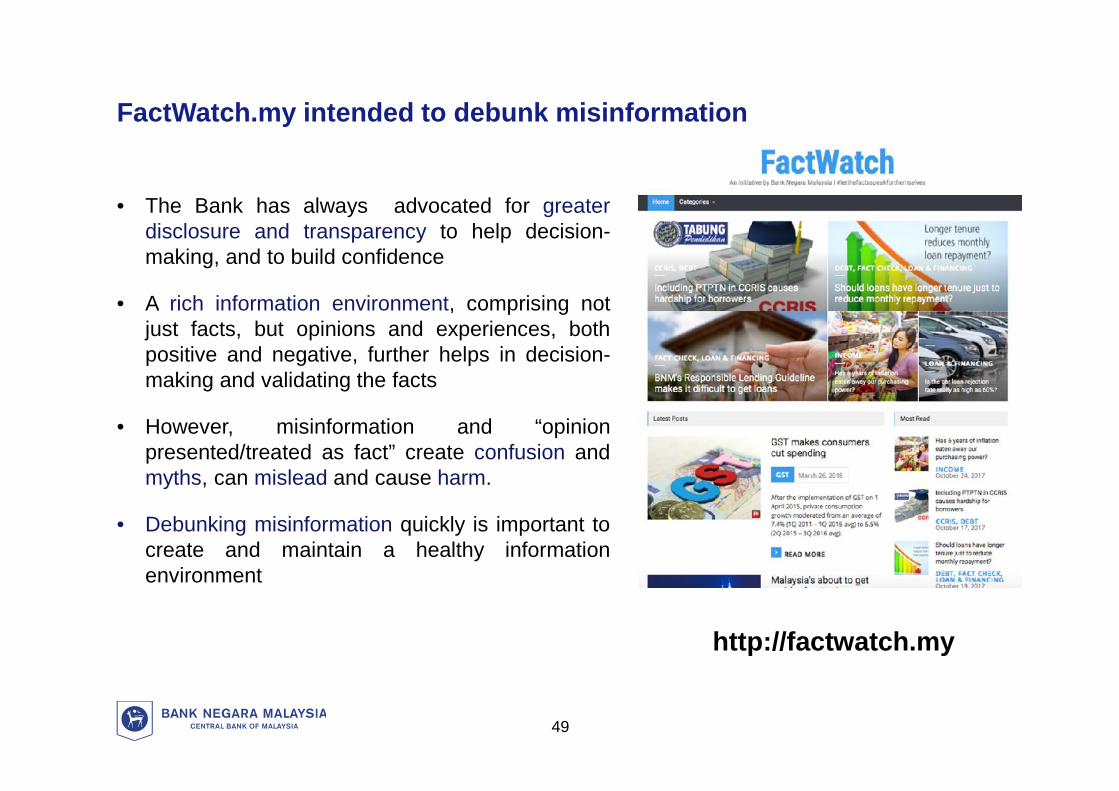
FactWatch.my intended to debunk misinformation
• The Bank has always advocated for greaterdisclosure and transparency to help decision-making, and to build confidence
• A rich information environment, comprising notjust facts, but opinions and experiences, bothpositive and negative, further helps in decision-making and validating the facts
• However, misinformation and “opinionpresented/treated as fact” create confusion andmyths, can mislead and cause harm.
• Debunking misinformation quickly is important tocreate and maintain a healthy informationenvironment
http://factwatch.my
49
FactWatch.my focuses on areas pertaining to the Bank
• FactWatch.my aims to provide factualinformation to correct misinformation andaddress misleading claims
• Does not provide opinions
• Focus is on areas pertaining to the Bank,such as economy, financial sector, financialconsumers
• Complements other fact-checking effortssuch as sebenarnya.my
• Posts will be shared on official social mediaaccounts for more effective dissemination
• Monetary Policy Statement –justifications for OPR decisions
• Rates and statistics on its website &periodicals
• Disclosure of enforcement actionsunder the laws administered by theBank
• Monetary Policy Statement –justifications for OPR decisions
• Rates and statistics on its website &periodicals
• Disclosure of enforcement actionsunder the laws administered by theBank
Some examples over the years include:
50