Embed Size (px)
Citation preview

Published by: BOYAR'S INTRINSIC VALUE RESEARCH LLC 6 East 32nd
St. 7th Floor New York, NY 10016 Tel: 212-995-8300 Fax: 212-995-5636
www.BoyarResearch.com
Asset Analysis Focus and Boyar’s Micro Cap Focus are not investment advisory bulletins, recommending the purchase or sale of any security. Rather they should be used as a guide in aiding the investment community to better understand the intrinsic worth of a corporation. Our services are not intended to replace fundamental research, but should be used in conjunction with it. Additional information is available on request. The statistical and other information contained in this document has been obtained from official reports, current manuals and other sources which we believe reliable. While we cannot guarantee its entire accuracy or completeness, we believe it may be accepted as substantially correct. Boyar's Intrinsic Value Research LLC its officers, directors and employees may at times have a position in any security mentioned herein. Boyar's Intrinsic Value Research LLC Copyright 2014.
TABLE OF CONTENTS
About Boyar’s Intrinsic Value Research LLC .................................... 3
A recent full-length Asset Analysis Focus report
The Charles Schwab Corporation ............................................ 8
Summaries of recent full-length Asset Analysis Focus reports
Devon Energy Corporation ...................................................... 27
DIRECTV ................................................................................ 27
Live Nation Entertainment Inc. ................................................ 27
Regal Entertainment Group ..................................................... 28
The Scotts Miracle Gro-Company .......................................... 28
Whistler Blackcomb Holdings Inc. ............................................ 28
Examples from the 2014 Forgotten Forty
About The Forgotten Forty .............................................................. 29
Crocs, Inc. ............................................................................... 30
International Speedway Corporation ....................................... 31
A recent sample of the Boyar’s Micro Cap Focus report
About Boyar’s Micro Cap Focus .............................................. 32
United Online, Inc. ................................................................... 33

Mark Boyar has been publishing Asset Analysis Focus (AAF) since 1975. AAF, which is published by Boyar’s Intrinsic Value Research LLC, focuses on U.S. equity securities and looks at a corporation and its asset base in the same manner an acquisition minded business executive would. AAF seeks to identify companies trading at a substantial discount to their intrinsic or private market value. AAF’s Research Approach & Methodology: AAF takes a company’s financial statements, tears them apart and reconstructs them in accordance with economic reality as opposed to generally accepted accounting principles. Asset Analysis Focus seeks possible investment opportunities across the market capitalization spectrum and within a diverse range of industries. A large number of the companies featured in AAF are not widely followed by Wall Street. It is interesting to note that approximately 40 percent of the companies profiled in AAF since 1975 have been acquired.* Stock selection strategies employed by Asset Analysis Focus include:
“Hidden” Asset Method
Business Value Method
Restructuring Plays, Breakups and Spinoffs
Franchise Approach
Fallen Angels
Catalysts and Special Situations (Event Driven) Why Subscribe to Asset Analysis Focus Now? We believe this is an opportune time to consider subscribing to Asset Analysis Focus. While the major indices have advanced dramatically since their March 2009 lows, we continue to identify companies that are trading at levels that are significantly below our estimates of their intrinsic or private market values. We have made a concerted effort to bring more new ideas to our subscribers. By way of example, below is a list of all the new ideas (presented by market cap at the time of publication) we have generated for our subscribers since 2011.
Large Cap Mid Cap Small Cap Micro Cap ¹ ($10 billion+) ($2 billion-$9.9 billion) ($500 million-$1.9 billion) (sub $500 million)
Bed Bath and Beyond Inc. Energizer Holdings, Inc. Crocs, Inc. A.T. Cross Company
Campbell Soup Company Equifax Inc. Crown Media Holdings Inc.² Core-Mark Holdings Company Inc.
Cisco Systems, Inc. Expedia, Inc. Dole Food Company, Inc. Cowen Group, Inc.
Coach, Inc. Hanesbrands Inc. Heckmann Corporation Crown Crafts, Inc.
Constellation Brands, Inc. Legg Mason,Inc. Howard Hughes Corporation Douglas Dynamics, Inc.
CVS Caremark Corporation Mohawk Industries, Inc. Live Nation Entertainment, Inc. Inventure Foods Inc.
Devon Energy Corporation Regal Entertainment Group Post Holdings Inc. Kirkland’s Inc.
DirecTV Scotts Miracle-Gro
Company Trustmark Corporation Lydall, Inc.
Kohl’s Corporation Staples Inc. United Online, Inc.² Outdoor Channel Holdings Inc.
Netflix, Inc. (short) W.R. Berkley Corporation Watsco, Inc. Winnebago Industries Inc.
SLM Corporation Vulcan Materials Company Whistler Blackcomb Holdings Inc. XO Group Inc.
The Charles Schwab Corp. Whirlpool Corporation
Tyco International, Ltd. Xylem Inc.
Vivendi S.A.
Wells Fargo & Company
Yahoo! Inc.
3

Performance
While the major indices have performed well since the market bottomed in March of 2009, the companies featured in Asset Analysis Focus have outperformed the S&P 500 by approximately 7% per year since 2009.**
Below are the top performing stocks featured in Asset Analysis Focus organized by year since 2009.
2009
Rank Security Return S&P 500 Outperformance
1 CBS Corporation 1392.74% 151.45% 1241.29%
2 Boston Beer Co., Inc. 808.98% 111.77% 697.21%
3 Saks Incorporated 764.32% 134.70% 629.62%
4 Comcast Corporation 283.69% 101.10% 182.60%
5 Home Depot, Inc. 248.46% 101.06% 147.40%
2010
Rank Security Return S&P 500 Outperformance
1 Discover Financial Services 314.14% 70.43% 243.71%
2 Epoch Holding Corp.† 196.47% 41.50% 154.97%
3 Ascent Capital Group, Inc. 222.99% 69.67% 153.32%
4 Waste Management Inc. 204.32% 64.29% 140.03%
5 The Madison Square Garden Co. 162.80% 57.54% 105.26%
2011
Rank Security Return S&P 500 Outperformance
1 Mohawk Industries Inc. 238.10% 57.59% 180.51%
2 Hanesbrands Inc. 212.87% 42.23% 170.64%
3 Expedia Inc. 192.33% 47.48% 144.85%
4 Whirlpool Corporation 194.46% 57.59% 136.87%
5 Yahoo! Inc. 146.59% 39.27% 107.32%
20.9% 21.5% 18.5%
30.9%
17.7% 17.2% 15.9% 14.8%
21.1%
14.9%
0%
5%
10%
15%
20%
25%
30%
35%
40%
2009 2010 2011 2012 2013
Asset Analysis Focus - Annualized Performance Versus The S&P 500
AAF Companies S&P 500
4

A Subscription to Asset Analysis Focus Includes:
Seven issues each featuring in-depth reports on three companies we believe to be undervalued. Most issues contain a profile of a large, medium, and small capitalization stock. Featured stocks come from a wide variety of industries. The Summer Issue, which profiles an industry or area of the economy that is out of favor on Wall Street. Our selection has at times been highly controversial, but in most instances, over the long term, has proven to be prophetic. The Forgotten Forty. Every December, Boyar’s Intrinsic Value Research produces The Forgotten Forty. The Forgotten Forty, contains our investment theses on the forty companies in our universe that in our opinion have the greatest potential for capital appreciation in the coming year due to a catalyst or corporate action we believe is likely to occur to help unlock shareholder value. If you would like to learn more about subscribing to Asset Analysis Focus please contact me directly at 212-995-8300 ext 215 or email me at [email protected]. Sincerely,
Jonathan Boyar
*Past performance is no guarantee of future results. ¹The micro cap names with the exception of Douglas Dynamics and Core-Mark Holdings Company Inc., were included in Boyar’s Micro Cap Focus, a separate service offered by Boyar’s Intrinsic Value Research LLC. ²Crown Media Holdings and United Online, Inc., were featured in Boyar’s Micro Cap Focus. **This represents the average annualized performance for all regular Asset Analysis reports from their respective publication dates starting in 2009 through December 2013. The performance of companies featured in 2013 are not annualized. The S&P 500 results are not inclusive of dividends. †Epoch Holding Corp. was acquired by TD Bank on 3/27/13; the return shown here stops at this latter date.
2012
Rank Security Return S&P 500 Outperformance
1 Hanesbrands Inc. 159.01% 39.07% 119.94%
2 Live Nation Entertainment, Inc. 110.21% 31.23% 78.98%
3 Liberty Interactive Corporation 97.09% 35.34% 61.75%
4 Meredith Corporation 79.67% 32.23% 47.44%
5 Core-Mark Holdings Company,Inc. 86.97% 40.84% 46.13%
2013
Rank Security Return S&P 500 Outperformance
1 Live Nation Entertainment, Inc. 59.74% 17.79% 41.95%
2 Core-Mark Holding Company, Inc. 45.02% 15.99% 29.03%
3 The Scotts Miracle-Gro Company 28.90% 14.58% 14.32%
4 Liberty Interactive Corporation 28.67% 14.58% 14.09%
5 Tyco International Ltd. 34.51% 22.58% 11.93%
5

Companies profiled in Asset Analysis Focus since 2009
Ticker Company Review Type Date of Issue Price at Date Current Price Δ Price (%)
OEH Orient-Express Hotels Ltd New 1/30/2009 $6.32 $15.11 139.08%
TWX Time Warner Inc Update 1/30/2009 $9.33 $36.15 287.42%
BEN Franklin Resources Inc New 2/27/2009 $15.27 $57.73 278.14%
CBS CBS Corp Update 2/27/2009 $4.27 $63.74 1392.74%
MDS Midas, Inc Update 2/27/2009 $7.35 $11.50 56.46%
WU Western Union Co New 3/30/2009 $12.00 $17.25 43.75%
SKS Saks Inc Update 3/30/2009 $1.85 $15.99 764.32%
UPS United Parcel Service Inc Update 3/30/2009 $48.61 $105.08 116.17%
KSWS K Swiss Inc New 4/30/2009 $10.04 $4.74 -52.79%
SAM Boston Beer Company Inc Update 4/30/2009 $26.60 $241.79 808.98%
BMY Bristol-Myers Squibb Co Update 4/30/2009 $19.20 $53.15 176.82%
UNG United States Natural Gas Fund, LP New 5/29/2009 $14.60 $2.59 -82.29%
CMCSK Comcast Corp Update 5/29/2009 $13.00 $49.88 283.69%
DBD Diebold Inc Update 5/29/2009 $24.72 $33.01 33.54%
WEN The Wendy's Co New 6/30/2009 $4.00 $8.72 118.00%
HNZ H. J. Heinz Company Update 6/30/2009 $35.70 $72.50 103.08%
HD Home Depot Inc Update 6/30/2009 $23.63 $82.34 248.46%
ELY Callaway Golf Company New 10/2/2009 $7.32 $8.43 15.16%
ISCA International Speedway Corporation New 10/2/2009 $27.09 $35.45 30.86%
MAR Marriott International Inc New 10/2/2009 $25.61 $54.63 113.30%
POOL Pool Corp New 10/2/2009 $21.38 $58.14 171.94%
BK Bank of New York Mellon Corp Update 10/30/2009 $26.66 $34.94 31.06%
BR Broadridge Financial Solutions Inc Update 10/30/2009 $20.81 $39.52 89.91%
CVC Cablevision Systems Corp Update 10/30/2009 $22.96 $49.35 114.95%
AOL AOL Inc New 1/28/2010 $23.37 $41.63 78.11%
IILG Interval Leisure Group Inc New 1/28/2010 $12.79 $30.91 141.66%
DFS Discover Financial Services Update 1/28/2010 $13.51 $55.95 314.14%
EPHC Epoch Holding Corporation New 2/26/2010 $10.20 $30.25 196.57%
KRFT Kraft Foods Group Inc New 2/26/2010 $28.43 $53.09 86.74%
DIS Walt Disney Co Update 2/26/2010 $31.24 $76.40 144.56%
MSG The Madison Square Garden Co New 3/30/2010 $21.91 $57.58 162.80%
AMP Ameriprise Financial Inc Update 3/30/2010 $45.27 $115.05 154.14%
TRV Travelers Companies Inc Update 3/30/2010 $53.93 $90.54 67.88%
BAC Bank of America Corp New 4/28/2010 $17.78 $15.57 -12.43%
WTW Weight Watchers International Inc New 4/28/2010 $26.67 $32.93 23.47%
MDP Meredith Corp Update 4/28/2010 $36.26 $51.80 42.86%
ASCMA Ascent Capital Group Inc New 5/28/2010 $26.49 $85.56 222.99%
GRMN Garmin Ltd New 5/28/2010 $33.58 $46.19 37.55%
PLL Pall Corp Update 5/28/2010 $34.05 $85.35 150.66%
CLX The Clorox Co Update 6/29/2010 $62.73 $92.76 47.87%
PLA Playboy Enterprises, Inc Update 6/29/2010 $4.08 $6.15 50.74%
WU Western Union Co Update 6/29/2010 $14.94 $17.25 15.46%
SYY Sysco Corp New 9/15/2010 $29.01 $15.99 -44.88%
WM Waste Management Inc New 9/15/2010 $34.53 $105.08 204.32%
MHFI The McGraw-Hill Companies, Inc New 9/15/2010 $30.29 $55.69 83.86%
TAP Molson Coors Brewing Co New 9/15/2010 $45.13 $56.15 24.42%
MKC McCormick & Company Inc New 9/15/2010 $40.95 $68.92 68.30%
BMS Bemis Company Inc New 9/15/2010 $31.09 $40.96 31.75%
SNA Snap-On Inc New 9/15/2010 $45.51 $109.52 140.65%
WDFC WD-40 Company New 9/15/2010 $36.28 $74.68 105.84%
LH Laboratory Corporation of America Holdings New 10/28/2010 $81.32 $91.37 12.36%
CMCSK Comcast Corp Update 10/28/2010 $19.59 $49.88 154.62%
WEN The Wendy's Co Update 10/28/2010 $4.64 $8.72 87.93%
CSCO Cisco Systems Inc New 1/27/2011 $21.44 $22.43 4.62%
HBI Hanesbrands Inc New 1/27/2011 $22.46 $70.27 212.87%
NFLX Netflix Inc New-Pair Trade 1/27/2011 $210.87 $368.17 74.60%
TWX Time Warner Inc New-Pair Trade 1/27/2011 $32.31 $69.72 115.78%
YHOO Yahoo! Inc New 2/28/2011 $16.40 $40.44 146.59%
DBD Diebold Inc Update 2/28/2011 $35.16 $33.01 -6.11%
MDS Midas, Inc Update 2/28/2011 $7.71 $11.50 49.16%
CVS CVS Caremark Corp New 3/30/2011 $33.64 $71.57 112.75%
TRMK Trustmark Corp Update 3/30/2011 $23.28 $26.84 15.29%
IILG Interval Leisure Group Inc Update 3/30/2011 $16.30 $30.91 89.62%
CVC Cablevision Systems Corp Update 4/29/2011 $35.23 $34.96 -0.77%
EPHC Epoch Holding Corporation Update 4/29/2011 $17.34 $30.25 74.45%
ISCA International Speedway Corporation Update 4/29/2011 $30.60 $35.45 15.85%
HEK Heckmann Corporation New 5/31/2011 $60.00 $16.79 -72.02%
6

Companies profiled in Asset Analysis Focus since 2009
Ticker Company Review Type Date of Issue Price at Date Current Price Δ Price (%)
HD Home Depot Inc Update 5/31/2011 $36.28 $82.34 126.96%
MSG The Madison Square Garden Co Update 5/31/2011 $27.51 $57.58 109.31%
SMG Scotts Miracle-Gro Co New 6/28/2011 $51.49 $62.22 20.84%
ELY Callaway Golf Company Update 6/28/2011 $6.34 $8.43 32.97%
HNZ H. J. Heinz Company Update 6/28/2011 $53.13 $72.49 36.44%
EFX Equifax Inc New 9/13/2011 $31.01 $69.09 122.80%
MHK Mohawk Industries Inc New 9/13/2011 $44.04 $148.90 238.10%
WSO Watsco Inc New 9/13/2011 $57.25 $88.96 55.39%
WHR Whirlpool Corp New 9/13/2011 $53.27 $156.86 194.46%
CPB Campbell Soup Co New 10/31/2011 $33.25 $43.28 30.17%
EXPE Expedia Inc New 10/31/2011 $26.26 $76.77 192.33%
PLL Pall Corp Update 10/31/2011 $51.17 $85.35 66.80%
CORE Core-Mark Holding Company, Inc New 1/31/2012 $40.61 $75.93 86.97%
XYL Xylem Inc New 1/31/2012 $25.91 $34.60 33.54%
BK Bank of New York Mellon Corp Update 2/29/2012 $22.11 $34.94 58.03%
LH Laboratory Corporation of America Holdings Update 2/29/2012 $89.89 $91.37 1.65%
LINTA Liberty Interactive Corp Update 2/29/2012 $18.76 $36.97 97.09%
ENR Energizer Holdings Inc New 3/30/2012 $74.18 $108.24 45.92%
LYV Live Nation Entertainment Inc New 3/30/2012 $9.40 $19.76 110.21%
TAP Molson Coors Brewing Co Update 3/30/2012 $45.23 $56.15 24.14%
WDFC WD-40 Company Update 3/30/2012 $45.35 $74.68 64.67%
PLOW Douglas Dynamics, Inc New 4/30/2012 $14.13 $16.82 19.04%
MDP Meredith Corp Update 4/30/2012 $28.83 $51.80 79.67%
CVC Cablevision Systems Corp Update 5/30/2012 $11.43 $17.93 56.87%
ELY Callaway Golf Company Update 5/30/2012 $5.50 $8.43 53.27%
DELL Dell Inc Update 5/30/2012 $12.56 $13.86 10.35%
DVN Devon Energy Corp New 6/28/2012 $56.85 $61.87 8.83%
POST Post Holdings Inc New 6/28/2012 $30.85 $49.27 59.71%
HBI Hanesbrands Inc Brief Update 6/28/2012 $27.13 $70.27 159.01%
PLL Pall Corp Brief Update 6/28/2012 $53.06 $85.35 60.86%
SMG Scotts Miracle-Gro Co Brief Update 6/28/2012 $40.42 $62.22 53.93%
BBBY Bed Bath & Beyond Inc New 9/12/2012 $69.77 $80.30 15.09%
DOLE Dole Food Company, Inc New 9/12/2012 $14.07 $13.50 -4.05%
LMCA Liberty Media Corporation New 9/12/2012 $102.52 $175.53 71.22%
VIA Viacom Inc New 9/12/2012 $50.81 $87.77 72.74%
DTV DirecTV New 10/31/2012 $51.14 $69.06 35.04%
LM Legg Mason Inc New 10/31/2012 $25.48 $43.48 70.64%
WM Waste Management Inc Update 10/31/2012 $32.74 $44.87 37.05%
TYC Tyco International Ltd New 1/29/2013 $30.51 $41.04 34.51%
VIV.PA Vivendi S.A. New 1/29/2013 $16.02 $19.16 19.60%
WU Western Union Co Update 1/29/2013 $14.06 $17.25 22.69%
DOLE Dole Food Company, Inc Brief Update 2/27/2013 $11.26 $13.50 19.89%
ISCA International Speedway Corporation Brief Update 2/27/2013 $30.57 $35.45 15.96%
KSS Kohl's Corp New 2/27/2013 $46.62 $56.75 21.73%
RGC Regal Entertainment Group New 2/27/2013 $15.60 $19.45 24.68%
LYV Live Nation Entertainment Inc Brief Update 3/28/2013 $12.37 $19.76 59.74%
SPLS Staples Inc New 3/28/2013 $13.42 $15.89 18.41%
TAP Molson Coors Brewing Co Brief Update 3/28/2013 $48.93 $56.15 14.76%
WTW Weight Watchers International Inc Update 3/28/2013 $42.11 $32.93 -21.80%
COH Coach Inc New 4/29/2013 $58.27 $56.13 -3.67%
CORE Core-Mark Holding Company, Inc Update 4/29/2013 $52.36 $75.93 45.02%
XYL Xylem Inc Update 4/29/2013 $28.25 $34.60 22.48%
CROX Crocs Inc New 5/31/2013 $17.64 $15.92 -9.75%
DFS Discover Financial Services Update 5/31/2013 $47.41 $55.95 18.01%
WRB W. R. Berkley Corp New 5/31/2013 $40.97 $43.39 5.91%
DVN Devon Energy Corp Update 6/27/2013 $52.36 $61.87 18.16%
LINTA Liberty Interactive Corp Update 6/27/2013 $22.81 $29.35 28.67%
SMG Scotts Miracle-Gro Co Update 6/27/2013 $48.27 $62.22 28.90%
STZ Constellation Brands, Inc. New 9/16/2013 $58.82 $70.38 19.65%
SCHW The Charles Schwab Corporation New 9/16/2013 $22.08 $26.00 17.75%
SLM SLM Corporation New 9/16/2013 $24.83 $26.28 5.84%
VMC Vulcan Materials New 9/16/2013 $52.35 $59.42 13.51%
WB.T Whistler Blacomb Holdings, Inc. New 10/31/2013 $14.50 $16.38 12.97%
DTV DirecTV Update 10/31/2013 $62.49 $69.06 10.51%
LM Legg Mason Inc. Update 10/31/2013 $38.47 $43.48 13.02%
Performance includes special dividends and spinoffs but not regular dividends. Past performance is no guarantee of future results. These results are unaudited. The results are as of December 2013. Stocks profiled less than one year ago are not annualized.
7

September 16, 2013 Volume XXXIX, Issue VII & VIII
The Charles Schwab Corporation
NASDAQ: SCHW
Dow Jones Indus: 15,494.78
S&P 500: 1,697.60 Russell 2000: 1,056.25 Trigger: Yes Index Component: S&P 500 Type of Situation: Business Value, Consumer Franchise
Introduction
“The Coiled Spring Remains Intact.”
– Charles Schwab CEO Walt Bettinger April 25, 2013 during Schwab’s Business Update
This is not your father’s discount broker. By all accounts, the Charles Schwab brokerage firm upstart that successfully challenged the full service brokerage model during the early 1970s bears little resemblance to the current Company. Over the past two decades, Schwab has successfully transformed its business model from commission dependent to one that derives the vast majority of its revenues and profitability from either fee based or spread based businesses.
At June 30, 2013, asset management and administration fees (43% of 2Q 2013 net revenues) and net interest revenue (35%) accounted for nearly 80% of Schwab’s total net revenues. Meanwhile, transactional based revenues including equity commissions now represent just 17% of total net revenues, down from 60% as recently as 1998. While a portion of the Company’s changing mix reflects ongoing commission rate pressures, the strength of Schwab’s asset gathering abilities should not be understated. Over the past 15 years, SCHW’s total client assets have increased from $491 billion to $2.1 trillion, representing a 10% CAGR.
Price: $ 22.08 Shares Outstanding (MM): 1,282 Fully Diluted (MM) (% Increase): 1,288 (0.5%) Average Daily Volume (MM): 8.9
Market Cap (MM): $ 28,439 Enterprise Value (MM): $ 23,835 Percentage Closely Held: Charles Schwab: 14.1%
52-Week High/Low: $ 22.69/12.50 5-Year High/Low: $ 24.09/10.75
Trailing Twelve Months Price/Earnings: 33.4x Price/Stated Book Value: 2.9x
Long Term Debt (MM): $ 1,630 Implied Upside to Estimate of Intrinsic Value: 45%
Dividend: $ 0.24 Yield: 1.1%
Net Revenue Per Share: TTM: $ 3.93 2012: $ 3.83 2011: $ 3.82 2010: $ 3.56
Earnings Per Share: TTM $ 0.66 2012: $ 0.69 2011: $ 0.70 2010: $ 0.38
Fiscal Year Ends: Company Address: Telephone: CEO/President:
December 31 211 Main Street San Francisco, CA 94105 415-667-7000 Walter W. Bettinger
Clients of Boyar Asset Management, Inc. do not own shares of the Charles Schwab Corporation common stock.
Analysts employed by Boyar’s Intrinsic Value Research LLC do not own shares of SCHW common stock.
8

The Charles Schwab Corporation
New assets entering Schwab’s various platforms are increasingly generating fees for the Company
based on asset levels rather than commissions. Between 2009 and 2012, the Company’s asset management and administration fees (excluding money market fund fees) increased to $1.7 billion from $1.1 billion representing a 17% CAGR. It should also be noted that nearly half of Schwab’s total client assets ($980 billion out of $2.1 trillion) at 2Q 2013 were receiving some type of ongoing advice. The vast majority of these advice assets were generating an ongoing revenue stream for the Company. In addition to Schwab’s asset gathering success, the Charles Schwab Bank, which was launched in 2003, has seen deposits explode contributing to a nearly 3 fold increase in interest earning-assets over the past 5 years to ~$128 billion as of June 30, 2013. While lower trading volumes and competitive pressures have impacted the Company’s traditional brokerage business, the decline in commission revenues has been more than offset by higher fee and spread based revenues.
We believe Charles Schwab will be a primary beneficiary of what we view as a rising interest rate environment in the coming years. As we detailed in the introduction of this 2013 Summer Double Issue entitled “Stocks That Should Benefit from a Domestic Recovery and Higher Inflation,” we believe that interest rates are poised to increase markedly in a post-Bernanke world. The unprecedented low interest rate environment has been particularly challenging for Schwab and has masked the Company’s true earnings power. Approximately 75% of the Company’s interest-earning assets are currently tied to short term rates. In addition to the pressure on net interest revenue (net interest revenues have increased only modestly despite a 3 fold increase in interest-earning assets over the past 5 years), low interest rates have forced the Company to provide fee waivers for its money market funds in order for investors in these products to earn a satisfactory (read: positive) return from these vehicles. During 2012, money market fund fee waivers totaled a whopping $587 million, representing nearly 30% of the Company’s asset management and administration fees. While fee waivers have pressured earnings in recent years, we would not be surprised if this headwind soon pivots to a tailwind. It should be noted that the foregone fees represent a high margin revenue stream for the Company. As a result, as interest rates begin to increase this revenue component should experience a significant acceleration in earnings and have a disproportionate impact on SCHW’s overall profitability.
In the wake of the financial crisis with many of its competitors in a weakened financial position, Schwab made a strategic decision to continue to invest in its client capabilities. It’s hard to argue that this was not the right decision. The Company’s customer loyalty and customer satisfaction are currently at record levels with Schwab garnering the top spot once again (for three straight years) in 2012 by the American Customer Satisfaction Index. Between 2008 and 2012, Schwab attracted $500 billion in assets, which is $200 billion more than its top four publicly traded competitors combined. While expenses continued to remain elevated, tracking in-line with revenue growth in recent years, management recently stated that expense growth during 2014 should be ―muted‖ and trail revenue growth by ~300 to 500 bps. We believe this outlook is realistic reflecting Schwab’s asset gathering progress and interest rate outlook coupled with the Company’s disciplined expense management as the low interest rate environment has persisted. For example, during 2012, Schwab realized approximately ~$80 million of annual expense savings.
There are a number of items that should allow Schwab to accelerate growth in the coming years including organic growth initiatives, strategic acquisitions, increased market share from the wirehouses and reversal of fund flows in favor of higher margin equity products. During 2012, the Company launched Schwab Index Advantage to become a much greater participant in the $5 trillion 401(k) market by offering low cost mutual funds as well as professional advice. Recent results have been encouraging as Schwab was able to attract $4 billion from 50 employers in just its first year. Schwab’s recent decision to offer a marketplace of commission free ETFs should also help accelerate fee based revenues. While Schwab foregoes a commission payment, it now generates an attractive long-term recurring revenue stream tied to asset levels. Schwab’s 2011 acquisition of Windhaven has proven to be a home run with assets under management rising to $17 billion from $4 billion subsequent to the acquisition. Windhaven utilizes primarily ETF securities in managing its three strategies. In 2012, Schwab acquired ThomasPartners, which manages dividend oriented portfolios. We believe that ThomasPartners’ products will be increasingly sought after by investors. Finally, we believe that equity funds should begin to garner net inflows following 6 straight years of outflows. During the first eight months of 2013, Schwab experienced $3.4 billion and $1.6 billion of inflows into large cap and small/mid cap funds, respectively including inflows in 6 of the first 8 months. We would not be surprised if equity funds should continue to experience net inflows, which should have a positive impact on Schwab’s profitability due to the higher fees Schwab receives from equity funds compared with bond funds.
9

The Charles Schwab Corporation
Schwab is well capitalized and is poised to return a significant amount of value to shareholders during a
more normalized interest rate environment, in our view. At June 30, 2013, Schwab Bank boasted a Tier 1 Risk-Based Capital ratio of 18.6%, well above the 6% level deemed to be well capitalized. While the unfavorable interest rate environment has created its share of headwinds, the Company has taken advantage of historically low rates to secure capital at attractive rates. We would not be surprised if Schwab boosts its dividend or returns a significant amount of value to shareholders through share buybacks as soon as the Company receives more clarity on future capital requirements.
Based on our sum of the parts valuation, our estimate of Schwab’s intrinsic value is $32 a share, representing 45% upside from current levels. We would not be surprised if this is conservative, especially as the Company’s true earnings power emerges. In addition, we would not rule out the potential for a takeout. Company founder Charles Schwab is 75 years old and controls over 14% of the stock. We believe the Company’s fee based business would be attractive for a number of large financial institutions.
Business Description
The Charles Schwab Corporation operates as a holding Company that provides a number of services including securities brokerage, banking, money management and financial advisory through its various subsidiaries. At June 30, 2013, Schwab held $2.05 trillion in client assets, maintained 9 million active brokerage accounts, had 910k banking accounts and served 1.6 million corporate retirement plan participants. The Company’s major sources of revenues are derived from asset management and administration fees, net interest revenue and trading revenue. The following provides a breakdown of SCHW’s total net revenues by source at December 31, 2012:
Schwab Sources of Revenue 2012 ($MM)
Other - Net
$256
5%
Trading
Revenue
$868
18%
Asset Mgmt. &
Admin. Fees
$2,043
41%
Net Interest
Revenue
$1,764
36%
Note: Excludes $16 million deduction for provision for loan losses and $32 million reduction due to impairment losses on securities.
The Company provides financial services to individuals through two reportable segments including
Investor Services and Advisor Services. During the first quarter of 2013, SCHW realigned its reportable segments due to organizational changes. The segment formerly known as Institutional Services was renamed Advisor Services. In addition, the Retirement Plan Services and Corporate Brokerage Services business units are now part of the Investor Services segment. Under the new segment reporting, the Investor Services segment now accounts for 75% of Schwab’s total net revenues (66% under the old classification) while the Advisor Services business represents 23% of total net revenues (32% previously). The following provides a breakdown of client assets by business:
Total Net Revenues $4,931 MM
10

The Charles Schwab Corporation
Client Assets by Business ($MM)
Investor
Services
$1,151
56%
Advisor
Services
$900
44%
Investor Services – The Investor Services segment provides retail brokerage and banking services to individual investors, retirement plan services, and corporate brokerage services. The following illustrates the components and trends of revenue within the Investor Services segment:
Investor Services
Year Ended December 31, 2010 2011 2012 Growth Rate
2011-2012
Net Revenues Asset management and
administration fees $ 1,275 $ 1,357 $ 1,436 6% Net interest revenue 1,363 1,542 1,559 1% Trading revenue 598 667 612 (8%) Other – net 80 98 123 26% Provision for loan losses (24) (16) (15) (6%) Net impairment losses on securities (34) (29) (29) -
Total net revenues 3,258 3,619 3,686 2%
Expenses Excluding Interest 2,331 2,569 2,693 5%
Income before taxes on income $ 927 $ 1,050 $ 993 (5%)
Income before taxes on income margin 28.5% 29.0% 26.9%
Source: SCHW 2012 Annual Report; Reflects new segment classification
Advisor Services – The Advisor Services segment provides custodial, trading, and support services to independent investment advisors. In addition, the Company provides retirement business services to independent retirement plan advisors and recordkeepers whose plan assets are held at Schwab Bank. Notably, Schwab currently holds a 26% market share of advisors which is more than twice the share of its nearest competitor (Fidelity holds an ~12% market share). At June 30, 2013, Schwab served 7,000 advisors representing ~$900 billion in assets comprised of over 2 million active accounts. The following illustrates the components and trends of revenue within the Advisor Services segment:
Total Client Assets $2,051 MM
11

The Charles Schwab Corporation
Advisor Services
Year Ended December 31, 2010 2011 2012 Growth Rate
2011-2012
Net Revenues Asset management and
administration fees $ 547 $ 571 $ 607 6% Net interest revenue 161 183 205 12% Trading revenue 232 260 255 (2%) Other – net 55 62 62 - Provision for loan losses (3) (2) (1) (50%) Net impairment losses on securities (2) (2) (3) 50%
Total net revenues 990 1,072 1,125 5%
Expenses Excluding Interest 694 731 739 1%
Income before taxes on income $ 296 $ 341 $ 386 13%
Income before taxes on income margin 29.9% 31.8% 34.3%
Source: SCHW 2012 Annual Report; Reflects new segment classification
Schwab’s Business Model Transformation – Good Growth in Fee Based Revenues
Charles Schwab, which celebrates its 40th anniversary during 2013, barely resembles the upstart that
challenged the full service brokerage industry beginning in the early 1970s. A significant contributor to the Company’s changing business model was the 1992 introduction of Schwab’s Mutual Fund OneSource, a no transaction fee mutual fund service. Mutual Fund OneSource followed on the heels of the 1984 launch of Schwab’s Mutual Fund Marketplace, which offered load and no load funds with a transaction fee. By December 31, 1993, Mutual Fund OneSource enabled customers to trade over 200 mutual funds in 25 well-known fund families without incurring brokerage transaction fees. At year end 1993, assets associated with Mutual Fund OneSource purchases totaled $8.3 billion. The following provides a summary of major OneSource milestones.
Mutual Fund OneSource Milestones
1992 1997 2002 2012
(March)
Fund Companies 8 125 221 430+
Funds 80+ 800+ 1,000+ 4,000+
Mutual Fund OneSource Assets $1.6 Billion $57 Billion $84 Billion $214 Billion
Simplifying the mutual fund investing process was the brainchild of the Company’s founder who was overwhelmed with the paperwork (multiple 1099s and fund company statements) and frustrated with the slow process associated with his direct investments in 8-10 mutual funds of several fund families. While the fund platform offered investors many benefits, the addition of a high margin recurring revenue stream based on asset levels rather than commissions was a boon to Schwab’s business model. In our view, Schwab’s business model continues to strengthen as the Company derives an increasing amount of its profitability from fee-based sources. As of June 30, 2013, nearly half of Schwab’s client assets ($980 billion out of $2.1 trillion) were receiving some type of ongoing advice up from $789 billion in advice-based assets at the end of 2011. The vast majority of these advice assets are generating an ongoing revenue stream for the Company based on asset levels. Thanks to the growth in Schwab’s fee-based businesses, commission revenues now represent just 17% of total net revenues down from approximately 60% as recently as 1998.
12

The Charles Schwab Corporation
Source: Company presentation, July 2013
To be sure, part of the decline in commission revenues reflects the competitive pressures within the
brokerage industry. In addition, in recent years, commission revenues have been impacted by lower client trading volumes. It should be noted, however, that the decline in commission revenues has been more than offset by increases in both asset management and administration fees, and net interest revenues. Schwab Bank, which launched in 2003, has been a major contributor to the growth in net interest revenues, which have more than doubled to $1.8 billion at year end 2012 from $825 million at the end of 2002. While commission revenues have been under pressure, management expects commission revenues to be a source of growth, albeit modest (low single digit rate), going forward and are expected to increase in line with client acquisitions and new account formations.
Net Revenues 2002-2012 by Primary Source ($MM)
2002 2003 2004 2005 2006 2007 2008 2009 2010 2011 2012
Asset Mgmt. & Admin. Fees $1,753 $1,832 $2,091 $2,269 $1,945 $2,358 $2,355 $1,875 $1,822 $1,928 $2,043
Net Interest Revenues $825 $728 $936 $1,022 $1,434 $1,647 $1,665 $1,245 $1,524 $1,725 $1,764
Trading Revenues $1,135 $1,097 $936 $778 $785 $860 $1,080 $996 $830 $927 $868
Note: excludes other net, provision for loan losses and net impairment losses on securities
Although asset management and administration fees have expanded subsequent to the financial crisis, their true run rate is being masked by fee waivers the Company is offering for investors in certain of its money market funds. During 2012, Schwab’s money market fund fee waivers were a whopping/record $587 million, accounting for nearly 30% of the Company’s reported asset management and administration fees. As soon as short interest rates begin to increase, the current headwind from the waivers will likely pivot to a meaningful tailwind, allowing Schwab to experience significant earnings acceleration.
13

The Charles Schwab Corporation
Asset Management and Administration Fees Composition ($MM)
2009 2010 2011 2012 % Change 2009-2012
2012 Average
Fee
Schwab MMF before Fee Waivers $1,011 $865 $865 $891 -11.9% 0.57%
Fee Waivers ($224) ($433) ($568) ($587)
Schwab MMF after Fee Waivers $787 $432 $297 $304 -61.4% 0.20%
Equity and Bond Funds $108 $114 $118 $125 15.7% 0.26%
Mutual Fund OneSource $446 $608 $680 $680 52.5% 0.31%
Total Mutual Funds $1,341 $1,154 $1,095 $1,109 -17.3% 0.26%
Advice Solutions $278 $384 $522 $580 108.6% 0.48%
Other $256 $284 $311 $354 38.3%
Asset Management and Administration Fees $1,875 $1,822 $1,928 $2,043 9.0% Trading revenues $996 $830 $927 $868
3-Year CAGR
Asst Mgmt & Admin Fees (ex Money Market Funds) $1,088 $1,390 $1,631 $1,739 16.9%
It is also worth noting the growth in advice solutions revenues within the asset management and administration fees category. Advice solutions, which encompasses a wide range of products including separately managed accounts, has been the fastest growing component of revenue within the category and now represents 28% of total category revenues up from 15% in 2009. Furthermore, advice solutions assets commanded the highest average fee (48bps) after adjusting for the waivers on the Company’s money market funds. With new advice products commanding significantly higher management fees (Windhaven, ThomasPartners, etc., discussed in greater detail in a later section) than some of SCHW’s legacy programs (Schwab advisor network @ ~ 20 bps), we would expect the average fee on these assets to expand going forward.
Schwab’s Net Interest Revenues – Levered to a Recovery in Short-Term Interest Rates
“And I guess no conversation with Schwab management would be complete without reinforcing the fact that we retain all of the significant upside in our revenue and earnings in a rising interest rate world. The coiled spring remains intact. Our managerial discipline with respect to expenses remains intact. And of course our ability to organically grow the franchise also remains intact.”
– Charles Schwab CEO Walt Bettinger during April 2013 Business Update
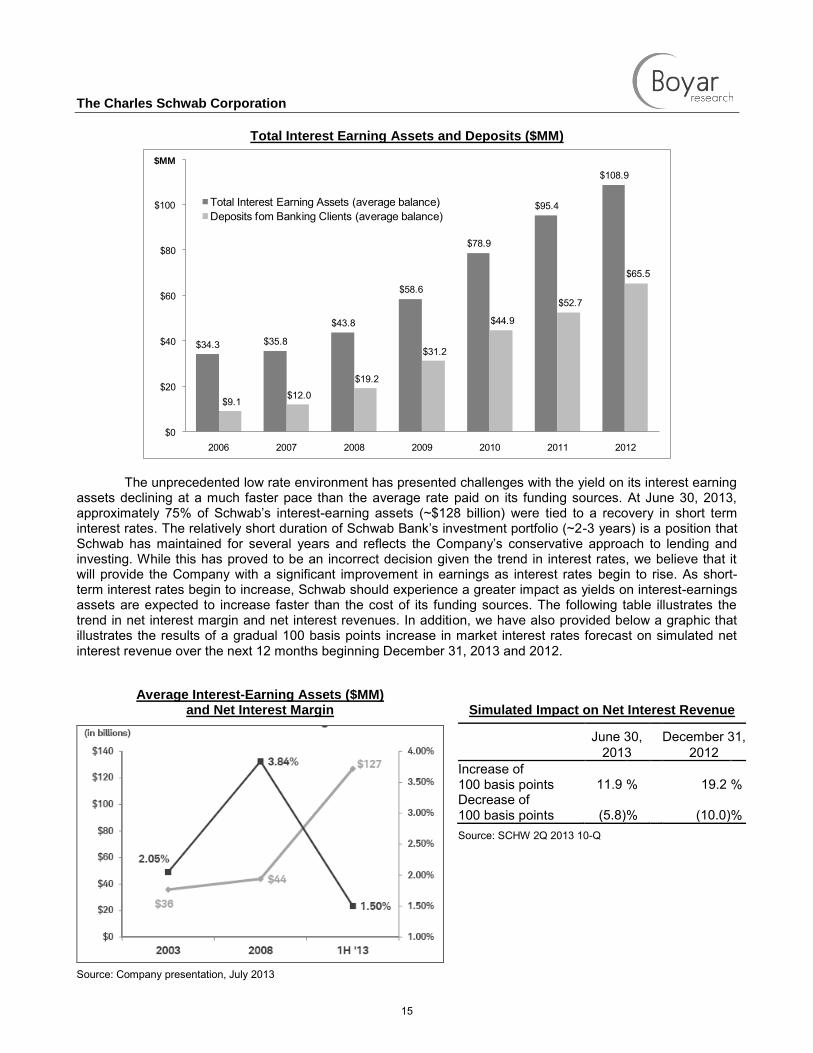
In addition to the pressure on fee based revenues from the low interest rate environment noted above, Schwab’s net interest revenues (35% of total net revenues) have also been impacted. While net interest revenues have increased subsequent to the downturn thanks to good growth in interest earning assets (+14% CAGR over the past 10 years), their true run rate has been masked by the ongoing compression in net interest margin. The following chart illustrates the growth in Schwab’s interest-earning assets and deposits.
14
The Charles Schwab Corporation
Total Interest Earning Assets and Deposits ($MM)
$34.3 $35.8
$43.8
$58.6
$78.9
$95.4
$108.9
$9.1 $12.0
$19.2
$31.2
$44.9
$52.7
$65.5
$0
$20
$40
$60
$80
$100
$120
2006 2007 2008 2009 2010 2011 2012
$MM
Total Interest Earning Assets (average balance)
Deposits fom Banking Clients (average balance)
The unprecedented low rate environment has presented challenges with the yield on its interest earning
assets declining at a much faster pace than the average rate paid on its funding sources. At June 30, 2013, approximately 75% of Schwab’s interest-earning assets (~$128 billion) were tied to a recovery in short term interest rates. The relatively short duration of Schwab Bank’s investment portfolio (~2-3 years) is a position that Schwab has maintained for several years and reflects the Company’s conservative approach to lending and investing. While this has proved to be an incorrect decision given the trend in interest rates, we believe that it will provide the Company with a significant improvement in earnings as interest rates begin to rise. As short-term interest rates begin to increase, Schwab should experience a greater impact as yields on interest-earnings assets are expected to increase faster than the cost of its funding sources. The following table illustrates the trend in net interest margin and net interest revenues. In addition, we have also provided below a graphic that illustrates the results of a gradual 100 basis points increase in market interest rates forecast on simulated net interest revenue over the next 12 months beginning December 31, 2013 and 2012.
Average Interest-Earning Assets ($MM)
and Net Interest Margin
Simulated Impact on Net Interest Revenue
Source: Company presentation, July 2013
June 30, December 31,
2013 2012
Increase of 100 basis points 11.9 % 19.2 % Decrease of 100 basis points (5.8) % (10.0) %
Source: SCHW 2Q 2013 10-Q
15

The Charles Schwab Corporation
It’s not a big surprise that net interest revenues have been impacted amidst this environment given the
compression in net interest margin. However, it is worth noting that the pressure on net interest revenue has occurred even as total earning assets experienced strong growth (up nearly 3-fold over the past five years). While bears may state that the Company is currently posting sub optimal returns, we would argue that the Company’s growth in total earning assets is being overlooked and normalized earnings power is far greater than current levels of profitability. As illustrated in the table below, Schwab’s run rate earnings based on its current assets and in a more normalized Fed Funds rate (Fed Funds rate of 2%, which was experienced in 2Q 2008) is significantly higher than recent reported earnings.
Schwab’s Incremental Earnings Power
Source: Company presentation, February 2013
Utilizing Schwab’s hypothetical 4Q 2012 earnings of $0.43 a share, which includes Schwab’s estimated
incremental earnings in a 2% Fed Funds environment, translates to run-rate annual earnings in excess of $1.70 a share. In our view, even this earnings level likely understates the Company’s true earnings power as it does not reflect the potential for future asset growth and the Company’s ongoing progress in gathering an increasing amount of assets in fee based accounts. While we are under no illusion that the current Fed Fund rate will immediately return to 2008 levels, we believe that an increase should begin to occur in the not too distant future, especially as Fed intervention winds down.
A Closer Look at Schwab Bank’s Lending and Bank Investment Portfolio
Given the rapid growth in Schwab’s interest-earning assets, it is worth taking a closer look at the Company’s lending and investment portfolio. The following table illustrates Schwab’s loan growth and quality metrics.
SCHW Loan Quality Metrics as a % of Outstanding Loans
2007 2008 2009 2010 2011 2012
Total Loans to Banking Clients ($MM) $3,450 $6,062 $7,391 $8,773 $9,866 $10,782
Growth rate (%) 47.6% 75.7% 21.9% 18.7% 12.5% 9.3%
Loan Delinquencies 0.80% 0.54% 0.87% 0.96% 0.81% 0.77%
Non-accrual loans 0.12% 0.13% 0.46% 0.58% 0.53% 0.45%
Allowance for loan losses 0.20% 0.33% 0.61% 0.60% 0.55% 0.52%
16

The Charles Schwab Corporation
It should be noted that a large amount of the increase in the lending portfolio occurred in the wake of the
financial crisis. Accordingly, given Schwab’s conservative lending standards, the Company has been afforded the opportunity to make extremely attractive loans in recent years, in our view. At June 30, 2013, the weighted-average estimated current LTV ratios were 55% and 63% for Schwab’s First Mortgage and HELOC loan portfolios, respectively. In addition, the weighted-average updated FICO scores were very strong and stood at 770 for the First Mortgage portfolio and 767 for the HELOC portfolio. The conservative nature of the Company’s loan portfolio is also reinforced by modest delinquency rates compared with the industry.
30-Day+ Delinquency Trend - Schwab vs. Industry
Source: Company presentation, July 2013
In addition to managing its loan portfolio in a conservative manner, the Company has continued to manage its bank investment portfolio prudently. At June 30, 2013, all of the corporate debt securities and non-mortgage asset-backed securities were rated investment grade or higher. The following provides a breakdown of Schwab Bank’s investment portfolio:
Schwab Bank’s Securities Portfolio
Amortized
Gross Unrealized
Gross Unrealized Fair
June 30, 2013 Cost Gains Losses Value
Securities available for sale:
U.S. agency mortgage-backed securities $ 18,422 $ 202 $ 16 $ 18,608
Asset-backed securities 11,895 21 77 11,839
Corporate debt securities 8,306 39 26 8,319
Certificates of deposit 4,915 7 1 4,921
U.S. agency notes 3,740 - 105 3,635
Non-agency residential mortgage-backed securities 700 5 54 651
Commercial paper 160 - - 160
Other securities 272 9 - 281
Total securities available for sale $ 48,410 $ 283 $ 279 $ 48,414
Securities held to maturity:
U.S. agency mortgage-backed securities $ 24,887 $ 184 $ 643 $ 24,428
Other securities 931 - 71 860
Total securities held to maturity $ 25,818 $ 184 $ 714 $ 25,288
Source: SCHW 2Q 2013 10-Q
17

The Charles Schwab Corporation
Growth Investments Also Masking Schwab’s Operating Leverage
In addition to the reduction in money market fund fees and the pressure on net interest revenues, the operating leverage inherent in Schwab’s business model is also being masked by elevated spending in recent years. While Schwab has reduced costs to reflect the challenging operating/interest rate environment, the Company invested heavily in client capabilities in the wake of the financial crisis in order to drive growth and increase market share as its competitors were in a weakened financial position. For example, during 2012, Schwab invested more than $160 million in client initiatives (following on the heels of $180 million in client related projects during 2011). It’s hard to argue with the results Schwab has posted. Between 2008 and 2012, Schwab’s total assets increased by over $500 billion, which is $200 billion more than the asset growth of all of its four largest publicly-traded peers combined. During 2012, Schwab recorded core net new assets (before one-time flows) of $112 billion, representing a 37% increase over the prior year. Notably, there were $47.8 billion of core net new assets during the fourth quarter (more than double the year earlier level) while December 2012 was a record month in terms of core net new asset growth with $23 billion, ~$5 billion greater than the prior monthly record. While there were some one-time macro events that helped the strong asset growth during 2012 (tax law changes resulted in business divestitures, etc.), the Company’s strong momentum has continued into 2013. During the first half of 2013, core net new assets were up $66 billion, up 54% from the first half of 2012.
Source: Company presentation, July 2013
While Schwab continues to see an opportunity to drive growth, future spending will likely be more muted
in the coming years. Despite increased spending on client initiatives, Schwab’s expenses as a percentage of total client assets has migrated lower over the years notwithstanding an increase during the recent downturn. As part of a multi-year plan Schwab management put together in 2009, the Company’s plan targeted a 9% year over year increase in expenses during 2013 with expenses beginning to moderate during 2014. During the Company’s April 2013 business update, management noted that it now expects that expenses to increase ~7% during 2013 on a year over year basis and management stated that it expects expense growth during 2014 to be ―quite muted.‖ This should translate to revenue growth during 2013 increasing 100-200 basis points above expenses. In April, management noted that during 2014 that gap could be much larger (300 to 500 bps) assuming current trading and interest rate levels. The following chart illustrates Schwab’s expense trends relative to its total assets and compared with its peers. Another chart illustrating Schwab’s expense discipline and operating leverage, is its expense ratio relative to its peers. Schwab boasts a meaningfully lower expense ratio relative to its publicly traded peers and this ratio has declined meaningfully over the past 8 years.
18

The Charles Schwab Corporation
Total Expenses to Client Assets
Source: Company presentation February 2013
Fee Based Growth Opportunities Should Further Strengthen Schwab’s Business Model
In addition to the potential of capturing higher fee based revenues from reduced fee waivers, we believe there are a number of items that could bolster Schwab’s fee based revenues going forward. These items include Schwab’s recently launched 401 (k) plan, new commission free ETF platform, opportunistic advisor acquisitions, and increased market share from full service brokerage firms. The following provides additional details on each of these items that we believe should favorably impact the Company’s fee based revenues.
Schwab Index Advantage and ETF 401(k) Plans – Just as Schwab shook up the traditional brokerage industry during the 70s, the Company is now aiming to become a more meaningful player in the sizable $5 trillion 401(k) market. During 2012, the Company launched Schwab Index advantage, which is a low cost 401 (k) plan offering significant savings for participants compared with traditional plans. A key component of the plan is that it provides index mutual funds with low operating expenses. According to Schwab, members in the Schwab Index Advantage 401(k) plans have seen their weighted average operating expense ratio (OER) decline by 77% to $14.78 per $10,000 compared with a weighted average OER of $65.11 for these plans prior to transitioning. In addition, the program also comes with a low-cost professional, independent advisor service that develops a savings and investment program with the goal of helping participants increase retirement savings. According to Schwab CEO Bettinger, employees receiving customized advice save at twice the rate of employees who do not receive advice (10% of pay vs. 5%). Nearly 90% of the participants in Schwab Index Advantage plans are receiving low-cost, professional, third-party advice to help manage their 401(k) investments. In early 2013, Schwab noted that its Schwab Index Advantage assets were ~$4 billion from 50 employers representing 36,000 participants. During the second half of 2013, Schwab intends to launch an ETF-only 401(k) plan for providers that offer employees the ability to invest in low-cost , index ETFs.
Schwab ETF OneSource – In February 2013, Schwab became the first industry participant to launch a broad-based (funds from multiple firms) commission free ETF platform. ETF OneSource debuted in early 2013 offering the largest number of commission-free ETFs from most of the industry’s largest ETF providers. Schwab is compensated based on an ongoing servicing fee from the advisor based on asset levels. In our view, this arrangement has a number of advantages including further enhancing the company’s fee based revenues. During Schwab’s February 2013 business update Schwab CEO Walt Bettinger stated, “We would much rather be paid basis points on an ongoing basis rather than one-time transactional compensation that historically has been under pressure and could be under significant pressure out in the future.” According to Schwab management, early indications are that the flows into
19

The Charles Schwab Corporation
the ETF OneSource platform are coming out of commission oriented ETFs or commission equities rather cannibalizing Schwab’s Mutual Fund OneSource program. This is important due to the fact the Mutual Fund OnceSource program is arguably more profitable than ETF OneSource. ETF OneSource assets (which includes Schwab ETFs) stood at $12 billion and has increased by $3 billion since the program launch earlier this year.
Advice Based Solutions – Schwab is increasingly generating fee based revenues from its retail asset base. While retail assets have historically generated commission revenues for the Company, retail assets in recent years are generating ongoing fees for the Company tied to some type of advice offering. We believe that this is important and will strengthen Schwab’s business model by generating additional investment management fees and diversifying the Company’s revenue streams. As illustrated in the chart below, 17% (or $138 billion) of Schwab’s retail client assets are now part of a fee based advice offering, up from approximately 5% of assets just 10 years ago. During the first half of 2013 net new flows into advice offers were up 62% compared with the prior year. Management recently stated that it would not be unreasonable for this amount to increase further (to ~34%) over a period of time. Indeed, during Schwab’s July business update CEO Bettinger stated, “We think there is significant room for that number to run.”
Retail Fee-Based Advised Assets
$138
17%
0%
5%
10%
15%
20%
25%
$0
$20
$40
$60
$80
$100
$120
$140
$160
2003 2008 Q2-13
$ B
illi
on
s
Investor Services Advised Assets
Investor Services Advised Assets as a % of Total Retail Assets
Source: Company presentation, July 2013
To further its fee based ambitions, Schwab has made a couple of strategic acquisitions recently
of money management firms with differentiated product offerings. During 2010, Schwab acquired Windward Investment Management (rebranded as Windhaven) during 2010 for $150 million in cash and stock. At the time of the acquisition, Windhaven managed ~$4.24 billion. Windhaven, whose portfolios are comprised of primarily ETF securities, is currently the largest ETF based money manager and manages three strategies including diversified conservative, diversified growth and diversified aggressive. The acquisition has been nothing short of a home run for Schwab as total assets managed by Windhaven have increased nearly fourfold to over $17 billion as of June 2013. In December 2012 Schwab acquired ThomasPartners for $85 million. ThomasPartners, which managed approximately $2.3 billion in equity portfolios, offers a growth-oriented, dividend-focused solution for clients that are looking for income. Windhaven and ThomasPartners should be able to take advantage of Schwab’s strong distribution network. According to data from securities industry researcher Cerulli Associates, assets in separately managed account programs increased at a 12% CAGR between 1999 and 2011 versus 4.6% growth from long-term securities. Cerulli projects separately managed accounts will increase at a 14% CAGR between 2011 and 2015.
20

The Charles Schwab Corporation
Ongoing Market Share Gains from Wire Houses - As we noted above, Schwab has gained a significant amount of market share in recent years relative to full service and discount brokers. We believe that Schwab can continue expanding its market share and there is a large potential universe of assets. At present there is nearly $11 trillion in assets at full commission brokers, which is ~6x the amount of assets at Schwab’s historical discount competitors. Notably, according to a recent survey by Cerulli Associates, nearly two-thirds of wire house investors do not believe that their firm is looking out for their interests. Schwab’s retail affluent assets (clients with $250k+ in assets) have increased to $698 billion from $404 billion between 2005 and the second quarter of 2013 representing a 7% CAGR. We believe that Schwab’s retail asset growth can continue given the Company’s strong level of customer satisfaction. Schwab’s client promoter score (a measure of customer loyalty where anything over 0 is considered good and a ranking over 50 is deemed to be excellent) currently stands at 54 as of the second quarter of 2013, up from 21 in 2005. Schwab believes that its client promoter score is approximately 4 times greater than the typical wire house firm. In addition, in 2012 for the third straight year, Schwab ranked number one in customer satisfaction based upon the results of an independent survey conducted by the American Customer Satisfaction Index. Strong client loyalty and satisfaction is important for attracting new assets due to the fact that 40% of new clients come from referrals from existing clients and 60% of new retail clients do not utilize anyone but Schwab.
Client Promoter Score (CPS) for Affluent Retail Clients(1)
Notes: Client segments based on assets held at Schwab. (1)
2013 Affluent CPS based on weighted average Q4 2012/2013 CPS of clients with $250 K-$1 M and $1 M+ in assets.
Source: Company presentation, July 2013
Shift to Equities from Bonds – Flows out of equity funds are starting to reverse following six straight years of net outflows experienced by the industry. During 2012, industry equity mutual funds experienced approximately $90 billion in net outflows representing the second largest year of outflows on record (in 2008 there was $136 billion of outflows). Schwab has not been immune to the exodus from equity funds, with large cap mutual funds experiencing net outflows over the past 5 years. While the equity mutual fund outflows have been discouraging and have pressured Schwab’s earnings given their relatively higher fees, there is reason to be optimistic that industry conditions are improving. Through the first eight months of 2013, Schwab experienced net inflows into Large and Small/Mid Capitalization funds of $3.4 billion and $1.6 billion respectively, with both segments generating inflows in 6 out of the 8 months.
21

The Charles Schwab Corporation
Mutual Fund Net Buys (Sells)
(1)
(in millions of dollars) 2007
Yr 2008
Yr 2009
Yr 2010
Yr 2011
Yr 2012
Yr
2013
Jan Feb Mar Apr May Jun Jul Aug
Large Capitalization Stock 3,968 (5,967) (1,889) (2,714) (5,281) (7,304) 1,080 236 339 1,069 (233) 213 839 (186)
Small / Mid Capitalization Stock 356 (3,225) 2,103 13 (3,323) (3,720) 746 422 358 (452) (123) 68 402 179
International 9,103 (9,779) 3,255 3,071 (2,007) 3,322 2,714 1,752 1,623 1,149 1,249 850 1,205 1,482
Specialized 286 (2,218) 1,966 703 1,761 733 545 434 453 77 474 120 431 320
Hybrid 9,392 476 4,325 7,772 4,918 3,282 1,205 931 927 637 762 349 583 317
Taxable Bond 8,628 762 31,656 16,633 12,650 27,778 3,402 1,456 2,216 1,884 1,363 (5,150) (705) (2,117)
Tax-Free Bond 1,583 511 7,054 378 (411) 4,275 728 259 53 (539) (264) (1,227) (563) (922)
Money Market Funds 40,467 22,497 (38,882) (16,675) 6,573 6,776 (6,031) (1,610) (945) (3,782) 1,043 5,044 710 1,917
(1)Represents the principal value of client mutual fund transactions handled by Schwab, including transactions in proprietary funds. Includes
institutional funds available only to Investment Managers
Source: Schwab’s Monthly Activity Report- August 2013; SEC Filings
While Investors have begun to exit bond funds, most of these funds have made their way into money market funds, which currently are generating low/reduced fees due to the aforementioned fee waivers. Ultimately, we would not be surprised if these funds made their way into equity mutual funds due to the strong performance commanded by this asset class in recent years. Although we expect bond mutual funds to be pressured in a rising interest rate environment, our conversation with Schwab management revealed that its clients have historically been underrepresented in the fixed income asset class. Utilizing the asset mix of Schwab’s client’s that own individual stocks and bonds as a proxy, fixed income has represented just 24% of Schwab’s assets on a historical basis and now is at the low end of its range (19%). Accordingly, this should minimize the impact from potentially large bond outflows in the coming years.
Fixed Income Securities as a % of Schwab Customer Securities (Equity and Fixed Income)
0%
5%
10%
15%
20%
25%
30%
35%
40%
1Q-0
2
3Q-0
2
1Q-0
3
3Q-0
3
1Q-0
4
3Q-0
4
1Q-0
5
3Q-0
5
1Q-0
6
3Q-0
6
1Q-0
7
3Q-0
7
1Q-0
8
3Q-0
8
1Q-0
9
3Q-0
9
1Q-1
0
3Q-1
0
1Q-1
1
3Q-1
1
1Q-1
2
3Q-1
2
1Q-1
3
Strong Balance Sheet and Capital Position Provides Flexibility to Return Value to Shareholders
While the low interest rate environment has presented a number of challenges for the Company, there have been a few benefits. Schwab has taken advantage of low interest rates and robust credit markets to raise long-term capital at attractive levels.
22

The Charles Schwab Corporation
The following provides a summary of the Company’s recent capital structure activity:
July 2013:
Issued $275 million of 2.2% senior notes that mature in 2018.
2012:
Issued $850 million in preferred stock as part of a low cost non-dilutive way to fund future growth.
Retired $750 million of outstanding 4.95% senior notes due in 2014 through a debt exchange offer and subsequent redemption of the remaining balance. As part of the refinancing, Schwab exchanged $256 million in 4.95% Senior Notes due 2014 for $256 million 3.225% Senior Sotes due 2022. Separately, the Company issued $350 million of 3-year Senior Notes with a 0.85% coupon.
Redeemed all of its $202 million of remaining Trust Preferred securities and the underlying 7.5% Junior subordinated notes as the Federal Reserve’s proposal to phase out those securities for regulatory capital treatment.
SCHW believes that up to approximately 15% of its capital structure could be comprised of preferred securities. This translates to about $500 million of capacity now and management expects that it will grow over time to the extent that retained earnings grow.
Schwab Remains Well Capitalized
In the third quarter of 2012, Schwab reduced its target Tier 1 Leverage Ratio for Schwab Bank from at least 7.5% to at least 6.25%. Schwab attributed the change to its conservative approach to lending and investing, which results in a lower risk profile relative to the industry and risk based capital ratios significantly in excess of well capitalized levels. Commenting on the Company’s leverage level at its July 2013 business update Nigel Murtagh who serves as an EVP, Corporate Risk at Schwab stated, “Certainly we could get down to a 6.25%, 6% [Tier I leverage ratio], and given the quality of the way we manage our balance sheet, we’re able to absorb those significant downturns, and still have a cushion to the regulatory minimums.” Despite the reduced target, we would still expect the Company to continue to maintain excess capital. According to Schwab’s CFO Joe Martinetto during the Company’s February 2013 business update, “And then as a Company we tend to run with a little bit of a buffer to make sure that we are going to stay well in excess of that.” Nevertheless, at June 30, 2013, Schwab Bank boasted a Tier 1 Risk-Based Capital ratio of 18.6%, well above the 6% level deemed to be well capitalized. In addition, Schwab’s net capital was $1.3 billion (10% of aggregate debit balances), which was $1.1 billion in excess of its minimum required net capital and $634 million in excess of 5% of aggregate debit balances. The following provides a summary of Schwab’s capital ratios (Schwab Bank) as of June 30, 2013:
The Regulatory Capital and Ratios for Schwab Bank at June 30, 2013
Minimum Capital Minimum to be
Actual Requirement Well Capitalized
Amount Ratio Amount Ratio Amount Ratio
Tier 1 Risk-Based Capital $ 5,961 18.6 % $ 1,280 4.0 % $ 1,920 6.0 %
Total Risk-Based Capital $ 6,020 18.8 % $ 2,560 8.0 % $ 3,200 10.0 %
Tier 1 Leverage $ 5,961 6.6 % $ 3,637 4.0 % $ 4,546 5.0 %
Tangible Equity $ 5,961 6.6 % $ 1,818 2.0 % N/A
Source: SCHW 2Q 2013 10-Q
Returns to Shareholders Should Accelerate – Sizable Share Repurchases on the Horizon?
Schwab’s strong capital position coupled with its robust balance sheet with $6.2 billion of cash (including $1.1 billion at the parent company) and just $1.6 billion of long term debt position it well to return a significant amount of value to shareholders. In addition, we would expect Schwab to generate a significant amount of excess capital in the coming years as the Company’s true earnings power unfolds. While there may be some near term uncertainty associated with new regulatory capital requirements, we believe Schwab’s current capital buffer provides it with a sizable cushion. During the Company’s April 2013 business update,
23

The Charles Schwab Corporation
CFO Martinetto stated, “And we are, again, very comfortable with our capitalization. The stress test results that we have run internally would indicate that we have got adequate capital for some very severe scenarios that we’ve been able to run. So our comfort with our capital level is very high.”
While the exact timing of an earnings recovery/acceleration is unclear, we believe that returning value to shareholders will become an increased priority as earnings improve and excess capital is generated. CFO Martinetto also stated at the April Business Update, “But should we get to the point where that capital formation is outstripping the need to retain and to support the growth of the business then we will look to return it to shareholders as I think we’ve done it in the past.” Schwab has a solid track record of paying dividends with the Company consistently paying a dividend since it initiated one in 1989 (including 19 increases). While Schwab’s current cash dividend of $0.24 a share on an annual basis is well above targeted net income levels of 20%-30%, we believe there is a good chance that the payout will be increased further as earnings recover. In addition, we would not be surprised if share repurchases and/or special dividends (the Company did pay a $1.00 special dividend in 2007) are utilized for excess capital. Management recently stated that if Schwab gets to the point where capital formation exceeds the amount needed to retain and grow its business then it will return capital to investors as it has done historically.
Money Market Fund Reform Regulatory Pressures Abating
“I think our take is very favorable on what finally came out in money fund reform. We were quite pleased to see some of our ideas incorporated into the proposal. Our belief is, we are heading toward a set of products which will allow us to continue to meet client demand for products like money funds, while continuing to basically preserve the economics of the product set. I think that was all pretty much good news as we saw it evolve.”
– Joe Martinetto CFO of Charles Schwab during July 2013 Business update
The topic of money market reform is an important consideration for Schwab investors. The money market industry has been under great scrutiny in recent years, especially since the Reserve Primary Fund ―broke the buck‖ in September 2008. Some of the initial proposals for money market ―reform‖ called for the complete elimination of the product. Given the importance of money market funds to Schwab’s business model, we believe the uncertainty has created an overhang on Schwab’s stock price. At June 30, 2013, Schwab managed $162 billion in money market funds, and before fee waivers, these funds commanded the highest average fee (~57 bps during the first half of 2013) of the Company’s fee generating assets. In June, the SEC announced two proposals relating to money market reform. The first proposal would require that prime institutional funds, which are considered to be the higher risk funds, have an NAV that fluctuates with daily values compared with a stable $1 NAV. The second proposal would retain the stable NAV for money market funds but impose restrictions on redemptions and charge withdrawal fees during financial turmoil. The SEC noted that it would be amenable to some sort of mixture of the two proposals whereby the floating NAV and the liquidity fees and gates proposals would be combined in a single reform package. While there continues to be uncertainty surrounding money market funds, and there could ultimately be additional capital requirements and expenses associated with the product, we believe an Armageddon scenario is now remote. Further, we believe that Schwab should be able to navigate any increased capital requirement associate with potential regulatory reform.
Valuation and Conclusion
Forecasting the exact timing of a sustained improvement in interest rates is likely a fool’s errand. Nevertheless, as we have detailed in our introduction, we believe that both short and long-term interest rates are poised to increase from currently depressed levels. Longer-term interest rates have begun their ascent in recent months with the 10-year treasury recently recording a multi-year high of ~3.0%, up from near record lows earlier this year at ~1.6%. While Schwab is more levered to a rise in short term rates, which continue to face pressure, we believe they will be set to rise too, especially as quantitative easing winds down and market forces become the primary driver of interest rates going forward. Under a scenario of higher short term rates, the relatively short duration of Schwab’s investment portfolio coupled with the absence of money market fund waivers will likely allow Schwab to experience a significant acceleration in future earnings. The Company’s current forecast for its net interest margin of ~1.5% is well below the ~3.5% NIM just prior to the financial crisis. Meanwhile the Company’s money market fund waivers continue to be at record levels despite the recent ascent of interest
24

The Charles Schwab Corporation
rates reflecting the fact the short rates have actually experienced pressure due to the shift of assets from bonds into shorter duration vehicles.
In determining our estimate of Schwab’s intrinsic value we have valued the Company’s two main segments including Investor Services and Advisor Services based on a percentage of total client assets. We believe that this approach is appropriate reflecting the Company’s asset base, which is increasingly generating recurring fees for the Company. While traditional fee based asset managers have historically commanded valuations in the ~2.5% of AUM level in a takeout scenario, we have applied a discounted multiple to Schwab’s businesses given the Company’s lower fee generation rate as a percentage of client assets. In valuing the Investor Services segment, we have applied a 1.5% multiple to our projected 2015E AUM level. For the Advisors Services segment, we have applied a higher 2.0% multiple to estimated asset levels due to that businesses higher profitability and growth rate. Our projection for client asset growth within Investor Services and Advisor Services is 5% and 7.5%, respectively, which is well below the 10% CAGR for the Company’s total client assets over the past 15 years. Based on our projections, our intrinsic value estimate for Schwab is $32 a share, representing 45% upside from current levels. It should be noted that we have only given the Company credit for $1.1 billion in excess capital, which represents the current amount of cash at the parent company. Given the Company’s strong capital position and earnings potential in a normalized interest rate environment, we believe that Schwab will be in the position to build a meaningful amount of excess capital and return a significant amount of value to shareholders in the coming years. Don’t rule out the potential for a takeout. Founder Charles Schwab is 75 years old and controls over 14% of the Company. We would not be surprised if he decided to sell the business to a strategic acquirer, especially as the Company’s true earnings power emerges. We suspect the Company’s fee based business would be sought after by a number of larger financial institutions.
SCHW – Estimate of Intrinsic Value
Value ($MM)
Investor Services @ 1.5% of 2015E Total Client Assets $19,311
Advisor Services @ 2% of 2015E Total Client Assets $20,858
Current ―excess‖ cash $1,100
Equity value $41,269
Diluted Shares Outstanding (current) 1,288
Per Share $32.04
% Upside to Estimate of Intrinsic Value 45.11%
It is worth highlighting that at our estimated intrinsic value for Schwab, the Company would be valued at ~1.8% of projected assets under management, which is in line with the trading valuation of Schwab at year end 2007. At current levels, Schwab is valued at just 1.2% of total client assets despite the fact that its business has expanded markedly. The following provides a comparison, between 2007 and June 2013:
25

The Charles Schwab Corporation
Schwab Comparison
12/31/07 6/30/13
Client Assets $1,446,000 $2,015,000
Price $25.55 $22.08*
Shares 1,222 1,288
Market Cap $31,222.10 $28,439.04
EV/Assets 1.75% 1.18%
Interest Earnings Assets $12,722 $127,626
Net Interest Revenue $1,647 $1,892**
Brokerage Accounts 7mm 8.8mm
Corporate Retirement Accounts 1.2mm 1.6mm
Banking Accounts 262K 865k
* Price as of 9/16/2013
** Based on 6/30/2013 Run Rate
Risks
Risks that Schwab may not achieve our estimate of the Company’s intrinsic value include, but are not limited to, continued historically low interest rate environment, increased capital requirements due to regulatory changes, inability to retain and attract new assets, fee pressure on the Company’s product offerings, and deterioration in the Company’s loan and investment portfolio. It is worth noting that at June 30, 2013, 46% of Schwab’s residential real estate mortgages and 51% of its HELOC balances were secured by properties which are located in California
Analyst Certification:
Asset Analysis Focus certifies that the views expressed in this report accurately reflect the personal views of our analysts about the subject securities and issuers mentioned. We also certify that no part of our analysts’ compensation was, is, or will be, directly or indirectly, related to the specific views expressed in this report.
26

Asset Analysis Focus is a valuable resource to aid with new idea generation. Below please find summaries that contain our investment thesis and valuation for companies recently profiled in Asset Analysis Focus. If you would like the full length-report for one of the companies mentioned below, please email [email protected].
S E A R C H I N G F O R V A L U E S I N C E 1 9 7 5
Published by: BOYAR'S INTRINSIC VALUE RESEARCH LLC 6 East 32nd
St. 7th Floor New York, NY 10016 Tel: 212-995-8300 Fax: 212-995-5636
www.BoyarResearch.com
Asset Analysis Focus is not an investment advisory bulletin, recommending the purchase or sale of any security. Rather it should be used as a guide in aiding the investment community to better understand the intrinsic worth of a corporation. The service is not intended to replace fundamental research, but should be used in conjunction with it. Additional information is available on request. The statistical and other information contained in this document has been obtained from official reports, current manuals and other sources which we believe reliable. While we cannot guarantee its entire accuracy or completeness, we believe it may be accepted as substantially correct. Boyar's Intrinsic Value Research LLC its officers, directors and employees may at times have a position in any security mentioned herein. Boyar's Intrinsic Value Research LLC Copyright 2014.
DEVON ENERGY CORPORATION ($52.36) — June 2013 Issue Devon Energy Corporation is a well established firm in the Oil and Gas Exploration and Production sector. The Company has elected to focus on its core operations within the North American onshore area, and divest all offshore and international assets. Moreover, it has decided to focus its future production growth on higher-return crude oil and NGL (natural gas liquids) projects. The Company’s strategic changes have been accompanied by several positive financial developments. DVN has reduced its net debt by 20% since 2003 and repurchased 20% of its share base during the same period. Additionally, the Company has increased its dividend 8 times since 2004. Looking ahead, additional debt reduction and return of capital to shareholders should be made possible by repatriation of $2 billion in overseas cash. Management has also announced a plan to spin off its U.S. midstream operations into an MLP as a means of enhancing shareholder value. Despite several positive developments, DVN shares remain out of favor. DVN shares have declined 7% over the past year, and shares have dropped about 55% over the past 5 years, underperforming its peer group by about 30 percentage points over both time periods. In our view, this performance gap helps to illustrate how poor investor sentiment has become for DVN shares, and the increasingly favorable risk/reward scenario that is being created. Based on our assumptions for 2015, which reflect DVN’s evolving production profile and a normalized commodity price environment, the firm should be capable of generating annual EBITDA of at least $8 billion. Utilizing relatively modest assumptions (a multiple of 5.0x 2015 on an EV/EBITDA basis) produces an estimated intrinsic value of approximately $90 per share for DVN, implying total return potential of about 73% from the current valuation. DIRECTV ($62.49) — October 2013 Issue DIRECTV is believed to be world’s largest provider of pay-TV video services with 36.7 million subscribers including over 20 million subscribers in the U.S and over 16.7 million subscribers in Latin America. At current levels, DIRECTV trades at just 5.4x our 2015E EBITDA. We believe the Company’s valuation is inconsistent with the Company’s robust free cash flow generation and attractively positioned Latin American business. DIRECTV’s Latin America businesses operate in a more favorable competitive environment as the cable infrastructure is much less developed than it is in the U.S. In addition, penetration rates of pay-TV in Latin America are well below the levels experienced in developed markets. Finally, we believe the rapidly growing middle class populations in the region should provide a meaningful tailwind for the Company. While we are under no illusion that the U.S. pay-TV distribution industry is anything but mature, we believe that suggestions of its demise are completely unfounded. Although content is increasingly viewed over multiple platforms, we believe the traditional video distributor such as DTV will continue to play a critically important role in the future content ecosystem. Since just 2005, DTV has repurchased nearly $28 billion of stock at an average price of $31.75 a share, 50% below the current share price, reducing shares outstanding by a whopping 60%. Despite recently reaching targeted leverage levels, we believe the Company should have plenty of capacity to return value to shareholders as 2013 is likely to represent the peak year in terms of capital expenditures. Our estimate of the Company’s intrinsic value is $94, representing 50% upside from current levels. We believe there are a number of items that could drive shares higher including a merger with peer Dish (meaningful synergies), an initiation of a dividend (capture a wider investor base) and an improving housing market.
LIVE NATION ENTERTAINMENT INC. ($12.37) — March 2013 Issue Live Nation is set to launch a completely re-vamped ticketing platform in 2013, which will enable client up-sell opportunities, dynamic pricing, and integrated secondary ticketing inventory, and will generate upwards of $50 million in annual cost savings. Combined with digital advertising and sponsorship, international concerts, and festival growth, LYV management’s goal of 30-35% adjusted operating income growth over the next 3 years does not look unattainable. Liberty Media also recently increased its equity stake in LYV (to 27%) as well as its managerial oversight with Liberty CEO Greg Maffei’s assumption of LYV’s chairmanship in March 2013. This should bring a greater focus on capital allocation as LYV’s free cash flow grows, and potentially the exploration of other strategic alternatives to unlock shareholder value.
Summaries of Six Reports

REGAL ENTERTAINMENT GROUP ($15.60) — February 2013 Issue
Regal Entertainment Group operates the largest movie theatre circuit in the United States. Regal operates an attractive business model featuring a high and stable margin dual revenue stream (box office revenues and concessions sales) and a largely variable cost structure. Competition is local and Regal’s leading position in most of its markets, plus the Company’s modern theatre base and 3D screen conversion, have allowed Regal to raise average ticket prices at a 4% CAGR over the long term. Regal’s scale also allows the Company to favorably negotiate film rental costs and rebates from concessions vendors. Combined with the recession-proof nature of movie theatre attendance, these factors have allowed Regal to consistently produce 18%-20% EBITDA margins over a complete business cycle. Regal also continues to opportunistically acquire smaller competitors at highly accretive multiples averaging 5x-7x cash flow, before accounting for meaningful purchasing synergies. Regal currently trades at approximately 7.4x TTM EV/Adjusted EBITDA, roughly in line with the average among its larger competitors and the recent AMC Entertainment transaction. However, Regal’s EV/EBITDA multiple understates the Company’s unmatched free cash flow generation. Regal generated $263 million in free cash flow in 2012 (10.8% free cash flow yield) and has generated an average of $272 million ($1.76 per share) per year over the past 10 years. Regal’s strong free cash flow generation reflects excess depreciation, cash tax benefits, relatively low capital requirements given the state of the Company’s existing theatre portfolio, and the business’ mature growth stage. More than 100% of free cash flow has historically been returned to shareholders via dividends, and Regal currently offers an attractive 5.4% dividend yield. The Company should also continue to return excess cash to shareholders via special dividends. Valuing Regal at 12x 2013E free cash flow (in line with the AMC transaction multiple), we estimate Regal’s intrinsic value is approximately $21.50 per share. THE SCOTTS MIRACLE GRO-COMPANY ($48.27) — June 2013 Issue The Scotts Miracle-Gro Company is a leading manufacturer of consumer branded products for lawn and garden care. SMG possesses meaningful competitive advantages including an unrivaled supply chain, well-regarded brands and unmatched scale. Since our initial report two years ago, shares have declined by 6.3%, underperforming the S&P 500 which returned 24% over that same time period. We believe this underperformance can be partially attributed to weak operating results over the past two years primarily resulting from unfavorable weather, weak consumer sentiment and higher raw materials costs. With growth failing to materialize in recent years, SMG recently decided to adjust its strategy and manage its operations for profitability and cash flow. Beginning with SMG’s current fiscal year (FY 2013), management has embarked on an aggressive long term plan to achieve a 40% gross profit margin (up from 34% achieved in 2012) and a 15% operating profit margin (compared to 9% in 2012). We believe these long-term goals are achievable reflecting the Company’s recent initiatives to reduce product costs ($60 million in annual savings expected by 2016) and its SG&A cost savings program that should produce ~$35 million in annual savings, among other measures. Further, we continue to see Scotts as a beneficiary of favorable long-term demographics (gardening tends to increase as consumers age) and the ongoing housing market recovery. As part of SMG’s new strategy, the Company has updated its capital allocation priorities and now expects to return two-thirds of it free cash flow to shareholders with the remaining earmarked for capital expenditure projects (previously, management prioritized its FCF generation evenly between capital expenditures, mergers & acquisitions and returns to shareholders). Applying a discounted (relative to peer trading multiples and precedent transactions) 10.0x EBITDA multiple to our estimated normalized EBITDA of $515 million, our estimate of SMG’s intrinsic value is $76 per share, representing 57% upside from current levels.
WHISTLER BLACOMB HOLDING INC. (Can$14.50) — October 2013 Issue Whistler operates the Whistler mountain resort outside Vancouver in British Columbia, Canada. Whistler is a pre-eminent resort that offers the most skiable terrain and greatest number of marked slopes in North America while attracting the highest annual skier attendance on the continent. Following an IPO in November 2010, WB shares faced early selling pressure attributable to lack of investor awareness/under-coverage on Wall Street, a low float with the overhang from a distressed former controlling shareholder (Intrawest) looking to complete its exit, and weak 2010 results due to disruptions caused by co-hosting the Vancouver Olympic Games. While shares have rebounded more recently, we still view Whistler as an underappreciated crown jewel asset with large competitive advantages in an industry with huge barriers to entry. We are further attracted by Whistler’s business model which features a recurring revenue base anchored by pre-paid lift tickets and supplemented with high-margin ancillary revenue from local monopoly businesses (ski schools, on-mountain retail sales, etc.). Combined with strong pricing power and relatively stable annual attendance, this business quality is reflected in WB’s outsized EBITDA margins and consistent free cash flow generation. Despite these compelling features, WB still trades at relatively modest multiples including 9.4x 2014E EV/EBITDA and 13.3x TTM free cash flow. By comparison, peer Vail Resorts trades at 20x free cash flow and 11.5x 2014E EV/EBITDA. In our view, this discount is unwarranted given WB’s superior operating margins. Furthermore, we see incremental earnings upside over the next few years from pricing action, a recovery in high-value international ‘destination’ visitors, growth of summertime businesses, and reaping the benefits from hosting the Olympics. Valuing WB at 12x 2015E EV/EBITDA, we estimate WB’s intrinsic value could approach $21 per share over the coming years. In the meantime, WB continues to offer outsized return of capital to shareholders with a hefty 6.7% dividend yield.
28

En
Every December, Boyar’s Intrinsic Value Research produces The Forgotten Forty. The Forgotten Forty contains our
investment theses on the forty companies in our universe that in our opinion have the greatest potential for capital
appreciation in the coming year due to a catalyst or corporate action we believe is likely to occur to help unlock
shareholder value. Over the past decade, The Forgotten Forty has significantly outperformed the S&P 500.*
The following pages contain 2 of the 40 reports that were in this year’s Forgotten Forty.
*Past performance is no guarantee of future results. These results are not audited.
The Forgotten Forty - Growth of $100 between 2004-2013*
Forgotten Forty
S&P 500
0%
5%
10%
15%
20%
25%
30%
35%
Forgotten Forty S&P 500
34.84%
24.13%
The Forgotten Forty – Results for 2012-2013*
$192.91
$161.36
$0.00
$50.00
$100.00
$150.00
$200.00
$250.00
2004 2005 2006 2007 2008 2009 2010 2011 2012 2013
Fogotten Forty S&P 500
Forgotten Forty
29

INVESTMENT RESEARCH SUMMARY PRICED DECEMBER 12, 2013
Crocs, Inc.
Balance Sheet Data Catalysts/Highlights
(in millions) 9/30/13 2012 2011 The Company continues to have an attractive set of growth opportunities from a long-term perspective despite near-term headwinds.
After recent declines, underlying business is being valued at a P/E of just 6.5x, and an EV/EBITDA multiple of 4.0x.
CROX’s strong balance sheet provides downside support, and its depressed valuation has already attracted interest from private equity investors.
Cash $ 332 $ 294 $ 258
Goodwill 0 0 0
TOTAL ASSETS $ 947 $ 830 $ 695
Long Term Debt $ 9 $ 5 $ 0
Shareholders Equity 690 617 492
TOTAL LIABILITIES AND SHAREHOLDERS EQUITY
$ 947 $ 830 $ 695
Fiscal Year Ending December 31
P&L Analysis ($ in millions except per share items)
2012 2011 2010 2009
Revenues 1,123 1,001 790 646
Net Income 131 113 68 -42
Earnings Per Share 1.44 1.24 0.76 -0.49
Dividends Per Share NA NA NA NA
Price Range 22.59-12.00 32.47-14.20 19.54-5.81 8.20-1.00
INVESTMENT RATIONALE
Crocs, Inc. is a relatively young Company, but it possesses a full and eventful history. CROX was established in 1999, and by 2007 sales exceeded $800 million despite the fact that CROX was essentially a one-product company (its eponymously named clog). However sales trends eventually softened, and a challenging economic backdrop exacerbated the operational challenges faced by the firm. Not surprisingly CROX shares cratered during that period, plummeting to approximately $1 per share during 2009. The Company pursued several initiatives to rationalize its operations, and to diversify its sales mix in terms of both products and distribution channels. By 2010 the firm had started to regain its footing, illustrated by improving sales and profits and a recovering stock price.
During the most recent fiscal year, CROX generated approximately $1.1 billion in revenue and $184 million in operating income. Sales were still largely derived from footwear (about 96% of sales), but its footwear product line has become substantially more diversified, which now includes sandals, boots, and flats, and other products such as accessories and apparel. CROX’s well-known clog style of shoes now accounts for less than 50% of total revenue. In terms of distribution channels, sales during the most recent fiscal year were generated from wholesale (58%), retail (33%), and internet (9%). CROX has become a truly global business, selling products in over 90 countries across the world. Overseas markets now account for 65% of total sales. In terms of overseas markets, Asia is CROX’s most important region. Japan represents the Company’s largest foreign market (15% of total sales), bu t China represents an increasingly important growth engine. Within the Chinese market, sales growth has been exceeding 20%, and the region is approaching $100 million in sales for the Company.
CROX’s financial results have softened somewhat during recent quarters, causing the stock to correct by approximately 20% earlier this year. Profits were particularly disappointing during 2Q-2013 (reported in late July), and management reduced its earnings guidance for the upcoming quarters. The shortfall was largely a result of an unexpected contraction in gross margin due to weak sales trends in the wholesale channel (mainly in North America and Japan). Unfavorable weather trends and challenging consumer fundamentals were among the primary headwinds during the period. In our view, these factors represent near-term issues rather than a material deterioration in the firm’s business model or long-term growth prospects. We believe the Company continues to have an attractive set of growth opportunities from a long-term perspective. Additional expansion of its store base, and the robust growth prospects in several overseas markets should be among the primary catalysts for higher sales and profits. Continued execution of the Company’s strategy to expand its product line and distribution channels, combined with an enhanced marketing effort will be critical to capitalizing on these growth opportunities.
We would also highlight CROX’s very strong financial position. As of the most recent quarter, CROX held over $300 million in net cash representing over 25% of the Company’s total market capitalization. Although near-term results may be depressed, CROX generates a healthy stream of free cash flow; the Company’s annual free cash flow has approximated $100 million during recent years (implying a 9% free cash flow yield). Importantly, the firm continues to have the financial resources to fund growth opportunities and return capital to shareholders. CROX recently announced a 15 million share increase in its stock buyback program (to 17.8 million in total authorization). The current authorization would allow CROX to repurchase about 20% of its shares outstanding.
In our view, the stock’s weak performance has created a very favorable risk/reward scenario for long-term investors. The stock has lost about 20% of its value over the past 6 months, and investor sentiment for the shares has deteriorated significantly. Utilizing relatively conservative assumptions, we believe EPS of at least $1.40 and EBITDA of at least $180 million should be achievable for CROX during the next 2-3 years. Assuming these levels of profitability are attainable, the stock’s current price values CROX’s underlying business at a P/E of just 6.5x (excluding its net cash balance), and implies an EV/EBITDA multiple of 4.0x (based on our FY 2015 projections). Assuming the stock trades at a 7.0x EV/EBITDA multiple (applied to our FY 2015 projections) produces an estimated intrinsic value of $20 per share. This estimate of intrinsic value implies upside potential of over 50%. It also warrants mention that CROX could attract the interest of private equity investors given the Company’s strong financial position and depressed valuation (recent media reports suggest this is already happening).
Symbol: CROX
Exchange: NASDAQ
Current Price: $12.71
Current Yield: NA
Current Dividend: NA
Shares Outstanding (MM): 86.9
Major Shareholders: Insiders own 1%
Average Daily Trading Volume (MM): 1,321
52-Week Price Range: $17.95-$11.96
Price/Earnings Ratio: 13.2x
Stated Book Value Per Share: $7.94
30

INVESTMENT RESEARCH SUMMARY PRICED DECEMBER 12, 2013
International Speedway Corporation
Balance Sheet Data Catalysts/Highlights
(in millions) 8/31/13 2012 2011 NASCAR recently signed 10-year contracts (beginning in 2015) with NBC and Fox on extremely favorable terms providing revenue visibility through 2024
Ongoing stabilization and the potential return to growth in attendance revenues due to ongoing economic improvement
Further traction with Hollywood Casino at Kansas Speedway, which generated $21.5 million in cash for ISCA during FY 2013
Cash $ 164 $ 78 $ 110
Current Assets 255 128 165
TOTAL ASSETS $ 2,029 $ 1,942 $ 1,945
Current Liabilities $ 119 $ 77 $ 87
Long Term Debt 274 274 313
Shareholders Equity 1,269 1,249 1,212
TOTAL LIABILITIES AND SHAREHOLDERS EQUITY
$ 2,029 $ 1,942 $ 1,945
Fiscal Year Ending November 30
P&L Analysis ($ in millions except per share items)
2012 2011 2010 2009
Revenues 612 630 645 693
Net Income 55 69 55 91
Earnings Per Share 1.18 1.46 1.13 1.87
Dividends Per Share 0.20 0.18 0.16 0.14
Price Range 29.30-23.18 32.32-20.08 31.12-22.34 30.95-16.49
INVESTMENT RATIONALE
International Speedway owns or operates 13 of the nation’s premier motorsports entertainment facilities and generates more than 90% of its sales from NASCAR sanctioned racing events. NASCAR is the #1 rated spectator sport (in terms of attendees) and the #2 rated sport on television (after the NFL). ISCA operates an attractive business model with approximately 62% of its revenue (media rights and corporate sponsorships) secured under long-term contracts with annual escalators providing it with a predictable and recurring source of revenue and cash flow. In addition, the barriers to entry to the business are enormous with the Company’s unsuccessful foray into NYC during the last decade supporting our view (ISCA had to abandoned its plan to build a stadium on Staten Island due to a community uproar).
While there had been investor concerns surrounding NASCAR’s media rights (~50% of ISCA’s revenues) renewal due to ratings pressure, those fears proved to be unfounded. In July 2013, NASCAR announced that NBC had secured the majority of NASCAR’s annual rights under a 10-year contract (2015-2024) reported to be 54% above ($440 million average annual value vs. $270 million) the prior agreement with ESPN. The NBC agreement followed on the heels of Fox’s 8-year renewal (amended to 10-years) in 2012 that represented a ~36% increase over the prior deal. We had previously speculated that interest in NASCAR’s media rights was likely to be strong, especially given both Fox and NBC’s ambitions to rival ESPN’s sports programming. ISCA/NASCAR’s ability to command large live audiences is becoming increasingly attractive to advertisers in today’s fragmented media landscape. Given the favorable renewals, we believe ISCA could receive a one-time step up in rights fees in 2015 since the new media contract will likely increase at a low low-mid single digit rate over its term.
In our view, the favorable media rights renewal is being overshadowed by the Company’s revitalization of the iconic Daytona International Speedway and initiatives to increase its utilization. In July 2013, ISCA announced a plan to modernize the Daytona facility ($375-$400 million expected costs) that is expected to generate incremental revenue ($20 million) and provide a $15 million boost to EBITDA with a mid single-digit growth rate within the first year after its 2016 completion. While some investors may be wary of the endeavor dubbed Daytona Rising, we would expect ISCA to follow the playbook of MSG, which recently completed a successful renovation of its eponymous arena. We believe the Daytona renovation will allow the Company to attract meaningfully higher revenues from increased luxury suite sales and increased sponsorships, among other items. ISCA has strong liquidity to fund the project with $164 million of cash and total debt to capitalization of just 17.9%. While ISCA will likely utilize its revolver ($300 million that is currently undrawn) on a short-term basis to fund the project, ISCA does not expect to incur any long-term debt. In addition to Daytona Rising, the Company recently entered into a JV intended to monetize and increase the utilization of its Daytona property. The project currently under consideration is a mixed-use and entertainment destination (think Disneyland for NASCAR fans) directly across from the famed Daytona Speedway.
ISCA has been disproportionately impacted by the weak economy and this fact is apparent in the over 50% decline in the Company’s attendance/admissions revenues (22% of ISCA’s 2012 total revenues) from their peak in 2007. While the attendance declines have been discouraging and have had an outsized impact on profitability, prospects for a recovery are encouraging. ISCA’s attendance revenues appear to be stabilizing with attendance revenues declining by just 1% on a comparable race basis during 3Q 2013. The ongoing improvement, albeit slow, in the housing industry and resurgent auto industry, two areas of the economy that employ a large base of NASCAR fans, should bode well for future attendance. Corporations are also beginning to increase spending on sponsorship/hospitality following a pull back in the wake of the financial crisis. In response to attendance pressures, ISCA has taken approximately $46 million out of its cost structure since 2009, which should provide nice leverage as attendance/admission revenues begin to recover.
At current levels, ISCA trades for 7.4x our projected 2015E EBITDA. Adjusting for the ~$117 million benefit that ISCA will receive from its recent Staten Island transaction, the current forward valuation drops to just 6.8x. In our view, this valuation is inconsistent with the ISCA’s strong business model including a highly visible revenue/cash flow stream, robust profitability (2012 EBITDA margins: 30%), and unique assets. ISCA’s Hollywood Casino JV with Penn Gaming ($21.5 million cash contribution in FY 2013) continues to gain traction and should serve as an additional source of value creation. If ISCA’s shares continue to languish, we would not rule out the potential that the France Family considers taking the Company private.
Symbol: ISCA
Exchange: NASDAQ Current Price: $33.16 Current Yield: 0.7% Current Dividend: $0.22 Shares Outstanding (MM): 46.2 Major Shareholders: France Family 40% Econ, 70% Voting
Average Daily Trading Volume (MM): 0.10 52-Week Price Range: $35.77-$26.02 Price/Earnings Ratio: 29.1x Stated Book Value Per Share: $27.47
31

Boyar’s Intrinsic Value Research LLC., has always prided itself on covering a diverse range of companies, from small cap names such as Interval Leisure Group to larger companies such as DirectTV and Bank of America. We will continue to do this. However, in February of 2010 we launched a new service entitled Boyar’s Micro Cap Focus dedicated to identifying what we believe are intrinsically undervalued micro cap stocks. To date, we have published an in-depth research report on approximately fifteen micro cap companies. Notably, the micro cap companies that we have featured have gained approximately 122% on average from their respective publication date, versus an approximate 46% average gain for the Russell Microcap Value Index. The report on United Online, Inc. found on the following pages is a representative sample of the type of report you can expect to receive if you become a subscriber to our service.*
Why did we decide to launch Boyar’s Micro Cap Focus? As a result of the turbulence on Wall Street, and the large contraction in both independent and Wall Street research departments, quality reports on the very smallest publicly traded companies have become an endangered species. We feel this presents an opportunity both for us and for our subscribers.
Due to the small floats of the micro cap names that Boyar’s Micro Cap Focus intends to feature, we will only be offering these reports in very limited circulation. For details on how to become one of the maximum of 20 subscribers who will receive this service, please contact me at 212-995-8300 ext 215 or [email protected].
*Past performance is no guarantee of future results. This represents the average performance for all Boyar’s Micro Cap Focus reports from
their respective publication dates. The results are as of December 2013. These figures are unaudited.
0%
20%
40%
60%
80%
100%
120%
140%
Boyar’s Micro Cap Focus Russell Microcap Value Index
122%
46%
Boyar’s Micro Cap Focus Outperformance
32

Volume IV, Issue II July 18, 2013
PUBLISHED BY: Boyar’s Intrinsic Value Research LLC. · 6 East 32nd St. · 7th Floor · New York, NY 10010 TEL: 212-995-8300 · FAX: 212-995-5636
www.BoyarResearch.com Boyar’s Micro Cap Focus is not an investment advisory bulletin, recommending the purchase or sale of any security. Rather it should be used as a guide in aiding the investment community to better understand the intrinsic worth of a corporation. The service is not intended to replace fundamental research, but should be used in conjunction with it. Additional information is available on request. The statistical and other information contained in this document has been obtained from official reports, current manuals and other sources which we believe reliable. While we cannot guarantee its entire accuracy or completeness, we believe it may be accepted as substantially correct. Boyar’s Intrinsic Value Research LLC, its officers, directors and employees may at times have a position in any security mentioned herein. Boyar’s Intrinsic Value Research LLC, Copyright 2014.
Featured Company: United Online, Inc.
Summary Data:
Ticker: UNTD
Exchange: NASDAQ
Price: $8.08
52 week High/Low: $8.08/$3.90
Dividend Yield: 4.9%
Diluted Shares (MM): 92.0
% Closely Held: 6%
Market Cap ($MM): $743.6
Net Debt ($MM): $111.8
Enterprise Value ($MM): $855.4
Volume (3 mos. Avg): 766,346
Sector: Consumer Discretionary
Fiscal Year Ends: December 31
Intrinsic Value: $11.19
% Upside to Intrinsic Value: 39%
Clients of Boyar Asset Management, Inc. do not own shares of United Online, Inc. common stock. Analysts employed by Boyar’s Intrinsic Value Research LLC do not own shares of UNTD common stock.
Overview and Investment Thesis United Online (“UNTD” or the “Company”) is an Internet conglomerate that provides a number of consumer products and services across several recognizable brands. United Online began in the late 1990s as the first prominent free dial-up Internet service provider under the NetZero brand, and the Company’s Internet access and related services have undergone a well-managed decline that is still producing cash flow for the firm. Through a series of diversifying acquisitions in the mid-2000s, UNTD now also controls a series of Content & Media properties (most prominently, Classmates.com) as well as FTD, a premier floral network and gift products e-commerce operator. With an enterprise value of $855 million, United Online is larger than the typical company profiled in Boyar’s Micro Cap Focus. However, United Online’s pending spinoff of the FTD Companies floral business (tentatively set for September 2013) presents a unique catalyst. While UNTD shares have already surged 92% since the initial announcement nearly one year ago, UNTD shares are still well off their multi-year highs and trade at discounted valuation levels of only 6.7x EV/OIBDA and an 8.7% trailing free cash flow yield. Despite now contributing a majority of UNTD’s profitability, FTD has been overshadowed by United Online’s collection of legacy businesses that have been battling terminal decline ever since UNTD acquired FTD in 2008. By contrast, FTD is an attractive, growing niche e-commerce business that possesses a valuable network and brand built over a 100-plus year history. The execution of the spinoff could provide substantial incremental long-term upside, and we estimate the independent FTD business alone could command more than the combined entity’s current market value. Precedent transactions and current peer valuations (most prominently,

United Online, Inc.
1-800-Flowers.com) support a double-digit EV/OIBDA multiple for the business, which would imply a nearly $10 per share intrinsic value for FTD looking out 2-3 years. The business also produces consistent free cash flow with negative working capital requirements, creating a highly leverageable business model. Absent capital deployment, we estimate FTD’s leverage ratio could decline to only 0.3x by the close of 2015—suggesting the capacity for large-scale share repurchases at FTD following the separation. On the other hand, the remaining UNTD stub could face significant shareholder rotation and related selling pressure due to its vastly reduced market cap. Combined with extreme aversion to investing in a Company that will principally consist of terminally declining businesses, the UNTD stub could become an orphaned stock—potentially creating a very attractive investment opportunity for micro-cap investors. While we believe the stub’s core businesses are in their final years of profitability, UNTD will be protected with $60 million or more of cash on the balance sheet. The stub could also offer a free call option on UNTD’s large patent portfolio (upwards of 70 Internet-related patents dating back to the 1990s, currently under evaluation for monetization by Evercore) and the upstart NetZero 4G mobile broadband business. Finally, we would not be surprised to see a further separation of United Online after the FTD spinoff, whether through a sale or spinoff/merger of individual assets or a sale of the entire Company (which should not jeopardize the tax-free status of the spinoff). The ISP business would have obvious synergies with AOL or Earthlink, while the Company’s vast consumer database and targeted Internet marketing/sales platform could also be leveraged by a larger peer. United Online History
United Online traces its roots to NetZero, an Internet access services provider (ISP) incorporated in 1997 and launched in October 1998. NetZero’s unique free-to-use, unlimited usage, ad-supported dial-up Internet service rapidly gained users as the Internet was becoming widely adopted. NetZero was able to support this model through its proprietary advertising technology, which offered advertisers unique targeting capabilities, banner advertising tools, and market research and measurement capabilities. Current Chairman, President and CEO Mark Goldston came aboard as CEO in March 1999. Mr. Goldston’s prior experience included stints at private equity and advisory firms as well as managerial positions including CEO of Einstein/Noah Bagel Corp. (1996-1997), President and COO of L.A. Gear (1991-1994), and CMO at Reebok. By September 1999 NetZero advantageously executed an IPO at the height of the technology bubble. Completed at $16 per share, the IPO raised $160 million and valued the Company at approximately $1.6 billion. The dot-com bubble soon collapsed, and NetZero shares were trading below $1 by the close of year 2000. Following several small acquisitions of proprietary Internet technology companies that quickly failed, in June 2001, NetZero and dial-up ISP peer Juno Online Services orchestrated an all-stock merger. The successor Company was renamed United Online, with NetZero shareholders retaining a 61.5% interest in the merged Company. The merger offered meaningful synergies by creating the second largest ISP in the U.S. (approximately 7 million active users), while retaining both brands allowed United Online to cross-market both free and premium pay (primarily under the Juno brand) services.
Facing intense competition from broadband Internet alternatives, UNTD pushed to diversify beyond the
declining dial-up Internet business in 2004. UNTD developed proprietary premium email and content services and made efforts to expand its advertising services. Then, in November 2004, UNTD signed an agreement to acquire Classmates Online for $100 million in cash. Classmates Online operated the Classmates.com website, one of the earliest social networks launched in 1995 to enable classmates (primarily high school) to reconnect. The business had approximately 1.5 million pay accounts (~$3/month) at the time of the acquisition, and the business grew rapidly over the next 4 years to reach ~5 million pay accounts. United Online explored a spinoff/IPO for the business in 2007 before cancelling the IPO due to tepid demand and weakening financial markets. While intense free social network competition has subsequently caused Classmates to decline as rapidly as its prior advance, management still estimates UNTD has made ~4x return on the acquisition. In April 2006, United Online acquired MyPoints, a member-driven Internet direct marketing service with approximately 1.4 million active members, for $56 million in cash or ~12x EBITDA. United Online hoped to leverage the Company’s vast consumer database and targeted advertising expertise across MyPoint’s website and direct marketing service, but meaningful synergies failed to emerge and the acquisition was substantially written off in recent years.
34
United Online, Inc.
United Online completed its largest acquisition in August 2008, acquiring FTD Group for $449 million in
cash and stock plus the assumption of ~$270 million in net debt. FTD originally stood for Florists’ Telegraph Delivery Association and traces back to 1910 as the first retail florists’ cooperative association established in the U.S. FTD enabled customers to order out-of-market delivery of flowers, by linking a local florist with a delivering florist in any other market in the network via wire. FTD was demutualized in 1994 in conjunction with a ~$10 million investment by Perry Capital and Bain Capital. With the development of the Internet, FTD rapidly grew order volume by enabling consumers to place orders online at FTD.com, to be fulfilled by FTD network member florists. FTD completed its IPO in October 1999, valuing the Company at greater than $300 million. After acquiring FTD in late 2003, private equity firm Leonard Green quickly brought FTD public again in February 2005, raising $200 million. FTD agreed to acquire leading U.K. and Ireland floral e-commerce company Interflora for £66 million in July 2006, adding over $110 million in international revenues. FTD, which was still 31% owned by affiliates of Leonard Green at the time, soon initiated a sale process in mid-2006. The process attracted several initial bidders including multiple private equity firms as well as a strategic bidder, with initial bids reaching as high as $19 per share. As the credit markets began to shake and the economy approached a recession, negotiations broke down with these bidders by late 2007 and United Online swooped in, eventually acquiring FTD for $14.55/share in cash and stock. FTD shareholders received UNTD shares worth approximately 15% of the merged company.
The subsequent recession proved challenging for all of United Online’s businesses, FTD included. But
while FTD has fully recovered in recent years, UNTD’s ISP and social network businesses have continued to deteriorate in the face of intense competition and heavy subscriber losses. Recognizing that the anticipated synergies between FTD’s huge customer list and United Online’s advertising/marketing platforms never emerged (as well as intense shareholder pressure and a share price reaching decade lows), in August 2012 United Online announced plans to spin off FTD to shareholders. The spinoff is expected to be completed by the end of 3Q 2013. Chairman/CEO Goldston has also announced his intention to retire from all positions at UNTD and FTD, concurrent with the completion of the spinoff. FTD President Robert Apatoff will assume the CEO position at FTD Companies, while the board has yet to appoint a replacement CEO for United Online.
To receive the rest of this report, please contact: [email protected]
35