Embed Size (px)
Citation preview
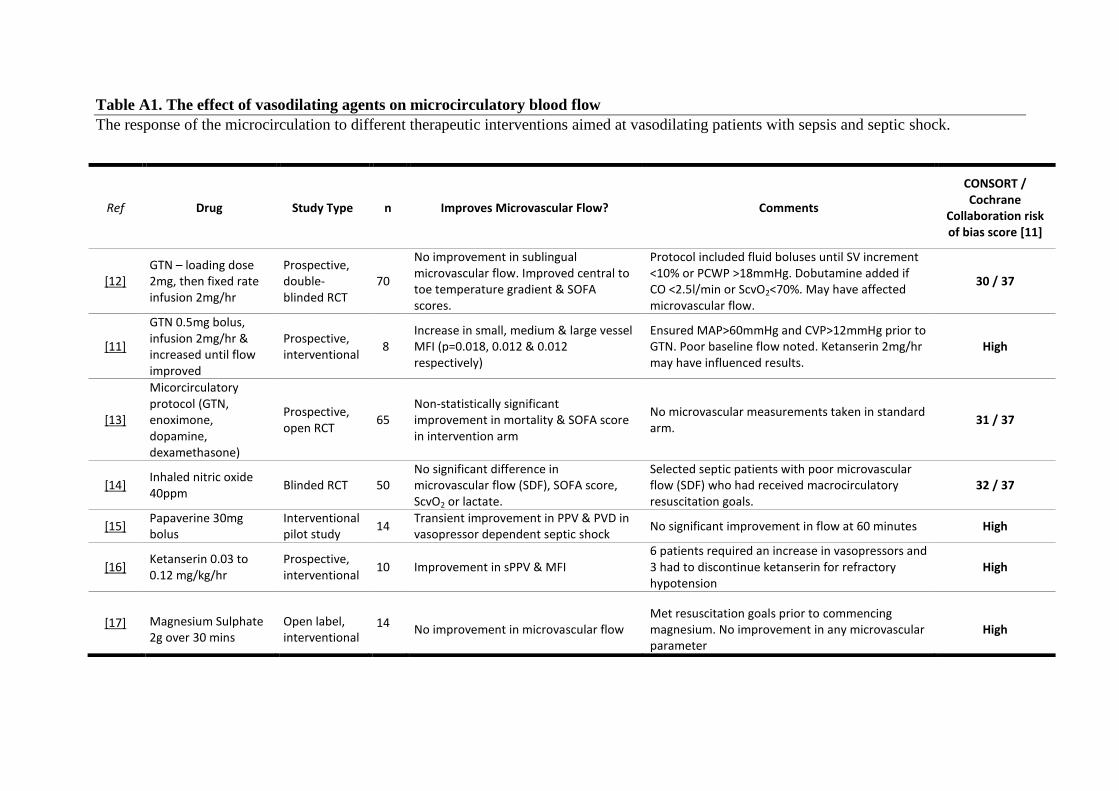
Table A1. The effect of vasodilating agents on microcirculatory blood flow
The response of the microcirculation to different therapeutic interventions aimed at vasodilating patients with sepsis and septic shock.
Ref Drug Study Type n Improves Microvascular Flow? Comments
CONSORT / Cochrane
Collaboration risk of bias score [11]
[12] GTN – loading dose 2mg, then fixed rate infusion 2mg/hr
Prospective, double-blinded RCT
70
No improvement in sublingual microvascular flow. Improved central to toe temperature gradient & SOFA scores.
Protocol included fluid boluses until SV increment <10% or PCWP >18mmHg. Dobutamine added if CO <2.5l/min or ScvO2<70%. May have affected microvascular flow.
30 / 37
[11]
GTN 0.5mg bolus, infusion 2mg/hr & increased until flow improved
Prospective, interventional
8 Increase in small, medium & large vessel MFI (p=0.018, 0.012 & 0.012 respectively)
Ensured MAP>60mmHg and CVP>12mmHg prior to GTN. Poor baseline flow noted. Ketanserin 2mg/hr may have influenced results.
High
[13]
Micorcirculatory protocol (GTN, enoximone, dopamine, dexamethasone)
Prospective, open RCT
65 Non-statistically significant improvement in mortality & SOFA score in intervention arm
No microvascular measurements taken in standard arm.
31 / 37
[14] Inhaled nitric oxide 40ppm
Blinded RCT 50 No significant difference in microvascular flow (SDF), SOFA score, ScvO2 or lactate.
Selected septic patients with poor microvascular flow (SDF) who had received macrocirculatory resuscitation goals.
32 / 37
[15] Papaverine 30mg bolus
Interventional pilot study
14 Transient improvement in PPV & PVD in vasopressor dependent septic shock
No significant improvement in flow at 60 minutes High
[16] Ketanserin 0.03 to 0.12 mg/kg/hr
Prospective, interventional
10 Improvement in sPPV & MFI 6 patients required an increase in vasopressors and 3 had to discontinue ketanserin for refractory hypotension
High
[17] Magnesium Sulphate 2g over 30 mins
Open label, interventional
14 No improvement in microvascular flow
Met resuscitation goals prior to commencing magnesium. No improvement in any microvascular parameter
High
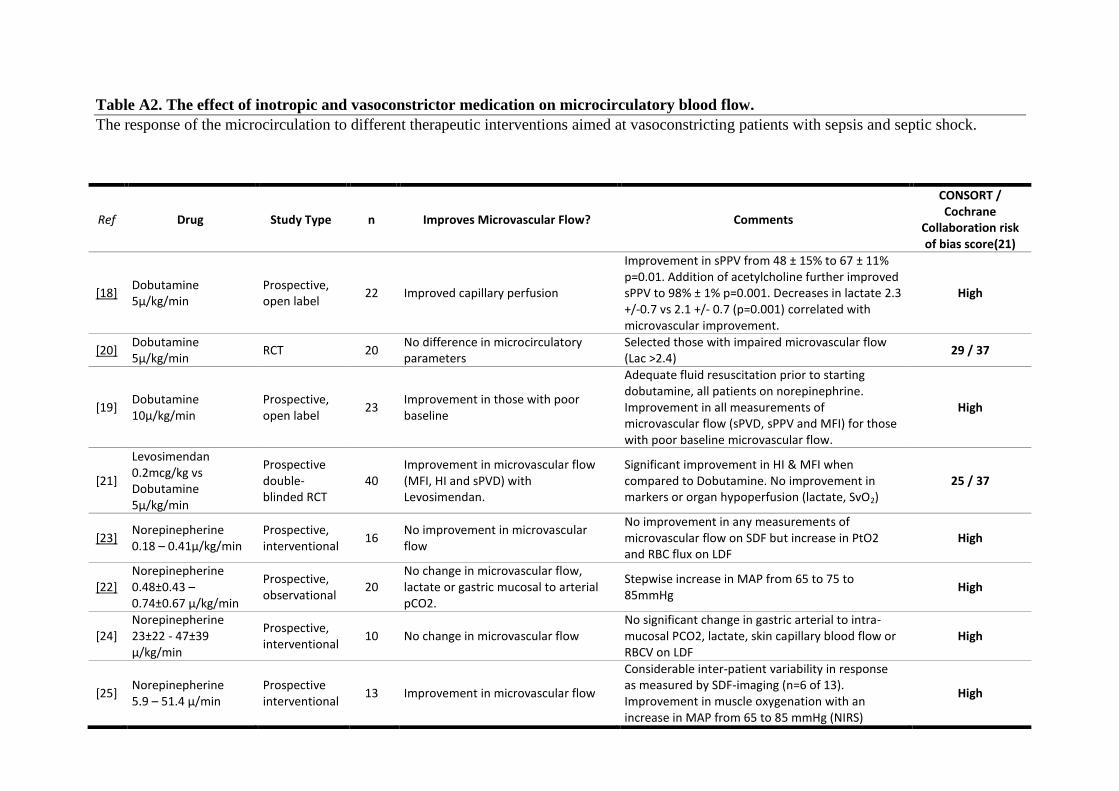
Table A2. The effect of inotropic and vasoconstrictor medication on microcirculatory blood flow.
The response of the microcirculation to different therapeutic interventions aimed at vasoconstricting patients with sepsis and septic shock.
Ref Drug Study Type n Improves Microvascular Flow? Comments
CONSORT / Cochrane
Collaboration risk of bias score(21)
[18] Dobutamine 5µ/kg/min
Prospective, open label
22 Improved capillary perfusion
Improvement in sPPV from 48 ± 15% to 67 ± 11% p=0.01. Addition of acetylcholine further improved sPPV to 98% ± 1% p=0.001. Decreases in lactate 2.3 +/-0.7 vs 2.1 +/- 0.7 (p=0.001) correlated with microvascular improvement.
High
[20] Dobutamine 5µ/kg/min
RCT 20 No difference in microcirculatory parameters
Selected those with impaired microvascular flow (Lac >2.4)
29 / 37
[19] Dobutamine 10µ/kg/min
Prospective, open label
23 Improvement in those with poor baseline
Adequate fluid resuscitation prior to starting dobutamine, all patients on norepinephrine. Improvement in all measurements of microvascular flow (sPVD, sPPV and MFI) for those with poor baseline microvascular flow.
High
[21]
Levosimendan 0.2mcg/kg vs Dobutamine 5µ/kg/min
Prospective double-blinded RCT
40 Improvement in microvascular flow (MFI, HI and sPVD) with Levosimendan.
Significant improvement in HI & MFI when compared to Dobutamine. No improvement in markers or organ hypoperfusion (lactate, SvO2)
25 / 37
[23] Norepinepherine 0.18 – 0.41µ/kg/min
Prospective, interventional
16 No improvement in microvascular flow
No improvement in any measurements of microvascular flow on SDF but increase in PtO2 and RBC flux on LDF
High
[22] Norepinepherine 0.48±0.43 – 0.74±0.67 µ/kg/min
Prospective, observational
20 No change in microvascular flow, lactate or gastric mucosal to arterial pCO2.
Stepwise increase in MAP from 65 to 75 to 85mmHg
High
[24] Norepinepherine 23±22 - 47±39 µ/kg/min
Prospective, interventional
10 No change in microvascular flow No significant change in gastric arterial to intra-mucosal PCO2, lactate, skin capillary blood flow or RBCV on LDF
High
[25] Norepinepherine 5.9 – 51.4 µ/min
Prospective interventional
13 Improvement in microvascular flow
Considerable inter-patient variability in response as measured by SDF-imaging (n=6 of 13). Improvement in muscle oxygenation with an increase in MAP from 65 to 85 mmHg (NIRS)
High
[26] Norepinepherine 0.04-0.68 µ/kg/min
Prospective, interventional
19 Improved microcirculatory flow when MAP increased to patients' 'normal' MAP
Average MAP taken from previous 2 years of GP records.
High
[27]
Norepinepherine(NA) + AVP (0.04 U/min) vs NA + terlipressin (1 mcg/kg/hr) vs NA + placebo
Prospective double-blinded RCT
60
AVP & TP decreased amount of norepinepherine required to reach MAP 65-75 without decreasing microvascular flow.
Used intermittent fluid boluses to maintain CVP +/-3mmHg form baseline which may have affected results.
16.5 / 37
[28]
Terlipressin 0.5mg bolus (Patients already on norepinepherine titrated to MAP 65-75)
Prospective interventional
20 Improvement in microvascular flow (MFI, sPPV & HI)
Improved microvascular flow but no improvement in downstream markers (ScvO2, lactate). All patients received hydrocortisone & 3 received Activated Protein C.
High
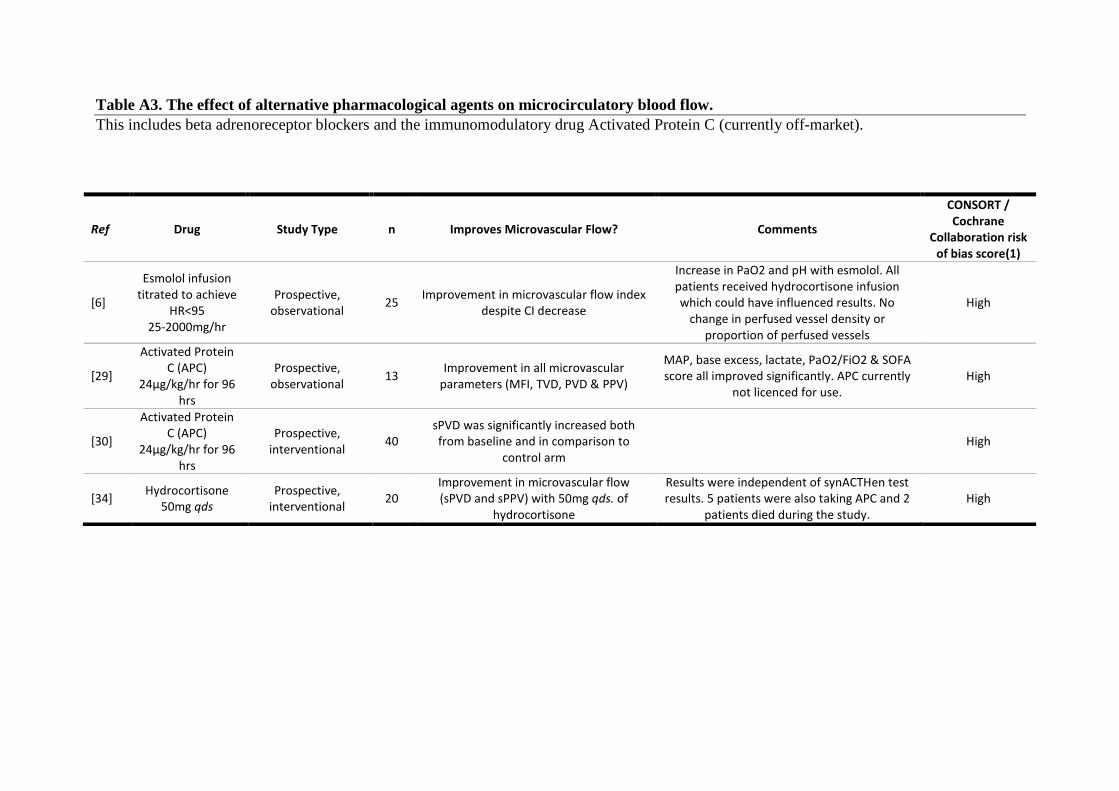
Table A3. The effect of alternative pharmacological agents on microcirculatory blood flow.
This includes beta adrenoreceptor blockers and the immunomodulatory drug Activated Protein C (currently off-market).
Ref Drug Study Type n Improves Microvascular Flow? Comments
CONSORT / Cochrane
Collaboration risk of bias score(1)
[6]
Esmolol infusion titrated to achieve
HR<95 25-2000mg/hr
Prospective, observational
25 Improvement in microvascular flow index
despite CI decrease
Increase in PaO2 and pH with esmolol. All patients received hydrocortisone infusion which could have influenced results. No
change in perfused vessel density or proportion of perfused vessels
High
[29]
Activated Protein C (APC)
24µg/kg/hr for 96 hrs
Prospective, observational
13 Improvement in all microvascular
parameters (MFI, TVD, PVD & PPV)
MAP, base excess, lactate, PaO2/FiO2 & SOFA score all improved significantly. APC currently
not licenced for use. High
[30]
Activated Protein C (APC)
24µg/kg/hr for 96 hrs
Prospective, interventional
40 sPVD was significantly increased both from baseline and in comparison to
control arm High
[34] Hydrocortisone
50mg qds Prospective,
interventional 20
Improvement in microvascular flow (sPVD and sPPV) with 50mg qds. of
hydrocortisone
Results were independent of synACTHen test results. 5 patients were also taking APC and 2
patients died during the study. High
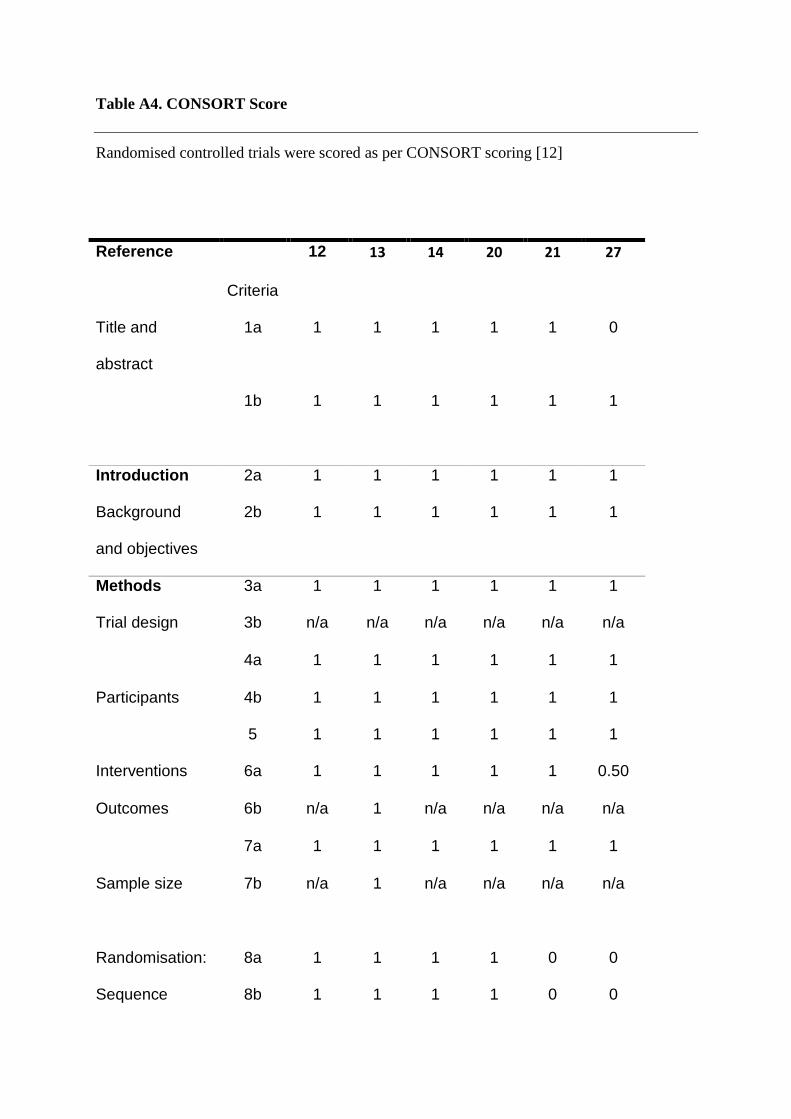
Table A4. CONSORT Score
Randomised controlled trials were scored as per CONSORT scoring [12]
Reference 12 13 14 20 21 27
Criteria
Title and
abstract
1a 1 1 1 1 1 0
1b 1 1 1 1 1 1
Introduction 2a 1 1 1 1 1 1
Background
and objectives
2b 1 1 1 1 1 1
Methods 3a 1 1 1 1 1 1
Trial design 3b n/a n/a n/a n/a n/a n/a
4a 1 1 1 1 1 1
Participants 4b 1 1 1 1 1 1
5 1 1 1 1 1 1
Interventions 6a 1 1 1 1 1 0.50
Outcomes 6b n/a 1 n/a n/a n/a n/a
7a 1 1 1 1 1 1
Sample size 7b n/a 1 n/a n/a n/a n/a
Randomisation: 8a 1 1 1 1 0 0
Sequence 8b 1 1 1 1 0 0
generation 9 1 1 1 1 0 0
Allocation
concealment
mechanism
10 1 0 1 1 0 0
Implementation 11a 1 0 1 1 0 0
Blinding 11b 1 1 1 1 1 1
12a 1 1 1 1 1 0.5
Statistical
methods
12b 1 1 1 1 1 0
Results 13a 1 1 1 0 1 0
Participant flow
(a diagram is
strongly
recommended)
13b 1 1 1 0 1 0
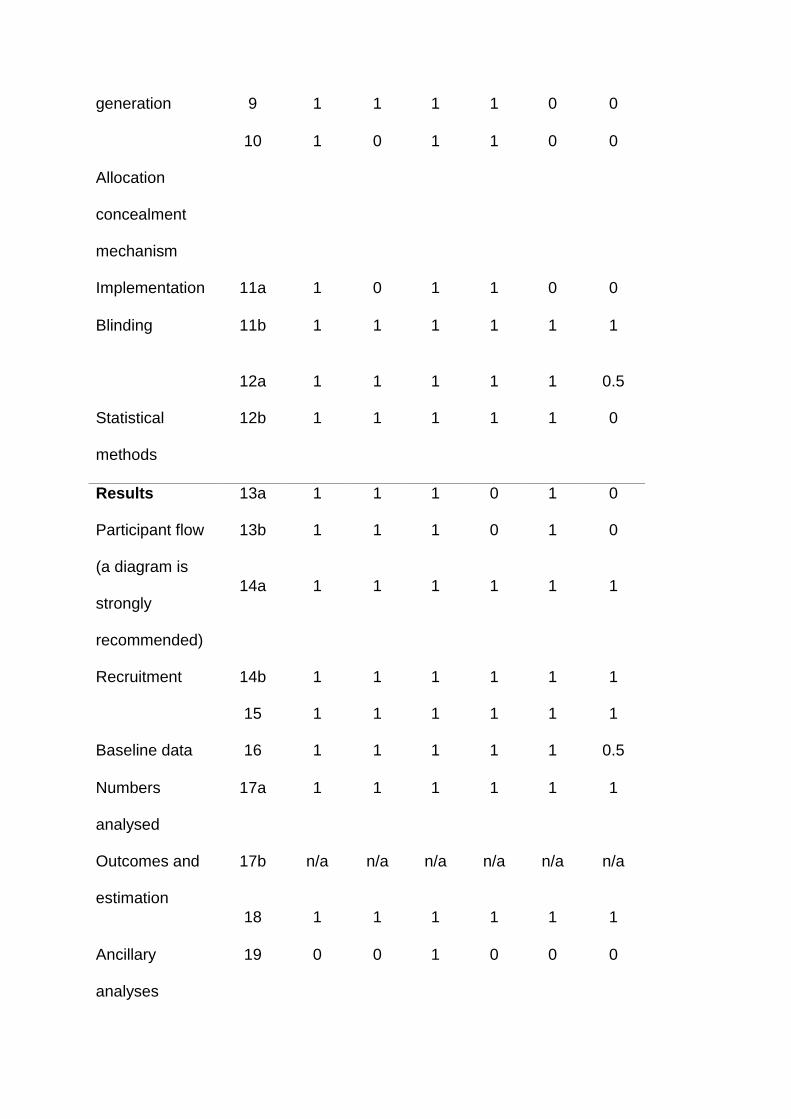
14a 1 1 1 1 1 1
Recruitment 14b 1 1 1 1 1 1
15 1 1 1 1 1 1
Baseline data 16 1 1 1 1 1 0.5
Numbers
analysed
17a 1 1 1 1 1 1
Outcomes and
estimation
17b n/a n/a n/a n/a n/a n/a
18 1 1 1 1 1 1
Ancillary
analyses
19 0 0 1 0 0 0
Harms
Discussion 20 1 1 1 1 1 1
Limitations 21 1 1 1 1 1 1
Generalisability 22 1 1 1 1 0 1
Interpretation
Other
information
23 0 1 1 1 1 1
Registration 24 0 1 1 1 1 1
Protocol 25 1 0 0 0 0 0
Funding 1 0 0 0 0 0 0
TOTAL 30 31 32 29 25 16.5
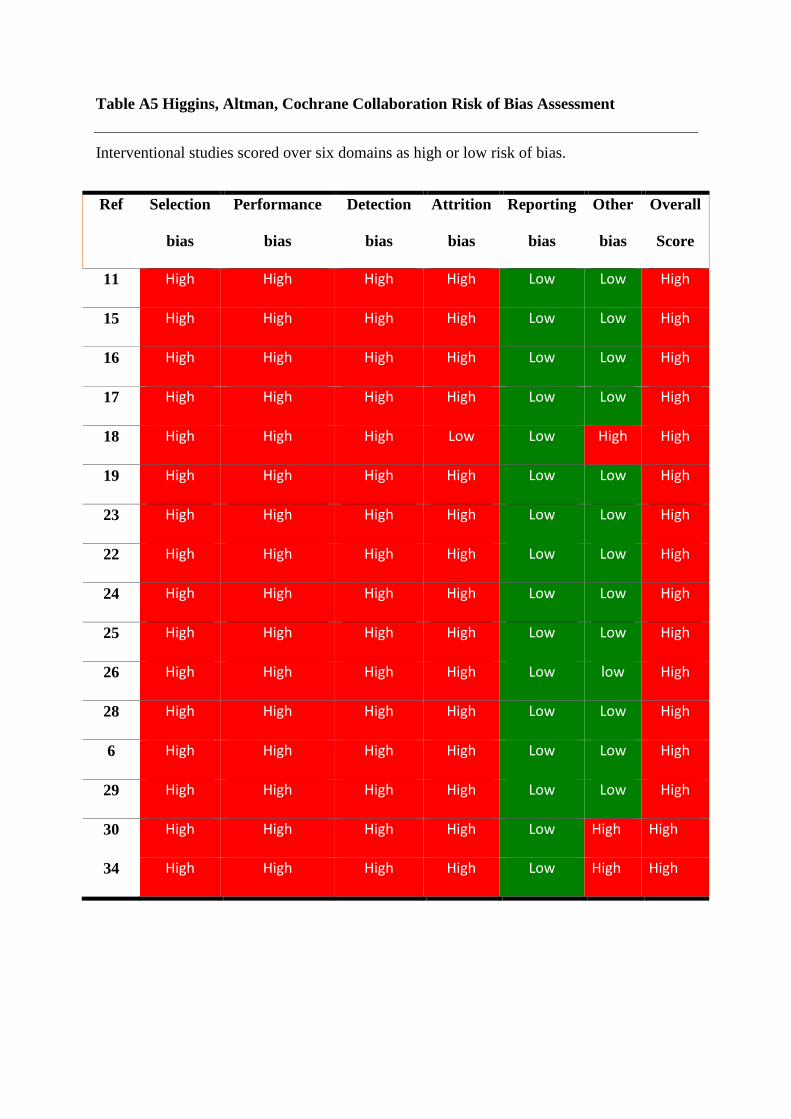
Table A5 Higgins, Altman, Cochrane Collaboration Risk of Bias Assessment
Interventional studies scored over six domains as high or low risk of bias.
Ref
Selection
bias
Performance
bias
Detection
bias
Attrition
bias
Reporting
bias
Other
bias
Overall
Score
11 High High High High Low Low High
15 High High High High Low Low High
16 High High High High Low Low High
17 High High High High Low Low High
18 High High High Low Low High High
19 High High High High Low Low High
23 High High High High Low Low High
22 High High High High Low Low High
24 High High High High Low Low High
25 High High High High Low Low High
26 High High High High Low low High
28 High High High High Low Low High
6 High High High High Low Low High
29 High High High High Low Low High
30 High High High High Low High High
34 High High High High Low High High