Embed Size (px)
Citation preview

Asia Petrochemical Industry Conference 2017
May 18~19, 2017
C o u n t r y R e p o r tF r o m
K O R E A
C O N T E N T S
Ⅰ. Country Report ··························································· 1
Ⅱ. Olefins & Aromatics ··············································· 15
Ⅲ. Polyolefins ································································· 26
Ⅳ. Styrenics ···································································· 31
Ⅴ. PVC ············································································· 36
Ⅵ. Synthetic Rubber ······················································ 39
Ⅶ. Synthetic Fiber Raw Materials ····························· 42
Ⅷ. Chemicals ··································································· 47
- 1 -
Ⅰ . Country Report
- 2 -
Korea Petrochemical Current Status and Prospects 1. Korean Economy’s Current Status and Prospects▢ In 2016, Korea gross domestic production (GDP) grew by 2.5%, a 0.2%p
decrease from the previous year. Domestic demands made a rebound
underpinned by favorable conditions in the construction industry, but
growth of exports blunted due to the slowdown of the Chinese economy
and the downturn trend in oil prices.
▢ This year, the Korean economy is showing signs of moderate
recovery, for example increases in employment and industrial
production, with lower oil prices contributing to stable commodity
prices. There are an increasing number of signs indicative of
economic recovery include the rebound of equipment investment and
stock markets, although the politics issues.
▢ However, there are uncertainties in overseas, including, the protective
trade and Chinese economy growth rate. With unlikely skyrockets in
domestic consumption and continued slowdown of exports, this year the
Korean economy is expected to grow in the similar pace as the previous
year, falling short of the government’s forecast of 2.5%.
< Key indicators of the Korean economy and forecasts (Unit: %) >
2016 2017 2018Annual 1st half 2nd half Annual Annual
GDP 2.7 2.4 2.6 2.5 2.8
Private consumption 2.4 1.9 1.9 1.9 2.3
Equipment investment -2.6 3.0 2.0 2.5 3.6
Construction investment 10.9 5.9 3.0 4.3 0.1
Commodity exports 0.9 2.9 2.0 2.4 2.8
Source: Bank of Korea (January 2017).

- 3 -
2. Petrochemical Industry’s Status and Prospects [2016 Status]▢ In 2016, production and demand in the three key areas of the
petrochemical industry (synthetic resin, synthetic fiber raw materials,
and synthetic rubber) were increased by front industries, whereas
export and import marked of decrease.
◦ Despite the recovery of increased production and domestic demands
in synthetic resins, the production volume was 20,931 KT, a year
on year (YoY) decrease of 0.3%, due to dull productions in
synthetic fiber raw materials and synthetic rubber.
◦ Exports were 10,773 KT, marking a 5.8% YoY decrease due to
enhanced self-reliance in China that is the biggest export market
and worsened global oversupply of synthetic fiber raw materials
and synthetic rubber.
◦ Demands increased to 11,077 KT, an 5.2% YoY increase, underpinned
by strong increases in synthetic resin demands from some front
industries such as construction.
◦ The rate of operation of domestic petrochemical industry(based on 3
major fields) decreased to 86.5%, a 0.8%p YoY decrease, affected by
sluggishness in synthetic fiber raw materials and synthetic rubber.
The synthetic resin industry enjoyed higher profitability, and its
operation rate remained high at 94.1%, a 0.9%p YoY increase.
Synthetic fiber raw materials experienced a 3.5%p YoY decrease in
the operation rate, 76.3%, due to decreased exports to the Chinese
market, and the operation rate of the synthetic rubber industry was
down to 72.4% affected by global oversupply and sluggish
production in forward industries, marking a 0.7%p YoY decrease.
* Operation rate of the three major fields (%): 87.3 (2015) 86.5 (2016) (0.8%p )
- 4 -
<Supply and demand of major petrochemical products>
(Unit: 1,000 tons)
1H 2H Total 1H 2H TotalG.R G.R G.R G.R G.R G.R
Pro 6,742 3.5% 6,653 1.2% 13,394 2.3% 6,752 0.2% 6,945 4.4% 13,697 2.3%
Exp 3,886 2.4% 3,727 -3.2% 7,612 -0.4% 3,895 0.2% 3,814 2.3% 7,709 1.3%
Imp 196 3.7% 194 6.7% 390 5.2% 189 -3.6% 198 2.2% 387 -0.7%
Dem 3,052 4.9% 3,120 7.3% 6,172 6.1% 3,046 -0.2% 3,329 6.7% 6,375 3.3%
Pro 3,301 -7.7% 3,344 -0.2% 6,645 -4.1% 3,421 3.6% 3,344 0.0% 6,765 1.8%
Exp 1,342 -20.1% 1,231 -17.2% 2,573 -18.8% 1,250 -6.8% 1,243 1.0% 2,493 -3.1%
Imp 216 -19.8% 232 -4.5% 448 -12.6% 210 -2.9% 215 -7.2% 425 -5.1%
Dem 2,176 0.3% 2,344 11.4% 4,520 5.8% 2,381 9.4% 2,315 -1.2% 4,696 3.9%
Pro 451 -11.1% 442 -6.3% 893 -8.8% 435 -3.5% 489 10.8% 924 3.6%
Exp 299 -7.2% 289 -6.0% 588 -6.6% 285 -4.7% 325 12.6% 610 3.8%
Imp 39 -12.2% 41 -9.0% 80 -10.6% 45 13.9% 34 -16.2% 79 -1.5%
Dem 191 -16.7% 194 -7.4% 385 -12.2% 195 1.9% 199 2.4% 393 2.2%
Pro 10,493 -1.0% 10,438 0.4% 20,931 -0.3% 10,608 1.1% 10,778 3.3% 21,386 2.2%
Exp 5,526 -4.7% 5,247 -7.0% 10,773 -5.8% 5,430 -1.7% 5,383 2.6% 10,813 0.4%
Imp 452 -10.3% 467 -0.6% 918 -5.6% 444 -1.7% 448 -4.1% 891 -2.9%
Dem 5,419 2.1% 5,658 8.3% 11,077 5.2% 5,622 3.7% 5,843 3.3% 11,465 3.5%
20172016
Syn.Resin
Syn.
Fiber
Raw
Mat'ls
Syn.Rubber
Total
Data: KPIANote: Production is based on sales
<Trend of Fluctuation Rate of Demand for Major Petrochemicals>
Data: KPIA
- 5 -
[Prospect of 2017]
▢ In 2017, the petrochemical industry is expected to enjoy increases in
productions and demands underpinned by favorable conditions in its
front industries and improved export market conditions.
◦ Productions are expected to reach 21,386 KT, a 2.2% YoY increase,
due to slight equipment increases, for example KPIC and reduced
NCC turn around (T/A) works. In particular, synthetic resin and
rubber productions are expected to enjoy a slight rise.
◦ Exports are expected to reach 10,813 KT, a 0.4% YoY increase, due
to positive factors such as the landing of China’s economic
slowdown and favorable conditions for the US economy.
◦ Demands are expected to reach 11,465 KT, a 3.5% YoY increase.
Increased production and investment in the construction industry
will lead to a boom in synthetic resin productions.
- 6 -
<Status and Prospect of Demand and Supply of Major Petrochemicals>
(Unit: 1,000 tons)
10 '15 '16 G.R '17P G.R AAGR( '10~'17)
Production 11,727 13,090 13,394 2.3% 13,697 2.3% 2.2%Imports 190 371 390 5.2% 387 -0.7% 10.7%Sub-Total 11,917 13,461 13,784 2.4% 14,084 2.2% 2.4%Exports 6,958 7,643 7,612 -0.4% 7,709 1.3% 1.5%Domestic Demand 4,960 5,817 6,172 6.1% 6,375 3.3% 3.7%self-effic. (%) 236 225 217 215 Production 8,582 6,928 6,645 -4.1% 6,765 1.8% -3.3%Imports 591 512 448 -12.6% 425 -5.1% -4.6%Sub-Total 9,172 7,440 7,121 -4.3% 7,190 1.0% -3.4%Exports 4,312 3,166 2,573 -18.8% 2,493 -3.1% -7.5%Domestic Demand 4,860 4,274 4,520 5.8% 4,696 3.9% -0.5%self-effic. (%) 177 162 147 144 Production 878 978 893 -8.8% 924 3.6% 0.7%Imports 71 90 80 -10.6% 79 -1.5% 1.5%Sub-Total 949 1,068 973 -8.9% 1,003 3.1% 0.8%Exports 552 630 588 -6.6% 610 3.8% 1.4%Domestic Demand 398 439 385 -12.2% 393 2.2% -0.2%self-effic. (%) 221 223 232 235 Production 21,186 20,996 20,931 -0.3% 21,386 2.2% 0.1%Imports 852 973 918 -5.6% 891 -2.9% 0.6%Sub-Total 22,038 21,969 21,878 -0.4% 22,227 1.6% 0.1%Exports 11,821 11,439 10,773 -5.8% 10,813 0.4% -1.3%Domestic Demand 10,217 10,529 11,077 5.2% 11,465 3.5% 1.7%self-effic. (%) 207 199 189 187
Syn.Rubber
Syn. Resin
Syn. Fiber Raw Mat' ls
Total
Data: KPIA

- 7 -
□ Trend of Supply and Demand for Each Field
(1) Synthetic resin
[Status of 2016]
▢ In 2016, the synthetic resin industry in Korea marked increases in
production and demand underpinned by construction investment.
◦ Productions were 13,394 KT, a 2.3% YoY increase, thanks to
increased productions following ABS equipment expansions,
improved export market conditions, and favorable conditions in the
appliances and automotive industries.
In particular, ABS enjoyed a high, 9.2% YoY increase underpinned
by equipment expansions.
◦ Exports decreased to 7,612T, a 0.4% YoY decrease. HDPE, PVC, and
EPS marked significant decreases, whereas ABS exports increased
by 8.5%, respectively, compared to the previous year. Synthetic
resin exports to China accounted for 33.9% of the total exports
with a 0.3%p YoY decrease. Exports to Vietnam made a sudden
rise of 11.8%. Exports to Malaysia and Indonesia increased 23.8%,
21.2% YoY too.
◦ Demands reached 6,172 KT, a 6.1% YoY increase, favored by
growth of construction material demands following the booming
construction industry, amendments to the construction regulations.
- 8 -
[Prospect of 2017]
▢ In 2017, Korean synthetic resin industry is expected to do well all in
productions, demands and exports, favored by the landing of
China’s demand, growth led by advanced economies, and stronger
cost competitiveness underpinned by low oil prices.
◦ Productions are expected to reach 13,697 KT, a 2.3% YoY increase,
thanks to increases in small production facilities, reductions in NCC
T/A, and an improved operation rate following predictions for the
tight ethylene supply and demand in Asia.
◦ Exports are expected to reach 7,709 KT, a 1.3% YoY increase, led
by increases in PE, PP, ABS exports owing to stronger export
competitiveness following declines in raw material prices (naphtha,
etc.) affected by the low oil price.
◦ Demands are expected to be 6,375 KT, a 3.3% YoY increase, thanks
to the expected increases in construction materials demands
following the continued upturn in the nation’s construction market.
<Status of Synthetic Resin Demands and Supply>
(Unit: 1,000 tons)
Total 1H 2H Total TotalG.R G.R G.R G.R G.R
Pro 13,024 3.8% 6,742 3.5% 6,653 1.2% 13,394 2.3% 13,697 2.3%
Exp 7,651 1.0% 3,886 2.4% 3,727 -3.2% 7,612 -0.4% 7,709 1.3%
Imp 371 4.8% 196 3.7% 194 6.7% 390 5.2% 387 -0.7%
Dem 5,745 8.0% 3,052 4.9% 3,120 7.3% 6,172 6.1% 6,375 3.3%
20172015 2016
Syn.Resin
Data: KPIANote: Production is based on sales
- 9 -
(2) Synthetic Fiber Raw Materials
[Status of 2016]
▢ In 2016, Korean synthetic fiber raw material productions made a
4.1% YoY decrease to 6,645 KT, although the demands increased by
5.8% compared to the previous year, 4,520 KT.
◦ Productions marked a 4.1% YoY decrease, 6,645 KT, due to a
decline in the operation rate affected by China’s stronger
self-reliance in TPA. But DMT productions increased owing to the
completion of SK Petrochemical’s 60 KT expansion project at the
June of 2016 and growth of the local market, respectively.
◦ Exports decreased by 18.8% compared to the previous year,
2,573KT. Continued declines were observed in the TPA which is
suffering from oversupplies in China.
- Exports of synthetic fiber raw materials to China decreased by
31.3% compared to the previous year, 756 KT. In particular, TPA
exports experienced severe sluggishness including continued
declines in the Chinese market, which surrendered its position as
the biggest export market to Lithuania.
- Upon the anti-dumping regulation against TPA, exports to China
and India decreased by 73.2%, 52.8% to the previous year.
◦ Demands decreased to 4,520 KT, a 5.8% YoY increase affected by
downturns in the front industries.
- 10 -
[Prospect of 2017]
▢ In 2017, the synthetic fiber raw material industry is expected to rise
in productions and demands.
◦ Productions are expected to increase to 6,765 KT, marking a 1.8%
YoY increase because of base effect by TPA, and expansion project
of DMT. CPLM market will be improved than previous year.
◦ Exports are expected to be 2,493 KT, a 3.1% YoY decrease. There
are increasing oversupplies in the Chinese market, which is also
experiencing economic recessions. The second largest market, India,
is becoming increasingly self-reliant underpinned by equipment
expansion and import regulations.
◦ Demands are expected to mark a 3.9% YoY increase, 4,696 KT.
<Status of Synthetic Fiber Raw Materials Demands and Supply>
(Unit: 1,000 tons)
Total 1H 2H Total TotalG.R G.R G.R G.R G.R
Pro 6,941 -6.7% 3,301 -7.7% 3,344 -0.2% 6,645 -4.1% 6,765 1.8%
Exp 3,170 -9.7% 1,342 -20.1% 1,231 -17.2% 2,573 -18.8% 2,493 -3.1%
Imp 521 -11.4% 216 -19.8% 232 -4.5% 448 -12.6% 425 -5.1%
Dem 4,291 -5.0% 2,176 0.3% 2,344 11.4% 4,520 5.8% 4,696 3.9%
2015 2016 2017
Syn.
Fiber
Raw
Mat'ls
Data: KPIANote: Production is based on sales
- 11 -
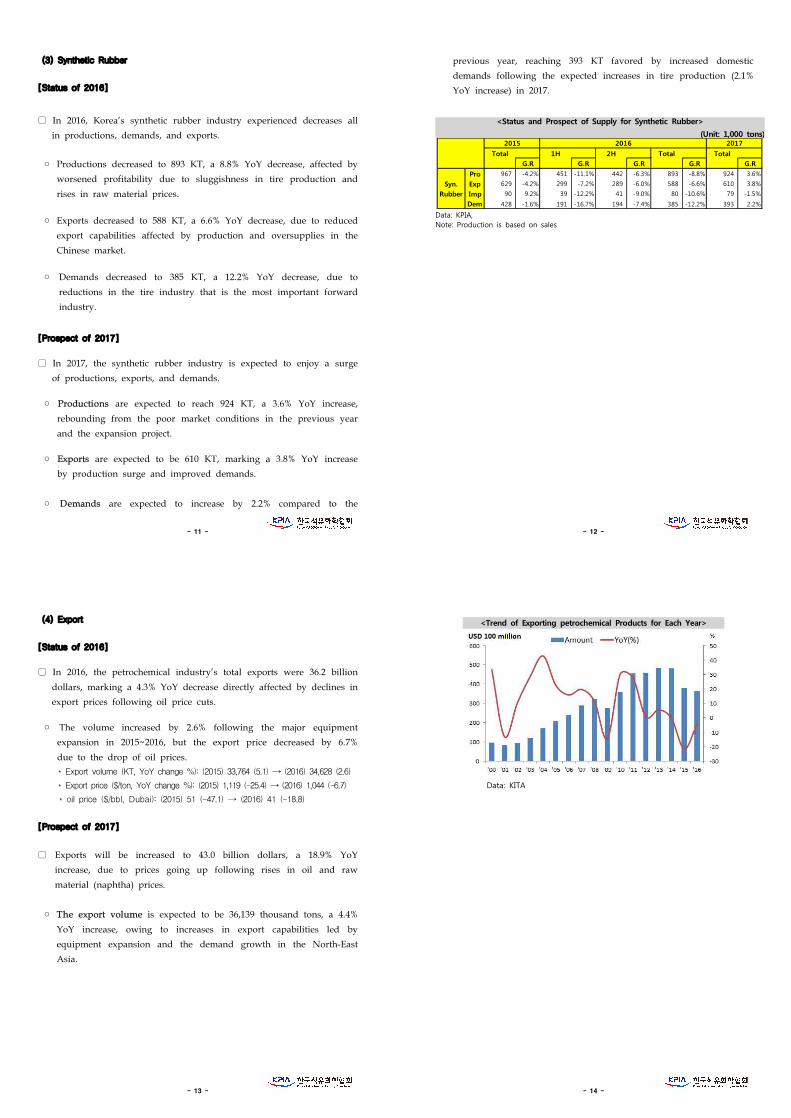
(3) Synthetic Rubber
[Status of 2016]
▢ In 2016, Korea’s synthetic rubber industry experienced decreases all
in productions, demands, and exports.
◦ Productions decreased to 893 KT, a 8.8% YoY decrease, affected by
worsened profitability due to sluggishness in tire production and
rises in raw material prices.
◦ Exports decreased to 588 KT, a 6.6% YoY decrease, due to reduced
export capabilities affected by production and oversupplies in the
Chinese market.
◦ Demands decreased to 385 KT, a 12.2% YoY decrease, due to
reductions in the tire industry that is the most important forward
industry.
[Prospect of 2017]
▢ In 2017, the synthetic rubber industry is expected to enjoy a surge
of productions, exports, and demands.
◦ Productions are expected to reach 924 KT, a 3.6% YoY increase,
rebounding from the poor market conditions in the previous year
and the expansion project.
◦ Exports are expected to be 610 KT, marking a 3.8% YoY increase
by production surge and improved demands.
◦ Demands are expected to increase by 2.2% compared to the
- 12 -
previous year, reaching 393 KT favored by increased domestic
demands following the expected increases in tire production (2.1%
YoY increase) in 2017.
<Status and Prospect of Supply for Synthetic Rubber>
(Unit: 1,000 tons)
Total 1H 2H Total TotalG.R G.R G.R G.R G.R
Pro 967 -4.2% 451 -11.1% 442 -6.3% 893 -8.8% 924 3.6%
Exp 629 -4.2% 299 -7.2% 289 -6.0% 588 -6.6% 610 3.8%
Imp 90 9.2% 39 -12.2% 41 -9.0% 80 -10.6% 79 -1.5%
Dem 428 -1.6% 191 -16.7% 194 -7.4% 385 -12.2% 393 2.2%
Syn.Rubber
2015 2016 2017
Data: KPIA,Note: Production is based on sales
- 13 -
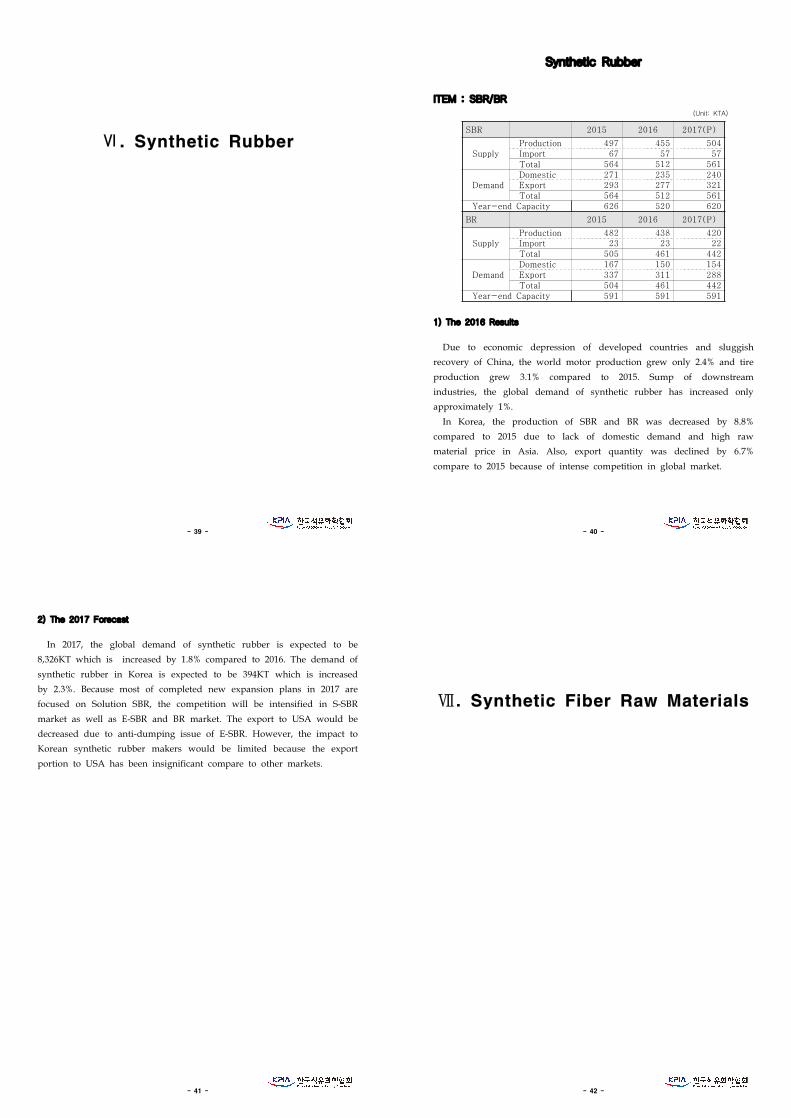
(4) Export
[Status of 2016]
▢ In 2016, the petrochemical industry’s total exports were 36.2 billion
dollars, marking a 4.3% YoY decrease directly affected by declines in
export prices following oil price cuts.
◦ The volume increased by 2.6% following the major equipment
expansion in 2015~2016, but the export price decreased by 6.7%
due to the drop of oil prices.
* Export volume (KT, YoY change %): (2015) 33,764 (5.1) → (2016) 34,628 (2.6)
* Export price ($/ton, YoY change %): (2015) 1,119 (-25.4) → (2016) 1,044 (-6.7)
* oil price ($/bbl, Dubai): (2015) 51 (-47.1) → (2016) 41 (-18.8)
[Prospect of 2017]
▢ Exports will be increased to 43.0 billion dollars, a 18.9% YoY
increase, due to prices going up following rises in oil and raw
material (naphtha) prices.
◦ The export volume is expected to be 36,139 thousand tons, a 4.4%
YoY increase, owing to increases in export capabilities led by
equipment expansion and the demand growth in the North-East
Asia.
- 14 -
<Trend of Exporting petrochemical Products for Each Year>
Data: KITA

- 15 -
Ⅱ. Olefins & Aromatics
- 16 -
Olefins & Aromatics1. Olefins (Ethylene, Propylene, Butadiene)
ITEM : Ethylene (Unit: KTA)
2015 2016 2017(P)Supply
Production 8,275 8,524 8,735 Import 201 147 135Total 8,476 8,671 8,870
DemandDomestic 7,842 7,918 8,000Export 634 753 870Total 8,476 8,671 8,870
Year-end Capacity 8,640 8,670 9,000
1) The 2016 ResultsEthylene balance was kept tight in Asia and ethylene price was
continuously rising due to the strong demand in downstream such as
SM and VCM. Also, Crackers had reduced production due to T/As,
Asahi Kasei NCC plant scrap, unplanned S/D and Shell’s long term
trouble.
Due to the strong demand in Asia, production in Korea was increased
by 250KTA year on year.
2) The 2017 ForecastWhile the ethylene balance in Asia was tight due to the reduction of
MTO operation rate and start-up of stand-alone derivatives from the
first half. However, the balance will be changed to even or long
position from second half of the year due to the North America ECC
start up and it could affect both side of monomer and polymer. Also, Korean
cracker (KPIC) will be revamped in June, and increasing monomer production.
- 17 -
ITEM : Propylene (Unit: KTA)
2015 2016 2017(P)Supply
Production 6,981 7,462 7,650Import 449 265 245Total 7,430 7,728 7,895
DemandDomestic 6,172 6,037 6,248Export 1,258 1,690 1,647 Total 7,430 7,728 7,895
Year-end Capacity 7,604 8,204 8,420
1) The 2016Results
After SK Advanced (PDH 600KTA) start up in early 2016, the balance
in Korea was expected to be over–supplied. However, the over-supply
compensated most of production trouble at Chinese units and reduction
of OCU operation rate. Also, market demand was increased due to
good economics of downstream, such as PP, AN. The import volume
had decreased compared to previous year.
2) The 2017 Forecast
During the first half of 2017, propylene balance was tight due to
limited expansion, supply decreased with T/A in NEA and prolonged
derivatives economic benefits. However, the production will be
increased due to the new Chinese C/MTO and KPIC’s expansion and
less T/A from second half of the year. And also the economics of
demand will be getting worse. So, production increase will be larger
than demand growth.
- 18 -
ITEM : Butadiene (Unit: KTA)
2015 2016 2017(P)Supply
Production 1,188 1,235 1,275 Import 426 410 398 Total 1,614 1,645 1,673
DemandDomestic 1,458 1,490 1,512 Export 155 156 161Total 1,614 1,645 1,673
Year-end Capacity 1,322 1,322 1,322
1) The 2016 Results
There were some troubles of BD plants in Southeast Asia and more
T/A in Northeast Asia than usual.
Particularly China, demand was very strong due to increasing domestic
car sales and production in 4Q 2016. So BD balance in Northeast Asia
was very tight and price surged.
2) The 2017 Forecast
BD demand is expected to increase slightly in accordance with tire
industry growth(Rubber demand increase : 2 ~ 3%). There are T/A
plans in 2Q, Korea, which are SK Global(NCC 190KTA), KPIC(NCC
470KTA) and YNCC(BD 220KTA). So BD balance in Asia will be tight
in 2Q of this year.
But Opal’s new BD plant has been started in Feb and Sailboat,
Ningmei also will start in first half, Thus supply tightness could be
eased year on year.

- 19 -
2. Aromatics (Benzene, Toluene, Xylene)
ITEM : Benzene (Unit: KTA)
2015 2016 2017(P)Supply
Production 6,058 5,827 6,200Import 47 93 80Total 6,105 5,921 6,280
DemandDomestic 3,523 3,817 3,950Export 2,582 2,103 2,330Total 6,105 5,921 6,280
Year-end Capacity 6,443 6,919 7,059
1) The 2016 Results
Despite the new capacity of Hyundai Chemical in October, Benzene
production has been decreased to 5,827 KTA in 2016 compared to 6,058
KTA in 2015, due to the T/As of GS Caltex, Lotte Chemical, Hanwha
TOTAL, SKGC, UAC, YNCC and OCI.
In 2016, the domestic demand has been increased by 294 KT mainly
due to the expansion of the phenol plant of Kumho P&B as well as
decreased SM plants T/As from 2015.
2) The 2017 Forecast
The production volume in 2017 is expected to be increased to 6,200
KT from 5,827 KT in 2016. Although some of the reformers as well as
crackers have planned T/A in 2017, the Benzene loss by the T/A will
be less than the previous year. And there are some additional volume
from Hyundai Chemical which started its commercial production from
last October, S-Oil, KPIC and Hanwha-TOTAL which have T/A for
revamping in 1st half of the year.
- 20 -
Although most of the local SM plants have planned T/As including
LG Chemical, Hanwha-TOTAL, Lotte Chemical and YNCC, the demand
is expected to be increased by 133 KT. The main reason for the
increase is the phenol plant of Kumho P&B which is operating from
year 2016.
- 21 -
ITEM : Toluene (Unit: KTA)
2015 2016 2017(P)Supply
Production 1,583 1,722 1,760Import 760 561 550Total 2,343 2,283 2,310
DemandDomestic 1,921 1,751 1,800Export 422 533 510Total 2,343 2,283 2,310
Year-end Capacity 2,251 2,261 2,276
1) The 2016 Results
After the major PX expansion in 2014, a majority of Toluene
productions were supplied to TDP and STDP, But Heavy T/A and
Troubles in Domestic PX producer decreased domestic Toluene demand.
Accordingly, exports increased to 25% compared to the previous year,
whereas imports decreased by 26% due to heavy T/A and Troubles in
domestic PX Producer. In the beginning of 2016, they say strong
gasoline blending demand may overwhelm Toluene market, However
technically Blending demand was not that strong beyond expectation.
2) The 2017 Forecast
Unexpectedly, robust BZ market leads Toluene demand from
petrochemical sector by high TDP operation rate. Futhermore, Hanhwa
Total and Hyundai chemical intends to rise up TDP operation by
consuming domestic Toluene within local Refining/Petrochemical
complex such as Daesan.
Nevertheless Strong demands for gasoline and PX in China will lead
to stimulate exports to the Chinese market, so it seems to stay tight
balance inside domestic market.
- 22 -
ITEM : Mixed Xylene (Unit: KTA)
2015 2016 2017(P)Supply
Production 2,688 3,063 3,150Import 1,830 1,838 1,850Total 4,519 4,902 5,000
DemandDomestic 3,295 3,878 3,950Export 1,224 1,024 1,050Total 4,519 4,902 5,000
Year-end Capacity 3,313 4,320 4,325
1) The 2016 Results
Northeast Asian mixed xylenes supply had been ample with high
operation and Hyundai chemical in S.Korea Started up Nov, 2016 and
MX balance certainly changed to long. It, MX Spread with Naphtha
was larger at around $270 per mt in August 2016 and the 2016 annual
average was around $250 per mt. The mixed xylenes margin has down
significantly since then.
Furthermore, China started up a large mixed xylenes capacity in East
China and it means that China has enough reformer-based mixed
xylenes for high PX operation and In addition, China’s dependency on
imported isomer mixed xylenes became very small.
2) The 2017 Forecast
We can describe the current 2017 MX market only this word
“Surplus”, as the Benzene/MX and toluene price spread has increased
due to the relatively strong benzene price, the MX margin from TDP
based on the market Toluene price has continued to improve
substantially. Since last december, the TDP MX margin has been
positive.

- 23 -
Actually, The MX market had been tight since mid-2015, but it has
recently become longer, the US MX price has decreased in line with
toluene. Consequently, the price spread between the United States and
Asia has decreased and the arbitrage window for Asian MX to the
United States has been closed.
Whereas, there will be something what the current situation could be
changed from May by several Japanese MX Suppliers will undertake
turnarounds. Their total production loss might be around 120KTA in
May and June. In the second quarter, the Northeast Asian MX market
will be firmer, however after that the balance might be come back to
long. The key factor is clearly PX economics.
- 24 -
ITEM : Para Xylene
(Unit: KTA)
2015 2016 2017(P)Supply
Production 8,915 9,484 9,550Import 84 44 50Total 8,998 9,527 9,600
DemandDomestic 3,136 3,093 3,100Export 5,862 6,435 6,450Total 8,998 9,527 9,550
Year-end Capacity 10,080 10,336 10,507
1) The 2016 Results
In 1Q 2016, PX price rose to $800/MT from $700/MT due to
expectations for the Mogas market and some PX plants’ T/A. In
addition, new PTA plant’s start-up (Hanbang, 2,200KTA) in china at the
end of 1Q led to supply/demand tightness.
However, when PX price reached $800/MT and PX/Naphtha spread
reached $400/MT, PX producers, PTA producers and some Traders had
started PX/Naphtha spread hedging play. As a result, PX price had
moved from $780/MT to $820/MT range from 2Q to early 4Q. In 4Q,
PX supply and demand remained long due to T/A by major PTA
companies, but PX price had risen due to OPEC’s production reduction
agreement.
2) The 2017 Forecast
In 1Q 2017, PX price stared to rise with oil price hikes and solid
polyester demand. However, in mid-March, the PX price declined due
to the sharp price drop in the Chinese futures market following
- 25 -
uncertainties in oil prices and the shrinking liquidity in China, and also
high PTA inventory and Reliance’s PX selling to Asia made PX price to
drop.
Nevertheless we expect PX price and spread in 2Q to recover on the
back of PTA supply/demand rebalancing due to T/A of PTA producers
in April and increased demand expectation of mogas and polyester
market.
In 2H 2017, PX price will expected to be weak because of oversupply
which is new start-up of Nghi Son PX(700KTA) in Vietnam and impact
of Reliance’s (2,200KTA) PX selling from India.
- 26 -
Ⅲ . Polyolefins

- 27 -
PolyolefinsITEM : LDPE (including L-LDPE, EVA)
(Unit: KTA)
2015 2016 2017(P)Supply
Production 2,667 2,703 2,754Import 117 121 119Total 2,784 2,824 2,873
DemandDomestic 1,223 1,289 1,347Export 1,561 1,535 1,526Total 2,784 2,824 2,873
Year-end Capacity 2,700 2,720 2,760
1) The 2016 Results
In 2016, the total domestic LDPE production (including LLDPE/EVA) had
increased by 1.3% (2,703KT) compared to 2015, as Hanwha Total expanded
the production capacity in 4Q 2016 and the capacity will be increase by
40,000mt/year. The total amount of imported LDPE products were similar to
that of in year 2015. Domestic demand of LDPE had increased by 5.4% with
global economy recovery and china demand, as the Chinese government
continues to promote self-reliance on petrochemical products.
2) The 2017 Forecast
LDPE in Northeast Asia will continue to expand at an average rate of
4.0% per year until 2021. Its growth rate is supported by China’s high
ethylene vinyl acetate (EVA) demand growth. During the past few years,
EVA demand in China grew at more than 10% each year.
Northeast Asia LLDPE demand are forecast to expand at an average
annualized growth rate around 5.5% per year over the next five years.
especially high-valued mLLDPE for packaging, is expected to grow at a
- 28 -
faster rate with competitive pricing. Although China has a small plant for
mLLDPE, this rapidly growing demand will be entirely met by imports
during the forecast years.
In Korea, the total domestic LDPE production will be 2,754KT, increase by
1.8%. Hanwha Total revamped up 40KT(EVA) in 4Q 2016 could influenced
on domestic demand.
- 29 -
ITEM : HDPE (Unit: KTA)
2015 2016 2017(P)Supply
Production 2,184 2,129 2,193Import 49 55 55Total 2,233 2,184 2,248
DemandDomestic 1,028 1,071 1,125Export 1,205 1,112 1,123Total 2,233 2,183 2,248
Year-end Capacity 2,385 2,385 2,385
1) The 2016 Results
In 2016, Korea’s HDPE production was decreased by 2.5% at 2,129
thousand ton compared to 2015 according to the Turn-around such as Lotte
Chemical, SK Global Chemical, Daelim etc.
The domestic demand was increased by 4.2% due to the recovered domestic
economy. The export volume was decreased by 7.7% beacause of less
production and slow down of global trade.
2) The 2017 Forecast
In 2017, There will be a few scheduled T/A compared to last year.
Production is expected to be 2,193 thousand ton which is increased by 3.0%
compared to previous year.
The domestic demand is expected to be moderated due to the stable oil
price and market environment. But the export volume will be similar to
previous year. Chinese high self-sufficiency rate will limit the import volume
growth from Korea.
- 30 -
ITEM : PP (Unit: KTA)
2015 2016 2017(P)Supply
Production 4,051 4,088 4,277Import 31 29 29Total 4,082 4,116 4,306
DemandDomestic 1,570 1,569 1,600Export 2,512 2,548 2,706Total 4,082 4,116 4,306
Year-end Capacity 4,257 4,257 4,457
1) The 2016 Results
In 2016, the domestic production of PP was 4,088KT, increased by 0.9%
compared to 2015. The import of PP was 29KT, which is similar with 2015.
Domestic demand of PP was 1,569KT, increase by 4.7% due to lower
feedstock price with recovery of construction and car industry. PP export
volume was slightly increased by 1.4% in 2016.
2) The 2017 Forecast
Northeast Asia is the world’s largest PP producing region, holding about
40% of global nameplate capacity in 2016. The capacity will continue to
expand in the next five years, and it is expected to capture almost 43% of
the global capacity by the end of 2021.
Northeast Asia captured 42% of the global PP consumption in 2016 and
remained the number-one demand region in the world. The proportional
demand share is expected to further expand in the next five years to more
than 44% by 2021.
In Korea, Hyosung started up their 200KTA plant on Jan 2017 in Ulsan and
S-oil has the plan to new plant operation for 400KTA in end of 2017. Those
expansion would have effect on domestic market.

- 31 -
Ⅳ . Styrenics
- 32 -
StyrenicsITEM : PS
(Unit: KTA)
2015 2016 2017(P)Supply
Production 591 628 670Import 31 27 25Total 622 654 695
DemandDomestic 314 349 359Export 309 300 267Total 623 649 626
Year-end Capacity 726 741 686
1) The 2016 Results
The production was 670 thousand tons, 6.1% higher than that in 2015
due to sales increase in domestic market.
The demand was 649 thousand tons, 4.1% higher than that in 2015
mainly came from 11.1% YoY increase in domestic sales.
2) The 2017 Forecast
The production will be 7.5% lower than that in 2016 due to LGC
HIPS business withdrawal. The demand will be 2.9% higher than that
in 2016 mainly came from 11.6% YoY increase in domestic construction
demand.
- 33 -
ITEM : ABS (Unit: KTA)
2015 2016 2017(P)Supply
Production 1,684 1,841 1,822Import 6 10 10Total 1690 1,851 1,832
DemandDomestic 445 499 527Export 1,246 1,352 1,305Total 1,690 1,851 1,832
Year-end Capacity 1,786 1,936 2,031
1) The 2016 Results
2016 ABS Domestic production was increased 9.3% YoY to 1,841kT by
automotive demand and 150kT expansion of LG chem.
Demand for both domestic and exports grew by 9.5% YoY to 1,851kT.
Exports to US, Mexico, Thailand and Vietnam increased nearly 20% led
the exports growth.
2) The 2017 Forecast
Domestic capacity is expected to increase additional 95kT in 2017. LG
chem and Lotte advanced materials are planning to expansion.
However, production will decrease by 19kT due to other maker's T/A
plan.
- 34 -
ITEM : SM (Unit: KTA)
2015 2016 2017(P)Supply
Productio.n 2,903 3,041 2,970Import 779 806 844Total 3,682 3,847 3,814
DemandDomestic 2,435 2,554 2,592Export 1,247 1,293 1,222Total 3,682 3,847 3,814
Year-end Capacity 3,266 3,266 3,266
1) The 2016 Results
Due to relatively less SM T/A than last year, Korean SM production
was 3,041KT (+4.8%), and export volume was 1,293KT (+3.7%).
* LG Daesan (170KT) : 5/9 ~ 5/26 T/A (Loss : -8KT)
* HTC #2 (650KT) : 9/28 ~ 10/17 T/A (Loss : -36KT)
* SKGC (405KT) : 11/8 ~ 12/5 T/A (Loss : -31KT)
※ Total T/A Loss : -75KT
Korean domestic demand was 2,554KT (+4.9%).
* LG Chem expanded 100KT on their ABS plant from Oct., 2015.
SM-Naphtha spread increased to $750~800 in March & April due to lots
of SM T/A, but it decreased to $550 level due to new SM S/U (Xinri
#2, Ningbo Daxie) in June and the expectation for weak demand of Q4
in September. However, it rebounded again over $700 in November and
December as per Unexpected SM plants’trouble (Westlake, Styrolution)
in USA.
2) The 2017 Forecast
Most of SM producers in Korea except SKGC have T/A plan in

- 35 -
2017. So, estimated production would be decreased to 2,970KT (-2.3%).
* LG Yesou (500KT) : 3/8 ~ 4/12 T/A (Loss : -49KT)
* HTC #1 (400KT) : 4/16 ~ 5/1 T/A (Loss : -18KT)
* LOTTE (580KT) : 5/15 ~ 6/14 T/A (Loss : -49KT)
* YNCC (290KT) : 5/29 ~ 6/23 T/A (Loss : -21KT)
* LG Daesan(170KT):10/23 ~ 11/10T/A (Loss: -9KT)
※ Total T/A Loss : -146KT
Korean domestic demand would be 2,592KT (+1.5%) amid no expansion
plan. SM-Naphtha spread would be strong during 1st
half of 2017 due
to lots of SM T/A, but it would decrease during the 2nd
half of 2017
as per new SM plants’S/U in China. (Qingdao Jianye, Ningbo Keyuan)
- 36 -
Ⅴ. PVC
- 37 -
PVCITEM : PVC
(Unit: KTA)
2015 2016 2017(P)Supply
Production 1,508 1,538 1,520Import 119 121 115Total 1,627 1,659 1,635
DemandDomestic 1,038 1,124 1,115Export 589 535 520Total 1,627 1,659 1,635
Year-end Capacity 1,540 1,540 1,540
1) The 2016 Results
Lowered-oil price made ethylene based PVC price competitive
compared to previous year. Korean Domestic PVC demand increased by
8.2% in 2016 mainly driven by increasing demand in construction sector
such as Window profile & Pipes.
2) The 2017 Forecast
Lower-oil prices will continue in 2017 and Korean domestic demand
will remain stable but slowing down growth of China will affect PVC
regional demand negatively. It is expected that China’s PVC export
volume will increase continuously and may become one of the largest
PVC exporter in the region.
- 38 -
ITEM : VCM (Unit: KTA)
2015 2016 2017(P)Supply
Production 1,583 1,605 1,597Import 6 14 8Total 1,589 1,619 1,605
DemandDomestic 1,511 1,540 1,530Export 78 79 75Total 1,589 1,619 1,605
Year-end Capacity 1,630 1,630 1,630
1) The 2016 Results
Overall, domestic demand slightly increased in 2016 as the demand
for self – consumption increased. In Korea, domestic demand mostly
accounted for self-consumption to produce PVC.
Asahimas, an Indonesian producer, expended its VCM capacity by
double to 800,000 metric tons per year in 2016. Asian VCM market
balance will be shifting to ‘loose’ position. As a result, a price spread
between PVC and VCM was widened compared to previous year.
2) The 2017 Forecast
There will be no significant change of VCM supply-demand balance
in Korea, 2016, except that total export volume is expected to show a
slight increase with more VCM production compared to last year’s.
Considering VCM expansion in Indonesia scheduled to start up in
March 2016, Asian VCM market balance will be shifting to ‘loose’
position. As a result, a price spread between PVC and VCM is likely to
be widened, which will lead to an increase of VCM trading volume.
- 39 -
Ⅵ. Synthetic Rubber
- 40 -
Synthetic Rubber
ITEM : SBR/BR (Unit: KTA)
SBR 2015 2016 2017(P)Supply
Production 497 455 504Import 67 57 57Total 564 512 561
DemandDomestic 271 235 240Export 293 277 321Total 564 512 561
Year-end Capacity 626 520 620BR 2015 2016 2017(P)
SupplyProduction 482 438 420Import 23 23 22Total 505 461 442
DemandDomestic 167 150 154Export 337 311 288Total 504 461 442
Year-end Capacity 591 591 591
1) The 2016 Results
Due to economic depression of developed countries and sluggish
recovery of China, the world motor production grew only 2.4% and tire
production grew 3.1% compared to 2015. Sump of downstream
industries, the global demand of synthetic rubber has increased only
approximately 1%.
In Korea, the production of SBR and BR was decreased by 8.8%
compared to 2015 due to lack of domestic demand and high raw
material price in Asia. Also, export quantity was declined by 6.7%
compare to 2015 because of intense competition in global market.
- 41 -
2) The 2017 Forecast
In 2017, the global demand of synthetic rubber is expected to be
8,326KT which is increased by 1.8% compared to 2016. The demand of
synthetic rubber in Korea is expected to be 394KT which is increased
by 2.3%. Because most of completed new expansion plans in 2017 are
focused on Solution SBR, the competition will be intensified in S-SBR
market as well as E-SBR and BR market. The export to USA would be
decreased due to anti-dumping issue of E-SBR. However, the impact to
Korean synthetic rubber makers would be limited because the export
portion to USA has been insignificant compare to other markets.
- 42 -
Ⅶ. Synthetic Fiber Raw Materials

- 43 -
Synthetic Fiber Raw Materials
ITEM : AN (Unit: KTA)
2015 2016 2017(P)Supply
Production 670 710 740 Import 105 135 170 Total 775 845 910
DemandDomestic 550 600 660 Export 243 241 260 Total 793 841 920
Year-end Capacity 850 850 850
1) The 2016 Results
Compared to 2015, domestic AN demand in Korea was increased 9%
mainly due to improved ABS demand but Export was stable as new
plants in China had operated well.
In terms of Supply, production and Import was increased 6% and 29%
respectively for recovery of the demand.
2) The 2017 Forecast
Domestic demand is expected to grow 10% in accordance with
positive outlook in ABS and strong growth in other derivatives’ sectors.
Export also will be expanded by 8% for the same reason.
Meanwhile, supply will rise by 8% because of the increased quantities
in import and T/A period shortening.
- 44 -
ITEM : Caprolactam (Unit: KTA)
2015 2016 2017(P)Supply
Production 92 176 215Import 84 36 10Total 175 212 225
DemandDomestic 171 175 170Export 4 37 55Total 175 212 225
Year-end Capacity 270 270 270
1) The 2016 Results
The industry’s leading suppliers carried out production reductions in
response to the enduring oversupplied market conditions, while Capro
Corp. increased production in an effort to expand overseas market.
2) The 2017 Forecast
The over-supplied market is expected to be more-balanced, following
production reductions by major suppliers.
- 45 -
ITEM : MEG (Unit: KTA)
2015 2016 2017(P)Supply
Production 1,279 1,222 1,265Import 323 276 276Total 1,602 1,498 1,541
DemandDomestic 1,015 1,017 1,053Export 587 481 489Total 1,602 1,498 1,541
Year-end Capacity 1665 1,665 1,665
1) The 2016 ResultsDue to the high price of raw material, EG market was sluggish in
2016. Operation rate has declined for 3.4% from 76.8% in last year.
Production was decreased by 4.5% at 1,222 thousand ton compared to
2015.
The export volume was decreased by 18.1% beacause of less
production and more sales to domestic market.
2) The 2017 ForecastThere is no change of production capacity in 2017, but the operation
rate is expected to incline due to the relatively favorable ethylene-EG
spread compared to previous year. It is expected to deepen its tightness
compared to the previous year for the supply situation in Korea with
the influence of T/A such as Lotte Chem, KPIC, LG Chem etc.
- 46 -
ITEM : TPA (Unit: KTA)
2015 2016 2017(P)Supply
Production 4,822 4,453 4,470Import - 1 1Total 4,822 4,454 4,471
DemandDomestic 2,508 2,678 2,730Export 2,314 1,776 1,741Total 4,822 4,454 4,471
Year-end Capacity 6,340 6,340 6,340
1) The 2016 Results
In 2016, the worsening of TPA margin has reduced the production by
369kt to 4,455kt in line with year 2015.
The Korean domestic demand remained relatively stable. On the other
hand, the export market competition was severe and profitability was
not good.
2) The 2017 Forecast
TPA operation in Europe, India, etc. is not good in the first half
owing to some technical issues. Korean exports will take advantage
from this return. Thus we anticipate high operation in the first half of
this year.
However, there are concerns about a possible decline in some orders
due to issues such as Turkish anti-dumping in the second half.

- 47 -
Ⅷ. Chemicals
- 48 -
ChemicalsITEM : Phthalic Anhydride
(Unit: KTA)
2015 2016 2017(P)
SupplyProduction 385 377 370Import 1 1 1Total 386 377 370
DemandDomestic 201 211 198Export 184 166 171Total 385 377 369
Year-end Capacity 405 405 405
1) The 2016 Results
DOMESTIC MARKET, Due to the growth of Non-phthalate use, the
demand for plasticizers, paints and pigments was decreased compared
to the previous year.
EXPORT MARKET, The rise of the raw material price and the rise of
the demand for the Indian market have led to a significant increase of
the international price for PA. Since the second half of the year, the
international price for PA has remained strong a tight supply in the
Chinese market caused by Chinese environmental regulation.
2) The 2017 Forecast
DOMESTIC MARKET, Demand is expected to be the same level as
last year. If the international price rise due to a tight supply of raw
materials, the domestic price be positioned to a strong level.
EXPORT MARKET, PA spread is expected to remain high level due
to the strong demand in emerging market such as India.
- 49 -
2016 Q1 Q2 Q3 Q4 Average
AA Price $311 $321 $313 $385 $333
ITEM : Acetic Acid (Unit: KTA)
2015 2016 2017(P)
SupplyProduction 520 559 531Import 6 - 12Total 526 559 543
DemandDomestic 372 376 393Export 163 177 153Total 535 553 546
Year-end Capacity 570 570 570
1) The 2016 Results
o Supply & Demand : Continuing oversupply and weak demand in general
- Supply
・ Overall Chinese AA plants kept healthy operation rate・ Chinese idled plant Henan Longyu 400kty restarted(Sep.2016)
- Demand
・ Weak demand in PTA and EA following global economy recession・ Domestic PTA operating ratio lowered to 74% (△2%, 76% in 2015)
o Price : Stable to weak but rebounded in Q4
- Overall price decreased in line with weak supply & demand
(2015 : $427 → 2016 : $333/ton)- But price rebounded from Q4 due to strong coal price for feedstock
※ Chinese coal price (Fob qinghuang dao) Jul ‘16 $65 -> Nov ‘16 $100/ton
- 50 -
2) The 2017 Forecast
o Supply & Demand : Oversupply might be somewhat digested because
of no new AA capacity expansion and demand increase
- Supply
・ No noticeable new AA plants expansion by 2020・ Supply reduction following concentrated AA plant’s shut down
- Demand
・ Demand will be recovered reflecting natural increase of demandon PTA and EA・ New demand is forcasted from Chinese new ethanol plant operation
o Price : Stable to firm
- Bullish price trend is expected because of oversupply mitigation and
strong chinese coal price.
- Stable to firm price trend will be supported by heavy turnaround
plan in several AA plants during Q2 and Q3
※ AA Price(cfr NEA) : 2016 Q4 $385 -> 2017 Q1 $427/ton

- 51 -
ITEM : Phenol (Unit: KTA)
2015 2016 2017(P)Supply
Production 943 1,032 1,120Import 120 108 40Total 1,063 1,140 1,160
DemandDomestic 832 882 860Export 275 273 300Total 1,107 1,155 1,160
Year-end Capacity 980 1,180 1,280
1) The 2016 Results
Demand
- Good and high O/R for Anone Base CPL
- Increasing Phenol demand, due to expansion for BPA
- Nearly 90% O/R of CPDC in Taiwan. BPA Expansion (Covestro)
Supply
- Despite of new expansion, tight supply from some troubles and G20
summit meeting in 2nd half
→ Expansion: KPB(300KT), PTT(250KT)
→ Trouble : Shell, PTT, CCP and so on
2) The 2017 Forecast
Demand
- Healthy demand from new Anone Base Carpro Plant
→ Shenyuan(200KT) '17.1Q, CPDC Rudong (150KA) '17.4Q
Supply
- Tight Balance in 1H by focus on T/A of main suppliers
- 52 -
- Inflow low value deep-see cargo from end of '16 makes market
down
- Overweight on new comers such as CNOOC and Petro Rabigh in 2H
→ Control possibility of oversupply, due to adjustment of O/F
considering intra-regional Maker profitability
- 53 -
ITEM : 2-Ethyle Hexanol (Unit: KTA)
2015 2016 2017(P)Supply
Production 410 410 400Import 113 156 140Total 523 566 540
DemandDomestic 402 460 480Export 92 104 56Total 494 564 536
Year-end Capacity 410 410 400
1) The 2016 Results
In 2016, C3 price had been on a strong uptrend all through the year
differently from market forecast because the majority of Asian crackers’
quadrennial planned maintenance was implemented and there were little
projected C3 expansion on stream. It caused C3 supply in the market
limited and the price remained strong and firm. On the other hand,
2EH demand and price had been weak due to the bearish market
sentiment from downstream and the 2EH oversupply condition.
Therefore, 2EH-C3 spread had kept narrowed, even reversed, making
2EH producers’ profitability worsen.
2) The 2017 Forecast
Newly expanded C3 plants (PDH/MTO) of 2 million MT are expected
to come on stream in China this year, helping C3 supply condition
improve and lowering C3 price. Meanwhile, there are few near-term
planned expansion projects of 2EH in this region. Thus, in 2017, 2EH-C3
spread is expected to get better than last year, helping 2EH profitability
recover.


![Final report - pdf version...b) Ethylene production by source. c) Propylene production by source [6] In a steam cracking plant, the process from feedstock to olefins involves many](https://img.dokumen.tips/doc/110x75/6141006783382e045471cfce/final-report-pdf-version-b-ethylene-production-by-source-c-propylene-production.jpg)


![Development of Ethanol conversion catalysts from various clays...olefins such as ethylene and diethyl ether [6, 7]. Bentonite and kaolin are the most common known clays used industrially](https://img.dokumen.tips/doc/110x75/60c7bc41ef3aae5eee7647b8/development-of-ethanol-conversion-catalysts-from-various-clays-olefins-such.jpg)