Embed Size (px)
Citation preview

Treatment of Textile Wastewater
by MBR System
Søren Gramkow Hostrup Glinvad
Master Thesis 2011 - 2012
Aalborg University


Title:Treatment of TextileWastewater by MBR system
Theme:Wastewater Treatment
Master Student:Søren Gramkow Hostrup Glinvad
Supervisor:Kristian KeidingMorten Lykkegaard Christensen
Semester:9th-10th semester
Project period:September 1st 2011 to May 31st 2012
Søren Gramkow Hostrup Glinvad
Number of copies: 4Number of pages: 47Number of appendices: 3
Abstract:
The aim of this thesis is to efficiently re-move color from textile wastewater usingMBR technology and Advanced OxidationProcesses (AOP). MBR technology is of greatinterest because of its capability to provide astable and high quality treatment. Fenton’s re-action is chosen to be used in the oxidationtreatment, since the treatment previously hasshown to effectively degrade dyes.A lab scale MBR system, located at MariborUniversity, Slovenia was used during this the-sis. The MBR system was constructed as anexternal submerged MBR system. The Fen-ton’s reaction was used to treat both the waste-water and the permeate from the MBR system.The absorbance was measured in order toevaluate the color removal of the MBR sys-tem. A clear reduction in the absorbance wasobserved in the permeate and a highly visi-ble color removal was obtained. The resultsshowed an efficient removal of COD, NH4
+,NO3
−, NO2− and total nitrogen. The treat-
ment with Fenton’s reaction on wastewaterand permeate showed efficient color removalboth before and after MBR treatment.It is concluded that MBR treatment is an ef-ficient method for the degradation of dyes intextile wastewater. With optimal operationconditions, a high removal percent of colorand nutrients can be obtained. It is concludedthat the use of AOP can further improve thequality of the permeate and increase the prob-ability of reusing the water in the dyeing pro-cess.


Titel:Rensning af TekstilSpildevand ved brug af MBR
Tema:Spildevandsbehandling
Kandidatstuderende:Søren Gramkow Hostrup Glinvad
Vejleder:Kristian KeidingMorten Lykkegaard Christensen
Semester:9.-10. semester
Projekt periode:1. September 2011 til 31. Maj 2012
Søren Gramkow Hostrup Glinvad
Oplagstal: 4Sideantal: 47Bilagstal: 3
Synopsis:
Formålet med denne afhandling er ved hjælpaf MBR-teknologi og Advanced OxidationProcesses (AOP) at reducere farveindholdet itekstilt spildevand. MBR-teknologi er af storinteresse grundet dets evne til at levere en sta-bil behandling af høj kvalitet. Som videre be-handling er det valgt at benytte Fenton’s reac-tion, idet denne behandling tidligere har visten effektiv nedbrydning af farvestoffer.I denne afhandling blev der anvendt et MBRsystem, placeret på Maribor Universitet. MBRsystemet er konstrueret som et eksternt ned-dykket MBR system. Til yderlig behandlingblev Fenton’s reagent benyttet på både spilde-vandet og permeatet fra MBR systemet.For at vurdere farvenedbrydningen i MBRsystemet blev absorbansen i permeatet målt.En tydelig reduktion i absorbansen blev ob-serveret og en tydelig farvenedbrydning blevopnået. Resultaterne viste en effektiv fjernelseaf COD, NH4
+, NO3−, NO2
− og total nitro-gen. Behandling med Fenton’s reaction påspildevand og permeat viste en effektiv far-venedbrydning både før og efter MBR behan-dlingen.Det konkluderes, at MBR behandling er eneffektiv metode til nedbrydning af farvestof-fer i tekstilt spildevand. Det er muligt atopnå en høj nedbrydningsprocent af farve ognæringsstoffer med optimale driftsbetingelser.Det konkluderes at anvendelsen af AOPyderligere kan forbedre kvaliteten af perme-atet og øge sandsynligheden for at genbrugevandet i farveprocessen.


Preface
This thesis is composed on the basis of work done at the Faculty of Engineering and Science atAalborg University in the period of September 2011 to June 2012 under the guidance of Kris-tian Keiding and Morten Lykkegaard Christensen. The experimental work was performed at theUniversity of Maribor, Slovenia in the period of November 2011 to April 2012 under the super-vision of dr. Irena Petrinic, research assistant.
The thesis is divided into nine chapters. Chapter one gives a short introduction to the motivationfor developing and improving the implementation of membrane bioreactors (MBR) and othertechnologies. Chapter two and three give a detailed exposition of the principles of MBR andoxidation technologies. Chapter four accounts for the thesis statement followed by chapter fiveand six, which describes the experimental work and the considerations behind. Chapter seven,eight and nine cover the results, discussion and conclusion of the treatment of textile wastewaterusing MBR and oxidation technologies.
A CD-ROM is attached to the thesis, containing all the presented results and associated calcula-tions as well as the articles used as source material for this thesis.
Acknowledgement
I would like to thank my supervisor Kristian Keiding for his guidance during my masters thesisand for giving me the opportunity to independently shape my work.
Furthermore I would like to thank:
• Irena Petrinic, Maribor University, for qualified guidance during my stay at MariborUniversity.• Arnela Muric and Jasmina Korenak, Maribor University, for assistance and cooperation in
the laboratory.• Tanja Botic, Maribor University, for supporting experiments in the laboratory.• My fellow students and colleagues at Aalborg University and Maribor University for their
interest in my project and support during my project.
And finally a very special thanks to my family who always supported me during my education.
I


Contents
1 Introduction 1
2 Principles of MBR 32.1 Configurations of MBR . . . . . . . . . . . . . . . . . . . . . . . . . . . . . . 3
3 Oxidation Technologies 73.1 Principles of Oxidation . . . . . . . . . . . . . . . . . . . . . . . . . . . . . . 73.2 Advanced Oxidation Processes . . . . . . . . . . . . . . . . . . . . . . . . . . 8
4 Thesis Statement 11
5 Experimental Setup 135.1 Setup Parameters for Lab Scale MBR . . . . . . . . . . . . . . . . . . . . . . 135.2 Setup for Fenton’s reagent experiments . . . . . . . . . . . . . . . . . . . . . 15
6 Experimental Procedure 176.1 Determination of DO, MLSS and pH . . . . . . . . . . . . . . . . . . . . . . . 176.2 Determination of COD and Nutrient Content . . . . . . . . . . . . . . . . . . . 176.3 Preliminary Experiments with Fenton’s Reaction . . . . . . . . . . . . . . . . 186.4 Treatment with Fenton’s Reaction . . . . . . . . . . . . . . . . . . . . . . . . 196.5 UV-Vis Measurements of MBR Samples . . . . . . . . . . . . . . . . . . . . . 19
7 Results and Interpretation 217.1 Analytical measurements . . . . . . . . . . . . . . . . . . . . . . . . . . . . . 217.2 Treatment with Fenton’s Reaction . . . . . . . . . . . . . . . . . . . . . . . . 23
8 Discussion 278.1 MBR Operation and Analytical Measurements . . . . . . . . . . . . . . . . . . 278.2 Treatment with Fenton’s Reaction . . . . . . . . . . . . . . . . . . . . . . . . 298.3 Alternative Choices of AOP . . . . . . . . . . . . . . . . . . . . . . . . . . . 31
9 Conclusion 33
A Chemicals and Apparatus 39
B MBR Operational Conditions 41
C Fenton’s Reaction Results 45
III


1Introduction
Since the 1990s, the number of installed membrane bioreactor (MBR) plants have increased sig-nificantly, showing an increased interest and confidence in MBR technology. It is evident thatMBR technology is becoming more and more significant in processes where the environmentalfootprint needs to be limited and a high water product quality is demanded. The use of MBRtechnology has reached a global implementation in a wide range of countries, such as China,Japan, Australia, USA and a large part of Europe [1].
The stage of MBR development in each country and geographic region, depends strongly onthe legislation on discharge and reuse of wastewater. As a result of stricter legislation in theindustrial and developed countries, as compared to the developing countries, the use of MBRtechnology is more widespread. However globally the legislation is becoming more and morestrict and it is expected that the developing countries will follow with these restrictions. Thiswill demand further development and wider use of wastewater treatment plants.[1]The most significant aspect of the MBR technology, that is affecting its use, is the cost and plantsize. MBR technology is more costly than conventional treatment plants, which is mostly dueto the energy demand, membrane replacement and sludge management. However the costs havedecreased significant since its implementation in the 1990s and continues to decrease today. Thisstill makes MBR technology one of the most established technologies for wastewater treatment,along with the key-fact that MBR systems provide highly consistant quality of water effluents.[1]
Especially in the textile industry a high quality of water effluent is demanded, since textile waste-water can be a major source of color and contaminants when discharged to the environment. Thecolor from the textile wastewater is mainly due to the intense dyeing process, which involves awide range of different types of dyes, of which only 50 % is biodegradable [2][3]. Many of thesedyes can cause environmental problems if released into the aquatic environment, thus causinghighly environmental concerns. Because of this and local water scarcity, which is a problem inmany regions, reuse of the water effluent has become an important issue in the textile industry.[4]Both biological and chemical treatment have been proven efficient to some degree in removalof color from textile wastewater. As mentioned, MBR technology is already highly used, butcan still be developed to further improve the effluent quality. A possible choice of additionaltreatment is the use of chemical oxidation technologies. Chemical oxidation technologies arevery attractive because of their capability of degrading and mineralizing inorganic and organiccontaminants very fast compared to other degrading methods. It is an efficient technology toapply as pre- or post-treatment combined with a MBR system.
1


2Principles of MBR
2.1 Configurations of MBR
MBR technology includes biological treatment and membrane filtration. With a MBR it is pos-sible to remove dissolved and suspended organic chemical constituents through biodegradation,as well as bio adsorption, and suspended matter through physical separation like membrane fil-tration. Most importantly it is necessary to maintain appropriate biological conditions in thebioreactor for retaining a sufficient microorganism environment for removal of the organic con-stituents. Therefore it is necessary to evaluate several parameters during the process of a MBR,for example the configuration of the reactor, aeration, mixed liquor suspended solids (MLSS),hydraulic retention time (HRT), etc. [1]. A standard measurement of the content of organicconstituents in the wastewater and effluent (permeate) is the chemical and biochemical oxygendemand (COD and BOD), with both being an indirect measurement of the content of organicconstituents in the sample. COD is the measurement of oxygen needed for oxidation of theorganic constituents, while BOD is the measurement of oxygen needed by aerobic biological or-ganisms to degrade organic constituents [1] [5]. The microoganisms in the bioreactor can eitherbe aerobic or anaerobic depending on the desired treatment and conditions in the bioreactor.After the bioreactor treatment they are separated from the water through membrane filtrationresulting in a clarified permeate. [1]The configuration of the MBR system is especially referring to how the membrane module isintegrated with the bioreactor and is of high importance. There are two main MBR system con-figurations; submerged and sidestream MBR. These two configurations are shown in figure 2.1.
Figure 2.1: Configurations of a MBR: (a) sidestream and (b) submerged. Modified from [1].
A submerged MBR is usually less energy intensive than a sidestream MBR, however recentdevelopments have decreased the extra energy demand and cost for sidestreams MBR. In a sub-merged MBR the membrane module is installed either in the main bioreactor or a separate tank.
3

Chapter 2. Principles of MBR
Often membrane configurations used is flat sheets and tubular. An advantage of the submergedMBR is the possibility of incorporating a backwash system through the membrane module with-out removing it. This is also highly needed since the intensive direct contact with the activatedsludge can result in a high fouling degree, however aeration is mainly used to reduce fouling.If the membrane module is in a separate tank, but still submerged, the activated sludge must berecirculated back to the main bioreactor to avoid sludge accumulation. [1]In a sidestream MBR the membrane module is installed externally to the reactor. A pumpingsystem is then required to transfer the activated sludge to the membrane module and back tothe bioreactor. However the membrane module can be placed at lower levels than the bioreactorto utilize the gravitational force and hence to ease the maintenance. The membrane modulescan more easily be cleaned chemically without any chemical risk to the activated sludge, andmaintenance of the membrane module is more optimal, since they can be replaced relative fast.Both configurations have advantages and disadvantages, and are both used industrial. [1]
Furthermore the configuration of the bioreactor is classified according to process configuration,feeding regime and redox conditions. Process configuration determines the way the wastewateris in contact with the biomass, which for a MBR system is as suspended growth, where thebiomass is suspended in the reactor. The feeding regime determines in which way the wastewa-ter is introduced to the bioreactor, which for a MBR system is continuously. Other systems caninstead involve a fixed film instead of suspension or feeding batch-wise instead of continuously,like moving bed bioreactor (MBBR) or sequencing batch reactor (SBR). [1]In a MBR system the redox conditions are established by either dissolved oxygen (DO) beingpresent in aerobic reactors or complete absence of oxygen in anaerobic reactors. Sometimesalso an anoxic reactor is used, where oxygen is provided by another chemical compound. Thesetup of the bioreactor is especially important in order to achieve sufficient removal of organicand nitrogenous matter. In the activated sludge system within the bioreactor several reactionsoccur, that changes the form of the nitrogenous matter. An overview of this system is shown infigure 2.2. [1] [6]
Figure 2.2: Schematic presentation of the forms of nitrogenous matter and their reaction path-ways. Modified from Haandel et al. [6]
4

Nitrogenous matter in wastewater is mainly composed of ammonium nitrogen (present as gaseousNH3 and ionic NH4
+) and organic nitrogen. Traces of the oxidized form of nitrogen can bepresent, namely nitrate (NO3
−) and nitrite (NO2−). The total amount of nitrogen in the influent
and effluent is defined by equation 2.1 and 2.2 [6].
Nti = Nki +Nni = Noi +Nai +Nni (2.1)Nte = Nke +Nne = Noe +Nae +Nne (2.2)
Nti Total nitrogen in influentNki Total kjeldahl nitrogen in influentNni Nitrate in influentNoi Organic nitrogen in influentNai Ammonium in influent
Nte Total nitrogen in effluentNke Total kjeldahl nitrogen in effluentNne Nitrate in effluentNoe Organic nitrogen in effluentNae Ammonium in effluent
The Total Kjeldahl Nitrogen (TKN) is the sum of organic nitrogen and ammonium concentra-tions, as shown in equation 2.1 and 2.2. This value is often used to determine the content ofnitrogenous matter in wastewater instead of total organic nitrogen (TN). As shown in figure 2.2different reactions occur, known as ammonification/assimilation, nitrification and denitrifica-tion. Ammonification is the conversion of organic nitrogen into ammonium, and assimilation isthe reverse process. The reaction is described by the following reaction:
RNH2 +H2O+H+↔ ROH+NH+4 (2.3)
Ammonification classically occurs in the aerobic reactor, where ammonium is used in the nitri-fication stage. Nitrification is the biological conversion of ammonium to nitrate and occurs onlyunder aerobic conditions. Nitrification is divided into two stages, the conversion of ammoniumto nitrite and the conversion of nitrite to nitrate. The reactions are as following:
2NH+4 +3O2→ 2NO−2 +2H++2H2O (2.4)
2NO−2 +2O2→ 2NO−3 (2.5)
The second reaction step proceeds much faster than the first step, which means that nitrite neveraccumulates in the bioreactor, as long as sufficient levels of carbon sources and dissolved oxygenare present. The DO level should be above 2.0 mg/L for maintaning growth of the microorga-nisms in the aerobic reactor. [1] [7]Denitrification occurs in the anaerobic reactor, where nitrate is converted to gaseous molecularnitrogen. Denitrification occurs under anaerobic conditions, where organic carbon is oxidizedusing the nitrate ion. A general description is shown in the following reaction:
C10H19O3N+10NO−3 → 5N2 +10CO2 +3H2O+NH3 +10OH− (2.6)
5

Chapter 2. Principles of MBR
In reaction 2.6, C10H19O3N represents the dissolved organic matter in the wastewater. If thereis not enough organic matter in the wastewater, additional carbon can be added in the form ofglucose. However most full scale MBR plants recircle the wastewater from the aerobic reactor,which is rich on nitrate. For complete removal of nitrogen both aerobic and anaerobic treat-ment is necessary [8]. Simpel aerobic MBR systems are however also commonly used withoutanaerobic treatment, but for industrial high strength wastewater anaerobic treatment is more suf-ficient [9] [10] [11] [12]. Different setups of aerobic and anaerobic reactors have been usedwhere either the wastewater first enters the aerobic reactor and then the anaerobic reactor or thereverse setup, but with recirculation back to the anaerobic reactor. The latter is however provento be more efficient when dealing with industrial textile wastewater. [13]
The textile industry produces wastewater containing large quantities of dyes, which most are ofsynthetic origin and consist of complex aromatic molecules. Different kind of dyes exist andtheir use is dependent on the types of fibers used in the dyeing process. A selection of dyesthat can be named includes acid dyes, basic dyes, direct dyes and reactive dyes. A large part ofthese dyes are however resistant to biodegradation and cannot be removed by aerobic biologicaltreatment [14]. The aerobic biological treatment mainly involves adsorption, because the aer-obic degradation occurs very slowly and often leaves behind non-biodegradable or difficult todegrade intermediates [15]. Instead anaerobic biological treatment have proven to degrade thedyes more rapidly, however it produces toxic aromatic amines, which cannot be further degradedin the anaerobic reactor and will accumulate. A combination of an anaerobic reactor followedby an aerobic reactor is the optimal setup, since the toxic amines can be degraded in the aerobicreactor [16]. A recirculation of the wastewater from the aerobic reactor to the anaerobic reactoris however necessary in order to achieve a proper removal of nitrogen. [17] [18] [19]
When biological treatment of wastewater is not sufficient enough for color removal, chemicaltreatment can be a more effcient method. It is an efficient technology that can be applied aspretreatment of wastewater, for detoxification and enhancing the biodegradability, before thebiological treatment. Thereby the biological process can be concentrated on the nutrient re-moval.
6

3Oxidation Technologies
3.1 Principles of Oxidation
Chemical oxidation technologies can be used as part of the treatment of drinking water, ground-water and wastewater. They are normally combined with other treatment technologies, such asbiological treatment and membrane filtration. Chemical oxidation technologies are very attrac-tive because of their capability of degrading and mineralizing inorganic and organic contami-nants very fast compared to other degrading methods. It is an efficient technology to apply aspre- and post-treatment of wastewater for detoxification and enhancing the biodegradability be-fore the biological treatment and improve the effluent water.
Most of the recent research on chemical oxidation technologies has concentrated on AdvancedOxidation Processes (AOPs). Several studies have examined the effect of wastewater treatedwith AOPs and compared it with nontreated wastewater. The results indicated an improved pu-rification of the wastewater and of various other parameters. But to fully determine the efficiencyof AOPs, it is necessary to understand the principles of oxidation.Oxidation is part of a reduction-oxidation (redox) reaction, which involves oxidation and reduc-tion. A redox reaction includes the transfer of one or more electrons from an electron donor(reductant) to an electron acceptor (oxidant). Oxidation is the removal of electrons and reduc-tion is the gain of electrons. The specie that loses electrons is oxidized, while the other speciegains electrons and is reduced. The number of electrons gained or lost in a process is equal tothe change in the oxidation state of the reduced or oxidized specie [20]. The oxidation potentialfor selected chemical reactants is shown in figure 3.1.
Table 3.1: Oxidation potential for selected chemical reactants [21].
Oxidant Oxidation potential, E0 [V]
Hydroxyl radical 2.80Ozone
acidic 2.07basic 1.24
Hydrogen peroxideacidic 1.78basic 0.85
Chlorine dioxide 1.71Chlorine
acidic (elementary) 1.36acidic (hypochlorous acid) 1.49basic (hypochlorite) 0.90
7

Chapter 3. Oxidation Technologies
A change in the oxidation state is generated by an oxidant and/or reductant that is powerfullenough to effect this change. The power of an oxidant or reductant is measured by the oxidationpotential of the species. A higher oxidation potential results in a more effective oxidation. Thehigher the oxidation potential of a specie is, the more affinity for electrons it has. An overviewof selected oxidants and their oxidation potential is given in table 3.1 [21].
Fluorine is one of the strongest oxidants, as shown in table 3.1. Fluorine is however a highlytoxic chemical and it is therefore unattractive as an oxidant in water and wastewater treatment.Hydroxyl radicals, ozone and hydrogen peroxide are also some of the strongest oxidants, asshown in table 3.1. They are even stronger than chlorine and chlorine dioxide, which have pre-viously been used in water and wastewater treatment. This makes them very attractive as usableoxidants. [22] [23]
3.2 Advanced Oxidation Processes
AOPs involve two stages of the oxidation process, as described in section 3.1. First the forma-tion of strong oxidants and then the reaction between oxidants and contaminants. In general,AOPs include processes based on the generation of hydroxyl radicals. As shown in table 3.1 onthe preceding page, the hydroxyl radical is very desirable because of its high oxidation potentialand fast reaction rate. The hydroxyl radical is so reactive that it reacts with almost any organiccontaminants in the solution at high reaction rates in the order of 109-1010 M−1·s−1. [24] [25]
Hydroxyl radicals can oxidize the organic contaminants by a number of pathways, resulting in aradical chain oxidation ending with complete oxidation of the organic contaminants. Hydroxylradicals can oxidize the organic contaminants by abstraction of protons producing organic ra-dicals, which can be further oxidized. Another possibility is the addition to double bonds, likearomatic rings, where a complex between the hydroxyl radical and the organic contaminant iscreated, which again can be further oxidized. [23] [26]
The effectiveness of an AOP is proportional to its ability to generate hydroxyl radicals and isdependent on the reaction rate between the hydroxyl radicals and contaminants. One of the mostestablished oxidants used in chemical oxidation technology is hydrogen peroxide. However oxi-dation by hydrogen peroxide alone is not effective enough for removal of organic contaminants,because of low reaction rates at reasonable hydrogen peroxide concentrations [23]. Therefore, acatalyst must be present to activate the generation of hydroxyl radicals. This can be done withultraviolet (UV) light, ozone or iron salts, which is known as Fenton’s reaction. Compared toother chemical oxidation processes, Fenton’s reaction has the advantage of not being an energyand cost intensive process, like processes including ozonation and UV [22]. Likewise the pro-cesses can include a lot more complicated setup, whereas treatment with Fenton’s reagent canbe quite simple.
8

3.2.1 Fenton’s Reaction
In the Fenton’s reaction, hydrogen peroxide reacts with ferrous iron from the iron salt to formFenton’s reagent. This reagent is based on the catalytic effect of ferrous iron on the decomposi-tion of hydrogen peroxide. The iron-oxide complex is however unstable and immediately reactsto form hydroxyl radicals. The overall reaction is shown below. [27] [28]
Fe2++H2O2→ Fe3++OH−+OH• (3.1)
The Fenton reaction can be separated into two separated systems. The ferrous system refers tothe primary reaction which produces hydroxyl radicals, shown above in reaction 3.1. The ferricsystem is responsible for the regeneration of ferrous iron in order maintain the generation ofhydroxyl radicals. This is shown in reaction 3.2 along with several sidereactions that includeferric and ferrous iron. [29]
Fe3++H2O2→ Fe2++H++OH•2 (3.2)
Fe3++OH•2 → Fe2++H++O2 (3.3)
Fe2++OH•2 → Fe3++OH−2 (3.4)
Fe2++OH•→ Fe3++OH− (3.5)H2O2 +OH•→ H2O+OH•2 (3.6)
(3.7)
As shown in the reactions above, ferrous and ferric iron can also participate in other side reac-tions along with the generated hydroxyl and hydroperoxyl radicals and thus resulting in termi-nation of the generated radicals [27] [29]. The scavenging of radicals by reactions 3.3 and 3.4is not as important as the scavenging of hydroxyl radicals. The hydroperoxyl radicals are notnearly as reactive as hydroxyl radicals, therefore hydroxyl radicals are of much more importancefor the oxidation of organic contaminants [27].
In the presence of organic contaminants, these will react with the generated hydroxyl radicalsand be oxidized. Further reaction with ferric iron and water generates new organic products thatcan be further oxidized until a complete mineralization is obtained [28]. The reaction schemesare shown below:
RH+OH•→ H2O+R• (3.8)
R•+Fe3+→ R++Fe2+ (3.9)
R++H2O→ ROH+H+ (3.10)
The above reaction schemes show that ferric iron is also reduced back to ferrous iron when in-cluding organic contaminants, which is able to maintain the generation of hydroxyl radicals. Theshown reactions are together known as the classical ”radical chain” mechanism, which is pro-posed for simple Fe 3+ systems involving OH • and OH •2 . However the mechanism of reaction
9

Chapter 3. Oxidation Technologies
with Fenton’s reagent is relatively complex and may change depending on the reaction condi-tions [27]. This is especially documented by Yoon et al. [29], where different ratios between ironand hydrogen peroxide shows different reaction pathways. This is further discussed in chapter 8.
The reaction efficiency of Fenton’s reagent is however also dependent on other parameters thanthe chemical ratios. It has been proven that the reaction is strongly dependent on the pH duringthe reaction. At pH lower than 3.5, the ferrous iron and hydrogen peroxide are more stable insolution, which results in a better redox system. At pH above 4, the ferrous iron can easily formferric iron which is less stable than ferrous iron. Ferric iron has a high tendency for generatingiron hydroxide complexes at pH above 4, which is also why the pH is typical raised after thereaction for removing excess iron as precipitated iron hydroxide complexes [3] [30] [31]. Forhydrogen peroxide it applies that in basic solution it is unstable and easily decomposes into wa-ter and oxygen gas [30]. Also previous studies have mainly performed the reactions at pH 3 andaccording to Pignatello et al. [27] the efficiency drops below and above pH 3. Also Oliveros etal. [32] showed that pH 3 is a critical point for the redox system.
A more in depth comparison of the processes is presented in chapter 8. All mentioned processeshave been proven to effectively degrade and remove dyes from textile wastewater in experimen-tal studies, however the Fenton’s reaction is not as examined in full scale as the other processes[22]. Therefore on the basis of the preceding sections, it is chosen to further evaluate the effectof treatment with Fenton’s reagent on textile wastewater in relation to MBR treatment.
10

4Thesis Statement
Wastewater released from textile industries can cause environmental and health hazards becauseof the often toxic content of dyes from the dyeing process. Most of the dyes used in the textileindustry and their degradation products are cytotoxic or carcinogenic. Thus, decolorization oftextile wastewater is an important environmental concern. Today there is a great focus on reusingthe effluent water in the dyeing process. Hence there is an urgent need to develop an economi-cal treatment system for the treatment of wastewater, which can meet the strict quality standards.
This study aims at decolorizing textile wastewater by a MBR system and furthermore study theeffect of treatment by Advanced Oxidation Processes (AOP). In order to do so the operatingconditions of the MBR system and the influence on the performance must be investigated. Theinfluence of parameters such as aeration, mixed liquor suspended solids (MLSS) and hydraulicretention time (HRT) will be investigated.
The conventional aerobic and anaerobic wastewater treatment processes, such as MBR systems,usually can not efficiently decolorize the effluents contaminated with dyes, due to their com-plex polyaromatic structure and non-biodegradability. Therefore further treatment in the formof chemical oxidation, such as AOP, can be necessary to achieve a better performance. In thisstudy the efficiency of pre- and post-treatment with AOP and integration into the MBR systemwill be tested and investigated.
The objectives of this study are therefore:
• Treatment of textile wastewater with a MBR system.• Evaluate the wastewater treatment of a MBR system.• Evaluate the wastewater treatment with Fenton’s reaction.• To measure and evaluate the content of COD, NH4
+, NO3−, PO4
3− and total N.
11


5Experimental Setup
5.1 Setup Parameters for Lab Scale MBR
Setup of the lab scale MBR is schematic presented in figure 5.1. The system is a ZeeWeed R©
ZenoGem R© MBR system provided by Zenon Systems and operated at Maribor University.
Figure 5.1: Schematic presentation of the lab scale MBR.
The setup included a bioreactor, divided into an aerobic and anaerobic reactor, and an externalsubmerged membrane module. The transmembrane pressure (TMP) was controlled by an airpump, pumping at a constant rate. Every 10 min the pressure was reversed and the membranewas backpulsed with permeate from the storage tank for 30 s. To further prevent fouling on themembrane, an air compressor applied aeration along the membrane surface.
In the bioreactor, the aerobic reactor was supplied with aeration by the same air compressor usedfor the filtration unit. In the anaerobic reactor, circulation was assured by a mechanical stirrer toavoid settling. The flow balance of the system is shown in figure 5.2.
13

Chapter 5. Experimental Setup
Biological unit
Qfeed
Qnutrient
Filtration unitQbio
Qrecirc
Permeate tank
Qpermeate
Qpermeate, recirc
Qeffluent
0,6 L/h
0,5 L/h
1,1 L/h
24 L/h
23 L/h
1,0 L/h
0,4 L/h
Figure 5.2: An overview of the flow rates in the MBR system.
Due to lack of sludge recirculation, 2 L of sludge was transferred daily from the filtration unit tothe bioreactor. This is however not assessed as part of the flow balance in figure 5.2. The systemwas fed with wastewater at a rate of 0.6 L/h and nutritent solution at a rate of 0.5 L/h for a totalperiod of 40 days. All physical operation parameters are presented in table 5.1.
Table 5.1: Physical parameters for lab scale MBR.
Parameter Value
Volume aerobic tank [L] 23Volume anaerobic tank [L] 12Volume membrane tank [L] 25Volume permeate tank [L] 15Membrane surface area [m2] 0.93Pore size [µm] 0.04Backpulse 30 s every 10 min
Activated sludge was collected from Maribor Municipal Wastewater Treatment Plant and hadan initial MLSS of approximately 10 g/L. The wastewater used as feed was retrieved from BetiTextile Plant in Metlika, Slovenia. Along with the wastewater, a nutrient solution containingadditional glucose, ammonium and phosphate sources was also added to the bioreactor. Thebiological parameters are presented in table 5.2.
Table 5.2: Biological parameters for lab scale MBR.
Parameter Value
Feed COD [mg O2/L] ∼900COD load [g COD/g MLSS] ∼0.45MLSS [g/L] ∼2HRT [day] ∼2
14

Sludge samples from the bioreactor and filtration unit were taken every second day for MLSSmeasurements, as described later in section 6.1.
Each day the DO level and pH-values were monitored, along with the TMP and flow rates of thesystem. Samples from the wastewater and permeate were taken everyday for UV-Vis measure-ments and twice a week for nutrient analysis, as desribed later in section 6.1.
5.2 Setup for Fenton’s reagent experiments
As mentioned in section 5.1, the wastewater was retrieved from Beti Textile Plant in Metlika,Slovenia. The plant mainly uses acid dyes in the dyeing process, however several more kindsof dyes are also used. In order to determine if Fenton’s reaction can be used for the degradationof acid dyes, some preliminary experiments were conducted with Nylosan Yellow E-2RL andNylosan Red E-BL, which both are acid dyes, provided by Beti Textile Plant. The experimentswere conducted based on the previous work done by T. Kurbus [33].
As mentioned in section 3.2, certain reaction conditions must be optimized in order to achievethe optimal treatment with Fenton’s reaction. This includes pH, time of reaction and doses ofhydrogen peroxide and iron sulfate. As described in section 3.2 the efficiency of the reaction isstrongly dependent on pH. Several studies have shown that the maximum reaction rate occursaround pH 3 in most cases. In basic solution the iron will precipitate as Fe(OH)3 and not actas a catalyst for the radical generation [21] [34]. Therefore are all experiments with Fenton’sreaction in this study conducted with a pH around 3.
The reaction rates with Fenton’s reaction is mainly limited by the generation of hydroxyl radi-cals, which is dependent on the iron concentration. A too low concentration of iron will resultin excessive long reaction rates and a too high concentration of hydrogen peroxide will result inradical scavenging [21] [35] [36]. Typical Fe:H2O2 ratios are between 1:5 and 1:10 (w/w), withminimum iron concentrations at 3-15 mg/L. According to US Peroxide [21] a ratio between ironand the desired substrate removed is optimal at 1:10-50 (w/w). However since the wastewatercontains an unknown content and type of dyes, it is decided to adjust the iron concentration afterthe COD level, which is given in mg O2/L. It is selected on the basis of this to perform threedifferent experiments with an Fe:COD ratio of 1:10, 1:15 and 1:25 (w/w).
According to Alaton et al. [34] and Lucas et al. [35] the optimal ratio between iron sulfate andhydrogen peroxide is between 1:5 and 1:10 molar ratio. Converted to a weight/weight ratio it is1:3 to 1:6. US Peroxide [21] states that a range from 1:5 to 1:25 (w/w) is usable for treatmentwith Fenton’s reaction, as long as the iron concentration is above the minimal limit. On the basisof this it is chosen that different Fe:H2O2 ratios of 1:5, 1:10, 1:15 and 1:20 (w/w) are tested foreach of the different Fe:COD ratios.
15

Chapter 5. Experimental Setup
For the procedure of the treatment with Fenton’s reaction several studies show that only a shortreaction time is necessary. According to both Alaton et al. [34] and Lodha et al. [3] most of thedye removal occurs during the first few minutes, afterwards the removal effect becomes steady.Generally a reaction time of 30 min is applied, since an effect can still be observed so long [3][34] [37]. Therefore a reaction time of 30 min is chosen for the experiments in this thesis.Furthermore H2SO4 and NaOH is chosen to be used for lowering and raising the pH respec-tively. Only a simple experimental setup is necessary, with a small sample put under stirring atroom temperature. After the reaction the pH is raised in order to precipitate additional iron asferric hydroxide. The significance of this is later discussed in chapter 8.
16

6Experimental Procedure
6.1 Determination of DO, MLSS and pH
The DO levels in the anaerobic and aerobic tanks were measured using an oxygen sensor. DOlevels were measured three times every day during the MBR process.
For determination of sludge concentration, 50 ml of samples from both the aerobic and anaero-bic reactor in the bioreactor and the membrane module were filtered on a pre-dried and weighed12 µm filter. Then the filter and filtercake were dried at 105 ◦C for 21
2 h and then weighed again.This procedure was done every second day.
pH was measured with a pH meter equipped with a pH electrode every day during the MBRprocess. pH measurements were done in the feed tank, permeate tank, aerobic and anaerobicreactor every day.
6.2 Determination of COD and Nutrient Content
All the analysis are performed with LANGE Colorimetric cuvette tests. For heating the samplesa HACH LANGE Heater was used and for measuring and calculating the absorbance and con-centration a HACH LANGE Spectrophotometer was used. Product informations are shown inAppendix A and on the attached CD-ROM.
For the analysis of COD in wastewater, a HACH LANGE Sample cuvette, containing a mixtureof 90 % sulphuric acid, 1.5 % inorganic mercury compounds, 1 % potassium dichromate and0.5 % silver sulfate, was fist shaken and then added 2 ml of wastewater. Then the cuvette wasshaken again and heated to 148◦ for 2 hours. Afterwards the cuvette was shaken and cooleddown until measurement and calculation of absorbance and concentration.For the analysis of COD in permeate a HACH LANGE Sample cuvette, containing a mixture of90 % sulphuric acid, 8 % water, 1.7 % inorganic mercury compounds, 0.5 % silver sulfate and0.1 % potassium dichromate, was fist shaken and then added 2 ml of permeate. Then the cuvettewas shaken again and heated to 148◦ for 2 hours. Afterwards the cuvette was shaken and cooleddown until measurement and calculation of absorbance and concentration.
For the analysis of phosphate, a 0.5 ml sample of either wastewater or permeate was transferredto a HACH LANGE Sample cuvette containing a mixture of 95 % water and 1 % sulphuricacid. Then a cap, containing a sample of 71 % sodium peroxydisulfate and 21 % sodium meta-borate, was added on the cuvette and shaken until homogenized. Then the cuvette was heated
17

Chapter 6. Experimental Procedure
to 100◦ for 1 hour. After being cooled down, 0.2 ml solution of 80 % water, 16 % sulphuricacid, 2 % ammonium heptamolybdate tetrahydrate and 1 % sulfamic acid and potassium anti-mony(III)oxide tartrate hemihydrate was added along with a new cap containing 50 % ascorbicacid, 25 % sodium metaborate and 15 % dextran. Then the cuvette was shaken until homoge-nized and after 10 min the absorbance and concentration were measured and calculated.
For the analysis of total nitrogen in wastewater, a 0.2 ml sample of wastewater was mixed with2.3 ml solution of 98 % water and 2 % sodium hydroxide and one tablet of 65 % dipotassiumperoxodisulphate, 20 % sodium metaborate and 15-20 % disodium tetraborate anhydrous. Themixture was then heated at 100◦ for 1 hour. After being cooled down a capsule containing 70% sodium sulfite and 0.7 % sodium azide was added and then shaken until dissolved. Then 0.5ml of the mixture was transferred to a HACH LANGE Sample cuvette containing 60 % sul-phuric acid, 33 % phosphoric acid and 7 % water. Then 0.2 ml solution of 75 % water, 20 %isopropanol, 1 % 2,6-xylenol and isopentyle acetate was added and mixed. After 15 min theabsorbance and concentration were measured and calculated.
For the analysis of ammonium, a 0.5 ml sample of either wastewater or permeate was transferredto a HACH LANGE Sample cuvette containing a mixture of 95 % water and 0.2 % sodium hy-droxide. Then a new cap, containing a sample of 76 % D(-)-Mannitol, 12 % troclosene sodiumdihydrate and 12 % sodium nitroprusside dihydrate, was added on the cuvette and shaken untilhomogenized. After 15 min the absorbance and concentration were measured and calculated.
For the analysis of nitrite, a 0.2 ml sample of either wastewater or permeate was transferred to aHACH LANGE Sample cuvette containing a mixture of 97 % water and 3 % citric acid. Then anew cap, containing a sample of 70 % D(-)-Mannitol, 25 % 1-Naphthylamine sulfonic acid salt,0.25 % sodium hydroxide, was added on the cuvette and shaken until homogenized. After 10min the absorbance and concentration were measured and calculated.
For the analysis of nitrate, a 0.2 ml sample of either wastewater or permeate was transferred to aHACH LANGE Sample cuvette containing a mixture of 60 % sulphuric acid, 33 % phosphoricacid and 7 % water. Then 1 ml solution of 95 % water, 5 % isopropanol, 1 % 2,6-xylenol andisopentyle acetate was added and the cuvette shaken until homogenized. After 15 min the ab-sorbance and concentration were measured and calculated.
6.3 Preliminary Experiments with Fenton’s Reaction
In order to determine that the Fenton’s reaction can be used to degrade acid dyes, a preliminaryexperiment with the dyes Nylosan Yellow E-2RL and Nylosan Red E-BL was made. For bothdyes, the following method applies:
18

A sample of 250 ml dye solution was put under stirring in a conical flask with a magnetic stirrer.First the pH was adjusted to 3.0 with 1M H2SO4 and then a dose of 0.1M FeSO4·7H2O solutionwas added. Finally a dose of a 0.1M H2O2 solution was added and the reaction started. Sampleswere taken every minute during the first five minutes of reaction. Afterwards samples were takenevery 10 or 20 minutes as the reaction proceeded.
The samples were analysed with UV-Vis spectroscopy. The absorbance of the Nylosan YellowE-2RL samples was measured at 381 nm and for the Nylosan Red E-BL samples the absorbancewas measured at 521 nm. Two standardsolutions were prepared for both dyes, which were usedto obtain two standardcurves and determination of the maximum absorbance wavelength. Thesestandardcurves along with calculations are shown on the attached CD-ROM.
6.4 Treatment with Fenton’s Reaction
In order to determine the optimal conditions for the Fenton’s reaction treatment, several experi-ments were performed with different concentrations of the Fenton’s reagents in order to deter-mine the optimal Fe:H2O2 and Fe:COD ratio. For all experiments, the following method applies:
A sample of 100 ml wastewater (50 ml for the permeate) was put under stirring in a conical flaskwith a magnetic stirrer. First the pH was adjusted to 3.0 with 1M H2SO4 and then a dose of a0.1M FeSO4·7H2O solution was added. Finally a dose of a 0.1M H2O2 solution was added andthe reaction started.
The mixture was left stirring for 30 min, whereafter the reaction was stopped by adjusting thepH to 12 with 5M NaOH. Then the mixture was filtered through a 12 µm filter and the precipi-tate was removed. The procedure was the same for treatment of the permeate.
6.5 UV-Vis Measurements of MBR Samples
Each day samples were taken from the feed and permeate tank for UV-Vis measurements. Be-fore measurements, the samples were filtered with a 12 µm filter in order to remove interferingparticles. A full UV-Vis spectrum from 200 to 800 nm was measured for each sample. Demine-ralized water was used as a reference.
Furthermore full UV-Vis spectra were also done for the wastewater and permeate samples treatedwith Fenton’s reaction in the range 200 to 800 nm. Demineralized water was used as a reference.
19

7Results and Interpretation
The results are divided into two sections. First section presents the analytical measurementsfrom the MBR system along with the UV-Vis measurements of the permeate. Second sectionpresents the results from the treatment with Fenton’s reaction on the dye solutions, wastewaterand permeate.
7.1 Analytical measurements
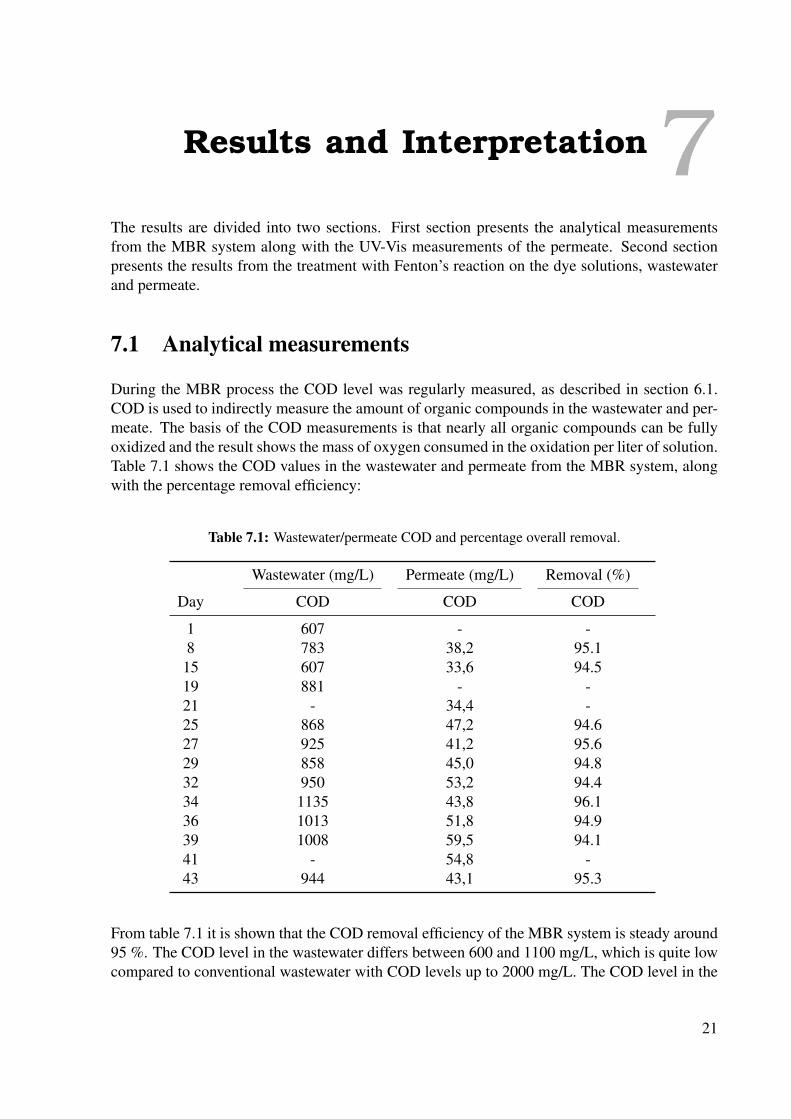
During the MBR process the COD level was regularly measured, as described in section 6.1.COD is used to indirectly measure the amount of organic compounds in the wastewater and per-meate. The basis of the COD measurements is that nearly all organic compounds can be fullyoxidized and the result shows the mass of oxygen consumed in the oxidation per liter of solution.Table 7.1 shows the COD values in the wastewater and permeate from the MBR system, alongwith the percentage removal efficiency:
Table 7.1: Wastewater/permeate COD and percentage overall removal.
Wastewater (mg/L) Permeate (mg/L) Removal (%)
Day COD COD COD
1 607 - -8 783 38,2 95.1
15 607 33,6 94.519 881 - -21 - 34,4 -25 868 47,2 94.627 925 41,2 95.629 858 45,0 94.832 950 53,2 94.434 1135 43,8 96.136 1013 51,8 94.939 1008 59,5 94.141 - 54,8 -43 944 43,1 95.3
From table 7.1 it is shown that the COD removal efficiency of the MBR system is steady around95 %. The COD level in the wastewater differs between 600 and 1100 mg/L, which is quite lowcompared to conventional wastewater with COD levels up to 2000 mg/L. The COD level in the
21

Chapter 7. Results and Interpretation
permeate differs between 30 and 60 mg/L, which is well below the ordinary limit of 125 mg/L.
Furthermore also the content of phosphate, total nitrogen, ammonium, nitrate and nitrite in thewastewater and permeate was measured, as described in section 6.1. These results are given intable 7.2.
Table 7.2: Wastewater/permeate PO4-P and total N, and permeate NH4-N, NO3-N and NO2-N.
Wastewater (mg/L) Permeate (mg/L)
Day PO4-P Total N PO4-P Total N NH4-N NO3-N NO2-N
1 - 16.6 - - - - -8 0.9 15.8 5.3 22.0 0.06 21.8 0.05
15 - 16.6 7.6 57.2 2.89 20.7 0.0519 1.0 16.7 - - - - -21 - - 6.1 21.2 - - -25 8.4 48.7 5.0 3.7 0.15 1.0 0.0227 1.6 39.2 4.4 0.9 0.08 0.0 0.0429 0.9 36.5 2.5 0.8 0.06 0.0 0.0332 2.8 29.8 2.2 9.4 0.67 3.9 0.0834 1.5 27.5 4.8 4.1 0.19 3.0 0.0236 1.3 25.3 7.7 7.9 1.82 6.5 0.0539 3.2 60.1 6.7 13.3 7.01 4.1 0.1141 - - 4.4 13.8 9.38 3.1 0.0843 0.8 23.3 4.7 10.4 4.81 4.4 0.09
From table 7.2 it is observed that the removal efficiency of total nitrogen is fairly variable, sincequite significant changes of the content in the permeate are shown. The content of ammonium,nitrate and nitrite is at reasonable low values, indicating efficient nitrification and denitrification.However at the end of the MBR process an increase in the content of ammonium and nitrate isobserved. This is probably due to the addition of further nutrient content, as mentioned in sec-tion 5.1. This is further discussed in chapter 8. An increase of the phosphate content is observedfrom the wastewater to the permeate during the entire MBR process.
Regularly during the MBR process samples from the wastewater and permeate were taken forUV-Vis measurements. A spectrum from 200 to 800 nm was measured for both the wastewaterand permeate. A section of the permeate spectrum is illustrated in figure 7.1.
22

0,0
0,2
0,4
0,6
0,8
1,0
250 280 310 340 370 400
Ab
sorb
ance
Wavelength (nm)
Day 10 Day 15 Day 20 Day 25 Day 30 Day 35 Day 40
Figure 7.1: Section of the UV-Vis spectrum for selected permeate samples. The figure illustrateshow the absorbance increases during the MBR process.
Figure 7.1 illustrates a section from 250 to 400 nm of the full UV-Vis spectrum for the permeate.It is illustrated how the absorbance increases during the MBR process. The same tendency isobserved for the wastewater samples, which is illustrated in figure B.4 in Appendix B. The fullUV-Vis spectrum for the permeate samples is likewise presented in Appendix B.
7.2 Treatment with Fenton’s Reaction
For determining if treatment with Fenton’s reaction effectively degrades acid dyes, two dye so-lutions of Nylosan Yellow E-2RL and Nylosan Red E-BL were treated with Fenton’s reaction.Samples were taken during the experiments for measuring the absorbance of the dyes. The re-sults show a significant reduction in the absorbance after treatment with Fenton’s reaction. Theabsorbance as a function of the reaction time for both dyes is shown in figure 7.2.
23

Chapter 7. Results and Interpretation
0,0
2,0
4,0
6,0
8,0
10,0
0 50 100 150 200
Ab
sorb
ance
Time (min)
Nylosan Yellow Nylosan Red
Figure 7.2: Absorbance as a function of reaction time for Nylosan Yellow E-2RL and NylosanRed E-BL solutions treated with Fenton’s reaction.
Figure 7.2 shows a significant reduction in the absorbance relatively fast. Most of the degrada-tion of the dyes occurs during the first five minutes of the reaction, and afterwards the decreasein absorbance occurs more slowly. For both dyes the starting concentration was 10 mg/L andboth experiments ended with a concentration below 1 mg/L. For Nylosan Red E-BL the con-centration was even below 0.5 mg/L. For Nylosan Yellow E-2RL a degradation percent of 94 %was obtained, while for Nylosan Red E-BL a degradation percent of 98 % was obtained. Thisindicates that treatment with Fenton’s reaction is useful for treating the wastewater and permeate.
For determination of the optimal amount of reagents and the optimal ratio (w/w) between fer-rous sulfate and hydrogen peroxide a series of experiments were conducted. With these resultsthe optimal conditions for treating the wastewater and permeate from the MBR system can bedetermined.
After each experiment the treated samples were analyzed with UV-Vis spectroscopy, as men-tioned in section 6.4. For both the wastewater and permeate samples, it was clear that the oxida-tion became less effective at higher amounts of added hydrogen peroxide. This was evident at allFe:COD ratios, indicating that no matter the iron concentration, a small ratio between iron andhydrogen peroxide is preferred. For both wastewater and permeate samples, the Fe:COD ratioof 1:10 (w/w) resulted in the best reaction efficiency. At lower doses (1:25) of iron the efficiencydecreases quite significant and at higher doses (1:5) the efficiency was also lower. Comparingall the graphs together, the best result was proven to be a Fe:COD ratio of 1:10 (w/w) and a
24

Fe:H2O2 ratio of 1:5 (w/w). The UV-Vis measurements for these ratios for both wastewaterand permeate are shown in figure 7.3. The results for the rest of the experiments are shown inAppendix C.
0,0
0,5
1,0
1,5
2,0
2,5
3,0
3,5
4,0
200 250 300 350 400 450 500 550 600 650 700 750 800
Ab
sorb
ance
Wavelength (nm)
Fenton treated permeate Permeate Fenton treated wastewater Wastewater
Figure 7.3: UV-Vis spectrum of the wastewater and permeate treated with Fenton’s reagent withratio 1:10 (w/w) Fe:COD and 1:5 (w/w) Fe:H2O2.
In figure 7.3 it is shown that the MBR treatment and treatment with Fenton’s reaction both arerelatively effective. Both methods show almost complete color removal in the visible spec-trum from 400 to 700 nm, although the MBR treatment shows a little higher removal than thetreatment with Fenton’s reaction. Additional treatment with Fenton’s reaction on the permeateresults in a further decrease in the absorbance in the low range of the visible spectrum and in theultraviolet range.By studying the ultraviolet range, the difference between the samples is more obvious shown.The wastewater sample shows a significant peak around 270 nm, which has been considerablydecreased in the permeate and moved to around 285 nm. In the wastewater treated with Fenton’sreaction the peak is more apparent at 260 nm, but still with an indication of a peak around 270nm. In the permeate treated with Fenton’s reaction, the same tendency can be observed as inthe wastewater treated with Fenton’s reaction. The peaks are however significant decreased andmoved slightly. A more close-up spectrum can be seen in figure 7.4.
25

Chapter 7. Results and Interpretation
0,0
0,2
0,4
0,6
0,8
1,0
200 250 300 350 400 450 500 550 600 650 700 750 800
Ab
sorb
ance
Wavelength (nm)
Fenton treated permeate Permeate Fenton treated wastewater Wastewater
Figure 7.4: UV-Vis spectrum of the wastewater and permeate treated with Fenton’s reactionwith ratio 1:10 (w/w) Fe:COD and 1:5 (w/w) Fe:H2O2.
Figure 7.4 shows more clearly the small amount of absorbance around 390-400 nm in the waste-water treated with Fenton’s reaction and permeate from MBR treatment. It is only below 400 nmthat the difference between these two samples are visible, otherwise no difference in the rest ofthe visible spectrum is observed. The curve for permeate treated with Fenton’s reaction shows adecrease in absorbance in the whole spectrum. This observed color reduction is shown in figure7.5.
Figure 7.5: From the left: Wastewater, wastewater treated with Fenton’s reaction, permeate,permeate treated with Fenton’s reaction.
Figure 7.5 shows the color removal efficiency for the MBR and treatment with Fenton’s reaction.The blue color from the wastewater is completely removed in both treatments, however thepermeate from MBR is less yellow than the wastewater treated with Fenton’s reaction. Almostcomplete color removal is obtained with treatment of permeate with Fenton’s reaction.
26

8Discussion
8.1 MBR Operation and Analytical Measurements
In figure 7.1 in section 7.1, a UV-Vis spectrum for the permeate samples is illustrated. The spec-trum is shown in the range from 250 to 400 nm in order to more clearly illustrate the changes inabsorbance during the MBR process. The figure illustrates how the absorbance increases duringthe process from day 10 to day 40. Directly this could indicate a decreasing performance andcolor removal efficiency, however the same tendency is observed for the wastewater. The UV-Vis spectrum for the wastewater samples taken during the MBR process is shown in figure B.4in Appendix B. Although this tendency is not as obvious as for the permeate, the absorbance ofthe wastewater still has a major influence on the permeate quality. On the assumption that thebiological conditions are stable during the entire MBR process, then the removal degree of colorwould be almost steady. This would mean that a higher absorbance in the wastewater wouldresult in a higher absorbance in the permeate, as compared to a lower beginning absorbance inthe wastewater. So the increased absorbance in the permeate can partially be explained by avarying and higher absorbance in the wastewater. However the increase can still be explainedby a decrease in the performance efficiency of the MBR system, since the MBR did not operateunder optimal conditions. This is discussed later in this chapter.
From the UV-Vis spectra of the wastewater and permeate shown in figure 7.3 in section 7.2,as well as from visible observation, a clear reduction in color was obtained from MBR treat-ment. The blue color in the wastewater is completely removed, leaving only a yellow color. Itis also observed that the decrease in absorbance from wastewater to permeate is almost steadyin the visible spectrum. The absorbance curve for the permeate does not change shape from thecurve for the wastewater, which could indicate adsorption of the dyes to the biomass insteadof biodegradation. With biodegradation of the dyes it would have been expected that the peakswould change shape, as new intermediates is created when breaking down the dye molecules.On the basis of this observation, samples from the bioreactor were studied with a microscope.With this it was possible to notice that the biomass was colored blue or surrounded by blue colorboth in the aerobic and anaerobic reactor. As mentioned in section 2.1 adsorption of dyes to thebiomass is most likely to occur in the aerobic reactor, however this was also observed in the anae-robic reactor. This could indicate that the dyes present in the wastewater is non-biodegradableor that both biodegradation and adsorption is occuring. Even though adsorption is the primaryremoval mechanism in aerobic treatments, it is not all dyes that are adsorbed by activated sludge.The adsorption depends strongly on the dye structure, coloring groups and solubility. Cationicdyes have been shown to adsorb better than anionic dyes to activated sludge [38].
To obtain sufficient treatment, the operational conditions of the MBR must be optimized. Anhighly important parameter is the MLSS. Under normal conditions it would take the bioreactorapproximately one month for the microorganisms to stabilize and adjust to the wastewater. Dur-
27

Chapter 8. Discussion
ing this period the MLSS value is typical steady around 1-2 g/L, whereafter it begins to increasebefore stabilizing around 10-15 g/L [39]. This is for a MBR system operating under perfect con-ditions, which is not valid in this thesis. Figure B.1 in Appendix B shows the change in MLSSduring the MBR process. Immediately in the beginning of the process a decrease is observedin the MLSS concentration, whereafter the concentration is steady around 1-2 g/L, howeverslightly decreasing from 2 g/L towards 1 g/L. No increase in the MLSS is indicated during theprocess. This is most likely due to the high hydraulic retention time (HRT) of approximatelytwo days. Because of limited supplies of raw wastewater, the influent to the bioreactor had to bekept at a relatively low flow, which resulted in a low COD loading. This means that the microor-ganisms had limited recources for feeding and cell growth, resulting in the low and decreasingMLSS concentration. The MLSS concentration in the anaerobic reactor is lower than in theaerobic reactor, which could be because anaerobic treatment is more efficient for high strengthwastewater. Since the wastewater was low strength and relatively low temperature could occur,this could induce low biomass growth and growth rate, which would make it more difficult tosustain a sufficient biomass concentration. Further complications leading to a low MLSS con-centration, could be because of no recirculation of the biomass from the membrane module tothe bioreactor. However this is considered as not having as much an influence on the MLSS,since a decrease in MLSS in the membrane module tank also was observed, see figure B.1 inAppendix B. In order to sustain the biomass concentration in the bioreactor, 2 L of biomass wastransferred manually each day from the filtration unit to the bioreactor. Furthermore a solutionof glucose was added simultaneously to the bioreactor to ensure enough carbon sources for themicroorganisms to feed on. It is believed this maintained the MLSS concentration at a steadylevel instead of further decreasing.
Despite the non optimal conditions of the MBR, efficient removal of nutrients was still achieved.As shown in table 7.1 in section 7.1 the COD removal was stable around 94 % for all measure-ments conducted. This indicates a stable system in the bioreactor, which further supports thediscussion about the changes in absorbance, as described in the beginning of this chapter. TheCOD level was well below the limit of 125 mg/L as imposed by European legislation [40].Table 7.2 in section 7.1 shows the measured concentrations of phosphate and total nitrogen inthe wastewater along with phosphate, total nitrogen, ammonium, nitrate and nitrite concentra-tions in the permeate. An obvious tendency of increasing concentrations of phosphate, whencomparing the wastewater and permeate, is observed. Biological phosphorus removal requiresdifferent operational conditions than the removal of nitrogen, i.e. high biomass yields and shortsludge retention times. To effectively remove phosphate from the wastewater an anaerobic andaerobic reactor is needed. Sufficient biological phosphoruos removal in a MBR is done bypoly-phosphate accumulating organisms (PAOs). PAOs require anaerobic conditions for the as-similation of organic matter, such as volatile fatty acids, with the release of phosphorus fromintracellular polyphosphate granules. Then under aerobic conditions, phosphorus removed fromsolution by PAOs, resulting in phosphoruos-rich wastage [40] [41]. If the subsequent removalof phosphate in the aerobic reactor is not sufficient enough, this would result in an increasedconcentration of phosphate in the permeate. This is clearly observed in the measurements of thephosphate concentrations. So the high concentration of phosphate in the permeate is due to therelease of phosphate from the sludge. This indicates that to optimize the removal of phosphate,another post-treatment must be performed.
28
By studying table 7.2 it is shown that an efficient removal of nitrogen was obtained. In thebeginning of the MBR process, mixed results were obtained with increasing concentrations ofnitrogen and nitrate in the permeate. The ammonium concentration in the wastewater was mea-sured to be around 7 mg/L. The ammonium concentration in the permeate is measured to bebelow this concentration at all measurements, except during the last week of the process. Theefficient removal of ammonium indicates a successful nitrification in the aerobic reactor, whereammonium is converted to nitrite and nitrate. Nitrite is effectively converted to nitrate, which theresults also show, since only very small traces of nitrite are found in all the samples. In the be-ginning of the MBR process the microorganisms have not yet adapted to the environment, so theefficiency of the nitrification and denitrification is expected to be limited. This is as mentionedshown by the increased concentrations of nitrate, which could indicate an unefficient denitrifi-cation. In the anaerobic reactor nitrate is used in oxidizing organic carbon, however if anaerobicconditions have not been established, then a efficient denitrification can not be obtained and thenitrate can not be removed from the wastewater.During the last week of the MBR process, a significant increase in the concentration of totalnitrogen, ammonium and nitrate was observed. This is due to the addition of nutrient solution tothe bioreactor. In order to maintain the growth of the microorganisms, a solution of glucose, am-monium chloride and dipotassium phosphate was added. This was done so the microorganismswould have enough carbon, nitrogen and phosphorus for cell growth and reproduction. As men-tioned before this is believed to be the reason why a steady MLSS concentration was obtained.However by adding the nutrient solution, large amounts of ammonium and phosphate was addedcompared to the starting concentrations in the wastewater. Calculations of the nutrient solutionare found on the attached CD-ROM. This means that with these much higher concentrationsof nitrogen, ammonium and phosphate being added to the bioreactor, a higher concentration isexpected to be present in the permeate. The microorganisms can only consume a certain amountof nutrients, which means that a larger amount of nutrients is left in the wastewater, resulting ina higher concentration in the permeate. This difference can however be neglected by describ-ing the kinetics of the nitrification and denitrification. A range of equations and mass balancescan be used to evaluate the biosystem and determine the removal efficiency of the nutrients.Thereby can the difference in concentration caused by the added nutrient solution be eliminated.This however requires, that the biokinetic constants are know for the specific system, in order todescribe the efficiency of the biosystem. This was not done in this thesis, but could be of greatinterest in future studies.
8.2 Treatment with Fenton’s Reaction
As illustrated in figure 7.2 it was possible to effectively degrade the acid dyes Nylosan Yellowand Nylosan Red. The degradation of the dyes was relatively fast and mainly occured in thefirst few minutes of the reaction, whereafter the degradation slowed down. This is dependenton the reagent concentrations compared to the dye concentration, which has a great influenceon the reaction rate. Overall this indicates that treatment with Fenton’s reaction can efficientlybe used for treating textile wastewater containing acid dyes. This is further confirmed in figure7.5 in section 7.1 which shows a clear reduction in color when treating both wastewater and per-
29

Chapter 8. Discussion
meate with Fenton’s reaction. The blue color in the wastewater has been completely removedboth in the wastewater and permeate treated with Fenton’s reaction. This indicates a successfuldegradation of the dyes responsible for the blue color. However it was not possible to obtaincomplete color removal, when only treating the wastewater with Fenton’s reaction, since a yel-low color is still visible, as shown in figure 7.5. Also it is clear that the chemical treatment of thewastewater was not as efficient as the biological treatment, since the permeate from the MBRshows less coloring. It is surprising that the biological treatment shows greater effect on thecolor removal than the chemical treatment, since textile wastewater contains large amounts ofnon-biodegradable dyes, as mentioned in section 2.1. The wastewater is however of low strengthdue to the relatively low COD content and clarity in color compared to previously experimentswith textile wastewater, and can therefore be expected to be less toxic for the microorganisms.Although as previous mentioned the high efficiency in color removal from the MBR could bebecause of adsorption occuring instead of biodegradation.
When studying the permeate results, from figure 7.5 in section 7.2, a complete color removalwhen treating the permeate with Fenton’s reaction is observed. This shows that the wastewatercan efficiently be further treated after the MBR treatment and treatment with Fenton’s reactionas a post-treatment can improve the water quality. This is confirmed from the UV-Vis spectrumin figure 7.4 in section 7.2, where the permeate curve does not show any absorbance in the vis-ible spectrum. It it clearly observed that the permeate treated with Fenton’s reaction achieved afurther decrease in absorbance and thereby a further degradation of the dyes. Also in this fig-ure the absorbance of the wastewater can be further studied. There is indications of absorbancepeaks around 440 and 590 nm, however not very significant because of the influence of the largepeaks in the ultraviolet range. The peak around 590 indicates a blue color and the peak around440 indicates a yellow color, which is still present at lower amounts after treatment. This consistwith the fact that the color of the wastewater was blue, with indication of green color comingfrom the mixture of yellow and blue [42].
A complete indication of the dyes present in the samples is however not obtainable. The waste-water is a mixture of different dyes with unknown structures and other chemicals that has beenused during the dyeing process. The dyes and chemicals used in the dyeing process is a com-mercial secret, so the actual chemical name and structure is not obtainable. A wide range ofdifferent types of dyes are expected to be used, so it is difficult to precisely determine the originof the peaks in the spectrum. Especially the peaks present in the ultraviolet range are difficultto identificate, since several chromophores absorb UV radiation. However the peak around 254nm, which is only present in the samples treated with Fenton’s reaction, could be an indication ofhydrogen peroxide. The main peak just below 300 nm, which is present in all samples, could bean indication of the amount of organic contaminants still present in the samples. A wide rangeof ultraviolet absorbing chromophores exist, of which many can be present in dye molecules andintermediates [43].
The results show that when treating raw wastewater with Fenton’s reaction it was not possibleto obtain the same degree of color removal as with the MBR treatment. However further treat-ment with Fenton’s reaction of the permeate showed further color removal, resulting in an almostcolorless sample. This suggest that the use of Fenton’s reaction is better used as a post-treatment
30

instead of a pre-treatment to biological treatment. However to fully compare the results it wouldbe necessary to use wastewater treated with Fenton’s reaction in a MBR system in order to seeif the pre-treatment of Fenton’s reaction followed by biological treatment would result in bettercolor removal. It is however questionable if the implementation of Fenton’s reaction to MBRtreatment is beneficial. The pre-treatment with Fenton’s reaction would mean the use of largeamounts of chemicals when applied industrial, which would further result in large amounts ofiron precipitate. The excess iron is removed after treatment by raising the pH and precipitate itas Fe(OH)3. This would result in large amounts of precipitate that needs to be securely elimi-nated, which would increase the maintenance and cost significantly. Therefore a post-treatmentwould be preferred over a pre-treatment. However the efficiency of post-treatment with Fen-ton’s reaction can be discussed, since the effect is not that significant as the results show. Thecolor removal did in fact improve, but it is questionable how high a water quality is needed forthe textile industry to reuse the water in the dyeing process. This must be considered by themanufacturers before a final decision can be taken, on whether a post-treatment is feasible. Theextra maintenance alone can eliminate the option of using Fenton’s reaction, since the wholeprocess must be under pH-controlled conditions, which requires more maintenance and extracosts. These are the biggest disadvantages of the Fenton’s reaction, so comparing the obtainedresults and the disadvantages of the process, it is questionable that the use of Fenton’s reactionin practice can be implemented.
8.3 Alternative Choices of AOP
Instead of using Fenton’s reaction as treatment several other AOPs can be used, as previous men-tioned in section 3.2. These processes includes H2O2/O3, H2O2/UV and O3/UV. The advantagesof Fenton’s reaction compared to the other processes, is its low energy demand and the use ofrelatively low cost chemicals. Previous studies have shown that color removal efficiency withFenton’s reaction can be achieved just as high as processes including H2O2/O3, H2O2/UV andO3/UV. In some studies an even higher removal efficiency, but also lower removal efficiencieshave been shown [37] [44] [45]. However, as described previously, several disadvantages withthe Fenton’s reaction exist and highly influence the use of the process in practice. Whereas treat-ments with ozone and UV are already more tested in full scale [22] [46]. The advantages anddisadvantages of H2O2/O3, H2O2/UV and O3/UV processes are listed in table 8.1 along with abrief description of the process.
31

Chapter 8. Discussion
Table 8.1: Brief description, advantages and disadvantages of different AOP technologies [22].
AOP Technology Description Advantage Disadvantage
H2O2/O3 O3 and H2O2 react toform hydroxyl radicalsin aqueous solution.
More effective than O3and H2O2 alone.An already establishedtechnology.
May require ozone off-gas treatment.Higher costs.
O3/UV Hydroxyl radicals aregenerated when UVlight is applied toozonated water.
More efficient at gen-erating hydroxyl radi-cals than H2O2/UVprocesses.
Energy and cost inten-sive process.Turbidity can interferewith UV light.May require ozone off-gas treatment.
H2O2/UV Direct photochemicalcleavage of H2O2 ge-nerates hydroxyl radi-cals.
An already establishedtechnology.No off-gas treatmentrequired.Not limited by masstransfer relative to O3processes
Energy and cost inten-sive process.Turbidity can interferewith UV light.
As with the Fenton’s reaction, several studies have already shown that with treatments includ-ing H2O2/O3, H2O2/UV or O3/UV it is possible to obtain COD and color removal over 90 %[37] [47]. According to Melin et al. [22] the treatment with O3/UV or H2O2/UV have a higherefficiency than treatment with H2O2/O3 or Fenton’s reaction, which is because of the UV light.Several other studies have proven that when applying UV light to treatments with either ozone,hydrogen peroxide or Fenton’s reaction, the efficiency in color removal increases significant [37][44]. However treatments including UV light are more influenced by the wastewater quality,since the UV light can be highly affected by high turbidity in the wastewater and thereby de-creasing the process efficiency. Also the possibility of components in the wastewater absorbingthe UV light can be relatively high, for example nitrates and UV light absorbing chromophoresfrom dyes [22] [48].Other disadvantages with ozone and UV involving processes is the cost of the equipment andprocesses. For ozone treatments an off-gas treatment system would be required, since thereare strict laws for releasing ozone into the atmosphere, which would further increase the mainte-nance cost. For both treatments with ozone and/or UV the operational cost would increase, wheninstalling the equipment for the processes. However compared to treatment with Fenton’s re-action, which deals with less expensive chemicals and equipment, the treatment with H2O2/O3,H2O2/UV or O3/UV would still be preferred. The processes are close to being equally efficientand advantages and disadvantages can be named for all processes However treatments withozone and UV are more widely tested in both lab scale and full scale. The Fenton’s reactionsuffers especially from the pH adjustment and large amounts of iron sludge that needs to bedisposed, which increases the maintainance severely.
32

9Conclusion
The aim of this thesis was to treat textile wastewater with MBR treatment and improve the efflu-ent quality by further treatment with Fenton’s reaction. This was successfully achieved and theconclusion is as following:
On the basis of the results obtained in this thesis, it is concluded that MBR treatment is an ef-ficient method for treating textile wastewater with focus on removing the color. In this study,textile wastewater was efficiently decolorized through biological treatment and membrane fil-tration. The biological treatment efficiently decreased the content of COD, total nitrogen, am-monium, nitrate and nitrite in the wastewater and an approved effluent quality was obtained.The results however showed that improvements can still be made with respect to the content ofphosphate in the effluent. Even though the bioreactor was constructed to obtain optimal removalof phosphate, higher concentrations were still obtained in the effluent. On the basis of this, it itconcluded that further phosphate removal treatments can be necessary.
Furthermore the treatment with Fenton’s reaction was performed on the wastewater and per-meate from the MBR system. The results showed that it was possible to obtain an efficientcolor removal in both the wastewater and permeate. The treatment with Fenton’s reaction on thewastewater showed less efficient color removal than the MBR treatment, while the treatment ofpermeate from the MBR system showed improved effluent quality. On the basis of these resultsit is concluded that post-treatment with Fenton’s reagent is more desirable than pre-treatmentof the wastewater. However it is necessary to further test the use of Fenton’s reaction as a pre-treatment for obtaining a definite conclusion.
Even though post-treatment with Fenton’s reaction is concluded as being efficient, it is stillconcluded that further improvements of the treatment must be made, before the treatment withFenton’s reaction is sustainable. The maintenance is still too high compared to other AdvancedOxidation Processes. Processes including ozone and UV treatment is far more desirable becauseof their easier implementation into the industrial sector. The use of these processes is alreadybeing implemented, while the treatment with Fenton’s reaction needs further investigation be-fore it can be sustainable.
33


Bibliography
[1] Judd, S. The MBR book, vol. 2 of ISBN: 978-0-08-096682-3 (Butterworth-Heinemann,2011).
[2] Al-Kdasi, A., Idris, A., Saed, K. & Guan, C. Treatment of textile wastewater by advancedoxidation processes - a review. Global NEST: The international journal 6 (2004). Page222-230.
[3] Lodha, B. & Chaudhari, S. Optimization of fenton-biological treatment scheme for thetreatment of aqueous dye solutions. Journal of Hazardous Materials 148 (2007). Page459-466.
[4] Zuriaga-Agustí, E. et al. Sequencing batch reactor technology coupled with nanofiltrationfor textile wastewater reclamation. Chemical Engineering Journal 161 (2010). Page122-128.
[5] Madigan, M., Martinko, J., Dunlap, P. & Clark, D. Biology of microorganisms, vol. 12 ofISBN: 978-0321-53615-0 (Pearson Education Inc., 2000).
[6] van Haandel, A. & van der Lubbe, J. Handbook Biological Waste Water Treatment, vol. 1of ISBN: 978-90-77983-22-5 (Quist Publishing, 2007).
[7] Radjenovic, J., Matosic, M., Mijatovic, I. & Petrovic, M. Membrane bioreactor (mbr) asan advanced wastewater treatment technology. Handbook of Environmental Chemistry 5(2008). Page 37-101.
[8] de Silva, D., Urbain, V., Abeysinghe, D. & Rittmann, B. Advanced analysis ofmembrane-bioreactor performance with aerobic-anoxic cycling. Water ScienceTechnology 38 (1998). Page 505-512.
[9] Chang, I., Clech, P. L., Jefferson, B. & Judd, S. Membrane fouling in membranebioreactors for wastewater treatment. Journal of Environmental Engineering (2002). Page1018-1029.
[10] Zaloum, R., Lessard, S., Mourato, D. & Carriere, J. Membrane bioreactor treatment ofoily wastes from a metal transformation mill. Water Science Technology 30 (1994). Page21-27.
[11] Zhang, B., Yamamoto, K., Ohgaki, S. & Kamiko, N. Floc size distribution and bacterialactivities in membrane separation activated sludge processes for small-scale wastewatertreatment/reclamation. Water Science Technology 35 (1997). Page 37-44.
35
Bibliography
[12] Nagano, A., Arikawa, E. & Kobayashi, H. The treatment of liquor wastewater containinghigh-strength suspended solids by membrane bioreactor system. Water ScienceTechnology 26 (1992). Page 887-895.
[13] O’Neill, C., Hawkes, F., Hawkes, D. & Esteves, S. Anaerobic-aerobic biotreatment ofsimulated textile effluent containing varied ratios of starch and azo dye. Water Research 8(2000). Page 2355-2361.
[14] Vinodgopal, K. & Kamat, P. Photochemistry of textile azo dyes. spectral characterizationof excited state, reduced and oxidized forms of acid orange 7. Journal of Photochemistryand Photobiology 83 (1994). Page 141-146.
[15] Mohanty, S., Dafale, N. & Rao, N. Microbial decolorization of reactive black-5 in atwo-stage anaerobic-aerobic reactor using acclimatized activated textile sludge.Biodegradation 17 (2006). Page 403-413.
[16] Kim, S., An, J. & Kim, B. The effects of reductant and carbon source on the microbialdecolorization of azo dyes in an anaerobic sludge process. Dyes and Pigments 76 (2008).Page 256-263.
[17] You, S. & Teng, J. Performance and dye-degrading bacteria isolation of a hybridmembrane process. Journal of Hazardous Materials 172 (2009). Page 172-179.
[18] Mahdavi, A., Donnelly, T. & Anderson, G. Colour removal from a simulated dyewastewater using a two-phase anaerobic packed bed reactor. Water Research 35 (2001).Page 425-432.
[19] Chen, K., Wu, J., Liou, D. & Hwang, S. Decolorization of the textile dyes by newlyisolated bacterial strains. Journal of Biotechnology 101 (2003). Page 57-68.
[20] Atkins, P. & de Paula, J. Physical Chemistry, vol. 8 of ISBN: 9780198700722 (OxfordUniversity Press, 2006).
[21] US Peroxide. Fenton’s reagent general chemistry. URL:http://www.h2o2.com/industrial/fentons-reagent.aspx?pid=143&name=General-Chemistry-of-Fenton-s-Reagent, Downloaded: 04-03-2012.
[22] Partnership, T. C. M. R. Treatment technologies for removal of Methyl Tertiary ButylEther (MTBE) from drinking water, vol. 2 (National Water Researcg Institute - USA,2000). Edited by Gina Melin.
[23] Carey, J. An introduction to advanced oxidation processes (aop) for destruction oforganics in wastewater. Water Pollution Researc Journal of Canada 27 (1992). Page 1-21.
[24] Haag, W. & Yao, C. Rate constants for reaction of hydroxyl radicals with several drinkingwater contaminants. Environmental Science and Technology 26 (1992). Page 1105-1013.
[25] Andreozzi, R., Caprio, V., Insola, A. & Marotta, R. Advanced oxidation processes (aop)for water purification and recovery. Catalysis Today 53 (1999). Page 51-59.
36

[26] Özen, A., Aviyente, V. & Klein, R. Modeling the oxidative degradation of azo dyes: Adensity funtional theory study. Journal of Physical Chemistry 107 (2003). Page4898-4907.
[27] Pignatello, J. Dark and photoassisted fe3+-catalyzed degradation of chlorophenoxyherbicides by hydrogen peroxide. Environmental Science and Technology 26 (1992).Page 944-951.
[28] Kuo, W. Decolorizing dye wastewater with fenton’s reagent. Water Research 26 (1992).Page 881-886.
[29] Yoon, J., Lee, Y. & Kim, S. Investigation of the reaction pathway of oh radicals producedby fenton oxidation in the conditions of wastewater treatment. Water Science andTechnology 44 (2001). Page 15-21.
[30] Meric, S., Kaptan, D. & Ölmez, T. Color and cod removal from wastewater containingreactive black 5 using fenton’s oxidation process. Chemosphere 54 (2004). Page 435-441.
[31] Tantak, N. & Chaudhari, S. Degradation of azo dyes by sequential fenton’s oxidation andaerobic biological treatment. Journal of Hazardous Materials B136 (2006). Page698-705.
[32] Pignatello, J., Oliveros, E. & MacKay, A. Dadvanced oxidation processes for organiccontaminant destruction based on the fenton reaction and related chemistry.Environmental Science and Technology 36:1 (2006). Page 1-84.
[33] Kurbus, T. Primerjava naprednih oksidacijskih postopkov razbarvanja reaktivnih barvil.Master Thesis (2003).
[34] Arslan-Alaton, I., Gursoy, B. & Schmidt, J. Advanced oxidation of acid and reactivedyes: Effect of fenton treatment on aerobic, anoxic and anaerobic processes. Dyes andPigments 78 (2008). Page 117-130.
[35] Lucas, M., Dias, A., Sampaio, A., Amaral, C. & Peres, J. Degradation of a textile reactiveazo dye by a combined chemical-biological process: Fenton’s reagent-yeast. WaterResearch 41 (2007). Page 1103-1109.
[36] Liao, C., Kang, S. & Wu, F. Hydroxyl radical scavenging role of chloride and bicarbonateions in the H2O2/uv process. Chemosphere 44 (2001). Page 1193-1200.
[37] Azbar, N., Yonar, T. & Kestioglu, K. Comparison of various advanced oxidationprocesses and chemical treatment methods for cod and color removal from a polyester andacetate fiber dyeing effluent. Chemosphere 55 (2004). Page 35-43.
[38] Basibuyuk, M. & Forster, C. An examination of the adsorption characteristics of a basicdye (maxilon red bl-n) on to live activated sludge system. Process Biochemistry 38(2003). Page 1311-1316.
[39] Korenak, J. Maribor university. Private conversation (2012).
37

Bibliography
[40] Monclús, H., Sipman, J., Ferrero, G., Rodriguez-Roda, I. & Comas, J. Biological nutrientremoval in an mbr treating municipal wastewater with special focus on biologicalphosphorus removal. Bioresource Technology 101 (2010). Page 3984-3991.
[41] Comeau, Y., Rabionwitz, B., Hall, K. & Oldham, W. Phosphate release and uptake inenhanced biological phosphorus removal from wastewater. Journal Water PollutionControl Federation 59 (1987). Page 707-715.
[42] Zollinger, H. Color Chemistry, vol. 3 of ISBN: 3-906390-23-3 (Wiley-VCH, 2003).
[43] National Physical Laboratory. UV-visible spectroscopy. URL:http://www.kayelaby.npl.co.uk/chemistry/3_8/3_8_7.html, Downloaded:12-01-2012.
[44] Ruppert, G., Bauer, R. & Heisler, G. Uv-o3, uv-h2o2, uv-tio2 and the photo-fentonreaction - comparison of advanced oxidation processes for wastewater treatment.Chemosphere 28 (1994). Page 1447-1454.
[45] Faouzi, M. et al. Advanced oxidation processes for the treatment of wastes polluted withazoic dyes. Electrochimica Acta 52 (2006). Page 325-331.
[46] Cehovin, M. Mak-cmc. Private conversation (2011).
[47] Ledakowicz, S., Solecka, M. & Zylla, R. Biodegradation, decolourisation anddetoxification of textile wastewater enhanced by advanced oxidation processes. Journal ofBiotechnology 89 (2001). Page 175-184.
[48] Michigan State University. Visible and ultraviolet spectroscopy. URL:http://www2.chemistry.msu.edu/faculty/reusch/VirtTxtJml/Spectrpy/UV-Vis/spectrum.htm, Downloaded: 22-05-2012.
38

AChemicals and Apparatus
ChemicalsIron(II) sulfate heptahydrateFeSO4·7H2OProducer: Fluka ChemikaCas: 7782-63-0Assay: >99.5 %Batch No: 326730/1 993
Hydrogen peroxideH2O2Producer: Sigma-AldrichCas: 7722-84-1
Sulfuric acidH2SO4Producer: Panreac QuimicaCas: 7664-93-9Assay: 93-98 %
Sodium hydroxideNaOHProducer: Sigma-AldrichCas: 1310-73-2
Ammonium chlorideNH4ClProducer: Fluka ChemikaCas: 12125-02-0
Dipotassium phosphateK2HPO4Producer: KemikaCas: 7758-11-4
ApparatusSpectrophotometerModel: HACH LANGE DR 2800Producer: HACH LANGE GmbHOrigin: Düsseldorf, GermanySRN: 1233542
SpectrophotometerModel: Agilent 8453 UV-VisProducer: Agilent TechnologiesOrigin: Germany
HeaterModel: HACH LANGE LT 200Producer: HACH LANGE GmbHOrigin: Düsseldorf, GermanySRN: 1234034
pH-meter and DO-meterModel: inoLab Multi 720Producer: WTWOrigin: GermanySRN: 10350609
Filter paperModel: MN 614Producer: Macherey-Nagel GmbHOrigin: Düren, GermanyType: Fast filtration
39

Chapter A. Chemicals and Apparatus
HACH LANGE Cuvette Tests
COD cuvette testProduct code: LCK 314 CODRange: 15-150 mg/l O2Producer: HACH LANGE GmbHOrigin: Düsseldorf, Germany
COD cuvette testProduct code: LCK 514 CODRange: 100-2000 mg/l O2Producer: HACH LANGE GmbHOrigin: Düsseldorf, Germany
Ammonium cuvette testProduct code: LCK 305 AmmoniumRange: 1.0-12 mg/l NH4−NProducer: HACH LANGE GmbHOrigin: Düsseldorf, Germany
Nitrate cuvette testProduct code: LCK 340 NitrateRange: 5.0-35 mg/l NO3−NProducer: HACH LANGE GmbHOrigin: Düsseldorf, Germany
Nitrite cuvette testProduct code: LCK 342 NitriteRange: 0.6-6.0 mg/l NO2−NProducer: HACH LANGE GmbHOrigin: Düsseldorf, Germany
Phosphate cuvette testProduct code: LCK 348 PhosphateRange: 0.5-5.0 mg/l PO4−PProducer: HACH LANGE GmbHOrigin: Düsseldorf, Germany
Total nitrogen cuvette testProduct code: LCK 138 LatoNRange: 1-16 mg/l TNProducer: HACH LANGE GmbHOrigin: Düsseldorf, Germany
Total nitrogen cuvette testProduct code: LCK 338 LatoNRange: 20-100 mg/l TNProducer: HACH LANGE GmbHOrigin: Düsseldorf, Germany
40

BMBR Operational Conditions
MLSS Results
Every second day during the MBR process the MLSS value was determined for the aerobic re-actor, anaerobic reactor and the membrane unit tank. Figure B.1 shows the change in MLSS asa function of time:
0,0
2,0
4,0
6,0
8,0
10,0
12,0
0 5 10 15 20 25 30 35 40 45
MLS
S (g
/L)
Days
Membrane tank Anaerobic tank Aerobic tank
Figure B.1: MLSS change over time for the aerobic reactor, anaerobic reactor and membraneunit tank.
MLSS is observed to be steady over time both in the aerobic and anaerobic reactor, but a smalldescrease is observed. In the membrane unit tank a obvious decrease in MLSS is observed. Thisis directly opposite the expected tendency, which is an increase in MLSS [7].
41

Chapter B. MBR Operational Conditions
Dissolved Oxygen Results
Every day during the MBR process the DO level was measured in the aerobic and anaerobicreactor. The measurements were conducted three times every day in order to observe the changein DO more specific. The change in DO as a function of time is presented in figure B.2:
0,0
1,0
2,0
3,0
4,0
5,0
6,0
7,0
0 5 10 15 20 25 30 35 40 45
Oxy
gen
(mg/
L)
Days
Aerobic reactor Anaerobic reactor
Figure B.2: DO change over time for the aerobic reactor and anaerobic reactor.
An adequate level of DO must be kept in the aerobic reactor for the nitrification process to takeplace properly. According to literature the DO level must be above 2 mg/L for this to happen.Meanwhile the DO level in the anaerobic reactor must be below 1 mg/L, since the presence ofoxygen is an obstacle for the denitrification.
From figure B.2 it can be concluded that the right operational conditions have been present forthe microorganisms. The aerobic reactor had a DO level between 3 and 5 mg/L, while in theanaerobic reactor the DO level was mostly kept below 0.5 mg/L.
42

pH Results
Every day during the MBR process the pH level was measured in the aerobic reactor, anaerobicreactor and permeate. The change in pH as a function of time is presented in figure B.3:
2,0
3,0
4,0
5,0
6,0
7,0
8,0
9,0
10,0
11,0
12,0
0 5 10 15 20 25 30 35 40 45
pH
Days
Permeate Aerobic Anaerobic Feed
Figure B.3: Change in pH in the aerobic and anaerobic reactor, feed and permeate.
Figure B.3 shows that the pH for the wastewater (feed) change around pH 6-7 with a short in-crease in the end of the MBR process. In the first half of the operation periode, the pH levelswere almost at the same level in both the aerobic and anaerobic reactor and in the permeate.After this the pH levels became quite different. The anaerobic reactor had generally a pH levellower than the aerobic reactor around pH 6, whereas the pH level in the aerobic reactor wassteady just above pH 7. The permeate had the highest pH level around 8 with almost littlechange in the pH level.
43

Chapter B. MBR Operational Conditions
UV-Vis Measurements
The following figures present the UV-Vis results for wastewater and permeate. The first and lastmeasurements are marked on the graphs. The results can also be found on the CD-ROM.
2,0
2,5
3,0
3,5
4,0
Ab
sorb
an
ce
0,0
0,5
1,0
1,5
200 300 400 500 600 700 800
Ab
sorb
an
ce
Wavelength (nm)
Figure B.4: UV-Vis spectrum of wastewater samples during the MBR process.
2,0
2,5
3,0
3,5
4,0
Ab
sorb
an
ce
0,0
0,5
1,0
1,5
200 250 300 350 400 450 500 550 600
Ab
sorb
an
ce
Wavelength (nm)
Figure B.5: UV-Vis spectrum of permeate samples during the MBR process.
44

CFenton’s Reaction Results
The following figures present the results obtained from treating raw wastewater with Fenton’sreagent using different amounts of reagents and different Fe:H2O2 ratios.
Figure C.1: UV-Vis spectrum of wastewater treated with Fenton’s reagent with ratio 1:5 (w/w)Fe:COD.
Figure C.2: UV-Vis spectrum of wastewater treated with Fenton’s reagent with ratio 1:10 (w/w)Fe:COD.
45

Chapter C. Fenton’s Reaction Results
Figure C.3: UV-Vis spectrum of wastewater treated with Fenton’s reagent with ratio 1:25 (w/w)Fe:COD.
The following figures present the results obtained from treating the permeate with Fenton’sreagent using different amounts of reagents and different Fe:H2O2 ratios.
Figure C.4: UV-Vis spectrum of permeate treated with Fenton’s reagent with ratio 1:5 (w/w)Fe:COD.
46

Figure C.5: UV-Vis spectrum of permeate treated with Fenton’s reagent with ratio 1:10 (w/w)Fe:COD.
Figure C.6: UV-Vis spectrum of permeate treated with Fenton’s reagent with ratio 1:25 (w/w)Fe:COD.
47


![Untitled-1 [wazir.in] 2016 - Theme Paper.pdf · Theme Paper 1 Chapter 1: The way things are Current status of global textile and apparel sector T extile and apparel (T&A) products](https://img.dokumen.tips/doc/110x75/5ed70dd962136e72fb7bbf9a/untitled-1-wazirin-2016-theme-paperpdf-theme-paper-1-chapter-1-the-way.jpg)