Embed Size (px)
Citation preview

BULETINUL INSTITUTULUI POLITEHNIC DIN IAŞI Publicat de
Universitatea Tehnică „Gheorghe Asachi” din Iaşi Tomul LXI (LXV), Fasc. 2, 2015
SecŃia CONSTRUCłII DE MAŞINI
SYSTEM FOR MEASURING AND ACQUIRING
TEMPERATURES USING THE NI LABVIEW 2014 PLATFORM
BY
VASILE CAUNII and ADRIAN SACHELARIE∗∗∗∗
“Gheorghe Asachi” Technical University of Iaşi, România,
Department of Automotive and Mechanics
Received: July 10, 2015 Accepted for publication: October 5, 2015
Abstract. Alongside the growth of the complexity degree of ventilation and
air conditioning systems, the issue of experimental assessment and validation of the mathematic model, computer simulation or the project itself arises. The high accuracy, real time, measurements, their acquirement and export in different electronic formats have become an important condition for the realization of any experiment or project. In order to accomplish this it is necessary that the hardware equipment is as flexible as possible and allows the usage of a multitude of sensors and, moreover, to be accompanied by a software package with a multitude of options regarding data configuration, acquirement and export.
Key words: HVAC; Data acquisition; Sensors; Data export; DAQ card.
1. Introduction
In the conditions of the acerbic competition from the HVAC ventilation
and air conditioning systems market, the issue of time decrease and their project, realization and implementation costs arises. A decisive factor is the usage of an efficient measurement and control equipment that allows the connection of a great variety of sensors, to allow the implementation of a large ∗Corresponding author; e-mail: [email protected]
40 Vasile Caunii and Adrian Sachelarie
number of functions, to provide the user with the necessary data and high precision in a user-friendly format and, not lastly, to be able to generate different output signals necessary for orders.
2. NI LabView Platform
2.1. Data Acquisition (DAQ)
A logic step in this process is the usage of a Data acquisition card
connected to a computer, equipment which brings together the conditions mentioned in the previous paragraph allowing data acquirement and its use according to the project.
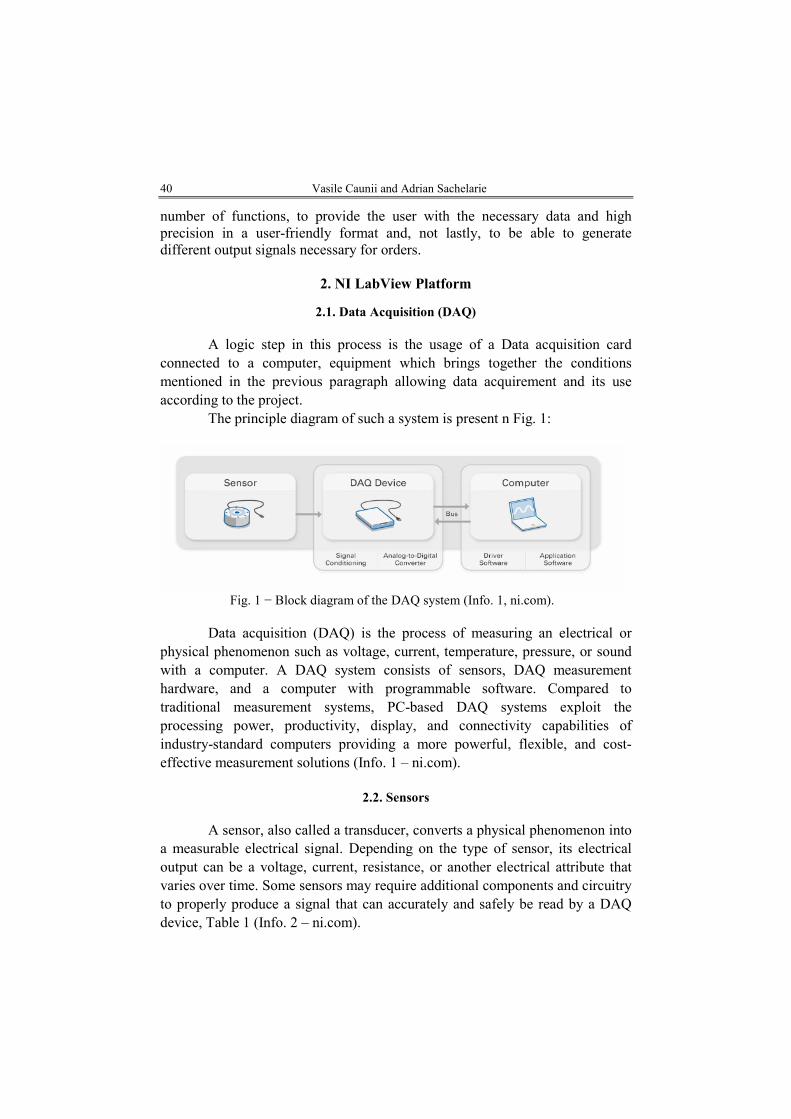
The principle diagram of such a system is present n Fig. 1:
Fig. 1 − Block diagram of the DAQ system (Info. 1, ni.com).
Data acquisition (DAQ) is the process of measuring an electrical or
physical phenomenon such as voltage, current, temperature, pressure, or sound with a computer. A DAQ system consists of sensors, DAQ measurement hardware, and a computer with programmable software. Compared to traditional measurement systems, PC-based DAQ systems exploit the processing power, productivity, display, and connectivity capabilities of industry-standard computers providing a more powerful, flexible, and cost-effective measurement solutions (Info. 1 – ni.com).
2.2. Sensors
A sensor, also called a transducer, converts a physical phenomenon into
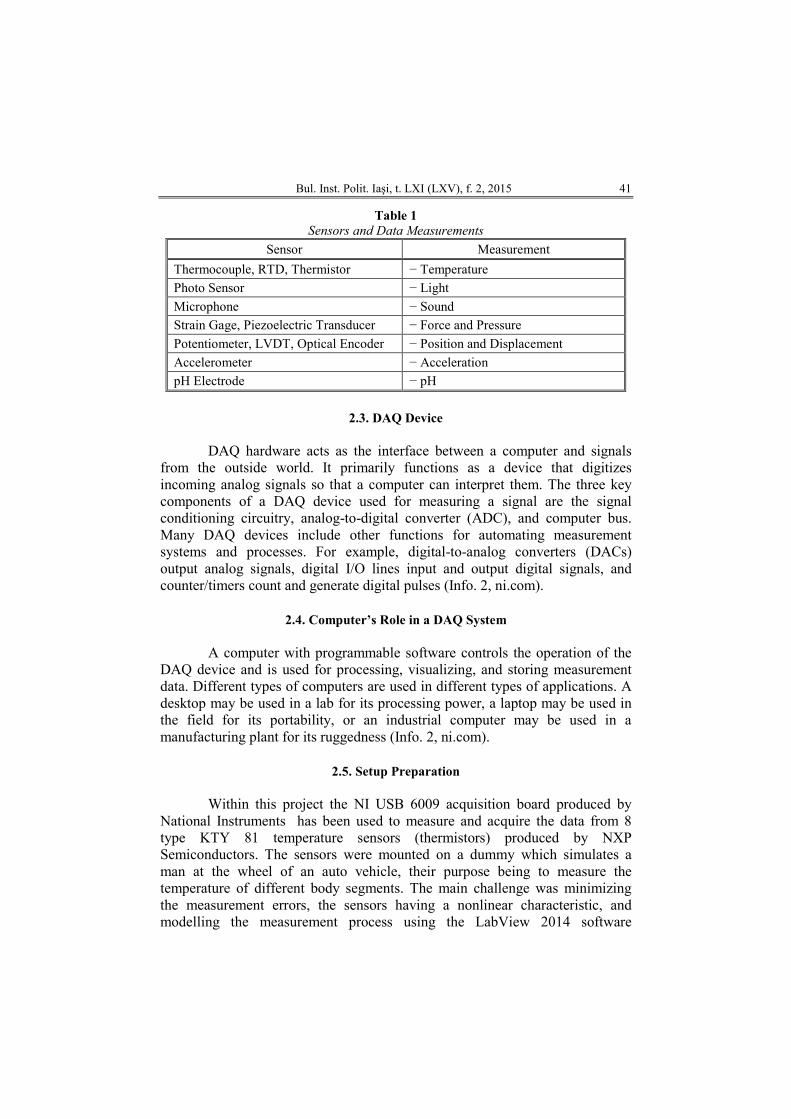
a measurable electrical signal. Depending on the type of sensor, its electrical output can be a voltage, current, resistance, or another electrical attribute that varies over time. Some sensors may require additional components and circuitry to properly produce a signal that can accurately and safely be read by a DAQ device, Table 1 (Info. 2 – ni.com).
Bul. Inst. Polit. Iaşi, t. LXI (LXV), f. 2, 2015 41
Table 1
Sensors and Data Measurements
Sensor Measurement
Thermocouple, RTD, Thermistor − Temperature
Photo Sensor − Light
Microphone − Sound
Strain Gage, Piezoelectric Transducer − Force and Pressure
Potentiometer, LVDT, Optical Encoder − Position and Displacement
Accelerometer − Acceleration
pH Electrode − pH
2.3. DAQ Device
DAQ hardware acts as the interface between a computer and signals
from the outside world. It primarily functions as a device that digitizes incoming analog signals so that a computer can interpret them. The three key components of a DAQ device used for measuring a signal are the signal conditioning circuitry, analog-to-digital converter (ADC), and computer bus. Many DAQ devices include other functions for automating measurement systems and processes. For example, digital-to-analog converters (DACs) output analog signals, digital I/O lines input and output digital signals, and counter/timers count and generate digital pulses (Info. 2, ni.com).
2.4. Computer’s Role in a DAQ System
A computer with programmable software controls the operation of the
DAQ device and is used for processing, visualizing, and storing measurement data. Different types of computers are used in different types of applications. A desktop may be used in a lab for its processing power, a laptop may be used in the field for its portability, or an industrial computer may be used in a manufacturing plant for its ruggedness (Info. 2, ni.com).
2.5. Setup Preparation
Within this project the NI USB 6009 acquisition board produced by
National Instruments has been used to measure and acquire the data from 8 type KTY 81 temperature sensors (thermistors) produced by NXP Semiconductors. The sensors were mounted on a dummy which simulates a man at the wheel of an auto vehicle, their purpose being to measure the temperature of different body segments. The main challenge was minimizing the measurement errors, the sensors having a nonlinear characteristic, and modelling the measurement process using the LabView 2014 software

42 Vasile Caunii and Adrian Sachelarie
instrument. The sensors were installed on a test dummy, one on every important body segment as shown in the Fig. 2:
Fig. 2 − Dummy with temperature sensors. As we can see, on every important body segment, a temperature sensor
was installed in a semi-sphere to be able to isolate it from the influence of the radiant surfaces.
The construction of the sensors and their inter faceting can be noticed in the Fig. 3.
Fig. 3 − Acquisition board and temperature sensors.
Bul. Inst. Polit. Iaşi, t. LXI (LXV), f. 2, 2015 43
2.6. Sensors
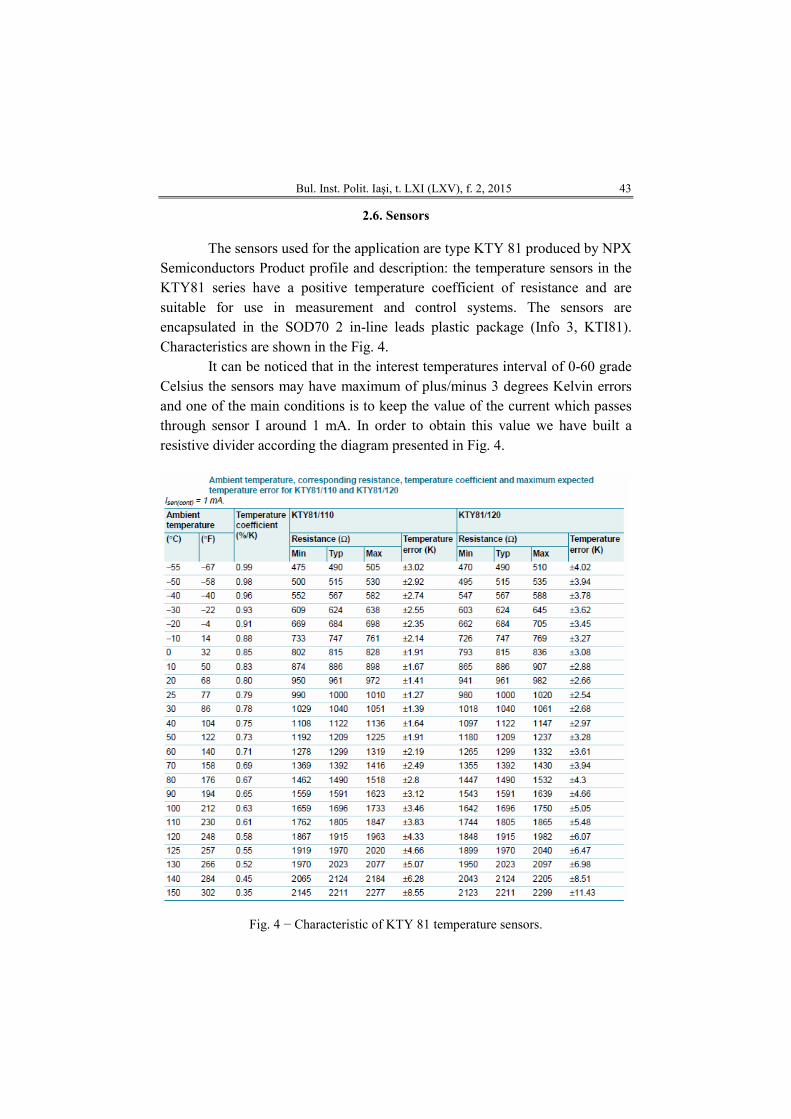
The sensors used for the application are type KTY 81 produced by NPX Semiconductors Product profile and description: the temperature sensors in the KTY81 series have a positive temperature coefficient of resistance and are suitable for use in measurement and control systems. The sensors are encapsulated in the SOD70 2 in-line leads plastic package (Info 3, KTI81). Characteristics are shown in the Fig. 4.
It can be noticed that in the interest temperatures interval of 0-60 grade Celsius the sensors may have maximum of plus/minus 3 degrees Kelvin errors and one of the main conditions is to keep the value of the current which passes through sensor I around 1 mA. In order to obtain this value we have built a resistive divider according the diagram presented in Fig. 4.
Fig. 4 − Characteristic of KTY 81 temperature sensors.
44 Vasile Caunii and Adrian Sachelarie
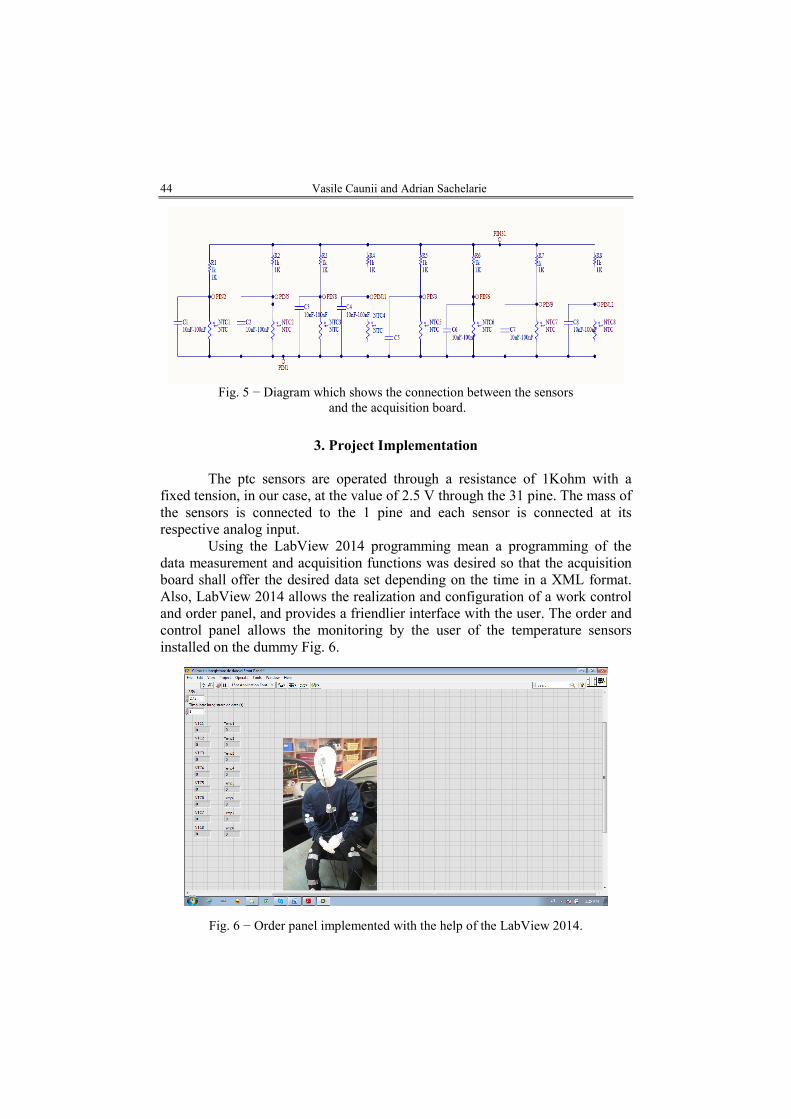
Fig. 5 − Diagram which shows the connection between the sensors
and the acquisition board.
3. Project Implementation
The ptc sensors are operated through a resistance of 1Kohm with a fixed tension, in our case, at the value of 2.5 V through the 31 pine. The mass of the sensors is connected to the 1 pine and each sensor is connected at its respective analog input.
Using the LabView 2014 programming mean a programming of the data measurement and acquisition functions was desired so that the acquisition board shall offer the desired data set depending on the time in a XML format. Also, LabView 2014 allows the realization and configuration of a work control and order panel, and provides a friendlier interface with the user. The order and control panel allows the monitoring by the user of the temperature sensors installed on the dummy Fig. 6.
Fig. 6 − Order panel implemented with the help of the LabView 2014.

Bul. Inst. Polit. Iaşi, t. LXI (LXV), f. 2, 2015 45
The block diagram of the NI USB 6009 acquisition card configuration is complex and contains more interconnected logic blocks, each of them modelling a certain function. Moreover, in order to satisfy the precision needs of the project, value interpolation block was provided for the tensions read from each sensor, Fig. 7.
Fig. 7 − The block diagram of acquisition card configuration as part of sensor reading.
Here we also define the type of signal which will be read at each analog
input, in our case choosing a direct current DC or a wave which varies continuously in time and not a rectangular or square wave.
The most important point is configuring the DAQ card within the DAQ Assistant block in which we must specify the number of active inputs and outputs, error conditions, the sampling rate of signals to be acquisitioned. Also in the configuration block we define the tasks that must be performed, start routine, stop routine and error. As shown in each of the 8 temperature sensor signals is configured on an analog input, the card allowing an excursion of the signal between +/− 10 V, Fig. 8.
After the global configuration of the acquisition board, the inputs must be individually configured. Within this block we can configure if the signal has to be submitted to processes such as filtering, demodulation etc. In our case, we preferred a hardware filtering because a software filtering could have affected the processing speed due to the fact that the board would have performed extra calculations.

46 Vasile Caunii and Adrian Sachelarie
Fig. 8 − The set-up configuration of the analog input 1. After it is allocated to a certain input, the signal, which is a tension read
from the thermally sensitive resistor, is converted using mathematical operations and transformed into a temperature. A special instrument provided by the LabView 2014 program is that it offers the possibility of a block which performs a value interpolation function, as seen in the figure below. The values measured by the sensors are then received by the logical memory block and sent to the panel configured initially to be displayed Fig. 9.
Fig. 9 − Interpolation block with look-up table and sampling function.
Bul. Inst. Polit. Iaşi, t. LXI (LXV), f. 2, 2015 47
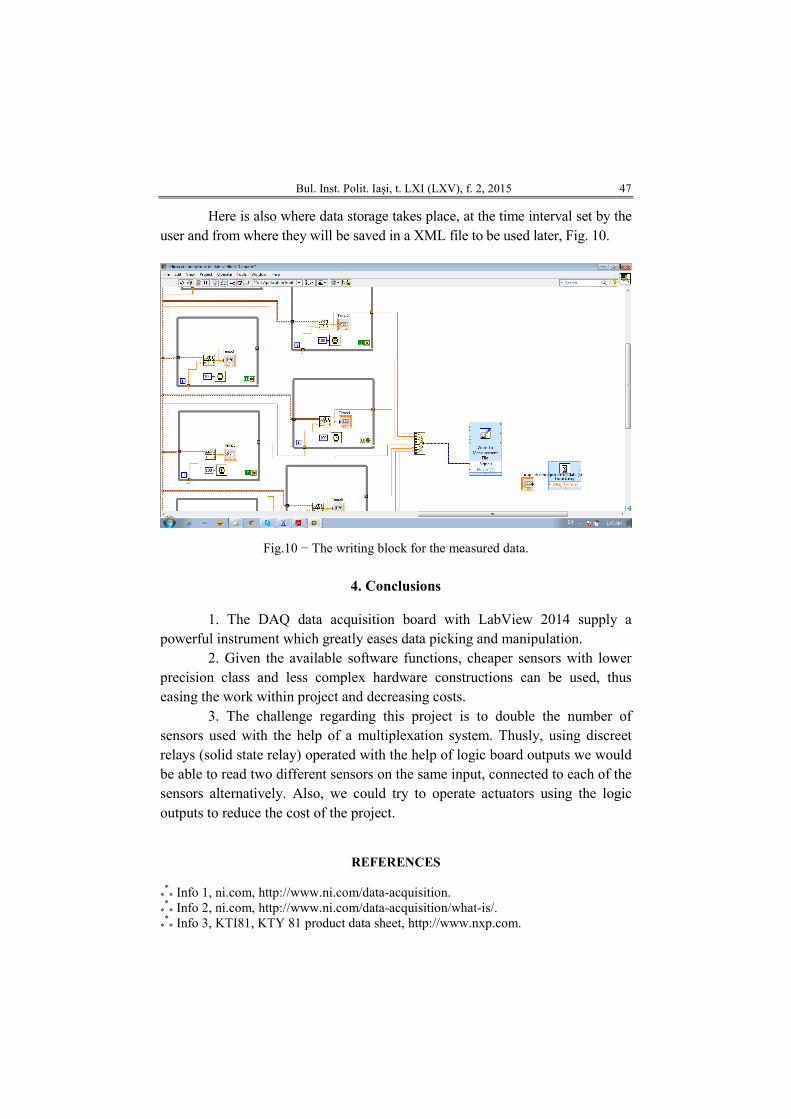
Here is also where data storage takes place, at the time interval set by the user and from where they will be saved in a XML file to be used later, Fig. 10.
Fig.10 − The writing block for the measured data.
4. Conclusions
1. The DAQ data acquisition board with LabView 2014 supply a
powerful instrument which greatly eases data picking and manipulation. 2. Given the available software functions, cheaper sensors with lower
precision class and less complex hardware constructions can be used, thus easing the work within project and decreasing costs.
3. The challenge regarding this project is to double the number of sensors used with the help of a multiplexation system. Thusly, using discreet relays (solid state relay) operated with the help of logic board outputs we would be able to read two different sensors on the same input, connected to each of the sensors alternatively. Also, we could try to operate actuators using the logic outputs to reduce the cost of the project.
REFERENCES
*** Info 1, ni.com, http://www.ni.com/data-acquisition.
*** Info 2, ni.com, http://www.ni.com/data-acquisition/what-is/.
*** Info 3, KTI81, KTY 81 product data sheet, http://www.nxp.com.

48 Vasile Caunii and Adrian Sachelarie
SISTEM DE MĂSURARE ŞI ACHIZIłIE A TEMPERATURILOR
FOLOSIND PLATFORMA NI LABVIEW 2014
(Rezumat) Odată cu creşterea gradului de complexitate a sistememelor de ventilaŃie şi aer
condiŃionat, se pune problema verificării şi validării experimentale a modelului matematic, a simulării pe calculator sau a proiectului în sine. Măsurătorile cu o mare acurateŃe, în timp real, achiziŃia lor şi exportul acestor date în diverse formate electronice a devenit o condiŃie prioritară în realizarea oricărui experiment sau proiect. Pentru realizarea acestui deziderat este necesar ca echipamentul hardware să fie cât mai flexibil şi să permită folosirea unei multitudini de senzori şi, în plus să fie însoŃit de un pachet de software care să aibă o multitudine de opŃiuni privind configurarea, achiziŃia datelor şi exportul lor. În urma studiului, s-a constatat că placa de achiziŃie de date DAQ împreună cu LabView 2014 pun la dispoziŃie un instrument puternic care uşurează mult culegerea datelor şi manipularea lor. Datorită funcŃiilor software disponibile se pot utiliza senzori mai ieftini cu o clasă de precizie mai scăzută, construcŃii hardware mai puŃin pretenŃioase uşurând munca în cadrul unui proiect şi scazând costurile.