Embed Size (px)
Citation preview

Synthetic Aperture Imagingin Breast Ultrasound:
A Preliminary Clinical Study
Won Hwa Kim, MD, Jung Min Chang, MD, PhD, Choye Kim, BS, Jongho Park, MS,Yangmo Yoo, PhD, Woo Kyung Moon, MD, PhD, Nariya Cho, MD, PhD, Byung Ihn Choi, MD, PhD
Ac
Fr(WSeJ.Bi28Ce(2e-
ªdo
Rationale and Objectives: To compare the image quality between conventional and synthetic aperture (SA) imaging in breast ultrasound
(US).
Materials and Methods: Twenty-four patients with 31 breast lesions were included in our study. The US data were processed with SAalgorithm. For quantitative analysis, contrast-to-noise ratio (CNR) and signal-to-noise ratio (SNR) were calculated. For qualitative analysis,
conventional and SA images were reviewed by three radiologists and diagnostic preference (conspicuity, margin sharpness, and contrast)
was assessed. The radiologists also determined whether artifacts were present. Parameters were analyzed using a paired t-test, Wilcoxonsigned-rank test, and chi-square test.
Results: The mean CNRs were higher in SA images compared with conventional images (mean, 2.56 versus 2.28, P = .004). The mean
SNRs were higher in SA images compared with conventional images (31.62 versus 25.26, P < .0001). SA images were considered as being‘‘better’’ or ‘‘much better’’ in 16–23 (51.6–74.2%) lesions of total 31 lesions for conspicuity, in 17–24 (45.2%–77.4%) for margin sharpness,
and in 13–23 (41.9%–74.2%) for contrast. Significant preferences in SA imageswere demonstrated (conspicuity,P < .05 for all radiologists;
margin sharpness and contrast in two radiologists). Refraction and speckle artifactswere less frequently observed in SA images (refraction,
P < .05 for all radiologists; speckle,P < .05 for two radiologists), whereas reflection artifactsweremore frequent in SA images (P < .05 in tworadiologists).
Conclusion: SA imaging provides better image quality than conventional imaging in patients with focal breast lesions in breast US.
Key Words: Ultrasound; synthetic aperture imaging; breast lesions.
ªAUR, 2012
INTRODUCTION image quality and contribute to the inconsistent and inaccu-
Ultrasonography (US) of the breast plays a critical role
in the diagnosis and management of breast diseases.
US with a high-frequency transducer is essential
for noninvasive diagnosis of screening-detected or palpable
masses, and it allows radiologists to differentiate between
benign or malignant masses using descriptive parameters (1).
The limitations of US, however, are that it is operator-
dependent and has considerable interobserver variability in
terms of radiologists’ descriptions and assessments of breast
lesions (2). Because inherent artifacts, such as speckle, acoustic
shadowing, and acoustic enhancement, can compromise
ad Radiol 2012; 19:923–929
om the Department of Radiology, Seoul National University Hospital.H.K., J.M.C., W.K.M., N.C., B.I.C.), 28, Yongon-dong, Chongno-gu,oul, 100-744, Seoul, Korea; Departments of Electronic Engineering (C.K.,P.) and Electronic Engineering and Interdisciplinary Program of Integratedotechnology (Y.Y.), Sogang University, Seoul, Korea. Received February, 2012; accepted April 2, 2012. Supported by the Converging Researchnter Program through the Ministry of Education, Science and Technology010K001113 and 2010K001110). Address correspondence to: J.M.C.mail: [email protected]
AUR, 2012i:10.1016/j.acra.2012.04.005
rate interpretation of breast images, several US techniques
had been developed and are commercially used to overcome
these problems (3–5). Nevertheless, conventional US still
has its own set of problems (eg, fixed transmit focus and
limitation of penetration) that is responsible for
compromising image quality.
Synthetic aperture (SA) imaging is a US algorithm technique
that can potentially provide higher image quality than conven-
tional imaging by using the superposition of the acoustic fields
The SA technique was originally developed from synthetic
aperture radar for geological and sonar applications, but it has
been modified for use in medical imaging for several decades
(6,7). The major difference between SA and conventional
imaging is that SA imaging simultaneously produces the full
range of images at each transmission, whereas a single image
line is built sequentially to form the full range of an image in
conventional imaging. In SA imaging, the simultaneously
obtained full range of the images yields low-resolution images,
which are synthesized to create a high-resolution image
(Fig 1) (8,9). During this process, the SA imaging system
calculates the transmit focus in all points of an image with
information from each emission, which provides more
uniform resolution beyond the fixed focus depth.
923

Figure 1. Schematic illustrations of conven-
tional and synthetic aperture (SA) imaging. Inconventional imaging, an image is formed by
sequentially building up each image line
achieved at each transmission. In SAimaging, a full line of low-resolution image is
produced from each transmission, and the
low-resolution imagesare synthesizedcoher-
ently to provide a high-resolution image.
KIM ET AL Academic Radiology, Vol 19, No 8, August 2012
Although previous theoretical and experimental in vitro
studies have generally shown that the image quality of SA
imaging is superior to conventional imaging, little research
has been conducted on the effects of SA imaging in clinical
settings (8–10). One in vivo SA imaging study used
a convex array transducer in the abdomen; however, the
study population was small and limited to healthy volunteers
(6). To the best of our knowledge, SA imaging for the appli-
cation of breast US has never been investigated.
Therefore, we conducted this study to compare the image
quality between conventional and SA imaging in breast US on
the basis of quantitative and qualitative analyses.
MATERIALS AND METHODS
Patients
This study was approved by our institutional review board,
and informed consent was obtained from all patients. Between
April 2011 and May 2011, US imaging was performed on 24
patients (with a total of 31 breast lesions) whowere to undergo
surgery or US-guided biopsy (mean age 46 years; age range
27–68 years). Nine of the 31 lesions were biopsied with
a 14-gauge automated needle, and 11-gauge vacuum-
assisted biopsies were performed for two lesions. The remain-
ing 20 lesions were surgically excised. Histological diagnoses
of the lesions were made by a pathologist with 20 years of
experience in breast pathology. There were 15 benign masses
(4 fibroadenomas, 3 adenoses, 1 intraductal papilloma, and 7
fibrocystic diseases) and 16 malignant masses (3 cases of ductal
carcinoma in situ and 13 cases of invasive carcinoma).The
mean sizes of the benign and malignant lesions were 1.25
cm (0.3–2 cm) and 2.03 cm (0.5–5.4 cm), respectively.
US Unit and Imaging Acquisition
The equipment used in this study was a commercial US
scanner (SonixTouch, Ultrasonix Medical Co., Richmond,
924
BC, Canada) that was equipped with a research package using
a 7.5-MHz linear array transducer and a SonixDAQ parallel
data acquisition system (because no SA system is currently
available). For conventional imaging, a 64-element
transmit-and-receive aperture was used, and the transmit
focus point was adjusted depending on the location of the
breast lesions. Similar to conventional imaging, a 64-
element transmit-and-receive aperture was used in SA
imaging, and 32 intermediate image lines from 32
emission-and-reception events were synthesized to produce
a high-resolution image. Images in both methods were
obtained on the same plane of the lesion by two experienced
radiologists. Except for focus depth, the other parameters (eg,
central frequency, dynamic range) were identical among
patients and techniques.
Quantitative Image Analysis
For quantitative image analysis, pre-beamformed raw channel
data acquired from the US machine were transferred to
a personal computer and processed offline with in-house soft-
ware running in MATLAB (Mathworks, Natick, MA).Two
parameters were used for an objective analysis: contrast-to-
noise ratio (CNR) and signal-to-noise ratio (SNR). To obtain
a sample value of the CNR, rectangular regions of interest
(ROIs) with a size of approximately 5 mm2 were placed in
the lesion and adjacent breast parenchyma. The CNR was
calculated by the following equation:
CNR ¼ jm1� m2jffiffiffiffiffiffiffiffiffiffiffiffiffiffiffis21 þ s2
2
pwhere m1 and m2 are the mean gray intensities within a rect-
angular ROI drawn within the lesion and in the back-
ground, respectively, and s1 and s2 are the variances
(standard deviation) of the mean gray intensities within
the rectangular ROI in the lesion and the background,
Academic Radiology, Vol 19, No 8, August 2012 SYNTHETIC APERTURE IMAGING IN BREAST ULTRASOUND
respectively. Similarly, the SNR is given by the following
equation:
SNRdB ¼ 10 log
�Psignal
Pnoise
�;
where Psignal and Pnoise are the powers of the signal and the
noise, respectively.
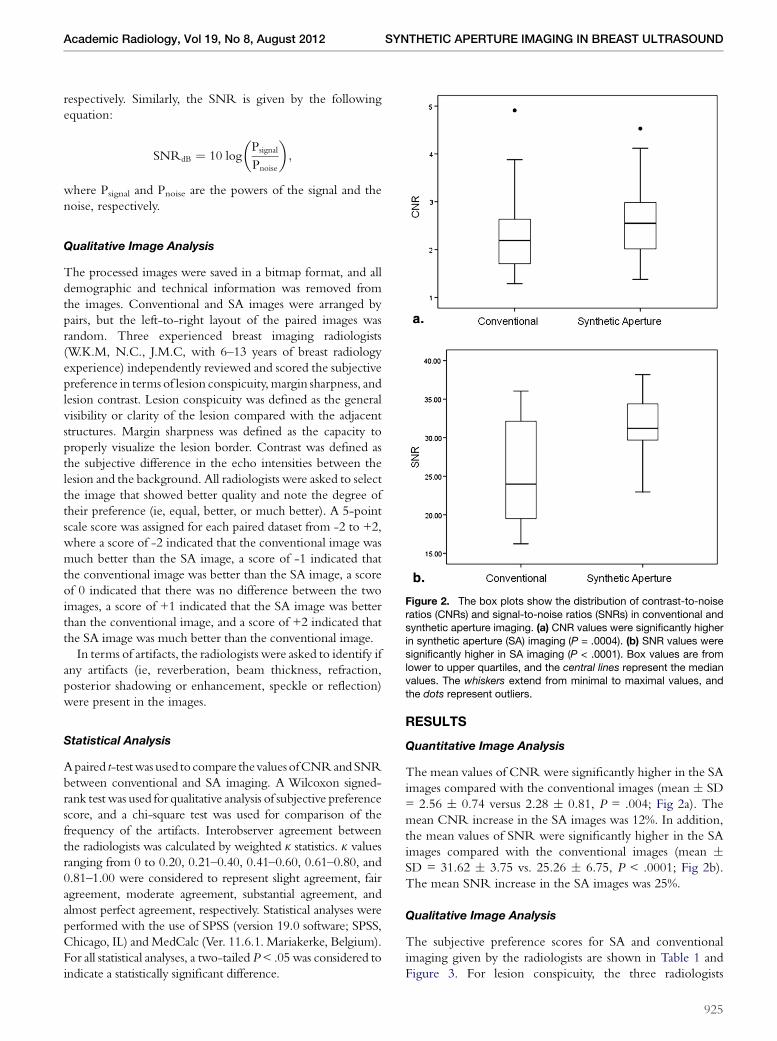
Figure 2. The box plots show the distribution of contrast-to-noise
ratios (CNRs) and signal-to-noise ratios (SNRs) in conventional andsynthetic aperture imaging. (a) CNR values were significantly higher
in synthetic aperture (SA) imaging (P = .0004). (b) SNR values were
significantly higher in SA imaging (P < .0001). Box values are from
lower to upper quartiles, and the central lines represent the medianvalues. The whiskers extend from minimal to maximal values, and
the dots represent outliers.
Qualitative Image Analysis
The processed images were saved in a bitmap format, and all
demographic and technical information was removed from
the images. Conventional and SA images were arranged by
pairs, but the left-to-right layout of the paired images was
random. Three experienced breast imaging radiologists
(W.K.M, N.C., J.M.C, with 6–13 years of breast radiology
experience) independently reviewed and scored the subjective
preference in terms of lesion conspicuity,margin sharpness, and
lesion contrast. Lesion conspicuity was defined as the general
visibility or clarity of the lesion compared with the adjacent
structures. Margin sharpness was defined as the capacity to
properly visualize the lesion border. Contrast was defined as
the subjective difference in the echo intensities between the
lesion and the background. All radiologists were asked to select
the image that showed better quality and note the degree of
their preference (ie, equal, better, or much better). A 5-point
scale score was assigned for each paired dataset from -2 to +2,
where a score of -2 indicated that the conventional image was
much better than the SA image, a score of -1 indicated that
the conventional image was better than the SA image, a score
of 0 indicated that there was no difference between the two
images, a score of +1 indicated that the SA image was better
than the conventional image, and a score of +2 indicated that
the SA image was much better than the conventional image.
In terms of artifacts, the radiologists were asked to identify if
any artifacts (ie, reverberation, beam thickness, refraction,
posterior shadowing or enhancement, speckle or reflection)
were present in the images.
Statistical Analysis
Apaired t-testwas used to compare thevaluesofCNRandSNR
between conventional and SA imaging. A Wilcoxon signed-
rank test was used for qualitative analysis of subjective preference
score, and a chi-square test was used for comparison of the
frequency of the artifacts. Interobserver agreement between
the radiologists was calculated by weighted k statistics. k values
ranging from 0 to 0.20, 0.21–0.40, 0.41–0.60, 0.61–0.80, and
0.81–1.00 were considered to represent slight agreement, fair
agreement, moderate agreement, substantial agreement, and
almost perfect agreement, respectively. Statistical analyses were
performed with the use of SPSS (version 19.0 software; SPSS,
Chicago, IL) andMedCalc (Ver. 11.6.1. Mariakerke, Belgium).
For all statistical analyses, a two-tailed P< .05 was considered to
indicate a statistically significant difference.
RESULTS
Quantitative Image Analysis
The mean values of CNR were significantly higher in the SA
images compared with the conventional images (mean � SD
= 2.56 � 0.74 versus 2.28 � 0.81, P = .004; Fig 2a). The
mean CNR increase in the SA images was 12%. In addition,
the mean values of SNR were significantly higher in the SA
images compared with the conventional images (mean �SD = 31.62 � 3.75 vs. 25.26 � 6.75, P < .0001; Fig 2b).
The mean SNR increase in the SA images was 25%.
Qualitative Image Analysis
The subjective preference scores for SA and conventional
imaging given by the radiologists are shown in Table 1 and
Figure 3. For lesion conspicuity, the three radiologists
925

TABLE 1. Subjective Preference Scores of Synthetic Aperture Imaging Compared with Conventional Imaging
Parameters
Conventional Images
Much Better
(Score = �2)
Conventional
Images Better
(Score = �1) Same (Score = 0)
SA Images
Better
(Score = +1)
SA Images
Much Better
(Score = +2)
Average
Score P Valuey
Conspicuity
Radiologist 1 0 (0) 6 (19.4) 9 (29) 13 (41.9) 3 (9.7) 0.42 .019*
Radiologist 2 0 (0) 4 (12.9) 9 (29) 18 (58.1) 0 (0) 0.45 .003*
Radiologist 3 0 (0) 5 (16.1) 3 (9.7) 12 (38.7) 11 (35.5) 0.94 <.0001*
Margin sharpness
Radiologist 1 0 (0) 6 (19.4) 8 (25.8) 15 (48.4) 2 (6.5) 0.42 .016*
Radiologist 2 0 (0) 6 (19.4) 11 (35.5) 14 (45.2) 0 (0) 0.26 .074
Radiologist 3 0 (0) 6 (19.4) 1 (3.2) 16 (51.6) 8 (25.8) 0.84 <.0001*
Contrast
Radiologist 1 0 (0) 6 (19.4) 9 (29) 13 (41.9) 3 (9.7) 0.42 .019*
Radiologist 2 0 (0) 6 (19.4) 12 (38.7) 13 (41.9) 0 (0) 0.23 .074
Radiologist 3 0 (0) 3 (9.7) 5 (16.1) 16 (51.6) 7 (22.6) 0.87 <.0001*
Data are presented as the mean values, and the numbers in parentheses are percentages.
*P < .05, two-tailed.yWilcoxon signed-rank test.
Figure 3. The bar graphs show the frequency distribution of preference scores of synthetic aperture imaging compared with conventional
imaging for (a) lesion conspicuity, (b) margin sharpness, and (c) contrast.
KIM ET AL Academic Radiology, Vol 19, No 8, August 2012
926

Figure 4. A 45-year-old woman with inva-sive ductal carcinoma in her left upper breast.
(a) Conventional ultrasound imaging demon-
strates an ill-defined hypoechoic mass
(arrow). (b) Synthetic aperture imaging showsimprovements inmargin sharpness and lesion
contrast of the mass (arrow) and connective
tissue in the subcutaneous fat (arrowhead).
For lesion conspicuity and margin sharpness,two of the three radiologists scored (b) as
‘‘better,’’ and the other radiologist scored (b)as ‘‘much better.’’ For the contrast measure-ment, all radiologists scored (b) as ‘‘better.’’
The contrast-to-noise ratio (CNR) and
signal-to-noise ratio (SNR) were higher in
synthetic aperture imaging (CNR, 2.69 vs.2.47; SNR, 36.46 vs. 34.93).
TABLE 2. Artifacts of Synthetic Aperture Imaging versusConventional Imaging
Artifacts
Conventional
(n = 31)
Synthetic
Aperture (n = 31) P Value
Refraction
Radiologist 1 12 7 .025*
Radiologist 2 12 5 .020*
Radiologist 3 19 7 .001*
Speckle
Radiologist 1 14 5 .029*
Radiologist 2 10 3 .052
Radiologist 3 15 7 .033*
Reflection
Radiologist 1 2 14 .003*
Radiologist 2 4 24 <.0001*
Radiologist 3 5 12 .071
Posterior shadowing
Radiologist 1 3 3 1.000
Radiologist 2 14 6 .083
Radiologist 3 2 0 .317
Posterior enhancement
Radiologist 1 1 0 .317
Radiologist 2 5 3 .157
Radiologist 3 0 0 1.000
Numbers are frequencies of artifacts in the 31 image pairs.
*P < .05, two-tailed.
Academic Radiology, Vol 19, No 8, August 2012 SYNTHETIC APERTURE IMAGING IN BREAST ULTRASOUND
indicated a score of ‘‘better’’ or ‘‘much better’’ for SA images in
16 (51.6%), 18 (58.1%), and 23 (74.2%) of the 31 total image
pairs, which was compared with 6 (19.4%), 4 (12.9%), and 5
(16.1%) for the conventional image pairs (Fig 4). The mean
scores of lesion conspicuity in the SA images were 0.42,
0.45, and 0.94 for the three radiologists, and all three radiol-
ogists rated significantly different scores between SA and
conventional images (P = .019, P = .003, P < .0001).
For margin sharpness, the three radiologists indicated
a score of ‘‘better’’ or ‘‘much better’’ for SA images in 17
(54.9%), 14 (45.2%), and 24 (77.4%) of the image pairs, which
was compared with 6 (19.4%), 6 (19.4%), and 6 (19.4%) for
the conventional image pairs. The mean average scores of
SA images for margin sharpness was 0.42, 0.26, and 0.84 in
the three radiologists, and two out of the three radiologists
rated significantly different scores between SA and conven-
tional images (P = .016, P < .0001).
For the measure of contrast, the three radiologists indicated
a score of ‘‘better’’ or ‘‘much better’’ for SA images in 16
(51.6%), 13 (41.9%), and 23 (74.2%) of the image pairs, which
was compared with 6 (19.4%), 6 (19.4%), and 3 (9.7%) for the
conventional image pairs. The mean scores of the SA images
for contrast were 0.42, 0.23, and 0.87 for the three radiolo-
gists, and two of the three radiologists rated significantly
different scores between SA and conventional images
(P = .019, P < .0001).
Refractions, which are caused by differences in sound
speeds between tissues and are usually seen as shadows around
the edges of the lesion or Cooper’s ligament, were less
frequently observed in the SA images compared with the
conventional images, and the differences were significant for
all three radiologists (conventional versus SA: 38.7%, 38.7%,
and 61.3% versus 22.6%, 16.1%, and 22.6%, P < .05 for all
three radiologists; Table 2, Fig 5). Speckles, which give noisy
and granular artifacts, were also less frequently found in the SA
images compared with the conventional images (conventional
versus SA: 45.2%, 32.3%, and 48.4% versus 16.1%, 9.7%, and
22.6%, P < .05 in two radiologists and P = .052 in one radi-
ologist). In contrast, reflections, which were seen as strong
echo signals around the tissue interface (eg, connective tissue
within fat lobules), were more frequently seen in the SA
images (conventional versus SA: 6.5%, 12.9%, and 16.1%
versus 45.2%, 77.4%, and 38.7%, P < .05 in two radiologists,
and P = .071 in one radiologist).
In overall, there were moderate interobserver agreements
between the radiologists in the grading of subjective prefer-
ence; kappa scores are summarized in Table 3.
DISCUSSION
In the present study, we assessed quantitative and qualitative
parameters for a new SA imaging technique for the
927

Figure 5. A 68-year-old woman with invasive
ducal carcinoma in her left upper outer breast.(a) Conventional ultrasound imaging demon-
strates a hypoechoic round mass (arrow),
which is difficult to distinguish from thesurrounding breast parenchyma. The refrac-
tion artifacts (arrowhead) are severe. (b) In
synthetic aperture imaging, the mass and the
surrounding normal tissues are more conspic-uous and there is a sharper margin and higher
contrast of the mass. In addition, a minimal
degree of refraction artifact is visible. For
lesion conspicuity, margin sharpness andcontrast, two of the three radiologists scored
(b) as ‘‘much better,’’ and the other radiologist
scored (b) as ‘‘better.’’ The contrast-to-noise
ratio (CNR) and signal-to-noise ratio (SNR)were higher in synthetic aperture imaging
(CNR, 2.53 vs. 2.19; SNR, 34.57 vs. 23.98).
TABLE 3. Levels of Agreement for Interobserver Variability forConventional and Synthetic Aperture Images
Parameters
Radiologists
1 and 2
Radiologists
1, 2, and 3
Radiologists
2 and 3
Conspicuity 0.59 � 0.13 0.65 � 0.1 0.56 � 0.08
Margin sharpness 0.46 � 0.15 0.44 � 0.01 0.44 � 0.1
Contrast 0.68 � 0.07 0.57 � 0.11 0.44 � 0.09
Artifact 0.32 � 0.06 0.50 � 0.06 0.27 � 0.06
Data are presented as the mean � standard deviation. A kappa
value of 0 to 0.20 was considered to be slight agreement, 0.21–
0.40 was considered fair agreement, 0.41–0.60 was considered
moderate agreement 0.61–0.80 was considered substantial agree-
ment, and 0.81–1.00 was considered almost perfect agreement.
KIM ET AL Academic Radiology, Vol 19, No 8, August 2012
visualization of breast lesions, and we compared the SA tech-
nique with conventional US. We noted higher values for
CNR and SNR in the SA images, and we found a higher
preference in terms of lesion conspicuity, margin sharpness,
and contrast in the SA images. In addition, artifacts (eg,
speckle and refraction artifacts) were less frequently observed
in the SA imaging. We found that the SA images were higher
quality than the conventional images, which was consistent
with previous in vitro and in vivo studies (6,10,11). Our
findings, together with previous theoretical and
experimental reports, suggest that SA imaging can offer
a promising alternative to conventional techniques in
medical US.
Conventional US imaging systems have several technical
constraints because of the use of a fixed transmit focus,
and high-resolution images are only achieved in the region
of the focus depth. Although the conventional system may
transmit with multiple transmit focusing along the scan
line to further improve resolution, the frame rate is conse-
quently reduced by the number of transmit focus. In addi-
tion, the attempts of current systems to increase the
number of active elements in the beamformer and increase
928
the central frequency of the transducer have the potential
to lower the frame rate to maintain the same level of image
quality.
In contrast with conventional imaging, the SA imaging
system is capable of calculating the transmit focus for all
points in the image (ie, dynamic focus in both transmit
and receive); thus, high resolution is obtained throughout
the image. This advantage in SA imaging can enhance lesion
visualization in deeper locations in the tissue. Several
previous studies have also shown an improvement in pene-
tration depth with the use of SA (6,9). In addition, a high
frame rate is still maintained in SA imaging because only
a sparse set of emissions is needed to create a full image
(12). SA imaging results in uniform improvements in image
resolution at all points of the image, which might also
provide better image quality in recently introduced auto-
mated whole-breast US systems. Indeed, automated US
using conventional imaging might suffer from the predeter-
mined focus, which would obscure the objects beyond the
focus depth.
Even with high-resolution images in breast US imaging,
artifacts (eg, shadowing and refractions caused by normal
anatomic structures) might interfere with fine visualization
of target lesions (13). In our study, we found that the
frequency of refraction and speckle artifacts was lower in the
SA imaging compared with the conventional imaging. The
reason might be caused by the fact that SA imaging averages
the various artifact patterns by synthesizing the low-
resolution images; however, reflection artifacts from specular
reflectors were accentuated in the SA imaging, which agreed
with a previous reports by Pederson et al (6,14). Interestingly,
most of the reflection artifacts in our images were found just
above the rib.
The present study had several limitations. First, this study
consisted of a small number of breast masses and did not
include normal breast tissues and benign breast cysts. Further
studies with a larger number of patients are needed to

Academic Radiology, Vol 19, No 8, August 2012 SYNTHETIC APERTURE IMAGING IN BREAST ULTRASOUND
generalize the feasibility of SA imaging in clinical applications.
Second, we did not evaluate the effect of image quality by
motion and penetration depth. In several previous reports,
SA imaging has shown a substantial amount of susceptibility
to patient motion (6,15). In this study, we could not assess
the effect of motion on image quality of SA imaging
because the equipment we used was not real-time ultrasound.
In regard to penetration depth in SA imaging, we also
observed a tendency toward improved penetration, which
resulted in a more uniformed resolution, even in deeper
tissues beyond the focal lesion; however, this was not proved
in this study. Future studies examining the penetration depth
in SA imaging should be investigated in various clinical
settings. Third, image acquisition was performed using rela-
tively low-frequency (7.5-MHz) probe that is related to
higher rate of artifact than usual images because this study
was a preclinical study and the commercial real-time equip-
ment with high-frequency probe for SA imaging is not
currently available. For this reason, scanning using high-
frequency probe was preceded before the scanning using
low-frequency probe for research purpose that allowed us to
detect small (< 5 mm) lesions that may not be plausible with
low-frequency probe. Therefore, the effect of SA imaging
on detection rate especially for small lesions could not be
investigated. Further research on implementation of SA
imaging using more relevant commercial equipment that
provides real-time scanning and a high-frequency probe is
needed.
In conclusion, SA imaging provides better image quality
than conventional imaging in breast US. Although our study
was limited to a small number of patients, further clinical
investigations should be performed to validate the medical
applications of SA imaging.
REFERENCES
1. Stavros AT, Thickman D, Rapp CL, et al. Solid breast nodules: use of
sonography to distinguish between benign and malignant lesions. Radi-
ology 1995; 196:123.
2. Baker JA, Kornguth P, Soo MS, et al. Sonography of solid breast lesions:
observer variability of lesion description and assessment. AJR Am J
Roentgenol 1999; 172:1621.
3. Szopinski KT, Pajk AM, Wysocki M, et al. Tissue harmonic imaging: utility
in breast sonography. J Ultrasound Med 2003; 22:479.
4. Mesurolle B, Helou T, El-Khoury M, et al. Tissue harmonic imaging,
frequency compound imaging, and conventional imaging: use and benefit
in breast sonography. J Ultrasound Med 2007; 26:1041.
5. Huber S, Wagner M, Medl M, et al. Real-time spatial compound imaging in
breast ultrasound. Ultrasound Med Biol 2002; 28:155–163.
6. Pedersen MH, Gammelmark KL, Jensen JA. In-vivo evaluation of convex
array synthetic aperture imaging. Ultrasound Med Biol 2007; 33:37–47.
7. O’Donnell M. Coded excitation system for improving the penetration of
real-time phased-array imaging systems. IEEE Trans Ultrason Ferroelec-
trics Frequency Control 1992; 39:341–351.
8. Jensen JA, Nikolov SI, Gammelmark KL, et al. Synthetic aperture ultra-
sound imaging. Ultrasonics 2006; 44:e5–e15.
9. Bae MH, Jeong MK. A study of synthetic-aperture imaging with virtual
source elements in B-mode ultrasound imaging systems. IEEE Trans Ul-
trason Ferroelectrics Frequency Control 2000; 47:1510–1519.
10. Gammelmark KL, Jensen JA. Multielement synthetic transmit aperture
imaging using temporal encoding. IEEE Trans Med Imaging 2003; 22:
552–563.
11. Kim K, Hwang J, Jeong J, et al. An efficient motion estimation and
compensation method for ultrasound synthetic aperture imaging. Ultrason
Imaging 2002; 24:81–99.
12. Nikolov S, Jensen JA. Synthetic aperture tissue and flow ultrasound
imaging. In: Synthetic aperture tissue and flow ultrasound imaging.
Denmark: Technical University of Denmark, Department of Electrical
Engineering, Biomedical Engineering; 2001.
13. Baker JA, Soo MS, Rosen EL. Artifacts and pitfalls in sonographic imaging
of the breast. AJR Am J Roentgenol 2001; 176:1261.
14. Pedersen MH, Misaridis TX, Jensen JA. Clinical evaluation of chirp-coded
excitation in medical ultrasound. Ultrasound Med Biol 2003; 29:895–905.
15. Trahey GE, Nock LF. Synthetic receive aperture imaging with phase
correction for motion and for tissue inhomogeneities. II. Effects of and
correction for motion. IEEE Trans Ultrason Ferroelectrics Frequency
Control 1992; 39:496–501.
929