Embed Size (px)
Citation preview
SYNTHESIS, SPECTROSCOPIC, AND THERMODYNAMIC STUDY OF URANYL
AND NEODYMIUM PHOSPHATE SOLID PHASES
By
CHRISTOPHER ROBERT ARMSTRONG
A dissertation submitted in partial fulfillment of
the requirements for the degree of
DOCTOR OF PHILOSOPHY
WASHINGTON STATE UNIVERSITY
Department of Chemistry
DECEMBER 2009
ii
To the Faculty of Washington State University:
The members of the Committee appointed to examine the dissertation of
CHRISTOPHER ROBERT ARMSTRONG find it satisfactory and recommend that it be
accepted.
___________________________
Sue B. Clark, Ph.D., Chair
___________________________
Kenneth L. Nash, Ph.D.
___________________________
Peter R. Griffiths, Ph.D.
___________________________
James O. Schenk, Ph.D.
iii
ACKNOWLEDGEMENTS
I acknowledge the following people, without whom the work presented herein
would not have been possible. I gratefully acknowledge my advisor, Dr. Sue Clark, for
her guidance, patience and support; and for giving me the latitude to explore my own
research interests. Dr. Ken Nash is thanked for his good-natured attitude, exemplary
editorial skills, and simply for teaching me so much about solution chemistry and solvent
extraction. Dr. Peter Griffiths is thanked for sharing his incredible knowledge in the field
of IR spectroscopy. Many of the scientific findings presented in this dissertation are
directly related to the knowledge he has shared with me. Dr. Louis Scudiero is
acknowledged for his assistance with running the TGA and DSC instruments, and Dr.
Andrew Felmy is thanked for his help with thermodynamic interpretations. Lastly, I
acknowledge all of the members, past and present, of the Clark, Nash, Benny and Wall
groups at WSU. The help, guidance and support I received from them are immeasurable.
iv
SYNTHESIS, SPECTROSCOPIC, AND THERMODYNAMIC STUDY OF URANYL
AND NEODYMIUM PHOSPHATE SOLID PHASES
Abstract
by Christopher Robert Armstrong, Ph.D.
Washington State University
December 2009
Chair: Sue B. Clark
Hydrated uranyl phosphates comprise some of the most refractory U-bearing
minerals in oxidizing environments. As such, these solids are expected to precipitate
where in-situ phosphate amendments are employed in contaminant remediation scenarios.
However, the structure, stability, and mechanisms by which these hydrated uranyl
phosphates form are not well understood. The work presented herein is largely focused
on (1) synthesis of a suite of hydrated uranyl phosphates, (2) characterization of these
phases using a variety of analytical techniques, (3) analysis of the solution phases
associated with the solids that form, and (4) development of thermodynamic data for
these hydrated uranyl phosphates. In a related study, the uptake of the lanthanide cation
neodymium onto hydroxylapatite (HA): Ca5(PO4)3OH was also investigated.
v
The following novel contributions are presented in this study.
1. We synthesized, for the first time, the mixed actinide and lanthanide phosphate,
francoisite-(Nd):Nd[(UO2)3OOH(PO4)2)]•5H2O.
2. The transformation of chernikovite: H3O[(UO2)(PO4)]•4H2O into triuranyl
diphosphate tetrahydrate (TDT):(UO2)2(PO4)3•4H2O was demonstrated.
3. The solubility of triuranyl diphosphate tetrahydrate (TDT) was measured at 23
and 50oC, and we report the first log Ksp data for elevated temperature.
4. The energetics of hydration were investigated for the natural meta autunite
mineral (Ca[(UO2)(PO4)]2 •6.5H2O and synthetic sodium autunite:
Na2[(UO2)(PO4)]2 •3H2O.
5. We show that the uptake mechanism of Nd onto HA is highly pH dependent.
Whereas at high pH (ca. 10), isomorphic Nd-Ca substitution is observed, at lower
pH (ca. 4), the precipitation of a discrete hydrated NdPO4 phase is evidenced.
vi
TABLE OF CONTENTS
ACKNOWLEDGEMENTS ...........................................................................................................III
ABSTRACT .................................................................................................................................. IV
LIST OF FIGURES ........................................................................................................................ X
LIST OF TABLES ..................................................................................................................... XIV
ATTRIBUTIONS ..................................................................................................................... XVII
CHAPTER ONE: Introduction
1.0 Actinide Contamination ...........................................................................................................1
1.1 U-bearing phosphate mineral stability ......................................................................................1
1.2 U-bearing mineral crystal structures .........................................................................................2
1.3 U-bearing mineral solubility .....................................................................................................3
1.4 Role of water in hydrated oxysalts............................................................................................4
1.5 Spectroscopic studies ...............................................................................................................7
1.6 Apatite minerals ........................................................................................................................7
1.7 f-element and HA interactions ..................................................................................................8
1.8 Lanthanide phosphate minerals.................................................................................................9
1.9 Research and Objectives .........................................................................................................10
1.10 Overview ..............................................................................................................................10
CHAPTER TWO: Spectroscopic and Thermal Study of Hydrated Uranyl Phosphates:
Francoisite-(Nd) and Triuranyl Diphosphate Tetrahydrate
1. INTRODUCTION ....................................................................................................................18
2. EXPERIMENTAL MATERIALS AND METHODS ..............................................................20
3. RESULTS .................................................................................................................................25
3.1. Elemental Analysis ................................................................................................................25
3.2. Thermal Analysis ...................................................................................................................26
3.3 Powder x-ray diffraction (PXRD) ..........................................................................................31
3.4 ATR-IR and Raman Spectroscopy..........................................................................................33
4. DISCUSSION ...........................................................................................................................38
vii
4.1. ATR-IR and Raman spectroscopy .........................................................................................38
4.2. Water Sorption Verification ...................................................................................................50
5. SUMMARY ..............................................................................................................................55
CHAPTER THREE: Delineating Hydrated Uranyl Phosphates: Powder XRD and ATR-
IR Studies
1. INTRODUCTION .....................................................................................................................69
2. EXPERIMENTAL MATERIALS AND METHODS ..............................................................71
3. RESULTS AND DISCUSSION ...............................................................................................74
3.1 Elemental Analysis (ICP-OES and TGA) ..............................................................................74
3.2 PXRD analysis ........................................................................................................................76
3.3 ATR-IR analysis .....................................................................................................................79
4. CONCLUSION .........................................................................................................................84
CHAPTER FOUR: The Hydrothermal Transformation of Chernikovite into Triuranyl
Diphosphate Tetrahydrate (TDT)
1. INTRODUCTION ....................................................................................................................93
2. EXPERIMENTAL MATERIALS AND METHODS ..............................................................95
3. RESULTS ................................................................................................................................97
4. DISCUSSION .........................................................................................................................108
5. CONCLUSION .......................................................................................................................110
CHAPTER FIVE: Experimental solubility of triuranyl diphosphate tetrahydrate (TDT) at
23oC and 50
oC
1. INTRODUCTION ..................................................................................................................113
2. MATERIALS AND METHODS ............................................................................................114
3. RESULTS AND DISCUSSION .............................................................................................117
viii
3.1. Experimental results.............................................................................................................117
3.2. Final TDT characterization ..................................................................................................124
4. SUMMARY ............................................................................................................................132
CHAPTER SIX: The effect of hydration on the Gibbs free energy of formation for U6+
solids: A thermal study
1. INTRODUCTION ..................................................................................................................137
2. EXPERIMENTAL ..................................................................................................................140
3. DISCUSSION .........................................................................................................................142
4. RESULTS ..............................................................................................................................143
4.1. Elemental Analysis (ICP-OES) ...........................................................................................143
4.2. PXRD analysis .....................................................................................................................145
4.3. ATR-IR Spectrometry ..........................................................................................................148
4.4. Thermal Analyses (TGA and DSC) ....................................................................................150
5. CONCLUSION .......................................................................................................................157
CHAPTER SEVEN: Partitioning of Neodymium into Hydroxylapatite (Ca5(PO4)3OH)
1. INTRODUCTION ..................................................................................................................161
2. EXPERIMENTAL METHODS AND MATERIALS ............................................................162
3. RESULTS AND DISCUSSION .............................................................................................164
4. CONCLUSION .......................................................................................................................174
ix
CHAPTER EIGHT: CONCLUSION ........................................................................................188

x
LIST OF FIGURES
Fig. 1. Crystallographic structure of triuranyl diphosphate tetrahydrate (TDT) (Burns,
2005) ...............................................................................................................................................6
Fig. 2. Panel A. TGA of francoisite-(Nd). The TGA temperature profile represents the
average of duplicate runs. All runs were conducted at 5 oC/min scan rate ...................................27
Fig. 3. Panel A. TGA plot of TDT representing the average of duplicate runs conducted
at a scan rate of 5 oC/min. Panel B. 1
st derivative of profile shown in Panel A ...........................29
Fig. 4. Powder XRD diffractograms of francoisite-(Nd) (top) and TDT (bottom) ....................32
Fig. 5. ATR-IR spectrum of francoisite-(Nd) in the mid-infrared spectrum ...............................34
Fig. 6. ATR-IR spectrum of TDT in the mid-infrared spectrum .................................................35
Fig. 7. Raman spectrum of francoisite-(Nd) .................................................................................43
Fig. 8. Raman spectrum of TDT ...................................................................................................44
Fig. 9. Thermogravimetric analyses (TGA) conducted on francoisite-(Nd) ...............................52
Fig. 10. Thermogravimetric analyses (TGA) conducted on TDT ................................................53
Fig.EA- 1. TGA (top) and DSC (bottom) for francoisite-(Nd). Both TGA and DSC plots
represent the average of duplicate runs. All runs were conducted at 5 oC/min scan rate .............64
Fig. EA-2. TGA (top) and DSC (bottom) for TDT. Both TGA and DSC plots represent
the average of duplicate runs. All runs were conducted at 5 oC/min scan rate ............................65
Fig.E-A3. Comparison of francoisite-(Nd) IR data for room temperature (RT) and
samples heated to 80 oC and 500
oC ..............................................................................................66
xi
Fig. E-A4. ATR-IR spectra of TDT at various temperatures. The crystals were analyzed
at room temperature (bottom spectrum) after heating overnight at 130oC (middle
spectrum) and to 220oC (top spectrum) ........................................................................................67
Fig. 11. TGA temperature profiles of Na autunite (dotted line), chernikovite (dashed
line) and TDT (solid line). These thermograms represent the average of quadruplicate
TGA runs in the case of Na autunite and triplicate runs for chernikovite and TDT. All
runs were conducted from 25oC to 500
oC at 10
oC/min .................................................................77
Fig. 12. Powder XRD diffractograms of Na autunite synthesized by the author (black),
placed in a Parrbomb at 140oC for three days (dotted) and PDF #29-1284 (grey) ........................79
Fig. 13. Powder XRD diffractograms of the well-aged chernikovite synthesized by the
author (most intense diffractogram in black) and the published PDF # 29-0670 (lower
profile in grey) for synthetic chernikovite .....................................................................................80
Fig. 14. Powder XRD diffractogram of TDT and published XRD pattern of TDT, PDF#
37-0369 (grey lines) ......................................................................................................................81
Fig. 15. ATR-IR spectra of Na autunite: Na[(UO2)(PO4)]•1.5H2O (top), chernikovite
(H3O[(UO2)(PO4)]•4H2O (middle) and TDT: (UO2)3(PO4)2•4H2O (bottom) showing
structural evidence of distinct phases ............................................................................................83
Fig. 16. TGA temperature profiles for chernikovite (dotted line) and TDT (solid line).
These thermograms represent the average of triplicate runs for chernikovite and TDT.
All runs were conducted from 25oC to 500
oC at 10
oC/min ...........................................................99

xii
Fig. 17. Powder XRD diffractograms of the well-aged chernikovite synthesized by the
author (most intense diffractogram in black) and the published PDF # 29-0670 (lower
profile in grey) for synthetic chernikovite ...................................................................................100
Fig. 18. Powder XRD diffractograms of TDT that was generated via hydrothermal
reaction of well-aged synthetic chernikovite. Note the intensity of this XRD pattern ...............102
Fig. 19. ATR-IR spectra of chernikovite [H3O[(UO2)(PO4)]xH2O] (top) and TDT:
[UO2)3(PO4)2∙4H2O] (bottom)......................................................................................................104
Fig. 20. Proposed structural shift from the meta-stable autunite anion topology to the
more stable, edge sharing uranophane anion topology ................................................................109
Fig. 21. Approaching equilibrium from undersaturation of (UO2)3(PO4)2•4H2O; 0.1m
NaClO4; initial pCH+ = 2;T= 23oC (top); 50
oC (bottom). Diamonds: U; Squares: P .................119
Fig. 22. Approaching equilibrium from undersaturation of (UO2)3(PO4)2•4H2O; 0.5m
NaClO4; initial pCH+ = 2;T= 23oC (top); 50
oC (bottom). Diamonds: U; Squares: P .................120
Fig. 23. Approaching equilibrium from undersaturation of (UO2)3(PO4)2•4H2O; 1.0m
NaClO4; initial pCH+ = 2;T= 23oC (top); 50
oC (bottom). Diamonds: U; Squares: P .................121
Fig. 24. Approaching equilibrium from undersaturation of (UO2)3(PO4)2•4H2O; 2.0m
NaClO4; initial pCH+ = 2;T= 23oC (top); 50
oC (bottom). Diamonds: U; Squares: P .................122
Fig. 25. Approaching equilibrium from undersaturation of (UO2)3(PO4)2•4H2O; 5.0m
NaClO4; initial pCH+ = 2;T= 23oC (top); 50
oC (bottom). Diamonds: U; Squares: P .................123
Fig. 26. IR spectra of various equilibrated solids. Top panel: 5.0m NaClO4; middle
panel: 1.0m NaClO4; bottom panel: 0.1m NaClO4 ......................................................................127
xiii
Fig. 27. XRD diffractograms of various equilibrated solids. Top panel: 5.0m NaClO4;
middle panel: 1.0m NaClO4; bottom panel: 0.1m NaClO4 ..........................................................129
Fig. 28. PXRD profiles of synthetic Na autunite (black) and the corresponding published
pattern, PDF # 29-1284 (grey) ....................................................................................................146
Fig. 29. PXRD profiles of calcium meta autunite (black) and published pattern for
calcium meta autunite; PDF # 39-1351 (grey) .............................................................................147
Fig. 30. ATR-IR spectra of synthetic Na autunite and meta autunite .........................................148
Fig. 31. DSC run of 6.3 mg of zinc. Scan rate: 10oC/min .........................................................151
Fig. 32. Average of three TGA (top) and ten DSC (bottom) temperature profiles of
synthetic sodium autunite at a scan rate of 10oC/min ..................................................................154
Fig. 33. Average of three TGA (top) and ten DSC (bottom) temperature profiles of meta
autunite at a scan rate of 10oC/min ..............................................................................................156
Fig. 34. Dissolved Ca and P concentrations as a function of pH in suspensions of HA
only (open squares) and HA equilibrated with 85 ppm Nd (solid squares) ................................165
Fig. 35. Dissolved Nd concentrations both with and without the influence of HA ....................167
Fig. 36. IR spectra of various solids in this study .......................................................................169
Fig. 37. XRD patterns of various solids in this study ................................................................172
Fig. 38. Calibration curve for UV-VIS studies of HA surface area determination using the
MB adsorption method ................................................................................................................181
Fig. 39. HA surface charge and PZC ..........................................................................................186

xiv
LIST OF TABLES
Table 1. Analytes and corresponding wavelengths and detection limits in this study .................22
Table 2. Chemical digestion data for francoisite-(Nd) (top) and TDT (bottom) ........................26
Table 3. Approximate francoisite-(Nd) (top) and TDT (bottom) dehydration events as a
function of temperature from TGA analyses .................................................................................30
Table 4. Tentative band assignments for francoisite-(Nd) ..........................................................36
Table 5. Tentative band assignments for TDT .............................................................................37
Table 6. Comparison of the calculated O-O bond distances in Ǻ (from Libowitzky,
1999) and their relationship to the frequency of the v3 H2O mode. ..............................................41
Table 7. Comparison between calculated and experimental uranyl bond lengths for
francoisite-(Nd) (top) and TDT (bottom) .....................................................................................45
Table 8. Initial TGA and second TGA runs of the same samples following a cooling
period of approximately two hours in the open atmosphere ..........................................................54
Table 9. Chemical digestion data for the solids in this study. In descending order: Na
autunite, chernikovite and TDT .....................................................................................................75
Table 10. Band assignments for Na autunite, chernikovite and TDT ..........................................84
Table 11. Analytes and corresponding wavelengths and ICP detection limits in this study........96
Table 12. Chemical digestion data for well-aged chernikovite and chernikovite-derived
TDT ................................................................................................................................................98
Table 13. Band assignments for chernikovite ............................................................................105
Table 14. Band assignments for TDT ........................................................................................106
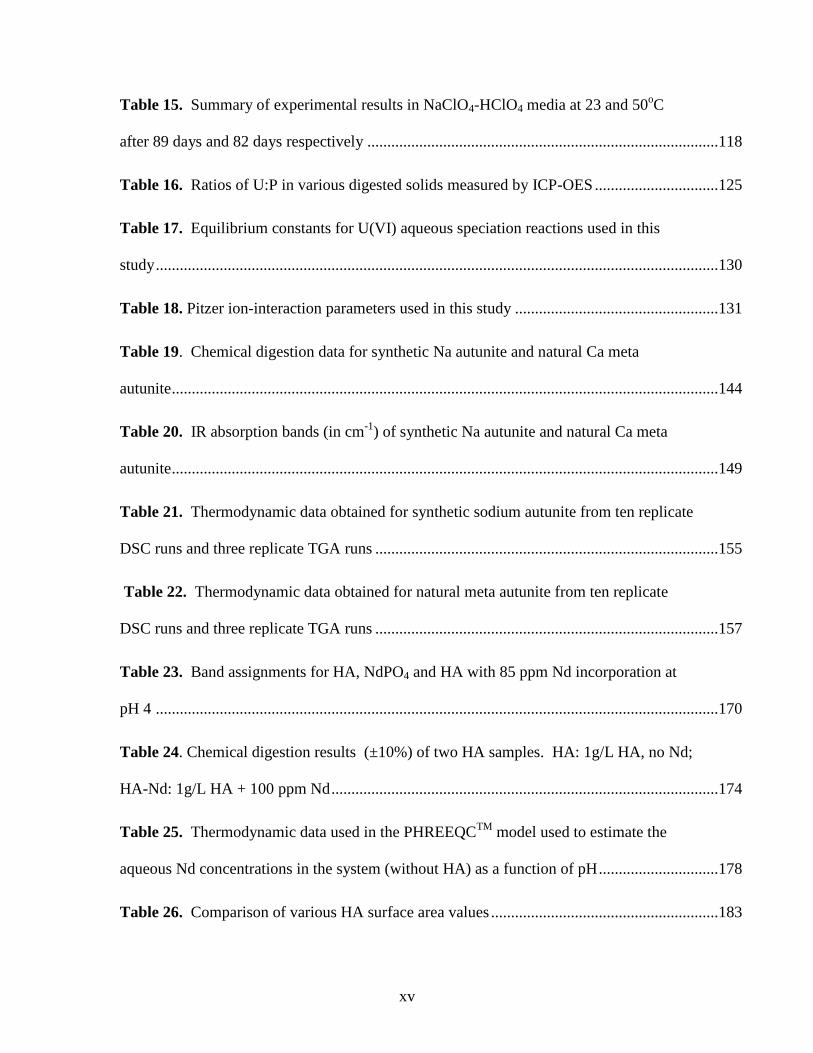
xv
Table 15. Summary of experimental results in NaClO4-HClO4 media at 23 and 50oC
after 89 days and 82 days respectively ........................................................................................118
Table 16. Ratios of U:P in various digested solids measured by ICP-OES ...............................125
Table 17. Equilibrium constants for U(VI) aqueous speciation reactions used in this
study .............................................................................................................................................130
Table 18. Pitzer ion-interaction parameters used in this study ...................................................131
Table 19. Chemical digestion data for synthetic Na autunite and natural Ca meta
autunite .........................................................................................................................................144
Table 20. IR absorption bands (in cm-1
) of synthetic Na autunite and natural Ca meta
autunite .........................................................................................................................................149
Table 21. Thermodynamic data obtained for synthetic sodium autunite from ten replicate
DSC runs and three replicate TGA runs ......................................................................................155
Table 22. Thermodynamic data obtained for natural meta autunite from ten replicate
DSC runs and three replicate TGA runs ......................................................................................157
Table 23. Band assignments for HA, NdPO4 and HA with 85 ppm Nd incorporation at
pH 4 .............................................................................................................................................170
Table 24. Chemical digestion results (±10%) of two HA samples. HA: 1g/L HA, no Nd;
HA-Nd: 1g/L HA + 100 ppm Nd .................................................................................................174
Table 25. Thermodynamic data used in the PHREEQCTM
model used to estimate the
aqueous Nd concentrations in the system (without HA) as a function of pH ..............................178
Table 26. Comparison of various HA surface area values .........................................................183
xvi
Table 27. Comparison of literature values of the PZC of hydroxylapatite ................................187
xvii
ATTRIBUTIONS
All of the work reported in this dissertation was conducted by myself in consultation with
the following people. My advisor, Dr. Sue B. Clark and committee members, Drs.
Kenneth L. Nash and Peter R. Griffiths share authorship of the work presented in Chapter
Two. Chapter Five acknowledges Drs. Andrew R. Felmy and Sue B. Clark as coauthors.
Dr. Sue B. Clark and I share exclusive authorship in all of the other submitted
manuscripts (Chapters Three, Four, Six and Seven) resulting from this dissertation.
1
CHAPTER ONE
INTRODUCTION
1.0 Actinide Contamination
The development and production of nuclear weapons and energy in the United States has
resulted in significant contamination to soil and groundwater systems (Abdelouas et al., 1999).
Nuclear waste packages that come in contact with groundwater are susceptible to corrosion
resulting in the release of radionuclides into the biosphere. Comprising the most abundant
radionuclide in U.S. Department of Energy (DOE) complexes, Uranium is present in the soil and
groundwater of twelve DOE sites (Wellman et al., 2006). Although in many cases the oxidation
of U(IV) to U(VI) results in the formation of refractory U mineral phases, the exact mechanisms
of U(VI) incorporation and the structure and stability of these phases are not well understood.
Addressing some of these problems, particularly as they pertain to U(VI) phosphates, is
the key motivation for the research presented in this dissertation. The following sections discuss
recent studies that have been carried out pertinent to the work undertaken in this thesis, followed
by a discussion of additional research that needs to be addressed, thereby providing the reader
with a brief overview of the salient topics presented in this work. The bulk of the experimental
studies carried out in the following chapters pertain to the chemistry of hydrated uranyl
phosphates. In addition, a related study of f-element and apatite interactions is also presented.
1.1 U-bearing phosphate mineral stability
In a study investigating the long-term stability of U phosphate mineral phases in natural systems,
Jerden et al. (2003) examined the paragenesis of U-bearing mineral phases at the Coles Hill
2
uranium deposit, Virginia. These workers reported that dissolved U was effectively sequestered
due to the oxidation of relatively abundant uraninite (UIV
O2) and subsequent U6+
phosphate
precipitation. Jerden et al. (2003) further concluded that the natural system had reached a steady
state with respect to U mobility, and by extrapolationg their experimental findings, they
estimated a time-scale of U-phosphate (meta autunite) stability to be 250,000 years.
1.2 U-bearing mineral crystal structures
Using primarily single crystal x-ray diffraction (XRD), Burns and coworkers (Burns et al., 1999;
Burns, 2005) presented a comprehensive overview of the topologies of a variety of uranyl
bearing minerals. The uranyl phosphates generally comprise the least soluble suite of uranyl
minerals (Gorman-Lewis, 2008). As such, detailed structural characterization of these materials
has been carried out by several workers (Locock and Burns, 2002; Locock and Burns, 2003a;
Burns, 2005; Bray et al., 2008; Yu et al., 2008; and references therein). Of these uranyl
phosphates, the autunite mineral family has received the most attention, including single crystal
XRD studies to determine the structure of mono- (Locock et al., 2004), di- (Locock and Burns,
2003b) and trivalent (Khosrawan-Sazedj, 1982) autunite minerals. Using the anion topology
developed by Burns et al. (1996), these workers showed that the autunite mineral system is
composed of sheets containing uranyl square bipyramids bound to phosphate tetrahedra via
oxygen atoms. These polyhedra typically share vertices and are structurally similar to the uranyl
silica group uranophane. In all cases, cations coordinated by varying numbers of water
molecules are located in the interlayer. The hydrated cation in turn is bonded to either the
phosphate or uranyl oxygen (or both) via long range electrostatic attraction or more directly
through oxygen bridging (Burns, 1999). Locock and Burns (2002) also determined the crystal
structure (orthorhombic crystal system) of synthetic triuranyl diphosphate tetrahydrate (TDT:
3
(UO2)3(PO4)2∙4H2O)). It is comprised of the uranophane anion sheet topology. As such, the
crystal structure of TDT consists of sheet-like motifs of pentagonal uranyl bipyramids
coordinated by phosphate tetrahedra via oxygen bridges (Fig. 1). In contrast to the autunite
family, however, the uranyl and phosphate groups in TDT share oxygen edges. In addition, a
uranyl bipyramid occupies the “interlayer” resulting in an open framework structure. Recent
uranyl phosphate structural studies have extended these investigations to include interstitial
organic ligands, such as C6H14N22+
(Bray et al., 2008) and 4,4’-bipyridyl (Yu and Albrecht-
Schmitt, 2008) and mixed-metal uranyl compounds (Yu et al., 2008).
1.3 U-bearing mineral solubility
In oxidizing environments, uranium primarily occurs in the hexavalent state as the uranyl cation
(UO22+
). As noted above, spent nuclear fuel corrosion can result in the precipitation of highly
stable uranyl solids (Abdelouas et al., 1999). Of these minerals, the oxides, silicates, and
particularly the phosphates are the most stable, and thus are expected to comprise important
sinks for uranium under oxidizing conditions. Consequently, several experimental studies have
been conducted on the solubility of the more common naturally occurring uranyl-bearing
minerals such as uranyl phosphates (Vesely et al., 1965; Markovic et al., 1983; Felmy et al.,
2005; Rai et al., 2005), silicates (Nguyen, et al., 1992; Ilton et al., 2006; Gorman-Lewis et al.,
2007), oxy-hydroxides (Rai et al., 2002; Giammar and Hering, 2002) and carbonates (Meinrath
et al., 1993; Elless and Lee, 1998).
However, thermodynamic data obtained from experimental solubility studies of U6+
solids yield log Ksp values that are in some cases highly disparate (Gorman-Lewis et al., 2008).
Slight physico-chemical variations in the solid (e.g., degree of crystallinity, particle size, natural
4
vs. synthetic sample, chemical impurities etc.) can lead to very different results (Gorman-Lewis
et al., 2008). In addition, quantification of the aqueous hydrogen ion concentration is often
improperly conducted leading to significantly erroneous measurements. Moreover, inadequate
characterization of both the initial solid and the final equilibrated solid can lead to misleading
interpretations. In this dissertation (Chapter 4) we show that under favorable conditions,
complete structural transformation of one hydrated uranyl phosphate into another occurs.
Hydrothermal treatment caused a complete reorganization in the structural unit, whereby uranyl
square bipyramids (in chernikovite) converted to uranyl pentagonal bipyramids (in TDT). This
finding stresses the importance of rigorously characterizing both the starting material and the end
product, particularly in thermodynamic studies that involve variations in the physico-chemical
conditions of the aqueous systems, e.g., temperature and/or ionic strength. Thus, one aim of this
study is to conduct a thorough characterization of both the starting material and the end product
in solubility studies with varying ionic strength and temperature, as described in detail in Chapter
5 of this dissertation.
1.4 The role of water in hydrated oxysalts
One of the main goals of this study is to delineate the different roles of water in the hydrated
uranyl phosphates investigated in this dissertation. To this end, we have adopted the operational
definitions of water initially developed by Hawthorne (1992), and later expanded to include
uranyl oxysalts by Schindler and Hawthorne (2008). For hydrated oxysalts, Hawthorne defined
a structural unit and an interstitial complex. The structural unit is the “backbone” of the solid
(i.e., the sheet) where the majority of the covalent bonding takes place. In our case the structural
unit comprises the uranyl and phosphate polyhedra. The interstitial complex (i.e., the interlayer)
5
effectively stitches the two-dimensional structural units together, comprising variably bonded
and oriented water molecules and polyvalent cations.
In hydrated oxysalts, water typically resides in the structural unit, coordinated to the
metal cation, and in the interstitial complex, either directly coordinated to the interstitial metal or
occupying available free space, held in place by hydrogen bonding (i.e., occluded). In addition,
water is also present in hydrated oxysalts on the surfaces of the solid due to physisorption,
effectively in equilibrium with atmospheric water.
Water is thus delineated into four categories:
i. Structural water (within the sheet)
ii. Interstitial (coordinated) water (within the interlayer)
iii. Occluded water (within the interlayer)
iv. Physisorbed water
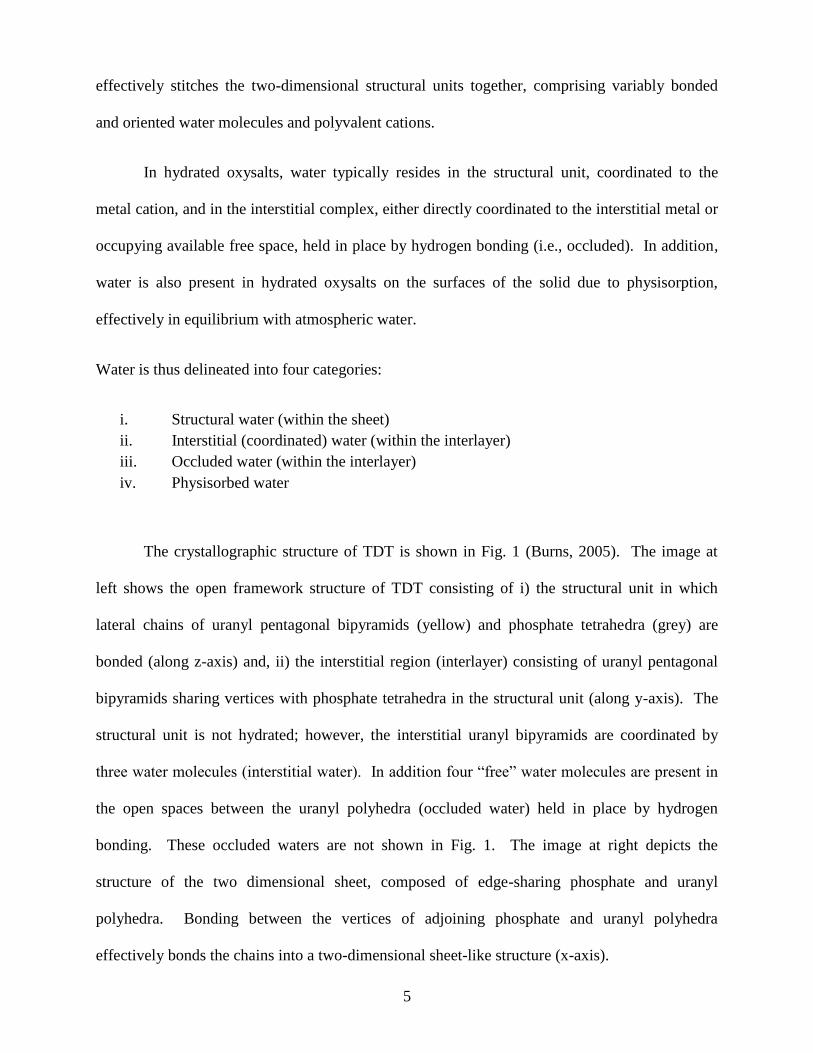
The crystallographic structure of TDT is shown in Fig. 1 (Burns, 2005). The image at
left shows the open framework structure of TDT consisting of i) the structural unit in which
lateral chains of uranyl pentagonal bipyramids (yellow) and phosphate tetrahedra (grey) are
bonded (along z-axis) and, ii) the interstitial region (interlayer) consisting of uranyl pentagonal
bipyramids sharing vertices with phosphate tetrahedra in the structural unit (along y-axis). The
structural unit is not hydrated; however, the interstitial uranyl bipyramids are coordinated by
three water molecules (interstitial water). In addition four “free” water molecules are present in
the open spaces between the uranyl polyhedra (occluded water) held in place by hydrogen
bonding. These occluded waters are not shown in Fig. 1. The image at right depicts the
structure of the two dimensional sheet, composed of edge-sharing phosphate and uranyl
polyhedra. Bonding between the vertices of adjoining phosphate and uranyl polyhedra
effectively bonds the chains into a two-dimensional sheet-like structure (x-axis).
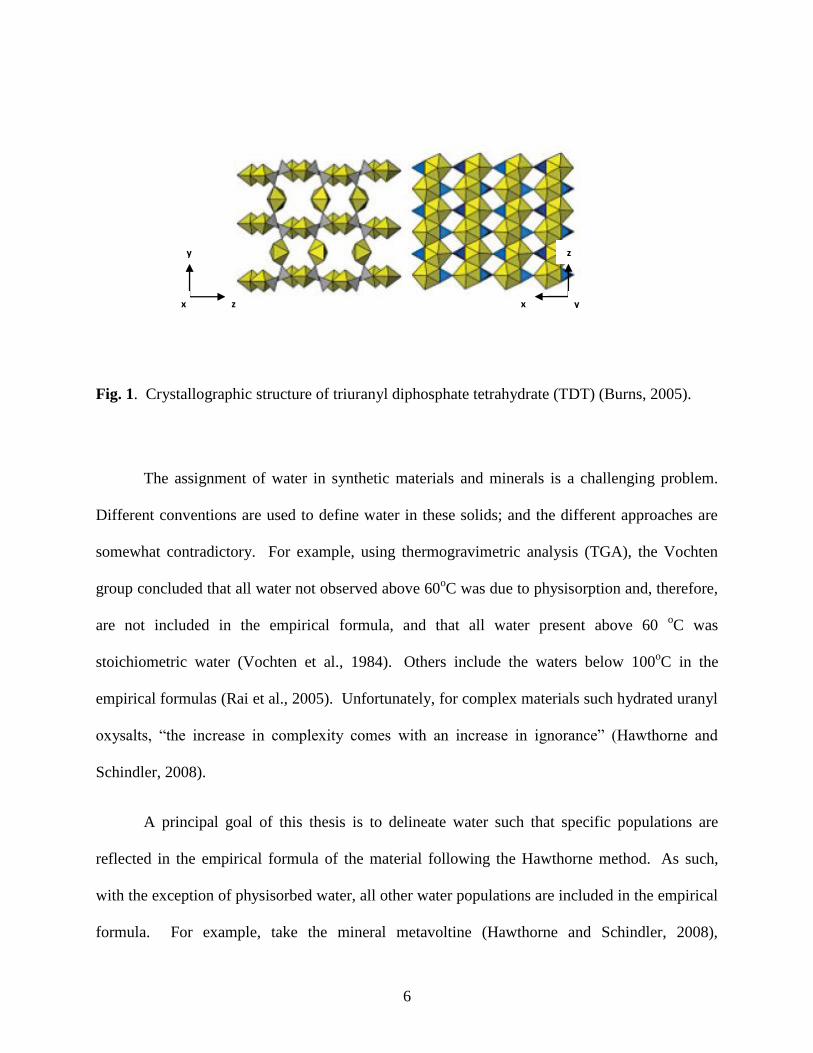
6
Fig. 1. Crystallographic structure of triuranyl diphosphate tetrahydrate (TDT) (Burns, 2005).
The assignment of water in synthetic materials and minerals is a challenging problem.
Different conventions are used to define water in these solids; and the different approaches are
somewhat contradictory. For example, using thermogravimetric analysis (TGA), the Vochten
group concluded that all water not observed above 60oC was due to physisorption and, therefore,
are not included in the empirical formula, and that all water present above 60 oC was
stoichiometric water (Vochten et al., 1984). Others include the waters below 100oC in the
empirical formulas (Rai et al., 2005). Unfortunately, for complex materials such hydrated uranyl
oxysalts, “the increase in complexity comes with an increase in ignorance” (Hawthorne and
Schindler, 2008).
A principal goal of this thesis is to delineate water such that specific populations are
reflected in the empirical formula of the material following the Hawthorne method. As such,
with the exception of physisorbed water, all other water populations are included in the empirical
formula. For example, take the mineral metavoltine (Hawthorne and Schindler, 2008),
z y x
x
x
y
x
z
7
K2Na6Fe(H2O)6[Fe3O(SO4)6(H2O)3]2(H2O)6. Here the formula clearly delineates stoichiometric
water. The first water group (from left to right) represents interstitial-coordinated, the second
water group is indicative of structural water and the last water group is attributed to weakly
bound (occluded) interstitial water.
1.5 Spectroscopic studies
With the exception of recent Raman studies as described below, vibrational spectroscopic
investigations of uranyl phosphates have received little attention. Cejka (1999) presented a
thorough overview of all the available thermal and IR studies for U-bearing minerals. Pham-Thi
and Colomban (1985) conducted an exhaustive study investigating a trio of hydrated uranyl
phosphates, including TDT and chernikovite, H3O[UO2PO4]∙4H2O. These workers provided
both IR and Raman data on these phases. The Vochten group reported a series of U-mineral IR
studies (Vochten et al., 1984; Vochten, 1990; Van Haverbeke et al., 1996). More recently, the
Frost group has conducted numerous Raman spectroscopic investigations on uranyl-bearing
minerals (Frost and Weir, 2004a; Frost et al., 2004b; Frost et al., 2006a; Frost et al., 2006b).
1.6 Apatite Minerals
Apatites are ubiquitous in nature and are present in igneous (Piccoli and Candela, 2002)
sedimentary (Knudsen and Gunter, 2002) and metamorphic (Spear and Pyle, 2002) regimes.
Hydroxylapatite, Ca5(PO4)3OH), fluorapatite (Ca5(PO4)3F) and chlorapatite (Ca5(PO4)3Cl)
represent the three end members in the apatite mineral family; and all of these minerals are stable
in soil environments (Bruno et al., 1995; Finch and Murakami, 1999; Jerden et al., 2003).
8
Apatite readily incorporates a host of polyvalent metals and anionic complexes while
retaining the same overall crystal structure (isomorphic substitution). In fact, apatite
accommodates half of the periodic table into its lattice arrangement (Hughes and Rakovan,
2002). Additionally, apatites are very important in biological systems. Hydroxylapatite (HA) is
the main constituent in bones and teeth accounting for about 1% of our body weight (Huminicki
and Hawthorne, 2002). It was initially believed that metal ion uptake by apatite was
predominantly electrostatically-driven, since the apatite surface exhibits a point of zero charge
(PZC) at pH ca. 8 (Bell et al., 1972). However, it has since been recognized that the process(es)
governing metal ion and apatite interactions is more complicated, as discussed below.
1.7 f-element – HA Interactions
The application of apatite phases in natural systems for the removal of transition metals has been
extensively studied. However, research focusing on actinide and lanthanide interactions with
apatite is rather limited.
In one of the earlier U-apatite studies, Jeanjean et al., (1995) determined that HA
dissolution and subsequent U precipitation was the most important metal removal mechanism
compared to a sorption process. In separate studies on the use of apatite as a contaminant
remediation strategy, Fuller et al. (2002, 2003) concluded that the predominant uptake
mechanism of U onto apatite was sorption followed by precipitation. These authors observed
almost complete U removal from the system. The initial predominant uptake mechanism was
sorption; however, as the concentration of U increased at the surface of the solid, a positive local
saturation index resulted in the rapid precipitation of U-bearing phosphate phases. In a similar
study of uranyl uptake by apatite, Ohnuki et al. (2004) observed sorption followed by surface
9
mineralization as autunite precipitated on the surface of apatite even though the bulk solution
was undersaturated with respect to autunite. Workers from Florida State University (Thakur et
al., 2005) conducted additional uranyl-hydroxylapatite investigations. This study was the first to
present sorption edge curves as a function of pH for uranyl sorption onto hydroxylapatite. Very
little data exists for lanthanide uptake by HA; however, in an investigation of apatite
sequestration of Eu3+
and uranyl, Knox et al. (2003) observed complete metal ion removal by
apatite and provided partition coefficient data (Kd) as evidence to support a sorption hypothesis.
It is evident that systems involving the removal of metals by apatite phases are highly
complex. Such metal characteristics as oxidation state, ionic radius, coordination number, hard
or soft acid character all contribute to the process by which a given metal is sequestered by
apatite. Solution/suspension pH, background electrolyte and temperature are also very important
factors (Xu et al., 1994 and references therein).
1.8 Lanthanide phosphate minerals
Lanthanides account for approximately 40% of the total mass of uranium fission products. In
addition, these rare earth elements (REE) are reasonable chemical analogues of trivalent
actinides such as Am3+
, Cm3+
, Pu3+
, etc. (Choppin, 1983; 1986; 1989; Nitsche, 1990).
A significant proportion of mined phosphates are obtained from lanthanide phosphate
minerals (e.g., REE(PO4) (s)). Such phosphates exhibit a 1:1 REE to phosphate ratio, and are
highly stable and ubiquitous in nature (Boatner, 2002). Monazite, the mineral name assigned to
the light rare earth (LREE) orthophosphates (e.g., La, Ce, Nd), incorporates a variety of cations
into its structure. Not only is monazite economically important for acquiring LREE, but U and
Th are also extracted from monazite (Boatner, 2002).
10
1.9 Research and Objectives
The following is a summary of the objectives of this study:
1. Develop an effective analytical strategy to rigorously characterize synthetic and natural
hydrated uranyl phosphates.
2. Define and delineate the roles of water in hydrated uranyl compounds.
3. Investigate the energetics of both natural and synthetic U-phosphates, including studying
the thermodynamics of hydration and solubility at elevated temperature.
4. Investigate the processes and mechanisms controlling the partitioning of Nd to HA as a
function of pH.
1.10 Overview
The following chapters are a collection of individual research topics, each of which is written in
manuscript format for submission to various scientific journals. Chapter Two reports data on the
synthesis, spectroscopic and thermal characterization of selected synthetic hydrated uranyl
phosphates, entitled “Spectroscopic and Thermal Study of Hydrated Uranyl Phosphates:
Francoisite-(Nd) and Triuranyl Diphosphate Tetrahydrate”. This study is being submitted to
American Mineralogist. Chapter Three discusses the need for using a complementary approach
involving both infrared spectroscopy and powder x-ray diffraction to effectively characterize
hydrated uranyl phosphates. This work, entitled “Delineating Hydrated Uranyl Phosphates:
Powder XRD and ATR-IR Studies”, is being submitted to Journal of Physics: Conference Series
as part of the proceedings of the Actinides 2009 conference. Chapter Four, entitled “The
Hydrothermal Transformation of Chernikovite into Triuranyl Diphosphate Tetrahydrate (TDT)”,
reports the complete conversion of one hydrated phosphate into another due to hydrothermal
11
treatment, namely chernikovite to triuranyl diphosphate tetrahydrate (TDT). This contribution is
being submitted to American Mineralogist. Chapter Five is a thermodynamic study, reporting
data on the solubility of TDT at 23 and 50oC. This work, entitled “Experimental solubility of
triuranyl diphosphate tetrahydrate (TDT) at 23oC and 50
oC”, is being submitted to
Radiochimica Acta as part of the proceedings of the Migration 2009 conference. Chapter Six is
another thermodynamic study; however this one involves the use of differential scanning
calorimetry (DSC) to obtain the enthalpy associated with discrete water populations in hydrated
uranyl phosphates. This work, entitled “The effect of hydration on the enthalpy for U6+
solids:
A thermal study”, is being submitted to the Journal of Solid State Chemistry for publication.
Chapter Seven reports data on the uptake of Nd onto hydroxylapatite entitled “Partitioning of
Neodymium into Hydroxylapatite (Ca5(PO4)3OH)”. This work is being submitted to
Radiochimica Acta as part of the proceedings of the Migration 2009 conference.

12
References
Abdelouas, A.; Lutze, W., and Nuttal, H.E. In Uranium: Mineralogy, Geochemistry, and the
Environment; Burns, P.C., Finch, R., Eds. Reviews in Mineralogy 38; Mineralogical Society
of America: Washington, DC, 1999, 433-474.
Bell, L.C., Posner, A.M., Quirk, J.P. Nature. 1972, 239, 515-517.
Boatner, L.A. In: Phosphates: Geochemical, geobiological, and Materials Importance. Kohn,
M.J., Rakovan J., Hughes, J.M., Eds. Reviews in Mineralogy, 48, Mineralogical Society of
America: Washington, DC. 2002, 87-121.
Bray, T.H., Gorden, J.D., Albrecht-Schmitt, T.E. (2008) Synthesis and structure of
[C6H14N2][(UO2)4(HPO4)2(PO4)2(H2O)]∙H2O: An expanded open-framework amine-bearing
uranyl phosphate. J. Sol. State Chem. 181, 2199-2204.
Burns, P.C., Miller, M.L., Ewing, R.C. (1996) U6+
minerals and inorganic phases: A
comparison and hierarchy of crystal structures. Can. Mineral. 34. 845-880.
Burns, P.C. (1999) The crystal chemistry of uranium. In: Reviews in Mineralogy Vol. 38.
Eds. Burns, P.C., Finch, R. Mineralogical Society of America. 23-86.
Burns, P.C. (2005) U6+
minerals and inorganic compounds: Insights into an expanded
structural hierarchy of crystal structures. Can. Mineral. 43, 1839-1894.
Bruno, J.; de Pablo, J.; Duro, L.; Figuerola, E. Geochem. Cosmochim. Acta, 1995, 59(20), 4113-
4123.
Cejka, J. (1999) Infrared spectroscopy and thermal analysis of uranyl minerals. In: Reviews in
Mineralogy Vol. 38. Eds. Burns, P.C., Finch, R. Mineralogical Society of America. 521-
622.
Choppin, G.R. J. Less-Common Metals, 1983, 93, 323-330.
Choppin, G.R. J. Less-Common Met., 1986, 126, 307-313.
Choppin, G.R. Mar. Chem., 1989, 28, 19-26.
Elless, M.P., Lee, S.Y. (1998) Uranium solubility of carbonate-rich uranium-contaminated
soils. Water, Air, Soil Pollut. 107, 147-162.
Felmy, A.R., Xia, Y., Wang, Z. (2005) The solubility product of NaUO2PO4∙xH2O determined
in phosphate and carbonate solutions. Radiochim. Acta. 93, 401-408.
Finch, R.J., Murakami, T. In Uranium: Mineralogy, Geochemistry, and the Environment; Burns,
P.C., Finch, R., Eds. Reviews in Mineralogy 38; Mineralogical Society of America:
Washington, DC, 1999, 91-181.
13
Frost, R.L., Weir, M. (2004a) Raman Spectroscopy of autunite minerals at liquid nitrogen
temperature. Spectrochim. Acta Part A. 60, 2399-2409.
Frost, R.L., Weir, M., Adebajo, M.O. (2004b) Thermal decomposition of metazeunerite – a
high-resolution thermogravimetric and hot-stage Raman spectroscopic study. Thermochim.
Acta. 419, 119-129.
Frost, R.L., Cejka, J., Weir, M. (2006a) Raman spectroscopic study of uranyl oxyhydroxide
hydrates: bequerelite, billietite, curite, shoepite, and vandendriesscheite. J. Raman Spec.
38, 460-466.
Frost, R.L., Weir, M.L., Martens, W., Cejka, J. (2006b) The structure of phurcalite – A
vibrational spectroscopic study. Vib. Spec. 41, 205-212.
Fuller, C.C, Bargar, J.R., Davis, J.A., Piana, M.J. Environ. Sci. Technol. 2002, 36, 158-165.
Fuller, C.C, Bargar, J.R., Davis, J.A. Environ. Sci. Technol., 2003, 37, 4642-4649.
Giammar, D.E. Xie, L., Pasteris, J.D. (2008) Immobilization of lead with nanocrystalline
carbonated apatite present in fish bone. Environ. Eng. Sci. 25, 725-736.
Gorman-Lewis, D.J., Mazeina, L., Fein, B., Szymanowski, J., Burns, P.C., Navrotzky, A. (2007)
Thermodynamic properties of soddyite from solubility and calorimetry measurements. J.
Chem. Thermodyn. 39, 568-575.
Gorman-Lewis, D., Burns, P.C., Fein, J.B. Review of uranyl mineral solubility measurements.
J. Chem. Thermodyn. 40 (2008) 335-352.
Hawthorne, F.C. (1992) The role of OH and H2O in oxide and oxysalt minerals. Zeit. Fur
Kristall. 201, 183-206.
Hawthorne, F.C., Schindler, M. (2008) Understanding the weakly bonded constituents in
oxysalt minerals. Zeit. Fur Kristall. 223, 41-68.
Hughes, J.M., Rakovan, J. In: Phosphates: Geochemical, geobiological, and Materials
Importance. Kohn, M.J., Rakovan J., Hughes, J.M., Eds. Reviews in Mneralogy, 48,
Mineralogical Society of America: Washington, DC. 2002, 1-13.
Huminicki, D.M.C., Hawthorne, F.C. In: Phosphates: Geochemical, geobiological, and
Materials Importance. Kohn, M.J., Rakovan J., Hughes, J.M., Eds. Reviews in Mneralogy,
48, Mineralogical Society of America: Washington, DC. 2002, 123-255.
Ilton, E.S., Liu, C.X., Yantasee, W., Wang, Z.M., Moore, D.A., Felmy, A.R., Zachara, J.M.
(2006) The dissolution of synthetic Na-boltwoodite in sodium carbonate solutions.
Geochim. Cosmochim. Acta. 70, 4836-4849.

14
Jeanjean, J., Rouchaud, J.C., Tran, L., Federoff, M. J. Radioanal. Nucl. Chem., Letters, 1995, 6,
529-539.
Jerden, J.L., Sinha, A.K., Zelanzny, L. Chem. Geol., 2003, 199, 129-157.
Khosrawan-Sazedj, F. (1982) On the space group of threadgoldite. Tschermaks Mineral.
Petrogr. Mitt. 30, 111-115.
Knox, A.S., Kaplan, D.I., Adriano, D.C., Hinotn, T.G., Wilson, M.D. J. Environ. Qual., 2003,
32, 515-525.
Knudsen, A.C., Gunter, M.E. In: Phosphates: Geochemical, geobiological, and Materials
Importance. Kohn, M.J., Rakovan J., Hughes, J.M., Eds. Reviews in Mneralogy, 48,
Mineralogical Society of America: Washington, DC. 2002, 363-391.
Locock, A.J., Burns, P.C. (2002) The crystal structure of triuranyl diphosphate tetrahydrate. J.
Sol. State Chem. 163, 275-280.
Locock, A.J., Burns, P.C. (2003a) Crystal structures and synthesis of the copper-dominant
members of the autunite and meta-autunite groups: torbenite, zeunerite, metatorbernite and
metazeunerite. Can. Mineral. 41, 489-502.
Locock, A.J., Burns, P.C. (2003b) The crystal structure of synthetic autunite. Amer. Mineral.
88, 240-244.
Locock, A.J., Burns, P.C, Duke, M.J.M., Flynn, T.M. (2004) Monovalent cations in structures
of the meta-autunite group. Can. Mineral. 42, 973-996.
Markovic., M., Pavkovic, N. (1983) Solubility and equilibrium constants of uranyl(2+) in
phosphate solutions. Inorg. Chem. 22, 978-982.
Meinrath, G., Kimura, T. (1993) Behavior of uranium (VI) solids under conditions of natural
aquatic systems. Inorg. Chem. Acta. 204, 79-85.
Nitsche, H. Basic research for assessment of geologic nuclear waste repositories: What
solubility and speciation studies of transuranium elements can tell us. Paper presented at the
Intl. Symp. on Sci. Basis for Nuclear Waste Management, Boston, MA Conf. Proceedings,
1990.
Nguyen, S.N., Silva, R.J., Weed, H.C., Andrews, J.E. (1992) Standard Gibbs free energies of
formation at the temperature 303.15 K of four uranyl silicates: soddyite, uranophane, sodium
boltwoodite, and sodium weeksite. J. Chem. Thermodyn. 24, 359-376.
Ohnuki, T., Kozai, N., Samadfam, M., Yasuda, R., Yamamoto, S., Narumi, K., Naramoto, H.,
Murakami, T. Chem. Geol., 2004, 211, 1-14.
Pham-Thi, M., Colomban, Ph. (1985) Morphological, X-ray and vibrational study of various
uranyl phosphate hydrates. J. Less-Common Met. 108, 189-216.
15
Piccoli, P.M, Candela, P.A. In: Phosphates: Geochemical, geobiological, and Materials
Importance. Kohn, M.J., Rakovan J., Hughes, J.M., Eds. Reviews in Mineralogy, 48,
Mineralogical Society of America: Washington, DC. 2002, 255-293.
Rai, B.D., Felmy, A.R., Hess, N.J., LeGore, V.L., McCready, D.E. (2002) Thermodynamics of
the U(VI)-Ca2+
-Cl −-OH
−-H2O system: Solubility product of becquerelite. Radiochim. Acta
90, 495-503.
Rai, B.D., Xia, Y., Rao, L., Hess, N.J., Felmy, A.R., Moore, D.A., McCready, D.E. (2005)
Solubility of (UO2)3(PO4)2∙4H2O in H+-Na
+-OH
-- H2PO4 -PO4
3- - H2O and its comparison to
the analogous PuO22+
system. J. Sol. Chem. 34, 469-498.
Schindler, M., Hawthorne, F.C. (2008) The stereochemistry and chemical composition of
interstitial complexes in uranyl-oxysalt minerals. Can. Mineral. 46, 467-501.
Spear, F.S., Pyle, J.M. In: Phosphates: Geochemical, geobiological, and Materials Importance.
Kohn, M.J., Rakovan J., Hughes, J.M., Eds. Reviews in Mineralogy, 48, Mineralogical
Society of America: Washington, DC. 2002, 337-363.
Thakur, P., Moore, R.C., Choppin, G.R. Radiochim. Acta, 2005, 93, 385-391.
Van Haverbeke, Vochten, R., Van Springel, K. (1996) Solubility and spectrochemical
characteristics of synthetic chernikovite and meta-ankoleite. Mineral. Mag. 60, 759-766.
Vesely, V., Pekarek, V., Abbrent, M. (1965) A study of uranyl phosphates III Solubility
products of uranyl hydrogen phosphate, uranyl orthophosphate and some alkali uranyl
phosphates. J. Inorg. Nucl. Chem. 27, 1159-1166.
Vochten, R., De Grave, E., Pelsmaekers, J. (1984) Mineralogical study of bassetite in relation to
its oxidation. Amer. Mineral. 69, 967-978.
Vochten, R. (1990) Transformation of chernikovite and sodium autunite into lehnerite. Amer.
Mineral. 75, 221-225.
Wellman, D.M., McNamara, B.K., Burton, S.D., Geiszler, K.N., Baum, S.R., Butler, B.C. In
Remediation of Contaminated Sediments. Olfenbuttel, R.F., White, P.J., Eds. Proceedings of
the Third International Conference on Remediation of Contaminated Sediments. New
Orleans, Lousiana. Battelle Press, Columbus, OH, 2006.
Xu, Y., Schwartz, F.W. Environ. Sci. Technol., 1994, 28, 1472-1480.
Yu, Y., Albrecht-Schmitt, T.E. (2008) Incorporation of tetrahedral Co(II) into a mixed-metal
uranyl phosphate framework: Synthesis and structure of K2[UO2Co(PO4)2]∙H2O. Sol. State
Sci. 10, 821-824.
16
Yu, Y., Zhan, W., Albrecht-Schmitt, T.E. (2008) [H2bipy]2[(UO2)6Zn2(PO3OH)4(PO4)4]∙H2O:
An open framework uranyl zinc phosphate templated by diprotonated 4,4’-bipyridyl. Inorg.
Chem. 47, 9050-9054.
17
CHAPTER TWO
Spectroscopic and Thermal Study of Hydrated Uranyl Phosphates: Francoisite-(Nd) and
Triuranyl Diphosphate Tetrahydrate
Christopher R. Armstrong,a, Kenneth L. Nash,
a Peter R. Griffiths,
b Sue B. Clark,
a,*
aDepartment of Chemistry, Washington State University, Pullman, WA 99164, U.S.A.
bDepartment of Chemistry, University of Idaho, Moscow, ID 83844, U.S.A.
Abstract
In this report we present data on the bulk and nanoscale characterization of triuranyl diphosphate
tetrahydrate (TDT) and the novel francoisite-(Nd) (empirical formulas below). Experimental
studies including chemical digestion, thermogravimetric analysis (TGA), differential scanning
calorimetry (DSC), attenuated total reflection infrared spectrometry (ATR-IR), Raman
spectroscopy and powder x-ray diffraction (PXRD) were conducted. The stoichiometry and
related degree of hydration for TDT and francoisite were determined to be
Nd[(UO2)3.4O(OH)(PO4)2.0]•5.2H2O and (UO2)3.1(PO4)2.0•3.9H2O respectively. Both phases are
hygroscopic, readsorbing 40 % and 86 % of initial water content respectively upon reheating to
500oC; however, no structural changes were observed. The local bonding environments of
uranyl and water were investigated with ATR-IR and Raman spectroscopy. The uranyl-oxygen
(uranyl group) and O-O bond (hydrogen bonded oxygen and water) lengths were calculated from
the vibrational frequencies of the antisymmetric and symmetric modes of uranyl and the
stretching modes of water. The calculated values obtained for the materials synthesized in this
study agree well with literature values for the synthetic TDT and natural francoisite-(Nd). The
IR spectra of protiated and deuterated francoisite-(Nd) confirmed a coordinated hydroxyl group
bridging vicinal uranyl groups in the francoisite-(Nd) structural unit. These studies provide the
basis for further thermodynamic (solubility, sorption) and geochemical modeling investigations
of these and other uranyl phosphate compounds.
Key words: francoisite-(Nd), triuranyl diphosphate tetrahydrate, uranyl, spent nuclear fuel
18
1. INTRODUCTION
In an effort to better understand the mobility of f-elements in natural systems, fundamental
investigations into the chemistry of these metal cations at the solid-solution interface have
received considerable attention. Uranium primarily occurs in the hexavalent state as uranyl
(UO22+
) in oxidizing environments. Uranyl compounds have been introduced into the biosphere
primarily as the result of corrosion of spent nuclear fuel (SNF) (Kim et al., 1999), leakage of
underground storage tanks (Womack and Larkin, 1971) and the extraction and purification of
uranium ores for weapons production (Buck et al., 1996). Of these uranyl solids, the oxides,
silicates and phosphates are the most stable and thus are expected to comprise the most important
sinks for uranium in oxidizing waste disposal environments. Consequently, solubility studies of
the more common naturally occurring uranyl-bearing minerals such as uranyl phosphates
(Vesely et al., 1965; Markovic et al., 1983; Felmy et al., 2005; Rai et al., 2005) silicates
(Nguyen, et al., 1992; Ilton et al., 2006; Gorman-Lewis et al., 2007), oxy-hydroxides (Rai et al.,
2002; Giammar and Hering, 2002) and carbonates (Meinrath et al., 1993; Elless and Lee, 1998)
have been conducted. Phosphate solids are highly stable in aqueous systems under ambient
conditions throughout a wide pH range. Showing a high potential for reducing the mobility of
aqueous metals including actinide cations, phosphates may serve as effective remediation
amendments both as solids, in various forms of synthetic (Wright and Conca, 2002) and natural
apatite, e.g., fish bone (Giammar et al., 2008), and in the solution phase, e.g., polyphosphates
(Wellman et al., 2006). To predict the environmental fate of mixed actinide phosphates over a
geological timescale, it is necessary to elucidate the structure and stability of solid phases that
result from these phosphate-induced metal stabilization strategies.
Triuranyl diphosphate tetrahydrate (TDT), ([(UO2)3(PO4)2]∙4H2O, and francoisite-(Nd),
(Nd[(UO2)3O(OH)(PO4)2]∙5H2O, were selected for this study for two reasons. First, both of

19
these materials are sparingly soluble and are thus expected to limit the concentration of aqueous
uranyl ion. Additionally, francoisite-(Nd) contains both an actinide (U) and a lanthanide (Nd)
atom. The trivalent Nd ion is a reasonable analog for Am and Cm ions because of its similarity
in ionic radius and oxidation state. Thus francoisite-(Nd) serves as a good model of a mixed
actinide solid that may form as the result of anthropogenic actinide infiltration, particularly in
locations where phosphate amendments (apatite, polyphosphates) may be used in remediation
scenarios.
In this contribution, we provide characterization data of the uranyl phosphates, TDT and
the novel francoisite-(Nd) with an emphasis on understanding the role of water in these
materials. The goal of this study is to (i) characterize select hydrated uranyl phosphates,
francoisite-(Nd) and triuranyl diphosphate tetrahydrate (TDT) and, (ii) investigate the role of
water in these materials. The delineation of distinct water populations in these uranyl phosphates
can assist us in predicting the stability of these phases. For example, the assignment of distinct
standard state free energies of formation of water, reflecting different water occupancies, yields a
more accurate estimation of the thermodynamic properties of a broad range of uranyl solids for
which experimental thermodynamic data are highly disparate or not presently available.
In this report, we endeavor to delineate water such that specific populations are reflected
in the empirical formula of the material following the Hawthorne method, as described in
Chapter One of this thesis. As such, with the exception of physisorbed water, all other water
populations are included in the empirical formula. For example, take the mineral metavoltine
(Hawthorne and Schindler, 2008), K2Na6Fe(H2O)6[Fe3O(SO4)6(H2O)3]2(H2O)6. Here the
formula clearly delineates stoichiometric water. The first water group (from left to right)
represents interstitial-coordinated, the second water group is indicative of structural water and
the last water group is attributed to weakly bound (occluded) interstitial water.
20
1.1. Vibrational spectroscopic studies
Until quite recently, vibrational spectroscopic studies of uranyl phosphates, particularly Raman
spectroscopy, have received little attention. Cejka (1999) presented a thorough overview of all
the available thermal and infrared (IR) spectroscopic studies of U-bearing minerals. Pham-Thi
and Colomban (1985) conducted an exhaustive study investigating a trio of uranyl phosphates.
These workers provided both IR and Raman data on these materials. The Vochten group
reported a series of U-mineral characterization studies of which IR data is only a part (Vochten et
al., 1984; Vochten, 1990; Van Haverbeke et al., 1996). The Frost group has conducted
numerous Raman spectroscopic investigations on uranyl-bearing minerals (Frost and Weir,
2004a; Frost et al., 2004b; Frost et al., 2006a; Frost et al., 2006b).
2. EXPERIMENTAL MATERIALS AND METHODS
Chemicals
All chemicals are reagent grade or higher. Deionized (18 MΩ ) and boiled water was used in
preparations of all solutions. Standards used for ICP-OES analyses were 99.9% purity.
Synthesis
The pH was measured with a ThermoElectron Corp. Orion 4 Star pH meter equipped with a Ross
combination pH electrode (Orion Model 8102). Prior to each use, the pH electrode was
calibrated with NIST standards. For hydrothermal reactions, 23- and 45-mL Teflon®
liners were
placed inside stainless steel Parr acid digestion bombs.

21
Francoisite-(Nd) synthesis
Francoisite-(Nd) crystals were synthesized by two methods. In the first, stoichiometric volumes
of 0.05M Nd(NO3)•6H2O, H3PO4 and UO2(NO3)•6H2O were mixed in a jacketed reaction vessel
at 40 ± 0.1oC. The initial pH was low (ca. 1.8) and a pale yellow precipitate was observed
immediately. The pH was adjusted to 5 and maintained with a small amount of 1 M NaOH. As
the pH was increased to ca. 5, a color change to bright yellow was observed in the solid. Once
adjusted, the pH remained at ca. 5 throughout the synthesis. The second method involved the
use of Nd and uranyl acetate salts instead of the nitrates (with the same concentrations and
stoichiometric proportions as the nitrate procedure above). Note: All of the experiments
conducted in this study involved the francoisite-(Nd) synthesized by this acetate method. The
initial pH was ca. 4.5 and a bright yellow precipitate was observed immediately. The pH was
raised and maintained at ca. 5 with 1 M NaOH. The suspension was stirred overnight under N2
gas at 40ºC, and was subsequently allowed to settle and age overnight under N2 at 40ºC. 1-mL
samples of the mother liquor were taken in duplicate and acidified with concentrated HNO3 and
diluted with ultrapure deionized water (DIW) and stored for further analysis. The solid was
extracted and vacuum-filtered through 0.45-µm Millipore membranes and rinsed three times
with boiling DIW. The resulting filtrate was covered and stored in the dark to dry until constant
weight was obtained. The solid was then ground with an agate mortar and pestle and sieved (100
mesh) to an approximate 150-µm particle size. Duplicate powder samples of approximately 10
mg were digested in concentrated HNO3 and diluted to 100 mL in a volumetric flask with DIW.
Dissolved metal determination from both the solid and mother liquor was carried out on a
Perkin-Elmer Optima 3200 axial torch inductively-coupled optical emission spectrometer (ICP-
OES). See Table 1 for detection limit details. For all samples, three replicate intensities were
recorded from which the average and standard deviation was calculated.

22
Table 1. Analytes and corresponding wavelengths and detection limits in this study.
Analyte Line (nm) Detection limit
(mg/L) 1σ
Na 330.237 2.00 0.09
Nd 401.225 0.05 0.01
P 213.617 0.08 0.03
U 367.007 0.30 0.02
Triuranyl diphosphate tetrahydrate (TDT) synthesis
Microcrystalline TDT was synthesized according to the modified method of Rai et al. (2005).
Stoichiometric volumes of 0.7M H3PO4 and 0.05M UO2(NO3)2·6H2O were mixed in a jacketed
reaction vessel under N2 atmosphere at 40oC (± 0.1). The suspension was stirred overnight at
40oC and subsequently allowed to settle. Twice the supernatant was decanted and replaced with
degassed DIW at 40oC. The suspension was vacuum filtered through 0.45-µm Millipore
membranes, rinsed three times with boiling DIW and dried overnight at 30oC. Solids were
crushed with a mortar and pestle and sieved (100 mesh) to an approximate 150 µm particle size.
Both the solid and the mother liquor were prepared for elemental analysis in the same manner as
francoisite-(Nd) mentioned above.
2.1 D2O studies
Deuterated francoisite-(Nd) and TDT were synthesized in the same manner as described above.
In all cases, 99% D2O (Cambridge Isotope Laboratories) was used to prepare the stock solutions
for synthesis. These solutions were sealed and stored in a desiccator. In addition, the deuterated
samples were dried under an Ar atmosphere and promptly sealed to avoid H2O/ D2O exchange.
23
2.2 Powder x-ray diffraction (PXRD)
PXRD was performed on fine grained samples (~ 150 µm) of francoisite-(Nd) and TDT at room
temperature using a Siemens Kristalloflex D500 diffractometer with the following parameters:
Copper source (Kα; 1.54018 Ǻ); 35 keV, 30 mA, Kβ filter: Ni; scintillation counter detector;
Continuous mode: 0.02d/min; 2θ range: 5-60. The diffractograms were produced using MDI
Data Scan 4 and Jade 8 software packages. No background corrections or smoothing was
applied.
2.3 Thermal Analyses (TGA and DSC)
To assess the degree of hydration in the synthetic francoisite-(Nd) and triuranyl diphosphate
samples, thermogravimetric analysis (TGA) and differential scanning calorimetry (DSC) were
conducted using a Perkin-Elmer TGA-7 and Perkin-Elmer DSC-7 instruments, respectively. For
TGA, the powders were analyzed inside a platinum pan. The TGA was calibrated with a 10 mg
standard weight furnished by Perkin-Elmer. For DSC, the samples were crimped inside
aluminum pans. The DSC was calibrated with pure zinc and indium metal standards. For both
TGA and DSC, the scan rate was 5oC/min and the experimental temperature ranged from 25
oC to
500oC. Approximately 10 mg of solid was used in all of these experiments, which were
completed in duplicate.
24
2.4 ATR-IR Spectrometry
For the studies presented herein, attenuated total reflection infrared (ATR-IR) spectra were
measured. ATR has several advantages over conventional mid-infrared transmission techniques.
Because the depth of penetration, dp, is only about a quarter of the wavelength, a very thin
sample (<10 µm) is not necessary. Ion exchange between diluents such as KBr and the sample
can result in band broadening and lower intensity (Cejka, 1999; Griffiths and de Haseth, 2007).
In ATR, solid samples do not need to be diluted (e.g., with KBr) and can be analyzed in their
neat state thus obviating any ion exchange issues. All that is required is sufficient contact
between the sample and the internal reflection element (IRE). Because samples do not have to
be ground very finely, as required for mineral oil mulls or KBr disks, changes in spectral
characteristics due to morphological changes in the sample on grinding are not usually observed
with ATR.
Measurements were made on solids in this study using a Nicolet 6700 FT-IR
spectrometer with an ATR accessory equipped with a ThermoElectron Smart Nexus Orbit single-
reflection diamond IRE. Spectra were measured between 4000 and 400 cm-1
at 8 cm-1
resolution.
A total of 200 scans were averaged for each sample and background. The system was purged
with desiccated N2 at 30 psi. As noted above, the solid samples were ground with an agate
mortar and pestle and sieved to an approximate 150 µm particle size. To account for the
wavelength dependence of dp, an ATR correction built into the OMNIC software was applied.
2.5 Raman Spectrometry
Experiments were conducted on ~ 150 µm particle size powders of francoisite-(Nd) and TDT at
room temperature using a Delta Nu Advantage 633 Raman spectrometer with the following
25
parameters. Laser: HeNe (632.8 nm); CCD detector; integration time 30s; spectral range: 1200 –
400 cm-1
. All spectra represent the average of ten scans.
3. RESULTS
3.1. Elemental Analysis
3.1a. Francoisite-(Nd)
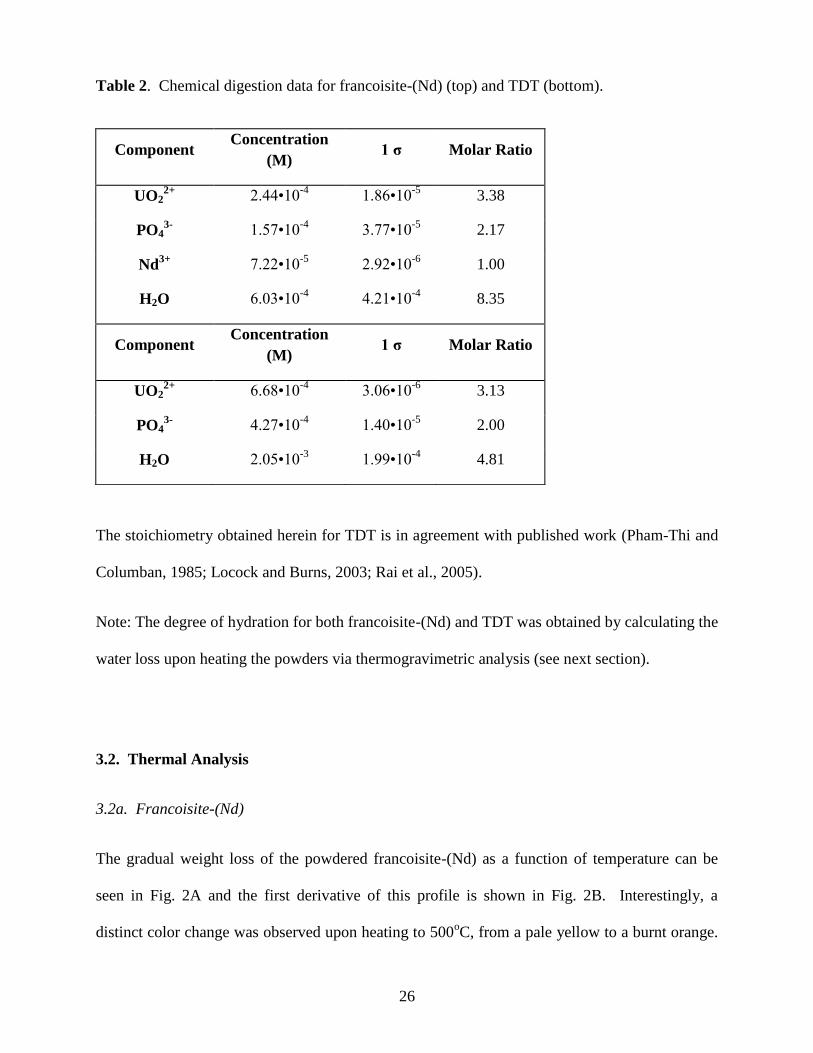
Average concentrations of the duplicate chemical digestion samples are shown in Table 2. These
dissolved elemental concentrations were used to determine the following empirical formula.
Nd[(UO2)3.38O(OH)(PO4)2]•5.16H2O
This may be compared to the empirical formula of natural francoisite (Piret et al., 1988):
0.94Nd[(UO2)3.15 O(OH)(PO4)1.92]•xH2O
The elemental composition reported herein is in reasonable agreement with the natural
francoisite-(Nd) sample. However, residual sodium was detected in the synthetic francoisite-
(Nd). In addition the natural sample had a host of trace impurities that were detected in the
elemental analysis (Piret et al., 1988). Thus, small compositional differences between the
synthetic and natural samples are expected.
3.1b. TDT
The chemical digestion data of the average concentration of duplicates shown in Table 2 were
used to determine the following empirical formula:
(UO2)3.13(PO4)2•3.91H2O
26
Table 2. Chemical digestion data for francoisite-(Nd) (top) and TDT (bottom).
The stoichiometry obtained herein for TDT is in agreement with published work (Pham-Thi and
Columban, 1985; Locock and Burns, 2003; Rai et al., 2005).
Note: The degree of hydration for both francoisite-(Nd) and TDT was obtained by calculating the
water loss upon heating the powders via thermogravimetric analysis (see next section).
3.2. Thermal Analysis
3.2a. Francoisite-(Nd)
The gradual weight loss of the powdered francoisite-(Nd) as a function of temperature can be
seen in Fig. 2A and the first derivative of this profile is shown in Fig. 2B. Interestingly, a
distinct color change was observed upon heating to 500oC, from a pale yellow to a burnt orange.
Component Concentration
(M) 1 σ Molar Ratio
UO22+
2.44•10-4
1.86•10-5
3.38
PO43-
1.57•10-4
3.77•10-5
2.17
Nd3+ 7.22•10
-5 2.92•10
-6 1.00
H2O 6.03•10-4
4.21•10-4
8.35
Component Concentration
(M) 1 σ Molar Ratio
UO22+
6.68•10-4
3.06•10-6
3.13
PO43-
4.27•10-4
1.40•10-5
2.00
H2O 2.05•10-3
1.99•10-4
4.81
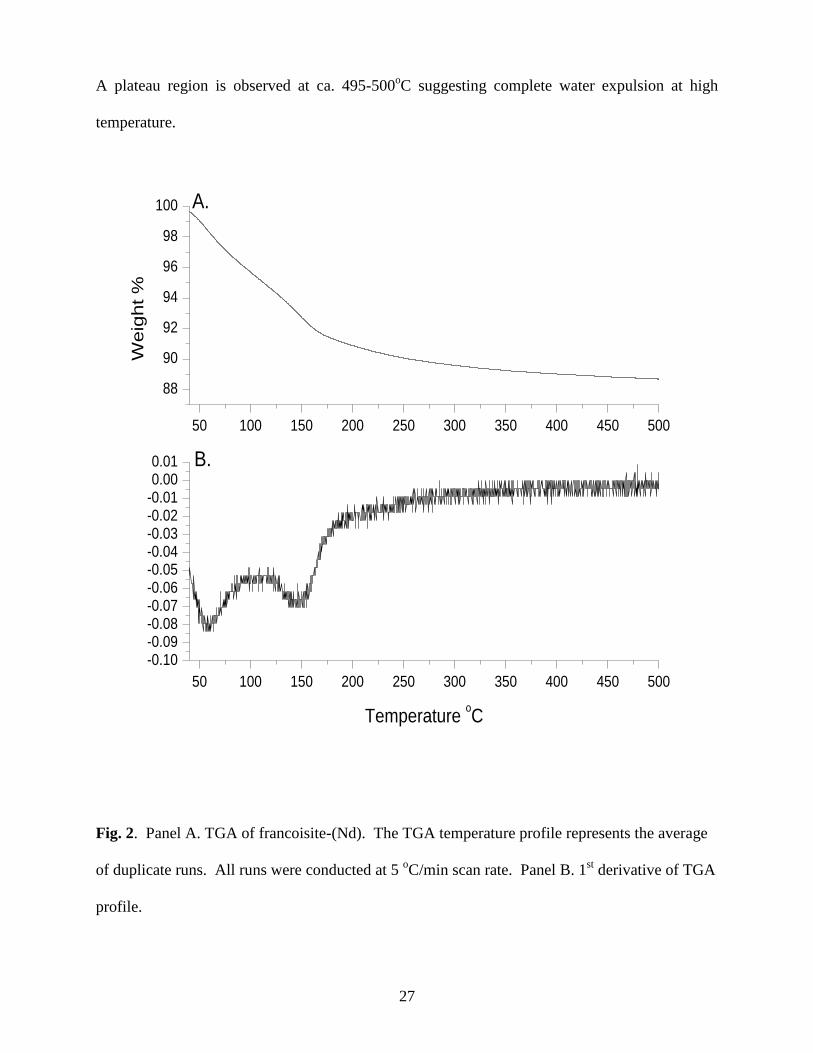
27
A plateau region is observed at ca. 495-500oC suggesting complete water expulsion at high
temperature.
50 100 150 200 250 300 350 400 450 500
-0.10-0.09-0.08-0.07-0.06-0.05-0.04-0.03-0.02-0.010.000.01 B.
Temperature oC
50 100 150 200 250 300 350 400 450 500
88
90
92
94
96
98
100 A.
We
igh
t %
Fig. 2. Panel A. TGA of francoisite-(Nd). The TGA temperature profile represents the average
of duplicate runs. All runs were conducted at 5 oC/min scan rate. Panel B. 1
st derivative of TGA
profile.
28
The broad curves in the DSC temperature profile are indicative of local maxima
suggesting separate endothermic events (Fig. EA-1; Supplementary Data). Although the TGA
derivative profile appears to exhibit the most conspicuous evidence, the complementary data
accrued from both the TGA and DSC yield two well-defined water loss events, along with a
more diffuse water release event at high temperature (above 245oC) . These events, together
with approximate temperature ranges, are shown in Table 3. Below 100ºC and centered at ca.
60ºC , roughly 3.2 moles of water are released and are attributed to physisorption. From 100ºC
to 500ºC, a broad dehydration event is observed centered at ca. 150ºC resulting in the release of
approximately 5.2 moles of water. These waters are likely occluded in the interstitial region.
From these data, a maximum of 8.36 moles of water per formula unit of francoisite-(Nd) were
calculated. The waters associated with the solid below ca. 100ºC are attributed to physisorption
and are thus not counted as stoichiometric water (Rai et al., 2005). Hence, the formula unit
according to the method of Hawthorne (1992) based upon elemental and thermal analyses is:
Nd[(UO2)3O(OH)(PO4)2]∙5.2H2O.
3.2b. TDT
The dehydration of TDT crystals as a function of temperature was investigated in a similar
manner to that of francoisite-(Nd). Weight loss events can be evaluated by examining the TGA
temperature profiles depicted in Fig. 3 and DSC (Fig. EA-2; Supplementary Data). Three
dehydration events evidenced by slope changes in the TGA thermogram and the corresponding
derivative plot (Figs. 3A and 3B, respectively) are clearly visible. A minor event is observed
between 25 and 100ºC with a peak at ca. 60ºC.

29
50 100 150 200 250 300 350 400 450 500
-0.20
-0.15
-0.10
-0.05
0.00
0.05 B.
Temperature oC
50 100 150 200 250 300 350 400 450 500
92
94
96
98
100 A.W
eig
ht
%
Fig. 3. Panel A. TGA plot of TDT representing the average of duplicate runs conducted at a
scan rate of 5 oC/min. Panel B. 1
st derivative of profile shown in Panel A.
The major water loss event is centered at ca. 125ºC and a weak feature can be seen at ca. 260ºC.
These events are also evidenced in the characteristic endothermic peaks in the DSC curve at
approximately corresponding temperatures, although the endothermic events appear to be shifted
to a higher temperature (Fig. EA-2; Supplemental Data). This may be due to the fact that the
TGA samples are ran uncovered on the platinum pan whereas the DSC samples are crimped
inside aluminum pans. Thus in the case of the DSC, a slightly higher temperature may be

30
required to expel water from the surface of the solid. A plateau region past ca. 400ºC suggests
that all the waters have been released by this point. A maximum of 4.81 moles of water per
formula unit of TDT were calculated (Table 3).
Table 3. Approximate francoisite-(Nd) (top) and TDT (bottom) dehydration events as a
function of temperature from TGA analyses.
Temperature Range
(oC)
H2O Lost (mol) 1σ
25-100 3.186 0.020
100-245 4.092 0.039
245-500 1.066 0.058
Total H2O loss 8.355 0.073
Stoichiometric water
(mol) 5.169
0.076
Temperature Range
(oC)
H2O Lost (mol) 1σ
25-100 0.905 0.002
100-135 2.602 0.003
135-500 1.304 0.003
Total H2O loss 4.811 0.005
Stoichiometric water
(mol) 3.906 0.006
From these findings, the following local bonding environments of water are inferred.
From room temperature to ca. 100ºC, 0.9 moles of water are lost; these are attributed to
physisorbed (non-stoichiometric) water. Approximately 2.6 moles of water are released between
31
100ºC and 135ºC and are attributed to occluded interstitial water. From ca. 135ºC to 500ºC,
roughly 1.3 moles of water are released and these water molecules are attributed to interstitial
(coordinated) water. Thus the formula unit according to the method of Hawthorne (1999) based
upon elemental and thermal analyses requires that the interstitial uranyl and water groups be
delineated and, accounting for charge balance, becomes: UO2(H2O)1.3[(UO2)5(PO4)4]∙2.6H2O
These results are in good agreement with Rai et al. (2005) who reported four moles of
water lost in TGA and DSC experiments conducted under similar conditions. However, as
mentioned previously, these workers included the physisorbed water in the unit formula of TDT.
3.3 Powder x-ray diffraction (PXRD)
3.3a Francoisite-(Nd) and TDT
The diffractograms of PXRD analyses of francoisite-(Nd) and TDT are shown in Fig. 4. The
most prominent francoisite-(Nd) reflection occurs at 2θ = 11.34o at a d-spacing of 7.8 Ǻ (d-
spacing value not shown). This is the same 2θ location and d-spacing as the most intense
reflection in the natural francoisite-(Nd) sample reported by Piret et al., 1988 (PDF card: 42-
1314). In general, very good agreement was observed between the synthetic francoisite-(Nd)
diffractogram from this study and that of the natural sample.
The most prominent band in the TDT diffractogram appears at 2θ = 21o and a d-spacing
of 4.2 Ǻ (d-spacing value not shown). The powder diffraction data were compared to the
International Centre for Diffraction Data (ICDD) powder diffraction card 37-0369 and very good
agreement was observed. However it has been shown that the positions of the XRD reflections
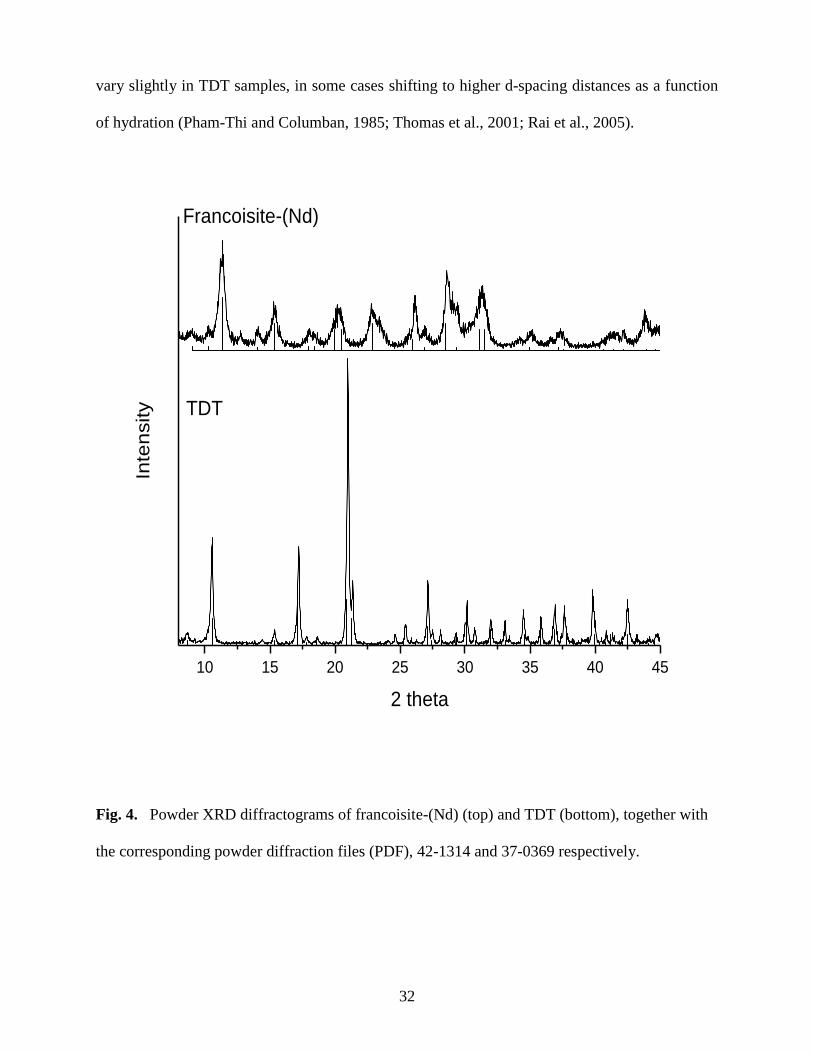
32
vary slightly in TDT samples, in some cases shifting to higher d-spacing distances as a function
of hydration (Pham-Thi and Columban, 1985; Thomas et al., 2001; Rai et al., 2005).
10 15 20 25 30 35 40 45
TDT
Francoisite-(Nd)
Inte
nsity
2 theta
Fig. 4. Powder XRD diffractograms of francoisite-(Nd) (top) and TDT (bottom), together with
the corresponding powder diffraction files (PDF), 42-1314 and 37-0369 respectively.
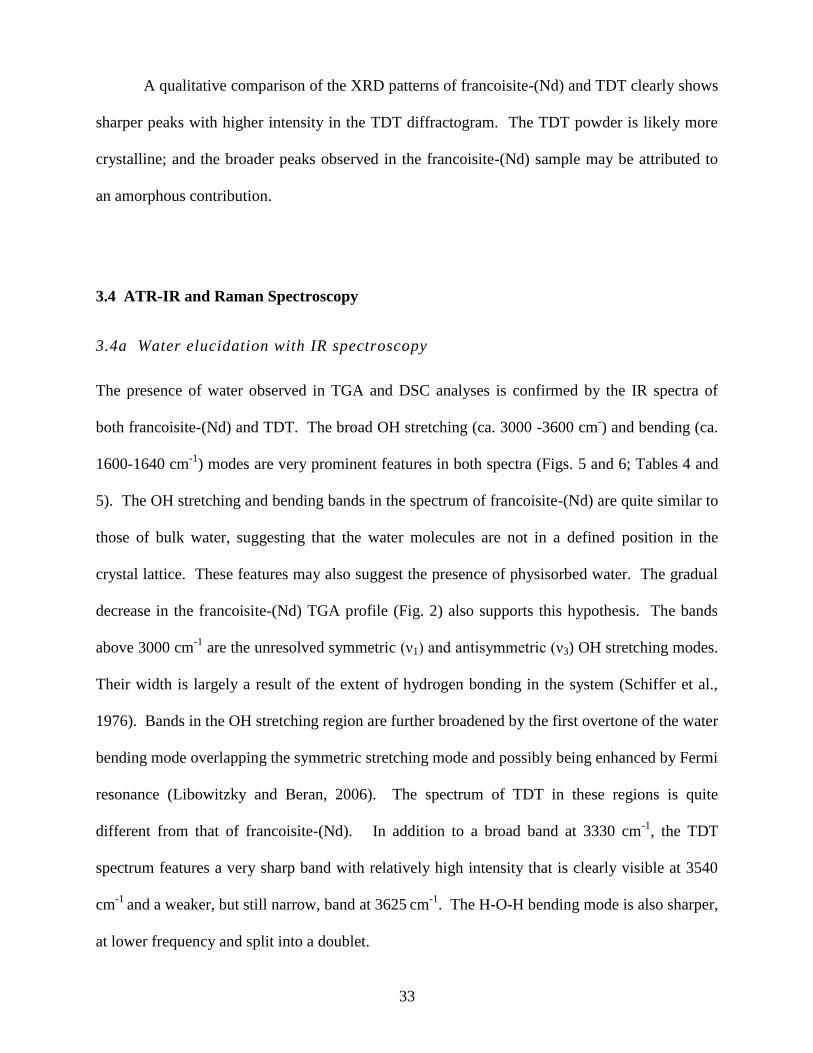
33
A qualitative comparison of the XRD patterns of francoisite-(Nd) and TDT clearly shows
sharper peaks with higher intensity in the TDT diffractogram. The TDT powder is likely more
crystalline; and the broader peaks observed in the francoisite-(Nd) sample may be attributed to
an amorphous contribution.
3.4 ATR-IR and Raman Spectroscopy
3.4a Water elucidation with IR spectroscopy
The presence of water observed in TGA and DSC analyses is confirmed by the IR spectra of
both francoisite-(Nd) and TDT. The broad OH stretching (ca. 3000 -3600 cm-) and bending (ca.
1600-1640 cm-1
) modes are very prominent features in both spectra (Figs. 5 and 6; Tables 4 and
5). The OH stretching and bending bands in the spectrum of francoisite-(Nd) are quite similar to
those of bulk water, suggesting that the water molecules are not in a defined position in the
crystal lattice. These features may also suggest the presence of physisorbed water. The gradual
decrease in the francoisite-(Nd) TGA profile (Fig. 2) also supports this hypothesis. The bands
above 3000 cm-1
are the unresolved symmetric (ν1) and antisymmetric (ν3) OH stretching modes.
Their width is largely a result of the extent of hydrogen bonding in the system (Schiffer et al.,
1976). Bands in the OH stretching region are further broadened by the first overtone of the water
bending mode overlapping the symmetric stretching mode and possibly being enhanced by Fermi
resonance (Libowitzky and Beran, 2006). The spectrum of TDT in these regions is quite
different from that of francoisite-(Nd). In addition to a broad band at 3330 cm-1
, the TDT
spectrum features a very sharp band with relatively high intensity that is clearly visible at 3540
cm-1
and a weaker, but still narrow, band at 3625 cm-1
. The H-O-H bending mode is also sharper,
at lower frequency and split into a doublet.
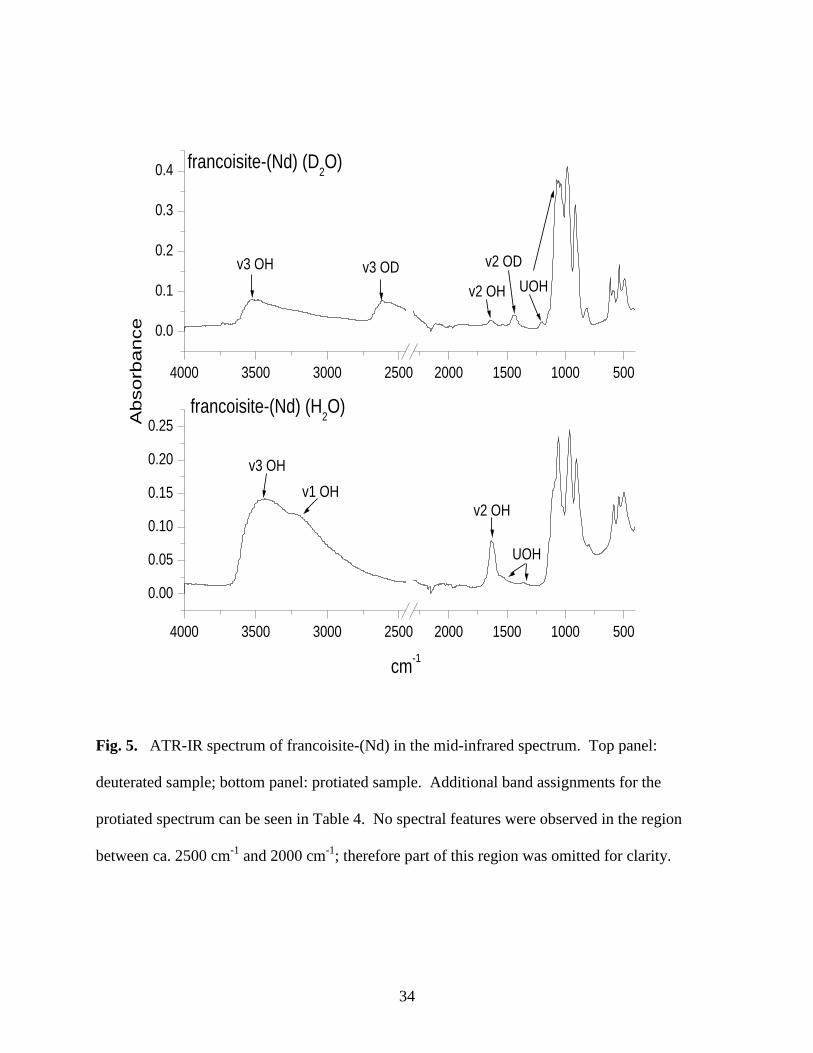
34
4000 3500 3000 2500 2000 1500 1000 500
0.00
0.05
0.10
0.15
0.20
0.25
UOH
francoisite-(Nd) (H2O)
v2 OHv1 OH
v3 OH
cm-1
4000 3500 3000 2500 2000 1500 1000 500
0.0
0.1
0.2
0.3
0.4
UOH
francoisite-(Nd) (D2O)
v2 OH
v2 ODv3 ODv3 OH
Absorb
ance
Fig. 5. ATR-IR spectrum of francoisite-(Nd) in the mid-infrared spectrum. Top panel:
deuterated sample; bottom panel: protiated sample. Additional band assignments for the
protiated spectrum can be seen in Table 4. No spectral features were observed in the region
between ca. 2500 cm-1
and 2000 cm-1
; therefore part of this region was omitted for clarity.
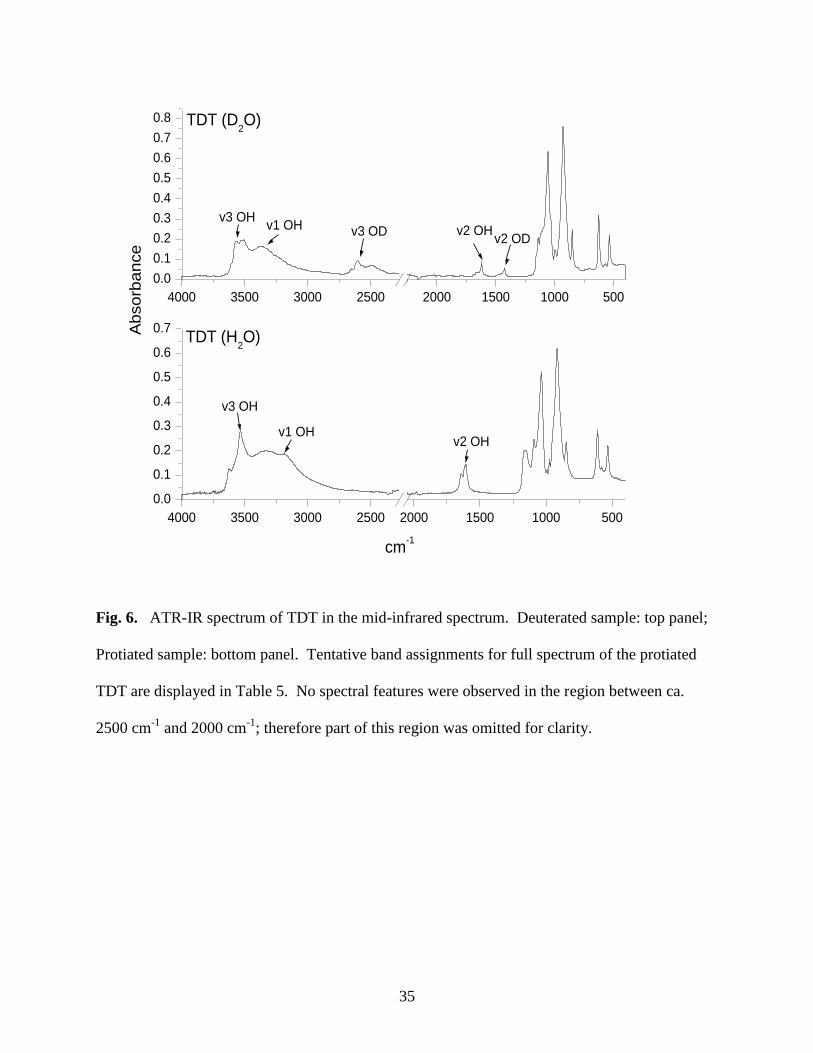
35
4000 3500 3000 2500 2000 1500 1000 500
0.0
0.1
0.2
0.3
0.4
0.5
0.6
0.7
v2 OHv1 OH
v3 OH
TDT (H2O)A
bsorb
ance
cm-1
4000 3500 3000 2500 2000 1500 1000 500
0.0
0.1
0.2
0.3
0.4
0.5
0.6
0.7
0.8
v1 OHv2 OD
v2 OHv3 ODv3 OH
TDT (D2O)
Fig. 6. ATR-IR spectrum of TDT in the mid-infrared spectrum. Deuterated sample: top panel;
Protiated sample: bottom panel. Tentative band assignments for full spectrum of the protiated
TDT are displayed in Table 5. No spectral features were observed in the region between ca.
2500 cm-1
and 2000 cm-1
; therefore part of this region was omitted for clarity.

36
Table 4. IR band assignments for francoisite-(Nd).
Wavenumber
(cm-1
) Group
Vibrational
Mode
493 PO43-
Degenerate
bend; ν4
542 PO43-
Degenerate
bend; ν4
585 PO43-
Degenerate
bend; ν4
798 UOH
In-plane bend;
δ
or out-of-plane
bend; γ
905 UO22+
Antisymmetric
stretch; ν3
960 PO43-
Antisymmetric
stretch; ν3
1060 PO43-
Antisymmetric
stretch; ν3
1360 UOH In-plane bend;
δ
1530 UOH In-plane bend;
δ
1630 H2O Bending; ν2
3205 OH Symmetric
stretching; ν1
3430 OH Antisymmetric
stretching; ν3
37
Table 5. IR band assignments for TDT.
Wavenumber
(cm-1
) Group
Vibrational
Mode
531 PO43-
Degenerate
bend; ν4
611 PO43-
Degenerate
bend; ν4
847 UO22+
Antisymmetric
stretch; ν3
917 UO22+
Antisymmetric
stretch; ν3
1034 PO43-
Antisymmetric
stretch; ν3
1090 PO43-
Antisymmetric
stretch; ν3
1160 H2O Librational
1607 H2O Bending; ν2
3180 H2O Symmetric
stretching; ν1
3330 H2O ν1/ ν3
3540 H2O Antisymmetric
stretching; ν3
3625 H2O ν1/ ν3
Typically the breadth of the OH stretching and H-O-H bending modes of water is
indicative both of the degree of hydrogen bonding, particularly where several water bonding
environments exist, and of the degree by which the location of the OH group is constrained.
Thus these bands in the spectrum of TDT indicate that the water is located in a more definite
position in the lattice than it is in the structure of francoisite-(Nd), a finding that is supported in
38
another TDT study (Locock and Burns, 2002). It is also probable that the bands due to
coordinated and lattice water overlap and are unresolved (Vochten, 1990).
4. DISCUSSION
4.1. ATR-IR and Raman spectroscopy
4.1a Interstitial Metal Coordination
For hydrated metals in solids, it has been shown that a correlation exists between metal charge
and the vibrational frequency of the coordinated water modes. Metal cations with higher
oxidation states effectively shift the electronic charge in the oxygen atom, resulting in a lowering
of the OH frequency (Vochten, 1990). This may explain the fact that the most prominent TDT ν3
H2O band (3540 cm-1
) is at higher frequency than that of francoisite-(Nd) (3430 cm-1
). The
trivalent Nd coordinated by water molecules may result in a reduction in the frequency of the ν3
mode relative to that of the divalent UO2 in TDT.
In accordance with several workers who have associated the highest energy, most intense
band to that of the antisymmetric stretching mode of water (Farmer and Lazarev, 1974; Cejka,
1999; Frost, 2006a), we have likewise assigned these bands to the antisymmetric stretching
modes of water. That the highest frequency TDT band is both sharper and located at a higher
wavenumber than francoisite-(Nd) can also be explained by the local coordination of the water
molecules in both materials. In the case of francoisite-(Nd), it has been reported that five water
molecules are coordinated to the interstitial Nd polyhedra (Piret et al., 1988). In addition, one
occluded water resides in the open space between Nd polyhedra presumably weakly bonded to
the coordinated water and/or oxygen via hydrogen bonding. In contrast, the TDT phase features
39
three coordinated water molecules to the interstitial U and four occluded water molecules
(Locock and Burns, 2002).
The relative frequencies of the bending vibrations of water (ν2) for TDT and francoisite-
(Nd) provide further insight into the bonding environments of water in these materials. For
example, we observed that higher stretching frequencies are associated with lower bending
frequencies. In the case of TDT the most prominent stretching and bending modes are 3540 cm-1
and 1607 cm-1
respectively (Fig. 6; Table 5). The corresponding modes absorb at 3430 cm-1
and
1630 cm-1
, respectively for francoisite-(Nd) (Fig. 5; Table 4). This negative correlation is
common and has been thoroughly addressed elsewhere (Nyquist, 1963; Novak, 1974).
According to Nyquist (1963), forces that impede the torsion of the OH group result in an
increase in bending frequency. Thus in general, the less freedom of motion, (i.e., more restricted
torsion), the higher the frequency of the bending mode. Hence, the local environment
surrounding a water molecule has a measurable effect on the stretching and bending modes such
that a relatively free molecule exhibits high stretching frequencies, and correspondingly, lower
bending frequencies, since the OH groups are less restricted and exhibit enhanced torsional
displacement.
The above conclusions are in line with published single-crystal XRD results. The
additional occluded water molecules in TDT relative to francoisite-(Nd) result in a greater
overall contribution of relatively short OH bonds and thus higher OH antisymmetric stretching
frequencies. Moreover, the greater spatial intermolecular distance of the occluded water results
in higher torsional OH bending and, correspondingly, a reduced OH bending frequency.
40
4.1b O-O bond distances and H2O vibrational frequencies
The relative strength of hydrogen bonds can often be deduced from IR spectroscopy. In the case
of water, stronger hydrogen bonding results in longer OH intramolecular bonds, leading to lower
OH vibrational frequencies. As a result, the distance between neighboring water molecules
(intermolecular H-bonding) can be estimated from the IR spectrum. This scenario is likely to
occur in francoisite-(Nd) and TDT by hydrogen bonding between the “free” occluded water(s)
and the waters (or oxygens) coordinated to the metal (Nd or uranyl respectively) in the interstitial
regions of the respective materials.
The correlation between OH vibrational frequencies and O-O bond length was
investigated by Libowitzky (1999). In this study a relationship between the OH stretching mode
and the associated O-O bond length was established for 65 different hydrated minerals.
Libowitzky plotted these values and obtained the following mathematical relationship (R2 =
0.96):
ν = 3592 – 309•109 • exp(-d/0.1321) (1)
where ν represents the wavenumber of the OH stretching mode and d is the O-O bond length in
the hydrogen bond (Ǻ). Equation (1) has been applied to the antisymmetric vibrational modes
for francoisite-(Nd) and TDT obtained from IR (Figs. 5 and 6 and Tables 4 and 5, respectively)
and the calculated oxygen – oxygen distances are displayed in Table 6.
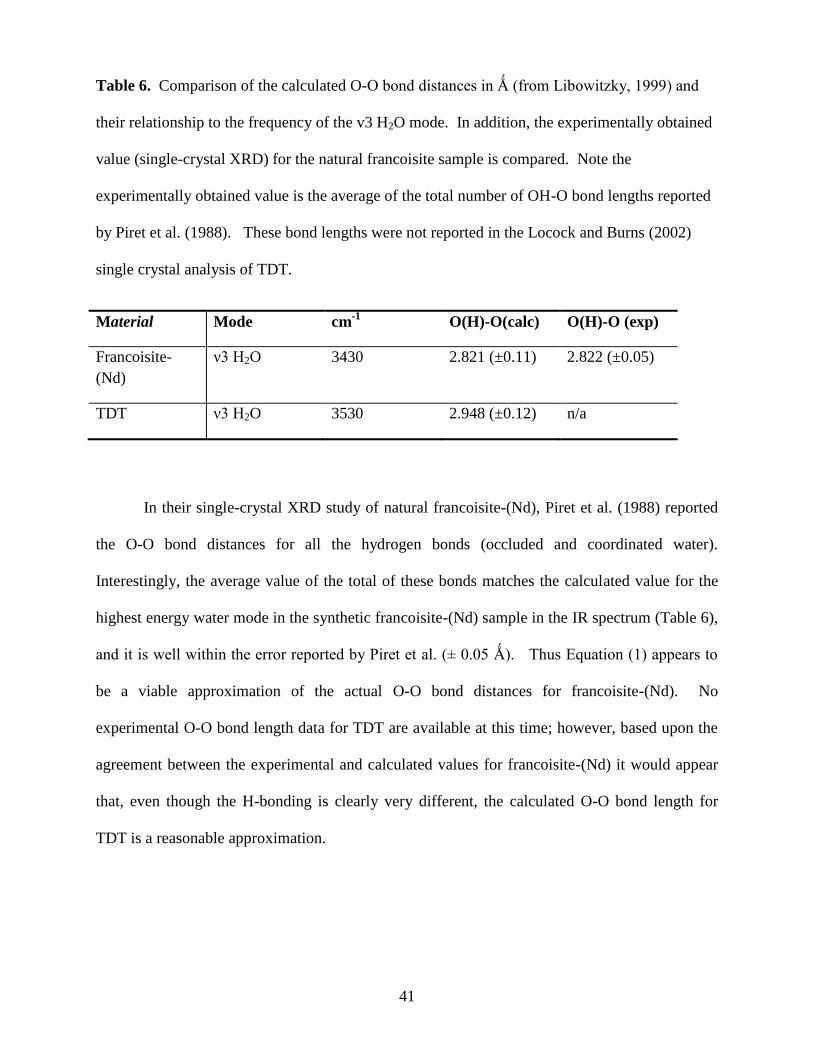
41
Table 6. Comparison of the calculated O-O bond distances in Ǻ (from Libowitzky, 1999) and
their relationship to the frequency of the v3 H2O mode. In addition, the experimentally obtained
value (single-crystal XRD) for the natural francoisite sample is compared. Note the
experimentally obtained value is the average of the total number of OH-O bond lengths reported
by Piret et al. (1988). These bond lengths were not reported in the Locock and Burns (2002)
single crystal analysis of TDT.
Material Mode cm-1
O(H)-O(calc) O(H)-O (exp)
Francoisite-
(Nd)
ν3 H2O 3430 2.821 (±0.11) 2.822 (±0.05)
TDT ν3 H2O 3530 2.948 (±0.12) n/a
In their single-crystal XRD study of natural francoisite-(Nd), Piret et al. (1988) reported
the O-O bond distances for all the hydrogen bonds (occluded and coordinated water).
Interestingly, the average value of the total of these bonds matches the calculated value for the
highest energy water mode in the synthetic francoisite-(Nd) sample in the IR spectrum (Table 6),
and it is well within the error reported by Piret et al. (± 0.05 Ǻ). Thus Equation (1) appears to
be a viable approximation of the actual O-O bond distances for francoisite-(Nd). No
experimental O-O bond length data for TDT are available at this time; however, based upon the
agreement between the experimental and calculated values for francoisite-(Nd) it would appear
that, even though the H-bonding is clearly very different, the calculated O-O bond length for
TDT is a reasonable approximation.
42
4.1c. Calculating U=O bond lengths in francoisite -(Nd) and TDT
It has been widely shown that an inverse relationship exists between the bond length and
the vibrational frequency of a particular moiety. This relationship can prove useful in
determining bond lengths for systems where no crystallographic data exists, such as with
synthetic francoisite-(Nd). Based on crystallographic and Raman data for a series of uranyl
compounds, Bartlett and Cooney (1989) developed relatively simple relationships between the ν1
and ν3 modes of the uranyl ion and the corresponding U=O bond length. Typically the bond
lengths for both U=O bonds in uranyl are very similar; however, in the case of non-negligible
asymmetry, these calculations represent the average of the two U=O bond lengths.
For the uranyl symmetric stretching mode:
RUO(pm) = 10650[ν1(cm-1
)]-2/3
+ 57.5 (2)
while for the uranyl antisymmetric stretching mode:
RUO(pm) = 9141[ν3(cm-1
)]-2/3
+ 80.4 (3)
where RUO represents the U=O bond length in picometers.
Since the ν3 mode of uranyl is both Raman and IR active and the ν1 mode is Raman active (and
very prominent), both of these spectroscopic techniques can be used in a complementary manner
to accrue U=O bond length information. The Raman spectra for francoisite-(Nd) and TDT are
displayed in Figs. 7 and 8 respectively. The ν1 and ν3 UO2 modes from Raman and ATR-IR
experiments (respectively) in this study were used to calculate uranyl bond lengths for
francoisite-(Nd) and TDT, the results of which are displayed in Table 7.
43
1200 1000 800 600 400 200
0
2000
4000
6000
8000
10000
12000
14000
16000 v1UO
2
v3PO
4
(825)
(993)
Ram
an
Inte
nsity
cm-1
Fig. 7. Raman spectrum of francoisite-(Nd); HeNe laser; 632.8nm. Integration: 30s; Average of
ten scans.
44
1200 1000 800 600 400 200
0
2000
4000
6000
8000
10000
12000
14000
16000
18000
(1153)vP-OH
(1033, 1005)
v3PO
4
(868)
v1UO
2R
am
an Inte
nsity
cm-1
Fig. 8. Raman spectrum of TDT; HeNe laser; 632.8nm. Integration: 30s; Average of ten scans.
In general, the RU-O values obtained from Equations (2) and (3) are in reasonable
agreement with the U=O bond lengths obtained by crystallographic means. In the case of
francoisite-(Nd) the calculated values underestimate the crystallographic U=O bond length. In
contrast, the calculated RU-O value for the ν3 UO2 mode from IR data for TDT appears to agree
well with experimental value. It is possible that the ν1 and ν3 uranyl modes for both francoisite-
(Nd) and TDT are split by crystal site splitting (Farmer and Lazarev, 1974; Vochten et al., 1984;
Frost et al., 2006b). In the case of francoisite-(Nd), two distinct uranyl polyhedra are present in
45
the structural unit, one hexagonal bipyramid and two pentagonal bipyramids. The TDT structure
features both structural and interlayer (interstitial) uranyl pentagonal bipyramids. These
crystallographically nonequivalent structures are expected to result in additional uranyl
vibrations in the infrared spectrum.
Table 7. Comparison between calculated and experimental uranyl bond lengths for francoisite-
(Nd) (top) and TDT (bottom).
Instrument Mode Wavenumber
(cm-1
)
RUO2
calculated (Ǻ)
RUO2 crystall.
(Ǻ)
Raman ν1 825 1.785 1.793
IR ν3 905 1.781
Instrument Mode Wavenumber
(cm-1
)
RUO2
calculated (Ǻ)
RUO2 crystall.
(Ǻ)
Raman ν1 868 1.745 1.770
IR ν3 917 1.772
The crystallographic bond lengths shown in Table 7 represent the average of the values
obtained. In addition, the bond length for francoisite-(Nd) that was obtained crystallographically
is for the natural mineral (Piret et al., 1988). Therefore, small differences between the natural
sample (which contains a host of impurities) and the synthetic sample are expected.
As mentioned previously, distinguishing between the antisymmetric stretching modes of
PO4 and UO2 can be a challenge. However, these calculations can assist in the assignment of the
Data obtained from single crystal XRD of natural sample (Piret et al., 1988)
Data obtained from single crystal XRD of synthetic sample (Locock and Burns, 2002)
46
antisymmetric phosphate and uranyl stretching modes. For example the IR spectrum of TDT
features the most intense band at 917 cm-1
(Fig. 6; Table 5). This band is in the vicinity of the
antisymmetric stretching vibrations of both uranyl and phosphate. Using Equation (3), a value of
917 cm-1
for the ν3 mode yields a U=O bond length of 1.772 Ǻ. This value is in very good
agreement with the reported uranyl bond length obtained from single-crystal XRD studies of
TDT (Locock and Burns, 2002). Therefore it seems reasonable to assign this mode to the uranyl
component, although the ν3 mode of phosphate may be accidentally degenerate.
4.1d. Delineating OH and H2O groups with IR spectroscopy
As noted above, Piret et al. (1988) presented data that suggested a hydroxyl group coordinated to
uranyl in the structural unit of natural francoisite-(Nd). Here we attempt to verify this finding by
examining well-characterized synthetic francoisite-(Nd) using IR spectroscopy. However, there
are three main reasons why distinguishing between the vibrational bands of hydroxyl (U-OH)
and H2O components in francoisite-(Nd) is problematic. Firstly, the O-H stretching modes of U-
OH and H2O groups typically absorb at similar frequencies; and thus their respective bands
frequently overlap. Secondly, H-bonding occurring between coordinated and occluded water in
the interstitial region can result in significant ν3 and ν1 band broadening (ca. 3600 – 3000 cm-1
)
effectively masking the U-OH band in this region. Lastly, regions in the spectrum that would
otherwise indicate in-plane and out-of-plane U-OH bending modes are in the same spectral
region as the most prominent phosphate vibrations. Thus these U-OH modes are either masked
or overlapped in the high energy region of the mid IR (3600 – 3000 cm-1
) by water stretching
modes and, correspondingly, in the middle range (ca. 1000 – 900 cm-1
) and at lower frequencies
(700 – 490 cm-1
) by PO4 components. However, by comparing the spectra of well-characterized
47
francoisite-(Nd) to that of TDT (no hydroxyl groups), information can be gleaned that supports
the presence of U-OH bands in francoisite-(Nd).
The following tentative band assignments are made in agreement with Cejka (1999). The
two weak bands at 1530 and 1360 cm-1
are assigned to the in-plane (δ) bending vibrations of U-
OH (Fig. 5). Additionally, as noted above, it is possible that both in-plane (δ) and out-of-plane
(γ) U-OH bending modes are present in roughly the same spectral regions as some phosphate
stretching modes. These U-OH bending modes are common in uranyl hydroxo compounds
(Cejka, 1999). For example, the shoulder at 1115 cm-1
might be associated with the U-OH out-
of-plane bending mode. In addition, the weak mode at 798 cm-1
may also be attributed to a U-
OH bend.
Further information can be gleaned regarding delineating H2O and OH bands by
examining the spectra of partially deuterated francoisite-(Nd) and TDT (Figs. 5 and 6
respectively). The characteristic isotopic shift to lower frequency in the stretching and bending
modes of heavy water relative to H2O is readily observed in the deuterated samples. Some
additional observations are noteworthy. The weak bands tentatively assigned to δ U-OH in the
protiated francoisite-(Nd) spectrum (1530 and 1360 cm-1
) together with the shoulder at 1115
cm-1
are not present in the deuterated francoisite-(Nd) spectrum. However a small band is
present at 1210 cm-1
in the spectrum of deuterated francoisite-(Nd). In addition, the prominent
band at ca. 1060 cm-1
is significantly broadened in the spectrum of deuterated francoisite-(Nd).
It is possible that these bands are all associated with U-OH/ U-OD vibrations that are simply red-
shifted in the deuterated compound. Therefore it may be possible that the δ U-OH modes
shifted from ca. 1530 and 1360 cm-1
to ca. 1210 and 1080 cm-1
, respectively upon deuteration.
Thus the prominent, sharp band in the H2O compound is transformed to one encompassing both
the v3 PO4 mode and the γ U-OD modes in the spectrum of deuterated francoisite-(Nd), resulting
48
in a broad overlapping band. In fact this feature looks like three unresolved bands in the
spectrum of the deuterated material (Fig. 5).
This hypothesis appears to be supported by the spectra of protiated and deuterated TDT
(Fig. 6). Apart from the expected isotopic H2O – D2O redshift, the influence of D2O does not
have the same effect as in francoisite-(Nd). The most prominent difference appears to be a
weakening of intensity and sharpening of band width in the 1150 cm-1
band relative to the 1160
cm-1
band in the H2O TDT spectrum. These features are tentatively assigned to the librational
mode of H2O. Thus, as expected, no U-OH band assignments are proposed in the TDT spectra.
In general the most prominent bands in the spectrum remain relatively unchanged in the
deuterated TDT spectrum. It is noteworthy that the francoisite-(Nd) and TDT compounds were
synthesized with D2O (rather than synthesized in H2O and later deuterated) and thus minor
spectral differences between the H2O and D2O derived materials are expected. It is also
important to recognize that even though the deuterated samples were synthesized in 99% D2O,
significant H2O is still present in the spectra. Thus the isotopic shift expected between these
samples is expected to be lower than in pure H2O and D2O materials. It is further likely that
some “OD” groups in the deuterated samples may indeed be protiated and thus no shift is
observed. This would appear to be the case if the band ca. 798 cm-1
is indeed associated with U-
OH, since negligible shifting of this band is observed between the protiated and deuterated
samples, although a significant increase in intensity is observed in the deuterated francoisite-
(Nd) at 798 cm-1
. Interestingly, an additional band appears in the deuterated sample that is
seemingly not present in the protiated material at ca. 615 cm-1
. This may be attributed to the
librational mode of water.
Although the band assignments for deuterated U-OH/U-OD are only tentative, the data
presented herein appears to support the findings of Piret et al. (1988) and Locock and Burns
49
(2002) in their single crystal XRD studies of francoisite-(Nd) and TDT, respectively. Using a
method developed by Donnay and Allman (1970) for recognizing O2-
, OH and H2O groups with
XRD, Piret et al. propose that a hydroxyl group acts as a central bridge between two pentagonal
uranyl bipyramids and one hexagonal bipyramid. Our IR data, particularly as evidenced in the
tentative U-OH assignments, appear to be in agreement with this finding.
4.1e Hygroscopic properties of francoisite -(Nd) and TDT
As mentioned previously, the width of the OH stretching bands and the degree of hydrogen
bonding in the system are strongly related. However, it has also been shown that narrow, high
frequency OH stretching bands are the result of weak hydrogen bonding (Libowitzky and Beran,
2006). As such, the sharp high energy band at ca. 3540 cm-1
in TDT likely represents the four
occluded waters isolated from one another in the unit cell but H-bonded to coordinated water or
oxygen in the interstitial uranyl bipyramids, each vibrating at a similar frequency. These
occluded water molecules can be identified via IR spectroscopy by examining the TDT and
francoisite-(Nd) samples after heating the crystals and concomitant water expulsion; see section
1.3.2 for details.
To examine the water features (ν1, ν2 and ν3 vibrational modes) in the IR spectrum as a
function of sample heating, separate samples of francoisite-(Nd) were heated to 80ºC and 500ºC
and subsequently analyzed by ATR-IR. In the case of the sample heated to 80ºC, the francoisite-
(Nd) crystals were placed in an oven overnight and subsequently allowed to cool in an enclosed
oven at 25ºC for approximately two hours prior to ATR-IR analysis to minimize water
readsorption. Samples heated to 500ºC were those that had been initially analyzed via TGA and
allowed to cool in the open atmosphere for approximately two hours prior to ATR-IR analysis.
50
The spectra of the heated samples, along with that of a sample that had not been heated, are
shown in Fig. EA-3 of Supplemental Data.
Samples of TDT were also heated and allowed to cool in the open atmosphere for
approximately two hours prior to IR analysis. These spectra are depicted in Fig. EA-4 in
Supplemental Data. The TDT heating temperatures were selected to approximate the regions
between the most pronounced water expulsion events in the TGA/DSC temperature profiles (Fig.
3).
In the case of francoisite-(Nd) it is clearly seen that heating does not have a significant
effect on the water features in the IR as the OH symmetric and antisymmetric stretching region
(ca. 3205 and 3430 cm-1
respectively) and the H2O bending mode at ca. 1630 cm-1
do not change
appreciably due to sample heating. However the IR spectra of the TDT crystals show more
pronounced changes in the stretching and bending modes of water. The sharp high energy band
attributed to the antisymmetric mode of occluded water appears to weaken in the heated samples,
while the water bending mode appears to sharpen as a function of temperature. Perhaps the most
conspicuous change, however, is the marked decrease of band intensity at ca. 1160 cm-1
in the
heated TDT crystals. This band may be attributed to librational water (Table 5), an external
vibrational mode indicative of free (occluded) water, which is expected to be expelled from the
solid as temperature is increased.
4.2. Water Sorption Verification: Reanalyzing the samples via TGA
From the TGA and DSC data presented above for francoisite-(Nd) and TDT, it is clearly seen
that water is expelled from the solid as the temperature is increased from 25ºC to 500ºC. Yet IR
data show that significant water remains in the samples that were heated. Two possibilities are
51
plausible for only minor changes observed in the water features (particularly in the case of
francoisite-(Nd)) after heating (Fig. EA-3; Supplemental Data). First, it is likely that water is
coordinated to the interstial Nd in francoisite-(Nd) in a manner similar to the coordination
environment in the uranyl pentagonal bipyramid in TDT (Locock and Burns, 2002). In contrast
to physisorbed and hydrogen bonded (occluded) water, the water molecules directly coordinated
to the interstitial metal are probably difficult to expel even after considerable heating. Second, it
is possible, and even probable, that some water readsorbed to the solid after the sample was
subjected to heating and subsequently analyzed by ATR-IR. To test these hypotheses, duplicate
samples were taken after heating to 500oC and allowed to cool overnight. These duplicate
samples of francoisite-(Nd) and TDT were subsequently reanalyzed by TGA from 25 to 500oC at
5oC/min, the data of which is depicted in Figs. 9 and 10, respectively. The total moles of water
lost in both runs are displayed in Table 8. Clearly water is readsorbing in both francoisite-(Nd)
and TDT, i.e., both samples are hygroscopic. Although the dehydration-rehydration process is
not completely reversible, a significant proportion of the water lost in the initial heating
experiment “resorbs”, particularly with respect to TDT. In the case of francoisite-(Nd)
approximately 3.35 moles of water has resorbed and 4.13 moles have reattached to the TDT
solid. Although extensive studies have been undertaken on dehydration of autunite as a function
of temperature by PXRD (Sowder, 1998; Wellman, 2004; Suzuki et al., 2005), to our knowledge
these dehydration-rehydration TGA studies are the first to be reported.
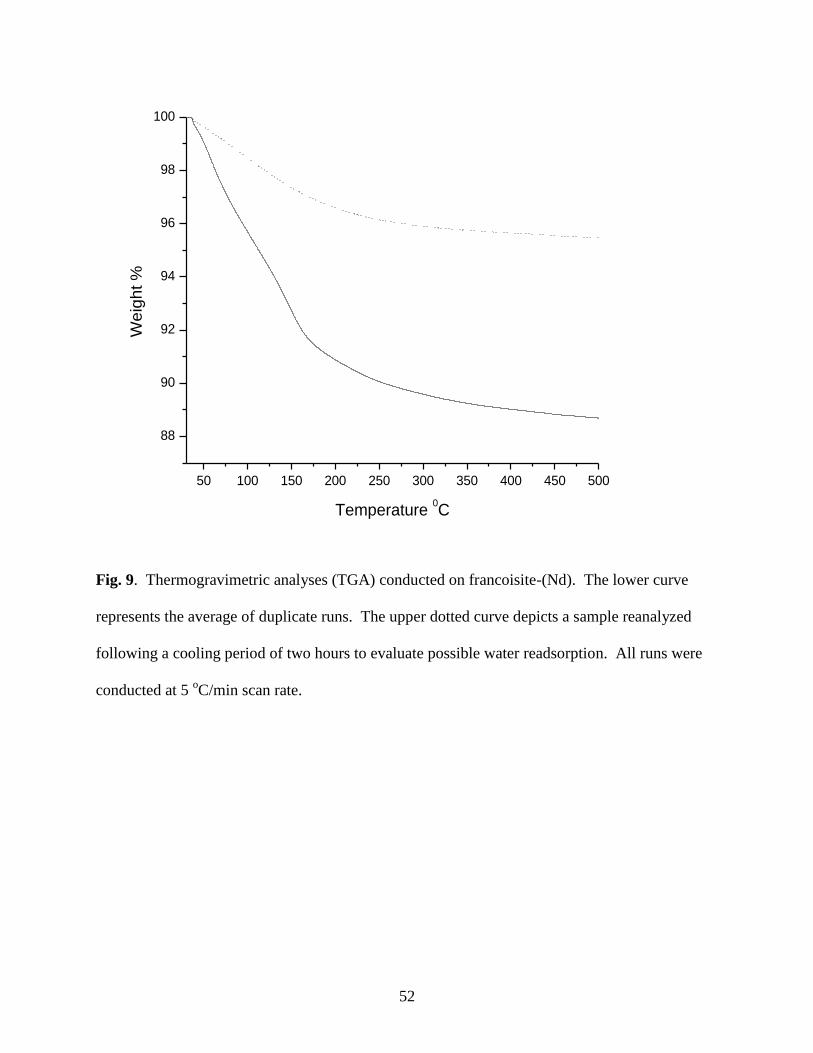
52
50 100 150 200 250 300 350 400 450 500
88
90
92
94
96
98
100
Weig
ht %
Temperature 0C
Fig. 9. Thermogravimetric analyses (TGA) conducted on francoisite-(Nd). The lower curve
represents the average of duplicate runs. The upper dotted curve depicts a sample reanalyzed
following a cooling period of two hours to evaluate possible water readsorption. All runs were
conducted at 5 oC/min scan rate.

53
50 100 150 200 250 300 350 400 450 500
92
94
96
98
100W
eig
ht %
Temperature 0C
Fig. 10. Thermogravimetric analyses (TGA) conducted on TDT. The lower curve represents the
average of duplicate runs. The upper dotted curve depicts a sample reanalyzed following a
cooling period of two hours to evaluate possible water readsorption. All runs were conducted at
5 oC/min scan rate.

54
Table 8. Initial TGA and second TGA runs of the same samples following a cooling period of
approximately two hours in the open atmosphere.
Material Moles H2O lost:
Initial Run
Moles H2O lost:
2nd Heating % Readsorbed
Francoisite-
(Nd) 8.36 3.35 40.2
TDT 4.81 4.13 85.8
Interestingly, the TDT crystals resorbed more water than francoisite-(Nd) (Table 8).
Also, although in general the reheated thermograms appear to exhibit similar temperature
profiles to the initial runs (albeit displaced vertically due to less water expulsion) some
differences are worth noting. In the case of francoisite-(Nd) the reheated sample features a more
gradual water loss profile than the initial run and no plateau is observed until the highest
temperature in either run. In contrast, the reheated TDT sample features a pseudoplateau at low
temperature but the slopes of both profiles are almost identical at elevated temperatures. These
findings suggest that the presence of water in the IR spectra of the heated samples in Fig. E-A4
(Supplemental Data) is indicative of both interstitially occluded and coordinated water (i.e.,
adsorbed and absorbed water). The temperature profile in the reheated TDT suggests that the
resorbed water has reincorporated back into the lattice, as evidenced by the sharp slopes and
plateau regions above 100ºC. Correspondingly, TDT showed more pronounced changes in the
IR spectrum due to heating than francoisite-(Nd). Therefore, the higher vibrational frequency
evidenced in the OH antisymmetric stretching mode in TDT relative to francoisite-(Nd) seems
likely due to i) more occluded waters and, ii) the coordination environment (divalent vs.
trivalent) of uranyl relative to Nd in the interstitial metals of TDT and francoisite-(Nd),
respectively.

55
5. SUMMARY
The empirical formula of francoisite-(Nd) was determined to be
Nd[(UO2)3.38(OH)(PO4)2]•5.16H2O, while that of triuranyl diphosphate tetrahydrate was
(UO2)3.13(PO4)2•3.91H2O. Slight deviations from the ideal stoichiometries of these materials
were attributed to residual sodium present in the samples. Powder XRD was conducted on these
samples and very good agreement between the samples synthesized in this study and the
available published data was observed.
To delineate distinct water populations, a method developed by Hawthorne (1992) was
employed and the unit formulas thus obtained for francoisite-(Nd) and TDT were
Nd[(UO2)3O(OH)(PO4)2]∙5.2H2O and UO2(H2O)1.3[(UO2)5(PO4)4]∙2.6H2O, respectively.
A vibrational spectroscopic study was conducted on these materials using ATR-IR and
Raman spectrometry. Tentative band assignments for the UO22+
, PO43-
, and H2O modes were
determined. The TGA, DSC, IR and Raman data showed that both francoisite-(Nd) and TDT
were strongly hydrated. In addition, the rapid readsorption of water molecules on both samples
was confirmed. The increased energy observed in the antisymmetric stretching mode of water in
the TDT relative to francoisite-(Nd) was attributed to two factors, i) the increased number of free
or weakly bound (occluded) waters in the TDT lattice and, ii) the divalent interstitial uranyl in
TDT relative to the trivalent interstitial Nd in francoisite-(Nd). The bond lengths for both O-O
(in intermolecular H-bonding) and U=O were estimated for both phases based upon empirical
calculations and reasonable agreement between the calculated bond lengths and those reported
from single-crystal XRD analyses was observed. The IR spectra of protiated and deuterated
francoisite-(Nd) confirmed a coordinated hydroxyl group bridging vicinal uranyl groups in the
francoisite-(Nd) structural unit.
56
Because of their low solubility, actinide and lanthanide phosphates are highly stable. The
likelihood of these materials occurring near spent nuclear fuel in natural systems makes it
necessary to understand the chemistry of f-element phosphate interactions in natural systems to
predict the fate of such metals over a geological time scale. The studies reported above provide
the basis for further thermodynamic (solubility, sorption) and geochemical modeling
investigations.
ACKNOWLEDGEMENTS
At Washington State University, this work was supported primarily by the U.S. Department of
Energy, Basic Energy Sciences, Heavy Element Chemistry program, contract DE-FG02-
06ER15782. In addition, SBC and CRA acknowledge support from the Joint Domestic Nuclear
Detection Office-National Science Foundation: Academic Research Initiative (ARI), contract
number ECCS-0833548 during the preparation of this manuscript. We also thank Dr. Louis
Scudiero (WSU) for his assistance with TGA and DSC analyses and the WSU Geological
Sciences Department for allowing CRA to use the PXRD.
57
REFERENCES
Bartlett, J.R., Cooney, R.P. (1989) On the determination of uranium-oxygen bond lengths in
dioxouranium(VI) compounds by Raman Spectroscopy. J. Mol. Struc. 193, 295-300.
Bray, T.H., Gorden, J.D., Albrecht-Schmitt, T.E. (2008) Synthesis and structure of
[C6H14N2][(UO2)4(HPO4)2(PO4)2(H2O)]∙H2O: An expanded open-framework amine-bearing
uranyl phosphate. J. Sol. State Chem. 181, 2199-2204.
Buck, E.C., Brown, N.R., Dietz, N.L. (1996) Contaminant uranium phases and leaching at the
Fernald site in Ohio. Environ. Sci. Tech. 30, 81-88.
Burns, P.C., Miller, M.L., Ewing, R.C. (1996) U6+
minerals and inorganic phases: A
comparison and hierarchy of crystal structures. Can. Mineral. 34. 845-880.
Burns, P.C. (1999) The crystal chemistry of uranium. In: Reviews in Mineralogy Vol. 38.
Eds. Burns, P.C., Finch, R. Mineralogical Society of America. 23-86.
Burns, P.C. (2005) U6+
minerals and inorganic compounds: Insights into an expanded
structural hierarchy of crystal structures. Can. Mineral. 43, 1839-1894.
Cejka, J. (1999) Infrared spectroscopy and thermal analysis of uranyl minerals. In: Reviews in
Mineralogy Vol. 38. Eds. Burns, P.C., Finch, R. Mineralogical Society of America. 521-
622.
Donnay, G., Allmann, R. (1970) How to recognize O2-
, OH- and H2O in crystal structure
determination by X-ray. Amer. Mineral. 55, 1003-1015.
Elless, M.P., Lee, S.Y. (1998) Uranium solubility of carbonate-rich uranium-contaminated
soils. Water, Air, Soil Pollut. 107, 147-162.
58
Farmer, V.C., Lazarev, A.N. (1974) The Anhydrous Oxide Minerals. In: The infra-red spectra
of minerals. Ed. Farmer, V.C. Mineralogical Society and the Macauley Instutute for Soil
Research. 183-205.
Felmy, A.R., Xia, Y., Wang, Z. (2005) The solubility product of NaUO2PO4∙xH2O determined
in phosphate and carbonate solutions. Radiochim. Acta. 93, 401-408.
Frost, R.L., Weir, M. (2004a) Raman Spectroscopy of autunite minerals at liquid nitrogen
temperature. Spectrochim. Acta Part A. 60, 2399-2409.
Frost, R.L., Weir, M., Adebajo, M.O. (2004b) Thermal decomposition of metazeunerite – a
high-resolution thermogravimetric and hot-stage Raman spectroscopic study. Thermochim.
Acta. 419, 119-129.
Frost, R.L., Cejka, J., Weir, M. (2006a) Raman spectroscopic study of uranyl oxyhydroxide
hydrates: bequerelite, billietite, curite, shoepite, and vandendriesscheite. J. Raman Spec.
38, 460-466.
Frost, R.L., Weir, M.L., Martens, W., Cejka, J. (2006b) The structure of phurcalite – A
vibrational spectroscopic study. Vib. Spec. 41, 205-212.
Giammar, D.E., Hering, J.G. (2002) Equilibrium and kinetic aspects of soddyite dissolution and
secondary phase precipitation in aqueous suspension. Geochim. Cosmochim. Acta. 66,
3235-3245.
Giammar, D.E. Xie, L., Pasteris, J.D. (2008) Immobilization of lead with nanocrystalline
carbonated apatite present in fish bone. Environ. Eng. Sci. 25, 725-736.
59
Gorman-Lewis, D.J., Mazeina, L., Fein, B., Szymanowski, J., Burns, P.C., Navrotzky, A. (2007)
Thermodynamic properties of soddyite from solubility and calorimetry measurements. J.
Chem. Thermodyn. 39, 568-575.
Griffiths, P.R., de Haseth, J.A. Fourier Transform Infrared Spectrometry (2007) John Wiley &
Sons, Inc. 529 pp.
Hawthorne, F.C. (1992) The role of OH and H2O in oxide and oxysalt minerals. Zeit. Fur
Kristall. 201, 183-206.
Hawthorne, F.C., Schindler, M. (2008) Understanding the weakly bonded constituents in
oxysalt minerals. Zeit. Fur Kristall. 223, 41-68.
Ilton, E.S., Liu, C.X., Yantasee, W., Wang, Z.M., Moore, D.A., Felmy, A.R., Zachara, J.M.
(2006) The dissolution of synthetic Na-boltwoodite in sodium carbonate solutions.
Geochim. Cosmochim. Acta. 70, 4836-4849.
Khosrawan-Sazedj, F. (1982) On the space group of threadgoldite. Tschermaks Mineral.
Petrogr. Mitt. 30, 111-115.
Kim, C.W., Wronkiewicz, D.J., Buck, E.C. (1999) Incorporation of radionuclides in the
alteration phases of spent nuclear fuel. Migration Conference. Lake Tahoe, NV, USA.
Libowitzky, E. (1999) Correlation of the O-H stretching frequencies and O-H∙∙∙O hydrogen
bond lengths in minerals. Monat. fur Chem. 130, 1047-1059.
Libowitzky, E., Beran, A. (2006) The Structure of hydrous species in nominally anhydrous
minerals: Information from polarized IR spectroscopy. In: Reviews in Mineralogy Vol. 62.
Eds. Keppler, H., Smyth, J.R. Mineralogical Society of America. 29-52.

60
Locock, A.J., Burns, P.C. (2002) The crystal structure of triuranyl diphosphate tetrahydrate. J.
Sol. State Chem. 163, 275-280.
Locock, A.J., Burns, P.C. (2003a) Crystal structures and synthesis of the copper-dominant
members of the autunite and meta-autunite groups: torbenite, zeunerite, metatorbernite and
metazeunerite. Can. Mineral. 41, 489-502.
Locock, A.J., Burns, P.C. (2003b) The crystal structure of synthetic autunite. Amer. Mineral.
88, 240-244.
Locock, A.J., Burns, P.C, Duke, M.J.M., Flynn, T.M. (2004) Monovalent cations in structures
of the meta-autunite group. Can. Mineral. 42, 973-996.
Markovic., M., Pavkovic, N. (1983) Solubility and equilibrium constants of uranyl(2+) in
phosphate solutions. Inorg. Chem. 22, 978-982.
Meinrath, G., Kimura, T. (1993) Behavior of uranium (VI) solids under conditions of natural
aquatic systems. Inorg. Chem. Acta. 204, 79-85.
Nguyen, S.N., Silva, R.J., Weed, H.C., Andrews, J.E. (1992) Standard Gibbs free energies of
formation at the temperature 303.15 K of four uranyl silicates: soddyite, uranophane, sodium
boltwoodite, and sodium weeksite. J. Chem. Thermodyn. 24, 359-376.
Novak, A. (1974) In: Structure and Bonding 18. Eds. Dunitz, J.D., Konstanz, P.H., Holm,
R.H., Ibers, J. A., Jorgensen, C.K., Neilands, J.B., Reinen, D., Williams, R.J.P. Springer-
Verlag. 177-216.
Nyquist, R.A. (1963) The O-H out-of-plane deformation in intramolecularly hydrogen bonded
phenols. Spectrochim. Acta 19, 1655-1664.

61
Pham-Thi, M., Colomban, Ph. (1985) Morphological, X-ray and vibrational study of various
uranyl phosphate hydrates. J. Less-Common Met. 108, 189-216.
Piret, P., Deliens, M., Piret-Meunier. (1988) La francoisite-(Nd), nouveau phosphate d’uranyle
et de terre rares; proprietes et structures cristalline. Bull. Mineral. 111, 443-449.
Rai, B.D., Felmy, A.R., Hess, N.J., LeGore, V.L., McCready, D.E. (2002) Thermodynamics of
the U(VI)-Ca2+
-Cl −-OH
−-H2O system: Solubility product of becquerelite. Radiochim. Acta
90, 495-503.
Rai, B.D., Xia, Y., Rao, L., Hess, N.J., Felmy, A.R., Moore, D.A., McCready, D.E. (2005)
Solubility of (UO2)3(PO4)2∙4H2O in H+-Na
+-OH
-- H2PO4 -PO4
3- - H2O and its comparison to
the analogous PuO22+
system. J. Sol. Chem. 34, 469-498.
Schiffer, J., Intenzo, M., Hayward, P., Calabrese, C. (1976) The FS correlation and a systematic
analysis of the stretching absorptions of water in the condensed state. J. Chem. Phys. 64,
3014-3020.
Schindler, M., Hawthorne, F.C. (2008) The stereochemistry and chemical composition of
interstitial complexes in uranyl-oxysalt minerals. Can. Mineral. 46, 467-501.
Sowder, A.G. (1998) The formation, transformation, and stability of environmentally relevant
uranyl mineral phases. PhD dissertation, Clemson University.
Suzuki, Y., Sato, T., Isobe, H., Kogure, T., Murakami, T. (2005) Dehydration processes in the
meta-autunite group minerals meta-autunite, metasaleeite, and metatorbernite. Amer.
Mineral. 90, 1308-1314.
62
Thomas, A., Dacheux, N., Le Coustumer, P., Brandel, V., Genet, M. (2001) Kinetic and
thermodynamic studies of the dissolution of thorium-uranium (IV) phosphate-diphosphate
solid solutions. J. Nucl. Mater. 295, 249-264.
Van Haverbeke, Vochten, R., Van Springel, K. (1996) Solubility and spectrochemical
characteristics of synthetic chernikovite and meta-ankoleite. Mineral. Mag. 60, 759-766.
Vesely, V., Pekarek, V., Abbrent, M. (1965) A study of uranyl phosphates III Solubility
products of uranyl hydrogen phosphate, uranyl orthophosphate and some alkali uranyl
phosphates. J. Inorg. Nucl. Chem. 27, 1159-1166.
Vochten, R., De Grave, E., Pelsmaekers, J. (1984) Mineralogical study of bassetite in relation to
its oxidation. Amer. Mineral. 69, 967-978.
Vochten, R. (1990) Transformation of chernikovite and sodium autunite into lehnerite. Amer.
Mineral. 75, 221-225.
Wellman, D.M. (2004) Environmental availability of uranium from secondary uranyl minerals.
PhD dissertation, Washington State University.
Wellman, D.M., Icenhower, J.P., Owen, A.T. 2006. Environ. Chem. 3. 219-224.
Womack, J.C., Larkin, D.J. (1971) ARH-2035. Richland, WA, USA.
Wright, J., Conca, J. 2002. RTDF PRB Action Meeting. Nov. 6-7.
Yu, Y., Albrecht-Schmitt, T.E. (2008) Incorporation of tetrahedral Co(II) into a mixed-metal
uranyl phosphate framework: Synthesis and structure of K2[UO2Co(PO4)2]∙H2O. Sol. State
Sci. 10, 821-824.

63
Yu, Y., Zhan, W., Albrecht-Schmitt, T.E. (2008) [H2bipy]2[(UO2)6Zn2(PO3OH)4(PO4)4]∙H2O:
An open framework uranyl zinc phosphate templated by diprotonated 4,4’-bipyridyl. Inorg.
Chem. 47, 9050-9054.

64
ELECTRONIC INDEX EA
Spectroscopic and Thermal Study of Hydrated Uranyl Phosphates: Francoisite-(Nd) and
Triuranyl Diphosphate Tetrahydrate
Christopher R. Armstrong,a, Kenneth L. Nash,
a Peter R. Griffiths,
b Sue B. Clark,
a,*
50 100 150 200 250 300 350 400 450 500
8000
8500
9000
9500
10000
Heat F
low
(uW
)
Temperature 0C
50 100 150 200 250 300 350 400 450 500
88
90
92
94
96
98
100
Weig
ht %
Fig.EA- 1. TGA (top) and DSC (bottom) for francoisite-(Nd). Both TGA and DSC plots
represent the average of duplicate runs. All runs were conducted at 5 oC/min scan rate.

65
50 100 150 200 250 300 350 400 450 500
8000
8500
9000
9500
10000
Heat F
low
(uW
)
Temperature 0C
50 100 150 200 250 300 350 400 450 500
92
94
96
98
100W
eig
ht %
Fig. EA-2. TGA (top) and DSC (bottom) for TDT. Both TGA and DSC plots represent the
average of duplicate runs. All runs were conducted at 5 oC/min scan rate.
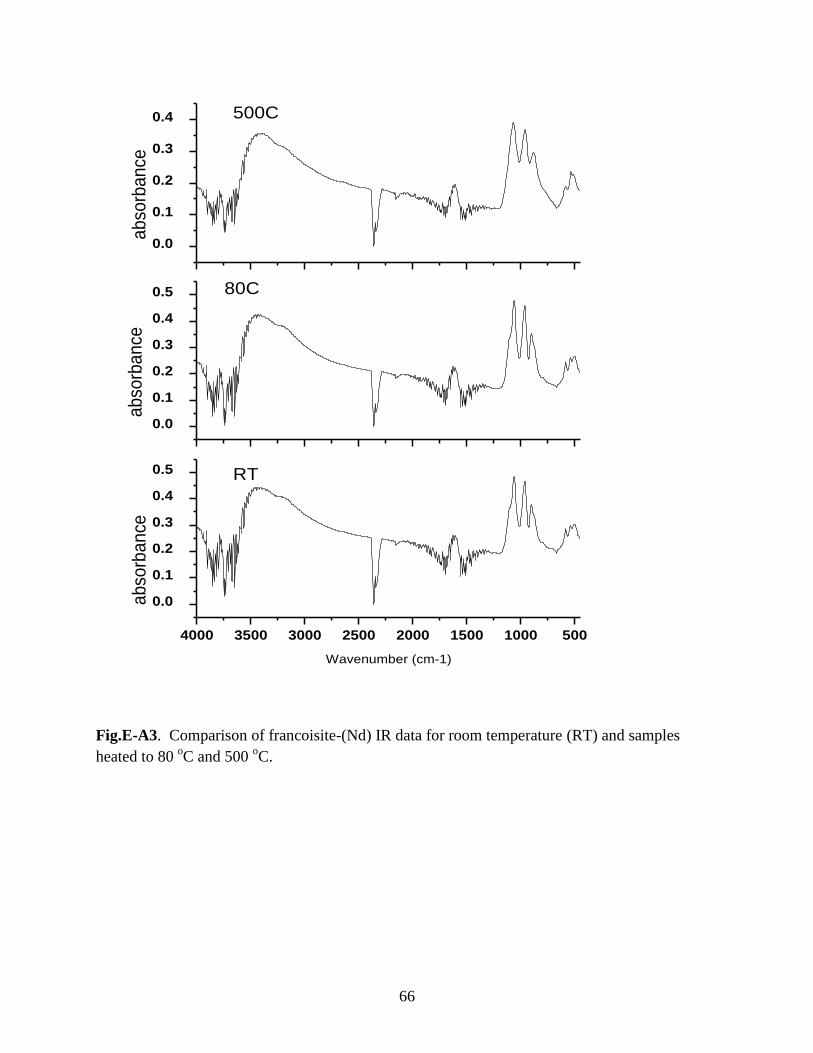
66
4000 3500 3000 2500 2000 1500 1000 500
0.0
0.1
0.2
0.3
0.4
0.5 RT
Wavenumber (cm-1)
ab
sorb
an
ce
0.0
0.1
0.2
0.3
0.4
0.5 80C
ab
sorb
an
ce
0.0
0.1
0.2
0.3
0.4 500C
ab
sorb
an
ce
Fig.E-A3. Comparison of francoisite-(Nd) IR data for room temperature (RT) and samples
heated to 80 oC and 500
oC.
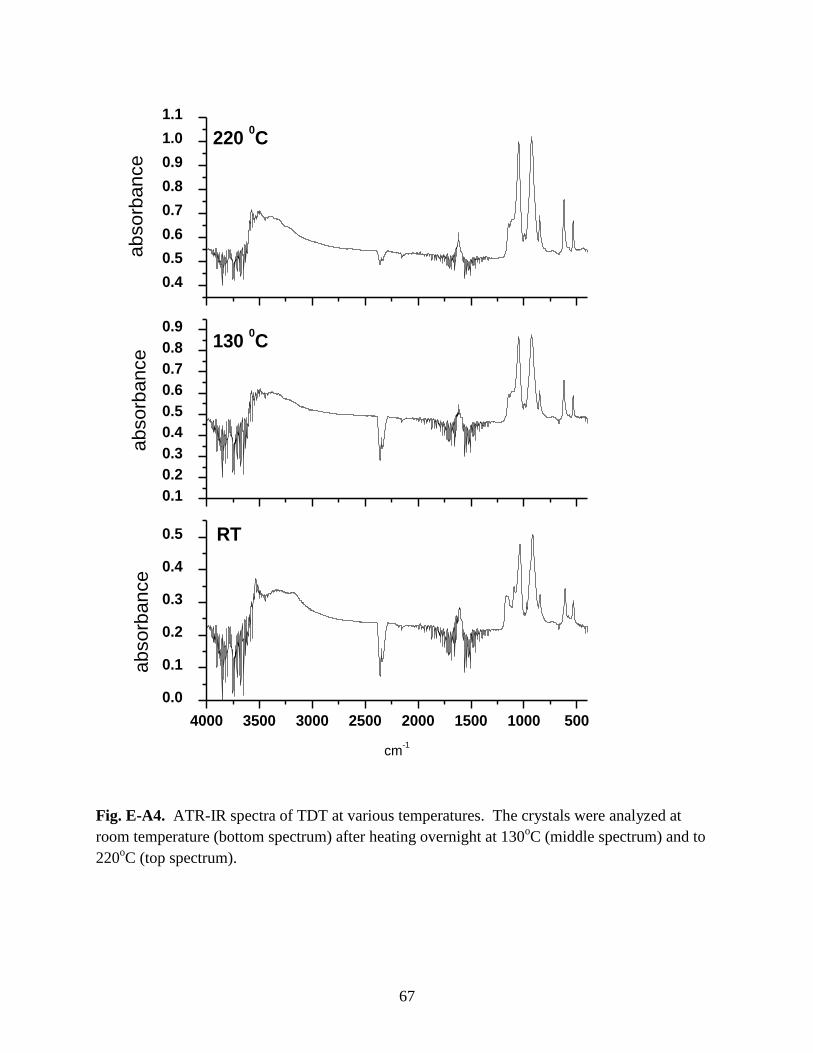
67
4000 3500 3000 2500 2000 1500 1000 500
0.0
0.1
0.2
0.3
0.4
0.5 RT
cm-1
0.1
0.2
0.3
0.4
0.5
0.6
0.7
0.8
0.9130
0C
0.4
0.5
0.6
0.7
0.8
0.9
1.0
1.1
absorb
ance
absorb
ance
absorb
ance
220 0C
Fig. E-A4. ATR-IR spectra of TDT at various temperatures. The crystals were analyzed at
room temperature (bottom spectrum) after heating overnight at 130oC (middle spectrum) and to
220oC (top spectrum).
68
CHAPTER THREE
Delineating Hydrated Uranyl Phosphates: Powder XRD and ATR-IR Studies
Christopher R. Armstrong and Sue B. Clark
Department of Chemistry, Washington State University, Pullman, WA 99164 U.S.A.
Corresponding author: [email protected]
Abstract. In this report a complementary approach using powder x-ray diffraction (PXRD) and
attenuated total reflection (ATR) IR spectroscopy is evaluated with an emphasis on (i)
delineating isostructural (Na autunite (Na[(UO2)(PO4)]•1.5H2O) and chernikovite
(H3O[(UO2)(PO4)]•4H2O)) and structurally distinct (triuranyl diphosphate tetrahydrate
(UO2)3(PO4)2•4H2O) hydrated uranyl phosphates. Our results show that this complementary
approach, when used in conjunction with elemental analysis, affords very accurate and reliable
identification and characterization of hydrated uranyl phosphates.
69
1. Introduction
Predicting the behavior of uranium in the environment and designing effective remediation
strategies for uranium contamination require knowledge of thermodynamic parameters, such as
solubilities of relevant mineral phases, to estimate groundwater concentrations and identify
possible solid phases for in-situ immobilization. The hexavalent uranium phosphate phases
known collectively as the autunites consist of a variety of isostructural layered minerals that vary
according to the metal ion occupancy in the interlayer [1]. Unfortunately, the reported
solubilities for the autunite phases often differ by many orders of magnitude [2], which may be
attributed to poor characterization of the solid phase. Because of their structural similarities,
delineating the end member autunites (e.g., chernikovite (H3O[(UO2)(PO4)]•xH2O), sodium
autunite (Na[(UO2)(PO4)]•xH2O), meta autunite (Ca[(UO2)(PO4)]2•xH2O), and their solid
solutions (i.e., mixtures of these phases) is challenging. Typical methods for characterization are
either thermal analysis, x-ray diffraction, or vibrational spectroscopy, e.g. attenuated total
reflection infrared (ATR-IR), but rarely do investigators employ all these approaches
simultaneously.
For this study, three synthetic hydrated uranyl phosphates, Na autunite, chernikovite and
triuranyl diphosphate tetrahydrate ((UO2)3(PO4)2∙4H2O) were investigated. Because they are
isostructural, Na autunite and chernikovite are often difficult to distinguish. Synthetic
chernikovite and TDT are of interest because although they are not isostructural, they can easily
be misidentified. Here, we describe a rigorous solid phase characterization approach for the
unique identification of these solids; it is based on (1) elemental analysis, (2) powder x-ray
diffraction (PXRD), (3) ATR-IR and (4) thermogravimetric analysis (TGA).
70
1.1.General problems with U-solid characterization using PXRD
In PXRD, the scattering magnitude of an atom in a unit cell is proportional to the atom’s atomic
number. Hence, for uranyl compounds the diffraction of U tends to dominate the XRD profile;
and consequently, diffractograms of different U-phases can be very difficult to distinguish [3].
Additionally, it has been shown that the degree of hydration in uranyl compounds can have a
significant effect on the 2-theta position and d-spacing of the reflections. For example, some d-
spacing distances increase with hydration; and this is attributed to interlayer swelling. For
example, the same phase with different hydration, i.e., (UO2)3(PO4)2∙4H2O vs.
(UO2)3(PO4)2∙6H2O, can result in a shift to a lower 2-theta position [4, 5, 6, 7]. This trend has
been observed in a variety of uranyl compounds, including other hydrated uranyl phosphates [8,
9], as well as uranyl silicates and oxy-hydroxides [10]. Thus, using PXRD alone to identify
synthetic hydrated uranyl compounds, particularly phosphates or silicates for which the
hydration state is unknown, is tenuous at best.
1.2. General problems with U-solid characterization using IR
Variations in sample preparation can greatly affect the IR spectrum [11]. For example,
overgrinding the solid can result in significant structural changes that can have a marked effect
on the resulting spectra. In addition, ion exchange between diluents such as KBr and the sample
can result in band broadening and lower intensity [12, 13]. However, ATR-IR eliminates these
issues. Because the depth of penetration, dp, is only about a quarter of the wavelength, a very
thin sample (<10 µm) is not necessary. Moreover, with ATR-IR, solid samples do not need to be
diluted (e.g., with KBr) and can be analyzed in their neat state. On the other hand, because
ATR-IR is largely a surface technique, the presence of atmospheric water on the surface of the
hygroscopic solid is difficult to avoid. Consequently, delineating physisorbed water and
71
stoichiometric water (i.e., water located in the interstitial region or structural unit of the
compound) is difficult.
2. Experimental Methods
All chemicals are reagent grade or higher. Distilled 18MΩ and boiled water was used in
preparations of all solutions. Standards used for ICP-OES analyses were 99.9% purity.
2.1. Synthetic uranyl compounds
Solution and suspension pH was measured with a ThermoElectron Corp. Orion 4 Star pH meter
equipped with a Ross combination pH electrode (Orion Model 8102). Prior to each use, the pH
electrode was calibrated with NIST standards. For hydrothermal reactions, 23- and 45-mL
Teflon® liners were placed inside stainless steel Parr acid digestion bombs.
2.1.1. Synthesis of TDT: (UO2)2(PO4)3∙4H2O(c). Microcrystalline TDT was synthesized
according to the modified method of Rai et al. [7]. Briefly, stoichiometric volumes of 0.7 M
H3PO4 and 0.05M UO2(NO3)2·6H2O were mixed in a jacketed reaction vessel under N2
atmosphere at 40oC (± 0.1). Precipitation was observed immediately, and the suspension pH was
ca. 1. The suspension was stirred overnight at 40oC and subsequently allowed to settle, after
which the supernatant was decanted and replaced with degassed 18 MΩ water at 40oC twice.
From the mixed suspension, a sample of approximately 60 mL was taken and placed in separate
45 mL Teflon® liners, which were then inserted into stainless steel Parr acid digestion bombs and
put in the oven at 140oC for one week. The Parr bombs were then taken out of the oven and
allowed to cool overnight at room temperature. The suspension was vacuum filtered through
72
0.45-µm Millipore membranes, rinsed three times with boiling DIW, covered and dried
overnight at 30oC. Solids were crushed with a mortar and pestle and sieved (sieve number 100)
to an approximate 150 µm particle size.
2.1.2. Synthesis of Na autunite: Na[(UO2)(PO4)]∙1.5H2O (c). Microcrystalline sodium autunite
was synthesized according to the method of Zheng et al. [14]. Stoichiometric volumes of 0.05 M
H3PO4 and 0.1 M UO2(NO3)2·6H2O were mixed in a jacketed reaction vessel under N2 at 70oC.
Standardized 0.1 M NaOH was added dropwise to the stirred suspension and the pH was
adjusted to approximately 5. The suspension was stirred overnight at 70oC, and subsequently
allowed to settle. The supernatant was decanted and replaced with degassed 18 MΩ DIW at 70oC
(twice), stirred and allowed to settle. The final pH was ca. 7. The final suspension was extracted
and vacuum filtered through 0.45-µm Millipore membranes, rinsed three times with boiling
DIW, covered and dried overnight at 30oC. Solids were crushed with a mortar and pestle and
sieved (sieve number 100) to an approximate 150 µm particle size. The resulting powder was
placed in 20 mL borosilicate centrifuge vials and stored.
2.1.3. Synthesis of chernikovite: H3O[(UO2)(PO4)]∙4H2O (c). Microcrystalline chernikovite was
synthesized in a manner very similar to that of TDT. However the uranyl nitrate and phosphoric
acid solutions were mixed in 1:1 ratios; and the chernikovite supernatant did not undergo
repeated rinsing with DIW. In addition, instead of undergoing hydrothermal reaction, the
suspension of chernikovite was placed in a 125 mL polypropylene bottle, sealed and stored in the
dark and allowed to age for approximately four months.
73
2.2. Elemental Analysis
For all of the synthetic phases in this study, duplicate solid samples of roughly 10 mg were
digested in concentrated nitric acid and diluted to 100 mL in a volumetric flask with boiled 18
MΩ water. These duplicate digest samples were subsequently analyzed for dissolved metal ion
content with a Perkin-Elmer Optima 3200 axial torch ion-coupled optical emission spectrometer
(ICP-OES) with a precision of approximately 5%. For all samples, three replicate intensities
were recorded from which the average and standard deviation was calculated (table 9).
2.3. Thermogravimetric Analyses (TGA)
To quantify the degree of hydration in the uranyl phosphates studied herein, TGA experiments
were conducted using a Perkin-Elmer TGA-7 instrument. The TGA was calibrated with a 10 mg
standard weight furnished by Perkin-Elmer. Powdered samples of approximately 10 mg were
analyzed inside a platinum pan. In all cases, the scan rate was 10oC/min and the experimental
temperature ranged from 25oC to 500
oC. A minimum of three replicate runs were conducted for
each uranyl phosphate as described below. In every case excellent agreement was observed
between replicate runs resulting in an experimental uncertainty of less than 1%.
2.4. Powder x-ray diffraction (PXRD)
Well-rinsed filtrates of the suspensions (~ 150 µm particle size) were prepared for PXRD
analysis at room temperature using a Siemens Kristalloflex D500 diffractometer with the
following parameters: Copper source (Kα; 1.5406 Ǻ); 35 keV, 30 mA, Kβ filter: Ni; scintillation
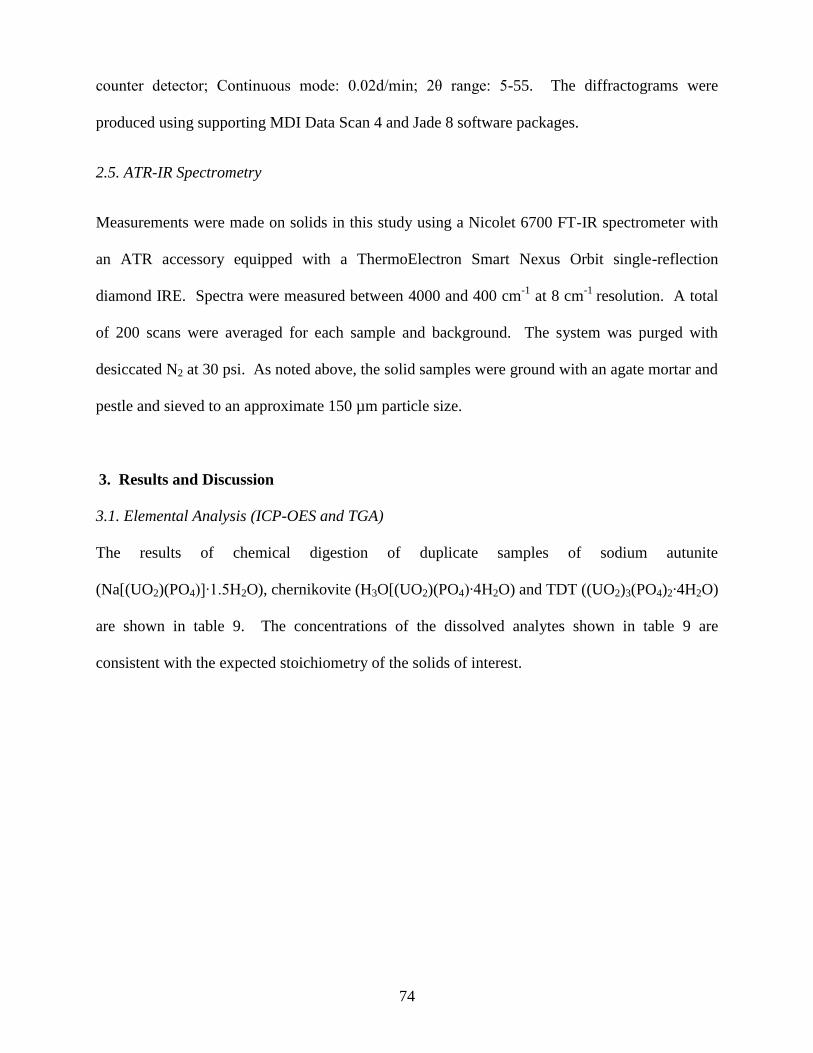
74
counter detector; Continuous mode: 0.02d/min; 2θ range: 5-55. The diffractograms were
produced using supporting MDI Data Scan 4 and Jade 8 software packages.
2.5. ATR-IR Spectrometry
Measurements were made on solids in this study using a Nicolet 6700 FT-IR spectrometer with
an ATR accessory equipped with a ThermoElectron Smart Nexus Orbit single-reflection
diamond IRE. Spectra were measured between 4000 and 400 cm-1
at 8 cm-1
resolution. A total
of 200 scans were averaged for each sample and background. The system was purged with
desiccated N2 at 30 psi. As noted above, the solid samples were ground with an agate mortar and
pestle and sieved to an approximate 150 µm particle size.
3. Results and Discussion
3.1. Elemental Analysis (ICP-OES and TGA)
The results of chemical digestion of duplicate samples of sodium autunite
(Na[(UO2)(PO4)]∙1.5H2O), chernikovite (H3O[(UO2)(PO4)∙4H2O) and TDT ((UO2)3(PO4)2∙4H2O)
are shown in table 9. The concentrations of the dissolved analytes shown in table 9 are
consistent with the expected stoichiometry of the solids of interest.
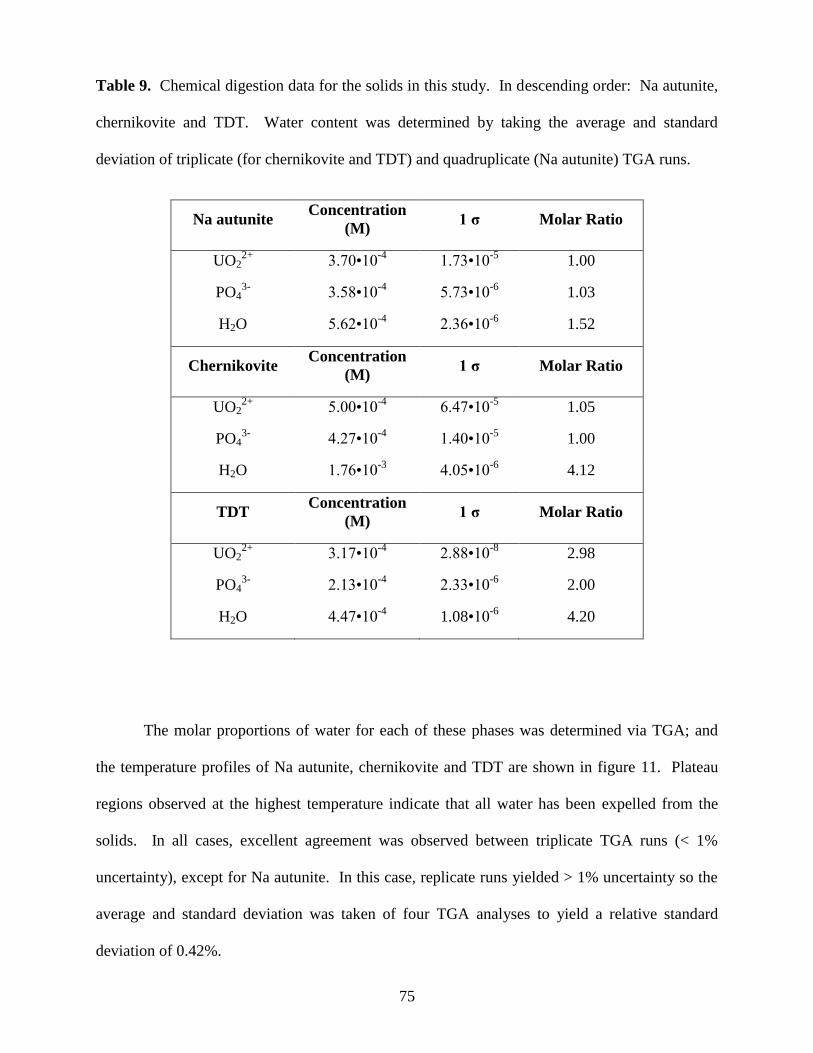
75
Table 9. Chemical digestion data for the solids in this study. In descending order: Na autunite,
chernikovite and TDT. Water content was determined by taking the average and standard
deviation of triplicate (for chernikovite and TDT) and quadruplicate (Na autunite) TGA runs.
Na autunite Concentration
(M) 1 σ Molar Ratio
UO22+
3.70•10-4
1.73•10-5
1.00
PO43-
3.58•10-4
5.73•10-6
1.03
H2O 5.62•10-4
2.36•10-6
1.52
Chernikovite Concentration
(M) 1 σ Molar Ratio
UO22+
5.00•10-4
6.47•10-5
1.05
PO43-
4.27•10-4
1.40•10-5
1.00
H2O 1.76•10-3
4.05•10-6
4.12
TDT Concentration
(M) 1 σ Molar Ratio
UO22+
3.17•10-4
2.88•10-8
2.98
PO43-
2.13•10-4
2.33•10-6
2.00
H2O 4.47•10-4
1.08•10-6
4.20
The molar proportions of water for each of these phases was determined via TGA; and
the temperature profiles of Na autunite, chernikovite and TDT are shown in figure 11. Plateau
regions observed at the highest temperature indicate that all water has been expelled from the
solids. In all cases, excellent agreement was observed between triplicate TGA runs (< 1%
uncertainty), except for Na autunite. In this case, replicate runs yielded > 1% uncertainty so the
average and standard deviation was taken of four TGA analyses to yield a relative standard
deviation of 0.42%.
76
Gradual water loss is observed in both Na autunite and chernikovite at relatively low
temperature, while the TDT temperature profile features a plateau from 25oC to ca. 83
oC. This
suggests that a smaller weight percentage of physisorbed water is associated with TDT relative to
Na autunite and chernikovite. Chernikovite undergoes the most sizeable dehydration in terms of
weight percent, losing most of its water by 125oC; however the sharpest event occurs between
ca. 40 to 75oC. Interestingly, both Na autunite and TDT feature the most significant dehydration
events at roughly the same temperature, ending at ca. 125oC. In addition, the TDT profile
exhibits a dehydration event at ca. 240oC that is not evident in either Na autunite or chernikovite.
77
50 100 150 200 250 300 350 400 450 50082
84
86
88
90
92
94
96
98
100
Weig
ht %
Temperature oC
Figure 11. TGA temperature profiles of Na autunite (dotted line), chernikovite (dashed line) and
TDT (solid line). These thermograms represent the average of quadruplicate TGA runs in the
case of Na autunite and triplicate runs for chernikovite and TDT. All runs were conducted from
25oC to 500
oC at 10
oC/min.
3.2. PXRD analysis
Samples of Na autunite, chernikovite and TDT were analyzed by PXRD and compared to
published powder diffraction files (PDFs). In the case of Na autunite, separate powders were
analyzed by PXRD to determine the effect of hydrothermal treatment. The first consisted of a
sample prepared as outlined above. The second sample was placed in a Parr bomb and heated at

78
140oC for three days. Both of these XRD patterns are shown in figure 12 together with PDF#
29-1284 for synthetic Na autunite. With the exception of increased intensity in the
hydrothermally treated Na autunite sample, which is indicative of an increase in crystallinity,
very good agreement between the two samples is observed. In general, the XRD patterns for
synthetic sodium autunite are consistent with the published XRD PDF# 29-1284. However,
some discrepancies are noteworthy. First, as noted above, differences in hydration can result in
shifts in the XRD patterns of hydrated uranyl compounds. A slight shift to higher 2-theta is
noticeable in the synthetic Na autunite relative to PDF# 29-1284 (figure 12). This is expected
since lower degrees of hydration can cause shifts to higher 2-theta locations. The PDF #29-1284
is for a trihydrate sodium autunite whereas the sample in this study contains 1.5 moles of water
as determined by TGA (table 9). Second, there are two peaks at 2-theta of ca. 19.5 and 32.5 in
the synthetic Na autunite from this study that are not present in the PDF# 29-1284. However,
both of these peaks are present in the PDF for synthetic chernikovite (PDF# 08-0296, not
shown). Although this suggests that this Na autunite may have some hydronium in the
interlayer, i.e., a small chernikovite contribution, no evidence of H3O+ in Na autunite is observed
with IR spectroscopy, as discussed in the following section.
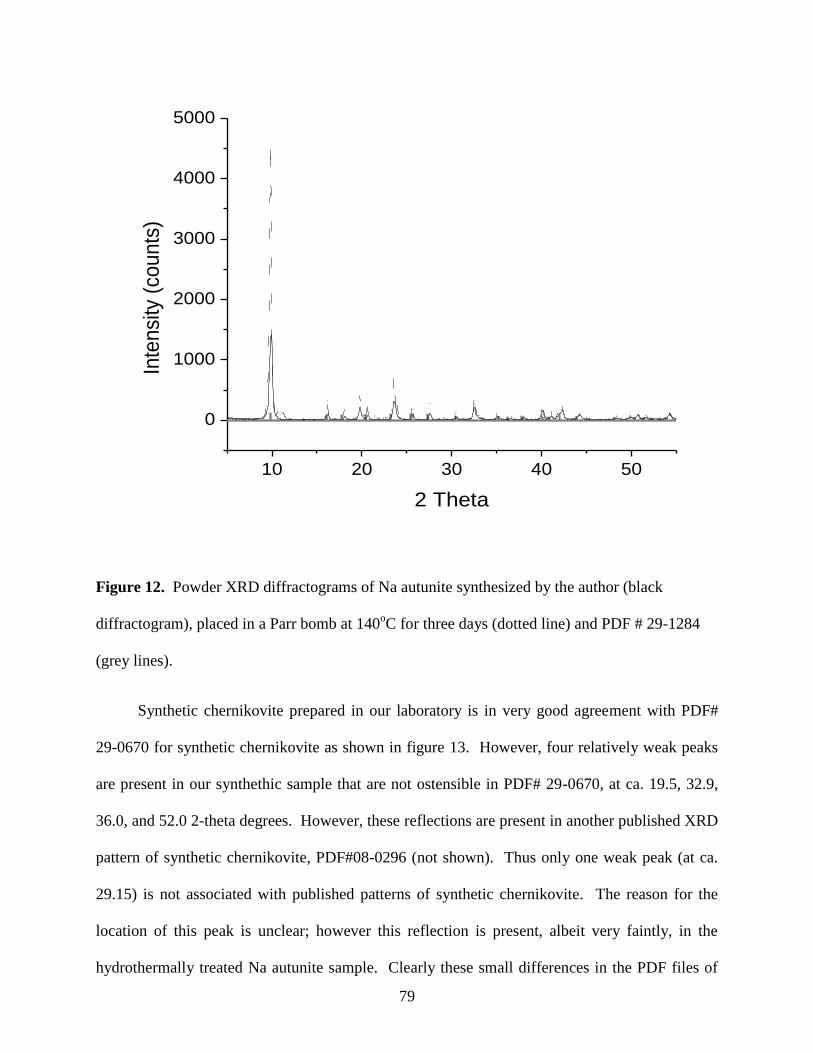
79
10 20 30 40 50
0
1000
2000
3000
4000
5000
Inte
nsi
ty (
cou
nts
)
2 Theta
Figure 12. Powder XRD diffractograms of Na autunite synthesized by the author (black
diffractogram), placed in a Parr bomb at 140oC for three days (dotted line) and PDF # 29-1284
(grey lines).
Synthetic chernikovite prepared in our laboratory is in very good agreement with PDF#
29-0670 for synthetic chernikovite as shown in figure 13. However, four relatively weak peaks
are present in our synthethic sample that are not ostensible in PDF# 29-0670, at ca. 19.5, 32.9,
36.0, and 52.0 2-theta degrees. However, these reflections are present in another published XRD
pattern of synthetic chernikovite, PDF#08-0296 (not shown). Thus only one weak peak (at ca.
29.15) is not associated with published patterns of synthetic chernikovite. The reason for the
location of this peak is unclear; however this reflection is present, albeit very faintly, in the
hydrothermally treated Na autunite sample. Clearly these small differences in the PDF files of
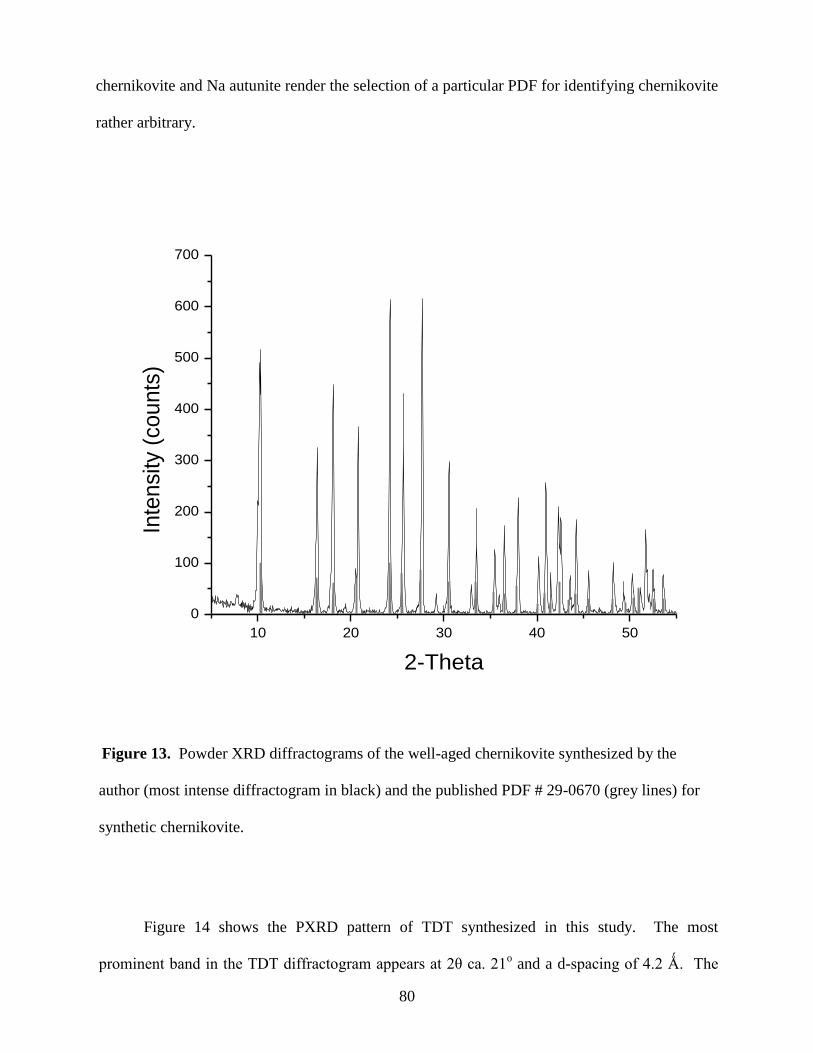
80
chernikovite and Na autunite render the selection of a particular PDF for identifying chernikovite
rather arbitrary.
10 20 30 40 50
0
100
200
300
400
500
600
700
Inte
nsity (
cou
nts
)
2-Theta
Figure 13. Powder XRD diffractograms of the well-aged chernikovite synthesized by the
author (most intense diffractogram in black) and the published PDF # 29-0670 (grey lines) for
synthetic chernikovite.
Figure 14 shows the PXRD pattern of TDT synthesized in this study. The most
prominent band in the TDT diffractogram appears at 2θ ca. 21o and a d-spacing of 4.2 Ǻ. The
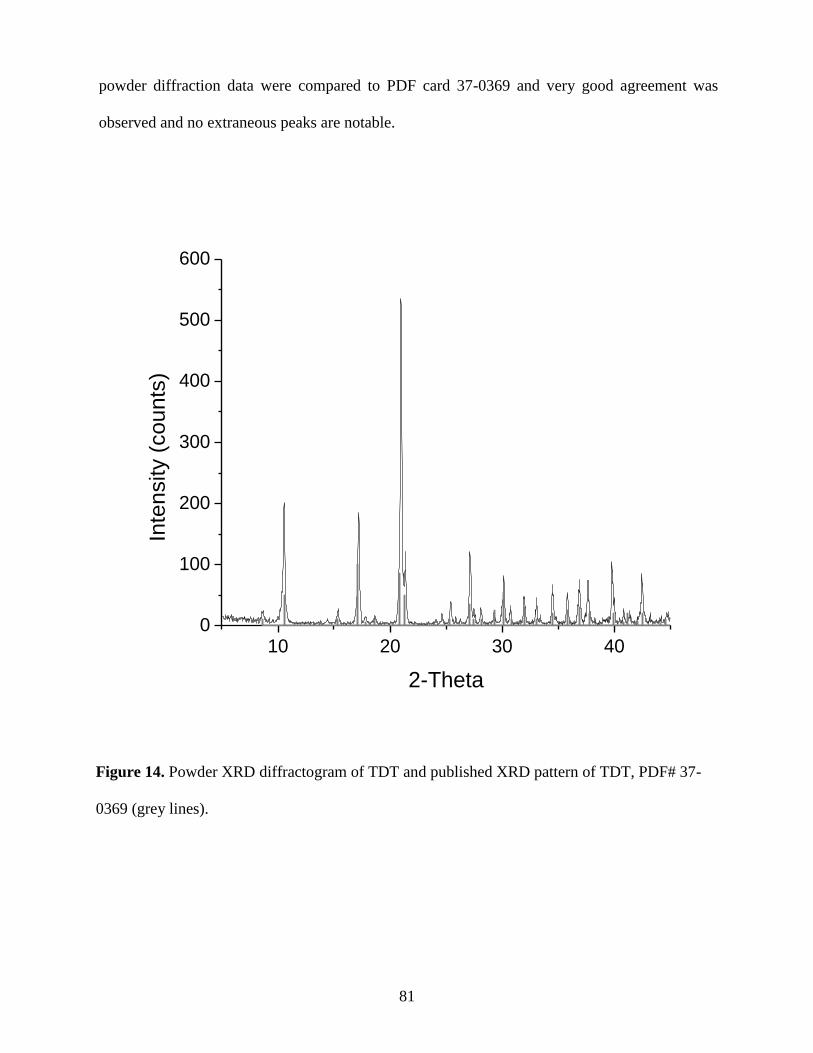
81
powder diffraction data were compared to PDF card 37-0369 and very good agreement was
observed and no extraneous peaks are notable.
10 20 30 400
100
200
300
400
500
600
Inte
nsity (
cou
nts
)
2-Theta
Figure 14. Powder XRD diffractogram of TDT and published XRD pattern of TDT, PDF# 37-
0369 (grey lines).

82
3.3. ATR-IR analysis
ATR-IR was performed on Na autunite, chernikovite and TDT. The band assignments of the
various components presented herein are in line with published studies of Na autunite [12],
chernikovite [4, 12] and TDT [4]. The IR spectra and corresponding band assignments for these
materials are shown in figure 15 and table 10 respectively.
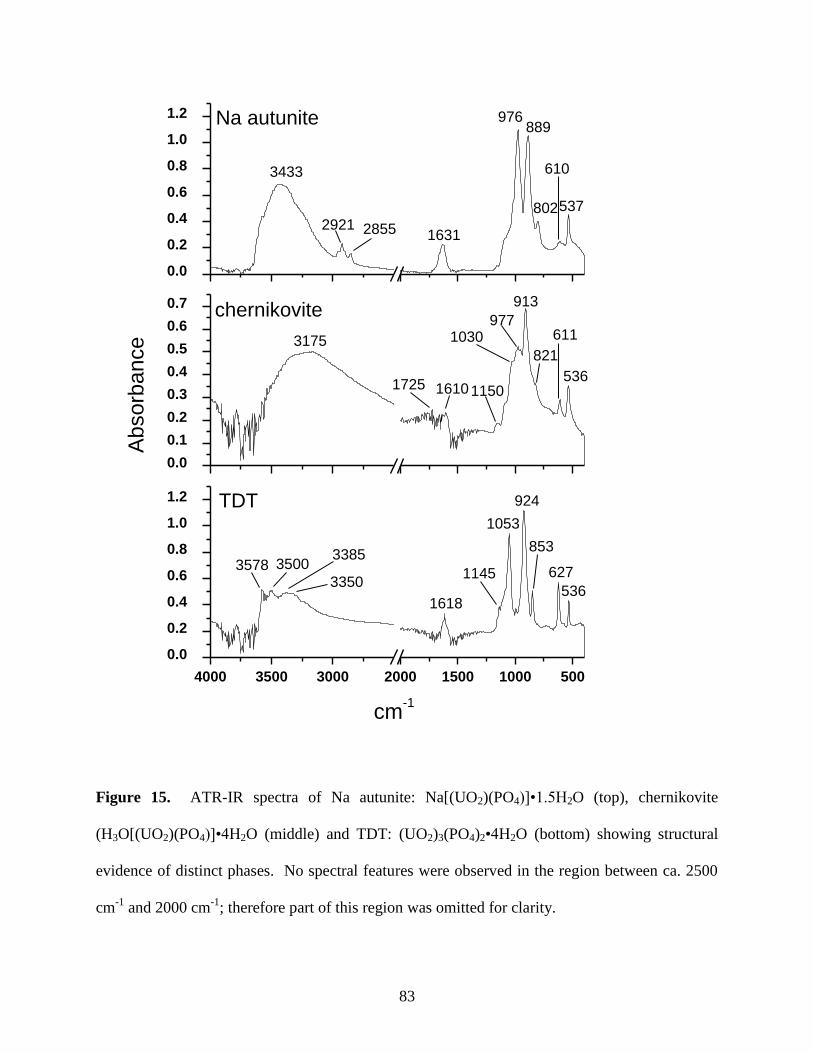
83
4000 3500 3000 2000 1500 1000 500
0.0
0.2
0.4
0.6
0.8
1.0
1.2
3385
536
627
853
924
1053
1145
1618
3350
35003578
TDT
cm-1
0.0
0.1
0.2
0.3
0.4
0.5
0.6
0.7
536
611
821
913
9771030
115016101725
3175
chernikovite
Absorb
ance
0.0
0.2
0.4
0.6
0.8
1.0
1.2
537
610
802
889976
163128552921
3433
Na autunite
Figure 15. ATR-IR spectra of Na autunite: Na[(UO2)(PO4)]•1.5H2O (top), chernikovite
(H3O[(UO2)(PO4)]•4H2O (middle) and TDT: (UO2)3(PO4)2•4H2O (bottom) showing structural
evidence of distinct phases. No spectral features were observed in the region between ca. 2500
cm-1
and 2000 cm-1
; therefore part of this region was omitted for clarity.
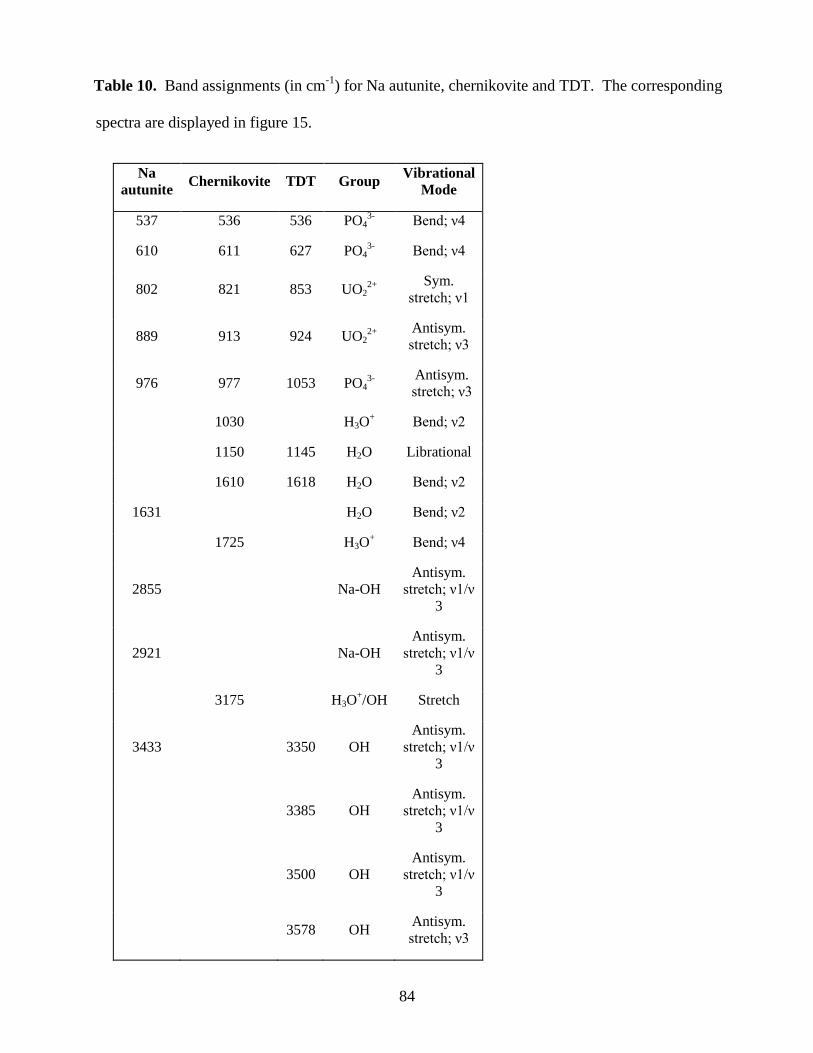
84
Table 10. Band assignments (in cm-1
) for Na autunite, chernikovite and TDT. The corresponding
spectra are displayed in figure 15.
Na
autunite Chernikovite TDT Group
Vibrational
Mode
537 536 536 PO43-
Bend; ν4
610 611 627 PO43-
Bend; ν4
802 821 853 UO22+
Sym.
stretch; ν1
889 913 924 UO22+
Antisym.
stretch; ν3
976 977 1053 PO43-
Antisym.
stretch; ν3
1030 H3O+ Bend; ν2
1150 1145 H2O Librational
1610 1618 H2O Bend; ν2
1631 H2O Bend; ν2
1725 H3O+ Bend; ν4
2855 Na-OH
Antisym.
stretch; ν1/ν
3
2921 Na-OH
Antisym.
stretch; ν1/ν
3
3175 H3O+/OH Stretch
3433 3350 OH
Antisym.
stretch; ν1/ν
3
3385 OH
Antisym.
stretch; ν1/ν
3
3500 OH
Antisym.
stretch; ν1/ν
3
3578 OH Antisym.
stretch; ν3
85
The broad, rather featureless band from ca. 3600 – 3000 cm-1
observed in all three solids is
a combination of many overlapping H-O-H antisymmetric and symmetric stretching vibrations
which is strong evidence of significant H-bonding and multiple H2O bonding environments in
these phases. This arises from structurally nonequivalent water groups in the given unit cell
[12]. In addition to these broad OH stretching vibrational modes in TDT, four relatively sharp
ν3/ν1 OH modes at 3578, 3500, 3385 and 3350 cm-1
provide further insight into the structure of
TDT (figure 15, bottom panel). In contrast to Na autunite and chernikovite, TDT comprises an
interlayer uranyl ion resulting in an open framework structure [18] that has a significant effect on
the location and bonding environment of the interlayer water molecules. In agreement with
Locock and Burns [15], we hypothesize that this open framework structure results in distinct
water populations that are occluded, filling the available space predominantly through hydrogen
bonding to the neighboring polyhedra in the interlayer and in the “sheet”. These distinct,
mutually isolated, water molecules produce relatively sharp OH stretching modes compared to
those observed in Na autunite and chernikovite.
The chernikovite spectrum (figure 15; middle panel) shows ample evidence of the
interlayer hydroxonium ion which affords the most important evidence in distinguishing
chernikovite from Na autunite. First, the broad v1 and v3 stretching modes of H3O+ are
expected at a lower energy than their H2O counterparts [12]. These H3O+ stretching modes are
typically featured at ca. 2500-3500 cm-1
, while the corresponding modes for H2O are observed at
ca. 3200-3600 cm-1
. Thus, the broad band starting at ca. 2500 cm-1
and centered at ca. 3175 cm-1
observed in chernikovite is likely the result of overlapping v1 and v3 bands of H3O+
and H2O. In
contrast, the Na autunite and TDT OH stretching modes appear at significantly higher
wavenumbers (figure 15). Second, and perhaps most conspicuously, the band at ca. 1725 cm-1
86
for chernikovite is most likely the v4 bending mode of H3O+. Overlap with the v2 bending mode
of H2O centered at 1610 cm-1
results in a diminution of band intensity for both the H3O+ and H2O
bending modes. Without H3O+, the H2O bending mode is typically relatively sharp and
symmetric as shown in the TDT and the Na autunite spectra (at 1618 cm-1
and 1631 cm-1
respectively). Third, the weak band at ca. 1030 cm-1
for chernikovite is attributed to the v2
bending mode of H3O+. This vibrational mode is difficult to observe in hydrated uranyl
phosphates [12, 16] since the relatively intense v3 PO4 mode tends to mask the v2 bending mode
of H3O. However, in this sample of chernikovite, the significantly weakened v3 PO4 mode
centered at 977 cm-1
is evidence of significant band overlap between these two modes. Spectral
evidence of H3O+ is therefore a very effective way to delineate chernikovite from other autunites,
since the other non-chernikovite phases exhibit a much sharper v3 PO4 band at ca. 977 cm-1
when H3O+ is not present (see the Na autunite spectrum in figure 15).
The ATR-IR spectrum of the hydrothermally treated Na autunite sample is shown in
figure 5 (top panel). In addition, the band assignments for this phase are shown in table 10.
Clearly the most prominent diagnostic features are evidenced in the appearance of relatively
sharp bands at 2921 cm-1
(with a shoulder at 2955 cm-1
) and at 2855 cm-1
in the Na autunite
spectrum. These features are lower energy vibrational modes than would be expected for typical
water stretching vibrations in these solids; and they are attributed to the Na-OH (νOH) stretching
mode. The Na-OH bond necessarily shifts the electron density of the oxygen donor resulting in a
weakening of the νOH relative to that of H2O. The sharpness of these bands compared to typical
OH stretching modes provides strong evidence that the Na ion is occupying very specific sites in
the interstitial region of the unit cell.
It has been shown that the sodium ion has a significant effect on the vibrational
frequencies of vicinal groups to which it is bonded, mainly via coordinated water, (e.g., UO22+
)
87
in the unit cell of a uranyl compound. For example, in studies of clarkeite:
Na[(UO2)O(OH)]xH2O [17, 18], IR data clearly showed a decrease in the ν3UO2 frequency with
increasing stoichiometric Na. In fact, other workers that studied synthetic clarkeite [19, 20, 21]
were able to roughly predict the amount of Na in the solid based upon the red-shift of ν3 UO2. In
agreement with Baran et al., we also observed a shift to slightly lower ν3 UO2 frequency in the
sodium autunite relative to that of chernikovite and TDT. Thus it appears that an interaction
between the interlayer Na and the structural uranyl is occurring. Accordingly, we propose that
the bands at 2920 cm-1
and 2854 cm-1
are νOH due to bridging between the Na+ and UO2
2+
moieties. Likely the interstitial Na-OH is hydrogen bonded to oxygen in the uranyl square
bipyramid. This bonding scheme accounts for both the presence of Na-OH (νOH) and the
reduced energy in the UO22+
antisymmetric stretch mode in synthetic sodium autunite.
4. Conclusions
For experimental investigations (solubility, sorption, etc) of hydrated uranyl compounds
adequate characterization of the solid is vital. The findings presented herein suggest that this
must include, at minimum, elemental analysis, PXRD, IR spectroscopy and TGA.
For relatively rapid solid phase identification, PXRD is a useful analytical tool. In
addition, PXRD can be used to qualitatively observe degrees of hydration in uranyl compounds.
However, delineating isostructural compounds presents a significant challenge, particularly for
those containing U, since U tends to dominate the XRD pattern. On the other hand, ATR-IR is a
very useful tool in delineating isostructural uranyl compounds since local bonding environments,
i.e., interlayer metal occupancies can be readily elucidated. However, ATR-IR is a surface
technique; and at times it can be difficult to delineate physisorbed water from stoichiometric
88
water in hygroscopic materials. Hence, the complementary use of both PXRD and ATR-IR is
necessary, in addition to elemental analyses, to effectively characterize and delineate hydrated
uranyl minerals and synthetic compounds.
In this report, we showed that variations in hydration have a significant effect on the
patterns observed with powder XRD. We also showed that both isostructural hydrated uranyl
phosphates (i.e., the autunites) and structurally distinct phases (i.e., TDT) exhibit very similar
XRD patterns.
With ATR-IR, we showed that specific bonding environments (e.g., Na-OH), and
components (e.g., H3O+) can be readily elucidated affording a more reliable delineation of
isostructural Na autunite and chernikovite, respectively. In addition, PXRD and ATR-IR data
were compared in delineating chernikovite and TDT – two phases that can be easily confused in
the synthesis process, i.e., one phase can precipitate when the other is intended. Structural
characteristics unique to each phase were exploited with ATR-IR.
Acknowledgements
This work was supported primarily by the U.S. Department of Energy, Basic Energy Sciences,
Heavy Element Chemistry program, contract DE-FG02-06ER15782. In addition, SBC and CRA
gratefully acknowledge support from the Joint Domestic Nuclear Detection Office-National
Science Foundation: Academic Research Initiative (ARI), contract number ECCS-0833548
during the preparation of this manuscript.
89
References
[1] Burns P C 1999 Reviews in Mineralogy Vol. 38 Ed P C Burns and R Finch (Mineralogical
Society of America) 23-86.
[2] Gorman-Lewis D J, Burns P C and Fein J B 2008 J. Chem. Thermodyn. 40 335-52.
[3] Hill F C 1999 Reviews in Mineralogy Vol. 38 Ed P C Burns and R Finch (Mineralogical
Society of America) 653-73.
[4] Pham-Thi M and Colomban P 1985 J. Less-Common Met. 108 189-216.
[4] Thomas A, Dacheux N, Le Coustumer P, Brandel V and Genet M 2001 J. Nucl. Mater. 295
249-64.
[6] Felmy A R, Xia, Y and Wang Z 2005 Radiochim. Acta 93 401-08.
[7] Rai B D, Xia Y, Rao L, Hess N J, Felmy A R, Moore D A and McCready D E 2005 J. Sol.
Chem. 34 469-98.
[8] Suzuki Y, Sato T, Isobe H, Kogure T and Murakami T 2005 Amer. Mineral. 90 1308-14.
[9] Wellman D M 2004 Environmental availability of uranium from secondary uranyl minerals.
(PhD dissertation, Washington State University; Pullman WA, USA).
[10] Sowder A G 1998 The formation, transformation, and stability of environmentally relevant
uranyl mineral phases. (PhD dissertation, Clemson University; Clemson SC, USA).
[11] Hofmeister A M, Keppel E, Bowey J E and Speck A K 2000 Europ. Space Agengy.
Special Pub. 456 343-46.
[12] Cejka J 1999 Reviews in Mineralogy Vol. 38 Ed P C Burns and R Finch (Mineralogical
Society of America) 521-622.
[13] Griffiths P R and de Haseth J A 2007 Fourier Transform Infrared Spectrometry (New York;
John Wiley & Sons, Inc) 529 pp.
[14] Zheng Z, Wan J, Song X and Tetsu T K 2006 Coll. Surfaces. 274 48-55.
[15] Locock A J and Burns P C 2002 J. Sol. State Chem. 163 275-80.
90
[16] Rosiere J Thesis 1973 Universite des Sciences et Technologie du Languedoc (in French)
150 pp.
[17] Siderenko G A 1978 Atom. Moscow. 216 pp. (in Russian)
91
CHAPTER FOUR
The Hydrothermal Transformation of Chernikovite into Triuranyl Diphosphate Tetrahydrate
(TDT)
Christopher R. Armstrong and Sue B. Clark1
Department of Chemistry, Washington State University, Pullman, WA 99164 U.S.A.
E-mail: [email protected]
Abstract. Isostructural hydrated uranyl phosphates, and in particular those that comprise the
autunite mineral family, have been routinely synthesized by manipulating the metal occupancies
in the interstitial region of the compound of interest, while leaving the chemical properties of the
sheet structures intact. Hence, no alteration is intended in the structural unit as the result of these
interlayer ion-exchange processes. However significant, and in some cases inadvertent,
structural changes can occur, particularly when the synthesis conditions (e.g., temperature and
pressure) are altered. In this report we demonstrate the efficacy of using powder x-ray
diffraction (PXRD) and attenuated total reflection infrared (ATR-IR) spectrometry in monitoring
the structural transformation of chernikovite into triuranyl diphosphate tetrahydrate (TDT). We
show that a significant structural change occurs as the result of hydrothermal treatment of well-
aged synthetic chernikovite. We demonstrate that vertex-sharing, square uranyl bipyramids
convert to edge-sharing pentagonal bipyramids suggesting that, under elevated temperature and
pressure conditions, the latter structural conformation is more stable. These results underscore
1 Corresponding author: Tel: 01-509-335-1411; fax: 01-509-335-8867. E-mail: [email protected]
92
the importance of rigorously characterizing synthetic uranyl compounds before and after
hydrothermal treatment; since neglecting to do so can result in highly erroneous experimental
(solubility, sorption etc) interpretations.
93
1. INTRODUCTION
Hydrated uranyl phosphates belonging to the autunite mineral family are common in nature,
particularly in uraniferous alkali igneous rocks containing accessory apatites (Langmuir, 1978).
These autunites typically form as the result of chemical weathering (i.e., macroscale dissolution
of bulk rock matrices), oxidation of U4+
to UO22+
and subsequent uranyl phosphate precipitation
throughout a wide pH range. Due to their relatively low solubility, autunites are the most
common uranium minerals in arid, oxidizing regions (Nininger, 1954).
In addition to the ubiquity of naturally-occurring autunites, these phases are also
commonly formed by anthropogenic means. At the Hanford site in WA, between 1944 and 1951
roughly 5000 short tons of uranium were recovered from bismuth phosphate processing wastes.
These materials were neutralized, subsequently precipitated as predominantly Na autunite
[Na(UO2)(PO4)•xH2O], and held in underground storage tanks (Felmy et al., 2005). However it
has been since discovered that these suspensions have leaked from the storage tanks into the
surrounding subsurface (Womack et al., 1971) and the chemistry of these solids is not well
understood. As such, fundamental experimental studies, i.e., structural, thermodynamic, are
required of these solid-solution systems thus affording insights into the environmental fate U in
groundwater systems where these anthropogenic processes have taken place.
Owing to their isostructural properties, a variety of end member autunites have been
synthesized from one starting material, namely chernikovite: H3O(UO2)(PO4)•xH2O. Van
Haverbeke et al. (1996) prepared meta-ankoleite [K(UO2)(PO4)•3H2O] via ion exchange between
hydronium and potassium by refluxing synthetic chernikovite several times in a 1M KCl
solution. In a similar manner, Vochten (1990) reported the transformation of both chernikovite
and sodium autunite [Na(UO2)(PO4)•8H2O] into lehnerite [Mn(UO2)2(PO4)2•8H2O]. In fact,
Vochten et al. reported a series of ion-exchange syntheses involving uranyl phosphates and the
94
chemically analogous uranyl arsenates by using chernikovite (and the chemically analogous
arsenate) as the starting material in the preparation of meta-zeunerite [Cu(UO2)2(AsO4)2•8H2O]
(Vochten and Goeminne, 1984), meta-kirchheimerite [Co(UO2)2(AsO4)2•8H2O] (Vochten and
Goehminne, 1984), bassetite [Fe(UO2)2(PO4)2•8H2O] (Vochten et al., 1984) and kahlerite
[Fe(UO2)2(AsO4)2•12H2O].
All of the aforementioned studies involved the manipulation of the interlayer by the
simple exchange of interstitial metals. No structural transformation was reported and in many of
these studies it is not clear whether the sample was monitored for structural changes during
hydrothermal reaction, i.e., reacting the suspension in a Parr bomb at elevated temperature.
In this contribution we present data using a variety of analytical techniques including
attenuated total reflection infrared (ATR-IR) spectrometry, powder x-ray diffraction (PXRD),
and thermogravimetric analysis (TGA). We demonstrate that a fundamental reorganization of
the chernikovite unit cell takes place, resulting in the structurally distinct triuranyl diphosphate
tetrahydrate (TDT) due to hydrothermal reaction. These findings suggest that hydrothermal
treatment may not only increase the crystallinity of uranyl compounds, but also may result in
significant structural modifications. As such, these findings convey the importance of properly
characterizing these uranyl compounds before and after hydrothermal treatment to monitor
structural changes, something that has not been done sufficiently in the past. Such structural
conversions may be a previously unconsidered source of error in solubility studies of uranyl
compounds.
95
2. EXPERIMENTAL MATERIALS AND METHODS
2.1. Chemicals
All chemicals are reagent grade or higher. Doubly deionized 18MΩ and boiled water (DDI) was
used in preparations of all solutions. Standards used for ICP-OES analyses were 99.9% purity.
2.2. Synthetic and natural compounds
The pH was measured with a ThermoElectron Corp. Orion 4 Star pH meter equipped with a Ross
combination pH electrode (Orion Model 8102). Prior to each use, the pH electrode was
calibrated with NIST standards. For hydrothermal reactions, 23- and 45-mL Teflon®
liners were
placed inside stainless steel Parr acid digestion bombs.
2.2.1. Synthetic chernikovite: H3O[(UO2)(PO4)]∙2.5H2O (c)
Microcrystalline chernikovite was synthesized by mixing stoichiometric volumes of 0.7 M
H3PO4 and 0.05 M UO2(NO3)2·6H2O in a jacketed reaction vessel under N2 atmosphere at 40oC
(± 0.1). The suspension was stirred overnight at 40oC and subsequently allowed to settle at
40oC. The settled suspension was subsequently mixed and the suspension (chernikovite and its
mother liquor) was placed in a 125 mL polypropylene bottle, sealed and stored in the dark and
allowed to age for 4 months. The mixed suspension was then vacuum- filtered through 0.45-µm
Millipore membranes, rinsed three times with boiling DIW, covered and dried overnight at 30oC.
Solids were crushed with a mortar and pestle and sieved (sieve number 100) to an approximate
150 µm particle size.

96
2.3. Elemental Analysis
For all of the solid phases in this study, duplicate solid samples of roughly 10 mg were digested
in concentrated nitric acid and diluted to 100 mL in a volumetric flask with boiled 18MΩ water.
These duplicate digest samples were subsequently analyzed for dissolved metal content with a
Perkin-Elmer Optima 3200 axial torch ion-coupled optical emission spectrometer (ICP-OES)
with a precision of approximately 5%. For all samples, three replicate intensities were recorded
from which the average and standard deviation was calculated (Table 11).
Table 11. Analytes and corresponding wavelengths and ICP detection limits in this study.
Analyte Emission
line (nm)
Detection
Limit
(mg/L)
1σ
P 213.617 0.08 0.03
U 367.007 0.30 0.02
2.4. Thermogravimetric Analyses (TGA)
To quantify the degree of hydration in the uranyl phosphates studied herein, TGA experiments
were conducted using a Perkin-Elmer TGA-7 instrument. The TGA was calibrated with a 10 mg
standard weight furnished by Perkin-Elmer. Powdered samples of approximately 10 mg were
analyzed inside a platinum pan. In all cases, the scan rate was 10oC/min and the experimental
temperature ranged from 25oC to 500
oC. All of the uranyl phosphates were analyzed in
triplicate; and in every case excellent agreement was observed between replicate runs resulting in
an experimental uncertainty of less than 1%.
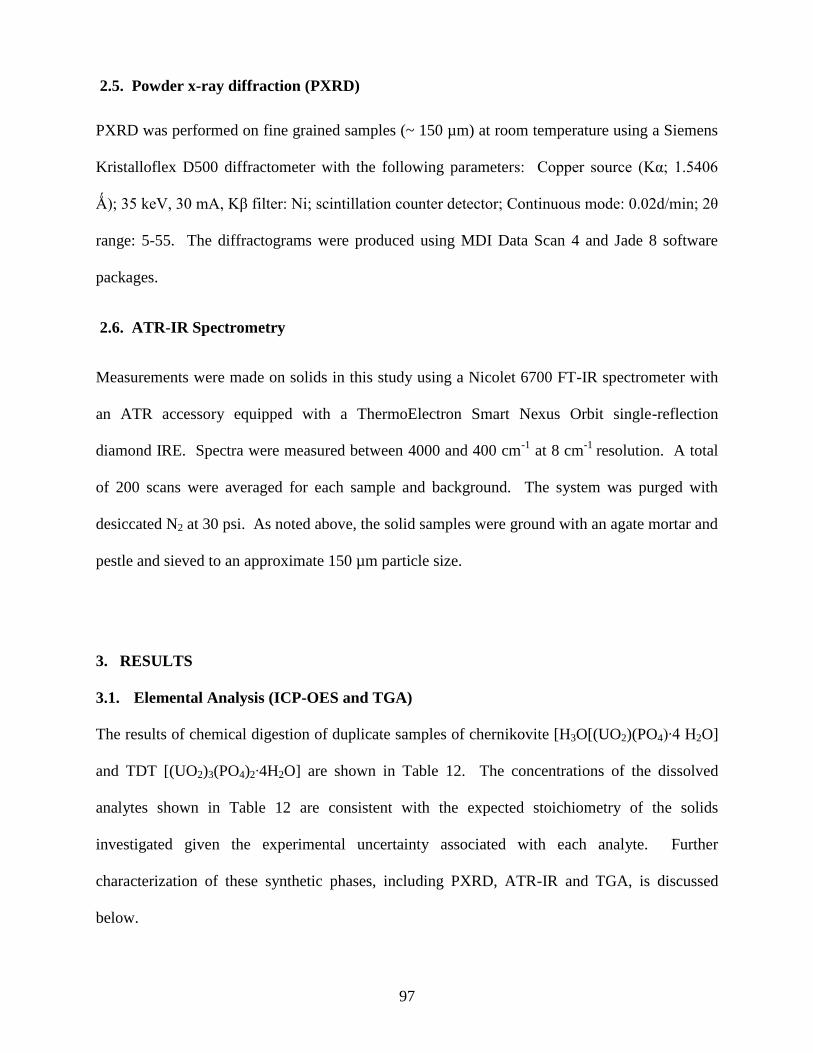
97
2.5. Powder x-ray diffraction (PXRD)
PXRD was performed on fine grained samples (~ 150 µm) at room temperature using a Siemens
Kristalloflex D500 diffractometer with the following parameters: Copper source (Kα; 1.5406
Ǻ); 35 keV, 30 mA, Kβ filter: Ni; scintillation counter detector; Continuous mode: 0.02d/min; 2θ
range: 5-55. The diffractograms were produced using MDI Data Scan 4 and Jade 8 software
packages.
2.6. ATR-IR Spectrometry
Measurements were made on solids in this study using a Nicolet 6700 FT-IR spectrometer with
an ATR accessory equipped with a ThermoElectron Smart Nexus Orbit single-reflection
diamond IRE. Spectra were measured between 4000 and 400 cm-1
at 8 cm-1
resolution. A total
of 200 scans were averaged for each sample and background. The system was purged with
desiccated N2 at 30 psi. As noted above, the solid samples were ground with an agate mortar and
pestle and sieved to an approximate 150 µm particle size.
3. RESULTS
3.1. Elemental Analysis (ICP-OES and TGA)
The results of chemical digestion of duplicate samples of chernikovite [H3O[(UO2)(PO4)∙4 H2O]
and TDT [(UO2)3(PO4)2∙4H2O] are shown in Table 12. The concentrations of the dissolved
analytes shown in Table 12 are consistent with the expected stoichiometry of the solids
investigated given the experimental uncertainty associated with each analyte. Further
characterization of these synthetic phases, including PXRD, ATR-IR and TGA, is discussed
below.

98
Table 12. Chemical digestion data for well-aged chernikovite and chernikovite-derived TDT.
Water content was determined by taking the average and standard deviation of triplicate TGA
runs (Na autunite).
Chernikovite Concentration
(M) 1 σ Molar Ratio
UO22+
4.98•10-4
3.19•10-6
1.02
PO43-
4.89•10-4
5.99•10-7
1.00
H2O 2.01•10-3
4.54•10-6
4.12
TDT Concentration
(M) 1 σ Molar Ratio
UO22+
3.14•10-4
1.26•10-5
2.95
PO43-
2.13•10-4
3.07•10-6
2.00
H2O 4.47•10-4
1.08•10-6
4.20
As noted above, the molar proportions of H2O for each of these phases was determined
via TGA. Experiments were conducted from 25 – 500oC at a 10
oC/min scan rate; and the
temperature profiles of Na autunite, chernikovite and TDT are shown in Fig. 16. Plateau regions
observed at the highest temperature indicates that all water has been expelled from the solids. In
all cases, excellent agreement is observed between replicate TGA runs (< 1% uncertainty).
Gradual water loss is observed in chernikovite at relatively low temperature, while the
TDT temperature profile features a plateau from 25oC to ca. 83
oC. This suggests that a smaller
weight percentage of physisorbed water is associated with TDT relative to chernikovite as this
latter phase undergoes the most sizeable dehydration in terms of weight percent losing most of
its water by 125oC; however the sharpest event occurs between ca. 40 to 75
oC. In addition, the
TDT profile exhibits a dehydration event at ca. 240oC that is not evident in chernikovite
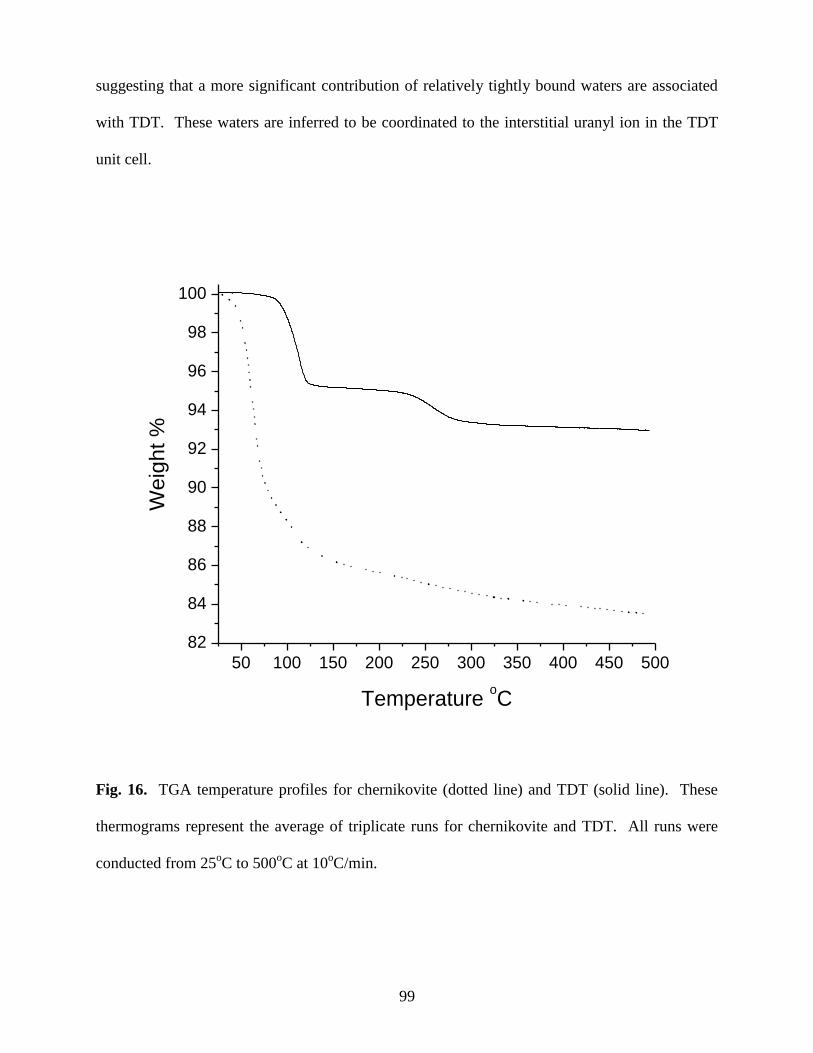
99
suggesting that a more significant contribution of relatively tightly bound waters are associated
with TDT. These waters are inferred to be coordinated to the interstitial uranyl ion in the TDT
unit cell.
50 100 150 200 250 300 350 400 450 500
82
84
86
88
90
92
94
96
98
100
Weig
ht %
Temperature oC
Fig. 16. TGA temperature profiles for chernikovite (dotted line) and TDT (solid line). These
thermograms represent the average of triplicate runs for chernikovite and TDT. All runs were
conducted from 25oC to 500
oC at 10
oC/min.
100
3.2. PXRD analysis
Synthetic chernikovite prepared in this laboratory is in very good agreement with PDF# 29-0670
as shown in Fig. 17. However, three relatively weak peaks are present in our synthethic sample
that are not conspicuous in PDF# 29-0670 at ca. 19.5, 32.9 and 36.0 2-theta degrees.
Interestingly, these peaks are present in another published XRD pattern of synthetic chernikovite,
PDF#08-0296 (not shown). Thus only one weak peak (at ca. 29.15) is not associated with
published patterns of synthetic chernikovite. The reason for the location of this peak is unclear
and it could be the result of a minor impurity.
10 20 30 40 50
0
100
200
300
400
500
600
700
Inte
nsity (
a.u
.)
2-theta
Fig. 17. Powder XRD diffractograms of the well-aged chernikovite synthesized by the author
(most intense diffractogram in black) and the published PDF # 29-0670 (lower profile in grey)
for synthetic chernikovite.
101
The XRD pattern of the chernikovite-derived TDT is shown in Fig. 18. Although PDFs
cannot be directly compared to the PXRD pattern of TDT due to the latter’s marked intensity,
the tabulated 2-theta and d-spacing values of this TDT phase (not shown) are in very good
agreement with PDF# 54-0773 and 37-0369 (Fig. 18). Note: the tabulated 2-theta and d-
spacing values for all the synthetic phases in this study are available from the authors upon
request. The marked intensity of the TDT suggests that it is highly crystalline; and it is clear
that the transformation from chernikovite into TDT is complete. Considering the similarity of
XRD patterns of hydrated uranyl phosphates, the difference between the well-aged chernikovite
(Fig. 17) and the end-product TDT is rather striking.
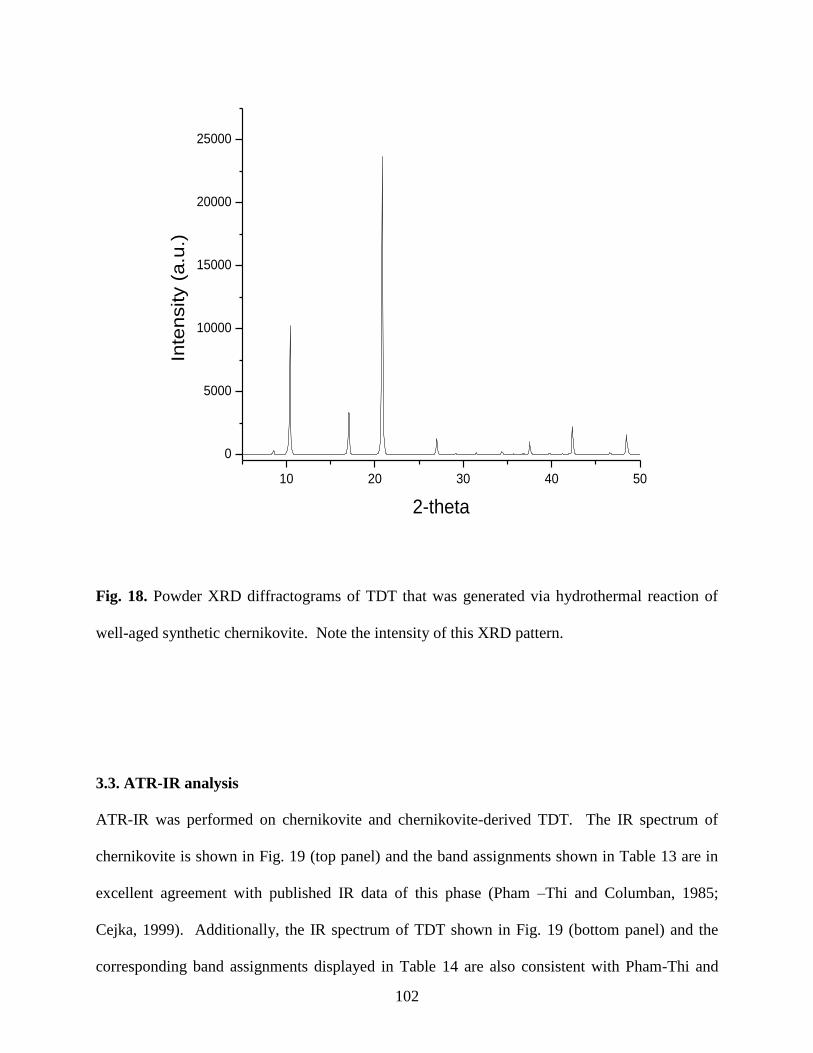
102
10 20 30 40 50
0
5000
10000
15000
20000
25000
Inte
nsity (
a.u
.)
2-theta
Fig. 18. Powder XRD diffractograms of TDT that was generated via hydrothermal reaction of
well-aged synthetic chernikovite. Note the intensity of this XRD pattern.
3.3. ATR-IR analysis
ATR-IR was performed on chernikovite and chernikovite-derived TDT. The IR spectrum of
chernikovite is shown in Fig. 19 (top panel) and the band assignments shown in Table 13 are in
excellent agreement with published IR data of this phase (Pham –Thi and Columban, 1985;
Cejka, 1999). Additionally, the IR spectrum of TDT shown in Fig. 19 (bottom panel) and the
corresponding band assignments displayed in Table 14 are also consistent with Pham-Thi and
103
Columban (1985). Moreover, the IR data for this TDT phase (derived from chernikovite) is also
in line with TDT synthesized by another method in a related study conducted in our laboratory
(see Chapter One of this dissertation), thereby providing further evidence that complete
conversion from chernikovite to TDT has taken place.
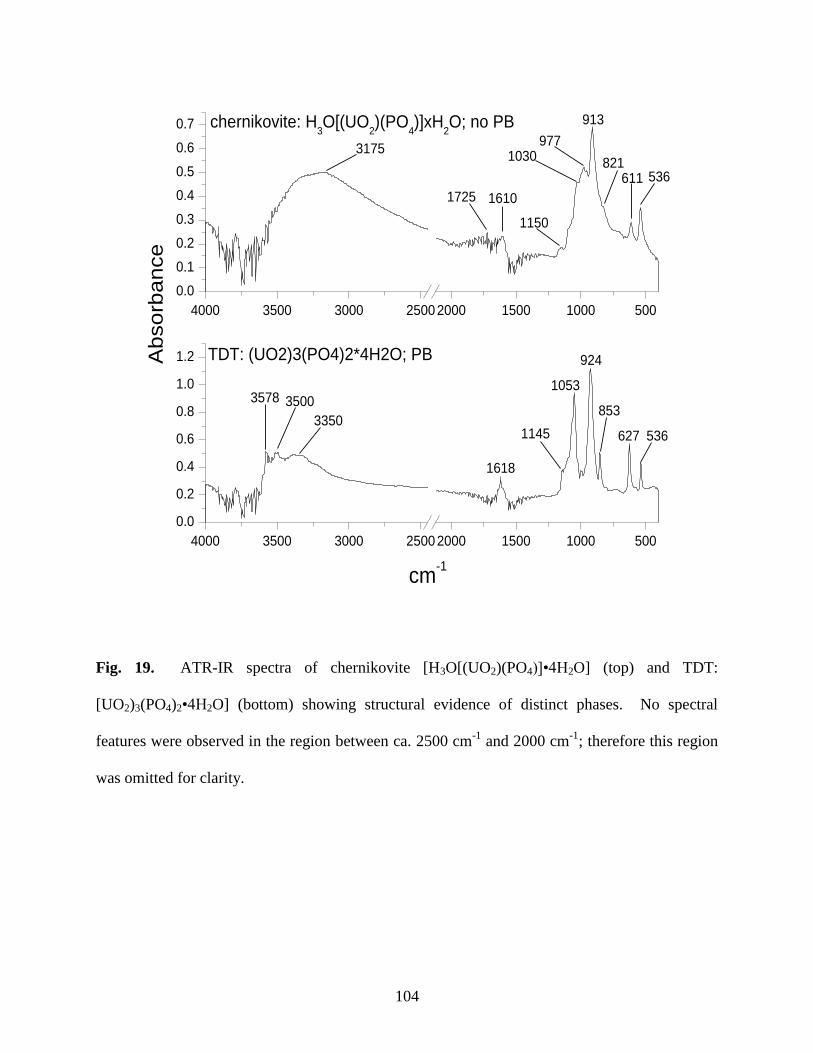
104
4000 3500 3000 25002000 1500 1000 500
0.0
0.2
0.4
0.6
0.8
1.0
1.2
536627
853
924
1053
1145
1618
3350
35003578
TDT: (UO2)3(PO4)2*4H2O; PBAbso
rban
ce
cm-1
4000 3500 3000 25002000 1500 1000 500
0.0
0.1
0.2
0.3
0.4
0.5
0.6
0.7
31751030
536611821
913
977
1150
16101725
chernikovite: H3O[(UO
2)(PO
4)]xH
2O; no PB
Fig. 19. ATR-IR spectra of chernikovite [H3O[(UO2)(PO4)]•4H2O] (top) and TDT:
[UO2)3(PO4)2•4H2O] (bottom) showing structural evidence of distinct phases. No spectral
features were observed in the region between ca. 2500 cm-1
and 2000 cm-1
; therefore this region
was omitted for clarity.
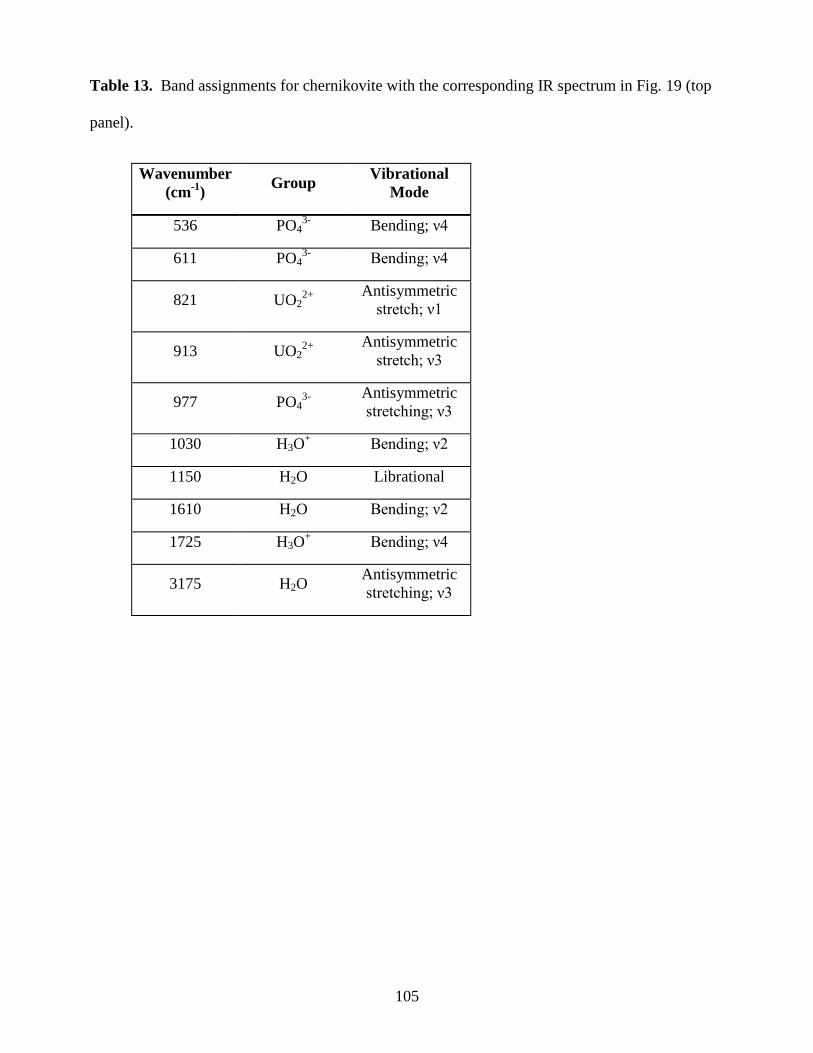
105
Table 13. Band assignments for chernikovite with the corresponding IR spectrum in Fig. 19 (top
panel).
Wavenumber
(cm-1
) Group
Vibrational
Mode
536 PO43-
Bending; ν4
611 PO43-
Bending; ν4
821 UO22+
Antisymmetric
stretch; ν1
913 UO22+
Antisymmetric
stretch; ν3
977 PO43-
Antisymmetric
stretching; ν3
1030 H3O+ Bending; ν2
1150 H2O Librational
1610 H2O Bending; ν2
1725 H3O+ Bending; ν4
3175 H2O Antisymmetric
stretching; ν3
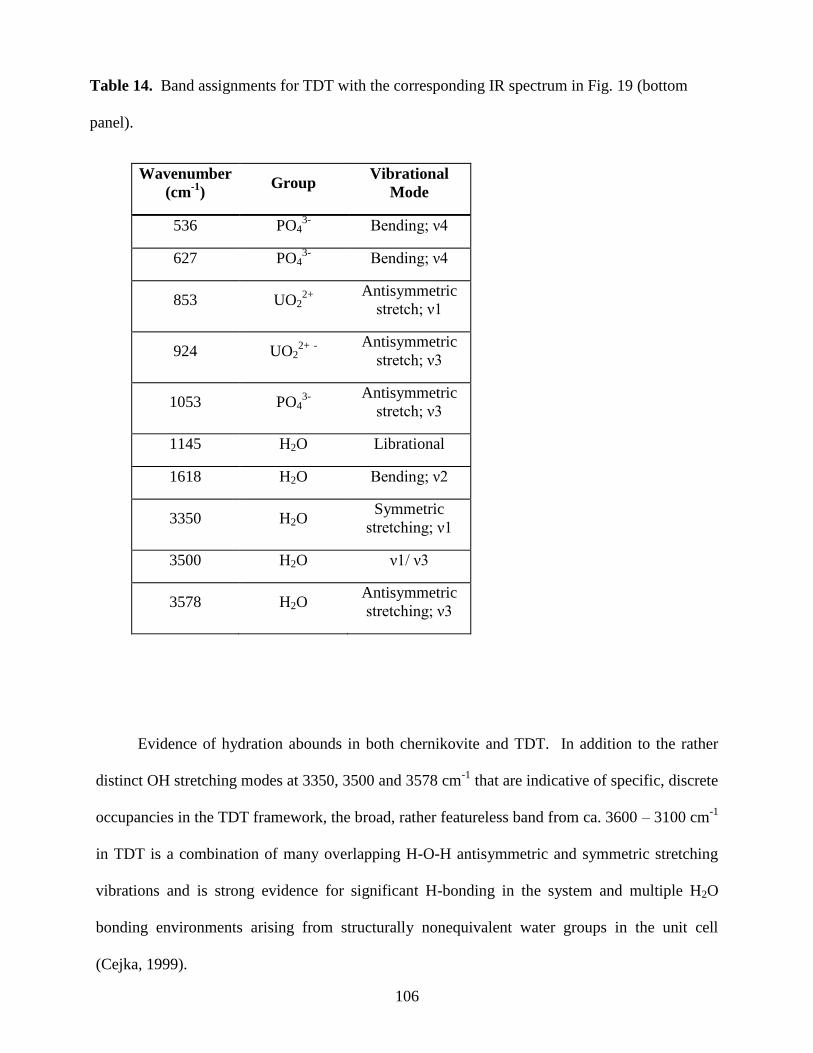
106
Table 14. Band assignments for TDT with the corresponding IR spectrum in Fig. 19 (bottom
panel).
Wavenumber
(cm-1
) Group
Vibrational
Mode
536 PO43-
Bending; ν4
627 PO43-
Bending; ν4
853 UO22+
Antisymmetric
stretch; ν1
924 UO22+
-
Antisymmetric
stretch; ν3
1053 PO43-
Antisymmetric
stretch; ν3
1145 H2O Librational
1618 H2O Bending; ν2
3350 H2O Symmetric
stretching; ν1
3500 H2O ν1/ ν3
3578 H2O Antisymmetric
stretching; ν3
Evidence of hydration abounds in both chernikovite and TDT. In addition to the rather
distinct OH stretching modes at 3350, 3500 and 3578 cm-1
that are indicative of specific, discrete
occupancies in the TDT framework, the broad, rather featureless band from ca. 3600 – 3100 cm-1
in TDT is a combination of many overlapping H-O-H antisymmetric and symmetric stretching
vibrations and is strong evidence for significant H-bonding in the system and multiple H2O
bonding environments arising from structurally nonequivalent water groups in the unit cell
(Cejka, 1999).

107
In addition to the strong indications of hydration (3175 and 1610 cm-1
), the chernikovite
spectrum also shows ample evidence of the interlayer hydroxonium ion. Firstly, the v1 and v3
stretching modes of H3O+ are typically lower energy vibrations than their H2O counterparts.
Hence, these H3O+ stretching modes are observed at ca. 2500-3500 cm
-1, while the
corresponding modes for H2O are observed at ca. 3200-3600 cm-1
. Thus, the broad, rather non-
descript feature starting at ca. 2500 cm-1
and centered at ca. 3175 cm-1
is likely the result of
overlapping v1 and v3 bands of both H3O+
and H2O. In contrast, the TDT spectrum features a
considerably more gradual increase in intensity beginning at a higher wavenumber. Secondly,
and perhaps most conspicuously, the band at ca. 1725 cm-1
is most likely the v4 bending mode of
H3O+. Overlap with the v2 bending mode of H2O centered at 1610 cm
-1 results in a diminution
of band intensity for both the H3O+ and H2O bending modes. Without H3O
+, the H2O bending
mode is typically relatively sharp and symmetric as shown in the TDT spectrum at 1618 cm-1
(bottom spectrum). Lastly, the weak band at ca. 1030 cm-1
is attributed to the v2 bending mode
of H3O+. This vibrational mode is difficult to observe in hydrated uranyl phosphates (Rosiere,
1973; Cejka, 1999) since the relatively intense v3 PO4 mode tends to mask the v2 bending mode
of H3O. However, in this sample of chernikovite, the significantly weakened v3 PO4 mode
centered at 977 cm-1
is evidence of significant band overlap between these two modes.
In addition to very broad features resulting from the overlap of several symmetric and
antisymmetric OH stretching vibrations, highly resolved water modes are observed in both the
chernikovite and TDT spectra. These are attributed to atmospheric H2O as evidenced by the
narrow bands in the bending and stretching regions of water. Additionally, the high resolution,
high energy bands centered at ca. 3790 cm-1
are also attributed to atmospheric water. As noted
above, surface water present in hygroscopic solids is readily observable with ATR-IR, typically
108
resembling water vapor, particularly when high resolution scans (≤ 8 cm-1
) are conducted and no
spectral smoothing is employed.
4. DISCUSSION
Chemical digestion, PXRD and IR data provide clear evidence of the structural transformation of
chernikovite into TDT. As noted above, chernikovite has been used as a starting material in the
subsequent synthesis of other autunite phases via interlayer cation exchange. However, these
studies involved simply the manipulation of the interlayer by substituting more favorable cations,
presumably due to either stronger electrostatic affinity of divalent metals relative to H3O+, or a
much higher concentration of the exchanging ion. Our results suggest a transformation within
the structural unit and a concomitant configurational change in the uranyl ion from a square to a
pentagonal bipyramid, as described in detail below.
4.1. Transformation of chernikovite into TDT
It has been suggested that under certain conditions, the edge-sharing configuration between
adjacent pentagonal uranyl bipyramids may be more stable than the vertex-sharing uranyl square
bipyramids and phosphate tetrahedra. A recent single crystal XRD study of synthetic uranyl
phosphates and arsenates by Alekseev et al. (2008) proposed a structural pathway whereby
vertex-sharing uranyl square bipyramids and phosphate tetrahedra transform into edge-sharing
pentagonal uranyl bipyramids and phosphate tetrahedra (Fig. 20). Interestingly, this structural
transformation comprises a uranyl polyhedral reorganization from square to pentagonal
bipyramids. Alekseev et al., 2008 asserted that the hydrational state, i.e., the various roles of
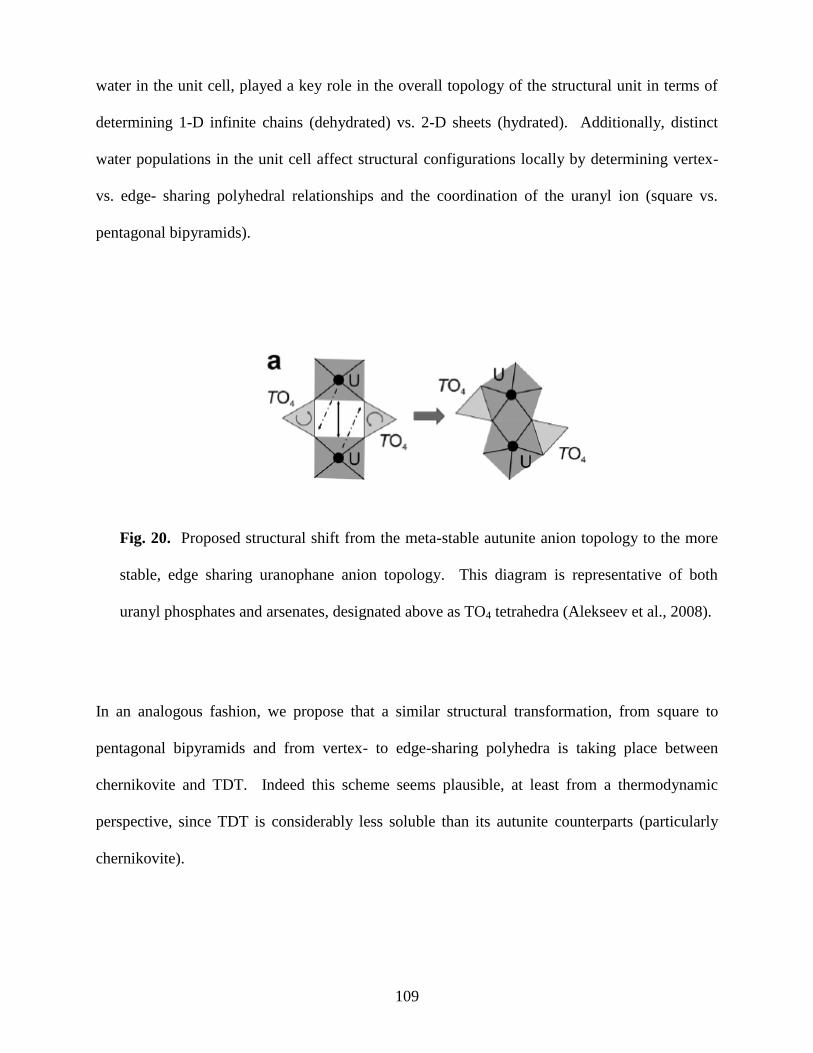
109
water in the unit cell, played a key role in the overall topology of the structural unit in terms of
determining 1-D infinite chains (dehydrated) vs. 2-D sheets (hydrated). Additionally, distinct
water populations in the unit cell affect structural configurations locally by determining vertex-
vs. edge- sharing polyhedral relationships and the coordination of the uranyl ion (square vs.
pentagonal bipyramids).
Fig. 20. Proposed structural shift from the meta-stable autunite anion topology to the more
stable, edge sharing uranophane anion topology. This diagram is representative of both
uranyl phosphates and arsenates, designated above as TO4 tetrahedra (Alekseev et al., 2008).
In an analogous fashion, we propose that a similar structural transformation, from square to
pentagonal bipyramids and from vertex- to edge-sharing polyhedra is taking place between
chernikovite and TDT. Indeed this scheme seems plausible, at least from a thermodynamic
perspective, since TDT is considerably less soluble than its autunite counterparts (particularly
chernikovite).
110
5. Conclusion
Chemical digestion (Table 12), PXRD (Figs. 12 and 18) and IR data (Fig. 19) confirmed the
transformation of chernikovite into TDT due to hydrothermal treatment. This finding suggests
that, under the conditions of this study, edge-sharing uranyl pentagonal bipyramids present in the
TDT structural unit are more stable than the corresponding chernikovite structural conformation,
which comprises vertex-sharing uranyl square bipyramids. This study underscores the
importance of rigorously characterizing synthetic uranyl compounds, particularly solids that are
placed in a Parrbomb (at elevated temperature and pressure), since such treatment can result in
the synthesis of a vastly different compound.
Acknowledgements
At Washington State University, this work was supported primarily by the U.S. Department of
Energy, Basic Energy Sciences, Heavy Element Chemistry program, contract DE-FG02-
06ER15782. In addition, SBC and CRA gratefully acknowledge support from the Joint
Domestic Nuclear Detection Office-National Science Foundation: Academic Research Initiative
(ARI), contract number ECCS-0833548 during the preparation of this manuscript. We also
thank Dr. Louis Scudiero (WSU) for his assistance with TGA and DSC analyses and the WSU
geological department for allowing CRA to use the XRD.
111
References
Langmuir, D. Geochim. Cosmochim. Acta., 1978, 42, 547-569.
Nininger, R.D. Minerals for Atomic Energy, 1954, Van Nostrand.
Felmy, A.R., Xia, Y., Wang, Z. Radiochim. Acta, 2005, 93, 401-408.
Womack, J.C., Larkin, D.J. Investigation and evaluation of 102-BX tank leak. ARH-2035, 1971,
Richland, WA, USA.
Van Haverbeke, L., Vochten, R., Van Springel, K. Mineral. Mag., 1996, 60, 759-766.
Vochten, R. Amer. Mineral., 1990, 75, 221-225.
Vochten, R. and Goeminne, A. Phys. Chem. Minerals, 1984, 11, 95-100.
Vochten, R., De Grave, E., Pelsmaekers, J. Amer. Mineral., 1984, 69, 967-978.
Pham-Thi, M., Colomban, Ph. J. Less-Common Met., 1985, 189-216.
Cejka, J. Reviews in Mineralogy Vol. 38., Eds. Burns, P.C., Finch, R. 1999, 522-622.
Alekseev, E.V., Krivovichek, S.V., Malcherek, T., Depmeier, W. J. Sol. State Chem., 2008.
Rosiere, J. Thesis. Universite des Sciences et Technologie du Languedoc., 1973, 150 pp.
112
CHAPTER FIVE
Solubility of triuranyl diphosphate tetrahydrate (TDT) and Na autunite at 23oC and 50
oC
Christopher R. Armstrong1, Andrew R. Felmy
2 and Sue B. Clark
2*
1Washington State University, Pullman, WA 99164, U.S.A.
2Pacific Northwest National Laboratory, Richland, WA 99354, USA
Autunite / U(VI) phosphate minerals / Actinide contaminant remediation
Summary. In this report we present experimental solubility data for well-characterized triuranyl
diphosphate tetrahydrate (TDT: (UO2)3(PO4)2∙4H2O)) and Na autunite (Na[UO2PO4]∙xH2O) at
23oC and 50
oC in NaClO4-HClO4 solutions at pCH+ = 2. Duplicate samples of TDT in 0.1, 0.5,
1.0, 2.0 and 5.0 m were equilibrated at 23oC and 50
oC. TDT solid was synthesized and
characterized with ICP-OES, ATR-IR and powder XRD before and after solubility experiments.
The pH of the suspension was monitored throughout the experiments. Equilibrium was achieved
from undersaturation with respect to TDT and Na autunite. Steady-state conditions were
achieved in all cases within 82 days. TDT was unstable at ionic strengths above 0.1 m, where
the complete conversion to Na autunite was observed. The ion-interaction model was used to
interpret the experimental solubility data. The solubility product, log Ksp, for TDT was
determined to be -49.7 and -51.3 at 23oC and 50
oC respectively. Log Ksp for Na autunite was
determined to be -24.4 (23oC) and -24.1 (50
oC).
* Corresponding author: Tel: 01-509-335-1411; fax: 01-509-335-8867. Email: [email protected]
113
1. INTRODUCTION
Uranyl phosphates occur both naturally, in the vicinity of uraniferous alkali igneous rocks
containing accessory apatite [1], and by anthropogenic means, where the interaction of U with
either (i) apatite [2, 3, 4], or (ii) aqueous polyphosphates [5] results in the precipitation of these
refractory phases. Consequently, several experimental studies have been conducted on the
solubility of hydrated uranyl phosphates [6, 7, 8, 9]. These thermodynamic data (e.g., log Ksp)
for relatively simple actinide-ligand systems assist in predicting the fate of f-elements in aquifer
systems over a geological timescale. However, thermodynamic data obtained from experimental
solubility studies of similar U6+
solids yield log Ksp values that are in some cases highly disparate
[10]. Slight physico-chemical variations in the solid (e.g., degree of crystallinity, particle size,
natural vs. synthetic sample, chemical impurities etc.) can lead to very different results.
Moreover, quantification of the aqueous hydrogen concentration is often conducted improperly,
leading to significantly erroneous results. In addition, inadequate characterization of both the
initial solid and the final equilibrated phase render the correct interpretation of experimental
results a challenge. In previous studies, we have shown that under favorable conditions,
complete structural transformation of one hydrated uranyl phosphate into another occurs [11].
This finding stresses the importance of rigorously characterizing both the starting material and
the end product, particularly in thermodynamic studies that involve variations in the physico-
chemical conditions of the aqueous systems, e.g., temperature and/or ionic strength.
The main goal of this contribution is to determine the temperature dependence of TDT
((UO2)3(PO4)2∙4H2O) and Na autunite (Na[UO2PO4]∙xH2O) solubilities. Experimental
thermodynamic studies have been carried out at room temperature (23oC ±1) and a moderately
elevated temperature (50oC ±0.5) ranging in ionic strength from 0.1 m to 5.0 m. One aim of this
present study is to conduct a thorough characterization of both the starting material and the end

114
product in solubility studies with varying ionic strength and temperature. To our knowledge
these thermodynamic investigations of TDT and Na autunite at elevated temperature are the first
to be reported.
2. MATERIALS AND METHODS
2.1 Chemicals
All chemicals are reagent grade or higher. Deionized (18 MΩ) and boiled water (DIW) was used
in preparations of all solutions. Standards used for ICP-OES analyses were 99.9% purity.
Concentrations of HClO4 were verified by duplicate potentiometric titrations with standardized
base solutions. A Metrohm pH meter (Model 713) equipped with a Ross combination pH
electrode (Orion Model 8102) was used to measure the electromotive force (EMF). Prior to each
use, the pH electrode was calibrated with NIST standards.
2.2 Experimental Set-Up
Experiments were carried out in 125 mL high density polyethylene bottles under room
temperature conditions (23oC ±1). For all of the samples, approximately 50 mg of solid was
mixed with 50 g of DIW. The ionic strength was varied using 99.8% NaClO4 and the initial
pCH+ (negative log of hydrogen ion molality) was adjusted with 99% HClO4. Duplicate samples
were shaken continuously at 200 rpm using a circulating table. At selected time intervals, mixed
suspensions were extracted and centrifuged using a Thermo Electron Sorvall Discovery M150
SE Ultracentrifuge at 120k rpm (7 minutes acceleration; 6 minutes at 120k rpm; 1 min
deceleration). Duplicates of the supernatant were extracted, acidified with concentrated HNO3,
115
diluted with degassed DIW and placed in 15 mL polypropylene centrifuge tubes and
subsequently analyzed with a Perkin-Elmer Optima 3200 axial torch inductively-coupled plasma
optical emission spectrometer (ICP-OES) for total U and P concentrations. Three replicates were
completed for each analyte with the ICP, and the resulting concentrations were estimated from
the calibration curves. The associated error was calibration, the quality control samples, the
triplicate ICP readings, and the duplicate samples.
For solubility experiments conducted at 50oC, a ThermoElectron shaking and circulating
water bath was used, and the temperature variability was ± 0.5 o
C. These samples were also
constantly agitated at 200 rpm.
Attenuated total reflection infrared (ATR-IR) measurements were made on solids in this
study using a Nicolet 6700 FT-IR spectrometer with an ATR accessory equipped with a
ThermoElectron Smart Nexus Orbit single-reflection diamond IRE. Spectra were measured
between 4000 and 400 cm-1
at 8 cm-1
resolution. A total of 200 scans were averaged for each
sample and background. The system was purged with desiccated N2 at 30 psi. As noted above,
the solid samples were ground with an agate mortar and pestle and sieved to an approximate 150
µm particle size.
Powder x-ray diffraction (PXRD), was performed on fine grained samples (~ 150 µm) of
TDT at room temperature using a Siemens Kristalloflex D500 diffractometer with the following
parameters: Copper source (Kα; 1.54018 Ǻ); 35 keV, 30 mA, Kβ filter: Ni; scintillation counter
detector; Continuous mode: 0.02d/min; 2θ range: 5-55. The diffractograms were produced using
MDI Data Scan 4 and Jade 8 software packages. No background corrections or smoothing was
applied.
116
2.3 TDT Characterization
2.3.1 Triuranyl diphosphate tetrahydrate (TDT) synthesis
Microcrystalline TDT ((UO2)3(PO4)2∙4H2O) was synthesized according to the modified method
of Rai et al. [8]. Rigorous characterization of TDT including elemental analysis, PXRD,
thermogravimetric analysis (TGA), differential scanning calorimetry (DSC), ATR-IR and Raman
spectroscopy has been carried out in this laboratory in a separate study [11].
2.4 Activity Considerations
In this study, we measured pH on a concentration scale, which represents the negative log of
hydrogen molality; and the pH is hereafter referred to as pCH+. If activity coefficients and ionic
strength are kept approximately constant, then pCH+ can be measured. To calculate the molal
hydrogen concentration in all suspensions, it was necessary to prepare a series of standards, in
duplicate, at all ionic strengths, at both 23 and 50oC, and at pCH+ = 2, to construct calibration
curves of pH calculated vs. pH measured. The molal hydrogen concentrations were thus
obtained and the average (and 1-σ) of duplicates is expressed as pCH+ in Table 15. These
solubility experiments were conducted in acidic media for the following reasons. First, U6+
phosphates are highly insoluble at or above circumneutral pH. Thus a relatively low pH was
essential to ensure adequate dissolution such that total aqueous concentrations could be
accurately quantified with ICP-OES. Second, the equilibria (e.g., speciation) of the system are
greatly simplified at low pH. Third, by maintaining low pH systems, we can neglect carbonate
and most UO2 hydrolysis species, thereby further simplifying the interpretation of the
thermodynamic data.
117
3. RESULTS AND DISCUSSION
3.1 Experimental results
The dissolved concentrations of both U and P were measured periodically and are shown in Figs.
21-25. For both temperatures, steady-state conditions were attained from undersaturation in the
case of TDT and oversaturation in the case of Na autunite, due to the conversion of the former
phase to the latter at elevated ionic strengths, as described below. The lower ionic strength
samples (0.1 m and 0.5 m) reached steady-state relatively quickly, in approximately 25 days.
Note that the 0.5 m (23oC) system exhibits markedly non-stoichiometric TDT dissolution, as the
concentration of P is inordinately low. At elevated (1.0, 2.0 and 5.0 m) ionic strengths, dissolved
P decreases to concentrations that are around the detection limit of the ICP-OES (ca. 0.05 ppm).
This is primarily due to the precipitation of Na autunite, as discussed in the following section.
For this reason, extra time was required to demonstrate steady-state conditions. A summary of
the results for all of the experimental runs is shown in Table 15. The steady-state values of U
and P reported in Table 15 are the average with 1-sigma uncertainty of duplicate runs for each
experimental system.
118
Table. 15. Summary of experimental results in NaClO4-HClO4 media at 23 and 50oC after 89
days and 82 days respectively.
Experimental
system
Ionic
strength
(m)
T
(oC)
U (m) P (m) pCH+
0.0099 m
HClO4/0.09 m
NaClO4
0.1 23
50
5.02E-
4(±7.09E-6)
3.35E-
4(±2.27E-5)
3.15E-4(±2.47E-5)
2.36E-4(±3.40E-5)
2.07 (±0.06)
1.86 (±0.10)
0.0099 m
HClO4/0.049
m NaClO4
0.5 23
50
7.70E-4(±1.2E-
4)
3.50E-
4(±1.68E-5)
8.24E-5(±4.03E-5)
2.44E-4(±1.76E-5)
1.90 (±0.04)
2.01 (±0.04)
0.0099 m
HClO4/0.99 m
NaClO4
1.0 23
50
9.11E-
4(±1.11E-4)
8.83E-
4(±3.70E-5)
4.78E-5(±2.34E-5)
5.41E-5(±6.70E-6)
1.78 (±0.07)
2.08 (±0.02)
0.0099 m
HClO4/1.99 m
NaClO4
2.0 23
50
8.31E-
4(±1.53E-4)
8.96E-
4(±1.84E-4)
9.90E-6(±1.40E-5)
4.99E-5(±2.33E-5)
1.85 (±0.07)
1.88 (±0.01)
0.0099 m
HClO4/4.99 m
NaClO4
5.0 23
50
8.07E-
4(±1.06E-4)
7.62E-
4(±2.63E-4)
3.09E-4(±4.26E-4)
1.20E-4(±1.45E-4)
2.02 (±0.27)
2.07 (±0.33)
119
Fig. 21. Approaching equilibrium from undersaturation of (UO2)3(PO4)2•4H2O; 0.1 m NaClO4;
initial pCH+ = 2;T= 23oC (top); 50
oC (bottom). Diamonds: U; Squares: P. Error bars represent
1-sigma of duplicates.
0
0.0001
0.0002
0.0003
0.0004
0.0005
0.0006
0.0007
0 10 20 30 40 50 60 70 80 90 100
Time (days)
mol
al
0
0.0001
0.0002
0.0003
0.0004
0.0005
0.0006
0 10 20 30 40 50 60 70 80 90
Time (days)
mo
lal
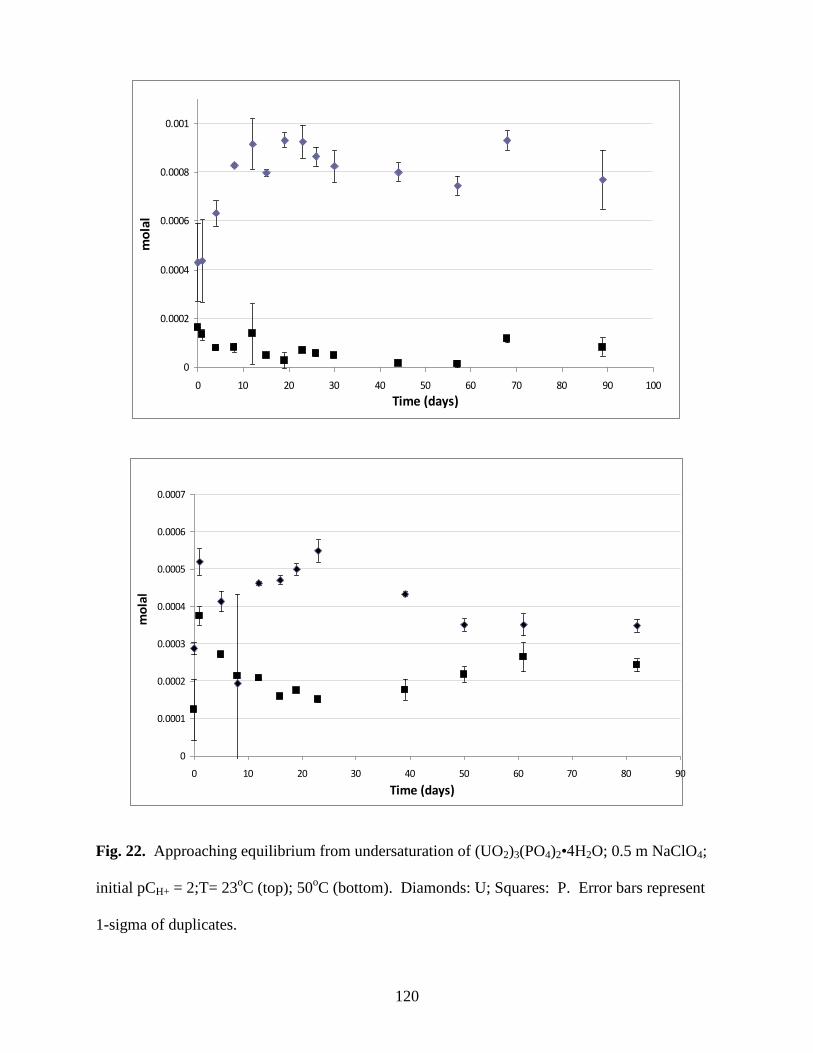
120
Fig. 22. Approaching equilibrium from undersaturation of (UO2)3(PO4)2•4H2O; 0.5 m NaClO4;
initial pCH+ = 2;T= 23oC (top); 50
oC (bottom). Diamonds: U; Squares: P. Error bars represent
1-sigma of duplicates.
0
0.0002
0.0004
0.0006
0.0008
0.001
0 10 20 30 40 50 60 70 80 90 100
Time (days)
mo
lal
0
0.0001
0.0002
0.0003
0.0004
0.0005
0.0006
0.0007
0 10 20 30 40 50 60 70 80 90
Time (days)
mo
lal

121
Fig. 23. Approaching equilibrium from undersaturation of (UO2)3(PO4)2•4H2O; 1.0 m NaClO4;
initial pCH+ = 2;T= 23oC (top); 50
oC (bottom). Diamonds: U; Squares: P. Error bars represent
1-sigma of duplicates.
0
0.0002
0.0004
0.0006
0.0008
0.001
0.0012
0 10 20 30 40 50 60 70 80 90 100
Time (days)
mo
lal
0
0.0002
0.0004
0.0006
0.0008
0.001
0 10 20 30 40 50 60 70 80 90
Time (days)
mo
lal
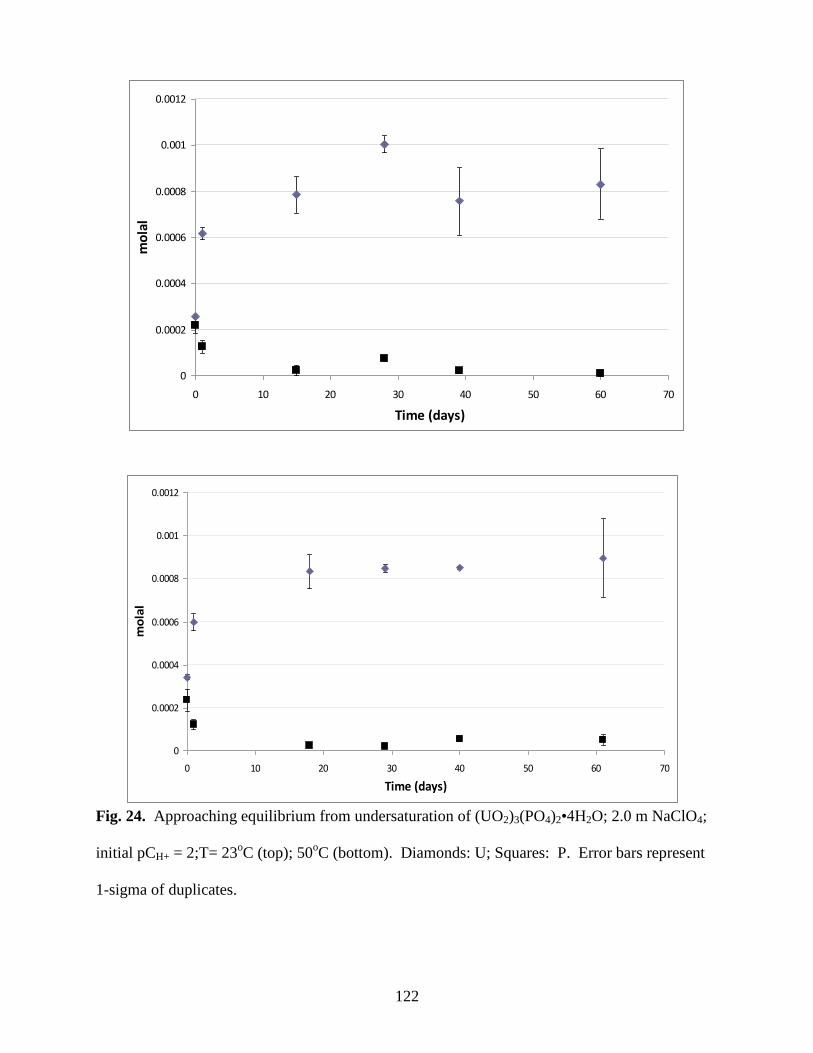
122
Fig. 24. Approaching equilibrium from undersaturation of (UO2)3(PO4)2•4H2O; 2.0 m NaClO4;
initial pCH+ = 2;T= 23oC (top); 50
oC (bottom). Diamonds: U; Squares: P. Error bars represent
1-sigma of duplicates.
0
0.0002
0.0004
0.0006
0.0008
0.001
0.0012
0 10 20 30 40 50 60 70
Time (days)
mo
lal
0
0.0002
0.0004
0.0006
0.0008
0.001
0.0012
0 10 20 30 40 50 60 70
Time (days)
mo
lal
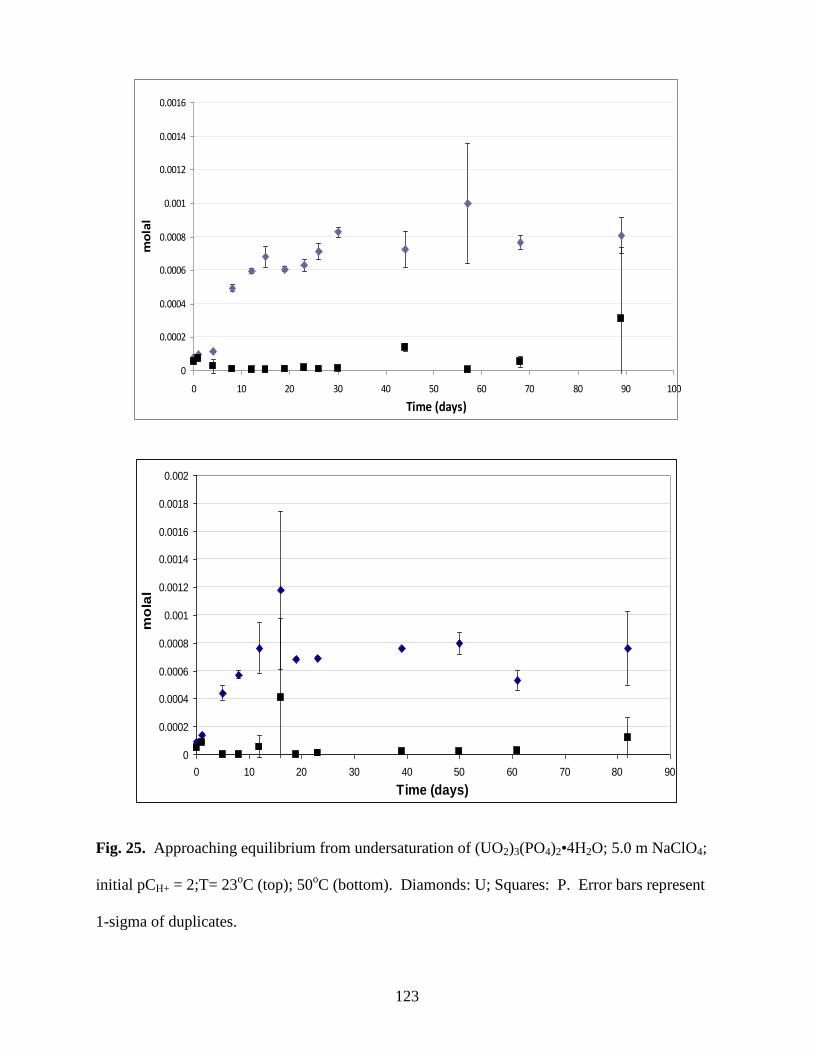
123
Fig. 25. Approaching equilibrium from undersaturation of (UO2)3(PO4)2•4H2O; 5.0 m NaClO4;
initial pCH+ = 2;T= 23oC (top); 50
oC (bottom). Diamonds: U; Squares: P. Error bars represent
1-sigma of duplicates.
0
0.0002
0.0004
0.0006
0.0008
0.001
0.0012
0.0014
0.0016
0 10 20 30 40 50 60 70 80 90 100
Time (days)
mo
lal
0
0.0002
0.0004
0.0006
0.0008
0.001
0.0012
0.0014
0.0016
0.0018
0.002
0 10 20 30 40 50 60 70 80 90
Time (days)
mo
lal
124
3.2 Final TDT characterization
Due to the incongruent dissolution of TDT observed when the ionic strength exceeded 0.1 m
(Figs. 21-25), it was necessary to thoroughly evaluate the end-product solid. After achieving
steady-state U and P concentrations, samples at the same ionic strength (both temperatures) were
compared. Elemental analysis and IR data showed excellent agreement. For PXRD, the 1.0 m
and 5.0 m samples were similar, with the exception of two minor peaks in the heated 1.0 m
sample. These diffractions suggest a change in hydration for the sample at elevated temperature
[11]. Thus, no significant differences were observed between 23oC and 50
oC samples when
ionic strengths were directly compared. For these reasons, and for simplicity, we show post-run
data for the 23oC samples only.
3.2.1 Final elemental analysis of the solids
Suspensions of the 0.1, 1.0 and 5.0 m ionic strength equilibrated samples were withdrawn and
vacuum-filtered with 0.45µm Millipore filters. The filtered solids were rinsed repeatedly with
boiling 18 MΩ DIW and air-dried. Dried samples were ground with a mortar and pestle to
particle sizes of approximately 150 µm. Approximately 10 mg of the solids were digested (the
remainder was stored for IR and XRD analyses) with concentrated HNO3, diluted to 100 mL
with degassed 18 MΩ DIW and analyzed with ICP-OES. These samples were prepared in
duplicate. The U and P ratios obtained after chemical digestion of the end-product solids are
shown in Table 16.
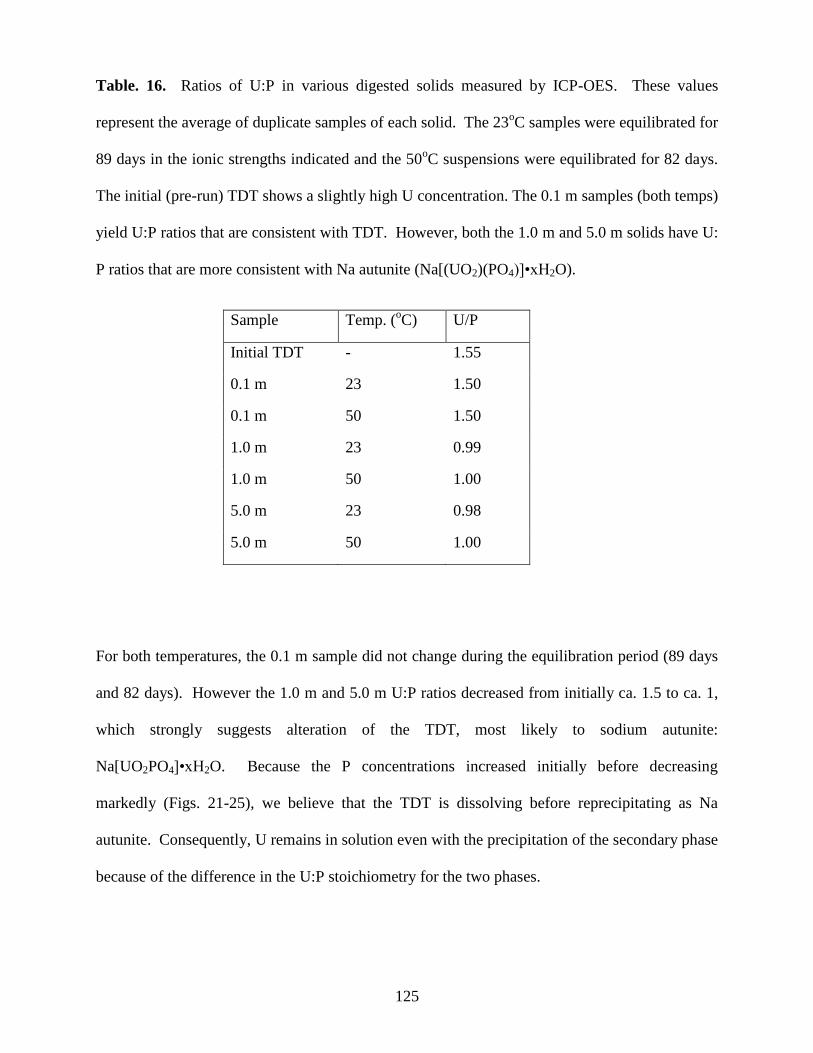
125
Table. 16. Ratios of U:P in various digested solids measured by ICP-OES. These values
represent the average of duplicate samples of each solid. The 23oC samples were equilibrated for
89 days in the ionic strengths indicated and the 50oC suspensions were equilibrated for 82 days.
The initial (pre-run) TDT shows a slightly high U concentration. The 0.1 m samples (both temps)
yield U:P ratios that are consistent with TDT. However, both the 1.0 m and 5.0 m solids have U:
P ratios that are more consistent with Na autunite (Na[(UO2)(PO4)]•xH2O).
Sample Temp. (oC) U/P
Initial TDT - 1.55
0.1 m 23 1.50
0.1 m 50 1.50
1.0 m 23 0.99
1.0 m 50 1.00
5.0 m 23 0.98
5.0 m 50 1.00
For both temperatures, the 0.1 m sample did not change during the equilibration period (89 days
and 82 days). However the 1.0 m and 5.0 m U:P ratios decreased from initially ca. 1.5 to ca. 1,
which strongly suggests alteration of the TDT, most likely to sodium autunite:
Na[UO2PO4]•xH2O. Because the P concentrations increased initially before decreasing
markedly (Figs. 21-25), we believe that the TDT is dissolving before reprecipitating as Na
autunite. Consequently, U remains in solution even with the precipitation of the secondary phase
because of the difference in the U:P stoichiometry for the two phases.

126
3.2.2 Final solid phase characterization by ATR-IR
After the completion of the solubility experiments, the remaining solids were analyzed by ATR-
IR. Fig. 26 shows the IR spectra of 0.1 m and 1.0 m equilibrated solids. Because the 5.0 m
spectrum was almost identical to that of the 1.0 m sample, it was omitted. In addition, the IR
spectrum of a sample of synthetic Na autunite is included for comparison (Fig. 26, top panel).
The IR spectrum of the TDT starting material was identical to that of the 0.1 m equilibrated solid
(data not shown), and these spectra were in good agreement with published data [12]. In
contrast, the 1.0 m and 5.0 m samples, although almost mutually identical, are very different than
both the initial TDT product and the 0.1 m solids, instead showing spectral features that are more
consistent with a Na autunite phase [13].
The following uranyl and phosphate stretching modes provide the most compelling
evidence for a TDT-to-Na autunite conversion at ionic strengths above 0.1 m. First, the
symmetric stretching mode of uranyl (ν1 UO22+
) is shifted from 853 cm-1
to ca. 802 cm-1
.
Second, a red-shift from 924 cm-1
to ca. 890 cm-1
is evident in the uranyl antisymmetric
stretching (ν3 UO22+
) mode. Third, a red-shift from 1053 cm-1
to ca. 980 cm-1
in the ν3 PO43-
mode is also observed. All of these lower energy vibrational modes are expected in autunite
rather than in TDT.
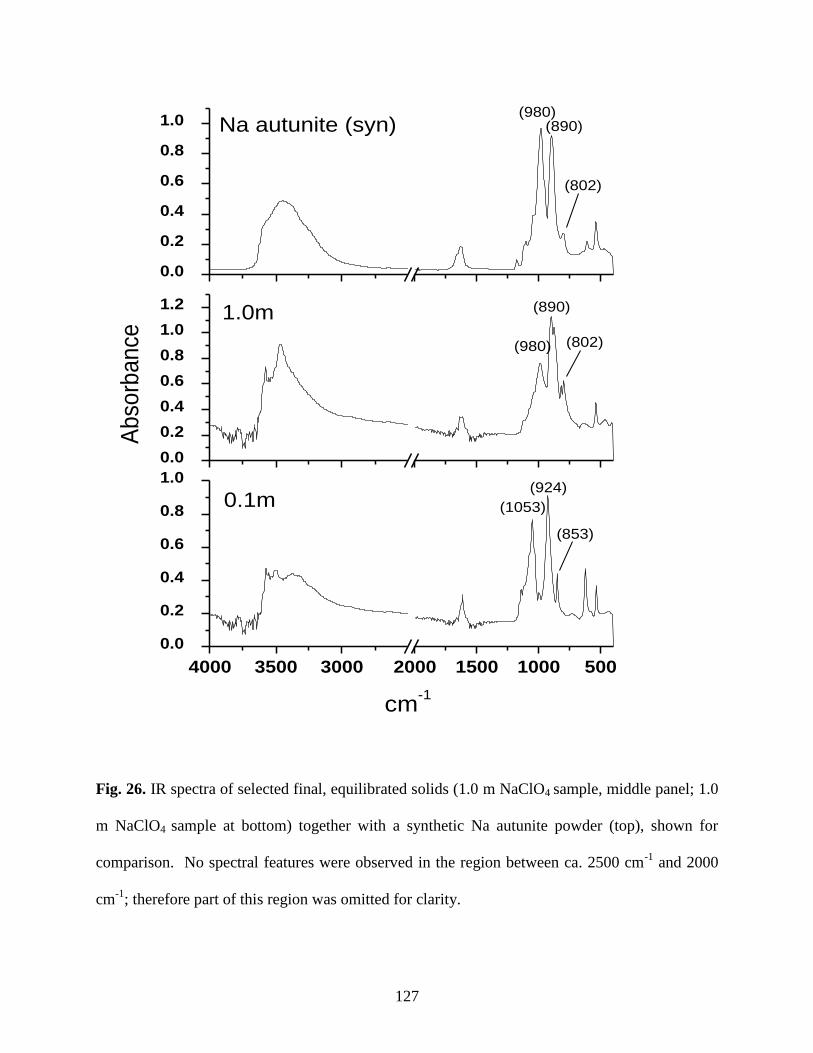
127
4000 3500 3000 2000 1500 1000 500
0.0
0.2
0.4
0.6
0.8
1.0
1.0m
(853)
(924)
(1053)
(980)
cm-1
0.0
0.2
0.4
0.6
0.8
1.0
1.2
0.1m
(802)(980)
0.0
0.2
0.4
0.6
0.8
1.0A
bso
rban
ceNa autunite (syn)
(890)
(802)
(890)
Fig. 26. IR spectra of selected final, equilibrated solids (1.0 m NaClO4 sample, middle panel; 1.0
m NaClO4 sample at bottom) together with a synthetic Na autunite powder (top), shown for
comparison. No spectral features were observed in the region between ca. 2500 cm-1
and 2000
cm-1
; therefore part of this region was omitted for clarity.
128
3.2.3 Final solid phase analysis by PXRD
In agreement with ICP and IR data, the 0.1 m sample is identical to the starting material (i.e., no
equilibration with a solution phase); and it is consistent with the PDF # 37-0369 for TDT (Fig.
27, bottom panel). In contrast, the 1.0 m and 5.0 m samples are very similar although they are
markedly different than both the 0.1m equilibrated suspension and PDF # 39-0369, again in
agreement with ICP and IR data. A comparison of these 1.0 m and 5.0 m solids and the
published XRD profile for Na autunite (73-7368) shows very good agreement (Fig. 27, top
panel). Thus, these XRD findings support the data obtained from IR analyses of the post-
solubility 0.1 m, 1.0 m and 5.0 m solids, namely that the 0.1 m equilibrated solid does not
undergo any transformation, whereas the 1.0 m and 5.0 m samples show strong evidence of a
transformation of TDT to Na autunite.
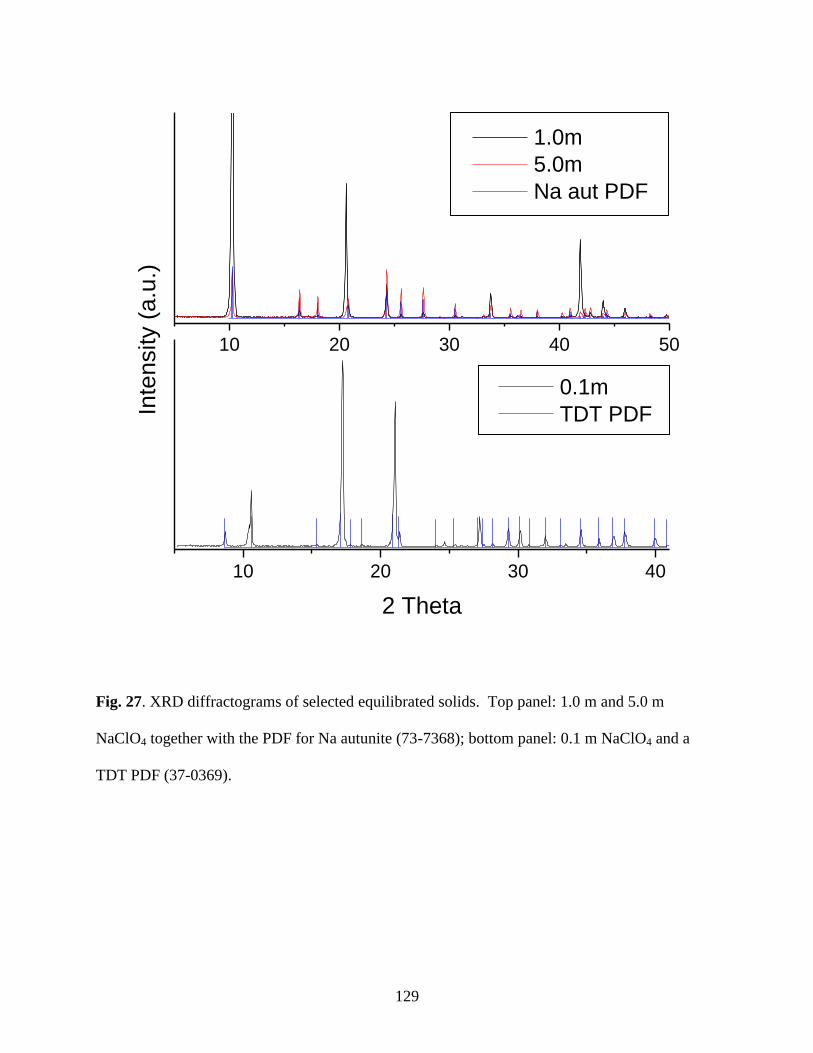
129
10 20 30 40
10 20 30 40 50
Inte
nsity (
a.u
.)
2 Theta
0.1m
TDT PDF
1.0m
5.0m
Na aut PDF
Fig. 27. XRD diffractograms of selected equilibrated solids. Top panel: 1.0 m and 5.0 m
NaClO4 together with the PDF for Na autunite (73-7368); bottom panel: 0.1 m NaClO4 and a
TDT PDF (37-0369).
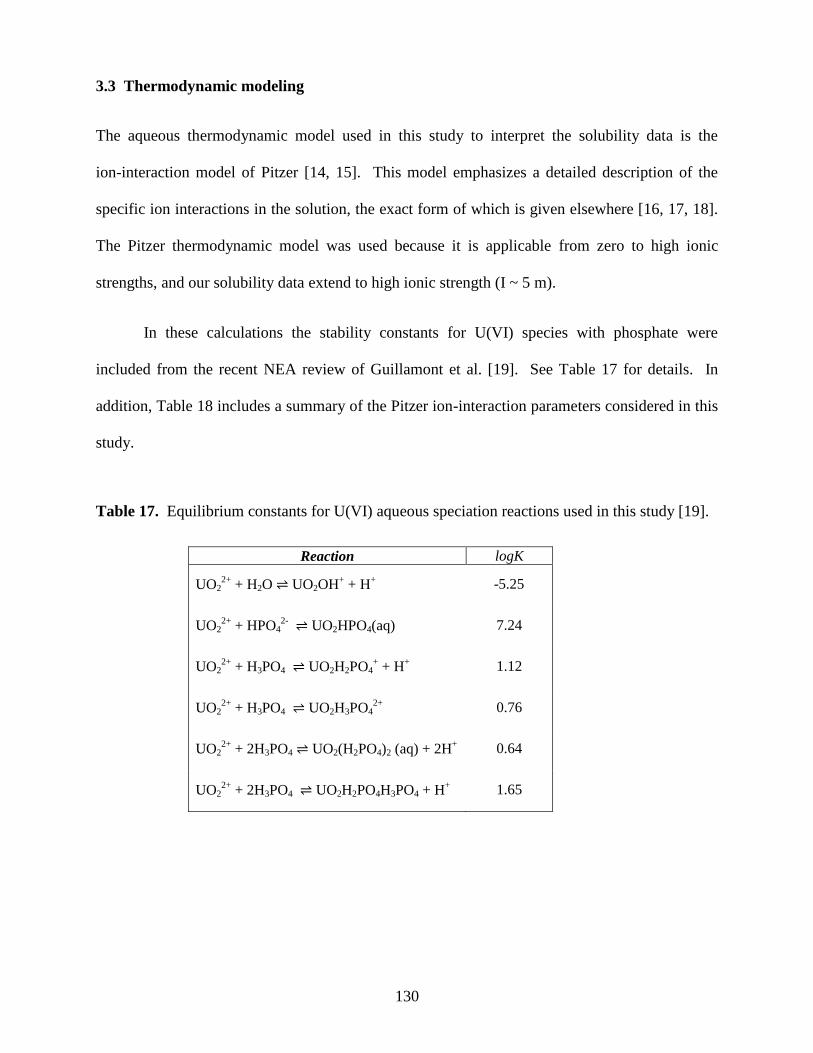
130
3.3 Thermodynamic modeling
The aqueous thermodynamic model used in this study to interpret the solubility data is the
ion-interaction model of Pitzer [14, 15]. This model emphasizes a detailed description of the
specific ion interactions in the solution, the exact form of which is given elsewhere [16, 17, 18].
The Pitzer thermodynamic model was used because it is applicable from zero to high ionic
strengths, and our solubility data extend to high ionic strength (I ~ 5 m).
In these calculations the stability constants for U(VI) species with phosphate were
included from the recent NEA review of Guillamont et al. [19]. See Table 17 for details. In
addition, Table 18 includes a summary of the Pitzer ion-interaction parameters considered in this
study.
Table 17. Equilibrium constants for U(VI) aqueous speciation reactions used in this study [19].
Reaction logK
UO22+
+ H2O UO2OH+ + H
+ -5.25
UO22+
+ HPO42-
UO2HPO4(aq)
7.24
UO22+
+ H3PO4 UO2H2PO4+ + H
+ 1.12
UO22+
+ H3PO4 UO2H3PO42+
0.76
UO22+
+ 2H3PO4 UO2(H2PO4)2 (aq) + 2H+ 0.64
UO22+
+ 2H3PO4 UO2H2PO4H3PO4 + H+ 1.65
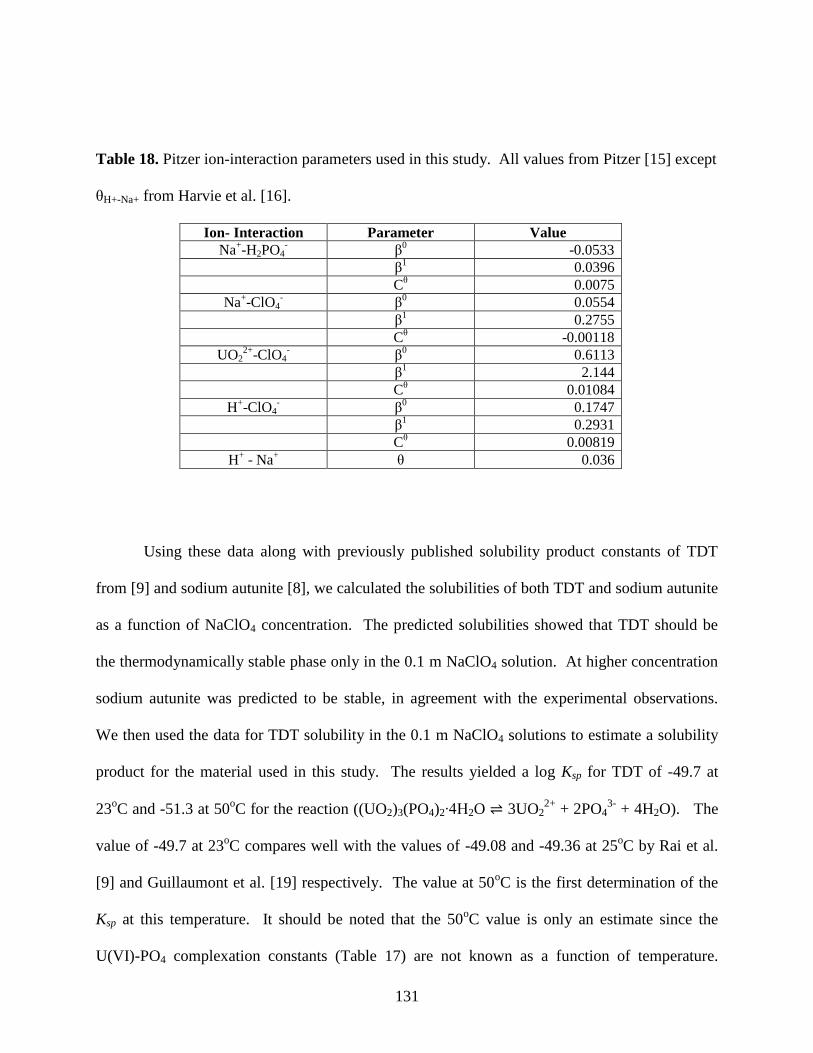
131
Table 18. Pitzer ion-interaction parameters used in this study. All values from Pitzer [15] except
θH+-Na+ from Harvie et al. [16].
Ion- Interaction Parameter Value
Na+-H2PO4
- β
0 -0.0533
β1 0.0396
Cθ 0.0075
Na+-ClO4
- β
0 0.0554
β1 0.2755
Cθ -0.00118
UO22+
-ClO4- β
0 0.6113
β1 2.144
Cθ 0.01084
H+-ClO4
- β
0 0.1747
β1 0.2931
Cθ 0.00819
H+ - Na
+ θ 0.036
Using these data along with previously published solubility product constants of TDT
from [9] and sodium autunite [8], we calculated the solubilities of both TDT and sodium autunite
as a function of NaClO4 concentration. The predicted solubilities showed that TDT should be
the thermodynamically stable phase only in the 0.1 m NaClO4 solution. At higher concentration
sodium autunite was predicted to be stable, in agreement with the experimental observations.
We then used the data for TDT solubility in the 0.1 m NaClO4 solutions to estimate a solubility
product for the material used in this study. The results yielded a log Ksp for TDT of -49.7 at
23oC and -51.3 at 50
oC for the reaction ((UO2)3(PO4)2∙4H2O 3UO2
2+ + 2PO4
3- + 4H2O). The
value of -49.7 at 23oC compares well with the values of -49.08 and -49.36 at 25
oC by Rai et al.
[9] and Guillaumont et al. [19] respectively. The value at 50oC is the first determination of the
Ksp at this temperature. It should be noted that the 50oC value is only an estimate since the
U(VI)-PO4 complexation constants (Table 17) are not known as a function of temperature.
132
However, in these systems the uncomplexed UO22+
species dominates the overall U(VI)
speciation (~90%). Therefore, the estimated Ksp at 50oC should be reasonable. The lower value
for the Ksp at 50oC reflects the lower U(VI) and phosphate concentrations in solution relative to
the room temperature samples and suggests that TDT may exhibit retrograde solubility, a finding
that has been observed with lanthanide phosphates [20].
The determination of the Ksp for sodium autunite was considerably more difficult at 23oC
owing to relatively large changes in the apparent Ksp as a function of ionic strength. However, at
the lowest concentration in which sodium autunite was predicted to be stable (0.5 m NaClO4),
the calculated log Ksp for the reaction (NaUO2PO4.xH2O Na+ + UO2
2+ + PO4
3- + xH2O) was -
24.4 compared to the value determined by Felmy et al. [8] (log Ksp = -23.6). At 50oC the results
as a function of ionic strength extending from 0.5 m NaClO4 to 5.0 m NaClO4 were all in
reasonable agreement. Fitting all of these data together yielded a log Ksp of -24.1. This is the
first determination of the solubility product for sodium autunite at temperatures above 25oC.
4. SUMMARY
Experimental solubility studies of TDT and Na autunite have been conducted over a wide ionic
strength range (0.1 to 5.0 m) at both 23oC and 50
oC. ICP-OES, PXRD and IR data were all in
agreement showing that (1) at comparable ionic strengths, the 23oC and 50
oC equilibrated solids
showed no significant differences, and (2) the 0.1 m solids remained unchanged over the 89 day
equilibration period. However, the 1.0 m and 5.0 m samples showed strong evidence of a
conversion of TDT to Na autunite. The ion-interaction model of Pitzer [14, 15] was used to
interpret the experimental solubility data for both TDT and Na autunite at 23oC and 50
oC. The
log Ksp’s for TDT at 23oC and 50
oC respectively are: -49.7 and -51.3; and the log Ksp’s for Na
133
autunite at 23oC and 50
oC respectively are: -24.4 and -24.1. The room temperature values for
both of these phases are in agreement with published data, while the thermodynamic data
obtained at 50oC are the first to be reported for these phases. It appears that TDT may exhibit
slight retrograde solubility, while no significant temperature dependence is evident in the case of
Na autunite.
Acknowledgements
This work was supported primarily by the U.S. Department of Energy, Basic Energy Sciences,
Heavy Element Chemistry program, contract DE-FG02-06ER15782. In addition, SBC and CRA
gratefully acknowledge support from the Joint Domestic Nuclear Detection Office-National
Science Foundation: Academic Research Initiative (ARI), contract number ECCS-0833548
during the preparation of this manuscript.
134
References
1. Langmuir, D. Geochim. Cosmochim. Acta. 42, 547 (1978).
2. Jeanjean, J., Rouchaud, J.C., Tran, L., Federoff, M. J. Radioanal. Nucl. Chem., Lett. 6, 529
(1995).
3. Fuller, C.C, Bargar, J.R., Davis, J.A., Piana, M.J. Environ. Sci. Technol, 36, 158 (2002).
4. Fuller, C.C, Bargar, J.R., Davis, J.A. Environ. Sci. Technol. 37, 4642 (2003).
5. Wellman, D.M. Ph.D. Dissertation, Washington State University, Pullman, WA, (2004) 196
pp.
6. Vesely, V., Pekarek, V., Abbrent, M. J. Inorg. Nucl. Chem. 27, 1159 (1965).
7. Sandino, A., Bruno, J. Geochim. Cosmochim. Acta. 56, 4235 (1992).
8. Felmy, A.R., Xia, Y., Wang, Z. Radiochim. Acta 93, 401 (2005).
9. Rai, D., Xia, Y., Rao, L., Hess, N.J., Felmy, A.R., Moore, D.A., McCready, D.E. J. Sol.
Chem. 34, 69 (2005).
10. Gorman-Lewis, D., Burns, P.C., Fein, J.B. J. Chem. Thermodyn. 40, 335 (2008).
11. Armstrong, C.R. PhD dissertation. Washington State University (2009).
12. Pham-Thi, M. and Colomban, Ph. J. Less-Common Met. 108, 189 (1985).
13. Cejka, J. Reviews in Mineralogy Vol. 38. Eds. Burns, P.C., Finch, R. 522 (1999).
14. Pitzer, K. S. J. Phys. Chem. 77, 268 (1973)
15. Pitzer, K. S. Activity Coefficients in Electrolyte Solutions, 2nd ed. Boca Raton, Florida,
CRC Press (1991).
16. Harvie, C. E., Mo/ ller, N., Weare , J. H. Geochim. Cosmochim. Acta 48, 723 (1984).
17. Felmy, A. R., Weare, J. H. Geochim. Cosmochim. Acta 50, 2771 (1986).
18. Felmy, A. R., Rai, D., Schramke, J. A., Ryan, J. L. Radiochim. Acta 48, 29 (1989).
19. Guillamont, R., Fanghanel, T., Fuger, J., Grenthe, I., Neck, V., Palmer, D.A., Rand, M.H.
Update on the Chemical Thermodynamics of Uranium, Neptunium, Plutonium, Americium,
135
and Technetium. Chemical Thermodynamics, Vol. 5. Elsevier Science Publishers,
Amsterdam, North-Holland (2003).
20. Cetiner, Z.S., Wood, S., Gammons, C.H. Chem. Geol. 217, 147 (2003).
136
CHAPTER SIX
The enthalpy of hydration for U6+
solids: A thermal study
Christopher R. Armstrong, Kenneth L. Nash, Sue B. Clark3
Dept. of Chemistry, Washington State University, Pullman, WA 99164, U.S.A.
Abstract
A new method of delineating the types of water present in uranyl oxysalts is presented. Two
well-characterized uranyl phosphates, natural meta autunite (Ca[(UO2)(PO4)]2∙6.5H2O) and
synthetic sodium autunite (Na2[(UO2)(PO4)]2∙3H2O) are investigated. Complementary data from
thermogravimetric analysis (TGA) and differential scanning calorimetry (DSC) are accrued and
the roles of water are elucidated. Three types of water are thus distinguished: (1) physisorbed,
(2) occluded and, (3) interstitial-coordinated. Each type of water is discussed in the context of its
respective enthalpy of hydration. The novel approach described herein can be readily applied to
a variety of hydrated minerals and synthetic compounds.
3Corresponding author: Tel: 01-5093351411; fax: 01-509-3358867. Email: [email protected]
137
1. INTRODUCTION
1.1 Background
Tardy and Garrels (1974, 1976, 1977) developed a simple method of estimating the standard
state free energies of formation (∆Gfo) for various minerals by summing the stoichiometric ∆Gf
o
contributions of the constituent components. The efficacy of this approach rests upon the
assumption that the standard state free energy of formation for a given component oxide is the
same for all phases in which the component is present in a similar structural arrangement.
This method was subsequently used to estimate ∆Gfo for uranyl oxides (Finch, 1997),
uranyl silicates (Clark et al., 1998) and a variety of U phases (Chen et al., 1999). Clark et al.
(1998) demonstrated a linear relationship between the waters of hydration and the standard state
free energy of formation for hydrated uranyl nitrates, sulfates and phosphates. These workers
used the mean of the slopes of free energy vs. waters of hydration to interpolate/extrapolate the
contribution of free energy of the component water to the standard state free energy of formation
of select uranyl silicates. Although it would appear that this method provides a rough estimate of
the weighted average of component water in the summing exercise, it does not differentiate the
different types of water present in these solid phases; and thus error in these assessments is
unavoidable.
Chen et al. (1999) modified this approach by accounting for the coordination
environments of all of the constituent components in a given unit cell. A multiple linear
regression scheme was employed using experimental thermodynamic data from a host of uranyl
solids. These workers demonstrated that ∆Gfo
and ∆Hfo of uranyl minerals can be effectively
estimated by summing the oxide polyhedral contributions, which they referred to as “fictive”
structural components.
138
1.2. Rationale
As pointed out by Chen et al. (1999), estimating the standard state free energies of formation for
U6+
phases based upon the summing of individual constituent components from available
thermodynamic data is problematic for several reasons. Firstly, the free energies of these
components in pure substances (e.g., MgO (pure) vs. constituent MgO (in oxysalt) can be vastly
different. Secondly, the differences in stoichiometry and degrees of disorder, i.e., highly
distorted uranyl polyhedra, can also greatly affect these types of estimations. Lastly, knowledge
of the bonding environments of water, and the ∆Gfo associated with these water molecules, is
lacking.
As noted above, water is invariably assigned an individual ∆Gfo which is subsequently
applied to the stoichiometric contribution of water to the given solid. It has been widely shown
that the role of water in hydrated oxysalts is highly complex and, to a large extent, governs the
overall stability of the solid phase (Hawthorne, 1992; Hawthorne and Schindler, 2008; Schindler
and Hawthorne, 2008). Thus it is clear that treating the plurality of water bonding environments
as an individual component leads to erroneous ∆Gfo
estimations.
Chen et al. (1999), attempted to distinguish between two types of water, water of
hydration and structural water. However it is not clear how these assignments were made, since
the water of hydration could be either physisorbed or occluded water. Additionally, the
designation of structural water is somewhat misleading, since many U6+
phases do not contain
any structural water; instead these are typically water molecules that are coordinated to the
interlayer metal in the interstitial region. Lastly, in cases where hydroxyl groups were present in
the structural unit, Chen et al. treated these OH groups as water groups, assigning 0.5 moles of
structural water for every mole of OH observed. While this approach is likely an improvement

139
over previous attempts to handle the complexities of uranyl mineral hydration, it does not
delineate the “structural” water and waters of hydration in terms of their respective free energy
contributions to the ∆Gfo
of the U solid of interest.
In this report, the importance of considering the energetic contributions arising from
different hydration components in uranyl oxysalts is discussed; and we endeavor to provide
specific enthalpies of hydration for these respective water populations. Here we present
thermodynamic data obtained from TGA and DSC delineating distinct water populations in two
hydrated uranyl phosphates: natural meta autunite and synthetic sodium autunite.
In this contribution, the convention of Hawthorne (1992) was followed, i.e., three types
of water: (1) physisorbed, (2) occluded and, (3) interstitial-coordinated water are designated. A
thorough discussion of these designations is presented elsewhere (see Introduction of this
dissertation). Briefly, the physisorbed water represents all water molecules that are adsorbed to
the surface of the solid, effectively in equilibrium with atmospheric water. Occluded water
describes water molecules that are occupying available space within the interlayer (i.e., zeolitic
water). These waters are held in place by hydrogen bonding. Lastly, interstitial-coordinated
water describes H2O that is coordinated to the metal cation in the interstitial region. To our
knowledge, no water is present in the sheet of the structure (i.e., the region containing the uranyl
and phosphate polyhedra) in the autunites presented in this study.
Using thermogravimetric analyses (TGA), the total hydration of synthetic Na autunite
and natural meta autunite was quantified. Next, distinct bonding environments for respective
water populations were elucidated. Lastly, differential scanning calorimetry (DSC) was used to
obtain the enthalpy (∆Hhyd) associated with the release of a given water population from the solid
of interest.
140
2. EXPERIMENTAL
2.1. Chemicals
All chemicals are reagent grade or higher. Deionized (18 MΩ) and boiled water was used in
preparations of all solutions. Standards used for ICP-OES analyses were 99.9% purity.
2.2. Synthetic and natural compounds
2.2.1. Synthetic Na autunite: Na[(UO2)(PO4)]∙1.5H2O (c)
Microcrystalline sodium autunite was synthesized according to the method of Zheng et al., 2006.
Stoichiometric volumes of 0.05 M H3PO4 and 0.1 M UO2(NO3)2·6H2O were mixed in a jacketed
reaction vessel under N2 at 70oC. Standardized 0.1 M NaOH was added dropwise to the stirred
suspension and the pH was adjusted to approximately 8. The suspension was stirred overnight at
70oC and subsequently allowed to settle. The supernatant was decanted and replaced with
degassed 18 MΩ DIW at 70oC (twice), stirred and allowed to settle. The final pH was ca. 7. The
final suspension was extracted and vacuum filtered through 0.45-µm Millipore membranes,
rinsed three times with boiling DIW, covered and dried overnight at 30oC. Solids were crushed
with a mortar and pestle and sieved (sieve number 100) to an approximate 150 µm particle size,
placed in 20 mL borosilicate centrifuge vials and stored.
2.2.2. Natural meta autunite: Ca[(UO2)(PO4)]2∙5.6H2O) (c)
Meta autunite is commercially available from Excalibur Inc., obtained from the Daybreak Mine
in northeastern Washington State. In addition to the rigorous characterization of meta autunite
conducted in this lab, this mineral has been characterized previously by Wellman (2004). The
141
mineral was ground to approximately 150um particle size, and separated gravimetrically by
repeated washing with DIW according to Wellman (2004) to remove minor accessory
components present in this natural material.
2.3. Elemental Analysis
For both meta autunite and sodium autunite, duplicate powder samples of approximately 10 mg
were digested in concentrated HNO3 and diluted to 100 mL in a volumetric flask with DIW.
Dissolved metal determination was carried out on a Perkin-Elmer Optima 3200 axial torch
inductively-coupled optical emission spectrometer (ICP-OES). For all samples, three replicate
intensities were recorded from which the average and standard deviation was calculated.
2.4. Powder x-ray diffraction (PXRD)
PXRD was performed on fine grained samples (~ 150 µm) of Na autunite and Ca meta autunite
at room temperature using a Siemens Kristalloflex D500 diffractometer with the following
parameters: Copper source (Kα; 1.54018 Ǻ); 35 keV, 30 mA, Kβ filter: Ni; scintillation counter
detector; Continuous mode: 0.02d/min; 2θ range: 5-20. The diffractograms were produced using
MDI Data Scan 4 and Jade 8 software packages.
2.5. ATR-IR Spectrometry
Measurements were made on solids in this study using a Nicolet 6700 FT-IR spectrometer with
an ATR accessory equipped with a ThermoElectron Smart Nexus Orbit single-reflection
diamond IRE. Spectra were measured between 4000 and 400 cm-1
at 8 cm-1
resolution. A total

142
of 200 scans were averaged for each sample and background. The system was purged with
desiccated N2 at 30 psi. The solid samples were ground with an agate mortar and pestle and
sieved to an approximate 150 µm particle size.
2.6. Thermal Analyses (TGA and DSC)
Thermogravimetric analysis (TGA) and differential scanning calorimetry (DSC) were conducted
using a Perkin-Elmer TGA-7 and Perkin-Elmer DSC instruments, respectively. The TGA was
calibrated with a 10 mg standard weight furnished by Perkin-Elmer. The DSC was calibrated
with solid zinc and indium standard materials. For TGA, powders were were crimped inside an
aluminum pan and subsequently placed in an open platinum pan for analysis. For DSC, the
crimped aluminum pans were inserted directly into the instrument, i.e., no platinum pan was
required. For both TGA and DSC, the scan rate was 10oC/min and the experimental temperature
ranged from 25oC to 500
oC. Approximately 10 mg of solid was used in all of these experiments.
3. DISCUSSION
The differential scanning calorimeter (DSC) measures the power (mW) that is required to
maintain equal temperature between the sample and references vessels. When a physical change
occurs (i.e. melting) in the sample, heat is absorbed (endothermic reaction) and power must be
added to the sample vessel to maintain the same temperature as that of the reference vessel,
resulting in a distinct peak in a power vs. temperature profile. The power (W = J/s) is easily
converted to heat capacity (J/g∙C) when a temperature scan rate (C/s) is applied and the sample
weight is known. Thus the heat capacity of the system (Cp) is measured as a function of T for a
given scan rate. A local maximum in the profile (Cpmax) signals an endothermic dehydration

143
event and the temperature at this peak of the curve is the temperature of dehydration (Thyd) for
that particular event.
The enthalpy associated with this dehydration event, ∆Hhyd, is obtained by integrating the
area under the curve between the minimum and maximum temperatures:
∆Hhyd = ∫Cp dt (1)
The TGA allows one to calculate the number of moles that are lost by the solid as a
function of temperature. By assimilating both the DSC and TGA data, thermodynamic data for
specific hydration events are readily obtainable.
4. RESULTS
4.1 Elemental Analysis (ICP-OES)
The results of chemical digestion of duplicate samples of Na autunite and Ca meta autunite
(Ca[(UO2)(PO4)]2∙6.5H2O) are shown in Table 19.
The concentrations of the dissolved analytes shown in Table 19 are in line with the
expected stoichiometry of Ca meta autunite given the experimental uncertainty associated with
each analyte. However, sodium autunite exhibits an inordinately high Na concentration.
However, since the U/P ratio was in line with the expected stoichiometry, this Na is deemed an
impurity that does not have a significant effect on the overall composition of Na autunite.
Further characterization of Na autunite including PXRD, ATR-IR and TGA confirm the identity
of this phase as discussed below.
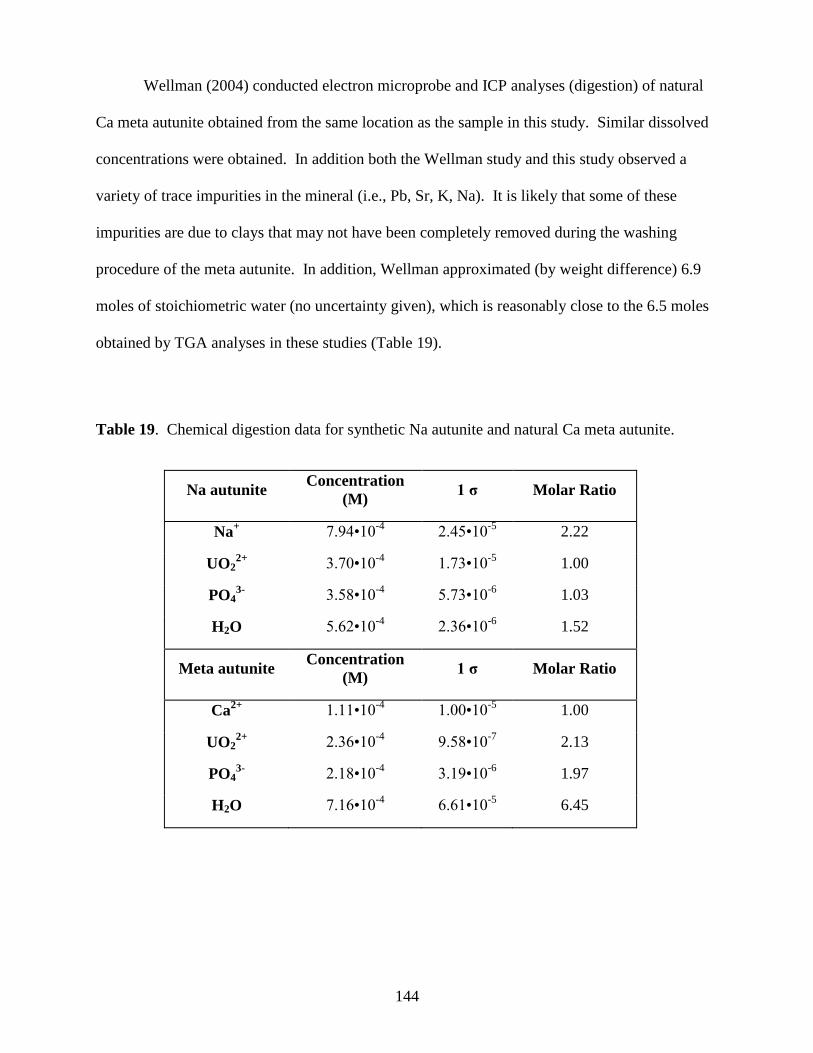
144
Wellman (2004) conducted electron microprobe and ICP analyses (digestion) of natural
Ca meta autunite obtained from the same location as the sample in this study. Similar dissolved
concentrations were obtained. In addition both the Wellman study and this study observed a
variety of trace impurities in the mineral (i.e., Pb, Sr, K, Na). It is likely that some of these
impurities are due to clays that may not have been completely removed during the washing
procedure of the meta autunite. In addition, Wellman approximated (by weight difference) 6.9
moles of stoichiometric water (no uncertainty given), which is reasonably close to the 6.5 moles
obtained by TGA analyses in these studies (Table 19).
Table 19. Chemical digestion data for synthetic Na autunite and natural Ca meta autunite.
Na autunite Concentration
(M) 1 σ Molar Ratio
Na+ 7.94•10
-4 2.45•10
-5 2.22
UO22+
3.70•10-4
1.73•10-5
1.00
PO43-
3.58•10-4
5.73•10-6
1.03
H2O 5.62•10-4
2.36•10-6
1.52
Meta autunite Concentration
(M) 1 σ Molar Ratio
Ca2+
1.11•10-4
1.00•10-5
1.00
UO22+
2.36•10-4
9.58•10-7
2.13
PO43-
2.18•10-4
3.19•10-6
1.97
H2O 7.16•10-4
6.61•10-5
6.45
145
4.2 PXRD analysis
Powders of sodium autunite, and calcium meta autunite were prepared as described above and
analyzed by PXRD and compared to published powder diffraction files (PDF). In general good
agreement is observed between the synthetic Na autunite from this study and the published
PXRD pattern of the same phase (Fig. 28). However, some discrepancies are noteworthy. First,
the degree of hydration has a significant effect on the d-spacing distances (and 2-theta scattering)
due to interlayer swelling in these sheet structures as a function of hydration (Phi-Tham and
Columban, 1988; Sowder, 1998). As determined by TGA, the synthetic Na autunite in this study
contains approximately 1.5 moles of water (Table 19 and Fig 32). In contrast, the synthetic Na
autunite depicted in PDF#29-1284 is a trihydrate - roughly double the stoichiometric water
content. Hence, unless a PDF with similar hydration is obtainable, and in this case it was not,
shifts in 2-theta scattering degrees are expected. In addition, there are two peaks at 2-theta of ca.
19.5 and 32.5 in the synthetic Na autunite from this study that are not present in the PDF# 29-
1284. However, both of these peaks are present in the PDF for synthetic chernikovite (PDF#08-
0296). Both being autunites with the same (UO2)(PO4)- structural unit, the only difference
between the two phases being interlayer metal occupancies, it is not surprising that these patterns
are very similar. It is highly unlikely that Na autunite contains any chernikovite because the
latter phase precipitates at very low pH (ca. 1), while the former material requires relatively high
synthesis pH (ca. 7). At this pH, insufficient hydronium ions are present to interchange with Na
and co-occupy the autunite interlayer. However, these findings clearly illustrate the difficulty of
delineating autunites with PXRD alone. Further characterization studies are necessary, such as
elemental analysis and IR, as described herein.
146
10 20 30 40 50 60
0
200
400
600
800
1000
1200
1400
1600
Inte
nsity (
co
un
ts)
2-Theta
Fig. 28. PXRD profiles of synthetic Na autunite (black) and the corresponding published
pattern, PDF # 29-1284 (grey).
147
10 20 30 40 50 60
0
200
400
600
800
1000
1200
1400
1600
Inte
nsity (
cou
nts
)
2-Theta
Fig. 29. PXRD profiles of calcium meta autunite (black) and published pattern for calcium meta
autunite; PDF # 39-1351 (grey).
The meta autunite sample in this study was compared to a published PXRD pattern of the same
phase and excellent agreement was observed (Fig 29).
148
4.3. ATR-IR Spectrometry
In addition to elemental analysis, TGA and PXRD, ATR-IR was performed on Na autunite and
Ca meta autunite. The tentative band assignments of the various components presented herein
are in line with published studies (Cejka, 1999 and references therein). The IR spectra are shown
in Fig. 30 and the associated band assignments are shown in Table 20.
4000 3500 3000 2500 1500 1000 500
0.0
0.1
0.2
0.3
0.4 Ca meta autunite
Abso
rban
ce
cm-1
4000 3500 3000 2500 1500 1000 500
0.0
0.2
0.4
0.6
0.8
1.0
Na autunite (syn)
Fig. 30. ATR-IR spectra of synthetic Na autunite and meta autunite in the mid-infrared spectrum.

149
Table 20. IR absorption bands (in cm-1
) of synthetic Na autunite and natural Ca meta autunite
corresponding to the spectrum in Fig. 32. s = strong, m = medium, w = weak, v = very, b =
broad.
Na autunite Meta autunite Assignment
3696 (m) νOH
3592 (s,b) 3564 (s,b) νOH
3435 (s,b) 3410 (s,b) νOH
3230 (s,b) νOH
1630 (s) 1630 (s) ν2 OH
1179 (w) ν4 OH
1106 (w) 1112 (vw) ν3 PO4
980 (vs) 996 (vs) ν3 PO4
895 (vs) 911 (vs) ν3 UO2
801 (m) ν1 UO2
612 (m) ν4 PO4
533 (s) 535 (s) ν4 PO4
466 (m) ν4 PO4
The spectra of both synthetic and natural autunite samples are very similar. Despite the
fact that meta autunite features a rather sharp mode at ca. 3700 cm-1
which is attributed to the
antisymmetric stretch of water (v3 OH), both show appreciable hydration as evidenced by the
broad, rather featureless band from ca. 3700 – 3000 cm-1
. This band is actually the result of
many overlapping antisymmetric v3, and symmetric, v1 OH modes due to the variety of water
bonding environments (e.g., physisorbed, occluded and interstitial) in these phases. The most
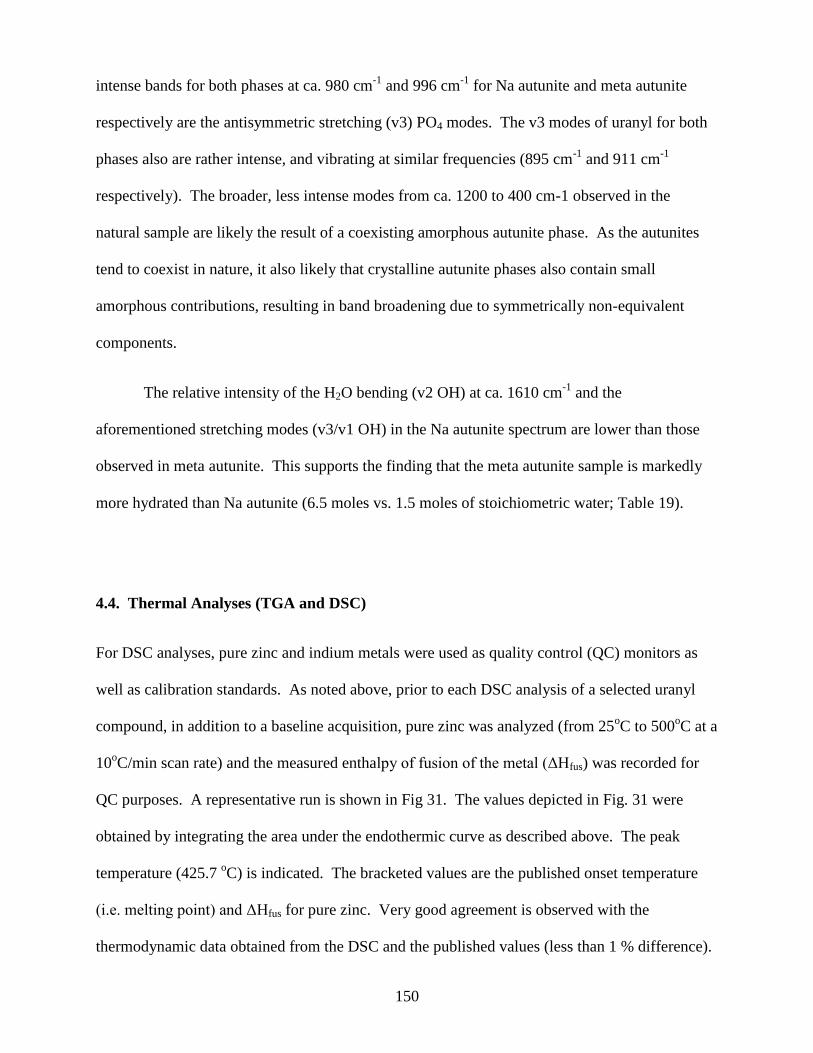
150
intense bands for both phases at ca. 980 cm-1
and 996 cm-1
for Na autunite and meta autunite
respectively are the antisymmetric stretching (v3) PO4 modes. The v3 modes of uranyl for both
phases also are rather intense, and vibrating at similar frequencies (895 cm-1
and 911 cm-1
respectively). The broader, less intense modes from ca. 1200 to 400 cm-1 observed in the
natural sample are likely the result of a coexisting amorphous autunite phase. As the autunites
tend to coexist in nature, it also likely that crystalline autunite phases also contain small
amorphous contributions, resulting in band broadening due to symmetrically non-equivalent
components.
The relative intensity of the H2O bending (v2 OH) at ca. 1610 cm-1
and the
aforementioned stretching modes (v3/v1 OH) in the Na autunite spectrum are lower than those
observed in meta autunite. This supports the finding that the meta autunite sample is markedly
more hydrated than Na autunite (6.5 moles vs. 1.5 moles of stoichiometric water; Table 19).
4.4. Thermal Analyses (TGA and DSC)
For DSC analyses, pure zinc and indium metals were used as quality control (QC) monitors as
well as calibration standards. As noted above, prior to each DSC analysis of a selected uranyl
compound, in addition to a baseline acquisition, pure zinc was analyzed (from 25oC to 500
oC at a
10oC/min scan rate) and the measured enthalpy of fusion of the metal (ΔHfus) was recorded for
QC purposes. A representative run is shown in Fig 31. The values depicted in Fig. 31 were
obtained by integrating the area under the endothermic curve as described above. The peak
temperature (425.7 oC) is indicated. The bracketed values are the published onset temperature
(i.e. melting point) and ΔHfus for pure zinc. Very good agreement is observed with the
thermodynamic data obtained from the DSC and the published values (less than 1 % difference).
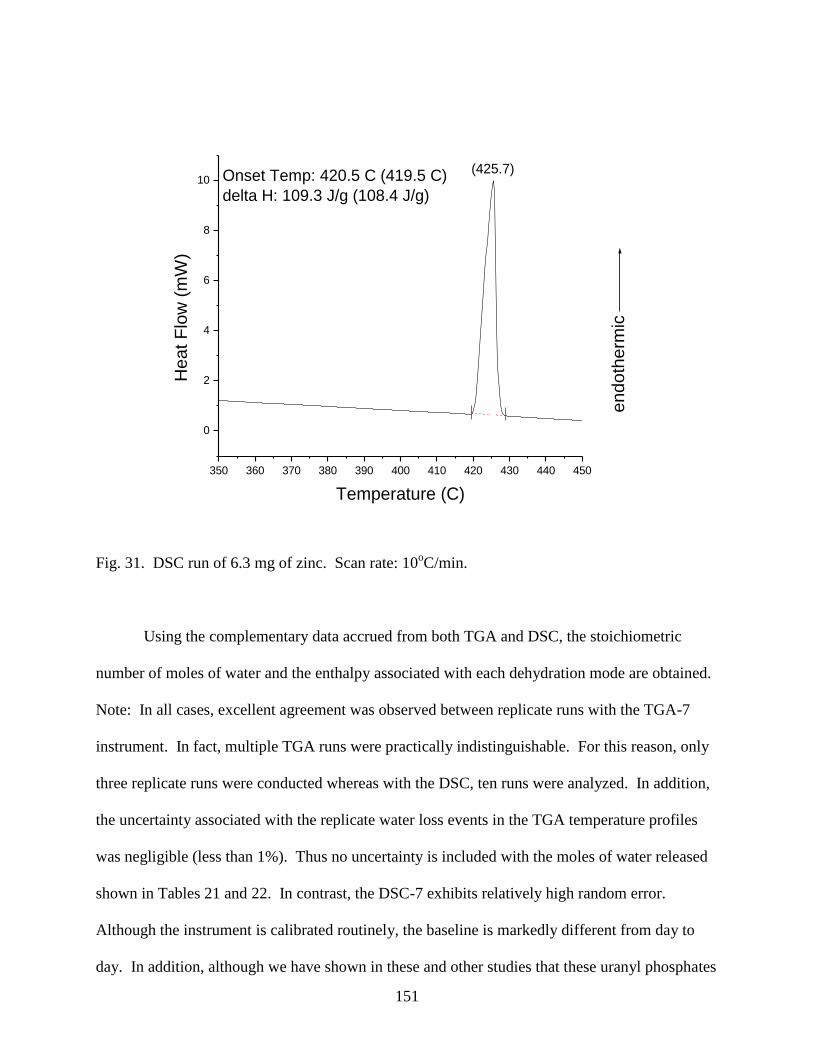
151
Fig. 31. DSC run of 6.3 mg of zinc. Scan rate: 10oC/min.
Using the complementary data accrued from both TGA and DSC, the stoichiometric
number of moles of water and the enthalpy associated with each dehydration mode are obtained.
Note: In all cases, excellent agreement was observed between replicate runs with the TGA-7
instrument. In fact, multiple TGA runs were practically indistinguishable. For this reason, only
three replicate runs were conducted whereas with the DSC, ten runs were analyzed. In addition,
the uncertainty associated with the replicate water loss events in the TGA temperature profiles
was negligible (less than 1%). Thus no uncertainty is included with the moles of water released
shown in Tables 21 and 22. In contrast, the DSC-7 exhibits relatively high random error.
Although the instrument is calibrated routinely, the baseline is markedly different from day to
day. In addition, although we have shown in these and other studies that these uranyl phosphates
350 360 370 380 390 400 410 420 430 440 450
0
2
4
6
8
10
endoth
erm
ic
Onset Temp: 420.5 C (419.5 C)
delta H: 109.3 J/g (108.4 J/g)
(425.7)H
eat F
low
(m
W)
Temperature (C)
152
are crystalline, small amounts of amorphous material may be present, particularly in the
synthetic phases. For these reasons, a total of ten replicate DSC runs were completed for each
material, and thermodynamic analyses were conducted on each individual run. From these
individual runs, ∆Hhyd was determined for the different modes of hydration as outlined above.
The average and standard deviation was taken of these data resulting in the values shown in
Tables 21 and 22 with 1-sigma uncertainty.
The data obtained from both TGA and DSC are shown in Tables 21 and 22 for sodium
autunite and meta autunite respectively. The moles of water were obtained by calculating the
weight loss between the plateau regions of the thermograms at each dehydration event (Figs. 32
and 33; top panels). These dehydration events in the TGA correspond with the endothermic
peaks (Thyd) observed in the DSC (See Figs. 32 and 33 and Tables 21 and 22 respectively). In
the case of physisorbed water, a pseudoplateau is observed (TGA; lowest temperature events)
suggesting that these water molecules are gradually (i.e. continuously) released from the surface
of these solids.
The temperature ranges that encompass the endothermic peaks that were integrated to
obtain ∆Hhyd are shown in Tables 21 and 22. These temperatures represent the average range of
the ten replicate runs for each of the three dehydration modes (physisorption, occlusion,
interstitial-coordinated). The standard deviation (1σ) of the average of the ten runs is indicated
in brackets.
The relatively abrupt dehydration event (both phases) evidenced by the slope changes in
the TGA and corresponding endothermic peaks in the DSC are followed by a slower diffusion of
water from the solid; hence a gradual, shallow slope is observed as the temperature is elevated
past the peak of the event. In the case of the lowest temperature event (both phases) only a
153
shallow negative slope is observed. This is inferred to be physisorbed water and in this case only
gradual diffusion from the surface of the solid is expected. Additionally, although a distinct
plateau is not evident at the highest temperature, the final data points in all runs had indeed
leveled off. Although it is possible that tightly bound waters may be still be present at 773 K, it
is more likely that sodium autunite and meta autunite are almost completely dehydrated at 773 K.
An exothermic event at ca. 313 K is observed in almost all of the DSC runs in this study
(Figs. 32 and 33; bottom panels). And although a broad and relatively minor endothermic event
may be evidenced at a slightly higher temperature (325 K and 328 K, sodium autunite and meta
autunite respectively), which may be attributed to the release of surface water (physisorption), it
is unclear if this is an artifact of the DSC, particularly in the case of Na autunite, since two
events are so close together. Interestingly a small, rather continuous weight loss event is
evidenced in the corresponding TGA profile at roughly the same temperature in Na autunite.
However, due to the exothermic artifact, the event at ca. 325 K was not included in the
thermodynamic analysis of sodium autunite.
In comparing natural meta autunite and synthetic sodium autunite some observations are
noteworthy. The major dehydration event in meta autunite, tentatively attributed to occluded
water at 372 K, is followed by a smaller mode at 446 K which is attributed to coordinated water
within the interstitial region of the mineral. In contrast, the major dehydration mode observed in
Na autunite (422 K) is the highest temperature event and is likewise assigned as interstitial-
coordinated water.
The thermodynamic data presented in Tables 21 and 22 yield somewhat surprising
results. In the case of sodium autunite, the largest enthalpic contribution is attributed to
interstitial-coordinated water, a finding that seems intuitive since the strongest (and thus most
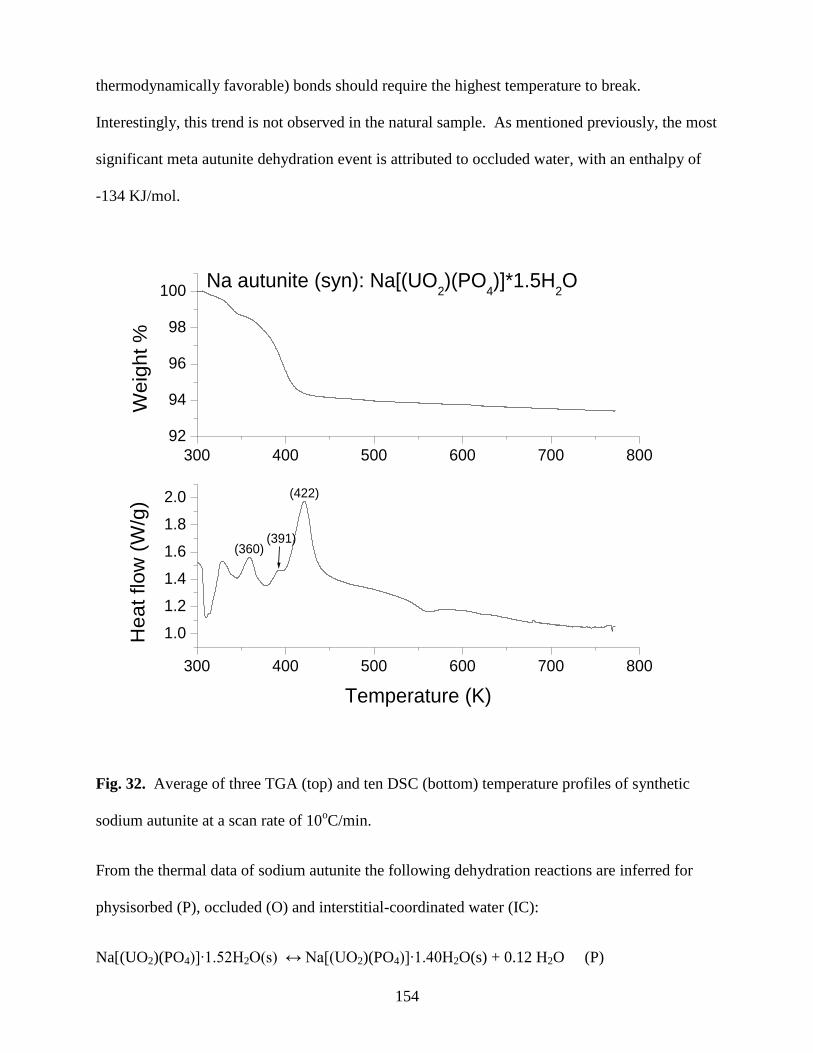
154
thermodynamically favorable) bonds should require the highest temperature to break.
Interestingly, this trend is not observed in the natural sample. As mentioned previously, the most
significant meta autunite dehydration event is attributed to occluded water, with an enthalpy of
-134 KJ/mol.
300 400 500 600 700 800
1.0
1.2
1.4
1.6
1.8
2.0
(360)(391)
(422)
He
at
flo
w (
W/g
)
Temperature (K)
300 400 500 600 700 800
92
94
96
98
100Na autunite (syn): Na[(UO
2)(PO
4)]*1.5H
2O
We
igh
t %
Fig. 32. Average of three TGA (top) and ten DSC (bottom) temperature profiles of synthetic
sodium autunite at a scan rate of 10oC/min.
From the thermal data of sodium autunite the following dehydration reactions are inferred for
physisorbed (P), occluded (O) and interstitial-coordinated water (IC):
Na[(UO2)(PO4)]∙1.52H2O(s) ↔ Na[(UO2)(PO4)]∙1.40H2O(s) + 0.12 H2O (P)

155
Na[(UO2)(PO4)]∙1.40H2O(s) ↔ Na[(UO2)(PO4)]∙1.15H2O(s) + 0.25 H2O (O)
Na[(UO2)(PO4)]∙1.15H2O(s) ↔ Na[(UO2)(PO4)](s) + 1.15 H2O (IC)
The results of these calculations for each dehydration event are depicted in Table 21.
Table 21. Thermodynamic data obtained for synthetic sodium autunite from ten replicate DSC
runs and three replicate TGA runs. Bracketed values represent 1-sigma of the average of ten
replicates from DSC analyses.
Dehydration
Mode
Endothermic
Temperature
Range (K)
Thyd
(K)
∆Hhyd
(KJ/mol)
Moles H2O
released
Physisorbed 345- 377 360 (1) -17.6 (4.6) 0.12
Occluded 378 – 398 391 (1) -2.6 (0.4) 0.25
Coordinated 398 - 444 422 (1) -72.6 (5.6) 1.15
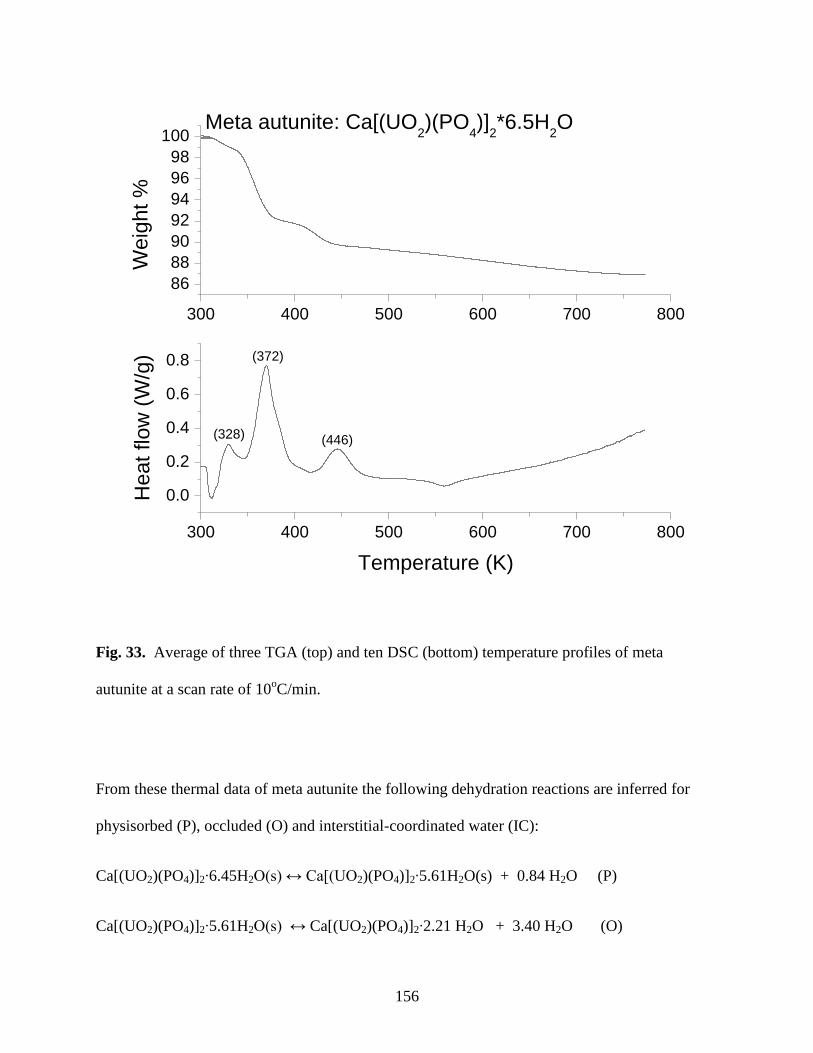
156
300 400 500 600 700 800
0.0
0.2
0.4
0.6
0.8
(446)
(372)
(328)
He
at
flo
w (
W/g
)
Temperature (K)
300 400 500 600 700 800
86
88
90
92
94
96
98
100Meta autunite: Ca[(UO
2)(PO
4)]
2*6.5H
2O
We
igh
t %
Fig. 33. Average of three TGA (top) and ten DSC (bottom) temperature profiles of meta
autunite at a scan rate of 10oC/min.
From these thermal data of meta autunite the following dehydration reactions are inferred for
physisorbed (P), occluded (O) and interstitial-coordinated water (IC):
Ca[(UO2)(PO4)]2∙6.45H2O(s) ↔ Ca[(UO2)(PO4)]2∙5.61H2O(s) + 0.84 H2O (P)
Ca[(UO2)(PO4)]2∙5.61H2O(s) ↔ Ca[(UO2)(PO4)]2∙2.21 H2O + 3.40 H2O (O)
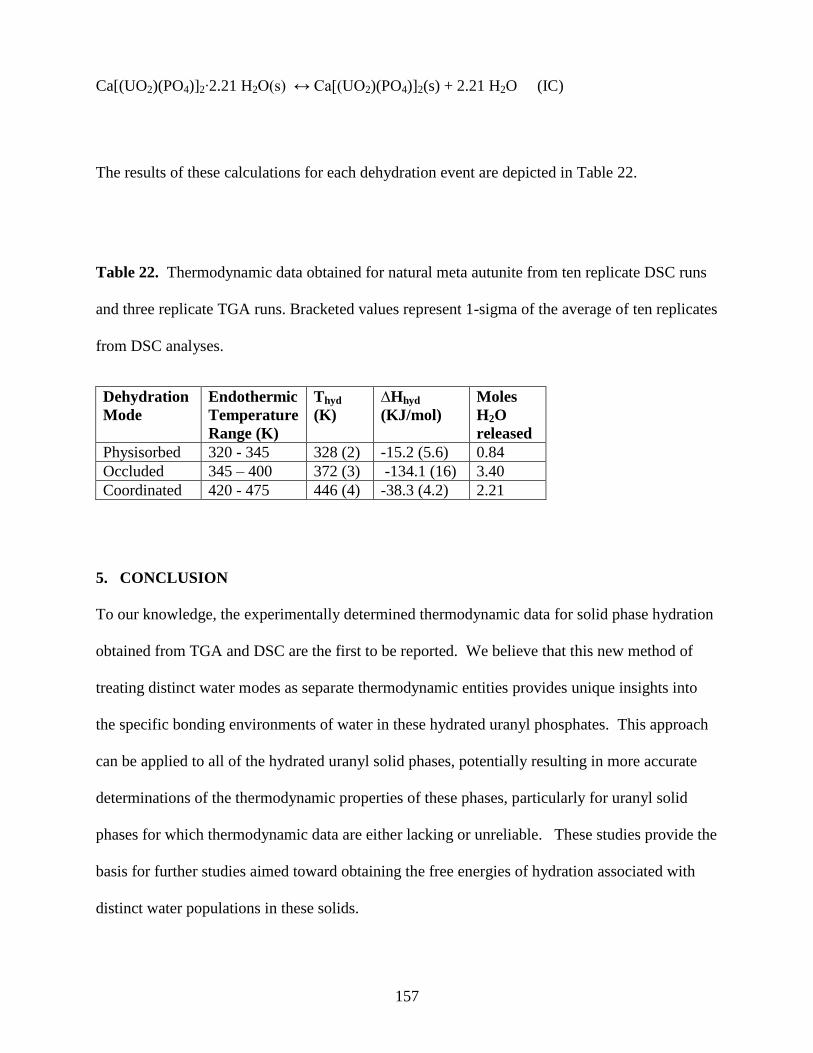
157
Ca[(UO2)(PO4)]2∙2.21 H2O(s) ↔ Ca[(UO2)(PO4)]2(s) + 2.21 H2O (IC)
The results of these calculations for each dehydration event are depicted in Table 22.
Table 22. Thermodynamic data obtained for natural meta autunite from ten replicate DSC runs
and three replicate TGA runs. Bracketed values represent 1-sigma of the average of ten replicates
from DSC analyses.
Dehydration
Mode
Endothermic
Temperature
Range (K)
Thyd
(K)
∆Hhyd
(KJ/mol)
Moles
H2O
released
Physisorbed 320 - 345 328 (2) -15.2 (5.6) 0.84
Occluded 345 – 400 372 (3) -134.1 (16) 3.40
Coordinated 420 - 475 446 (4) -38.3 (4.2) 2.21
5. CONCLUSION
To our knowledge, the experimentally determined thermodynamic data for solid phase hydration
obtained from TGA and DSC are the first to be reported. We believe that this new method of
treating distinct water modes as separate thermodynamic entities provides unique insights into
the specific bonding environments of water in these hydrated uranyl phosphates. This approach
can be applied to all of the hydrated uranyl solid phases, potentially resulting in more accurate
determinations of the thermodynamic properties of these phases, particularly for uranyl solid
phases for which thermodynamic data are either lacking or unreliable. These studies provide the
basis for further studies aimed toward obtaining the free energies of hydration associated with
distinct water populations in these solids.

158
References
Clark, S.B., Ewing, R.C., Schaumloffel, J.C. (1998) A method to predict free energies of
formation of mineral phases in the U(VI) – SiO2 – H2O system. J. Alloys Comp. 271-273.
(189-193).
Cejka, J. Reviews in Mineralogy Vol. 38. Eds. Burns, P.C., Finch, R. (1999) 522-622.
Chen, F., Ewing, R.C., Clark, S.B. (1999) The gibbs free energies and enthalpies of formation
of U6+ phases: An empirical method of prediction. Amer. Mineral. 84. (650-664).
Finch, R. (1997) Thermodynamic stabilities of U(VI) minerals: Estimated and observed
relationships. Mat. Res. Symp. Proc. 465. (1185-1192).
Grenthe, I., Fuger, J., Konings, R.J.M., Lemire, R.J., Muller, A.B., Nguyen-Trung, C., Warner,
H. (1992) Chemical Thermodynamics of Uranium. 713 pp. North-Holland, Amsterdam.
Hawthorne, F.C. (1992) The role of OH and H2O in oxide and oxysalt minerals. Zeit. Fur
Kristall. 201, 183-206.
Hawthorne, F.C., Schindler, M. (2008) Understanding the weakly bonded constituents in
oxysalt minerals. Zeit. Fur Kristall. 223, 41-68.
Pham-Thi, M., Colomban, Ph. J. Less-Common Met. (1989) 189-216.
Schindler, M., Hawthorne, F.C. (2008) The stereochemistry and chemical composition of
interstitial complexes in uranyl-oxysalt minerals. Can. Mineral. 46, 467-501.
Sowder, A.G. PhD dissertation. (1998) Clemson University.
Tardy, Y., Garrels, R.M. (1974) A method of estimating the Gibbs free energies of formation of
layer silicates. Geochim. Cosmochim. Acta 38. 1101-1116.
159
Tardy, Y., Garrels, R.M. (1976) ) Prediction of Gibbs free energies of formation- I.
Relationships among Gibbs free energies of formation of hydroxides, oxides and aqueous
ions. Geochim. Cosmochim. Acta 40. 1051-1056.
Tardy, Y., Garrels, R.M. (1977) Prediction of Gibbs free energies of formation- II. Monovalent
and divalent metal silicates. Geochim. Cosmochim. Acta 41. 87-92.
Wellman, D.M. (2004) Environmental availability of uranium from secondary uranyl minerals.
PhD dissertation, Washington State University.
160
CHAPTER SEVEN
Partitioning of Neodymium into Hydroxylapatite (Ca5(PO4)3OH)
Christopher R. Armstrong and Sue B. Clark
Dept. of Chemistry, Washington State University, Pullman, WA 99164, U.S.A.
Contaminant remediation / Apatite / Radioactive waste disposal / Neodymium / ATR-IR
Summary. In this report the uptake of Nd onto hydroxylapatite (HA: Ca5(PO4)3OH) as a
function of pH at 25oC was investigated. The incorporation of Nd into HA was monitored with
inductively-coupled plasma optical emission spectrometry (ICP-OES), powder x-ray diffraction
(PXRD), and attenuated total reflection infrared (ATR-IR) spectroscopy. Probing both solid and
solution phases provides insight into the mechanism(s) of lanthanide partitioning to
hydroxylapatite. These results show almost complete removal (~ 99%) of 85 ppm Nd
throughout the pH range of ca. 4.5 to 10, and the process for Nd uptake is pH dependent. At
lower pH (ca. 4) a discrete nanocrystalline NdPO4∙xH2O solid precipitated, whereas at pH 10, Nd
partitioning was attributed to isormorphic substitution.
To whom correspondence should be addressed. Tel. 509-335-2911. Email: [email protected]
161
1. INTRODUCTION
Apatite (Ca5(PO4)3X; where X = Cl, F or OH) incorporates a host of polyvalent metal ions and
anionic species while retaining the same overall crystal structure (i.e., isomorphic substitution).
In fact, apatite accommodates half of the periodic table into its lattice arrangement [1]. Although
transition metal ion sequestration by apatite has been extensively studied, mechanistic studies
that define the process(es) of actinide and lanthanide interactions with apatite are rather limited.
One of the earlier U-apatite studies [2] to address this issue determined that
hydroxylapatite (HA) dissolution and subsequent UO2 precipitation effectively removed uranyl
from solution. In separate studies of apatite remediation in an oxidizing environment, Fuller et
al. [3,4] concluded that the predominant uptake mechanism of U onto apatite was sorption
followed by solubility-controlled precipitation resulting in almost complete U removal from the
system. In a similar study of uranyl uptake by apatite, Ohnuki et al. [5] observed sorption
followed by surface mineralization as autunite (uranyl phosphate) precipitated on the surface of
apatite, even though the bulk solution was undersaturated with respect to autunite. Hence, U
uptake was not solubility controlled. Workers from Florida State University [6] were the first to
present sorption edge curves as a function of pH for uranyl sorption onto hydroxylapatite. Knox
et al. [7] investigated Eu3+
(and uranyl) uptake by apatite and observed complete metal removal
by apatite, which they also attributed to a sorption mechanism. In a related study, Martin et al.
[8] specified a cation-exchange process between lanthanide cations (Eu3+
and La3+
) and Ca2+
at
the apatite surface.
Thus, previous studies suggest that both electrostatic and solubility driving forces are at
play in f-element uptake by HA; and these processes may not be mutually exclusive, and are not
well understood. In addition to sample purity, synthetic vs. natural apatite and variations in
surface charge, metal ion properties such as oxidation state, ionic radius, coordination number
and hard/soft acid character all contribute to the process(es) by which a given metal ion is

162
sequestered by apatite. Moreover, the physico-chemical conditions of the system, e.g.,
solution/suspension pH, ionic strength and temperature are also very important factors [9 and
references therein].
The goal of this present study is to use a variety of analytical techniques to investigate the
mechanism(s) of uptake of Nd3+
by HA. Neodymium was investigated in this study because
lanthanides are common uranium fission products. Moreover, Nd3+
is a reasonable chemical
analogue of trivalent actinides such as Am3+
, Cm3+
and Pu3+
[10, 11, 12, 13].
In the present contribution, the removal of Nd by HA as a function of pH was monitored
using inductively-coupled optical emission (ICP-OES) spectrometry, attenuated total reflection
infrared spectroscopy (ATR-IR) and powder x-ray diffraction (PXRD) with the main objective of
elucidating the predominant uptake mechanism(s) in this process. Here we show, for the first
time, a complementary analytical approach, probing both the solid and solution phases, that
affords an effective and reliable interpretation of Nd3+
- HA- H2O systems as a function of pH.
2. EXPERMIMENTAL METHODS AND MATERIALS
2.1 Experimental
All chemicals are reagent grade or higher. To minimize dissolved CO2, all solutions were
prepared with boiled 18 MΩ doubly deionized (DDI) water. The 85 ppm Nd used in these
experiments was prepared from neodymium nitrate salt (Alfa). Standards used for elemental
analyses were of 99.9% purity. The synthetic hydroxylapatite is commercially available (Sigma-
Aldrich). Initially, the HA powder was rinsed repeatedly with degassed 18 MΩ DDI water and
vacuum filtered. The dried HA was subsequently ground with a mortar and pestle to an
approximate 250 µm particle size and stored in a polystyrene bottle with a screw top. The HA-
Nd solids were prepared in a similar manner as that of HA. Suspension pH was measured with a
163
Metrohm pH meter (Model 713) equipped with a Ross combination pH electrode (Orion Model
8102). Prior to each use, the pH electrode was calibrated with NIST standards. HA dissolution
and Nd incorporation was monitored by adjusting the pH with standardized 0.1 M KOH or 0.1 M
HCl solutions via potentiometric titrations using a Mettler-ToledoTM
autotitrator. The duration
of individual experimental runs was typically between five and ten hours. Suspensions were
constantly stirred under an inert N2 atmosphere at 25oC in a jacketed reaction vessel.
Approximately 2 mL samples were extracted via a polystyrene syringe and polypropylene tubing
at roughly 0.5 pH unit intervals. The samples were forced through a 0.2 um polyethersulfone
(PES) filter, acidified with concentrated HNO3, diluted and stored in 15 mL centrifuge tubes for
subsequent ICP-OES analyses. The reaction vessel, stir bar and all the tubing were soaked in a
5% HNO3 acid bath between titration runs. In all cases, duplicate experiments were conducted
and the experimental conditions (e.g., temperature, ionic strength etc.) were held constant.
2.2. Dissolved metal concentrations
Aqueous Nd, Ca and P concentrations were obtained using a Perkin-Elmer Optima 3200 axial
torch ICP-OES with a precision of approximately 5%. For all samples, three replicate intensities
were recorded from which the average and standard deviation was calculated.
2.3 ATR-IR Spectrometry
Measurements were made on solids in this study using a Nicolet 6700 FT-IR spectrometer with
an ATR accessory equipped with a ThermoElectron Smart Nexus Orbit single-reflection
diamond IRE. Spectra were measured between 4000 and 400 cm-1
at 8 cm-1
resolution. A total
of 200 scans were averaged for each sample and background. The system was purged with
desiccated N2 at 30 psi. As noted above, the solid samples were ground with an agate mortar and
pestle and sieved to an approximate 250 µm particle size.
164
2.4 Powder x-ray diffraction (PXRD)
PXRD was performed on fine grained samples (~ 250 µm) of HA under ambient conditions
using a Siemens Kristalloflex D500 diffractometer with the following parameters: Copper
source (Kα; 1.54018 Ǻ); 35 keV, 30 mA, Kβ filter: Ni; scintillation counter detector; Continuous
mode: 0.02d/min; 2θ range: 5-55. The powders were sprinkled onto a zero background glass
slide containing a very thin layer of Vaseline®
(smear mount) to reduce preferred orientation.
The XRD instrument was calibrated prior to each analysis with a corundum (α-Al2O3) external
standard. The diffractograms were produced using supporting MDI Data Scan 4 and Jade 8
software packages.
3. RESULTS AND DISCUSSION
3.1 Hydroxylapatite dissolution and Nd partitioning as a function of pH
The dissolution of HA (Ca5(PO4)3OH) as a function of pH at 25oC is shown in Fig. 34 (open
symbols). In all cases, elevated concentrations of both Ca and P were observed below pH ca. 8,
demonstrating that HA undergoes dissolution when the pH of the system drops below its point of
zero charge (PZC) [14]. At pH values below 5, nearly complete HA dissolution was observed, in
agreement with other studies [15, 16].
A
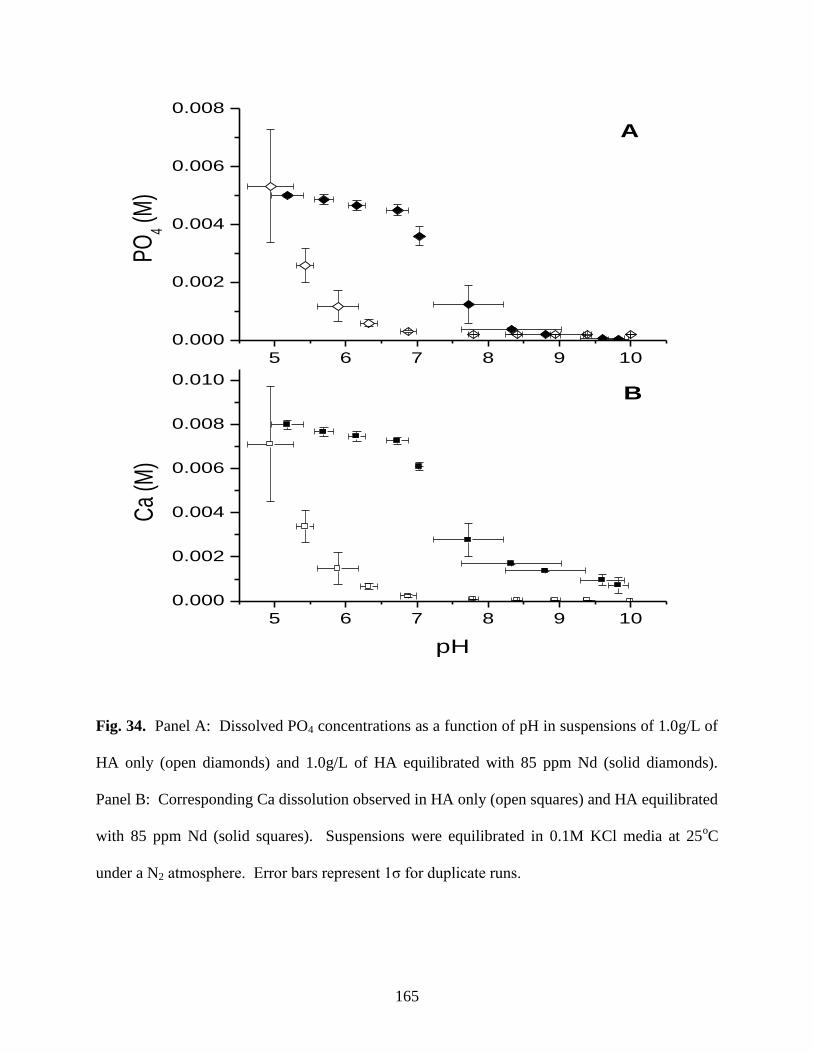
165
5 6 7 8 9 10
0.000
0.002
0.004
0.006
0.008
0.010
5 6 7 8 9 10
0.000
0.002
0.004
0.006
0.008
B
Ca
(M)
pH
AP
O4 (M
)
Fig. 34. Panel A: Dissolved PO4 concentrations as a function of pH in suspensions of 1.0g/L of
HA only (open diamonds) and 1.0g/L of HA equilibrated with 85 ppm Nd (solid diamonds).
Panel B: Corresponding Ca dissolution observed in HA only (open squares) and HA equilibrated
with 85 ppm Nd (solid squares). Suspensions were equilibrated in 0.1M KCl media at 25oC
under a N2 atmosphere. Error bars represent 1σ for duplicate runs.
166
When Nd is present in the system, the dissolution behavior of HA is markedly different
as a function of pH (Fig. 34, solid symbols). These Nd-HA systems did not exhibit a sorption
edge as reported by others [7]. In these studies, near complete (~ 99%) Nd removal was
observed throughout the pH range of these experiments (Fig. 35, panel B). It should be noted
that several of the Nd values are approximately 0.1 ppm, which is approaching the ICP-OES
limit of detection for Nd (401.225 nm emission line) of 0.05 ± 0.01 ppm.
Although Nd removal was nearly complete at all pH values, the presence of Nd in the
system had a rather significant, and pH dependent, effect on HA dissolution. A marked increase
in both Ca and P was observed over a wide pH range (Fig. 34). At circumneutral pHs (ca. 6 –
8), Nd had the most pronounced effect on Ca dissolution where a concentration increase of
approximately 0.007M was observed at ca. pH 6.8. Although a corresponding enhancement in P
dissolution was also observed due to 85 ppm Nd, it occurred over a narrower pH range (pH ca.
5.5 to 8.5) than that of Ca. Significantly, above pH ca. 8, considerable Ca dissolution was
observed, whereas in HA-only systems Ca concentrations remained very low in this pH range.
These results suggest that isomorphic Nd3+
- Ca2+
substitution may be taking place above pH 8.
In addition to the Nd-HA (binary) systems, duplicate 85 ppm Nd, 0.10M KCl
experiments were carried out and are shown in Fig. 35, panel A. These Nd runs serve as a blank
comparison of the binary systems; and thus provide insights into Nd solubility under the
conditions of this study without the influence of HA.
Aqueous Nd concentrations remained relatively constant from ca. pH 2 to 7, but dropped
sharply above pH ca. 7.5. The Nd dissolution data shown in Fig. 35 are in reasonable agreement
with the PHREEQCTM
[17] prediction (Fig. 35, crosses) based upon thermodynamic data shown
in Table 25 (Appendix A). The free Nd3+
species predominates in solution until ca. pH 7.5

167
where Nd hydrolysis and subsequent Nd(OH)3 precipitation controls Nd solubility. These results
clearly show the significant effect that HA has on the removal of Nd from solution, particularly
below pH ca. 7.
5 6 7 8 9 10
0.0
0.5
1.0
1.5
2 3 4 5 6 7 8 9 10 11
0
20
40
60
80
B
pH
A
Nd (
pp
m)
Fig. 35. Dissolved Nd as a function of pH at 25oC under a N2 atmosphere (Panel A, diamonds).
Starting system: 85 ppm Nd, 0.10M KCl. Error bars represent 1σ for duplicate runs. Crosses in
Panel A represent Nd solubility modeled in PHREEQCTM
. Loss of Nd from solution above ca.
pH 7 is largely due to Nd hydrolysis and subsequent Nd(OH)3 precipitation. Panel B shows final
Nd concentrations in a binary system (initially 85 ppm Nd equilibrated with HA in 0.1M KCl).
168
3.2. ATR-IR analysis
To examine the pH dependence of Nd uptake by HA, separate HA solids (with ~ 85 ppm Nd
incorporated into each sample) equilibrated separately at pH 4 and 10 at 25oC in 0.1M KCl were
analyzed with ATR-IR. These spectra are shown in Fig. 36, panels B and C respectively. In
addition, ATR-IR was also performed on synthetic NdPO4 and HA and these spectra are also
shown in Fig. 36, panels A and D respectively. The corresponding band assignments for HA and
NdPO4 shown in Table 23 are consistent with published IR studies of these respective phases
[18, 19].
The phosphate vibrational modes dominate the IR spectra of all of these solids. In fact,
the spectra of HA and NdPO4 are very similar, as these phases feature three PO4 modes that
vibrate at the same frequencies (shown in red in Fig. 36).
The IR spectra of HA and the HA+Nd are virtually identical (Fig. 36), suggesting that no
structural changes have occurred to HA due to the uptake of 85 ppm Nd at pH 10. Thus, under
alkaline conditions where the net surface charge of HA is expected to be negative [14], it is
likely that Nd partitioning is largely due to electrostatically-driven isomorphic substitution, as
noted above.
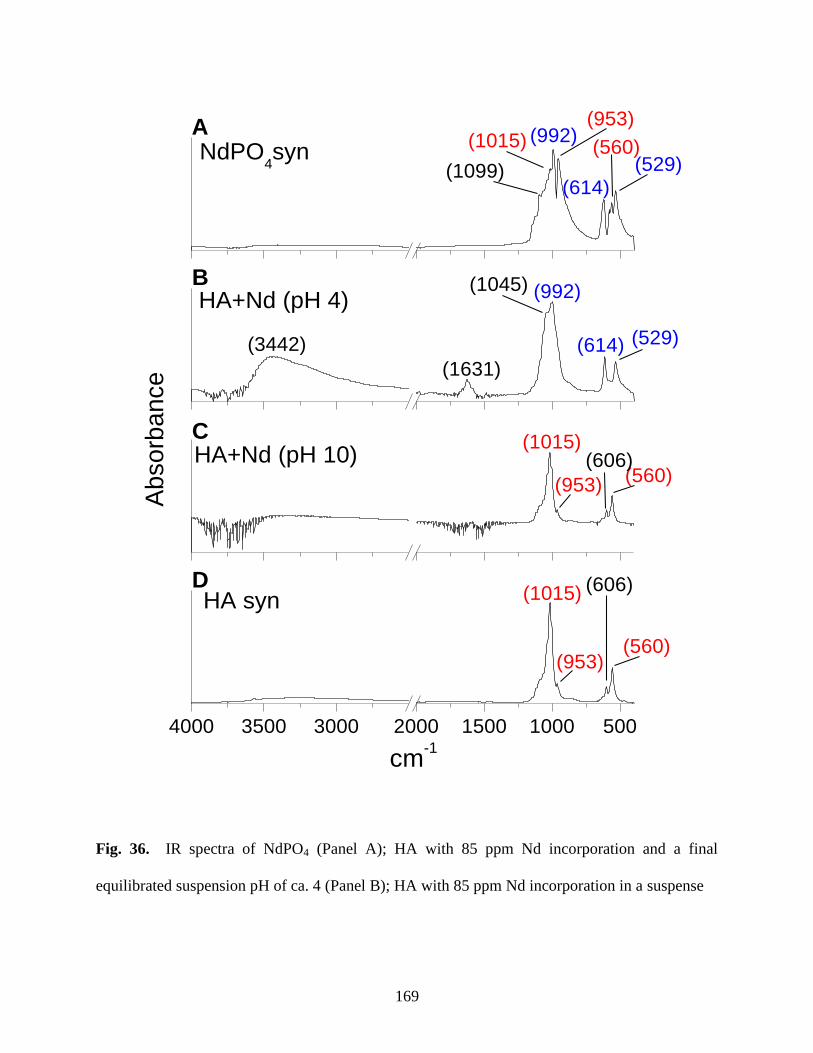
169
4000 3500 3000 2000 1500 1000 500
(606)
(953)
(1015)
(1015)
HA syn
cm-1
D
C
(560)
(560)(606)
(953)
HA+Nd (pH 10)
B
(614)
(992)(1045)
(1631)
(3442)
HA+Nd (pH 4)
A
(529)
(529)(560)
(614)
(953)(992)(1015)
(1099)NdPO
4syn
Ab
so
rba
nce
Fig. 36. IR spectra of NdPO4 (Panel A); HA with 85 ppm Nd incorporation and a final
equilibrated suspension pH of ca. 4 (Panel B); HA with 85 ppm Nd incorporation in a suspense
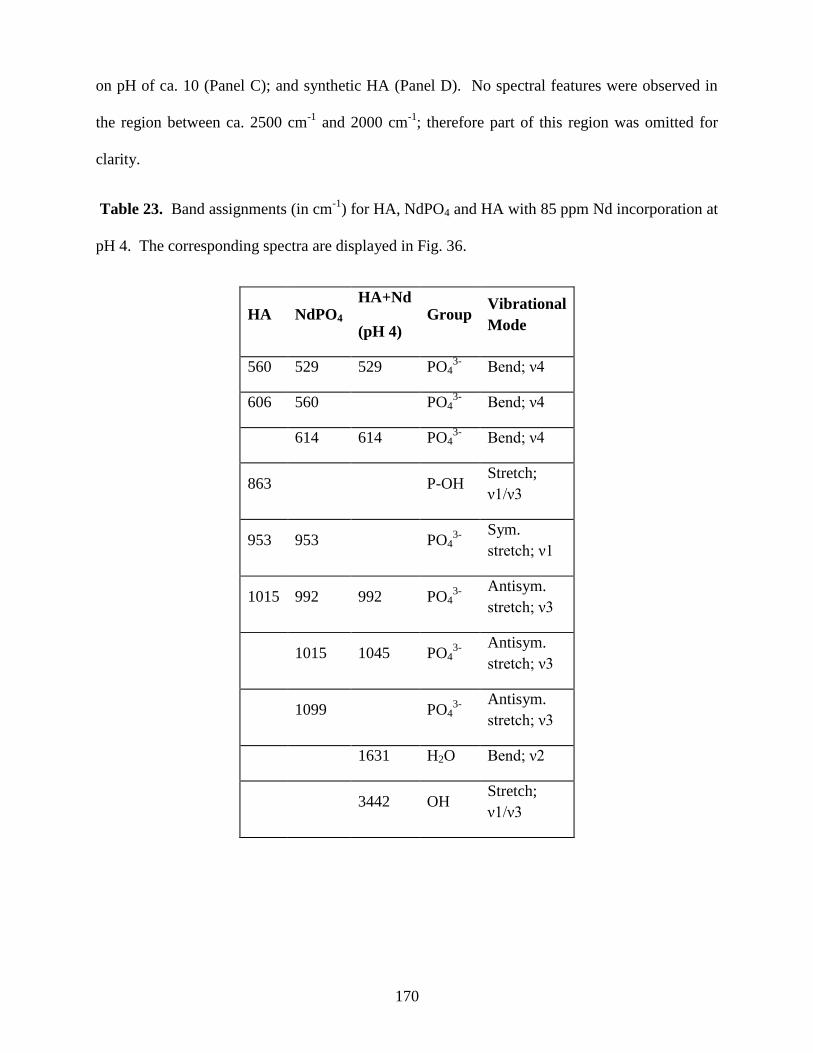
170
on pH of ca. 10 (Panel C); and synthetic HA (Panel D). No spectral features were observed in
the region between ca. 2500 cm-1
and 2000 cm-1
; therefore part of this region was omitted for
clarity.
Table 23. Band assignments (in cm-1
) for HA, NdPO4 and HA with 85 ppm Nd incorporation at
pH 4. The corresponding spectra are displayed in Fig. 36.
HA NdPO4
HA+Nd
(pH 4) Group
Vibrational
Mode
560 529 529 PO43-
Bend; ν4
606 560 PO43-
Bend; ν4
614 614 PO43-
Bend; ν4
863 P-OH Stretch;
ν1/ν3
953 953 PO43-
Sym.
stretch; ν1
1015 992 992 PO43-
Antisym.
stretch; ν3
1015 1045 PO43-
Antisym.
stretch; ν3
1099 PO43-
Antisym.
stretch; ν3
1631 H2O Bend; ν2
3442 OH Stretch;
ν1/ν3
171
Although the IR spectrum of the HA-Nd solid equilibrated at pH 10 is indistinguishable
from that of HA, it is very different than the solid equilibrated at pH 4. In fact, three of the
phosphate modes of the pH 4 solid match those of NdPO4 (Alfa) shown in blue in Fig. 36. These
findings suggest that at low pH NdPO4 precipitation has occurred at the expense of HA.
Interestingly, the pH 4 HA-Nd solid is hydrated, as evidenced by the broad stretching (v1/v3)
OH modes centered at 3442 cm-1
and a bending (v2 H2O) mode centered at 1631 cm-1
. This
finding is indicative of the precipitation of a neodymium phosphate phase with the rhabdophane
crystal structure, NdPO4∙xH2O [20].
3.3 PXRD
Samples of HA, NdPO4, HA-Nd (pH 4) and HA-Nd (pH 10) were analyzed by PXRD and,
where possible, compared to published powder diffraction files (PDFs). The HA diffractogram,
shown in Fig. 37, is in very good agreement with PDF # 76-0694 (bottom panel). In addition,
the NdPO4 sample also shown in Fig. 37 is consistent with PDF # 46-1328 (top panel).
The Nd-HA pH 10 diffractogram is also shown in Fig. 37 (bottom panel). Although the
reflections are both broader and more intense, the XRD pattern of the Nd-HA pH 10 sample is in
good agreement with both the synthetic HA and the synthetic HA PDF# 76-0694 (bottom panel),
suggesting that Nd is not having a significant effect on the HA structure, thus further supporting
the hypothesis of isomorphic Nd-Ca substitution, at pH 10. The increased intensity in the Nd-
HA sample relative to HA may be the result of an increase in the crystal size in the former phase
due to the fact that the equilibrated HA-Nd suspension was allowed to age unstirred for several
months prior to PXRD analysis. In a separate study in this laboratory, a similar increase in XRD
172
peak intensity was observed due to hydrothermal treatment of HA; and scanning electron
microscopy (SEM) results strongly suggested an increase in macrocrystallinity.

173
20 25 30 35 40 45 50 55
20 25 30 35 40 45 50 55
HA
HA+Nd (pH 10)
PDF#76-0694
Inte
nsity (
a.u
.)
2 Theta
PDF#46-1328
NdPO4
HA+Nd (pH 4)
Fig. 37. XRD patterns of HA and Nd solid equilibrated at pH 10 (top), HA (middle) and HA
PDF# 76-0694 (bottom).
174
The Nd-HA pH 4 diffractogram is shown in Fig. 37 (top). Several of the major peaks of
the pH 4 solid match those of the synthetic NdPO4 (Alfa) and the corresponding NdPO4 PDF #
46-1328 (top panel). Additionally, the only peaks that match the HA PDF # 76-0694 are also
consistent with the NdPO4 pattern. Hence, similarities between HA and NdPO4 due to the PO4
ligand evidenced in the IR spectrum (Fig. 36) also emerge in the PXRD data. Thus, in
agreement with IR data, NdPO4 appears to be the predominant phase in the Nd-HA pH 4 solid.
Additionally, in marked contrast to the pH 10 residue, the pH 4 powder features broad XRD
peaks with relatively low intensity suggesting a significant contribution of nanocrystalline
material. This finding is consistent with the rapid precipitation (e.g., tens of minutes) of NdPO4
at pH 4 hypothesized in this study. Moreover, our results are in agreement with Köhler et al.
[20] who also reported the precipitation of nanocrystalline rhabdophane (NdPO4∙xH2O) on the
surface of apatite.
3.4. Chemical digestion
To monitor the molar ratios of Nd, Ca and P in the solids in this study, duplicate samples of
roughly 10 mg were digested in concentrated nitric acid and diluted to 100 mL in a volumetric
flask with boiled 18 MΩ DDI water and subsequently analyzed for metal ion content with ICP-
OES. The molar ratios of each analyte represent the average of the duplicate samples (± 5%) for
each solid and are shown in Table 24.
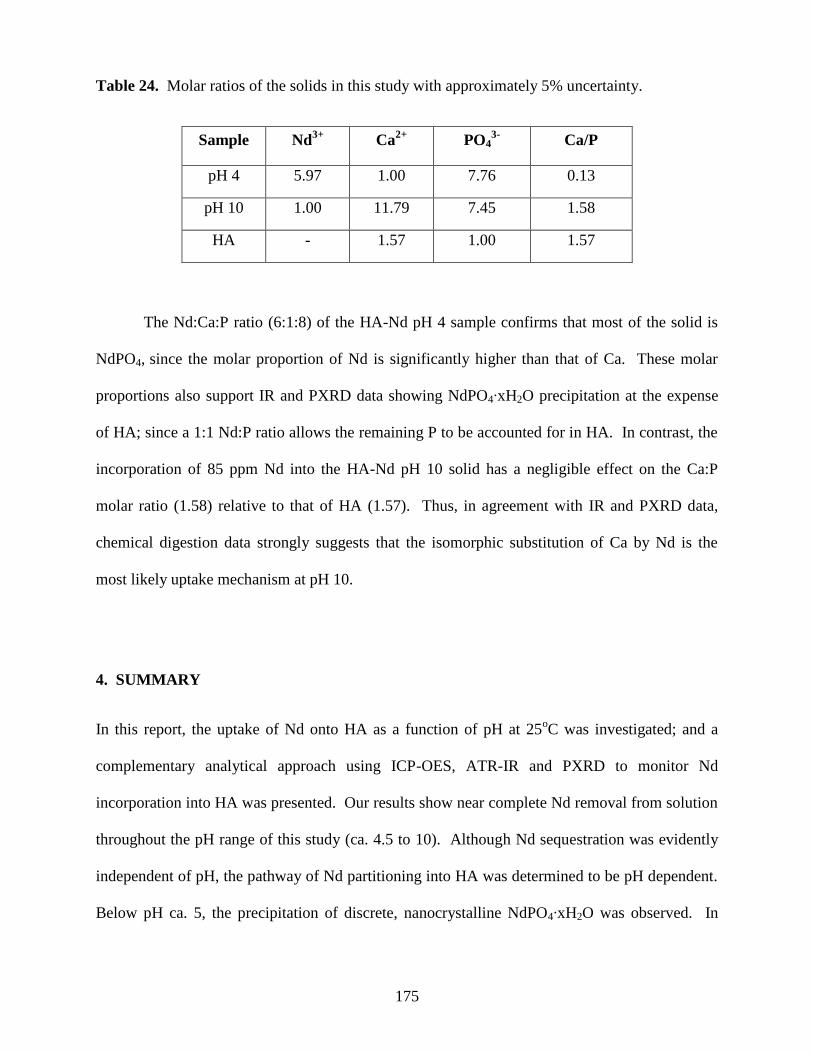
175
Table 24. Molar ratios of the solids in this study with approximately 5% uncertainty.
Sample Nd3+
Ca2+
PO43-
Ca/P
pH 4 5.97 1.00 7.76 0.13
pH 10 1.00 11.79 7.45 1.58
HA - 1.57 1.00 1.57
The Nd:Ca:P ratio (6:1:8) of the HA-Nd pH 4 sample confirms that most of the solid is
NdPO4, since the molar proportion of Nd is significantly higher than that of Ca. These molar
proportions also support IR and PXRD data showing NdPO4∙xH2O precipitation at the expense
of HA; since a 1:1 Nd:P ratio allows the remaining P to be accounted for in HA. In contrast, the
incorporation of 85 ppm Nd into the HA-Nd pH 10 solid has a negligible effect on the Ca:P
molar ratio (1.58) relative to that of HA (1.57). Thus, in agreement with IR and PXRD data,
chemical digestion data strongly suggests that the isomorphic substitution of Ca by Nd is the
most likely uptake mechanism at pH 10.
4. SUMMARY
In this report, the uptake of Nd onto HA as a function of pH at 25oC was investigated; and a
complementary analytical approach using ICP-OES, ATR-IR and PXRD to monitor Nd
incorporation into HA was presented. Our results show near complete Nd removal from solution
throughout the pH range of this study (ca. 4.5 to 10). Although Nd sequestration was evidently
independent of pH, the pathway of Nd partitioning into HA was determined to be pH dependent.
Below pH ca. 5, the precipitation of discrete, nanocrystalline NdPO4∙xH2O was observed. In
176
contrast, at pH 10, no structural alterations of HA were evidenced; thus we conclude that
isomorphic Nd-Ca substitution to be the most likely Nd partitioning pathway.
These studies show that although apatite amendments offer promise for in situ actinide
remediation, pH plays a key role in the chemistry of these aqueous systems. Sorption
mechanisms are thus envisaged in pHs above the PZC of HA (ca. 8) where (1) cation exchange is
likely to take place and, (2) HA solubility is relatively low. In contrast, HA dissolution and
subsequent actinide phosphate precipitation is expected below the PZC and particularly below
pH 5.
Acknowledgements
This work was supported primarily by the U.S. Department of Energy, Basic Energy Sciences,
Heavy Element Chemistry program, contract DE-FG02-06ER15782. In addition, SBC and CRA
gratefully acknowledge support from the Joint Domestic Nuclear Detection Office-National
Science Foundation: Academic Research Initiative (ARI), contract number ECCS-0833548
during the preparation of this manuscript.
177
References
1. Hughes, J.M., Rakovan, J. In: Phosphates: Geochemical, geobiological, and Materials
Importance. Kohn, M.J., Rakovan J., Hughes, J.M., Eds. Reviews in Mineralogy, 48,
Mineralogical Society of America: Washington, DC. (2002).
2. Jeanjean, J., Rouchaud, J.C., Tran, L., Federoff, M. J. Radioanal. Nucl. Chem., Lett. 6, 529
(1995).
3. Fuller, C.C, Bargar, J.R., Davis, J.A., Piana, M.J. Environ. Sci. Technol. 36, 158 (2002).
4. Fuller, C.C, Bargar, J.R., Davis, J.A. Environ. Sci. Technol. 37, 4642 ( 2003).
5. Ohnuki, T., Kozai, N., Samadfam, M., Yasuda, R., Yamamoto, S., Narumi, K., Naramoto, H.,
Murakami, T. Chem. Geol. 211, 1 (2004).
6. Thakur, P., Moore, R.C., Choppin, G.R. Radiochim. Acta 93, 385 (2005).
7. Knox, A.S., Kaplan, D.I., Adriano, D.C., Hinton, T.G., Wilson, M.D. J. Environ. Qual. 32,
515 (2003).
8. Martin, P., Carlot, G., Chevarier, A., Den-Auwer, C., Panczer, G. J. Nucl. Mat. 275, 268
(1999).
9. Xu, Y., Schwartz, F.W. Environ. Sci. Technol. 28, 1472 (1994).
10. Choppin, G.R. J. Less-Common Metals 93, 323 (1983).
11. Choppin, G.R. J. Less-Common Met. 126, 307 (1986).
12. Choppin, G.R. Mar. Chem. 28, 19 (1989).
13. Nitsche, H. Basic research for assessment of geologic nuclear waste repositories: What
solubility and speciation studies of transuranium elements can tell us. Paper presented at the

178
Intl. Symp. on Sci. Basis for Nuclear Waste Management, Boston, MA Conf. Proceedings
(1990).
14. Armstrong, C.R. PhD dissertation. Washington State University, USA (2009).
15. Dorozhkin, S.V. J. Coll. Int. Sci. 191, 489 (1997).
16. Dorozhkin, S.V. J. Cryst. Growth 182, 133 (1997).
17. Parkhurst, D.L., Appelo, C.A.J. Users guide to PHREEQC (Version 2). A computer
program for speciation, batch reaction, one dimensional transport and inverse geochemical
calculations. U.S. Geological Survey Water Resources Investigations Report 99-4259
(1999).
18. Fowler, B.O. Inorg. Chem. 13, 194 (1974).
19. Ross, S.D. In: The Infrared Spectra of Minerals. Ed. Farmer, V.C. Mineralogical Society,
London (1974).
20. Köhler, S.J., Harouiya, N., Chaïrat, C., Oelkers, E.H. Chem. Geol. 222, 168 (2005).
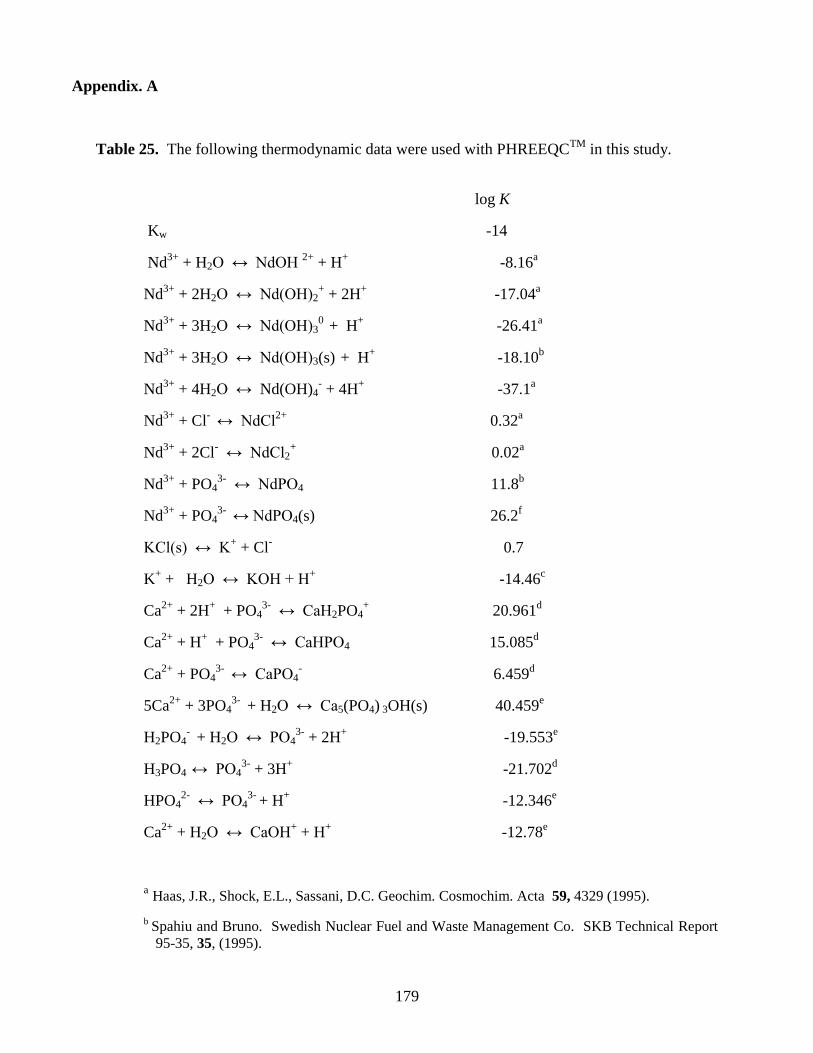
179
Appendix. A
Table 25. The following thermodynamic data were used with PHREEQCTM
in this study.
log K
Kw -14
Nd3+
+ H2O ↔ NdOH 2+
+ H+
-8.16a
Nd3+
+ 2H2O ↔ Nd(OH)2+ + 2H
+ -17.04
a
Nd3+
+ 3H2O ↔ Nd(OH)30
+ H
+ -26.41
a
Nd3+
+ 3H2O ↔ Nd(OH)3(s) +
H
+ -18.10
b
Nd3+
+ 4H2O ↔ Nd(OH)4- + 4H
+ -37.1
a
Nd
3+ + Cl
- ↔ NdCl
2+ 0.32
a
Nd3+
+ 2Cl- ↔ NdCl2
+ 0.02
a
Nd3+
+ PO43-
↔ NdPO4 11.8b
Nd3+
+ PO43-
↔ NdPO4(s) 26.2
f
KCl(s) ↔ K+ + Cl
- 0.7
K+ + H2O ↔ KOH + H
+ -14.46
c
Ca2+
+ 2H+
+ PO43-
↔ CaH2PO4+ 20.961
d
Ca2+
+ H+
+ PO43-
↔ CaHPO4 15.085d
Ca2+
+ PO43-
↔ CaPO4
- 6.459
d
5Ca2+
+ 3PO43-
+ H2O ↔ Ca5(PO4) 3OH(s) 40.459
e
H2PO4- + H2O ↔ PO4
3- + 2H
+ -19.553
e
H3PO4 ↔ PO4
3- + 3H
+ -21.702
d
HPO42-
↔ PO43-
+ H+
-12.346e
Ca2+
+ H2O ↔ CaOH+ + H
+ -12.78
e
a Haas, J.R., Shock, E.L., Sassani, D.C. Geochim. Cosmochim. Acta 59, 4329 (1995).
b Spahiu and Bruno. Swedish Nuclear Fuel and Waste Management Co. SKB Technical Report
95-35, 35, (1995).
180
c Baes and Mesmer. Hydrolysis of Cations. John Wiley and Sons, New York, N.Y. (1976).
d Guillamont, R., Fanghanel, T., Fuger, J., Grenthe, I., Neck, V., Palmer, D.A., Rand, M.H.
Update on the Chemical Thermodynamics of Uranium, Neptunium, Plutonium, Americium,
and Technetium. Chemical Thermodynamics, Vol. 5. Elsevier Science Publishers,
Amsterdam, North-Holland (2003).
e Wateq4F
f Liu, X. and Byrne, R.H. Geochim. Cosmochim. Acta 61, 1625 (1997).
181
Appendix B.
HA surface area determination
Surface area calculations are necessary in order to approximate the number of sorbate molecules
that bind to a given surface. The sorptive properties of a given material in equilibrium with an
aqueous solution are proportional to its surface area and specific surface charge (Langmuir,
1997). This experimentally determined value is also a very important input parameter in
geochemical codes, without which, sorption modeling would likely not be possible. Also, small
discrepancies in surface area values (e.g., values obtained from solid phases with varying purity
and crystallinity) can result in erroneous data. Therefore, surface area and surface charge
investigations are fundamental preliminary steps in most mineral-water studies.
The surface area (m2/g) of synthetic hydroxylapatite purchased from Sigma-Aldrich was
determined using two different approaches: 1) The BET method; 2) The methylene blue (MB)
method according to Giles and Nakhwa (1962). The results of HA surface area determination by
the BET method can be seen in Table 26. Surface area determination by the MB method was
conducted as follows.
Experiments were conducted by varying the concentrations of aqueous MB while
keeping the HA concentration constant at 1.0g/L. Batch sorption experiments were conducted at
circumneutral pH. Samples were equilibrated overnight by agitation at 275 rpm, filtered with 0.2
µm PES filters and analyzed by a Cary 14 UV-VIS spectrophotometer at 665 nm. A calibration
curve was obtained for known MB concentrations (Fig. 38).
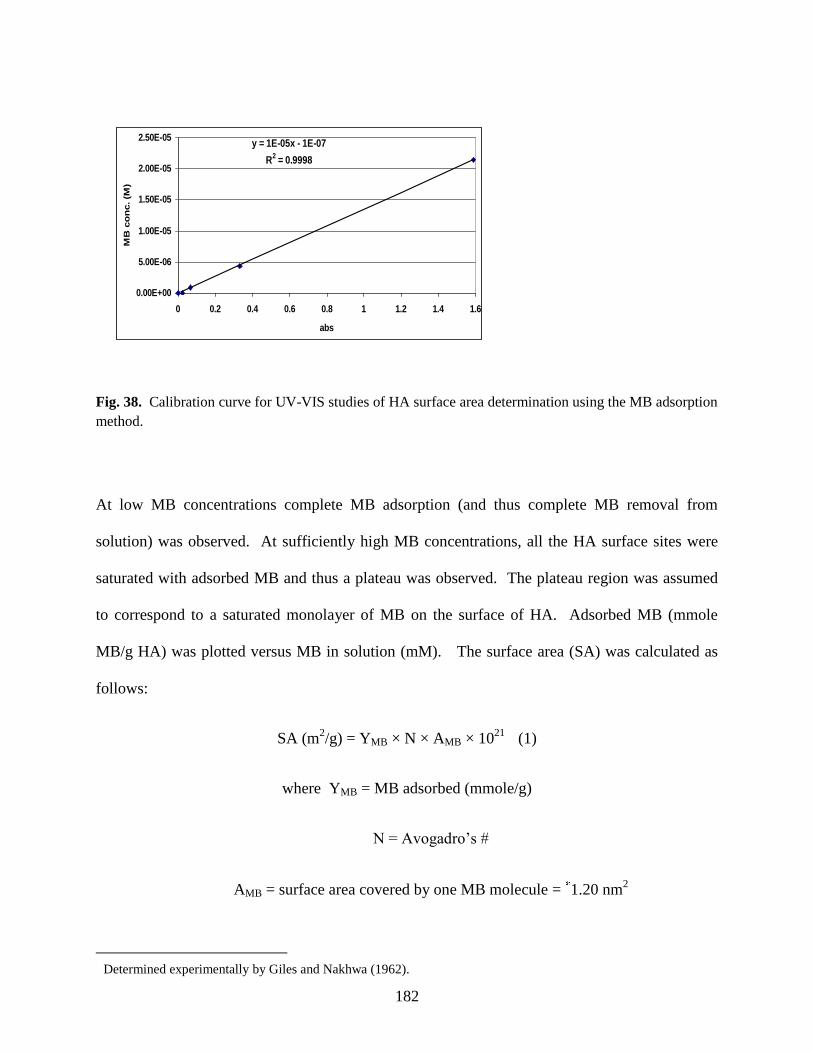
182
y = 1E-05x - 1E-07
R2 = 0.9998
0.00E+00
5.00E-06
1.00E-05
1.50E-05
2.00E-05
2.50E-05
0 0.2 0.4 0.6 0.8 1 1.2 1.4 1.6
abs
MB
co
nc. (M
)
Fig. 38. Calibration curve for UV-VIS studies of HA surface area determination using the MB adsorption
method.
At low MB concentrations complete MB adsorption (and thus complete MB removal from
solution) was observed. At sufficiently high MB concentrations, all the HA surface sites were
saturated with adsorbed MB and thus a plateau was observed. The plateau region was assumed
to correspond to a saturated monolayer of MB on the surface of HA. Adsorbed MB (mmole
MB/g HA) was plotted versus MB in solution (mM). The surface area (SA) was calculated as
follows:
SA (m2/g) = YMB × N × AMB × 10
21 (1)
where YMB = MB adsorbed (mmole/g)
N = Avogadro’s #
AMB = surface area covered by one MB molecule = 1.20 nm2
Determined experimentally by Giles and Nakhwa (1962).
183
The results of this and other studies are displayed in Table 26. With the exception of the Bell
and coworkers (1972) study, the calculated surface area of 51.6m2/g is comparable to other
studies. It should be noted that the other studies obtained surface area data via the BET method.
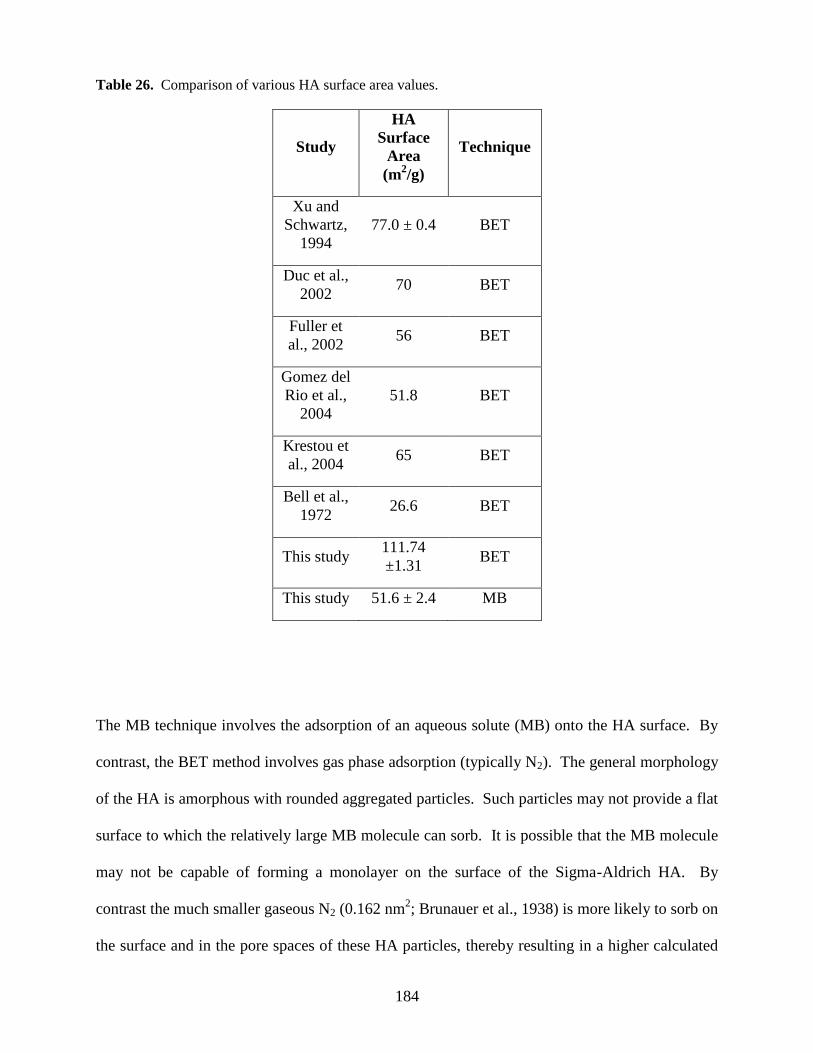
184
Table 26. Comparison of various HA surface area values.
Study
HA
Surface
Area
(m2/g)
Technique
Xu and
Schwartz,
1994
77.0 ± 0.4 BET
Duc et al.,
2002 70 BET
Fuller et
al., 2002 56 BET
Gomez del
Rio et al.,
2004
51.8 BET
Krestou et
al., 2004 65 BET
Bell et al.,
1972 26.6 BET
This study 111.74
±1.31 BET
This study 51.6 ± 2.4 MB
The MB technique involves the adsorption of an aqueous solute (MB) onto the HA surface. By
contrast, the BET method involves gas phase adsorption (typically N2). The general morphology
of the HA is amorphous with rounded aggregated particles. Such particles may not provide a flat
surface to which the relatively large MB molecule can sorb. It is possible that the MB molecule
may not be capable of forming a monolayer on the surface of the Sigma-Aldrich HA. By
contrast the much smaller gaseous N2 (0.162 nm2; Brunauer et al., 1938) is more likely to sorb on
the surface and in the pore spaces of these HA particles, thereby resulting in a higher calculated
185
surface area. This hypothesis could be tested by conducting BET and MB analyses on the Parr
bomb HA samples. The flat, plate-like surfaces of the Parr bomb HA samples may provide
relatively similar sorbent surfaces for both N2 and the larger MB molecule. As such, closer
agreement between the calculated surface area values using both methods is expected.
186
Appendix C.
HA surface charge and PZC determination
Many natural and synthetic mineral phases exhibit a pH dependent surface charge. That is, the
surface of the mineral in contact with the bulk solution typically exhibits a positive net charge at
sufficiently low pH primarily due to protonation of surface sites and a negative net charge at high
pH chiefly due to deprotonation. The point of zero charge (PZC) is the pH at which the net
surface charge is zero. The PZC is independent of ionic strength; thus, titrations conducted with
varying ionic strength tend to converge at the PZC (Fig. 39). For systems involving the
adsorption of solutes other than H+, the PZC allows one to qualitatively predict the pH range of
optimal metal or ligand adsorption.
The specific surface charge of HA was determined experimentally by conducting
potentiometric titrations using a Mettler-Toledo autotitrator. A 200 mL solution of either 0.01M
or 0.1M KCl was mixed with 0.20 g of HA and allowed to equilibrate overnight under N2
atmosphere at 250 C in a jacketed borosilicate reaction vessel connected to a Thermo-Haake
circulating water (and propylene glycol) bath. A Ross combination glass electrode was
calibrated with standard solutions of either KOH and KCl or HCl and KCl attaining ionic
strengths of 0.01M or 0.1M. Therefore, activity coefficients were assumed to be unity and pcH
(designated hereafter as pH) was measured for all the experiments. In all cases, titrants of
standardized 0.1M KOH for forward titrations and 0.1M HCl for reverse titrations were used.
The surface charge of HA was determined as a function of pH using the following
equations (Stumm, 1992).
Mean surface charge:
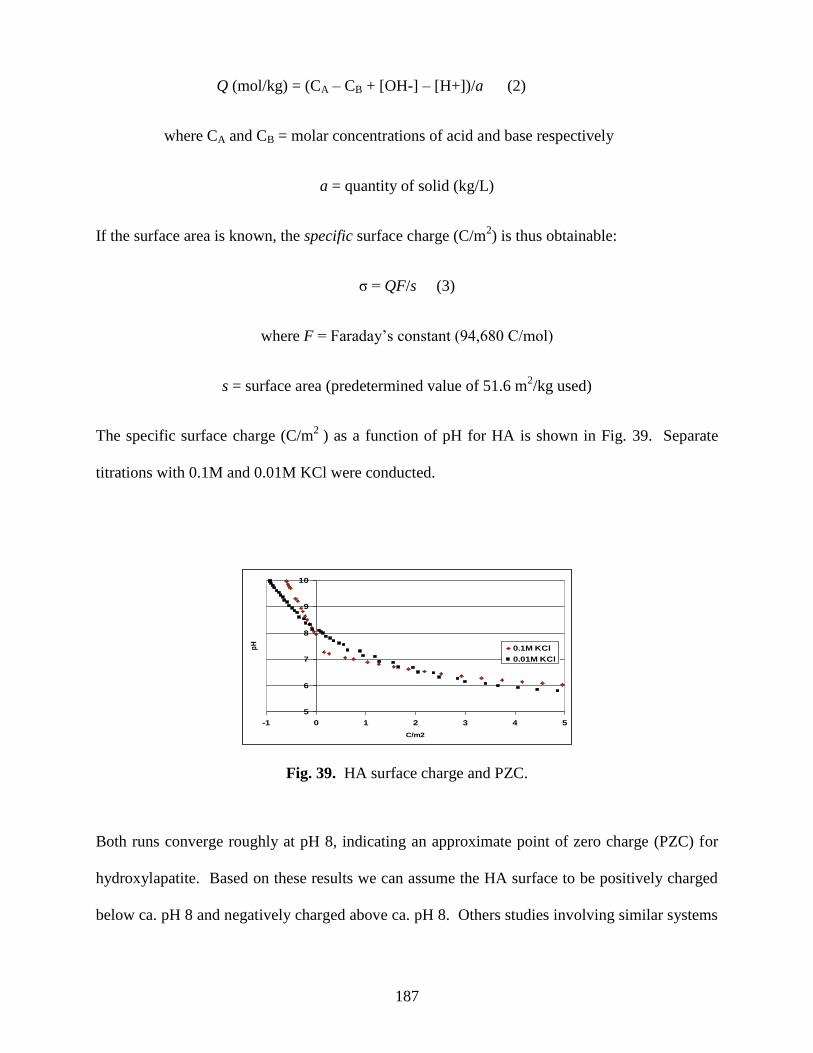
187
5
6
7
8
9
10
-1 0 1 2 3 4 5
C/m2
pH
0.1M KCl
0.01M KCl
Q (mol/kg) = (CA – CB + [OH-] – [H+])/a (2)
where CA and CB = molar concentrations of acid and base respectively
a = quantity of solid (kg/L)
If the surface area is known, the specific surface charge (C/m2) is thus obtainable:
σ = QF/s (3)
where F = Faraday’s constant (94,680 C/mol)
s = surface area (predetermined value of 51.6 m2/kg used)
The specific surface charge (C/m2
) as a function of pH for HA is shown in Fig. 39. Separate
titrations with 0.1M and 0.01M KCl were conducted.
Fig. 39. HA surface charge and PZC.
Both runs converge roughly at pH 8, indicating an approximate point of zero charge (PZC) for
hydroxylapatite. Based on these results we can assume the HA surface to be positively charged
below ca. pH 8 and negatively charged above ca. pH 8. Others studies involving similar systems
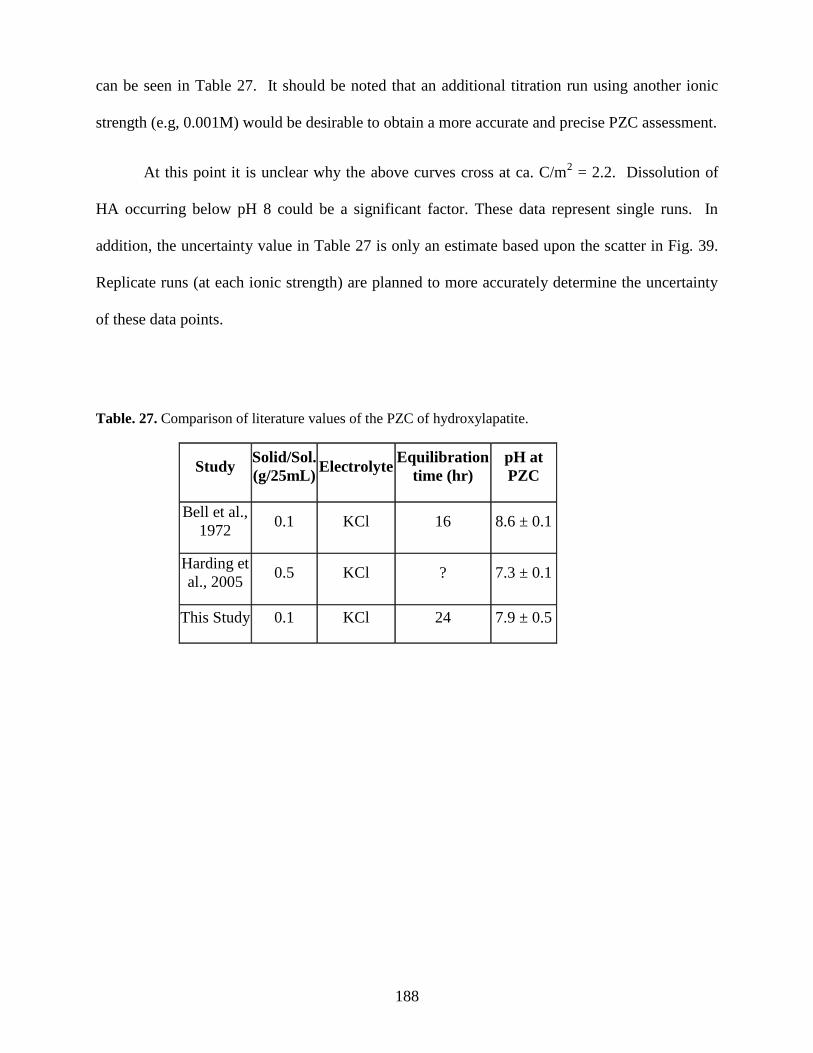
188
can be seen in Table 27. It should be noted that an additional titration run using another ionic
strength (e.g, 0.001M) would be desirable to obtain a more accurate and precise PZC assessment.
At this point it is unclear why the above curves cross at ca. C/m2 = 2.2. Dissolution of
HA occurring below pH 8 could be a significant factor. These data represent single runs. In
addition, the uncertainty value in Table 27 is only an estimate based upon the scatter in Fig. 39.
Replicate runs (at each ionic strength) are planned to more accurately determine the uncertainty
of these data points.
Table. 27. Comparison of literature values of the PZC of hydroxylapatite.
Study Solid/Sol.
(g/25mL) Electrolyte
Equilibration
time (hr)
pH at
PZC
Bell et al.,
1972 0.1 KCl 16 8.6 ± 0.1
Harding et
al., 2005 0.5 KCl ? 7.3 ± 0.1
This Study 0.1 KCl 24 7.9 ± 0.5
189
CHAPTER EIGHT
CONCLUSION
The overall goal of this study was to conduct a rigorous investigation into the chemistry of
various hydrated uranyl phosphates. These phases are important primarily from an
environmental remediation perspective. Here we have attempted to model natural processes
where f-elements are expected to interact with phosphates in aqueous systems. Although it has
been known for some time that phosphate solid phases resulting from both natural and
anthropogenic means are highly recalcitrant, and, generally speaking, expected to effectively
sequester f-elements, the thermodynamic properties and fundamental structure of these phases
are not well understood. For these reasons, we have undertaken primarily a characterization and
thermodynamic investigation of selected hydrated uranyl phosphates. Highlights of the findings
in this study are as follows.
We synthesized and characterized a mixed lanthanide-actinide phosphate, namely
francoisite-(Nd) and discussed the viability of encountering such a phase in scenarios where low
level radioactive waste or spent nuclear fuel comes in contact with aqueous phosphate (Chapter
Two).
We illustrated problems associated with characterizing hydrated uranyl phosphates with
powder XRD alone; instead we argued that a complementary approach is required and a viable
and effective strategy is outlined (Chapter Three). We propose that implementing the strategy
outlined therein will afford greater confidence in data obtained from experimental
thermodynamic studies such as solubility and sorption.
The complete conversion of one hydrated uranyl phophate into another, namely
chernikovite to TDT is reported and a fundamental structural transformation is observed
190
(Chapter Four). In this study the importance of rigorously characterizing these synthetic uranyl
materials is underscored since chernikovite and TDT can be easily confused during synthesis,
potentially leading to highly erroneous thermodynamic interpretations.
Thermodynamic data for most uranyl-bearing materials are lacking at elevated
temperatures; and, to obtain a more complete understanding of the chemical equilibria in nuclear
waste packages, studies above room temperature are required. We investigated the temperature
dependence of the solubility of TDT, at 23 and 50oC. The temperature dependence was notable
at some, but not all of the ionic strengths investigated (Chapter Five). In systems with ionic
strengths higher than 0.5m NaClO4, i.e., 1.0 to 5.0m, the conversion of TDT to Na autunite was
observed.
A novel thermodynamic technique is presented in Chapter Six, wherein differential
scanning calorimetry is used to determine the enthalpy associated with discrete hydration events,
arising from distinct water populations in two hydrated uranyl phosphates, namely synthetic Na
autunite and natural Ca autunite. We feel that this novel approach can be applied to a wide array
of hydrated solids, not just uranyl-bearing materials, particularly more soluble solids, i.e.,
CuSO4•5H2O, since the Gibbs free energy associated with these hydration events likely
represents a more significant contribution to the overall free energy of formation.
The complete sequestration of aqueous Nd by hydroxylapatite throughout a wide pH
range was presented in Chapter Seven. Thus, in this contribution we showed that metal uptake
by this phosphate was pH independent. However we demonstrated that the mechanism of uptake
was pH-dependent, with precipitation of discrete NdPO4(s) taking place at pHs below 5, and Nd
sorption occuring at ca. pH 10.