Embed Size (px)
Citation preview
Synthesis and Characterization of Drug-Containing, Polysaccharide-
Based Nanoparticles for Applications in Oral Drug Delivery
Sonal Mazumder
Dissertation submitted to the faculty of the Virginia Polytechnic Institute and State
University in partial fulfillment of the requirements for the degree of
Doctor of Philosophy
In
Macromolecular Science and Engineering
Richey M. Davis, Chairman
Kevin J. Edgar
Judy S. Riffle
Nammalwar Sriranganathan
Eugene Joseph
June 27, 2013
Blacksburg, Virginia
Keywords:
polysaccharides, mixing, nanoprecipitation, cellulose derivatives, antibacterial,
antiviral, nanoparticle, self-assembly, particle size distribution, crystallization,
composition, drug delivery, release kinetics, oral systems
Synthesis and Characterization of Drug-Containing, Polysaccharide-Based
Nanoparticles for Applications in Oral Drug Delivery
Sonal Mazumder
ABSTRACT
Amorphous solid dispersions of polysaccharide-drug nanoparticles were produced by a
rapid precipitation process known as flash nanoprecipitation and the formulation process and
properties of nanoparticles were investigated. In this thesis, several novel cellulose derivatives
and a pullulan derivative were studied. Among these polymers, carboxymethyl cellulose acetate
butyrate (CMCAB)-drug nanoparticles were investigated in detail. Previous work has shown that
the presence of different chemical groups in CMCAB could aid in complexation with
hydrophobic drugs with low solubility, forming an amorphous matrix which can increase the
effective solubility and, hence, bioavailability of the drug in physiological conditions. An
antibacterial drug and two less soluble anti-viral drugs were selected as model drugs for this
study. A separate study was conducted with several other cellulose derivatives like cellulose
acetate propionate adipates with two different degree of substitution 0.33 and 0.85 (CAP-Adp
0.33 and CAP-Adp 0.85), cellulose acetate sebacate (CA-320S Se) and butyl pullulan-6-
carboxylate (BPC) polymers. The effect of polymer interaction with drug molecule on release of
antiviral drugs was studied with these latter polymers.
The purpose of this research was two-fold. First, the methodology for producing drug-
polymer nanoparticles with well-defined particle size distributions was developed. Second, the
factors affecting drug loading and release properties of these nanoparticles were investigated.
The nanoparticles were processed using two methods of solvent removal and drying to
investigate their effects on drug loading and particle size: (a) various combinations of rotary
iii
vacuum evaporation (rotavap) and acid-induced flocculation were used and (b), dialysis followed
by freeze drying. Dynamic light scattering showed particle sizes were between 150-400 nm with
polydispersity index values as low as 0.12. The antibiotic drug loading efficiencies ranged from
14-40%, whereas drug loading efficiency as high as 85 % was attained with the antiviral drug.
The dissolution studies showed an increase in the solution concentration and release of the
amorphous drug nanoparticles. The high glass transition temperature helped to stabilize the drug
in an amorphous form, thus increasing the effective solution concentration of the drug in an
aqueous medium.
iv
For my late grandfather:
Shri Chittaranjan Majumder
The beginning of knowledge is the discovery of something we do not
understand.
- Frank Herbert
v
Acknowledgements
My Ph.D. program experience was the most challenging, yet enjoyable and rewarding,
academic experience of my life, because I like to learn. It was an overwhelming experience as it
opened my world throughout the years. I have met a lot of wonderful people. I have had the
privilege of working with Dr. Richey Davis, who was instrumental in helping me to complete
my doctoral work. I sincerely thank him for his unending support and invaluable guidance
throughout the period of my PhD.
I am also indebted to Dr. Judy Riffle whose help, stimulating suggestions and
encouragement helped me in all the time of research. I take the opportunity to express my
deepest sense of gratitude to Dr. Kevin J. Edgar for his constructive criticism, endless help, and
guidance during my period of my PhD work. It was a great pleasure to get input and advice from
Dr. Eugene Joseph. I am very much grateful to Dr. Nammalwar Sriranganathan for his
generous support and constant encouragement.
I consider myself very fortunate to have been able to work with Dr. Ishwar K. Puri on
several other projects and publications during my PhD. He has always encouraged me and given
me confidence. While working with him I also got the privilege to work with Dr. Joseph
Falkinham. He has my deepest gratitude for his extreme encouragement and guidance. I am also
very thankful to Dr. Chris Cornelius for his input.
I am also very thankful to my colleagues, particularly in Dr. Edgar’s group, for
synthesizing some of the polymers and helping with release studies. They include Haoyu Liu,
Junia Pereira and Hale Cigdem Arca. It was also a pleasure to work with Samantha
Casterlow who executed cell and animal experiments with my nanoparticles. I acknowledge the
help rendered by Bruce Orler, Rick Caudill, Stephen McCartney, Weinan Leng, in learning
and operating several instruments. I am grateful to Mr. Jason Schroedl for helping with
computer related problems. Thanks to Raquel Mejia Ariza and Sharavanan
Balasubramaniam for incorporating me into the research group and for introducing me to many
laboratory and experimental techniques. I am particularly indebted to Sharavanan for his
endless help and support during my defense. I would like to thank my labmate Seyyed
Mohammad Hossein Abtahi and my colleagues from Dr. Edgar and Dr. Riffle group for their
help and keeping things interesting.

vi
I would like to thank Riley Chan for his ability to fix just about anything and Angie
Flynn, Nora Bentley, Tina Kirk, Mary Smith Jane, Cyndy Graham, Tammy Hiner Jo,
Leslie Thornton- O’Brien, Shelley Johnson, Lois Hall, Dawn Maxey, Lisa Smith ,Ennis
McCrery, Ruth Athanson, Graduate School and Cranwell International Center for their
assistance with countless matters.
A special thanks to Anne-Marie Bracken: your friendship and advice has touched me
from the day I arrived at Virginia Tech.
I also thank the following for financial support: National Science Foundation (DMR
#0909065), Macromolecular Interfaces Institute Graduate Student Fellowship, Institute for
Critical Technology and Applied Science (ICTAS), DuPont Chemical Company and Department
of Engineering Science and Mechanics.
My life at Virginia Tech is priceless and I am really fortunate to know wonderful people
here. I would like to thank Naresh, who has supported me through thick and thin- he had been a
great friend, philosopher and guide. I thank Monrudee, whose care and support always
motivated me. I am extremely thankful to my colleagues of my dance group-Dancilla and entire
Blacksburg Indian community. I would like to thank my committee (2010-2011) and members of
Indian Students Association in Virginia Tech. I am also very thankful to the members of
Graduate Student Assembly (GSA), College of Engineering Graduate Student Committee
(COEGSC) and ASHA for Education. I have gained immense experience and learnt various
leadership and teamwork qualities while working with them.
Sincerest thanks to my father, Dhananjoy Mazumder, and mother, Jayashri
Mazumder, for being such wonderful parents providing constant support and encouragement.
Thanks to my brother, Joydeep Mazumder, for everything. I must thank Anish Kumar
Pramanik, for all his support and encouragement. Thanks for respecting my dreams and helping
me to fulfill them. I thank Rajib Dey for his immense support and constant guidance as a
teacher, a colleague and a friend. Thanks to my friends in India for all their support and love.
Finally, I would like to thank my professors from Jadavpur Univeristy in India, who
helped me to follow my dream and pursue my doctoral studies at Virginia Tech.
Sonal Mazumder
Blacksburg, Virginia-USA
vii
June, 2013
Attribution
Professor Richey M. Davis is my research advisor and committee chair. He provided guidance,
help, and support throughout the work in this PhD dissertation. Also he significantly contributed
to the written communication of the research.
Ms. Samantha Casterlow executed the cell toxicity and MIC experiments with the nanoparticles
(Chapter 3).
Ms. Junia Pereira provided training with HPLC technique and learn about drug release studies
from particles. She prepared the CMCAB drug microparticles (Chapter 4). She also synthesized
the BPC polymer (Chapter 5).
Mr. Haoyu Liu synthesized the cellulose adipates and sebacate, discussed in Chapter 5. He also
prepared microparticles with the adipates for the same study.
Dr. Bruce Orler helped with the Differential Calorimetry Scans and also provided guidance and
reasoning to the results obtained (Chapter 4 and Chapter 5).
Mr. Rick Caudill helped with the XRD measurements (Chapter 3, 4 and 5)
Ms. Hale Cigdem Arca prepared microparticles and executed dissolution experiments, discussed
in Chapter 3.
viii
TABLE OF CONTENTS
Chapter 1: Introduction ________________________________________ 1
1.1. Significance and Motivation ________________________________ 1
1.2. Specific Research Objectives _______________________________ 3
1.3. Overview of Chapters _____________________________________ 6
1.4. References ______________________________________________ 8
Chapter 2: Literature Review ___________________________________ 12
2.1. Introduction to Oral Drug Delivery __________________________ 12
2.1.1. Oral Drug Delivery Route ______________________________ 12
2.1.2. Barriers to Oral Drug Delivery __________________________ 15
2.1.3. Critical Factors Affecting Oral Drug Delivery ______________ 15
2.2. Nanoparticle and Microparticles in Drug Delivery ______________ 19
2.3. Amorphous Solid Dispersions ______________________________ 25
2.3.1. Polysaccharides in Drug Delivery ________________________ 38
2.4. Synthesis of Solid Drug Nanoparticles _______________________ 45
2.5. Drug Delivery for Tuberculosis (TB) ________________________ 54
2.5.1. Tuberculosis-The disease ______________________________ 54
2.5.2. TB Drugs in this Study ________________________________ 54
2.5.3. Polymer Nanoparticles in Treating TB ____________________ 57
2.6. Drug Delivery for Human Immunodeficiency Virus (HIV) _______ 62
2.6.1. Human Immunodeficiency Virus-The disease ______________ 62
2.6.2. HIV Drugs in this Study _______________________________ 63
2.6.3. Polymer Nanoparticles in Treating HIV ___________________ 64
2.7. References _____________________________________________ 68
Chapter 3: Nanoparticles of Rifampicin and Carboxymethyl Cellulose Acetate
Butyrate Prepared by Rapid Precipitation ________________________ 90
3.1. Introduction __________________________________________ 92
3.2. Materials and methods __________________________________ 98
3.2.1. Materials for particle preparation ____________________ 98
3.2.2. Materials for cell culture experiments ________________ 99
ix
3.3. Particle preparation and characterization ___________________ 100
3.3.1. General procedure for rapid precipitation in Multi Inlet
Vortex Mixer _______________________________________ 100
3.3.2. Particle purification and recovery __________________ 101
3.3.3. Microparticle preparation and characterization ________ 103
3.3.4. Re-dispersion of dried nanoparticles ________________ 103
3.3.5. Particle size – dynamic light scattering ______________ 103
3.3.6. Particle morphology – X ray diffraction _____________ 104
3.3.7. Drug loading __________________________________ 104
3.3.8. Drug release studies _____________________________ 105
3.3.9. Cell culture experiments _________________________ 106
3.4. Results and discussion _________________________________ 107
3.4.1. Determination of optimal CMCAB polymer concentration
__________________________________________________ 108
3.4.2. Particle size analysis ____________________________ 109
3.4.3. Rifampicin drug loading _________________________ 113
3.4.4. Particle morphology _____________________________ 116
3.4.5. Dissolution studies ______________________________ 118
3.4.6. Minimum inhibitory concentrations for M.Smegmatis ___ 120
3.4.7. Cell toxicity ___________________________________ 120
3.5. Conclusions _________________________________________ 122
3.6. References __________________________________________ 124
3.7. Supporting Information ________________________________ 129
Chapter 4: Preparation and characterization of nanoparticles of carboxymethyl
cellulose acetate butyrate containing anti-viral drugs for oral drug delivery
_________________________________________________________ 140
4.1. Introduction _________________________________________ 141
4.2. Materials and methods _________________________________ 145
4.2.1. Materials _____________________________________ 145
4.2.2. Nanoparticle preparation by rapid precipitation in Multi Inlet
Vortex Mixer _______________________________________ 147
4.2.3. Mcroparticle formation __________________________ 147
4.2.4. Nanoparticles recovery, solvent removal and drying ____ 148
x
4.2.5. Drug composition by high performance liquid chromatography
__________________________________________________ 148
4.2.6. Particle size – dynamic light scattering and scanning electron
microscopy ________________________________________ 149
4.2.7. Characterization of crystallinity ____________________ 149
4.2.8. Dissolution studies ______________________________ 150
4.3. Results and discussion _________________________________ 151
4.3.1. Drug incorporation in particles ____________________ 151
4.3.2. Particle size analysis ____________________________ 153
4.3.3. Crystallinity studies of nanoparticles and microparticles _ 155
4.3.4. Differential scanning calorimetry __________________ 158
4.3.5. Dissolution studies ______________________________ 162
4.4. Conclusions _________________________________________ 169
4.5. References __________________________________________ 171
4.6. Supporting Information ________________________________ 179
Chapter 5: Preparation and Properties of Nanoparticles of Complexes of
Polysaccharides and Antiviral Drugs: Effect of Polysaccharide Chemistry
_________________________________________________________ 186
5.1. Introduction _________________________________________ 188
5.2. Materials and methods _________________________________ 192
5.2.1. Materials _____________________________________ 192
5.2.2. Nanoparticle preparation by rapid precipitation in Multi Inlet
Vortex Mixer _______________________________________ 195
5.2.3. Mcroparticle formation __________________________ 196
5.2.4. Nanoparticles recovery, solvent removal and drying ____ 196
5.2.5. Drug composition by high performance liquid chromatography
__________________________________________________ 196
5.2.6. Particle size – dynamic light scattering and scanning electron
microscopy ________________________________________ 197
5.2.7. Characterization of crystallinity ____________________ 198
5.2.8. Dissolution studies ______________________________ 199
5.3. Results and discussion _________________________________ 199
5.3.1. Drug incorporation in particles ____________________ 200
5.3.2. Particle size analysis ____________________________ 201
xi
5.3.3. Crystallinity studies of nanoparticles and microparticles _ 204
5.3.4. Differential scanning calorimetry __________________ 205
5.3.5. Dissolution studies ______________________________ 210
5.4. Conclusions _________________________________________ 217
5.5. References __________________________________________ 219
5.6. Supporting Information ________________________________ 225
Chapter 6: Conclusion and Future Work _____________________ 227
6.1. Conclusions _________________________________________ 227
6.2. Future Work _________________________________________ 231
6.3. References __________________________________________ 231
xii
List of Figures
Chapter 1: Introduction
Figure 1. Evaluation steps of various factors that affect the oral
bioavailability of drug candidates _______________________________ 2
Chapter 2: Literature Review
Figure 1. Oral drug delivery through GI tract _____________________ 13
Figure 2. Spherical particle of radius r ___________________________ 20
Figure 3. Tacrolimus solid dispersions with HPMC, PVP and PEG 6000
show enhanced solubility initially compared to crystalline Tacrolimus.
Only HPMC was able to maintain supersaturation by inhibiting
recrystallization in solution ___________________________________ 31
Figure 4a. In-vitro dissolution of a physical mixture (PM) of crystalline
ritonavir and PEG (10:90), amorphous solid dispersions (ASD) of ritonavir
in PEG at different drug : polymer ratios. There is an increase in release of
amorphous drug compared to the crystalline drug. The lowest amorphous
drug:PEG ration (10:90) shows the highest release _________________ 33
Figure 4b. Plasma concentration of amorphous ritonavir (in PEG) at
different drug: polymer ratios compared to crystalline ritonavir. The lowest
amorphous drug : polymer = 10:90 shows highest plasma concentration 34
Figure 5. Structure of Carboxymethyl cellulose acetate butyrate (CMCAB)
_________________________________________________________ 42
Figure 6. Molecular structure of the novel synthesized cellulose derivatives
and the in substituent groups. These cellulose derivatives are not
regioselectively substituted ___________________________________ 43
Figure 7. Butyl pullulan -6-carboxylate __________________________ 44
Figure 8. Schematic representation of MIVM producing polymer-drug
nanocomplexes adapted from the work by Mustafa et al. ____________ 48
Figure 9. The surface area increases when solids are fractured from the
micron-size range (microparticles) to the nanometer-size particles used in
xiii
the various nanoparticle formulations to improve the performance of
poorly water-soluble compounds _______________________________ 49
Figure 10. Structure of rifampicin ______________________________ 55
Figure 11. Structure of Isoniazid _______________________________ 56
Figure 12. Structure of Pyrazinamide ____________________________ 57
Figure 13a. Structure of Ritonavir ______________________________ 63
Figure 13b. Structure of Efavirenz ______________________________ 63
Chapter 3: Nanoparticles of Rifampicin and Carboxymethyl Cellulose
Acetate Butyrate Prepared by Rapid Precipitation
Figure 1. Structure of Carboxymethyl cellulose acetate butyrate (CMCAB)
_________________________________________________________ 99
Figure 2. Structure of rifampicin. Arrow represent hydroxyl group at
position C8 ________________________________________________ 99
Figure 3. Intensity-average hydrodynamic diameters of CMCAB and
rifampicin-CMCAB particles at pH 7 after acid flocculation followed by
vacuum drying and then redispersion. +RV: rotary evaporation used; -RV
rotary evaporation not used; CA = citric acid; HCl = hydrochloric acid. n =
3. Targeted rifampicin loading 25 wt% _________________________ 111
Figure 4. Particle sizes of 3 batches (I-III) of CMCAB and rifampicin-
CMCAB particles after fabrication in the multi-inlet vortex mixer and after
processing by dialysis and freeze drying followed by redispersion in water
at pH 7. The targeted rifampicin composition was 25 wt% __________ 112
Figure 5. Scanning electron microscope images for microparticles at 5Kx
magnification. The bar in each image corresponds to 10 µm _________ 113
Figure 6. Rifampicin weight% in nanoparticles prepared by the
flocculation method at different conditions as measured by UV-Visible
spectrophotometry. +RV means rotary evaporation was used and -RV
means rotary evaporation was not used. CA = citric acid, HCl =
hydrochloric acid. Results for 2 batches are shown _______________ 114
xiv
Figure 7. X-ray diffractograms of (a) Rifampicin, (b) CMCAB, (c)
Rifampicin-CMCAB physical mixture, (d) Rifampicin-CMCAB
nanoparticles (actual drug loading is 10 wt%), (e) Rifampicin-CMCAB
microparticles _____________________________________________ 117
Figure 8a. Drug release profile of rifampicin from nanoparticles and
microparticles compared to free rifampicin as received at pH 6.8 _____ 119
Figure 8b. Drug release profile of rifampicin from nanoparticles and
microparticles compared to free rifampicin as received at pH 1.2 _____ 119
Figure 9. Cytotoxicity of rifampicin-CMCAB nanoparticle formulations
(average of batch A and batch B) vs. free rifampicin. 500 µg/ml
rifampicin, J774A.1 cell line. _________________________________ 121
Figure S1. Calibration curve of rifampicin dissolved in acetonitrile at 475
nm to quantitate the rifampicin compositions in the nanoparticles _____ 131
Figure S2. Calibration curve of rifampicin dissolved in acetonitrile at 254
nm used to quantitate the rifampicin concentration in the dissolution
experiments ______________________________________________ 134
Chapter 4: Preparation and characterization of nanoparticles of
carboxymethyl cellulose acetate butyrate containing anti-viral drugs for
oral drug delivery
Figure 1. Structure of Carboxymethyl cellulose acetate butyrate (CMCAB)
________________________________________________________ 146
Figure 2a. Structure of ritonavir _______________________________ 146
Figure 2b. Structure of efavirenz ______________________________ 146
Figure 3. RTV and EFV composition in CMCAB nanoparticles measured
by HPLC at 240 nm. Average results from three batches are shown __ 152
Figure 4. Particle sizes (Dynamic light scattering) of CMCAB, CMCAB-
RTV and CMCAB- EFV nanoparticles after mixing, dialysis and freeze
drying. The targeted drug composition was 25 wt% and the actual
compositions of the freeze-dried particles are shown in Figure 3 _____ 153
Figure 5. Scanning electron microscope images for microparticles at 50Kx
magnification. The bar in each image corresponds to 200 nm ________ 154
xv
Figure 6. X-ray diffractograms of (a) Crystalline RTV (as received), (b)
Crystalline EFV (as received), (c) Physical mixture of CMCAB-25 wt%
RTV, (d) Physical mixture of CMCAB-25 wt% EFV, (e) CMCAB-RTV
(actual drug loading is 19 wt%), (f) CMCAB-EFV (actual drug loading is
19 wt%), (g) CMCAB-RTV microparticles with 25 wt% of RTV, (h)
CMCAB-EFV microparticles with 25 wt % of EFV _______________ 157
Figure 7. First DSC scan showing melting peak of RTV at 126° C. A
similar peak is observed in the physical mixtures but no such peak is
observed in the any of the CMCAB-drug particles. Here NPs =
nanoparticles, MPs = microparticles. ___________________________ 158
Figure 8. Comparison between experimental Tg and theoretical predictions
(Fox ideal Tg), (a) RTV containing particles, (b) EFV containing particles
at different drug composition _________________________________ 161
Figure 9a. Dissolution profile of CMCAB-RTV nanoparticles from 3
batches __________________________________________________ 162
Figure 9b. Dissolution profile of CMCAB-EFV nanoparticles from 3
batches __________________________________________________ 163
Figure 10a. Drug release profile of RTV. Approximately 70% (for drug
composition 19 wt %), 60% (for drug composition of 29 wt %) and 55%
(for drug composition 40 wt %) of RTV present in the amorphous matrix
of CMCAB was dissolved in 5 hours ___________________________ 164
Figure 10b. Drug release profile of EFV/CMCAB nanoparticles vs pure
EFV ____________________________________________________ 165
Figure 11a. . Solution concentration of RTV from nanoparticle and
microparticle ASDs vs pure RTV (potassium phosphate buffer, pH 6.8)
________________________________________________________ 167
Figure 11b. Solution concentration of EFV from nanoparticle and
microparticle ASDs vs pure EFV (potassium phosphate buffer, pH 6.8)
________________________________________________________ 167
Figure 12a. . Comparison of percentage drug release from CMCAB-RTV
microparticles and nanoparticles (results from 3 batches) ___________ 168
xvi
Figure 12b. Comparison of percentage drug release from CMCAB-EFV
microparticles and nanoparticles (results from 3 batches) ___________ 169
Figure S1. Calibration curve of ritonavir dissolved in acetonitrile at 240
nm ______________________________________________________ 179
Figure S2. Calibration curve of Efavirenz dissolved in acetonitrile at 240
nm ______________________________________________________ 180
Figure S3. Particle Size Analysis of CMCAB, CMCAB-RTV and
CMCAB-EFV nanoparticles after mixing, dialysis and freeze drying __ 183
Figure S4. X-ray diffractograms of pure CMCAB as received _______ 184
Figure S5. X-ray diffractograms of (A) CMCAB-RTV (actual drug loading
is 29 wt%), (B) CMCAB-RTV (actual drug loading is 40 wt%), (C)
CMCAB-EFV (actual drug loading is 18 wt%), (D) CMCAB-EFV (actual
drug loading is 43 wt%) _____________________________________ 184
Figure S6. First DSC scan showing melting peak of EFV at 140° C. No
such peak is observed in the any of the CMCAB-EFV nanoparticles __ 185
Chapter 5: Preparation and Properties of Nanoparticles of Complexes of
Polysaccharides and Antiviral Drugs: Effect of Polysaccharide
Chemistry
Figure 1a. Structure of ritonavir _______________________________ 193
Figure 1b. Structure of efavirenz ______________________________ 193
Figure 2. (a) Molecular structures of the novel cellulose derivatives. These
cellulose derivatives are not regioselectively substituted, (b) Butyl
pullulan-6-carboxylate (BPC) ________________________________ 194
Figure 3. Particle sizes of polysaccharide-drug (RTV and EFV)
nanoparticles after mixing, dialysis and freeze drying. The freeze dried
powders except BPC were mixed with trehalose before freeze drying. The
targeted drug composition was 25 wt% and the actual compositions of the
freeze-dried particles are shown in Table 2. The error bars shows standard
deviation from 3 different batches of particles. A = CAP Adp 0.33, B =
CAP Adp 0.85, C= CA 320S Seb, D = BPC nanoparticles __________ 202
xvii
Figure 4. Scanning electron microscope images for (a) CAP Adp 0.33-
RTV microparticles at 15Kx magnification , (b) CAP Adp 0.85-RTV
microparticles at 7Kx magnification. The bar in each image corresponds to
2 µm ____________________________________________________ 203
Figure 5. X-ray diffractograms of (a) Crystalline RTV (as received), (b)
Crystalline EFV (as received) and polyssacharide nanoparticles (c)
ascending order: CAP Adp 0.33-RTV, CAP Adp 0.85-RTV, CA 320S
Seb-RTV, BPC-RTV, (d) ascending order : CAP Adp 0.33-EFV, CAP
Adp 0.85-EFV, CA 320S Seb-EFV, BPC-EFV showed no diffraction
peaks implying the drugs were mostly amorphous ________________ 205
Figure 6. First DSC scan showing melting peak of RTV at 126° C. No such
peak is observed in any of the polymer-drug nanoparticles __________ 206
Figure 7. Comparison between experimental Tg and theoretical predictions
(Fox ideal Tg) of nanoparticles ________________________________ 209
Figure 8a. Concentration profile of RTV (A) as received, (B) from CAP
Adp 0.33, (C) from CA 320S Seb, (D) from CAP Adp 0.85, (E) from BPC.
The error bars represents standard deviation of results from 3 batches _ 211
Figure 8b. Concentration profile of EFV (A) as received, (B) from CAP
Adp 0.33, (C) from CAP Adp 0.85, (D) from CA 320S Seb, (E) from BPC.
The error bars represent standard deviation from 3 batches __________ 211
Figure 9a. Release profile of RTV (A) as received, (B) from CAP Adp
0.33, (C) from CAP Adp 0.85, (D) from CA 320S Seb, (E) from BPC. The
error bars represent standard deviation of results from 3 batches ______ 213
Figure 9b. Release profile of EFV (A) as received, (B) from CAP Adp
0.33, (C) from CAP Adp 0.85, (D) from CA 320S Seb, (E) from BPC. The
error bars represent standard deviation of results from 3 batches _____ 214
Figure 10a. Comparison of solubility of RTV from CAP Adp 0.33 and
CAP Adp 0.85 microparticles (MP) and nanoparticles (NP) and crystalline
RTV as received (result from 1 batch). RTV compositions are listed in
Table 2 __________________________________________________ 216
xviii
Figure 10b. Comparison of RTV release from CAP Adp 0.33 and CAP
Adp 0.85 microparticles (MP) and nanoparticles (NP), vs crystalline RTV
(result from 1 batch). RTV compositions are listed in Table 2 _______ 216
Figure S1. X-ray diffractograms of (A) polymers as received (B) CAP
adipates 0.33 and 0.85 microparticles containing RTV _____________ 225
Figure S2. First DSC scan showing melting peak of EFV at 140° C. No
such peak is observed in the any of the polymer-EFV nanoparticles ___ 226
Figure S3. DSC scan of RTV containing CAP Adp 0.33 and CAP Adp
0.85 _____________________________________________________ 226
Chapter 6: Conclusion and Future Work
Figure 1. Drug concentration using different separation based approaches
________________________________________________________ 233
xix
List of Tables
Chapter 2: Literature Review
Table 1. Physiological charateristics in the GI tract _________________ 14
Table 2. Properties of Nanoparticles and Microparticles in Drug Delivery
_________________________________________________________ 20
Table 3. Properties of Polymers commonly used as ASDs ___________ 28
Table 4. Polysaccharides in Pharmaceutical use ___________________ 40
Table 5. Abbreviation and properties of Novel Synthesized Cellulose and
Pullulan Derivatives _________________________________________ 45
Table 6. Comparative studies of the methods used to synthesize
nanoparticles ______________________________________________ 51
Chapter 3: Nanoparticles of Rifampicin and Carboxymethyl Cellulose
Acetate Butyrate Prepared by Rapid Precipitation
Table 1. Effect of CMCAB concentration on particle size at mixer
conditions - THF:water ratio 1:9 v/v , 25ºC, and Re = 15,000 _______ 109
Table 2. Rifampicin formulations and MIC ranges for susceptibility of M.
Smegmatis _______________________________________________ 120
Table S.1. Particle Size Analysis of CMCAB particles after recovering
them by vacuum filtration and drying in vacuum oven for 5-6 hours at
room temperature by DLS – at different rotary evaporation conditions and
addition of different excipients. The average results from 3 batches are
shown ___________________________________________________ 135
Table S.2. Particle Size Analysis of Rifampicin-CMCAB particles after
recovering them by vacuum filtration and drying in vacuum oven for 5-6
hours at room temperature by DLS - at different rotary evaporation
conditions and addition of different excipients. The average results from 3
batches are shown _________________________________________ 136
Table S.3. Drug loading of complexes prepared by the acid flocculation
method at different conditions ________________________________ 137
xx
Table S.4. Particle size and drug loading comparison of complexes from a
single batch that were processed by flocculation with citric acid with no
rotary evaporation step and by dialysis followed by freeze drying ____ 138
Chapter 4: Preparation and characterization of nanoparticles of
carboxymethyl cellulose acetate butyrate containing anti-viral drugs for
oral drug delivery
Table 1. The glass transitions of CMCAB, drugs and complexes calculated
from the second DSC scan and Fox ideal mixing equations _________ 159
Chapter 5: Preparation and Properties of Nanoparticles of Complexes of
Polysaccharides and Antiviral Drugs: Effect of Polysaccharide
Chemistry
Table 1. Abbreviation and properties of Novel Synthesized Cellulose and
Pullulan Derivatives ________________________________________ 193
Table 2. RTV and EFV composition in polysaccharide nanoparticles
measured by HPLC at 240 nm. Averages from three batches are shown
_______________________________________________________ 200
Table 3. Effect of trehalose on particle sizes of freeze dried nanoparticles
________________________________________________________ 203
Table 4. Glass transitions of polymer, drugs and polymer-drug
nanoparticles (2nd
DSC scans) and Fox ideal mixing equation ________ 207
1
Chapter 1. Introduction
1.1 Significance and Motivation
Drug discovery is a time consuming, onerous and expensive process. The average cost of
bringing every new drug from laboratory to patients is approximately $1-2 billion and the
process takes up to 14-15 years 1,2
. Due to the high cost, there is tremendous pressure to
maximize efficiency and minimize the time it takes to discover and bring a drug to the market. In
order to do this, it is necessary to analyze the entire drug discovery and development process and
make necessary changes to increase efficiency and minimize time. The goals to be met to
commercialize a drug candidate are:
1. Therapeutic strategy
2. Structure-activity relationship
3. Dose form and regimen
4. Best possible safety profile
5. Novelty of the compounds
6. Scalability
7. Cost of the starting materials
8. Toxicity issues
9. Successful drug delivery in animal models
10. Clinical trials and approvals
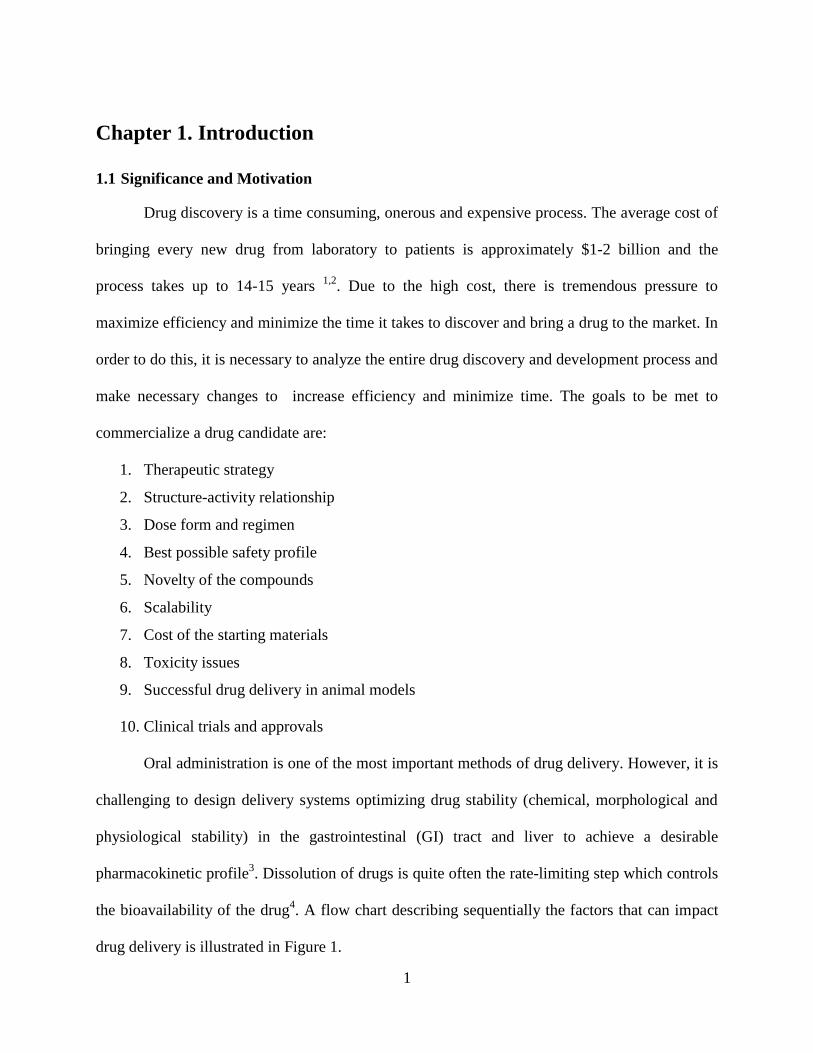
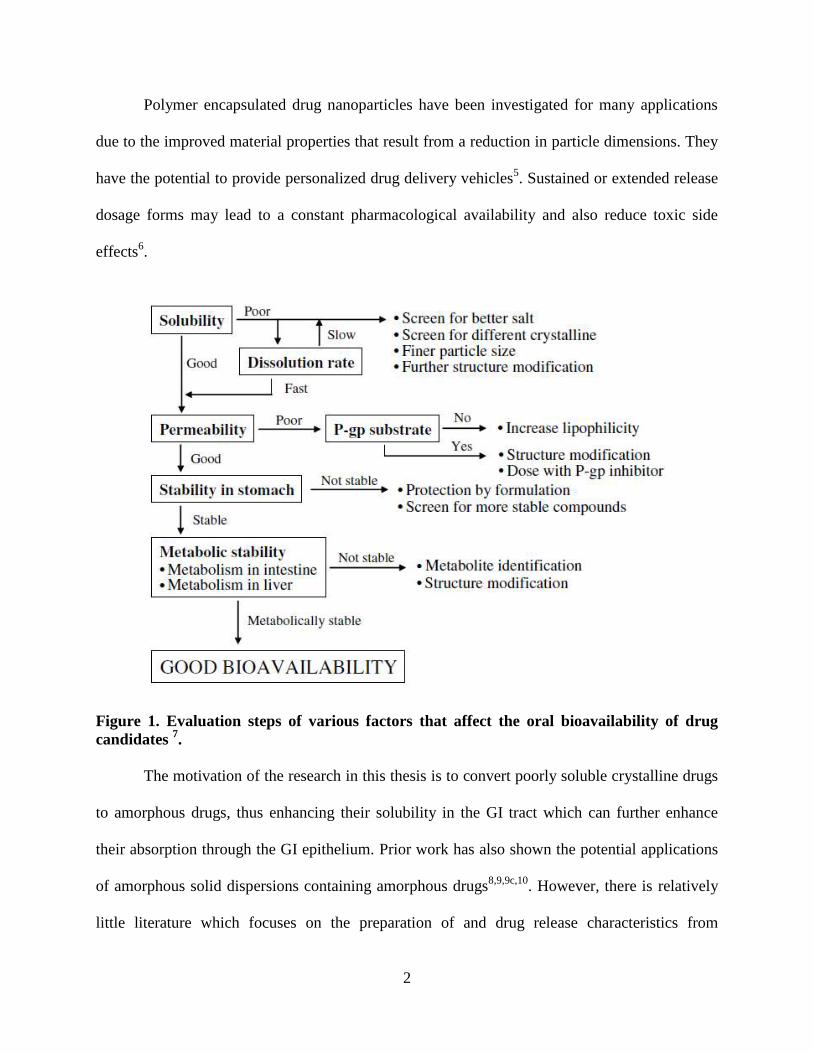
Oral administration is one of the most important methods of drug delivery. However, it is
challenging to design delivery systems optimizing drug stability (chemical, morphological and
physiological stability) in the gastrointestinal (GI) tract and liver to achieve a desirable
pharmacokinetic profile3. Dissolution of drugs is quite often the rate-limiting step which controls
the bioavailability of the drug4. A flow chart describing sequentially the factors that can impact
drug delivery is illustrated in Figure 1.
2
Polymer encapsulated drug nanoparticles have been investigated for many applications
due to the improved material properties that result from a reduction in particle dimensions. They
have the potential to provide personalized drug delivery vehicles5. Sustained or extended release
dosage forms may lead to a constant pharmacological availability and also reduce toxic side
effects6.
Figure 1. Evaluation steps of various factors that affect the oral bioavailability of drug
candidates 7.
The motivation of the research in this thesis is to convert poorly soluble crystalline drugs
to amorphous drugs, thus enhancing their solubility in the GI tract which can further enhance
their absorption through the GI epithelium. Prior work has also shown the potential applications
of amorphous solid dispersions containing amorphous drugs8,9,9c,10
. However, there is relatively
little literature which focuses on the preparation of and drug release characteristics from
3
amorphous solid dispersions of polymer-drug nanoparticles. This work aimed to make well-
defined nanoparticles where a drug was molecularly dispersed in an amorphous polysaccharide
matrix. Polymers with pH sensitive chemical groups are used to protect the drug from
degradation in the stomach (at lower pH of 1.2) and release most of the drug in the small
intestine (absorption site, pH ~ 6.8). Methods were developed to produce nanoparticles rapidly
and under conditions that could be scalable. The particle size and drug loading of the particles
were controlled and the morphology was characterized to confirm presence of amorphous drugs.
The release mechanism of the drug from polymers is also investigated. The nanoparticles and
microparticles of same polymer-drug compositions were studied side-by-side to calculate the
enhancement of dissolution of drugs from the particles due to surface area effects. This work
does not include any studies associated with absorption of drugs through the epithelium or in-
vivo studies. In this work, poorly soluble antiviral drugs and a comparatively soluble
antibacterial drug are investigated.
1.2 Specific Research Objectives
The overall objective of this research was to investigate the preparation and drug
dissolution properties of amorphous solid dispersions of drugs in polysaccharide nanoparticles
for oral drug delivery. In order to accomplish this general objective, several specific research
objectives were necessary:
1. Investigate a method to prepare well defined polymer-drug nanoparticles in a rapid and
scalable manner
The preparation of well-defined nanoparticles has several challenges such as solvent
selection, concentration of polymer and drugs, nanoparticle isolation, purification and drying.
Some of the common methods of producing polymer-drug nanoparticles are solvent
evaporation11,12
, milling13
, high pressure homogenization24a, 165b
, electrospraying and
4
precipitation14
. Flash nanoprecipitation is a nanoparticle fabrication method that is rapid and
scalable 15,16,17
in which an organic solution of a polymer (typically an amphiphilic block
copolymer) and organic species (typically poorly water-soluble drugs and hydrophobically-
modified particles) are rapidly mixed with a non-solvent such as water under highly turbulent
conditions in a confined mixing chamber. This turbulent mixing forms a highly supersaturated
solution which undergoes particle nucleation and growth. Particle growth stops due to the
formation of a repulsive barrier on the particle surface. When amphiphilic copolymers are used,
that barrier typically consists of poly(ethylene oxide) chains that form a brush-like structure on
the nanoparticle surfaces. The supersaturation depends on the water/organic solvent ratio injected
into the mixer, the concentrations of the drugs and polymers, and temperature. This process is
attractive in that the particle size distributions can be controlled 18, 19
and high concentrations of
hydrophobic organic species can be incorporated due to kinetic entrapment in the polymers
20,21,22. Flash nanoprecipitation has been used with a four-jet multi-inlet vortex mixer (MIVM) to
produce nanoparticles with high loadings of drugs and imaging agents and with controlled
surface chemistries 23,24, 25,26,27
.
Drug nanoparticles have many advantages over micro/macro particles. The increase in
surface area to mass ratio for nanoparticles is dramatic, sometimes covering several orders of
magnitude28,29
. However, nanoparticles must be stabilized to prevent aggregation. It is also
important to note that not all drug candidates have physicochemical properties suitable for
effective particle size reduction, and nanoparticulate drugs may be susceptible to polymorphic
transition on manufacture or storage30,31
. The increase in surface area generated due to the
reduction in particle size increases the dissolution rate and, therefore, an increase in
5
bioavailability for drugs where exposure after oral administration is limited by the dissolution
rate 32
.
In this objective, amorphous solid dispersions of polysaccharide nanoparticles were made using
flash nanoprecipitation for the first time. This is important since there are few studies on
nanoparticles of amorphous solid dispersions in the literature. Due to the particular features of
flash nanoprecipitation, namely the need to remove an organic solvent from the mixture after the
particles were made, several methods of particle separation and drying were also investigated.
The main objective was to examine the effect of processing conditions on particle size and use
excipients to control aggregation when and where required.
2. Study formation of amorphous solid dispersions of polymer nanoparticles
Amorphous solid dispersions (ASDs) are formed when the drug is evenly and
molecularly dispersed in an amorphous polymer matrix. The drug is in the amorphous form in
the matrix and thus there is no heat of fusion barrier that a drug molecule has to overcome in
order to dissolve. Therefore, the amorphous form requires less energy for dissolution and thus
exhibits higher solution concentrations than the crystalline form. For poorly water soluble drugs,
ASDs are particularly useful in producing higher drug concentrations and faster release in the GI
tract than those from conventional formulations33
. The higher dissolution rates leads to
significant improvements in drug absorption (mainly BCS II and BCS IV drugs)8,32,34,35,36,37
. The
aim of this objective is to make amorphous dispersions of comparatively novel polysaccharides
and antibacterial and antiviral drugs.
Prior studies38
have shown that the enhancement of solubility and stability are largely due
to: (1) a moderate level of polymer hydrophobicity; (2) rigidity of polymer structure - semirigid
cellulose polymers have been more effective than the semiflexible synthetic polymers of similar
6
hydrophobicity; and (3) amphiphilicity which, in the case of the novel cellulose-based polymers
studied in this work, can be finely tuned. For example, increasing the degree of carboxylic acid
substitution in cellulose derivatives can inhibit drug crystallization. The purpose of this study
was to understand the behavior of nanoparticles made of polymers with different chemistries and
compare the drug release properties from these nanoparticle systems.
3. Compare drug release from nanoparticles and microparticles
The increase in surface area is considered responsible for increased dissolution for
microparticles and nanoparticles. Nanocrystals of ibuprofen and indomethacin showed fast
dissolution (around ˃80% release within 2 min)39,40,41
. There was a 2-3 fold increase in
dissolution rate of itraconazole whose particle size was reduced to 5.5 µm. It was also shown that
further reducing the particle size to prepare nanoscale particles of the size between 350-700 nm
leads to additional 3- to 5-fold increases in dissolution rate compared with the micronized
product42
. The aim of this study is to compare the enhancement in the dissolution rates of the
drug in micron-sized particles (prepared by coprecipitation or spray drying) and nanoparticles
(prepared by flash nanoprecipitation in the MIVM) compared to the free crystalline drugs. This
is also to understand the effect of particle size on drug release and determine whether synergy
between high surface area and suppression of crystallinity is observed.
1.3 Overview of Chapters
Chapter 2 is a literature review providing an overview of relevant topics including basic
theoretical background and a review of current research. The five primary topics covered in the
review are: (1) The oral drug delivery method, (2) Role of nanoparticles and microparticles in
drug delivery, (3) Polymers for oral drug delivery with emphasis on amorphous solid
7
dispersions, (4) Synthesis of polymer-drug nanoparticles, (5) Prior studies with antibacterial and
antiviral drugs.
Chapter 3 is the study of preparation of carboxymethyl cellulose acetate butyrate
(CMCAB) nanoparticles containing rifampicin (an antibacterial drug). The nanoparticles were
prepared by a rapid, scalable flash nanoprecipitation process using a multi inlet vortex mixer.
Two different processing methods were used to recover and dry these particles such as (a)
flocculation by acids and vacuum drying, and (b) dialysis and freeze drying. The main goal of
the work was to investigate a suitable method to prepare nanoparticles with well-defined particle
size and drug loading rapidly. The release of drug from the nanoparticles and microparticles of
the same polymer-drug composition were compared.
Chapter 4 is the study of preparation of CMCAB nanoparticles containing two poorly
soluble antiviral drugs by flash nanoprecipitation. The main goal of the study was to enhance the
solubility of the poorly soluble drugs by forming amorphous solid dispersion with CMCAB. The
particle size and release studies were done for three different drug loadings to investigate the role
of polymer in stability of drug loaded particles from recrystallization in solution.
Chapter 5 is the study of novel cellulose derivative and a pullulan derivative in
enhancing solubility and stability of poorly soluble antiviral drugs. Here, the effects of structure
property relationship of the polymers were studied on drug release kinetics.
Chapter 6 describes the conclusions drawn from the preceding chapters and the future
direction of this research. Overall conclusions are presented, as well as conclusions for each
individual chapter.
8
1.4 References
1. Adams, C. P.; Brantner, V. V., Spending on new drug development1. Health Economics
2010, 19 (2), 130-141.
2. Pharma 2005--an industrial revolution in R&D. In Pharma 2005, Price, Waterhouse,
Coopers: Newyork, 1998; pp 1-20.
3. Lavelle, E. C.; Sharif, S.; Thomas, N. W.; Holland, J.; Davis, S. S., The importance of
gastrointestinal uptake of particles in the design of oral delivery systems. Advanced Drug
Delivery Reviews 1995, 18 (1), 5-22.
4. Daugherty, A. L.; Mrsny, R. J., Regulation of the intestinal epithelial paracellular barrier.
Pharmaceutical Science & Technology Today 1999, 2 (7), 281-287.
5. Petros, R. A.; Desimone, J. M., Strategies in the design of nanoparticles for therapeutic
applications. Nat Rev Drug Discov 2010, 9 (8), 615-627.
6. Löbenberg, R.; Kim, J. S.; Amidon, G. L., Pharmacokinetics of an immediate release, a
controlled release and a two pulse dosage form in dogs. European Journal of Pharmaceutics and
Biopharmaceutics 2005, 60 (1), 17-23.
7. Han, C.; Wang, B., Factors That Impact the Developability of Drug Candidates: An
Overview. In Drug Delivery, John Wiley & Sons, Inc.: 2005; pp 1-14.
8. Law, D.; Schmitt, E. A.; Marsh, K. C.; Everitt, E. A.; Wang, W.; Fort, J. J.; Krill, S. L.; Qiu,
Y., Ritonavir–PEG 8000 amorphous solid dispersions: In vitro and in vivo evaluations. Journal
of Pharmaceutical Sciences 2004, 93 (3), 563-570.
9. (a) Sinha, S.; Ali, M.; Baboota, S.; Ahuja, A.; Kumar, A.; Ali, J., Solid Dispersion as an
Approach for Bioavailability Enhancement of Poorly Water-Soluble Drug Ritonavir. AAPS
PharmSciTech 2010, 11 (2), 518-527; (b) Li, B.; Konecke, S.; Harich, K.; Wegiel, L.; Taylor, L.
S.; Edgar, K. J., Solid dispersion of quercetin in cellulose derivative matrices influences both
solubility and stability. Carbohydrate Polymers 2013, 92 (2), 2033-2040; (c) Murdande, S. B.;
Pikal, M. J.; Shanker, R. M.; Bogner, R. H., Solubility advantage of amorphous pharmaceuticals:
I. A thermodynamic analysis. Journal of Pharmaceutical Sciences 2010, 99 (3), 1254-1264.
10. Posey-Dowty, J.; Watterson, T.; Wilson, A.; Edgar, K.; Shelton, M.; Lingerfelt, L., Zero-
order release formulations using a novel cellulose ester. Cellulose 2007, 14 (1), 73-83-83.
11. Bn V Hari, K. D. a. N. N., Development of Efavirenz nanoparticle for enhanced efficiency of
anti-retroviral therapy against HIV and AIDS. BMC Infectious Diseases 2012, (12), 7.
9
12. Christopher J Destache, T. B., Keith Christensen, Annemarie Shibata, Akhilesh Sharma and
Alekha Dash, Combination antiretroviral drugs in PLGA nanoparticle for HIV-1. BMC
Infectious Diseases 2009, (9), 198.
13. Schwitzer, J. M.; Müller, R. H., Drug Nanocrystals—The Universal Formulation Approach
for Poorly Soluble Drugs. In Nanoparticulate Drug Delivery Systems 2007, pp 71-88.
14. Keck, C. M.; Müller, R. H., Drug nanocrystals of poorly soluble drugs produced by high
pressure homogenisation. European Journal of Pharmaceutics and Biopharmaceutics 2006, 62
(1), 3-16.
15. Johnson, B. K.; PrudHomme, R. K., Flash NanoPrecipitation of Organic Actives and Block
Copolymers using a Confined Impinging Jets Mixer. Australian Journal of Chemistry 2003, 56
(10), 1021-1024.
16. Johnson, B. K.; Prud'homme, R. K., Chemical processing and micromixing in confined
impinging jets. AIChE Journal 2003, 49 (9), 2264-2282.
17. Johnson, B. K.; Prud’homme, R. K., Mechanism for Rapid Self-Assembly of Block
Copolymer Nanoparticles. Physical Review Letters 2003, 91 (11), 118302.
18. Liu, Y.; Kathan, K.; Saad, W.; Prud’homme, R. K., Ostwald Ripening of β-Carotene
Nanoparticles. Physical Review Letters 2007, 98 (3), 036102.
19. Liu, Y.; Cheng, C.; Prud’homme, R. K.; Fox, R. O., Mixing in a multi-inlet vortex mixer
(MIVM) for flash nano-precipitation. Chemical Engineering Science 2008, 63 (11), 2829-2842.
20. Gindy, M. E.; Ji, S.; Hoye, T. R.; Panagiotopoulos, A. Z.; Prud’homme, R. K., Preparation of
Poly(ethylene glycol) Protected Nanoparticles with Variable Bioconjugate Ligand Density.
Biomacromolecules 2008, 9 (10), 2705-2711.
21. Gindy, M. E.; Panagiotopoulos, A. Z.; Prud'homme, R. K., Composite Block Copolymer
Stabilized Nanoparticles: Simultaneous Encapsulation of Organic Actives and Inorganic
Nanostructures. Langmuir 2007, 24 (1), 83-90.
22. Ji, S.; Zhu, Z.; Hoye, T. R.; Macosko, C. W., Maleimide Functionalized Poly(ε-
caprolactone)-block-poly(ethylene glycol) (PCL-PEG-MAL): Synthesis, Nanoparticle
Formation, and Thiol Conjugation. Macromolecular Chemistry and Physics 2009, 210 (10), 823-
831.
10
23. Ungun, B.; Prud'homme, R. K.; Budijon, S. J.; Shan, J.; Lim, S. F.; Ju, Y.; Austin, R.,
Nanofabricated upconversion nanoparticles for photodynamic therapy. Opt. Express 2009, 17
(1), 80-86.
24. Kumar, V.; Hong, S. Y.; Maciag, A. E.; Saavedra, J. E.; Adamson, D. H.; Prud’homme, R.
K.; Keefer, L. K.; Chakrapani, H., Stabilization of the Nitric Oxide (NO) Prodrugs and
Anticancer Leads, PABA/NO and Double JS-K, through Incorporation into PEG-Protected
Nanoparticles. Molecular Pharmaceutics 2009, 7 (1), 291-298.
25. Chen, T.; D’addio, S. M.; Kennedy, M. T.; Swietlow, A.; Kevrekidis, I. G.; Panagiotopoulos,
A. Z.; Prud’homme, R. K., Protected Peptide Nanoparticles: Experiments and Brownian
Dynamics Simulations of the Energetics of Assembly. Nano Letters 2009, 9 (6), 2218-2222.
26. Ansell, S. M.; Johnstone, S. A.; Tardi, P. G.; Lo, L.; Xie, S.; Shu, Y.; Harasym, T. O.;
Harasym, N. L.; Williams, L.; Bermudes, D.; Liboiron, B. D.; Saad, W.; Prud’homme, R. K.;
Mayer, L. D., Modulating the Therapeutic Activity of Nanoparticle Delivered Paclitaxel by
Manipulating the Hydrophobicity of Prodrug Conjugates. Journal of Medicinal Chemistry 2008,
51 (11), 3288-3296.
27. D'addio, S. M.; Prud'homme, R. K., Controlling drug nanoparticle formation by rapid
precipitation. Advanced Drug Delivery Reviews 2011, 63 (6), 417-426.
28. Rh, J. J. a. M., Nanocrystal technology, drug delivery and clinical applications. Int J
Nanomedicine 2008, 3, 295-309.
29. Merisko-Liversidge, E. M.; Liversidge, G. G., Drug Nanoparticles: Formulating Poorly
Water-Soluble Compounds. Toxicologic Pathology 2008, 36 (1), 43-48.
30. Van Eerdenbrugh, B.; Van Den Mooter, G.; Augustijns, P., Top-down production of drug
nanocrystals: Nanosuspension stabilization, miniaturization and transformation into solid
products. International Journal of Pharmaceutics 2008, 364 (1), 64-75.
31. Wu, L.; Zhang, J.; Watanabe, W., Physical and chemical stability of drug nanoparticles.
Advanced Drug Delivery Reviews 2011, 63 (6), 456-469.
32. Williams, H. D.; Trevaskis, N. L.; Charman, S. A.; Shanker, R. M.; Charman, W. N.; Pouton,
C. W.; Porter, C. J. H., Strategies to Address Low Drug Solubility in Discovery and
Development. Pharmacological Reviews 2013, 65 (1), 315-499.
33. Gao, Y.; Carr, R. A.; Spence, J. K.; Wang, W. W.; Turner, T. M.; Lipari, J. M.; Miller, J. M.,
A pH-Dilution Method for Estimation of Biorelevant Drug Solubility along the Gastrointestinal
11
Tract: Application to Physiologically Based Pharmacokinetic Modeling. Molecular
Pharmaceutics 2010, 7 (5), 1516-1526.
34. Kennedy, M.; Hu, J.; Gao, P.; Li, L.; Ali-Reynolds, A.; Chal, B.; Gupta, V.; Ma, C.;
Mahajan, N.; Akrami, A.; Surapaneni, S., Enhanced Bioavailability of a Poorly Soluble VR1
Antagonist Using an Amorphous Solid Dispersion Approach: A Case Study. Molecular
Pharmaceutics 2008, 5 (6), 981-993.
35. Van Eerdenbrugh, B.; Van Speybroeck, M.; Mols, R.; Houthoofd, K.; Martens, J. A.; Froyen,
L.; Van Humbeeck, J.; Augustijns, P.; Van Den Mooter, G., Itraconazole/TPGS/Aerosil®200
solid dispersions: Characterization, physical stability and in vivo performance. European Journal
of Pharmaceutical Sciences 2009, 38 (3), 270-278.
36. Li, S.; Liu, Y.; Liu, T.; Zhao, L.; Zhao, J.; Feng, N., Development and in-vivo assessment of
the bioavailability of oridonin solid dispersions by the gas anti-solvent technique. International
Journal of Pharmaceutics 2011, 411 (1–2), 172-177.
37. Newman, A.; Knipp, G.; Zografi, G., Assessing the performance of amorphous solid
dispersions. Journal of Pharmaceutical Sciences 2012, 101 (4), 1355-1377.
38. Ilevbare, G. A.; Liu, H.; Edgar, K. J.; Taylor, L. S., Understanding Polymer Properties
Important for Crystal Growth Inhibition—Impact of Chemically Diverse Polymers on Solution
Crystal Growth of Ritonavir. Crystal Growth & Design 2012, 12 (6), 3133-3143.
39. Plakkot, S.; De Matas, M.; York, P.; Saunders, M.; Sulaiman, B., Comminution of ibuprofen
to produce nano-particles for rapid dissolution. International Journal of Pharmaceutics 2011,
415 (1–2), 307-314.
40. Liu, P.; Rong, X.; Laru, J.; Van Veen, B.; Kiesvaara, J.; Hirvonen, J.; Laaksonen, T.;
Peltonen, L., Nanosuspensions of poorly soluble drugs: Preparation and development by wet
milling. International Journal of Pharmaceutics 2011, 411 (1–2), 215-222.
41. Niwa, T.; Miura, S.; Danjo, K., Design of Dry Nanosuspension with Highly Spontaneous
Dispersible Characteristics to Develop Solubilized Formulation for Poorly Water-Soluble Drugs.
Pharmaceutical Research 2011, 28 (9), 2339-2349.
42. Sun, W.; Mao, S.; Shi, Y.; Li, L. C.; Fang, L., Nanonization of itraconazole by high pressure
homogenization: Stabilizer optimization and effect of particle size on oral absorption. Journal of
Pharmaceutical Sciences 2011, 100 (8), 3365-3373.
Sonal Mazumder-PhD Thesis
12
Chapter 2: Literature Review
2.1. Introduction to Oral Drug Delivery
Oral administration is the most simple and convenient mode of drug delivery. It is
painless compared to injections; convenient compared to enemas, easy to use, and can be
managed by the patient.
Almost 90% of all medicines are oral formulations. However, it is challenging to design delivery
systems optimizing drug stability (chemical, morphological and physiological stability in the GI
tract) in the gastrointestinal (GI) tract, such that a desirable pharmacokinetic profile may be
attained for a given drug1. In order to improve oral drug delivery it is important to recognize
solubility, permeability and residence time in the gastrointestinal milieu as well as different
characteristics of drugs and their delivery systems such as size, pH, density, diffusion, swelling,
adhesion, degradation and permeability2.
2.1.1. Oral Drug Delivery Route - Physicochemical and Physiological Conditions in the GI
Tract
The physiological characteristics of the gastrointestinal tract (Figure 2) are described in
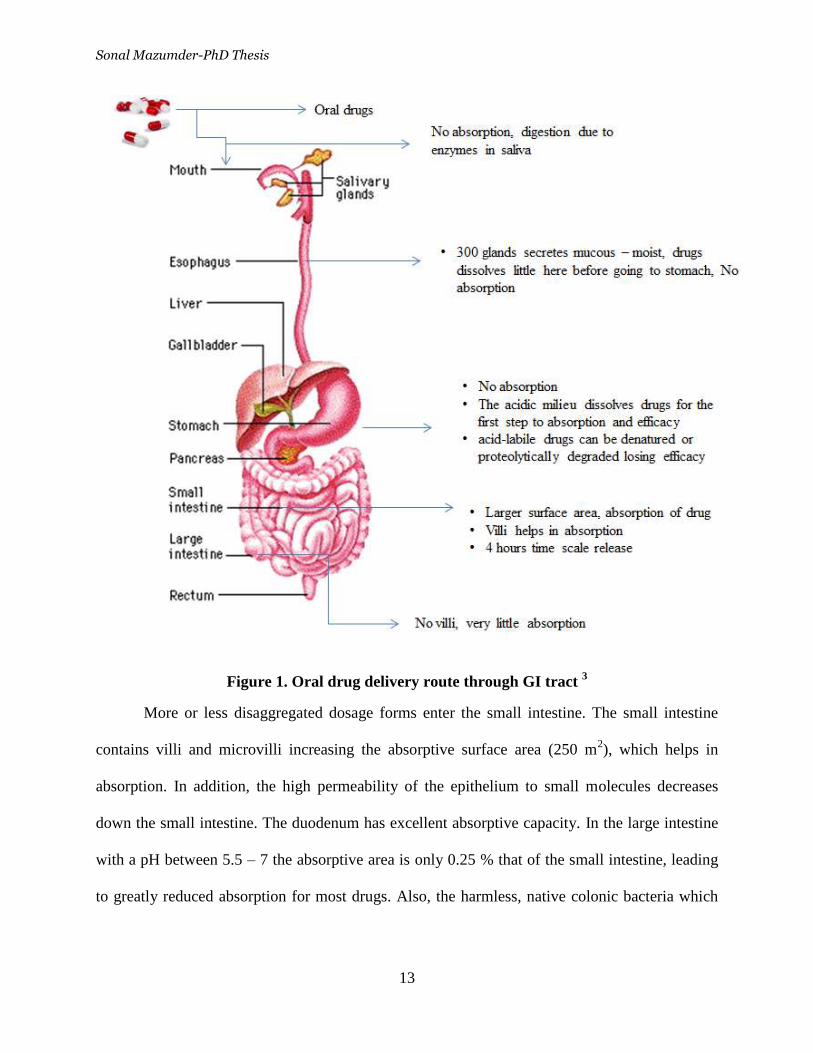
Table 1. The oral dosage forms comes in contact with saliva. Most drugs are not absorbed to any
significant extent in the mouth. The oral dosage form once swallowed rapidly goes to the
esophagus. The drug is barely dissolved here before going to the stomach. When it reaches the
stomach (fluid volume ≈1.5 L) the acidic milieu dissolves drugs (mainly the ones which
dissolves at low pH), for the first step to absorption or acid-labile drugs can be denatured or
proteolytically degraded losing efficacy. The pH and gastric retention time affects the dissolution
of the drugs in stomach.
Sonal Mazumder-PhD Thesis
13
Figure 1. Oral drug delivery route through GI tract 3
More or less disaggregated dosage forms enter the small intestine. The small intestine
contains villi and microvilli increasing the absorptive surface area (250 m2), which helps in
absorption. In addition, the high permeability of the epithelium to small molecules decreases
down the small intestine. The duodenum has excellent absorptive capacity. In the large intestine
with a pH between 5.5 – 7 the absorptive area is only 0.25 % that of the small intestine, leading
to greatly reduced absorption for most drugs. Also, the harmless, native colonic bacteria which
Sonal Mazumder-PhD Thesis
14
reside in this region may be killed when exposed to antibacterial drugs leading to gastrointestinal
side effects.
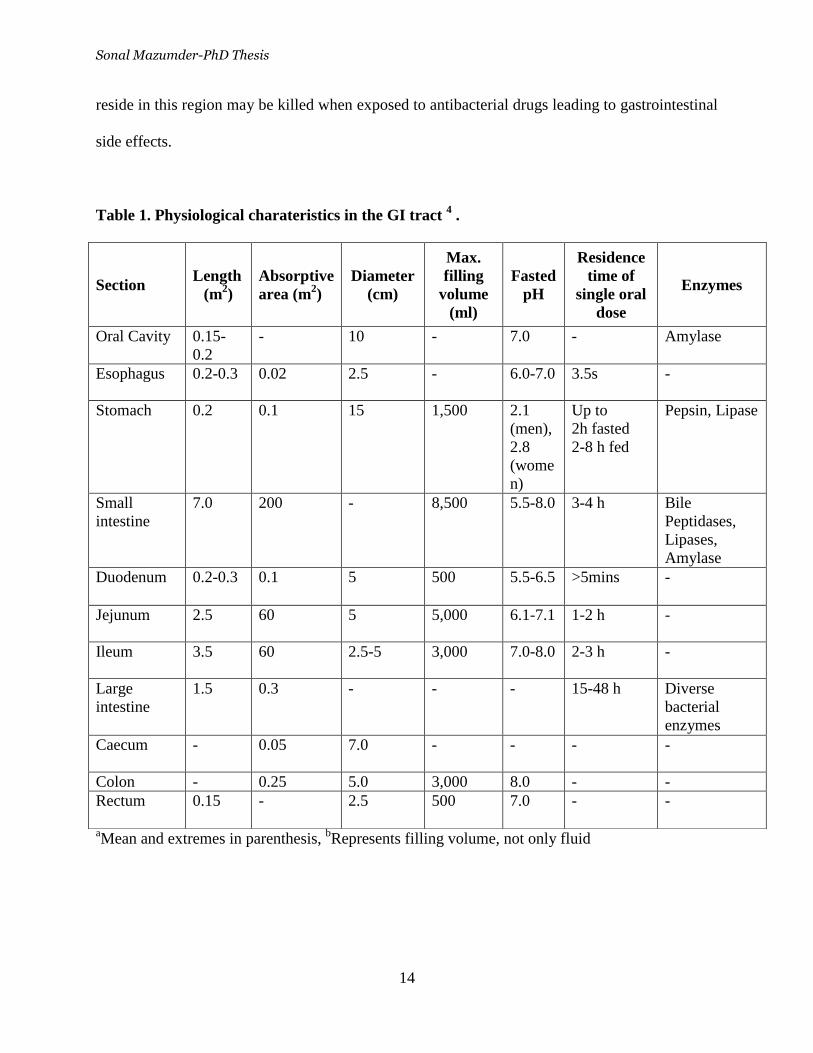
Table 1. Physiological charateristics in the GI tract 4 .
aMean and extremes in parenthesis,
bRepresents filling volume, not only fluid
Section Length
(m2)
Absorptive
area (m2)
Diameter
(cm)
Max.
filling
volume
(ml)
Fasted
pH
Residence
time of
single oral
dose
Enzymes
Oral Cavity 0.15-
0.2
- 10 - 7.0 - Amylase
Esophagus 0.2-0.3 0.02 2.5 - 6.0-7.0 3.5s -
Stomach 0.2 0.1 15 1,500 2.1
(men),
2.8
(wome
n)
Up to
2h fasted
2-8 h fed
Pepsin, Lipase
Small
intestine
7.0 200 - 8,500 5.5-8.0 3-4 h Bile
Peptidases,
Lipases,
Amylase
Duodenum 0.2-0.3 0.1 5 500 5.5-6.5 >5mins -
Jejunum 2.5 60 5 5,000 6.1-7.1 1-2 h -
Ileum 3.5 60 2.5-5 3,000 7.0-8.0 2-3 h -
Large
intestine
1.5 0.3 - - - 15-48 h Diverse
bacterial
enzymes
Caecum - 0.05 7.0 - - - -
Colon - 0.25 5.0 3,000 8.0 - -
Rectum 0.15 - 2.5 500 7.0 - -
Sonal Mazumder-PhD Thesis
15
2.1.2. Barriers to Oral Drug Delivery - Bioavailability
The Food and Drug Administration defines bioavailability 5 as ‘‘the rate and extent to
which the active ingredient or active moiety is absorbed from a drug product and becomes
available at the site of action. For drug products that are not intended to be absorbed into the
bloodstream, bioavailability may be assessed by measurements intended to reflect the rate and
extent to which the active ingredient or active moiety becomes available at the site of action.’’
Typically one modifies this definition to limit the delivery path from the site of administration to
the bloodstream. That is, bioavailability is defined as ‘‘the fraction of the oral dose that actually
reaches the systemic circulation intact,’’6 and is ‘‘commonly applied to both the rate and extent
of drug input into the systemic circulation”7.
It is important for the oral drug to overcome several different obstacles during the
delivery through the gastrointestinal tract, as well as through intestinal mucosa or the blood-brain
barrier. The barriers can be physiological and biochemical.8 These various barriers have to be
taken into account when designing drugs with improved absorption characteristics. However, the
focus of the thesis is to achieve maximum solution concentration in the small intestine to
enhance absorption of drug across the intestinal epithelium. The drug, while passing through the
stomach, can dissolve in the acidic environment. Some acid labile drugs can be denatured or
degraded and therefore lose their efficacy. Drugs which are poorly soluble, have poor
bioavailability from the small intestine, thereby decreasing the overall drug bioavailability.
2.1.3. Critical Factors Affecting Oral Drug Delivery
It is challenging to design delivery systems optimizing drug stability in the
gastrointestinal (GI) tract, such that a desirable pharmacokinetic profile may be attained for a
given drug 9. There are several factors in the GI tract which may limit the absorption and
Sonal Mazumder-PhD Thesis
16
solubility of drug in the intestine, like the morphological barriers (mucus layer, microvilli, etc.)
and some physiological factors (a wide range of pH, enzymatic activities, specific transport
mechanisms). The bioavailability of the drug is dependent on its dissolution which is usually the
rate-limiting step10
. Patient compliance problems can also be reduced by reducing the dosing
frequency to one dose per day 11
.
Drug Chemistry and Crystallinity
High water-solubility of the drug is required for rapid dissolution in the body fluids. In
order to permeate across the phospholipid bilayer of the cellular membrane, it must possess a
minimal lipophilicity.
The Lipinski “rule of five” is used to predict certain drug properties such as absorption or
permeation from the drug’s structure. For example, poor absorption or permeation is more likely
when there are more than five H-bond donors (–OH and –NH groups), 10 H-bond acceptors, the
molecular weight is greater than 500 and the calculated partition coefficient (log P) is greater
than 5 2.
The presence of different kinds of salts also affects the drug absorption. The presence of
excess chloride ions in gastric fluid can depress drug solubility resulting in salting out of the
drug12
. Potassium can irritate the GI, magnesium can be a laxative, and calcium can cause
constipation.
The crystallinity of the drug plays a major role in drug dissolution. The extent of
solubility and absorption depends on the polymorphic form of the drug. For example a
metastable polymorph would show higher solubility and absorption compared to a stable
polymorph. A study with beagles showed that the bioavailability of a monoclinic polymorph was
2.5 times higher than that of the more stable orthorhombic form 13
. The amorphous form requires
Sonal Mazumder-PhD Thesis
17
less energy for dissolution due to lack of crystalline lattices and thus exhibits higher
bioavailability than the crystalline form. The storage temperature of the drug formulation should
be 50ºC lower than the glass transition temperature to avoid spontaneous crystallization of
amorphous drugs 14
.
Particle Size
There has been considerable research about the preparation of microparticles and
nanoparticles with controlled features. For oral dosage forms, nanoparticles have shown great
promise for two reasons
(a) Most of the drugs, especially those which belong to Biopharmaceutics Classification System
(BCS) class II (high permeability, low solubility) and IV (low permeability, low solubility),
show insufficient bioavailability due to low solubility. Nanoparticles can clearly improve the
dissolution profile of the compound, thereby increasing the solubility15
.
(b) Research on the oral absorbability of nanoparticles has shown that drug-loaded systems could
effectively transport to systemic circulation16
. Undisputedly, this route of drug delivery is highly
complex.
Nanoparticles show faster and more uniform distribution in the GI tract compared to any
other dosage forms due to their small sizes17
. The larger surface area enhances the interaction of
the nanoparticles with the epithelial lining and mucus, prolonging retention time and thereby
enhancing bioavailability.18
Nanoparticle formulations exhibit enhance dissolution, safety,
patient compliance and improved drug efficacy.
The efficiency of a drug depends on its ability to dissolve, absorb, distribute and interact
with biological environment in the body. Drugs which show poor aqueous solubility are
dissolution-rate limited. The reduction in particle size of drug to nanometers improved
Sonal Mazumder-PhD Thesis
18
bioavailability significantly by enhancing dissolution rate19,20
. Therefore the amount of poorly
water-soluble drug that is free to be absorbed in the gastrointestinal tract and the chemical
potential across the membrane is maximized.
The enhancement of the dissolution rate can be shown by the classical convective mass transfer
rate equation21
Wd = KAsp[Cs - C∞] (1)
where,
Wd = (mass of drug released/time)/unit mass of particle
K = convective mass transfer coefficient
Asp = specific surface area of the particle
Cs = concentration of drug in liquid phase at surface of particle
C∞ = desired concentration of drug in the physiological environment
and
K = convective mass transfer coefficient ~ 2D/d
D = diffusion coefficient of drug in liquid phase
Asp = 6/(d) [units = area/particle mass]
Putting the values of K and Asp in equation (1),
Wd ~ (12D[Cs - C∞])/(d2 ) (2)
Reducing particle diameter from 1 micron to 50 nanometers (nm) increases the specific area and,
hence, the drug mass transfer rate Wd by 400-fold.
pH Dependent Drug Delivery
Polymers with different backbone modifications and side-chain conjugates have received
special attention in pH-controlled delivery of oral drugs. The group of methacrylate acid
Sonal Mazumder-PhD Thesis
19
copolymers or Eudragit® is widely used for the preparation of pH-sensitive coatings or
hydrogels. The dissolution of the polymer or extent of swelling depends on the ratio of free acid
to ester groups and also the quantity and type of charged groups (anionic or cationic) 22
.
According to the type of charged group, they will either dissolve completely in the stomach or, in
the case of quaternary amino groups, show swelling without complete disintegration. For
polymers containing polycarboxylic acid groups which are ionized at a pH > 5, release occurs
under alkaline conditions but not in acidic gastric fluids.
This pH-sensitive swelling of the polymers prevents exposure of the encapsulated
compound to harsh conditions in the stomach and enables unhindered delivery to the preferential
site of uptake. The fine-tuning of polymer composition, as well as type and extent of
derivatization, allows for a relatively precise controlling of the threshold pH. Some other
polymers show similar characteristics like chitosan or carboxymethylcellulose 23,23b
. The above
two characteristics of improving oral drug delivery (size and pH sensitive response) using
polymers has been used in this thesis to make novel polysaccharide drug nanoparticles of
cellulose derivate which has not been explored before.
2.2. Nanoparticles and Microparticles in Drug Delivery
In particulate drug delivery, the distinction is often made between micro- and
nanoparticles. Particle diameters between 50-300 nm can be called nanoparticles and diameters
above 500 nm are more likely to behave as microparticles... The difference in size between
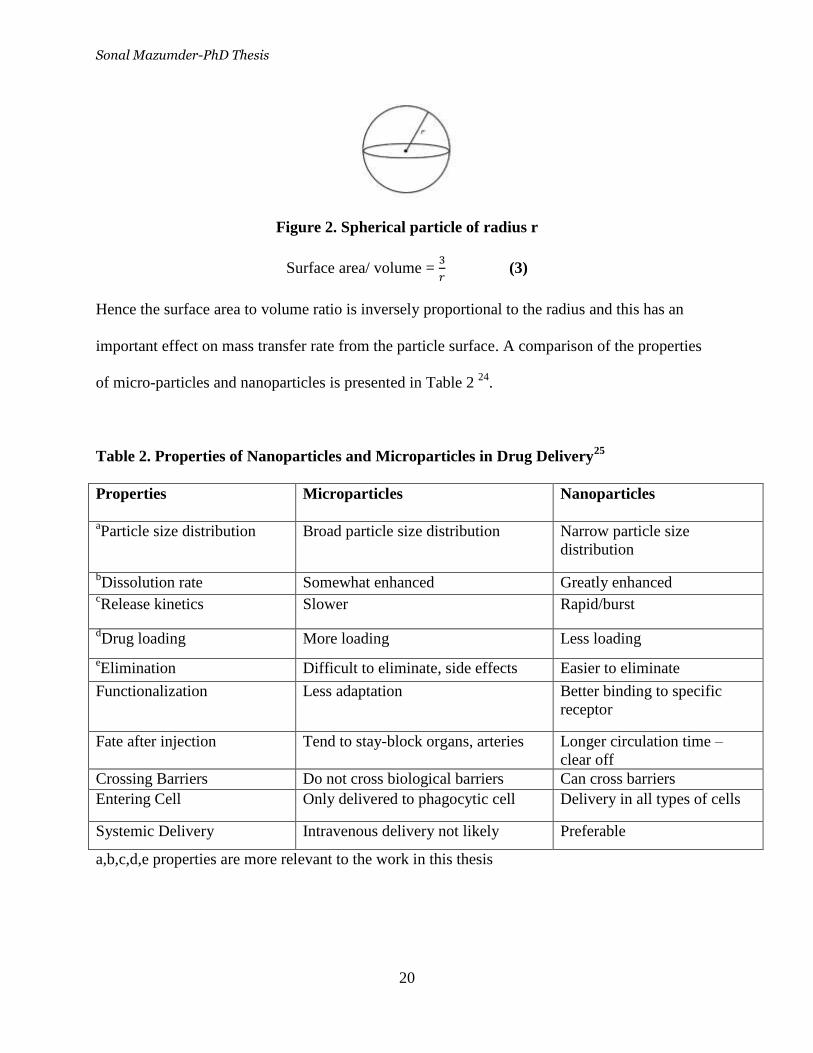
micro- and nanoparticles has several effects. For example, the surface-to-volume ratio for a
spherical particle (Figure 2) with a radius r is given by:
Sonal Mazumder-PhD Thesis
20
Figure 2. Spherical particle of radius r
Surface area/ volume =
(3)
Hence the surface area to volume ratio is inversely proportional to the radius and this has an
important effect on mass transfer rate from the particle surface. A comparison of the properties
of micro-particles and nanoparticles is presented in Table 2 24
.
Table 2. Properties of Nanoparticles and Microparticles in Drug Delivery25
Properties Microparticles Nanoparticles
aParticle size distribution Broad particle size distribution Narrow particle size
distribution
bDissolution rate Somewhat enhanced Greatly enhanced
cRelease kinetics Slower Rapid/burst
dDrug loading More loading Less loading
eElimination Difficult to eliminate, side effects Easier to eliminate
Functionalization Less adaptation Better binding to specific
receptor
Fate after injection Tend to stay-block organs, arteries Longer circulation time –
clear off
Crossing Barriers Do not cross biological barriers Can cross barriers
Entering Cell Only delivered to phagocytic cell Delivery in all types of cells
Systemic Delivery Intravenous delivery not likely Preferable
a,b,c,d,e properties are more relevant to the work in this thesis
Sonal Mazumder-PhD Thesis
21
The rate of dissolution for solid drug products can be enhanced by particle size reduction
and thereby increasing the surface area available for solvation. Particle size reduction
technologies are therefore routinely used to improve the oral bioavailability of poorly water
soluble drugs26,18, 27,27
.
Several top down, dry-impact processes like hammer mills, ball mills, and air-jet mills
are used to reduce the particle size of a coarse drug powder (a process called micronization).
This results in the formation of drug particles in the micron size range with particle sizes
commonly between 2-5 µm28,28b
. Recent technological developments have led to the ability to
produce much smaller (nano) particulates with sizes in the 200-500 nm range using polymeric
and surfactant stabilizers. While drug nanoparticles have a much larger surface area-to-volume
ratio than micron-scale particles, they can be highly cohesive and must be stabilized to prevent
aggregation29,30
.
The increase in surface area generated due to reduction in particle size increases the
dissolution and, therefore, an increase in bioavailability for drugs where exposure after oral
administration is limited by dissolution rate 31
. For example, there was an improvement in the
oral bioavailability of many poorly water-soluble drugs, including cilostazol32
, fenofibrate33
,
progesterone34
, proquazone35
, and nitrofurantoin36
after micronization, all of which are believed
to exhibit dissolution rate limited absorption. However, micron-sized drug particles are often
unable to overcome the challenges to absorption presented by compounds with very low aqueous
solubility (˂1 µg/ml)18, 37
. Therefore a number of methods have been developed to reduce
particle sizes to nanometer-scale dimensions.t is not a new concept to use nanoparticles as a
drug-delivery approach for various difficult-to-formulate reagents 38,39,40,41
. The nanometer size
Sonal Mazumder-PhD Thesis
22
increases the surface area which enhances the interaction of the particles with the epithelial
lining and mucus.
During past three decades, the pharmaceutical industry has developed and marketed
several nanoparticle formulations for intravenous administration such as intravenous nutritional
fat emulsion (Intralipid®) and liposomal products (Doxil®, AmBisome®)30
. However, poor drug
loading, high processing cost and limited availability of suitable excipients reduced the use of
these formulations. Many of these concerns have been approached by Elan’s NanoCrystal®
Technology. They successfully demonstrated the advantages of using nanoparticulates or
nanosuspension in several different modes of drug delivery 42
.
It has been estimated that more than 40% of pharmaceutically active substances have
poor bioavailability due to lack of significant solubility in water 43,44
. A molecule which needs to
penetrate a biological membrane to be absorbed must possess some hydrophobic or lipophilic
characteristics. Salts of such molecule which can retain biological activity have the potential to
improve solubility. However, these salt forms have several disadvantages such as poor stability,
poor bioavailability poor patient compliance. Nanoparticle formulation has proven to be very
useful technique to address the above mentioned issues.
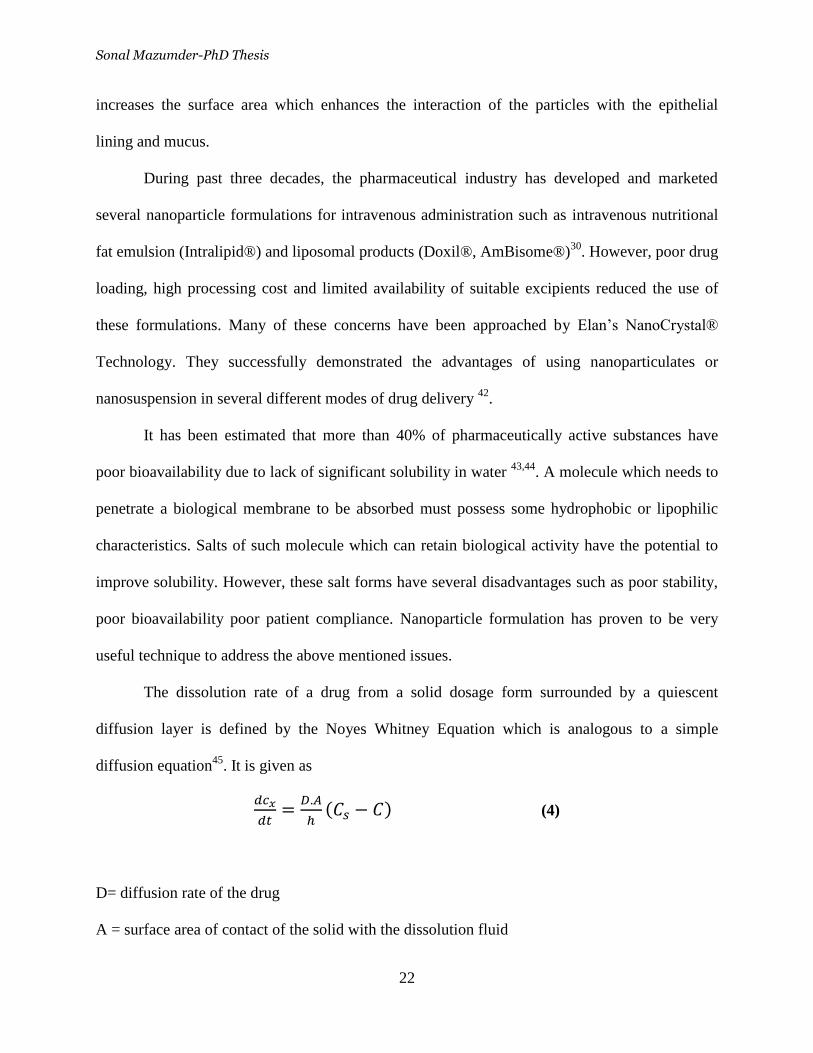
The dissolution rate of a drug from a solid dosage form surrounded by a quiescent
diffusion layer is defined by the Noyes Whitney Equation which is analogous to a simple
diffusion equation45
. It is given as
( ) (4)
D= diffusion rate of the drug
A = surface area of contact of the solid with the dissolution fluid
Sonal Mazumder-PhD Thesis
23
H = width of the diffusion layer
The increase in surface area is considered responsible for increased dissolution for
microparticles and nanoparticles. However, it is also apparent that the improvements in
dissolution velocity may exceed that predicted simply on the basis of available surface area.
There can be increase in the dissolution rate due to changes to drug solubility (Cs), to the
thickness of the diffusional layer (h), and to particle shape. According to traditional solubility
theory, the particle size has no effect on solid-state properties nor the efficiency of solvation.
Thus, a decrease in particle size is expected to have little impact on equilibrium solubility.
However, new technologies that support the isolation of particles with submicron particle sizes
require that this view be modified.
The Ostwald-Freundlich equation can be applied to show that a reduction in particle size
below 1 µm increases solvation pressure, subsequently giving rise to an increase in solubility29
.
It is difficult to measure the saturated solubility of a nanoparticle accurately, as it is complicated
by the potential for very small particles to remain suspended in solution after conventional
centrifugation (or even ultracentrifugation in some cases) and to pass through many of the
membrane filters used to separate drug in solution from solid drug46
. Given the low intrinsic
solubility of many of the drugs to which this technology is applied, only trace quantities of
particle contamination are required to generate large errors in solubility assessment.
The microparticle and nanoparticle systems previously shown to enhance itraconazole
dissolution in vitro were also subsequently examined in vivo after oral administration to rats, and
the differences in dissolution were shown to translate to differences in bioavailability. Thus,
micronization (to 5.5 mm) resulted in a 6-fold increase in oral bioavailability compared with a
non-micronized product, and further particle size reduction to yield nanoparticles with diameters
Sonal Mazumder-PhD Thesis
24
of 350 or 700 nm (by high-pressure homogenization) elicited further (6.8-fold) increases in
exposure compared with the micronized product ( ˃40-fold compared with non-micronized
drug)47
. In this case, the additional benefits of a reduction in particle size from 700 to 350 nm
were relatively small.
Drug nanosuspensions can be used in capsule and tablet formulation to study
pharmacokinetic, efficacy and toxicity for oral delivery20d,30
. When a formulation of a high
permeability and low solubility (˂1 mg/ml) was administered as oral nanosuspension to rats, the
drug exposure in rats was significantly increased compared with both nonmicronized material
and a lipid-surfactant mixture15
.
Polymer nanoparticles in Oral Drug Delivery
Nanocarriers such as polymeric nanoparticles or micelles have provided a promising
approach to obtain desirable biopharmaceutical and pharmacokinetic properties for medicines.
Different methods can be selected to prepare nanoparticles depending on the nature of the
polymer, as well as on the drug to be encapsulated48
. Some of the methods may be harmful to
biopharmaceuticals due to usage of organic solvents, heat, sonication or vigorous agitation.
Nanoparticles formation can be also based on electrostatic interactions which do not require
aggressive conditions during preparation, therefore minimizing possible damage to the drug
during formation 49
.
A large number of natural and synthetic biodegradable polymers are available to form
nanoparticles50
. Natural materials used for oral delivered nanoparticles include chitosan, dextran,
gelatine, alginate, agar 51
. The synthetic polymers which are used for oral drug delivery are poly
(lactide)(PLA), poly(glycolide) (PGA), poly(lactide-co-glycolide) (PLGA), poly(cyanoacrylates)
(PCA), polyethylenimine (PEI) or polycaprolactone (PCL)49, 52
.
Sonal Mazumder-PhD Thesis
25
2.3 Amorphous Solid Dispersions
Solid dispersions have been explored for enhancing dissolution and oral bioavailability
for poorly water-soluble drugs for over 50 years 53,53b,54,55,56
. There are several mechanisms by
which solid dispersions can increase drug dissolution such as by reduction in effective particle
size, improved wetting, enhanced solubilization, as well as suppressing the lattice energy barrier
by stabilizing the drug in the amorphous state.
The desirable properties of a polymer for oral drug delivery are as follows:
a) The polymer and its degradation products should be biocompatible.
b) The polymer must have a high glass transition temperature, so that the drug-polymer
formulation can stored for months.
c) A hydrophobic/hydrophilic balance and presence of groups such as charged groups that
maximize drug interaction and result in drug-polymer miscibility.
d) It must also prevent or retard drug recrystallization after release and a pH-controlled
release is most suitable for oral drug delivery (refer to section 1.3).
Many polymeric materials have been used for this purpose such as poly(lactic acid),
poly(glycolic acid), polycaprolactone, polysaccharides, poly(acrylic acid) family, proteins and
polypeptides (e.g., gelatin). Among them, polysaccharides are the most popular for making
nanoparticles for drug delivery. As stated before, the amorphous form of the drug requires less
energy for dissolution and thus exhibits higher bioavailability than the crystalline form. This
results in an amorphous solid dispersion (ASD) which is formed when the drug is evenly and
molecularly dispersed in an amorphous polymer matrix. ASDs have been proven to increase
dissolution rate and drug concentration in the gastrointestinal medium. 57
Higher dissolution rates
in some cases led to significant improvements in drug absorption58,31,59,60,61,56
. ASDs are also
Sonal Mazumder-PhD Thesis
26
well tolerated in vivo due to the presence of non-toxic excipients. Therefore, ASDs are often a
preferred method of increasing solubility and bioavailability of poorly soluble drugs.
An example of a commercially available ASD is that of Sporanox capsules (Janssen
Pharmaceuticals), an antifungal product containing the poorly water-soluble drug itraconazole
molecularly dispersed in HPMC and coated onto inert sugar beads. When Sporanox was
administered orally, there was significant enhancement of oral bioavailability compared with the
more slowly dissolving crystalline itraconazole 62,60
. Despite several advantages, there are only
few ASDs available commercially due to the thermodynamic instability of drug in the
amorphous form. For example Norvir (a capsule formulation of the antiviral drug ritonavir;
Abbott Laboratories) was withdrawn due to thermodynamic instability and replaced by a more
stable and less soluble crystalline polymorph63
.
Previous studies showed that high-molecular-weight polymers such as HPMC (and
derivatives), PVP, and the methacrylates are able to inhibit drug crystallization64,65,66
, and,
therefore, enhance physical stability. The mechanisms by which an amorphous drug is stabilized
include a reduction in molecular mobility by increasing local viscosity in the solid dispersion
matrix53b,67,68
, restriction of molecular movement due to intermolecular interactions between
polymer and drug69
, and the inhibition of crystal nucleation70,71,72,73
. The factors which effect the
inhibition of crystallization are crystallization tendencies of the drug, the properties of the carrier
(hydrophobicity, chain conformation), and the ratio of drug-to-carrier. Increasing the drug load
decreases the quantity of carrier available to stabilize the drug in the high energy form. Also,
high drug loading will promote phase separation within the solid dispersion thus increasing the
risk of instability74,75
.
Sonal Mazumder-PhD Thesis
27
Table 3 shows most common polymers used as ASDs. Also the polymer must not itself
have a tendency to crystallize70, 76
. It is preferable that all crystallinity of the drug substance be
suppressed by the polymer carrier since small pockets of crystallinity can act as seeds, resulting
in additional crystal growth which reduces the shelf-life of the drug formulation77
. To date,
polymers used in pharmaceutical formulations, such as polyethylene glycol (PEG) and
poly(vinylpyrollidinone) PVP are used to enhance drug solubility. However these polymers are
both highly water solubility and have a tendency to crystallize and an inability to stabilize some
actives in the solid phase, respectively78
. Recently, another interesting polysaccharide
hydroxypropylmethyl cellulose acetate succinate (HPMCAS) was found to have interesting
properties to form amorphous matrix formulations79
.
Most of the methods illustrated in Table 3 produce microparticles. In our work for the
first time amorphous solid dispersions of polymer-drug nanoparticles were prepared by a rapid
precipitation process. There have been several polysaccharides studied for producing amorphous
nanoparticles. However the following showed well defined characteristics suitable for oral drug
delivery.
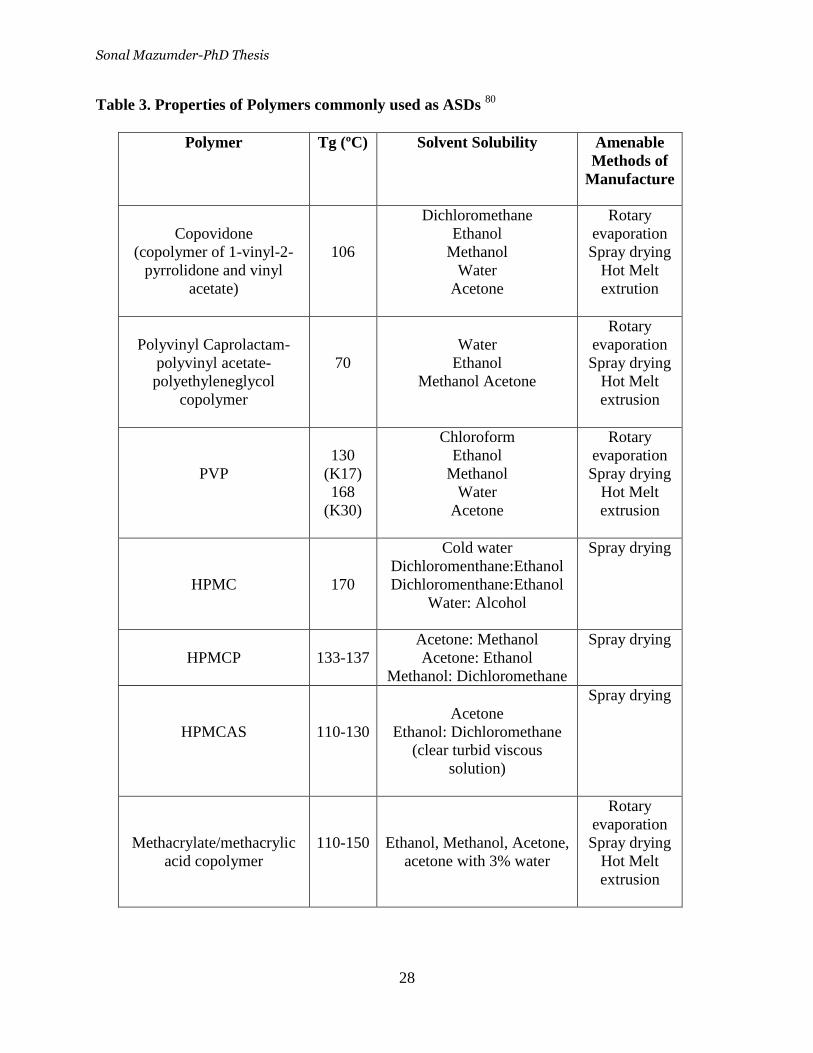
Sonal Mazumder-PhD Thesis
28
Table 3. Properties of Polymers commonly used as ASDs 80
Polymer Tg (ºC) Solvent Solubility Amenable
Methods of
Manufacture
Copovidone
(copolymer of 1-vinyl-2-
pyrrolidone and vinyl
acetate)
106
Dichloromethane
Ethanol
Methanol
Water
Acetone
Rotary
evaporation
Spray drying
Hot Melt
extrution
Polyvinyl Caprolactam-
polyvinyl acetate-
polyethyleneglycol
copolymer
70
Water
Ethanol
Methanol Acetone
Rotary
evaporation
Spray drying
Hot Melt
extrusion
PVP
130
(K17)
168
(K30)
Chloroform
Ethanol
Methanol
Water
Acetone
Rotary
evaporation
Spray drying
Hot Melt
extrusion
HPMC
170
Cold water
Dichloromenthane:Ethanol
Dichloromenthane:Ethanol
Water: Alcohol
Spray drying
HPMCP
133-137
Acetone: Methanol
Acetone: Ethanol
Methanol: Dichloromethane
Spray drying
HPMCAS
110-130
Acetone
Ethanol: Dichloromethane
(clear turbid viscous
solution)
Spray drying
Methacrylate/methacrylic
acid copolymer
110-150
Ethanol, Methanol, Acetone,
acetone with 3% water
Rotary
evaporation
Spray drying
Hot Melt
extrusion
Sonal Mazumder-PhD Thesis
29
The tendency of the drug to recrystallize from the supersaturated solutions that are
generated by dissolution of amorphous drug dictates the formulation performance. Without
stabilization, recrystallization occurs which destroys an ASD, leading to a decrease in the
quantity of drug in solution available for absorption. However, in several cases it was shown that
polymers can be included within the formulation matrix to reduce the tendency to crystallize
post-dissolution and to provide for significant increases in oral bioavailability81,82,83
.
When the drug is molecularly dispersed in the polymer matrix, the particle size of drug in
the carrier is minimized, theoretically, to the size of a single molecule84
. The effective surface
area for dissolution is increased due to the reduction in particle size. The dissolution of
amorphous drug may lead to secondary precipitation from the supersaturated solutions and
results in the formation of suspensions with relatively small particle size82,85,86
. It is often
difficult to distinguish between an increase in dissolution that results from a reduction in the
particle size of the aggregates present in the original solid dispersion and the size of particles that
may be formed in situ via precipitation on dissolution. Nonetheless, in most cases, an increase in
the dissolution rate resulting from a decrease in the size of dissolving drug particles is evident.
PEG-based solid dispersions enhance the dissolution of many low solubility
compounds87,88,89
. However, the tendency of PEG to crystallize is a crucial issue. In some
formulations like PEG 6000–based solid dispersions, the dissolution rate of diazepam and
temazepam increased compared with the crystalline drug but the rate of dissolution was no better
than that of equivalent PEG-drug physical mixtures87
. Similarly, the rates of dissolution of
physical mixtures of nifedipine with PEG 4000 and 6000 were equivalent to that of a solid
dispersion, even though the manufacturing of solid dispersions of polymer and drug resulted in
nifedipine transforming to a metastable and more soluble physical form90
.
Sonal Mazumder-PhD Thesis
30
The strength of intermolecular solid-state interactions in an amorphous solid is lower than
in crystalline solids. From the solubility equations31
, a reduction in intermolecular forces in the
solid state contributes to an increase in solubility. It is often found that there is a notable
difference in experimentally determined amorphous and crystalline solubilities91,92
. Therefore,
there have been complexities in measuring the “equilibrium” solubility of a thermodynamically
unstable amorphous material since spontaneous crystallization results in underestimation of the
initial (kinetic) solubility properties of the amorphous form92,93,94
. Recent work by Murdance et
al.93, 95
suggests that historical predictions of amorphous drug solubility, which were predicted
using the difference in heat capacity between crystalline and amorphous drug, may have been
overestimates since amorphous solids are often hygroscopic and constantly absorb water. This
results in decreasing the drug-water interactions which decreases the free energy difference
between amorphous and crystalline drug and reduces the solubility advantage compared with
theoretical predictions. However, there are significant drug solubility advantages from ASDs
which are demonstrated through increases in dissolution rate and, ultimately, oral bioavailability.
The dissolution of an amorphous drug from an ASD leads to the attainment of drug
solutions that are supersaturated with respect to the equilibrium crystalline drug. The
supersaturation provides a greater concentration of dissolved drug and generates drug solutions
with increased thermodynamic activity. This also provides an advantage with respect to drug
absorption, but the supersaturated solutions are unstable and at risk of precipitation. The rate of
drug precipitation from supersaturated solutions can be inhibited or retarded by the presence of
materials such as polymers that inhibit crystal nucleation or slow crystal growth96,83,97
. In work
by Yamashita et al.98
, it was shown that HPMC prevented recrystallization of tacrolimus more
effectively compared with PVP and PEG 6000 (Figure 3), and HPMC-based ASDs have
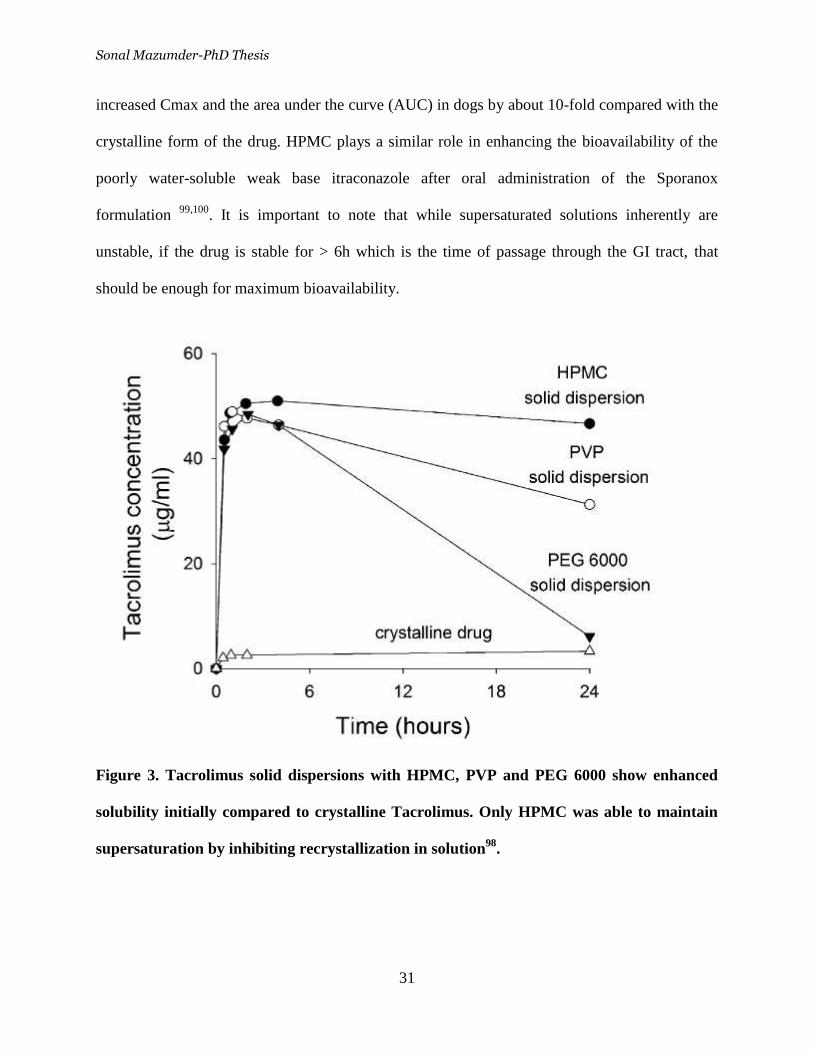
Sonal Mazumder-PhD Thesis
31
increased Cmax and the area under the curve (AUC) in dogs by about 10-fold compared with the
crystalline form of the drug. HPMC plays a similar role in enhancing the bioavailability of the
poorly water-soluble weak base itraconazole after oral administration of the Sporanox
formulation 99,100
. It is important to note that while supersaturated solutions inherently are
unstable, if the drug is stable for > 6h which is the time of passage through the GI tract, that
should be enough for maximum bioavailability.
Figure 3. Tacrolimus solid dispersions with HPMC, PVP and PEG 6000 show enhanced
solubility initially compared to crystalline Tacrolimus. Only HPMC was able to maintain
supersaturation by inhibiting recrystallization in solution98
.
Sonal Mazumder-PhD Thesis
32
HPMCAS has recently shown promising results in oral formulations 82,59, 101,92, 102
.
HPMCAS also has a high glass transition temperature (120°C) and, therefore, can reduce
mobility and protect against drug crystallization in the solid state.
The precipitation of the drug from a supersaturated solution consists of the formation of
particle nuclei and subsequent particle growth103,71
. The drivers of phase separation or
crystallization are responsible for nucleation and particle/crystal growth in solution. One way of
reducing the potential for precipitation from solution is by increasing the drug solubility in
solution, as this will reduce the level of supersaturation and the thermodynamic drivers of drug
precipitation. Polymeric carriers can enhance stability of supersaturated solutions by increasing
drug solubilization. They reduce drug precipitation by slowing the kinetics of drug precipitation
or crystallization,59, 84, 86, 97a, 102, 104
by interacting with the drug in solution and by adsorption to
the interface of the emerging particle/crystal nucleus 66,105,106,107
. Therefore the polymer has the
ability to reduce crystal growth and to disrupt the manner in which the crystal lattice is formed71
.
For example, a drug released from HPMCAS solid dispersions was stabilized in solution in the
form of amorphous drug polymer colloidal assemblies (20 to 300 nm in diameter)71
. The
presence of colloidal drug-polymer aggregates decreases the collision frequency of monomeric ,
solvated free drug molecules thereby decreasing the kinetic nucleation and providing more
sustained periods of supersaturation71, 93, 108
. The presence of nanoparticles in the dissolution
media during release of felodipine from HPMC85
and ketoconazole from PVP solid dispersions86
sustain the period of supersaturation. Separation techniques like centrifuge or filtration may not
be able to separate small aggregates from free drug in solution. This may complicate analysis. It
is difficult to define accurately whether the drug is completely dissolved in solution or dispersed
as nanosized aggregates92
. Another major disadvantage is that these nanoparticles may grow and
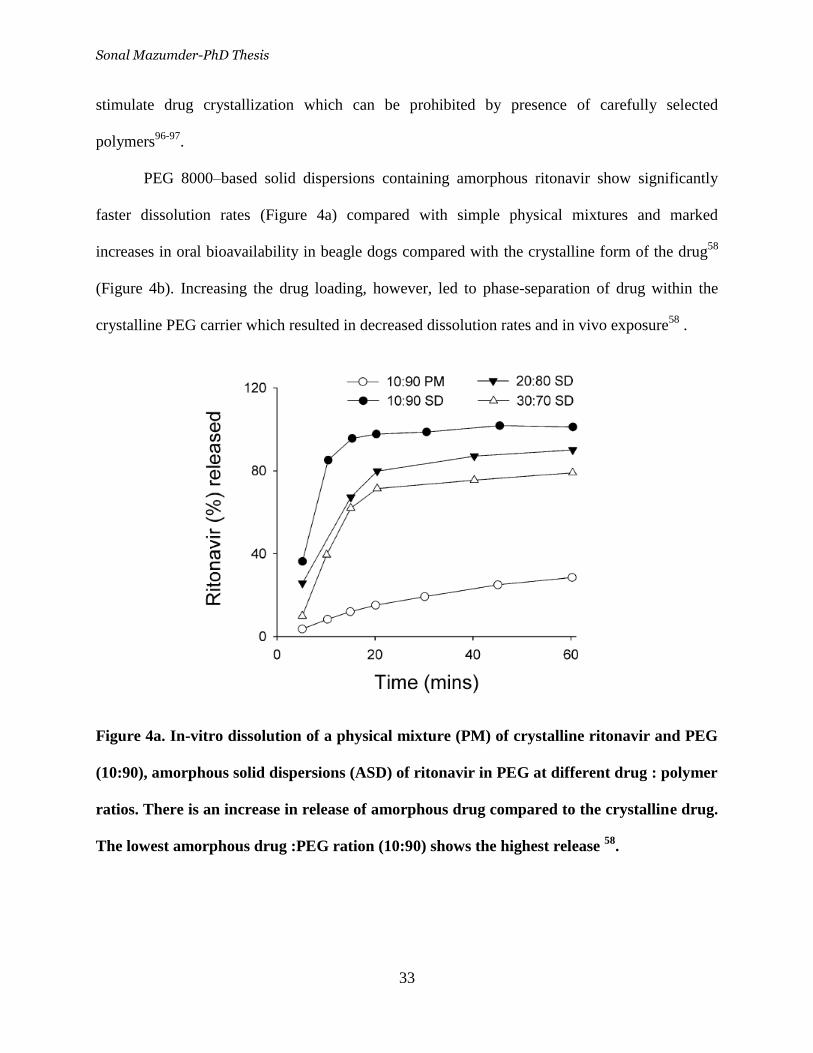
Sonal Mazumder-PhD Thesis
33
stimulate drug crystallization which can be prohibited by presence of carefully selected
polymers96-97
.
PEG 8000–based solid dispersions containing amorphous ritonavir show significantly
faster dissolution rates (Figure 4a) compared with simple physical mixtures and marked
increases in oral bioavailability in beagle dogs compared with the crystalline form of the drug58
(Figure 4b). Increasing the drug loading, however, led to phase-separation of drug within the
crystalline PEG carrier which resulted in decreased dissolution rates and in vivo exposure58
.
Figure 4a. In-vitro dissolution of a physical mixture (PM) of crystalline ritonavir and PEG
(10:90), amorphous solid dispersions (ASD) of ritonavir in PEG at different drug : polymer
ratios. There is an increase in release of amorphous drug compared to the crystalline drug.
The lowest amorphous drug :PEG ration (10:90) shows the highest release 58
.
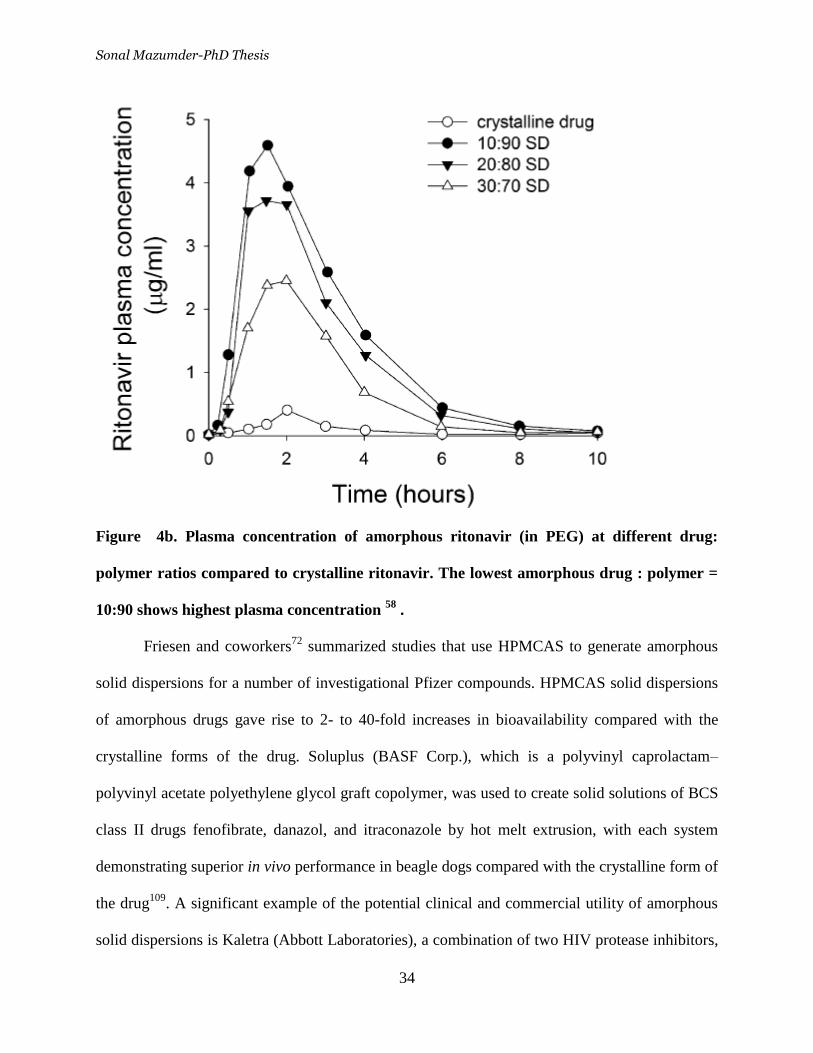
Sonal Mazumder-PhD Thesis
34
Figure 4b. Plasma concentration of amorphous ritonavir (in PEG) at different drug:
polymer ratios compared to crystalline ritonavir. The lowest amorphous drug : polymer =
10:90 shows highest plasma concentration 58
.
Friesen and coworkers72
summarized studies that use HPMCAS to generate amorphous
solid dispersions for a number of investigational Pfizer compounds. HPMCAS solid dispersions
of amorphous drugs gave rise to 2- to 40-fold increases in bioavailability compared with the
crystalline forms of the drug. Soluplus (BASF Corp.), which is a polyvinyl caprolactam–
polyvinyl acetate polyethylene glycol graft copolymer, was used to create solid solutions of BCS
class II drugs fenofibrate, danazol, and itraconazole by hot melt extrusion, with each system
demonstrating superior in vivo performance in beagle dogs compared with the crystalline form of
the drug109
. A significant example of the potential clinical and commercial utility of amorphous
solid dispersions is Kaletra (Abbott Laboratories), a combination of two HIV protease inhibitors,
Sonal Mazumder-PhD Thesis
35
ritonavir (50 mg) and lopinavir (200 mg), in a polyvinylpyrrolidone/ vinylacetate copolymer
(PVPVA) solid dispersion prepared by hot-melt extrusion110,110b
. Sporanox (Janssen
Pharmaceuticals) provides a second commercial example of the utility of amorphous solid
dispersions.
Molecular dispersion of a drug within a solid polymer is expected to provide the
maximum surface area available for hydration and, therefore, faster dissolution rates. Indeed, the
dissolution rate of molecularly dispersed drug may be almost instantaneous. However, when
drug dissolution is rapid, the dissolution rate of the carrier has the potential to limit drug
release84,111
. Drug dissolution is dependent on carrier hydrophilicity and viscosity. Drug release
from solid dispersions is dependent on the relation between the rate of release of drug and the
rate of release or dissolution of the polymeric carrier112
. It is often observed that low drug
loading favors the formation of molecular dispersions. Polymer selection is therefore a tradeoff
between properties, including release rate and amorphous drug stabilization113
.
Drug-release profiles also change with increasing drug-carrier ratio. It has been shown
that increasing the drug load decreases the quantity of carrier available to stabilize the drug in
the high energy form. Also, high drug loading will promote phase separation within the solid
dispersion, in turn increasing the risk of instability74,75
. Drug-release profiles also change with
increasing drug-carrier ratio. It was shown in several cases that with increasing drug loading,
there was a reduction in drug dissolution rate from solid dispersion114,58,115,116,117,101, 118,64,119,119b
.
The decrease in dissolution is due to a reduction in the quantity of molecularly dispersed drug
form since increasing drug load reduces the intermolecular distance between drug molecules and
the quantity of stabilizing polymer, both of which favor phase separation of
amorphous/crystalline particulate drug in the carrier69,75
.
Sonal Mazumder-PhD Thesis
36
At high drug-polymer ratios, the relative quantity of the polymer present is reduced,
thereby leading to a decrease in drug wetting only if the polymer is less hydrophobic than the
drug. This leads to a drug-rich solid phase which increases the risk of phase separation or
crystallization120,84,85
. Under these conditions, the rate of drug release is dependent on the
physical form of the drug in the drug-rich layer. Where the drug is present as an amorphous
suspension, its concentrations that are likely to be achieved during dissolution are expected to be
supersaturated relative to the solubility of the crystal form but unlikely (thermodynamically) to
exceed the saturated solubility of amorphous drug. In contrast, when the drug is molecularly
dispersed, rapid initial dissolution may lead to supersaturation relative to crystal drug solubility.
Most of the polymers which are used in ASDs have high Tg values (such as Tg of PVP
K30 is 168°C, and the Tg of HPMC is 170°C) , in excess of that of most drugs117,121
. The high Tg
values of these polymers dictate that homogeneous dispersions of drug and polymer have Tg
values that are higher than the drug Tg. Therefore, the polymeric formulations have the potential
to stabilize molecular transitions in the amorphous state. Dispersing drugs in a polymer matrix
provides a means of kinetic stabilization of the amorphous form of the drug that might not be
possible in the absence of polymer, because of rapid molecular relaxation and crystallization64
.
Polymer incorporation usually increases the physical stability of amorphous drug by increasing
the Tg of the system and reducing molecular mobility122,101,123
. The use of high-molecular weight
polymers as vehicles for solid dispersion formation, therefore, provides an opportunity to both
increase the likelihood of glass formation and promote the stability of the amorphous system
formed through increased Tg. The storage temperature of 50°C below the Tg reduces the
mobility sufficiently to allow acceptable physical stability53b,124
. It was shown that, in the
absence of polymer, indomethacin recrystallized in less than 6 weeks at storage temperatures
Sonal Mazumder-PhD Thesis
37
20°C below the Tg. However, when the drug was molecularly dispersed in PVP solid
dispersions, the difference between the Tg of indomethacin in the formulations and the storage
temperature increased to 40–50°C and recrystallization of indomethacin was suppressed64
.
Amorphous solid dispersions with high Tg values might show evidence of crystallization
due to plasticizing effect of moisture adsorption during storage125,126
. It is shown that sensitivity
to moisture was ascribed to the hygroscopic nature of PVP as similar solid dispersions containing
the less hygroscopic polymers HPMC and HPMCAS showed reduced instability on exposure to
moisture127
. In this regard one should be cautious about incorporating any hygroscopic
excipients or fillers in the tablet formulation which may act as plasticizers128
. Therefore, it is
important to use appropriate storage conditions, barrier packaging, and/or to use less hydrophilic,
less hygroscopic polymers to minimize water uptake.
To initiate crystallization, an activation energy barrier must be overcome that reflects the
kinetic limitations to crystallization. This is the energy required for molecules to diffuse and
appropriately align such that nucleation and the formation of a new solid phase are possible129
.
The stability of an amorphous drug is a function of both the free energy (equivalently, the
chemical potential) of the amorphous form and the kinetic barriers to crystallization provided by
the viscosity of the glass and supplemented by the addition of excipients, such as polymers70,72,
94.
Differential scanning calorimetry (DSC) is routinely used to determine the miscibility of
drug-polymer mixtures. When the Tg of the drug and polymer are different, a single Tg value
during a melting DSC cycle is usually considered satisfactory evidence of drug polymer
miscibility. In contrast, multiple Tg values suggest incomplete drug-polymer mixing or limited
drug-polymer miscibility114,130
. It is important to note that DSC is not a room temperature
Sonal Mazumder-PhD Thesis
38
technique; crystallization may occur during heat-up. Solubility parameters (Hildebrand and
Hansen) provide an alternative mechanism for estimation of the potential for drug-polymer
miscibility, where drug polymer combinations with the most similar solubility parameters are
expected to provide the greatest likelihood of miscibility131,132
. The lack of crystalline peaks and
presence of an amorphous halo in X-ray diffraction data also provide additional information
about the degree of molecular dispersion of the amorphous drug with the polymer.
The increase in drug loading led to a progressive decrease in the Tg of the drug-polymer
mixtures in diazepam-PVP solid dispersions. Above 35% w/w drug, two distinct Tg values were
observed (i.e., drug and polymer glass transitions) as the drug-phase separated from the polymer.
At higher drug loads, the absolute level of molecularly dispersed drug was largely unchanged.
However, the level of the drug arranged as amorphous clusters increased steadily. Solid
dispersions greater than the diazepam-PVP miscibility limit (35%), therefore, show
characteristics of both an amorphous suspension and an amorphous solid solution130
Unlike molecularly dispersed formulations, phase separated drugs present as suspended
amorphous particles ars no longer intimately mixed with the carrier. This more heterogeneous
molecular rearrangement is more likely to crystallize compared with solid dispersions where
drug is present in a molecularly dispersed form that has increased kinetic stability as a result of
intimate contact with the polymer68,133,
134
. Solid dispersions with lower drug-polymer ratios and
those with high drug polymer miscibility therefore show better physical stability at ambient
temperatures135,130,82,75
.
2.3.1 Polysaccharides in drug delivery
In oral drug delivery, commercial cellulose esters are used as excipients for coating,
membranes and promote dissolution of the drug. Cellulose acetate phthalate (Cellacefate, NF) is
Sonal Mazumder-PhD Thesis
39
used as an enteric coating for pharmaceutical active tablets prevent dissolution of the drug in the
stomach by utilizing its pH-mediated solubility .136
Cellacefate, NF is insoluble below pH~ 3 in
the stomach 137
but rapidly dissolves at pH 5 and up, which is typical of the pH range of the
gastrointestinal tract from the duodenum through the colon .138
Other cellulose esters used in
drug delivery, cellulose diacetate and cellulose acetate butyrate are water insoluble and pH
insensitive.
In oral dosage forms, hydroxypropylcellulose (HPC) is widely used as a binder due to
excellent chemical characteristics, water solubility and mucoadhesive properties. Ebube et al.
showed that the hydrophilic matrix formulations of HPC during release of acetaminophen were
altered due to the presence of pseudoephedrine which generated an additional osmotic gradient
resulting in faster polymer swelling and increase in gel thickness139
. Other applications of HPC
were in a preoral, extended-release bioadhesive tablet formulation of verapamil HCl 140
,
buccoadhesive tablets for insulin and propranolol delivery141
, vaginal bioadhesive tablets of
acyclovir142
and oral drug delivery of poorly soluble cyclosporine143
.
The 2-hydroxylpropyl ether of methyl cellulose (HPMC) is extensively used in oral
controlled drug delivery systems 144,144b
. It is derived from alkali-treated cellulose which is
reacted with methyl chloride and propylene oxide. HPMC swells and produces a viscous,
colloidal solution when dissolved slowly in cold water. It is also soluble in most polar organic
solvents. Recently scientists have recognized the interesting properties of
hydroxypropylmethylcellulose acetate succinate (HPMCAS) in amorphous matrix
formulations144a
. The most important polysaccharides used in pharmaceuticals are as shown in
Table 4.
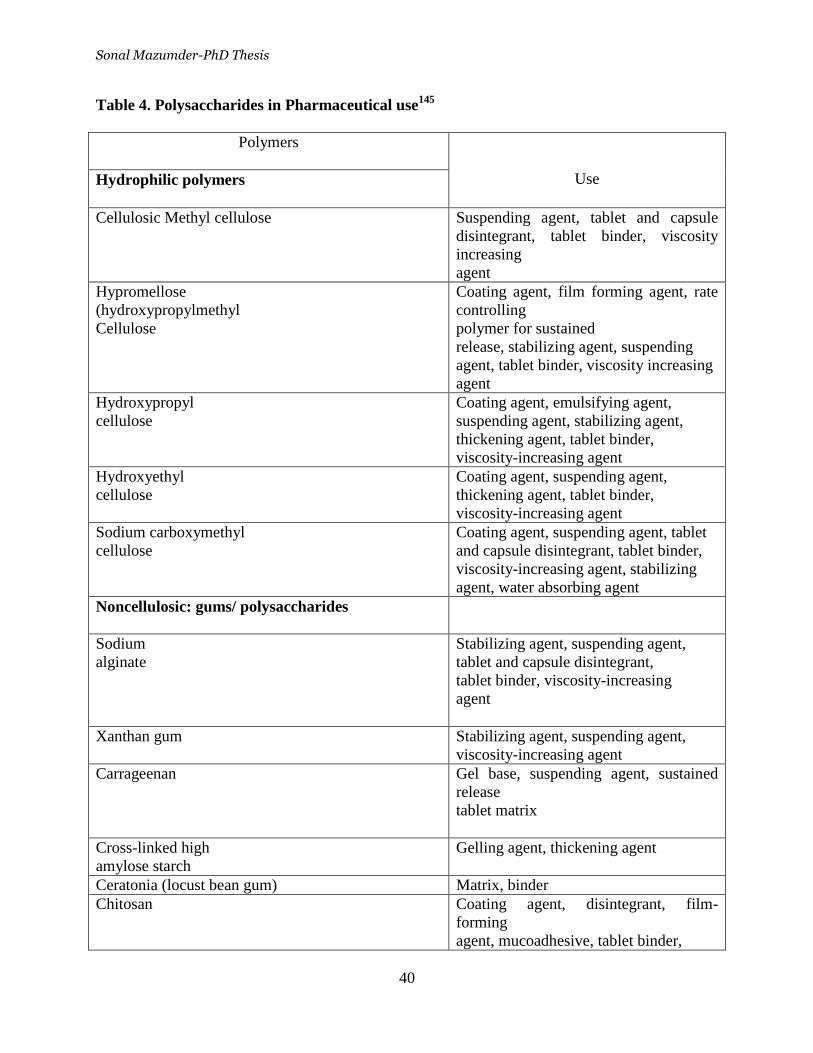
Sonal Mazumder-PhD Thesis
40
Table 4. Polysaccharides in Pharmaceutical use145
Polymers
Use Hydrophilic polymers
Cellulosic Methyl cellulose Suspending agent, tablet and capsule
disintegrant, tablet binder, viscosity
increasing
agent
Hypromellose
(hydroxypropylmethyl
Cellulose
Coating agent, film forming agent, rate
controlling
polymer for sustained
release, stabilizing agent, suspending
agent, tablet binder, viscosity increasing
agent
Hydroxypropyl
cellulose
Coating agent, emulsifying agent,
suspending agent, stabilizing agent,
thickening agent, tablet binder,
viscosity-increasing agent
Hydroxyethyl
cellulose
Coating agent, suspending agent,
thickening agent, tablet binder,
viscosity-increasing agent
Sodium carboxymethyl
cellulose
Coating agent, suspending agent, tablet
and capsule disintegrant, tablet binder,
viscosity-increasing agent, stabilizing
agent, water absorbing agent
Noncellulosic: gums/ polysaccharides
Sodium
alginate
Stabilizing agent, suspending agent,
tablet and capsule disintegrant,
tablet binder, viscosity-increasing
agent
Xanthan gum
Stabilizing agent, suspending agent,
viscosity-increasing agent
Carrageenan
Gel base, suspending agent, sustained
release
tablet matrix
Cross-linked high
amylose starch
Gelling agent, thickening agent
Ceratonia (locust bean gum) Matrix, binder
Chitosan Coating agent, disintegrant, film-
forming
agent, mucoadhesive, tablet binder,
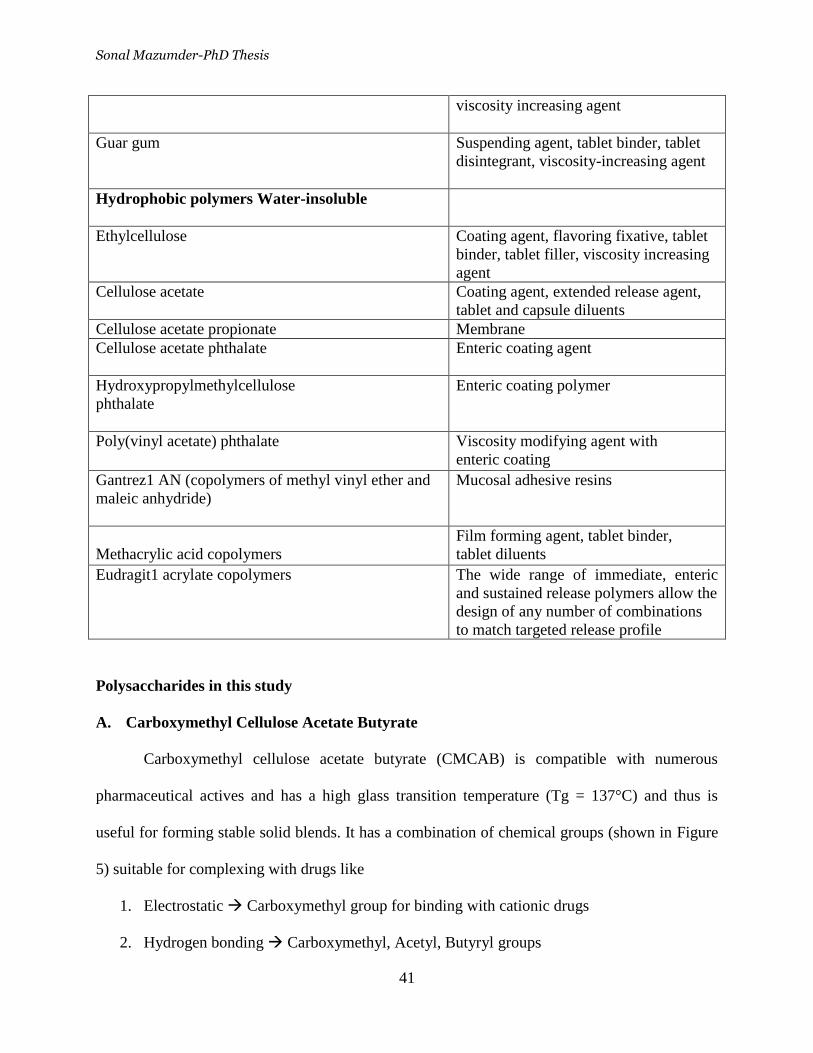
Sonal Mazumder-PhD Thesis
41
viscosity increasing agent
Guar gum Suspending agent, tablet binder, tablet
disintegrant, viscosity-increasing agent
Hydrophobic polymers Water-insoluble
Ethylcellulose
Coating agent, flavoring fixative, tablet
binder, tablet filler, viscosity increasing
agent
Cellulose acetate Coating agent, extended release agent,
tablet and capsule diluents
Cellulose acetate propionate Membrane
Cellulose acetate phthalate Enteric coating agent
Hydroxypropylmethylcellulose
phthalate
Enteric coating polymer
Poly(vinyl acetate) phthalate
Viscosity modifying agent with
enteric coating
Gantrez1 AN (copolymers of methyl vinyl ether and
maleic anhydride)
Mucosal adhesive resins
Methacrylic acid copolymers
Film forming agent, tablet binder,
tablet diluents
Eudragit1 acrylate copolymers
The wide range of immediate, enteric
and sustained release polymers allow the
design of any number of combinations
to match targeted release profile
Polysaccharides in this study
A. Carboxymethyl Cellulose Acetate Butyrate
Carboxymethyl cellulose acetate butyrate (CMCAB) is compatible with numerous
pharmaceutical actives and has a high glass transition temperature (Tg = 137°C) and thus is
useful for forming stable solid blends. It has a combination of chemical groups (shown in Figure
5) suitable for complexing with drugs like
1. Electrostatic Carboxymethyl group for binding with cationic drugs
2. Hydrogen bonding Carboxymethyl, Acetyl, Butyryl groups
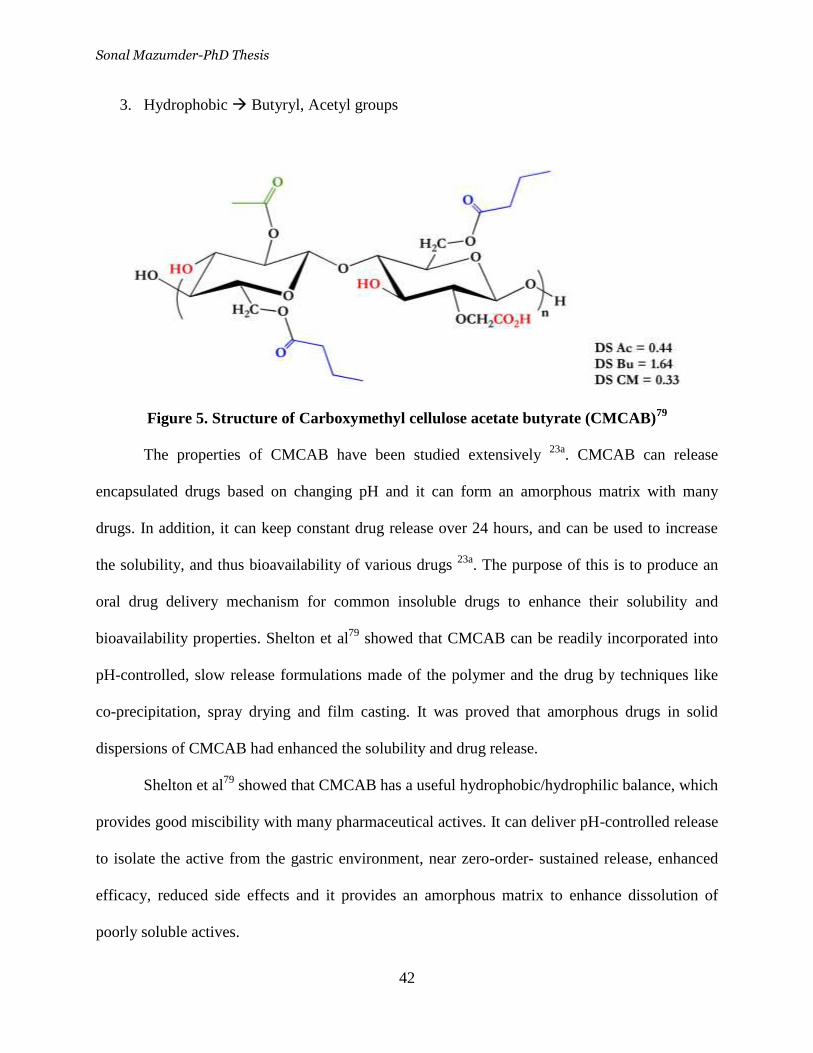
Sonal Mazumder-PhD Thesis
42
3. Hydrophobic Butyryl, Acetyl groups
Figure 5. Structure of Carboxymethyl cellulose acetate butyrate (CMCAB)79
The properties of CMCAB have been studied extensively 23a
. CMCAB can release
encapsulated drugs based on changing pH and it can form an amorphous matrix with many
drugs. In addition, it can keep constant drug release over 24 hours, and can be used to increase
the solubility, and thus bioavailability of various drugs 23a
. The purpose of this is to produce an
oral drug delivery mechanism for common insoluble drugs to enhance their solubility and
bioavailability properties. Shelton et al79
showed that CMCAB can be readily incorporated into
pH-controlled, slow release formulations made of the polymer and the drug by techniques like
co-precipitation, spray drying and film casting. It was proved that amorphous drugs in solid
dispersions of CMCAB had enhanced the solubility and drug release.
Shelton et al79
showed that CMCAB has a useful hydrophobic/hydrophilic balance, which
provides good miscibility with many pharmaceutical actives. It can deliver pH-controlled release
to isolate the active from the gastric environment, near zero-order- sustained release, enhanced
efficacy, reduced side effects and it provides an amorphous matrix to enhance dissolution of
poorly soluble actives.
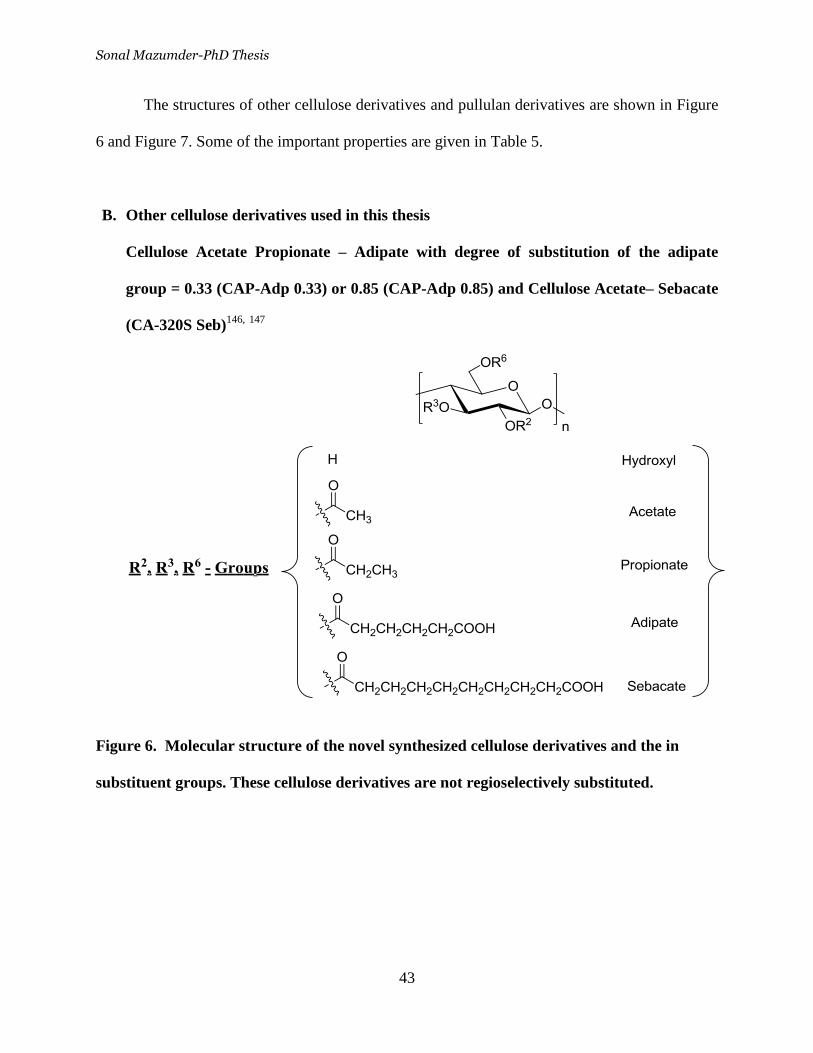
Sonal Mazumder-PhD Thesis
43
The structures of other cellulose derivatives and pullulan derivatives are shown in Figure
6 and Figure 7. Some of the important properties are given in Table 5.
B. Other cellulose derivatives used in this thesis
Cellulose Acetate Propionate – Adipate with degree of substitution of the adipate
group = 0.33 (CAP-Adp 0.33) or 0.85 (CAP-Adp 0.85) and Cellulose Acetate– Sebacate
(CA-320S Seb)146,
147
Figure 6. Molecular structure of the novel synthesized cellulose derivatives and the in
substituent groups. These cellulose derivatives are not regioselectively substituted.
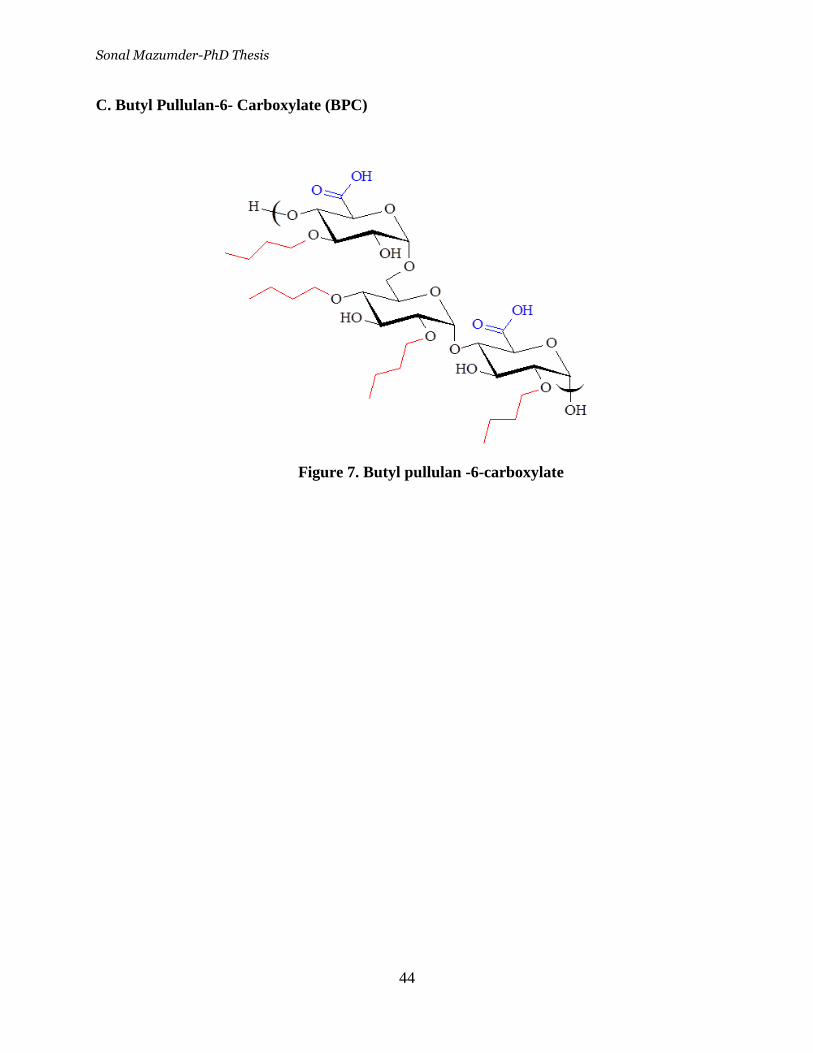
Sonal Mazumder-PhD Thesis
44
C. Butyl Pullulan-6- Carboxylate (BPC)
Figure 7. Butyl pullulan -6-carboxylate
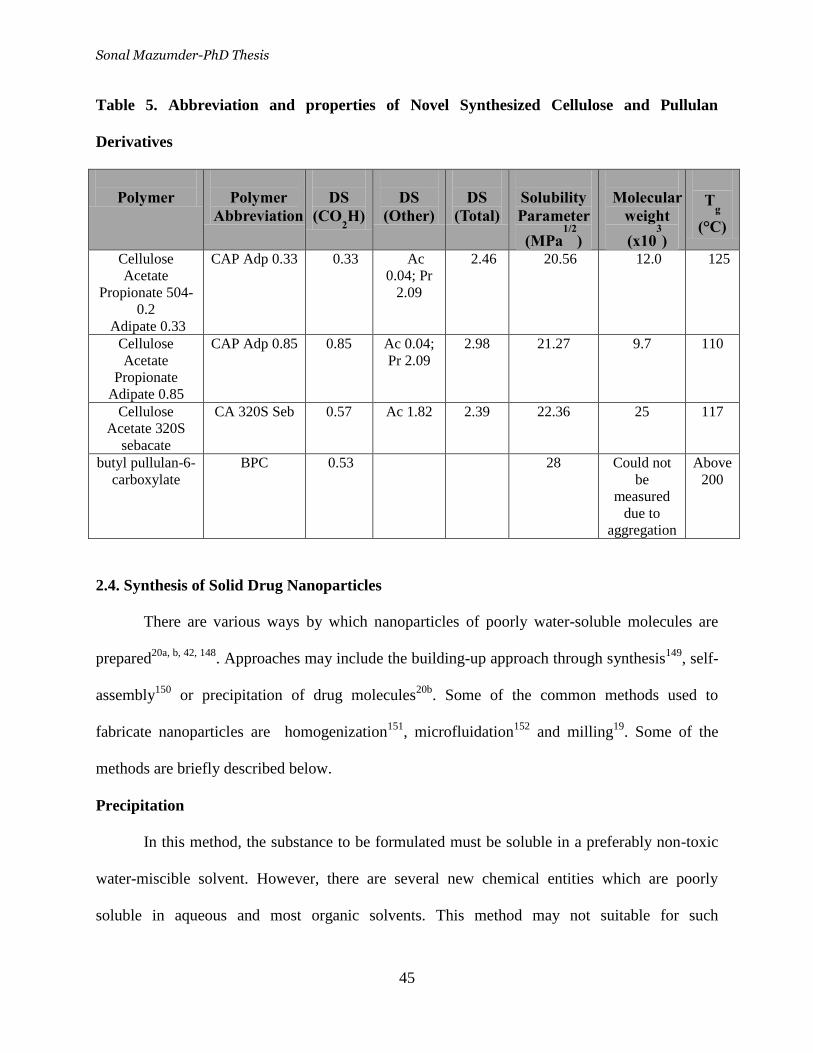
Sonal Mazumder-PhD Thesis
45
Table 5. Abbreviation and properties of Novel Synthesized Cellulose and Pullulan
Derivatives
Polymer
Polymer
Abbreviation
DS
(CO2H)
DS
(Other)
DS
(Total)
Solubility
Parameter
(MPa1/2
)
Molecular
weight
(x103
)
Tg
(°C)
Cellulose
Acetate
Propionate 504-
0.2
Adipate 0.33
CAP Adp 0.33 0.33 Ac
0.04; Pr
2.09
2.46 20.56 12.0 125
Cellulose
Acetate
Propionate
Adipate 0.85
CAP Adp 0.85 0.85 Ac 0.04;
Pr 2.09 2.98 21.27 9.7 110
Cellulose
Acetate 320S
sebacate
CA 320S Seb 0.57 Ac 1.82 2.39 22.36 25 117
butyl pullulan-6-
carboxylate
BPC 0.53 28 Could not
be
measured
due to
aggregation
Above
200
2.4. Synthesis of Solid Drug Nanoparticles
There are various ways by which nanoparticles of poorly water-soluble molecules are
prepared20a, b, 42, 148
. Approaches may include the building-up approach through synthesis149
, self-
assembly150
or precipitation of drug molecules20b
. Some of the common methods used to
fabricate nanoparticles are homogenization151
, microfluidation152
and milling19
. Some of the
methods are briefly described below.
Precipitation
In this method, the substance to be formulated must be soluble in a preferably non-toxic
water-miscible solvent. However, there are several new chemical entities which are poorly
soluble in aqueous and most organic solvents. This method may not suitable for such
Sonal Mazumder-PhD Thesis
46
compounds. After mixing the organic solution of the compound with an aqueous solution of
stabiliser, the ambient conditions are controlled to trigger precipitation of the desired crystalline
or amorphous drug particles in the nano- or micrometer size range (400–2,000 nm)18
. Then
selected polymers like gelatin, chitosan, poloxamer are added to stop the particle growth after a
certain stage. The drug nanoparticles are stabilized thereafter by spray-drying with excipients
(lactose, mannitol).
External forces
Drug particles can be broken at crystal imperfections by applying external forces153
. The
particle size threshold depends on the drug properties, as well as the energy input. In order to
further reduce particle size, the energy input must be exponentially increased after several
processing cycles.
Wet-Milling
In this process, a milling chamber is charged with milling media (pearls), dispersion
medium (mostly water), drug particles and stabilizer and is subjected to rotary movement as a
whole or its contents are stirred by an agitator. The revolving pearls generate a high shear force
and leads to interparticle collisions in the mill. Particles in the size range 80-400 nm are
generated. The disadvantage of this method is loss of product and higher chance of
contamination.
High Pressure Homogenization
In high pressure homogenization, a particulate suspension is driven through a constricted gap of
homogenizing valve. The velocity of the fluid in the passage increases immediately when the
suspension constantly flows through the narrow gap of ~20 mm. Gas bubbles are formed at room
temperature when the fluid’s static pressure is dropped below vaporization point. On passing the
Sonal Mazumder-PhD Thesis
47
gap, the fluid flow velocity decreases leading to loss of the gas bubbles, initiating high-energy
micro jet-streams leading to decrease in particle size. In this method, cavitation is very common
due to interparticle collisions and high shear forces20a, 151b, 153
. Also, it is important to reduce the
water in the suspension before they can be used as dosage forms. The drying methods
(lyophilization, spray drying and fluidized bed drying) are time and energy consuming153
.
Microfluidization
A Microfluidizer processor is used to decrease the size of drug crystals in suspension. A
pump forces the particle suspension through microchannels. Due to the narrow diameter of the
channels, the streaming velocity results in cavitation and high shear rates. This technique
involves high homogenization pressures and higher number of processing cycles to achieve the
desired particle size reduction151b, 153
.
Flash Nanoprecipitation using a Multi- Inlet Vortex Mixer
In this thesis, a Multi-Inlet Vortex Mixer (MIVM) is chosen for its ability to produce
nanoparticles of insoluble compounds using a process known as flash nano-precipitation. Most
work done with MIVMs involves producing nanoparticles, either of a single molecule or through
co-precipitation. 154
. This is due to the MIVM's ability to precipitate particles very rapidly by the
controlled nucleation and grown of particles. This allows for the production of nanoparticles in a
continuous manner and for the capability to control the size of the nanoparticles. 155
This is
achieved by controlling the Reynolds numbers of fluids allowing for rapid and completely
mixing. 154c, 155-156
There are two different important time scales to consider, the time of mixing
τmix and the time of aggregation τagg. The mixing time τmix concerns how fast materials entering
the mixer become well mixed and τagg concerns how long it takes for the polymers to aggregate
(Figure 8). When τmix > τagg, the particle size resulting from mixing will decrease as τmix
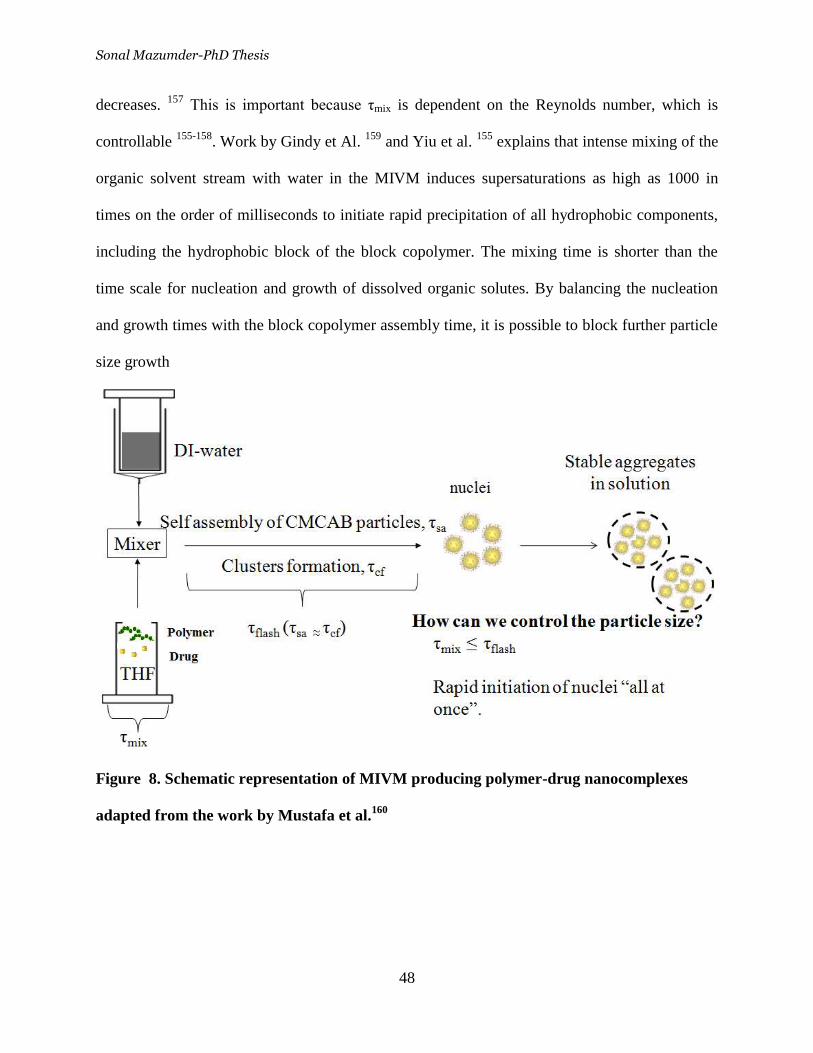
Sonal Mazumder-PhD Thesis
48
decreases. 157
This is important because τmix is dependent on the Reynolds number, which is
controllable 155-158
. Work by Gindy et Al. 159
and Yiu et al. 155
explains that intense mixing of the
organic solvent stream with water in the MIVM induces supersaturations as high as 1000 in
times on the order of milliseconds to initiate rapid precipitation of all hydrophobic components,
including the hydrophobic block of the block copolymer. The mixing time is shorter than the
time scale for nucleation and growth of dissolved organic solutes. By balancing the nucleation
and growth times with the block copolymer assembly time, it is possible to block further particle
size growth
Figure 8. Schematic representation of MIVM producing polymer-drug nanocomplexes
adapted from the work by Mustafa et al.160
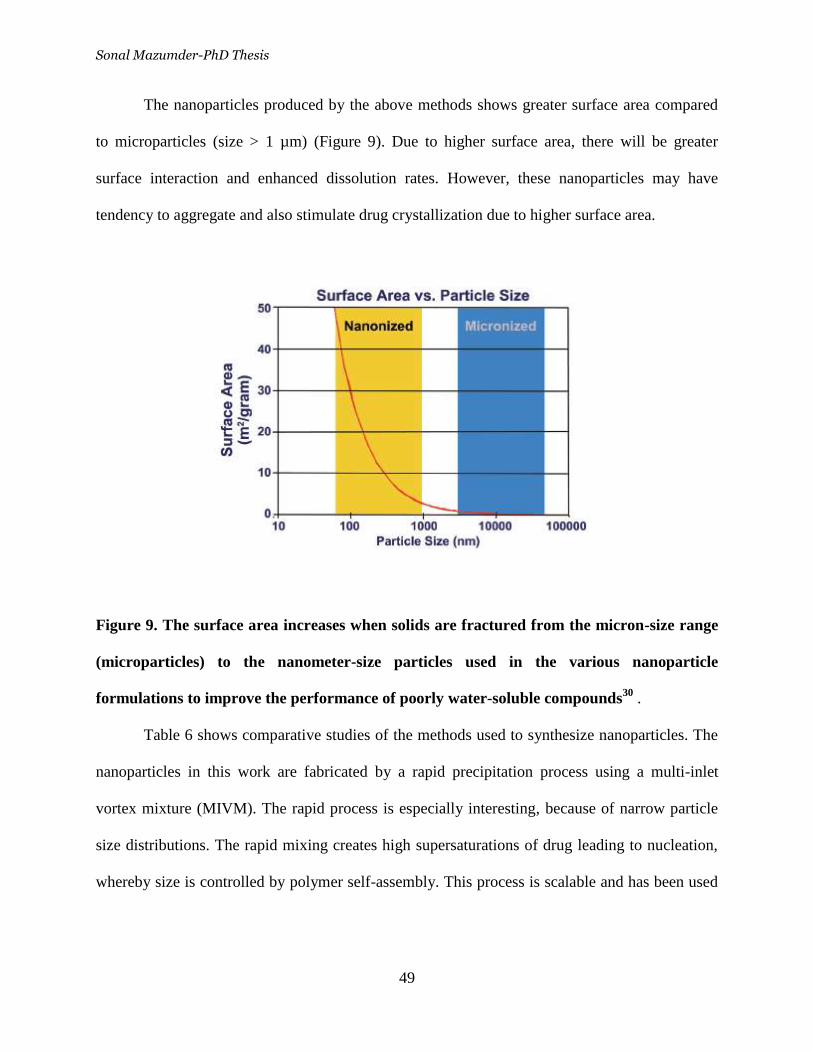
Sonal Mazumder-PhD Thesis
49
The nanoparticles produced by the above methods shows greater surface area compared
to microparticles (size > 1 µm) (Figure 9). Due to higher surface area, there will be greater
surface interaction and enhanced dissolution rates. However, these nanoparticles may have
tendency to aggregate and also stimulate drug crystallization due to higher surface area.
Figure 9. The surface area increases when solids are fractured from the micron-size range
(microparticles) to the nanometer-size particles used in the various nanoparticle
formulations to improve the performance of poorly water-soluble compounds30
.
Table 6 shows comparative studies of the methods used to synthesize nanoparticles. The
nanoparticles in this work are fabricated by a rapid precipitation process using a multi-inlet
vortex mixture (MIVM). The rapid process is especially interesting, because of narrow particle
size distributions. The rapid mixing creates high supersaturations of drug leading to nucleation,
whereby size is controlled by polymer self-assembly. This process is scalable and has been used
Sonal Mazumder-PhD Thesis
50
to produce stable nanoparticles that incorporate drugs, imaging agents, peptides, and targeting
ligands with controlled particle size distributions.
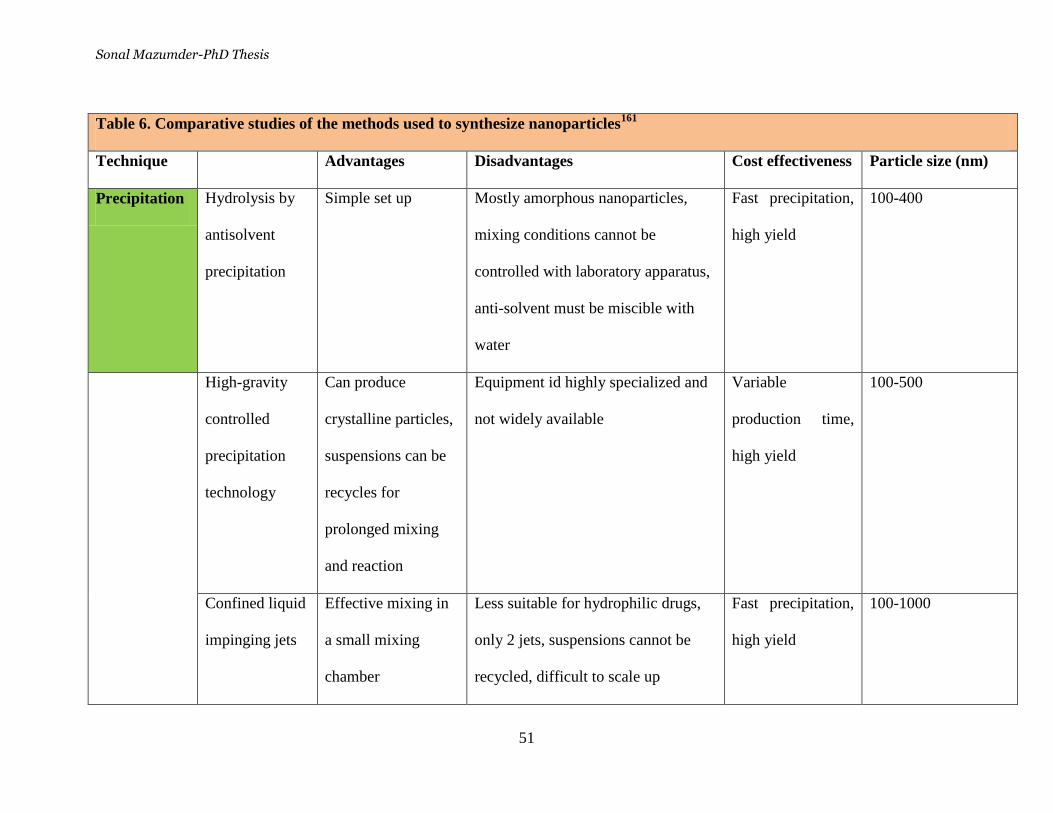
Sonal Mazumder-PhD Thesis
51
Table 6. Comparative studies of the methods used to synthesize nanoparticles161
Technique Advantages Disadvantages Cost effectiveness Particle size (nm)
Precipitation Hydrolysis by
antisolvent
precipitation
Simple set up Mostly amorphous nanoparticles,
mixing conditions cannot be
controlled with laboratory apparatus,
anti-solvent must be miscible with
water
Fast precipitation,
high yield
100-400
High-gravity
controlled
precipitation
technology
Can produce
crystalline particles,
suspensions can be
recycles for
prolonged mixing
and reaction
Equipment id highly specialized and
not widely available
Variable
production time,
high yield
100-500
Confined liquid
impinging jets
Effective mixing in
a small mixing
chamber
Less suitable for hydrophilic drugs,
only 2 jets, suspensions cannot be
recycled, difficult to scale up
Fast precipitation,
high yield
100-1000
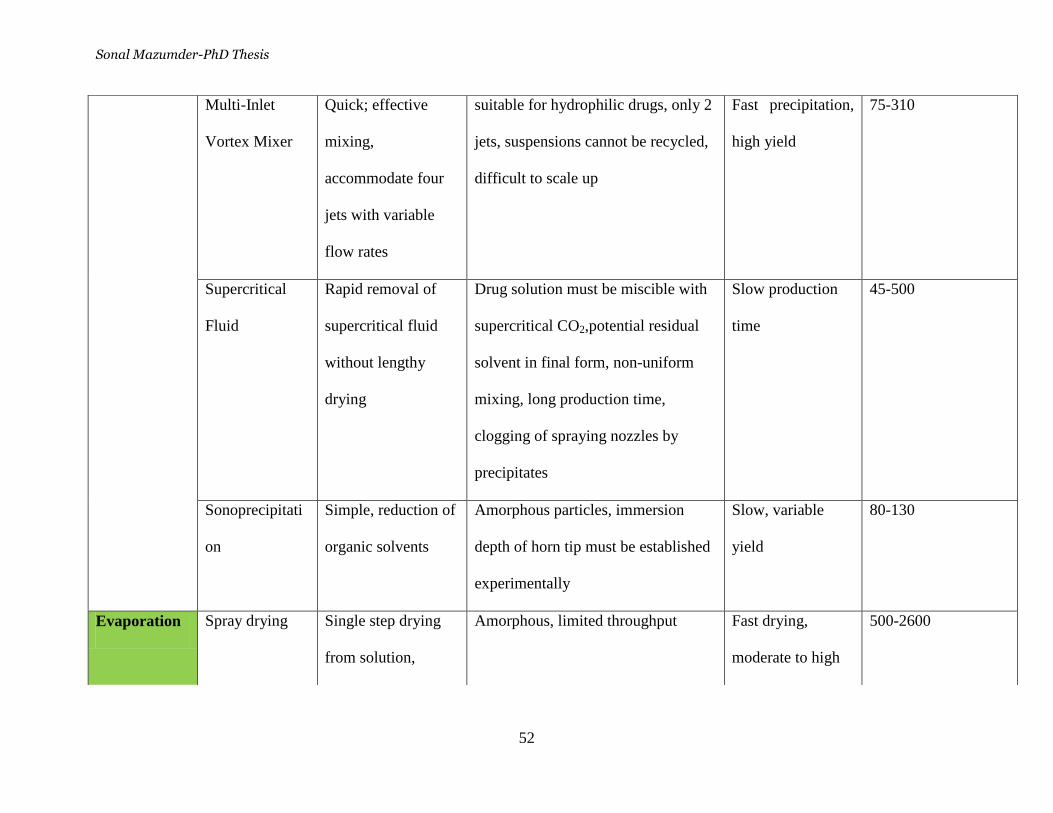
Sonal Mazumder-PhD Thesis
52
Multi-Inlet
Vortex Mixer
Quick; effective
mixing,
accommodate four
jets with variable
flow rates
suitable for hydrophilic drugs, only 2
jets, suspensions cannot be recycled,
difficult to scale up
Fast precipitation,
high yield
75-310
Supercritical
Fluid
Rapid removal of
supercritical fluid
without lengthy
drying
Drug solution must be miscible with
supercritical CO2,potential residual
solvent in final form, non-uniform
mixing, long production time,
clogging of spraying nozzles by
precipitates
Slow production
time
45-500
Sonoprecipitati
on
Simple, reduction of
organic solvents
Amorphous particles, immersion
depth of horn tip must be established
experimentally
Slow, variable
yield
80-130
Evaporation Spray drying Single step drying
from solution,
Amorphous, limited throughput Fast drying,
moderate to high
500-2600
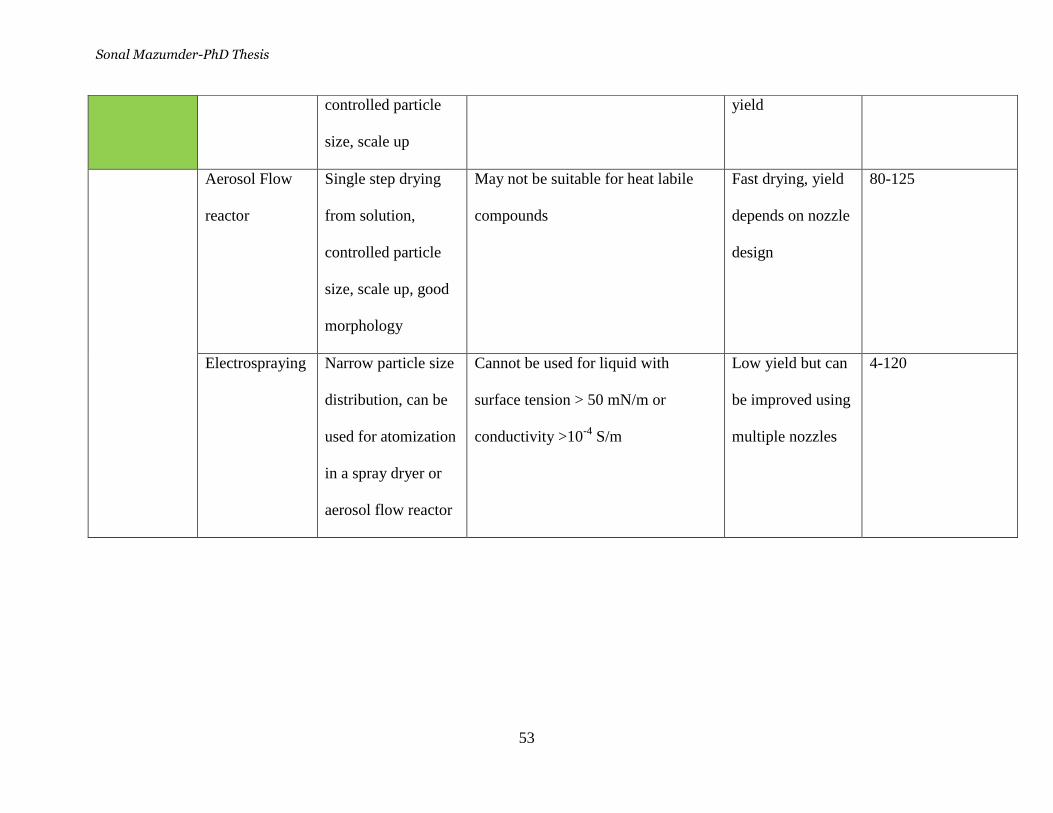
Sonal Mazumder-PhD Thesis
53
controlled particle
size, scale up
yield
Aerosol Flow
reactor
Single step drying
from solution,
controlled particle
size, scale up, good
morphology
May not be suitable for heat labile
compounds
Fast drying, yield
depends on nozzle
design
80-125
Electrospraying Narrow particle size
distribution, can be
used for atomization
in a spray dryer or
aerosol flow reactor
Cannot be used for liquid with
surface tension > 50 mN/m or
conductivity >10-4
S/m
Low yield but can
be improved using
multiple nozzles
4-120
Sonal Mazumder-PhD Thesis
54
2.5. Drug Delivery for Tuberculosis
2.5.1 Tuberculosis
Every year, almost 2 million deaths and eight million new cases caused by Tuberculosis
(TB) are reported. Despite available remedies, TB is a prominent disease in many
underdeveloped countries. The major problem in the treatment of TB involves continuous,
frequent multiple drug dosing. It is therefore important to formulate drugs which can be
introduced for long-duration release of the antimicrobial agents in a slow and sustained manner,
therefore reducing frequency and number of doses 162
.
2.5.2 TB drugs in this study
The model drugs used in this study were rifampicin, isoniazid and pyrazinamide. The
drug loading efficiency of isoniazid and pyrazinamide was very low (8-16 %) and therefore, only
rifampicin is discussed here in more detail.
Rifampicin (RIF) is a front line anti-tuberculosis drug usually prescribed in combination
with isoniazid, pyrazinamide and streptomycin for a period of six to seven months. Rifampicin
exhibits low bioavailability when delivered orally. It is a member of the rifamycin class of
antibiotics used for the treatment of tuberculosis, often a component of the prescribed multi-drug
fixed dose combination tablet 163
.
Rifampicin is a complex semi-synthetic macrocyclic antibiotic derived from
Streptomyces mediterranei. It was developed in the Dow-Lepetit Laboratories in Milan, Italy as a
part of a screening program for new antimicrobial agents 164
. Five compounds named rifamycin
A-E were isolated from fermentation cultures of S. mediterranei 165
. Rifamycin B was shown to
be the most stable, least toxic and most active164
. In 1965, rifampicin, a hydrazone of rifamycin
B, was found to have increased absorption while retaining its parent antimicrobial properties.
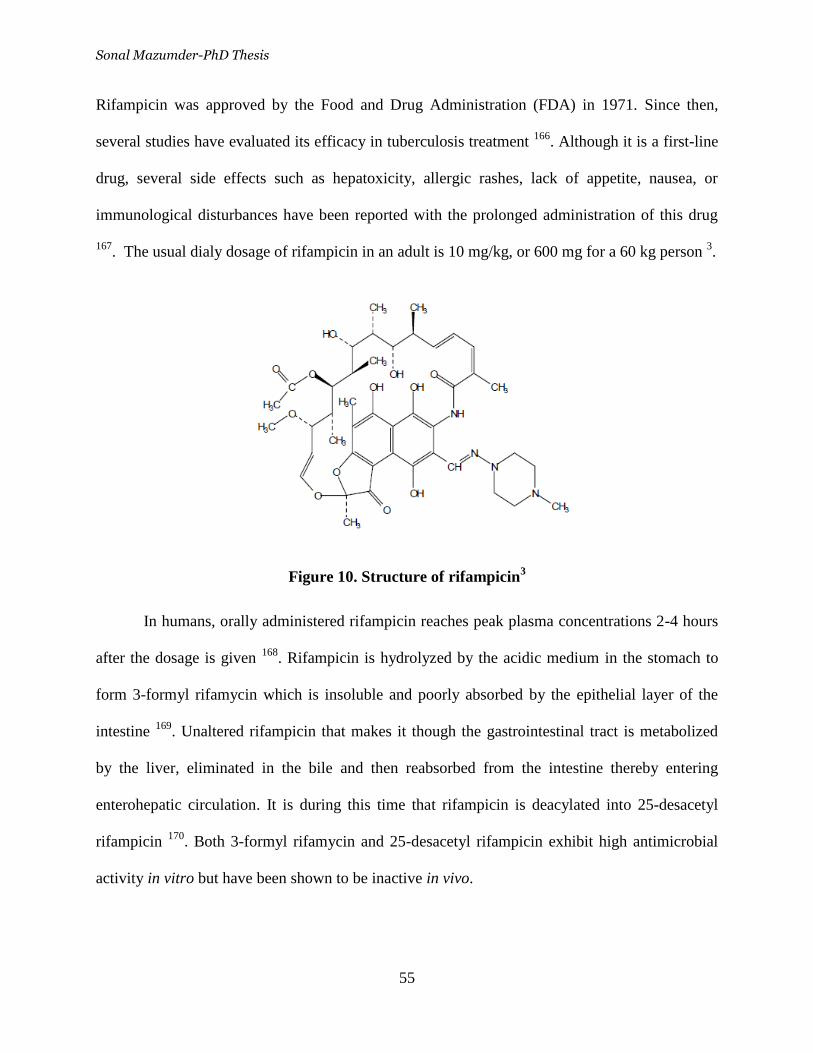
Sonal Mazumder-PhD Thesis
55
Rifampicin was approved by the Food and Drug Administration (FDA) in 1971. Since then,
several studies have evaluated its efficacy in tuberculosis treatment 166
. Although it is a first-line
drug, several side effects such as hepatoxicity, allergic rashes, lack of appetite, nausea, or
immunological disturbances have been reported with the prolonged administration of this drug
167. The usual dialy dosage of rifampicin in an adult is 10 mg/kg, or 600 mg for a 60 kg person
3.
Figure 10. Structure of rifampicin3
In humans, orally administered rifampicin reaches peak plasma concentrations 2-4 hours
after the dosage is given 168
. Rifampicin is hydrolyzed by the acidic medium in the stomach to
form 3-formyl rifamycin which is insoluble and poorly absorbed by the epithelial layer of the
intestine 169
. Unaltered rifampicin that makes it though the gastrointestinal tract is metabolized
by the liver, eliminated in the bile and then reabsorbed from the intestine thereby entering
enterohepatic circulation. It is during this time that rifampicin is deacylated into 25-desacetyl
rifampicin 170
. Both 3-formyl rifamycin and 25-desacetyl rifampicin exhibit high antimicrobial
activity in vitro but have been shown to be inactive in vivo.
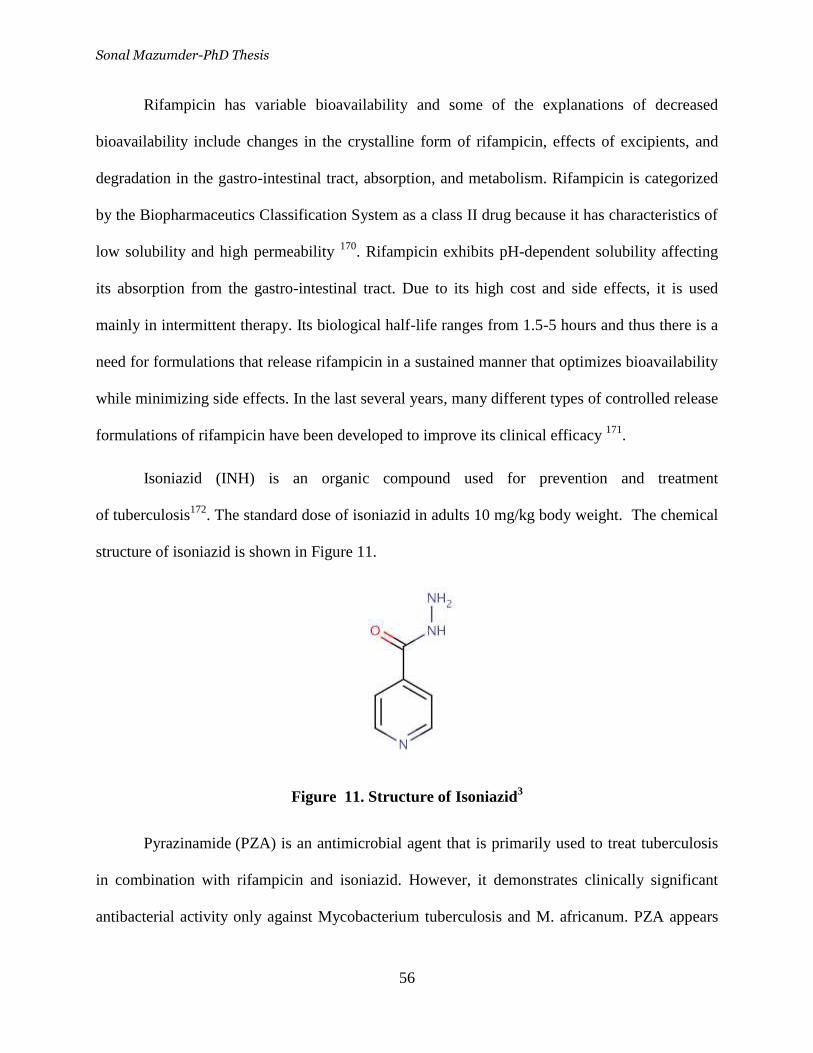
Sonal Mazumder-PhD Thesis
56
Rifampicin has variable bioavailability and some of the explanations of decreased
bioavailability include changes in the crystalline form of rifampicin, effects of excipients, and
degradation in the gastro-intestinal tract, absorption, and metabolism. Rifampicin is categorized
by the Biopharmaceutics Classification System as a class II drug because it has characteristics of
low solubility and high permeability 170
. Rifampicin exhibits pH-dependent solubility affecting
its absorption from the gastro-intestinal tract. Due to its high cost and side effects, it is used
mainly in intermittent therapy. Its biological half-life ranges from 1.5-5 hours and thus there is a
need for formulations that release rifampicin in a sustained manner that optimizes bioavailability
while minimizing side effects. In the last several years, many different types of controlled release
formulations of rifampicin have been developed to improve its clinical efficacy 171
.
Isoniazid (INH) is an organic compound used for prevention and treatment
of tuberculosis172
. The standard dose of isoniazid in adults 10 mg/kg body weight. The chemical
structure of isoniazid is shown in Figure 11.
Figure 11. Structure of Isoniazid3
Pyrazinamide (PZA) is an antimicrobial agent that is primarily used to treat tuberculosis
in combination with rifampicin and isoniazid. However, it demonstrates clinically significant
antibacterial activity only against Mycobacterium tuberculosis and M. africanum. PZA appears
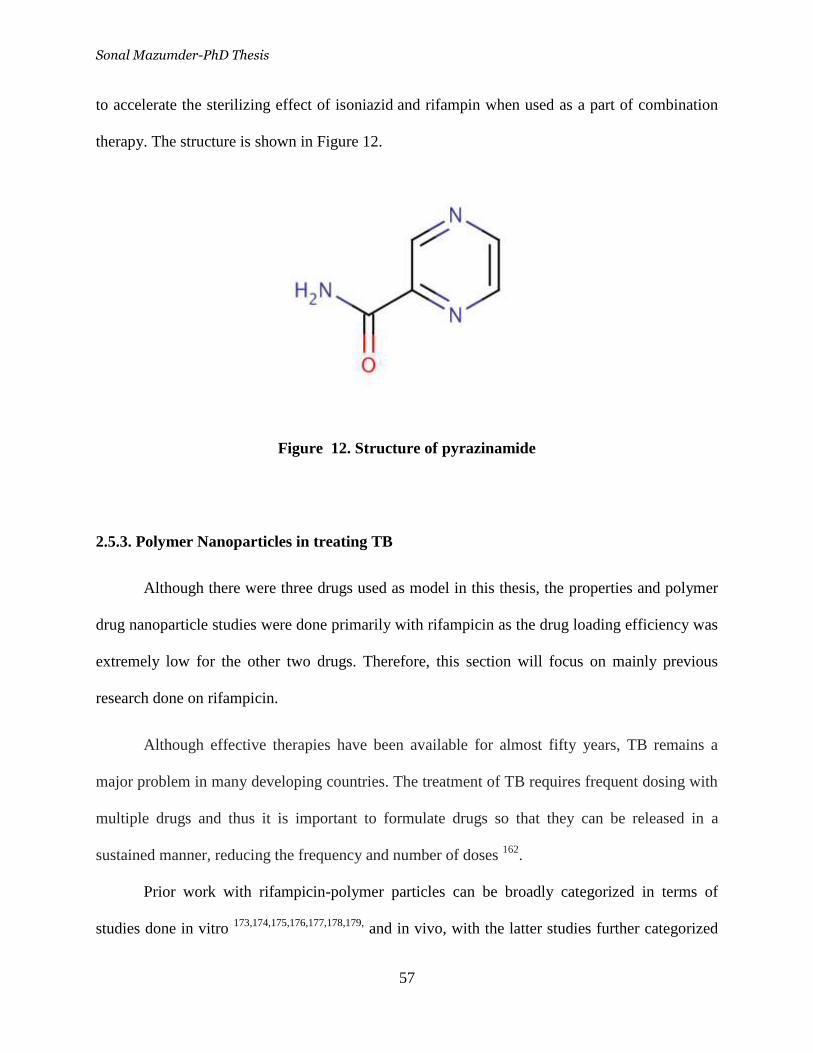
Sonal Mazumder-PhD Thesis
57
to accelerate the sterilizing effect of isoniazid and rifampin when used as a part of combination
therapy. The structure is shown in Figure 12.
Figure 12. Structure of pyrazinamide
2.5.3. Polymer Nanoparticles in treating TB
Although there were three drugs used as model in this thesis, the properties and polymer
drug nanoparticle studies were done primarily with rifampicin as the drug loading efficiency was
extremely low for the other two drugs. Therefore, this section will focus on mainly previous
research done on rifampicin.
Although effective therapies have been available for almost fifty years, TB remains a
major problem in many developing countries. The treatment of TB requires frequent dosing with
multiple drugs and thus it is important to formulate drugs so that they can be released in a
sustained manner, reducing the frequency and number of doses 162
.
Prior work with rifampicin-polymer particles can be broadly categorized in terms of
studies done in vitro 173,174,175,176,177,178,179,
and in vivo, with the latter studies further categorized
Sonal Mazumder-PhD Thesis
58
in terms of delivery method, i.e. by injection 180
, pulmonary delivery 41
,181
and oral delivery
182,183
,184
. Most studies involved polymer carriers that were either polyesters or polysaccharides.
Many of the studies focused on controlling drug loading and characterizing drug release but, in
many cases, the method of producing the particles was not rapid and scalable.
In-vitro studies
PLGA (Poly (lactic-co-glycolic) acid) nanoparticles and microparticles have been used
for encapsulation of TB drugs 185
. Rifampicin-loaded microspheres of PLGA were made by the
solvent evaporation method with particle sizes ranging from 1-10 µm. The drug loading was
between 50-67 % independent of microsphere size and it was observed that 80% of the drug was
released (measured in-vitro in PBS buffer of pH 7.4 at 37° C) in 24 hours 179
. Poly(3-
hydroxybutyrate-co-3-hydroxyvalerate) was used to load rifampicin using an oil-in-water
emulsification method. The particles were very large (around 20-60 µm) with only 14 % drug
loading and 90% release.
In another study, rifampicin was coated onto starch beads approximately 1 mm in size
along with polysaccharides and the subsequent release rates were found to vary inversely with
the coating thickness. 171b
. A number of release studies which were done in-vitro polysaccharides
like alginate, chitosan and hydroxypropylmethyl cellulose prepared by cation induced gelation,
spray drying, and granulation respectively showed prolonged release over 1-3 days with particle
sizes of several microns.
Poly(lactic-co-glycolic acid) PLGA was used to prepare rifampcin-polymer nanoparticles
(200-260nm). Rifampicin release was studied at pH 5.2 and pH 7.4. An initial burst was
observed in the first few hours and then gradually decreased and remained constant after a day
Sonal Mazumder-PhD Thesis
59
179. However, no results were shown regarding protection of the drug from degradation in the
stomach acid.
Vitamin E and poly(ε-caprolactone) were used to synthesize 100-200 nm rifampicin-
loaded particles by flash nanoprecipitation. However, no drug release studies were done 186
. The
rifampicin was conjugated covalently to an “anchoring” species, such as Vitamin E or a
biodegradable and biocompatible hydrophobic polymer. This enabled incorporation of active
compounds into nanoparticles. The hydrolytic cleavage of the linking group provides sustained
release of the active agent 187
. There has been no other work published to our knowledge on
preparation of polymer-loaded rifampicin nanoparticles using MIVM.
Pulmonary delivery studies
Anti-TB drugs encapsulated in nanoparticles were studied by pulmonary administration
181. In guinea pigs, a single aerosol dose of rifampicin-encapsulated nanoparticles resulted in
therapeutically useful levels in the circulation for 6-8 days. Pulmonary administration of five
doses at 10 day intervals resulted in complete clearance of TB in the lung. Forty six oral doses of
the free drug administered daily were required to obtain the same effect. Flexibility of the
nanoparticle-based formulations was further demonstrated by effective subcutaneous treatment
of mice infected with M. tuberculosis 180
. One subcutaneous dose of poly-(DL lactide-co-
glycolide) PLGA nanoparticles containing rifampicin, isoniazid and pyrazinamide resulted in
drug levels at therapeutically useful values for 32 and 36 days in the lungs and spleen, resulting
in complete clearance of bacteria whereas treatment with the pure drug required 35 daily oral
doses.
Sonal Mazumder-PhD Thesis
60
Cell studies
Anisimova et al. prepared rifampicin, isoniazid and streptomycin loaded PBCA (poly(N-
butylcyanoacrylate)) and PIBCA (poly(isobutylcyanoacrylate)) nanoparticles and studied in-vitro
cellular uptake in human blood monocytes in an effort to develop a drug depot system. The
typical particle size was 250 nm. Accumulation of these drugs in human monocytes was studied,
as well as their antimicrobial activity against Mycobacterium tuberculosis residing in human
monocyte-derived macrophages. The nanoparticle formulation led to higher intracellular levels
of the drugs and higher antimicrobial activity of isoniazid and streptomycin compared to their
free drug analogs but not so for rifampin 175
.
Oral delivery studies
Pandey et al. 182
developed sustained release rifampicin, as well as isoniazid and
pyrazinamide loaded PLGA nanoparticles for oral delivery. The particles were made by the
solvent emulsion technique in which the polymer and rifampicin were dissolved in a mixture of
DCM/acetone, and then this solution was slowly poured into an aqueous solution of PVA that
was stirred using a high-speed homogenizer. Stirring was continued for 3 hours to allow the
evaporation of the internal phase. The NPs were then isolated by centrifuging followed by
washing three times with deionized water. The suspension produced was freeze-dried for 48
hours to obtain a fine powder of NPs. This is not a rapid scalable method. The drug loading
efficiency of the microparticles was 8-18% and the mean particle size was ~ 2 µm. In animal
experiments, microparticles containing rifampicin showed higher therapeutic concentrations in
plasma compared to free drug. However, these microparticles suffered from several drawbacks
such as a low drug encapsulation, high polymer consumption, and a partial therapeutic
benefit. Nanoparticles of size range 186-290 nm (PDI =0.38 ± 0.04) and drug loading efficiency
Sonal Mazumder-PhD Thesis
61
57-68% showed similar results when tested in guinea pigs with equivalent amount of drug
(rifampicin 12 mg/kg + isoniazid 10 mg/kg + pyrazinamide 25 mg/kg body weight) 183
. Also
sustained drug release could be achieved in the plasma (5–12 days) with the nanoparticles
compared to the microparticles (3–4 days) of equivalent doses. At a 2/3rd
therapeutic dosage of
nanoparticles, the drug remained in the plasma (at therapeutically useful level, above MIC) for 7,
12 and 11 days for rifampicin, isoniazid and pyrazinamide respectively.
Zahroor et al. prepared alginate nanoparticles (235 nm diameter) of anti-TB drugs
(rifampicin, isoniazid, pyrazinamide and ethambutol) using controlled cation-induced gelation of
alginate. The drug loading efficiency for rifampicin was 80-90%. When the nanoparticles were
administered orally to mice, ethambutol, rifampicin, isoniazid, and pyrazinamide levels were
detected in plasma at therapeutic levels above the MIC (minimum inhibitory concentration) up to
7, 9, 11 and 11 days respectively (free drugs were cleared within 12 to 24 h from the blood but
were detectable in tissues (e.g. spleen, liver and lung) for more than one day). The drug levels
were detectable in tissues above the MIC (minimum inhibitory concentration) up to 15 days 184
.
This work is notable in that may be the first detailed study showing that orally-administered
nanoparticles can cross the GI-epithelium and enter the circulation in therapeutically useful
levels.
Formulations that would reduce dosing frequency and side effects of rifampicin and that
would enhance its bioavailability could be extremely valuable in treatment of this disease.
Enhancing bioavailability would reduce dosage, cost, and possibly variability and side effects.
There have been not many studies done where a polymer carrier was used to inhibit stomach
degradation of the drug to increase its bioavailability.
Sonal Mazumder-PhD Thesis
62
2.6. Drug Delivery for Human Immunodeficiency Virus (HIV)
2.6.1. Human Immunodeficiency Virus – the disease
The Human Immunodeficiency Virus (HIV) affects the immune system, causing acquired
immunodeficiency syndrome (AIDS) which results in life-threatening infections and diseases.
Currently, more than 33 million people are HIV-positive188
. Research has been conducted for 25
years regarding the development of prevention methods and treatment strategies. HIV mainly
infects cells of the immune system and central nervous systems (CNS). In order to treat HIV,
antiretroviral drugs have been developed to interrupt various stages of the HIV life cycle such as:
a) Reverse transcriptase inhibitors which act by blocking the activity of the reverse
transcriptase enzyme, thus preventing the construction of viral DNA.
b) Nucleoside analog reverse transcriptase inhibitors, including zidovudine, lamivudine, and
others which incorporate into the viral DNA
c) Nonnucleoside analog reverse transcriptase inhibitors, including etravirine, efavirenz, and
others
d) Protease inhibitors including ritonavir, atazanavir, and others which inhibit the protease
enzyme necessary for cleaving the viral proteins prior to final assembly into new viral
particles.
e) Fusion inhibitors that block the fusion of the virus with the cell membrane which is
necessary for entry into the cell.
f) Integrase inhibitors (i.e. raltegravir) which block the integration of viral DNA with
cellular DNA.
g) Entry inhibitors that bind to CCR5, a receptor on the viral membrane surface used in
entry into a cell.
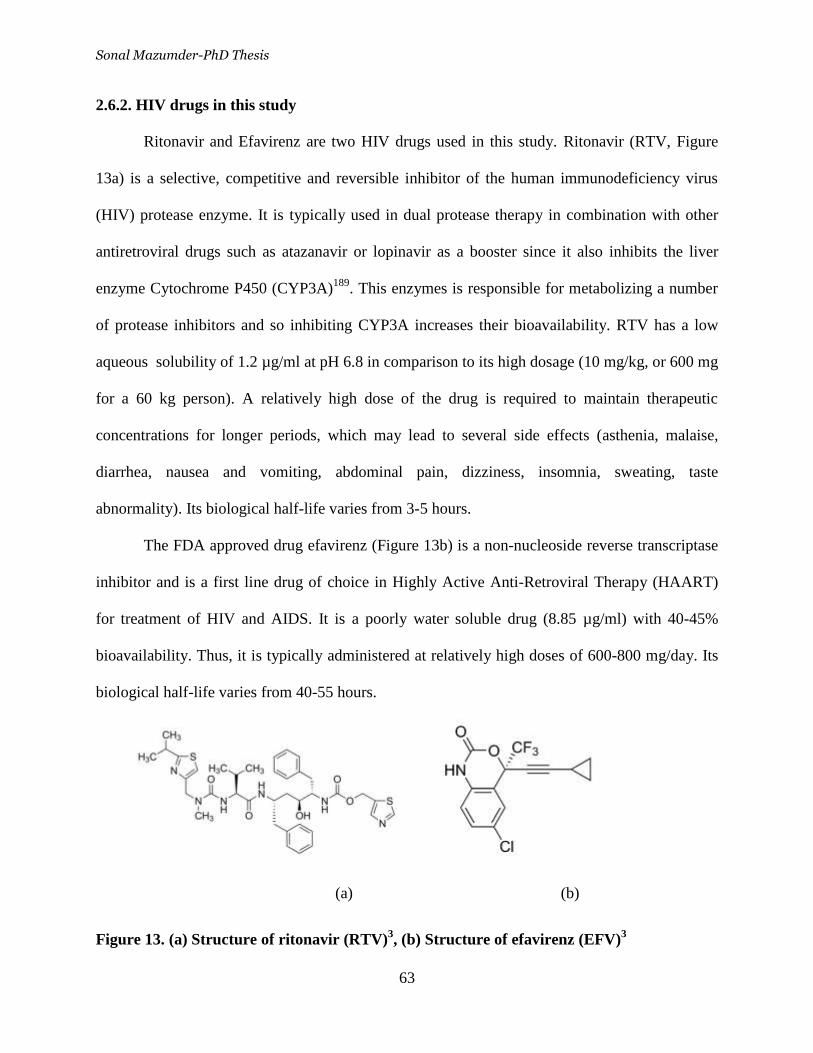
Sonal Mazumder-PhD Thesis
63
2.6.2. HIV drugs in this study
Ritonavir and Efavirenz are two HIV drugs used in this study. Ritonavir (RTV, Figure
13a) is a selective, competitive and reversible inhibitor of the human immunodeficiency virus
(HIV) protease enzyme. It is typically used in dual protease therapy in combination with other
antiretroviral drugs such as atazanavir or lopinavir as a booster since it also inhibits the liver
enzyme Cytochrome P450 (CYP3A)189
. This enzymes is responsible for metabolizing a number
of protease inhibitors and so inhibiting CYP3A increases their bioavailability. RTV has a low
aqueous solubility of 1.2 µg/ml at pH 6.8 in comparison to its high dosage (10 mg/kg, or 600 mg
for a 60 kg person). A relatively high dose of the drug is required to maintain therapeutic
concentrations for longer periods, which may lead to several side effects (asthenia, malaise,
diarrhea, nausea and vomiting, abdominal pain, dizziness, insomnia, sweating, taste
abnormality). Its biological half-life varies from 3-5 hours.
The FDA approved drug efavirenz (Figure 13b) is a non-nucleoside reverse transcriptase
inhibitor and is a first line drug of choice in Highly Active Anti-Retroviral Therapy (HAART)
for treatment of HIV and AIDS. It is a poorly water soluble drug (8.85 µg/ml) with 40-45%
bioavailability. Thus, it is typically administered at relatively high doses of 600-800 mg/day. Its
biological half-life varies from 40-55 hours.
(a) (b)
Figure 13. (a) Structure of ritonavir (RTV)3, (b) Structure of efavirenz (EFV)
3
Sonal Mazumder-PhD Thesis
64
2.6.3. Polymer Nanoparticles in treatment of HIV
Using three or more drugs in combination is known as highly effective antiretroviral
therapy (HAART) and is particularly effective in treating drug-resistant HIV strains 190
. HAART
has been able to increase the life expectancy of infected individuals from less than one year to 10
years191,192
. The therapy is limited by the development of multiple resistant strains, by viral
reservoir sites that cannot be reached by drugs using current delivery methods, and toxicity as a
result of the high and frequent dosing involved which can lead to reduced patient compliance.
The high cost associated with HAART is also an important issue, especially in developing
nations where HIV prevalence is high192
. Higher bioavailability would lead to reduced dose
which in turn would reduce cost and side effects and result in better compliance.
Drug delivery systems that can raise intracellular drug levels may help in preventing the
virus from infecting the cells. Systems that can maintain therapeutic concentrations of the drug in
the systemic circulation are useful for reducing the viral load. If systems could be developed that
can cross the physiological barriers and deliver their payload to the viral sanctuary sites, such as
the CNS, lymphatic system, and macrophages, the virus might ultimately be eradicated in
infected individuals.
Examples of nanoparticle delivery systems include liposomes, solid lipid nanoparticles,
polymeric nanoparticles, and dendrimers. Nanocarriers offer several advantages, such as the
protection of drugs against degradation193
, targeting of drugs to specific sites of action 194
, and
delivery of biological molecules such as proteins195
, peptides 196
, and oligonucleotides197
.
Several in vitro and in vivo studies are discussed in this section of the review. However, the work
in this thesis concerns only in vitro studies as most of the polymers are not biodegradable in
Sonal Mazumder-PhD Thesis
65
plasma. Future studies will emphasize use of biodegradable polymeric nanoparticles and their in-
vivo behavior.
The size and morphology of the polymer matrix plays an extremely important role in the
drug release and pharmacokinetics. Polymer drug delivery systems must possess the appropriate
morphology to produce the required drug release profile 198
. Recently, polymeric nanoparticles
(NPs) have been extensively and intensively studied and are considered among the most
promising drug delivery systems 199
. Nanoparticles have the ability to improve the half-life of the
drug by controlling the release and protecting the loaded drug against degradation 200
. All of
these benefits can contribute to the reduction of dose and dosing frequency, thereby reducing the
side effects and improving the patient compliance 201
. The next section discusses some of the
major studies done with microparticles and nanoparticles to enhance dissolution characteristics
of poorly soluble antiviral drugs.
In-vitro studies
Microspheres of polymethacrylate containing ritonavir were prepared using a solvent
evaporation method. The particles size of the spheres was 35-45 µm, whereas the drug-loading
efficiency was almost 100 %. Drug release was up to 93.4% and release was extended up to 10
hours. The rate of drug release followed zero order kinetics 202
.
Microparticles of antiviral drug, acyclovir were prepared for achieving sustained release
using cellulose acetate propionate (CAP) and cellulose acetate butyrate (CAB). The particles
were made by two different techniques, solvent evaporation-matrix erosion and spray drying.
The particle size was between 5-20 µm and the encapsulation efficiency ranged between 50-90
%. The authors recommended spray drying for formulating acyclovir with CAB to obtain a
controlled release dosage form with enhanced bioavailability and reduced dose frequency for
Sonal Mazumder-PhD Thesis
66
improved patient compliance 203
. Ethyl cellulose and Eudragit®RS100 (anionic copolymer based
on methacrylic acid and methyl methacrylate) polymeric microspheres containing stavudine were
prepared by oil‐in‐oil emulsion evaporation technique. The size of the particles ranged between
200-420 µm and the drug loading efficiency was between 85-90%. The in vitro release rate
increased compared to that of the pure drug.
Several nanoparticle formulation systems like micelles, microspheres, liposomes, solid-
lipid nanoparticles, dendrimers, cyclodextrins and emulsions are described by Lembo et al.204
.
Efavienz nanoparticles were formulated using methacrylate polymers with the trademark name
Eudragit E100 by the solvent evaporation method. The particle sizes ranged from 99-200 nm and
the drug loading efficiency ranged from 75-90 %. The in vitro release studies showed that 95-
100 % of drug was released compared to 23-58% release of pure drug205
.
In another study, multiple emulsion-solvent evaporation procedure was used to produce
nanoparticles of poly-(lactic-co-glycolic acid) (PLGA) containing ritonavir (RTV), lopinavir
(LPV), and efavirenz (EFV)206
. The average nanoparticle size was 262±84 nm and drug loading
averaged 4% (w/v). The in vitro release of the drugs from nanoparticles using peripheral
mononuclear cells (PBMC) was found to be at therapeutically interesting levels over 28 days
while the free drug controls were eliminated by 2 days.
The solubility of ritonavir from Gelucire3 (composed of mixture of glycerides and esters
of polyethylene glycol) nanoparticles of 600-800 nm was studied at the ratio of ritonavir:
gelucire 1:4 207
. The in-vitro dissolution studies showed higher release of ritonavir compared to
pure drug.
Ritonavir-loaded alginate nanoparticles were prepared by an in situ nano emulsion –
polymer cross linking approach 208
. The ritonavir ratio was varied in the nanoparticle at alginate:
Sonal Mazumder-PhD Thesis
67
ritonavir ratios of 1:1, 1:2 and 1:3. Drug loading efficiencies as high as 92% were reported and
the particle size was 77 ± 0.47 nm. Sustained drug release was observed for a period of 16 hours
which was better than what was observed with the free drug.
Cellulose acetate butyrate (CAB) and poly(vinyl pyrrolidone) (PVP) polymers were used
to make nanoparticles to enhance dissolution profile of an antiviral drug. The particle size was
322 - 434 nm and the drug loading efficiency was 50% - 70%. All the nanoparticles improved
the physicochemical properties of the drug 209
.
The control of drug release kinetics from the nanocarrier can be difficult. The drug
diffuses out of smaller nanocarriers faster, resulting in burst effects, making it difficult to obtain
sustained or controlled drug delivery over prolonged periods of time186, 210
. The drug release
kinetics can be improved by increasing the size of the nanocarriers, which results in higher drug
loading and prolonged drug release with a lower burst effect211,211b
. However, larger particle size
may hinder their transport across membranes. A significant challenge for nanocarrier drug
delivery is the optimization of particle size with desired release characteristics.
The studies above did not conclusively show decrease of crystallinity of RTV, EFV or
other HIV drugs for enhancement of solubility. Amorphous solid dispersions (discussed in
section 2.3) have demonstrated potential for enhancing solubility and bioavailability of poorly
soluble HIV drugs. However, there is a lack of understanding about the structure-property
relationship of polymer-drug nanoparticles and crystallization effect on drug solubility. There is
also limited literature available on rapid synthesis of nanoparticles with desired properties. This
thesis addresses the issues of rapid synthesis of amorphous solid dispersions in the form of
nanoparticles and the development of structure-property relationships that affect drug
crystallization and its effect on drug solubility.
Sonal Mazumder-PhD Thesis
68
2.7 References
1. Lavelle, E. C.; Sharif, S.; Thomas, N. W.; Holland, J.; Davis, S. S., The importance of
gastrointestinal uptake of particles in the design of oral delivery systems. Advanced Drug
Delivery Reviews 1995, 18 (1), 5-22.
2. Lipinski, C. A.; Lombardo, F.; Dominy, B. W.; Feeney, P. J., Experimental and
computational approaches to estimate solubility and permeability in drug discovery and
development settings. Advanced Drug Delivery Reviews 1997, 23 (1–3), 3-25.
3. Gastroenterology consultants of greater cinncinnati, Your digestive system and how it works
2006, https://ssl.gcis.net/giconsults/gi-tract.htm.
4. Franz Gabor, C. F., Lukas Neutsch, Improving Oral Delivery. In Drug Delivery - Principle
and Applications, Wiley, Ed. 2005; pp 345-397.
5. Guidance for Industry, CDER, FDA, Bioavailability and Bioequivalence Studies for
Orally Administered Drug Products—General Considerations. 21CFR320.1 Code of Federal
Regulations 1999, 5 (21), 300-499.
6. Gibaldi, M. P., D. , In In Pharmacokinetics,, 2nd ed.; Dekker: 1982; pp 145.
7. Rowland, M. T., T. , In In Clinical Pharmacokinetics, 3rd ed.; &, W.; Wilkins, Eds. 1995; pp
34.
8. Anna Maria, C. a. T. J. S., Physiological, Biochemical and Chemical Barriers to Oral Drug
Delivery. In Drug Delivery- Principles and Applications, Wiley: 2005; pp 345-397.
9. Daugherty, A. L.; Mrsny, R. J., Regulation of the intestinal epithelial paracellular barrier.
Pharmaceutical Science & Technology Today 1999, 2 (7), 281-287.
10. Gaucher, G.; Satturwar, P.; Jones, M.-C.; Furtos, A.; Leroux, J.-C., Polymeric micelles for
oral drug delivery. European Journal of Pharmaceutics and Biopharmaceutics 2010, 76 (2),
147-158.
11. Srivastava, K., Arora, A., Kataria, A., Cappelleri, C,J., Sadosky, A., Peterson, M, A.,, Impact
of reducing dosing frequency on adherence to oral therapies: a literature review and meta-
analysis. Patient Preference and Adherence 2013, 7, 419-434.
12. Thomas, E.; Rubino, J., Solubility, melting point and salting-out relationships in a group of
secondary amine hydrochloride salts. International Journal of Pharmaceutics 1996, 130 (2),
179-185.
Sonal Mazumder-PhD Thesis
69
13. Kimura, K.; Hirayama, F.; Uekama, K., Characterization of tolbutamide polymorphs
(burger's forms II and IV) and polymorphic transition behavior. Journal of Pharmaceutical
Sciences 1999, 88 (4), 385-391.
14. Yoshioka, M.; Hancock, B. C.; Zografi, G., Crystallization of indomethacin from the
amorphous state below and above its glass transition temperature. Journal of Pharmaceutical
Sciences 1994, 83 (12), 1700-1705.
15. Kesisoglou, F.; Panmai, S.; Wu, Y., Nanosizing — Oral formulation development and
biopharmaceutical evaluation. Advanced Drug Delivery Reviews 2007, 59 (7), 631-644.
16. Borm, W. H. D. J. P. J., Drug delivery and nanoparticles: Applications and hazards. Int J
Nanomedicine 2008, 3 (2), 133-149.
17. Asghar, L. F. A.; Chandran, S., Multiparticulate formulation approach to colon specific drug
delivery: current perspectives. 2006, 9, 327-38.
18. Keck, C. M.; Müller, R. H., Drug nanocrystals of poorly soluble drugs produced by high
pressure homogenisation. European Journal of Pharmaceutics and Biopharmaceutics 2006, 62
(1), 3-16.
19. Liversidge, G. G.; Cundy, K. C., Particle size reduction for improvement of oral
bioavailability of hydrophobic drugs: I. Absolute oral bioavailability of nanocrystalline danazol
in beagle dogs. International Journal of Pharmaceutics 1995, 125 (1), 91-97.
20. (a) Müller, R. H.; Jacobs, C.; Kayser, O., Nanosuspensions as particulate drug formulations
in therapy: Rationale for development and what we can expect for the future. Advanced Drug
Delivery Reviews 2001, 47 (1), 3-19; (b) Horn, D.; Rieger, J., Organic Nanoparticles in the
Aqueous Phase—Theory, Experiment, and Use. Angewandte Chemie International Edition 2001,
40 (23), 4330-4361; (c) Wu, Y.; Loper, A.; Landis, E.; Hettrick, L.; Novak, L.; Lynn, K.; Chen,
C.; Thompson, K.; Higgins, R.; Batra, U.; Shelukar, S.; Kwei, G.; Storey, D., The role of
biopharmaceutics in the development of a clinical nanoparticle formulation of MK-0869: a
Beagle dog model predicts improved bioavailability and diminished food effect on absorption in
human. International Journal of Pharmaceutics 2004, 285 (1–2), 135-146; (d) Langguth, P.;
Hanafy, A.; Frenzel, D.; Grenier, P.; Nhamias, A.; Ohlig, T.; Vergnault, G.; Spahn-Langguth, H.,
Nanosuspension Formulations for Low-Soluble Drugs: Pharmacokinetic Evaluation Using
Spironolactone as Model Compound. Drug Development and Industrial Pharmacy 2005, 31 (3),
319-329; (e) Jinno, J.-I.; Kamada, N.; Miyake, M.; Yamada, K.; Mukai, T.; Odomi, M.; Toguchi,
Sonal Mazumder-PhD Thesis
70
H.; Liversidge, G. G.; Higaki, K.; Kimura, T., Effect of particle size reduction on dissolution and
oral absorption of a poorly water-soluble drug, cilostazol, in beagle dogs. Journal of Controlled
Release 2006, 111 (1-2), 56-64.
21. R.B. Bird, E. L., W.E. Stewart, Transport Phenomena. 1st ed.; Wiley & Sons: 1960.
22. Moustafine, R. I.; Kabanova, T. V.; Kemenova, V. A.; Van Den Mooter, G., Characteristics
of interpolyelectrolyte complexes of Eudragit E100 with Eudragit L100. Journal of Controlled
Release 2005, 103 (1), 191-198.
23. (a) Posey-Dowty, J.; Watterson, T.; Wilson, A.; Edgar, K.; Shelton, M.; Lingerfelt, L., Zero-
order release formulations using a novel cellulose ester. Cellulose 2007, 14 (1), 73-83-83; (b)
Lorenzo-Lamosa, M. L.; Remuñán-López, C.; Vila-Jato, J. L.; Alonso, M. J., Design of
microencapsulated chitosan microspheres for colonic drug delivery. Journal of Controlled
Release 1998, 52 (1–2), 109-118.
24. Kohane, D. S., Microparticles and Nanoparticles for Drug Delivery. Biotechnology and
Bioengineering 2006, 96 (2), 203-209.
25. Kohane, D. S., Microparticles and nanoparticles for drug delivery. Biotechnology and
Bioengineering 2007, 96 (2), 203-209.
26. Rabinow, B. E., Nanosuspensions in drug delivery. Nature Reviews Drug Discovery 2004, 3,
785-796.
27. Merisko-Liversidge, E.; Liversidge, G. G., Nanosizing for oral and parenteral drug delivery:
A perspective on formulating poorly-water soluble compounds using wet media milling
technology. Advanced Drug Delivery Reviews 2011, 63 (6), 427-440.
28. (a) Nykamp, G.; Carstensen, U.; Müller, B. W., Jet milling—a new technique for
microparticle preparation. International Journal of Pharmaceutics 2002, 242 (1–2), 79-86; (b)
Rasenack, N.; Müller, B., Dissolution Rate Enhancement by in Situ Micronization of Poorly
Water-Soluble Drugs. Pharmaceutical Research 2002, 19 (12), 1894-1900.
29. Rh, J. J. a. M., Nanocrystal technology, drug delivery and clinical applications. Int J
Nanomedicine 2008, 3, 295-309.
30. Merisko-Liversidge, E. M.; Liversidge, G. G., Drug Nanoparticles: Formulating Poorly
Water-Soluble Compounds. Toxicologic Pathology 2008, 36 (1), 43-48.
Sonal Mazumder-PhD Thesis
71
31. Williams, H. D.; Trevaskis, N. L.; Charman, S. A.; Shanker, R. M.; Charman, W. N.; Pouton,
C. W.; Porter, C. J. H., Strategies to Address Low Drug Solubility in Discovery and
Development. Pharmacological Reviews 2013, 65 (1), 315-499.
32. Wu, L.; Zhang, J.; Watanabe, W., Physical and chemical stability of drug nanoparticles.
Advanced Drug Delivery Reviews 2011, 63 (6), 456-469.
33. Vogt, M.; Kunath, K.; Dressman, J. B., Dissolution enhancement of fenofibrate by
micronization, cogrinding and spray-drying: Comparison with commercial preparations.
European Journal of Pharmaceutics and Biopharmaceutics 2008, 68 (2), 283-288.
34. Hargrove Jt, M. W., And Wentz Ac, Absorption of oral progesterone is influenced by vehicle
and particle size. Am J Obstet Gynecol 1989, 161, 948-951.
35. J, N. F. a. R., Dependence of area under the curve on proquazone particle size and in vitro
dissolution rate. J Pharm Sci 1980, 69, 605-607.
36. Watari, N.; Funaki, T.; Aizawa, K.; Kaneniwa, N., Nonlinear assessment of nitrofurantoin
bioavailability in rabbits. Journal of Pharmacokinetics and Biopharmaceutics 1983, 11 (5), 529-
545.
37. Gao, P., Amorphous pharmaceutical solids: Characterization, stabilization, and development
of marketable formulations of poorly soluble drugs with improved oral absorption. Molecular
Pharmaceutics 2008, 5 (6), 903-904.
38. Poste, G.; Papahadjopoulos, D.; Vail, W. J.; David, M. P., Chapter 4 Lipid vesicles as
carriers for introducing biologically active materials into cells. In Methods in Cell Biology,
Academic Press: 1976, 14, pp 33-71.
39. Chen, T.; Shukoor, M. I.; Wang, R.; Zhao, Z.; Yuan, Q.; Bamrungsap, S.; Xiong, X.; Tan,
W., Smart multifunctional nanostructure for targeted cancer chemotherapy and magnetic
resonance imaging. ACS Nano 2011, 5 (10), 7866-7873.
40. Li, Y. Y.; Chen, X. G.; Zhang, J.; Liu, C. S.; Xue, Y. P.; Sun, G. Z.; Zhang, W. F., In vitro
release of rifampicin and biocompatibility of oleoylchitosan nanoparticles. Journal of Applied
Polymer Science 2009, 111 (5), 2269-2274.
41. Sung, J.; Padilla, D.; Garcia-Contreras, L.; Verberkmoes, J.; Durbin, D.; Peloquin, C.; Elbert,
K.; Hickey, A.; Edwards, D., Formulation and pharmacokinetics of self-assembled rifampicin
nanoparticle systems for pulmonary delivery. Pharmaceutical Research 2009, 26 (8), 1847-1855.
Sonal Mazumder-PhD Thesis
72
42. Merisko-Liversidge, E.; Liversidge, G. G.; Cooper, E. R., Nanosizing: a formulation
approach for poorly-water-soluble compounds. European Journal of Pharmaceutical Sciences
2003, 18 (2), 113-120.
43. Christopher A, L., Drug-like properties and the causes of poor solubility and poor
permeability. Journal of Pharmacological and Toxicological Methods 2000, 44 (1), 235-249.
44. (a) Lipinski, C., Poor aqueous solubility: an industry wide problem in drug discovery. Am
Pharm Rev 5 2002, 5, 82; (b) Lipper, R. A., E pluribus product. Modern Drug Discovery 1999,
55-60.
45. Noyes, A. A.; Whitney, W. R., The rate of solution of solid substances in their own solutions.
Journal of the American Chemical Society 1897, 19 (12), 930-934.
46. Van Eerdenbrugh, B.; Vermant, J.; Martens, J. A.; Froyen, L.; Humbeeck, J. V.; Van Den
Mooter, G.; Augustijns, P., Solubility Increases Associated with Crystalline Drug Nanoparticles:
Methodologies and Significance. Molecular Pharmaceutics 2010, 7 (5), 1858-1870.
47. Sun, W.; Mao, S.; Shi, Y.; Li, L. C.; Fang, L., Nanonization of itraconazole by high pressure
homogenization: Stabilizer optimization and effect of particle size on oral absorption. Journal of
Pharmaceutical Sciences 2011, 100 (8), 3365-3373.
48. Bawarski,W.E.;Chidlowsky,E.; Bharali, D. J.; Mousa, S. A., Emerging nanopharmaceuticals.
Nanomedicine: Nanotechnology, Biology and Medicine 2008, 4 (4), 273-282.
49. Kumari, A.; Yadav, S. K.; Yadav, S. C., Biodegradable polymeric nanoparticles based drug
delivery systems. Colloids and Surfaces B: Biointerfaces 2010, 75 (1), 1-18.
50. Hillaireau, H.; Couvreur, P., Nanocarriers’ entry into the cell: relevance to drug delivery.
Cellular and Molecular Life Sciences 2009, 66 (17), 2873-2896.
51. Prego, C.; Torres, D.; Fernandez-Megia, E.; Novoa-Carballal, R.; Quiñoá, E.; Alonso, M. J.,
Chitosan–PEG nanocapsules as new carriers for oral peptide delivery: Effect of chitosan
pegylation degree. Journal of Controlled Release 2006, 111 (3), 299-308.
52. W.H.D. Jong, P. J. B., Drug delivery and nanoparticles: Applications and hazards.
International Journal of Nanomedicine 2008 3(2), 133-149.
53. (a) Sekiguchi K.; Obi N.; Ueda Y., Studies on absorption of eutectic mixture. II. Absorption
of fused conglomerates of chloramphenicol and urea in rabbits. Chem Pharm Bull (Tokyo) 1961,
12, 134-144; (b) Hancock, B. C.; Zografi, G., Characteristics and significance of the amorphous
state in pharmaceutical systems. Journal of Pharmaceutical Sciences 1997, 86 (1), 1-12.
Sonal Mazumder-PhD Thesis
73
54. Serajuddin, A. T. M., Solid dispersion of poorly water-soluble drugs: Early promises,
subsequent problems, and recent breakthroughs. Journal of Pharmaceutical Sciences 1999, 88
(10), 1058-1066.
55. Leuner, C.; Dressman, J., Improving drug solubility for oral delivery using solid dispersions.
European Journal of Pharmaceutics and Biopharmaceutics 2000, 50 (1), 47-60.
56. Newman, A.; Knipp, G.; Zografi, G., Assessing the performance of amorphous solid
dispersions. Journal of Pharmaceutical Sciences 2012, 101 (4), 1355-1377.
57. Gao, Y.; Carr, R. A.; Spence, J. K.; Wang, W. W.; Turner, T. M.; Lipari, J. M.; Miller, J. M.,
A pH-dilution method for estimation of biorelevant drug solubility along the gastrointestinal
tract: Application to physiologically based pharmacokinetic modeling. Molecular Pharmaceutics
2010, 7 (5), 1516-1526.
58. Law, D.; Schmitt, E. A.; Marsh, K. C.; Everitt, E. A.; Wang, W.; Fort, J. J.; Krill, S. L.; Qiu,
Y., Ritonavir–PEG 8000 amorphous solid dispersions: In vitro and in vivo evaluations. Journal
of Pharmaceutical Sciences 2004, 93 (3), 563-570.
59. Kennedy, M.; Hu, J.; Gao, P.; Li, L.; Ali-Reynolds, A.; Chal, B.; Gupta, V.; Ma, C.;
Mahajan, N.; Akrami, A.; Surapaneni, S., Enhanced bioavailability of a poorly soluble VR1
antagonist using an amorphous solid dispersion approach: A case study. Molecular
Pharmaceutics 2008, 5 (6), 981-993.
60. Van Eerdenbrugh, B.; Van Speybroeck, M.; Mols, R.; Houthoofd, K.; Martens, J. A.; Froyen,
L.; Van Humbeeck, J.; Augustijns, P.; Van Den Mooter, G., Itraconazole/TPGS/Aerosil®200
solid dispersions: Characterization, physical stability and in vivo performance. European Journal
of Pharmaceutical Sciences 2009, 38 (3), 270-278.
61. Li, S.; Liu, Y.; Liu, T.; Zhao, L.; Zhao, J.; Feng, N., Development and in-vivo assessment of
the bioavailability of oridonin solid dispersions by the gas anti-solvent technique. International
Journal of Pharmaceutics 2011, 411 (1–2), 172-177.
62. Mellaerts, R.; Mols, R.; Jammaer, J. a. G.; Aerts, C. A.; Annaert, P.; Van Humbeeck, J.; Van
Den Mooter, G.; Augustijns, P.; Martens, J. A., Increasing the oral bioavailability of the poorly
water soluble drug itraconazole with ordered mesoporous silica. European Journal of
Pharmaceutics and Biopharmaceutics 2008, 69 (1), 223-230.
Sonal Mazumder-PhD Thesis
74
63. Bauer, J.; Spanton, S.; Henry, R.; Quick, J.; Dziki, W.; Porter, W.; Morris, J., Ritonavir: An
Extraordinary Example of Conformational Polymorphism. Pharmaceutical Research 2001, 18
(6), 859-866.
64. Yoshioka, M.; Hancock, B. C.; Zografi, G., Inhibition of indomethacin crystallization in
poly(vinylpyrrolidone) coprecipitates. Journal of Pharmaceutical Sciences 1995, 84 (8), 983-
986.
65. Van Den Mooter, G.; Augustijns, P.; Blaton, N.; Kinget, R., Physico-chemical
characterization of solid dispersions of temazepam with polyethylene glycol 6000 and PVP K30.
International Journal of Pharmaceutics 1998, 164 (1–2), 67-80.
66. Matsumoto, T.; Zografi, G., Physical properties of solid molecular dispersions of
indomethacin with poly(vinylpyrrolidone) and poly(vinylpyrrolidone-co-vinyl-acetate) in
relation to indomethacin crystallization. Pharmaceutical Research 1999, 16 (11), 1722-1728.
67. Shamblin, S. L.; Hancock, B. C.; Dupuis, Y.; Pikal, M. J., Interpretation of relaxation time
constants for amorphous pharmaceutical systems. Journal of Pharmaceutical Sciences 2000, 89
(3), 417-427.
68. Six, K.; Verreck, G.; Peeters, J.; Brewster, M.; Mooter, G. V. D., Increased physical stability
and improved dissolution properties of itraconazole, a class II drug, by solid dispersions that
combine fast- and slow-dissolving polymers. Journal of Pharmaceutical Sciences 2004, 93 (1),
124-131.
69. Vasanthavada, M.; Tong, W.-Q.; Joshi, Y.; Kislalioglu, M. S., Phase behavior of amorphous
molecular dispersions ii: role of hydrogen bonding in solid solubility and phase separation
kinetics. Pharmaceutical Research 2005, 22 (3), 440-448.
70. Konno, H.; Taylor, L. S., Influence of different polymers on the crystallization tendency of
molecularly dispersed amorphous felodipine. Journal of Pharmaceutical Sciences 2006, 95 (12),
2692-2705.
71. Lindfors, L.; Forssén, S.; Westergren, J.; Olsson, U., Nucleation and crystal growth in
supersaturated solutions of a model drug. Journal of Colloid and Interface Science 2008, 325 (2),
404-413.
72. Marsac, P.; Konno, H.; Rumondor, A. F.; Taylor, L., Recrystallization of nifedipine and
felodipine from amorphous molecular level solid dispersions containing poly(vinylpyrrolidone)
and sorbed water. Pharmaceutical Research 2008, 25 (3), 647-656.
Sonal Mazumder-PhD Thesis
75
73. Caron, V.; Bhugra, C.; Pikal, M. J., Prediction of onset of crystallization in amorphous
pharmaceutical systems: Phenobarbital, nifedipine/PVP, and phenobarbital/PVP. Journal of
Pharmaceutical Sciences 2010, 99 (9), 3887-3900.
74. Marsac, P.; Li, T.; Taylor, L., Estimation of Drug–Polymer Miscibility and Solubility in
Amorphous Solid Dispersions Using Experimentally Determined Interaction Parameters.
Pharmaceutical Research 2009, 26 (1), 139-151.
75. Qian, F.; Huang, J.; Hussain, M. A., Drug–polymer solubility and miscibility: Stability
consideration and practical challenges in amorphous solid dispersion development. Journal of
Pharmaceutical Sciences 2010, 99 (7), 2941-2947.
76. Hancock, B. C.; Parks, M., What is the True Solubility Advantage for Amorphous
Pharmaceuticals? Pharmaceutical Research 2000, 17 (4), 397-404.
77. Florence, A. T., Atwood, D., Physicochemical Principles of Pharmacy. 3rd ed ed.;
MacMillan Press: London., 1998.
78. (a) GinãS, J. M.; Arias, M. J.; Moyano, J. R.; Sãnchez-Soto, P. J., Thermal investigation of
crystallization of polyethylene glycols in solid dispersions containing oxazepam. International
Journal of Pharmaceutics 1996, 143 (2), 247-253; (b) Marsac, P.; Konno, H.; Rumondor, A.;
Taylor, L., Recrystallization of Nifedipine and Felodipine from Amorphous Molecular Level
Solid Dispersions Containing Poly(vinylpyrrolidone) and Sorbed Water. Pharmaceutical
Research 2008, 25 (3), 647-656.
79. Shelton Michael, C.; Posey-Dowty Jessica, D.; Lingerfelt, L.; Kirk Shane, K.; Klein, S.;
Edgar Kevin, J., Enhanced dissolution of poorly soluble drugs from solid dispersions in
carboxymethylcellulose acetate butyrate matrices. In Polysaccharide Materials: Performance by
Design, American Chemical Society: 2009, 1017, 93-113.
80. Rowe R.C., S., P.J., and Quinn M.E.,, Handbook of Pharmaceutical Excipients,. 6 ed.;
Pharmaceutical Press, 2009.
81. Tanno, F.; Nishiyama, Y.; Kokubo, H.; Obara, S., Evaluation of hypromellose acetate
succinate (HPMCAS) as a carrier in solid dispersions. Drug Development and Industrial
Pharmacy 2004, 30 (1), 9-17.
82. Friesen, D. T.; Shanker, R.; Crew, M.; Smithey, D. T.; Curatolo, W. J.; Nightingale, J. A. S.,
Hydroxypropyl methylcellulose acetate succinate-based spray-dried dispersions: An overview.
Molecular Pharmaceutics 2008, 5 (6), 1003-1019.
Sonal Mazumder-PhD Thesis
76
83. Brouwers, J.; Brewster, M. E.; Augustijns, P., Supersaturating drug delivery systems: The
answer to solubility-limited oral bioavailability? Journal of Pharmaceutical Sciences 2009, 98
(8), 2549-2572.
84. Craig, D. Q. M., The mechanisms of drug release from solid dispersions in water-soluble
polymers. International Journal of Pharmaceutics 2002, 231 (2), 131-144.
85. Alonzo, D. E.; Gao, Y.; Zhou, D.; Mo, H.; Zhang, G. G. Z.; Taylor, L. S., Dissolution and
precipitation behavior of amorphous solid dispersions. Journal of Pharmaceutical Sciences 2011,
100 (8), 3316-3331.
86. Kanaujia, P.; Lau, G.; Ng, W. K.; Widjaja, E.; Hanefeld, A.; Fischbach, M.; Maio, M.; Tan,
R. B. H., Nanoparticle formation and growth during in vitro dissolution of ketoconazole solid
dispersion. Journal of Pharmaceutical Sciences 2011, 100 (7), 2876-2885.
87. Verheyen, S.; Blaton, N.; Kinget, R.; Van Den Mooter, G., Mechanism of increased
dissolution of diazepam and temazepam from polyethylene glycol 6000 solid dispersions.
International Journal of Pharmaceutics 2002, 249 (1–2), 45-58.
88. Valizadeh, H.; Nokhodchi, A.; Qarakhani, N.; Zakeri‐Milani, P.; Azarmi, S.; Hassanzadeh,
D.; Löbenberg, R., Physicochemical characterization of solid dispersions of indomethacin with
PEG 6000, Myrj 52, Lactose, Sorbitol, Dextrin, and Eudragit® E100. Drug Development and
Industrial Pharmacy 2004, 30 (3), 303-317.
89. Baird, J. A.; Taylor, L. S., Evaluation and modeling of the eutectic composition of various
drug-polyethylene glycol solid dispersions. Pharmaceutical Development and Technology 2011,
16 (3), 201-211.
90. Save, T.; Venkitachalam, P., Studies on solid dispersions of nifedipine. Drug Development
and Industrial Pharmacy 1992, 18 (15), 1663-1679.
91. Hancock, B.; Parks, M., What is the True Solubility Advantage for Amorphous
Pharmaceuticals? Pharmaceutical Research 2000, 17 (4), 397-404.
92. Murdande, S. B.; Pikal, M. J.; Shanker, R. M.; Bogner, R. H., Aqueous solubility of
crystalline and amorphous drugs: Challenges in measurement. Pharmaceutical Development and
Technology 2011, 16 (3), 187-200.
93. Murdande, S. B.; Pikal, M. J.; Shanker, R. M.; Bogner, R. H., Solubility advantage of
amorphous pharmaceuticals: I. A thermodynamic analysis. Journal of Pharmaceutical Sciences
2010, 99 (3), 1254-1264.
Sonal Mazumder-PhD Thesis
77
94. Bhugra, C.; Pikal, M. J., Role of thermodynamic, molecular, and kinetic factors in
crystallization from the amorphous state. Journal of Pharmaceutical Sciences 2008, 97 (4),
1329-1349.
95. Murdande, S.; Pikal, M.; Shanker, R.; Bogner, R., Solubility advantage of amorphous
pharmaceuticals: II. Application of quantitative thermodynamic relationships for prediction of
solubility enhancement in structurally diverse insoluble pharmaceuticals. Pharmaceutical
Research 2010, 27 (12), 2704-2714.
96. Vandecruys, R.; Peeters, J.; Verreck, G.; Brewster, M. E., Use of a screening method to
determine excipients which optimize the extent and stability of supersaturated drug solutions and
application of this system to solid formulation design. International Journal of Pharmaceutics
2007, 342 (1–2), 168-175.
97. (a) Warren, D. B.; Benameur, H.; Porter, C. J. H.; Pouton, C. W., Using polymeric
precipitation inhibitors to improve the absorption of poorly water-soluble drugs: A mechanistic
basis for utility. Journal of Drug Targeting 2010, 18 (10), 704-731; (b) Guzmán, H. R.; Tawa,
M.; Zhang, Z.; Ratanabanangkoon, P.; Shaw, P.; Gardner, C. R.; Chen, H.; Moreau, J.-P.;
Almarsson, Ö.; Remenar, J. F., Combined use of crystalline salt forms and precipitation
inhibitors to improve oral absorption of celecoxib from solid oral formulations. Journal of
Pharmaceutical Sciences 2007, 96 (10), 2686-2702.
98. Yamashita, K.; Nakate, T.; Okimoto, K.; Ohike, A.; Tokunaga, Y.; Ibuki, R.; Higaki, K.;
Kimura, T., Establishment of new preparation method for solid dispersion formulation of
tacrolimus. International Journal of Pharmaceutics 2003, 267 (1–2), 79-91.
99. Augustijns, P.; Brewster, M. E., Supersaturating drug delivery systems: Fast is not
necessarily good enough. Journal of Pharmaceutical Sciences 2012, 101 (1), 7-9.
100. Six, K.; Daems, T.; De Hoon, J.; Van Hecken, A.; Depre, M.; Bouche, M.-P.; Prinsen, P.;
Verreck, G.; Peeters, J.; Brewster, M. E.; Van Den Mooter, G., Clinical study of solid
dispersions of itraconazole prepared by hot-stage extrusion. European Journal of
Pharmaceutical Sciences 2005, 24 (2–3), 179-186.
101. Konno, H.; Handa, T.; Alonzo, D. E.; Taylor, L. S., Effect of polymer type on the
dissolution profile of amorphous solid dispersions containing felodipine. European Journal of
Pharmaceutics and Biopharmaceutics 2008, 70 (2), 493-499.
Sonal Mazumder-PhD Thesis
78
102. Curatolo, W.; Nightingale, J.; Herbig, S., Utility of hydroxypropylmethylcellulose acetate
succinate (HPMCAS) for initiation and maintenance of drug supersaturation in the GI milieu.
Pharmaceutical Research 2009, 26 (6), 1419-1431.
103. Gebauer, D.; Völkel, A.; Cölfen, H., Stable prenucleation calcium carbonate clusters.
Science 2008, 322 (5909), 1819-1822.
104. Miller, D. A.; Dinunzio, J. C.; Yang, W.; Mcginity, J. W.; Williams, R. O., Enhanced in
vivo absorption of itraconazole via stabilization of supersaturation following acidic-to-neutral ph
transition. Drug Development and Industrial Pharmacy 2008, 34 (8), 890-902.
105. Yokoi, Y.; Yonemochi, E.; Terada, K., Effects of sugar ester and hydroxypropyl
methylcellulose on the physicochemical stability of amorphous cefditoren pivoxil in aqueous
suspension. International Journal of Pharmaceutics 2005, 290 (1–2), 91-99.
106. Gao, F.; Zhang, Z.; Bu, H.; Huang, Y.; Gao, Z.; Shen, J.; Zhao, C.; Li, Y., Nanoemulsion
improves the oral absorption of candesartan cilexetil in rats: Performance and mechanism.
Journal of Controlled Release 2011, 149 (2), 168-174.
107. Brewster, M. E.; Vandecruys, R.; Peeters, J.; Neeskens, P.; Verreck, G.; Loftsson, T.,
Comparative interaction of 2-hydroxypropyl-β-cyclodextrin and sulfobutylether-β-cyclodextrin
with itraconazole: Phase-solubility behavior and stabilization of supersaturated drug solutions.
European Journal of Pharmaceutical Sciences 2008, 34 (2–3), 94-103.
108. Gebauer, D.; Cölfen, H., Prenucleation clusters and non-classical nucleation. Nano Today
2011, 6 (6), 564-584.
109. Linn, M.; Collnot, E.-M.; Djuric, D.; Hempel, K.; Fabian, E.; Kolter, K.; Lehr, C.-M.,
Soluplus® as an effective absorption enhancer of poorly soluble drugs in vitro and in vivo.
European Journal of Pharmaceutical Sciences 2012, 45 (3), 336-343.
110. (a) Breitenbach, J., Melt extrusion: from process to drug delivery technology. European
Journal of Pharmaceutics and Biopharmaceutics 2002, 54 (2), 107-117; (b) Lei Gao, D. Z.,
Minghui Chen, Drug nanocrystals for the formulation of poorly soluble
drugs and its application as a potential drug delivery system. J Nanopart Res 2008, 10, 845-862.
111. Dinunzio, J. C.; Brough, C.; Miller, D. A.; Williams, R. O.; Mcginity, J. W., Fusion
processing of itraconazole solid dispersions by kinetisol® dispersing: A comparative study to hot
melt extrusion. Journal of Pharmaceutical Sciences 2010, 99 (3), 1239-1253.
Sonal Mazumder-PhD Thesis
79
112. Esnaashari, S.; Javadzadeh, Y.; Batchelor, H. K.; Conway, B. R., The use of
microviscometry to study polymer dissolution from solid dispersion drug delivery systems.
International Journal of Pharmaceutics 2005, 292 (1–2), 227-230.
113. Janssens, S.; Van Den Mooter, G., Review: physical chemistry of solid dispersions.
Journal of Pharmacy and Pharmacology 2009, 61 (12), 1571-1586.
114. Six, K.; Berghmans, H.; Leuner, C.; Dressman, J.; Van Werde, K.; Mullens, J.; Benoist,
L.; Thimon, M.; Meublat, L.; Verreck, G.; Peeters, J.; Brewster, M.; Van Den Mooter, G.,
Characterization of solid dispersions of itraconazole and hydroxypropylmethylcellulose prepared
by melt extrusion, Part II. Pharmaceutical Research 2003, 20 (7), 1047-1054.
115. Kapsi, S. G.; Ayres, J. W., Processing factors in development of solid solution
formulation of itraconazole for enhancement of drug dissolution and bioavailability.
International Journal of Pharmaceutics 2001, 229 (1–2), 193-203.
116. Janssens, S.; Nagels, S.; Armas, H. N. D.; D’autry, W.; Van Schepdael, A.; Van Den
Mooter, G., Formulation and characterization of ternary solid dispersions made up of
Itraconazole and two excipients, TPGS 1000 and PVPVA 64, that were selected based on a
supersaturation screening study. European Journal of Pharmaceutics and Biopharmaceutics
2008, 69 (1), 158-166.
117. Lakshman, J. P.; Cao, Y.; Kowalski, J.; Serajuddin, A. T. M., Application of melt
extrusion in the development of a physically and chemically stable high-energy amorphous solid
dispersion of a poorly water-soluble drug. Molecular Pharmaceutics 2008, 5 (6), 994-1002.
118. Abu-Diak, O. A.; Jones, D. S.; Andrews, G. P., An investigation into the dissolution
properties of celecoxib melt extrudates: understanding the role of polymer type and
concentration in stabilizing supersaturated drug concentrations. Molecular Pharmaceutics 2011,
8 (4), 1362-1371.
119. (a) Dontireddy, R.; Crean, A. M., A comparative study of spray-dried and freeze-dried
hydrocortisone/polyvinyl pyrrolidone solid dispersions. Drug Development and Industrial
Pharmacy 2011, 37 (10), 1141-1149; (b) Ghosh, I.; Snyder, J.; Vippagunta, R.; Alvine, M.;
Vakil, R.; Tong, W.-Q.; Vippagunta, S., Comparison of HPMC based polymers performance as
carriers for manufacture of solid dispersions using the melt extruder. International Journal of
Pharmaceutics 2011, 419 (1–2), 12-19.
Sonal Mazumder-PhD Thesis
80
120. Higuchi, W. I.; Mir, N. A.; Desai, S. J., Dissolution rates of polyphase mixtures. Journal
of Pharmaceutical Sciences 1965, 54 (10), 1405-1410.
121. Padden B, M. J., Robbins T, Zocharski Pd, Prasad L, Spence Jk, Lafountaine J,
Amorphous solid dispersions as enabling formulations for discovery and early development. Am
Pharm Rev 2011, 1, 66-73.
122. Van Den Mooter, G.; Wuyts, M.; Blaton, N.; Busson, R.; Grobet, P.; Augustijns, P.;
Kinget, R., Physical stabilisation of amorphous ketoconazole in solid dispersions with
polyvinylpyrrolidone K25. European Journal of Pharmaceutical Sciences 2001, 12 (3), 261-269.
123. Karavas, E.; Ktistis, G.; Xenakis, A.; Georgarakis, E., Miscibility behavior and formation
mechanism of stabilized felodipine-polyvinylpyrrolidone amorphous solid dispersions. Drug
Development and Industrial Pharmacy 2005, 31 (6), 473-489.
124. Hancock, B.; Shamblin, S.; Zografi, G., Molecular mobility of amorphous
pharmaceutical solids below their glass transition temperatures. Pharmaceutical Research 1995,
12 (6), 799-806.
125. Zhou, D.; Zhang, G. G. Z.; Law, D.; Grant, D. J. W.; Schmitt, E. A., Physical stability of
amorphous pharmaceuticals: Importance of configurational thermodynamic quantities and
molecular mobility. Journal of Pharmaceutical Sciences 2002, 91 (8), 1863-1872.
126. Miyazaki, T.; Yoshioka, S.; Aso, Y.; Kojima, S., Ability of polyvinylpyrrolidone and
polyacrylic acid to inhibit the crystallization of amorphous acetaminophen. Journal of
Pharmaceutical Sciences 2004, 93 (11), 2710-2717.
127. Konno, H.; Taylor, L., Ability of different polymers to inhibit the crystallization of
amorphous felodipine in the presence of moisture. Pharmaceutical Research 2008, 25 (4), 969-
978.
128. Bruce, C. D.; Fegely, K. A.; Rajabi-Siahboomi, A. R.; Mcginity, J. W., The influence of
heterogeneous nucleation on the surface crystallization of guaifenesin from melt extrudates
containing Eudragit® L10055 or Acryl-EZE®. European Journal of Pharmaceutics and
Biopharmaceutics 2010, 75 (1), 71-78.
129. James, P. F., Kinetics of crystal nucleation in silicate glasses. Journal of Non-Crystalline
Solids 1985, 73 (1–3), 517-540.
130. Van Drooge, D. J.; Hinrichs, W. L. J.; Visser, M. R.; Frijlink, H. W., Characterization of
the molecular distribution of drugs in glassy solid dispersions at the nano-meter scale, using
Sonal Mazumder-PhD Thesis
81
differential scanning calorimetry and gravimetric water vapour sorption techniques. International
Journal of Pharmaceutics 2006, 310 (1–2), 220-229.
131. Huang, J.; Li, Y.; Wigent, R. J.; Malick, W. A.; Sandhu, H. K.; Singhal, D.; Shah, N. H.,
Interplay of formulation and process methodology on the extent of nifedipine molecular
dispersion in polymers. International Journal of Pharmaceutics 2011, 420 (1), 59-67.
132. Paudel, A.; Van Humbeeck, J.; Van Den Mooter, G., Theoretical and experimental
investigation on the solid solubility and miscibility of naproxen in poly(vinylpyrrolidone).
Molecular Pharmaceutics 2010, 7 (4), 1133-1148.
133. Marsac, P.; Shamblin, S.; Taylor, L., Theoretical and practical approaches for prediction
of drug–polymer miscibility and solubility. Pharmaceutical Research 2006, 23 (10), 2417-2426.
134. Rumondor, A. C. F.; Taylor, L. S., Effect of polymer hygroscopicity on the phase
behavior of amorphous solid dispersions in the presence of moisture. Molecular Pharmaceutics
2009, 7 (2), 477-490.
135. Chan, K. L. A.; Kazarian, S. G., FTIR spectroscopic imaging of dissolution of a solid
dispersion of nifedipine in poly(ethylene glycol). Molecular Pharmaceutics 2004, 1 (4), 331-
335.
136. Palmieri, G. F.; Michelini, S.; Martino, P. D.; Martelli, S., Polymers with pH-dependent
solubility: Possibility of use in the formulation of gastroresistant and controlled-release matrix
tablets. Drug Development and Industrial Pharmacy 2000, 26 (8), 837-845.
137. Dressman, J. B.; Berardi, R. R.; Dermentzoglou, L. C.; Russell, T. L.; Schmaltz, S. P.;
Barnett, J. L.; Jarvenpaa, K. M., Upper gastrointestinal (GI) pH in young, healthy men and
women. Pharmaceutical Research 1990, 7 (7), 756-761.
138. Charman, W. N.; Porter, C. J. H.; Mithani, S.; Dressman, J. B., Physicochemical and
physiological mechanisms for the effects of food on drug absorption: The role of lipids and pH.
Journal of Pharmaceutical Sciences 1997, 86 (3), 269-282.
139. Ebube, N. K.; Jones, A. B., Sustained release of acetaminophen from a heterogeneous
mixture of two hydrophilic non-ionic cellulose ether polymers. International Journal of
Pharmaceutics 2004, 272 (1–2), 19-27.
140. Elkheshen S, Y. A., Alkhaled F., Per-oral extended-release bioadhesive tablet
formulation of verapamil HCl. Boll Chim Farm 2003, 142 (5), 226-31.
Sonal Mazumder-PhD Thesis
82
141. Hosny Ea, E. S., Saleh Si., Buccoadhesive tablets for insulin delivery: in-vitro and in-
vivo studies. Boll Chim Farm. 2002, 141 (3), 210-7.
142. Genç L, O. C., Güler E., Studies on vaginal bioadhesive tablets of acyclovir. Pharmazie.
2000, 55 (4), 297-9.
143. Francis Mira, F.; Piredda, M.; Winnik Françoise, M., Hydroxypropylcellulose in oral
drug delivery. In Polysaccharides for Drug Delivery and Pharmaceutical Applications,
American Chemical Society: 2006; Vol. 934, pp 57-75.
144. (a) Shelton Michael, C.; Posey-Dowty Jessica, D.; Lingerfelt, L.; Kirk Shane, K.; Klein,
S.; Edgar Kevin, J., Enhanced dissolution of poorly soluble drugs from solid dispersions in
carboxymethylcellulose acetate butyrate matrices. In Polysaccharide Materials: Performance by
Design, American Chemical Society: 2009; Vol. 1017, pp 93-113; (b) Guyot, M.; Fawaz, F.,
Design and in vitro evaluation of adhesive matrix for transdermal delivery of propranolol.
International Journal of Pharmaceutics 2000, 204 (1–2), 171-182.
145. Khandare, J.; Haag, R., Pharmaceutically used polymers: Principles, structures, and
applications of pharmaceutical delivery systems. Handb Exp Pharmacol. 2010, (197), 221-50.
146. Liu, H.; Kar, N.; Edgar, K., Direct synthesis of cellulose adipate derivatives using adipic
anhydride. Cellulose 2012, 19 (4), 1279-1293.
147. Liu, H.; Ilevbare, G. A.; Cherniawski, B. P.; Ritchie, E. T.; Taylor, L. S.; Edgar, K. J.,
Synthesis and structure-property evaluation of cellulose ω-carboxyesters for amorphous solid
dispersions. Carbohydrate Polymers 2012, http://dx.doi.org/10.1016/j.carbpol.2012.11.049
148. (a) Rabinow, B. E., Nanosuspensions in drug delivery. Nat Rev Drug Discov 2004, 3 (9),
785-796; (b) Merisko-Liversidge, E.; Mcgurk, S. L.; Liversidge, G. G., Insulin Nanoparticles: A
Novel Formulation Approach for Poorly Water Soluble Zn-Insulin. Pharmaceutical Research
2004, 21 (9), 1545-1553.
149. Liu, M.; Frãchet, J. M. J., Designing dendrimers for drug delivery. Pharmaceutical
Science & Technology Today 1999, 2 (10), 393-401.
150. (a) Letchford, K.; Burt, H., A review of the formation and classification of amphiphilic
block copolymer nanoparticulate structures: micelles, nanospheres, nanocapsules and
polymersomes. European Journal of Pharmaceutics and Biopharmaceutics 2007, 65 (3), 259-
269; (b) Kawakami, K.; Yoshikawa, T.; Hayashi, T.; Nishihara, Y.; Masuda, K., Microemulsion
formulation for enhanced absorption of poorly soluble drugs: II. In vivo study. Journal of
Sonal Mazumder-PhD Thesis
83
Controlled Release 2002, 81 (1-2), 75-82; (c) Colin W, P., Lipid formulations for oral
administration of drugs: non-emulsifying, self-emulsifying and "self-microemulsifying" drug
delivery systems. European Journal of Pharmaceutical Sciences 2000, 11, Supplement 2, S93-
S98.
151. (a) Liedtke, S.; Wissing, S.; Müller, R. H.; Mader, K., Influence of high pressure
homogenisation equipment on nanodispersions characteristics. International Journal of
Pharmaceutics 2000, 196 (2), 183-185; (b) Keck, C. M.; Müller, R. H., Drug nanocrystals of
poorly soluble drugs produced by high pressure homogenisation. European Journal of
Pharmaceutics and Biopharmaceutics 2006, 62 (1), 3-16.
152. Pace, S., Pace, G. W., Parikh, I., and Mishra, A., Novel injectable formulationsof
insoluble drugs. Pharm Tech 1999, 23, 116-34.
153. Schwitzer, J. M.; Müller, R. H., Drug Nanocrystals—The Universal Formulation
Approach for Poorly Soluble Drugs. Nanoparticulate Drug Delivery Systems, 2007,71-88.
154. (a) Liu, Y.; Tong, Z.; Prud'homme, R. K., Stabilized polymeric nanoparticles for
controlled and efficient release of bifenthrin. Pest Management Science 2008, 64 (8), 808-812;
(b) Matsumura, Y.; Maeda, H., A new concept for macromolecular therapeutics in cancer
chemotherapy: Mechanism of tumoritropic accumulation of proteins and the antitumor agent
smancs. Cancer Research 1986, 46 (12 Part 1), 6387-6392; (c) Gindy, M., Composite block
copolymer stabilized nanoparticles: Simultaneous encapsulation of organic actives and inorganic
nanostructures. Langumir 2008, 24, 83-90.
155. Liu, Y.; Cheng, C.; Prud'homme, R. K.; Fox, R. O., Mixing in a multi-inlet vortex mixer
(MIVM) for flash nano-precipitation. Chemical Engineering Science 2008, 63 (11), 2829-2842.
156. Johnson, B. K.; Prud'homme, R. K., Chemical processing and micromixing in confined
impinging jets. AIChE Journal 2003, 49 (9), 2264-2282.
157. Johnson, B. K.; Prud'homme, R. K., Flash NanoPrecipitation of Organic Actives and
Block Copolymers using a Confined Impinging Jets Mixer. Australian Journal of Chemistry
2003, 56 (10), 1021-1024.
158. (a) Mahajan, A. J.; Kirwan, D. J., Micromixing effects in a two-impinging-jets
precipitator. AIChE Journal 1996, 42 (7), 1801-1814; (b) Gillian, J. M.; Kirwan, D. J.,
Identification and correlation of mixing times in opposed-jet mixers. Chemical Engineering
Communications 2008, 195 (12), 1553 - 1574.
Sonal Mazumder-PhD Thesis
84
159. Gindy, M. E.; Panagiotopoulos, A. Z.; Prud'homme, R. K., Composite block copolymer
stabilized nanoparticles: simultaneous encapsulation of organic actives and inorganic
Nanostructures. Langmuir 2007, 24 (1), 83-90.
160. Akbulut, M.; Ginart, P.; Gindy, M. E.; Theriault, C.; Chin, K. H.; Soboyejo, W.;
Prud'homme, R. K., Generic Method of Preparing Multifunctional Fluorescent Nanoparticles
Using Flash NanoPrecipitation. Advanced Functional Materials 2009, 19 (5), 718-725.
161. Chan, H.-K.; Kwok, P. C. L., Production methods for nanodrug particles using the
bottom-up approach. Advanced Drug Delivery Reviews 2011, 63 (6), 406-416.
162. Gelperina, S.; Kisich, K.; Iseman, M. D.; Heifets, L., The Potential Advantages of
Nanoparticle Drug Delivery Systems in Chemotherapy of Tuberculosis. American Journal of
Respiratory and Critical Care Medicine 2005, 172 (12), 1487-1490.
163. Pähkla, R.; Lambert, J.; Ansko, P.; Winstanley, P.; Davies, P. D. O.; Kiivet, R. A.,
Comparative bioavailability of three different preparations of rifampicin. Journal of Clinical
Pharmacy and Therapeutics 1999, 24 (3), 219-225.
164. Sensi, P., History of the development of rifampin. Reviews of infectious diseases 1983, 5
(3), 402-406.
165. Van Ingen, J.; Aarnoutse, R. E.; Donald, P. R.; Diacon, A. H.; Dawson, R.; Plemper Van
Balen, G.; Gillespie, S. H.; Boeree, M. J., Why Do We Use 600 mg of Rifampicin in
Tuberculosis Treatment? Clinical Infectious Diseases 2011, 52 (9), e194-e199.
166. Lester, W., Rifampin: A Semisynthetic Derivative of Rifamycin-A Prototype for the
Future. Annual Review of Microbiology 1972, 26 (1), 85-102.
167. Calleja, .; lanco-Pr Eto, . a. J.; uz, N.; enedo, . a. J.; Dios-Viéitez, M. a. C.,
High-performance liquid–chromatographic determination of rifampicin in plasma and tissues.
Journal of Chromatography A 2004, 1031 (1–2), 289-294.
168. Acocella, G., Pharmacokinetics and Metabolism of Rifampin in Humans. Review of
Infectious Diseases 1983, 5 (Supplement 3), S428-S432.
169. Shishoo, C. J.; Shah, S. A.; Rathod, I. S.; Savale, S. S.; Kotecha, J. S.; Shah, P. B.,
Stability of rifampicin in dissolution medium in presence of isoniazid. International Journal of
Pharmaceutics 1999, 190 (1), 109-123.
170. Panchagnula, R.; Agrawal, S., Biopharmaceutic and pharmacokinetic aspects of variable
bioavailability of rifampicin. International Journal of Pharmaceutics 2004, 271 (1-2), 1-4.
Sonal Mazumder-PhD Thesis
85
171. (a) Mathur, I. S.; Gupta, H. P.; Srivastava, S. K.; Singh, S.; Madhu, K.; Khanna, N. M.,
Evaluation of Subdermal Biodegradable Implants Incorporating Rifampicin as a Method of Drug
Delivery in Experimental Tuberculosis of Guinea Pigs. Journal of Medical Microbiology 1985,
20 (3), 387-392; (b) Rao, B. S.; Murthy, K. V. R., Studies on rifampicin release from
ethylcellulose coated nonpareil beads. International Journal of Pharmaceutics 2002, 231 (1), 97-
106; (c) Schierholz, J. M., Physico-chemical properties of a rifampicin-releasing polydimethyl-
siloxane shunt. Biomaterials 1997, 18 (8), 635-641; (d) Ammar, H. O.; Khalil, R. M.,
Preparation and Evaluation of Sustained-Release Solid Dispersions of Drugs with Eudragit
Polymers. Drug Development and Industrial Pharmacy 1997, 23 (11), 1043-1054.
172. Meyer, H.; Mally, J., Über Hydrazinderivate der Pyridincarbonsäuren. Monatshefte für
Chemie 1912, 33 (4), 393-414.
173. Ito, F.; Makino, K., Preparation and properties of monodispersed rifampicin-loaded
poly(lactide-co-glycolide) microspheres. Colloids and Surfaces B: Biointerfaces 2004, 39 (1–2),
17-21.
174. Durán, N.; Alvarenga, M. A.; Silva, E. C.; Melo, P. S.; Marcato, P. D.,
Microencapsulation of antibiotic rifampicin in poly(3-hydroxybutyrate-co-3-hydroxyvalerate).
Archives of Pharmacal Research 2008, 31 (11), 1509-1516.
175. Anisimova, Y. V.; Gelperina, S. I.; Peloquin, C. A.; Heifets, L. B., Nanoparticles as
antituberculosis drugs carriers: Effect on activity against mycobacterium tuberculosis in human
monocyte-derived macrophages. Journal of Nanoparticle Research 2000, 2 (2), 165-171.
176. Hiremath, P. S.; Saha, R. N., Oral matrix tablet formulations for concomitant controlled
release of anti-tubercular drugs: Design and in vitro evaluations. International Journal of
Pharmaceutics 2008, 362 (1–2), 118-125.
177. Gupta, K. C.; Fawzi Habeeb, J., Controlled-release formulations for hydroxy urea and
rifampicin using polyphosphate-anion-crosslinked chitosan microspheres. J Appl Polym Sci
2007, 104 (3), 1942-1956.
178. Samad, A.; Sultana, Y.; Khar, R. K.; Chuttani, K.; Mishra, A. K., Gelatin microspheres of
rifampicin cross-linked with sucrose using thermal gelation method for the treatment of
tuberculosis. Journal of Microencapsulation 2008, 26 (1), 83-89.
179. Esmaeili, F.; Hosseini-Nasr, M.; Rad-Malekshahi, M.; Samadi, N.; Atyabi, F.;
Dinarvand, R., Preparation and antibacterial activity evaluation of rifampicin-loaded poly
Sonal Mazumder-PhD Thesis
86
lactide-co-glycolide nanoparticles. Nanomedicine : nanotechnology, biology, and medicine 2007,
3 (2), 161-167.
180. Pandey, R.; Khuller, G. K., Subcutaneous nanoparticle-based antitubercular
chemotherapy in an experimental model. Journal of Antimicrobial Chemotherapy 2004, 54 (1),
266-268.
181. Pandey, R.; Khuller, G. K., Antitubercular inhaled therapy: opportunities, progress and
challenges. Journal of Antimicrobial Chemotherapy 2005, 55 (4), 430-435.
182. Pandey, R.; Sharma, A.; Zahoor, A.; Sharma, S.; Khuller, G. K.; Prasad, B., Poly (dl-
lactide-co-glycolide) nanoparticle-based inhalable sustained drug delivery system for
experimental tuberculosis. Journal of Antimicrobial Chemotherapy 2003, 52 (6), 981-986.
183. Sharma, A.; Pandey, R.; Sharma, S.; Khuller, G. K., Chemotherapeutic efficacy of poly
(dl-lactide-co-glycolide) nanoparticle encapsulated antitubercular drugs at sub-therapeutic dose
against experimental tuberculosis. International Journal of Antimicrobial Agents 2004, 24 (6),
599-604.
184. Ahmad, Z.; Pandey, R.; Sharma, S.; Khuller, G. K., Pharmacokinetic and
pharmacodynamic behaviour of antitubercular drugs encapsulated in alginate nanoparticles at
two doses. International Journal of Antimicrobial Agents 2006, 27 (5), 409-416.
185. Bala I, H. S., Kumar M.N.V.R., PLGA nanoparticles in drug delivery: The state of the
art. Crit Rev Ther Drug Carrier Syst. 2004, 21 (5), 387-422.
186. Gref, R.; Minamitake, Y.; Peracchia, M.; Trubetskoy, V.; Torchilin, V.; Langer, R.,
Biodegradable long-circulating polymeric nanospheres. Science 1994, 263 (5153), 1600-1603.
187. D’addio, S. . Tuberculosis Therapeutics: Engineering Of Nanomedicinal Systems For
Local Delivery Of Targeted Drug Cocktails. Princeton University, 2012.
188. World Helath Organization, AIDS epidemic update 2009, Retrieved from
http://data.unaids.org/pub/report/2009/jc1700_epi_update_2009_en.pdf
189. Yekkala, R. S.; Ashenafi, D.; Mariën, I.; Xin, H.; Haghedooren, E.; Hoogmartens, J.;
Adams, E., Evaluation of an International Pharmacopoeia method for the analysis of ritonavir by
liquid chromatography. Journal of Pharmaceutical and Biomedical Analysis 2008, 48 (3), 1050-
1054.
190. Rohan, R. M. a. L. C., Progress in antiretroviral drug delivery using nanotechnology. Int
J Nanomedicine 2010, 5, 533-547.
Sonal Mazumder-PhD Thesis
87
191. Holtgrave, D. R., Causes of the decline in AIDS deaths, United States, 1995–2002:
prevention, treatment or both? Int J STD AIDS 2005, 16 (12), 777-781.
192. Vyas, T. K.; Shah, L.; Amiji, M. M., Nanoparticulate drug carriers for delivery of
HIV/AIDS therapy to viral reservoir sites. Expert Opinion on Drug Delivery 2006, 3 (5), 613-
628.
193. (a) Perera, G.; Greindl, M.; Palmberger, T. F.; Bernkop-Schnürch, A., Insulin-loaded
poly(acrylic acid)-cysteine nanoparticles: Stability studies towards digestive enzymes of the
intestine. Drug Delivery 2009, 16 (5), 254-260; (b) Mallipeddi, R.; Rohan, L. C., Nanoparticle-
based vaginal drug delivery systems for HIV prevention. Expert Opinion on Drug Delivery 2010,
7 (1), 37-48.
194. (a) Sharma, P.; Garg, S., Pure drug and polymer based nanotechnologies for the improved
solubility, stability, bioavailability and targeting of anti-HIV drugs. Advanced Drug Delivery
Reviews 2010, 62 (4-5), 491-502; (b) Rao, K. S.; Ghorpade, A.; Labhasetwar, V., Targeting anti-
HIV drugs to the CNS. Expert Opinion on Drug Delivery 2009, 6 (8), 771-784.
195. Ham, A.; Cost, M.; Sassi, A.; Dezzutti, C.; Rohan, L., Targeted Delivery of PSC-
RANTES for HIV-1 Prevention using Biodegradable Nanoparticles. Pharm Res 2009, 26 (3),
502-511.
196. Takeuchi, H.; Yamamoto, H.; Kawashima, Y., Mucoadhesive nanoparticulate systems for
peptide drug delivery. Advanced Drug Delivery Reviews 2001, 47 (1), 39-54.
197. (a) Weber, N.; Ortega, P.; Clemente, M. I.; Shcharbin, D.; Bryszewska, M.; De La Mata,
F. J.; Gómez, R.; Muñoz-Fernández, M. A., Characterization of carbosilane dendrimers as
effective carriers of siRNA to HIV-infected lymphocytes. Journal of Controlled Release 2008,
132 (1), 55-64; (b) Liu, Y.; Franzen, S., Factors Determining the Efficacy of Nuclear Delivery of
Antisense Oligonucleotides by Gold Nanoparticles. Bioconjugate Chemistry 2008, 19 (5), 1009-
1016.
198. Raval, J. P.; Naik, D. R.; Amin, K. A.; Patel, P. S., Controlled-release and antibacterial
studies of doxycycline-loaded poly(ε-caprolactone) microspheres. Journal of Saudi Chemical
Society 2011, doi:10.1016/j.jscs.2011.11.004.
199. Duan, J.; Zhang, Y.; Han, S.; Chen, Y.; Li, B.; Liao, M.; Chen, W.; Deng, X.; Zhao, J.;
Huang, B., Synthesis and in vitro/in vivo anti-cancer evaluation of curcumin-loaded
Sonal Mazumder-PhD Thesis
88
chitosan/poly(butyl cyanoacrylate) nanoparticles. International Journal of Pharmaceutics 2010,
400 (1–2), 211-220.
200. Mainardes, R. M.; Evangelista, R. C., PLGA nanoparticles containing praziquantel: effect
of formulation variables on size distribution. International Journal of Pharmaceutics 2005, 290
(1–2), 137-144.
201. Siccardi, M.; Martin P.; McDonald T. O.; Liptrott, N.J.; Giardiello, M.; Rannard, S.;
Owen, A.; Research Spotlight: Nanomedicines for HIV therapy. 20th Conference on
Retroviruses and Opportunistic Infections 2013, http://www.natap.org/2013/CROI/croi_187.htm
202. Jenita, J. J. L. N. T., Madhusudhan; Wilson, B.; Vithya, T.; Premakumari, K. B.,
Formulation and characterization of ritonavir loaded polymethacrylate microspheres for oral
delivery. Journal of Pharmacy Research 2011, 4 (7), 2159.
203. Naik, D. R. R., Jignesh P., Characteristic and controlled release of antiviral drug: A
comparative study on preparative techniques and polymer affected parameter. Biointerface
Research in Applied Chemistry 2012, 2 (5), 409.
204. Lembo D, C. R., Nanoparticulate delivery systems for antiviral drugs. Antivir Chem
Chemother. 2010, 21 (2), 53-70.
205. Hari, BN. V.; Dhevendaran, K.; Narayan, N., Development of Efavirenz nanoparticle for
enhanced efficiency of anti-retroviral therapy against HIV and AIDS. BMC Infectious Diseases
2012, 12, 7.
206. Christopher J Destache, T. B., Keith Christensen, Annemarie Shibata, Akhilesh Sharma
and Alekha Dash, Combination antiretroviral drugs in PLGA nanoparticle for HIV-1. BMC
Infectious Diseases 2009, 9, 198.
207. Sinha, S.; Ali, M.; Baboota, S.; Ahuja, A.; Kumar, A.; Ali, J., Solid Dispersion as an
Approach for Bioavailability Enhancement of Poorly Water-Soluble Drug Ritonavir. AAPS
PharmSciTech 2010, 11 (2), 518-527.
208. T.Vetrichelvan , I. S. B., Formulation and in vitro characterization of Sustained release
Ritonavir nanoparticles in alginates. Journal of Pharmacy Research 2011, 4 (7), 2152.
209. Naik, D. R.; Raval, J. P., Amorphous polymeric binary blend pH-responsive
nanoparticles for dissolution enhancement of antiviral drug. Journal of Saudi Chemical Society
2012, http://dx.doi.org/10.1016/j.jscs.2012.09.020.
Sonal Mazumder-PhD Thesis
89
210. Fu, K.; Harrell, R.; Zinski, K.; Um, C.; Jaklenec, A.; Frazier, J.; Lotan, N.; Burke, P.;
Klibanov, A. M.; Langer, R., A potential approach for decreasing the burst effect of protein from
PLGA microspheres. Journal of Pharmaceutical Sciences 2003, 92 (8), 1582-1591.
211. (a) Yoo, H. S.; Oh, J. E.; Lee, K. H.; Park, T. G., Biodegradable Nanoparticles
Containing Doxorubicin-PLGA Conjugate for Sustained Release. Pharm Res 1999, 16 (7), 1114-
1118; (b) Langer, R., Drug delivery and targeting. Nature 1998, 392 (6679 Suppl), 5-10.
90
Chapter 3: Nanoparticles of rifampicin and carboxymethyl cellulose
acetate butyrate prepared by rapid precipitation
Sonal Mazumdera, Hale Cigdem Arca
a, Samantha A. Casterlow
b, Nammalwar Sriranganathan
b ,
Kevin J. Edgar c and Richey M Davis
*d
aMacromolecular Interface Institute,
bDepartment of Biomedical Sciences and Pathobiology,
cDepartment of Sustainable Biomaterials, d
Department of Chemical Engineering
Virginia Polytechnic Institute and State University, Blacksburg, VA 24061, USA
*Corresponding author:
Richey M. Davis
Department of Chemical Engineering, VirginiaTech, Blacksburg, VA - 24061
Tel: 001+ 540-231-4578 ; Fax : 001+ 540-231-5022
E-mail address: [email protected]
ABSTRACT
Nanoparticles made up of antibiotic rifampicin and carboxymethyl cellulose acetate
butyrate (CMCAB) were produced by a rapid precipitation process. The particle formation
process and particle properties were investigated. Two different particle purification and
recovery methods were investigated – flocculation with acids and dialysis followed by freeze
drying. Particle diameters as measured by dynamic light scattering were in the range 150-400 nm
and depended upon the purification method used. The particles processed by flocculating with
acids were larger with diameters ~300-400 nm measured by dynamic light scattering whereas
particles processed by dialysis followed by freeze drying were smaller with diameters
approximately 150-200 nm with lower polydispersity indices. Rifampicin drug loading ranged
91
from 3-16 wt% and the corresponding drug loading efficiencies ranged from 12-45% depending
on the particle recovery/processing methods. The MTS cytotoxicity assay showed no significant
reduction in cell viability by the nanoparticles. The minimum inhibitory concentration results
obtained with M. smegmatis for the rifampicin-containing nanoparticles indicated that the
biological activity of rifampicin was well preserved after CMCAB nanoparticle formation.
Keywords: Rifampicin, carboxymethyl cellulose acetate butyrate, nanoparticles, flash
nanoprecipitation, flocculation, multi-inlet vortex mixer, cell viability
92
3.1. INTRODUCTION
Every year almost 2 million deaths and eight million new cases caused by Tuberculosis
(TB) are reported. Despite of available remedies, TB is a prominent disease in many progressive
countries. The treatment of TB requires frequent dosing with multiple drugs and thus it is
important to formulate drugs so that they can be released in a sustained manner, reducing the
frequency and number of doses 2. Rifampicin is a first-line drug recommended by WHO for the
treatment of tuberculosis. It is slightly soluble in water (2.5 mg/ml at pH 7.3) and degrades at
low pH 3. It has suboptimal oral bioavailability, especially for the preferred, multidrug dosage
form. The usual dosage of rifampicin in an adult is 10 mg/kg, or 600 mg for a 60 kg person daily
orally or intravenously 4. Due to bioavailability limitations, this relatively high dose of the drug
is required to maintain therapeutic concentrations which may lead to several side effects such as
hives, facial swelling, and breathing difficulty. Due to its high cost and side effects, rifampicin is
used mainly in intermittent therapy. Its biological half-life ranges from 1.5-5 hours. There is a
need for formulations that release rifampicin in a sustained manner and enhance bioavailability,
thereby creating the potential for enhanced patient convenience and adherence, and reduced drug
expense, side effects, and interpatient and chronological variability. Polymer encapsulated drug
nanoparticles have been investigated for many applications due to the improved material
properties that result from a reduction in particle dimensions and due to the potential for targeted
drug delivery 5. Oral administration of therapeutic agents represents the easiest and most
convenient mode of drug delivery, especially in cases of chronic treatment, since there is no
requirement for hospitalization, a critical issue in developing countries. In addition, patient
compliance in taking oral medications tends to be greater than with injected formulations 6.
However, it is challenging to design delivery systems for the gastrointestinal (GI) tract to obtain
93
desired pharmacokinetics 7. Several factors can limit the bioavailability of drugs from the GI
tract including aqueous solubility, ability to permeate through the lipid bilayer membranes of the
enterocytes that line the GI tract, and active processes such as efflux transport and metabolism.
Dissolution of drugs is frequently the rate-limiting step which controls bioavailability 8.
Sustained release formulations can lead to improved bioavailability, less frequent dosing, and
reduced undesirable side effects 9.
Prior work with rifampicin-polymer particles can be broadly categorized in terms of
studies done in vitro with microparticles 10,11,12,13
, in vitro with nanoparticles 14,15
, and in vivo,
with the latter studies further categorized in terms of delivery method, i.e. by injection 16
,
pulmonary delivery 17,18
and oral delivery19,20,21
. Most studies involved polymeric carriers, either
polyesters or polysaccharides. Many of the studies focused on controlling drug loading and
characterizing drug release but, in many cases, the method of producing the particles was not
rapid and scalable.
Flash nanoprecipitation is a nanoparticle fabrication method that is rapid and scalable in
which an organic solution of a polymer (typically an amphiphilic block copolymer) and organic
species (typically poorly water-soluble drugs and hydrophobically-modified particles) is rapidly
mixed with a non-solvent such as water under highly turbulent conditions in a confined mixing
chamber 22,23,24
. This turbulent mixing forms a highly supersaturated solution which undergoes
particle nucleation and growth. Particle growth stops due to the formation of a repulsive barrier
on the particle surface. When amphiphilic copolymers are used, that barrier typically consists of
poly(ethylene oxide) chains that form a brush-like structure on the nanoparticle surfaces. The
supersaturation depends on the water/organic solvent ratio injected into the mixer, the
concentrations of the drugs and polymers, and temperature. This process is attractive in that the
94
particle size distributions can be controlled 25, 26
and high concentrations of hydrophobic organic
species can be incorporated due to kinetic entrapment in the cores 27,28,29
. Flash nanoprecipitation
has been used with a four-jet multi-inlet vortex mixer (MIVM) to produce nanoparticles with
high loadings of drugs and imaging agents and with controlled surface chemistries 30,31, 32,33,34
.
Rifampicin has been incorporated into poly(ε-caprolactone) nanoparticles in the size
range 100-200 nm using flash nanoprecipitation. Due to rifampicin’s solubility in water, it was
necessary to first make an insoluble pro-drug form by conjugating it with Vitamin E succinate
and with poly(ε-caprolactone) which is biodegradable. The resulting pro-drugs were then co-
precipitated with diblock copolymers of poly(ethylene oxide-b-ε-caprolactone) at loadings of
14.5 wt % of rifampicin. Hydrolytic cleavage of the linking group provided a mechanism for the
sustained release of rifampicin35
. There has been no other work published to our knowledge on
preparation of rifampicin-loaded polymer nanoparticles using the MIVM.
Pandey et al.,19
developed PLGA particles loaded with rifampicin as well as isoniazid and
pyrazinamide. The drug loading efficiency of the microparticles was 8-18% and the mean
particle size was ~ 2 µm. The microparticles containing rifampicin showed higher therapeutic
concentration in plasma compared to free drug. However, these microparticles suffered from
several drawbacks such as a low drug encapsulation, high polymer consumption, and a partial
therapeutic benefit. When nanoparticles were dosed (5 oral doses every 10th
day) compared to 46
daily doses of free drugs, there was complete clearance of TB from the organs of infected mice.
Nanoparticles ranging in size from 186-290 nm (PDI =0.38 ± 0.04) and drug loading efficiency
57-68% showed similar results when tested in guinea pigs with equivalent amount of drug
(rifampicin 12 mg/kg + isoniazid 10 mg/kg + pyrazinamide 25 mg/kg body weight) 20
. It was
also observed that sustained drug release could be achieved in the plasma (5–12 days) with the
95
nanoparticles compared to the microparticles (3–4 days) of equivalent dose. At a 2/3rd
therapeutic dosage of nanoparticles, the drug remained in the plasma (at therapeutically useful
levels) for 7, 12 and 11 days for rifampicin, isoniazid and pyrazinamide, respectively.
Zahroor et al. prepared alginate nanoparticles (235 nm diameter) of anti-TB drugs
(rifampicin, isoniazid, pyrazinamide and ethambutol) using controlled cation-induced gelation of
alginate. The drug loading efficiency for rifampicin was 80-90%. When the nanoparticles were
administered orally to mice, ethambutol, rifampicin, isoniazid and pyrazinamide levels were
detected in plasma above the MIC and therapeutic level up to 7,9,11 and 11 days, respectively
(free drugs were cleared within 12 to 24 h from the blood but were detectable in tissues (e.g.
spleen, liver and lung) for more than one day). The drug levels were detectable in tissues above
the MIC (minimum inhibitory concentration) up to 15 days 21
. This work is notable as it is one of
the first detailed studies showing that orally-administered nanoparticles can cross the GI-
epithelium and enter the circulation in therapeutically useful levels.
Amorphous solid dispersions (ASD) are formed when the drug forms a molecular
dispersion in an amorphous polymer matrix. Due to the lack of an ordered molecular lattice, the
energy required for a molecule to go from the amorphous state to the solvated state is lower than
the energy required for the corresponding transition from the crystalline state and this increases
the bioavailability of the drug 36
. The most important polymer properties required for amorphous
matrix formulations are that they: (1) must be non-toxic and miscible at least in part with the
(often hydrophobic) drug, (2) must possess a high glass transition temperature (in order to inhibit
drug recrystallization in and migration through the matrix), and (3) must not itself have a
tendency to crystallize since it is important for the ASD to be stable during transport and
extended storage. There are relatively few ASDs available commercially due to the
96
thermodynamic instability of drugs in the amorphous form. Several synthetic polymers like
polyethylene glycol (PEG) and polyvinyl pyrrolidone (PVP) have been used for preparing
amorphous dispersions. PEG has high water solubility and has a tendency to crystallize37
, while
PVP is hygroscopic, dissolves fast at low pH, very water soluble and doesn’t always prevent
solution crystallization38
. Several polysaccharides (HPMC, HPMCAS, chitosan) have shown
promising results in forming amorphous drugs and improving dissolution and stability 39
.
There are few studies in the literature regarding nanoparticles of amorphous solid
dispersions. Improvement in the oral bioavailability of sirolimus - an immunosuppresent drug
used to prevent rejection in organ transplantation - was observed when ASDs of sirolimus-
polyvinylpyrrolidone (PVP) K30 nanoparticles (mean particle size 250 nm) were prepared using
a supercritical antisolvent (SAS) process 40
.
The high surface area of amorphous hydroxypropylmethylcellulose (HPMC) and
itraconazole (ITZ) nanoparticles (particle size 200-600 nm) prepared by controlled precipitation
showed rapid and higher supersaturation compared to low surface area solid dispersions41
.
A wet milling technique was used to prepare nanosized ASDs of Nobiletin (NOB) 42
. The
diameter of the nanoparticles was 270 nm, and there was a significant improvement in the
dissolution behavior compared with that of crystalline NOB.
ASDs of indomethacin (IM) and PVP prepared by co-grinding were compared with those
between IM and silica nanoparticles. The sizes of the particles were not mentioned. The results
showed that the solubility was solely dependent on the state of IM, irrespective of the carrier
species and carrier-dependent chemical interactions 43
In this present work, we made rifampicin-containing nanoparticles using carboxymethyl
cellulose acetate butyrate (CMCAB), a cellulose ester that was developed relatively recently.
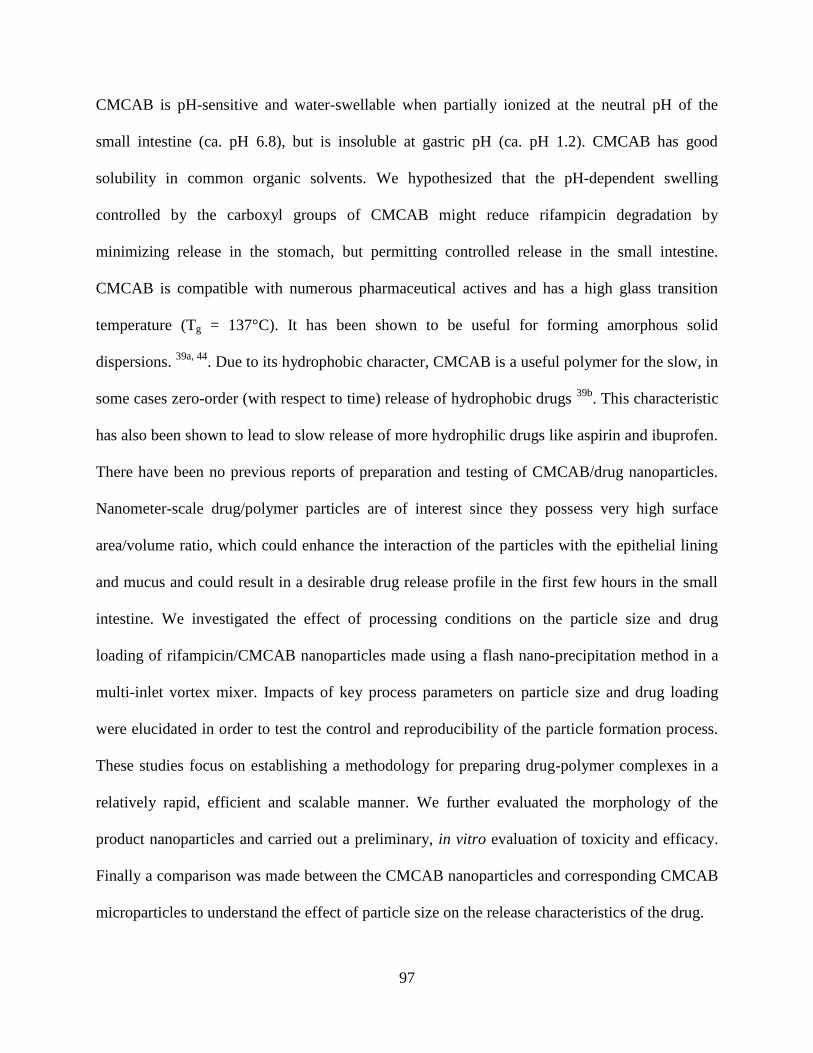
97
CMCAB is pH-sensitive and water-swellable when partially ionized at the neutral pH of the
small intestine (ca. pH 6.8), but is insoluble at gastric pH (ca. pH 1.2). CMCAB has good
solubility in common organic solvents. We hypothesized that the pH-dependent swelling
controlled by the carboxyl groups of CMCAB might reduce rifampicin degradation by
minimizing release in the stomach, but permitting controlled release in the small intestine.
CMCAB is compatible with numerous pharmaceutical actives and has a high glass transition
temperature (Tg = 137°C). It has been shown to be useful for forming amorphous solid
dispersions. 39a, 44
. Due to its hydrophobic character, CMCAB is a useful polymer for the slow, in
some cases zero-order (with respect to time) release of hydrophobic drugs 39b
. This characteristic
has also been shown to lead to slow release of more hydrophilic drugs like aspirin and ibuprofen.
There have been no previous reports of preparation and testing of CMCAB/drug nanoparticles.
Nanometer-scale drug/polymer particles are of interest since they possess very high surface
area/volume ratio, which could enhance the interaction of the particles with the epithelial lining
and mucus and could result in a desirable drug release profile in the first few hours in the small
intestine. We investigated the effect of processing conditions on the particle size and drug
loading of rifampicin/CMCAB nanoparticles made using a flash nano-precipitation method in a
multi-inlet vortex mixer. Impacts of key process parameters on particle size and drug loading
were elucidated in order to test the control and reproducibility of the particle formation process.
These studies focus on establishing a methodology for preparing drug-polymer complexes in a
relatively rapid, efficient and scalable manner. We further evaluated the morphology of the
product nanoparticles and carried out a preliminary, in vitro evaluation of toxicity and efficacy.
Finally a comparison was made between the CMCAB nanoparticles and corresponding CMCAB
microparticles to understand the effect of particle size on the release characteristics of the drug.
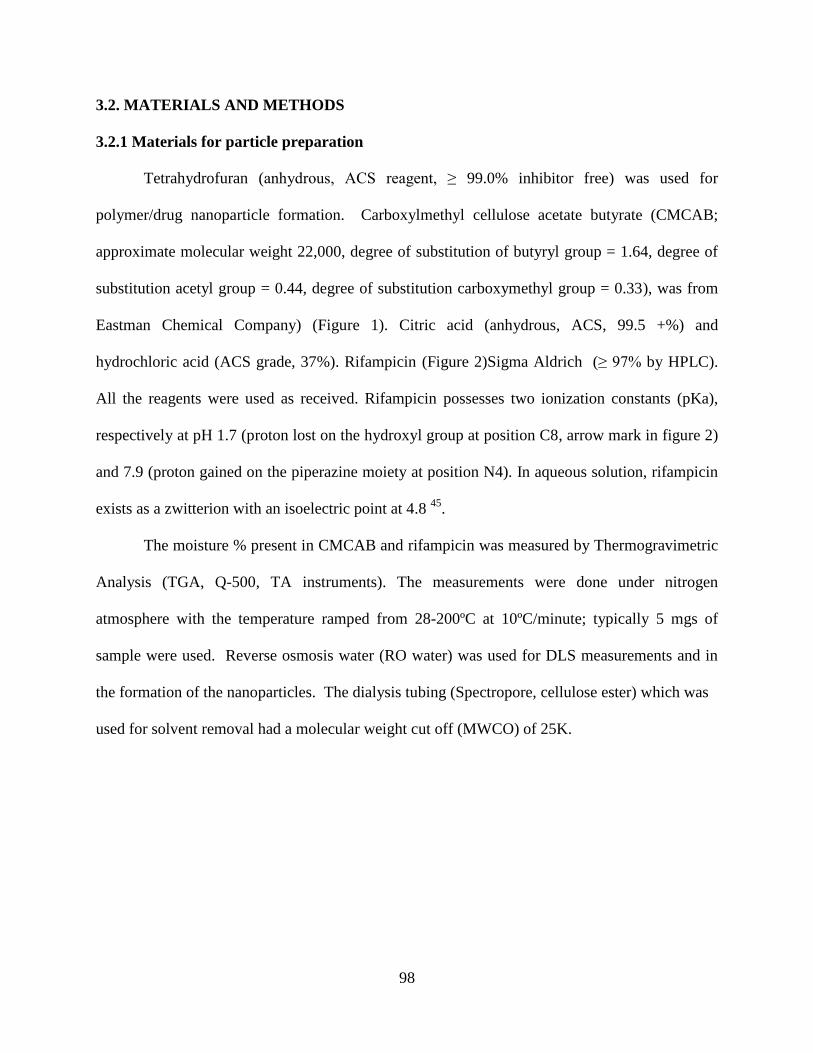
98
3.2. MATERIALS AND METHODS
3.2.1 Materials for particle preparation
Tetrahydrofuran (anhydrous, ACS reagent, ≥ 99.0% inhibitor free) was used for
polymer/drug nanoparticle formation. Carboxylmethyl cellulose acetate butyrate (CMCAB;
approximate molecular weight 22,000, degree of substitution of butyryl group = 1.64, degree of
substitution acetyl group = 0.44, degree of substitution carboxymethyl group = 0.33), was from
Eastman Chemical Company) (Figure 1). Citric acid (anhydrous, ACS, 99.5 +%) and
hydrochloric acid (ACS grade, 37%). Rifampicin (Figure 2)Sigma Aldrich (≥ 97% by HPLC).
All the reagents were used as received. Rifampicin possesses two ionization constants (pKa),
respectively at pH 1.7 (proton lost on the hydroxyl group at position C8, arrow mark in figure 2)
and 7.9 (proton gained on the piperazine moiety at position N4). In aqueous solution, rifampicin
exists as a zwitterion with an isoelectric point at 4.8 45
.
The moisture % present in CMCAB and rifampicin was measured by Thermogravimetric
Analysis (TGA, Q-500, TA instruments). The measurements were done under nitrogen
atmosphere with the temperature ramped from 28-200ºC at 10ºC/minute; typically 5 mgs of
sample were used. Reverse osmosis water (RO water) was used for DLS measurements and in
the formation of the nanoparticles. The dialysis tubing (Spectropore, cellulose ester) which was
used for solvent removal had a molecular weight cut off (MWCO) of 25K.
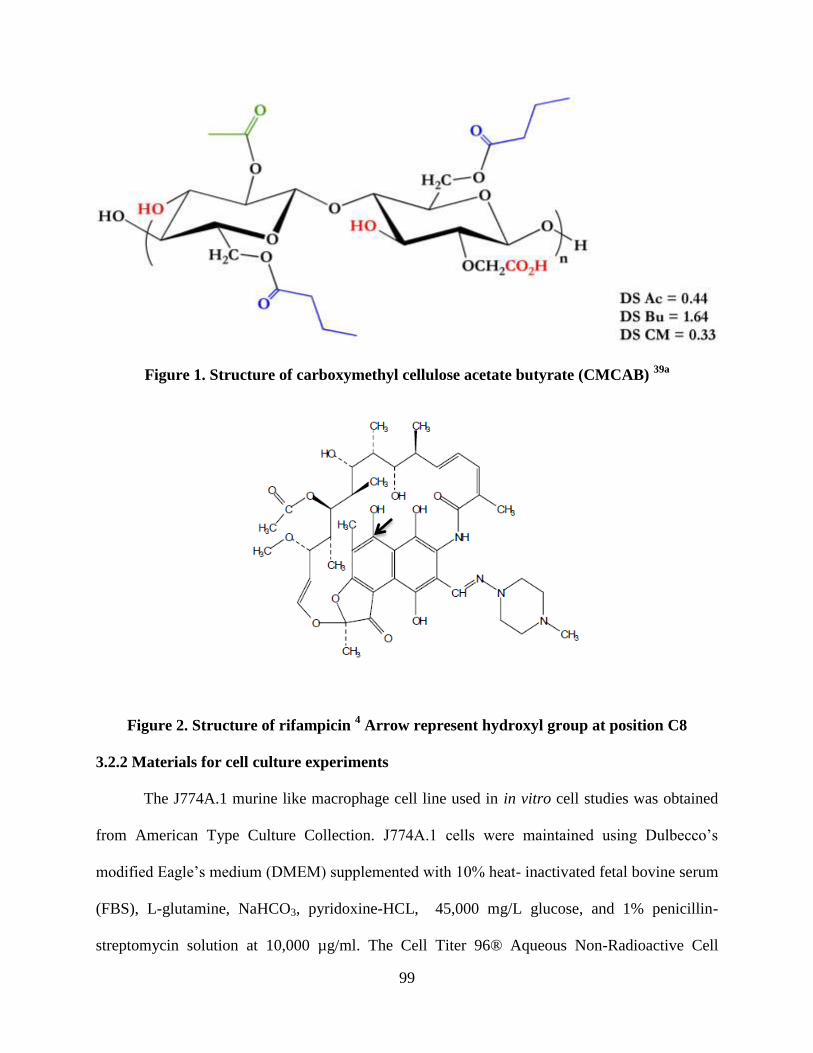
99
Figure 1. Structure of carboxymethyl cellulose acetate butyrate (CMCAB) 39a
Figure 2. Structure of rifampicin 4 Arrow represent hydroxyl group at position C8
3.2.2 Materials for cell culture experiments
The J774A.1 murine like macrophage cell line used in in vitro cell studies was obtained
from American Type Culture Collection. J774A.1 cells were maintained using Dulbecco’s
modified Eagle’s medium (DMEM) supplemented with 10% heat- inactivated fetal bovine serum
(FBS), L-glutamine, NaHCO3, pyridoxine-HCL, 45,000 mg/L glucose, and 1% penicillin-
streptomycin solution at 10,000 µg/ml. The Cell Titer 96® Aqueous Non-Radioactive Cell
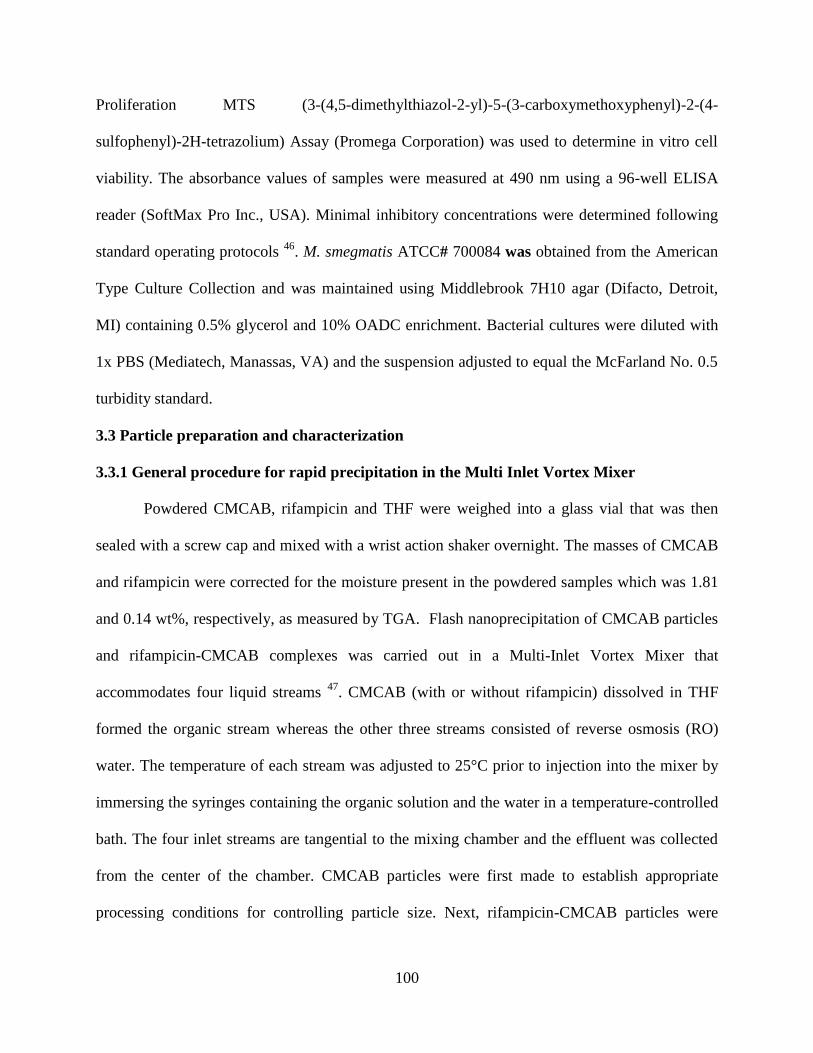
100
Proliferation MTS (3-(4,5-dimethylthiazol-2-yl)-5-(3-carboxymethoxyphenyl)-2-(4-
sulfophenyl)-2H-tetrazolium) Assay (Promega Corporation) was used to determine in vitro cell
viability. The absorbance values of samples were measured at 490 nm using a 96-well ELISA
reader (SoftMax Pro Inc., USA). Minimal inhibitory concentrations were determined following
standard operating protocols 46
. M. smegmatis ATCC# 700084 was obtained from the American
Type Culture Collection and was maintained using Middlebrook 7H10 agar (Difacto, Detroit,
MI) containing 0.5% glycerol and 10% OADC enrichment. Bacterial cultures were diluted with
1x PBS (Mediatech, Manassas, VA) and the suspension adjusted to equal the McFarland No. 0.5
turbidity standard.
3.3 Particle preparation and characterization
3.3.1 General procedure for rapid precipitation in the Multi Inlet Vortex Mixer
Powdered CMCAB, rifampicin and THF were weighed into a glass vial that was then
sealed with a screw cap and mixed with a wrist action shaker overnight. The masses of CMCAB
and rifampicin were corrected for the moisture present in the powdered samples which was 1.81
and 0.14 wt%, respectively, as measured by TGA. Flash nanoprecipitation of CMCAB particles
and rifampicin-CMCAB complexes was carried out in a Multi-Inlet Vortex Mixer that
accommodates four liquid streams 47
. CMCAB (with or without rifampicin) dissolved in THF
formed the organic stream whereas the other three streams consisted of reverse osmosis (RO)
water. The temperature of each stream was adjusted to 25°C prior to injection into the mixer by
immersing the syringes containing the organic solution and the water in a temperature-controlled
bath. The four inlet streams are tangential to the mixing chamber and the effluent was collected
from the center of the chamber. CMCAB particles were first made to establish appropriate
processing conditions for controlling particle size. Next, rifampicin-CMCAB particles were
101
made based on those processing conditions. The nanoparticles were formed at a Reynolds
number of ~ 3900. The Reynolds number is a dimensionless number that is a measure of
turbulence and, in this case, of mixing time. It depends upon the inlet stream velocities,
viscosities, and densities 47
, 23
. The defining equations for the Reynolds number in the mixer are
shown in the Supporting Information.
A New Era 4000 double syringe pump (for the organic stream) and a Harvard Apparatus
Remote Infuse/Withdraw PHD 4000 Hpsi Programmable syringe pump (for the three water
streams) controlled the inlet flow rates. The New Era pump was controlled with the software
Syringe Pump Pro version 1.53. The injected volume ratio of THF to RO water was 1:9 v/v. The
target composition of rifampicin was 25 wt% of the total solids on a dry basis.
3.3.2 Particle purification and recovery
Since the particles exit from the MIVM in a mixed THF-water phase, it was necessary to
remove the solvent and unincorporated drug from the particles before they can be used in
biological studies. Two purification methods were investigated to learn how they affected drug
loading and particle size. First, acid-induced flocculation followed by vacuum filtration and
drying was used. Second, dialysis followed by freeze drying was investigated as an alternative
processing route.
Particle flocculation followed by vacuum drying was previously shown to be an effective
method for quickly purifying and recovering dry particles that could be redispersed. Citric acid
was used to flocculate nanoparticles coated with steric stabilizing layers of poly(ethylene oxide)
and multivalent citric acid 48
. The resulting precipitate was recovered by vacuum filtration. We
investigated the use of both citric acid and HCl as flocculating agents. Suspensions of pure
CMCAB particles as well as rifampicin-CMCAB particles prepared in the mixer were divided
102
into two parts. The first part was used in the flocculation step without removing THF, while in
the second part, some of the THF was removed by rotary evaporation in a Buchi Rotavaporator
210/215 at 40°C under vacuum for 45 minutes before the flocculation step. Rotary evaporation
was done to inhibit drug leaching out from the particles due to the presence of THF. In a typical
experiment, the mass of the suspension collected from the mixer was measured and then
powdered citric acid was added to the suspension at a concentration of ~ 1 wt%. The suspension
was stirred for 10 mins by a magnetic stirrer and the pH was measured as ~2.0 using a pH meter.
The time required for significant flocculation to occur was noted by visual inspection. The
nanoparticle suspensions with citric acid and HCl were passed through a Nalgene vacuum filter
with a polycarbonate membrane (Millipore, 1.2 μm) followed by washing with 1% citric acid
solution and 1% dilute HCl solution, respectively. The wet cake collected on the membrane was
placed in aluminum drying pans and dried under vacuum at room temperature for 5-6 hours. The
dried samples were stored in sealed, screw cap glass vials and stored in the dark at room
temperature. The % moisture of the dry powder was measured using TGA. The above
experiment was done three times to quantitate the reproducibility in particle size and drug
loading. Similar precipitation experiments were done with dilute hydrochloric acid also at pH~2.
Particle purification and recovery was also studied using dialysis followed by freeze
drying. Pure CMCAB and rifampicin-CMCAB suspensions were dialyzed to remove THF, free
drug, and dissolved polymer. The dialysis was done with 35 mL of the suspension using dialysis
tubing with a molecular weight cutoff (MWCO) of 25K. In a typical experiment, 3.5 L of DI
water was used in a beaker and the water was changed 4 times over a period of 24 hours. The
dialyzed particles were dried in a LABCONCO freeze dryer at 0.018 mbar for 2 days.
103
3.3.3 Microparticle preparation and characterization
Since particle size could have significant effects on drug release, we compared the drug
release properties of the nanoparticles with microparticles made using a spray drying process.
CMCAB totaling 0.5 g was suspended in 50 ml of THF and mixed by magnetic stir bar for 16 -
18 hours at room temperature. After mixing, 0.05 g of rifampicin were added to the polymer
solution and was mixed for 10 minutes. The mixture was then pumped into a Buchi B-290 spray
dryer (Buchi, Newcastle, Delaware). The spray dryer conditions were programmed with an inlet
and outlet temperature of 90°C (to insure solvent evaporation), aspirator chamber at 100%
efficiency and pump pressure at 40% for optimal drying and isolation of homogeneous particles.
Dried powders were obtained and used for further analysis.
3.3.4 Re-dispersion of dried nanoparticles
The dried powders of the nanoparticles from the flocculation step were re-dispersed in DI
water and 50 μl of 0.1 N sodium hydroxide was added to adjust the solution to pH ~ 7.0, thus
ionizing the carboxylic acid groups which would disrupt any hydrogen bonding between NPs
and acids and also increase repulsive electrostatic forces. These particles were sonicated with a
probe tip sonicator for 3 minutes. The freeze dried powders purified by dialysis were dispersed in
DI water and mixed in a wrist action shaker for 15 minutes.
3.3.5 Particle size – Dynamic light scattering
Dynamic light scattering (DLS) measurements were performed before and after the rotary
evaporation and dialysis steps using a Malvern Zetasizer Nano-ZS (Malvern Instruments Ltd,
Malvern, UK) at a wavelength of 633 nm and with a scattering angle of 173˚ at 25 ± 0.1 ºC.
Typically 200 μl of the nanoparticle suspension diluted with 2 mL of deionized water The
suspensions were sonicated with a Tekmar TM 300 probe tip sonicator equipped with a microtip
104
at a power setting = 4 and duty cycle = 60% for 30 seconds and then filtered with a 1 μm PTFE
filter (Whatman, USA). Intensity average diameters were obtained by calculations using
Malvern’s Zetasizer Nano-ZS V 6.12, software that utilizes an algorithm based upon Mie theory
with the assumption that the scattering particles are hard spheres 49
.
Field emission scanning electron microscope (FESEM) images of the microparticles were
obtained using a LEO (Zeiss) 1550 instrument at a 5 kV accelerating voltage in the conventional
high vacuum mode.
The spray dried particles were bath sonicated at 0.1 mg/ml in DI water. About 100 μl of
each prepared sample was placed on imaging tape and allowed to dry at room temperature
overnight. Samples for SEM were mounted on metal stubs and coated with gold prior to analysis.
3.3.6 Particle morphology – X ray diffraction
The crystallinity properties of nanoparticles and microparticles were evaluated by powder
X-ray diffraction (PXRD). PXRD experiments were conducted with samples of the CMCAB (as
received), rifampicin (as received), physical mixtures of the as-received CMCAB and rifampicin
(mixed by grinding with a mortar and pestle) and the nanoparticles. PXRD patterns were
obtained using a Bruker D8 Discover X-ray Diffraction system (Madison, Wisconsin) which
emits Kα radiation (λ = 1.54 Aº) at 2200 watts and an accelerating potential of 60 kV. The
divergence and scattering slits were set at 1.0° and the receiving slit was set at 0.1 mm. The
experiment was conducted with a scan range from 10° - 40° 2θ, while the scanning speed was
4°/min.
3.3.7 Drug loading
In order to measure the drug loading of the nanoparticles and microparticles, a calibration
curve for the rifampicin dissolved in acetonitrile was developed using a UV–Visible
105
spectrophotometer (Thermo Scientific, Evolution 300) at a wavelength of 475 nm where the
absorbance was a maximum (Figure S.1 in Supporting Information). The resulting equation for
the calibration curve of rifampicin in acetonitrile was:
Absorbance at 475 nm = 0.0153Crif + 0.0096 [1]
where R² = 0.9999.
3.3.8 Drug Release studies
Typically, an amount equivalent to 1 mg drug (free drug, nanoparticles or microparticles)
was dispersed in 80 mL potassium phosphate buffer, pH 6.8 or pH 1.2 buffer for 6 hours at 37°C.
The apparatus used in the release experiments consisted of 250-mL jacketed flasks with
circulating ethylene glycol/water (1:1) to control the temperature. The solution was constantly
stirred at 350 rpm with a magnetic bar. Aliquots (1 mL) were withdrawn from the suspensions
every 0.5 h (during the first 2 h), then every hour for 6 h. Phosphate buffer (1 mL) was added to
maintain constant volume after each aliquot was withdrawn. The supernatant was separated from
excess solid in solution by ultracentrifugation at 13000 rpm (equivalent of 16060 g’s) in an
accuSpin Micro (Fisher Scientific) for 10 minutes. The supernatant was recovered, and the
solution concentration was determined by a high-performance liquid chromatography (HPLC)
system. The solubility studies were done approximately 2 weeks after the preparation of the
particles.
Drug release was measured using an Agilent 1200 Series HPLC system which consisted
of a quaternary pump, online degasser, manual injector with a 20 μL sample loop and Agilent
chemstation LC 3D software. Chromatography was conducted in reverse mode using an 50/50
(v/v) acetonitrile and phosphate buffer 0.01 M pH 2.3. The total analysis time was 8 min. The
mobile phase was delivered at a flow rate of 1.5 mL/min and the column temperature was
106
maintained at 30oC. The sample injection volume was 5 µL. Detection was performed by a diode
array detector at a wavelength of 254 nm for rifampicin. A calibration curve for the rifampicin
dissolved in acetonitrile was developed using at a wavelength of 254 nm (Figure S.2 in
Supporting Information).
3.3.9 Cell Culture Experiments
Initial concentrations of free drug and rifampicin nanoparticle formulations were
prepared at 1 mg/mL concentration by weight in PBS. Serial dilutions were done to obtain
concentrations ranging from 0.244-500 µg/mL of rifampicin. The amount of biologically active
rifampicin loaded in the nanoparticles was determined by comparing the MIC results to those of
the free drug.
Murine macrophage like cell line J774A.1 was maintained in Dulbecco’s modified
Eagle’s medium (DMEM) supplemented with 10% heat- inactivated fetal bovine serum (FBS),
L-glutamine, NaHCO3, pyridoxine-HCl, 45,000 mg/L glucose, and 1% penicillin-streptomycin
solution at 10,000 µg/mL. Approximately 2 x 10⁴ cells were incubated for 24-36 hours at 37°C
in 5% CO2 atmosphere until ~90% confluency was achieved. After confluency was achieved, the
cell culture medium was removed; the cells were gently washed with phosphate –buffered saline
solution (PBS) and fresh medium containing DMEM supplemented with 1% heat- inactivated
fetal bovine serum. Cell Titer 96® Aqueous Non-Radioactive Cell Proliferation MTS was
performed using procedures described in the Supplemental Information section.
M. smegmatis ATCC# 700084 was grown using Middlebrook 7H10 agar (Difacto,
Detroit, MI) containing 0.5% glycerol and 10% OADC enrichment. The bacterial cultures were
diluted in 1x PBS (Mediatech, Manassas, VA), the suspension adjusted to equal the McFarland
No. 0.5 turbidity standard, and 0.02 mL aliquots were transferred to each well of the 96-well
107
round bottom plate that contained 0.1 mL of Middlebrook 7H9 broth (Difacto, Detroit, MI) and
0.1 mL of each particle formulations and free drug at 2-fold serial dilutions in PBS ranging from
500 μg/mL to 7.81 μg/mL. The inoculated plates were incubated at 37°C for 48 hrs and the
minimum inhibitory concentration (MIC) was defined as the lowest concentration of compound
that inhibited visible growth.
3.4. RESULTS AND DISCUSSION
We first investigated the effect of injected CMCAB concentration on particle formation
to find the highest concentration at which well-defined particles were formed. This was done to
optimize particle processing. We then investigated how different particle processing schemes
affected particle properties, notably particle size and rifampicin loading. These processing
approaches included (i) particle flocculation and recovery by filtration and vacuum drying, and
(ii) particle recovery by dialysis and freeze drying. Next, the effect of the processing conditions
on the drug loading was studied. Drug release studies were conducted with rifampicin
nanoparticles and were compared to rifampicin microparticles of equivalent drug loading.
Finally, the minimum inhibitory concentration (MIC) was investigated and the cell toxicity of the
nanoparticles was characterized.
This is the first study for preparing nanoparticles of rifampicin and CMCAB by flash
nanoprecipitation. We explored the processing conditions on particle size and size distribution.
However, due to the need for using mixtures of solvent and water, this poses a problem for
particle isolation and purification because the drug is soluble in both water and THF. Thus we
explored two distinct approaches for purifying and recovery of particles to see how they effect
particle size and drug loading. We hypothesized that due to the pH sensitivity of CMCAB, there
108
would be a greater drug release at higher pH compared to the low pH found in the stomach, thus
providing protection of rifampicin in stomach.
3.4.1 Determination of optimal CMCAB polymer concentration
The concentration of CMCAB in the mixer was varied to find the highest concentration at
which particles with well-defined size distributions were formed. This was done to minimize the
amount of solvent removal and the particle purification time. Solutions of CMCAB dissolved in
THF at three concentrations - 5, 10, and 15 mg/mL - were injected into the mixer at a constant
THF:water ratio of 1:9 v/v and 25ºC. These corresponded to CMCAB concentrations in the
mixer of 0.45, 0.91, and 1.36 mg/mL assuming that there was no volume change upon mixing of
the THF and water streams. Solutions with a concentration of 5 mg/mL resulted in dispersions
with polydispersity index (PDI, measured by dynamic light scattering) 0.2 (Table 1). Particles
made with a CMCAB concentration of 15 mg/ml were very polydisperse and there were multiple
peaks in the correlogram. However, particles made with a CMCAB concentration of 10 mg/ml
had PDI = 0.2. Thus, particles made in the rest of this study were made with an injected CMCAB
concentration of 10 mg/mL. These results demonstrate that, unlike many previous particle
systems made by flash nanoprecipitation, nanoparticles of CMCAB with reasonably well-defined
particle size distributions can be formed in the multi-inlet vortex mixer without the need for an
amphiphilic block copolymer to sterically stabilize them. We hypothesize that the surface of the
CMCAB nanoparticles consists at least in part of mobile, hydrated chains that provide a
repulsive potential energy that arrests particle growth, probably by a combination of steric and
electrostatic interactions.
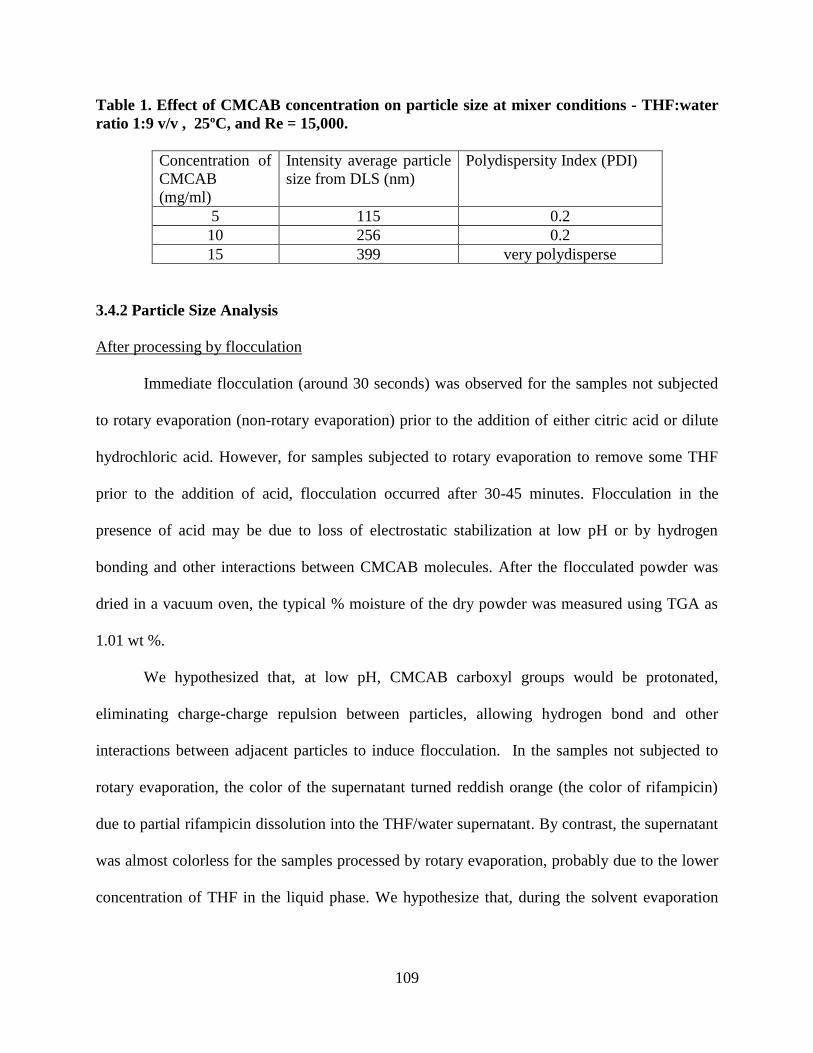
109
Table 1. Effect of CMCAB concentration on particle size at mixer conditions - THF:water
ratio 1:9 v/v , 25ºC, and Re = 15,000.
Concentration of
CMCAB
(mg/ml)
Intensity average particle
size from DLS (nm)
Polydispersity Index (PDI)
5 115 0.2
10 256 0.2
15 399 very polydisperse
3.4.2 Particle Size Analysis
After processing by flocculation
Immediate flocculation (around 30 seconds) was observed for the samples not subjected
to rotary evaporation (non-rotary evaporation) prior to the addition of either citric acid or dilute
hydrochloric acid. However, for samples subjected to rotary evaporation to remove some THF
prior to the addition of acid, flocculation occurred after 30-45 minutes. Flocculation in the
presence of acid may be due to loss of electrostatic stabilization at low pH or by hydrogen
bonding and other interactions between CMCAB molecules. After the flocculated powder was
dried in a vacuum oven, the typical % moisture of the dry powder was measured using TGA as
1.01 wt %.
We hypothesized that, at low pH, CMCAB carboxyl groups would be protonated,
eliminating charge-charge repulsion between particles, allowing hydrogen bond and other
interactions between adjacent particles to induce flocculation. In the samples not subjected to
rotary evaporation, the color of the supernatant turned reddish orange (the color of rifampicin)
due to partial rifampicin dissolution into the THF/water supernatant. By contrast, the supernatant
was almost colorless for the samples processed by rotary evaporation, probably due to the lower
concentration of THF in the liquid phase. We hypothesize that, during the solvent evaporation
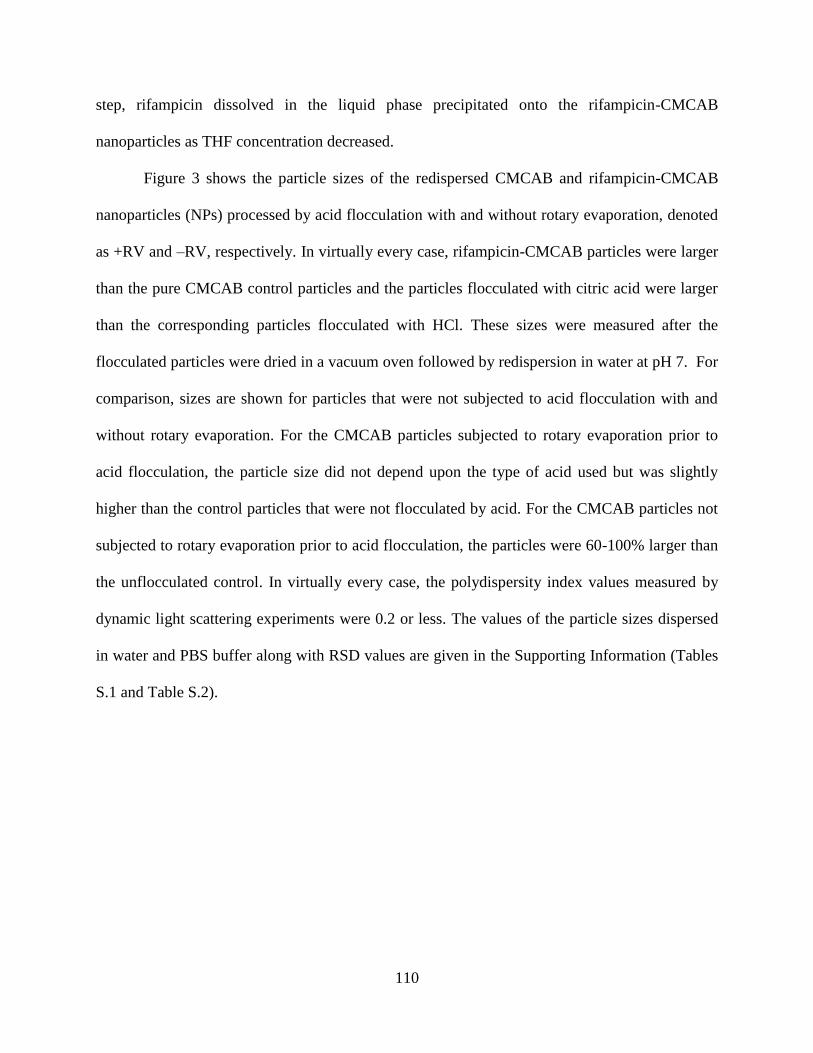
110
step, rifampicin dissolved in the liquid phase precipitated onto the rifampicin-CMCAB
nanoparticles as THF concentration decreased.
Figure 3 shows the particle sizes of the redispersed CMCAB and rifampicin-CMCAB
nanoparticles (NPs) processed by acid flocculation with and without rotary evaporation, denoted
as +RV and –RV, respectively. In virtually every case, rifampicin-CMCAB particles were larger
than the pure CMCAB control particles and the particles flocculated with citric acid were larger
than the corresponding particles flocculated with HCl. These sizes were measured after the
flocculated particles were dried in a vacuum oven followed by redispersion in water at pH 7. For
comparison, sizes are shown for particles that were not subjected to acid flocculation with and
without rotary evaporation. For the CMCAB particles subjected to rotary evaporation prior to
acid flocculation, the particle size did not depend upon the type of acid used but was slightly
higher than the control particles that were not flocculated by acid. For the CMCAB particles not
subjected to rotary evaporation prior to acid flocculation, the particles were 60-100% larger than
the unflocculated control. In virtually every case, the polydispersity index values measured by
dynamic light scattering experiments were 0.2 or less. The values of the particle sizes dispersed
in water and PBS buffer along with RSD values are given in the Supporting Information (Tables
S.1 and Table S.2).
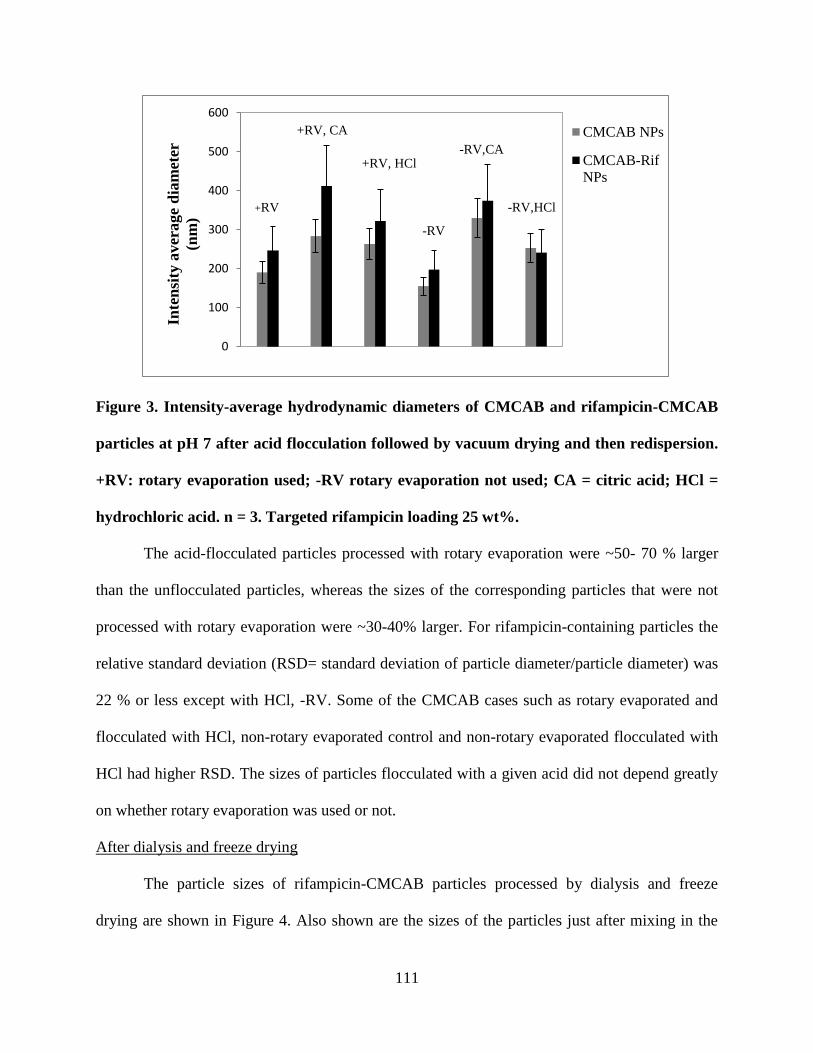
111
Figure 3. Intensity-average hydrodynamic diameters of CMCAB and rifampicin-CMCAB
particles at pH 7 after acid flocculation followed by vacuum drying and then redispersion.
+RV: rotary evaporation used; -RV rotary evaporation not used; CA = citric acid; HCl =
hydrochloric acid. n = 3. Targeted rifampicin loading 25 wt%.
The acid-flocculated particles processed with rotary evaporation were ~50- 70 % larger
than the unflocculated particles, whereas the sizes of the corresponding particles that were not
processed with rotary evaporation were ~30-40% larger. For rifampicin-containing particles the
relative standard deviation (RSD= standard deviation of particle diameter/particle diameter) was
22 % or less except with HCl, -RV. Some of the CMCAB cases such as rotary evaporated and
flocculated with HCl, non-rotary evaporated control and non-rotary evaporated flocculated with
HCl had higher RSD. The sizes of particles flocculated with a given acid did not depend greatly
on whether rotary evaporation was used or not.
After dialysis and freeze drying
The particle sizes of rifampicin-CMCAB particles processed by dialysis and freeze
drying are shown in Figure 4. Also shown are the sizes of the particles just after mixing in the
0
100
200
300
400
500
600
Inte
nsi
ty a
ver
age
dia
met
er
(nm
)
CMCAB NPs
CMCAB-Rif
NPs
+RV
+RV, CA
+RV, HCl
-RV
-RV,CA
-RV,HCl
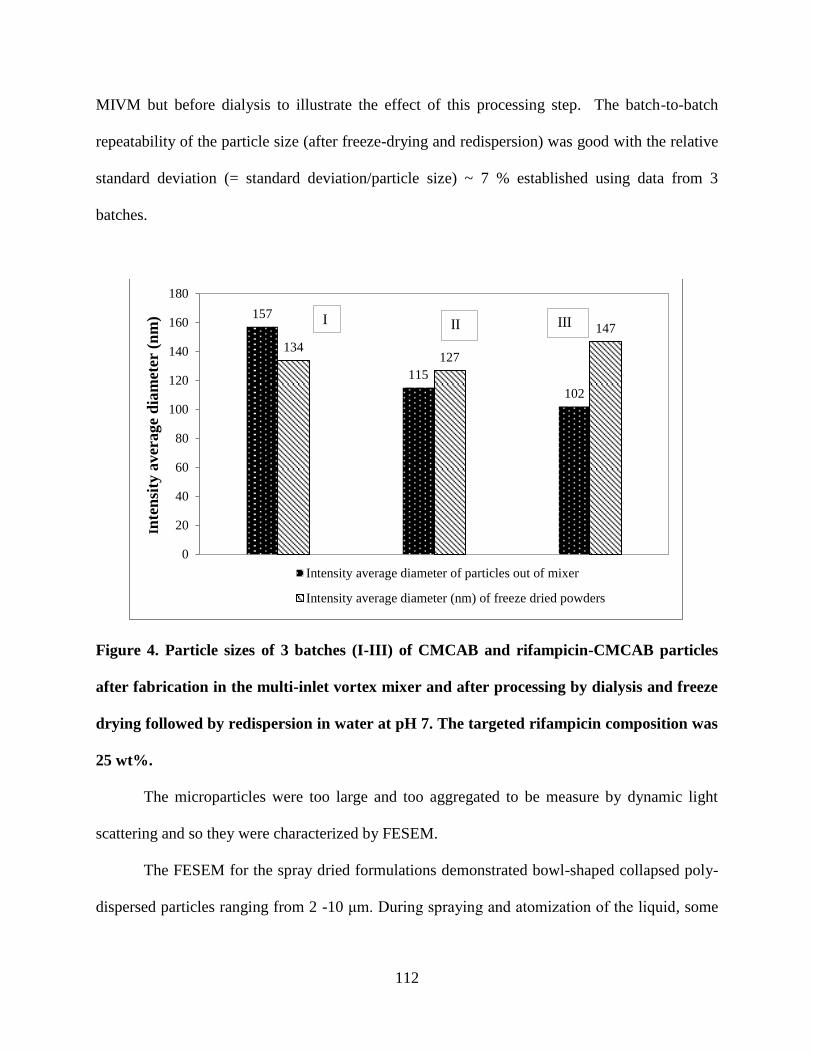
112
MIVM but before dialysis to illustrate the effect of this processing step. The batch-to-batch
repeatability of the particle size (after freeze-drying and redispersion) was good with the relative
standard deviation (= standard deviation/particle size) ~ 7 % established using data from 3
batches.
Figure 4. Particle sizes of 3 batches (I-III) of CMCAB and rifampicin-CMCAB particles
after fabrication in the multi-inlet vortex mixer and after processing by dialysis and freeze
drying followed by redispersion in water at pH 7. The targeted rifampicin composition was
25 wt%.
The microparticles were too large and too aggregated to be measure by dynamic light
scattering and so they were characterized by FESEM.
The FESEM for the spray dried formulations demonstrated bowl-shaped collapsed poly-
dispersed particles ranging from 2 -10 μm. During spraying and atomization of the liquid, some
157
115
102
134 127
147
0
20
40
60
80
100
120
140
160
180
Inte
nsi
ty a
ver
age
dia
met
er (
nm
)
Intensity average diameter of particles out of mixer
Intensity average diameter (nm) of freeze dried powders
II III I
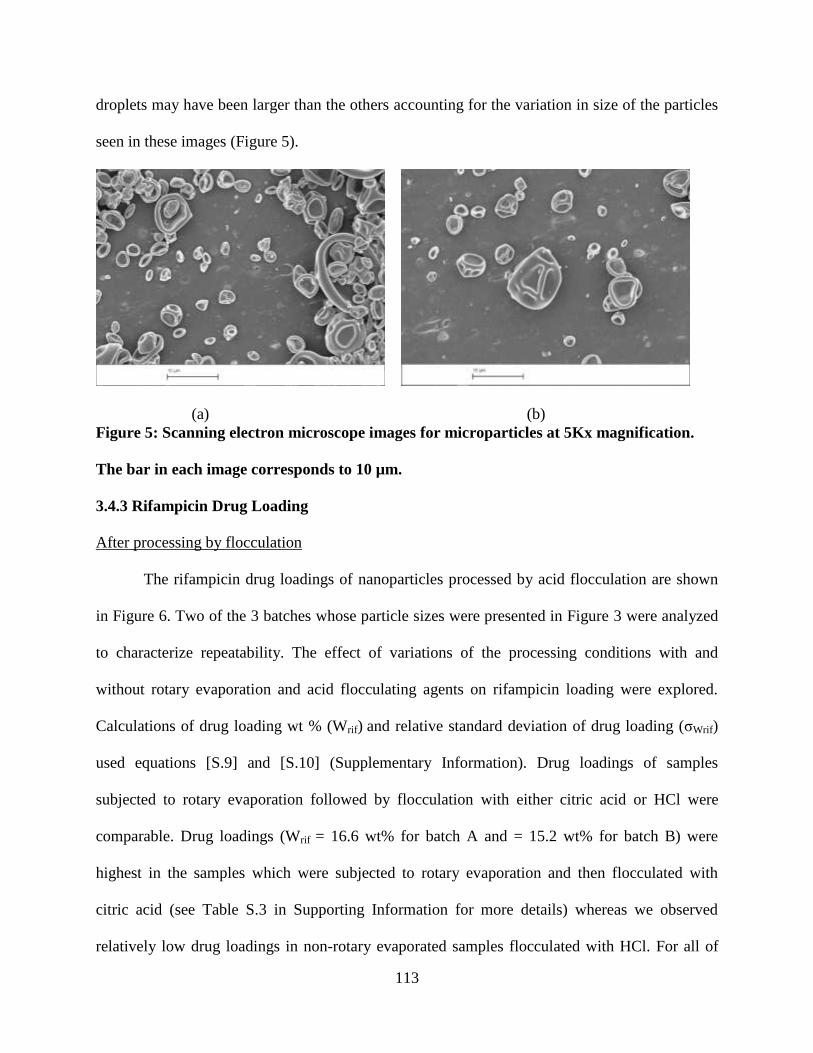
113
droplets may have been larger than the others accounting for the variation in size of the particles
seen in these images (Figure 5).
(a) (b)
Figure 5: Scanning electron microscope images for microparticles at 5Kx magnification.
The bar in each image corresponds to 10 µm.
3.4.3 Rifampicin Drug Loading
After processing by flocculation
The rifampicin drug loadings of nanoparticles processed by acid flocculation are shown
in Figure 6. Two of the 3 batches whose particle sizes were presented in Figure 3 were analyzed
to characterize repeatability. The effect of variations of the processing conditions with and
without rotary evaporation and acid flocculating agents on rifampicin loading were explored.
Calculations of drug loading wt % (Wrif) and relative standard deviation of drug loading (σWrif)
used equations [S.9] and [S.10] (Supplementary Information). Drug loadings of samples
subjected to rotary evaporation followed by flocculation with either citric acid or HCl were
comparable. Drug loadings (Wrif = 16.6 wt% for batch A and = 15.2 wt% for batch B) were
highest in the samples which were subjected to rotary evaporation and then flocculated with
citric acid (see Table S.3 in Supporting Information for more details) whereas we observed
relatively low drug loadings in non-rotary evaporated samples flocculated with HCl. For all of
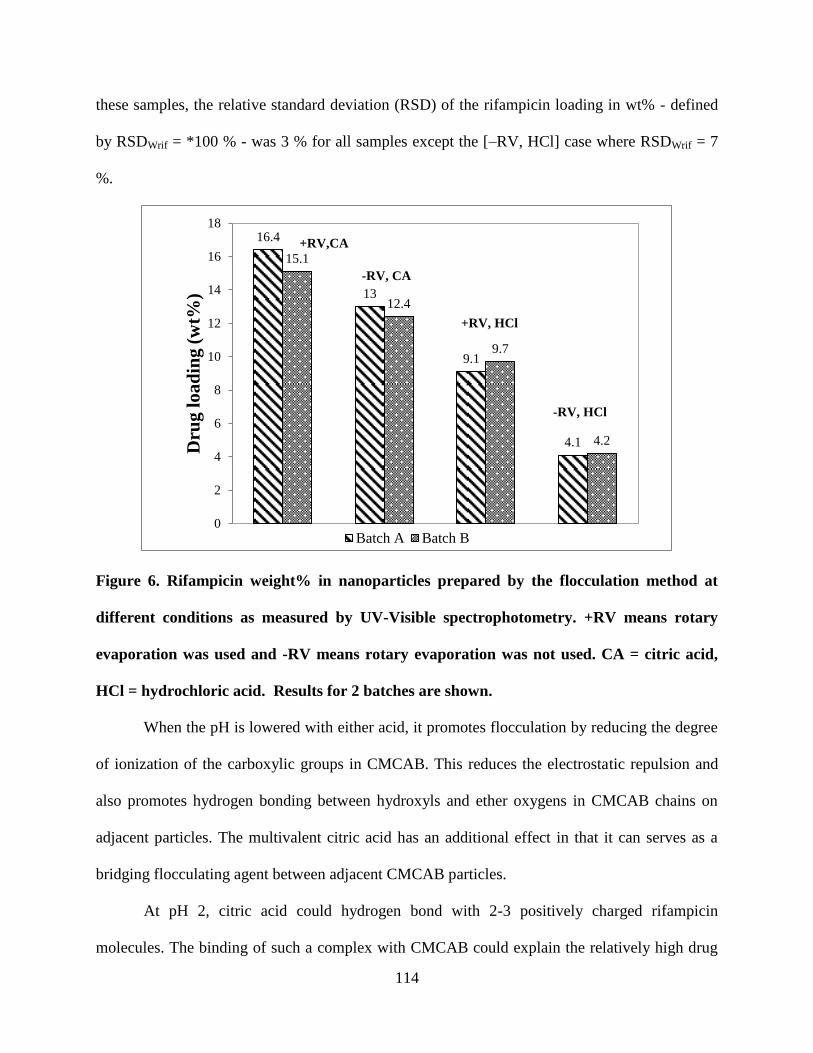
114
these samples, the relative standard deviation (RSD) of the rifampicin loading in wt% - defined
by RSDWrif = *100 % - was 3 % for all samples except the [–RV, HCl] case where RSDWrif = 7
%.
Figure 6. Rifampicin weight% in nanoparticles prepared by the flocculation method at
different conditions as measured by UV-Visible spectrophotometry. +RV means rotary
evaporation was used and -RV means rotary evaporation was not used. CA = citric acid,
HCl = hydrochloric acid. Results for 2 batches are shown.
When the pH is lowered with either acid, it promotes flocculation by reducing the degree
of ionization of the carboxylic groups in CMCAB. This reduces the electrostatic repulsion and
also promotes hydrogen bonding between hydroxyls and ether oxygens in CMCAB chains on
adjacent particles. The multivalent citric acid has an additional effect in that it can serves as a
bridging flocculating agent between adjacent CMCAB particles.
At pH 2, citric acid could hydrogen bond with 2-3 positively charged rifampicin
molecules. The binding of such a complex with CMCAB could explain the relatively high drug
16.4
13
9.1
4.1
15.1
12.4
9.7
4.2
0
2
4
6
8
10
12
14
16
18
Dru
g l
oa
din
g (
wt%
)
Batch A Batch B
-RV, CA
+RV, HCl
+RV,CA
-RV, HCl
115
loading. However, no such complexes of 2 or more rifampicin molecules could readily form with
HCl. The higher rifampicin loadings in the particles flocculated with citric acid suggest that the
solubility of rifampicin at pH 2 in citric acid may be lower than in HCl.
After dialysis and freeze drying
Drug loading in dialyzed and freeze dried particles was low (Figure 5). The targeted
rifampicin loading was 25 wt% while the actual loadings were 10.1 wt%, 9.6 wt%, and 11.7 wt%
in batches I, II, and III, respectively. The relative standard deviation RSDWrif was 7 % for these
samples as calculated using equations S.9 and S.10. This is understandable given the solubility of
rifampicin in THF and the enhanced water solubility due to these formulations. The drug loading
of rifampicin in the microparticles of rifampicin-CMCAB made by spray drying was 9.2 wt%.
Further comparison of processing methods
To further explore the effects of the processing method on rifampicin loading and to
minimize batch-to-batch variation, we prepared a batch of rifampicin-CMCAB nanoparticles and
processed part by flocculation/vacuum filtration and part by dialysis/freeze drying. The particles
processed by flocculation were not subjected to rotary evaporation because these samples
flocculated more quickly than did the samples subjected first to rotary evaporation. As noted
earlier, the flocculation time of samples processed using rotary evaporation was much shorter
than that for samples that were not subjected to rotary evaporation (30 seconds compared to 30-
45 minutes). We wanted to minimize the time that the particles were exposed to the THF/water
mixture after exiting the multi-inlet vortex mixer in order to minimize the loss of rifampicin due
to diffusion from the particles. The rifampicin loading was higher for the particles processed by
flocculation/vacuum filtration - Wrif = 11.3 wt% corresponding to a drug loading efficiency of
45% - compared to that for the particles processed by dialysis/freeze drying where Wrif = 8.5
116
wt% corresponding to a drug loading efficiency of 34% (Table S.4. in supplementary
information).
3.4.4 Particle morphology
The influence of CMCAB in the possible phase transformation in rifampicin-CMCAB
nanoparticles and microparticles was investigated through X-ray diffraction. The X-ray
diffraction pattern for the as-received rifampicin drug (as shown in Figure 7a) showed numerous
strong distinctive peaks at ~ 12º, 14º, 18º, 21º at 2θ indicating high its crystalline nature. The
polymer is amorphous in nature (Figure 7b). Some crystalline peaks for rifampicin were detected
in the physical mixture, showing that the rifampicin in the physical mixture remains crystalline
as expected. Finally, X-ray diffraction patterns of the nanoparticle and microparticle solid
dispersions showed no diffraction peaks, indicating that the rifampicin therein was amorphous.
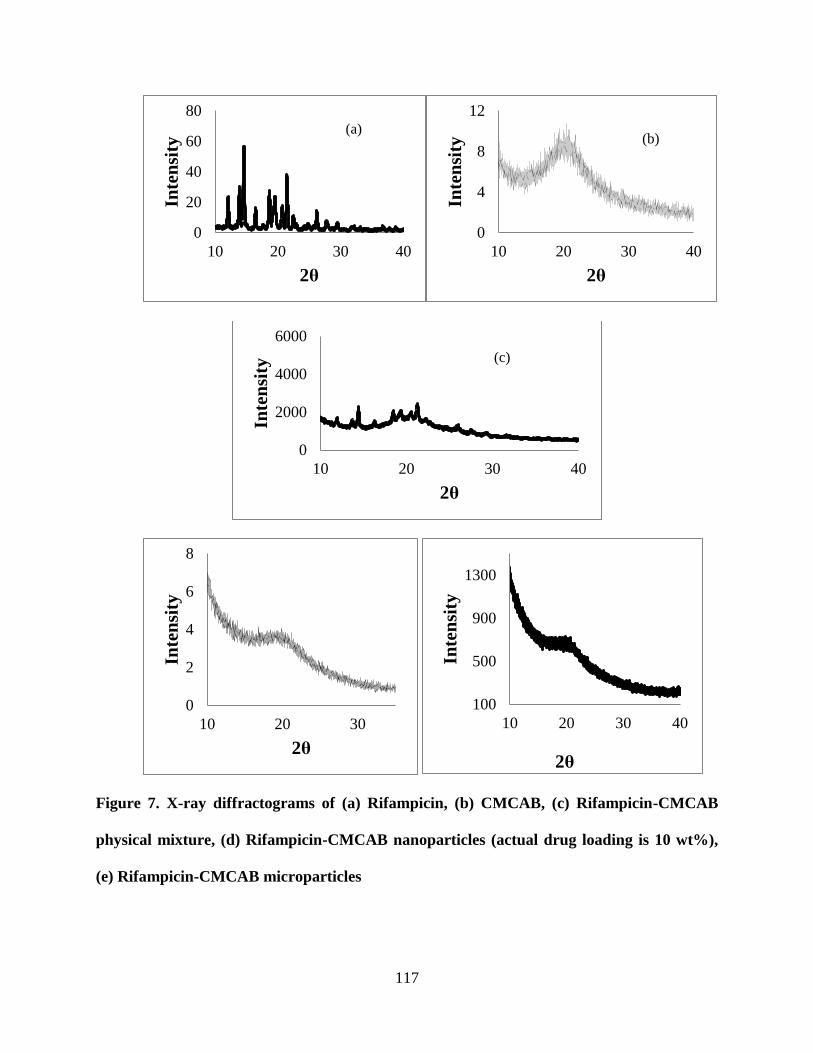
117
Figure 7. X-ray diffractograms of (a) Rifampicin, (b) CMCAB, (c) Rifampicin-CMCAB
physical mixture, (d) Rifampicin-CMCAB nanoparticles (actual drug loading is 10 wt%),
(e) Rifampicin-CMCAB microparticles
0
20
40
60
80
10 20 30 40
Inte
nsi
ty
2θ
0
4
8
12
10 20 30 40
Inte
nsi
ty
2θ
(b)
0
2000
4000
6000
10 20 30 40
Inte
nsi
ty
2θ
(c)
0
2
4
6
8
10 20 30
Inte
nsi
ty
2θ
100
500
900
1300
10 20 30 40
Inte
nsi
ty
2θ
(a)
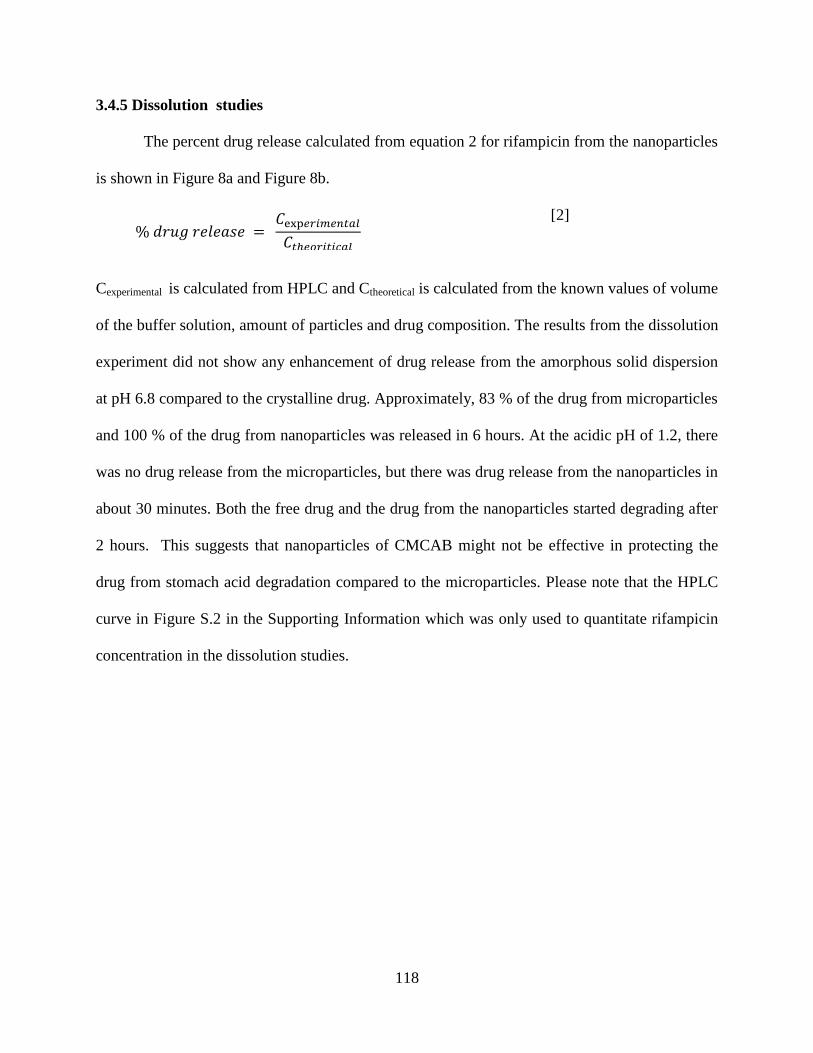
118
3.4.5 Dissolution studies
The percent drug release calculated from equation 2 for rifampicin from the nanoparticles
is shown in Figure 8a and Figure 8b.
[2]
Cexperimental is calculated from HPLC and Ctheoretical is calculated from the known values of volume
of the buffer solution, amount of particles and drug composition. The results from the dissolution
experiment did not show any enhancement of drug release from the amorphous solid dispersion
at pH 6.8 compared to the crystalline drug. Approximately, 83 % of the drug from microparticles
and 100 % of the drug from nanoparticles was released in 6 hours. At the acidic pH of 1.2, there
was no drug release from the microparticles, but there was drug release from the nanoparticles in
about 30 minutes. Both the free drug and the drug from the nanoparticles started degrading after
2 hours. This suggests that nanoparticles of CMCAB might not be effective in protecting the
drug from stomach acid degradation compared to the microparticles. Please note that the HPLC
curve in Figure S.2 in the Supporting Information which was only used to quantitate rifampicin
concentration in the dissolution studies.
% 𝑑𝑟𝑢𝑔 𝑟𝑒𝑙𝑒𝑎𝑠𝑒 = 𝐶
𝐶
× 100%
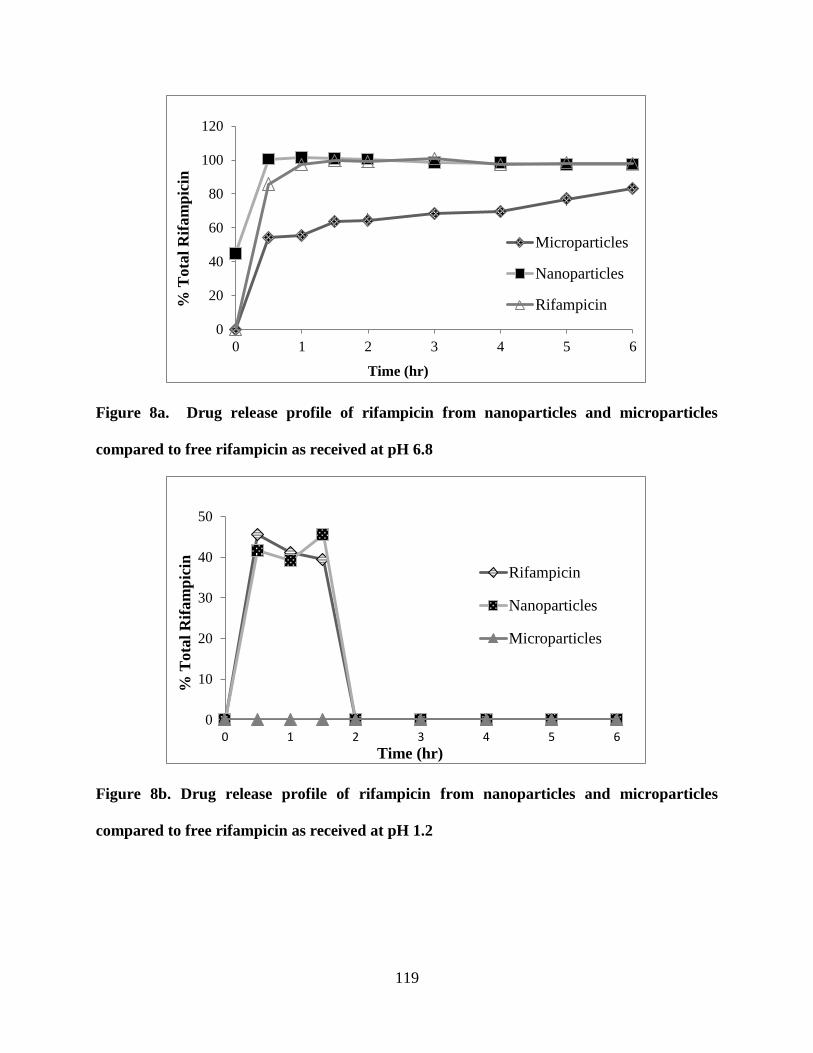
119
Figure 8a. Drug release profile of rifampicin from nanoparticles and microparticles
compared to free rifampicin as received at pH 6.8
Figure 8b. Drug release profile of rifampicin from nanoparticles and microparticles
compared to free rifampicin as received at pH 1.2
0
20
40
60
80
100
120
0 1 2 3 4 5 6
Microparticles
Nanoparticles
Rifampicin
Time (hr)
% T
ota
l R
ifam
pic
in
0
10
20
30
40
50
0 1 2 3 4 5 6
Rifampicin
Nanoparticles
Microparticles
Time (hr)
% T
ota
l R
ifam
pic
in
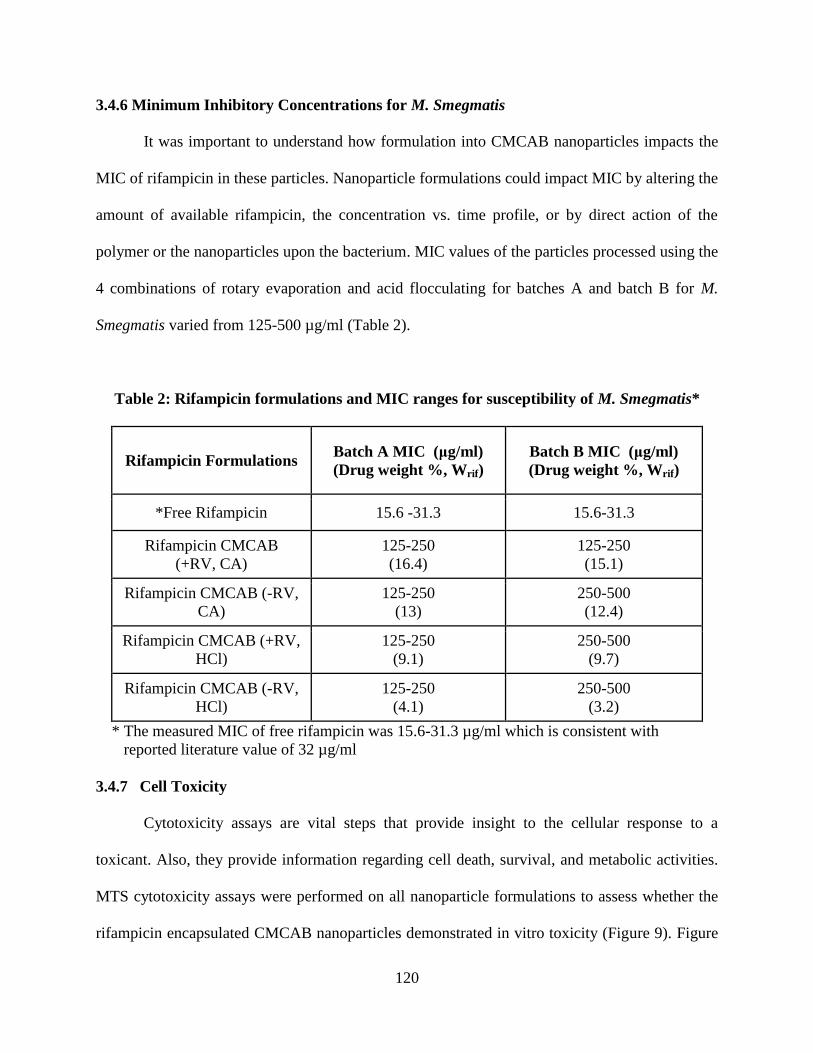
120
3.4.6 Minimum Inhibitory Concentrations for M. Smegmatis
It was important to understand how formulation into CMCAB nanoparticles impacts the
MIC of rifampicin in these particles. Nanoparticle formulations could impact MIC by altering the
amount of available rifampicin, the concentration vs. time profile, or by direct action of the
polymer or the nanoparticles upon the bacterium. MIC values of the particles processed using the
4 combinations of rotary evaporation and acid flocculating for batches A and batch B for M.
Smegmatis varied from 125-500 µg/ml (Table 2).
Table 2: Rifampicin formulations and MIC ranges for susceptibility of M. Smegmatis*
Rifampicin Formulations Batch A MIC (μg/ml)
(Drug weight %, Wrif)
Batch B MIC (μg/ml)
(Drug weight %, Wrif)
*Free Rifampicin 15.6 -31.3 15.6-31.3
Rifampicin CMCAB
(+RV, CA)
125-250
(16.4)
125-250
(15.1)
Rifampicin CMCAB (-RV,
CA)
125-250
(13)
250-500
(12.4)
Rifampicin CMCAB (+RV,
HCl)
125-250
(9.1)
250-500
(9.7)
Rifampicin CMCAB (-RV,
HCl)
125-250
(4.1)
250-500
(3.2)
* The measured MIC of free rifampicin was 15.6-31.3 µg/ml which is consistent with
reported literature value of 32 µg/ml
3.4.7 Cell Toxicity
Cytotoxicity assays are vital steps that provide insight to the cellular response to a
toxicant. Also, they provide information regarding cell death, survival, and metabolic activities.
MTS cytotoxicity assays were performed on all nanoparticle formulations to assess whether the
rifampicin encapsulated CMCAB nanoparticles demonstrated in vitro toxicity (Figure 9). Figure
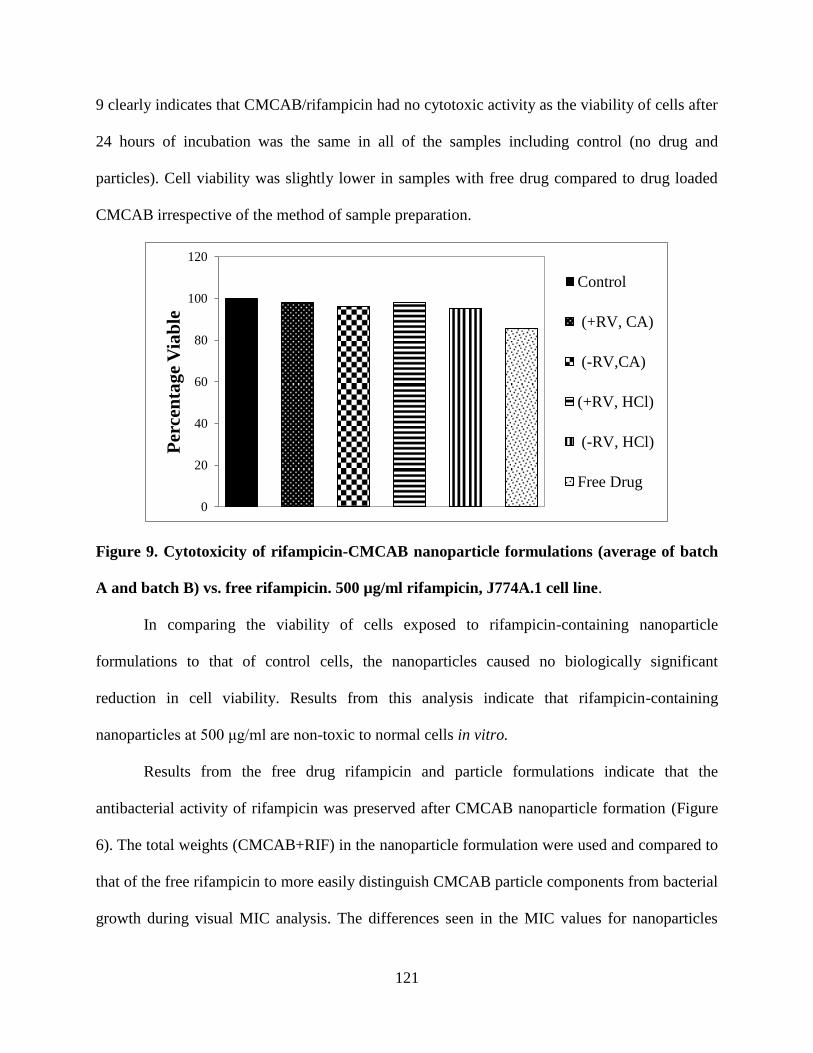
121
9 clearly indicates that CMCAB/rifampicin had no cytotoxic activity as the viability of cells after
24 hours of incubation was the same in all of the samples including control (no drug and
particles). Cell viability was slightly lower in samples with free drug compared to drug loaded
CMCAB irrespective of the method of sample preparation.
Figure 9. Cytotoxicity of rifampicin-CMCAB nanoparticle formulations (average of batch
A and batch B) vs. free rifampicin. 500 µg/ml rifampicin, J774A.1 cell line.
In comparing the viability of cells exposed to rifampicin-containing nanoparticle
formulations to that of control cells, the nanoparticles caused no biologically significant
reduction in cell viability. Results from this analysis indicate that rifampicin-containing
nanoparticles at 500 μg/ml are non-toxic to normal cells in vitro.
Results from the free drug rifampicin and particle formulations indicate that the
antibacterial activity of rifampicin was preserved after CMCAB nanoparticle formation (Figure
6). The total weights (CMCAB+RIF) in the nanoparticle formulation were used and compared to
that of the free rifampicin to more easily distinguish CMCAB particle components from bacterial
growth during visual MIC analysis. The differences seen in the MIC values for nanoparticles
0
20
40
60
80
100
120
Per
cen
tag
e V
iab
le
Control
(+RV, CA)
(-RV,CA)
(+RV, HCl)
(-RV, HCl)
Free Drug
122
formulated under the same conditions in Batch A and B are due to variations in drug
encapsulation efficiency between the groups.
3.5. CONCLUSIONS
This study demonstrates a methodology to produce rifampicin-CMCAB nanoparticle
suspensions with a multi inlet vortex mixer which is a rapid and scalable method. The
amorphous solid dispersions of these nanoparticles were formed for the first time. The intensity-
average hydrodynamic diameters ranged from 100 to 400 nm. The flocculation step followed by
vacuum filtration served to be a useful separation technique for the particles. Both citric acid and
dilute hydrochloric acid gave comparable results, inducing flocculation in almost the same times.
There was a significant difference in the flocculation time of rotary evaporated samples (30
seconds) compared to non-rotary evaporated samples (30-45 minutes). The flocculation/vacuum
filtration process is significantly faster than the dialysis/freeze drying process in purifying
rifampicin-CMCAB nanoparticles.
The particles processed by acid flocculation were not easily dispersible so probe
sonication was used to redisperse the particles in DI water. However, particles processed by
dialysis/freeze drying were much easily redispersed. Particles processed by the
flocculation/vacuum filtration process also had higher rifampicin loadings than did particles
processed by dialysis/freeze drying. It was shown that rifampicin-containing nanoparticles at 500
μg/ml were non-toxic in vitro. The biological activity of rifampicin was well preserved after
CMCAB nanoparticle formation. The nanoparticles were compared to microparticles of
Rifampicin-CMCAB (particle size between 2-10 µm). Both the particles consist of amorphous
drug. The release studies of the drug showed that the nanoparticles have higher release than that
of microparticles and the crystalline rifampicin at pH 6.8. There is also release of rifampicin
123
from nanoparticles at pH 1.2. The microparticles were shown to protect the drug from releasing
in stomach acid conditions.
ACKNOWLEDGEMENT
The authors gratefully acknowledge funding and support from the Macromolecules and
Interface Institute and the National Science Foundation, (under Contract # DMR 0909065). The
authors thank Eastman Chemical Company for kindly donating the CMCAB polymer. The
authors also thank Rick Caudill, Research Specialist, Department of Sustainable Biomaterials,
Virginia Tech for his assistance with the PXRD analysis and Mr. Steve McCartney of the
Institute for Critical Technology and Applied Science-Nanoscale Characterization and
Fabrication Laboratory (ICTAS-NCFL) at Virginia Tech for help with the FESEM images.
124
3.6 References
1. Organization, W. H. 2010/2011 Tuberculosis Global Facts; WHO: 2010.
2. Gelperina, S.; Kisich, K.; Iseman, M. D.; Heifets, L., The potential advantages of
nanoparticle drug delivery systems in chemotherapy of tuberculosis. American Journal of
Respiratory and Critical Care Medicine 2005, 172 (12), 1487-1490.
3. Panchagnula, R.; Agrawal, S., Biopharmaceutic and pharmacokinetic aspects of variable
bioavailability of rifampicin. International Journal of Pharmaceutics 2004, 271 (1-2), 1-4.
4. Sensi P, Margalith P, Timbal MT., Rifomycin, a new antibiotic—preliminary report. Farmaco
Ed Sci 1959, 14, 146–147
5. Petros, R. A.; Desimone, J. M., Strategies in the design of nanoparticles for therapeutic
applications. Nat Rev Drug Discov 2010, 9 (8), 615-627.
6. Lavelle, E. C.; Sharif, S.; Thomas, N. W.; Holland, J.; Davis, S. S., The importance of
gastrointestinal uptake of particles in the design of oral delivery systems. Advanced Drug
Delivery Reviews 1995, 18 (1), 5-22.
7. Daugherty, A. L.; Mrsny, R. J., Regulation of the intestinal epithelial paracellular barrier.
Pharmaceutical Science & Technology Today 1999, 2 (7), 281-287.
8. Gaucher, G.; Satturwar, P.; Jones, M.-C.; Furtos, A.; Leroux, J.-C., Polymeric micelles for
oral drug delivery. European Journal of Pharmaceutics and Biopharmaceutics 2010, 76 (2),
147-158.
9. Löbenberg, R.; Kim, J. S.; Amidon, G. L., Pharmacokinetics of an immediate release, a
controlled release and a two pulse dosage form in dogs. European Journal of Pharmaceutics and
Biopharmaceutics 2005, 60 (1), 17-23.
10. Ito, F.; Makino, K., Preparation and properties of monodispersed rifampicin-loaded
poly(lactide-co-glycolide) microspheres. Colloids and Surfaces B: Biointerfaces 2004, 39 (1–2),
17-21.
11. Durán, N.; Alvarenga, M. A.; Silva, E. C.; Melo, P. S.; Marcato, P. D., Microencapsulation
of antibiotic rifampicin in poly(3-hydroxybutyrate-co-3-hydroxyvalerate). Archives of
Pharmacal Research 2008, 31 (11), 1509-1516.
12. Gupta, K. C.; Fawzi Habeeb, J., Controlled-release formulations for hydroxy urea and
rifampicin using polyphosphate-anion-crosslinked chitosan microspheres. J Appl Polym Sci
2007, 104 (3), 1942-1956.
125
13. Samad, A.; Sultana, Y.; Khar, R. K.; Chuttani, K.; Mishra, A. K., Gelatin microspheres of
rifampicin cross-linked with sucrose using thermal gelation method for the treatment of
tuberculosis. Journal of Microencapsulation 2008, 26 (1), 83-89.
14. Anisimova, Y. V.; Gelperina, S. I.; Peloquin, C. A.; Heifets, L. B., Nanoparticles as
antituberculosis drugs carriers: effect on activity against mycobacterium tuberculosis in human
monocyte-derived macrophages. Journal of Nanoparticle Research 2000, 2 (2), 165-171.
15. Esmaeili, F.; Hosseini-Nasr, M.; Rad-Malekshahi, M.; Samadi, N.; Atyabi, F.; Dinarvand, R.,
Preparation and antibacterial activity evaluation of rifampicin-loaded poly lactide-co-glycolide
nanoparticles. Nanomedicine : nanotechnology, biology, and medicine 2007, 3 (2), 161-167.
16. Pandey, R.; Khuller, G. K., Subcutaneous nanoparticle-based antitubercular chemotherapy in
an experimental model. Journal of Antimicrobial Chemotherapy 2004, 54 (1), 266-268.
17. Sung, J.; Padilla, D.; Garcia-Contreras, L.; Verberkmoes, J.; Durbin, D.; Peloquin, C.; Elbert,
K.; Hickey, A.; Edwards, D., Formulation and pharmacokinetics of self-assembled rifampicin
nanoparticle systems for pulmonary delivery. Pharmaceutical Research 2009, 26 (8), 1847-1855.
18. Pandey, R.; Khuller, G. K., Antitubercular inhaled therapy: opportunities, progress and
challenges. Journal of Antimicrobial Chemotherapy 2005, 55 (4), 430-435.
19. Pandey, R.; Sharma, A.; Zahoor, A.; Sharma, S.; Khuller, G. K.; Prasad, B., Poly (dl-lactide-
co-glycolide) nanoparticle-based inhalable sustained drug delivery system for experimental
tuberculosis. Journal of Antimicrobial Chemotherapy 2003, 52 (6), 981-986.
20. Sharma, A.; Pandey, R.; Sharma, S.; Khuller, G. K., Chemotherapeutic efficacy of poly (dl-
lactide-co-glycolide) nanoparticle encapsulated antitubercular drugs at sub-therapeutic dose
against experimental tuberculosis. International Journal of Antimicrobial Agents 2004, 24 (6),
599-604.
21. Ahmad, Z.; Pandey, R.; Sharma, S.; Khuller, G. K., Pharmacokinetic and pharmacodynamic
behaviour of antitubercular drugs encapsulated in alginate nanoparticles at two doses.
International Journal of Antimicrobial Agents 2006, 27 (5), 409-416.
22. Johnson, B. K.; Prud'homme, R. K., Flash NanoPrecipitation of organic actives and block
copolymers using a confined impinging jets mixer. Australian Journal of Chemistry 2003, 56
(10), 1021-1024.
23. Johnson, B. K.; Prud'homme, R. K., Chemical processing and micromixing in confined
impinging jets. AIChE Journal 2003, 49 (9), 2264-2282.
126
24. Johnson, B. K.; Prud’homme, R. K., Mechanism for Rapid Self-Assembly of Block
Copolymer Nanoparticles. Physical Review Letters 2003, 91 (11), 118302.
25. Liu, Y.; Kathan, K.; Saad, W.; Prud’homme, R. K., Ostwald ripening of β-carotene
nanoparticles. Physical Review Letters 2007, 98 (3), 036102.
26. Liu, Y.; Cheng, C.; Prud’homme, R. K.; Fox, R. O., Mixing in a multi-inlet vortex mixer
(MIVM) for flash nano-precipitation. Chemical Engineering Science 2008, 63 (11), 2829-2842.
27. Gindy, M. E.; Ji, S.; Hoye, T. R.; Panagiotopoulos, A. Z.; Prud’homme, R. K., Preparation of
Poly(ethylene glycol) protected nanoparticles with variable bioconjugate ligand density.
Biomacromolecules 2008, 9 (10), 2705-2711.
28. Gindy, M. E.; Panagiotopoulos, A. Z.; Prud'homme, R. K., Composite Block Copolymer
Stabilized Nanoparticles: Simultaneous encapsulation of organic actives and inorganic
nanostructures. Langmuir 2007, 24 (1), 83-90.
29. Ji, S.; Zhu, Z.; Hoye, T. R.; Macosko, C. W., Maleimide functionalized poly(ε-caprolactone)-
block-poly(ethylene glycol) (pcl-peg-mal): synthesis, nanoparticle formation, and thiol
conjugation. Macromolecular Chemistry and Physics 2009, 210 (10), 823-831.
30. Ungun, B.; Prud'homme, R. K.; Budijon, S. J.; Shan, J.; Lim, S. F.; Ju, Y.; Austin, R.,
Nanofabricated upconversion nanoparticles for photodynamic therapy. Opt. Express 2009, 17
(1), 80-86.
31. Kumar, V.; Hong, S. Y.; Maciag, A. E.; Saavedra, J. E.; Adamson, D. H.; Prud’homme, R.
K.; Keefer, L. K.; Chakrapani, H., Stabilization of the nitric oxide (no) prodrugs and anticancer
leads, PABA/NO and double JS-K, through incorporation into peg-protected nanoparticles.
Molecular Pharmaceutics 2009, 7 (1), 291-298.
32. Chen, T.; D’addio, S. M.; Kennedy, M. T.; Swietlow, A.; Kevrekidis, I. G.; Panagiotopoulos,
A. Z.; Prud’homme, R. K., Protected peptide nanoparticles: experiments and brownian dynamics
simulations of the energetics of assembly. Nano Letters 2009, 9 (6), 2218-2222.
33. Ansell, S. M.; Johnstone, S. A.; Tardi, P. G.; Lo, L.; Xie, S.; Shu, Y.; Harasym, T. O.;
Harasym, N. L.; Williams, L.; Bermudes, D.; Liboiron, B. D.; Saad, W.; Prud’homme, R. K.;
Mayer, L. D., Modulating the therapeutic activity of nanoparticle delivered paclitaxel by
manipulating the hydrophobicity of prodrug conjugates. Journal of Medicinal Chemistry 2008,
51 (11), 3288-3296.
127
34. D'addio, S. M.; Prud'homme, R. K., Controlling Drug Nanoparticle Formation By Rapid
Precipitation. Advanced Drug Delivery Reviews 2011, 63 (6), 417-426.
35. (a) D’addio, S. M. Tuberculosis Therapeutics: Engineering Of Nanomedicinal Systems For
Local Delivery Of Targeted Drug Cocktails (Doctoral Dissertation). Princeton University, 2012;
(b) Ying, L. Formulating Nanoparticles By Flash Nanoprecipitation For Drug Delivery And
Sustained Release (Doctoral Dissertation). Princeton University, 2007.
36. Hancock, B.; Parks, M., What is the True Solubility Advantage for Amorphous
Pharmaceuticals? Pharmaceutical Research 2000, 17 (4), 397-404.
37. Ginés, J. M.; Arias, M. J.; Moyano, J. R.; Sánchez-Soto, P. J., Thermal investigation of
crystallization of polyethylene glycols in solid dispersions containing oxazepam. International
Journal of Pharmaceutics 1996, 143 (2), 247-253.
38. Marsac, P.; Konno, H.; Rumondor, A. F.; Taylor, L., Recrystallization of nifedipine and
felodipine from amorphous molecular level solid dispersions containing poly(vinylpyrrolidone)
and sorbed water. Pharmaceutical Research 2008, 25 (3), 647-656.
39. (a) Shelton Michael, C.; Posey-Dowty Jessica, D.; Lingerfelt, L.; Kirk Shane, K.; Klein, S.;
Edgar Kevin, J.; Enhanced dissolution of poorly soluble drugs from solid dispersions in
carboxymethylcellulose acetate butyrate matrices. In Polysaccharide Materials: Performance by
Design, American Chemical Society 2009, 1017, 93-113; (b) Posey-Dowty, J.; Watterson, T.;
Wilson, A.; Edgar, K.; Shelton, M.; Lingerfelt, L., Zero-order release formulations using a novel
cellulose ester. Cellulose 2007, 14 (1), 73-83.
40. Min-Soo Kim, J.-S. K., Hee Jun Park, Won Kyung Cho, Kwang-Ho Cha, and Sung-Joo
Hwang, Enhanced bioavailability of sirolimus via preparation of solid dispersion nanoparticles
using a supercritical antisolvent process. Int J Nanomedicine 2011, 6, 2997-3009.
41. Matteucci, M. E.; Brettmann, B. K.; Rogers, T. L.; Elder, E. J.; Williams, R. O.; Johnston, K.
P., Design of potent amorphous drug nanoparticles for rapid generation of highly supersaturated
media. Molecular Pharmaceutics 2007, 4 (5), 782-793.
42. Onoue, S.; Uchida, A.; Takahashi, H.; Seto, Y.; Kawabata, Y.; Ogawa, K.; Yuminoki, K.;
Hashimoto, N.; Yamada, S., Development of high-energy amorphous solid dispersion of
nanosized nobiletin, a citrus polymethoxylated flavone, with improved oral bioavailability.
Journal of Pharmaceutical Sciences 2011, 100 (9), 3793-3801.
128
43. Watanabe, T.; Hasegawa, S.; Wakiyama, N.; Kusai, A.; Senna, M., Comparison between
polyvinylpyrrolidone and silica nanoparticles as carriers for indomethacin in a solid state
dispersion. International Journal of Pharmaceutics 2003, 250 (1), 283-286.
44. (a) Li, B.; Konecke, S.; Harich, K.; Wegiel, L.; Taylor, L. S.; Edgar, K. J., Solid dispersion of
quercetin in cellulose derivative matrices influences both solubility and stability. Carbohydrate
Polymers 2013, 92 (2), 2033-2040; (b) Li, B.; Harich, K.; Wegiel, L.; Taylor, L. S.; Edgar, K. J.,
Stability and solubility enhancement of ellagic acid in cellulose ester solid dispersions.
Carbohydrate Polymers 2013, 92 (2), 1443-1450.
45. Malabarba, A., Ferrari, P., Depaoli, A., Gallo, G. G. & Cavalleri, B. , Synthesis and
conformation of some acetyl derivatives of rifampicin. Farmaco Scientifica 1986, 41, 131-50.
46. In Performance Standards for Antimicrobial Susceptibility Testing; Seventeenth
Informational Supplement M100-S17. , Clinical and laboratory Standards Institute (CLSI ): 2007,
27.
47. Liu, Y., Cheng, C., Prud'homme, R. K., Fox, R. O., Mixing in a multi-inlet vortex mixer
(MIVM) for flash nano-precipitation. Chemical Engineering Science 2008, 63 (11), 2829-2842.
48. D'addio, S. M., Kafka, C., Akbulut, M.; Beattie, P., Saad, W., Herrera, M., Kennedy, M. T.,
Prud'homme, R. K., Novel method for concentrating and drying polymeric nanoparticles:
hydrogen bonding coacervate precipitation. Molecular Pharmaceutics 2010, 7 (2), 557-564.
49. Wriedt, T., Mie Theory: A Review. Springer-Verlag Berlin Heidelberg 2012, Vol. 169.
129
3.7. Supporting Information
Calculation of Reynolds number in the multi-inlet vortex mixer
Re=Dmixer ∑ui
vi=Dmixer (
u1
v1 u2
v2 u3
v3 u4
v4) [S.1]
where ui is the velocity of each individual inlet stream and vi is the kinematic viscosity (density
over viscosity) of each inlet solvent at the mixer temperature. The volumetric flow rate, Qi, is
determined by the equation:
i= uiAis [S.2]
where Ais is the cross-sectional area of the inlet streams. When Ais is the same for all four
streams and it is assumed that the solution formed by mixing is ideal, i.e. there is no volume
change upon mixing, the liquid phase volume fractions i are calculated from:
i= ui
u1 u2 u3 u4 [S.3].
For the drug/polymer nanoparticles, u1, and for antisolvent, u2=u3=u4. Substituting these into
Equation 3 for the volume fraction and designating stream 1 as the organic stream
1=u1
u1 3u2-4
[S.4]
or u1=3 THF
1- THFu2-4 [S.5]
Using the inlet velocities of the different streams as a function of the volume fraction of the drug
stream produces a calculation of the Reynolds number using Equation 1:
Re=Dmixer (u1
v1 u2
v2 u3
v3 u4
v4) =Dmixer (
u1
v1 3
u2-4
v2) =Dmixer (
3 THF
1- THF
u2-4
v1 3
u2-4
v2)
Re=3u2-4Dmixer (
THF
1- THF
1
v1 1
v2) [S.6]
x= ( THF
1- THF
1
v1 1
v2)
130
where v1 – v4 are the kinematic viscosities of the stream 1-4.
Equation [S.6] simplifies to:
Re=3u2-4Dmixer
and is then used to solve for the volumetric flow rates of inlets 2-4 as a function of the Reynolds
number:
2-4=Re
3Dmixer [S.7]
Calculation of Drug Loading
Construction of calibration curve
In order to measure the rifampicin loading of the CMCAB nanoparticles, a calibration curve
(Figure S.1) for the rifampicin dissolved in acetonitrile was developed using a UV–Visible
spectrophotometer (Thermo Scientific, Evolution 300) at a wavelength of 475 nm where the
absorbance was a maximum. In a typical experiment, 10 mgs of Rifampicin were dissolved in a
10 ml volumetric flask containing 2 ml acetonitrile. More acetonitrile was added up to the 10 ml
mark to prepare the stock solution of rifampicin in acetonitrile. This solution was serially diluted
with acetonitrile to make solutions with rifampicin concentrations of 10, 20, 30, 40, 50, 60, and
70 µg/ml. The equation for the calibration curve of rifampicin in acetonitrile is
Absorbance at 475 nm = 0.0153Crif + 0.0096 [S.8]
where R² = 0.9999
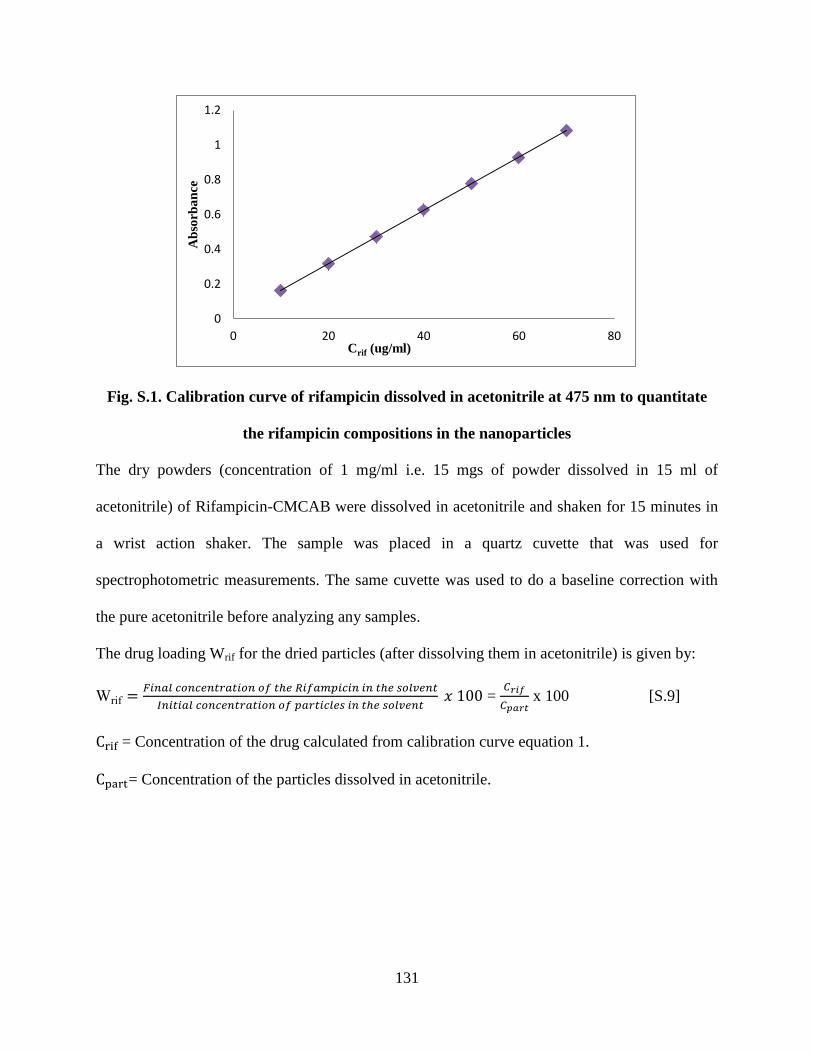
131
Fig. S.1. Calibration curve of rifampicin dissolved in acetonitrile at 475 nm to quantitate
the rifampicin compositions in the nanoparticles
The dry powders (concentration of 1 mg/ml i.e. 15 mgs of powder dissolved in 15 ml of
acetonitrile) of Rifampicin-CMCAB were dissolved in acetonitrile and shaken for 15 minutes in
a wrist action shaker. The sample was placed in a quartz cuvette that was used for
spectrophotometric measurements. The same cuvette was used to do a baseline correction with
the pure acetonitrile before analyzing any samples.
The drug loading Wrif for the dried particles (after dissolving them in acetonitrile) is given by:
Wrif =
100 =
x 100 [S.9]
= Concentration of the drug calculated from calibration curve equation 1.
= Concentration of the particles dissolved in acetonitrile.
0
0.2
0.4
0.6
0.8
1
1.2
0 20 40 60 80
Ab
sorb
an
ce
Crif (ug/ml)
132
The standard deviation of the drug loading σWrif of the rifampicin-CMCAB nanoparticles is given
by:
=
(
)
(
)
((
) (
))
=
× 100 [S.10]
where:
= standard deviation of mass fraction of Rifampicin drug in the particles
= standard deviation of weight fraction of Rifampicin drug in the particles
mAce = mass of acetonitrile which is used to make samples. For example, the mass of 1.5 mls of
acetonitrile that were typically used in the experiments would be used here.
mcomp = mass of the complex used in the drug loading measurements.
mAce = standard deviation of the mass of acetonitrile used to make sample. For example, 1.5 mls
of acetonitrile were measured into a pre-weighed bottle and the mass was measured. This was
done 5 times and the information was used to calculate mAce = 0.1649 grams.
mcomp = standard deviation of the mass of the dried complexes. For example, a typical mass of
complex was weighed on the balance and the balance readout was observed over a period of 1
minute, recording the magnitude of the fluctuation in the measurement, mfluct, (the maximum-
to-minimum value of the mass). Here mcomp = 0.0001 gms.
σ2
crif = standard deviation of the rifampicin concentration measured with the UV-Visible
spectrophotometer and is given by:
=
(
)
(
)
[S.11]
where:
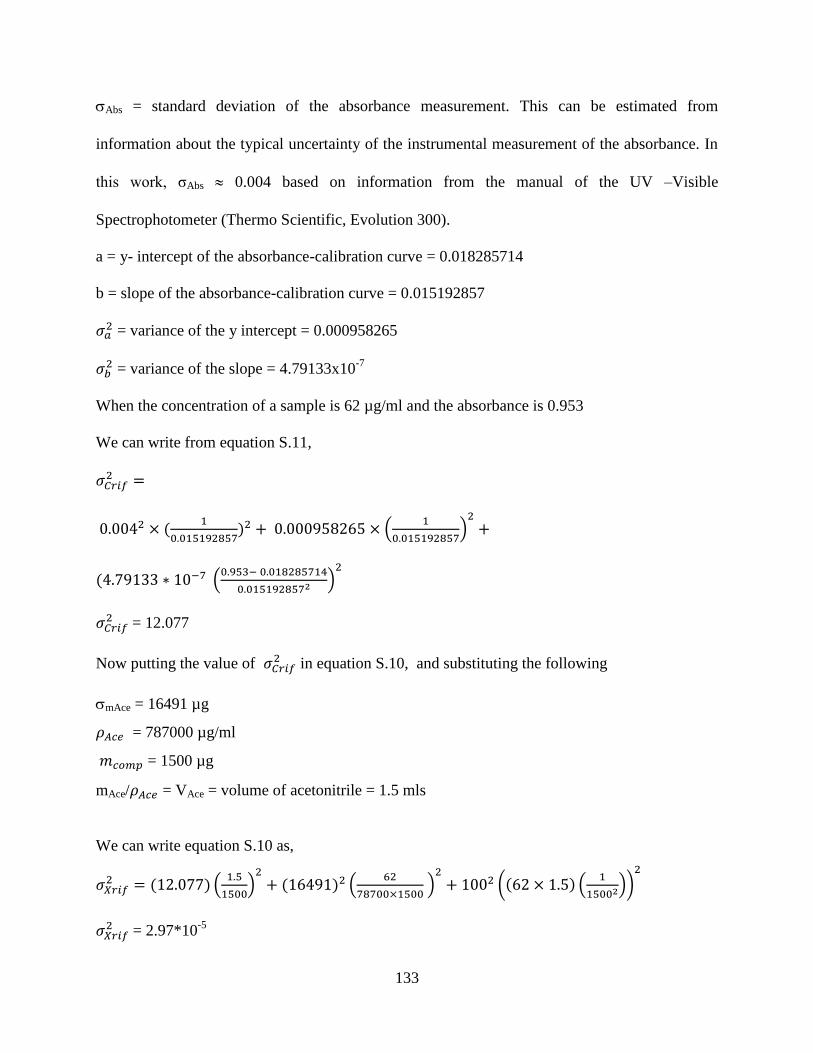
133
Abs = standard deviation of the absorbance measurement. This can be estimated from
information about the typical uncertainty of the instrumental measurement of the absorbance. In
this work, σAbs 0.004 based on information from the manual of the UV –Visible
Spectrophotometer (Thermo Scientific, Evolution 300).
a = y- intercept of the absorbance-calibration curve = 0.018285714
b = slope of the absorbance-calibration curve = 0.015192857
= variance of the y intercept = 0.000958265
= variance of the slope = 4.79133x10
-7
When the concentration of a sample is 62 µg/ml and the absorbance is 0.953
We can write from equation S.11,
=
0 00 ×
0 000 × (
)
1 10 (
)
= 12.077
Now putting the value of in equation S.10, and substituting the following
mAce = 16491 µg
= 787000 µg/ml
= 1500 µg
mAce/ = VAce = volume of acetonitrile = 1.5 mls
We can write equation S.10 as,
= 1 0 (
)
1 1 (
× )
100 ( × 1 (
))
= 2.97*10
-5
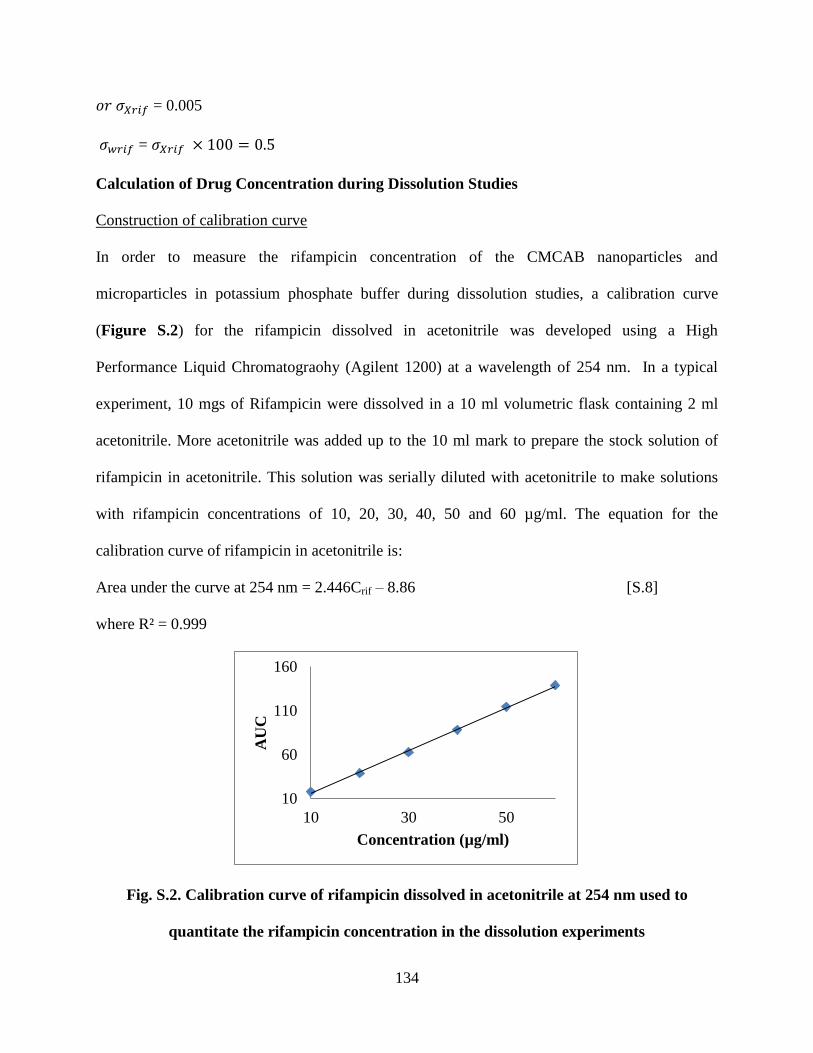
134
𝑟 = 0.005
= × 100 = 0
Calculation of Drug Concentration during Dissolution Studies
Construction of calibration curve
In order to measure the rifampicin concentration of the CMCAB nanoparticles and
microparticles in potassium phosphate buffer during dissolution studies, a calibration curve
(Figure S.2) for the rifampicin dissolved in acetonitrile was developed using a High
Performance Liquid Chromatograohy (Agilent 1200) at a wavelength of 254 nm. In a typical
experiment, 10 mgs of Rifampicin were dissolved in a 10 ml volumetric flask containing 2 ml
acetonitrile. More acetonitrile was added up to the 10 ml mark to prepare the stock solution of
rifampicin in acetonitrile. This solution was serially diluted with acetonitrile to make solutions
with rifampicin concentrations of 10, 20, 30, 40, 50 and 60 µg/ml. The equation for the
calibration curve of rifampicin in acetonitrile is:
Area under the curve at 254 nm = 2.446Crif – 8.86 [S.8]
where R² = 0.999
Fig. S.2. Calibration curve of rifampicin dissolved in acetonitrile at 254 nm used to
quantitate the rifampicin concentration in the dissolution experiments
10
60
110
160
10 30 50
AU
C
Concentration (µg/ml)

135
Table S.1. Particle Size Analysis of CMCAB particles after recovering them by vacuum
filtration and drying in vacuum oven for 5-6 hours at room temperature by DLS – at
different rotary evaporation conditions and addition of different excipients. The average
results from 3 batches are shown.
CMCAB
(Rotary
evaporation
conditions)
Excipient
(pH ≈2)
Intensity
average
diameter (nm)
in DI water
(NaOH added)
(RSD )
PDI
Intensity
average
diameter
(nm) in PBS
PDI
Rotary
evaporated
(control)
None 190±0.19 0.19
±0.04
- -
Rotary
evaporated
1 wt%
citric acid
283± 0.19 0.2
±0.04
270±0.08 0.14±0.04
Rotary
evaporated
1 wt% dil.
HCl
263±0.24 ±0.04 282±0.04 ±0.04
Non-rotary
evaporated
(control)
None 155±0.28 0.14±0.
04
- -
Non-rotary
evaporated
1wt%
citric acid
330±0.27 0.12±0.
04
258±0.27 0.23±0.04
Non-rotary
evaporated
1 wt% dil.
HCl
253±0.18 0.17±0.
04
282±0.24 ±0.04
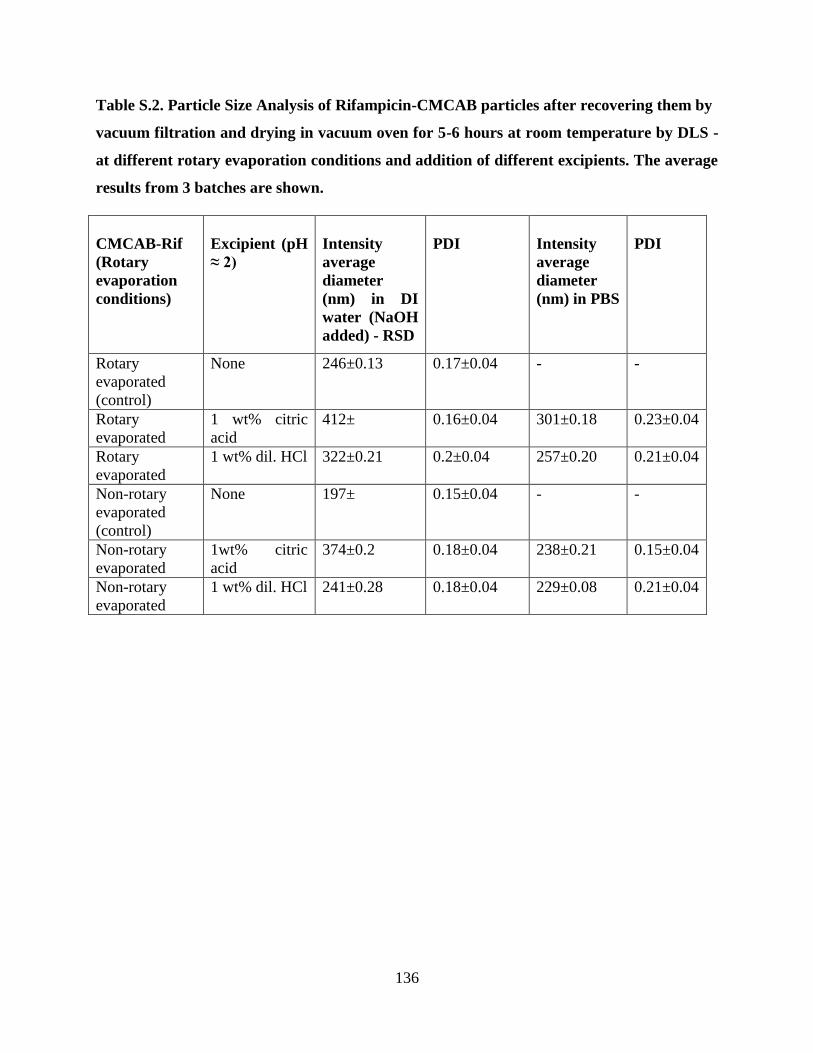
136
Table S.2. Particle Size Analysis of Rifampicin-CMCAB particles after recovering them by
vacuum filtration and drying in vacuum oven for 5-6 hours at room temperature by DLS -
at different rotary evaporation conditions and addition of different excipients. The average
results from 3 batches are shown.
CMCAB-Rif
(Rotary
evaporation
conditions)
Excipient (pH
≈ 2)
Intensity
average
diameter
(nm) in DI
water (NaOH
added) - RSD
PDI
Intensity
average
diameter
(nm) in PBS
PDI
Rotary
evaporated
(control)
None 246±0.13 0.17±0.04 - -
Rotary
evaporated
1 wt% citric
acid
412± 0.16±0.04 301±0.18 0.23±0.04
Rotary
evaporated
1 wt% dil. HCl 322±0.21 0.2±0.04 257±0.20 0.21±0.04
Non-rotary
evaporated
(control)
None 197± 0.15±0.04 - -
Non-rotary
evaporated
1wt% citric
acid
374±0.2 0.18±0.04 238±0.21 0.15±0.04
Non-rotary
evaporated
1 wt% dil. HCl 241±0.28 0.18±0.04 229±0.08 0.21±0.04
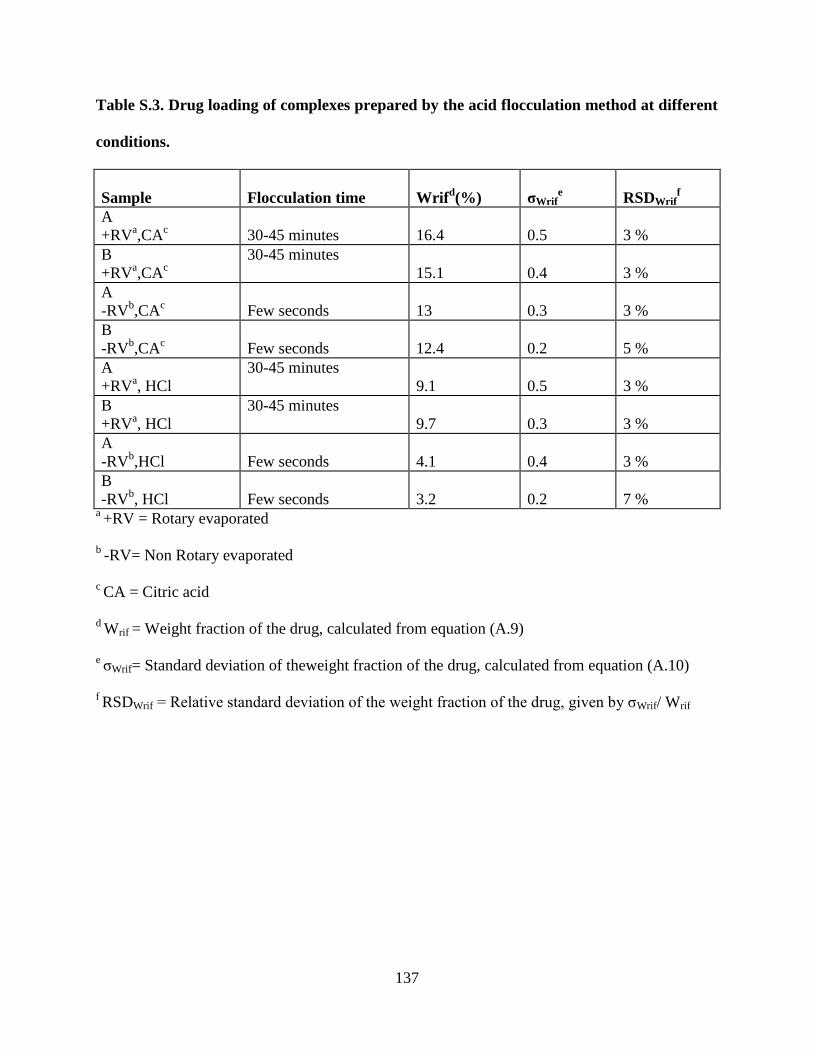
137
Table S.3. Drug loading of complexes prepared by the acid flocculation method at different
conditions.
Sample
Flocculation time Wrifd(%) σWrif
e RSDWrif
f
A
+RVa,CA
c
30-45 minutes 16.4 0.5 3 %
B
+RVa,CA
c 30-45 minutes
15.1 0.4 3 %
A
-RVb,CA
c
Few seconds 13 0.3 3 %
B
-RVb,CA
c
Few seconds 12.4 0.2 5 %
A
+RVa, HCl
30-45 minutes
9.1 0.5 3 %
B
+RVa, HCl
30-45 minutes
9.7 0.3 3 %
A
-RVb,HCl
Few seconds 4.1 0.4 3 %
B
-RVb, HCl
Few seconds 3.2 0.2 7 % a +RV = Rotary evaporated
b -RV= Non Rotary evaporated
c CA = Citric acid
d Wrif = Weight fraction of the drug, calculated from equation (A.9)
e σWrif= Standard deviation of theweight fraction of the drug, calculated from equation (A.10)
f RSDWrif = Relative standard deviation of the weight fraction of the drug, given by σWrif/ Wrif
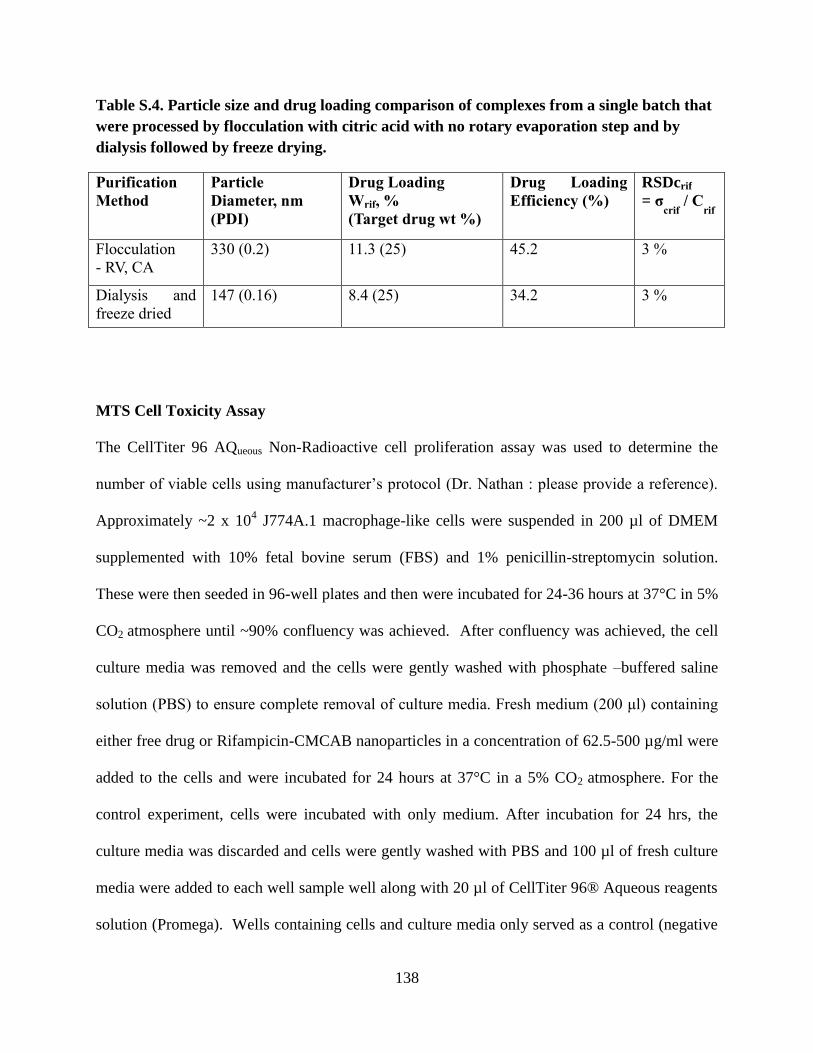
138
Table S.4. Particle size and drug loading comparison of complexes from a single batch that
were processed by flocculation with citric acid with no rotary evaporation step and by
dialysis followed by freeze drying.
Purification
Method
Particle
Diameter, nm
(PDI)
Drug Loading
Wrif, %
(Target drug wt %)
Drug Loading
Efficiency (%)
RSDcrif
= σcrif
/ Crif
Flocculation
- RV, CA
330 (0.2) 11.3 (25) 45.2 3 %
Dialysis and
freeze dried
147 (0.16) 8.4 (25) 34.2 3 %
MTS Cell Toxicity Assay
The CellTiter 96 AQueous Non-Radioactive cell proliferation assay was used to determine the
number of viable cells using manufacturer’s protocol (Dr. Nathan : please provide a reference).
Approximately ~2 x 10⁴ J774A.1 macrophage-like cells were suspended in 200 µl of DMEM
supplemented with 10% fetal bovine serum (FBS) and 1% penicillin-streptomycin solution.
These were then seeded in 96-well plates and then were incubated for 24-36 hours at 37°C in 5%
CO2 atmosphere until ~90% confluency was achieved. After confluency was achieved, the cell
culture media was removed and the cells were gently washed with phosphate –buffered saline
solution (PBS) to ensure complete removal of culture media. Fresh medium (200 μl) containing
either free drug or Rifampicin-CMCAB nanoparticles in a concentration of 62.5-500 µg/ml were
added to the cells and were incubated for 24 hours at 37°C in a 5% CO2 atmosphere. For the
control experiment, cells were incubated with only medium. After incubation for 24 hrs, the
culture media was discarded and cells were gently washed with PBS and 100 µl of fresh culture
media were added to each well sample well along with 20 µl of CellTiter 96® Aqueous reagents
solution (Promega). Wells containing cells and culture media only served as a control (negative
139
for signs of demised viability). After 3 hours of incubation at 37°C in the 5% CO2 atmosphere,
the absorbance of samples in the 96–well plate were measured at 490 nm using a ELISA reader
(SoftMax Pro Inc., USA). Results were expressed as a percentage mean absorbance by cell upon
incubation with various treatments with respect to the untreated control, considering the
absorption of control cells as 100% cell viability.
140
Chapter 4: Preparation and characterization of nanoparticles of
carboxymethyl cellulose acetate butyrate containing anti-viral drugs
for oral drug delivery
Sonal Mazumder
1, Junia M. Pereira
2, Jennifer M. Carter
3, E. Bruce Orler
4, Robert B. Moore III
5,
Kevin J. Edgar 6
and Richey M Davis*7
1,2,3Macromolecules and Interfaces Institute,
4,5Department of Chemistry,
6Department of
Sustainable Biomaterials,7Department of Chemical Engineering
Virginia Polytechnic Institute and State University, Blacksburg, VA 24061, USA
*Corresponding author:
Richey M. Davis
Department of Chemical Engineering, VirginiaTech, Blacksburg, VA - 24061
Tel: 001+ 540-231-4578 ; Fax : 001+ 540-231-5022
E-mail address: [email protected]
ABSTRACT
Nanoparticles comprised of carboxymethyl cellulose acetate butyrate (CMCAB)
complexed with the poorly soluble antiviral drugs ritonavir and efavirenz were produced by a
rapid precipitation process and the formulation process and properties of nanoparticles were
investigated. Two poorly soluble anti-viral drugs ritonavir and efavirenz were selected as model
drugs for this study. Methodology for producing drug-polymer nanoparticles with well-defined
particle size distributions was developed and factors affecting drug loading and release properties
of these nanoparticles were investigated. A comparison between drug release from nanoparticles
made by nanoprecipitation and microparticles made by a co-precipitation process was made in
141
order to investigate the effect of particle size on drug release from the polymer. Dynamic light
scattering showed particle sizes were between 150-250 nm with polydispersity index values as
low as 0.12. Drug loading efficiencies as high as 72-86% were attained. The dissolution studies
showed an increase in the solubility and faster release of the amorphous drug nanoparticles
compared to the as-received crystalline forms of the drugs and microparticles which were
prepared by co-precipitation.
Keywords: cellulose, ritonavir, efavirenz, mixing, nanoparticles, microparticles, drug release,
solubility, bioavailability, crystallization
4.1. INTRODUCTION
The Human Immunodeficiency Virus (HIV) attacks the immune system, causing life-
threatening secondary infections and diseases. Ritonavir and efavirenz are two important drugs
for HIV treatment. Ritonavir inhibits an enzyme which metabolizes other protease inhibitors and
Efavirenz is a non-nucleoside reverse transcriptase inhibitor (NNRTI). However, both drugs are
highly crystalline and poorly soluble in the gastrointestinal tract leading to poor bioavailability.
Oral drug delivery is commonly used in treating HIV but there are several factors in the
GI tract which can limit the bioavailability of drugs such as tissue barriers (mucosa, microvilli)
and physiological factors (varying pH, enzymes, transporter mechanisms)1. Low drug solubility
reduces bioavailability and so microparticles and nanoparticles of amorphous polymer-drug
complexes have been used in some cases to enhance the dissolution of poorly soluble drugs in
the intestinal tract 2,3,4,5
.
Reducing the particle size can improve the material properties of polymer-drug particles
as potential drug delivery systems6. We hypothesize that amorphous solid dispersions in the form
of polymer-drug nanoparticles with well-defined size distributions may release most of the
142
complexed drug in the ~4-5 hours that they reside in the small intestine. This high solution
concentration in the small intestine could lead to increased bioavailability that could enable the
use of reduced-dose formulations and reduced costs and side effects.
In this work, amorphous solid dispersions (ASDs) in the form of polysaccharide-drug
nanoparticles and microparticles were made in order to study the effect of particle size and
amorphous drug content on drug dissolution. Most drugs will crystallize and this creates an
energy barrier which must be overcome for the drug to dissolve in the bodily fluid. This can
greatly limit bioavailability and so one approach that has been taken is to create an amorphous
form of the drug which results in a much smaller energy barrier that must be overcome for
dissolution. In an ASD, the drug is dispersed, ideally molecularly, in a polymer matrix which
inhibits drug crystallization. ASDs have been reviewed in details in sections 2.3 and 3.1 of this
thesis. In addition to suppressing drug crystallization in the solid state, polymeric carriers can
also reduce drug precipitation by slowing the kinetics of drug precipitation or crystallization in
the solution state 3, 7
. 8.
The drug release from solid dispersions depends on dissolution of the polymeric carrier
and properties of the drug 9. It has been found that low drug loading favors the formation of
molecular dispersions. Increasing the drug loading necessarily decreases the quantity of polymer
carrier available to stabilize the drug in the high energy form. As a result, high drug loading can
promote phase separation within the solid dispersion10,11
which can affect drug-release profiles.
Several studies have shown that the drug dissolution rate from solid dispersions decreases with
increasing drug loading 12,13,14,15,16,17,18,19,19b
. This decrease in dissolution rate is due to a
reduction in the quantity of molecularly dispersed drug in polymer matrix 20,11
. The phase
separated drugs are more likely to crystallize compared with solid dispersions where drug is
143
present in a molecularly dispersed form that has increased kinetic stability as a result of intimate
contact with the polymer 21,22,23
. Solid dispersions with lower drug-polymer ratios and with good
miscibility between the drug and polymer and with glass transition temperatures appreciably
above room temperature show better physical stability at ambient temperatures24,25,26,11
.
Most of the polymers which are used in ASDs have high glass transition temperatures
(Tgs). For example, the Tg of PVP K30 is 168°C while the Tg of HPMC is 170°C16,27
.
Homogeneous dispersions of a drug and a high Tg polymer will have higher Tg values than that
of the pure drug. Thus, polymeric formulations can stabilize molecular transitions in the
amorphous state.
Considerable work has been done to formulate polymer-antiviral drug nanoparticles with
synthetic or semisynthetic polymers28,29,30,31,32,33
. More recently, studies have shown that
polysaccharides are very promising for oral drug delivery due to their affinity for complexing
with a variety of drugs which can suppress drug crystallization, their relatively high glass
transition temperatures, and their biocompatibility34,35,36
. The composition and morphology of
the polymer matrix plays an extremely important role in the drug release and pharmacokinetics
37. Nanoparticles have the ability to improve the dissolution rate of the drug
38. All of these
benefits can contribute to the reduction of dose and dosing frequency, thereby reducing the side
effects and improving the patient compliance39
. A detailed review of previous studies on
polymer-antiviral drug complexes can be found in literature review section 2.8.3 of this thesis.
In this present work, we made RTV and EFV-containing amorphous nanoparticles using
a recently developed cellulose ester, carboxymethyl cellulose acetate butyrate (CMCAB)35
,
which is pH-sensitive; water-swellable when partially ionized at pH 6-7, but is insoluble at pH ~
3-4. There is no previous study reported where these drugs were complexed with CMCAB to
144
form nanoparticles. We hypothesized that the pH-dependent swelling could lead to less release of
and less degradation of the drug incorporated into the particles when in the stomach and
controlled release of drug in the small intestine. There is no previous study reported where these
drugs were complexed with CMCAB to form nanoparticles. Many studies of nanoparticles made
with synthetic polymers have focused on controlling drug loading and characterizing drug
release but, in many cases, the method of producing the particles was not rapid and scalable. We
investigate the effect of processing conditions on the particle size and drug loading of
nanoparticles of RTV and EFV, made with a polysaccharide – CMCAB - using the flash nano-
precipitation method40
,41
,42
in a multi-inlet vortex mixer (MIVM) 43,44, 45,46,47
. In this method,
nanoparticles form very rapidly by controlled nucleation and growth of particles, which allows
for the production of nanoparticles of controlled size in a continuous manner48
. This is achieved
by controlling the Reynolds numbers and the liquid phase composition, allowing for rapid and
complete mixing41, 48-49
.
The work reported in this paper focused on establishing a methodology for preparing
well-defined drug-polymer complexes relatively rapidly and in a manner that can produce
particles with high drug loadings. The particle sizes and drug loading of the nanoparticles were
measured to test control and reproducibility of the particle formation process as quantified by an
error analysis. The suppression of crystallinity of the drugs in the amorphous nanoparticles was
studied by X-ray diffraction analysis and differential scanning calorimetry. Release of the drugs
from the polymer matrix was measured to understand the impact of the inhibition of drug
crystallization on release. Finally, we compare CMCAB-drug nanoparticles and the
corresponding microparticles to understand the effect of particle size on drug release and
145
determine whether synergy between high surface area and suppression of crystallinity is
observed.
4.2. MATERIALS AND METHODS
4.2.1 Materials
Tetrahydrofuran (anhydrous, ACS reagent, ≥99.0% inhibitor free) was used for
polymer/drug nanoparticles formation without further purification. Acetonitrile (HPLC grade,
>95 %) was used for HPLC analysis. Carboxylmethyl cellulose acetate butyrate (CMCAB);
approximate molecular weight 22000, degree of Substitution (DS) of butyryl group = 1.64, DS of
acetyl group = 0.44, DS of Carboxymethyl group = 0.33, Eastman Chemical Company) (Figure
1). CMCAB was provided in its free acid form and used as received. Ritonavir (RTV) and
efavirenz (EFV) were from Attix Pharmaceuticals, Canada) (Figure 2a and Figure 2b). The pKa
of RTV is 14.23 and that of EFV is 10.2. Millipore water (18.2 MΩ•cm at 25 °C ultrapure water,
Synergy Ultrapure Water Systems, USA) was used for DLS measurements and in the formation
of polymer/drug nanoparticles. The dialysis tubing (Spectropore, cellulose ester) which was
used for solvent removal had a molecular weight cut off (MWCO) of 25K.
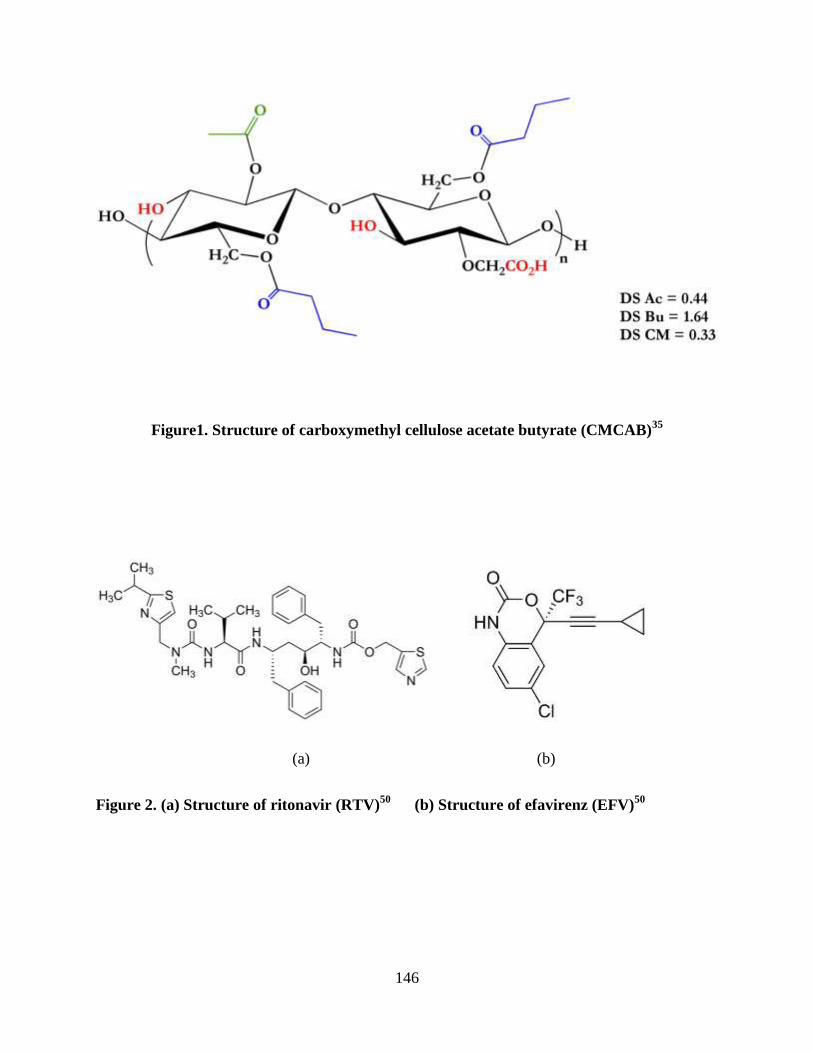
146
Figure1. Structure of carboxymethyl cellulose acetate butyrate (CMCAB)35
(a) (b)
Figure 2. (a) Structure of ritonavir (RTV)50
(b) Structure of efavirenz (EFV)50
147
4.2.2 Nanoparticle preparation by rapid precipitation in the Multi Inlet Vortex Mixer
Powdered CMCAB, drugs, and THF were weighed into a glass vial that was then sealed
with a screw cap and bath sonicated (Cole Parmer model 8890) for 45 minutes. Flash
nanoprecipitation of CMCAB-drug complexes was carried out in a four jet Multi-Inlet Vortex
Mixer that accommodates four streams49a,51
. The THF solution of CMCAB and drug (RTV/EFV)
was injected into the mixer along with three other water streams. The temperature of the streams
was adjusted to 25°C prior to injection into the mixer by immersing the delivery syringes in a
temperature controlled bath. The four inlet streams are tangential to the mixing chamber and exit
stream comes from the center of the chamber. The nanoparticles were formed at a nominal
Reynolds number of ~ 3900. The Reynolds number is a dimensionless number that is a measure
of turbulence and, in this case, of mixing time. It depends upon the inlet stream velocities,
viscosities, and densities49a,41
. The calculations for the Reynolds number are shown in
Supporting Information in Chapter 3.
A New Era 4000 double syringe pump (for the organic stream) and a Harvard Apparatus
Remote Infuse/Withdraw PHD 4000 Hpsi Programmable syringe pump (for the three water
streams) controlled the inlet flow rates. The New Era pump was controlled by the software,
Syringe Pump Pro version 1.53. The injected volume ratio of THF to Millipore water was 1:9
v/v. The concentration of CMCAB in THF used to make the particles was 10 mg/mL.
4.2.3 Microparticle formation
CMCAB (450 mg) in 30 mL acetone was stirred at room temperature until the polymer
was completely dissolved (approximately 2h). Ritonavir (150 mg) or efavirenz (150 mg) was
added to this solution and stirred for 10 min. The acetone solution containing the dissolved
polymer and drug was added drop-wise to 90 mL of water. The organic solvent was removed
148
from the resulting suspension using a rotary evaporator. The aqueous solution was then freeze-
dried to yield amorphous solid dispersions of ritonavir or efavirenz in CMCAB.
4.2.4 Nanoparticles recovery, solvent removal and drying
CMCAB-RTV/EFV suspensions were recovered from the MIVM and dialyzed to remove
THF, free drug, and dissolved polymer molecules. The dialysis was done with 40 mL of the
particles in dialysis tubing placed in a 4 L of DI water. The water was changed 4 times over a
period of 24 hours. The dialyzed particles were dried in a LABCONCO freeze dryer at 0.018
mbar for 2 days.
4.2.5 Drug composition by High Performance Liquid Chromatography (HPLC)
The drug contents of ASDs and dissolution samples were measured using an Agilent
1200 Series HPLC system which consisted of a quaternary pump, online degasser, manual
injector with a 20-μL sample loop and Agilent chemstation LC 3D software. Chromatography
was conducted in reverse mode using acetonitrile and phosphate buffer (0.05M pH 5.65). A
concentration gradient with the potassium phosphate buffer and acetonitrile was programmed.
The proportion of acetonitrile stayed at 40% for 1 min, was raised to 60% in 14 min, was
reduced back to 40% in 1 min and stayed at 40% for 4 min. The total analysis time was 20 min.
The mobile phase was delivered at a flow rate of 1.5 mL/min and the column temperature was
maintained at 30oC. The sample injection volume was 5 µL. Detection was performed by a diode
array detector at a wavelength of 240 nm for ritonavir and efavirenz. Calibration curves for RTV
and EFV dissolved in acetonitrile were developed and are shown in Figures S.1 and Figure S.2,
respectively, in the Supporting Information.
149
4.2.6 Particle size – Dynamic light scattering and scanning electron microscopy
Dynamic light scattering (DLS) measurements were performed of the nanoparticle sizes
were performed before and after the dialysis steps using a Malvern Zetasizer Nano-ZS (Malvern
Instruments Ltd, Malvern, UK) at a wavelength of 633 nm and with a scattering angle of 173˚ at
25 ± 0.1 ºC. Intensity average diameters were obtained by calculations using Malvern’s
Zetasizer nano 6.12, software that utilizes an algorithm based upon Mie theory with the
assumption that the scattering particles are hard spheres. For DLS analysis of the complexes,
typically 200 μl of the nanoparticle suspension obtained from the mixer were diluted with 2 mL
of deionized water. The dialyzed suspensions (1 mL) were diluted with 3 mL of deionized water
and the freeze dried powders were diluted with deionized water to make a concentration of 0.1
mg/mL. The suspensions were sonicated with a bath sonicator (Cole Parmer model 8890) for 10
minutes before measuring the particle size by dynamic light scattering. Field emission scanning
electron microscope (FESEM) images of the microparticles were obtained using a LEO (Zeiss)
1550 instrument at a 5 kV accelerating voltage in the conventional high vacuum mode.
4.2.7 Characterization of crystallinity
The crystallinity properties of nanoparticles and microparticles were evaluated by powder
X-ray diffraction (PXRD) and differential scanning calorimeter (DSC) experiments within 2-3
weeks from the preparation of the particles. PXRD experiments were conducted with samples of
the CMCAB (as received), RTV and EFV (as received), physical mixtures of the as-received
CMCAB and the drugs (mixed by grinding with a mortar and pestle) and the nanoparticles.
PXRD patterns were obtained using a Bruker D8 Discover X-ray Diffraction system (Madison,
Wisconsin) which emits Kα radiation (λ = 1.54 Aº) at 2200 watts and an accelerating potential of
60 kV. The divergence and scattering slits were set at 1.0° and the receiving slit was set at 0.1
150
mm. The experiment was conducted with a scan range from 10° - 40° 2θ, while the scanning
speed was 4°/min.
A differential scanning calorimeter (TA instruments model Q2000) equipped with a
RCA90 refrigerated cooling accessory was used to characterize the thermal transitions of the
polymer-drug mixtures. About 1.5-3.5 mg of sample (polymer, pure drugs, or nanoparticles) in
an aluminum Tzero pan as heated at a scanning rate of 10° C/min from a temperature of -85°C to
180°C, quenched, and then heated again. Dry N2 was used as the purge gas at 50 mL/min. The
instrument was equilibrated at -85°C. Calibration of temperature and the cell constant as carried
out with Indium. Glass transition (Tg) values were recorded as the mid-point of the endothermic
step transition from 2nd
heat scans. Thermal transitions were viewed and analyzed using the
analysis software Universal Analysis 2000.
4.2.8 Dissolution studies
Typically, 10 mg of RTV/EFV or 15 mg of nanoparticles were dispersed in 80 mL
potassium phosphate buffer, pH 6.8, at 37°C for 5 h. The apparatus used in the release
experiments consisted of 250-mL jacketed flasks with circulating ethylene glycol/water (1:1) to
control temperature. The solution was constantly stirred at 200 rpm with a magnetic bar.
Aliquots (0.8 mL) were withdrawn from the suspensions every 0.5 h (during the first 2 h), then
every hour for 5 h. Phosphate buffer (0.8 mL) was added to maintain constant volume after each
aliquot was withdrawn. The supernatant was separated from excess solid in solution by
ultracentrifugation at 13,000 rpm (equivalent of 16,060 g’s) in an accuSpin Micro (Fisher
Scientific) for 10 minutes. The supernatant was recovered, and drug concentration was
determined by HPLC. Microparticles containing an amount of drug equivalent to that of the
151
nanoparticles were used to compare the solubility and release of drugs vs particle diameter.
Solubility studies were done approximately 2-3 weeks after the preparation of the particles.
4.3. RESULTS AND DISCUSSION
We investigated the drug content, size, crystallinity and solubility of the nanoparticles.
We compared our results with microparticles of CMCAB-RTV and CMCAB-EFV formed by the
co-precipitation method. The role of CMCAB in enhancing solubility and inhibiting drug
crystallinity in the particles is also discussed. The multi-inlet vortex mixer makes it possible to
produce nanoparticles with high drug loadings and well-controlled particle size distributions.
Increasing the drug concentration in the mixer causes the drug supersaturation to increase which
should lead to a higher drug loading in the nanoparticles.
4.3.1 Drug incorporation in particles
Drug incorporation in nanoparticles
The RTV and EFV drug loadings of nanoparticles, shown in Figure 3 as wt % of drug,
Wdrug, were calculated using equation [S.9] in Supplementary Information. The calculations for
the relative standard deviation of drug loading (σwdrug) were made using equation [S.10] in
Supplementary Information.
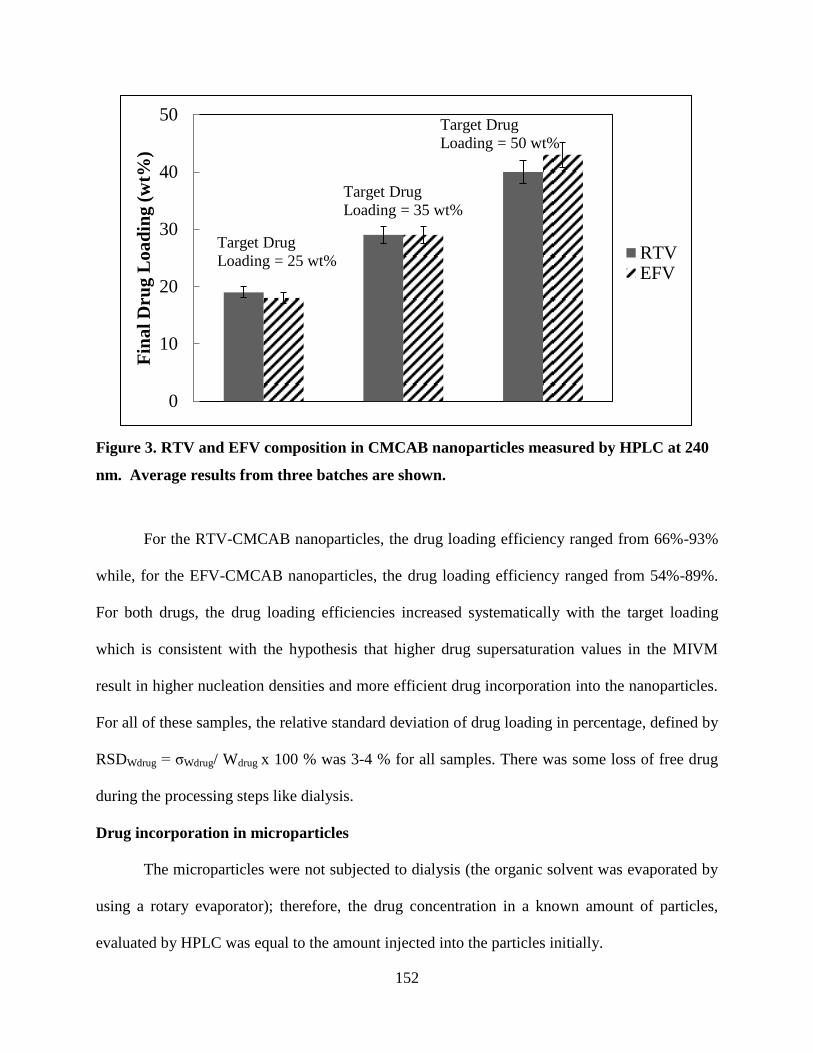
152
Figure 3. RTV and EFV composition in CMCAB nanoparticles measured by HPLC at 240
nm. Average results from three batches are shown.
For the RTV-CMCAB nanoparticles, the drug loading efficiency ranged from 66%-93%
while, for the EFV-CMCAB nanoparticles, the drug loading efficiency ranged from 54%-89%.
For both drugs, the drug loading efficiencies increased systematically with the target loading
which is consistent with the hypothesis that higher drug supersaturation values in the MIVM
result in higher nucleation densities and more efficient drug incorporation into the nanoparticles.
For all of these samples, the relative standard deviation of drug loading in percentage, defined by
RSDWdrug = σWdrug/ Wdrug x 100 % was 3-4 % for all samples. There was some loss of free drug
during the processing steps like dialysis.
Drug incorporation in microparticles
The microparticles were not subjected to dialysis (the organic solvent was evaporated by
using a rotary evaporator); therefore, the drug concentration in a known amount of particles,
evaluated by HPLC was equal to the amount injected into the particles initially.
0
10
20
30
40
50
Fin
al
Dru
g L
oa
din
g (
wt%
)
RTVEFV
Target Drug
Loading = 50 wt%
Target Drug
Loading = 35 wt%
Target Drug
Loading = 25 wt%
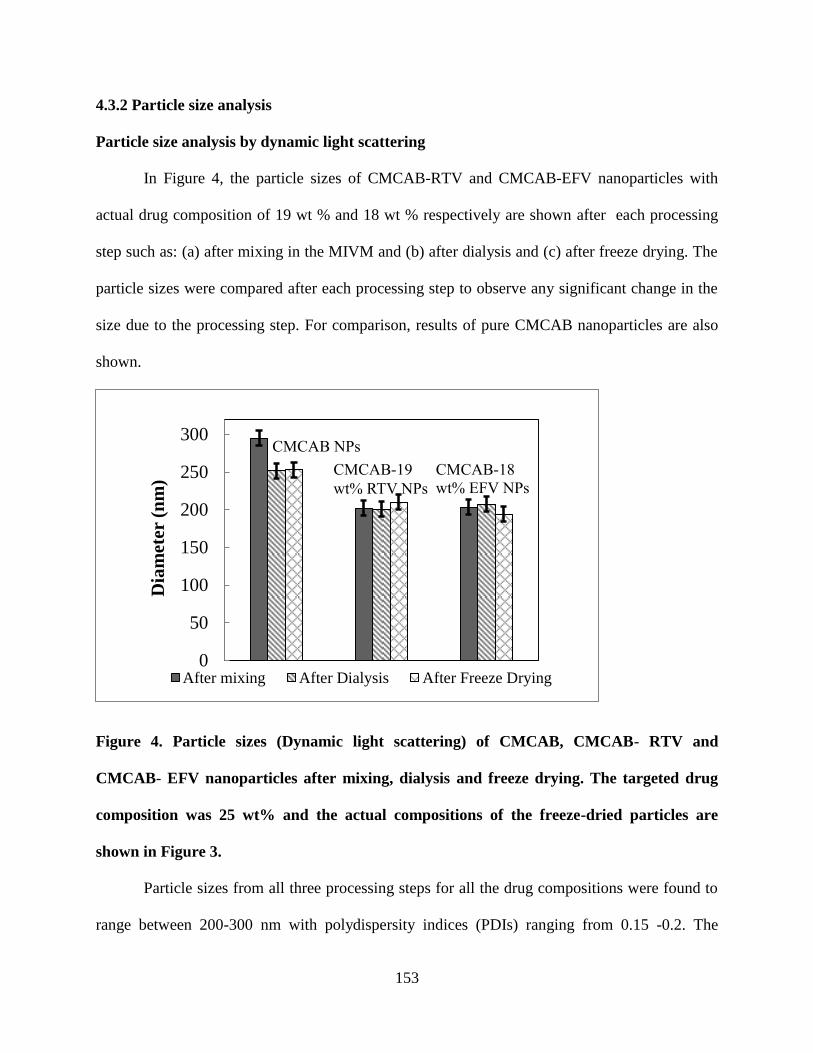
153
4.3.2 Particle size analysis
Particle size analysis by dynamic light scattering
In Figure 4, the particle sizes of CMCAB-RTV and CMCAB-EFV nanoparticles with
actual drug composition of 19 wt % and 18 wt % respectively are shown after each processing
step such as: (a) after mixing in the MIVM and (b) after dialysis and (c) after freeze drying. The
particle sizes were compared after each processing step to observe any significant change in the
size due to the processing step. For comparison, results of pure CMCAB nanoparticles are also
shown.
Figure 4. Particle sizes (Dynamic light scattering) of CMCAB, CMCAB- RTV and
CMCAB- EFV nanoparticles after mixing, dialysis and freeze drying. The targeted drug
composition was 25 wt% and the actual compositions of the freeze-dried particles are
shown in Figure 3.
Particle sizes from all three processing steps for all the drug compositions were found to
range between 200-300 nm with polydispersity indices (PDIs) ranging from 0.15 -0.2. The
0
50
100
150
200
250
300
Dia
met
er (
nm
)
After mixing After Dialysis After Freeze Drying
CMCAB NPs
CMCAB-19
wt% RTV NPs
CMCAB-18
wt% EFV NPs
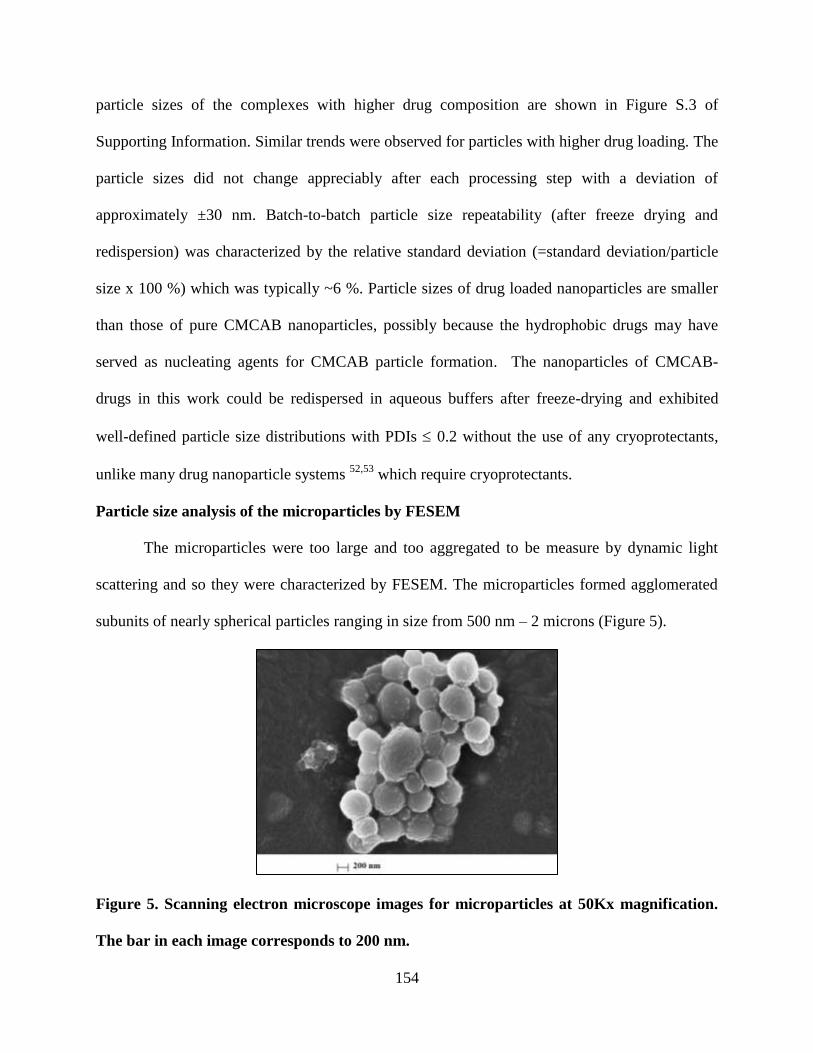
154
particle sizes of the complexes with higher drug composition are shown in Figure S.3 of
Supporting Information. Similar trends were observed for particles with higher drug loading. The
particle sizes did not change appreciably after each processing step with a deviation of
approximately ±30 nm. Batch-to-batch particle size repeatability (after freeze drying and
redispersion) was characterized by the relative standard deviation (=standard deviation/particle
size x 100 %) which was typically ~6 %. Particle sizes of drug loaded nanoparticles are smaller
than those of pure CMCAB nanoparticles, possibly because the hydrophobic drugs may have
served as nucleating agents for CMCAB particle formation. The nanoparticles of CMCAB-
drugs in this work could be redispersed in aqueous buffers after freeze-drying and exhibited
well-defined particle size distributions with PDIs 0.2 without the use of any cryoprotectants,
unlike many drug nanoparticle systems 52,53
which require cryoprotectants.
Particle size analysis of the microparticles by FESEM
The microparticles were too large and too aggregated to be measure by dynamic light
scattering and so they were characterized by FESEM. The microparticles formed agglomerated
subunits of nearly spherical particles ranging in size from 500 nm – 2 microns (Figure 5).
Figure 5. Scanning electron microscope images for microparticles at 50Kx magnification.
The bar in each image corresponds to 200 nm.
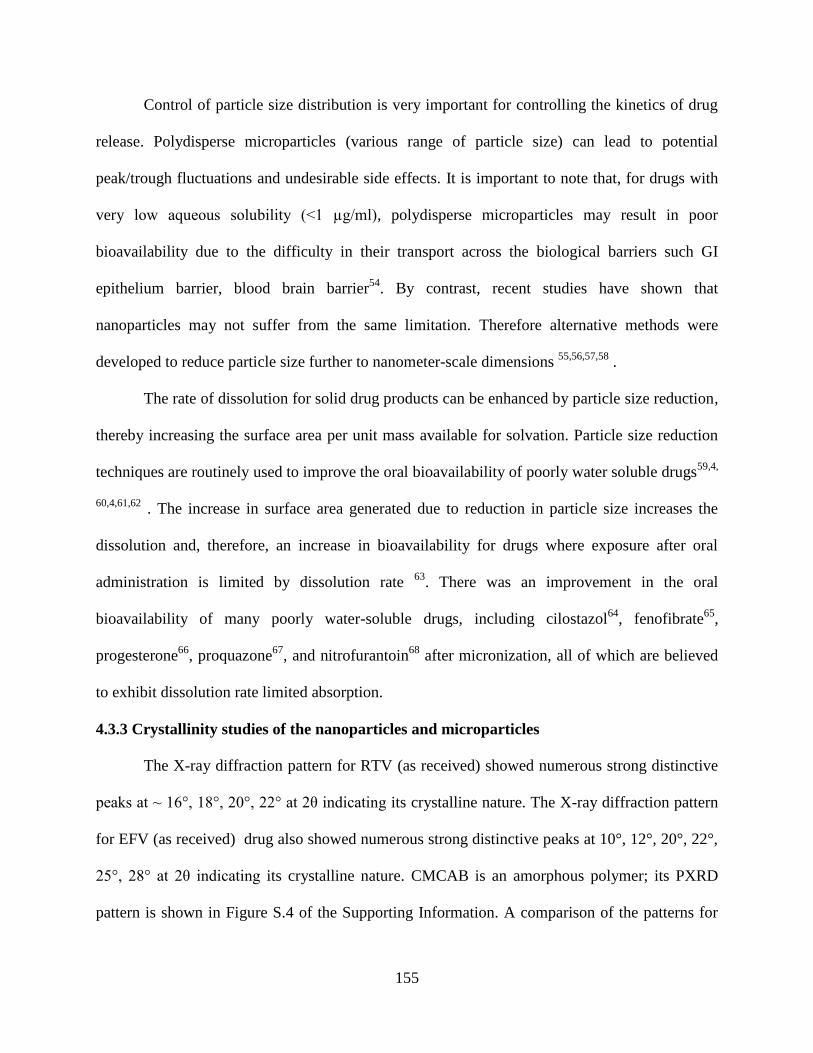
155
Control of particle size distribution is very important for controlling the kinetics of drug
release. Polydisperse microparticles (various range of particle size) can lead to potential
peak/trough fluctuations and undesirable side effects. It is important to note that, for drugs with
very low aqueous solubility (˂1 µg/ml), polydisperse microparticles may result in poor
bioavailability due to the difficulty in their transport across the biological barriers such GI
epithelium barrier, blood brain barrier54
. By contrast, recent studies have shown that
nanoparticles may not suffer from the same limitation. Therefore alternative methods were
developed to reduce particle size further to nanometer-scale dimensions 55,56,57,58
.
The rate of dissolution for solid drug products can be enhanced by particle size reduction,
thereby increasing the surface area per unit mass available for solvation. Particle size reduction
techniques are routinely used to improve the oral bioavailability of poorly water soluble drugs59,4,
60,4,61,62 . The increase in surface area generated due to reduction in particle size increases the
dissolution and, therefore, an increase in bioavailability for drugs where exposure after oral
administration is limited by dissolution rate 63
. There was an improvement in the oral
bioavailability of many poorly water-soluble drugs, including cilostazol64
, fenofibrate65
,
progesterone66
, proquazone67
, and nitrofurantoin68
after micronization, all of which are believed
to exhibit dissolution rate limited absorption.
4.3.3 Crystallinity studies of the nanoparticles and microparticles
The X-ray diffraction pattern for RTV (as received) showed numerous strong distinctive
peaks at ~ 16°, 18°, 20°, 22° at 2θ indicating its crystalline nature. The X-ray diffraction pattern
for EFV (as received) drug also showed numerous strong distinctive peaks at 10°, 12°, 20°, 22°,
25°, 28° at 2θ indicating its crystalline nature. CMCAB is an amorphous polymer; its PXRD
pattern is shown in Figure S.4 of the Supporting Information. A comparison of the patterns for
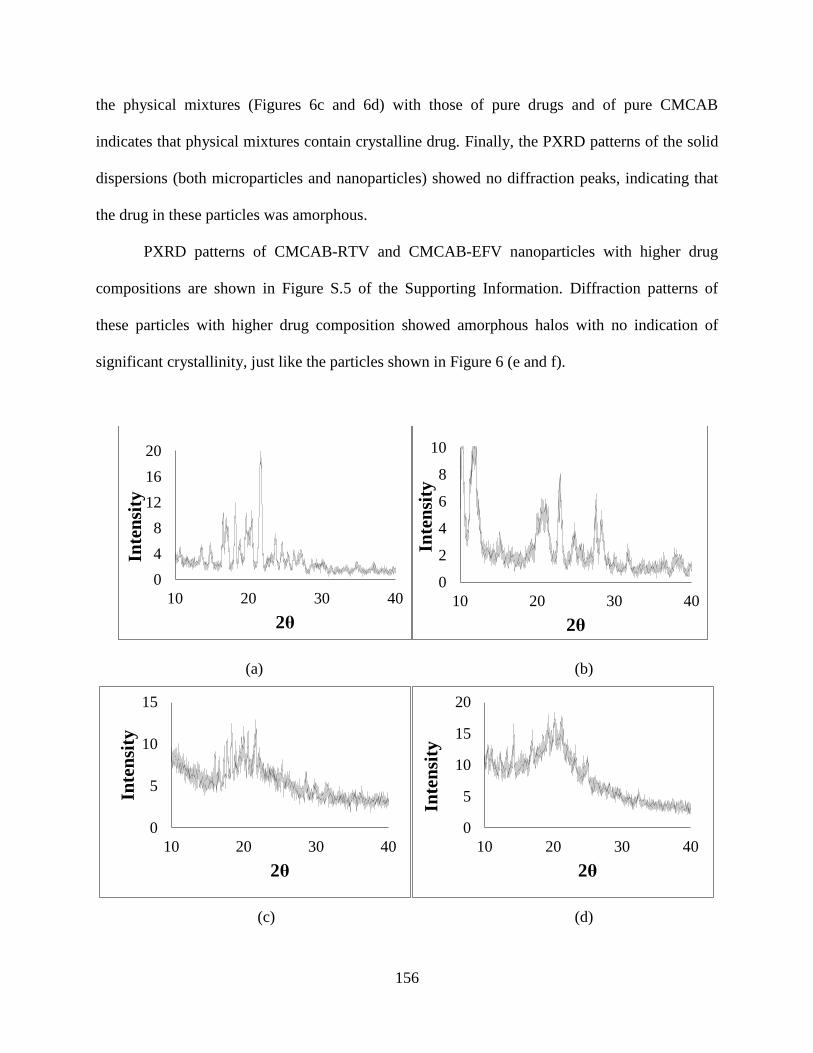
156
the physical mixtures (Figures 6c and 6d) with those of pure drugs and of pure CMCAB
indicates that physical mixtures contain crystalline drug. Finally, the PXRD patterns of the solid
dispersions (both microparticles and nanoparticles) showed no diffraction peaks, indicating that
the drug in these particles was amorphous.
PXRD patterns of CMCAB-RTV and CMCAB-EFV nanoparticles with higher drug
compositions are shown in Figure S.5 of the Supporting Information. Diffraction patterns of
these particles with higher drug composition showed amorphous halos with no indication of
significant crystallinity, just like the particles shown in Figure 6 (e and f).
(a) (b)
(c) (d)
0
4
8
12
16
20
10 20 30 40
Inte
nsi
ty
2θ
0
2
4
6
8
10
10 20 30 40
Inte
nsi
ty
2θ
0
5
10
15
10 20 30 40
Inte
nsi
ty
2θ
0
5
10
15
20
10 20 30 40
Inte
nsi
ty
2θ
157
(e) (f)
(g) (h)
Figure 6. X-ray diffractograms of (a) Crystalline RTV (as received), (b) Crystalline EFV
(as received), (c) Physical mixture of CMCAB-25 wt% RTV, (d) Physical mixture of
CMCAB-25 wt% EFV, (e) CMCAB-RTV (actual drug loading is 19 wt%), (f) CMCAB-
EFV (actual drug loading is 19 wt%), (g) CMCAB-RTV microparticles with 25 wt% of
RTV, (h) CMCAB-EFV microparticles with 25 wt % of EFV
0
2
4
6
8
10
10 20 30 40
Inte
nsi
ty
2θ
0
4
8
12
10 20 30 40
Inte
nsi
ty
2θ
0
50
100
150
10 20 30 40
Inte
nsi
ty
2θ
0
40
80
120
10 20 30 40
Inte
nsi
ty
2θ
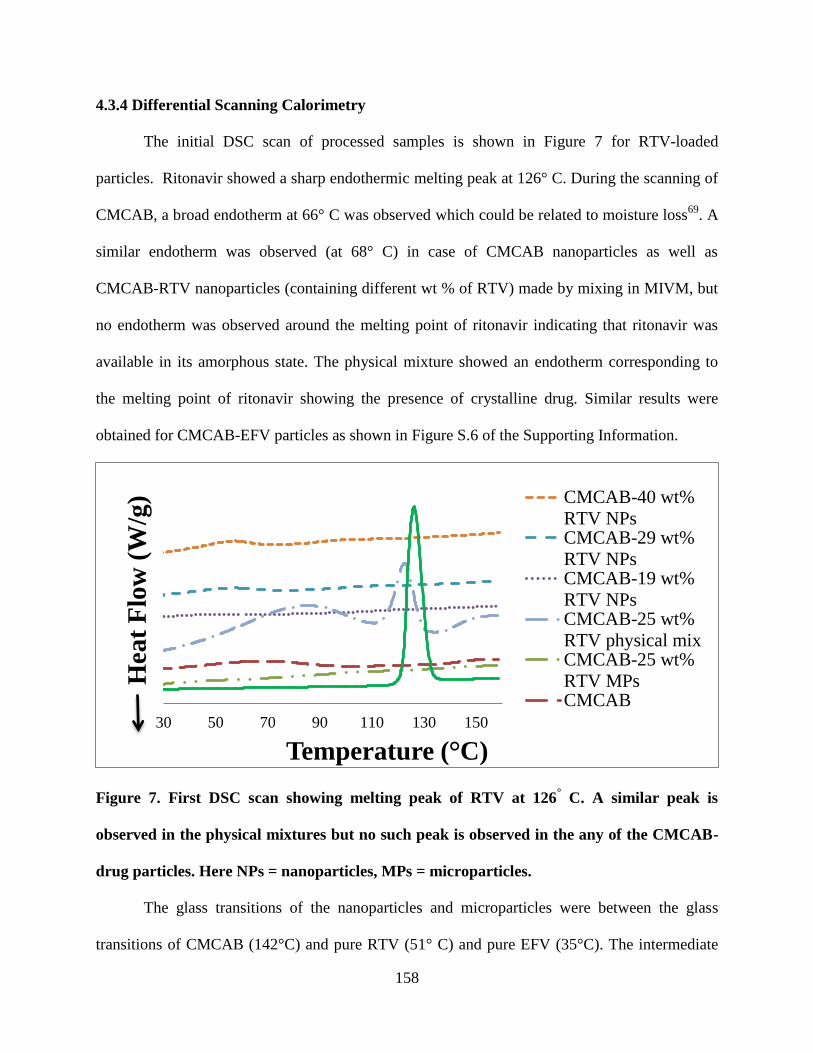
158
4.3.4 Differential Scanning Calorimetry
The initial DSC scan of processed samples is shown in Figure 7 for RTV-loaded
particles. Ritonavir showed a sharp endothermic melting peak at 126° C. During the scanning of
CMCAB, a broad endotherm at 66° C was observed which could be related to moisture loss69
. A
similar endotherm was observed (at 68° C) in case of CMCAB nanoparticles as well as
CMCAB-RTV nanoparticles (containing different wt % of RTV) made by mixing in MIVM, but
no endotherm was observed around the melting point of ritonavir indicating that ritonavir was
available in its amorphous state. The physical mixture showed an endotherm corresponding to
the melting point of ritonavir showing the presence of crystalline drug. Similar results were
obtained for CMCAB-EFV particles as shown in Figure S.6 of the Supporting Information.
Figure 7. First DSC scan showing melting peak of RTV at 126° C. A similar peak is
observed in the physical mixtures but no such peak is observed in the any of the CMCAB-
drug particles. Here NPs = nanoparticles, MPs = microparticles.
The glass transitions of the nanoparticles and microparticles were between the glass
transitions of CMCAB (142°C) and pure RTV (51° C) and pure EFV (35°C). The intermediate
30 50 70 90 110 130 150
Hea
t F
low
(W
/g)
Temperature (°C)
CMCAB-40 wt%
RTV NPsCMCAB-29 wt%
RTV NPsCMCAB-19 wt%
RTV NPsCMCAB-25 wt%
RTV physical mixCMCAB-25 wt%
RTV MPsCMCAB
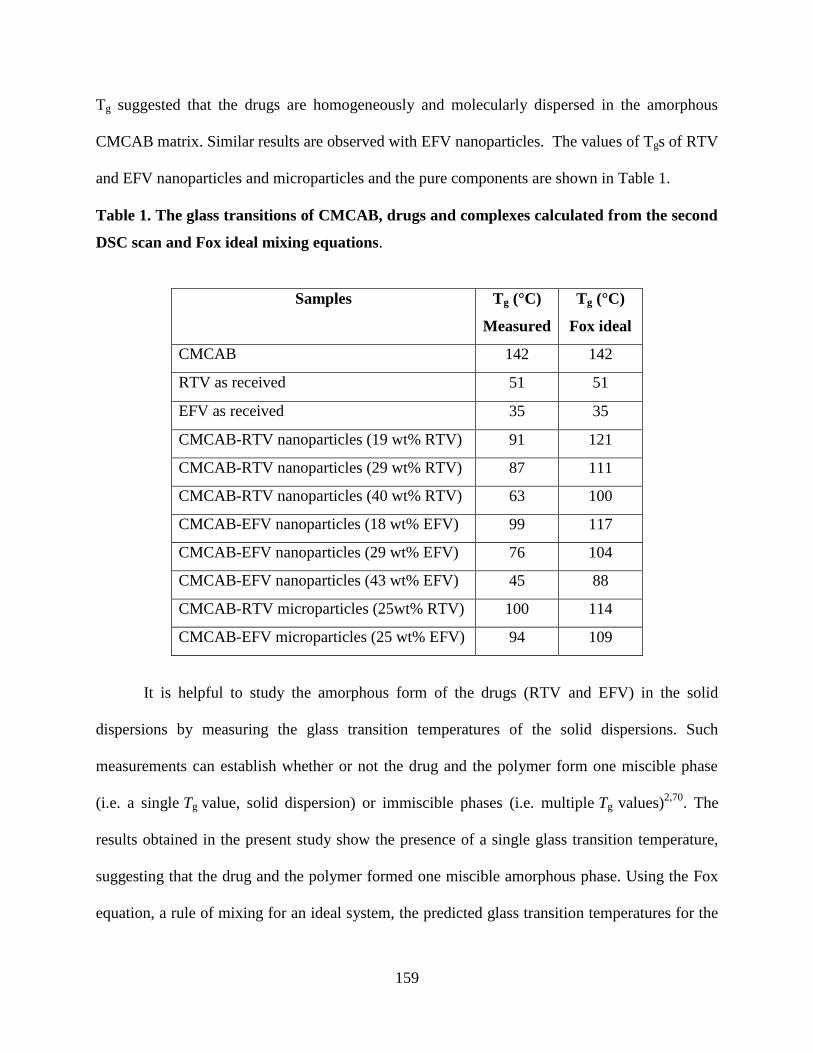
159
Tg suggested that the drugs are homogeneously and molecularly dispersed in the amorphous
CMCAB matrix. Similar results are observed with EFV nanoparticles. The values of Tgs of RTV
and EFV nanoparticles and microparticles and the pure components are shown in Table 1.
Table 1. The glass transitions of CMCAB, drugs and complexes calculated from the second
DSC scan and Fox ideal mixing equations.
Samples Tg (°C)
Measured
Tg (°C)
Fox ideal
CMCAB 142 142
RTV as received 51 51
EFV as received 35 35
CMCAB-RTV nanoparticles (19 wt% RTV) 91 121
CMCAB-RTV nanoparticles (29 wt% RTV) 87 111
CMCAB-RTV nanoparticles (40 wt% RTV) 63 100
CMCAB-EFV nanoparticles (18 wt% EFV) 99 117
CMCAB-EFV nanoparticles (29 wt% EFV) 76 104
CMCAB-EFV nanoparticles (43 wt% EFV) 45 88
CMCAB-RTV microparticles (25wt% RTV) 100 114
CMCAB-EFV microparticles (25 wt% EFV) 94 109
It is helpful to study the amorphous form of the drugs (RTV and EFV) in the solid
dispersions by measuring the glass transition temperatures of the solid dispersions. Such
measurements can establish whether or not the drug and the polymer form one miscible phase
(i.e. a single Tg value, solid dispersion) or immiscible phases (i.e. multiple Tg values)2,70
. The
results obtained in the present study show the presence of a single glass transition temperature,
suggesting that the drug and the polymer formed one miscible amorphous phase. Using the Fox
equation, a rule of mixing for an ideal system, the predicted glass transition temperatures for the
160
CMCAB-RTV and CMCAB-EFV solid dispersions obtained using these methods, were
compared with the experimentally determined values obtained from the DSC.
Fox ideal mixing:
(1)
where W(RTV or EFV) and W(CMCAB) are the weight fractions of RTV (or EFV) and HPMCAS,
respectively, and Tg(RTV or EFV)
and Tg(CMCAB)
are the glass transition temperatures of RTV (or
EFV) (i.e. 51ºC or 35 ºC) and CMCAB (142 ºC), respectively. As these predictions assume that
there is a linear extrapolation between the Tg values obtained for drugs (RTV and EFV) and
CMCAB, any deviation from the predicted values is taken to indicate the presence of molecular
interactions between the molecules. For both the RTV- and EFV-containing nanoparticles,
increasing the drug loading resulted in increasing deviations from the Fox-equation prediction,
particularly at drug loading of 29 wt% and higher. The microparticles prepared by co-
precipitation also showed variations from predicted Fox equation values.
In all cases for both RTV and EFV, both nanoparticles and microparticles the values of
Tg fall below the predictions of the Fox equation whereas those of the physical mixtures lie
above the predictions. This is consistent with the view that the drug polymer interactions are
much the same, regardless of particle size and these particular preparation methods. In view of
the limited data for the microparticles, the deviations of these from the Fox equations are similar
in magnitude to those of the nanoparticles.
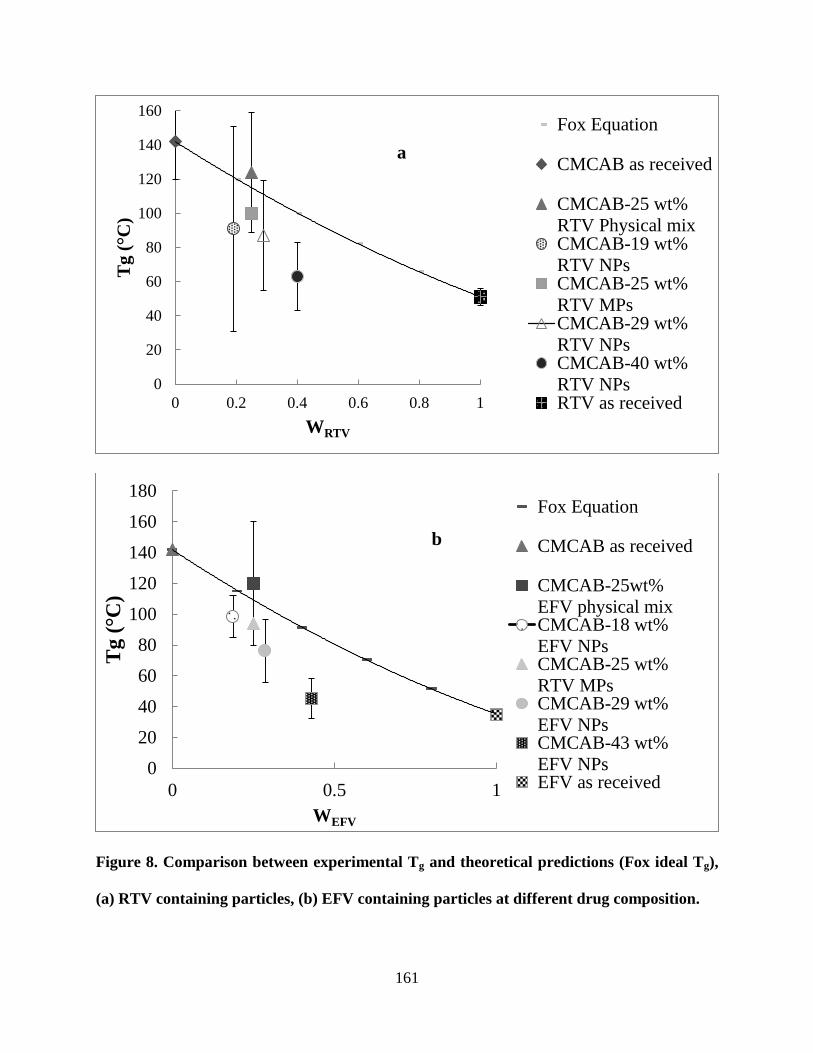
161
Figure 8. Comparison between experimental Tg and theoretical predictions (Fox ideal Tg),
(a) RTV containing particles, (b) EFV containing particles at different drug composition.
0
20
40
60
80
100
120
140
160
0 0.2 0.4 0.6 0.8 1
Tg
(°C
)
WRTV
Fox Equation
CMCAB as received
CMCAB-25 wt%
RTV Physical mixCMCAB-19 wt%
RTV NPsCMCAB-25 wt%
RTV MPsCMCAB-29 wt%
RTV NPsCMCAB-40 wt%
RTV NPsRTV as received
0
20
40
60
80
100
120
140
160
180
0 0.5 1
Tg
(°C
)
WEFV
Fox Equation
CMCAB as received
CMCAB-25wt%
EFV physical mixCMCAB-18 wt%
EFV NPsCMCAB-25 wt%
RTV MPsCMCAB-29 wt%
EFV NPsCMCAB-43 wt%
EFV NPsEFV as received
b
a
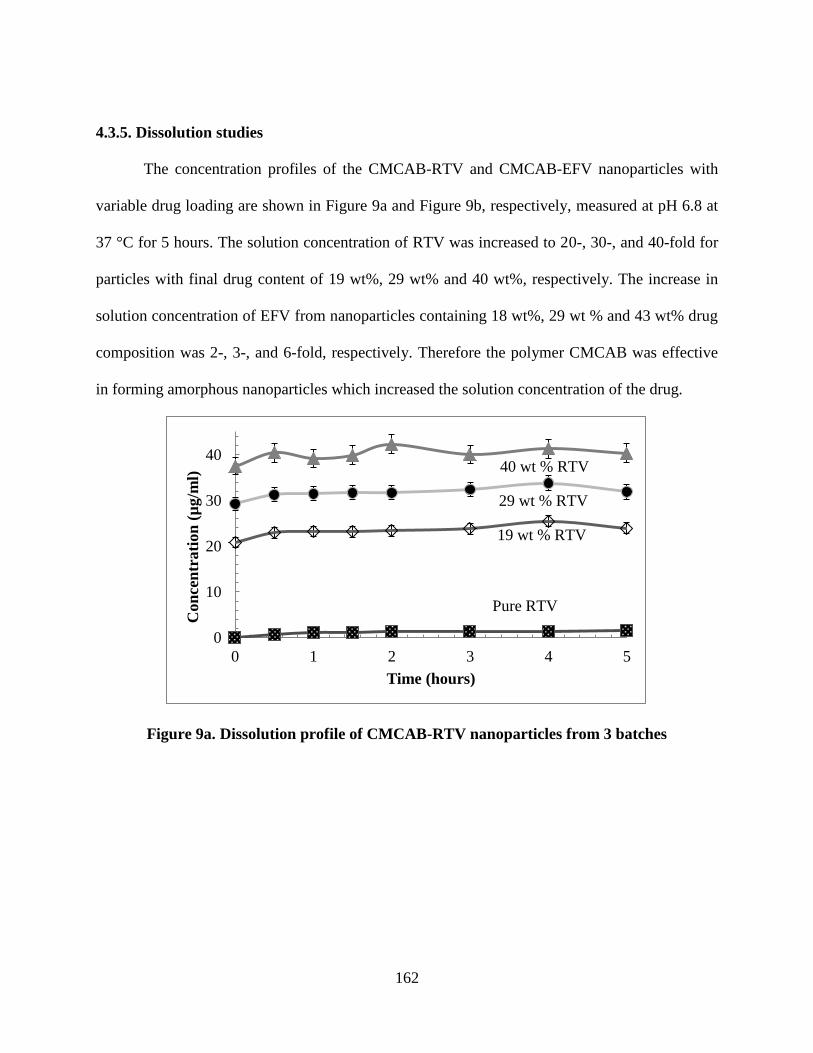
162
4.3.5. Dissolution studies
The concentration profiles of the CMCAB-RTV and CMCAB-EFV nanoparticles with
variable drug loading are shown in Figure 9a and Figure 9b, respectively, measured at pH 6.8 at
37 °C for 5 hours. The solution concentration of RTV was increased to 20-, 30-, and 40-fold for
particles with final drug content of 19 wt%, 29 wt% and 40 wt%, respectively. The increase in
solution concentration of EFV from nanoparticles containing 18 wt%, 29 wt % and 43 wt% drug
composition was 2-, 3-, and 6-fold, respectively. Therefore the polymer CMCAB was effective
in forming amorphous nanoparticles which increased the solution concentration of the drug.
Figure 9a. Dissolution profile of CMCAB-RTV nanoparticles from 3 batches
0
10
20
30
40
0 1 2 3 4 5
Con
cen
trati
on
(µ
g/m
l)
Time (hours)
19 wt % RTV
29 wt % RTV
40 wt % RTV
Pure RTV
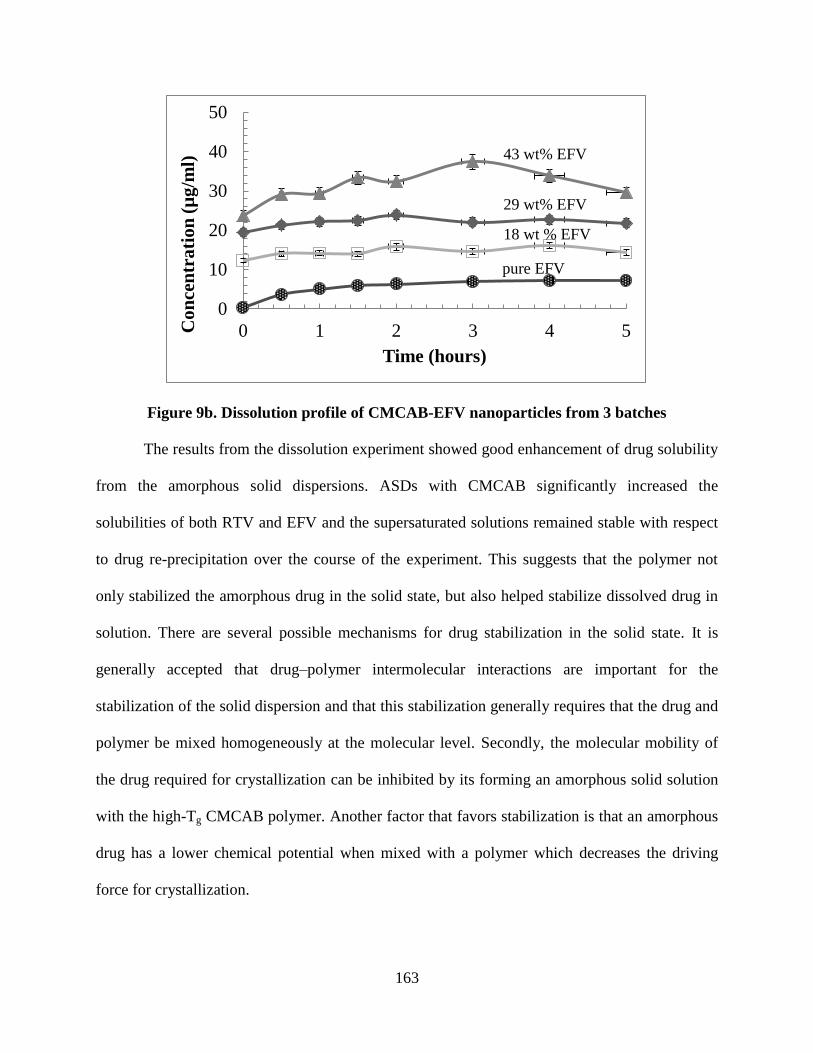
163
Figure 9b. Dissolution profile of CMCAB-EFV nanoparticles from 3 batches
The results from the dissolution experiment showed good enhancement of drug solubility
from the amorphous solid dispersions. ASDs with CMCAB significantly increased the
solubilities of both RTV and EFV and the supersaturated solutions remained stable with respect
to drug re-precipitation over the course of the experiment. This suggests that the polymer not
only stabilized the amorphous drug in the solid state, but also helped stabilize dissolved drug in
solution. There are several possible mechanisms for drug stabilization in the solid state. It is
generally accepted that drug–polymer intermolecular interactions are important for the
stabilization of the solid dispersion and that this stabilization generally requires that the drug and
polymer be mixed homogeneously at the molecular level. Secondly, the molecular mobility of
the drug required for crystallization can be inhibited by its forming an amorphous solid solution
with the high-Tg CMCAB polymer. Another factor that favors stabilization is that an amorphous
drug has a lower chemical potential when mixed with a polymer which decreases the driving
force for crystallization.
0
10
20
30
40
50
0 1 2 3 4 5Co
nce
ntr
ati
on
(µ
g/m
l)
Time (hours)
pure EFV
18 wt % EFV
29 wt% EFV
43 wt% EFV
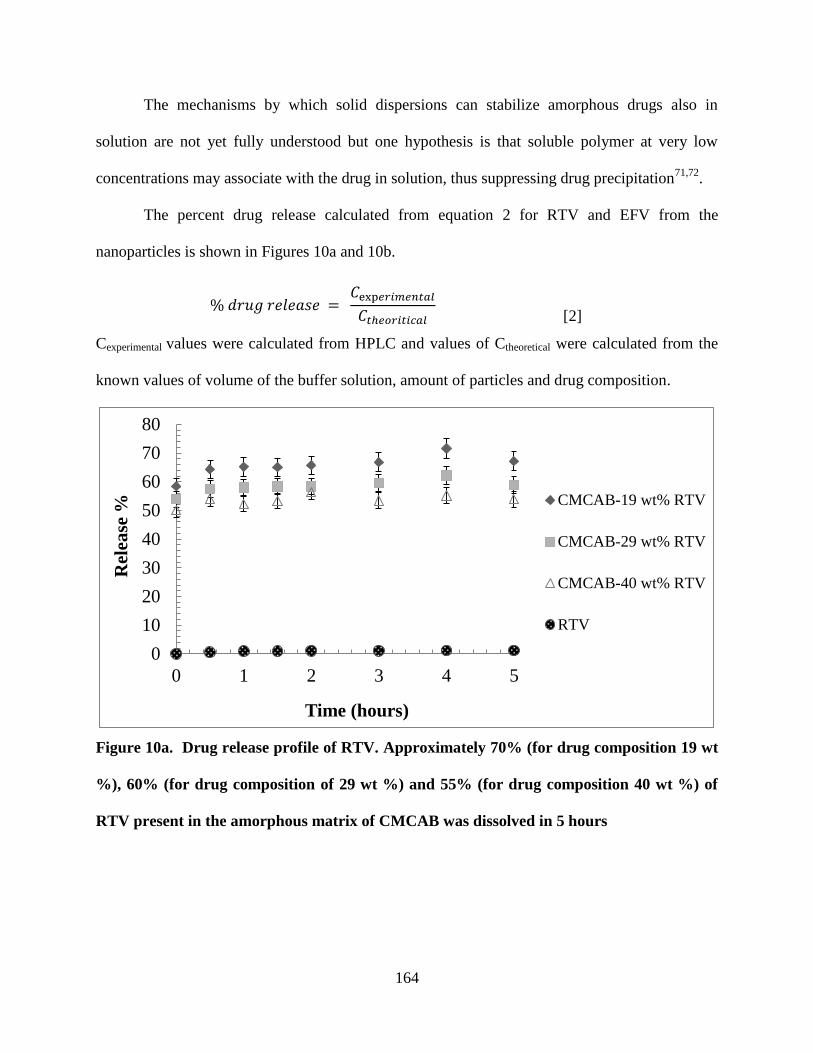
164
The mechanisms by which solid dispersions can stabilize amorphous drugs also in
solution are not yet fully understood but one hypothesis is that soluble polymer at very low
concentrations may associate with the drug in solution, thus suppressing drug precipitation71,72
.
The percent drug release calculated from equation 2 for RTV and EFV from the
nanoparticles is shown in Figures 10a and 10b.
[2]
Cexperimental values were calculated from HPLC and values of Ctheoretical were calculated from the
known values of volume of the buffer solution, amount of particles and drug composition.
Figure 10a. Drug release profile of RTV. Approximately 70% (for drug composition 19 wt
%), 60% (for drug composition of 29 wt %) and 55% (for drug composition 40 wt %) of
RTV present in the amorphous matrix of CMCAB was dissolved in 5 hours
0
10
20
30
40
50
60
70
80
0 1 2 3 4 5
Rel
ease
%
Time (hours)
CMCAB-19 wt% RTV
CMCAB-29 wt% RTV
CMCAB-40 wt% RTV
RTV
% 𝑑𝑟𝑢𝑔 𝑟𝑒𝑙𝑒𝑎𝑠𝑒 𝐶
𝐶
× 100%
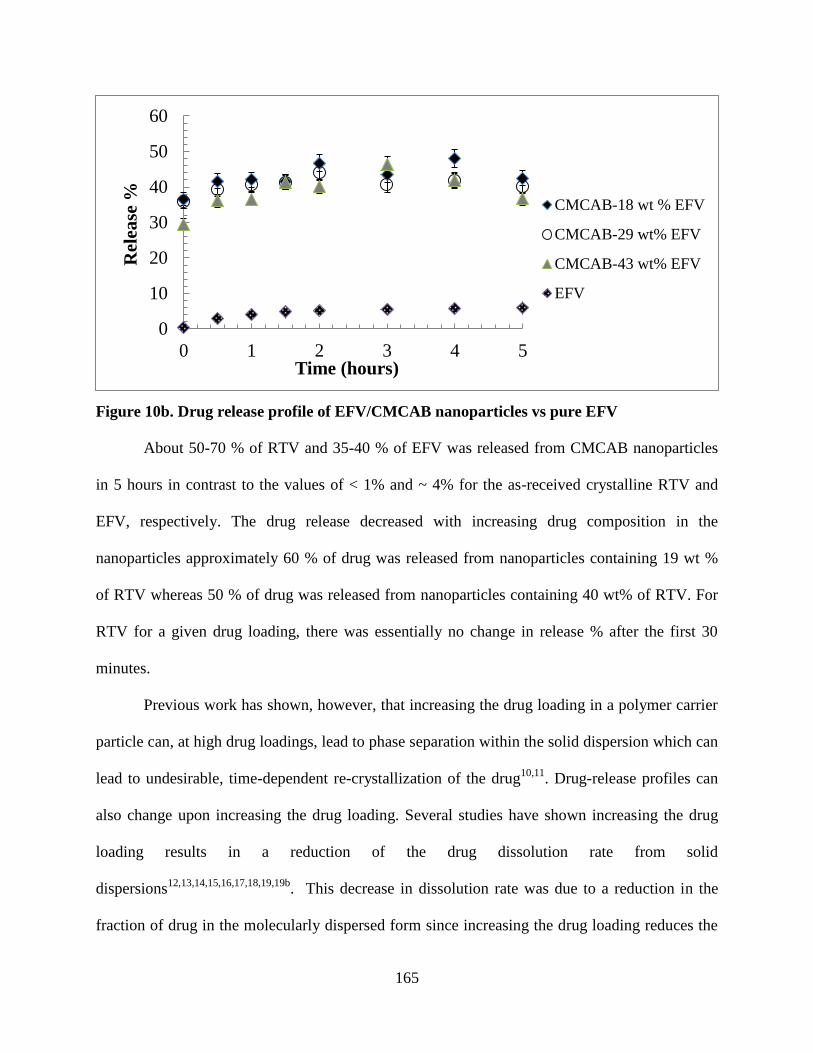
165
Figure 10b. Drug release profile of EFV/CMCAB nanoparticles vs pure EFV
About 50-70 % of RTV and 35-40 % of EFV was released from CMCAB nanoparticles
in 5 hours in contrast to the values of < 1% and ~ 4% for the as-received crystalline RTV and
EFV, respectively. The drug release decreased with increasing drug composition in the
nanoparticles approximately 60 % of drug was released from nanoparticles containing 19 wt %
of RTV whereas 50 % of drug was released from nanoparticles containing 40 wt% of RTV. For
RTV for a given drug loading, there was essentially no change in release % after the first 30
minutes.
Previous work has shown, however, that increasing the drug loading in a polymer carrier
particle can, at high drug loadings, lead to phase separation within the solid dispersion which can
lead to undesirable, time-dependent re-crystallization of the drug10,11
. Drug-release profiles can
also change upon increasing the drug loading. Several studies have shown increasing the drug
loading results in a reduction of the drug dissolution rate from solid
dispersions12,13,14,15,16,17,18,19,19b
. This decrease in dissolution rate was due to a reduction in the
fraction of drug in the molecularly dispersed form since increasing the drug loading reduces the
0
10
20
30
40
50
60
0 1 2 3 4 5
Rel
ease
%
Time (hours)
CMCAB-18 wt % EFV
CMCAB-29 wt% EFV
CMCAB-43 wt% EFV
EFV
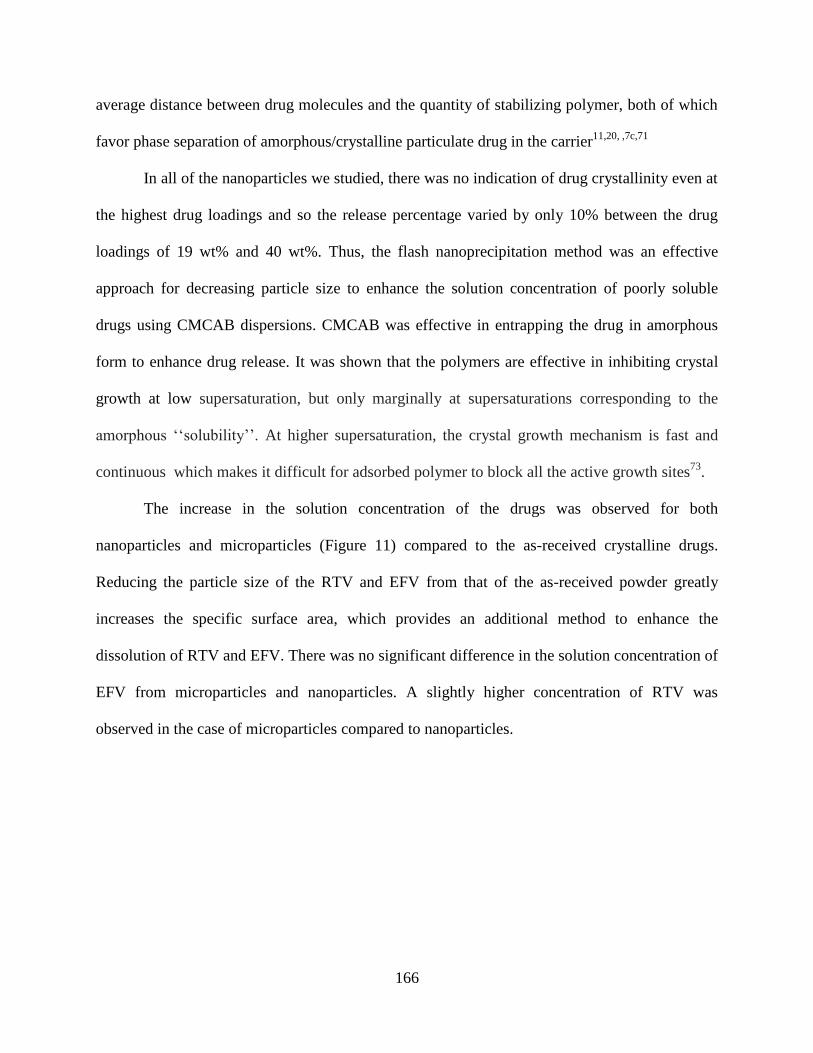
166
average distance between drug molecules and the quantity of stabilizing polymer, both of which
favor phase separation of amorphous/crystalline particulate drug in the carrier11,20, ,7c,71
In all of the nanoparticles we studied, there was no indication of drug crystallinity even at
the highest drug loadings and so the release percentage varied by only 10% between the drug
loadings of 19 wt% and 40 wt%. Thus, the flash nanoprecipitation method was an effective
approach for decreasing particle size to enhance the solution concentration of poorly soluble
drugs using CMCAB dispersions. CMCAB was effective in entrapping the drug in amorphous
form to enhance drug release. It was shown that the polymers are effective in inhibiting crystal
growth at low supersaturation, but only marginally at supersaturations corresponding to the
amorphous ‘‘solubility’’. At higher supersaturation, the crystal growth mechanism is fast and
continuous which makes it difficult for adsorbed polymer to block all the active growth sites73
.
The increase in the solution concentration of the drugs was observed for both
nanoparticles and microparticles (Figure 11) compared to the as-received crystalline drugs.
Reducing the particle size of the RTV and EFV from that of the as-received powder greatly
increases the specific surface area, which provides an additional method to enhance the
dissolution of RTV and EFV. There was no significant difference in the solution concentration of
EFV from microparticles and nanoparticles. A slightly higher concentration of RTV was
observed in the case of microparticles compared to nanoparticles.
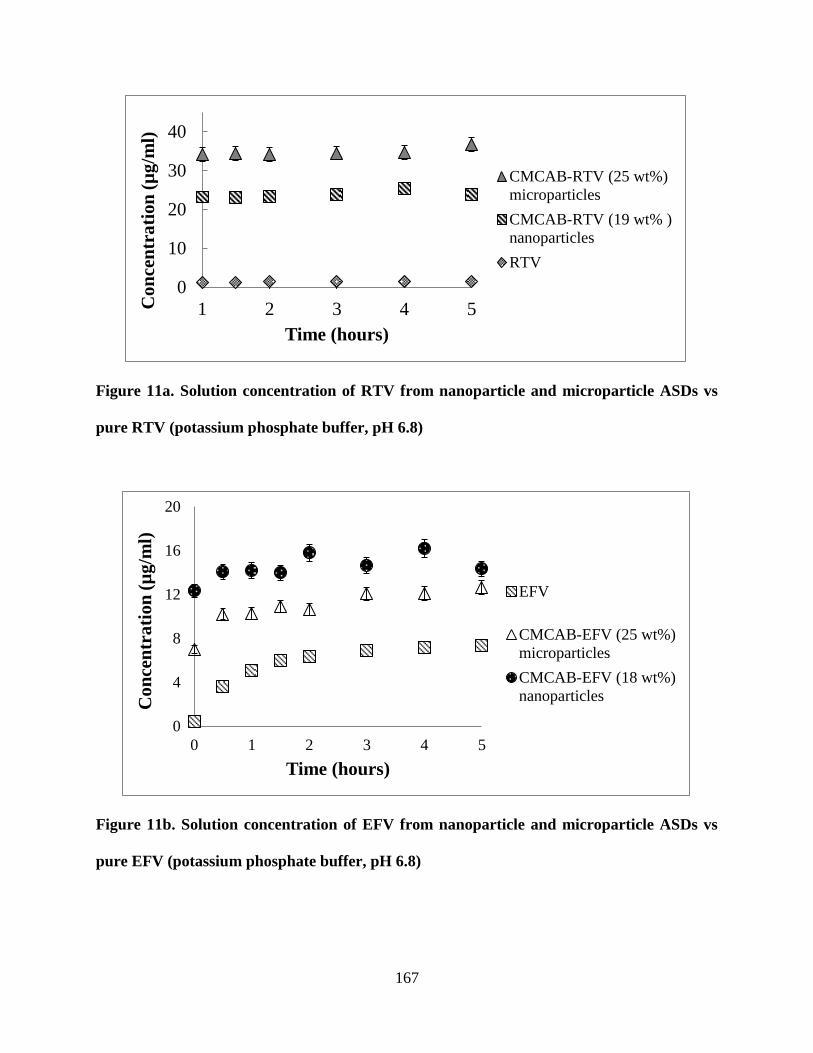
167
Figure 11a. Solution concentration of RTV from nanoparticle and microparticle ASDs vs
pure RTV (potassium phosphate buffer, pH 6.8)
Figure 11b. Solution concentration of EFV from nanoparticle and microparticle ASDs vs
pure EFV (potassium phosphate buffer, pH 6.8)
0
10
20
30
40
1 2 3 4 5 Co
nce
ntr
ati
on
(µ
g/m
l)
Time (hours)
CMCAB-RTV (25 wt%)
microparticles
CMCAB-RTV (19 wt% )
nanoparticles
RTV
0
4
8
12
16
20
0 1 2 3 4 5
Co
nce
ntr
ati
on
(µ
g/m
l)
Time (hours)
EFV
CMCAB-EFV (25 wt%)
microparticles
CMCAB-EFV (18 wt%)
nanoparticles
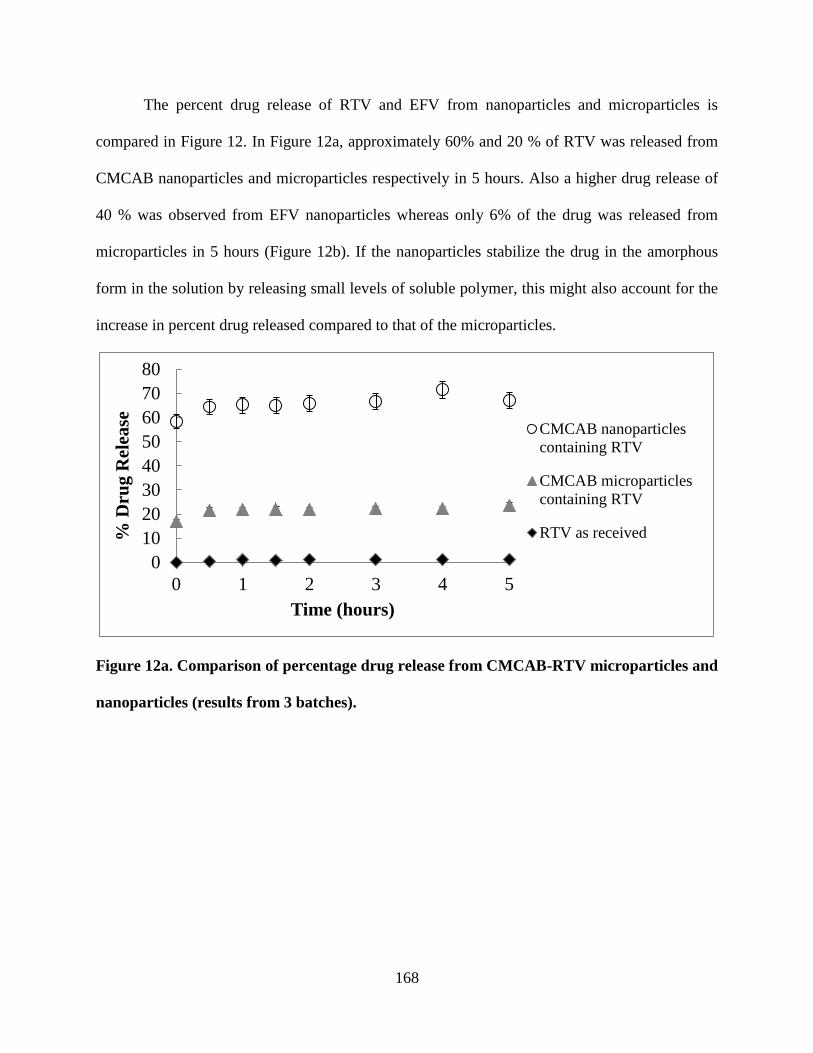
168
The percent drug release of RTV and EFV from nanoparticles and microparticles is
compared in Figure 12. In Figure 12a, approximately 60% and 20 % of RTV was released from
CMCAB nanoparticles and microparticles respectively in 5 hours. Also a higher drug release of
40 % was observed from EFV nanoparticles whereas only 6% of the drug was released from
microparticles in 5 hours (Figure 12b). If the nanoparticles stabilize the drug in the amorphous
form in the solution by releasing small levels of soluble polymer, this might also account for the
increase in percent drug released compared to that of the microparticles.
Figure 12a. Comparison of percentage drug release from CMCAB-RTV microparticles and
nanoparticles (results from 3 batches).
0
10
20
30
40
50
60
70
80
0 1 2 3 4 5
% D
rug
Rel
ease
Time (hours)
CMCAB nanoparticles
containing RTV
CMCAB microparticles
containing RTV
RTV as received
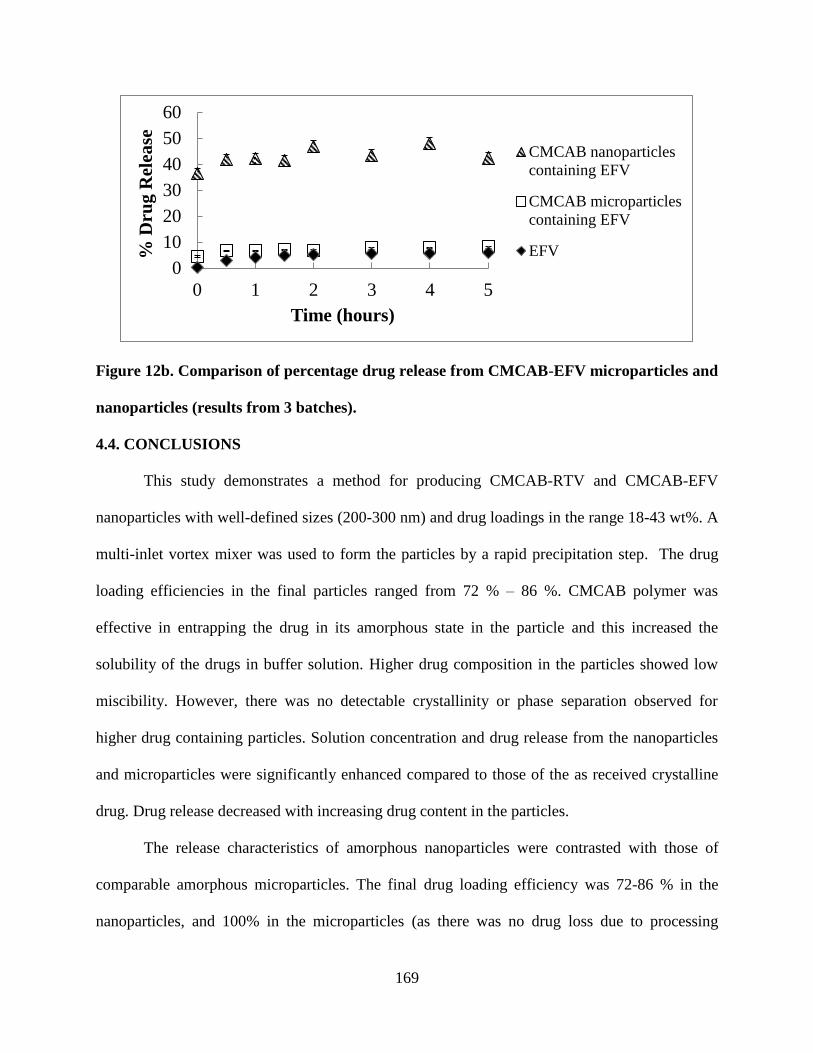
169
Figure 12b. Comparison of percentage drug release from CMCAB-EFV microparticles and
nanoparticles (results from 3 batches).
4.4. CONCLUSIONS
This study demonstrates a method for producing CMCAB-RTV and CMCAB-EFV
nanoparticles with well-defined sizes (200-300 nm) and drug loadings in the range 18-43 wt%. A
multi-inlet vortex mixer was used to form the particles by a rapid precipitation step. The drug
loading efficiencies in the final particles ranged from 72 % – 86 %. CMCAB polymer was
effective in entrapping the drug in its amorphous state in the particle and this increased the
solubility of the drugs in buffer solution. Higher drug composition in the particles showed low
miscibility. However, there was no detectable crystallinity or phase separation observed for
higher drug containing particles. Solution concentration and drug release from the nanoparticles
and microparticles were significantly enhanced compared to those of the as received crystalline
drug. Drug release decreased with increasing drug content in the particles.
The release characteristics of amorphous nanoparticles were contrasted with those of
comparable amorphous microparticles. The final drug loading efficiency was 72-86 % in the
nanoparticles, and 100% in the microparticles (as there was no drug loss due to processing
0
10
20
30
40
50
60
0 1 2 3 4 5
% D
rug
Rel
ease
Time (hours)
CMCAB nanoparticles
containing EFV
CMCAB microparticles
containing EFV
EFV
170
steps). The percentage release of drugs from nanoparticles was higher than from the
microparticles. The nanosized RTV and EFV had greatly increased specific surface area
compared to micron-sized particles, which greatly enhanced dissolution of RTV and EFV. There
was only a slight difference of solution concentration of microparticles and nanoparticles,
solution concentration of microparticles somewhat higher.
However, these are the first experiments on the effectiveness of these CMCAB-drug
nanoparticles and so more complete and statistically valid tests need to be performed. More
investigation is needed to characterize the very long storage stability of these particles. The
enhancement of release of drugs from polymer nanoparticles for effective drug delivery of low
solubility anti-viral drugs is an attractive area for additional research.
ACKNOWLEDGEMENT
The authors gratefully acknowledge funding and support from the Macromolecules and
Interface Institute, Institute of Critical Technology and Applied Sciences and the National
Science Foundation, (under Contract # DMR 0909065). The authors also thank Rick Caudill,
Research Specialist, Department of Sustainable Biomaterials, Virginia Tech for his assistance
with the PXRD analysis and Mr. Steve McCartney of the Institute for Critical Technology and
Applied Science-Nanoscale Characterization and Fabrication Laboratory (ICTAS-NCFL) at
Virginia Tech for help with the FESEM images.
171
4.5. REFERENCES
1. Lavelle, E. C.; Sharif, S.; Thomas, N. W.; Holland, J.; Davis, S. S., The importance of
gastrointestinal uptake of particles in the design of oral delivery systems. Advanced Drug
Delivery Reviews 1995, 18 (1), 5-22.
2. Huang, J.; Wigent, R. J.; Schwartz, J. B., Drug–polymer interaction and its significance on
the physical stability of nifedipine amorphous dispersion in microparticles of an ammonio
methacrylate copolymer and ethylcellulose binary blend. Journal of Pharmaceutical Sciences
2008, 97 (1), 251-262.
3. Kanaujia, P.; Lau, G.; Ng, W. K.; Widjaja, E.; Hanefeld, A.; Fischbach, M.; Maio, M.; Tan,
R. B. H., Nanoparticle formation and growth during in vitro dissolution of ketoconazole solid
dispersion. Journal of Pharmaceutical Sciences 2011, 100 (7), 2876-2885.
4. Merisko-Liversidge, E.; Liversidge, G. G., Nanosizing for oral and parenteral drug delivery:
A perspective on formulating poorly-water soluble compounds using wet media milling
technology. Advanced Drug Delivery Reviews 2011, 63 (6), 427-440.
5. Pranjali B. Gawali, S. J. K., Mangesh R. Bhalekar, Ashwini R. Madgulkar, Preparation and
Characterization of Amorphous Nanoparticles for Solubility Enhancement of Ritonavir.
International Journal of Pharmaceutical Invention 2012, 2 (6), 27.
6. Petros, R. A.; Desimone, J. M., Strategies in the design of nanoparticles for therapeutic
applications. Nat Rev Drug Discov 2010, 9 (8), 615-627.
7. (a) Curatolo, W.; Nightingale, J.; Herbig, S., Utility of Hydroxypropylmethylcellulose
Acetate Succinate (HPMCAS) for Initiation and Maintenance of Drug Supersaturation in the GI
Milieu. Pharmaceutical Research 2009, 26 (6), 1419-1431; (b) Warren, D. B.; Benameur, H.;
Porter, C. J. H.; Pouton, C. W., Using polymeric precipitation inhibitors to improve the
absorption of poorly water-soluble drugs: A mechanistic basis for utility. Journal of Drug
Targeting 2010, 18 (10), 704-731; (c) Craig, D. Q. M., The mechanisms of drug release from
solid dispersions in water-soluble polymers. International Journal of Pharmaceutics 2002, 231
(2), 131-144; (d) Kennedy, M.; Hu, J.; Gao, P.; Li, L.; Ali-Reynolds, A.; Chal, B.; Gupta, V.;
Ma, C.; Mahajan, N.; Akrami, A.; Surapaneni, S., Enhanced Bioavailability of a Poorly Soluble
VR1 Antagonist Using an Amorphous Solid Dispersion Approach: A Case Study. Molecular
Pharmaceutics 2008, 5 (6), 981-993; (e) Miller, D. A.; Dinunzio, J. C.; Yang, W.; Mcginity, J.
W.; Williams, R. O., Enhanced In Vivo Absorption of Itraconazole via Stabilization of
172
Supersaturation Following Acidic-to-Neutral pH Transition. Drug Development and Industrial
Pharmacy 2008, 34 (8), 890-902.
8. Lindfors, L.; Forssén, S.; Westergren, J.; Olsson, U., Nucleation and crystal growth in
supersaturated solutions of a model drug. Journal of Colloid and Interface Science 2008, 325 (2),
404-413.
9. Esnaashari, S.; Javadzadeh, Y.; Batchelor, H. K.; Conway, B. R., The use of
microviscometry to study polymer dissolution from solid dispersion drug delivery systems.
International Journal of Pharmaceutics 2005, 292 (1–2), 227-230.
10. Marsac, P.; Li, T.; Taylor, L., Estimation of Drug–Polymer Miscibility and Solubility in
Amorphous Solid Dispersions Using Experimentally Determined Interaction Parameters.
Pharmaceutical Research 2009, 26 (1), 139-151.
11. Qian, F.; Huang, J.; Hussain, M. A., Drug–polymer solubility and miscibility: Stability
consideration and practical challenges in amorphous solid dispersion development. Journal of
Pharmaceutical Sciences 2010, 99 (7), 2941-2947.
12. Six, K.; Berghmans, H.; Leuner, C.; Dressman, J.; Van Werde, K.; Mullens, J.; Benoist, L.;
Thimon, M.; Meublat, L.; Verreck, G.; Peeters, J.; Brewster, M.; Van Den Mooter, G.,
Characterization of Solid Dispersions of Itraconazole and Hydroxypropylmethylcellulose
Prepared by Melt Extrusion, Part II. Pharmaceutical Research 2003, 20 (7), 1047-1054.
13. Law, D.; Schmitt, E. A.; Marsh, K. C.; Everitt, E. A.; Wang, W.; Fort, J. J.; Krill, S. L.; Qiu,
Y., Ritonavir–PEG 8000 amorphous solid dispersions: In vitro and in vivo evaluations. Journal
of Pharmaceutical Sciences 2004, 93 (3), 563-570.
14. Kapsi, S. G.; Ayres, J. W., Processing factors in development of solid solution formulation of
itraconazole for enhancement of drug dissolution and bioavailability. International Journal of
Pharmaceutics 2001, 229 (1–2), 193-203.
15. Janssens, S.; Nagels, S.; Armas, H. N. D.; D’autry, W.; Van Schepdael, A.; Van Den Mooter,
G., Formulation and characterization of ternary solid dispersions made up of Itraconazole and
two excipients, TPGS 1000 and PVPVA 64, that were selected based on a supersaturation
screening study. European Journal of Pharmaceutics and Biopharmaceutics 2008, 69 (1), 158-
166.
173
16. Lakshman, J. P.; Cao, Y.; Kowalski, J.; Serajuddin, A. T. M., Application of Melt Extrusion
in the Development of a Physically and Chemically Stable High-Energy Amorphous Solid
Dispersion of a Poorly Water-Soluble Drug. Molecular Pharmaceutics 2008, 5 (6), 994-1002.
17. (a) Konno, H.; Handa, T.; Alonzo, D. E.; Taylor, L. S., Effect of polymer type on the
dissolution profile of amorphous solid dispersions containing felodipine. European Journal of
Pharmaceutics and Biopharmaceutics 2008, 70 (2), 493-499; (b) Abu-Diak, O. A.; Jones, D. S.;
Andrews, G. P., An Investigation into the Dissolution Properties of Celecoxib Melt Extrudates:
Understanding the Role of Polymer Type and Concentration in Stabilizing Supersaturated Drug
Concentrations. Molecular Pharmaceutics 2011, 8 (4), 1362-1371.
18. Yoshioka, M.; Hancock, B. C.; Zografi, G., Inhibition of indomethacin crystallization in
poly(vinylpyrrolidone) coprecipitates. Journal of Pharmaceutical Sciences 1995, 84 (8), 983-
986.
19. (a) Dontireddy, R.; Crean, A. M., A comparative study of spray-dried and freeze-dried
hydrocortisone/polyvinyl pyrrolidone solid dispersions. Drug Development and Industrial
Pharmacy 2011, 37 (10), 1141-1149; (b) Ghosh, I.; Snyder, J.; Vippagunta, R.; Alvine, M.;
Vakil, R.; Tong, W.-Q.; Vippagunta, S., Comparison of HPMC based polymers performance as
carriers for manufacture of solid dispersions using the melt extruder. International Journal of
Pharmaceutics 2011, 419 (1–2), 12-19.
20. Vasanthavada, M.; Tong, W.-Q.; Joshi, Y.; Kislalioglu, M. S., Phase Behavior of Amorphous
Molecular Dispersions II: Role of Hydrogen Bonding in Solid Solubility and Phase Separation
Kinetics. Pharmaceutical Research 2005, 22 (3), 440-448.
21. Six, K.; Verreck, G.; Peeters, J.; Brewster, M.; Mooter, G. V. D., Increased physical stability
and improved dissolution properties of itraconazole, a class II drug, by solid dispersions that
combine fast- and slow-dissolving polymers. Journal of Pharmaceutical Sciences 2004, 93 (1),
124-131.
22. Marsac, P.; Shamblin, S.; Taylor, L., Theoretical and Practical Approaches for Prediction of
Drug–Polymer Miscibility and Solubility. Pharmaceutical Research 2006, 23 (10), 2417-2426.
23. Rumondor, A. C. F.; Taylor, L. S., Effect of Polymer Hygroscopicity on the Phase Behavior
of Amorphous Solid Dispersions in the Presence of Moisture. Molecular Pharmaceutics 2009, 7
(2), 477-490.
174
24. Chan, K. L. A.; Kazarian, S. G., FTIR Spectroscopic Imaging of Dissolution of a Solid
Dispersion of Nifedipine in Poly(ethylene glycol). Molecular Pharmaceutics 2004, 1 (4), 331-
335.
25. Van Drooge, D. J.; Hinrichs, W. L. J.; Visser, M. R.; Frijlink, H. W., Characterization of the
molecular distribution of drugs in glassy solid dispersions at the nano-meter scale, using
differential scanning calorimetry and gravimetric water vapour sorption techniques. International
Journal of Pharmaceutics 2006, 310 (1–2), 220-229.
26. Friesen, D. T.; Shanker, R.; Crew, M.; Smithey, D. T.; Curatolo, W. J.; Nightingale, J. a. S.,
Hydroxypropyl Methylcellulose Acetate Succinate-Based Spray-Dried Dispersions: An
Overview. Molecular Pharmaceutics 2008, 5 (6), 1003-1019.
27. Padden B, M. J., Robbins T, Zocharski Pd, Prasad L, Spence Jk, Lafountaine J, Amorphous
solid dispersions as enabling formulations for discovery and early development. Am Pharm Rev
2011, 1, 66-73.
28. Dembri, A.; Montisci, M.-J.; Gantier, J.; Chacun, H.; Ponchel, G., Targeting of 3′-Azido 3′-
deoxythymidine (AZT)-loaded poly(isohexylcyanoacrylate) nanospheres to the gastrointestinal
mucosa and associated lymphoid tissues. Pharm Res 2001, 18 (4), 467-473.
29. Löbenberg, R.; Maas, J.; Kreuter, J., Improved body distribution of 14C-labelled AZT bound
to nanoparticles in rats determined by radioluminography. Journal of Drug Targeting 1998, 5
(3), 171-179.
30. Destache, C.; Belgum, T.; Christensen, K.; Shibata, A.; Sharma, A.; Dash, A., Combination
antiretroviral drugs in PLGA nanoparticle for HIV-1. BMC Infectious Diseases 2009, 9 (1), 198.
31. Mainardes, R. M.; Gremião, M. P. D.; Brunetti, I. L.; Da Fonseca, L. M.; Khalil, N. M.,
Zidovudine-loaded PLA and PLA–PEG blend nanoparticles: Influence of polymer type on
phagocytic uptake by polymorphonuclear cells. Journal of Pharmaceutical Sciences 2009, 98
(1), 257-267.
32. Sharma, P.; Garg, S., Pure drug and polymer based nanotechnologies for the improved
solubility, stability, bioavailability and targeting of anti-HIV drugs. Advanced Drug Delivery
Reviews 2010, 62 (4-5), 491-502.
33. Duan, J.; Zhang, Y.; Han, S.; Chen, Y.; Li, B.; Liao, M.; Chen, W.; Deng, X.; Zhao, J.;
Huang, B., Synthesis and in vitro/in vivo anti-cancer evaluation of curcumin-loaded
175
chitosan/poly(butyl cyanoacrylate) nanoparticles. International Journal of Pharmaceutics 2010,
400 (1–2), 211-220.
34. Posey-Dowty, J.; Watterson, T.; Wilson, A.; Edgar, K.; Shelton, M.; Lingerfelt, L., Zero-
order release formulations using a novel cellulose ester. Cellulose 2007, 14 (1), 73-83-83.
35. Shelton Michael, C.; Posey-Dowty Jessica, D.; Lingerfelt, L.; Kirk Shane, K.; Klein, S.;
Edgar Kevin, J., Enhanced dissolution of poorly soluble drugs from solid dispersions in
carboxymethylcellulose acetate butyrate matrices. In Polysaccharide Materials: Performance by
Design, American Chemical Society 2009, 1017, 93-113.
36. Sandra, K., Polysaccharides in Oral Drug Delivery ? Recent Applications and Future
Perspectives. In Polysaccharide Materials: Performance by Design, American Chemical Society:
2009, 1017, 13-30.
37. Raval, J. P.; Naik, D. R.; Amin, K. A.; Patel, P. S., Controlled-release and antibacterial
studies of doxycycline-loaded poly(ε-caprolactone) microspheres. Journal of Saudi Chemical
Society 2011, (in press).
38. Mainardes, R. M.; Evangelista, R. C., PLGA nanoparticles containing praziquantel: effect of
formulation variables on size distribution. International Journal of Pharmaceutics 2005, 290 (1–
2), 137-144.
39. Hariharan, S.; Bala, I.; Kumar, M. N. V. R., PLGA Nanoparticles in Drug Delivery: The
State of the Art. 2004, 21 (5), 36.
40. Johnson, B. K.; Prud; #39; Homme, R. K., Flash NanoPrecipitation of organic actives and
block copolymers using a confined impinging jets mixer. Australian Journal of Chemistry 2003,
56 (10), 1021-1024.
41. Johnson, B. K.; Prud'homme, R. K., Chemical processing and micromixing in confined
impinging jets. AIChE Journal 2003, 49 (9), 2264-2282.
42. Johnson, B. K.; Prud’homme, R. K., Mechanism for rapid self-assembly of block copolymer
nanoparticles. Physical Review Letters 2003, 91 (11), 118302.
43. Ungun, B.; Prud'homme, R. K.; Budijon, S. J.; Shan, J.; Lim, S. F.; Ju, Y.; Austin, R.,
Nanofabricated upconversion nanoparticles for photodynamic therapy. Opt. Express 2009, 17
(1), 80-86.
44. Kumar, V.; Hong, S. Y.; Maciag, A. E.; Saavedra, J. E.; Adamson, D. H.; Prud’homme, R.
K.; Keefer, L. K.; Chakrapani, H., Stabilization of the Nitric Oxide (NO) prodrugs and
176
anticancer leads, PABA/NO and double JS-K, through Incorporation into PEG-protected
nanoparticles. Molecular Pharmaceutics 2009, 7 (1), 291-298.
45. Chen, T.; D’addio, S. M.; Kennedy, M. T.; Swietlow, A.; Kevrekidis, I. G.; Panagiotopoulos,
A. Z.; Prud’homme, R. K., Protected peptide nanoparticles: Experiments and brownian dynamics
simulations of the energetics of assembly. Nano Letters 2009, 9 (6), 2218-2222.
46. Ansell, S. M.; Johnstone, S. A.; Tardi, P. G.; Lo, L.; Xie, S.; Shu, Y.; Harasym, T. O.;
Harasym, N. L.; Williams, L.; Bermudes, D.; Liboiron, B. D.; Saad, W.; Prud’homme, R. K.;
Mayer, L. D., Modulating the therapeutic activity of nanoparticle delivered paclitaxel by
manipulating the hydrophobicity of prodrug conjugates. Journal of Medicinal Chemistry 2008,
51 (11), 3288-3296.
47. D'addio, S. M.; Prud'homme, R. K., Controlling drug nanoparticle formation by rapid
precipitation. Advanced Drug Delivery Reviews 2011, 63 (6), 417-426.
48. Liu, Y.; Cheng, C.; Prud’homme, R. K.; Fox, R. O., Mixing in a multi-inlet vortex mixer
(MIVM) for flash nano-precipitation. Chemical Engineering Science 2008, 63 (11), 2829-2842.
49. Gindy, M., Composite block copolymer stabilized nanoparticles: Simultaneous encapsulation
of organic actives and inorganic nanostructures. Langumir 2008, 24, 83-90.
50. Hesse, L. M.; Von Moltke, L. L.; Shader, R. I.; Greenblatt, D. J., Ritonavir, Efavirenz, and
Nelfinavir Inhibit CYP2B6 Activity in Vitro: Potential Drug Interactions with Bupropion. Drug
Metabolism and Disposition 2001, 29 (2), 100-102.
51. Ariza, R. M. Design, Synthesis, and Characterization of Magnetite Clusters using a Multi
Inlet Vortex Mixer. Virginia Polytechnic Institute and State University, Blacksburg, Virginia,
2010.
52. Abdelwahed, W.; Degobert, G.; Fessi, H., Investigation of nanocapsules stabilization by
amorphous excipients during freeze-drying and storage. European Journal of Pharmaceutics and
Biopharmaceutics 2006, 63 (2), 87-94.
53. Abdelwahed, W.; Degobert, G.; Fessi, H., A pilot study of freeze drying of poly(epsilon-
caprolactone) nanocapsules stabilized by poly(vinyl alcohol): Formulation and process
optimization. International Journal of Pharmaceutics 2006, 309 (1–2), 178-188.
54. Kohane, D. S., Microparticles and nanoparticles for drug delivery. Biotechnology and
Bioengineering 2007, 96 (2), 203-209.
177
55. Plakkot, S.; De Matas, M.; York, P.; Saunders, M.; Sulaiman, B., Comminution of ibuprofen
to produce nano-particles for rapid dissolution. International Journal of Pharmaceutics 2011,
415 (1–2), 307-314.
56. Liu, P.; Rong, X.; Laru, J.; Van Veen, B.; Kiesvaara, J.; Hirvonen, J.; Laaksonen, T.;
Peltonen, L., Nanosuspensions of poorly soluble drugs: Preparation and development by wet
milling. International Journal of Pharmaceutics 2011, 411 (1–2), 215-222.
57. Niwa, T.; Miura, S.; Danjo, K., Design of dry nanosuspension with highly spontaneous
dispersible characteristics to develop solubilized formulation for poorly water-soluble drugs.
Pharmaceutical Research 2011, 28 (9), 2339-2349.
58. Sun, W.; Mao, S.; Shi, Y.; Li, L. C.; Fang, L., Nanonization of itraconazole by high pressure
homogenization: Stabilizer optimization and effect of particle size on oral absorption. Journal of
Pharmaceutical Sciences 2011, 100 (8), 3365-3373.
59. Rabinow, B. E., Nanosuspensions in drug delivery. Nature Reviews Drug Discovery 2004, 3,
785-796.
60. Keck, C. M.; Müller, R. H., Drug nanocrystals of poorly soluble drugs produced by high
pressure homogenisation. European Journal of Pharmaceutics and Biopharmaceutics 2006, 62
(1), 3-16.
61. Rh, J. J. a. M., Nanocrystal technology, drug delivery and clinical applications. Int J
Nanomedicine 2008, 3, 295-309.
62. Merisko-Liversidge, E. M.; Liversidge, G. G., Drug nanoparticles: Formulating poorly water-
soluble compounds. Toxicologic Pathology 2008, 36 (1), 43-48.
63. Williams, H. D.; Trevaskis, N. L.; Charman, S. A.; Shanker, R. M.; Charman, W. N.; Pouton,
C. W.; Porter, C. J. H., Strategies to address low drug solubility in discovery and development.
Pharmacological Reviews 2013, 65 (1), 315-499.
64. Wu, L.; Zhang, J.; Watanabe, W., Physical and chemical stability of drug nanoparticles.
Advanced Drug Delivery Reviews 2011, 63 (6), 456-469.
65. Vogt, M.; Kunath, K.; Dressman, J. B., Dissolution enhancement of fenofibrate by
micronization, cogrinding and spray-drying: Comparison with commercial preparations.
European Journal of Pharmaceutics and Biopharmaceutics 2008, 68 (2), 283-288.
66. Hargrove Jt, M. W., And Wentz Ac, Absorption of oral progesterone is influenced by vehicle
and particle size. Am J Obstet Gynecol 1989, 161, 948-951.
178
67. J, N. F. a. R., Dependence of area under the curve on proquazone particle size and in vitro
dissolution rate. J Pharm Sci 1980, 69, 605-607.
68. Watari, N.; Funaki, T.; Aizawa, K.; Kaneniwa, N., Nonlinear assessment of nitrofurantoin
bioavailability in rabbits. Journal of Pharmacokinetics and Biopharmaceutics 1983, 11 (5), 529-
545.
69. Guimes Rodrigues, F.; Ricardo Chagas Da, S.; Carla Da Silva, M.; Rosana Maria
Nascimento De, A.; Harumi, O., Water flux through blends from waste materials: Cellulose
acetate (from sugar cane bagasse) with polystyrene (from plastic cups). J Appl Polym Sci 2005,
96 (2), 516-522.
70. Rumondor, A. C. F.; Marsac, P. J.; Stanford, L. A.; Taylor, L. S., Phase behavior of
poly(vinylpyrrolidone) containing amorphous solid dispersions in the presence of moisture.
Molecular Pharmaceutics 2009, 6 (5), 1492-1505.
71. Alonzo, D. E.; Gao, Y.; Zhou, D.; Mo, H.; Zhang, G. G. Z.; Taylor, L. S., Dissolution and
precipitation behavior of amorphous solid dispersions. Journal of Pharmaceutical Sciences 2011,
100 (8), 3316-3331.
72. Hancock, B. C.; Zografi, G., Characteristics and significance of the amorphous state in
pharmaceutical systems. Journal of Pharmaceutical Sciences 1997, 86 (1), 1-12.
73. Ilevbare, G. A.; Liu, H.; Edgar, K. J.; Taylor, L. S., Understanding polymer properties
important for crystal growth inhibition—impact of chemically diverse polymers on solution
crystal growth of ritonavir. Crystal Growth & Design 2012, 12 (6), 3133-3143.
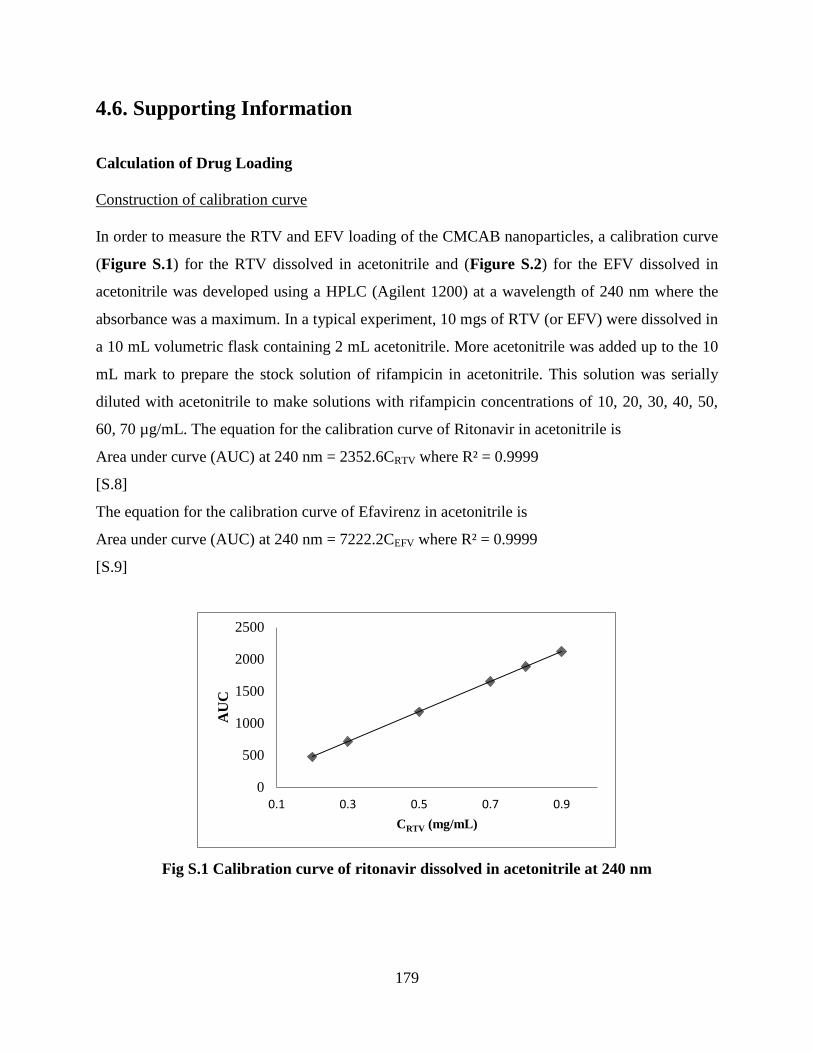
179
4.6. Supporting Information
Calculation of Drug Loading
Construction of calibration curve
In order to measure the RTV and EFV loading of the CMCAB nanoparticles, a calibration curve
(Figure S.1) for the RTV dissolved in acetonitrile and (Figure S.2) for the EFV dissolved in
acetonitrile was developed using a HPLC (Agilent 1200) at a wavelength of 240 nm where the
absorbance was a maximum. In a typical experiment, 10 mgs of RTV (or EFV) were dissolved in
a 10 mL volumetric flask containing 2 mL acetonitrile. More acetonitrile was added up to the 10
mL mark to prepare the stock solution of rifampicin in acetonitrile. This solution was serially
diluted with acetonitrile to make solutions with rifampicin concentrations of 10, 20, 30, 40, 50,
60, 70 µg/mL. The equation for the calibration curve of Ritonavir in acetonitrile is
Area under curve (AUC) at 240 nm = 2352.6CRTV where R² = 0.9999
[S.8]
The equation for the calibration curve of Efavirenz in acetonitrile is
Area under curve (AUC) at 240 nm = 7222.2CEFV where R² = 0.9999
[S.9]
Fig S.1 Calibration curve of ritonavir dissolved in acetonitrile at 240 nm
0
500
1000
1500
2000
2500
0.1 0.3 0.5 0.7 0.9
AU
C
CRTV (mg/mL)
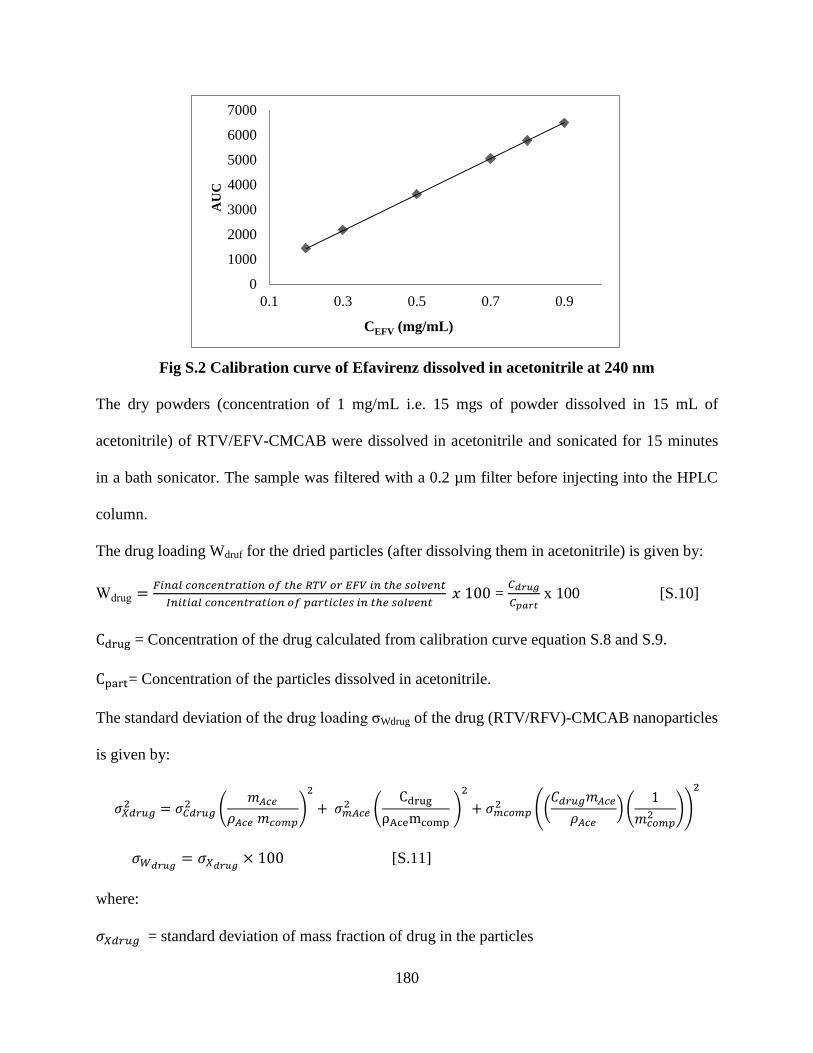
180
Fig S.2 Calibration curve of Efavirenz dissolved in acetonitrile at 240 nm
The dry powders (concentration of 1 mg/mL i.e. 15 mgs of powder dissolved in 15 mL of
acetonitrile) of RTV/EFV-CMCAB were dissolved in acetonitrile and sonicated for 15 minutes
in a bath sonicator. The sample was filtered with a 0.2 µm filter before injecting into the HPLC
column.
The drug loading Wdruf for the dried particles (after dissolving them in acetonitrile) is given by:
Wdrug
100 =
x 100 [S.10]
= Concentration of the drug calculated from calibration curve equation S.8 and S.9.
= Concentration of the particles dissolved in acetonitrile.
The standard deviation of the drug loading σWdrug of the drug (RTV/RFV)-CMCAB nanoparticles
is given by:
(
)
(
)
((
𝐶
)(
1
))
× 100 [S.11]
where:
= standard deviation of mass fraction of drug in the particles
0
1000
2000
3000
4000
5000
6000
7000
0.1 0.3 0.5 0.7 0.9
AU
C
CEFV (mg/mL)
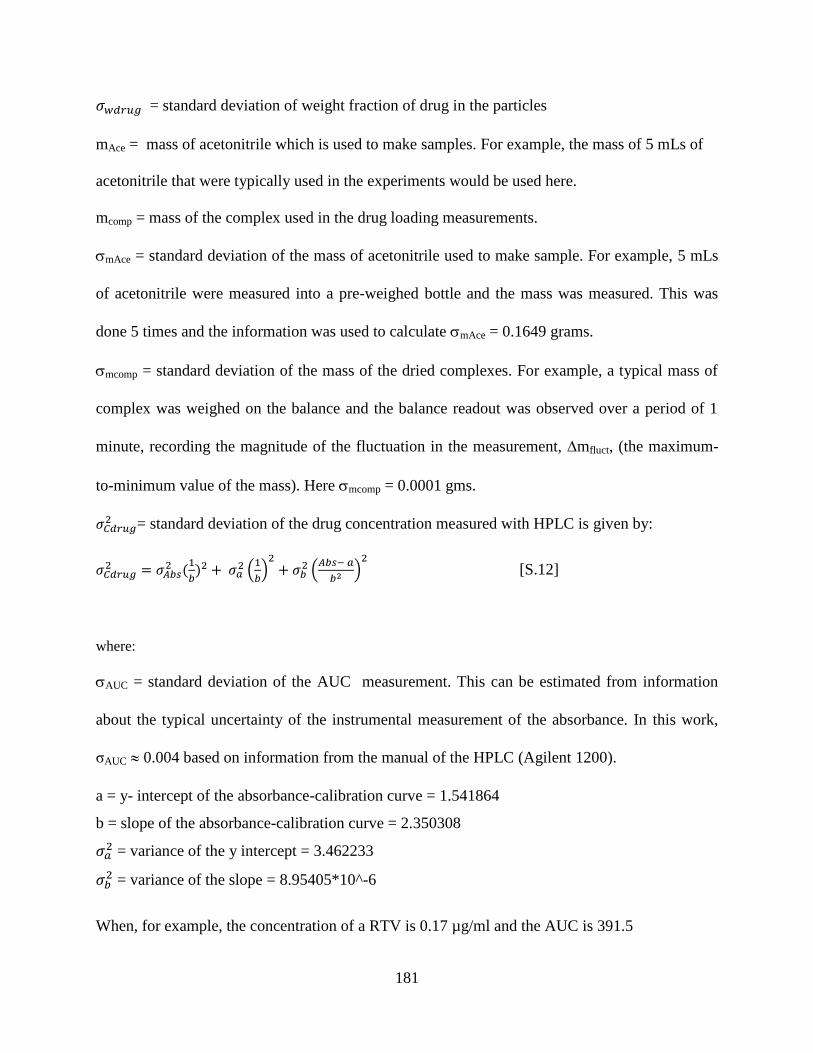
181
= standard deviation of weight fraction of drug in the particles
mAce = mass of acetonitrile which is used to make samples. For example, the mass of 5 mLs of
acetonitrile that were typically used in the experiments would be used here.
mcomp = mass of the complex used in the drug loading measurements.
mAce = standard deviation of the mass of acetonitrile used to make sample. For example, 5 mLs
of acetonitrile were measured into a pre-weighed bottle and the mass was measured. This was
done 5 times and the information was used to calculate mAce = 0.1649 grams.
mcomp = standard deviation of the mass of the dried complexes. For example, a typical mass of
complex was weighed on the balance and the balance readout was observed over a period of 1
minute, recording the magnitude of the fluctuation in the measurement, mfluct, (the maximum-
to-minimum value of the mass). Here mcomp = 0.0001 gms.
= standard deviation of the drug concentration measured with HPLC is given by:
(
)
(
) [S.12]
where:
AUC = standard deviation of the AUC measurement. This can be estimated from information
about the typical uncertainty of the instrumental measurement of the absorbance. In this work,
σAUC 0.004 based on information from the manual of the HPLC (Agilent 1200).
a = y- intercept of the absorbance-calibration curve = 1.541864
b = slope of the absorbance-calibration curve = 2.350308
= variance of the y intercept = 3.462233
= variance of the slope = 8.95405*10^-6
When, for example, the concentration of a RTV is 0.17 µg/ml and the AUC is 391.5
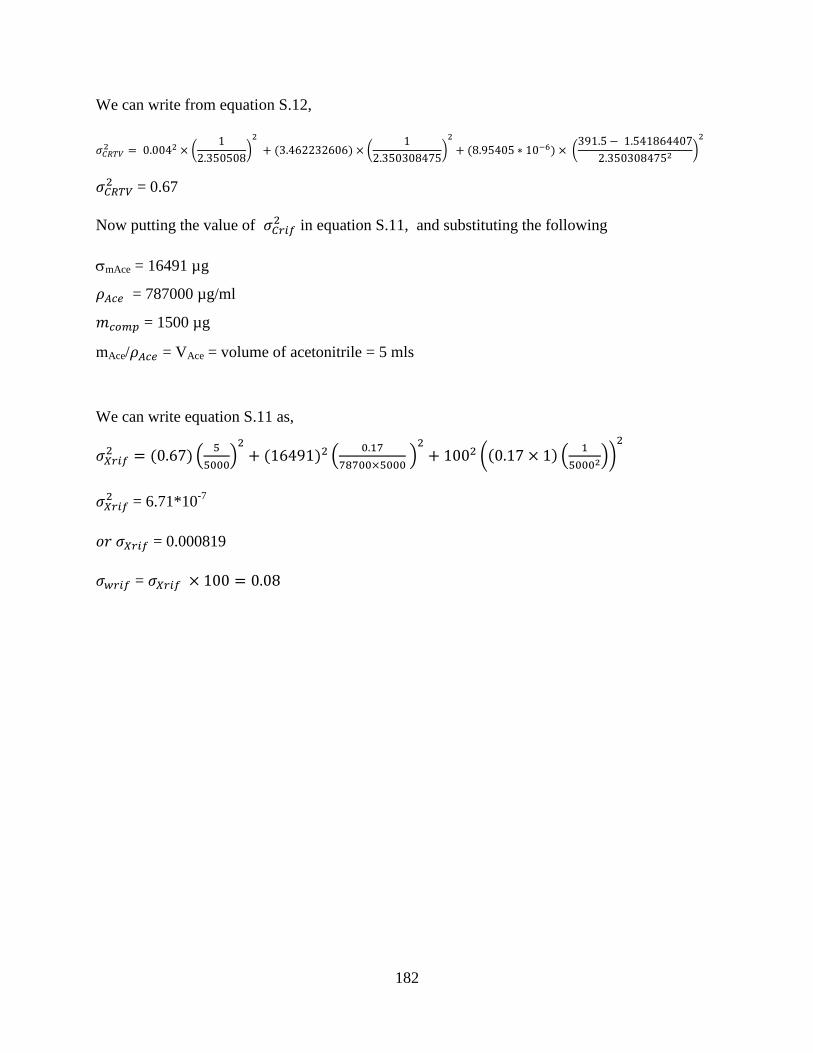
182
We can write from equation S.12,
0 00 × (
1
0 0 )
0 × (1
0 0 )
0 10 × ( 1 1 1 0
0 0 )
= 0.67
Now putting the value of in equation S.11, and substituting the following
mAce = 16491 µg
= 787000 µg/ml
= 1500 µg
mAce/ = VAce = volume of acetonitrile = 5 mls
We can write equation S.11 as,
0 (
)
1 1 (
× )
100 ( 0 1 × 1 (
))
= 6.71*10
-7
𝑟 = 0.000819
= × 100 0 0
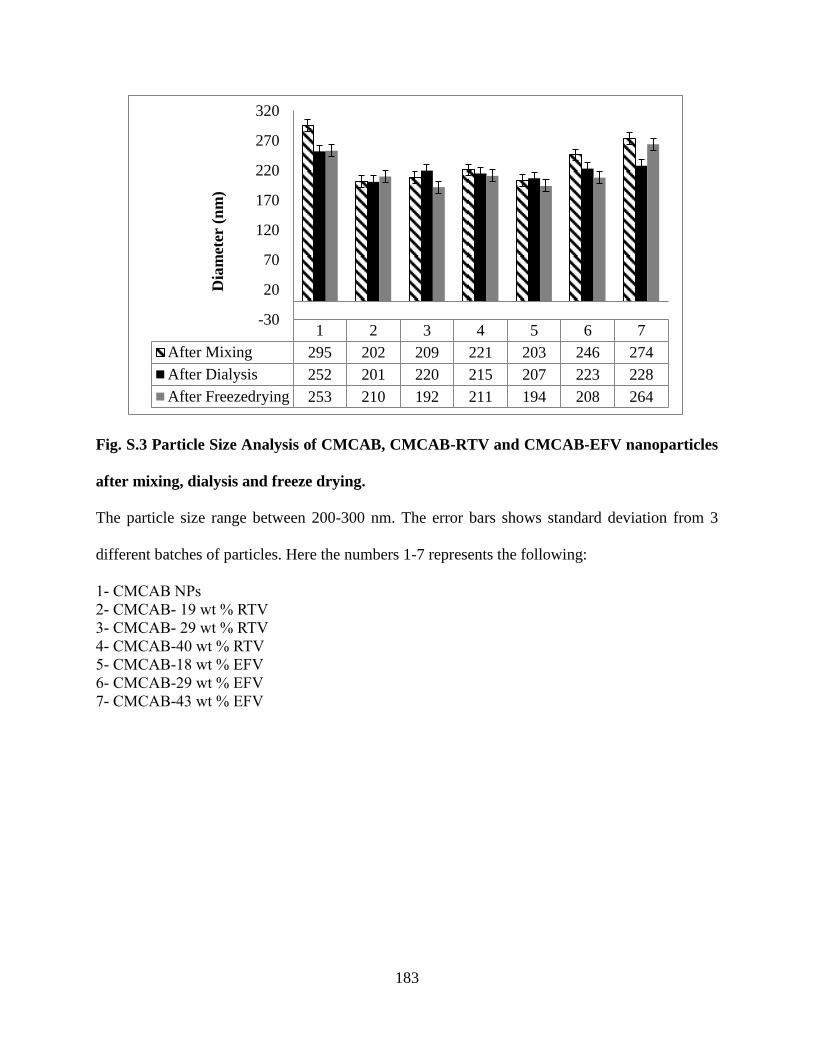
183
Fig. S.3 Particle Size Analysis of CMCAB, CMCAB-RTV and CMCAB-EFV nanoparticles
after mixing, dialysis and freeze drying.
The particle size range between 200-300 nm. The error bars shows standard deviation from 3
different batches of particles. Here the numbers 1-7 represents the following:
1- CMCAB NPs
2- CMCAB- 19 wt % RTV
3- CMCAB- 29 wt % RTV
4- CMCAB-40 wt % RTV
5- CMCAB-18 wt % EFV
6- CMCAB-29 wt % EFV
7- CMCAB-43 wt % EFV
1 2 3 4 5 6 7
After Mixing 295 202 209 221 203 246 274
After Dialysis 252 201 220 215 207 223 228
After Freezedrying 253 210 192 211 194 208 264
-30
20
70
120
170
220
270
320
Dia
met
er (
nm
)
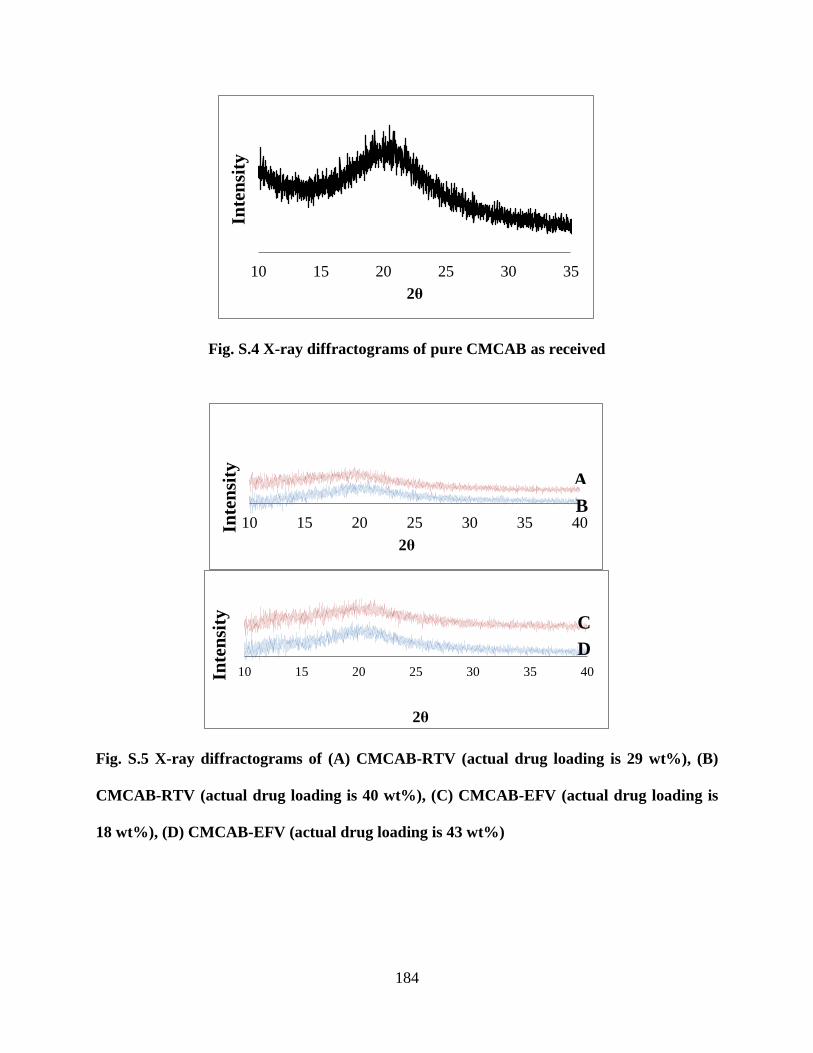
184
Fig. S.4 X-ray diffractograms of pure CMCAB as received
Fig. S.5 X-ray diffractograms of (A) CMCAB-RTV (actual drug loading is 29 wt%), (B)
CMCAB-RTV (actual drug loading is 40 wt%), (C) CMCAB-EFV (actual drug loading is
18 wt%), (D) CMCAB-EFV (actual drug loading is 43 wt%)
10 15 20 25 30 35
Inte
nsi
ty
2θ
10 15 20 25 30 35 40Inte
nsi
ty
2θ
A
B
10 15 20 25 30 35 40Inte
nsi
ty
2θ
C
D
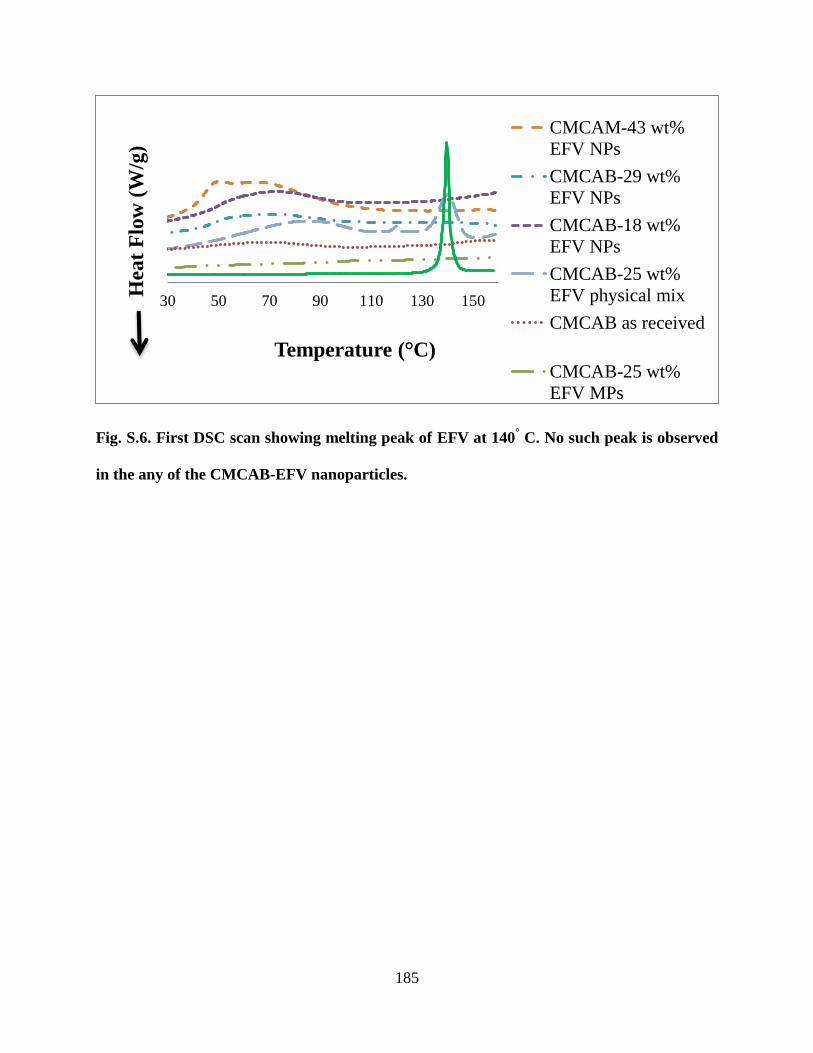
185
Fig. S.6. First DSC scan showing melting peak of EFV at 140° C. No such peak is observed
in the any of the CMCAB-EFV nanoparticles.
30 50 70 90 110 130 150
Hea
t F
low
(W
/g)
Temperature (°C)
CMCAM-43 wt%
EFV NPs
CMCAB-29 wt%
EFV NPs
CMCAB-18 wt%
EFV NPs
CMCAB-25 wt%
EFV physical mix
CMCAB as received
CMCAB-25 wt%
EFV MPs
186
Chapter 5: Preparation and Properties of Nanoparticles of
Complexes of Polysaccharides and Antiviral Drugs: Effect of
Polysaccharide Chemistry
Sonal Mazumdera, Haoyu Liu
a, Junia M. Pereira
a , Kevin J. Edgar
b, E. Bruce Orler
c, Robert B.
Moore IIIc and Richey M Davis
*d
aMacromolecules and Interfaces Institute,
bDepartment of Sustainable Biomaterials,
c Department
of Chemistry, dDepartment of Chemical Engineering
Virginia Polytechnic Institute and State University, Blacksburg, VA 24061, USA
*Corresponding author:
Richey M. Davis
Department of Chemical Engineering, VirginiaTech, Blacksburg, VA - 24061
Tel: 001+ 540-231-4578 ; Fax : 001+ 540-231-5022
E-mail address: [email protected]
ABSTRACT
Nanoparticles of amorphous dispersions of antiviral drugs, ritonavir (RTV) and efavirenz
(EFV) with several novel polysaccharides (cellulose esters and a pullulan derivative) were
produced by a rapid precipitation process. Particles were purified by dialysis and dried powders
were recovered after freeze drying. Particle diameters as measured by dynamic light scattering
were in the range 100-200 nm. The nanoparticles showed significant aggregation after freeze
drying but this was reduced by using trehalose as a cryoprotectant. The target drug loading in the
particles was 25 wt % and the drug loading efficiencies for the cellulose ester nanoparticles
ranged from 72-96% while the drug loading efficiency for the pullulan derivative nanoparticles
were approximately 62%. All the nanoparticles afforded increased solution concentration and
faster release compared to the pure drugs.
187
Keywords: Ritonavir, Efavirenz, cellulose ester, pullulan, nanoparticles, flash nanoprecipitation,
multi-inlet vortex mixer, drug release
188
5.1. INTRODUCTION
The Human Immunodeficiency Virus (HIV) affects the immune system and is
responsible for causing acquired immunodeficiency syndrome (AIDS). Currently, more than 33
million people are HIV-positive1. Ritonavir (RTV) and efavirenz (EFV) are two important drugs
for the treatment of HIV. RTV (Figure 1(a)) is an inhibitor of the HIV protease enzyme and also
a selective, competitive inhibitor of the liver enzyme Cytochrome P450 (CYP3A)2 which helps
to increase the bioavailability of other protease inhibitors like atazanavir or lopinavir that are
CYP3A substrates in dual protease therapy. It has a low solubility (1.2 µg/ml) and high dosage
(10 mg/kg, or 600 mg for a 60 kg person) and thus a very low oral bioavailability. A relatively
high dose of the drug is required to maintain therapeutic concentrations for longer periods, this
lead to several side effects (asthenia, malaise, diarrhea, nausea and vomiting, abdominal pain,
dizziness, insomnia, sweating, taste abonormality).
Efavirenz (Figure 1(b)) is a non-nucleoside reverse transcriptase inhibitor (NNRTI)
which has been approved by the FDA and is a first line drug of choice in Highly Active Anti-
Retroviral Therapy (HAART) for treatment of HIV and AIDS. It has low water solubility (8.85
µg/ml) with 40-45% of oral bioavailability and is typically administered in doses of 600-800
mg/day. Both RTV and EFV are highly crystalline and poorly soluble in the gastrointestinal
tract leading to poor bioavailability.
Oral administration of therapeutic agents is the easiest and frequently preferable mode of
drug delivery, as there is no requirement for hospitalization which requires medical
infrastructure, a critical issue in underdeveloped countries. In addition, patient compliance in
taking oral medications is greater than with injected formulations 3. However, it is important and
challenging to attain the desired pharmacokinetic profile for a given drug, especially one with
189
poor aqueous solubility 4. There are several factors in the GI tract which can limit the
bioavailability of drugs such as tissue barriers (mucosa, microvilli) and physiological factors
(varying pH, enzymes, transporter mechanisms).
For the purposes of drug delivery, nanoparticles are typically defined as a particulate
phase consisting of an active pharmaceutical ingredient having physical dimensions less than 1
micron and are dispersed in an external phase. The large surface area per unit mass enhances the
interaction of the particles with the epithelial lining and mucus. Nanoparticles with well-defined
size distributions have the potential to release large fractions of their drug load in the first few
hours in the small intestine. We hypothesize that effect of synergy between ASD and particle
size reduction will lead to high release rate in the small intestine could lead to improved solution
concentration, bioavailability and hence to a reduced required dose.
Controlling drug release kinetics from the nanocarrier can be difficult. A challenge in
designing nanocarrier drug delivery systems is finding the optimized particle size that will result
in desired release characteristics. Drug diffuses out of smaller nanocarriers faster, resulting in
burst effects instead of sustained or controlled drug delivery over prolonged periods of time 5.
The drug release kinetics can be improved by increasing the size of the nanocarriers, which
results in lower drug loss and prolonged drug release with a lower burst effect 6. However,
increasing the polymer-drug particle size may hinder their transport across membranes.
Recently, polysaccharides have been shown to be very promising for oral drug delivery
due to their affinity for complexing with a variety of drugs which can suppress crystallization of
the drugs, their relatively high glass transition temperatures, and their biocompatibility 7,8,9
.
Though several studies have concerned the formulation of polymer-antiviral drug nanoparticles
with synthetic or semisynthetic polymers (polymers prepared by chemical modification of
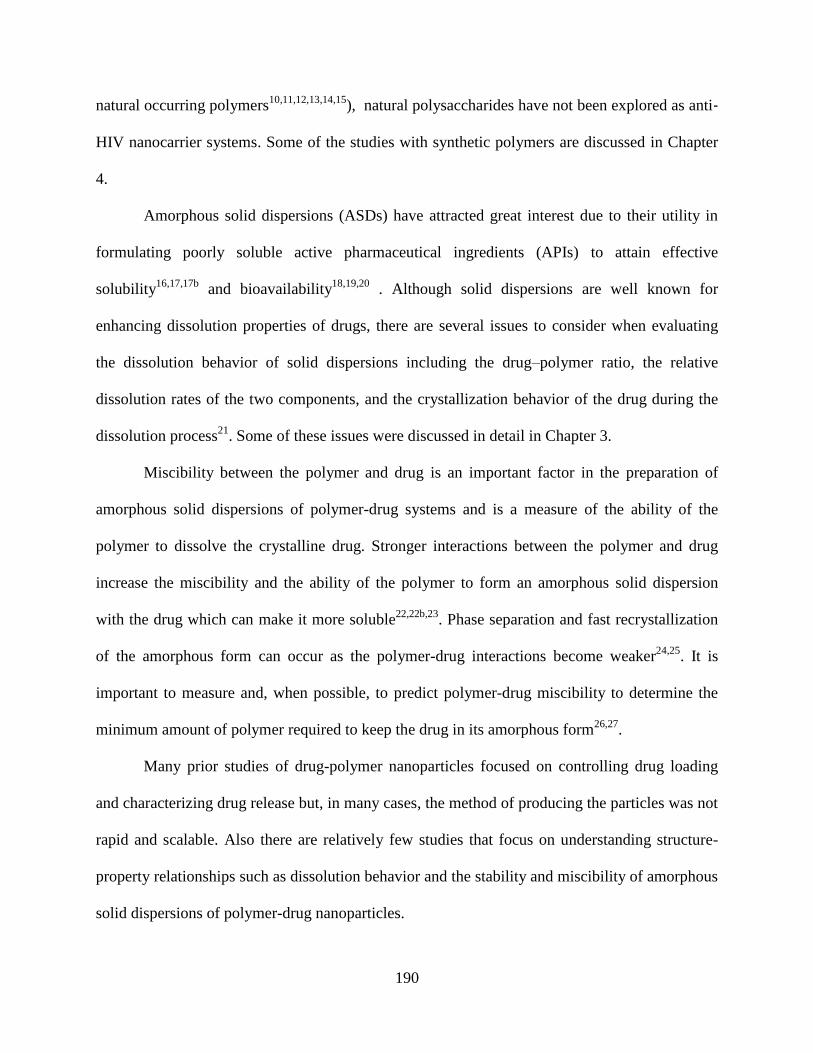
190
natural occurring polymers10,11,12,13,14,15
), natural polysaccharides have not been explored as anti‐
HIV nanocarrier systems. Some of the studies with synthetic polymers are discussed in Chapter
4.
Amorphous solid dispersions (ASDs) have attracted great interest due to their utility in
formulating poorly soluble active pharmaceutical ingredients (APIs) to attain effective
solubility16,17,17b
and bioavailability18,19,20
. Although solid dispersions are well known for
enhancing dissolution properties of drugs, there are several issues to consider when evaluating
the dissolution behavior of solid dispersions including the drug–polymer ratio, the relative
dissolution rates of the two components, and the crystallization behavior of the drug during the
dissolution process21
. Some of these issues were discussed in detail in Chapter 3.
Miscibility between the polymer and drug is an important factor in the preparation of
amorphous solid dispersions of polymer-drug systems and is a measure of the ability of the
polymer to dissolve the crystalline drug. Stronger interactions between the polymer and drug
increase the miscibility and the ability of the polymer to form an amorphous solid dispersion
with the drug which can make it more soluble22,22b,23
. Phase separation and fast recrystallization
of the amorphous form can occur as the polymer-drug interactions become weaker24,25
. It is
important to measure and, when possible, to predict polymer-drug miscibility to determine the
minimum amount of polymer required to keep the drug in its amorphous form26,27
.
Many prior studies of drug-polymer nanoparticles focused on controlling drug loading
and characterizing drug release but, in many cases, the method of producing the particles was not
rapid and scalable. Also there are relatively few studies that focus on understanding structure-
property relationships such as dissolution behavior and the stability and miscibility of amorphous
solid dispersions of polymer-drug nanoparticles.
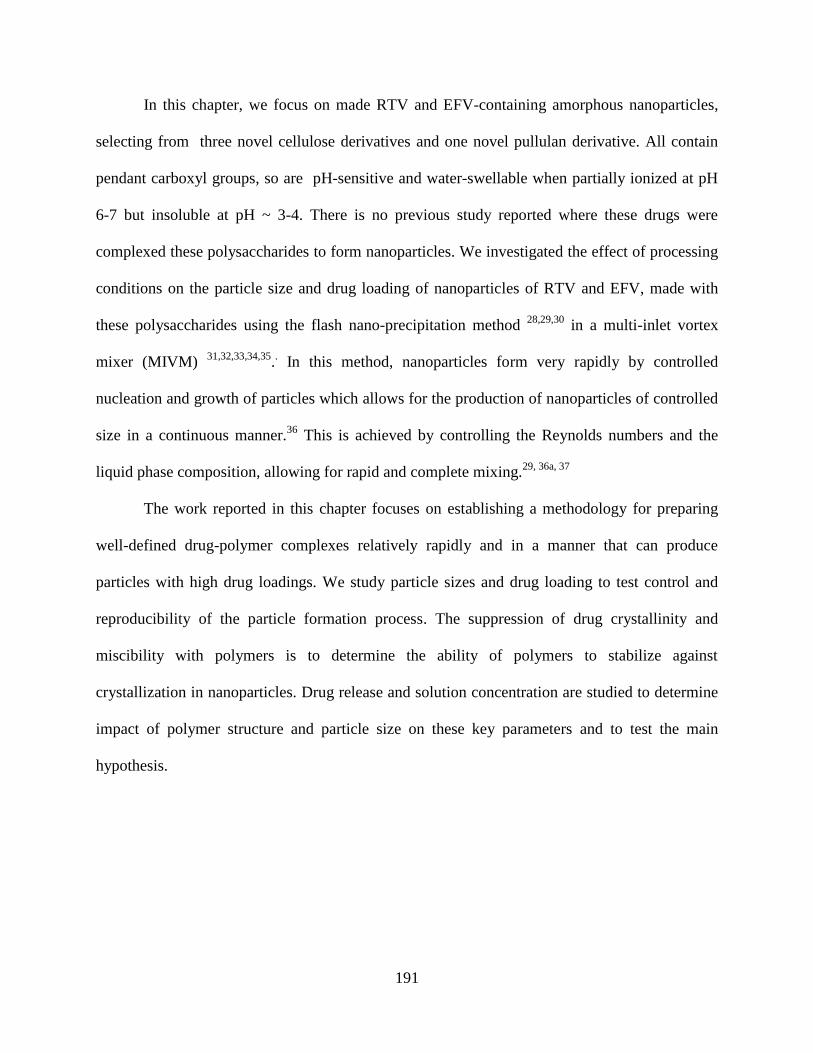
191
In this chapter, we focus on made RTV and EFV-containing amorphous nanoparticles,
selecting from three novel cellulose derivatives and one novel pullulan derivative. All contain
pendant carboxyl groups, so are pH-sensitive and water-swellable when partially ionized at pH
6-7 but insoluble at pH ~ 3-4. There is no previous study reported where these drugs were
complexed these polysaccharides to form nanoparticles. We investigated the effect of processing
conditions on the particle size and drug loading of nanoparticles of RTV and EFV, made with
these polysaccharides using the flash nano-precipitation method 28,29,30
in a multi-inlet vortex
mixer (MIVM) 31,32,33,34,35
.. In this method, nanoparticles form very rapidly by controlled
nucleation and growth of particles which allows for the production of nanoparticles of controlled
size in a continuous manner.36
This is achieved by controlling the Reynolds numbers and the
liquid phase composition, allowing for rapid and complete mixing.29, 36a, 37
The work reported in this chapter focuses on establishing a methodology for preparing
well-defined drug-polymer complexes relatively rapidly and in a manner that can produce
particles with high drug loadings. We study particle sizes and drug loading to test control and
reproducibility of the particle formation process. The suppression of drug crystallinity and
miscibility with polymers is to determine the ability of polymers to stabilize against
crystallization in nanoparticles. Drug release and solution concentration are studied to determine
impact of polymer structure and particle size on these key parameters and to test the main
hypothesis.
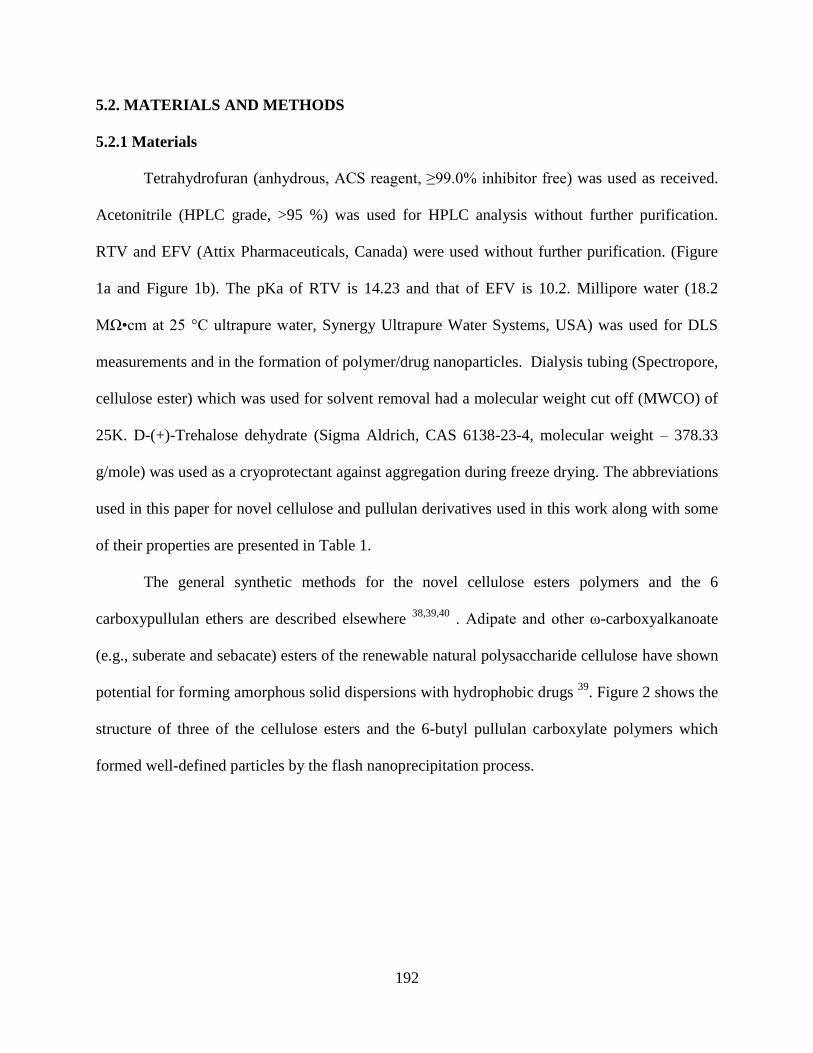
192
5.2. MATERIALS AND METHODS
5.2.1 Materials
Tetrahydrofuran (anhydrous, ACS reagent, ≥99.0% inhibitor free) was used as received.
Acetonitrile (HPLC grade, >95 %) was used for HPLC analysis without further purification.
RTV and EFV (Attix Pharmaceuticals, Canada) were used without further purification. (Figure
1a and Figure 1b). The pKa of RTV is 14.23 and that of EFV is 10.2. Millipore water (18.2
MΩ•cm at 25 °C ultrapure water, Synergy Ultrapure Water Systems, USA) was used for DLS
measurements and in the formation of polymer/drug nanoparticles. Dialysis tubing (Spectropore,
cellulose ester) which was used for solvent removal had a molecular weight cut off (MWCO) of
25K. D-(+)-Trehalose dehydrate (Sigma Aldrich, CAS 6138-23-4, molecular weight – 378.33
g/mole) was used as a cryoprotectant against aggregation during freeze drying. The abbreviations
used in this paper for novel cellulose and pullulan derivatives used in this work along with some
of their properties are presented in Table 1.
The general synthetic methods for the novel cellulose esters polymers and the 6
carboxypullulan ethers are described elsewhere 38,39,40
. Adipate and other ω-carboxyalkanoate
(e.g., suberate and sebacate) esters of the renewable natural polysaccharide cellulose have shown
potential for forming amorphous solid dispersions with hydrophobic drugs 39
. Figure 2 shows the
structure of three of the cellulose esters and the 6-butyl pullulan carboxylate polymers which
formed well-defined particles by the flash nanoprecipitation process.
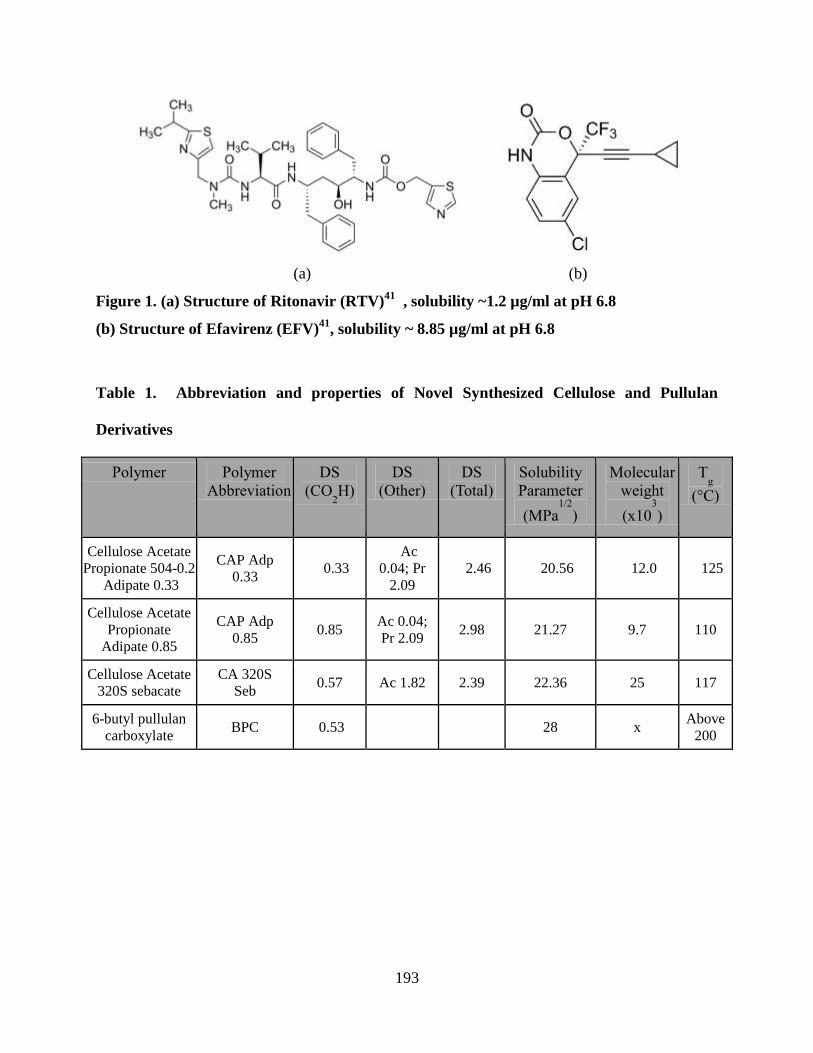
193
(a) (b)
Figure 1. (a) Structure of Ritonavir (RTV)41
, solubility ~1.2 µg/ml at pH 6.8
(b) Structure of Efavirenz (EFV)41
, solubility ~ 8.85 µg/ml at pH 6.8
Table 1. Abbreviation and properties of Novel Synthesized Cellulose and Pullulan
Derivatives
Polymer Polymer
Abbreviation DS
(CO2H)
DS
(Other) DS
(Total) Solubility
Parameter
(MPa1/2
)
Molecular
weight
(x103
)
Tg
(°C)
Cellulose Acetate
Propionate 504-0.2
Adipate 0.33
CAP Adp
0.33 0.33
Ac
0.04; Pr
2.09 2.46 20.56 12.0 125
Cellulose Acetate
Propionate
Adipate 0.85
CAP Adp
0.85 0.85
Ac 0.04;
Pr 2.09 2.98 21.27 9.7 110
Cellulose Acetate
320S sebacate
CA 320S
Seb 0.57 Ac 1.82 2.39 22.36 25 117
6-butyl pullulan
carboxylate BPC 0.53
28 x
Above
200
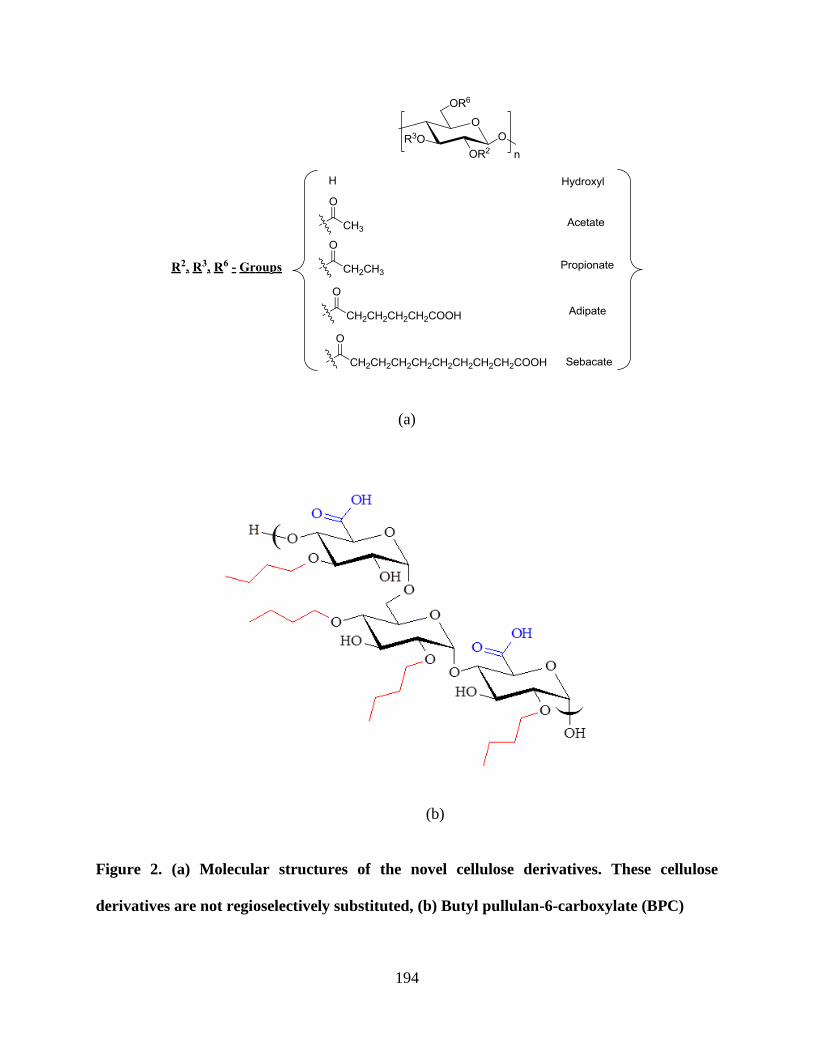
194
(a)
(b)
Figure 2. (a) Molecular structures of the novel cellulose derivatives. These cellulose
derivatives are not regioselectively substituted, (b) Butyl pullulan-6-carboxylate (BPC)
195
(The following methodologies (5.2.2-5.2.8) in this section follow very closely procedures in
Chapter 4: “Preparation and characterization of nanoparticles of carboxymethyl cellulose acetate
butyrate containing anti-viral drugs for oral drug delivery” and are shown here for
completeness.)
5.2.2 Nanoparticle preparation by rapid precipitation in the Multi Inlet Vortex Mixer
Each of the powdered polymers shown in Table 1 and drug (RTV or EFV) and THF were
weighed in to a glass vial that was then sealed with a screw cap and bath sonicated (Cole Parmer
model 8890) for 45 minutes. Flash nanoprecipitation of polymer-drug complexes was carried out
in a four-jet Multi-Inlet Vortex Mixer that accommodates four streams.36a,42
Polymer and drug
(RTV/EFV) were dissolved in THF (organic stream) which was injected into the mixer with
three other water streams. The temperature of the streams was adjusted to 25°C prior to injection
into the mixer by immersing the syringes containing the organic solution and the water in a
temperature controlled bath. The four inlet streams are tangential to the mixing chamber and the
the exit stream comes from the center of the chamber. The nanoparticles were formed at a
nominal Reynolds number of ~ 3900. The Reynolds number is a dimensionless number that is a
measure of turbulence and, in this case, of mixing time. It depends upon the inlet stream
velocities, viscosities, and densities36a,29
. Calculations for the Reynolds number are shown in the
Supporting Information in Chapter 3.
A New Era 4000 double syringe pump (for the organic stream) and a Harvard Apparatus
Remote Infuse/Withdraw PHD 4000 Hpsi Programmable syringe pump (for the three water
streams) controlled inlet flow rates. The New Era pump was controlled by the software, Syringe
Pump Pro version 1.53. The injected volume ratio of THF to Millipore water was 1:9 v/v. The
196
polymer concentration in THF was 10 mg/mL. The target loading of the RTV and EFV was 25
wt% of the total solids on a dry basis.
5.2.3 Microparticle formation
CAP Adp 0.33 or CAP Adp 0.85 (150 mg) in 40 mL acetone were stirred at room
temperature until the polymer was completely dissolved (approximately 2 hours). Ritonavir (50
mg) was added to this solution and stirred for 10 min. The acetone solution containing the
dissolved polymer and drug was added dropwise to 150 mL of water. The organic solvent was
removed from the resulting suspension using a rotary evaporator. The resulting aqueous solution
was then freeze-dried to yield microparticles of amorphous solid dispersions of ritonavir/
polymers.
5.2.4 Nanoparticles recovery, solvent removal and drying
Since the particles exit from the MIVM in a mixed organic-water phase, it was necessary
to remove the solvent and any unincorporated drug from the particles. Thus, particles were
processed by dialysis followed by freeze drying. Polymer-RTV/EFV suspensions were
recovered from the mixer and dialyzed to remove THF, free drug, and dissolved polymer
molecules. Particle suspensions (40 mL) was added to dialysis tubing, which was placed in 4 L
of DI water. The water was changed 4 times over a period of 24 hours. The dialyzed particles
were dried in a LABCONCO freeze dryer at 0.018 mbar for 2 days.
5.2.5 Drug composition by HPLC
Drug loading and drug release were measured using an Agilent 1200 Series HPLC
system which consisted of a quaternary pump, online degasser, manual injector with a 20-μL
sample loop and Agilent chemstation LC 3D software. Chromatography was conducted in
reverse mode using acetonitrile and phosphate buffer (0.05M, pH 5.65). Gradient at 40% for 1
197
min, raised to 60% in 14 min, was reduced to 40% in 1 min, held at 40% for 4 min. Total
analysis time was 20 min. Mobile phase was flow rate 1.5 mL/min, column temperature at 30oC.
Sample injection volume 5 µL. Detection was performed by a diode array detector at a
wavelength of 240 nm for ritonavir and efavirenz. Calibration curves for RTV and EFV
dissolved in acetonitrile were developed and are shown in Figures S.1 and Figure S.2,
respectively, in the Supporting Information in Chapter 4.
5.2.6 Particle size – Dynamic light scattering and Scanning Electron Microscopy
Dynamic light scattering (DLS) measurements of the nanoparticle sizes were performed
before and after dialysis using a Malvern Zetasizer Nano-ZS (Malvern Instruments Ltd,
Malvern, UK) at a wavelength of 633 nm and with a scattering angle of 173˚ at 25 ± 0.1 ºC.
Intensity average diameters were obtained by calculations using Malvern’s Zetasizer nano 6.12,
software that utilizes an algorithm based upon Mie theory with the assumption that the scattering
particles are hard spheres. For DLS analysis of the complexes, typically 200 μL of the
nanoparticle suspension obtained from the mixer were diluted with 2 mL of deionized water. The
dialyzed suspensions (1 mL) were diluted with 3 mL of deionized water and the freeze dried
powders were diluted with deionized water to make a concentration of 0.1 mg/mL. Trehalose
was added before freezing (as a cryoprotectant) at various values of the ratio of nanoparticles:
trehalose ranging from 1:1 to 1:10 to control the redispersibility of the particles. Trehalose forms
hydrogen bonds with nanoparticles during freeze drying and is preferably to many other
cryoprotectants since it has a high Tg, and is not very chemically reactive 43
. Trehalose was
added in nanoparticles of the cellulose derivatives but not added in BPC nanoparticles. The
suspensions were sonicated with a bath sonicator (Cole Parmer model 8890) for 10 minutes
before measuring the particle size by dynamic light scattering. Field emission scanning electron
198
microscope (FESEM) images of the microparticles were obtained using a LEO (Zeiss) 1550
instrument at a 5 kV accelerating voltage in the conventional high vacuum mode. The
microparticles were sonicated at 0.01 mg/ml in DI water. Approximately 100 μl of the prepared
samples was placed on imaging tape and allowed to dry at room temperature. Samples for SEM
were mounted on metal stubs and coated with gold prior to analysis.
5.2.7 Characterization of crystallinity
Crystallinity of nanoparticles and microparticles was evaluated by powder X-ray
diffraction (PXRD) and differential scanning calorimeter (DSC). Particles were stored for 2-3
weeks before analyzing with PXRD and DSC. The particles were kept in glass vials covered
tightly with screw caps and stored in refrigerator (~-20°C).
PXRD patterns were obtained using Bruker D8 Discover X-ray Diffraction system
(Madison, Wisconsin). The X-ray tube consists of a target material made of copper, which emits
a Kα radiation (λ = 1.54 Aº) using a power rating of 2200 watts and an accelerating potential of
60 kV. The divergence and scattering slits were set at 1.0° and the receiving slit was at 0.1 mm.
The experiment was conducted with a scan range from 10° - 40° 2θ, while the scanning speed
was 4°/min.
Morphology was investigated using a TA Instruments differential scanning calorimeter
(Q2000) equipped with a RCA90 refrigerated cooling accessory. Samples (1.5-3.5 mg) in
aluminum Tzero pans were heated at a scanning rate of 10° C/min from a temperature of -85°C
to 180°C, quenched and then heated again. Dry N2 was used as the purge gas at 50 ml/min. The
instrument was equilibrated at -85°C. The calibration of the temperature and cell constant was
carried out with indium. Tg was recorded as the mid-point of the endothermic step transition
199
from the 2nd
heat scan. Thermal transitions were viewed and analyzed using the analysis software
Universal Analysis 2000.
5.2.8 Dissolution studies
Typically, RTV/EFV (10 mgs) or nanoparticles (15 mg) were dispersed in potassium
phosphate buffer (80 mL, pH 6.8) at 37°C for 5 h. The apparatus used in the release experiments
consisted of 250-mL jacketed flasks with circulating ethylene glycol/water (1:1) to control the
temperature. The mixture was constantly stirred at 200 rpm with a magnetic stirr bar. Aliquots
(0.8 mL) were withdrawn from the suspensions every 0.5 hour (during the first 2 hours), then
every hour for 5 h. Phosphate buffer (pH 6.8, 0.8 mL) was added to maintain constant volume
after each aliquot was withdrawn. Samples were ultracentrifuged at 13,000 rpm (equivalent of
16060 g’s) in an accuSpin Micro (Fisher Scientific) for 10 minutes. The supernatant was
recovered, and the solution concentration was determined by HPLC. CAP adipate microparticles
with equivalent amount of drug as nanoparticles were used to compare the solubility and release
of drugs from both kinds of particles. The solubility studies were done approximately 2-3 weeks
after the preparation of the particles. During that period, the particles were kept in glass vials
covered tightly with screw caps and stored in a refrigerator at 4 C.
5.3. RESULTS AND DISCUSSION
We investigated the drug composition, size, crystallinity and solubility of the
nanoparticles, comparing with equivalent microparticles formed by a co-precipitation method.
The role of polymers in enhancing solubility and inhibiting drug crystallinity in the particles is
also discussed.
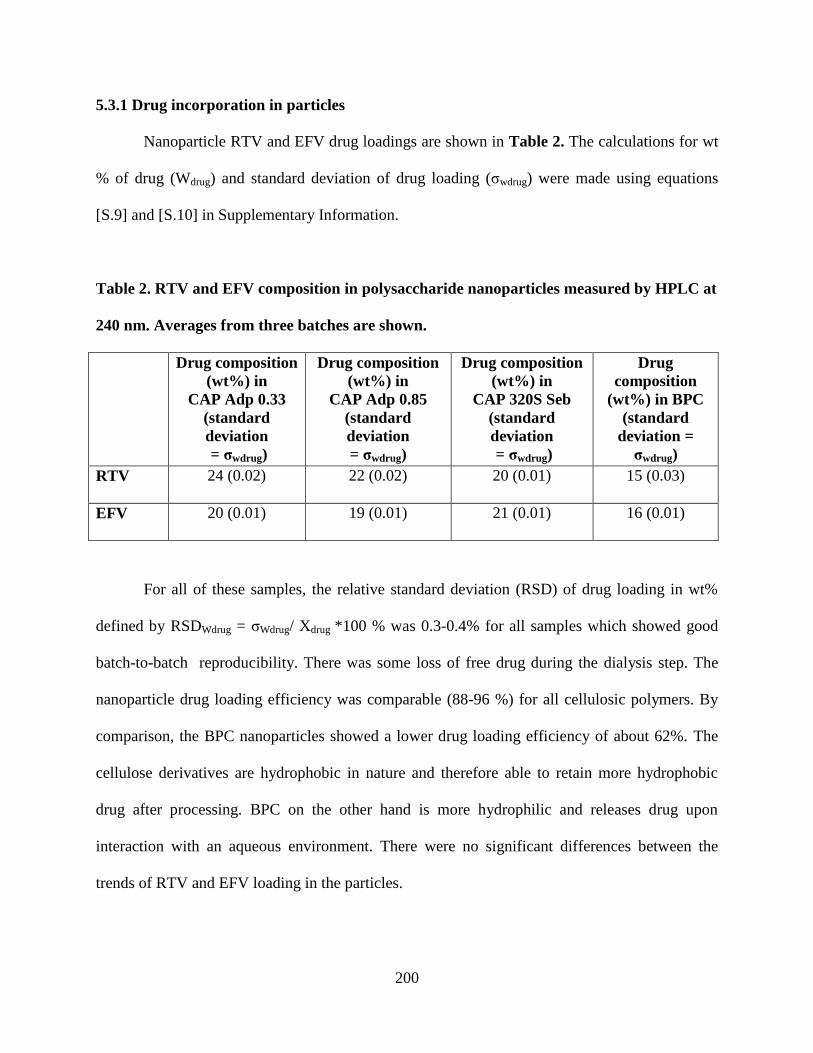
200
5.3.1 Drug incorporation in particles
Nanoparticle RTV and EFV drug loadings are shown in Table 2. The calculations for wt
% of drug (Wdrug) and standard deviation of drug loading (σwdrug) were made using equations
[S.9] and [S.10] in Supplementary Information.
Table 2. RTV and EFV composition in polysaccharide nanoparticles measured by HPLC at
240 nm. Averages from three batches are shown.
Drug composition
(wt%) in
CAP Adp 0.33
(standard
deviation
= σwdrug)
Drug composition
(wt%) in
CAP Adp 0.85
(standard
deviation
= σwdrug)
Drug composition
(wt%) in
CAP 320S Seb
(standard
deviation
= σwdrug)
Drug
composition
(wt%) in BPC
(standard
deviation =
σwdrug)
RTV 24 (0.02) 22 (0.02) 20 (0.01) 15 (0.03)
EFV 20 (0.01) 19 (0.01) 21 (0.01) 16 (0.01)
For all of these samples, the relative standard deviation (RSD) of drug loading in wt%
defined by RSDWdrug = σWdrug/ Xdrug *100 % was 0.3-0.4% for all samples which showed good
batch-to-batch reproducibility. There was some loss of free drug during the dialysis step. The
nanoparticle drug loading efficiency was comparable (88-96 %) for all cellulosic polymers. By
comparison, the BPC nanoparticles showed a lower drug loading efficiency of about 62%. The
cellulose derivatives are hydrophobic in nature and therefore able to retain more hydrophobic
drug after processing. BPC on the other hand is more hydrophilic and releases drug upon
interaction with an aqueous environment. There were no significant differences between the
trends of RTV and EFV loading in the particles.
201
The RTV content of the microparticles of CAP Adp 0.33 and CAP Adp 0.85 prepared for
comparison experiments was 24 wt%, which corresponded to a 96% drug loading efficiency.
5.3.2 Particle size analysis
Particle size analysis of nanoparticles by dynamic light scattering
Figure 3 shows particle sizes for polysaccharide nanoparticles with RTV and EFV after
each processing step including after mixing in the MIVM, after dialysis, and after freeze drying.
The particle sizes were compared after each processing step to observe any significant change in
the size due to the effect of processing step.
The particle sizes from all three processing steps for all the drug compositions were
found to be between 100-200 nm with a polydispersity index approximately 0.2. The particle
sizes were comparable after mixing and dialysis with a standard deviation of approximately ±30
nm. However, significant aggregation was observed after freeze drying. The addition of trehalose
before freezing at a weight ratio trehalose:nanoparticles of 1:9 resulted in a significant reduction
in particle size and polydispersity index. Table 3 shows that particles made with CAP Adp 0.33
and CAP Adp 0.85 were more effectively redispersed upon the addition of trehalose and that
higher concentrations of trehalose resulted in smaller values of the polydispersity index (PDI). It
is important to note that trehalose was only used for particle size experiments and not for the
drug dissolution experiments.
The particle sizes of BPC did not show narrow particle size distributions upon
redispersion after freeze drying. Due to the hydrophilic nature of the polymer, there was a
tendency to absorb moisture and agglomerate rather than re-dispersing on suspension in DI
water. The texture of the cellulose nanoparticles obtained after freeze drying was fluffy which
readily formed powder-like particles whereas the BPC nanoparticles were sticky in nature and
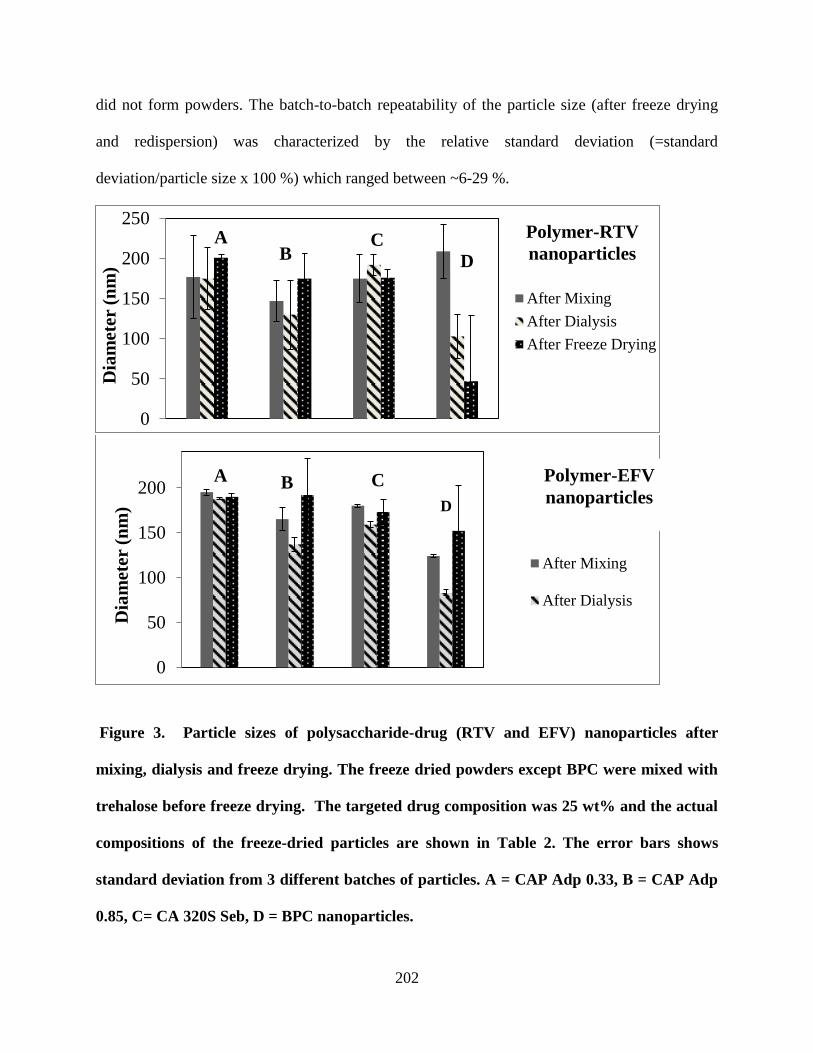
202
did not form powders. The batch-to-batch repeatability of the particle size (after freeze drying
and redispersion) was characterized by the relative standard deviation (=standard
deviation/particle size x 100 %) which ranged between ~6-29 %.
Figure 3. Particle sizes of polysaccharide-drug (RTV and EFV) nanoparticles after
mixing, dialysis and freeze drying. The freeze dried powders except BPC were mixed with
trehalose before freeze drying. The targeted drug composition was 25 wt% and the actual
compositions of the freeze-dried particles are shown in Table 2. The error bars shows
standard deviation from 3 different batches of particles. A = CAP Adp 0.33, B = CAP Adp
0.85, C= CA 320S Seb, D = BPC nanoparticles.
0
50
100
150
200
250
Dia
met
er (
nm
)
After Mixing
After Dialysis
After Freeze Drying
B C
D
0
50
100
150
200
Dia
met
er (
nm
)
After Mixing
After Dialysis
A B C
D
A Polymer-RTV
nanoparticles
Polymer-EFV
nanoparticles
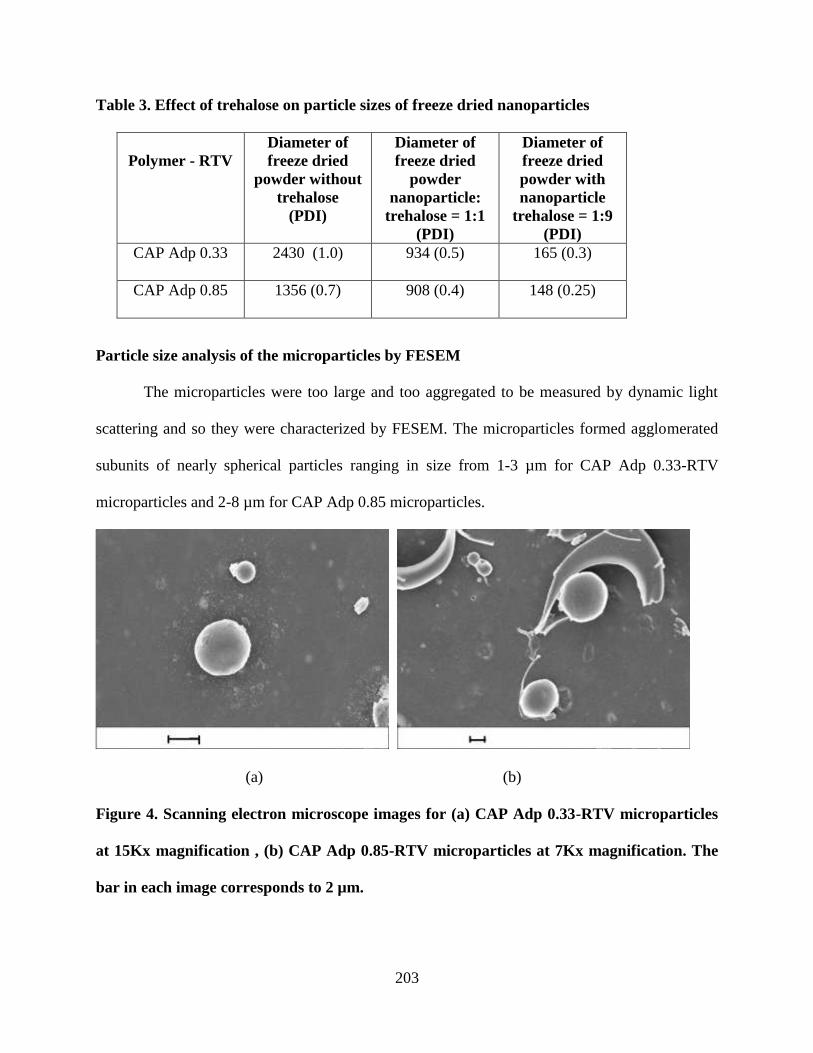
203
Table 3. Effect of trehalose on particle sizes of freeze dried nanoparticles
Polymer - RTV
Diameter of
freeze dried
powder without
trehalose
(PDI)
Diameter of
freeze dried
powder
nanoparticle:
trehalose = 1:1
(PDI)
Diameter of
freeze dried
powder with
nanoparticle
trehalose = 1:9
(PDI)
CAP Adp 0.33 2430 (1.0) 934 (0.5) 165 (0.3)
CAP Adp 0.85 1356 (0.7) 908 (0.4) 148 (0.25)
Particle size analysis of the microparticles by FESEM
The microparticles were too large and too aggregated to be measured by dynamic light
scattering and so they were characterized by FESEM. The microparticles formed agglomerated
subunits of nearly spherical particles ranging in size from 1-3 µm for CAP Adp 0.33-RTV
microparticles and 2-8 µm for CAP Adp 0.85 microparticles.
(a) (b)
Figure 4. Scanning electron microscope images for (a) CAP Adp 0.33-RTV microparticles
at 15Kx magnification , (b) CAP Adp 0.85-RTV microparticles at 7Kx magnification. The
bar in each image corresponds to 2 µm.
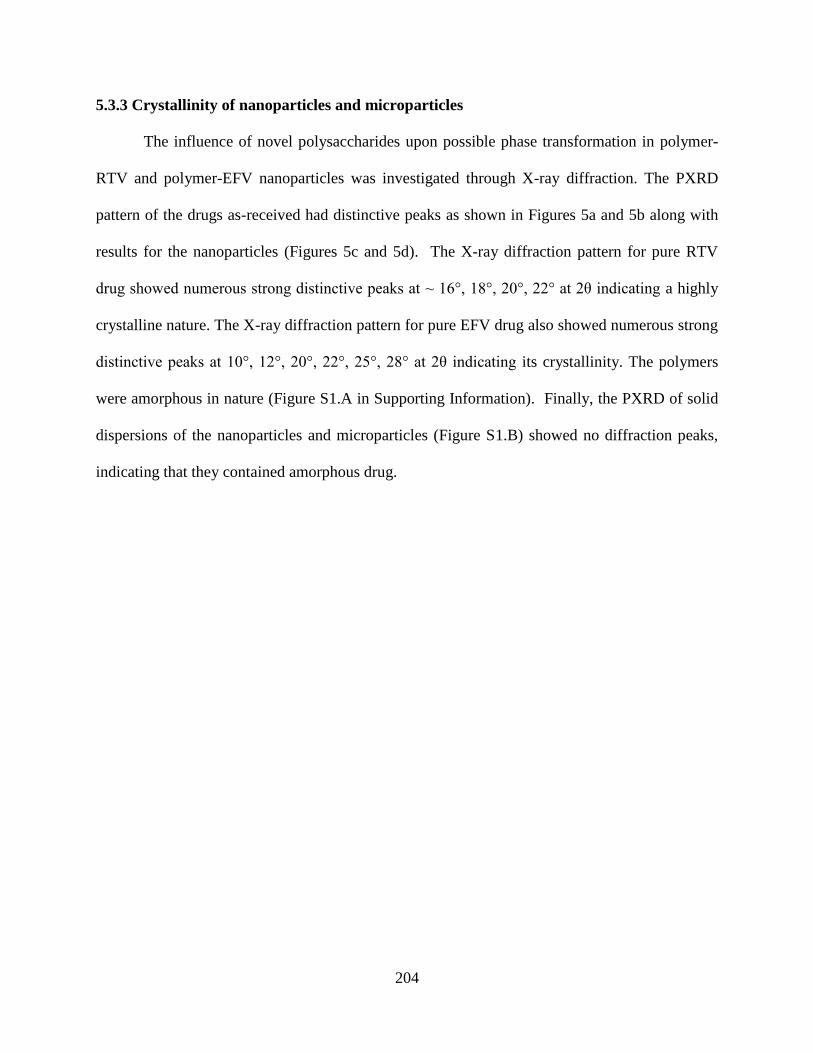
204
5.3.3 Crystallinity of nanoparticles and microparticles
The influence of novel polysaccharides upon possible phase transformation in polymer-
RTV and polymer-EFV nanoparticles was investigated through X-ray diffraction. The PXRD
pattern of the drugs as-received had distinctive peaks as shown in Figures 5a and 5b along with
results for the nanoparticles (Figures 5c and 5d). The X-ray diffraction pattern for pure RTV
drug showed numerous strong distinctive peaks at ~ 16°, 18°, 20°, 22° at 2θ indicating a highly
crystalline nature. The X-ray diffraction pattern for pure EFV drug also showed numerous strong
distinctive peaks at 10°, 12°, 20°, 22°, 25°, 28° at 2θ indicating its crystallinity. The polymers
were amorphous in nature (Figure S1.A in Supporting Information). Finally, the PXRD of solid
dispersions of the nanoparticles and microparticles (Figure S1.B) showed no diffraction peaks,
indicating that they contained amorphous drug.
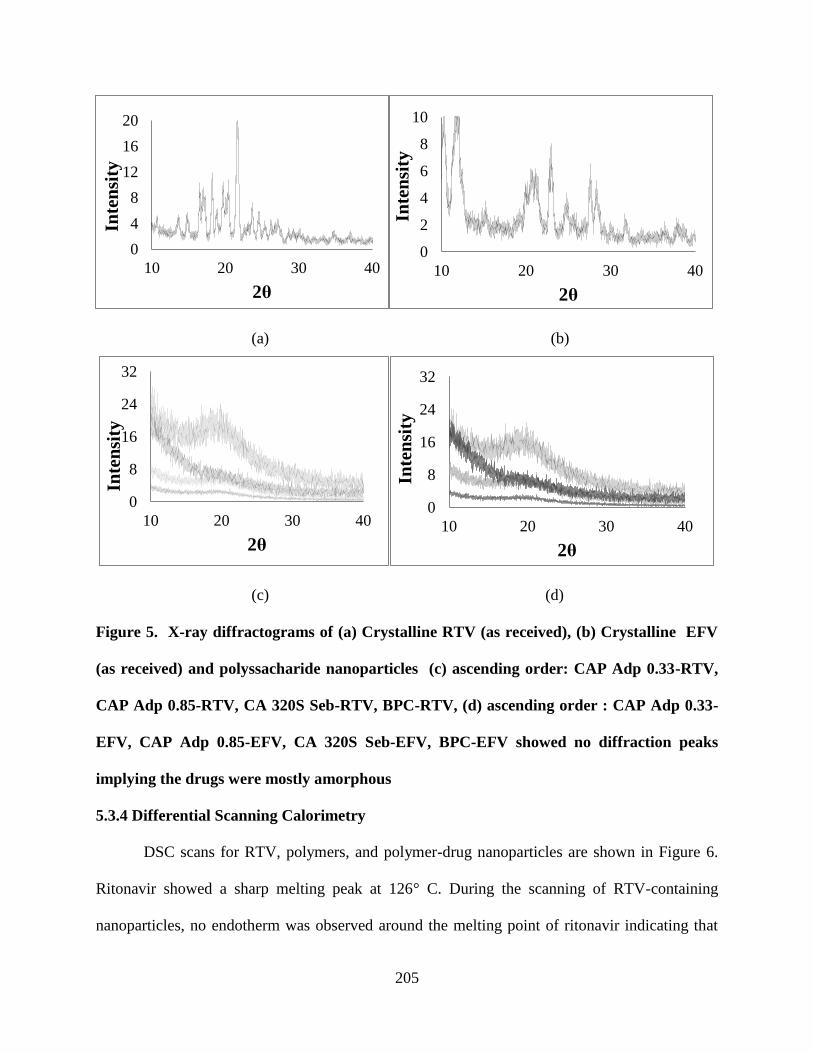
205
(a) (b)
(c) (d)
Figure 5. X-ray diffractograms of (a) Crystalline RTV (as received), (b) Crystalline EFV
(as received) and polyssacharide nanoparticles (c) ascending order: CAP Adp 0.33-RTV,
CAP Adp 0.85-RTV, CA 320S Seb-RTV, BPC-RTV, (d) ascending order : CAP Adp 0.33-
EFV, CAP Adp 0.85-EFV, CA 320S Seb-EFV, BPC-EFV showed no diffraction peaks
implying the drugs were mostly amorphous
5.3.4 Differential Scanning Calorimetry
DSC scans for RTV, polymers, and polymer-drug nanoparticles are shown in Figure 6.
Ritonavir showed a sharp melting peak at 126° C. During the scanning of RTV-containing
nanoparticles, no endotherm was observed around the melting point of ritonavir indicating that
0
4
8
12
16
20
10 20 30 40
Inte
nsi
ty
2θ
0
2
4
6
8
10
10 20 30 40
Inte
nsi
ty
2θ
0
8
16
24
32
10 20 30 40
Inte
nsi
ty
2θ
0
8
16
24
32
10 20 30 40
Inte
nsi
ty
2θ
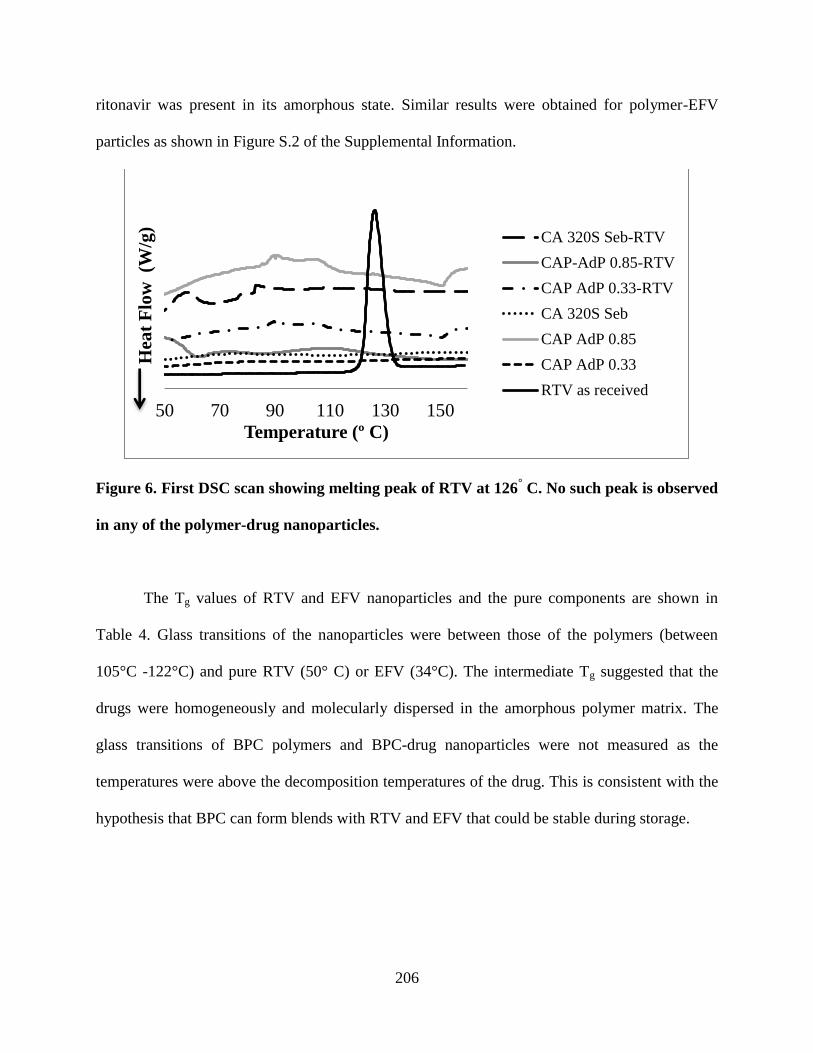
206
ritonavir was present in its amorphous state. Similar results were obtained for polymer-EFV
particles as shown in Figure S.2 of the Supplemental Information.
Figure 6. First DSC scan showing melting peak of RTV at 126° C. No such peak is observed
in any of the polymer-drug nanoparticles.
The Tg values of RTV and EFV nanoparticles and the pure components are shown in
Table 4. Glass transitions of the nanoparticles were between those of the polymers (between
105°C -122°C) and pure RTV (50° C) or EFV (34°C). The intermediate Tg suggested that the
drugs were homogeneously and molecularly dispersed in the amorphous polymer matrix. The
glass transitions of BPC polymers and BPC-drug nanoparticles were not measured as the
temperatures were above the decomposition temperatures of the drug. This is consistent with the
hypothesis that BPC can form blends with RTV and EFV that could be stable during storage.
50 70 90 110 130 150
Hea
t F
low
(W
/g)
Temperature (º C)
CA 320S Seb-RTV
CAP-AdP 0.85-RTV
CAP AdP 0.33-RTV
CA 320S Seb
CAP AdP 0.85
CAP AdP 0.33
RTV as received
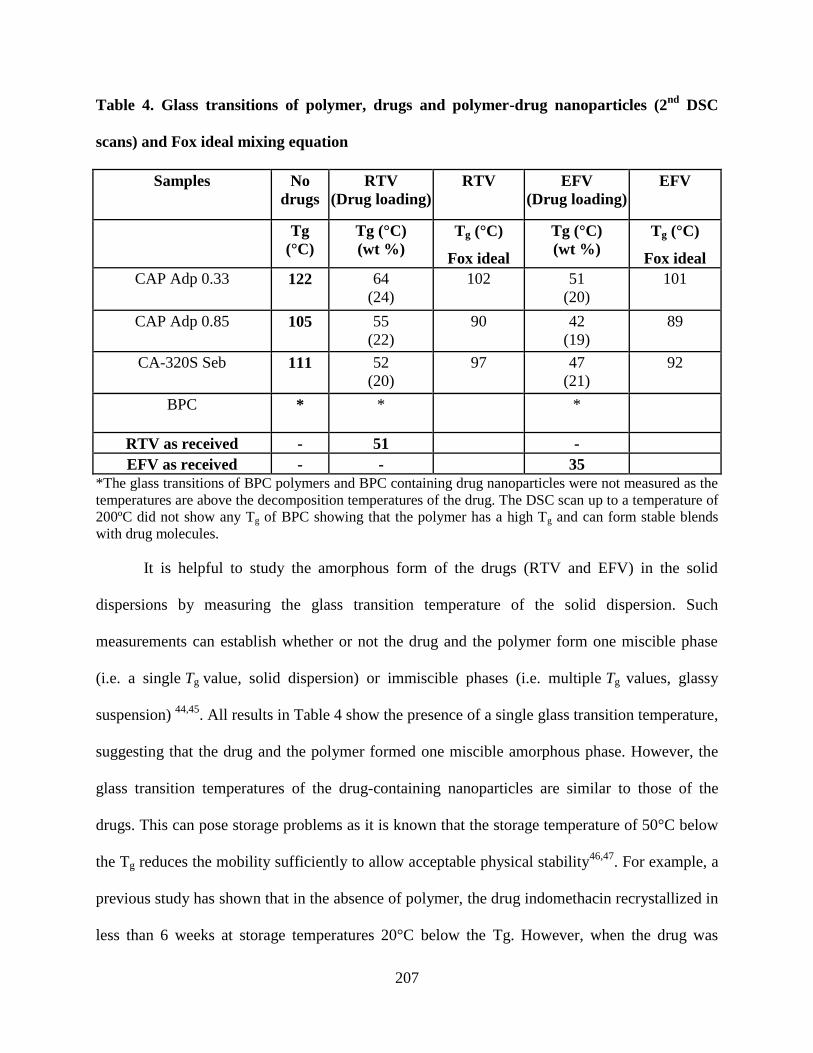
207
Table 4. Glass transitions of polymer, drugs and polymer-drug nanoparticles (2nd
DSC
scans) and Fox ideal mixing equation
Samples
No
drugs
RTV
(Drug loading)
RTV EFV
(Drug loading)
EFV
Tg
(°C)
Tg (°C)
(wt %)
Tg (°C)
Fox ideal
Tg (°C)
(wt %)
Tg (°C)
Fox ideal
CAP Adp 0.33
122 64
(24)
102 51
(20)
101
CAP Adp 0.85
105 55
(22)
90 42
(19)
89
CA-320S Seb
111 52
(20)
97 47
(21)
92
BPC
* * *
RTV as received - 51 -
EFV as received - - 35
*The glass transitions of BPC polymers and BPC containing drug nanoparticles were not measured as the
temperatures are above the decomposition temperatures of the drug. The DSC scan up to a temperature of
200ºC did not show any Tg of BPC showing that the polymer has a high Tg and can form stable blends
with drug molecules.
It is helpful to study the amorphous form of the drugs (RTV and EFV) in the solid
dispersions by measuring the glass transition temperature of the solid dispersion. Such
measurements can establish whether or not the drug and the polymer form one miscible phase
(i.e. a single Tg value, solid dispersion) or immiscible phases (i.e. multiple Tg values, glassy
suspension) 44,45
. All results in Table 4 show the presence of a single glass transition temperature,
suggesting that the drug and the polymer formed one miscible amorphous phase. However, the
glass transition temperatures of the drug-containing nanoparticles are similar to those of the
drugs. This can pose storage problems as it is known that the storage temperature of 50°C below
the Tg reduces the mobility sufficiently to allow acceptable physical stability46,47
. For example, a
previous study has shown that in the absence of polymer, the drug indomethacin recrystallized in
less than 6 weeks at storage temperatures 20°C below the Tg. However, when the drug was
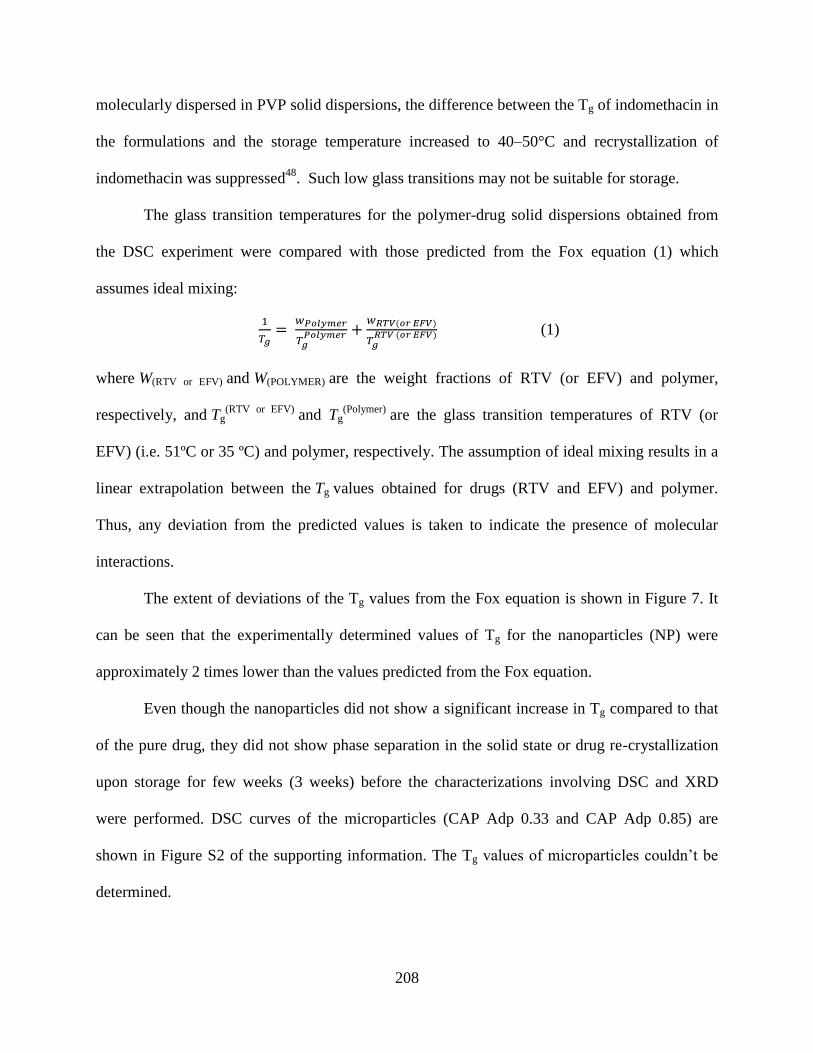
208
molecularly dispersed in PVP solid dispersions, the difference between the Tg of indomethacin in
the formulations and the storage temperature increased to 40–50°C and recrystallization of
indomethacin was suppressed48
. Such low glass transitions may not be suitable for storage.
The glass transition temperatures for the polymer-drug solid dispersions obtained from
the DSC experiment were compared with those predicted from the Fox equation (1) which
assumes ideal mixing:
(1)
where W(RTV or EFV) and W(POLYMER) are the weight fractions of RTV (or EFV) and polymer,
respectively, and Tg(RTV or EFV)
and Tg(Polymer)
are the glass transition temperatures of RTV (or
EFV) (i.e. 51ºC or 35 ºC) and polymer, respectively. The assumption of ideal mixing results in a
linear extrapolation between the Tg values obtained for drugs (RTV and EFV) and polymer.
Thus, any deviation from the predicted values is taken to indicate the presence of molecular
interactions.
The extent of deviations of the Tg values from the Fox equation is shown in Figure 7. It
can be seen that the experimentally determined values of Tg for the nanoparticles (NP) were
approximately 2 times lower than the values predicted from the Fox equation.
Even though the nanoparticles did not show a significant increase in Tg compared to that
of the pure drug, they did not show phase separation in the solid state or drug re-crystallization
upon storage for few weeks (3 weeks) before the characterizations involving DSC and XRD
were performed. DSC curves of the microparticles (CAP Adp 0.33 and CAP Adp 0.85) are
shown in Figure S2 of the supporting information. The Tg values of microparticles couldn’t be
determined.
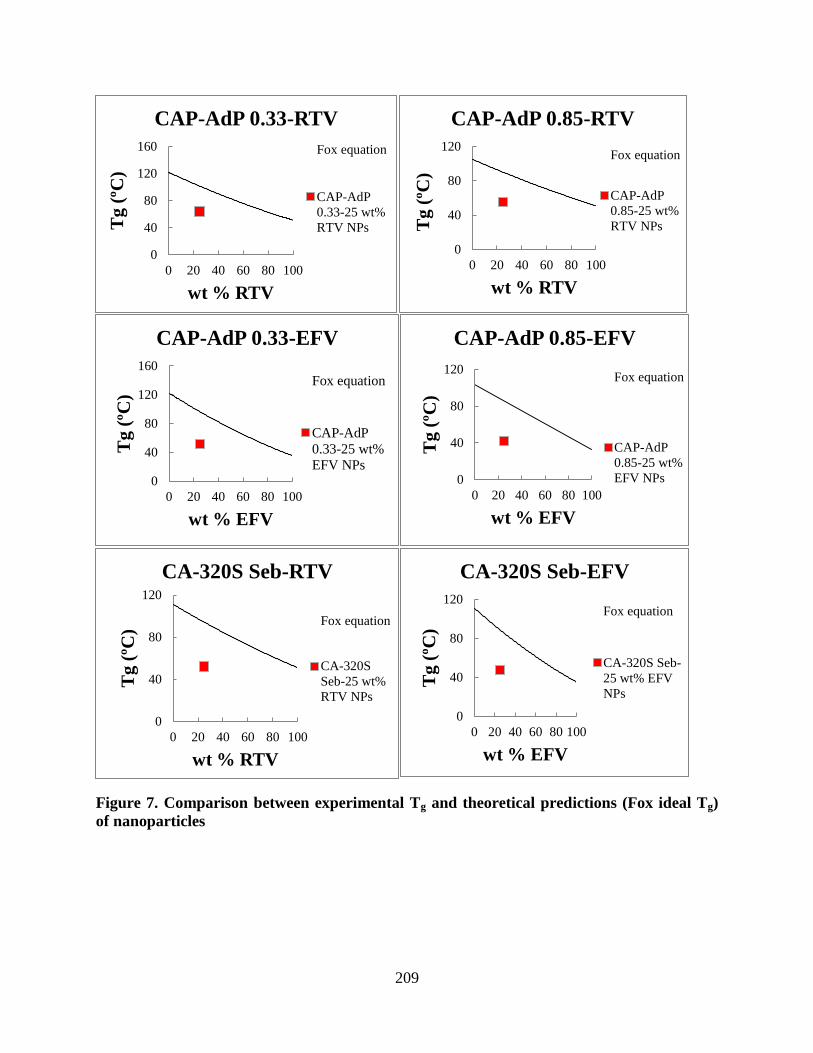
209
Figure 7. Comparison between experimental Tg and theoretical predictions (Fox ideal Tg)
of nanoparticles
0
40
80
120
160
0 20 40 60 80 100
Tg
(ºC
)
wt % RTV
CAP-AdP 0.33-RTV
Fox equation
CAP-AdP
0.33-25 wt%
RTV NPs
0
40
80
120
0 20 40 60 80 100
Tg
(ºC
)
wt % RTV
CAP-AdP 0.85-RTV
Fox equation
CAP-AdP
0.85-25 wt%
RTV NPs
0
40
80
120
160
0 20 40 60 80 100
Tg
(ºC
)
wt % EFV
CAP-AdP 0.33-EFV
Fox equation
CAP-AdP
0.33-25 wt%
EFV NPs0
40
80
120
0 20 40 60 80 100
Tg
(ºC
)
wt % EFV
CAP-AdP 0.85-EFV
Fox equation
CAP-AdP
0.85-25 wt%
EFV NPs
0
40
80
120
0 20 40 60 80 100
Tg
(ºC
)
wt % RTV
CA-320S Seb-RTV
Fox equation
CA-320S
Seb-25 wt%
RTV NPs
0
40
80
120
0 20 40 60 80 100
Tg
(ºC
)
wt % EFV
CA-320S Seb-EFV
Fox equation
CA-320S Seb-
25 wt% EFV
NPs
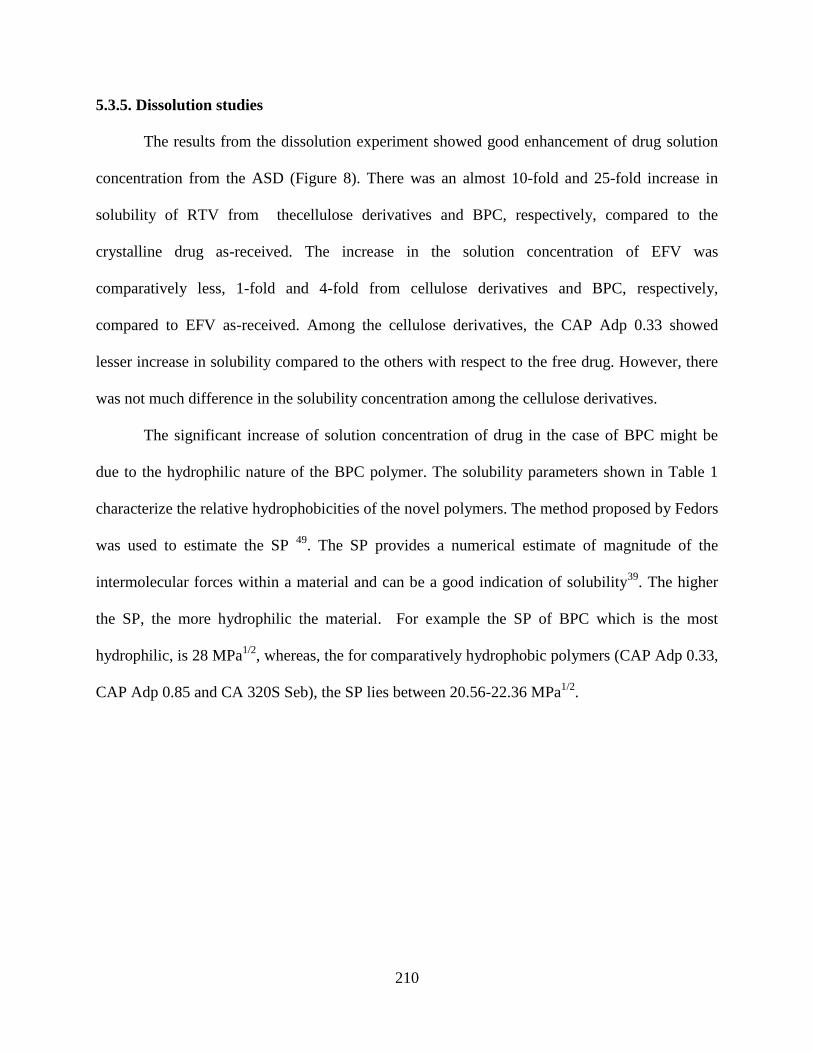
210
5.3.5. Dissolution studies
The results from the dissolution experiment showed good enhancement of drug solution
concentration from the ASD (Figure 8). There was an almost 10-fold and 25-fold increase in
solubility of RTV from thecellulose derivatives and BPC, respectively, compared to the
crystalline drug as-received. The increase in the solution concentration of EFV was
comparatively less, 1-fold and 4-fold from cellulose derivatives and BPC, respectively,
compared to EFV as-received. Among the cellulose derivatives, the CAP Adp 0.33 showed
lesser increase in solubility compared to the others with respect to the free drug. However, there
was not much difference in the solubility concentration among the cellulose derivatives.
The significant increase of solution concentration of drug in the case of BPC might be
due to the hydrophilic nature of the BPC polymer. The solubility parameters shown in Table 1
characterize the relative hydrophobicities of the novel polymers. The method proposed by Fedors
was used to estimate the SP 49
. The SP provides a numerical estimate of magnitude of the
intermolecular forces within a material and can be a good indication of solubility39
. The higher
the SP, the more hydrophilic the material. For example the SP of BPC which is the most
hydrophilic, is 28 MPa1/2
, whereas, the for comparatively hydrophobic polymers (CAP Adp 0.33,
CAP Adp 0.85 and CA 320S Seb), the SP lies between 20.56-22.36 MPa1/2
.
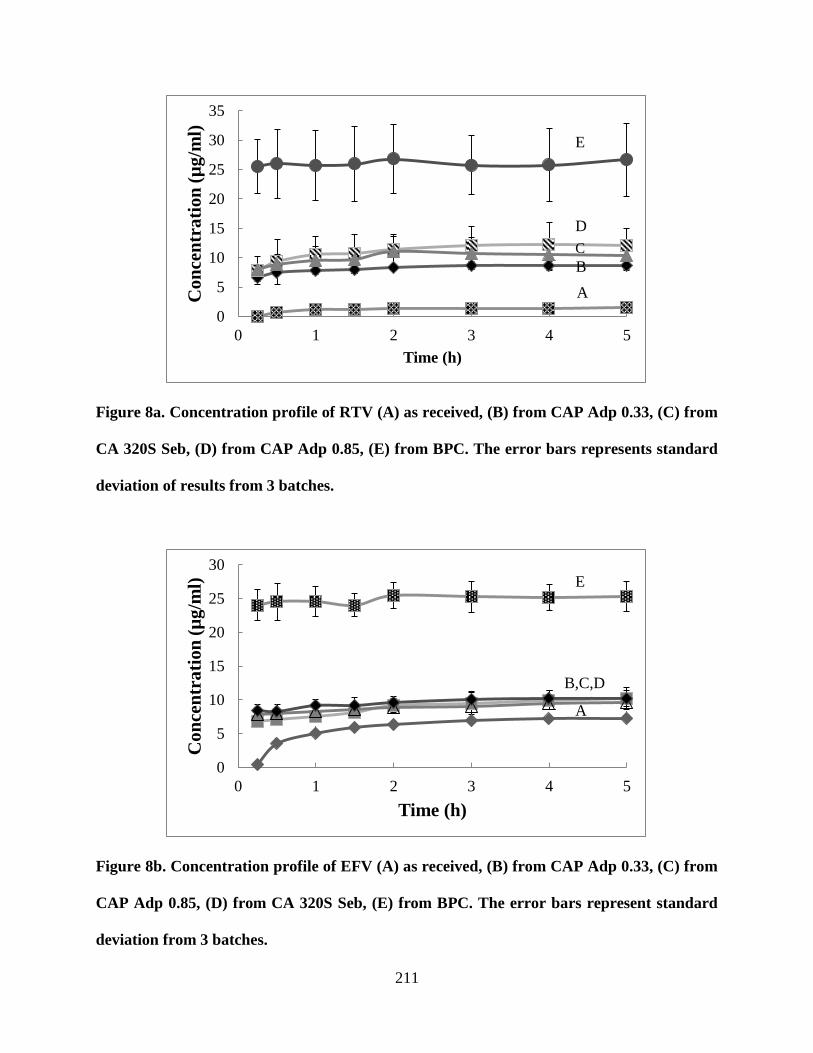
211
Figure 8a. Concentration profile of RTV (A) as received, (B) from CAP Adp 0.33, (C) from
CA 320S Seb, (D) from CAP Adp 0.85, (E) from BPC. The error bars represents standard
deviation of results from 3 batches.
Figure 8b. Concentration profile of EFV (A) as received, (B) from CAP Adp 0.33, (C) from
CAP Adp 0.85, (D) from CA 320S Seb, (E) from BPC. The error bars represent standard
deviation from 3 batches.
0
5
10
15
20
25
30
35
0 1 2 3 4 5
Co
nce
ntr
ati
on
(µ
g/m
l)
Time (h)
C
D
E
0
5
10
15
20
25
30
0 1 2 3 4 5
Co
nce
ntr
ati
on
(µ
g/m
l)
Time (h)
A
B,C,D
E
A
B
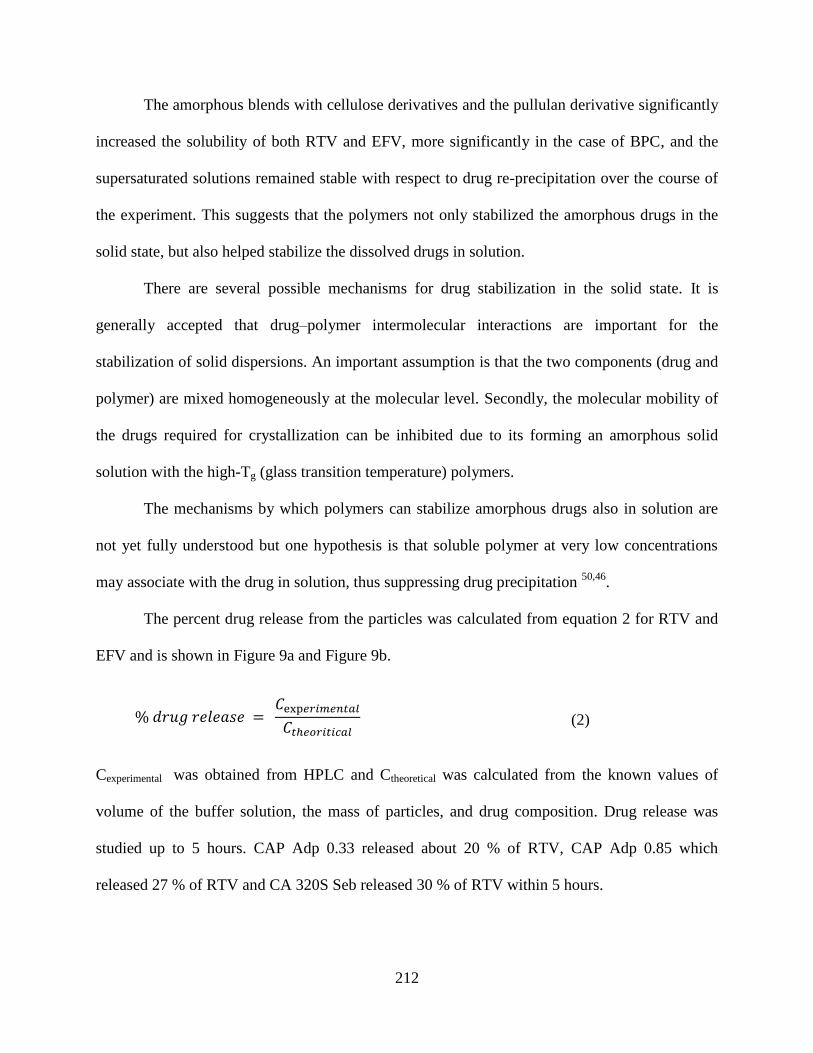
212
The amorphous blends with cellulose derivatives and the pullulan derivative significantly
increased the solubility of both RTV and EFV, more significantly in the case of BPC, and the
supersaturated solutions remained stable with respect to drug re-precipitation over the course of
the experiment. This suggests that the polymers not only stabilized the amorphous drugs in the
solid state, but also helped stabilize the dissolved drugs in solution.
There are several possible mechanisms for drug stabilization in the solid state. It is
generally accepted that drug–polymer intermolecular interactions are important for the
stabilization of solid dispersions. An important assumption is that the two components (drug and
polymer) are mixed homogeneously at the molecular level. Secondly, the molecular mobility of
the drugs required for crystallization can be inhibited due to its forming an amorphous solid
solution with the high-Tg (glass transition temperature) polymers.
The mechanisms by which polymers can stabilize amorphous drugs also in solution are
not yet fully understood but one hypothesis is that soluble polymer at very low concentrations
may associate with the drug in solution, thus suppressing drug precipitation 50,46
.
The percent drug release from the particles was calculated from equation 2 for RTV and
EFV and is shown in Figure 9a and Figure 9b.
(2)
Cexperimental was obtained from HPLC and Ctheoretical was calculated from the known values of
volume of the buffer solution, the mass of particles, and drug composition. Drug release was
studied up to 5 hours. CAP Adp 0.33 released about 20 % of RTV, CAP Adp 0.85 which
released 27 % of RTV and CA 320S Seb released 30 % of RTV within 5 hours.
% 𝑑𝑟𝑢𝑔 𝑟𝑒𝑙𝑒𝑎𝑠𝑒 𝐶
𝐶
× 100%
213
Figure 9a. Release profile of RTV (A) as received, (B) from CAP Adp 0.33, (C) from CAP
Adp 0.85, (D) from CA 320S Seb, (E) from BPC. The error bars represent standard
deviation of results from 3 batches.
0
20
40
60
80
100
0 1 2 3 4 5
Rel
ease
(%
)
Time (h)
A
B
C D
E
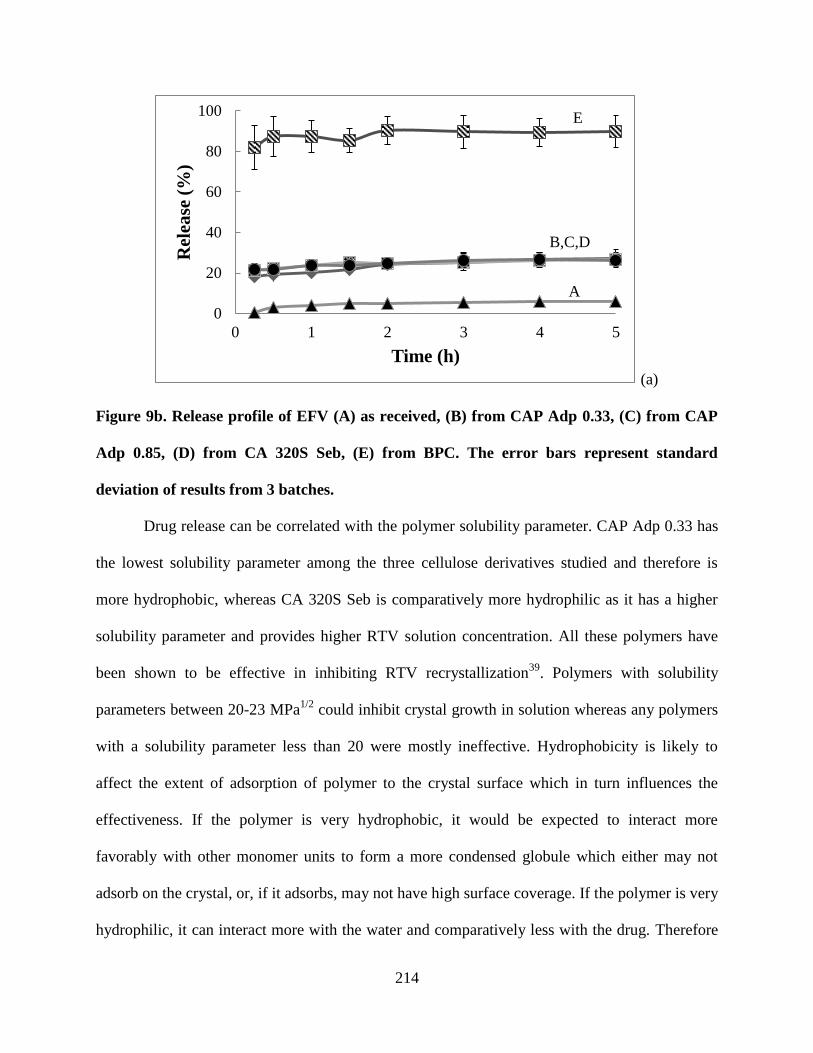
214
(a)
Figure 9b. Release profile of EFV (A) as received, (B) from CAP Adp 0.33, (C) from CAP
Adp 0.85, (D) from CA 320S Seb, (E) from BPC. The error bars represent standard
deviation of results from 3 batches.
Drug release can be correlated with the polymer solubility parameter. CAP Adp 0.33 has
the lowest solubility parameter among the three cellulose derivatives studied and therefore is
more hydrophobic, whereas CA 320S Seb is comparatively more hydrophilic as it has a higher
solubility parameter and provides higher RTV solution concentration. All these polymers have
been shown to be effective in inhibiting RTV recrystallization39
. Polymers with solubility
parameters between 20-23 MPa1/2
could inhibit crystal growth in solution whereas any polymers
with a solubility parameter less than 20 were mostly ineffective. Hydrophobicity is likely to
affect the extent of adsorption of polymer to the crystal surface which in turn influences the
effectiveness. If the polymer is very hydrophobic, it would be expected to interact more
favorably with other monomer units to form a more condensed globule which either may not
adsorb on the crystal, or, if it adsorbs, may not have high surface coverage. If the polymer is very
hydrophilic, it can interact more with the water and comparatively less with the drug. Therefore
0
20
40
60
80
100
0 1 2 3 4 5
Rel
ease
(%
)
Time (h)
A
B,C,D
E
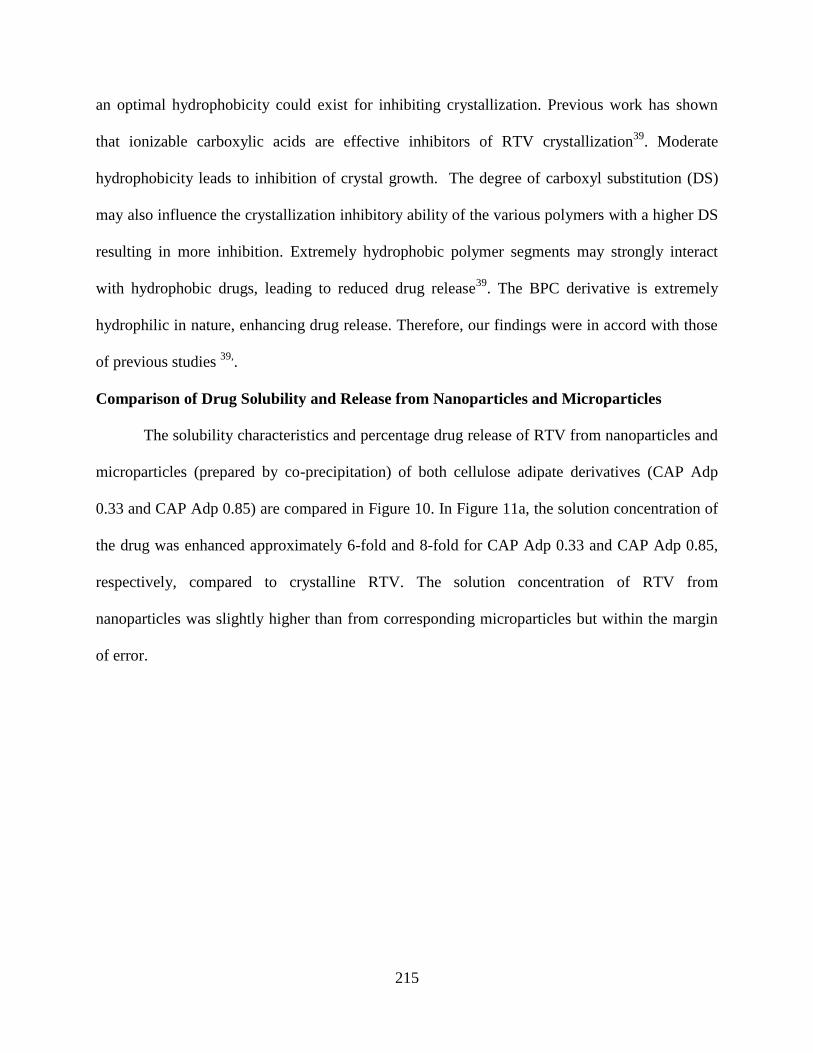
215
an optimal hydrophobicity could exist for inhibiting crystallization. Previous work has shown
that ionizable carboxylic acids are effective inhibitors of RTV crystallization39
. Moderate
hydrophobicity leads to inhibition of crystal growth. The degree of carboxyl substitution (DS)
may also influence the crystallization inhibitory ability of the various polymers with a higher DS
resulting in more inhibition. Extremely hydrophobic polymer segments may strongly interact
with hydrophobic drugs, leading to reduced drug release39
. The BPC derivative is extremely
hydrophilic in nature, enhancing drug release. Therefore, our findings were in accord with those
of previous studies 39,
.
Comparison of Drug Solubility and Release from Nanoparticles and Microparticles
The solubility characteristics and percentage drug release of RTV from nanoparticles and
microparticles (prepared by co-precipitation) of both cellulose adipate derivatives (CAP Adp
0.33 and CAP Adp 0.85) are compared in Figure 10. In Figure 11a, the solution concentration of
the drug was enhanced approximately 6-fold and 8-fold for CAP Adp 0.33 and CAP Adp 0.85,
respectively, compared to crystalline RTV. The solution concentration of RTV from
nanoparticles was slightly higher than from corresponding microparticles but within the margin
of error.
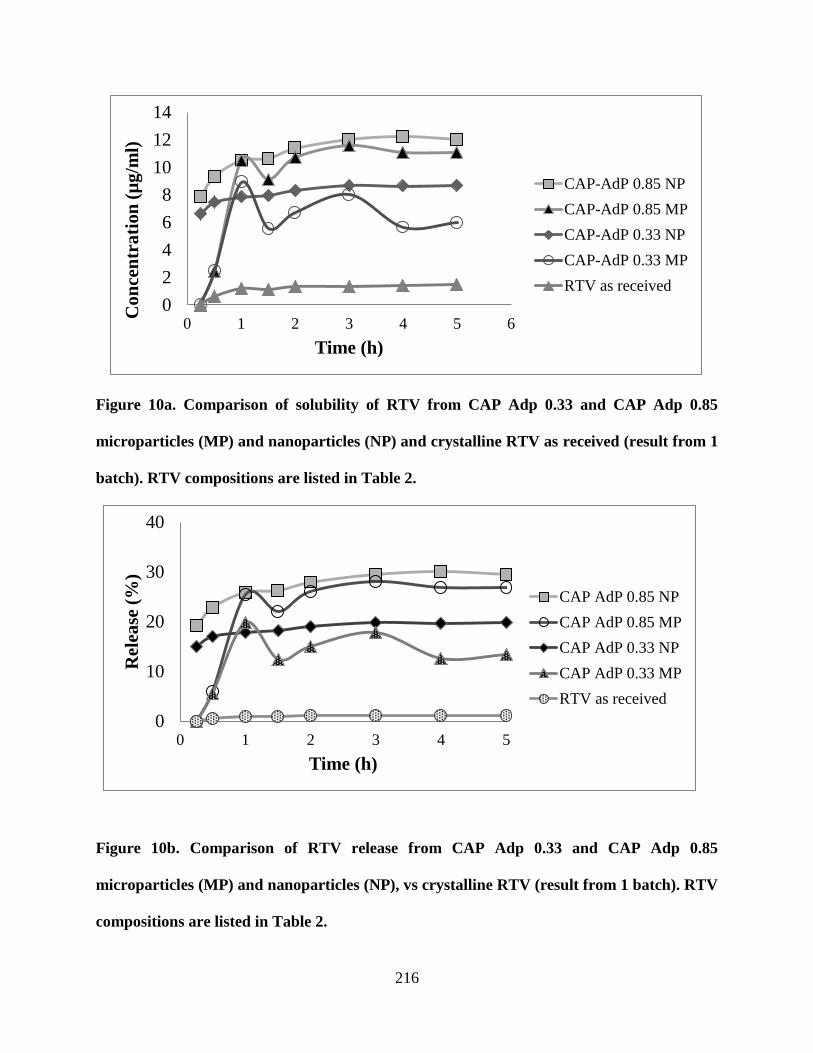
216
Figure 10a. Comparison of solubility of RTV from CAP Adp 0.33 and CAP Adp 0.85
microparticles (MP) and nanoparticles (NP) and crystalline RTV as received (result from 1
batch). RTV compositions are listed in Table 2.
Figure 10b. Comparison of RTV release from CAP Adp 0.33 and CAP Adp 0.85
microparticles (MP) and nanoparticles (NP), vs crystalline RTV (result from 1 batch). RTV
compositions are listed in Table 2.
0
2
4
6
8
10
12
14
0 1 2 3 4 5 6
Co
nce
ntr
ati
on
(µ
g/m
l)
Time (h)
CAP-AdP 0.85 NP
CAP-AdP 0.85 MP
CAP-AdP 0.33 NP
CAP-AdP 0.33 MP
RTV as received
0
10
20
30
40
0 1 2 3 4 5
Rel
ease
(%
)
Time (h)
CAP AdP 0.85 NP
CAP AdP 0.85 MP
CAP AdP 0.33 NP
CAP AdP 0.33 MP
RTV as received
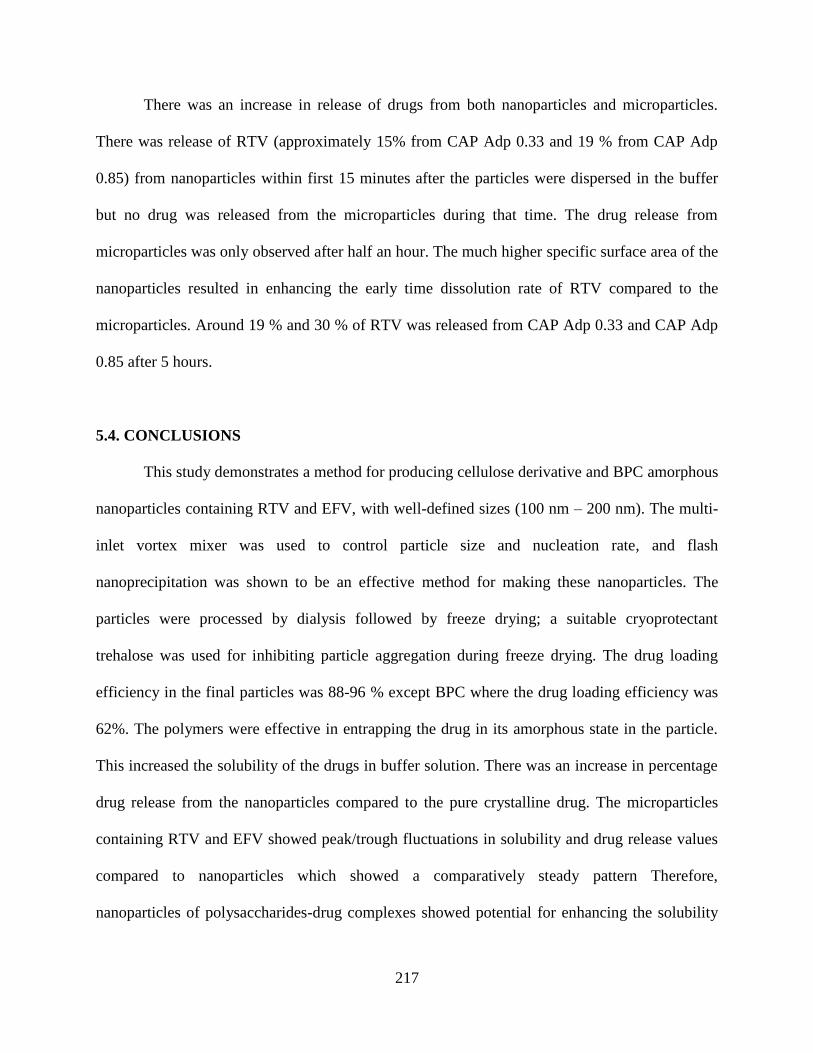
217
There was an increase in release of drugs from both nanoparticles and microparticles.
There was release of RTV (approximately 15% from CAP Adp 0.33 and 19 % from CAP Adp
0.85) from nanoparticles within first 15 minutes after the particles were dispersed in the buffer
but no drug was released from the microparticles during that time. The drug release from
microparticles was only observed after half an hour. The much higher specific surface area of the
nanoparticles resulted in enhancing the early time dissolution rate of RTV compared to the
microparticles. Around 19 % and 30 % of RTV was released from CAP Adp 0.33 and CAP Adp
0.85 after 5 hours.
5.4. CONCLUSIONS
This study demonstrates a method for producing cellulose derivative and BPC amorphous
nanoparticles containing RTV and EFV, with well-defined sizes (100 nm – 200 nm). The multi-
inlet vortex mixer was used to control particle size and nucleation rate, and flash
nanoprecipitation was shown to be an effective method for making these nanoparticles. The
particles were processed by dialysis followed by freeze drying; a suitable cryoprotectant
trehalose was used for inhibiting particle aggregation during freeze drying. The drug loading
efficiency in the final particles was 88-96 % except BPC where the drug loading efficiency was
62%. The polymers were effective in entrapping the drug in its amorphous state in the particle.
This increased the solubility of the drugs in buffer solution. There was an increase in percentage
drug release from the nanoparticles compared to the pure crystalline drug. The microparticles
containing RTV and EFV showed peak/trough fluctuations in solubility and drug release values
compared to nanoparticles which showed a comparatively steady pattern Therefore,
nanoparticles of polysaccharides-drug complexes showed potential for enhancing the solubility
218
and sustained release of poorly soluble drugs (RTV and EFV). The dissolution behavior was
dependent on both the properties of the polymer (solubility parameter, degree of substitution,
hyphobocity) as well the drug (solubility parameter, solubility, presence of hydrophobic groups).
The polymers with solubility parameter between 20-23 MPa1/2
could inhibit crystal growth in
solution, anything less than 20 were mostly ineffective. However, BPC with a higher solubility
parameter (28 MPa1/2
) showed very high concentration and release compared to the crystalline
drugs but did not show well defined drug composition and particle size.
Future studies of polysaccharides for the preparation of amorphous solid dispersions will
focus on whether the polymer hydrophobicity is likely to affect the extent of adsorption of the
polymer to the crystal surface of the drug. If the polymer is very hydrophobic, it could interact
more favorably with other, similar polymer chains to form a more condensed globule which
either may not adsorb on the crystal or if it adsorbs may not have high surface coverage. If the
polymer is very hydrophilic, it can interact more with the water and comparatively less with the
drug. Therefore an optimal hydrophobicity could exist for inhibiting crystallization. Future
studies will also probe whether a higher degree of carboxyl substitution (DS) shows more
effective inhibition of crystallization as suggested by the pullulan derivative results. There can be
differences in the particle shape, size, polydispersity and morphology depending on the
preparation method so care must be taken to use the synthesis method and purification
(separation, drying) techniques to obtain well-defined particles. The use of excipients such as
cryoprotectants (or excipients) to control particle size would be an additional and useful step.
219
ACKNOWLEDGEMENTS
The authors gratefully acknowledge funding and support from the Macromolecules and
Interface Institute and the National Science Foundation under Contract # DMR 0909065. The
authors also thank Rick Caudill, Research Specialist, Department of Sustainable Biomaterials for
his assistance with the PXRD analysis and Mr. Steve McCartney, of the Institute for Critical
Technology and Applied Science-Nanoscale Characterization and Fabrication Laboratory
(ICTAS-NCFL) at Virginia Tech for help with the FESEM images.
5.5. REFERENCES
1. World Helath Organization, AIDS epidemic update 2009, Retrieved from
http://data.unaids.org/pub/report/2009/jc1700_epi_update_2009_en.pdf
2. Yekkala, R. S.; Ashenafi, D.; Mariën, I.; Xin, H.; Haghedooren, E.; Hoogmartens, J.; Adams,
E., Evaluation of an International Pharmacopoeia method for the analysis of ritonavir by liquid
chromatography. Journal of Pharmaceutical and Biomedical Analysis 2008, 48 (3), 1050-1054.
3. Lavelle, E. C.; Sharif, S.; Thomas, N. W.; Holland, J.; Davis, S. S., The importance of
gastrointestinal uptake of particles in the design of oral delivery systems. Advanced Drug
Delivery Reviews 1995, 18 (1), 5-22.
4. Daugherty, A. L.; Mrsny, R. J., Regulation of the intestinal epithelial paracellular barrier.
Pharmaceutical Science & Technology Today 1999, 2 (7), 281-287.
5. (a) Gref, R.; Minamitake, Y.; Peracchia, M.; Trubetskoy, V.; Torchilin, V.; Langer, R.,
Biodegradable long-circulating polymeric nanospheres. Science 1994, 263 (5153), 1600-1603;
(b) Fu, K.; Harrell, R.; Zinski, K.; Um, C.; Jaklenec, A.; Frazier, J.; Lotan, N.; Burke, P.;
Klibanov, A. M.; Langer, R., A potential approach for decreasing the burst effect of protein from
PLGA microspheres. Journal of Pharmaceutical Sciences 2003, 92 (8), 1582-1591.
6. (a) Yoo, H. S.; Oh, J. E.; Lee, K. H.; Park, T. G., Biodegradable nanoparticles containing
doxorubicin-plga conjugate for sustained release. Pharm Res 1999, 16 (7), 1114-1118; (b)
Langer, R., Drug delivery and targeting. Nature 1998, 392 (6679 Suppl), 5-10.
220
7. Posey-Dowty, J.; Watterson, T.; Wilson, A.; Edgar, K.; Shelton, M.; Lingerfelt, L., Zero-
order release formulations using a novel cellulose ester. Cellulose 2007, 14 (1), 73-83-83.
8. Shelton Michael, C.; Posey-Dowty Jessica, D.; Lingerfelt, L.; Kirk Shane, K.; Klein, S.;
Edgar Kevin, J., Enhanced dissolution of poorly soluble drugs from solid dispersions in
carboxymethylcellulose acetate butyrate matrices. In Polysaccharide Materials: Performance by
Design, American Chemical Society 2009, 1017, 93-113.
9. Sandra, K., Polysaccharides in oral drug delivery? Recent applications and future
perspectives. In Polysaccharide Materials: Performance by Design, American Chemical Society
2009, 1017, 13-30.
10. Dembri, A.; Montisci, M.-J.; Gantier, J.; Chacun, H.; Ponchel, G., Targeting of 3′-Azido 3′-
deoxythymidine (AZT)-loaded poly(isohexylcyanoacrylate) nanospheres to the gastrointestinal
mucosa and associated lymphoid tissues. Pharm Res 2001, 18 (4), 467-473.
11. Löbenberg, R.; Maas, J.; Kreuter, J., Improved body distribution of 14C-labelled AZT bound
to nanoparticles in rats determined by radioluminography. Journal of Drug Targeting 1998, 5
(3), 171-179.
12. Destache, C.; Belgum, T.; Christensen, K.; Shibata, A.; Sharma, A.; Dash, A., Combination
antiretroviral drugs in PLGA nanoparticle for HIV-1. BMC Infectious Diseases 2009, 9 (1), 198.
13. Mainardes, R. M.; Gremião, M. P. D.; Brunetti, I. L.; Da Fonseca, L. M.; Khalil, N. M.,
Zidovudine-loaded PLA and PLA–PEG blend nanoparticles: Influence of polymer type on
phagocytic uptake by polymorphonuclear cells. Journal of Pharmaceutical Sciences 2009, 98
(1), 257-267.
14. Sharma, P.; Garg, S., Pure drug and polymer based nanotechnologies for the improved
solubility, stability, bioavailability and targeting of anti-HIV drugs. Advanced Drug Delivery
Reviews 2010, 62 (4-5), 491-502.
15. Ranjit Mondol, S. P., Somasree Ray, Sabyasachi Maiti, Polymeric Nanocarriers: A promising
research avenue for the delivery of antihiv drugs. International Journal of Applied
Pharmaceutics 2010, 2 (2), 1-5.
16. Hancock, B.; Parks, M., What is the true solubility advantage for amorphous
pharmaceuticals? Pharmaceutical Research 2000, 17 (4), 397-404.
17. (a) Konno, H.; Handa, T.; Alonzo, D. E.; Taylor, L. S., Effect of polymer type on the
dissolution profile of amorphous solid dispersions containing felodipine. European Journal of
221
Pharmaceutics and Biopharmaceutics 2008, 70 (2), 493-499; (b) Leuner, C.; Dressman, J.,
Improving drug solubility for oral delivery using solid dispersions. European Journal of
Pharmaceutics and Biopharmaceutics 2000, 50 (1), 47-60.
18. Chen, Y.; Zhang, G. G. Z.; Neilly, J.; Marsh, K.; Mawhinney, D.; Sanzgiri, Y. D., Enhancing
the bioavailability of ABT-963 using solid dispersion containing Pluronic F-68. International
Journal of Pharmaceutics 2004, 286 (1–2), 69-80.
19. Dinunzio, J. C.; Miller, D. A.; Yang, W.; Mcginity, J. W.; Williams, R. O., Amorphous
compositions using concentration enhancing polymers for improved bioavailability of
itraconazole. Molecular Pharmaceutics 2008, 5 (6), 968-980.
20. Kennedy, M.; Hu, J.; Gao, P.; Li, L.; Ali-Reynolds, A.; Chal, B.; Gupta, V.; Ma, C.;
Mahajan, N.; Akrami, A.; Surapaneni, S., Enhanced bioavailability of a poorly soluble vr1
antagonist using an amorphous solid dispersion approach: A case study. Molecular
Pharmaceutics 2008, 5 (6), 981-993.
21. A.P. Simonelli, S. C. M., W.I. Highuchi, Dissolution rates of high energy sulfathiazole-
provideone coprecipitates ii : characterization of form of drug controlling its dissolution rate via
solubility studies. Jounral of Pharamaceutical Sciences 1976, 65 (3), 355-361.
22. (a) Weuts, I.; Van Dycke, F.; Voorspoels, J.; De Cort, S.; Stokbroekx, S.; Leemans, R.;
Brewster, M. E.; Xu, D.; Segmuller, B.; Turner, Y. T. A.; Roberts, C. J.; Davies, M. C.; Qi, S.;
Craig, D. Q. M.; Reading, M., Physicochemical properties of the amorphous drug, cast films, and
spray dried powders to predict formulation probability of success for solid dispersions:
Etravirine. Journal of Pharmaceutical Sciences 2011, 100 (1), 260-274; (b) Wiranidchapong, C.;
Tucker, I. G.; Rades, T.; Kulvanich, P., Miscibility and interactions between 17β-estradiol and
Eudragit® RS in solid dispersion. Journal of Pharmaceutical Sciences 2008, 97 (11), 4879-4888.
23. Yoo, S.-U.; Krill, S. L.; Wang, Z.; Telang, C., Miscibility/stability considerations in binary
solid dispersion systems composed of functional excipients towards the design of multi-
component amorphous systems. Journal of Pharmaceutical Sciences 2009, 98 (12), 4711-4723.
24. Tobyn, M.; Brown, J.; Dennis, A. B.; Fakes, M.; Gao, Q.; Gamble, J.; Khimyak, Y. Z.;
Mcgeorge, G.; Patel, C.; Sinclair, W.; Timmins, P.; Yin, S., Amorphous drug–PVP dispersions:
Application of theoretical, thermal and spectroscopic analytical techniques to the study of a
molecule with intermolecular bonds in both the crystalline and pure amorphous state. Journal of
Pharmaceutical Sciences 2009, 98 (9), 3456-3468.
222
25. Zhu, Q.; Taylor, L. S.; Harris, M. T., Evaluation of the microstructure of semicrystalline
solid dispersions. Molecular Pharmaceutics 2010, 7 (4), 1291-1300.
26. Rumondor, A. F.; Ivanisevic, I.; Bates, S.; Alonzo, D.; Taylor, L., Evaluation of drug-
polymer miscibility in amorphous solid dispersion systems. Pharmaceutical Research 2009, 26
(11), 2523-2534.
27. Al-Obaidi, H.; Lawrence, M. J.; Al-Saden, N.; Ke, P., Investigation of griseofulvin and
hydroxypropylmethyl cellulose acetate succinate miscibility in ball milled solid dispersions.
International Journal of Pharmaceutics 2013, 443 (1–2), 95-102.
28. Johnson, B. K.; Prud; #39; Homme, R. K., Flash nanoprecipitation of organic actives and
block copolymers using a confined impinging jets mixer. Australian Journal of Chemistry 2003,
56 (10), 1021-1024.
29. Johnson, B. K.; Prud'homme, R. K., Chemical processing and micromixing in confined
impinging jets. AIChE Journal 2003, 49 (9), 2264-2282.
30. Johnson, B. K.; Prud’homme, R. K., Mechanism for rapid self-assembly of block copolymer
nanoparticles. Physical Review Letters 2003, 91 (11), 118302.
31. Ungun, B.; Prud'homme, R. K.; Budijon, S. J.; Shan, J.; Lim, S. F.; Ju, Y.; Austin, R.,
Nanofabricated upconversion nanoparticles for photodynamic therapy. Opt. Express 2009, 17
(1), 80-86.
32. Kumar, V.; Hong, S. Y.; Maciag, A. E.; Saavedra, J. E.; Adamson, D. H.; Prud’homme, R.
K.; Keefer, L. K.; Chakrapani, H., Stabilization of the Nitric Oxide (NO) prodrugs and
anticancer leads, PABA/NO and double JS-K, through incorporation into PEG-protected
nanoparticles. Molecular Pharmaceutics 2009, 7 (1), 291-298.
33. Chen, T.; D’addio, S. M.; Kennedy, M. T.; Swietlow, A.; Kevrekidis, I. G.; Panagiotopoulos,
A. Z.; Prud’homme, R. K., Protected peptide nanoparticles: Experiments and brownian dynamics
simulations of the energetics of assembly. Nano Letters 2009, 9 (6), 2218-2222.
34. Ansell, S. M.; Johnstone, S. A.; Tardi, P. G.; Lo, L.; Xie, S.; Shu, Y.; Harasym, T. O.;
Harasym, N. L.; Williams, L.; Bermudes, D.; Liboiron, B. D.; Saad, W.; Prud’homme, R. K.;
Mayer, L. D., Modulating the therapeutic activity of nanoparticle delivered paclitaxel by
manipulating the hydrophobicity of prodrug conjugates. Journal of Medicinal Chemistry 2008,
51 (11), 3288-3296.
223
35. D'addio, S. M.; Prud'homme, R. K., Controlling drug nanoparticle formation by rapid
precipitation. Advanced Drug Delivery Reviews 2011, 63 (6), 417-426.
36. (a) Liu, Y.; Cheng, C.; Prud'homme, R. K.; Fox, R. O., Mixing in a multi-inlet vortex mixer
(MIVM) for flash nano-precipitation. Chemical Engineering Science 2008, 63 (11), 2829-2842;
(b) http://www.avert.org/worldstats.htm.
37. Gindy, M., Composite block copolymer stabilized nanoparticles: Simultaneous encapsulation
of organic actives and inorganic nanostructures. Langumir 2008, 24, 83-90.
38. Kar, N.; Liu, H.; Edgar, K. J., Synthesis of cellulose adipate derivatives. Biomacromolecules
2011, 12 (4), 1106-1115.
39. Ilevbare, G. A.; Liu, H.; Edgar, K. J.; Taylor, L. S., Understanding polymer properties
important for crystal growth inhibition—impact of chemically diverse polymers on solution
crystal growth of ritonavir. Crystal Growth & Design 2012, 12 (6), 3133-3143.
40. Pereira, J. M., Mahoney M., Edgar, K. J., Synthesis of amphiphilic 6-carboxypullulan ethers.
Carbohydrate Polymers 2013, http://dx.doi.org/10.1016/j.carbpol.2012.12.029
41. Hesse, L. M.; Von Moltke, L. L.; Shader, R. I.; Greenblatt, D. J., Ritonavir, efavirenz, and
nelfinavir inhibit CYP2B6 activity in vitro: Potential drug interactions with bupropion. Drug
Metabolism and Disposition 2001, 29 (2), 100-102.
42. Ariza, R. M. Design, Synthesis, and characterization of magnetite clusters using a multi inlet
vortex mixer. Virginia Polytechnic Institute and State University, Blacksburg, Virginia, 2010.
43. Andronis, V.; Zografi, G., The Molecular mobility of supercooled amorphous indomethacin
as a function of temperature and relative humidity. Pharmaceutical Research 1998, 15 (6), 835-
842.
44. Huang, J.; Wigent, R. J.; Schwartz, J. B., Drug–polymer interaction and its significance on
the physical stability of nifedipine amorphous dispersion in microparticles of an ammonio
methacrylate copolymer and ethylcellulose binary blend. Journal of Pharmaceutical Sciences
2008, 97 (1), 251-262.
45. Rumondor, A. C. F.; Marsac, P. J.; Stanford, L. A.; Taylor, L. S., Phase behavior of
poly(vinylpyrrolidone) containing amorphous solid dispersions in the presence of moisture.
Molecular Pharmaceutics 2009, 6 (5), 1492-1505.
46. Hancock, B. C.; Zografi, G., Characteristics and significance of the amorphous state in
pharmaceutical systems. Journal of Pharmaceutical Sciences 1997, 86 (1), 1-12.
224
47. Hancock, B.; Shamblin, S.; Zografi, G., Molecular mobility of amorphous pharmaceutical
solids below their glass transition temperatures. Pharmaceutical Research 1995, 12 (6), 799-806.
48. Yoshioka, M.; Hancock, B. C.; Zografi, G., Inhibition of indomethacin crystallization in
poly(vinylpyrrolidone) coprecipitates. Journal of Pharmaceutical Sciences 1995, 84 (8), 983-
986.
49. Fedors, R. F., A method for estimating both the solubility parameters and molar volumes of
liquids. Polymer Engineering & Science 1974, 14 (2), 147-154.
50. Alonzo, D. E.; Gao, Y.; Zhou, D.; Mo, H.; Zhang, G. G. Z.; Taylor, L. S., Dissolution and
precipitation behavior of amorphous solid dispersions. Journal of Pharmaceutical Sciences 2011,
100 (8), 3316-3331.
51. Liu, H.; Ilevbare, G. A.; Cherniawski, B. P.; Ritchie, E. T.; Taylor, L. S.; Edgar, K. J.,
Synthesis and structure-property evaluation of cellulose ω-carboxyesters for amorphous solid
dispersions. Carbohydrate Polymers 2012, http://dx.doi.org/10.1016/j.carbpol.2012.11.049
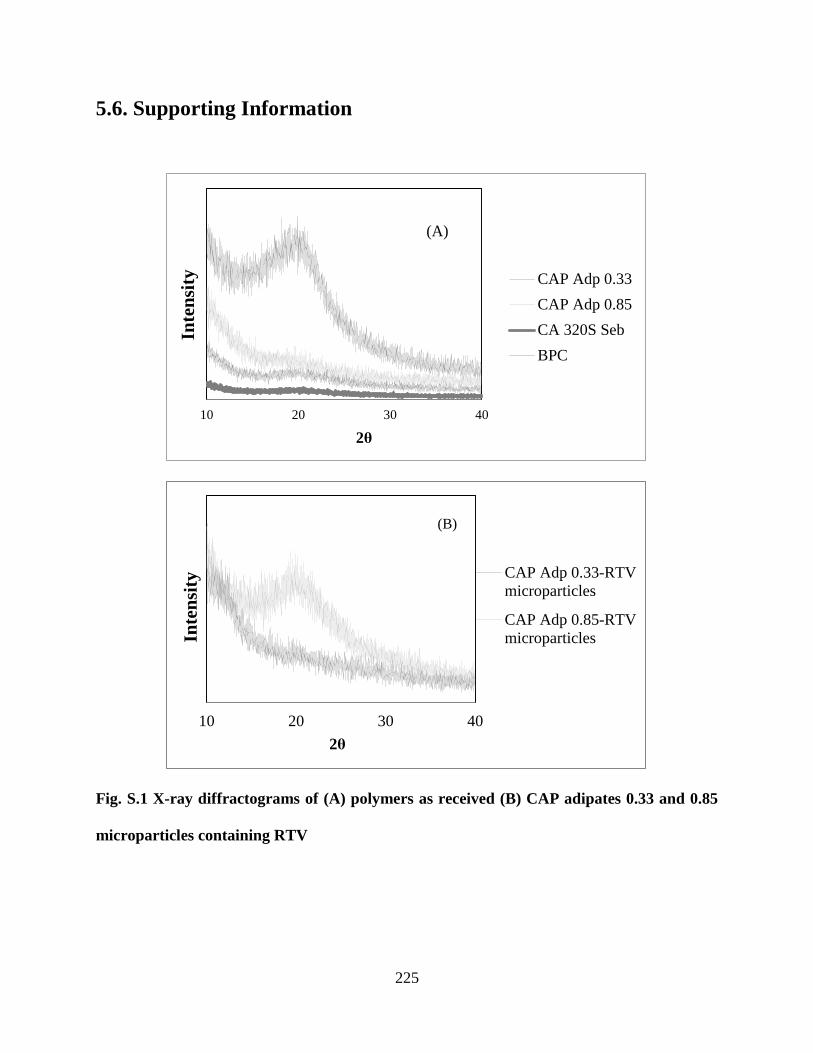
225
5.6. Supporting Information
Fig. S.1 X-ray diffractograms of (A) polymers as received (B) CAP adipates 0.33 and 0.85
microparticles containing RTV
10 20 30 40
Inte
nsi
ty
2θ
CAP Adp 0.33
CAP Adp 0.85
CA 320S Seb
BPC
10 20 30 40
Inte
nsi
ty
2θ
CAP Adp 0.33-RTV
microparticles
CAP Adp 0.85-RTV
microparticles
(B)
(A)
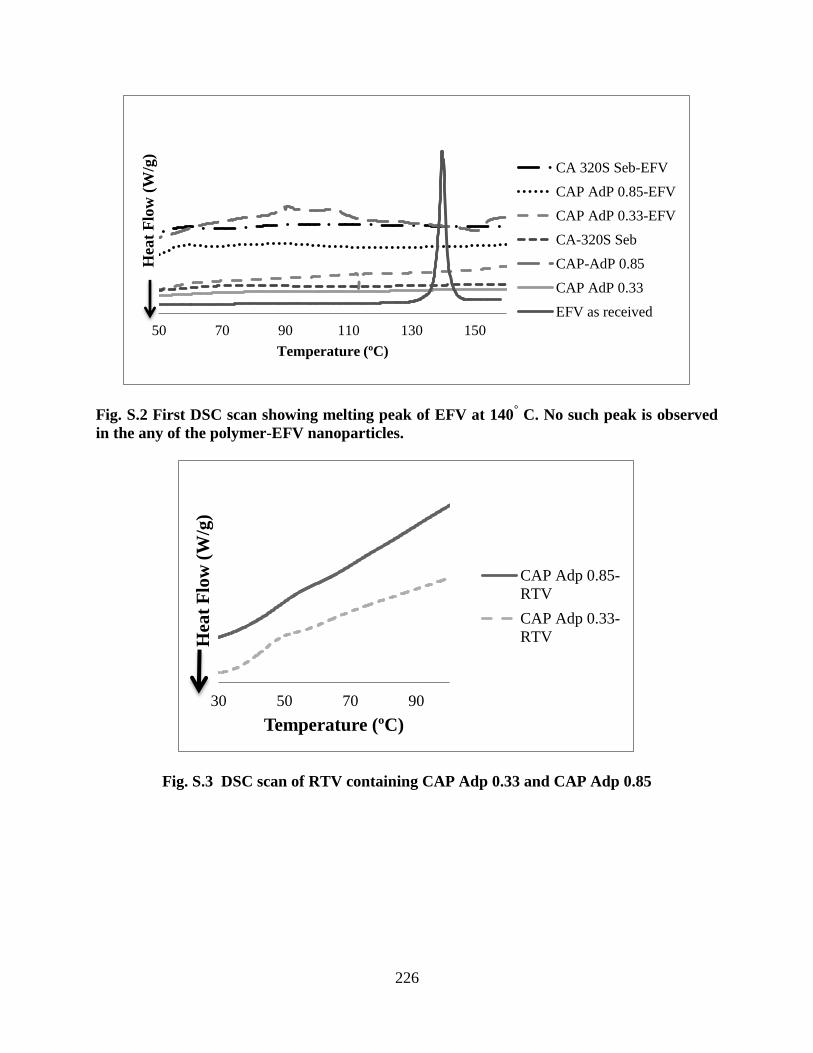
226
Fig. S.2 First DSC scan showing melting peak of EFV at 140° C. No such peak is observed
in the any of the polymer-EFV nanoparticles.
Fig. S.3 DSC scan of RTV containing CAP Adp 0.33 and CAP Adp 0.85
50 70 90 110 130 150
Hea
t F
low
(W
/g)
Temperature (ºC)
CA 320S Seb-EFV
CAP AdP 0.85-EFV
CAP AdP 0.33-EFV
CA-320S Seb
CAP-AdP 0.85
CAP AdP 0.33
EFV as received
30 50 70 90
Hea
t F
low
(W
/g)
Temperature (ºC)
CAP Adp 0.85-
RTV
CAP Adp 0.33-
RTV
227
Chapter 6. Conclusions and Future Work
The work in this thesis focused on the synthesis and characterization of amorphous solid
dispersions of drug-containing polymer nanoparticle complexes. The knowledge gained from
this work is intended to aid in the design of well-defined nanoparticles that could be applied in
oral drug delivery. These amorphous solid dispersion nanoparticles have been shown to have the
potential to enhance drug bioavailability and stability. The first half of this chapter presents
these conclusions in sequence. The second half of this chapter outlines work that at this time is
not complete, but shows considerable promise for future work.
6.1 Conclusions
Amorphous solid dispersion formulations containing amorphous drugs physically
dispersed within an inert polymer matrix have shown significant solution concentration
advantages and, ultimately, enhanced oral bioavailability. Enhancement of the rate of dissolution
of solid drug product will be necessary to maximize the release of drug. Also it will be important
to protect some drugs from stomach acid degradation so that most of it is released in the small
intestine for further absorption. Rapid nanoparticle production is critical ultimately for practical
applications. With that in mind, the main goals of this work have been to develop methods to aid
in the design of well-defined (particle size and drug composition) polysaccharide-nanoparticle
systems that will protect the drug at lower pH values and increase the release and solution
concentration at higher pH. This research has involved the development of processing methods
to prepare, separate, purify, and dry nanoparticles as well as the ability to redisperse for further
characterization.
In Chapter 3, a methodology to produce amorphous solid dispersions (ASDs) of an
antibacterial drug rifampicin and the high Tg polysaccharide CMCAB was presented. The
228
nanoparticle suspensions were prepared with the multi-inlet vortex mixer. Two different particle
purification and recovery methods were investigated – flocculation with acids and dialysis
followed by freeze drying. Intensity-average hydrodynamic diameters ranged from 100-400 nm.
Flocculation followed by vacuum filtration proved to be a useful particle isolation technique.
Both citric acid and dilute hydrochloric acid gave comparable results, inducing flocculation in
almost the same times. There was a significant difference in the flocculation time of samples
subjected first to rotary evaporation to remove THF (30 seconds) compared to samples not
subjected to rotary evaporation (30-45 minutes). The flocculation/vacuum filtration process is
significantly faster than the dialysis/freeze drying process in purifying rifampicin-CMCAB
nanoparticles.
The particles processed by acid flocculation were not easily dispersible so probe
sonication was used to redisperse the particles in DI water. However, particles processed by
dialysis/freeze drying were much easily redispersed. Particles processed by the
flocculation/vacuum filtration process also had higher rifampicin loadings than did particles
processed by dialysis/freeze drying. It was shown that rifampicin-containing nanoparticles at 500
μg/ml were non-toxic to murine macrophage cell line J774A.1 in vitro. The biologic activity of
rifampicin was well preserved after CMCAB nanoparticle formation. The nanoparticles
processed by dialysis and freeze drying were compared to microparticles (particle size 2-10 µm)
of rifampicin-CMCAB prepared by spray drying. The rifampicin in both the nanoparticles and
microparticles was amorphous. The release studies of the drug showed that the % release from
nanoparticles was higher than that from microparticles at pH 6.8. However, at pH 1.2, rifampicin
release from the nanoparticles was essentially the same as that from the free drug and was
subject to acid degradation. By comparison, the microparticles showed no drug release at pH 1.2,
229
indicating that these particles could protect the rifampicin under stomach acid conditions.
Therefore, nanoparticles of CMCAB without any further steps to protect the nanoparticles are
not suitable for oral delivery of rifampicin. It is important to complex the rifampicin or the
polymer with another compound which can slow down the drug release in stomach and yet give
significant release in the small intestine. A very important example, as mentioned earlier, is in
the work where rifampicin has been incorporated into poly(ε-caprolactone) nanoparticles in the
size range 100-200 nm using flash nanoprecipitation. Due to rifampicin’s solubility in water, it
was necessary to first make an insoluble pro-drug form by conjugating it with Vitamin E
succinate and with poly(ε-caprolactone) which is biodegradable. The resulting pro-drugs were
then co-precipitated with diblock copolymers of poly(ethylene oxide-b-ε-caprolactone) at
loadings of 14.5 wt % of rifampicin. Hydrolytic cleavage of the linking group provided a
mechanism for the sustained release of rifampicin1.
In Chapter 4, two poorly soluble antiviral drugs ritonavir (RTV) and efavirenz (EFV)
were used to prepare CMCAB ASD nanoparticles. The multi-inlet vortex mixer was used to
form the particles by a rapid precipitation step. Here the target drug loading was varied between
25-50 wt % and the particle size, final drug loading and dissolution studies of the nanoparticles
were evaluated. Final drug loadings were in the range 18-43 wt% with well-defined sizes (200-
300 nm). Drug loading efficiencies in the final particles ranged from 72 % – 86 %. CMCAB was
effective in entrapping the drug in its amorphous state in the particle and this increased drug
solution concentration in pH 6.8 buffer. There was no detectable crystallinity or phase separation
observed for any of the drug-containing particles. The nanoparticles were compared to
microparticles produced by a co-precipitation method. The final loading was 72-86 % in the
nanoparticles, and 100% in the microparticles as there was no drug loss due to processing steps.
230
Solution concentration and drug release from the nanoparticles and microparticles significantly
enhanced compared to those of crystalline drug. Drug release decreased with increasing amount
of drug in the particles.
Amorphous nanoparticle release characteristics were compared with those of amorphous
microparticles of the same polymer and drug. The percentage release of drugs from nanoparticles
was higher than that from microparticles. The particle size of the nanosized RTV and EFV
resulted in greatly increasing the specific surface area compared to the micron-sized particles,
which enhanced the dissolution rate of RTV and EFV. There was only a slight difference of
solution concentration enhancement between microparticles and nanoparticles.
In Chapter 5, we demonstrated the method to produce cellulose ω-carboxyalkanoates
and BPC nanoparticles with RTV and EFV, with well-defined sizes (100-200 nm). The Multi-
Inlet Vortex Mixer was used to control particle size and nucleation rate. The particles were
processed by dialysis followed by freeze drying. A cryoprotectant trehalose was used for
inhibiting particle aggregation during freeze drying. The drug loading efficiency in the final
particles was 88-96 % except BPC where the drug loading efficiency was 62%. The
nanoparticles made with cellulose derivatives used in this work did not show an intermediate Tg,
but rather showed a low Tg very near to the Tg of the drug itself. However, there was no phase
separation or appearance of crystalline peak when measured by DSC and XRD. This increased
the solution concentrations of the drugs in a pH 6.8 buffer. There was an increase in percentage
drug release from the nanoparticles compared to the pure crystalline drug. Polysaccharide
nanoparticles showed potential for enhancing the solution concentration and sustained release of
poorly soluble drugs (RTV and EFV). Previous studies showed dissolution behavior was
dependent on both the properties of the polymer (solubility parameter, degree of substitution,
231
hydrophobicity) as well the drug (solubility parameter, solubility, presence of hydrophobic
groups)2. The polymers with solubility parameters between 20-23 MPa
1/2 could inhibit crystal
growth in solution, anything less than 20 MPa1/2
were mostly ineffective. However, 6-butyl
pullulan carboxylate with a higher solubility parameter (as high as 28 MPa1/2
) showed very high
concentration and release compared to the crystalline drugs but did not show well defined drug
compositions and particle sizes. In future work on the preparation or selection of polysaccharides
for use in nanoparticulate drug polymer amorphous solid dispersions, one should take into
account the polymer’s hydrophobicity which is likely to affect the extent of adsorption of
polymer to the crystal surface of the drug. If the polymer is very hydrophobic, it would be
expected to interact more favorably with other monomer units to form a more condensed globule
which either may not adsorb on the crystal or if it adsorbs may not have high surface coverage. If
the polymer is very hydrophilic, it can interact more with the water and comparatively less with
the drug. Therefore an optimal hydrophobicity could exist for inhibiting crystallization. A higher
degree of carboxylic acid substitution (DS) shows more effective inhibition of crystallization.
There can be differences in the particle shape, size, polydispersity and morphology depending on
the preparation method so care must be taken to use the synthesis method and purification
(separation, drying) techniques to obtain well defined particles. The use of excipients such as
cryoprotectants (or excipients) to control particle size would be an additional and useful step.
6.2 Future Work
6.2.1 Calculation of Reynolds number, supersaturation and mixing time specific to
polymer-drug in solvent
The Reynolds number for CMCAB-drug systems (or any polymer-drug system) made in
the multi inlet vortex mixer (MIVM) must be calculated more precisely than was done in this
232
work. Secondly, the effect of Reynolds number on the diameter of the particles formed in the
MIVM should be studied such as in the Reynolds number range 50-10,000. The Reynolds
number at which the particle diameter is constant is where the mixing time is equal to the
nucleation time. At a higher Reynolds number, the particle size will be constant and only vary
with supersaturation. So, calculation of supersaturation and mixing time is also essential 3,4
.
6.2.2 Analyzing content of Tetrahydrofuran (THF) in the final particles-alternative
solvents
It is important to remove THF from the nanoparticle suspensions obtained from MIVM.
It is not desirable to have THF in the final nanoparticles made for oral delivery. Though dialysis
and rotary evaporation are effective ways of removing THF, the residual amount can be
quantified by analytical techniques like gas chromatograph (GC). Alternative solvents like
acetone, ethanol, and methanol can be explored.
6.2.3 Using high speed ultracentrifuge to separate nanoparticles during dissolution
studies
The presence of polymer-drug nano-assemblies complicates analysis since small
aggregates do not easily separate from free drug by traditional centrifuge or filtration based
separation techniques. Some initial work was done to understand the best way to separate free
drug from nanoparticles. CMCAB-RTV nanoparticles were dispersed in potassium phosphate
buffer at pH 6.8 and 1 ml of the suspension was collected after 1.5 hours. The suspension was
either filtered, centrifuged at different speeds, or ultra-centrifuged to investigate the best method
to isolate free drug in the supernatant5. Simple filtration of the nanosuspension by 20 nm Anotop
filter was not possible due to clogging of the filter. The nanosuspension was centrifuged at
different g-forces (16,060 and 22,789) and ultracentrifuged at very high g-force (144,794). One
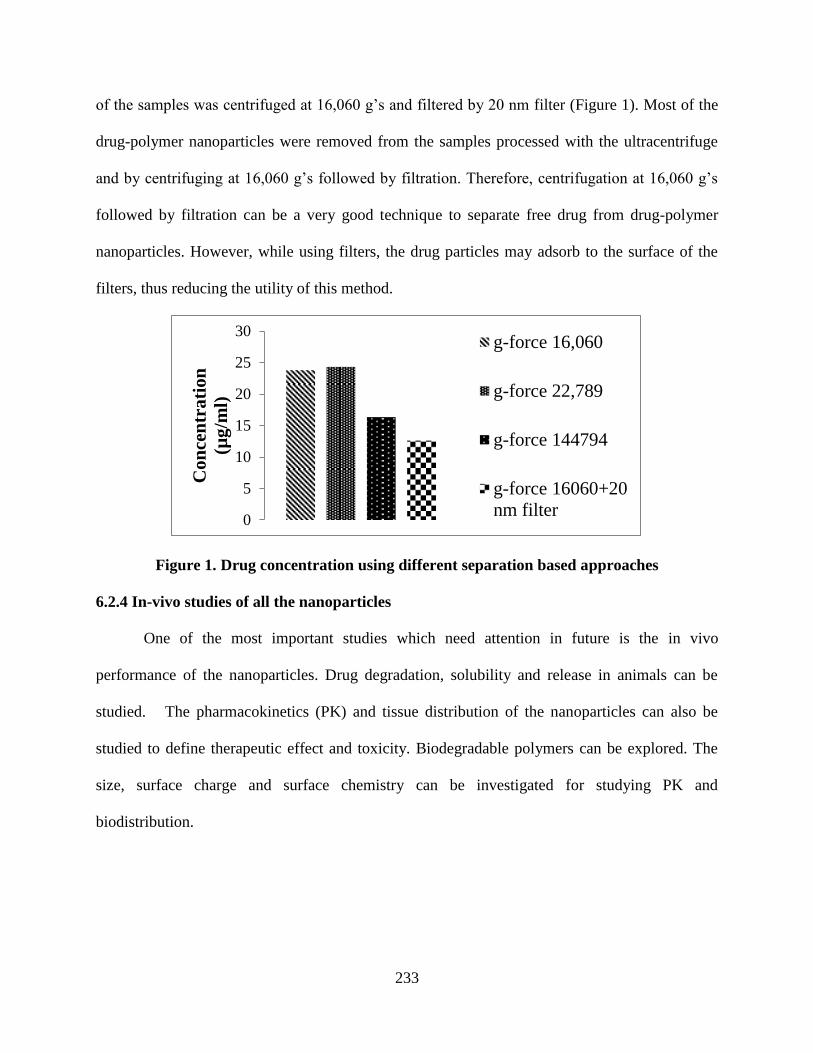
233
of the samples was centrifuged at 16,060 g’s and filtered by 20 nm filter (Figure 1). Most of the
drug-polymer nanoparticles were removed from the samples processed with the ultracentrifuge
and by centrifuging at 16,060 g’s followed by filtration. Therefore, centrifugation at 16,060 g’s
followed by filtration can be a very good technique to separate free drug from drug-polymer
nanoparticles. However, while using filters, the drug particles may adsorb to the surface of the
filters, thus reducing the utility of this method.
Figure 1. Drug concentration using different separation based approaches
6.2.4 In-vivo studies of all the nanoparticles
One of the most important studies which need attention in future is the in vivo
performance of the nanoparticles. Drug degradation, solubility and release in animals can be
studied. The pharmacokinetics (PK) and tissue distribution of the nanoparticles can also be
studied to define therapeutic effect and toxicity. Biodegradable polymers can be explored. The
size, surface charge and surface chemistry can be investigated for studying PK and
biodistribution.
0
5
10
15
20
25
30
Co
nce
ntr
ati
on
(µg
/ml)
g-force 16,060
g-force 22,789
g-force 144794
g-force 16060+20
nm filter
234
6.2.5 Synthesis of polysaccharides suitable for production of nanoparticles by rapid
precipitation method
More polysaccharides, especially biodegradable polysaccharides, which are suitable for
rapid precipitation should be explored. We studied several polysaccharides such
hydroxypropylmethyl cellulose acetate succinate (HPMCAS), cellulose acetate suberate (CA-
320S Sub), cellulose acetate propionate sebacate (CAP-Seb) and sodium alginate which did not
form well-defined particles when prepared in the MIVM but are very important for oral drug
delivery applications. Additional studies are needed with these and other polysaccharides to
define mixer conditions that would lead to well-defined particle sizes and drug compositions.
This could involve the use of solvents other than THF for making particles which are suitable for
the mixer. In addition, mixtures of polymers should be studied to learn if it is possible to
optimize the hydrophobic-hydrophilic ratio and form well-defined particles.
6.2.6 Combination of two or more drugs in the same polymer matrix (or blends of
polymers)
This thesis studied one drug at a time in various polymer matrixes. Most of the
formulations used to treat diseases like tuberculosis and HIV require combination of two or more
drugs. Therefore, efforts should be made to form nanoparticles of two or more drugs to learn
whether the drugs form amorphous solid dispersions. Measurements of the size, drug
compositions, morphology, and drug release should be done. The work will be challenging, yet
rewarding.
235
6.3 References
1. (a) D’addio, S. M. Tuberculosis therapeutics: engineering of nanomedicinal systems for local
delivery of targeted drug cocktails. princeton university, 2012; (b) Ying, L. Formulating
nanoparticles by flash nanoprecipitation for drug delivery and sustained release. Princeton
University, 2007.
2. Ilevbare, G. A.; Liu, H.; Edgar, K. J.; Taylor, L. S., Understanding polymer properties
important for crystal growth inhibition—impact of chemically diverse polymers on solution
crystal growth of ritonavir. Crystal Growth & Design 2012, 12 (6), 3133-3143.
3. Kumar, V.; Prud'homme, R. K., Thermodynamic limits on drug loading in nanoparticle
cores. Journal of Pharmaceutical Sciences 2008, 97 (11), 4904-4914.
4. Johnson, B. K.; Prud'homme, R. K., Chemical processing and micromixing in confined
impinging jets. AIChE Journal 2003, 49 (9), 2264-2282.
5. Van Eerdenbrugh, B.; Vermant, J.; Martens, J. A.; Froyen, L.; Humbeeck, J. V.; Van Den
Mooter, G.; Augustijns, P., Solubility increases associated with crystalline drug nanoparticles:
methodologies and significance. Molecular Pharmaceutics 2010, 7 (5), 1858-1870.