Embed Size (px)
Citation preview
Human MutationINFORMATICS
Syndrome to Gene (S2G): In-Silico Identificationof Candidate Genes for Human Diseases
Avitan Gefen,1y Raphael Cohen,1y and Ohad S. Birk1,2�
1The Morris Kahn Laboratory of Human Genetics, National Institute for Biotechnology in the Negev, Ben Gurion University, Beer-Sheva, Israel;2The Genetics Institute, Soroka Medical Center, Ben Gurion University, Beer-Sheva, Israel
Communicated by Anthony J. BrookesReceived 20 August 2009; accepted revised manuscript 13 November 2009.
Published online 5 January 2010 in Wiley InterScience (www.interscience.wiley.com). DOI 10.1002/humu.21171
ABSTRACT: The identification of genomic loci associatedwith human genetic syndromes has been significantlyfacilitated through the generation of high density SNParrays. However, optimal selection of candidate genes fromwithin such loci is still a tedious labor-intensive bottle-neck. Syndrome to Gene (S2G) is based on novelalgorithms which allow an efficient search for candidategenes in a genomic locus, using known genes whosedefects cause phenotypically similar syndromes. S2G(http://fohs.bgu.ac.il/s2g/index.html) includes two compo-nents: a phenotype Online Mendelian Inheritance in Man(OMIM)-based search engine that alleviates many of theproblems in the existing OMIM search engine (negationphrases, overlapping terms, etc.). The second componentis a gene prioritizing engine that uses a novel algorithm tointegrate information from 18 databases. When thedetailed phenotype of a syndrome is inserted to the web-based software, S2G offers a complete improved search ofthe OMIM database for similar syndromes. The softwarethen prioritizes a list of genes from within a genomic locus,based on their association with genes whose defects areknown to underlie similar clinical syndromes. Wedemonstrate that in all 30 cases of novel disease genesidentified in the past year, the disease gene was within thetop 20% of candidate genes predicted by S2G, and in mostcases—within the top 10%. Thus, S2G provides clinicianswith an efficient tool for diagnosis and researchers with acandidate gene prediction tool based on phenotypic dataand a wide range of gene data resources. S2G can alsoserve in studies of polygenic diseases, and in findinginteracting molecules for any gene of choice.Hum Mutat 31:229–236, 2010. & 2010 Wiley-Liss, Inc.
KEY WORDS: mendelian disease; candidate gene predic-tion; bioinformatics; OMIM; data integration
Introduction
Monogenic human syndromes are characterized by uniquecombinations of phenotypic determinants. While each syndrome
is caused by a mutation in a single gene, many syndromes that arecaused by mutations in different genes share various componentsof their phenotypes. For instance, more than 300 differentsyndromes have polydactyly as a prominent feature of the diseasephenotype. Moreover, there are many examples of practicallyidentical syndromes caused by mutations in different genes(genotypic heterogeneity). An example is Bardet Biedl syndrome(BBS) that can be caused by homozygous mutations in any one of14 known genes. It has been suggested and proven in recent yearsthat syndromes that are similar in their clinical phenotype arelikely to be caused by mutations in genes whose protein productsare related to one another [Oti et al., 2008]. The nature of the‘‘relation’’ between two genes whose defects cause the same (orsimilar) syndrome(s) might be of different kinds: the proteins
encoded by the genes might be in the same biochemical pathwayor in interacting biochemical or developmental pathways; theremight be protein-protein interactions between the two proteins—or between either of the two proteins and a third one; they mightbe related through a transcriptional molecular cascade; they mightcreate aggregates or act jointly to cause epigenetic changes leadingto hereditary changes in DNA regulation. They are also likely toshare expression patterns in specific tissues or cell types. Forinstance, many of the known 14 BBS genes encode proteins thatfunction in cilia, and molecular interactions have been demon-strated between some of these proteins.
Thus, when seeking a gene whose defect causes a novelmonogenic syndrome, one should give priority to genes encodingproteins known to be ‘‘related’’ to proteins whose defects underliephenotypically similar syndromes. There is a need for tools thatdirectly explore the phenotypic relationship between syndromesand their underlying genes and mechanisms, and that easily apply
the information for gene prioritization. To this end, one needs todeal with two facets of such a task: first, one should be able toidentify and prioritize a list of syndromes that are most similarphenotypically to a syndrome of choice and secondly, one shouldbe able to prioritize a list of genes in terms of their ‘‘relatedness’’ toa gene of choice. To achieve the first task, one can use any of theexisting clinical phenotype search engines. Of these databases,Online Mendelian Inheritance in Man (OMIM) (www.ncbi.nlm.nih.gov/omim) is one of the most commonly used by clinicians. Itis comprehensive, freely available online, and is regularly updatedthrough an National Institutes of Health (NIH) funded program.Each OMIM syndrome page includes a Clinical Synopsis sectioncontaining a list of known phenotypes comprising a clinicalsyndrome. However, the existing OMIM search engine has manyfaults: the textual phenotypic data in OMIM is in free text andmany different phrases are often used to describe the same
OFFICIAL JOURNAL
www.hgvs.org
& 2010 WILEY-LISS, INC.
Additional Supporting Information may be found in the online version of this article.
�Correspondence to: Ohad S. Birk, Genetics Institute, Soroka Medical Center,
Beer-Sheva, Israel. E-mail: [email protected]
yAvitan Gefen and Raphael Cohen contributed equally to this work.
phenotype, the difference originating in different spelling varia-tions or typing errors, varying sentence structures, use of a verbalphenotype description as well as usage of alternative medicalterms. This is further complicated by the existence of negationphrases. These variations often hinder searching for syndromes orusing the large amount of phenotypic information for researchpurposes.
When attempting to determine ‘‘relatedness’’ between differentgenes, several problems are encountered: one being that theamount of biological data concerning genes and the mechanismsby which they function grows exponentially. The amount of datarequires generation of new and better tools for exploring theinformation. Another problem is that there are a large number ofdifferent databases, all containing different facets of informationthat might be relevant to our queries. Such databases includepathways data (such as KEGG, Biocarta, Reactome), ontologydatabases, biochemical data bases and others. Attempts should bemade to maximize the use of existing information, and optimizetheir integration into a single measure of ‘‘relatedness’’ enablingprioritization.
Several bioinformatics tools have been developed to prioritizegenes (in a locus) by their relevance to a specific syndrome, diseasekeywords or even a set of genes [Adie et al., 2005, 2006; Aertset al., 2006; Bortoluzzi et al., 2005; Franke et al., 2006;Freudenberg and Propping, 2002; Kohler et al., 2008; Lage et al.,2007; Lupez-Bigas and Ouzouniz, 2004; Masseroli et al., 2005; Otiet al., 2006, 2008; Perez-Iratxeta et al., 2005; Rossi et al., 2006;Tiffin et al., 2005; Turner et al., 2003]. Only recently have suchtools included emphasis on phenotype related information orcomprehensive integration of data sources. However, these toolsare still far from being optimal for disease gene discovery: littleeffort has been made in optimizing phenotypic data analysis, andonly few of the gene-related databases are used in each searchengine.
In the present study, we designed a novel algorithm-basedsoftware (S2G) that, for a novel syndrome of choice, identifies thephenotypically most similar syndrome(s) for which the diseasegene is known. It then prioritizes the list of genes from thegenomic locus of the novel syndrome, based on their ‘‘relatedness’’to the causative gene in the phenotypically similar syndrome. S2Gis unique in combining a novel thorough clinical phenotype-basedsearch engine with an algorithm integrating molecular informa-tion from a large array of gene information databases. We
demonstrate that S2G is effective as an improved OMIM-basedsearch engine used in clinical diagnosis of known syndromes.Moreover, it is very effective as a research tool, greatly enhancingexisting capabilities in prioritizing and identifying novel diseasegenes for genetic syndromes.
Materials and Methods
OMIM Phenotype Search Engine
The OMIM phenotype search engine was generated as detailedin the Results section. In essence, The Clinical Synopsis data wereextracted from the OMIM database, phrases were corrected andparsed and the information was sorted into ‘‘areas’’. Then naturallanguage processing was done, synonyms were identified andunited, and negation phrases were identified and curated.
Based on the curated OMIM Clinical Synopsis databasegenerated, we went on to set up a computerized algorithm thatfinds phenotype based association between syndromes. Thesimilarity computation among syndromes is performed usingthe cosine distance over vectors of phenotype clusters. In thepresentation of the data, known associations between syndromesand genes are given based on the information in OMIMMorbidmap. The curated OMIM database is updated every 3months.
Gene-Relatedness Search Engine
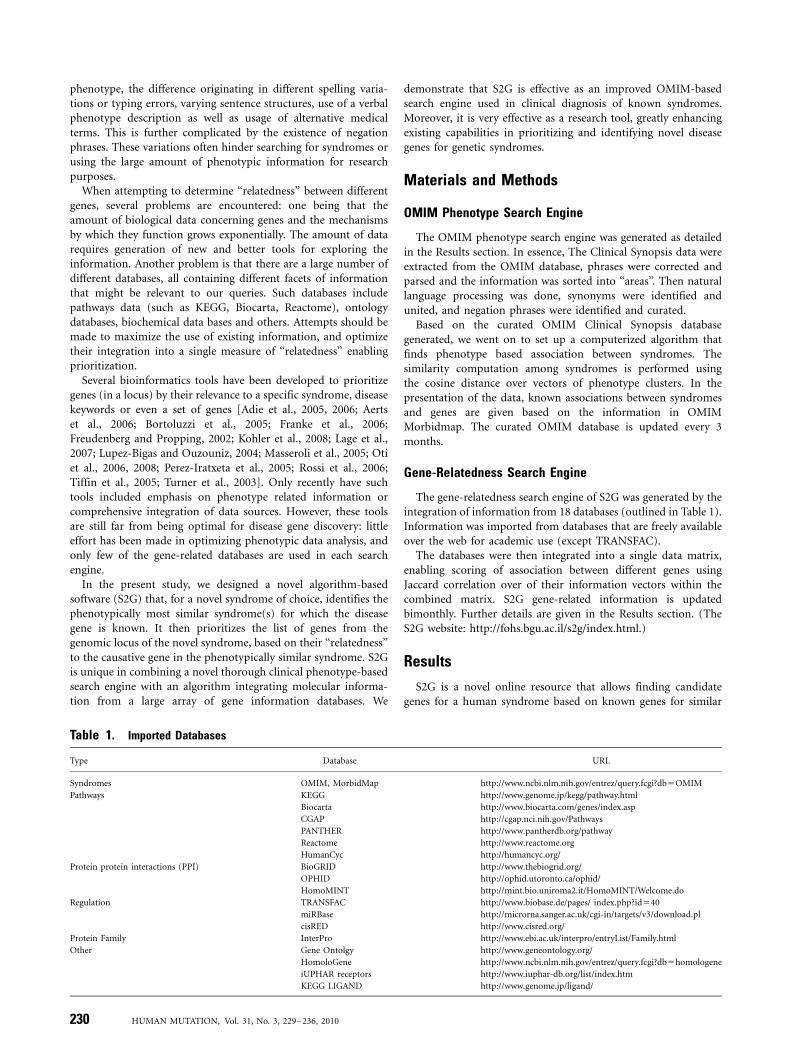
The gene-relatedness search engine of S2G was generated by theintegration of information from 18 databases (outlined in Table 1).Information was imported from databases that are freely availableover the web for academic use (except TRANSFAC).
The databases were then integrated into a single data matrix,enabling scoring of association between different genes usingJaccard correlation over of their information vectors within thecombined matrix. S2G gene-related information is updatedbimonthly. Further details are given in the Results section. (TheS2G website: http://fohs.bgu.ac.il/s2g/index.html.)
Results
S2G is a novel online resource that allows finding candidategenes for a human syndrome based on known genes for similar
Table 1. Imported Databases
Type Database URL
Syndromes OMIM, MorbidMap http://www.ncbi.nlm.nih.gov/entrez/query.fcgi?db5OMIM
Pathways KEGG http://www.genome.jp/kegg/pathway.html
Biocarta http://www.biocarta.com/genes/index.asp
CGAP http://cgap.nci.nih.gov/Pathways
PANTHER http://www.pantherdb.org/pathway
Reactome http://www.reactome.org
HumanCyc http://humancyc.org/
Protein protein interactions (PPI) BioGRID http://www.thebiogrid.org/
OPHID http://ophid.utoronto.ca/ophid/
HomoMINT http://mint.bio.uniroma2.it/HomoMINT/Welcome.do
Regulation TRANSFAC http://www.biobase.de/pages/ index.php?id540
miRBase http://microrna.sanger.ac.uk/cgi-in/targets/v3/download.pl
cisRED http://www.cisred.org/
Protein Family InterPro http://www.ebi.ac.uk/interpro/entryList/Family.html
Other Gene Ontolgy http://www.geneontology.org/
HomoloGene http://www.ncbi.nlm.nih.gov/entrez/query.fcgi?db5homologene
iUPHAR receptors http://www.iuphar-db.org/list/index.htm
KEGG LIGAND http://www.genome.jp/ligand/
230 HUMAN MUTATION, Vol. 31, No. 3, 229–236, 2010
syndromes. These known genes may be genes already discoveredto be associated with the same disorder (genotypic heterogeneity)or genes whose defects cause phenotypically similar disorders. S2Gintegrates two components: a novel OMIM-based search engine todetermine phenotypic similarity between syndromes, and a gene-based search engine that uses a novel algorithm integratinginformation from 18 databases, determining ‘‘relatedness’’ betweengenes.
The S2G OMIM-Based Search Engine
The first step in generating S2G was to design a web-based freesearch engine that would be effective in finding syndromes that arephenotypically similar to a known one. As the OMIM database isfree online and is continuously updated, we selected this databaseto use. However, when dealing with computerized searches,OMIM has several major faults that needed to be overcome,namely: negation phrases; use of different synonyms for the samephenotype; lack of standard ‘‘controlled’’ vocabulary.
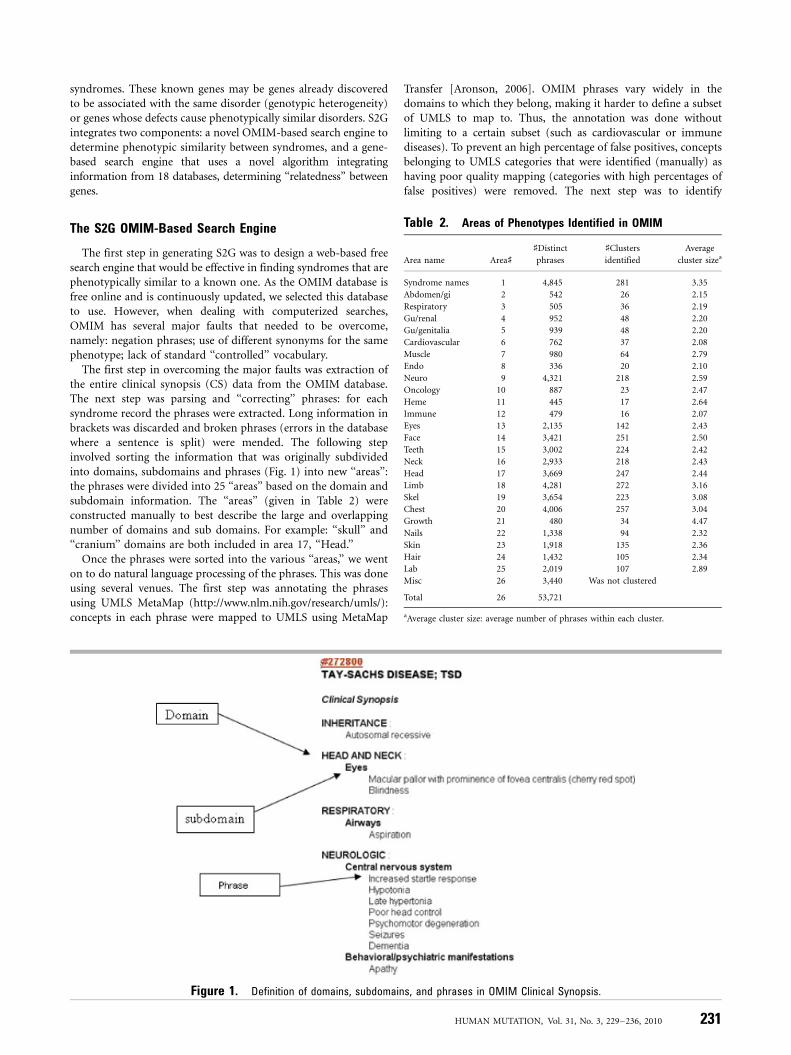
The first step in overcoming the major faults was extraction ofthe entire clinical synopsis (CS) data from the OMIM database.The next step was parsing and ‘‘correcting’’ phrases: for eachsyndrome record the phrases were extracted. Long information inbrackets was discarded and broken phrases (errors in the databasewhere a sentence is split) were mended. The following stepinvolved sorting the information that was originally subdividedinto domains, subdomains and phrases (Fig. 1) into new ‘‘areas’’:the phrases were divided into 25 ‘‘areas’’ based on the domain andsubdomain information. The ‘‘areas’’ (given in Table 2) wereconstructed manually to best describe the large and overlappingnumber of domains and sub domains. For example: ‘‘skull’’ and‘‘cranium’’ domains are both included in area 17, ‘‘Head.’’
Once the phrases were sorted into the various ‘‘areas,’’ we wenton to do natural language processing of the phrases. This was doneusing several venues. The first step was annotating the phrasesusing UMLS MetaMap (http://www.nlm.nih.gov/research/umls/):concepts in each phrase were mapped to UMLS using MetaMap
Transfer [Aronson, 2006]. OMIM phrases vary widely in thedomains to which they belong, making it harder to define a subsetof UMLS to map to. Thus, the annotation was done withoutlimiting to a certain subset (such as cardiovascular or immunediseases). To prevent an high percentage of false positives, conceptsbelonging to UMLS categories that were identified (manually) ashaving poor quality mapping (categories with high percentages offalse positives) were removed. The next step was to identify
Figure 1. Definition of domains, subdomains, and phrases in OMIM Clinical Synopsis.
Table 2. Areas of Phenotypes Identified in OMIM
Area name Area]]Distinct
phrases
]Clusters
identified
Average
cluster sizea
Syndrome names 1 4,845 281 3.35
Abdomen/gi 2 542 26 2.15
Respiratory 3 505 36 2.19
Gu/renal 4 952 48 2.20
Gu/genitalia 5 939 48 2.20
Cardiovascular 6 762 37 2.08
Muscle 7 980 64 2.79
Endo 8 336 20 2.10
Neuro 9 4,321 218 2.59
Oncology 10 887 23 2.47
Heme 11 445 17 2.64
Immune 12 479 16 2.07
Eyes 13 2,135 142 2.43
Face 14 3,421 251 2.50
Teeth 15 3,002 224 2.42
Neck 16 2,933 218 2.43
Head 17 3,669 247 2.44
Limb 18 4,281 272 3.16
Skel 19 3,654 223 3.08
Chest 20 4,006 257 3.04
Growth 21 480 34 4.47
Nails 22 1,338 94 2.32
Skin 23 1,918 135 2.36
Hair 24 1,432 105 2.34
Lab 25 2,019 107 2.89
Misc 26 3,440 Was not clustered
Total 26 53,721
aAverage cluster size: average number of phrases within each cluster.
HUMAN MUTATION, Vol. 31, No. 3, 229–236, 2010 231
synonyms. In order to be able to identify synonyms, it was essentialfirst to identify in each phrase the various parts of speech. Parts ofspeech (verb, adjective, etc.) were discovered using LingPipe(http://alias-i.com/lingpipe/) [Baldwin and Carpenter, 2003] withthe Genia corpus (http://www-tsujii.is.s.u-tokyo.ac.jp/�genia/topics/corpus/) [Kim et al., 2003]. The part of speech data was then usedwith WordNet (http://wordnet.princeton.edu/) for finding synon-ymous words for each word in the phrase. The data of this entirestep (in XML format) are available upon request.
Once the information was divided into ‘‘areas,’’ parts of speechwere identified, lists of the synonyms were generated, and parsingwas done using context free grammar (CFG). To that end, thewords (previously identified through UMLS) within each phrasewere divided into four labels. UMLS terms are divided intohundreds of categories. In order to use the UMLS categories in asimple manner, the categories were assigned into 1 of 4 labelsaccording to the functional role of the terms in the phenotypedescribing phrase. These labels were created to best describephenotype structure:
1. Pathology or Finding: disease names and symptoms (‘‘Hepato-megaly,’’ ‘‘Leukmia,’’ ‘‘Sclerosis,’’ ‘‘Fibroelastosis,’’ ‘‘Prolactindeficiency’’).
2. Named entities: chemicals, functions, microorganisms orprotein names (‘‘Adrenalin,’’ ‘‘Insulin,’’ ‘‘agglutination’’).
3. Anatomy: context of the phenotype, the area or body in whichit occurs (‘‘blood cells,’’ ‘‘testicular,’’ ‘‘long axis’’).
4. Modifiers: concepts describing the phenotype and changing itsmeaning (‘‘mild,’’ ‘‘decreased,’’ ‘‘low,’’ ‘‘enlarged’’).
A major problem when using the OMIM database is negationphrases. For instance, when one searches for ‘‘polydactyly’’ inOMIM, one also reaches all the syndromes where it is stated that‘‘there is no polydactyly’’. To circumvent this problem, we had toidentify and remove all the negation phrases in the data. Negationsare discovered using regular expressions (as described in Chapmanet al. [2001]). Two rules were defined:
1. Phrases with the word ‘‘normal’’ appearing anywhere (not aspart of another word such as ‘‘abnormal’’) are negations. Forinstance, ‘‘normal eyelashes’’ does not describe an abnormalityof the eyelashes and thus needs to be removed.
2. Phrases where the word ‘‘no’’ appears are negations only if theycontain a ‘‘Pathology’’ label in their parse tree (in order toremove sentences describing absent functions or body parts).For instance, ‘‘no hands’’ would remain in the data, while ‘‘nopolydactyly’’ would be removed.
Next, we compared and grouped phrases, looking for synony-mous phrases. Inside each area all phrase pairs were compared.The comparison was based on the following rules: phrases wereconsidered to be similar if they shared a synonymous Pathology/Named Entities and Anatomy area with synonymous modifiers.Decision trees are available in Supp. Figures S1 and S2. Phraseswithout a parse tree were compared using string distance. Similar(synonymous) phrases were organized into groups.
Once the new ‘‘curated’’ clinical phenotype dataset wasgenerated, the improved dataset underwent benchmark qualitytesting: random pairs from the groups created were classified by aclinical geneticist as true or false. Precision found in predictedsynonymous phrase pairs was 93.5% (6.5% false positives). Arandom sample of phrases classified as negations was classified aswell. A total of 856 distinct phrases (about 4% of the phrases) wereidentified as negation phrases. Precision (percentage of true
positives), measured by manual inspection of 10% of the negationphrases, was 89% with most false positive phrases beingambiguous (‘‘low to normal IQ,’’ ‘‘plasma testosterone is normalor increased’’).
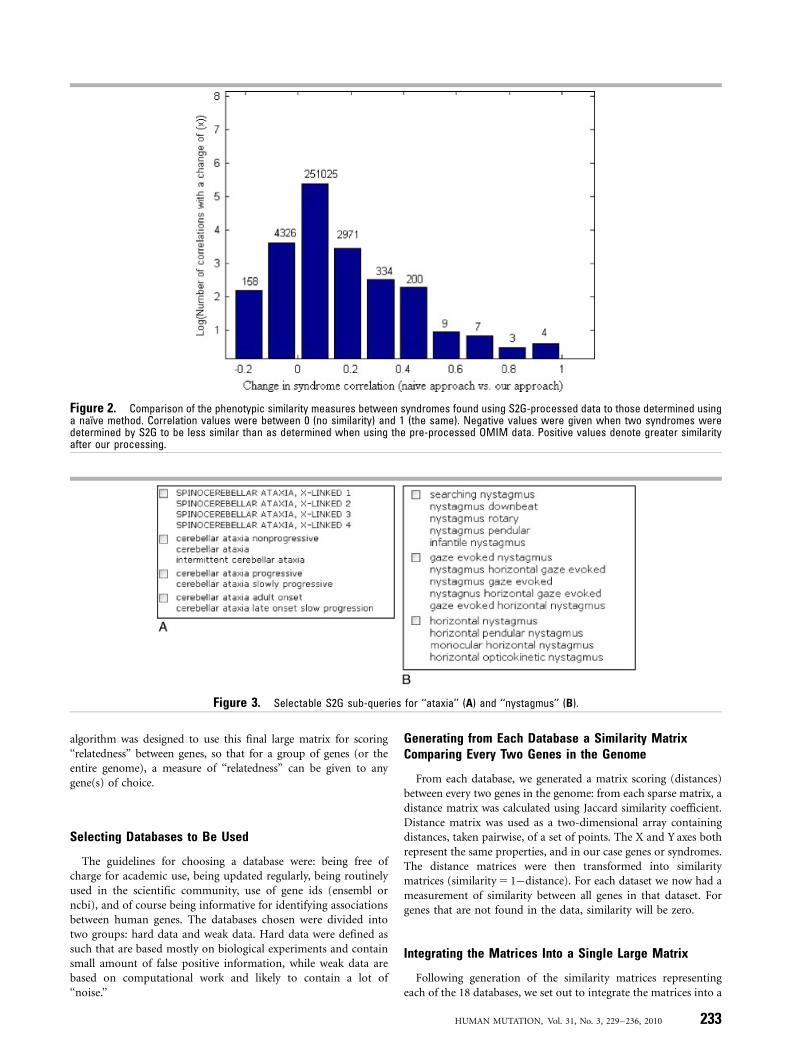
The two major advantages of S2G over the inherent OMIMsearch engine, were that S2G groups overlapping/similar pheno-types together and it ignores negations. The processing of thetextual data done in S2G was effective in enhancing the ability toaccurately determine phenotypic similarity or dissimilaritybetween clinical syndromes. The phenotypic similarity measuresbetween syndromes found using S2G-processed data werecompared to those determined using a naıve method (using thephenotype phrases before our processing). Correlation wascalculated for a pair of syndromes by counting the number ofshared phrases in their Clinical Synopsys (if syndrome A includes‘‘polydactyly’’ and ‘‘renal failure’’ and syndrome B includes‘‘polydactyly’’ and ‘‘VSD’’ their correlation is 0.5). The differencesbetween the measures of similarity between syndromes asdetermined by S2G versus those using the ‘‘naıve’’ OMIM dataare given in Figure 2. We observed changes in �260,000correlation values out of �574,000 correlations found in our data(553,570 correlations were found in the original data). Most of thechanges are slight improvements of less than 0.2. In another�4,500 cases, the correlation was reduced. 45,118 new connectionsbetween syndromes were identified, an average of nine newconnections per syndrome.
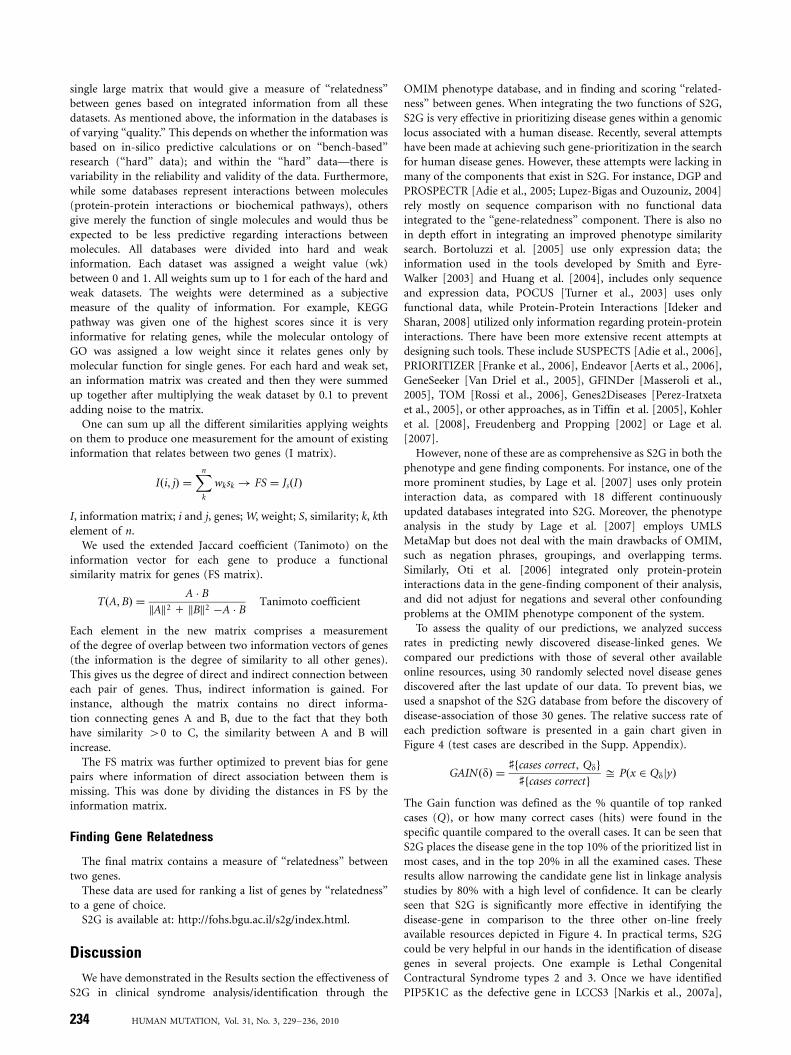
One of many examples of the advantage of using S2G over thenon-processed OMIM data is when looking at ‘‘lactic acidosis.’’When searching for ‘‘lactic acidosis’’ in OMIM, syndromenumber 608885 does not come up due to a spelling mistake(‘‘lacticacidosis’’) in the original OMIM database, while ‘‘glycogenstorage disease type VI’’ does come up ranked 59 (out of 117)as this entry contains the negation phrase ‘‘no lactic acidosis.’’Both mistakes are avoided in S2G. Furthermore, as seen inFigure 3, when entering phenotype queries such as ‘‘nystagmus’’or ‘‘ataxia’’ in S2G, one has a choice of sub-queries to selectfrom (several can be chosen), enabling further detailed probing ofthe data.
By selecting a group of phenotypes, one can search for similarsyndromes. We refer to the set of selected phenotypes as a ‘‘virtualsyndrome’’ and compute the set of most similar syndromes foundin the OMIM database. The similarity computation amongsyndromes is performed using the cosine distance over vectorsof phenotype clusters.
The S2G ‘‘Gene-Relatedness’’ Search Engine
Once the OMIM-based phenotype similarity search engine wascompleted, we went on to the other facet of this project, generatinga ‘‘gene-relatedness’’ index. The goal was to measure the probabilityof genes to function together in some known/putative way(‘‘relatedness’’). This is slightly different than regular similarity.Regular similarity can be viewed as a measure of the probability ofelements to be in the same group. But pathways are not distinctgroups, and genes often participate in more than one pathway.Measuring ‘‘relatedness’’ is thus not a trivial task, and was achievedas follows: we selected 18 freely available and continuously updatedgene databases harboring a wide array of information regardinggenes, their encoded proteins, functions and interactions. We thengenerated from each database a matrix showing and scoring‘‘distances’’ between every two genes in the genome. We went on totransform the distance matrices into information matrices, andfinally—integrated the matrices into a single large matrix. An
232 HUMAN MUTATION, Vol. 31, No. 3, 229–236, 2010
algorithm was designed to use this final large matrix for scoring‘‘relatedness’’ between genes, so that for a group of genes (or theentire genome), a measure of ‘‘relatedness’’ can be given to anygene(s) of choice.
Selecting Databases to Be Used
The guidelines for choosing a database were: being free ofcharge for academic use, being updated regularly, being routinelyused in the scientific community, use of gene ids (ensembl orncbi), and of course being informative for identifying associationsbetween human genes. The databases chosen were divided intotwo groups: hard data and weak data. Hard data were defined assuch that are based mostly on biological experiments and containsmall amount of false positive information, while weak data arebased on computational work and likely to contain a lot of‘‘noise.’’
Generating from Each Database a Similarity MatrixComparing Every Two Genes in the Genome
From each database, we generated a matrix scoring (distances)between every two genes in the genome: from each sparse matrix, adistance matrix was calculated using Jaccard similarity coefficient.Distance matrix was used as a two-dimensional array containingdistances, taken pairwise, of a set of points. The X and Y axes bothrepresent the same properties, and in our case genes or syndromes.The distance matrices were then transformed into similaritymatrices (similarity 5 1�distance). For each dataset we now had ameasurement of similarity between all genes in that dataset. Forgenes that are not found in the data, similarity will be zero.
Integrating the Matrices Into a Single Large Matrix
Following generation of the similarity matrices representingeach of the 18 databases, we set out to integrate the matrices into a
Figure 3. Selectable S2G sub-queries for ‘‘ataxia’’ (A) and ‘‘nystagmus’’ (B).
Figure 2. Comparison of the phenotypic similarity measures between syndromes found using S2G-processed data to those determined usinga naıve method. Correlation values were between 0 (no similarity) and 1 (the same). Negative values were given when two syndromes weredetermined by S2G to be less similar than as determined when using the pre-processed OMIM data. Positive values denote greater similarityafter our processing.
HUMAN MUTATION, Vol. 31, No. 3, 229–236, 2010 233
single large matrix that would give a measure of ‘‘relatedness’’between genes based on integrated information from all thesedatasets. As mentioned above, the information in the databases isof varying ‘‘quality.’’ This depends on whether the information wasbased on in-silico predictive calculations or on ‘‘bench-based’’research (‘‘hard’’ data); and within the ‘‘hard’’ data—there isvariability in the reliability and validity of the data. Furthermore,while some databases represent interactions between molecules(protein-protein interactions or biochemical pathways), othersgive merely the function of single molecules and would thus beexpected to be less predictive regarding interactions betweenmolecules. All databases were divided into hard and weakinformation. Each dataset was assigned a weight value (wk)between 0 and 1. All weights sum up to 1 for each of the hard andweak datasets. The weights were determined as a subjectivemeasure of the quality of information. For example, KEGGpathway was given one of the highest scores since it is veryinformative for relating genes, while the molecular ontology ofGO was assigned a low weight since it relates genes only bymolecular function for single genes. For each hard and weak set,an information matrix was created and then they were summedup together after multiplying the weak dataset by 0.1 to preventadding noise to the matrix.
One can sum up all the different similarities applying weightson them to produce one measurement for the amount of existinginformation that relates between two genes (I matrix).
Iði; jÞ ¼Xn
k
wksk ! FS ¼ JsðIÞ
I, information matrix; i and j, genes; W, weight; S, similarity; k, kthelement of n.
We used the extended Jaccard coefficient (Tanimoto) on theinformation vector for each gene to produce a functionalsimilarity matrix for genes (FS matrix).
TðA;BÞ ¼A � B
kAk2 1 kBk2 �A � BTanimoto coefficient
Each element in the new matrix comprises a measurementof the degree of overlap between two information vectors of genes(the information is the degree of similarity to all other genes).This gives us the degree of direct and indirect connection betweeneach pair of genes. Thus, indirect information is gained. Forinstance, although the matrix contains no direct informa-tion connecting genes A and B, due to the fact that they bothhave similarity 40 to C, the similarity between A and B willincrease.
The FS matrix was further optimized to prevent bias for genepairs where information of direct association between them ismissing. This was done by dividing the distances in FS by theinformation matrix.
Finding Gene Relatedness
The final matrix contains a measure of ‘‘relatedness’’ betweentwo genes.
These data are used for ranking a list of genes by ‘‘relatedness’’to a gene of choice.
S2G is available at: http://fohs.bgu.ac.il/s2g/index.html.
Discussion
We have demonstrated in the Results section the effectiveness ofS2G in clinical syndrome analysis/identification through the
OMIM phenotype database, and in finding and scoring ‘‘related-ness’’ between genes. When integrating the two functions of S2G,S2G is very effective in prioritizing disease genes within a genomiclocus associated with a human disease. Recently, several attemptshave been made at achieving such gene-prioritization in the searchfor human disease genes. However, these attempts were lacking inmany of the components that exist in S2G. For instance, DGP andPROSPECTR [Adie et al., 2005; Lupez-Bigas and Ouzouniz, 2004]rely mostly on sequence comparison with no functional dataintegrated to the ‘‘gene-relatedness’’ component. There is also noin depth effort in integrating an improved phenotype similaritysearch. Bortoluzzi et al. [2005] use only expression data; theinformation used in the tools developed by Smith and Eyre-Walker [2003] and Huang et al. [2004], includes only sequenceand expression data, POCUS [Turner et al., 2003] uses onlyfunctional data, while Protein-Protein Interactions [Ideker andSharan, 2008] utilized only information regarding protein-proteininteractions. There have been more extensive recent attempts atdesigning such tools. These include SUSPECTS [Adie et al., 2006],PRIORITIZER [Franke et al., 2006], Endeavor [Aerts et al., 2006],GeneSeeker [Van Driel et al., 2005], GFINDer [Masseroli et al.,2005], TOM [Rossi et al., 2006], Genes2Diseases [Perez-Iratxetaet al., 2005], or other approaches, as in Tiffin et al. [2005], Kohleret al. [2008], Freudenberg and Propping [2002] or Lage et al.[2007].
However, none of these are as comprehensive as S2G in both thephenotype and gene finding components. For instance, one of themore prominent studies, by Lage et al. [2007] uses only proteininteraction data, as compared with 18 different continuouslyupdated databases integrated into S2G. Moreover, the phenotypeanalysis in the study by Lage et al. [2007] employs UMLSMetaMap but does not deal with the main drawbacks of OMIM,such as negation phrases, groupings, and overlapping terms.Similarly, Oti et al. [2006] integrated only protein-proteininteractions data in the gene-finding component of their analysis,and did not adjust for negations and several other confoundingproblems at the OMIM phenotype component of the system.
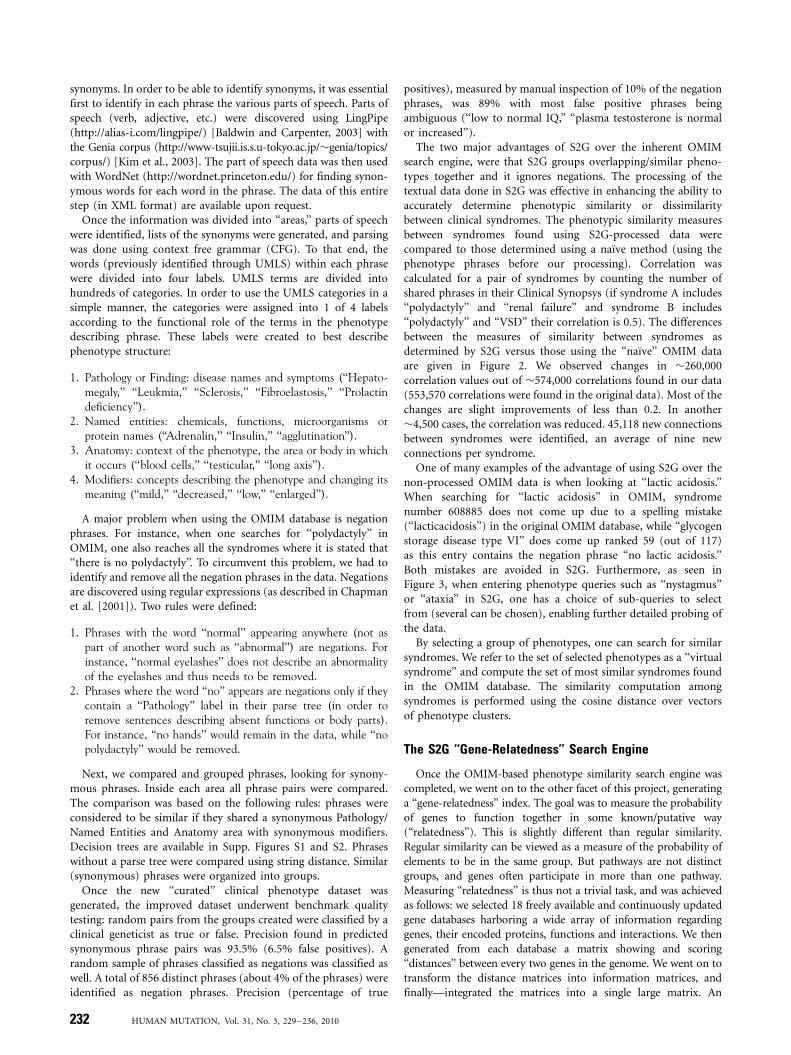
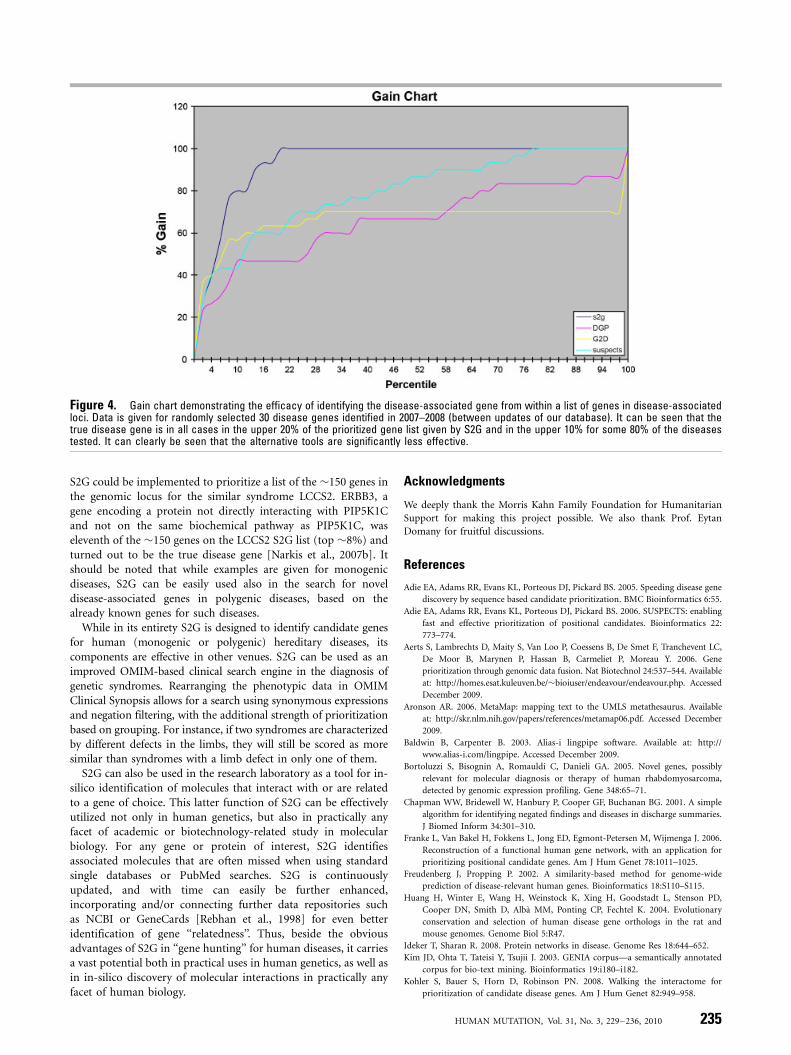
To assess the quality of our predictions, we analyzed successrates in predicting newly discovered disease-linked genes. Wecompared our predictions with those of several other availableonline resources, using 30 randomly selected novel disease genesdiscovered after the last update of our data. To prevent bias, weused a snapshot of the S2G database from before the discovery ofdisease-association of those 30 genes. The relative success rate ofeach prediction software is presented in a gain chart given inFigure 4 (test cases are described in the Supp. Appendix).
GAINðdÞ ¼]fcases correct; Qdg
]fcases correctgffi Pðx 2 QdjyÞ
The Gain function was defined as the % quantile of top rankedcases (Q), or how many correct cases (hits) were found in thespecific quantile compared to the overall cases. It can be seen thatS2G places the disease gene in the top 10% of the prioritized list inmost cases, and in the top 20% in all the examined cases. Theseresults allow narrowing the candidate gene list in linkage analysisstudies by 80% with a high level of confidence. It can be clearlyseen that S2G is significantly more effective in identifying thedisease-gene in comparison to the three other on-line freelyavailable resources depicted in Figure 4. In practical terms, S2Gcould be very helpful in our hands in the identification of diseasegenes in several projects. One example is Lethal CongenitalContractural Syndrome types 2 and 3. Once we have identifiedPIP5K1C as the defective gene in LCCS3 [Narkis et al., 2007a],
234 HUMAN MUTATION, Vol. 31, No. 3, 229–236, 2010
S2G could be implemented to prioritize a list of the �150 genes inthe genomic locus for the similar syndrome LCCS2. ERBB3, agene encoding a protein not directly interacting with PIP5K1Cand not on the same biochemical pathway as PIP5K1C, waseleventh of the �150 genes on the LCCS2 S2G list (top �8%) andturned out to be the true disease gene [Narkis et al., 2007b]. Itshould be noted that while examples are given for monogenicdiseases, S2G can be easily used also in the search for noveldisease-associated genes in polygenic diseases, based on thealready known genes for such diseases.
While in its entirety S2G is designed to identify candidate genesfor human (monogenic or polygenic) hereditary diseases, itscomponents are effective in other venues. S2G can be used as animproved OMIM-based clinical search engine in the diagnosis ofgenetic syndromes. Rearranging the phenotypic data in OMIMClinical Synopsis allows for a search using synonymous expressionsand negation filtering, with the additional strength of prioritizationbased on grouping. For instance, if two syndromes are characterizedby different defects in the limbs, they will still be scored as moresimilar than syndromes with a limb defect in only one of them.
S2G can also be used in the research laboratory as a tool for in-silico identification of molecules that interact with or are relatedto a gene of choice. This latter function of S2G can be effectivelyutilized not only in human genetics, but also in practically anyfacet of academic or biotechnology-related study in molecularbiology. For any gene or protein of interest, S2G identifiesassociated molecules that are often missed when using standardsingle databases or PubMed searches. S2G is continuouslyupdated, and with time can easily be further enhanced,incorporating and/or connecting further data repositories suchas NCBI or GeneCards [Rebhan et al., 1998] for even betteridentification of gene ‘‘relatedness’’. Thus, beside the obviousadvantages of S2G in ‘‘gene hunting’’ for human diseases, it carriesa vast potential both in practical uses in human genetics, as well asin in-silico discovery of molecular interactions in practically anyfacet of human biology.
Acknowledgments
We deeply thank the Morris Kahn Family Foundation for Humanitarian
Support for making this project possible. We also thank Prof. Eytan
Domany for fruitful discussions.
References
Adie EA, Adams RR, Evans KL, Porteous DJ, Pickard BS. 2005. Speeding disease gene
discovery by sequence based candidate prioritization. BMC Bioinformatics 6:55.
Adie EA, Adams RR, Evans KL, Porteous DJ, Pickard BS. 2006. SUSPECTS: enabling
fast and effective prioritization of positional candidates. Bioinformatics 22:
773–774.
Aerts S, Lambrechts D, Maity S, Van Loo P, Coessens B, De Smet F, Tranchevent LC,
De Moor B, Marynen P, Hassan B, Carmeliet P, Moreau Y. 2006. Gene
prioritization through genomic data fusion. Nat Biotechnol 24:537–544. Available
at: http://homes.esat.kuleuven.be/�bioiuser/endeavour/endeavour.php. Accessed
December 2009.
Aronson AR. 2006. MetaMap: mapping text to the UMLS metathesaurus. Available
at: http://skr.nlm.nih.gov/papers/references/metamap06.pdf. Accessed December
2009.
Baldwin B, Carpenter B. 2003. Alias-i lingpipe software. Available at: http://
www.alias-i.com/lingpipe. Accessed December 2009.
Bortoluzzi S, Bisognin A, Romauldi C, Danieli GA. 2005. Novel genes, possibly
relevant for molecular diagnosis or therapy of human rhabdomyosarcoma,
detected by genomic expression profiling. Gene 348:65–71.
Chapman WW, Bridewell W, Hanbury P, Cooper GF, Buchanan BG. 2001. A simple
algorithm for identifying negated findings and diseases in discharge summaries.
J Biomed Inform 34:301–310.
Franke L, Van Bakel H, Fokkens L, Jong ED, Egmont-Petersen M, Wijmenga J. 2006.
Reconstruction of a functional human gene network, with an application for
prioritizing positional candidate genes. Am J Hum Genet 78:1011–1025.
Freudenberg J, Propping P. 2002. A similarity-based method for genome-wide
prediction of disease-relevant human genes. Bioinformatics 18:S110–S115.
Huang H, Winter E, Wang H, Weinstock K, Xing H, Goodstadt L, Stenson PD,
Cooper DN, Smith D, Alba MM, Ponting CP, Fechtel K. 2004. Evolutionary
conservation and selection of human disease gene orthologs in the rat and
mouse genomes. Genome Biol 5:R47.
Ideker T, Sharan R. 2008. Protein networks in disease. Genome Res 18:644–652.
Kim JD, Ohta T, Tateisi Y, Tsujii J. 2003. GENIA corpus—a semantically annotated
corpus for bio-text mining. Bioinformatics 19:i180–i182.
Kohler S, Bauer S, Horn D, Robinson PN. 2008. Walking the interactome for
prioritization of candidate disease genes. Am J Hum Genet 82:949–958.
Figure 4. Gain chart demonstrating the efficacy of identifying the disease-associated gene from within a list of genes in disease-associatedloci. Data is given for randomly selected 30 disease genes identified in 2007–2008 (between updates of our database). It can be seen that thetrue disease gene is in all cases in the upper 20% of the prioritized gene list given by S2G and in the upper 10% for some 80% of the diseasestested. It can clearly be seen that the alternative tools are significantly less effective.
HUMAN MUTATION, Vol. 31, No. 3, 229–236, 2010 235
Lage K, Karlberg EO, Størling ZM, Olason PI, Pedersen AG, Rigina O, Hinsby AM,
Tumer Z, Pociot F, Tommerup N, Moreau Y, Brunak S. 2007. A human
phenome-interactome network of protein complexes implicated in genetic
disorders. Nat Biotechnol 25:309–316.
Lupez-Bigas N, Ouzouniz C. 2004. Genome-wide identification of genes likely to be
involved in human genetic disease. Nucleic Acids Res 32:3108–3114.
Masseroli M, Galati O, Pinciroli F. 2005. GFINDer: genetic disease and phenotype
location statistical analysis and mining of dynamically annotated gene lists.
Nucleic Acids Res 33:W717–W723. Available at: http://genoma.bioing.polimi.it/
gfinder. Accessed December 2009.
Narkis G, Ofir R, Landau D, Manor E, Volokita M, Hershkowitz R, Elbedour K,
Birk OS. 2007a. Lethal contractural syndrome type 3 (LCCS3) is caused by a
mutation in PIP5K1C, which encodes PIPKIg of the phophatidylinsitol pathway.
Am J Hum Genet 81:530–539.
Narkis G, Ofir R, Landau D, Manor E, Elbedour K, Birk O. 2007b. Lethal congenital
contractural syndrome type 2 (LCCS2) is caused by a mutation in ERBB3
(Her3), a modulator of the phosphatidylinositol-3-kinase/Akt pathway. Am J
Hum Genet 81:589–595.
Oti M, Snel B, Huynen MA, Brunner HG. 2006. Predicting disease genes using
protein–protein interactions. J Med Genet 43:691–698.
Oti M, Huynen M, Brunner H. 2008. Phenome connections. Trends Genet 24:103–106.
Perez-Iratxeta C, Wjst M, Bork P. 2005. G2D: a tool for mining genes associated with
disease. BMC Genet 6:45.
Rebhan M, Chalifa-Caspi V, Prilusky J, Lancet D. 1998. GeneCards: a novel functional
genomics compendium with automated data mining and query reformulation
support. Bioinformatics 14:656–664.
Rossi S, Masotti D, Nardini C, Bonora E, Romeo G, Macii E, Benini L, Volinia S.
2006. TOM: a web-based integrated approach for identification of candidate
disease genes. Nucleic Acid Research 34:W285–W292. Available at: http://www.
micrel.deis.unibo.it/�tom. Accessed December 2009.
Smith NG, Eyre-Walker A. 2003. Human disease genes: patterns and predictions.
Gene 318:169–175.
Tiffin N, Kelso JF, Powell AR, Pan H, Bajic VB, Hide WA. 2005. Integration of text—
and data—mining using ontologies successfully selects disease gene candidates.
Nucleic Acid Res 33:1544–1552.
Turner FS, Clutterbuck DR, Semple CA. 2003. POCUS: mining genomic sequence
annotation to predict disease genes. Genome Biol 4:R75.
Van Driel MA, Cuelenaere K, Kemmeren PP, Leunissen JA, Brunner HG, Vriend G.
2005. GeneSeeker: extraction and integration of human disease-related informa-
tion from web-based genetic databases. Nucleic Acid Res 33:W758–W761.
236 HUMAN MUTATION, Vol. 31, No. 3, 229–236, 2010