Embed Size (px)
Citation preview
Federal Department of Economic Affairs,
Education and Research EAER
State Secretariat for Economic Affairs SECO Bilateral Economic Relations Americas
Switzerland – Latin America
Economic Relations Report 2013
2
Distribution
For hard copies or further information, please contact: State Secretariat for Economic Affairs (SECO) Bilateral Economic Relations Americas Unit Holzikofenweg 36 CH-3003 Bern Phone: +41 / 31 324 14 53 Fax: +41 / 31 322 84 47 E-mail: [email protected] Available in electronic form at: www.seco.admin.ch/dokumentation/publikation/00008/00023/index.html?lang=en Bern, May 2013
3
Content
Foreword ................................................................................................................................ 5
1. Economic Situation in Latin America ............................................................................... 6
2. China's Presence in Latin America: Economic Implications ............................................. 8
3. Bilateral Economic Relations ......................................................................................... 15
3.1. Trade 15 3.2. Swiss Foreign Direct Investment 22 3.3. Bilateral Economic Agreements and Commissions 23 3.4. Latin American Integration: Recent Developments 25 3.5. Economic Development Cooperation of SECO: The Case of Colombia 29 3.6. Bilateral Visits in 2012 and Early 2013 31
Appendix .............................................................................................................................. 34 Boxes
1. Swiss Imports: New Methodology for Statistics 17 2. Differences between Swiss and Latin American Trade Data 21 3. The Aim of BITs and DTAs 24 4. SECO Publications on FTAs with Latin America 28
Tables 1. Chinese FDI in Latin America 12
Figures Switzerland – Latin America 1. Shifting Wealth: Latin America’s Trade with North America, Europe and Asia 8 2. China's Share in selected Latin American countries: Exports and Imports 9 3. Latin America's Exports to China and the World, 2009 9 4. Latin America's FDI in China 13 5. Merchandise Exports and Imports, 1965- 2012 15 6. Exports Variations by Major Partner, 2010-2012 16 7. Imports Variations by Major Partner, 2010-2012 18 8. Exports Variations by Major Product Group, 2009-2012 19 9. Imports Variations by Major Product Group, 2009-2012 20 10. Foreign Direct Investment by Major Partner, 1993-2011 22
Appendix Tables Switzerland – Latin America A.1. Merchandise Exports and Imports by Trading Partner, 2011-2012 35 A.2. Merchandise Exports and Imports, 1965-2012 37 A.3. Major Merchandise Export Markets. 1990-2012 38 A.4. Major Merchandise Import Markets, 1990-2012 39 A.5. Merchandise Exports by Product Group, 2000-2012 40 A.6. Merchandise Imports by Product Group, 2000-2012 41 A.7. Foreign Direct Investment by Major Partner, 1993-2011 42 A.8. Major Economic Agreements 43 A.9. Chambers of Commerce and Swiss Business Hub 44 A.10. Memorandum of Understanding Establishing a Bilateral Economic Dialogue 47
Appendix Figures Switzerland – Latin America A.1. Share of Merchandise Exports by Major Partner in Total Merchandise, 1990-2012 38 A.2. Share of Merchandise Imports by Major Partner in Total Merchandise, 1990-2012 39 A.3. Merchandise Exports by Major Product Group, 2000-2012 40 A.4. Merchandise Imports by Major Product Group, 2000-2012 41
4
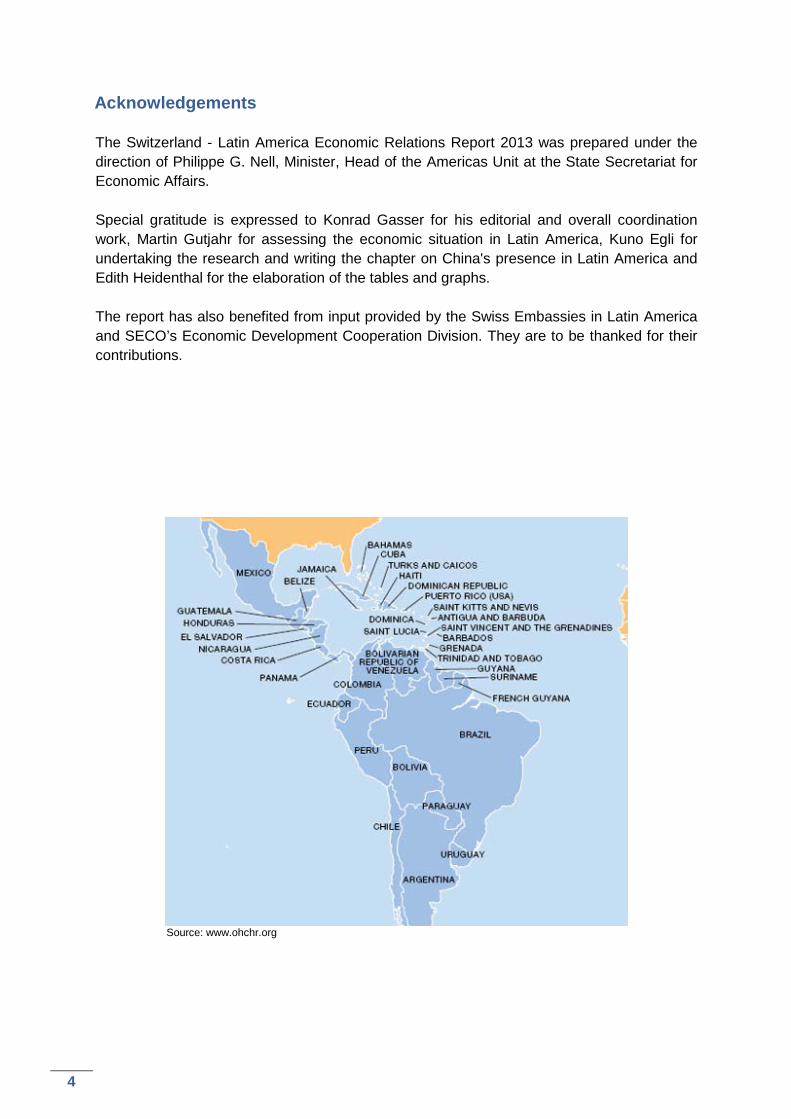
Acknowledgements
The Switzerland - Latin America Economic Relations Report 2013 was prepared under the direction of Philippe G. Nell, Minister, Head of the Americas Unit at the State Secretariat for Economic Affairs. Special gratitude is expressed to Konrad Gasser for his editorial and overall coordination work, Martin Gutjahr for assessing the economic situation in Latin America, Kuno Egli for undertaking the research and writing the chapter on China's presence in Latin America and Edith Heidenthal for the elaboration of the tables and graphs. The report has also benefited from input provided by the Swiss Embassies in Latin America and SECO’s Economic Development Cooperation Division. They are to be thanked for their contributions.
Source: www.ohchr.org
5
Foreword
We are pleased to present SECO’s 2013 report on the economic relations between Switzerland and Latin America. It provides an overview on the achievements and challenges of our bilateral relations and clearly confirms the region’s attractiveness for Switzerland.
During the 1980s, nobody would have predicted the current economic development of Latin America. Subsequently dubbed the “década perdida1”, this period was characterized by high levels of external debt, large fiscal deficits and strong inflationary pressures. The picture couldn’t look more different today: the region registers considerable growth rates and indebtedness has been brought down, giving room for countercyclical measures if needed. In contrast to the 1980s and 90s, today’s headlines focus on major difficulties in Europe. In this context, it comes as no surprise that Switzerland’s trade with the region increased by 11% last year while overall Swiss trade grew little more than 1%.
The rapid rise of China since the beginning of the 21st century had significant consequences for Latin America. The Middle Kingdom has become the third most important trade partner and investor on the continent. Behind this lies a fundamental shift of global trade patterns. Since China's accession to the World Trade Organisation in 2001, its exports of manufactured products to Latin America have skyrocketed, while the latter's commodity exports have surged. The implications for Latin America are evident. "Deindustrialization", "Dutch disease" and "concentration on low-skilled labour" are some of the catchwords that have frequently surfaced in recent years. This report dedicates a special chapter to the impact and benefits of China’s ascent for the region.
Latin American countries share a common history and cultural affinity. Yet, in economic terms, the integration of the continent remains surprisingly low. Whereas regional trade accounts for 40% of total trade in Asia and 50% in Europe, it is only about 20% in Latin America. Much remains to be done to bring intra- and inter-industry trade to a higher level and to establish value chains based on comparative advantages for specific types of inputs and products. The fall of trade barriers and the constant improvement of infrastructure will contribute to more integration.
In this context, we observe with great interest the recent creation of the Pacific Alliance; all its members have concluded free trade agreements with Switzerland and its EFTA partners. EFTA is currently also finalizing negotiations with various Central American countries. As for Mercosur, we would have a major interest to establish free trade relations and await the finalisation of the trade bloc's Agreement with the EU. At the bilateral level, Switzerland has recently established a new dialogue with Chile to reinforce our trade and investment relations and currently looks forward to the upcoming meetings under our bilateral economic commissions with Argentina, Brazil and Mexico.
We thank you for your interest in our report and wish you an insightful reading.
Eric Martin Ambassador, Head of Bilateral Economic Relations Delegate of the Federal Council for Trade Agreements
1 The lost decade.
6
Introduction
The report first presents Latin America's economic situation in 2012-2013. Section 2 highlights the region's rising ties with China and some of the consequences and challenges. Section 3 focuses on Swiss-Latin American relations in 2012 with the evolution of trade and investment flows, bilateral agreements, SECO's development cooperation program with Colombia, Latin American integration and official bilateral visits. In addition, the text of the Memorandum of Understanding between SECO and the Chilean Foreign Ministry establishing a bilateral economic dialogue is included at the end of the report.
1. Economic Situation in Latin America
Economic growth in Latin America and the Caribbean slowed down markedly from 4.6% in 2011 to 3% in 2012. The economies of Panama (10.7%), Peru (6.3%), Chile (5.5%), Venezuela (5.5%), Bolivia (5.2%) and Costa Rica (5%) largely maintained their solid growth rates from the previous year. Mexico also kept its 2011 level (3.9%), while Brazil registered a significant decline (0.9%; -1.8 percentage point against 2011) owing to macroeconomic policy tightening which had an unexpectedly strong negative impact on investment. A deceleration was also noted for Uruguay (3.8%; -1.9) and a much larger one for Argentina (1.9%; -7) and Ecuador (5%; -3). Paraguay's GDP shrank by 1.2%, mainly due to adverse weather conditions and the economic slowdown of its neighbours.2
The region's export performance was hampered by the difficult economic situation in its main foreign markets. Hesitant U.S. growth, the euro debt crisis and the economic slowdown in China led to disappointing export growth of 1.5% in 2012. The picture was mixed, however: exports were mainly held back by the weak performance of MERCOSUR countries (-2%) and Chile (-6%), while Mexico and Central America (+6% each) as well as the Andean countries (+5%) shipped more goods abroad last year than in 2011. During the same period imports to the region increased by 4%.3
On average, the ratio of public debt to GDP stands at 50.4%, unchanged from the previous year. The fiscal situation at the end of 2012 was not uniform across the region. At 95%, debt levels in Caribbean states are very high. In contrast, governments in Chile, Paraguay and Peru owe less than 20% of GDP. Brazil's debt level (67.2%) is substantially above those of Argentina (42.4%) and Mexico (43.5%). Although the average public sector deficit in the region in 2012 was 2.5%4, debt levels are currently not projected to rise, largely thanks to persistent economic growth. One notable exception is Venezuela, where government debt is set to increase by 22 percentage points to 61.8% of GDP between 2011 and 2013.5
In principle, healthy public finances would allow for countercyclical measures should the need arise.6 However, some of the expansionary fiscal policies taken after the financial crisis of 2008 are still in place without having been matched by structural increases in government revenue. In most of those countries additional public spending could thus lead to a primary
2 IMF, World Economic Outlook April 2013: Hopes, Realities, Risks, Washington, 2013, p. 154. 3 IDB, Latin American Trade Trend Estimates 2012, Washington, 2012, p. 1. 4 IDB data, 2012. 5 IMF, Regional Economic Update–Latin America and the Caribbean, Washington, 2012, p. 5; IMF data, 2013. 6 OECD/ECLAC, Latin American Economic Outlook 2013, Paris, 2013, p. 32.
7
deficit.
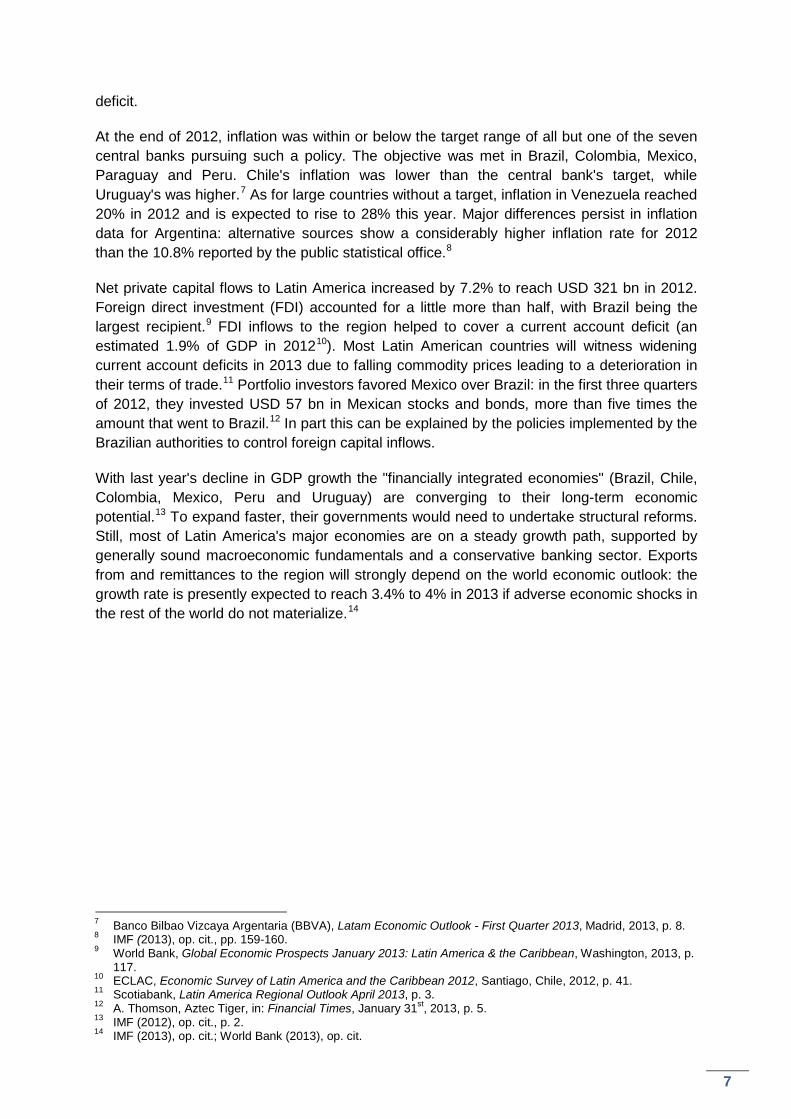
At the end of 2012, inflation was within or below the target range of all but one of the seven central banks pursuing such a policy. The objective was met in Brazil, Colombia, Mexico, Paraguay and Peru. Chile's inflation was lower than the central bank's target, while Uruguay's was higher.7 As for large countries without a target, inflation in Venezuela reached 20% in 2012 and is expected to rise to 28% this year. Major differences persist in inflation data for Argentina: alternative sources show a considerably higher inflation rate for 2012 than the 10.8% reported by the public statistical office.8
Net private capital flows to Latin America increased by 7.2% to reach USD 321 bn in 2012. Foreign direct investment (FDI) accounted for a little more than half, with Brazil being the largest recipient.9 FDI inflows to the region helped to cover a current account deficit (an estimated 1.9% of GDP in 201210). Most Latin American countries will witness widening current account deficits in 2013 due to falling commodity prices leading to a deterioration in their terms of trade.11 Portfolio investors favored Mexico over Brazil: in the first three quarters of 2012, they invested USD 57 bn in Mexican stocks and bonds, more than five times the amount that went to Brazil.12 In part this can be explained by the policies implemented by the Brazilian authorities to control foreign capital inflows.
With last year's decline in GDP growth the "financially integrated economies" (Brazil, Chile, Colombia, Mexico, Peru and Uruguay) are converging to their long-term economic potential.13 To expand faster, their governments would need to undertake structural reforms. Still, most of Latin America's major economies are on a steady growth path, supported by generally sound macroeconomic fundamentals and a conservative banking sector. Exports from and remittances to the region will strongly depend on the world economic outlook: the growth rate is presently expected to reach 3.4% to 4% in 2013 if adverse economic shocks in the rest of the world do not materialize.14
7 Banco Bilbao Vizcaya Argentaria (BBVA), Latam Economic Outlook - First Quarter 2013, Madrid, 2013, p. 8. 8 IMF (2013), op. cit., pp. 159-160. 9 World Bank, Global Economic Prospects January 2013: Latin America & the Caribbean, Washington, 2013, p.
117. 10 ECLAC, Economic Survey of Latin America and the Caribbean 2012, Santiago, Chile, 2012, p. 41. 11 Scotiabank, Latin America Regional Outlook April 2013, p. 3. 12 A. Thomson, Aztec Tiger, in: Financial Times, January 31st, 2013, p. 5. 13 IMF (2012), op. cit., p. 2. 14 IMF (2013), op. cit.; World Bank (2013), op. cit.
8
2. China's Presence in Latin America: Economic Implications
2.1. Introduction
One country that has been of great importance for Latin America, especially in the last few years, is the People's Republic of China. This section aims at shedding light on China's impact on Latin America in the areas of trade and investment.
China's GDP grew from USD 390bn in 1990 to USD 1’198bn in 2000 and to USD 8’227bn in 2012.15 Countries exporting investment goods, technology, raw materials and natural resources have benefitted most from China's expansion16. With the latter two being in abundant supply in Latin America, opportunities as well as challenges arose for the region's countries.
2.2. Trade
Since the middle of the past decade, Latin America and the Caribbean have been China's most dynamic trading partner.17 Economic Commission for Latin America and the Caribbean (ECLAC)
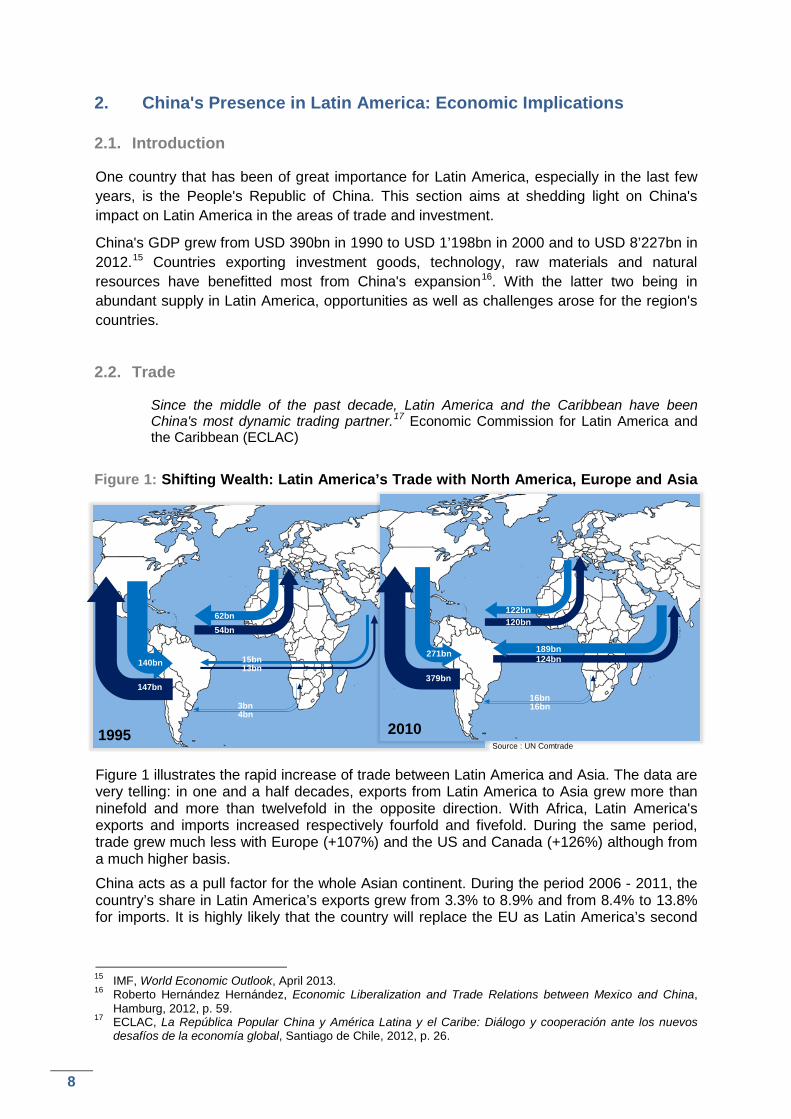
Figure 1: Shifting Wealth: Latin America’s Trade with North America, Europe and Asia
Figure 1 illustrates the rapid increase of trade between Latin America and Asia. The data are very telling: in one and a half decades, exports from Latin America to Asia grew more than ninefold and more than twelvefold in the opposite direction. With Africa, Latin America's exports and imports increased respectively fourfold and fivefold. During the same period, trade grew much less with Europe (+107%) and the US and Canada (+126%) although from a much higher basis.
China acts as a pull factor for the whole Asian continent. During the period 2006 - 2011, the country’s share in Latin America’s exports grew from 3.3% to 8.9% and from 8.4% to 13.8% for imports. It is highly likely that the country will replace the EU as Latin America’s second
15 IMF, World Economic Outlook, April 2013. 16 Roberto Hernández Hernández, Economic Liberalization and Trade Relations between Mexico and China,
Hamburg, 2012, p. 59. 17 ECLAC, La República Popular China y América Latina y el Caribe: Diálogo y cooperación ante los nuevos
desafíos de la economía global, Santiago de Chile, 2012, p. 26.
1995
147bn
140bn
62bn54bn
15bn13bn
3bn4bn
2010
379bn
271bn
122bn120bn
189bn124bn
16bn16bn
Source : UN Comtrade
9
China World
Agriculture
Fuels
Mining
Manu-facturing
35%
6%
48%
11%22%
20%
11%
46%
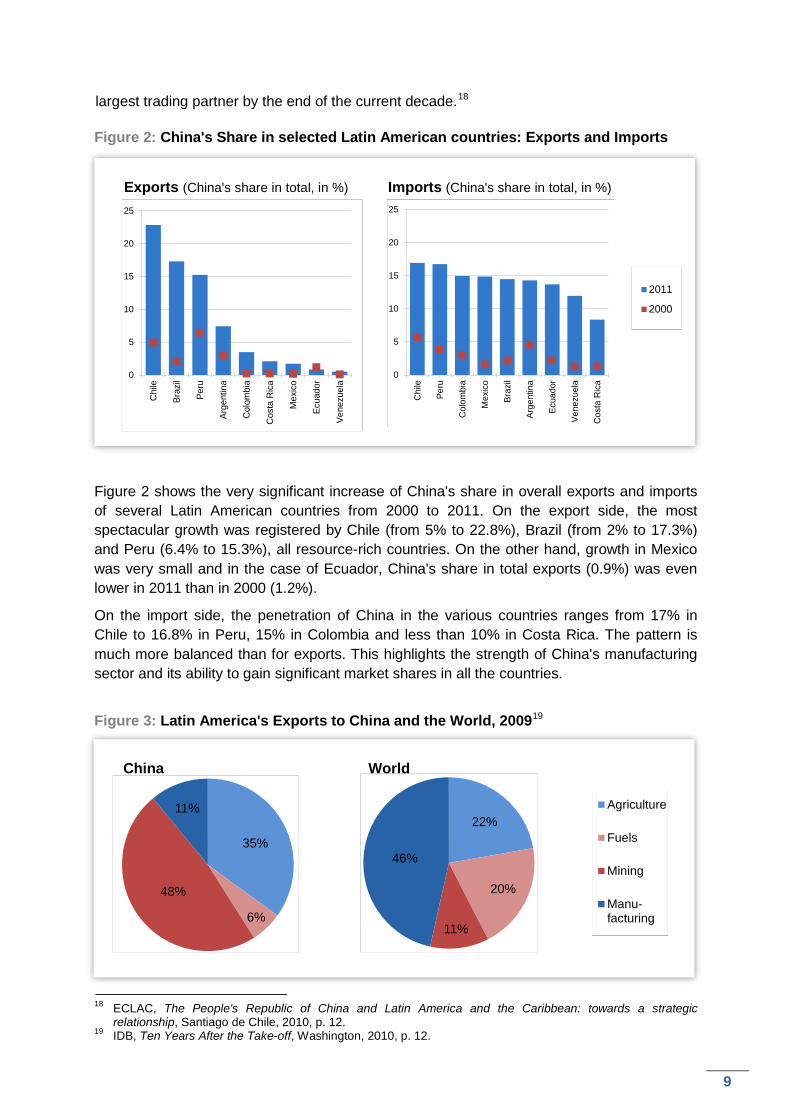
largest trading partner by the end of the current decade.18 Figure 2: China's Share in selected Latin American countries: Exports and Imports
Figure 2 shows the very significant increase of China's share in overall exports and imports of several Latin American countries from 2000 to 2011. On the export side, the most spectacular growth was registered by Chile (from 5% to 22.8%), Brazil (from 2% to 17.3%) and Peru (6.4% to 15.3%), all resource-rich countries. On the other hand, growth in Mexico was very small and in the case of Ecuador, China's share in total exports (0.9%) was even lower in 2011 than in 2000 (1.2%).
On the import side, the penetration of China in the various countries ranges from 17% in Chile to 16.8% in Peru, 15% in Colombia and less than 10% in Costa Rica. The pattern is much more balanced than for exports. This highlights the strength of China's manufacturing sector and its ability to gain significant market shares in all the countries.
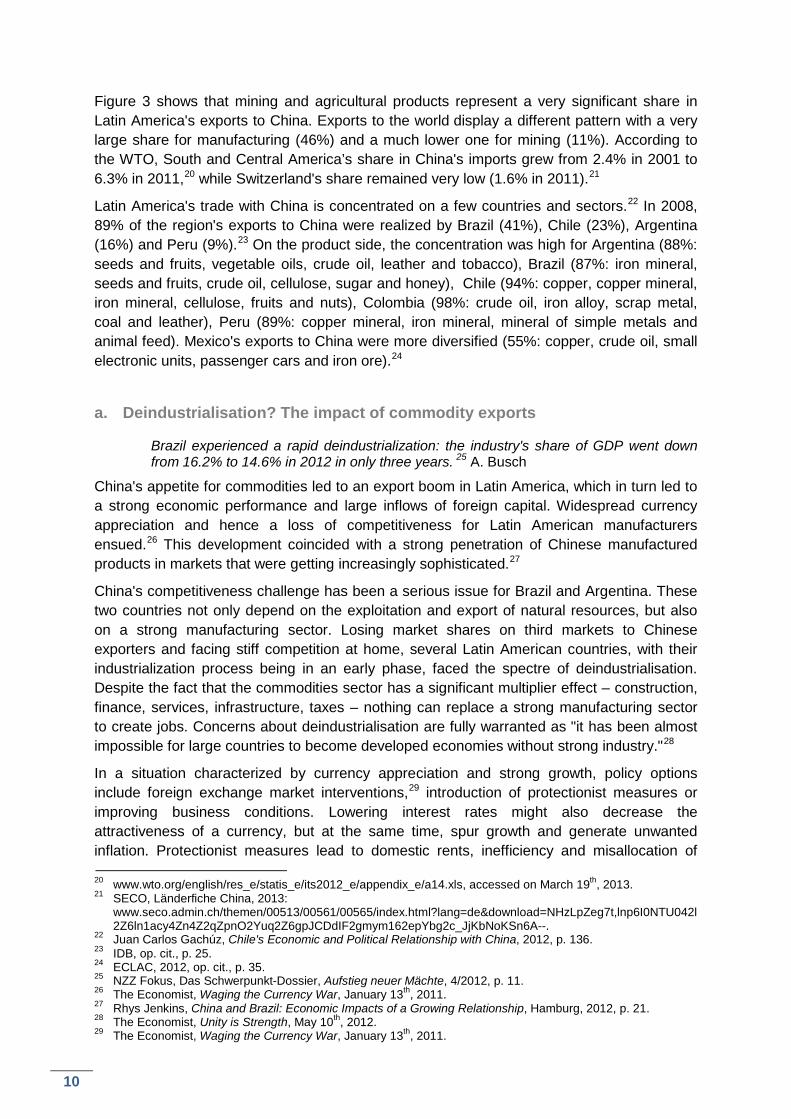
Figure 3: Latin America's Exports to China and the World, 200919
18 ECLAC, The People's Republic of China and Latin America and the Caribbean: towards a strategic
relationship, Santiago de Chile, 2010, p. 12. 19 IDB, Ten Years After the Take-off, Washington, 2010, p. 12.
Exports (China's share in total, in %) Imports (China's share in total, in %)
0
5
10
15
20
25
Chi
le
Peru
Col
ombi
a
Mex
ico
Braz
il
Arge
ntin
a
Ecua
dor
Vene
zuel
a
Cos
ta R
ica
0
5
10
15
20
25
Chi
le
Braz
il
Peru
Arge
ntin
a
Col
ombi
a
Cos
ta R
ica
Mex
ico
Ecua
dor
Vene
zuel
a
2011
2000
10
Figure 3 shows that mining and agricultural products represent a very significant share in Latin America's exports to China. Exports to the world display a different pattern with a very large share for manufacturing (46%) and a much lower one for mining (11%). According to the WTO, South and Central America’s share in China's imports grew from 2.4% in 2001 to 6.3% in 2011,20 while Switzerland's share remained very low (1.6% in 2011).21
Latin America's trade with China is concentrated on a few countries and sectors.22 In 2008, 89% of the region's exports to China were realized by Brazil (41%), Chile (23%), Argentina (16%) and Peru (9%).23 On the product side, the concentration was high for Argentina (88%: seeds and fruits, vegetable oils, crude oil, leather and tobacco), Brazil (87%: iron mineral, seeds and fruits, crude oil, cellulose, sugar and honey), Chile (94%: copper, copper mineral, iron mineral, cellulose, fruits and nuts), Colombia (98%: crude oil, iron alloy, scrap metal, coal and leather), Peru (89%: copper mineral, iron mineral, mineral of simple metals and animal feed). Mexico's exports to China were more diversified (55%: copper, crude oil, small electronic units, passenger cars and iron ore).24
a. Deindustrialisation? The impact of commodity exports
Brazil experienced a rapid deindustrialization: the industry's share of GDP went down from 16.2% to 14.6% in 2012 in only three years. 25 A. Busch
China's appetite for commodities led to an export boom in Latin America, which in turn led to a strong economic performance and large inflows of foreign capital. Widespread currency appreciation and hence a loss of competitiveness for Latin American manufacturers ensued.26 This development coincided with a strong penetration of Chinese manufactured products in markets that were getting increasingly sophisticated.27
China's competitiveness challenge has been a serious issue for Brazil and Argentina. These two countries not only depend on the exploitation and export of natural resources, but also on a strong manufacturing sector. Losing market shares on third markets to Chinese exporters and facing stiff competition at home, several Latin American countries, with their industrialization process being in an early phase, faced the spectre of deindustrialisation. Despite the fact that the commodities sector has a significant multiplier effect – construction, finance, services, infrastructure, taxes – nothing can replace a strong manufacturing sector to create jobs. Concerns about deindustrialisation are fully warranted as "it has been almost impossible for large countries to become developed economies without strong industry."28
In a situation characterized by currency appreciation and strong growth, policy options include foreign exchange market interventions,29 introduction of protectionist measures or improving business conditions. Lowering interest rates might also decrease the attractiveness of a currency, but at the same time, spur growth and generate unwanted inflation. Protectionist measures lead to domestic rents, inefficiency and misallocation of 20 www.wto.org/english/res_e/statis_e/its2012_e/appendix_e/a14.xls, accessed on March 19th, 2013. 21 SECO, Länderfiche China, 2013:
www.seco.admin.ch/themen/00513/00561/00565/index.html?lang=de&download=NHzLpZeg7t,lnp6I0NTU042l2Z6ln1acy4Zn4Z2qZpnO2Yuq2Z6gpJCDdIF2gmym162epYbg2c_JjKbNoKSn6A--.
22 Juan Carlos Gachúz, Chile's Economic and Political Relationship with China, 2012, p. 136. 23 IDB, op. cit., p. 25. 24 ECLAC, 2012, op. cit., p. 35. 25 NZZ Fokus, Das Schwerpunkt-Dossier, Aufstieg neuer Mächte, 4/2012, p. 11. 26 The Economist, Waging the Currency War, January 13th, 2011. 27 Rhys Jenkins, China and Brazil: Economic Impacts of a Growing Relationship, Hamburg, 2012, p. 21. 28 The Economist, Unity is Strength, May 10th, 2012. 29 The Economist, Waging the Currency War, January 13th, 2011.
11
resources. It might be more advisable to address the problems that make doing business in a country expensive: high taxes, a deficient infrastructure30, red tape and the lack of investment in education31 as well as in science and technology.32
b. WTO dispute settlement claims
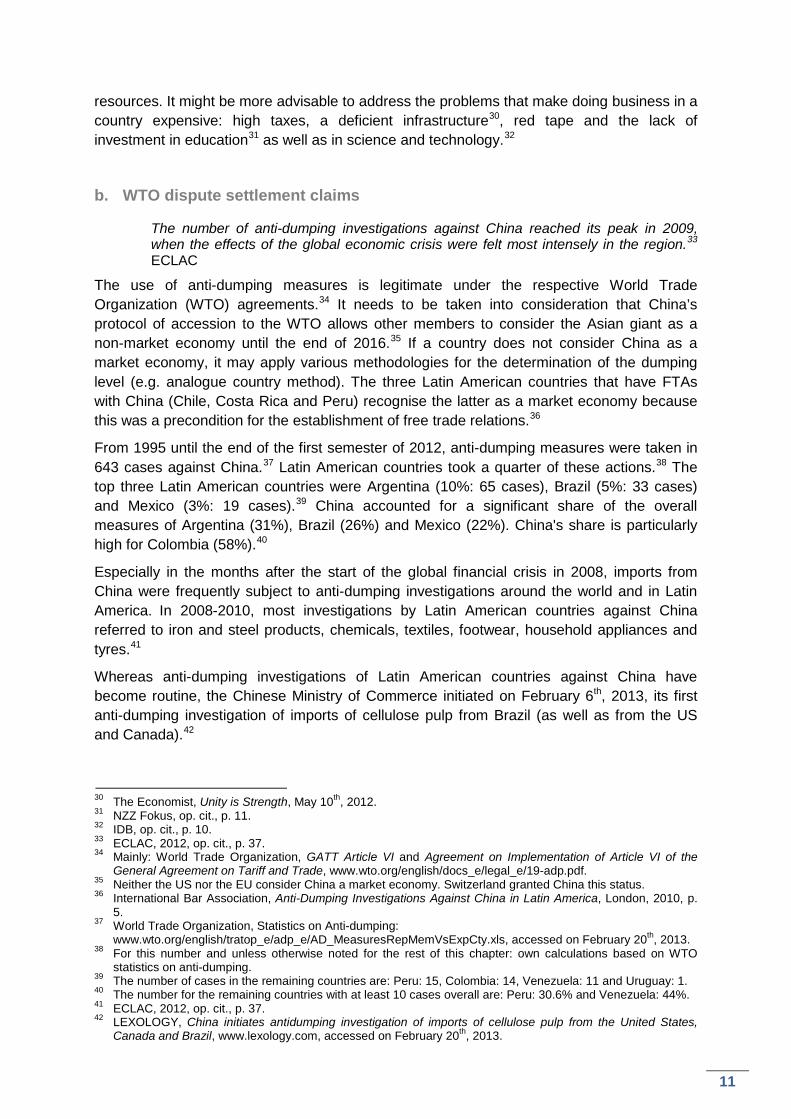
The number of anti-dumping investigations against China reached its peak in 2009, when the effects of the global economic crisis were felt most intensely in the region.33 ECLAC
The use of anti-dumping measures is legitimate under the respective World Trade Organization (WTO) agreements.34 It needs to be taken into consideration that China’s protocol of accession to the WTO allows other members to consider the Asian giant as a non-market economy until the end of 2016.35 If a country does not consider China as a market economy, it may apply various methodologies for the determination of the dumping level (e.g. analogue country method). The three Latin American countries that have FTAs with China (Chile, Costa Rica and Peru) recognise the latter as a market economy because this was a precondition for the establishment of free trade relations.36
From 1995 until the end of the first semester of 2012, anti-dumping measures were taken in 643 cases against China.37 Latin American countries took a quarter of these actions.38 The top three Latin American countries were Argentina (10%: 65 cases), Brazil (5%: 33 cases) and Mexico (3%: 19 cases).39 China accounted for a significant share of the overall measures of Argentina (31%), Brazil (26%) and Mexico (22%). China's share is particularly high for Colombia (58%).40
Especially in the months after the start of the global financial crisis in 2008, imports from China were frequently subject to anti-dumping investigations around the world and in Latin America. In 2008-2010, most investigations by Latin American countries against China referred to iron and steel products, chemicals, textiles, footwear, household appliances and tyres.41
Whereas anti-dumping investigations of Latin American countries against China have become routine, the Chinese Ministry of Commerce initiated on February 6th, 2013, its first anti-dumping investigation of imports of cellulose pulp from Brazil (as well as from the US and Canada).42
30 The Economist, Unity is Strength, May 10th, 2012. 31 NZZ Fokus, op. cit., p. 11. 32 IDB, op. cit., p. 10. 33 ECLAC, 2012, op. cit., p. 37. 34 Mainly: World Trade Organization, GATT Article VI and Agreement on Implementation of Article VI of the
General Agreement on Tariff and Trade, www.wto.org/english/docs_e/legal_e/19-adp.pdf. 35 Neither the US nor the EU consider China a market economy. Switzerland granted China this status. 36 International Bar Association, Anti-Dumping Investigations Against China in Latin America, London, 2010, p.
5. 37 World Trade Organization, Statistics on Anti-dumping:
www.wto.org/english/tratop_e/adp_e/AD_MeasuresRepMemVsExpCty.xls, accessed on February 20th, 2013. 38 For this number and unless otherwise noted for the rest of this chapter: own calculations based on WTO
statistics on anti-dumping. 39 The number of cases in the remaining countries are: Peru: 15, Colombia: 14, Venezuela: 11 and Uruguay: 1. 40 The number for the remaining countries with at least 10 cases overall are: Peru: 30.6% and Venezuela: 44%. 41 ECLAC, 2012, op. cit., p. 37. 42 LEXOLOGY, China initiates antidumping investigation of imports of cellulose pulp from the United States,
Canada and Brazil, www.lexology.com, accessed on February 20th, 2013.
12
2.3. Investments
Chinese outward investment around the world set another record in 2012.43 D. Scissors
In order to realize the full potential of a bilateral economic relationship, trade needs to be complemented by robust investments flows.44 For a host country, incoming FDI means an inflow of capital, knowledge and new jobs.45
a. China's investments in Latin America
When Wen Jiabao visited Argentina, Brazil, Chile and Uruguay in 2012, he declared that Beijing wanted to invest USD 10 billion.46 W. Kunath
In 2010, China was the third largest foreign investor in Latin America.47 For China, Latin America is the second most important FDI destination just after the Asia-Pacific region.48
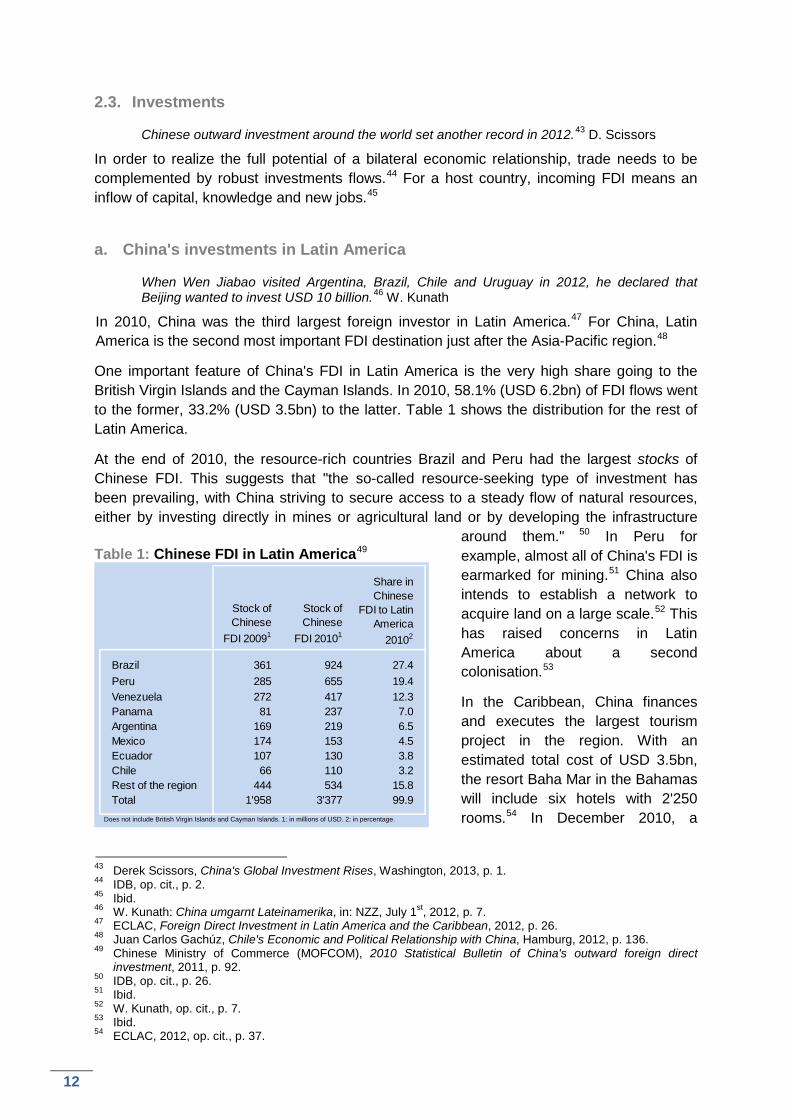
One important feature of China's FDI in Latin America is the very high share going to the British Virgin Islands and the Cayman Islands. In 2010, 58.1% (USD 6.2bn) of FDI flows went to the former, 33.2% (USD 3.5bn) to the latter. Table 1 shows the distribution for the rest of Latin America.
At the end of 2010, the resource-rich countries Brazil and Peru had the largest stocks of Chinese FDI. This suggests that "the so-called resource-seeking type of investment has been prevailing, with China striving to secure access to a steady flow of natural resources, either by investing directly in mines or agricultural land or by developing the infrastructure
around them." 50 In Peru for example, almost all of China's FDI is earmarked for mining.51 China also intends to establish a network to acquire land on a large scale.52 This has raised concerns in Latin America about a second colonisation.53
In the Caribbean, China finances and executes the largest tourism project in the region. With an estimated total cost of USD 3.5bn, the resort Baha Mar in the Bahamas will include six hotels with 2'250 rooms.54 In December 2010, a
43 Derek Scissors, China's Global Investment Rises, Washington, 2013, p. 1. 44 IDB, op. cit., p. 2. 45 Ibid. 46 W. Kunath: China umgarnt Lateinamerika, in: NZZ, July 1st, 2012, p. 7. 47 ECLAC, Foreign Direct Investment in Latin America and the Caribbean, 2012, p. 26. 48 Juan Carlos Gachúz, Chile's Economic and Political Relationship with China, Hamburg, 2012, p. 136. 49 Chinese Ministry of Commerce (MOFCOM), 2010 Statistical Bulletin of China's outward foreign direct
investment, 2011, p. 92. 50 IDB, op. cit., p. 26. 51 Ibid. 52 W. Kunath, op. cit., p. 7. 53 Ibid. 54 ECLAC, 2012, op. cit., p. 37.
Table 1: Chinese FDI in Latin America49
Brazil 361 924 27.4Peru 285 655 19.4Venezuela 272 417 12.3Panama 81 237 7.0Argentina 169 219 6.5Mexico 174 153 4.5Ecuador 107 130 3.8Chile 66 110 3.2Rest of the region 444 534 15.8Total 1'958 3'377 99.9
Stock of Chinese
FDI 20091
Stock of Chinese
FDI 20101
Share in Chinese
FDI to Latin America
20102
Does not include British Virgin Islands and Cayman Islands. 1: in millions of USD. 2: in percentage.
13
cooperation program in the area of mining was signed between Argentina and China.55 There are also investments in the area of services: in Argentina, the state-owned Industrial and Commercial Bank of China (ICBC) purchased in November 2012 an 80% interest in Standard Bank for USD 600 million from Standard Bank (South Africa).56 China deems it strategically important to control the exploitation of scarce natural resources and is particularly interested in the lithium held by Bolivia, who holds the largest reserves in the world.57
b. Latin America's multinational firms in China
It is safe to say that Latin American companies making direct investments in China remain the exception rather than the rule.58 IDB
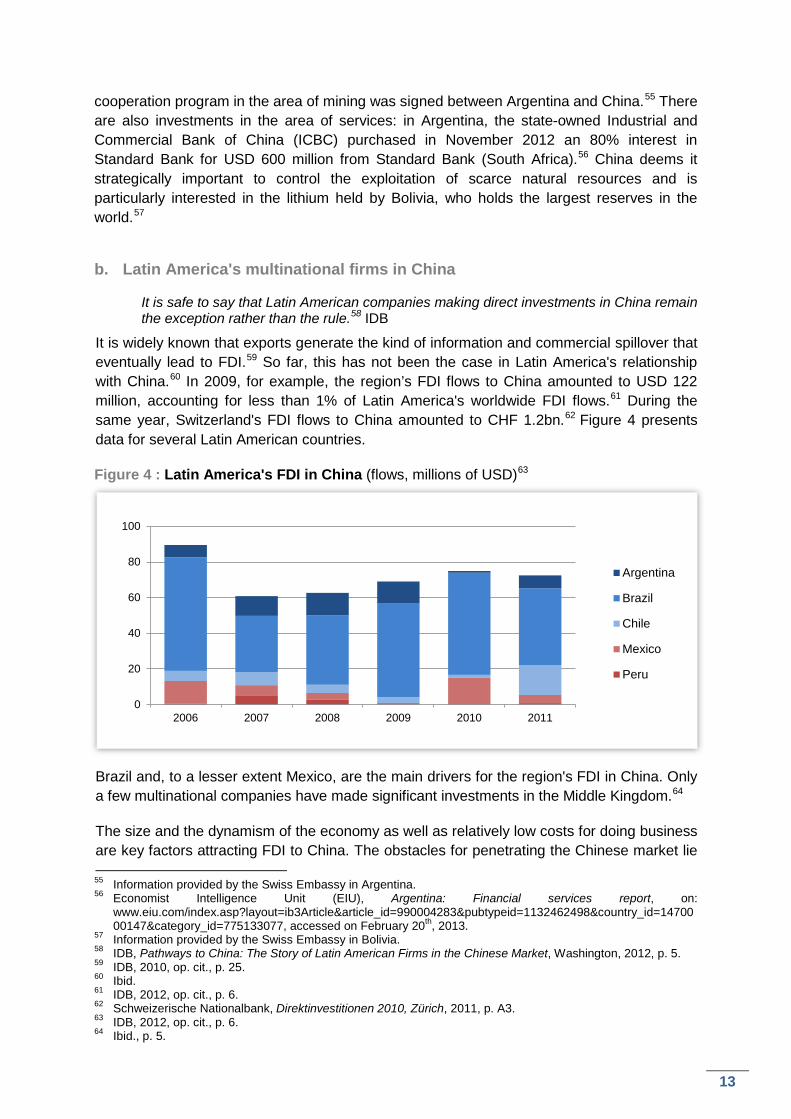
It is widely known that exports generate the kind of information and commercial spillover that eventually lead to FDI.59 So far, this has not been the case in Latin America's relationship with China.60 In 2009, for example, the region’s FDI flows to China amounted to USD 122 million, accounting for less than 1% of Latin America's worldwide FDI flows.61 During the same year, Switzerland's FDI flows to China amounted to CHF 1.2bn.62 Figure 4 presents data for several Latin American countries.
Figure 4 : Latin America's FDI in China (flows, millions of USD)63
Brazil and, to a lesser extent Mexico, are the main drivers for the region's FDI in China. Only a few multinational companies have made significant investments in the Middle Kingdom.64
The size and the dynamism of the economy as well as relatively low costs for doing business are key factors attracting FDI to China. The obstacles for penetrating the Chinese market lie 55 Information provided by the Swiss Embassy in Argentina. 56 Economist Intelligence Unit (EIU), Argentina: Financial services report, on:
www.eiu.com/index.asp?layout=ib3Article&article_id=990004283&pubtypeid=1132462498&country_id=1470000147&category_id=775133077, accessed on February 20th, 2013.
57 Information provided by the Swiss Embassy in Bolivia. 58 IDB, Pathways to China: The Story of Latin American Firms in the Chinese Market, Washington, 2012, p. 5. 59 IDB, 2010, op. cit., p. 25. 60 Ibid. 61 IDB, 2012, op. cit., p. 6. 62 Schweizerische Nationalbank, Direktinvestitionen 2010, Zürich, 2011, p. A3. 63 IDB, 2012, op. cit., p. 6. 64 Ibid., p. 5.
China Worldwide
0
20
40
60
80
100
2006 2007 2008 2009 2010 2011
Argentina
Brazil
Chile
Mexico
Peru
14
in the language, different business cultures, customer preferences and the regulatory environment.65
In the case of Chile, FDI stock in China reached USD 280 million in December 2011 with mainly industry (70.5%) and services (29.2%; maritime transport and commerce). China accounted for 0.45% of Chile's FDI in the world.66
Examples of multinational firms that succeeded in entering the Chinese market are the Brazilian metals and mining company Vale67, the Mexican Grupo Bimbo Food Co68 and Chile's Molymet69. In the case of Vale, its venture into the Chinese market was successful. Whereas China accounted for 7% of Vale's total revenues in 2002, this share increased to almost one third (32.4%) in 2011.70 An important factor for Vale's success was that the company established a representation office in Shanghai as early as 1973.71 In 2006, Grupo Bimbo invested USD 11 million in the purchase of the Beijing Food Processing Centre. In 2009 and 2010, it acquired the local bakery brands Baiwanzhuangyuan and Million Land. 72 The expansion of Latin America's companies into China may also take the form of joint ventures; Venezuela plans to build at least three refineries in China to process Venezuelan oil under that cooperation scheme.73
The rather weak presence of Latin American firms in China may be linked to the fact that Latin America's comparative advantage is in mining, a sector with a strong foreign presence in Latin America and limited opportunities in China. Furthermore, investments in China are likely to be made by large multinationals.
2.4. Conclusion
This section showed a significant strengthening of the economic relationship between Latin America and China. Latin American mining and agricultural exports contribute to meet China's growing demand for commodities. On Latin America's import side, the goods purchased from China have become more and more sophisticated. The resulting trade pattern raises concerns. Latin American leaders need to find ways to move up along the global value chain.74
On the investment side, flows have only recently started to pick up. Chinese FDI focus on resource-rich countries. Especially in the area of large-scale Chinese investments into food producing areas, concerns about a second colonisation have been raised. Latin America's investment flows into China are very small, but the success of companies like Vale or Bimbo may encourage others to follow.
65 Ibid., p. 9. 66 Ministerio de Relaciones Exteriores del Gobierno de Chile, Inversión Directa de Capitales Chilenos en China :
1990 - Diciembre 2011, on: www.direcon.gob.cl/inversion/1423, accessed on February 20th, 2013. 67 Vale is the worldwide leader in iron ore production and the second biggest nickel producer. Additional
information: www.vale.com/EN/aboutvale/Pages/default.aspx. 68 Grupo Bimbo produces baked goods and is one of the largest food companies in Latin America. Additional
information: www.grupobimbo.com/en/index.html. 69 Molymet works in the treatment and processing of molybdenum and related products. Additional information:
www.molymet.cl/en/our-company.html. 70 IDB, 2012, op. cit., p. 30. 71 Ibid. 72 Ibid., p. 8. 73 Information provided by the Swiss Embassy in Venezuela. 74 OECD, Development Centre Studies: The Visible Hand of China in Latin America, Paris, 2007, p. 8.
15
3. Bilateral Economic Relations
3.1. Trade
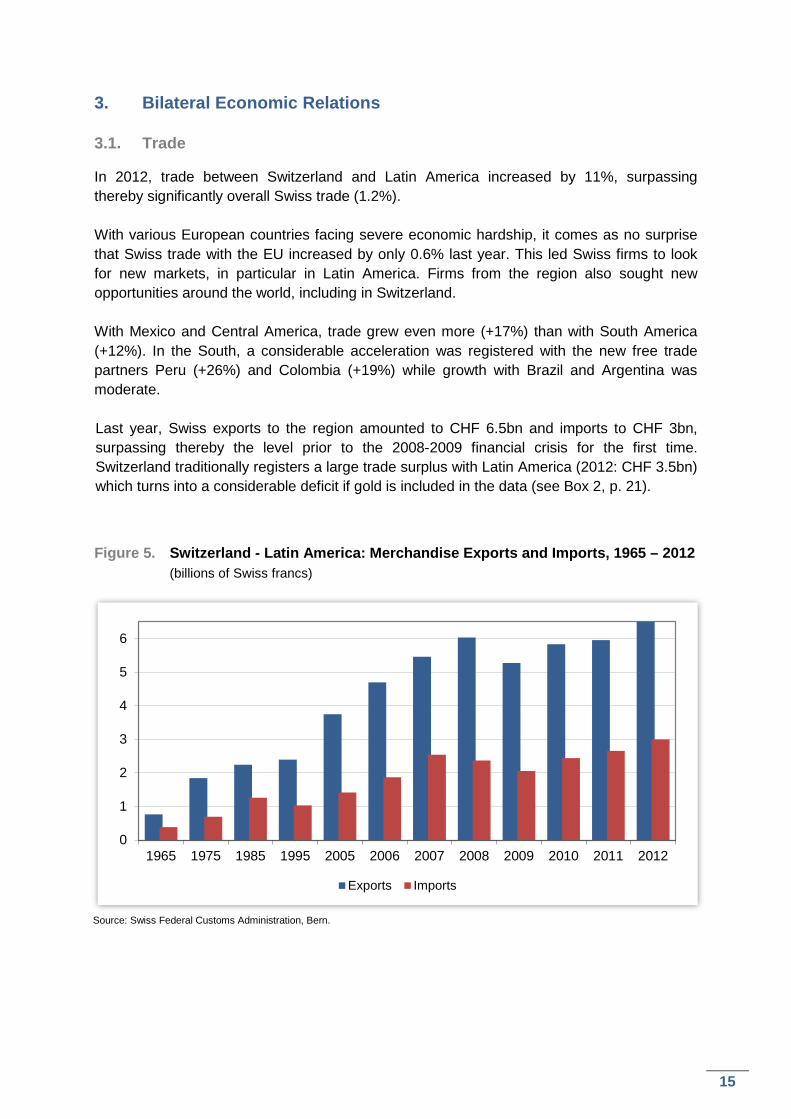
In 2012, trade between Switzerland and Latin America increased by 11%, surpassing thereby significantly overall Swiss trade (1.2%). With various European countries facing severe economic hardship, it comes as no surprise that Swiss trade with the EU increased by only 0.6% last year. This led Swiss firms to look for new markets, in particular in Latin America. Firms from the region also sought new opportunities around the world, including in Switzerland. With Mexico and Central America, trade grew even more (+17%) than with South America (+12%). In the South, a considerable acceleration was registered with the new free trade partners Peru (+26%) and Colombia (+19%) while growth with Brazil and Argentina was moderate. Last year, Swiss exports to the region amounted to CHF 6.5bn and imports to CHF 3bn, surpassing thereby the level prior to the 2008-2009 financial crisis for the first time. Switzerland traditionally registers a large trade surplus with Latin America (2012: CHF 3.5bn) which turns into a considerable deficit if gold is included in the data (see Box 2, p. 21). Figure 5. Switzerland - Latin America: Merchandise Exports and Imports, 1965 – 2012 (billions of Swiss francs)
Source: Swiss Federal Customs Administration, Bern.
0
1
2
3
4
5
6
1965 1975 1985 1995 2005 2006 2007 2008 2009 2010 2011 2012
Exports Imports
16
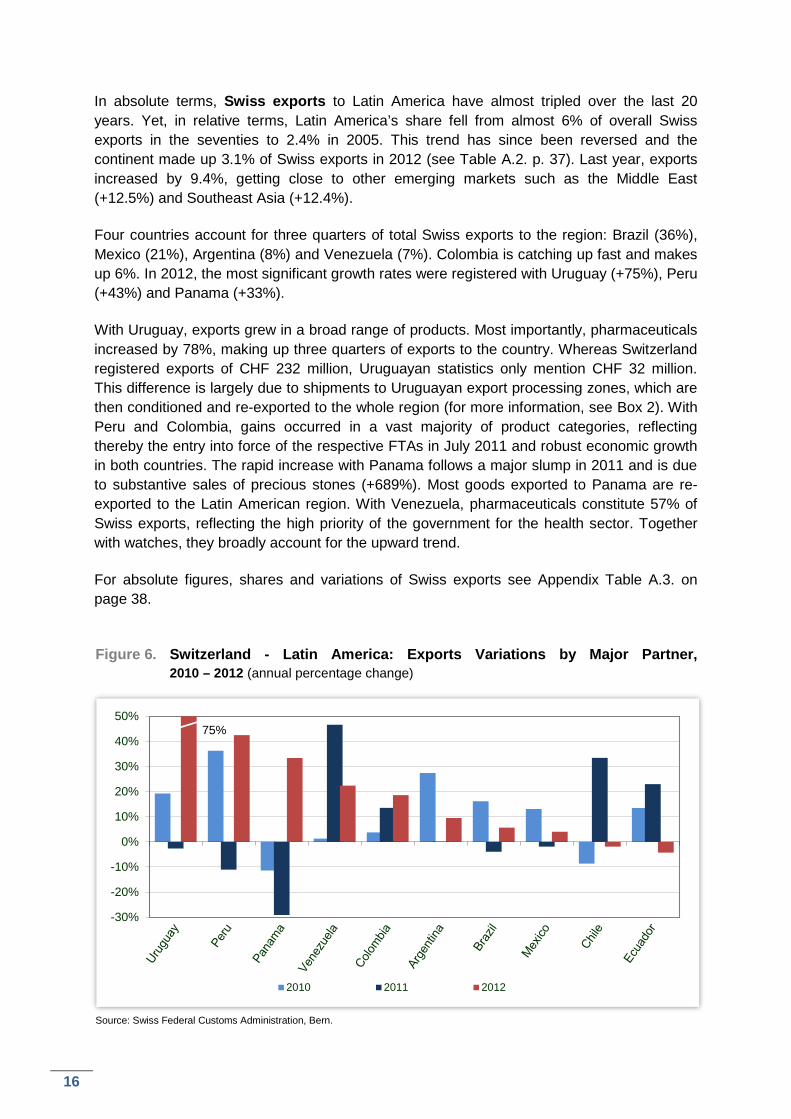
In absolute terms, Swiss exports to Latin America have almost tripled over the last 20 years. Yet, in relative terms, Latin America’s share fell from almost 6% of overall Swiss exports in the seventies to 2.4% in 2005. This trend has since been reversed and the continent made up 3.1% of Swiss exports in 2012 (see Table A.2. p. 37). Last year, exports increased by 9.4%, getting close to other emerging markets such as the Middle East (+12.5%) and Southeast Asia (+12.4%). Four countries account for three quarters of total Swiss exports to the region: Brazil (36%), Mexico (21%), Argentina (8%) and Venezuela (7%). Colombia is catching up fast and makes up 6%. In 2012, the most significant growth rates were registered with Uruguay (+75%), Peru (+43%) and Panama (+33%). With Uruguay, exports grew in a broad range of products. Most importantly, pharmaceuticals increased by 78%, making up three quarters of exports to the country. Whereas Switzerland registered exports of CHF 232 million, Uruguayan statistics only mention CHF 32 million. This difference is largely due to shipments to Uruguayan export processing zones, which are then conditioned and re-exported to the whole region (for more information, see Box 2). With Peru and Colombia, gains occurred in a vast majority of product categories, reflecting thereby the entry into force of the respective FTAs in July 2011 and robust economic growth in both countries. The rapid increase with Panama follows a major slump in 2011 and is due to substantive sales of precious stones (+689%). Most goods exported to Panama are re-exported to the Latin American region. With Venezuela, pharmaceuticals constitute 57% of Swiss exports, reflecting the high priority of the government for the health sector. Together with watches, they broadly account for the upward trend. For absolute figures, shares and variations of Swiss exports see Appendix Table A.3. on page 38. Figure 6. Switzerland - Latin America: Exports Variations by Major Partner,
2010 – 2012 (annual percentage change)
Source: Swiss Federal Customs Administration, Bern.
-30%
-20%
-10%
0%
10%
20%
30%
40%
50%
2010 2011 2012
75%
17
Box 1. Swiss Imports: New Methodology for Statistics
Since the beginning of 2012, the Swiss Federal Customs Administration (FCA) attributes the geographic origin of imported goods to the country where the latter are entirely produced or predominantly processed. This implies that henceforth, a product re-exported from a third country to Switzerland is registered by FCA under the country where production effectively took place whereas it was formerly attributed to the transit country.
Under the previous methodology, import data from transit countries with important harbours like Germany or the Netherlands were artificially overvalued, while they were systematically undervalued in the case of countries of production. Aside from Colombia (-1%) and Panama (-33%), the data for Latin American countries are higher with the new system. The explanation for Panama lies in the country’s important export processing zone Colón which hosts more than 2’500 companies and handles more than USD 16bn in imports and re-exports each year.75
As statistical comparisons with previous years are not possible, this publication’s data for 2009, 2010 and 2011 have been adapted to the new methodology. The latter stems from recommendations by the United Nations on international merchandise trade statistics76 and the bilateral agreement between Switzerland and the European Union in the area of statistical cooperation.
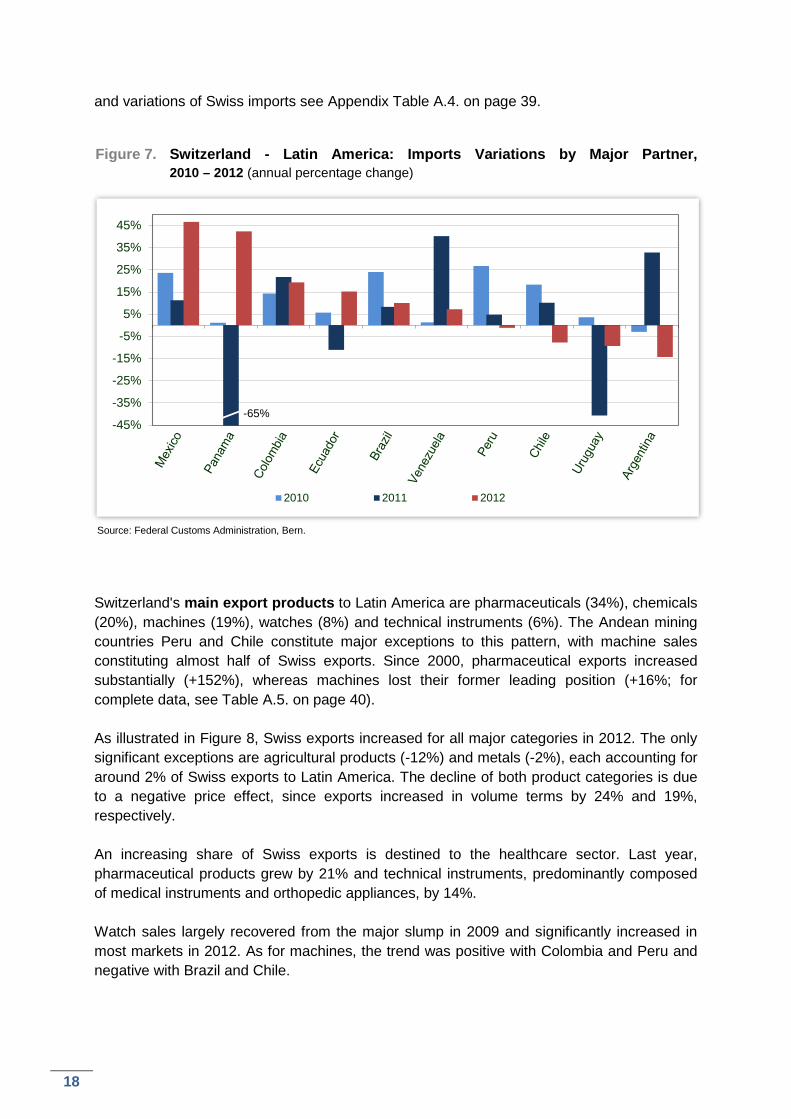
Swiss imports from Latin America grew by 15.7% in 2012, vastly outstripping overall Swiss import growth (+0.3%). Since 2005, their share in overall imports has grown steadily from 0.9% to 1.6% last year. The bulk of Swiss imports from Latin America comes from Brazil, Mexico and Colombia (73%). Brazil makes up the largest part; yet, its relative importance has declined progressively over the last decade from close to 50% to 36% last year. As illustrated in Figure 7, the most significant growth rates were registered with Mexico (+47%), Panama (+42%), Colombia (+19%) and Ecuador (15%). Having almost doubled within a year, pharmaceutical products account for 65% of imports from Mexico. From Panama and Colombia, Swiss firms purchased increasing amounts of precious and semi-precious stones (CHF 32 and CHF 21 million respectively). In the case of Panama, the latter reached 55% of imports. With Colombia, trade is more diversified with imports developing all across the board during the review period. Ecuador, which accounts for barely 2% of Swiss exports to Latin America, has managed to gain a 3.3% share in imports from the region due to good access to Swiss retail distribution. Switzerland mainly buys agricultural products from the country, yet in 2012, shipments of precious metals worth CHF 21.3 million bolstered values significantly. With the southern cone, imports from Chile (-7.8%), Uruguay (-9.4%) and Argentina (-14.3%) decreased significantly while they increased from Brazil (+10%). For absolute figures, shares 75 http://colonfreezone.com/about-the-cfz/ 76 United Nations Department of Economic and Social Affairs, Statistics Division, International Merchandise
Trade Statistics : Concepts and Definitions 2010, New York, 2011.
18
and variations of Swiss imports see Appendix Table A.4. on page 39. Figure 7. Switzerland - Latin America: Imports Variations by Major Partner,
2010 – 2012 (annual percentage change)
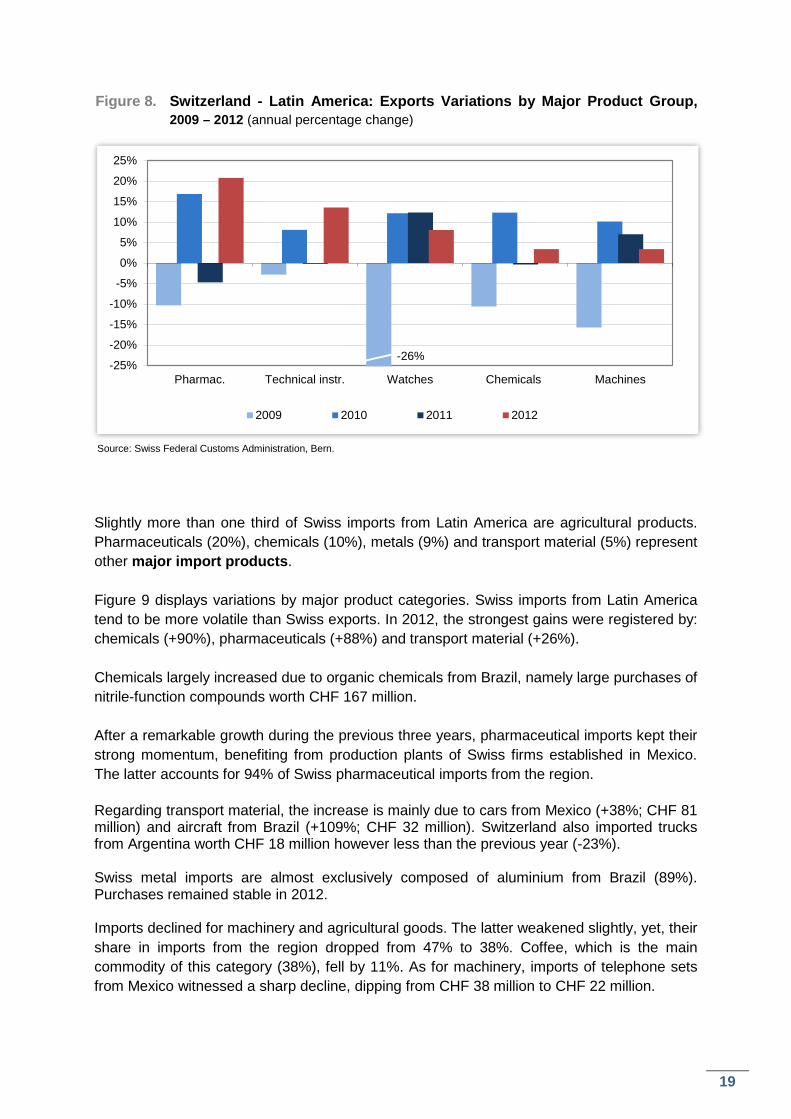
Source: Federal Customs Administration, Bern. Switzerland's main export products to Latin America are pharmaceuticals (34%), chemicals (20%), machines (19%), watches (8%) and technical instruments (6%). The Andean mining countries Peru and Chile constitute major exceptions to this pattern, with machine sales constituting almost half of Swiss exports. Since 2000, pharmaceutical exports increased substantially (+152%), whereas machines lost their former leading position (+16%; for complete data, see Table A.5. on page 40). As illustrated in Figure 8, Swiss exports increased for all major categories in 2012. The only significant exceptions are agricultural products (-12%) and metals (-2%), each accounting for around 2% of Swiss exports to Latin America. The decline of both product categories is due to a negative price effect, since exports increased in volume terms by 24% and 19%, respectively. An increasing share of Swiss exports is destined to the healthcare sector. Last year, pharmaceutical products grew by 21% and technical instruments, predominantly composed of medical instruments and orthopedic appliances, by 14%. Watch sales largely recovered from the major slump in 2009 and significantly increased in most markets in 2012. As for machines, the trend was positive with Colombia and Peru and negative with Brazil and Chile.
-45%
-35%
-25%
-15%
-5%
5%
15%
25%
35%
45%
2010 2011 2012
-65%
19
Figure 8. Switzerland - Latin America: Exports Variations by Major Product Group, 2009 – 2012 (annual percentage change)
Source: Swiss Federal Customs Administration, Bern.
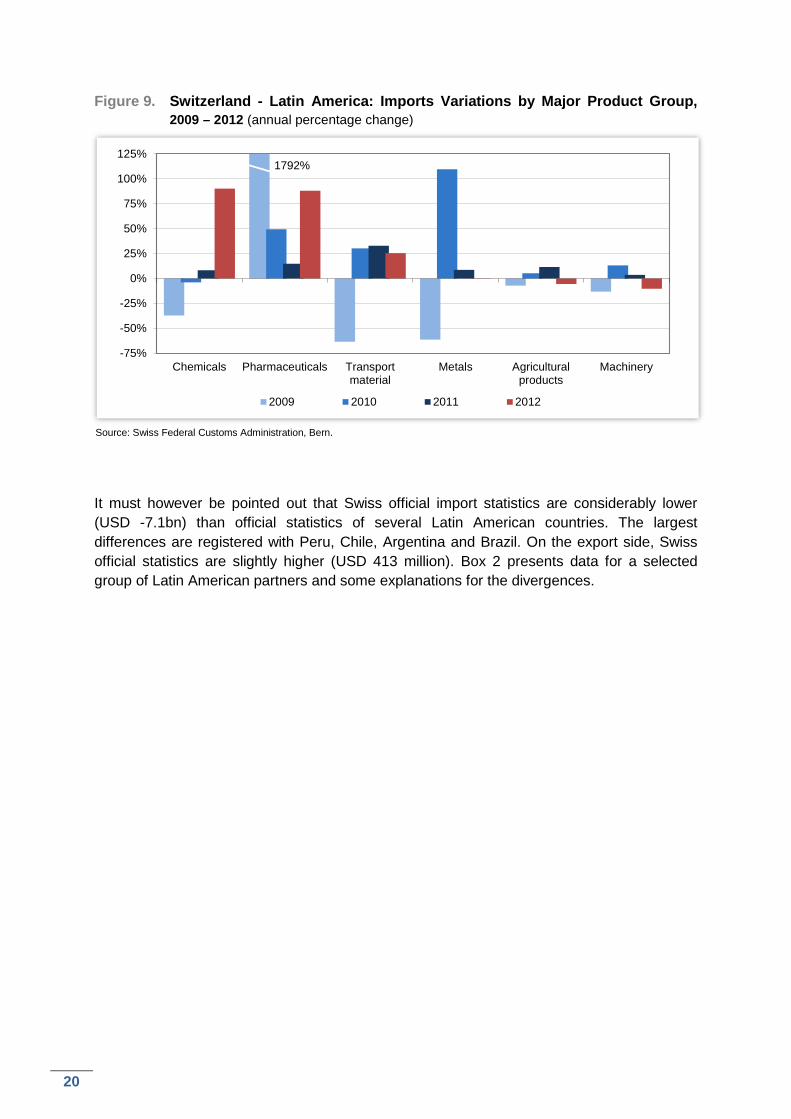
Slightly more than one third of Swiss imports from Latin America are agricultural products. Pharmaceuticals (20%), chemicals (10%), metals (9%) and transport material (5%) represent other major import products. Figure 9 displays variations by major product categories. Swiss imports from Latin America tend to be more volatile than Swiss exports. In 2012, the strongest gains were registered by: chemicals (+90%), pharmaceuticals (+88%) and transport material (+26%). Chemicals largely increased due to organic chemicals from Brazil, namely large purchases of nitrile-function compounds worth CHF 167 million. After a remarkable growth during the previous three years, pharmaceutical imports kept their strong momentum, benefiting from production plants of Swiss firms established in Mexico. The latter accounts for 94% of Swiss pharmaceutical imports from the region. Regarding transport material, the increase is mainly due to cars from Mexico (+38%; CHF 81 million) and aircraft from Brazil (+109%; CHF 32 million). Switzerland also imported trucks from Argentina worth CHF 18 million however less than the previous year (-23%). Swiss metal imports are almost exclusively composed of aluminium from Brazil (89%). Purchases remained stable in 2012. Imports declined for machinery and agricultural goods. The latter weakened slightly, yet, their share in imports from the region dropped from 47% to 38%. Coffee, which is the main commodity of this category (38%), fell by 11%. As for machinery, imports of telephone sets from Mexico witnessed a sharp decline, dipping from CHF 38 million to CHF 22 million.
-25%
-20%
-15%
-10%
-5%
0%
5%
10%
15%
20%
25%
Pharmac. Technical instr. Watches Chemicals Machines
2009 2010 2011 2012
-26%
20
Figure 9. Switzerland - Latin America: Imports Variations by Major Product Group, 2009 – 2012 (annual percentage change)
Source: Swiss Federal Customs Administration, Bern. It must however be pointed out that Swiss official import statistics are considerably lower (USD -7.1bn) than official statistics of several Latin American countries. The largest differences are registered with Peru, Chile, Argentina and Brazil. On the export side, Swiss official statistics are slightly higher (USD 413 million). Box 2 presents data for a selected group of Latin American partners and some explanations for the divergences.
-75%
-50%
-25%
0%
25%
50%
75%
100%
125%
Chemicals Pharmaceuticals Transportmaterial
Metals Agriculturalproducts
Machinery
2009 2010 2011 2012
1792%
21
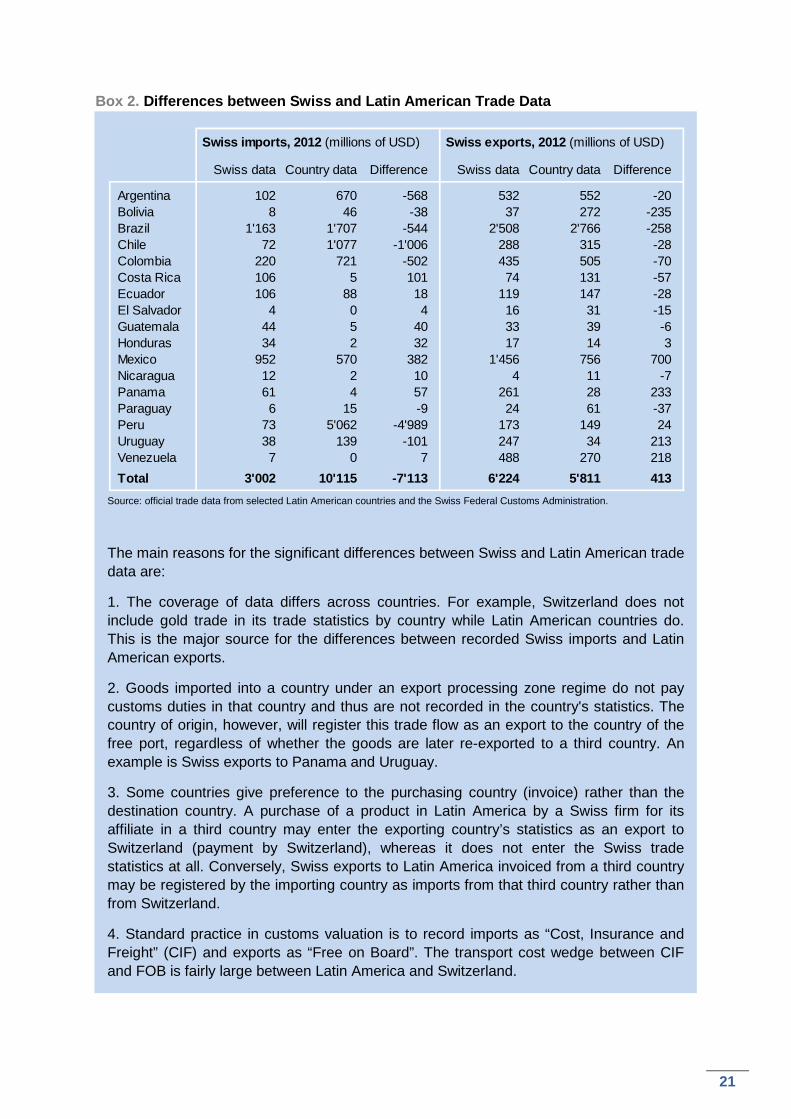
Box 2. Differences between Swiss and Latin American Trade Data
Source: official trade data from selected Latin American countries and the Swiss Federal Customs Administration.
The main reasons for the significant differences between Swiss and Latin American trade data are:
1. The coverage of data differs across countries. For example, Switzerland does not include gold trade in its trade statistics by country while Latin American countries do. This is the major source for the differences between recorded Swiss imports and Latin American exports.
2. Goods imported into a country under an export processing zone regime do not pay customs duties in that country and thus are not recorded in the country's statistics. The country of origin, however, will register this trade flow as an export to the country of the free port, regardless of whether the goods are later re-exported to a third country. An example is Swiss exports to Panama and Uruguay.
3. Some countries give preference to the purchasing country (invoice) rather than the destination country. A purchase of a product in Latin America by a Swiss firm for its affiliate in a third country may enter the exporting country’s statistics as an export to Switzerland (payment by Switzerland), whereas it does not enter the Swiss trade statistics at all. Conversely, Swiss exports to Latin America invoiced from a third country may be registered by the importing country as imports from that third country rather than from Switzerland.
4. Standard practice in customs valuation is to record imports as “Cost, Insurance and Freight” (CIF) and exports as “Free on Board”. The transport cost wedge between CIF and FOB is fairly large between Latin America and Switzerland.
Swiss imports, 2012 (millions of USD) Swiss exports, 2012 (millions of USD)
Swiss data Country data Difference Swiss data Country data Difference
Argentina 102 670 -568 532 552 -20Bolivia 8 46 -38 37 272 -235Brazil 1'163 1'707 -544 2'508 2'766 -258Chile 72 1'077 -1'006 288 315 -28Colombia 220 721 -502 435 505 -70Costa Rica 106 5 101 74 131 -57Ecuador 106 88 18 119 147 -28El Salvador 4 0 4 16 31 -15Guatemala 44 5 40 33 39 -6Honduras 34 2 32 17 14 3Mexico 952 570 382 1'456 756 700Nicaragua 12 2 10 4 11 -7Panama 61 4 57 261 28 233Paraguay 6 15 -9 24 61 -37Peru 73 5'062 -4'989 173 149 24Uruguay 38 139 -101 247 34 213Venezuela 7 0 7 488 270 218Total 3'002 10'115 -7'113 6'224 5'811 413
22
3.2. Swiss Foreign Direct Investment
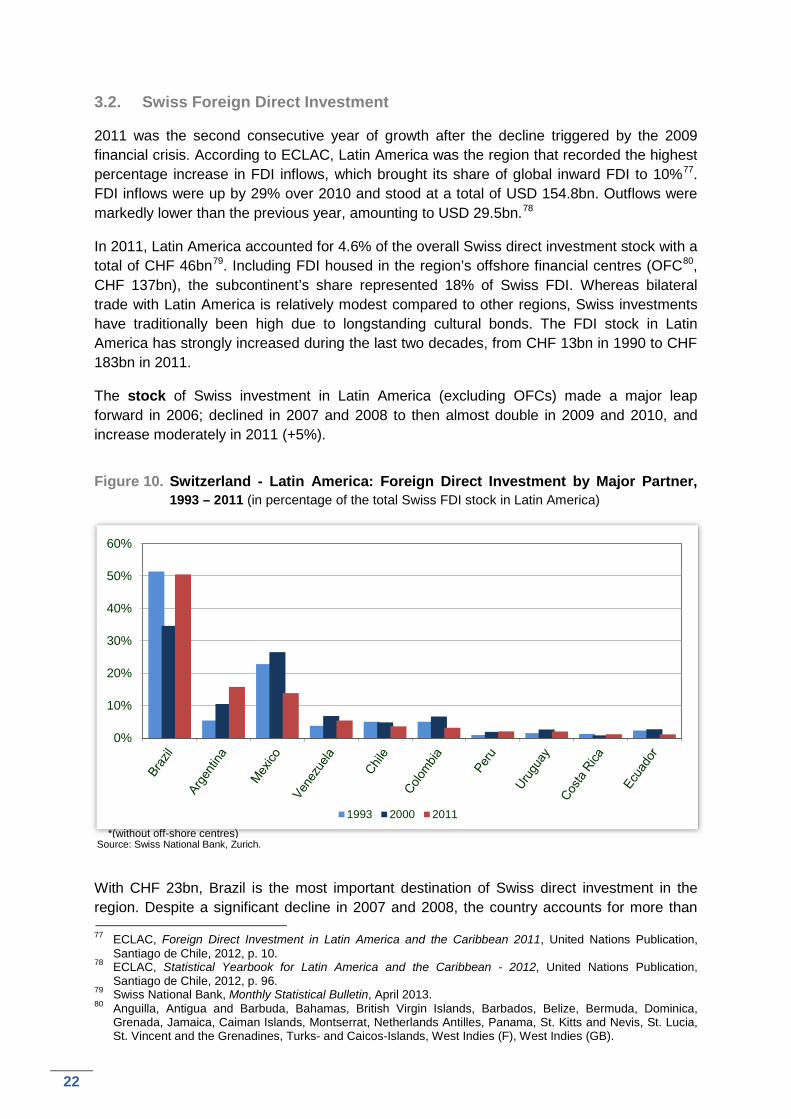
2011 was the second consecutive year of growth after the decline triggered by the 2009 financial crisis. According to ECLAC, Latin America was the region that recorded the highest percentage increase in FDI inflows, which brought its share of global inward FDI to 10%77. FDI inflows were up by 29% over 2010 and stood at a total of USD 154.8bn. Outflows were markedly lower than the previous year, amounting to USD 29.5bn.78 In 2011, Latin America accounted for 4.6% of the overall Swiss direct investment stock with a total of CHF 46bn79. Including FDI housed in the region’s offshore financial centres (OFC80, CHF 137bn), the subcontinent’s share represented 18% of Swiss FDI. Whereas bilateral trade with Latin America is relatively modest compared to other regions, Swiss investments have traditionally been high due to longstanding cultural bonds. The FDI stock in Latin America has strongly increased during the last two decades, from CHF 13bn in 1990 to CHF 183bn in 2011. The stock of Swiss investment in Latin America (excluding OFCs) made a major leap forward in 2006; declined in 2007 and 2008 to then almost double in 2009 and 2010, and increase moderately in 2011 (+5%).
Figure 10. Switzerland - Latin America: Foreign Direct Investment by Major Partner,
1993 – 2011 (in percentage of the total Swiss FDI stock in Latin America)
Source: Swiss National Bank, Zurich.
With CHF 23bn, Brazil is the most important destination of Swiss direct investment in the region. Despite a significant decline in 2007 and 2008, the country accounts for more than 77 ECLAC, Foreign Direct Investment in Latin America and the Caribbean 2011, United Nations Publication,
Santiago de Chile, 2012, p. 10. 78 ECLAC, Statistical Yearbook for Latin America and the Caribbean - 2012, United Nations Publication,
Santiago de Chile, 2012, p. 96. 79 Swiss National Bank, Monthly Statistical Bulletin, April 2013. 80 Anguilla, Antigua and Barbuda, Bahamas, British Virgin Islands, Barbados, Belize, Bermuda, Dominica,
Grenada, Jamaica, Caiman Islands, Montserrat, Netherlands Antilles, Panama, St. Kitts and Nevis, St. Lucia, St. Vincent and the Grenadines, Turks- and Caicos-Islands, West Indies (F), West Indies (GB).
0%
10%
20%
30%
40%
50%
60%
1993 2000 2011*(without off-shore centres)
23
half of overall Swiss FDI in Latin America. It is followed by Argentina and Mexico with shares of 16% and 14%, respectively. Swiss FDI stock in Argentina tripled from 2010 to 2011 due to acquisitions in the services sector and the establishment of holding societies in Switzerland owning firms in the South American country. Ranking fourth, Venezuela continues to attract large Swiss investments despite serious economic challenges, e.g. firms are facing considerable difficulties in order to obtain hard currency to repatriate royalty fees and profits. Figure 10 presents the main destination countries for Swiss FDI in Latin America. In 2011, Argentina (CHF 1.5bn) and Brazil (CHF 1.1bn) attracted significant Swiss FDI flows. They were followed by Venezuela (CHF 378 million), Chile (CHF 358 million) and Mexico (CHF 278 million).81 The region’s OFCs also registered major financial inflows, amounting to CHF 908 million. After stagnating during the late eighties, the number of Swiss firms’ employees in Latin America rose considerably during the early nineties, from 90’700 in 1990 to 144’700 in 1995. It has again been increasing constantly throughout the last decade, from 160’200 in 2002 to 277’100 in 2011. This clearly reflects the vigorous growth of Latin American economies from 2002 onwards. Swiss firms employ most staff in Brazil (117'000), Mexico (45'400), Argentina (23'800), Chile (16'900), Colombia (16’700) and Venezuela (12'300). Following the Venezuelan nationalization of foreign cement firms in 2008, Holcim reached an arrangement with the government covering the terms for compensation. Nevertheless, in March 2009, Holcim had to file a complaint at the International Centre for Settlement of Investment Disputes (ICSID) in Washington on the basis of the Swiss-Venezuelan Agreement on the Protection and Promotion of Investments. In September 2010, both Parties reached a settlement and the first 40% of the total compensation (USD 650 million) was paid. The remaining 60% are to be settled until 2014. The first two out of four instalments were paid to Holcim in 2011 and 2012.
3.3. Bilateral Economic Agreements and Joint Economic Commissions
Agreements on the Promotion and Reciprocal Protection of Investments
Switzerland has signed over 120 agreements on the promotion and reciprocal protection of investments (BITs). After Germany and China, Switzerland has the world's third largest network of such agreements. Switzerland has concluded BITs with most Latin American countries, except with the Bahamas, Belize, Bermuda, Grenada, Haiti and Surinam. The agreement with Trinidad and Tobago, signed in 2010, entered into force in May 2012. The agreements negotiated with Brazil (1994) and Guyana (2005) have yet to enter into force. The Brazilian authorities have indicated that their parliament will not adopt the 14 BITs signed with various countries worldwide, including Switzerland. Major reservations refer to the differentiated treatment of foreign and local investors. In addition to access to the domestic court system, foreign investors would be able to bring a claim before an
81 Swiss National Bank, Monthly Statistical Bulletin, March 2013. For methodological aspects of data on stock
and flows, see www.snb.ch/ext/stats/fdi/pdf/en/Direktinvestitionen.book.pdf, p. 18.
24
international arbitration panel. Brazil objects that this would effectively discriminate domestic investors. The BIT with Guyana has been ratified by Switzerland and awaits the completion of legal procedures in Guyana. Double Taxation Agreements
Switzerland presently has agreements on the avoidance of double taxation (DTAs) with Argentina (on a provisional basis), Chile, Colombia, Ecuador, Jamaica, Mexico, Trinidad and Tobago, Uruguay and Venezuela. On March 13th, 2009, the Federal Council announced the intention of Switzerland to adopt the OECD standard on administrative assistance in tax matters in accordance with Art. 26 of the OECD Model Tax Convention. Existing DTAs with Mexico and Colombia have been revised to include the OECD’s administrative assistance standard, which allows the exchange of information in individual cases where a specific and justified request has been made. The new provisions entered into force in 2010 with Mexico and were initialled in August 2011 with Colombia. The DTAs signed with Uruguay (October 2010) and Peru (September 2012) included the OECD standard from the outset. The list of the economic agreements between Switzerland and Latin America is presented in the Appendix, Table A.8., page 43.
Box 3. The Aim of BITs and DTAs
Bilateral Investment Agreements: Their aim is to secure non-discriminatory treatment for investors after establishment – the so-called national treatment regime – to guarantee free transfer of funds (e.g. returns, repayment of loans, royalties, sale of investment) and to deal with compensation in case of dispossession. Double Taxation Agreements: Their objective is to overcome obstacles for cross-border economic transactions, yet they also govern administrative assistance in tax matters. They reduce the overall tax burden and encourage foreign investment by alleviating or eliminating double taxation. These two instruments establish legal frameworks that contribute to increase a country's attractiveness for foreign investors.
Joint Economic Commissions
Switzerland has established about 20 economic commissions worldwide in order to strengthen bilateral economic relations and discuss specific problems with partner countries. Talks also cover pluri- and multilateral issues and usually include representatives of the private sector. In Latin America, Switzerland has instituted such commissions with Argentina, Brazil, Chile82, Mexico and Venezuela. In 2012, meetings took place with Brazil and Chile. 82 The official denomination of the commission is Bilateral Economic Dialogue. See Appendix A.10.
25
Swiss-Brazilian Joint Commission on Trade and Economic Relations On September 18th, 2012, the fourth Swiss-Brazilian Joint Commission on Trade and Economic Relations took place in Brasilia. The delegations of Switzerland and Brazil were headed respectively by Ambassador Eric Martin, Delegate of the Federal Council for Trade Agreements, SECO, and Ambassador Valdemar Carneiro Leão, Undersecretary of Economic Affairs and Finance of the Ministry of Foreign Affairs. An extensive exchange of views first took place at the governmental level. Discussions covered the economic situations in both countries, regional integration, WTO and G20 issues, the protection of intellectual property, negotiations on a double taxation agreement as well as EFTA's interest to deepen trade relations with Mercosur. In a second session, open to representatives of the private sector, several concrete trade and investment issues in the areas of pharmaceutical regulation, government procurement and taxation were discussed. Swiss-Chilean Bilateral Economic Dialogue
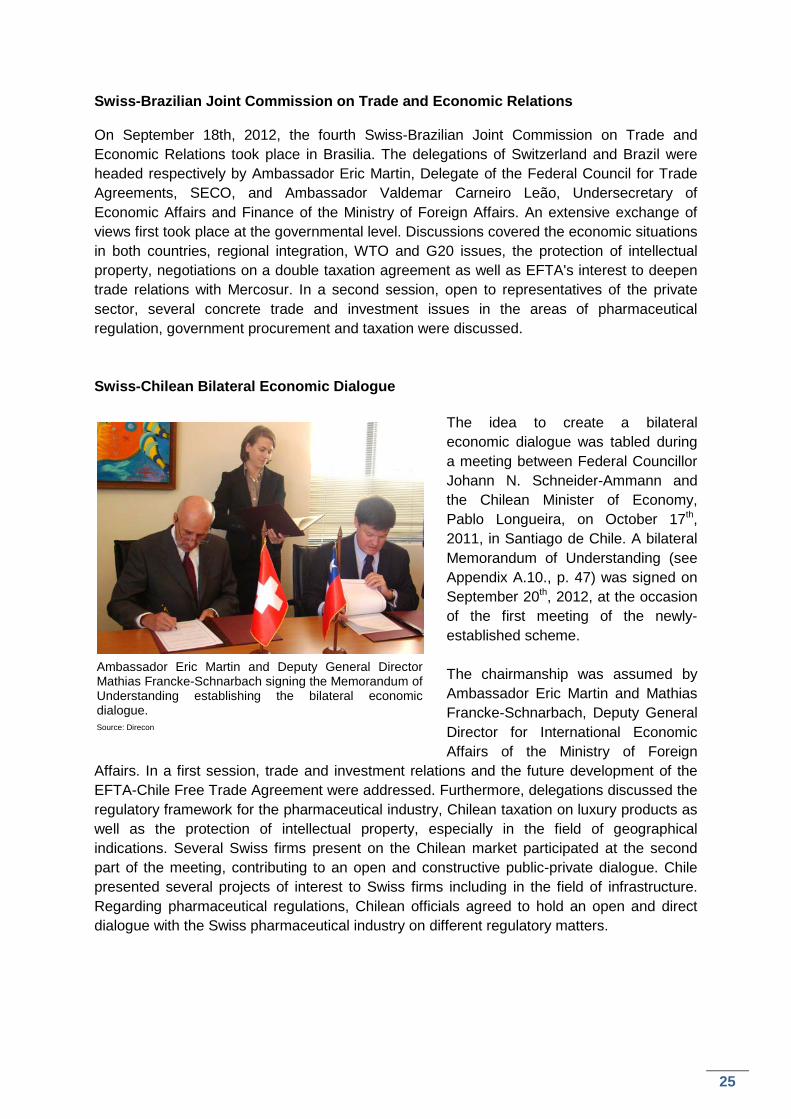
The idea to create a bilateral economic dialogue was tabled during a meeting between Federal Councillor Johann N. Schneider-Ammann and the Chilean Minister of Economy, Pablo Longueira, on October 17th, 2011, in Santiago de Chile. A bilateral Memorandum of Understanding (see Appendix A.10., p. 47) was signed on September 20th, 2012, at the occasion of the first meeting of the newly-established scheme. The chairmanship was assumed by Ambassador Eric Martin and Mathias Francke-Schnarbach, Deputy General Director for International Economic Affairs of the Ministry of Foreign
Affairs. In a first session, trade and investment relations and the future development of the EFTA-Chile Free Trade Agreement were addressed. Furthermore, delegations discussed the regulatory framework for the pharmaceutical industry, Chilean taxation on luxury products as well as the protection of intellectual property, especially in the field of geographical indications. Several Swiss firms present on the Chilean market participated at the second part of the meeting, contributing to an open and constructive public-private dialogue. Chile presented several projects of interest to Swiss firms including in the field of infrastructure. Regarding pharmaceutical regulations, Chilean officials agreed to hold an open and direct dialogue with the Swiss pharmaceutical industry on different regulatory matters.
Ambassador Eric Martin and Deputy General Director Mathias Francke-Schnarbach signing the Memorandum of Understanding establishing the bilateral economic dialogue. Source: Direcon
26
3.4. Latin American Integration : Recent Developments
Inter-American Integration
Recent developments regarding economic integration across the Americas: United States – Colombia: An FTA was signed in November 2006 and approved by the Colombian Congress in June 2007. On April 7th, 2011, both governments announced a comprehensive "Action Plan Related to Labour Rights", aimed at enhancing labour rights in Colombia. In October 2011, the U.S. Congress then approved the FTA, which entered into force on May 15th, 2012.83 United States – Panama: The bilateral FTA was ratified by the Panamanian National Assembly only weeks after the signature in June 2007. The U.S. Congress passed the Agreement together with the U.S.-Colombia FTA in October 2011 after addressing concerns regarding tax transparency and labour rights in Panama.84 The agreement entered into force on October 31th, 2012. Panama – Peru: The FTA, signed on May 25th, 2011, entered into force on May 1st, 2012. Peru – Mexico: An FTA, signed on April 6th, 2011, entered into force on February 1st, 2012. Mercosur: Venezuela’s full membership to the largest economic bloc in Latin America became effective on August 12th, 2012. Mercosur and Venezuela’s heads of state had already signed the accession protocol for the latter in 2006; yet, the ratification had been blocked by the parliament of Paraguay. After the impeachment of the Paraguayan President Fernando Lugo in June 2012, Paraguay was temporarily excluded from the bloc and the remaining heads of state made the Venezuelan accession effective. At Mercosur's regular summit in Brasilia on December 7th, 2012, Mercosur heads of state and President Evo Morales signed the accession protocol for Bolivia. Latin American Integration Association LAIA85: On February 2nd, 2012, Panama became the thirteenth LAIA-member86. Nicaragua is currently completing different requisites to join the group as well. With the signature of the Montevideo Treaty in 1980, LAIA has replaced the former Latin American Free Trade Association, ALALC, founded in 1960. LAIA has close to 500 million inhabitants.
83 www.ustr.gov/uscolombiatpa 84 www.ustr.gov/trade-agreements/free-trade-agreements/panama-tpa: On April 18th, 2011, a Tax Information
Exchange Agreement (TIEA) went into effect between the United States and Panama. The TIEA will permit the two countries to improve their tax information exchange transparency networks globally. The government of Panama has also taken a series of legislative and administrative actions to further strengthen its labour laws and enforcement.
85 Asociación Latinoamericana de Integración, ALADI in Spanish. 86 Argentina, Bolivia, Brazil, Chile, Ecuador, Colombia, Cuba, Mexico, Panama, Paraguay, Peru, Uruguay and
Venezuela.
27
Integration between Europe and Latin America
Latin America – European Union: The seventh bi-annual summit between the EU and Latin America and the Caribbean (LAC) took place in Santiago de Chile on January 26th - 27th, 2013.87 Its theme was “investments for a sustainable development”. For the first time, the subcontinent appeared under the recently created institutional framework “Community of Latin American and Caribbean States” CELAC. At the following CELAC summit, Cuba took over the one-year presidency from Chile. Prior to the summit, on January 24th, the 6th EU-Brazil summit was held in Brasilia. The strategic partnership between the two parties includes a dialogue on political and economic affairs, trade, science and technology, regional cooperation and cultural matters. A business summit took place on the sidelines of the meeting.
Mercosur – European Union: The long-stalled negotiations for an association agreement between Mercosur and the EU were re-launched during the EU-LAC Madrid summit in May 2010. Major difficulties remain in opening up the EU's agricultural market and Mercosur's industry, services and government procurement. Differences in rules on investment and intellectual property persist. In October 2012, the parties concluded their 9th round of negotiations. They are currently preparing their respective market access offers.88 Andean Community (CAN) – European Union: In June 2007, the two parties launched negotiations for a comprehensive association agreement. Differences among CAN members led the EU to negotiate only with Colombia and Peru. Negotiations were concluded in February 2010 and the agreement was signed on June 26th, 2012. With Peru, it is provisionally applied since March 1st, 2013; Colombia is expected to implement it later this year.
Central America89 – European Union: Negotiations for an association agreement between the EU and the six Central American States were concluded on May 18th, 2010, during the EU-LAC summit in Madrid. The European Commission approved the text in October 2010, the EU Parliament in December 2012. The trade pillar of the agreement might become provisionally applicable as of mid-2013.90
EFTA91 – Latin America
Mercosur – EFTA: EFTA and Mercosur Member States signed a Declaration on co-operation in 2000. Within this framework, discussions are held on ways to further deepen economic relations. The third meeting of the EFTA-Mercosur Joint Committee took place in Montevideo in September 2011; the parties exchanged information on economic developments, investment and trade relations, and compared their respective free trade policies. During recent contacts, no further progress could be achieved.
87 www.eeas.europa.eu/lac 88 http://ec.europa.eu/trade/creating-opportunities/bilateral-relations/regions/mercosur/, accessed on March 26th,
2013. 89 Costa Rica, El Salvador, Guatemala, Honduras, Nicaragua and Panama. Since 2010, Panama has taken part
in the negotiations as a full member rather than just as an observer. 90 http://trade.ec.europa.eu/doclib/docs/2006/december/tradoc_118238.pdf, accessed on March 22nd, 2013. 91 The members of the European Free Trade Association (EFTA) are: Iceland, Liechtenstein, Norway and
Switzerland.
28
Central America – EFTA: In November 2010, EFTA ministers decided to strengthen economic relations with Central America. After an exploratory meeting in Panama City in March 2011, FTA negotiations were launched with Panama, Costa Rica and Honduras in November 2011. They were concluded with Costa Rica and Panama in December 2012. The signing ceremony is foreseen for June 2013. Negotiations with Guatemala registered further progress in February 2013 but are not yet concluded. Integration between the rest of the world and Latin America
Chile – Malaysia: An FTA, signed on November 13th, 2010, entered into force on April 18th, 2012.
Peru – Japan: An FTA, signed on May 31th, 2011, entered into force on March 1st, 2012.
Switzerland is following closely Latin America’s integration and the region’s economic relations with Europe and the rest of the world. Priorities to further strengthen economic ties with specific partners will be influenced by the European Union's new FTAs and the interests of Latin American countries.
Box 4. SECO Publications on FTAs with Latin America
In Latin America, EFTA has so far concluded comprehensive FTAs with Mexico, Chile, Colombia and Peru. In order to facilitate access to the respective markets for small- and medium-sized Swiss Enterprises, SECO has issued several publications:
Doing Business in Mexico was first published in 2002 and its second edition was released in July 2009.92 After a brief review of Mexico’s politics, geography and economy, the FTA’s benefits regarding market access (goods, services, government procurement) and improvement of rules (investment, competition, intellectual property) are highlighted. The last two chapters deal with key elements to facilitate market entry into Mexico and with opportunities and risks for Swiss firms.
EFTA-Chile Free Trade Agreement: Opportunities for Swiss Business is similar in structure and content to the aforementioned publication on Mexico. First released in 2005, a second edition was published in March 2008.93
EFTA-Colombia Free Trade Agreement: Opportunities for Swiss Business was published in May 2011 commemorating the 100th anniversary of formal diplomatic relations between Switzerland and Colombia and marking the entry into force of the FTA.94
92 This publication is available in a pdf form at: www.seco.admin.ch/dokumentation/publikation/00008/00023/02431/index.html?lang=en 93 This publication is available in a pdf form at: www.seco.admin.ch/dokumentation/publikation/00008/00023/01817/index.html?lang=en 94 This publication is available in a pdf form at: www.seco.admin.ch/dokumentation/publikation/00008/04654/index.html?lang=en
29
3.5. Economic Development Cooperation of SECO: The Case of Colombia
This section provides a short overview of SECO’s economic development cooperation in Colombia; projects are financed on a grant basis for a total of approximately CHF 15 million per year. Peru benefits from a similar contribution. Colombia has been a priority country of Switzerland's economic cooperation since 2009. In 2012, the Swiss Parliament passed a bill for the framework credit on international cooperation covering 2013-2016 and confirmed Colombia to remain one of eight95 focus countries of SECO. For the implementation of its program SECO has defined three thematic priorities:
1) Strengthen public institutions to improve service delivery and governance: SECO supports a more efficient, effective and transparent management of public sector resources. The aim is to improve management capacities in government institutions at all levels and to put in place effective tools for planning and coordinating policies, programs and projects with a view to ensuring stable, transparent and accountable public finances and addressing imbalances in service delivery at the national and sub-national level.
2) Enhance international competitiveness to achieve more inclusive growth and
reduce income inequalities: SECO supports Colombia’s efforts to maintain sustained, dynamic and inclusive growth. The aim is to address constraints to private sector growth such as low factor productivity, insufficient financial market deepening and barriers to market access. The creation of a more conducive business environment will provide for more enterprises to enter the formal sector. This will reinforce SME competitiveness gains and further improve their access to finance and foreign markets. For growth to be sustainable, resources need to be used more efficiently and biodiversity preserved. Adequate entrepreneurial skills and good corporate governance will further increase sustainability and positively impact on economic performance. In order for growth to be more inclusive, this pillar will also encompass measures to promote innovation and the diversification of the economy to unlock new drivers for growth. Reforms of the productive structure coupled with improved vocational training are crucial for inclusive growth to generate more good-quality jobs and develop a more equitable society.
3) Strengthen climate change risk management and sustainable urban
development to mitigate the impact of climate change and manage rapidly growing urbanization: SECO supports Colombia in its effort to strengthen climate risk management policies and information systems, focusing on climate-relevant information and data. This will allow Colombia to define and implement specific environmental policies and strategies in alignment with the priorities of the National Disaster Risk Management System, in terms of both adaptation to and mitigation of climate change. SECO also supports Colombia’s efforts to strengthen sustainable urban management. Key areas of support include integrated waste management systems including sanitation, urban planning, sustainable construction and housing,
95 Together with Egypt, Ghana, Indonesia, Peru, South Africa, Tunisia and Vietnam.
30
as well as the promotion of renewable/non-conventional energies. SECO’s support in this field is aimed at contributing to the gradual emergence of greener and more sustainable cities over time, factoring in climate change risks and vulnerabilities.
The following section presents a concrete project of SECO in Colombia. Towards a Green Building Code
Since 2011, the Swiss Economic Cooperation supports an ambitious regulatory reform in the field of green building in Colombia, which aims at promoting energy efficiency and natural resources savings, as well as appropriate waste management in the housing sector. As a direct result of this project, significant reductions of energy consumption of buildings are expected.
In Colombia, extreme events and climatic variability – the two previous rainy seasons led to the destruction of more than 500’000 homes – have very problematic consequences in terms of sustainable management of water resources and therefore for the generation and distribution of electricity in urban areas, where 70% of the population live and where consumption of energy could grow by 60% in the coming years. Various projections show that construction activity will increase significantly in coming years and that most of that growth will be in the social housing sector.
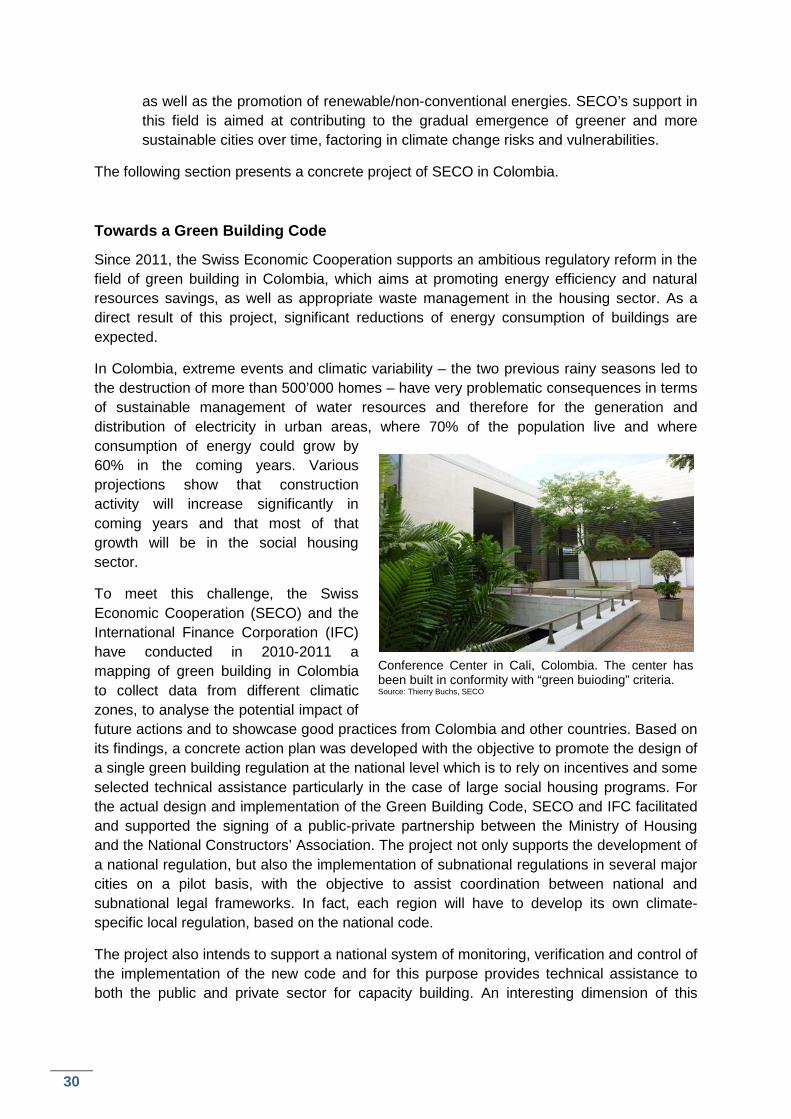
To meet this challenge, the Swiss Economic Cooperation (SECO) and the International Finance Corporation (IFC) have conducted in 2010-2011 a mapping of green building in Colombia to collect data from different climatic zones, to analyse the potential impact of future actions and to showcase good practices from Colombia and other countries. Based on its findings, a concrete action plan was developed with the objective to promote the design of a single green building regulation at the national level which is to rely on incentives and some selected technical assistance particularly in the case of large social housing programs. For the actual design and implementation of the Green Building Code, SECO and IFC facilitated and supported the signing of a public-private partnership between the Ministry of Housing and the National Constructors’ Association. The project not only supports the development of a national regulation, but also the implementation of subnational regulations in several major cities on a pilot basis, with the objective to assist coordination between national and subnational legal frameworks. In fact, each region will have to develop its own climate-specific local regulation, based on the national code.
The project also intends to support a national system of monitoring, verification and control of the implementation of the new code and for this purpose provides technical assistance to both the public and private sector for capacity building. An interesting dimension of this
Conference Center in Cali, Colombia. The center has been built in conformity with “green buioding” criteria. Source: Thierry Buchs, SECO
31
project is the possible replication of the “green mortgage program96” that was implemented with great success in Mexico in recent years. Another key component of the project is adequate communication and information in order to generate knowledge for market actors, particularly at the end-user level. This is crucial to generate significant demand for sustainable buildings in the long term.
This project is perfectly in line with SECO’s country strategy for Colombia – in particular with the strengthening of climate change risk management and sustainable urban development. The project also helps Switzerland to profile its pioneer experience in the field of green building. As early as 1998, for example, Switzerland began to develop sustainable building standards with a focus on energy efficiency (MINERGIE). Currently, the country counts about 20'000 buildings in conformity with energy efficiency standards, this is more than 2’200 buildings per million inhabitants. The Swiss experience is also very rich as regards interaction between the federal or subnational levels, with several programs certifying that a city has an integrated efficient energy management. The city of Lausanne, for example, was the first in Europe to achieve this certification in 1996. Today, Switzerland has certified over 250 such cities.
Thus, by supporting the green building project in Colombia, Switzerland intends to contribute significantly to the sustainable environmental management of Colombian cities and to substantial energy and water savings, in particular for social housing, a key priority of the current Colombian government.
3.6. Bilateral Visits in 2012 and Early 2013
Panama City, March 22nd – 23rd, 2012: Philippe G. Nell, Minister, Head of the Americas Unit at SECO met the Minister of Trade and Industry Ricardo Quijano. They discussed the ongoing negotiations for an EFTA-Central America FTA, Panama’s FTA with the US as well as the fraudulent use of the term “Swiss” in Panama. With the Minister of Economy and Finance, Frank George De Lima, talks focused on the challenges to implement FATCA97 and issues linked with the dollarization and the competitiveness of Panama’s economy. Guatemala City, March 26th, 2012: In Guatemala, Philippe G. Nell met representatives of the Inter-American Development Bank IDB, the Bank of Guatemala and the Ministry of Economy. During the meetings, the business environment, reform priorities as well as negotiations for an FTA between EFTA and Central America were discussed. San Salvador, March 27th – 28th, 2012: In El Salvador, Philippe G. Nell had meetings with the Minister of Foreign Affairs, Hugo Martínez, the Minister of Economy, Héctor Dada Hirezi, representatives of the IDB and the World Bank as well as with Swiss business representatives. The economic perspectives of the country as well as negotiations for an
96 More information on the project :
www.ecpamericas.org/data/files/Initiatives/energy_efficiency_working_group/eewg_mexico_workshop/infonavit.pdf
97 FATCA: Foreign account tax compliance act; provisions of the US fiscal code referring to the transfer by foreign financial institutions to US authorities of information on bank and other accounts held by American citizens abroad.
32
FTA between EFTA and Central America were at the core of discussions. Due to resource constraints, the country expressed the wish to join the negotiations only at a later stage. Tegucigalpa, March 29th – 30th, 2012: During Philippe G. Nell's visit in Honduras, talks at the Ministry of Foreign Affairs and the Honduran Private Enterprise Council focused on the negotiations for an FTA with Central America. The economic and social situation was discussed with representatives of the Central Bank, the World Bank, the IDB as well as the U.S. Embassy. Brasilia, São Paulo, May 4th – 8th, 2012: During Philippe G. Nell's visit in Brasilia, meetings took place at the Foreign Ministry, the Ministry for Development, Industry and Foreign Trade, the Brazilian Trade and Investment Promotion Agency APEX as well as the IMF. Talks mainly focused on the preparation of the upcoming Joint Economic Commission and relations between EFTA and Mercosur. M. Nell also participated at the newly-established Financial Dialogue between the State Secretariat for International Financial Matters and the Brazilian Ministry of Finance. São Paulo, Brasilia, September 17th - 19th, 2012: Ambassador Eric Martin, Head of Bilateral Economic Relations at SECO, visited Brazil together with a Swiss business delegation. In São Paulo, they met with members of the Swiss-Brazilian Chamber of Commerce (Swisscam) as well as with representatives of the German-Brazilian Chamber of Commerce. Important challenges were identified in the areas of double taxation, pharmaceutical regulation and the insurance market. Meetings in São Paulo allowed preparing discussions of the fourth meeting of the Swiss-Brazilian Joint Commission (see page 25) in Brasilia the following day. In the capital, the delegation also met the director of the National Industry Confederation, José Augusto Fernandes. Discussions mainly covered double taxation and EFTA’s interest in free trade relations with MERCOSUR. Other meetings included the Brazilian branch office of ECLAC, the national development bank BNDES as well as Fundação Getulio Vargas. Santiago de Chile, September 20th, 2012: In Chile, Ambassador Eric Martin signed a Memorandum of Understanding establishing the Bilateral Economic Dialogue and co-chaired the first meeting with Mathias Francke-Schnarbach, Deputy General Director for International Economic Affairs of the Ministry of Foreign Affairs (see page 25). He also met ECLAC Executive Secretary Alicia Bárcena and discussed Latin America’s economic situation, structural
Ambassador Eric Martin with José Luis Silva Martinot, Minister of Foreign Commerce and Tourism (1st right), Marisol Espinoza Cruz, First Vice President of Peru (4th left), Swiss Ambassador to Peru Anne-Pascale Krauer-Müller (2nd right) and representatives of Swiss Chambers of Commerce in Latin America Source: Swisschamperu
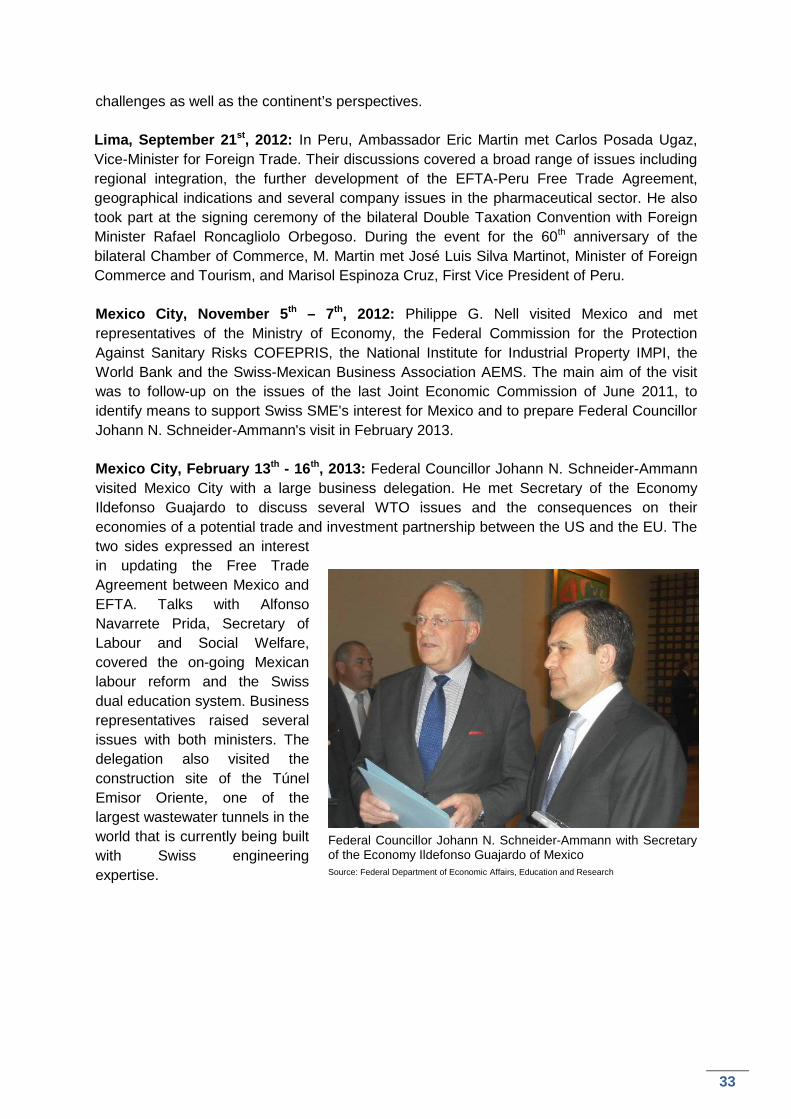
33
challenges as well as the continent’s perspectives. Lima, September 21st, 2012: In Peru, Ambassador Eric Martin met Carlos Posada Ugaz, Vice-Minister for Foreign Trade. Their discussions covered a broad range of issues including regional integration, the further development of the EFTA-Peru Free Trade Agreement, geographical indications and several company issues in the pharmaceutical sector. He also took part at the signing ceremony of the bilateral Double Taxation Convention with Foreign Minister Rafael Roncagliolo Orbegoso. During the event for the 60th anniversary of the bilateral Chamber of Commerce, M. Martin met José Luis Silva Martinot, Minister of Foreign Commerce and Tourism, and Marisol Espinoza Cruz, First Vice President of Peru. Mexico City, November 5th – 7th, 2012: Philippe G. Nell visited Mexico and met representatives of the Ministry of Economy, the Federal Commission for the Protection Against Sanitary Risks COFEPRIS, the National Institute for Industrial Property IMPI, the World Bank and the Swiss-Mexican Business Association AEMS. The main aim of the visit was to follow-up on the issues of the last Joint Economic Commission of June 2011, to identify means to support Swiss SME's interest for Mexico and to prepare Federal Councillor Johann N. Schneider-Ammann's visit in February 2013. Mexico City, February 13th - 16th, 2013: Federal Councillor Johann N. Schneider-Ammann visited Mexico City with a large business delegation. He met Secretary of the Economy Ildefonso Guajardo to discuss several WTO issues and the consequences on their economies of a potential trade and investment partnership between the US and the EU. The two sides expressed an interest in updating the Free Trade Agreement between Mexico and EFTA. Talks with Alfonso Navarrete Prida, Secretary of Labour and Social Welfare, covered the on-going Mexican labour reform and the Swiss dual education system. Business representatives raised several issues with both ministers. The delegation also visited the construction site of the Túnel Emisor Oriente, one of the largest wastewater tunnels in the world that is currently being built with Swiss engineering expertise.
Federal Councillor Johann N. Schneider-Ammann with Secretary of the Economy Ildefonso Guajardo of Mexico Source: Federal Department of Economic Affairs, Education and Research
34
Appendix
Tables and Figures
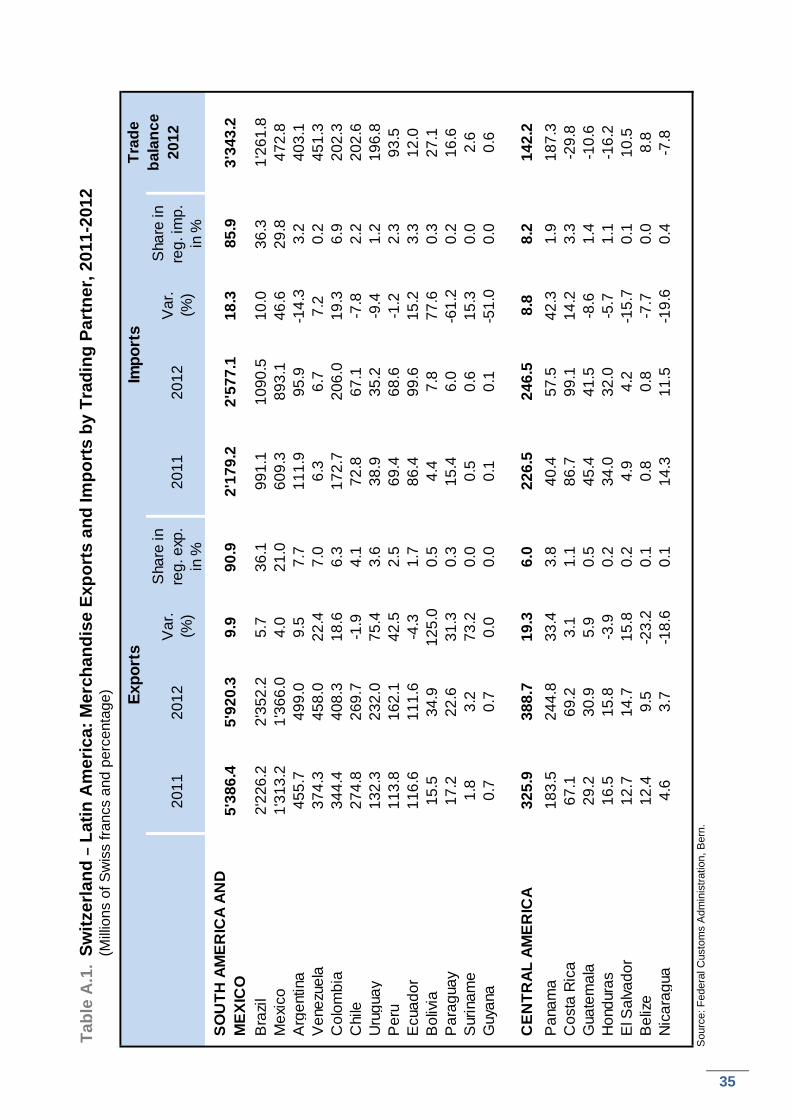
35
Ex
port
sIm
port
s
2011
2012
Var
. (%
)
Sha
re in
re
g. e
xp.
in %
2011
2012
Var
. (%
)
Sha
re in
re
g. im
p.in
%SO
UTH
AM
ERIC
A AN
D
MEX
ICO
5'38
6.4
5'92
0.3
9.9
90.9
2'17
9.2
2'57
7.1
18.3
85.9
3'34
3.2
Bra
zil
2'22
6.2
2'35
2.2
5.7
36.1
991.
110
90.5
10.0
36.3
1'26
1.8
Mex
ico
1'31
3.2
1'36
6.0
4.0
21.0
609.
389
3.1
46.6
29.8
472.
8A
rgen
tina
455.
749
9.0
9.5
7.7
111.
995
.9-1
4.3
3.2
403.
1V
enez
uela
374.
345
8.0
22.4
7.0
6.3
6.7
7.2
0.2
451.
3C
olom
bia
344.
440
8.3
18.6
6.3
172.
720
6.0
19.3
6.9
202.
3C
hile
274.
826
9.7
-1.9
4.1
72.8
67.1
-7.8
2.2
202.
6U
rugu
ay13
2.3
232.
075
.43.
638
.935
.2-9
.41.
219
6.8
Per
u11
3.8
162.
142
.52.
569
.468
.6-1
.22.
393
.5E
cuad
or11
6.6
111.
6-4
.31.
786
.499
.615
.23.
312
.0B
oliv
ia15
.534
.912
5.0
0.5
4.4
7.8
77.6
0.3
27.1
Par
agua
y17
.222
.631
.30.
315
.46.
0-6
1.2
0.2
16.6
Sur
inam
e1.
83.
273
.20.
00.
50.
615
.30.
02.
6G
uyan
a0.
70.
70.
00.
00.
10.
1-5
1.0
0.0
0.6
CEN
TRAL
AM
ERIC
A32
5.9
388.
719
.36.
022
6.5
246.
58.
88.
214
2.2
Pan
ama
183.
524
4.8
33.4
3.8
40.4
57.5
42.3
1.9
187.
3C
osta
Ric
a67
.169
.23.
11.
186
.799
.114
.23.
3-2
9.8
Gua
tem
ala
29.2
30.9
5.9
0.5
45.4
41.5
-8.6
1.4
-10.
6H
ondu
ras
16.5
15.8
-3.9
0.2
34.0
32.0
-5.7
1.1
-16.
2E
l Sal
vado
r12
.714
.715
.80.
24.
94.
2-1
5.7
0.1
10.5
Bel
ize
12.4
9.5
-23.
20.
10.
80.
8-7
.70.
08.
8N
icar
agua
4.6
3.7
-18.
60.
114
.311
.5-1
9.6
0.4
-7.8
Trad
eba
lanc
e20
12
Sou
rce:
Fed
eral
Cus
tom
s A
dmin
istra
tion,
Ber
n.
Switz
erla
nd –
Lat
in A
mer
ica:
Mer
chan
dise
Exp
orts
and
Impo
rts
by T
radi
ng P
artn
er, 2
011-
2012
(M
illion
s of
Sw
iss
franc
s an
d pe
rcen
tage
) Ta
ble
A.1
.
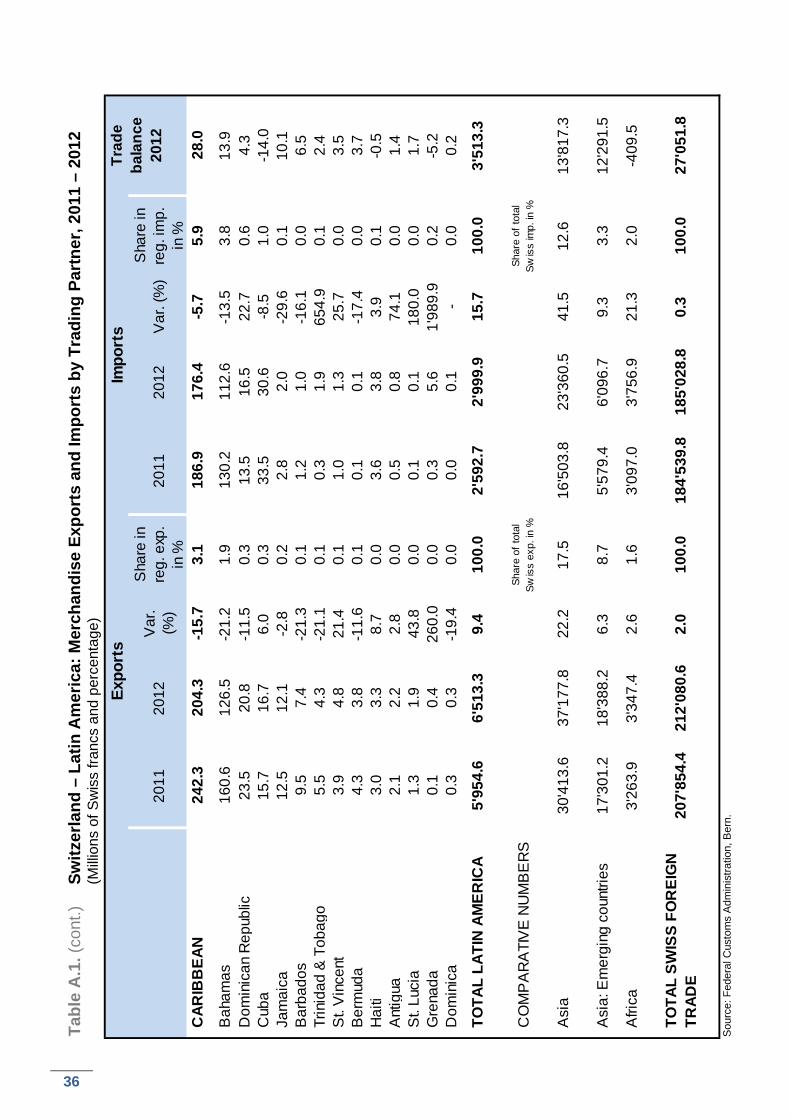
36
Ex
port
sIm
port
s
2011
2012
Var
. (%
)
Sha
re in
re
g. e
xp.
in %
2011
2012
Var
. (%
)S
hare
in
reg.
imp.
in %
CAR
IBB
EAN
242.
320
4.3
-15.
73.
118
6.9
176.
4-5
.75.
928
.0
Bah
amas
160.
612
6.5
-21.
21.
913
0.2
112.
6-1
3.5
3.8
13.9
Dom
inic
an R
epub
lic23
.520
.8-1
1.5
0.3
13.5
16.5
22.7
0.6
4.3
Cub
a15
.716
.76.
00.
333
.530
.6-8
.51.
0-1
4.0
Jam
aica
12.5
12.1
-2.8
0.2
2.8
2.0
-29.
60.
110
.1B
arba
dos
9.5
7.4
-21.
30.
11.
21.
0-1
6.1
0.0
6.5
Trin
idad
& T
obag
o5.
54.
3-2
1.1
0.1
0.3
1.9
654.
90.
12.
4S
t. V
ince
nt3.
94.
821
.40.
11.
01.
325
.70.
03.
5B
erm
uda
4.3
3.8
-11.
60.
10.
10.
1-1
7.4
0.0
3.7
Hai
ti3.
03.
38.
70.
03.
63.
83.
90.
1-0
.5A
ntig
ua2.
12.
22.
80.
00.
50.
874
.10.
01.
4S
t. Lu
cia
1.3
1.9
43.8
0.0
0.1
0.1
180.
00.
01.
7G
rena
da0.
10.
426
0.0
0.0
0.3
5.6
1'98
9.9
0.2
-5.2
Dom
inic
a0.
30.
3-1
9.4
0.0
0.0
0.1
-0.
00.
2
TO
TAL
LATI
N A
MER
ICA
5'95
4.6
6'51
3.3
9.4
100.
02'
592.
72'
999.
915
.710
0.0
3'51
3.3
CO
MP
AR
ATI
VE
NU
MB
ER
SSh
are
of to
tal
Swis
s ex
p. in
%
Shar
e of
tota
lSw
iss
imp.
in %
Asi
a30
'413
.637
'177
.822
.217
.516
'503
.823
'360
.541
.512
.613
'817
.3
Asi
a: E
mer
ging
cou
ntrie
s17
'301
.218
'388
.26.
38.
75'
579.
46'
096.
79.
33.
312
'291
.5
Afri
ca3'
263.
93'
347.
42.
61.
63'
097.
03'
756.
921
.32.
0-4
09.5
TOTA
L SW
ISS
FOR
EIG
N
TRAD
E20
7'85
4.4
212'
080.
62.
010
0.0
184'
539.
818
5'02
8.8
0.3
100.
027
'051
.8
Trad
eba
lanc
e20
12
Sw
itzer
land
– L
atin
Am
eric
a: M
erch
andi
se E
xpor
ts a
nd Im
port
s by
Tra
ding
Par
tner
, 201
1 –
2012
(M
illion
s of
Sw
iss
franc
s an
d pe
rcen
tage
) Ta
ble
A.1
. (co
nt.)
Sou
rce:
Fed
eral
Cus
tom
s A
dmin
istra
tion,
Ber
n.
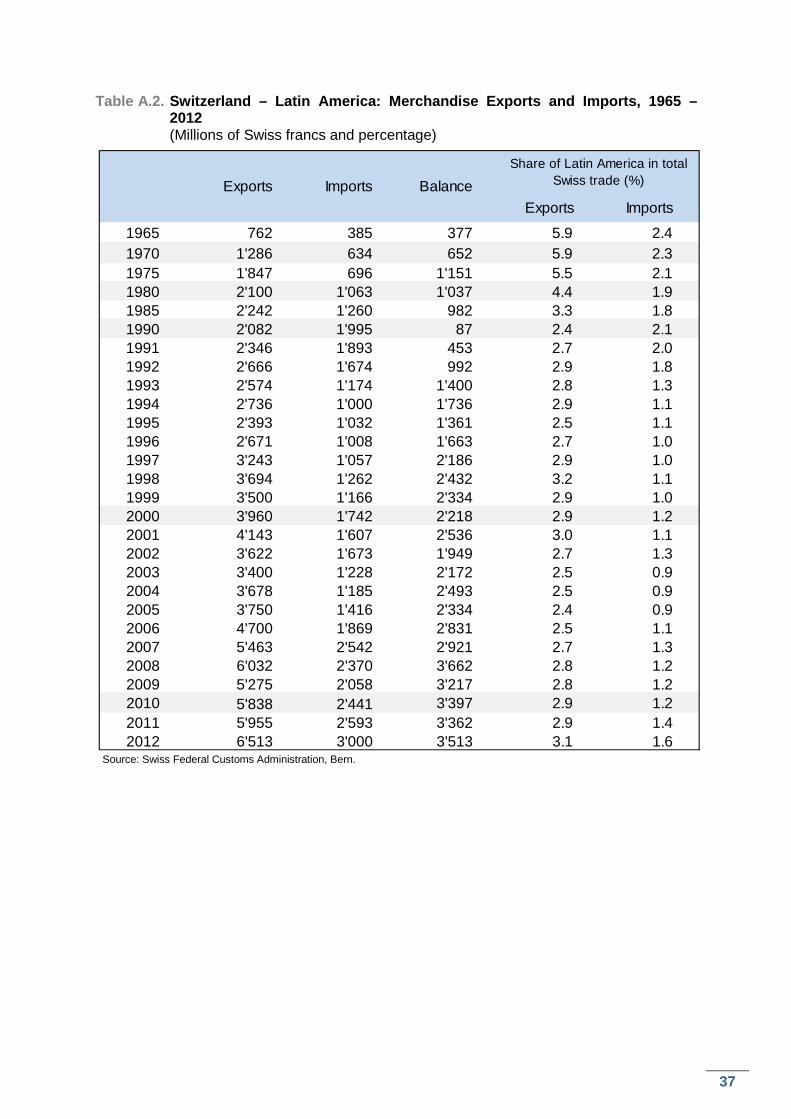
37
Table A.2. Switzerland – Latin America: Merchandise Exports and Imports, 1965 – 2012
(Millions of Swiss francs and percentage)
Source: Swiss Federal Customs Administration, Bern.
Share of Latin America in total Swiss trade (%)
Exports Imports
1965 762 385 377 5.9 2.41970 1'286 634 652 5.9 2.31975 1'847 696 1'151 5.5 2.11980 2'100 1'063 1'037 4.4 1.91985 2'242 1'260 982 3.3 1.81990 2'082 1'995 87 2.4 2.11991 2'346 1'893 453 2.7 2.01992 2'666 1'674 992 2.9 1.81993 2'574 1'174 1'400 2.8 1.31994 2'736 1'000 1'736 2.9 1.11995 2'393 1'032 1'361 2.5 1.11996 2'671 1'008 1'663 2.7 1.01997 3'243 1'057 2'186 2.9 1.01998 3'694 1'262 2'432 3.2 1.11999 3'500 1'166 2'334 2.9 1.02000 3'960 1'742 2'218 2.9 1.22001 4'143 1'607 2'536 3.0 1.12002 3'622 1'673 1'949 2.7 1.32003 3'400 1'228 2'172 2.5 0.92004 3'678 1'185 2'493 2.5 0.92005 3'750 1'416 2'334 2.4 0.92006 4'700 1'869 2'831 2.5 1.12007 5'463 2'542 2'921 2.7 1.32008 6'032 2'370 3'662 2.8 1.22009 5'275 2'058 3'217 2.8 1.22010 5'838 2'441 3'397 2.9 1.22011 5'955 2'593 3'362 2.9 1.42012 6'513 3'000 3'513 3.1 1.6
BalanceExports Imports
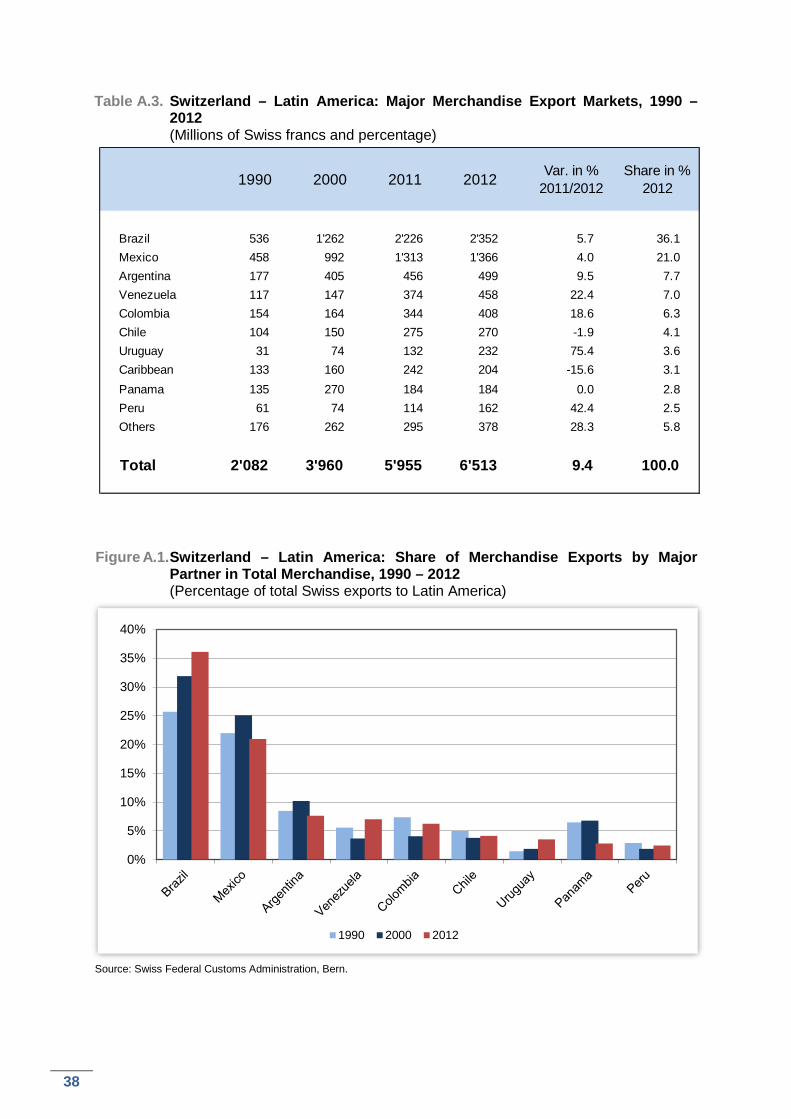
38
Table A.3. Switzerland – Latin America: Major Merchandise Export Markets, 1990 – 2012
(Millions of Swiss francs and percentage)
Figure A.1. Switzerland – Latin America: Share of Merchandise Exports by Major
Partner in Total Merchandise, 1990 – 2012 (Percentage of total Swiss exports to Latin America)
Source: Swiss Federal Customs Administration, Bern.
1990 2000 2011 2012 Share in %2012
Brazil 536 1'262 2'226 2'352 5.7 36.1Mexico 458 992 1'313 1'366 4.0 21.0Argentina 177 405 456 499 9.5 7.7Venezuela 117 147 374 458 22.4 7.0Colombia 154 164 344 408 18.6 6.3Chile 104 150 275 270 -1.9 4.1Uruguay 31 74 132 232 75.4 3.6Caribbean 133 160 242 204 -15.6 3.1Panama 135 270 184 184 0.0 2.8Peru 61 74 114 162 42.4 2.5Others 176 262 295 378 28.3 5.8
Total 2'082 3'960 5'955 6'513 9.4 100.0
Var. in %2011/2012
0%
5%
10%
15%
20%
25%
30%
35%
40%
1990 2000 2012
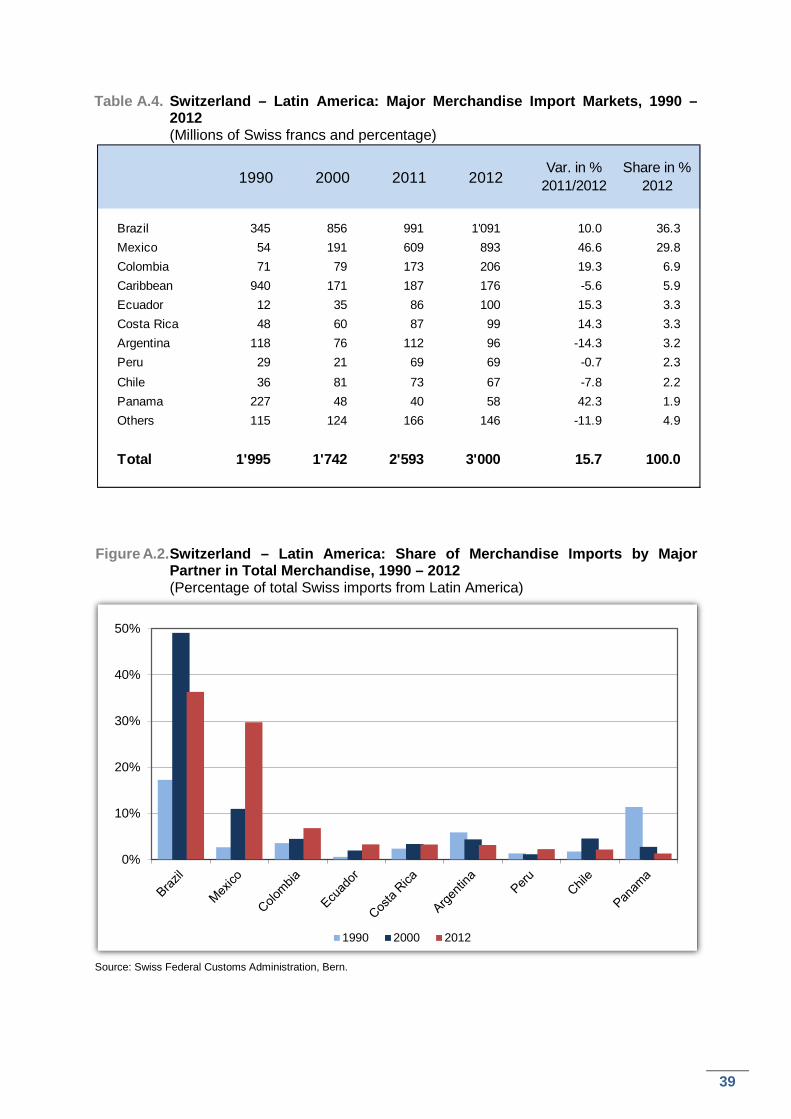
39
Table A.4. Switzerland – Latin America: Major Merchandise Import Markets, 1990 – 2012
(Millions of Swiss francs and percentage)
Figure A.2. Switzerland – Latin America: Share of Merchandise Imports by Major
Partner in Total Merchandise, 1990 – 2012 (Percentage of total Swiss imports from Latin America)
Source: Swiss Federal Customs Administration, Bern.
1990 2000 2011 2012
Brazil 345 856 991 1'091 10.0 36.3Mexico 54 191 609 893 46.6 29.8Colombia 71 79 173 206 19.3 6.9Caribbean 940 171 187 176 -5.6 5.9Ecuador 12 35 86 100 15.3 3.3Costa Rica 48 60 87 99 14.3 3.3Argentina 118 76 112 96 -14.3 3.2Peru 29 21 69 69 -0.7 2.3Chile 36 81 73 67 -7.8 2.2Panama 227 48 40 58 42.3 1.9Others 115 124 166 146 -11.9 4.9
Total 1'995 1'742 2'593 3'000 15.7 100.0
Var. in %2011/2012
Share in %2012
0%
10%
20%
30%
40%
50%
1990 2000 2012
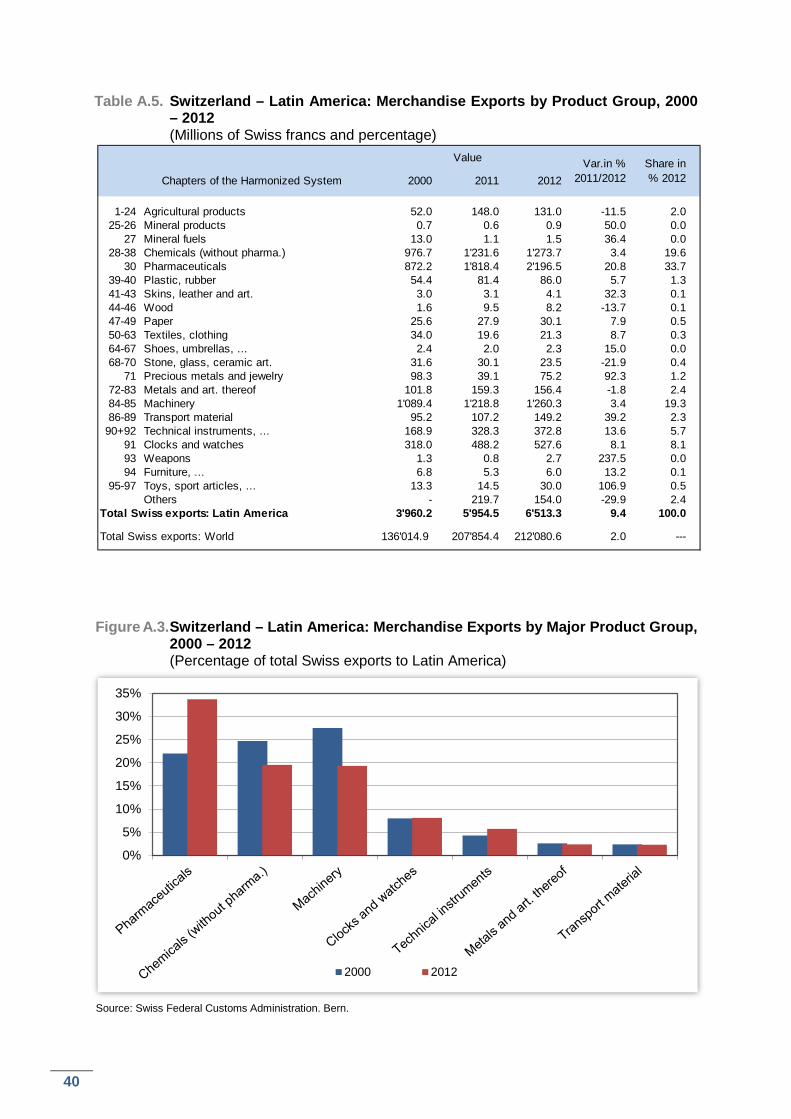
40
Table A.5. Switzerland – Latin America: Merchandise Exports by Product Group, 2000 – 2012
(Millions of Swiss francs and percentage)
Figure A.3. Switzerland – Latin America: Merchandise Exports by Major Product Group,
2000 – 2012 (Percentage of total Swiss exports to Latin America)
Source: Swiss Federal Customs Administration. Bern.
Value
Chapters of the Harmonized System 2000 2011 2012
1-24 Agricultural products 52.0 148.0 131.0 -11.5 2.025-26 Mineral products 0.7 0.6 0.9 50.0 0.0 27 Mineral fuels 13.0 1.1 1.5 36.4 0.0
28-38 Chemicals (without pharma.) 976.7 1'231.6 1'273.7 3.4 19.6 30 Pharmaceuticals 872.2 1'818.4 2'196.5 20.8 33.7
39-40 Plastic, rubber 54.4 81.4 86.0 5.7 1.341-43 Skins, leather and art. 3.0 3.1 4.1 32.3 0.144-46 Wood 1.6 9.5 8.2 -13.7 0.147-49 Paper 25.6 27.9 30.1 7.9 0.550-63 Textiles, clothing 34.0 19.6 21.3 8.7 0.364-67 Shoes, umbrellas, ... 2.4 2.0 2.3 15.0 0.068-70 Stone, glass, ceramic art. 31.6 30.1 23.5 -21.9 0.4 71 Precious metals and jewelry 98.3 39.1 75.2 92.3 1.2
72-83 Metals and art. thereof 101.8 159.3 156.4 -1.8 2.484-85 Machinery 1'089.4 1'218.8 1'260.3 3.4 19.386-89 Transport material 95.2 107.2 149.2 39.2 2.3
90+92 Technical instruments, ... 168.9 328.3 372.8 13.6 5.7 91 Clocks and watches 318.0 488.2 527.6 8.1 8.1 93 Weapons 1.3 0.8 2.7 237.5 0.0 94 Furniture, ... 6.8 5.3 6.0 13.2 0.1
95-97 Toys, sport articles, ... 13.3 14.5 30.0 106.9 0.5 Others - 219.7 154.0 -29.9 2.4
Total Swiss exports: Latin America 3'960.2 5'954.5 6'513.3 9.4 100.0
Total Swiss exports: World 136'014.9 207'854.4 212'080.6 2.0 ---
Var.in % 2011/2012
Share in % 2012
0%
5%
10%
15%
20%
25%
30%
35%
2000 2012
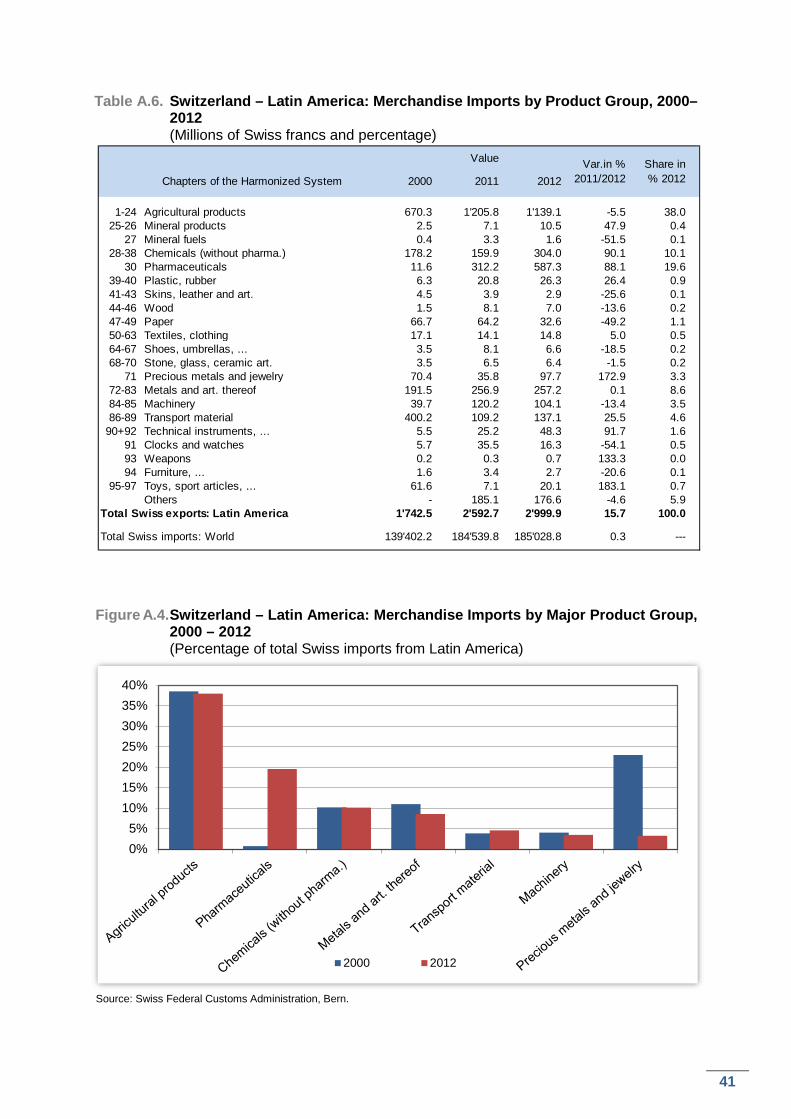
41
Table A.6. Switzerland – Latin America: Merchandise Imports by Product Group, 2000–2012
(Millions of Swiss francs and percentage)
Figure A.4. Switzerland – Latin America: Merchandise Imports by Major Product Group,
2000 – 2012 (Percentage of total Swiss imports from Latin America)
Source: Swiss Federal Customs Administration, Bern.
Value
Chapters of the Harmonized System 2000 2011 2012
1-24 Agricultural products 670.3 1'205.8 1'139.1 -5.5 38.025-26 Mineral products 2.5 7.1 10.5 47.9 0.4 27 Mineral fuels 0.4 3.3 1.6 -51.5 0.1
28-38 Chemicals (without pharma.) 178.2 159.9 304.0 90.1 10.1 30 Pharmaceuticals 11.6 312.2 587.3 88.1 19.6
39-40 Plastic, rubber 6.3 20.8 26.3 26.4 0.941-43 Skins, leather and art. 4.5 3.9 2.9 -25.6 0.144-46 Wood 1.5 8.1 7.0 -13.6 0.247-49 Paper 66.7 64.2 32.6 -49.2 1.150-63 Textiles, clothing 17.1 14.1 14.8 5.0 0.564-67 Shoes, umbrellas, ... 3.5 8.1 6.6 -18.5 0.268-70 Stone, glass, ceramic art. 3.5 6.5 6.4 -1.5 0.2 71 Precious metals and jewelry 70.4 35.8 97.7 172.9 3.3
72-83 Metals and art. thereof 191.5 256.9 257.2 0.1 8.684-85 Machinery 39.7 120.2 104.1 -13.4 3.586-89 Transport material 400.2 109.2 137.1 25.5 4.6
90+92 Technical instruments, ... 5.5 25.2 48.3 91.7 1.6 91 Clocks and watches 5.7 35.5 16.3 -54.1 0.5 93 Weapons 0.2 0.3 0.7 133.3 0.0 94 Furniture, ... 1.6 3.4 2.7 -20.6 0.1
95-97 Toys, sport articles, ... 61.6 7.1 20.1 183.1 0.7 Others - 185.1 176.6 -4.6 5.9
Total Swiss exports: Latin America 1'742.5 2'592.7 2'999.9 15.7 100.0
Total Swiss imports: World 139'402.2 184'539.8 185'028.8 0.3 ---
Var.in % 2011/2012
Share in % 2012
0%5%
10%15%20%25%30%35%40%
2000 2012
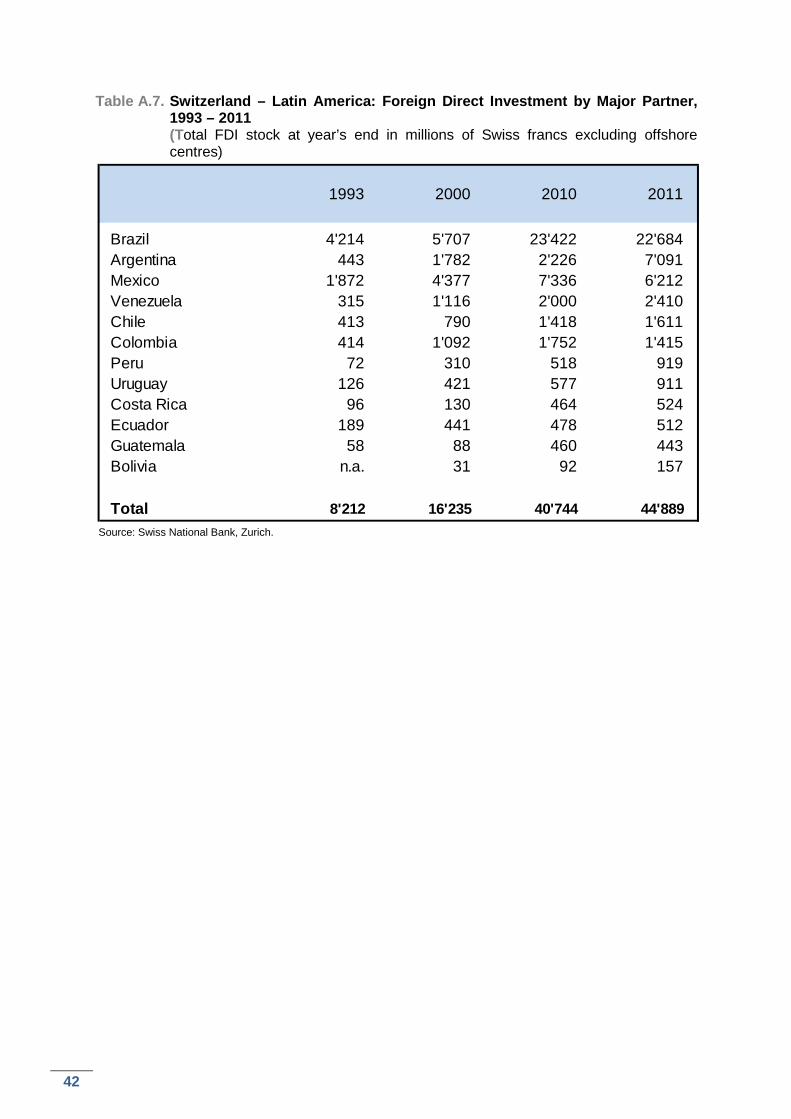
42
Table A.7. Switzerland – Latin America: Foreign Direct Investment by Major Partner, 1993 – 2011
(Total FDI stock at year’s end in millions of Swiss francs excluding offshore centres)
Source: Swiss National Bank, Zurich.
Brazil 4'214 5'707 23'422 22'684 Argentina 443 1'782 2'226 7'091 Mexico 1'872 4'377 7'336 6'212 Venezuela 315 1'116 2'000 2'410 Chile 413 790 1'418 1'611 Colombia 414 1'092 1'752 1'415 Peru 72 310 518 919 Uruguay 126 421 577 911 Costa Rica 96 130 464 524 Ecuador 189 441 478 512 Guatemala 58 88 460 443 Bolivia n.a. 31 92 157
Total 8'212 16'235 40'744 44'889
1993 2000 20112010
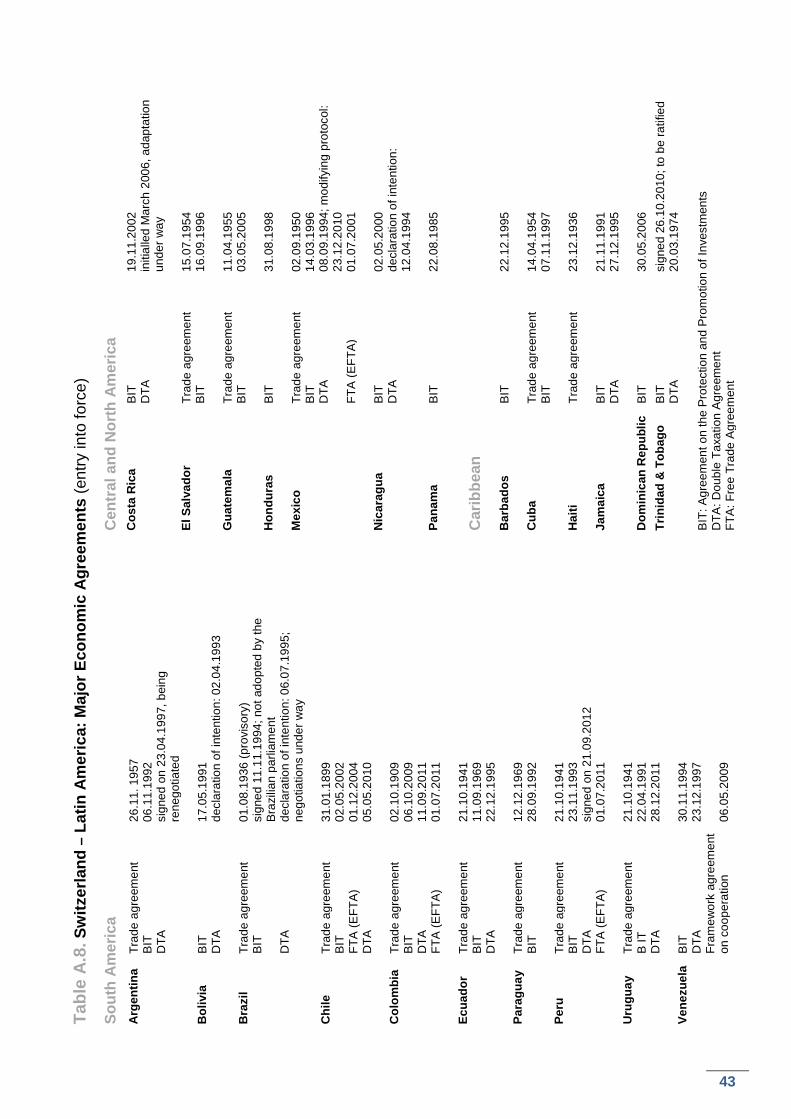
43
Table 4
Tabl
e A
.8. S
witz
erla
nd –
Lat
in A
mer
ica:
Maj
or E
cono
mic
Agr
eem
ents
(ent
ry in
to fo
rce)
Sout
h A
mer
ica
Arge
ntin
a Tr
ade
agre
emen
t 26
.11.
195
7
B
IT
06.1
1.19
92
D
TA
sign
ed o
n 23
.04.
1997
, bei
ng
rene
gotia
ted
B
oliv
ia
BIT
17
.05.
1991
DTA
de
clar
atio
n of
inte
ntio
n: 0
2.04
.199
3
Bra
zil
Trad
e ag
reem
ent
01.0
8.19
36 (p
rovi
sory
)
BIT
si
gned
11.
11.1
994;
not
ado
pted
by
the
Bra
zilia
n pa
rliam
ent
D
TA
decl
arat
ion
of in
tent
ion:
06.
07.1
995;
ne
gotia
tions
und
er w
ay
C
hile
Tr
ade
agre
emen
t 31
.01.
1899
BIT
02
.05.
2002
FTA
(EFT
A)
01.1
2.20
04
D
TA
05.0
5.20
10
C
olom
bia
Trad
e ag
reem
ent
02.1
0.19
09
B
IT
06.1
0.20
09
D
TA
11.0
9.20
11
FT
A (E
FTA
) 01
.07.
2011
Ecua
dor
Trad
e ag
reem
ent
21.1
0.19
41
B
IT
11.0
9.19
69
D
TA
22.1
2.19
95
Pa
ragu
ay
Trad
e ag
reem
ent
12.1
2.19
69
B
IT
28.0
9.19
92
Pe
ru
Trad
e ag
reem
ent
21.1
0.19
41
B
IT
23.1
1.19
93
D
TA
sign
ed o
n 21
.09.
2012
FTA
(EFT
A)
01.0
7.20
11
U
rugu
ay
Trad
e ag
reem
ent
21.1
0.19
41
B
IT
22.0
4.19
91
D
TA
28.1
2.20
11
Ve
nezu
ela
BIT
30
.11.
1994
DTA
23
.12.
1997
Fram
ewor
k ag
reem
ent
on c
oope
ratio
n 06
.05.
2009
Cen
tral
and
Nor
th A
mer
ica
Cos
ta R
ica
BIT
19
.11.
2002
DTA
in
itial
led
Mar
ch 2
006,
ada
ptat
ion
unde
r way
El
Sal
vado
r Tr
ade
agre
emen
t 15
.07.
1954
BIT
16
.09.
1996
Gua
tem
ala
Trad
e ag
reem
ent
11.0
4.19
55
B
IT
03.0
5.20
05
H
ondu
ras
BIT
31
.08.
1998
Mex
ico
Trad
e ag
reem
ent
02.0
9.19
50
B
IT
14.0
3.19
96
D
TA
08.0
9.19
94; m
odify
ing
prot
ocol
: 23
.12.
2010
FTA
(EFT
A)
01.0
7.20
01
N
icar
agua
B
IT
02.0
5.20
00
D
TA
decl
arat
ion
of in
tent
ion:
12
.04.
1994
Pana
ma
BIT
22
.08.
1985
Car
ibbe
an
Bar
bado
s B
IT
22.1
2.19
95
C
uba
Trad
e ag
reem
ent
14.0
4.19
54
B
IT
07.1
1.19
97
H
aiti
Trad
e ag
reem
ent
23.1
2.19
36
Ja
mai
ca
BIT
21
.11.
1991
DTA
27
.12.
1995
Dom
inic
an R
epub
lic
BIT
30
.05.
2006
Trin
idad
& T
obag
o B
IT
DTA
si
gned
26.
10.2
010;
to b
e ra
tifie
d
20.0
3.19
74
BIT
: Agr
eem
ent o
n th
e P
rote
ctio
n an
d P
rom
otio
n of
Inve
stm
ents
D
TA: D
oubl
e Ta
xatio
n A
gree
men
t FT
A: F
ree
Trad
e A
gree
men
t
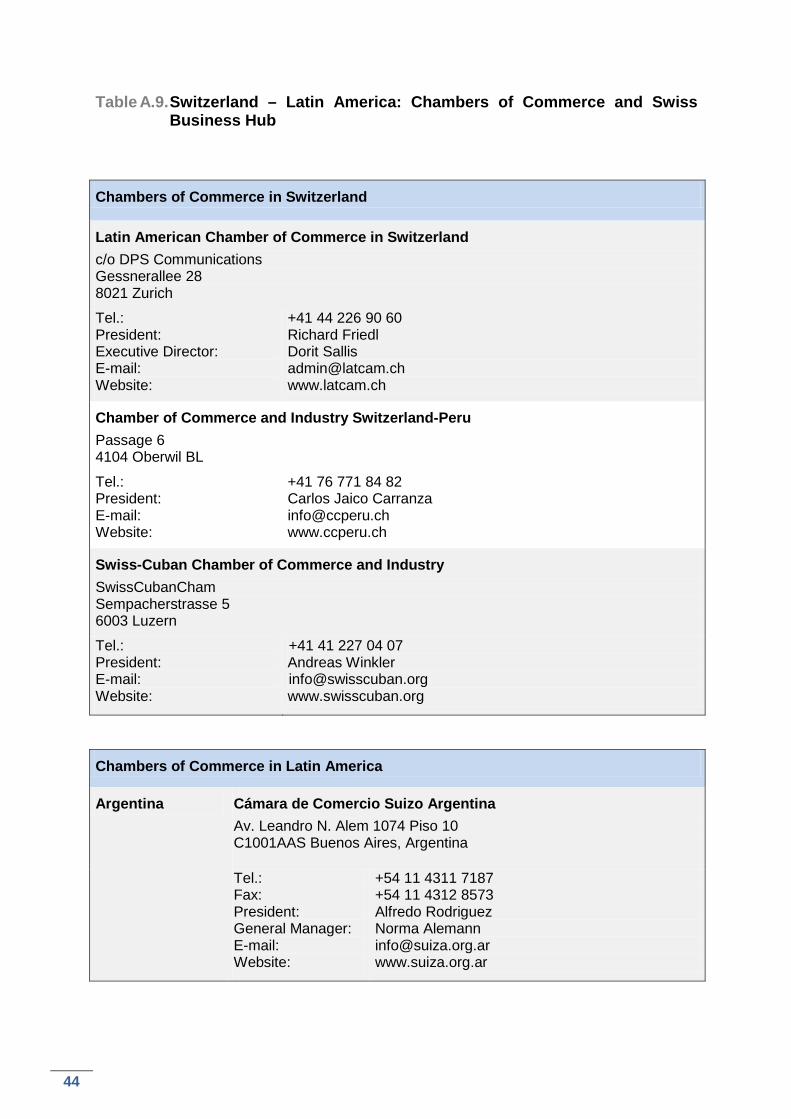
44
Table A.9. Switzerland – Latin America: Chambers of Commerce and Swiss Business Hub
Chambers of Commerce in Switzerland
Latin American Chamber of Commerce in Switzerland c/o DPS Communications Gessnerallee 28 8021 Zurich
Tel.: President: Executive Director: E-mail: Website:
+41 44 226 90 60 Richard Friedl Dorit Sallis [email protected] www.latcam.ch
Chamber of Commerce and Industry Switzerland-Peru Passage 6 4104 Oberwil BL
Tel.: President: E-mail: Website:
+41 76 771 84 82 Carlos Jaico Carranza [email protected] www.ccperu.ch
Swiss-Cuban Chamber of Commerce and Industry SwissCubanCham Sempacherstrasse 5 6003 Luzern
Tel.: President: E-mail: Website:
+41 41 227 04 07 Andreas Winkler [email protected] www.swisscuban.org
Chambers of Commerce in Latin America
Argentina Cámara de Comercio Suizo Argentina Av. Leandro N. Alem 1074 Piso 10 C1001AAS Buenos Aires, Argentina
Tel.: Fax: President: General Manager: E-mail: Website:
+54 11 4311 7187 +54 11 4312 8573 Alfredo Rodriguez Norma Alemann [email protected] www.suiza.org.ar
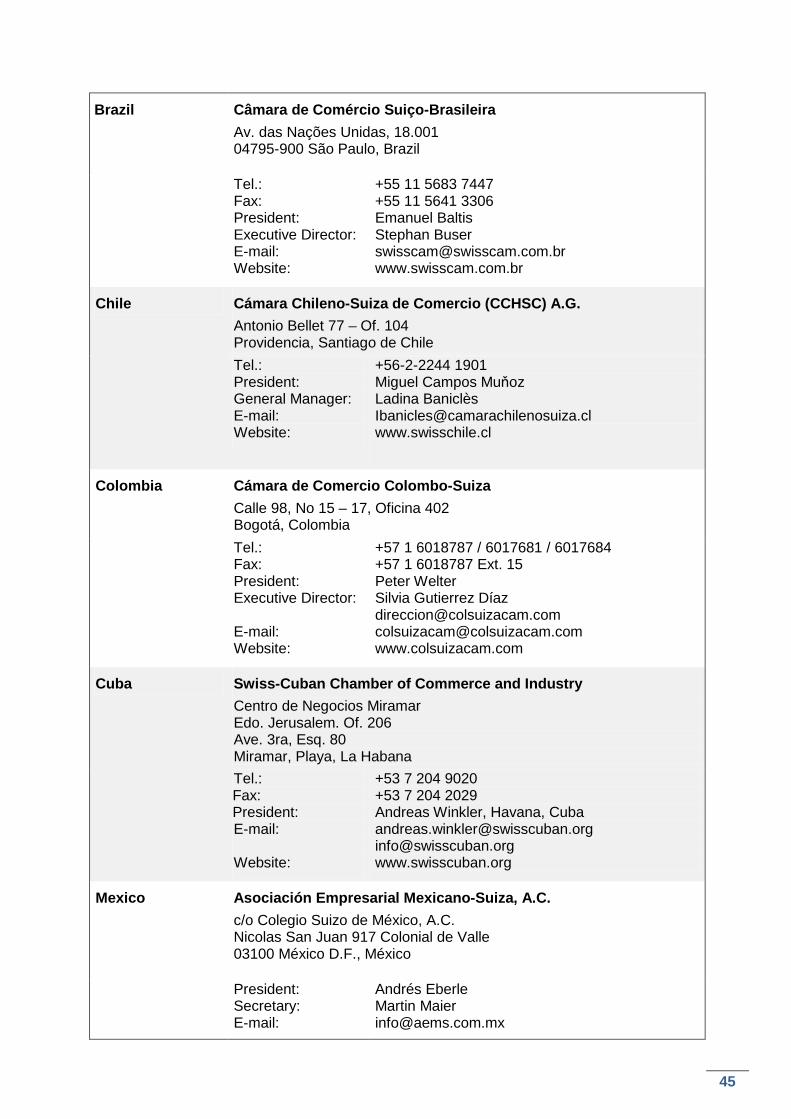
45
Brazil Câmara de Comércio Suiço-Brasileira Av. das Nações Unidas, 18.001 04795-900 São Paulo, Brazil
Tel.: Fax: President: Executive Director: E-mail: Website:
+55 11 5683 7447 +55 11 5641 3306 Emanuel Baltis Stephan Buser [email protected] www.swisscam.com.br
Chile Cámara Chileno-Suiza de Comercio (CCHSC) A.G. Antonio Bellet 77 – Of. 104 Providencia, Santiago de Chile Tel.: President: General Manager: E-mail: Website:
+56-2-2244 1901 Miguel Campos Muňoz Ladina Baniclès [email protected] www.swisschile.cl
Colombia Cámara de Comercio Colombo-Suiza Calle 98, No 15 – 17, Oficina 402 Bogotá, Colombia Tel.: Fax: President: Executive Director: E-mail: Website:
+57 1 6018787 / 6017681 / 6017684 +57 1 6018787 Ext. 15 Peter Welter Silvia Gutierrez Díaz [email protected] [email protected] www.colsuizacam.com
Cuba Swiss-Cuban Chamber of Commerce and Industry Centro de Negocios Miramar Edo. Jerusalem. Of. 206 Ave. 3ra, Esq. 80 Miramar, Playa, La Habana Tel.: Fax: President: E-mail: Website:
+53 7 204 9020 +53 7 204 2029 Andreas Winkler, Havana, Cuba [email protected] [email protected] www.swisscuban.org
Mexico Asociación Empresarial Mexicano-Suiza, A.C. c/o Colegio Suizo de México, A.C. Nicolas San Juan 917 Colonial de Valle 03100 México D.F., México
President: Secretary: E-mail:
Andrés Eberle Martin Maier [email protected]
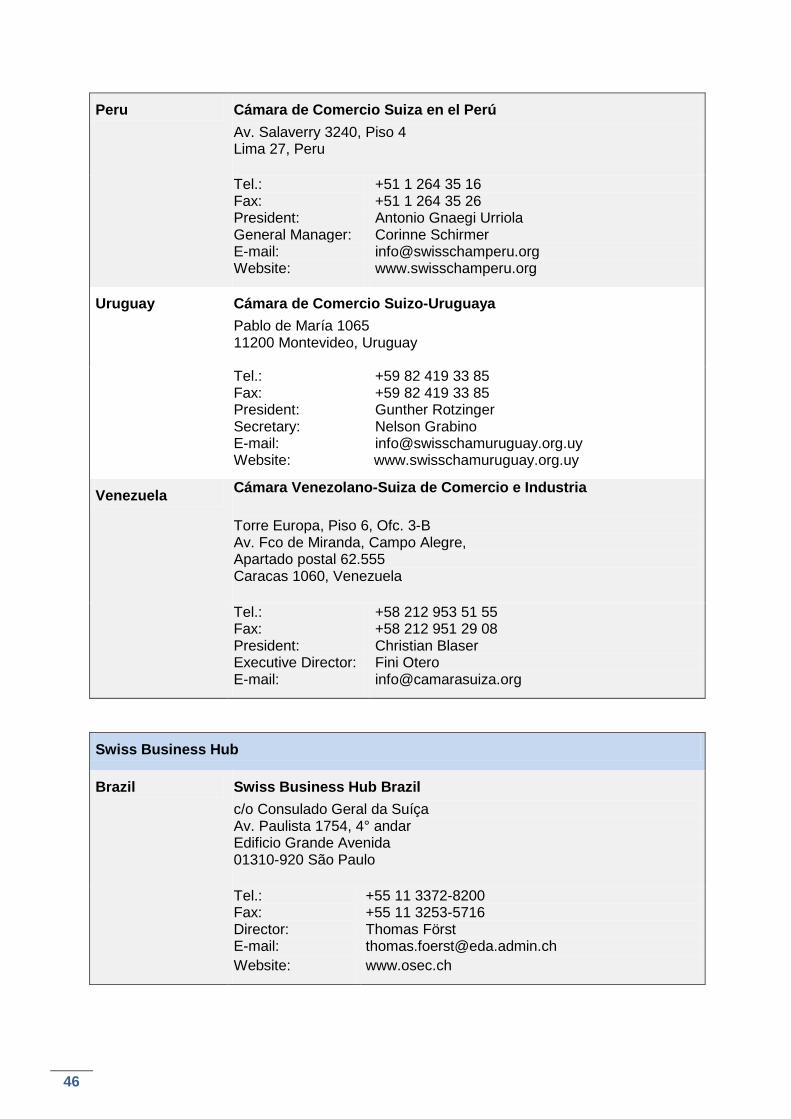
46
Peru Cámara de Comercio Suiza en el Perú Av. Salaverry 3240, Piso 4 Lima 27, Peru
Tel.: Fax: President: General Manager: E-mail: Website:
+51 1 264 35 16 +51 1 264 35 26 Antonio Gnaegi Urriola Corinne Schirmer [email protected] www.swisschamperu.org
Uruguay Cámara de Comercio Suizo-Uruguaya Pablo de María 1065 11200 Montevideo, Uruguay
Tel.: Fax: President: Secretary: E-mail: Website:
+59 82 419 33 85 +59 82 419 33 85 Gunther Rotzinger Nelson Grabino [email protected] www.swisschamuruguay.org.uy
Venezuela Cámara Venezolano-Suiza de Comercio e Industria
Torre Europa, Piso 6, Ofc. 3-B Av. Fco de Miranda, Campo Alegre, Apartado postal 62.555 Caracas 1060, Venezuela
Tel.: Fax: President: Executive Director: E-mail:
+58 212 953 51 55 +58 212 951 29 08 Christian Blaser Fini Otero [email protected]
Swiss Business Hub
Brazil Swiss Business Hub Brazil c/o Consulado Geral da Suíça Av. Paulista 1754, 4° andar Edificio Grande Avenida 01310-920 São Paulo
Tel.: Fax: Director: E-mail: Website:
+55 11 3372-8200 +55 11 3253-5716 Thomas Först [email protected] www.osec.ch
47
Appendix A.10. Memorándum de Entendimiento entre el Ministerio de Relaciones Exteriores de Chile y la Secretaría de Estado para Asuntos Económicos del Departamento Federal de Economía de la Confederación Suiza
El Ministerio de Relaciones Exteriores de Chile
y
la Secretaría de Estado para Asuntos Económicos del Departamento Federal de Economía de la Confederación Suiza,
en adelante los “Signatarios”, buscando ampliar y consolidar sus relaciones comerciales y económicas a través de un trabajo de colaboración amistosa, deseando fomentar los flujos comerciales y de inversiones entre ambos países, conscientes de la permanente necesidad de intercambio de información mediante contactos bilaterales regulares, agradados por contar con un favorable marco de condiciones, caracterizado por la existencia de acuerdos bilaterales vigentes en los ámbitos de libre comercio, protección de inversiones y doble imposición, han llegado al siguiente entendimiento:
Artículo I Diálogo bilateral económico
El objetivo de este Memorándum es el fortalecimiento de las relaciones comerciales entre los Signatarios sobre una base amplia y estructurada. En consecuencia, los Signatarios mantendrán un intercambio regular de opiniones sobre materias económicas de interés común, con la finalidad de establecer un diálogo bilateral entre ellas, en adelante denominado “diálogo bilateral económico”.
Artículo II Reuniones
Con el objetivo de llevar a cabo el diálogo bilateral económico, los Signatarios se reunirán una vez al año o con la regularidad que ellos acuerden. Las reuniones se realizaran en forma alternada en el territorio de cada uno de los Signatarios. Asimismo, los Signatarios acordarán fecha, lugar, duración y materias que serán abordadas con anterioridad a cada encuentro.
Artículo III Presidencia
La Presidencia de las reuniones del diálogo bilateral económico será ejercida conjuntamente por ambos Signatarios:
(a) Para el caso de Chile: por un representante de la Dirección General de Relaciones Económicas Internacionales o quien éste designe;
(b) Para el caso de Suiza: por un
representante de la Dirección de la Secretaría de Estado para Asuntos Económicos o quien éste designe.
Artículo IV Objetivos
El diálogo bilateral económico tendrá los siguientes objetivos:
(a) Abordar temas económicos de alcance bilateral, multilateral o general, que sean de interés para ambas partes;
(b) Identificar y adoptar medidas para el fomento del comercio bilateral y apoyar al sector privado en el establecimiento y la realización de oportunidades comerciales entre ambos países;
(c) Cooperar para promover con especial interés en el sector privado suizo el concepto “Chile País Plataforma”;
(d) Abordar temáticas relacionadas a obstáculos para el comercio y las inversiones;
(e) Intentar resolver de común acuerdo los problemas derivados de las relaciones bilaterales entre los Signatarios; y
(f) Considerar cualquier otro asunto de carácter bilateral económico acordado entre los Signatarios.
Artículo V Participación
A las sesiones podrán ser convocados adicionalmente expertos. Los Signatarios podrán invitar a representantes de otros ministerios, así como de asociaciones
48
profesionales y del sector privado, a tomar parte activa en el diálogo. Se decidirá acerca de la participación teniendo en cuenta la agenda, establecida de común acuerdo con una anterioridad de al menos treinta días. El diálogo económico podrá convocar a subcomisiones y sesiones ad hoc.
Artículo VI Autoridad responsable
La autoridad responsable de la administración del presente Memorándum de Entendimiento es:
(a) En el caso de Chile, la Dirección General de Relaciones Económicas Internacionales; y
(b) En el caso de Suiza, la Secretaría de Estado para Asuntos Económicos.
Artículo VII Entrada en vigencia y terminación
Los Signatarios dejan constancia que el presente Memorándum de Entendimiento no crea derechos ni obligaciones en el ámbito del derecho internacional y que los Signatarios le podrán poner término en cualquier momento, mediante notificación escrita enviada a la otra parte. El presente Memorándum de Entendimiento será efectivo a partir del día en que se suscriba. Suscrito en Santiago de Chile, el 20 de septiembre de 2012, en idiomas español y alemán, siendo ambos textos igualmente válidos.