Embed Size (px)
Citation preview
SWEN 256 – Software Process & Project Management

Plan: Identify activities. No
specific start and end dates.
Estimating: Determining the size
& duration of activities.
Schedule: Adds specific start
and end dates, relationships,
and resources.
Track: Uses monitoring and tools
to determine if plans, estimates,
and schedules are accurate
Planning
Estimating
Scheduling
Tracking

1. Identify “what” needs to be done
o Work Breakdown Structure (WBS)
2. Identify “how much” (the size)
o Size estimation techniques
3. Identify the dependency between tasks
o Dependency graph, network diagram
4. Estimate total duration of the work to be done
o The actual schedule

You need to decompose your project into
manageable chunks
ALL projects need this step
Divide & Conquer
Two main causes of project failure
o Forgetting something critical
o Ballpark estimates become targets
How does partitioning help this?
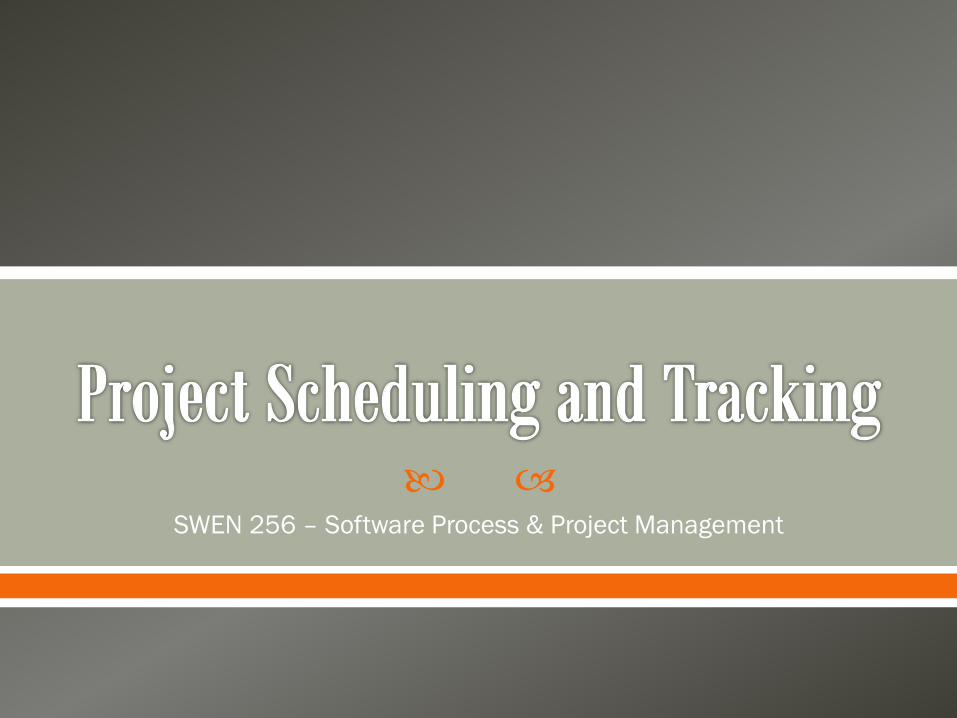
A Project: functions, activities, tasks
a.k.a. WBS
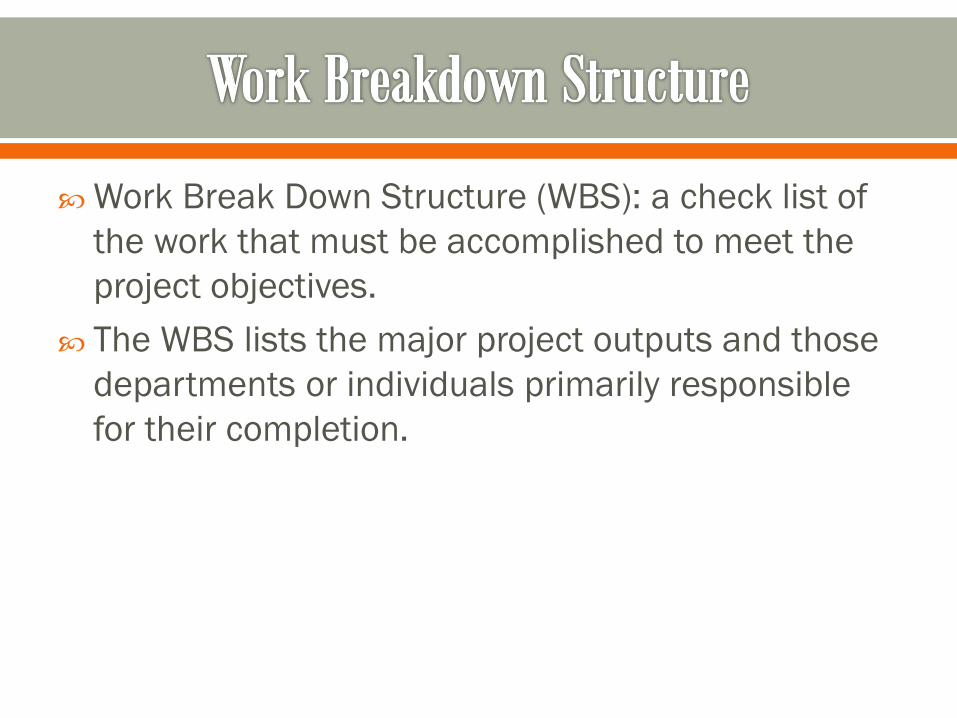
Work Break Down Structure (WBS): a check list of
the work that must be accomplished to meet the
project objectives.
The WBS lists the major project outputs and those
departments or individuals primarily responsible
for their completion.
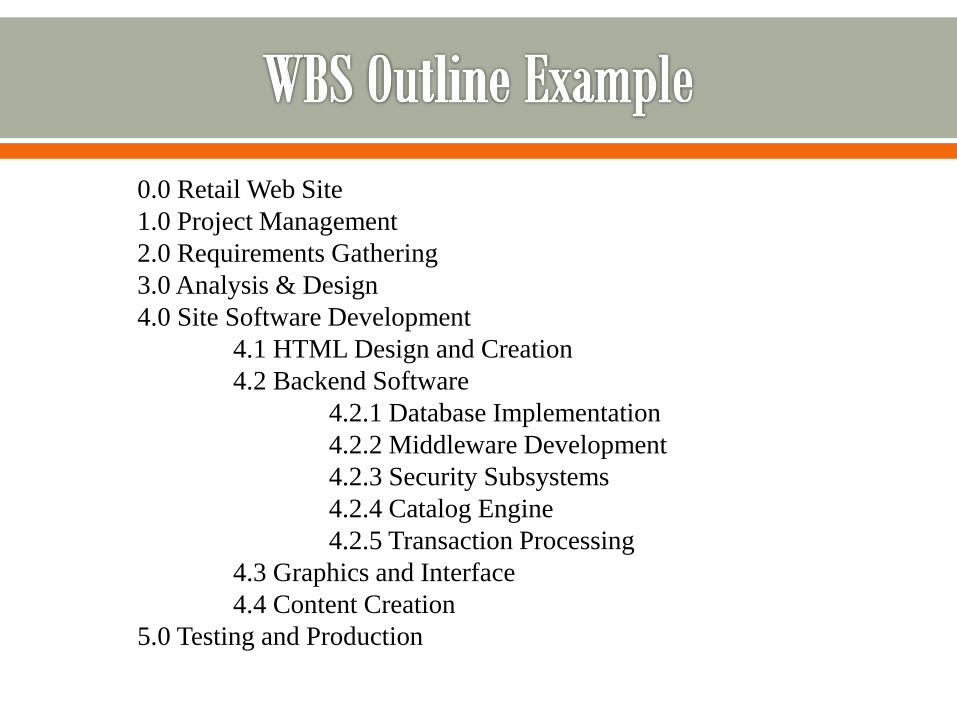
0.0 Retail Web Site
1.0 Project Management
2.0 Requirements Gathering
3.0 Analysis & Design
4.0 Site Software Development
4.1 HTML Design and Creation
4.2 Backend Software
4.2.1 Database Implementation
4.2.2 Middleware Development
4.2.3 Security Subsystems
4.2.4 Catalog Engine
4.2.5 Transaction Processing
4.3 Graphics and Interface
4.4 Content Creation
5.0 Testing and Production

From: http://www.hyperthot.com/pm_wbs.htm
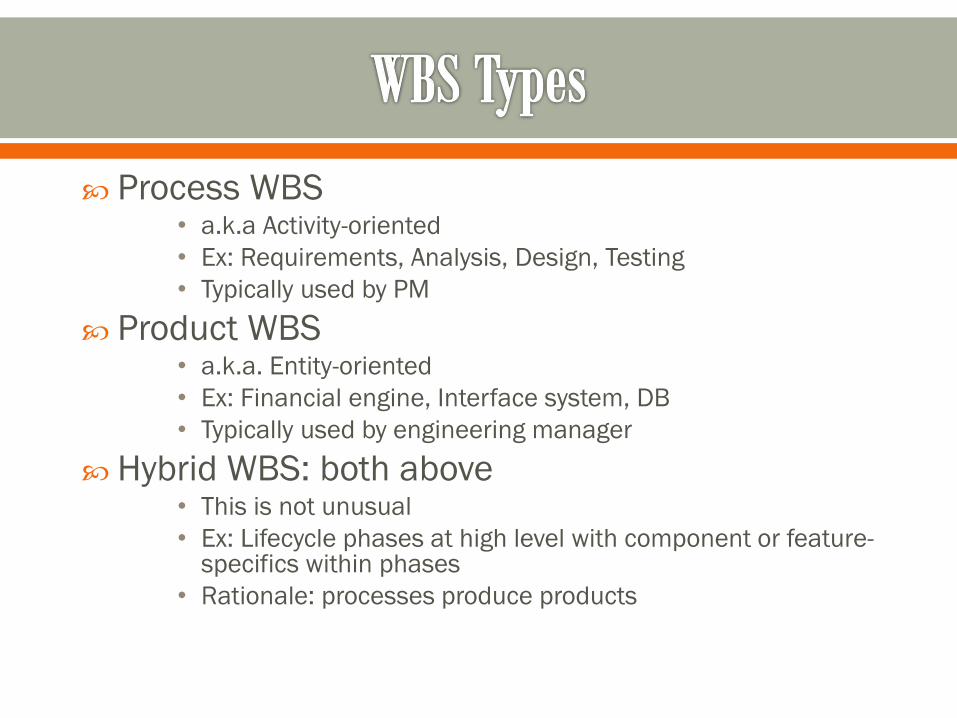
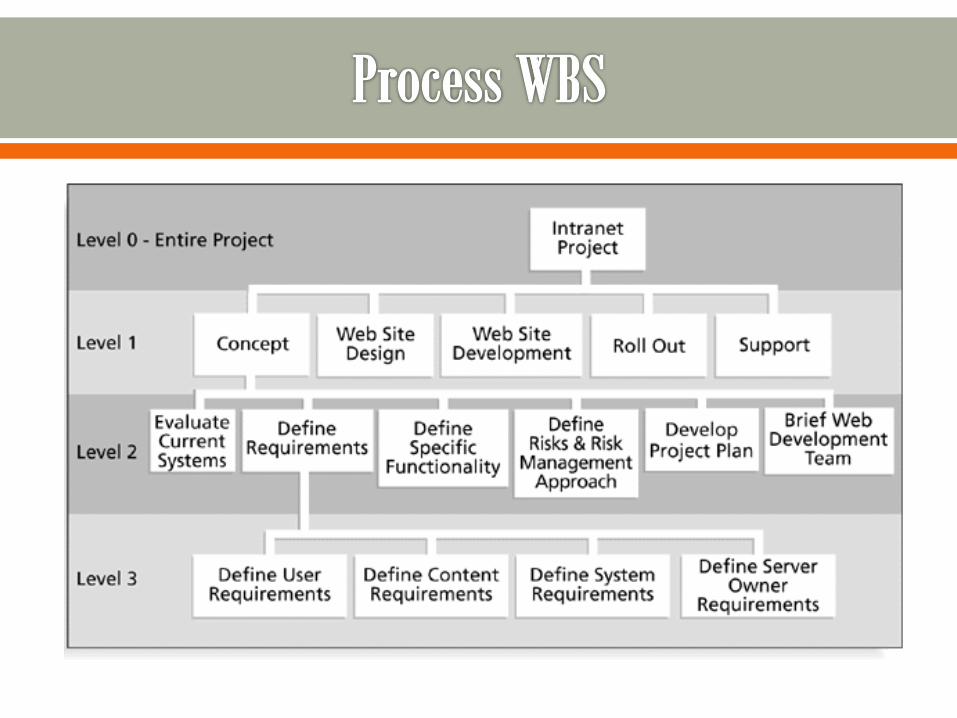
Process WBS• a.k.a Activity-oriented
• Ex: Requirements, Analysis, Design, Testing
• Typically used by PM
Product WBS• a.k.a. Entity-oriented
• Ex: Financial engine, Interface system, DB
• Typically used by engineering manager
Hybrid WBS: both above• This is not unusual
• Ex: Lifecycle phases at high level with component or feature-specifics within phases
• Rationale: processes produce products


List of Activities, not Things
List of items can come from many sources
o SOW, Proposal, brainstorming, stakeholders, team
Describe activities using “bullet language”
o Meaningful but terse labels
All WBS paths do not have to go to the same level
Do not plan more detail than you can manage

Generic term for discrete tasks with definable end results
The “one-to-two” rule
o Often at: 1 or 2 persons for 1 or 2 weeks
Basis for monitoring and reporting progress
o Can be tied to budget items (charge numbers)
o Resources (personnel) assigned
Ideally shorter rather than longer
o Longer makes in-progress estimates needed
o These are more subjective than “done”
o “4/40” or “8/80” rule ( shortest/longest duration)
o Not so small as to micro-manage

PM must map activities to chosen lifecycle
Each lifecycle has different sets of activities
Integral process activities occur for all
o Planning, configuration, testing
Operations and maintenance phases are not normally in plan (considered post-project)
Some models are “straightened” for WBS
o Spiral and other iterative models
o Linear sequence several times
Deliverables of tasks vary by methodology
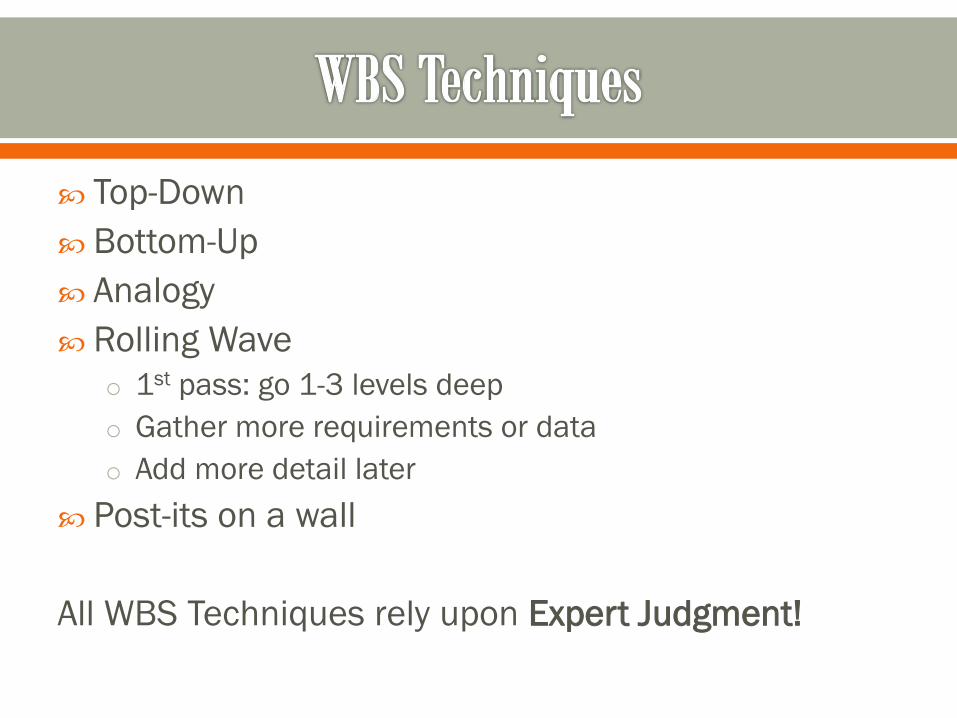
Top-Down
Bottom-Up
Analogy
Rolling Wave
o 1st pass: go 1-3 levels deep
o Gather more requirements or data
o Add more detail later
Post-its on a wall
All WBS Techniques rely upon Expert Judgment!

Top-down
o Start at highest level
o Systematically develop increasing level of detail
o Best if
• The problem is well understood
• Technology and methodology are not new
• This is similar to an earlier project or problem
o But is also applied in majority of situations
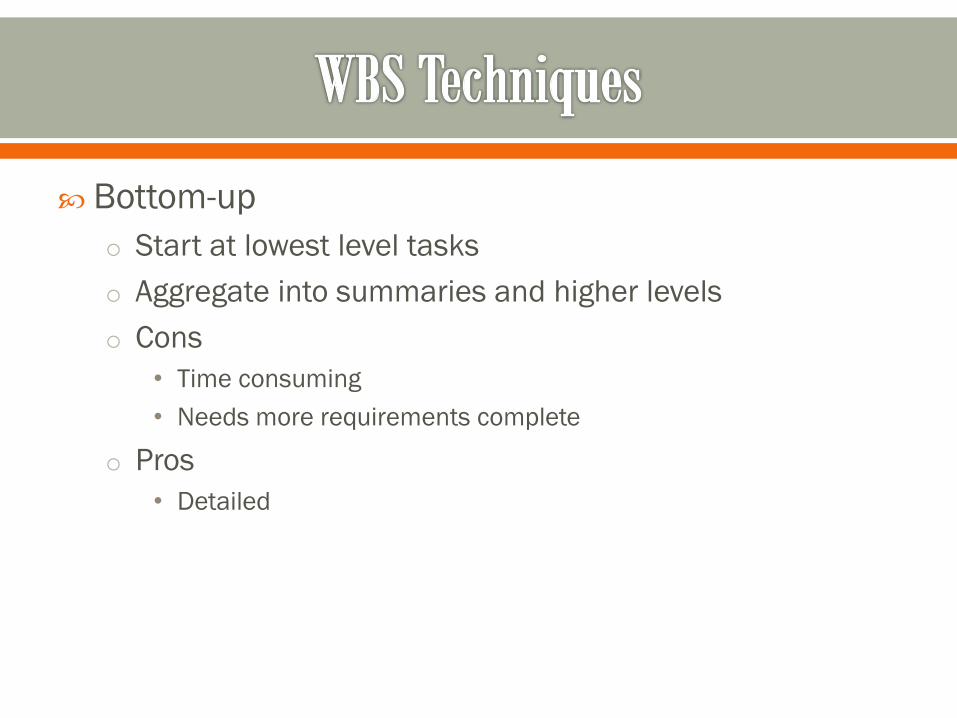
Bottom-up
o Start at lowest level tasks
o Aggregate into summaries and higher levels
o Cons
• Time consuming
• Needs more requirements complete
o Pros
• Detailed

Analogy
o Base WBS upon that of a “similar” project
o Use a template
o Analogy also can be estimation basis
o Pros
• Based on past actual experience
o Cons
• Needs comparable project

Brainstorming
o Generate all activities you can think of that need to be
done
o Group them into categories
Both Top-down and Brainstorming can be used on
the same WBS
Remember to get the people who will be doing the
work involved (buy-in matters!)
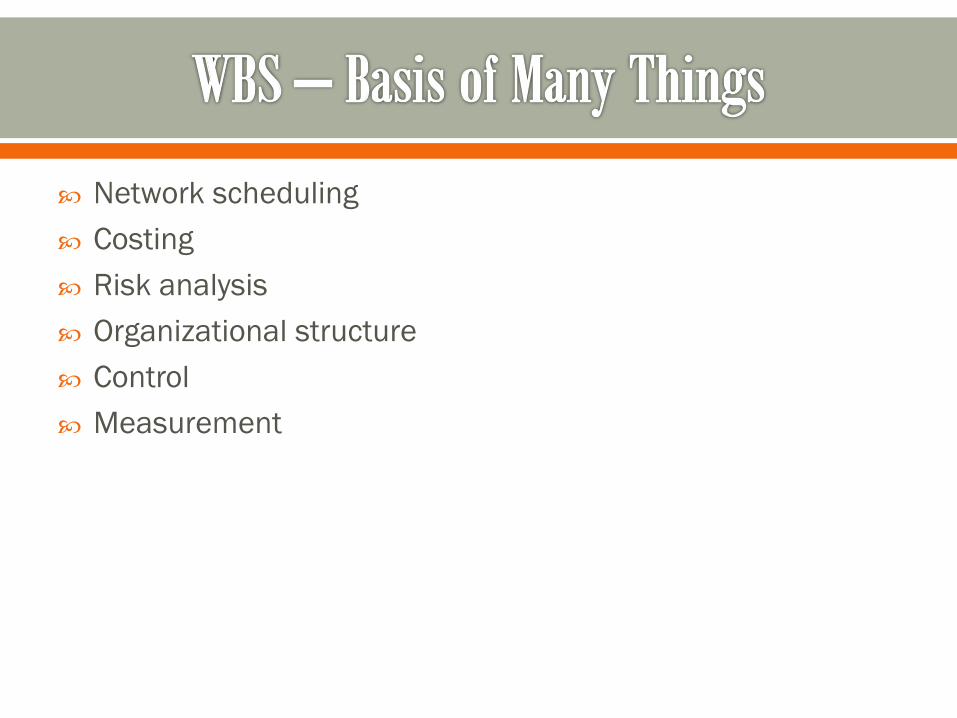
Network scheduling
Costing
Risk analysis
Organizational structure
Control
Measurement

Should be easy to understand
Some companies have corporate standards for these schemes
Some top-level items, like Project Mgmt. are in WBS for each project
o Others vary by project
What often hurts most is what’s missing
Break down until you can generate accurate time & cost estimates
Ensure each element corresponds to a deliverable
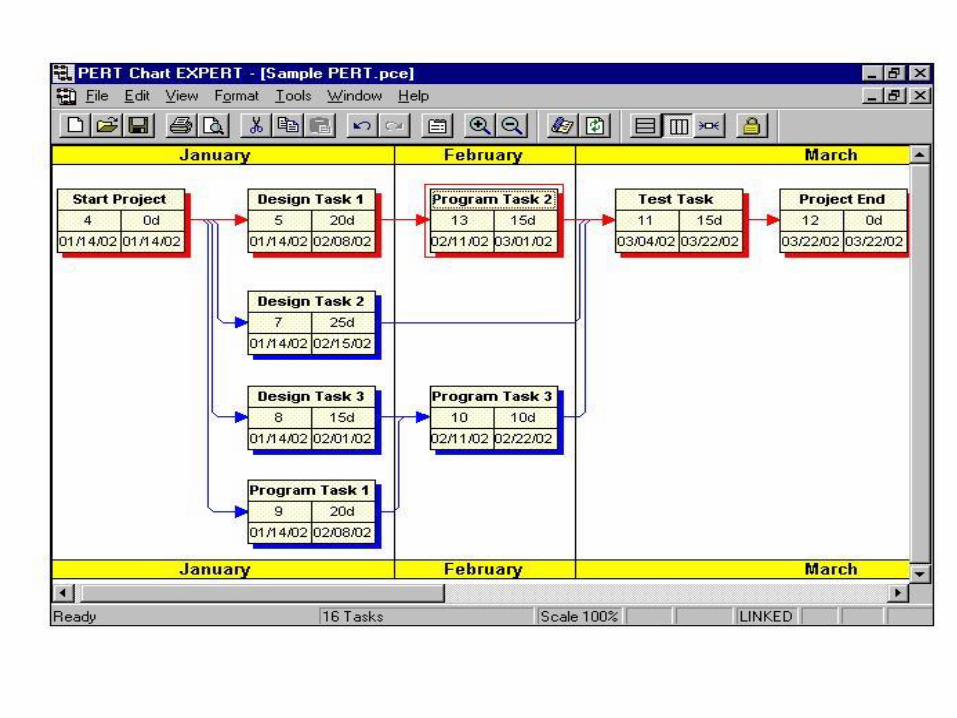
Tools and Techniques
Milestone Chart
Gantt chart
Network Techniques
o CPM (Critical Path Method)
o PERT (Program Evaluation and Review Technique)
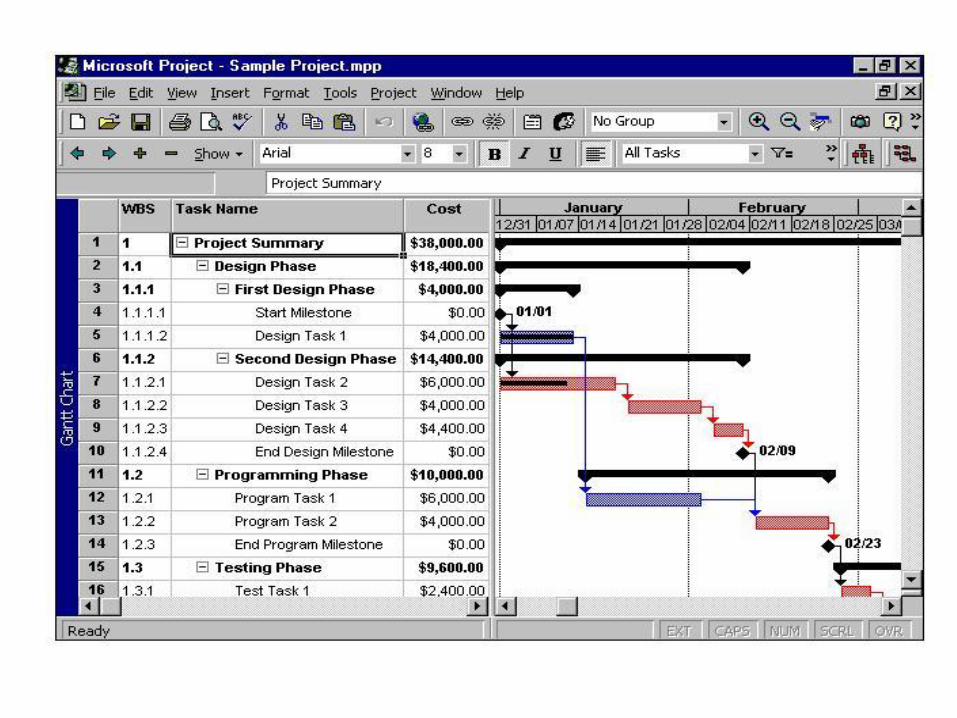
Gantt chart is a means of displaying simple
activities or events plotted against time or dollars
Most commonly used for exhibiting program
progress or for defining specific work required to
reach an objective
Gantt charts may include listing of activities,
activity duration, scheduled dates, and progress-to-
date
Advantages:
o Easy to understand
o Easy to change
Disadvantages:
o Only a vague description of the project
o Does not always show interdependency of activities
o May not show results of an early or late start of an
activity
A precedence network diagram is a graphic model
portraying the sequential relationship between key
events in a project.
Initial development of the network requires that the
project be defined and thought out.
The network diagram clearly and precisely
communicates the plan of action to the project
team and the client.
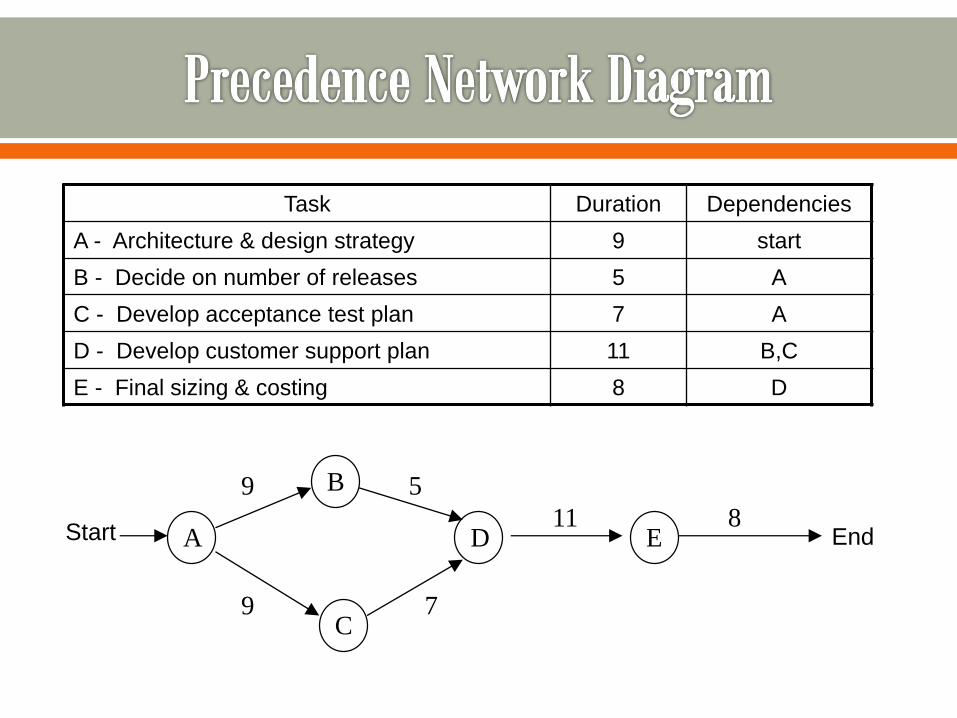
Task Duration Dependencies
A - Architecture & design strategy 9 start
B - Decide on number of releases 5 A
C - Develop acceptance test plan 7 A
D - Develop customer support plan 11 B,C
E - Final sizing & costing 8 D
A D
C
B
E EndStart
9
9
5
7
11 8
Critical Path Method (CPM) tries to answer the
following questions:
What is the duration of the project?
By how much (if at all) will the project be delayed if
any one of the activities takes N days longer?
How long can certain activities be postponed
without increasing the total project duration?
Sequence of activities that have to be executed one after
another
Duration times of these activities will determine the overall
project time, because there is no slack/float time for these
activities
If any of the activities on the critical path takes longer than
projected, the entire project will be delayed by that same
amount
Critical path = Longest path in the precedence network
(generally, the longest in time)
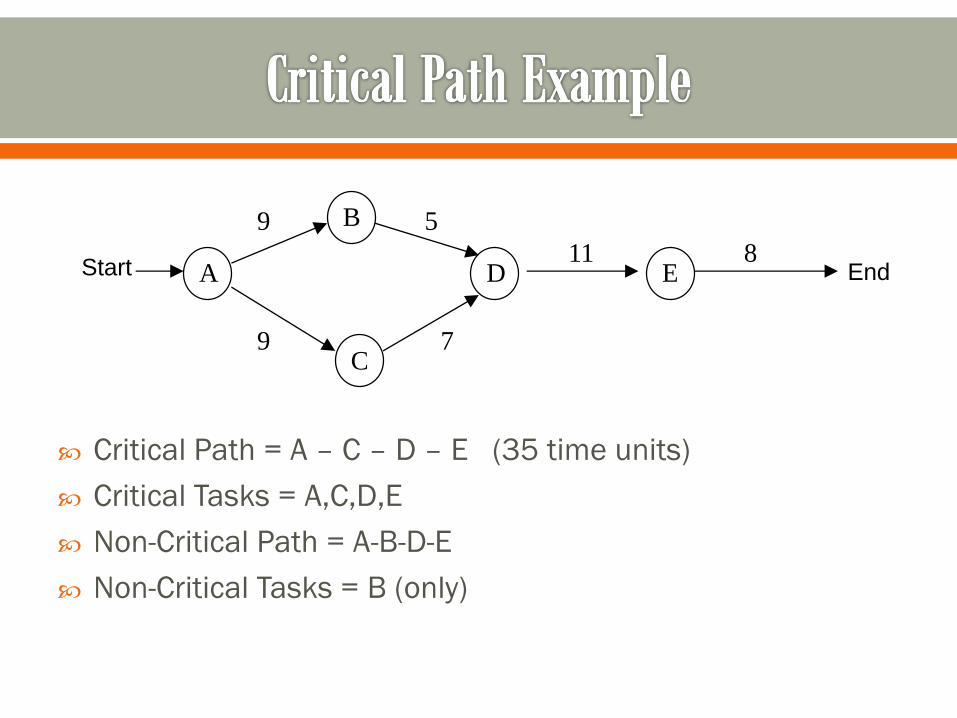
Critical Path = A – C – D – E (35 time units)
Critical Tasks = A,C,D,E
Non-Critical Path = A-B-D-E
Non-Critical Tasks = B (only)
A D
C
B
E EndStart
9
9
5
7
11 8
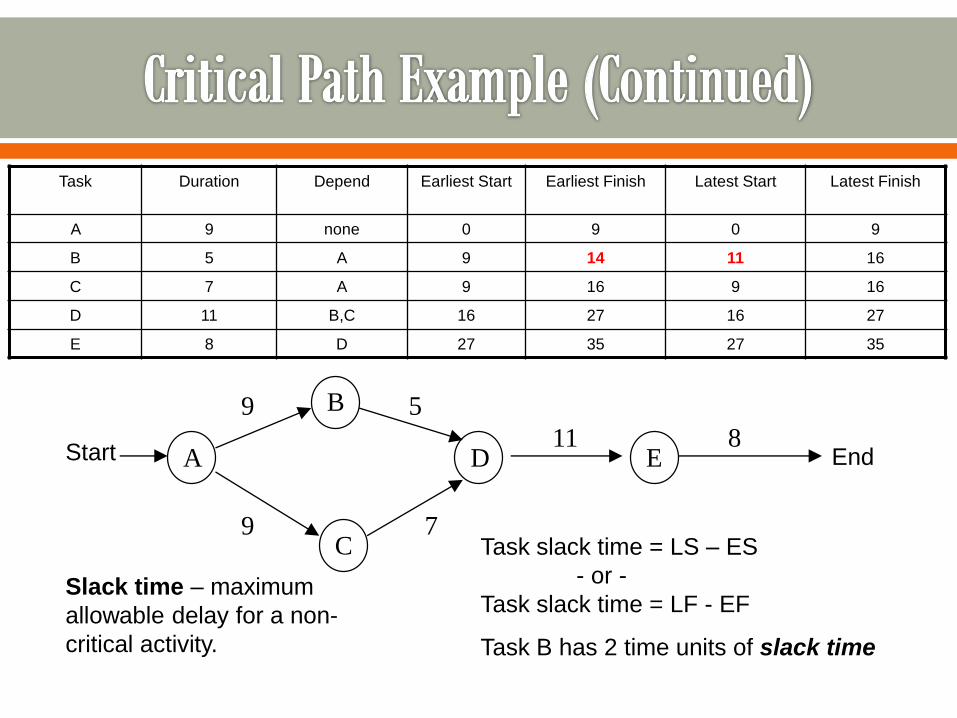
Task Duration Depend Earliest Start Earliest Finish Latest Start Latest Finish
A 9 none 0 9 0 9
B 5 A 9 14 11 16
C 7 A 9 16 9 16
D 11 B,C 16 27 16 27
E 8 D 27 35 27 35
A D
C
B
E EndStart
9
9
5
7
11 8
Task slack time = LS – ES
- or -
Task slack time = LF - EF
Task B has 2 time units of slack time
Slack time – maximum
allowable delay for a non-
critical activity.

Start End
Fill Bucket
with Water
2 Min
Pour Soap
into
Bucket
1 Min
Find Mop
& Bucket
3 Min
Find
Broom &
Dustpan
3 Min
Move
Obstacles
4 Min
Choose
Soap
4 Min
Sweep
Floor
8 Min
Sweep
Debris into
Dustpan
2 Min
Empty
Dustpan in
Garbage
1 Min
Put Broom
& Dustpan
Away
2 Min
Mop Floor
15 Min
Clean
Used Mop
& Bucket
4 Min
What is the Critical Path?
What is the Near Critical Path?
What is the Float/Slack of “Choose Soap”?
What is the float of “Mop Floor”?

Start End
Fill Bucket
with Water
2 Min
Pour Soap
into
Bucket
1 Min
Find Mop
& Bucket
3 Min
Find
Broom &
Dustpan
3 Min
Move
Obstacles
4 Min
Choose
Soap
4 Min
Sweep
Floor
8 Min
Sweep
Debris into
Dustpan
2 Min
Empty
Dustpan in
Garbage
1 Min
Put Broom
& Dustpan
Away
2 Min
Mop Floor
15 Min
Clean
Used Mop
& Bucket
4 Min
0 Early 4
0 Late 4
4 Early 12
4 Late 12
12 Early 14
12 Late 14
14 Early 15
30 Late 31
15 Early 17
31 Late 33
0 Early 3
1 Late 4
0 Early 3
8 Late 11
4 Early 5
11 Late 12
5 Early 7
12 Late 14
14 Early 29
14 Late 29
0 Early 4
7 Late 11
29 Early 33
29 Late 33
Time
Start-Early-Finish
Start-Late-Finish
Calculate FloatLate Start – Early Start or
Late Finish – Early Finish

Fast Tracking – Work critical path activities in parallel,
instead of sequentially.
Sweep
Floor
8 Min
Sweep
Debris into
Dustpan
2 Min
Becomes
Sweep
Floor
9 Min
Sweep
Debris into
Dustpan
9 Min
Crashing – Cost and schedule tradeoffs (Time ≈ Money)
with the end result of reducing overall time to completion
Other Ways (Less preferred but sometimes needed)
o Reduce Scope/Quality of product
o Increase resources, Reduce risks
o Say no: Sometimes schedule compression just isn’t an option
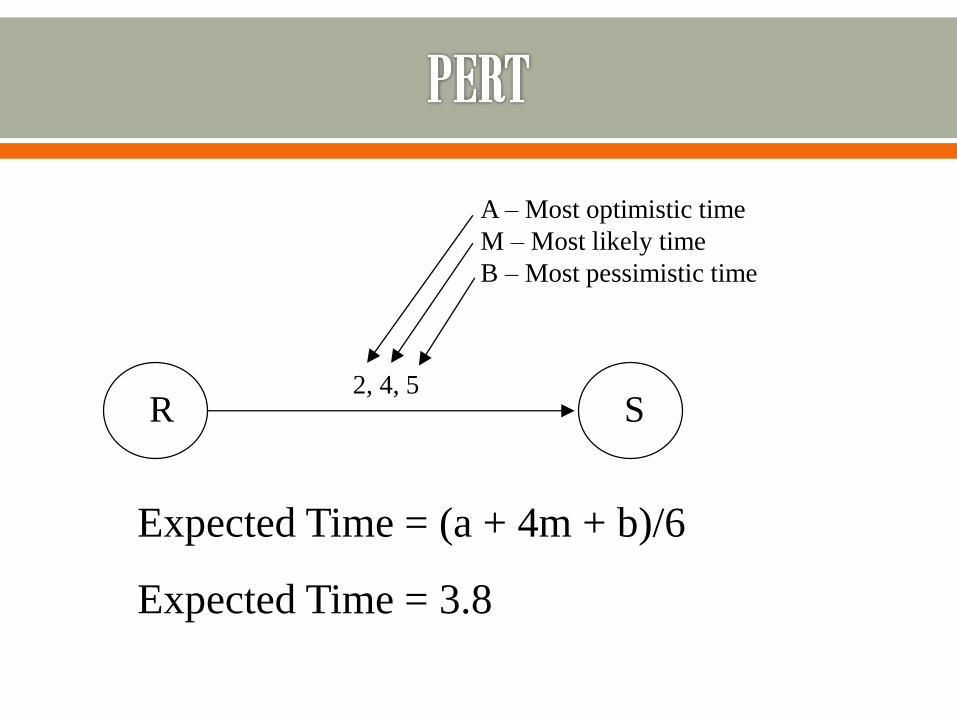
R S2, 4, 5
Expected Time = (a + 4m + b)/6
Expected Time = 3.8
A – Most optimistic time
M – Most likely time
B – Most pessimistic time


Task Complete?
Conceptual Design Complete
Program Specification Complete
Coding In Progress
Documentation In Progress
User Manual Production Not Started
Testing Not Started

Task How Complete?
Conceptual Design 200/200
Program Specification 300/300
Coding 150/600
Documentation 10/100
User Manual Production 0/400
Testing 0/500
660 / 2100 * 100 = 31.4% complete
Earned Value (EV) is a methodology used to control a
project
It provides a uniform measure for project progress for the
entire project or any sub-element
Provides a consistent method of project progress and
performance
Provides a basis for cost performance analysis of a project
1. Establish a WBS to divide the project into
manageable parts
2. Identify the activities required for the current
project
3. Allocate the effort required for each activity
4. Schedule the activities over time and resources
5. Analyze/review the schedule
(continued)
6. Update the schedule by reporting activity progress
7. Enter the actual cost on the activities
8. Execute the Earned Value calculations
9. Analyze the data and make course corrections as
necessary
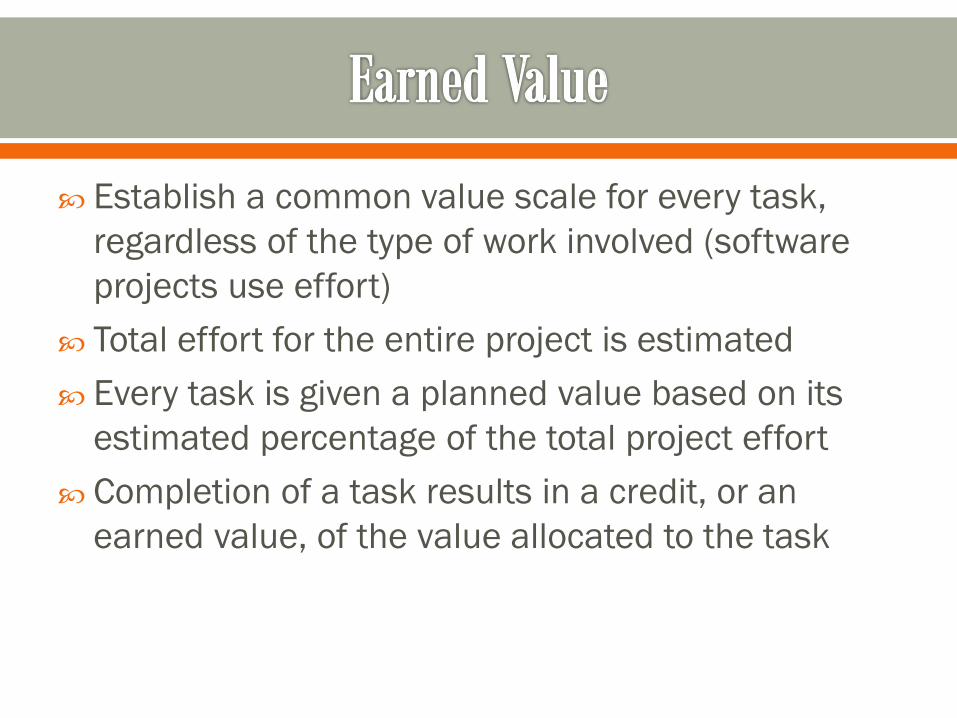
Establish a common value scale for every task,
regardless of the type of work involved (software
projects use effort)
Total effort for the entire project is estimated
Every task is given a planned value based on its
estimated percentage of the total project effort
Completion of a task results in a credit, or an
earned value, of the value allocated to the task
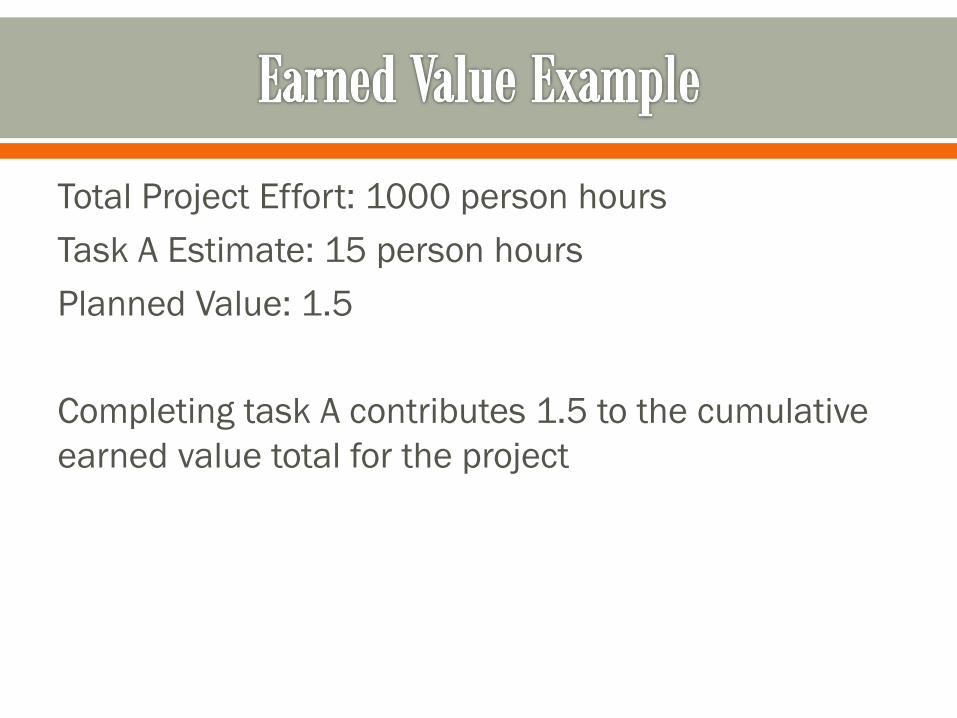
Total Project Effort: 1000 person hours
Task A Estimate: 15 person hours
Planned Value: 1.5
Completing task A contributes 1.5 to the cumulative
earned value total for the project

Earned value credit is given only when the task is
100% complete
Partially completed tasks are NOT given partial
credit (in most software projects)
Large tasks can/must be broken into subtasks
Size tasks up to 80 person-hours; aim for 2 to 4
task completions per week
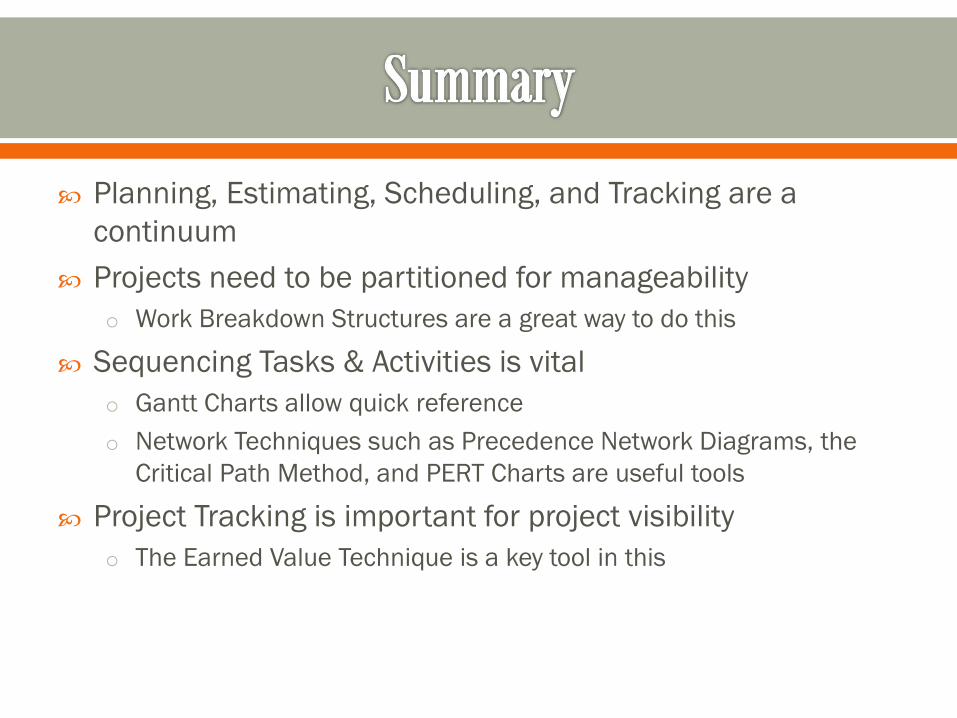
Planning, Estimating, Scheduling, and Tracking are a
continuum
Projects need to be partitioned for manageability
o Work Breakdown Structures are a great way to do this
Sequencing Tasks & Activities is vital
o Gantt Charts allow quick reference
o Network Techniques such as Precedence Network Diagrams, the
Critical Path Method, and PERT Charts are useful tools
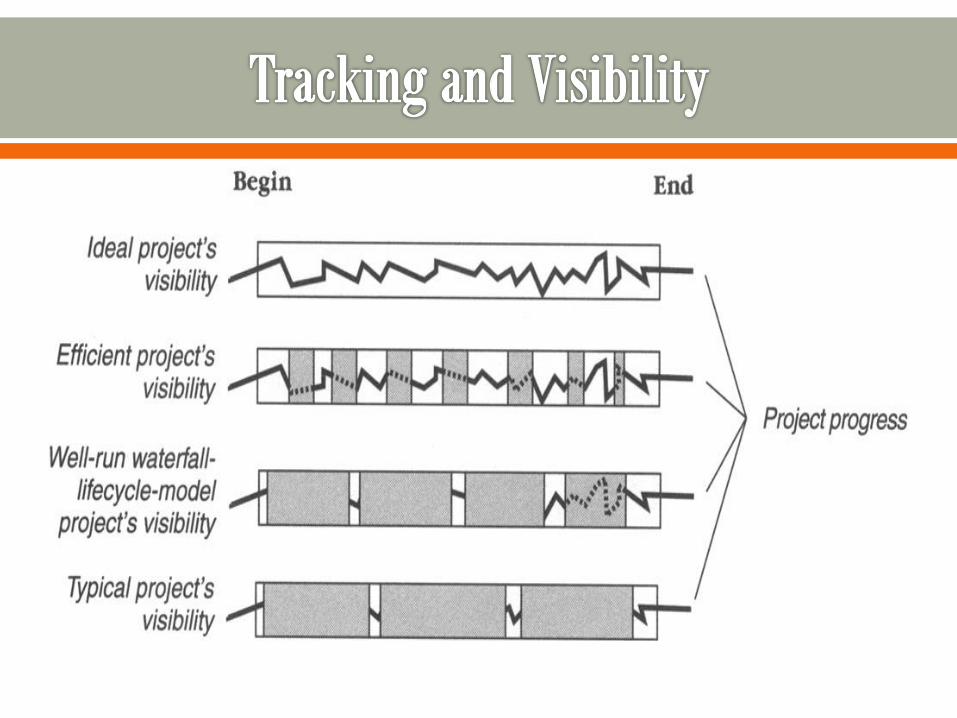
Project Tracking is important for project visibility
o The Earned Value Technique is a key tool in this