Embed Size (px)
Citation preview
File Name: NVI SFMP-FINAL_20130418
Revised: April 18th, 2013
Page i of 160 HARD COPIES OF THIS DOCUMENT ARE UNCONTROLLED. The current version is available on the Western intranet site.
Sustainable Forest Management Plan (SFMP)
Holberg, Port McNeill and Jeune Landing Forest
Operations
TFL 6, TFL 39 Block 4, Managed Forests 29, 31 & 61 and related licences
Indicator Results included for year 2012
Last Updated: April 18th, 2013
HARD COPIES OF THIS DOCUMENT ARE UNCONTROLLED. The current version is available on the Western intranet site Page i
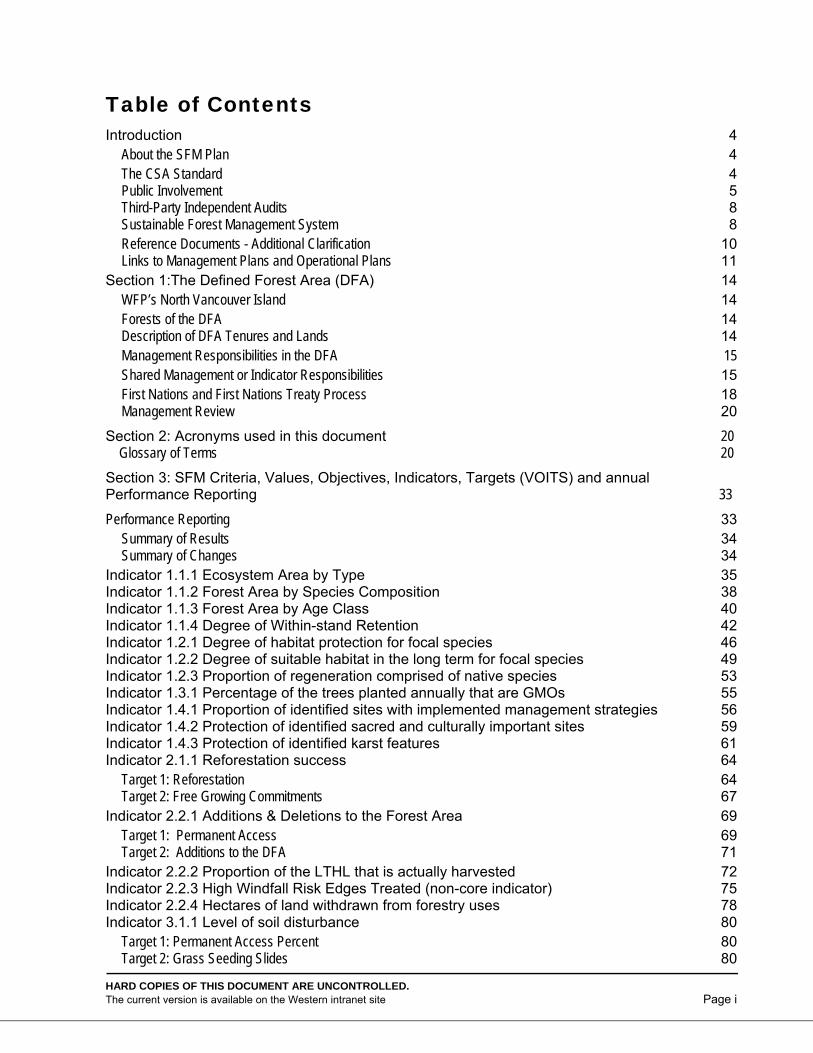
Table of Contents Introduction 4
About the SFM Plan 4 The CSA Standard 4 Public Involvement 5 Third-Party Independent Audits 8 Sustainable Forest Management System 8 Reference Documents - Additional Clarification 10 Links to Management Plans and Operational Plans 11
Section 1:The Defined Forest Area (DFA) 14 WFP’s North Vancouver Island 14 Forests of the DFA 14 Description of DFA Tenures and Lands 14 Management Responsibilities in the DFA 15 Shared Management or Indicator Responsibilities 15 First Nations and First Nations Treaty Process 18 Management Review 20
Section 2: Acronyms used in this document 20 Glossary of Terms 20
Section 3: SFM Criteria, Values, Objectives, Indicators, Targets (VOITS) and annual Performance Reporting 33
Performance Reporting 33 Summary of Results 34 Summary of Changes 34
Indicator 1.1.1 Ecosystem Area by Type 35 Indicator 1.1.2 Forest Area by Species Composition 38 Indicator 1.1.3 Forest Area by Age Class 40 Indicator 1.1.4 Degree of Within-stand Retention 42 Indicator 1.2.1 Degree of habitat protection for focal species 46 Indicator 1.2.2 Degree of suitable habitat in the long term for focal species 49 Indicator 1.2.3 Proportion of regeneration comprised of native species 53 Indicator 1.3.1 Percentage of the trees planted annually that are GMOs 55 Indicator 1.4.1 Proportion of identified sites with implemented management strategies 56 Indicator 1.4.2 Protection of identified sacred and culturally important sites 59 Indicator 1.4.3 Protection of identified karst features 61 Indicator 2.1.1 Reforestation success 64
Target 1: Reforestation 64 Target 2: Free Growing Commitments 67
Indicator 2.2.1 Additions & Deletions to the Forest Area 69 Target 1: Permanent Access 69 Target 2: Additions to the DFA 71
Indicator 2.2.2 Proportion of the LTHL that is actually harvested 72 Indicator 2.2.3 High Windfall Risk Edges Treated (non-core indicator) 75 Indicator 2.2.4 Hectares of land withdrawn from forestry uses 78 Indicator 3.1.1 Level of soil disturbance 80
Target 1: Permanent Access Percent 80 Target 2: Grass Seeding Slides 80
HARD COPIES OF THIS DOCUMENT ARE UNCONTROLLED. The current version is available on the Western intranet site Page ii
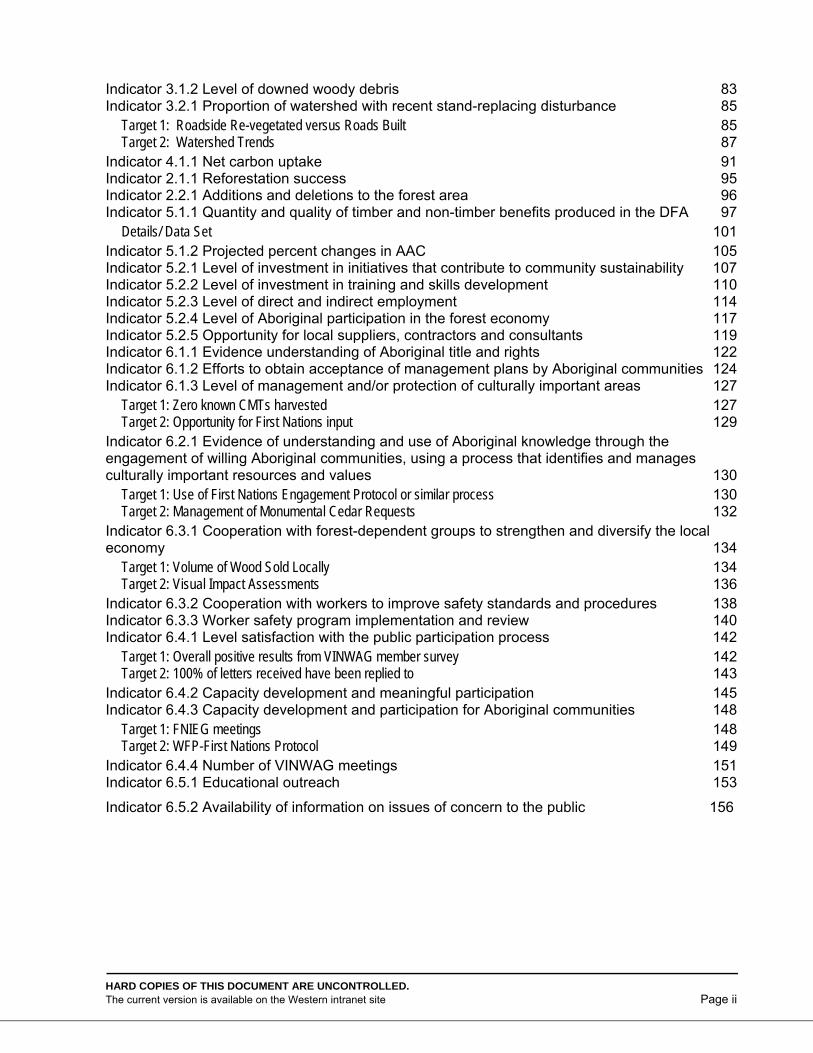
Indicator 3.1.2 Level of downed woody debris 83 Indicator 3.2.1 Proportion of watershed with recent stand-replacing disturbance 85
Target 1: Roadside Re-vegetated versus Roads Built 85 Target 2: Watershed Trends 87
Indicator 4.1.1 Net carbon uptake 91 Indicator 2.1.1 Reforestation success 95 Indicator 2.2.1 Additions and deletions to the forest area 96 Indicator 5.1.1 Quantity and quality of timber and non-timber benefits produced in the DFA 97
Details/ Data Set 101 Indicator 5.1.2 Projected percent changes in AAC 105 Indicator 5.2.1 Level of investment in initiatives that contribute to community sustainability 107 Indicator 5.2.2 Level of investment in training and skills development 110 Indicator 5.2.3 Level of direct and indirect employment 114 Indicator 5.2.4 Level of Aboriginal participation in the forest economy 117 Indicator 5.2.5 Opportunity for local suppliers, contractors and consultants 119 Indicator 6.1.1 Evidence understanding of Aboriginal title and rights 122 Indicator 6.1.2 Efforts to obtain acceptance of management plans by Aboriginal communities 124 Indicator 6.1.3 Level of management and/or protection of culturally important areas 127
Target 1: Zero known CMTs harvested 127 Target 2: Opportunity for First Nations input 129
Indicator 6.2.1 Evidence of understanding and use of Aboriginal knowledge through the engagement of willing Aboriginal communities, using a process that identifies and manages culturally important resources and values 130
Target 1: Use of First Nations Engagement Protocol or similar process 130 Target 2: Management of Monumental Cedar Requests 132
Indicator 6.3.1 Cooperation with forest-dependent groups to strengthen and diversify the local economy 134
Target 1: Volume of Wood Sold Locally 134 Target 2: Visual Impact Assessments 136
Indicator 6.3.2 Cooperation with workers to improve safety standards and procedures 138 Indicator 6.3.3 Worker safety program implementation and review 140 Indicator 6.4.1 Level satisfaction with the public participation process 142
Target 1: Overall positive results from VINWAG member survey 142 Target 2: 100% of letters received have been replied to 143
Indicator 6.4.2 Capacity development and meaningful participation 145 Indicator 6.4.3 Capacity development and participation for Aboriginal communities 148
Target 1: FNIEG meetings 148 Target 2: WFP-First Nations Protocol 149
Indicator 6.4.4 Number of VINWAG meetings 151 Indicator 6.5.1 Educational outreach 153
Indicator 6.5.2 Availability of information on issues of concern to the public 156
HARD COPIES OF THIS DOCUMENT ARE UNCONTROLLED. The current version is available on the Western intranet site Page iii
List of Figures Figure 1: NVI Sustainable Forest Management (SFM) System ....................................................... 9 Figure 2: Link between legislation and the SFM Plan .................................................................... 11 Figure 3: WFP North Vancouver Island - CSA Defined Forest Area (DFA).................................... 12 Figure 4: Map Showing Boundaries of Traditional Territories of First Nations within the DFA ....... 19
List of Tables Table 1: Defined Forest Area Statistics .......................................................................................... 13 Table 2: Treaty status of First Nations on the DFA (updated 10 August 2011) ............................... 20
HARD COPIES OF THIS DOCUMENT ARE UNCONTROLLED. The current version is available on the Western intranet site. Page 4 of 160
Introduction About the SFM Plan The Sustainable Forest Management (SFM) Plan outlines a series of performance indicators in accordance with the CSA Z809-08 standard. The SFMP supplements and reports on existing management plans and regulatory requirements (Figure 2). WFP produces an Annual Report of progress on the SFM Plan.
British Columbia has rigorous legislation and policies for protection, conservation, and sustainable management of forests. This legislative framework is being continuously improved, as is forest management and policy. In addition to applying regulatory tools, WFP benefits from using voluntary tools, such as CSA Certification, to aid in the achievement of sustainable forest management (SFM).
Appendix I: Table of Local SFM Values and Indicators
Appendix I summarizes the Values, Objectives, Indicator, and Target (VOIT) framework, management strategies, basis for the Targets, and timelines. WFP, working with interested parties in the public participation process, established the DFA-specific performance requirements that address all the CSA SFM elements in Clause 6 of the CSA Z809-08 Standard.
Appendix II: Detailed Indicator Descriptions and Methods
Appendix II lists each indicator in the SFM Plan, and provides the detailed rationale for selection, target, variance, history of the indicator, timelines for improvement, the current status, reporting and monitoring procedures, forecasts, and the assumptions and analytical methods.
Appendix III: Forecasting Alternate Strategies
Appendix III describes alternative management strategies and forecasts.
Appendix IV: Current Annual SFM Performance Report
Appendix IV references the latest SFM Annual Report. The report summarises any missed Targets, reasons why Targets may not have been achieved, and any related corrective action required.
Appendix V: Glossary
Appendix V contains the glossary of terms and acronyms.
The CSA Standard
CSA is based on the most broadly accepted Canadian forest values generated to date as embodied in the Canadian Council of Forest Ministers (CCFM) SFM criteria and elements. The CCFM SFM criteria and elements are fully consistent with those of the UNCED Montréal and Helsinki processes, which are both recognized by governments around the world. WFP is required to work closely with the public to identify local values, objectives, indicators, and targets that reflect the national criteria and to incorporate them into forest management planning and practices. Decisions are made together with the public during this process. CSA Z809 is more than a system standard; it is also a performance standard, and it also sets specific requirements for the public participation process. This approach to performance not only respects government-recognized criteria for SFM but also allows the public to participate in the interpretation for the local forest.
HARD COPIES OF THIS DOCUMENT ARE UNCONTROLLED. The current version is available on the Western intranet site. Page 5 of 160
The 2008 edition is the third edition of CSA Z809 (CSA Z809-08), Sustainable Forest Management standard. It supersedes the previous edition, published in 2002 under the title “Sustainable Forest Management: Requirements and Guidance” and the previous edition published in 1996.
The standard is available at:
http://www.csagroup.org/%5Crepository%5Cgroup%5CZ809-08.pdf
Changes in the 2008 standard are summarized here:
http://www.scc.ca/en/accreditation/ms/csa-z809-transition
One key change the 2008 edition of the standard is the requirement to develop and incorporate 35 mandatory “Core Indicators” defined by CSA as a way to foster consistency between SFM plans across Canada. Other changes include discussion topics for the public advisory process for each of the CCFM criterion.
Public Involvement
The CSA Standard was first published in 1996, following years of discussion and work, using an open and inclusive process managed by the CSA to define the standard. In 2000, the CSA set out to review and improve upon the original Standard, and again sought and incorporated public input into the 2002 edition. Revision of the 2002 edition, in turn, was initiated in 2004 with input from existing Public Advisory Groups (PAGs) and Aboriginal representatives and incorporated into the 2008 edition.
Under the standard, Western Forest Products is required to seek comprehensive, continuous public participation and work with Aboriginal peoples at the local community level. The public identifies forest values of specific importance to environmental, social, and economic concerns and needs. The public, represented largely by a Local Public Advisory Group, also takes part in the forest planning process and works with WFP to ensure that targets and values are addressed. The public participation requirement is one of the most rigorous of its kind in certification standards in the world today. Because Canadian forests are primarily publicly owned, it was seen as vital that Canadian forest certification extensively involves the public. Forest management that meets the CSA SFM requirements involves a positive relationship between the organization and the local community.
Local Public Advisory Group
The public advisory group, referred to as the Vancouver Island North Woodlands Advisory Group (VINWAG), was formed in February 2001. It consists of a representative matrix of a diversity of stakeholders from the local communities. Sectors represented include youth and education, small business, labour and local government. In 2008, members of the group agreed to amend their terms of reference to include additional sectors to represent aquaculture and ‘the community at large.’ Together, this group and Western Forest Products continue to develop the SFM performance framework that is incorporated in this SFM Plan. This SFM Plan involved consultation with local communities, to develop the SFM framework, including the local Values, Objectives, Indicators, and Targets (VOIT). VINWAG operates under a Terms of Reference in accordance with the CSA requirements. In 2007, BC Timber Sales (BCTS) asked and was granted permission to join VINWAG and for VINWAG to serve as a local advisory group for its CSA certification initiative. BCTS left the table in 2009 to pursue another type of certification.
HARD COPIES OF THIS DOCUMENT ARE UNCONTROLLED. The current version is available on the Western intranet site. Page 6 of 160
First Nations Involvement
First Nations’ peoples are provided opportunity and are encouraged to contribute their knowledge and concerns into the process of setting the objectives in this SFM Plan. WFP hosts a “First Nation Information Exchange Group” (FNIEG) and provides the Bands’ minutes of VINWAG meetings related to the SFM Plan to facilitate awareness of the CSA process, but this is not considered involvement in the process and is not consultation. First Nations information sharing with respect to the CSA certification is without prejudice to their aboriginal and treaty rights.
First Nations related indicators are located within Criterion #6 in the SFM Plan.
The SFM system recognizes that Canadian forests have special significance to Aboriginal peoples. It further recognizes that the legal status of Aboriginal peoples is unique and that they possess special knowledge and insights concerning sustainable forest management derived from traditional practices and experience. First Nations peoples are provided opportunity and are encouraged to contribute their knowledge and concerns into the SFM Plan process.
Adaptive Management and Annual Reporting
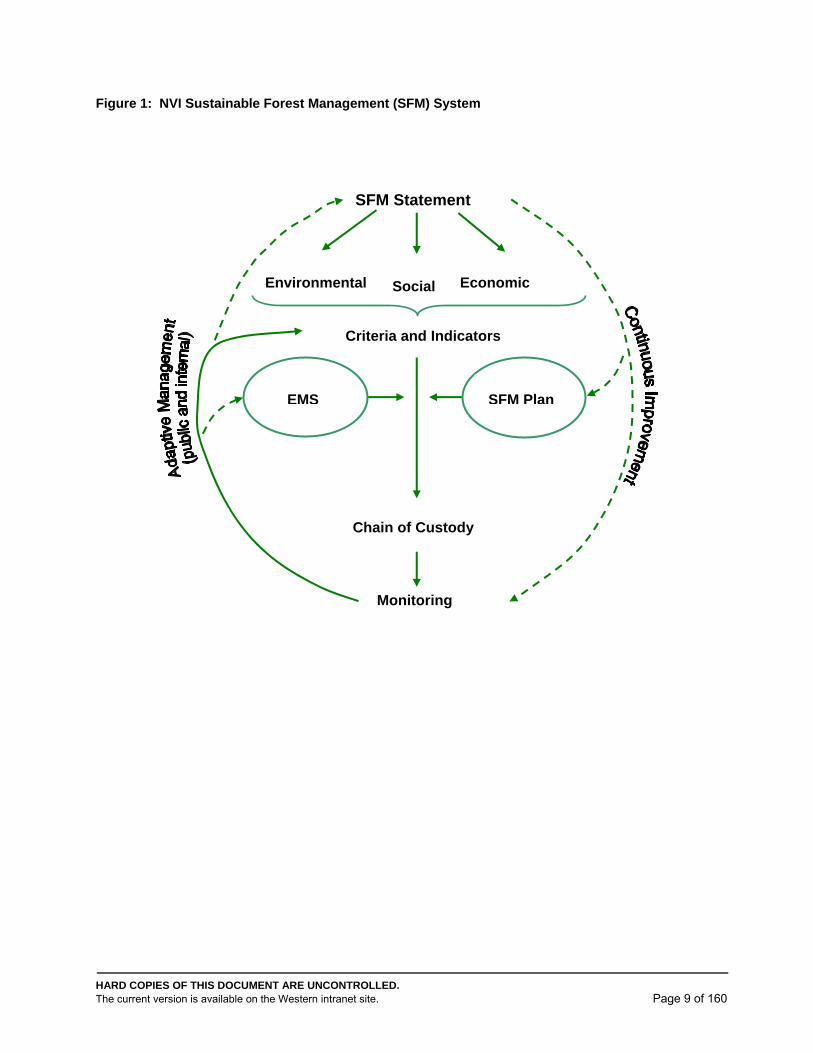
Ongoing Public Advisory Group participation will provide opportunities for continual input, learning, improvement, and the resolution of issues that may arise in the implementation of the SFM Plan and the WFP SFM System. The adaptive management under WFP’s SFM System (Figure 1) ensures that the SFM Plan remains relevant and a product of continual improvement. This is ensured by annual review with VINWAG of the advisory group terms of reference, the WFP SFM Plan annual report, and review of any recommendations for SFM Plan improvement, for example any recommendations arising from the annual audit process.
Setting Local DFA-Specific Performance Requirements
The Canadian Council of Forest Ministers (CCFM) developed generic national Indicators (CAN/CSA Z808-96) as a starting point for consideration in developing Indicators for a DFA. Since other coastal British Columbia regional Z809 initiatives had been previously been completed, VINWAG chose to examine these regionally developed Indicator sets in 2001, noting that they had been derived using the CCFM Indicators as guidance. Since then a continual improvement process has been conducted, and the SFM Plan has been updated to reflect the Z809-02 and Z809-08 standards and evolving Federal and Provincial legislation and policy. Appendix I records and summarizes the SFM work including the following:
For each element, one or more DFA-specific values shall be identified;
For each value, one or more objectives shall be set;
For each value, one or more meaningful indicators shall be identified, including core and locally selected indicators. Indicators shall be quantitative where feasible.
For each indicator, data on the current status shall be provided, and one appropriate target shall be set. Each target shall specify acceptable levels of variance for the indicator and clear time frames for achievement. A clear justification shall be provided for why the targets have been chosen;
One or more (alternative) strategies shall be identified and elaborated for indicators for meeting identified Targets;
Forecasts shall be prepared for the expected responses of each indicator to applicable strategies. Methods and assumptions used for making each forecast shall be described.
HARD COPIES OF THIS DOCUMENT ARE UNCONTROLLED. The current version is available on the Western intranet site. Page 7 of 160
During plan implementation, measurements shall be taken for each indicator at appropriate times and places. Measurement results shall be interpreted in the context of the forecasts in the SFM plan in an adaptive management process.
Z809-08 does not require VINWAG to work through all the content; it gives them the opportunity to do so. This is a fundamental shift recognizing the public’s right to focus on what it finds of greatest interest to work on. The public’s involvement has been expanded to include “management strategies”, “review of the SFM Plan”, and “issues of interest relevant to SFM on the DFA”. The company still must address the values and elements the public chooses not to proactively engage in. The primary role of public participation is the development of VOITs for the DFA. Members of VINWAG are invited to identify areas where they feel improvement could be made upon indicators, for example. In many cases, specialists having experience with certain values are brought in to make presentations to VINWAG members and answer questions. However, they must be given the opportunity to perform all of the items above. WFP must determine which, if any, strategies or monitoring programs they want to assess, evaluate or design.
Performance Framework for the DFA: “VOITs”
In this SFMP, Appendix I lists the performance matrix for the DFA. For each indicator, a detailed description, forecast, and methods is included in this SFM Plan in Appendix II.
The local Values, Objectives, Indicators, Targets (“VOIT’s”), and Acceptable Variances for each CSA Criteria and Element were developed during discussions between VINWAG and WFP staff and consultants starting in 2001 under the CSA Z809-96 process. In 2004, VOITs were reviewed and updated into a revised SFM Plan reflecting the improvements of the CSA Z809-02 standard. The Z809-02 concept of VOITs is now in line with ISO 14001 and its VOITs for “significant aspects”, under the WFP EMS. In 2006, the effects of the BC Bill 28 Forest Revitalization Act were incorporated into the plan, and a number of Targets reduced or noted as needing review to reflect the smaller area remaining in the DFA.
Management Strategies describe means of achieving objectives and targets. The public advisory process includes review of the company’s forest management strategies. Existing organizational and government policies that govern the conduct of forest management activities are described in the SFMP. Management strategies are drawn from TFL Management Plans, Forest Stewardship Plans (e.g. Results and strategies), Managed Forest Management Commitments, Private Managed Forest Land Act and Regulations, Forest Practices Code and the Forest and Range Practices Act. TFL 6 Management Plan #10 and TFL 39 Management Plan #9 provide more detail, and are intended to be referenced as integral to this SFM Plan.
Alternative Strategies are reviewed with VINWAG, in relation to their forecasts, so that a preferred strategy can be selected. A summary is provided in Appendix III. The management strategies are drawn from TFL 6 Management Plan #10, TFL 39 Management Plan #9, Silviculture Strategy documents, and the Kingcome TSA Timber Supply Review. These contain inventories, descriptions of current conditions, and Timber Supply Analyses describing several alternative management strategies and associated long term forecasts. Alternatives are summarized in a report for the CSA advisory group.
Monitoring methods and responsibilities for tracking indicator performance is described in the SFMP for each indicator. Adaptive management and continual improvement is the process by which the plan is monitored and improved. NVI’s performance against this plan is subject to on-going monitoring and annual review and assessment by NVI management and VINWAG. The monitoring and adaptive management process is described in WFP’s SFM System manual. Implementation Schedules (Action Plan Timelines) are aspects of the SFM Plan needing
HARD COPIES OF THIS DOCUMENT ARE UNCONTROLLED. The current version is available on the Western intranet site. Page 8 of 160
improvement or further research. These specify the delivery dates for key outcomes. Timelines are by definition sensitive to both efficiency (i.e., getting on with the implementation of this Standard without undue delay) as well as effectiveness (i.e., taking sufficient time for the SFM requirements to be met and for key tasks to be completed successfully).
Third-Party Independent Audits
To become certified to this Standard, WFP must undergo a third-party, independent audit to the SFM requirements in this Standard. A registrar (certifier), accredited by the Standards Council of Canada, conducts the audit. The individual auditors employed or contracted by the registrar have the requisite forestry expertise and are certified as environmental auditors. Audits to this Standard are done by accredited certifiers and certified auditors who are independent of the standards-writing body (CSA). In addition to the initial audit, there are mandatory annual reviews, which include both a document review and on-site checks of the forest to ensure progress is being made towards the achievement of targets and that the SFM requirements are being upheld. In addition, a full re-certification audit is required periodically following the initial certification.
Sustainable Forest Management System
WFP’s Sustainable Forest Management System (Figure 1) is described in WFP’s Environmental Management System (EMS). Serving as the foundation, WFP’s EMS was implemented and registered under ISO 14001 certification in 1999, and has been re-registered in corresponding annual audits since then. Incremental upon this foundation is the incorporation of the SFM performance framework as described in the NVI SFM Plan. The NVI SFM System describes the adaptive management procedures and public advisory group process that WFP will follow to implement, review, and continually improve the SFM Plan.
The SFM System also includes a Chain of Custody (CoC) procedure, in accordance with the internationally recognized Programme for the Endorsement of Forest Certification schemes (PEFC) Annex 4 standard. Chain of Custody provides assurance that forest products being traded and sold as “certified” can be traced to forests certified to the Z809 standard or other PEFC recognized forest certifications. The process by which the WFP CoC is maintained is described in the SFM system. In November 2001 WFP attained certification of its Chain of Custody process through an independent audit, and it continues to undertake regular, annual surveillance audits.
HARD COPIES OF THIS DOCUMENT ARE UNCONTROLLED. The current version is available on the Western intranet site. Page 9 of 160
Figure 1: NVI Sustainable Forest Management (SFM) System
Monitoring
Chain of Custody
SFM Statement
Criteria and Indicators
SFM PlanEMS
Social EconomicEnvironmental
HARD COPIES OF THIS DOCUMENT ARE UNCONTROLLED. The current version is available on the Western intranet site. Page 10 of 160
Reference Documents - Additional Clarification CAN/CSA ISO 14001-2004 - Environmental Management Systems – Specification with
guidance for use.
CSA Plus 1133 (2nd Ed. Pub 2003) – Guidelines for Sustainable Forest Management Systems: General Audit Principles and Audit Procedures for Auditing Sustainable Forest Management Systems. Internal Audit procedures developed under Section 7.5.4 of the Standard - Internal Audits to the SFM Requirements - must conform to this guideline.
CSA Plus 1134 (2nd Ed. Pub 2003) – Guidelines for Sustainable Forest Management Systems: Qualification Criteria for Sustainable Forest Management Systems Auditors. Guiding document defining the criteria for internal auditors as required under Section 7.5.4 of the Standard - Internal Audits to the SFM Requirements
CAN/CSA Z731-03 Emergency Response Planning for Industry. Key document for ISO 14001. Tool for developing procedures under section 7.4.7 – Emergency Preparedness and Response - of the Standard
CSA Z764-96 (R2002) A Guide to Public Involvement. Defines how to build an effective public advisory committee.
PEFC Annex 4 (Chain of Custody of Forest Based Products - Requirements), 2005.
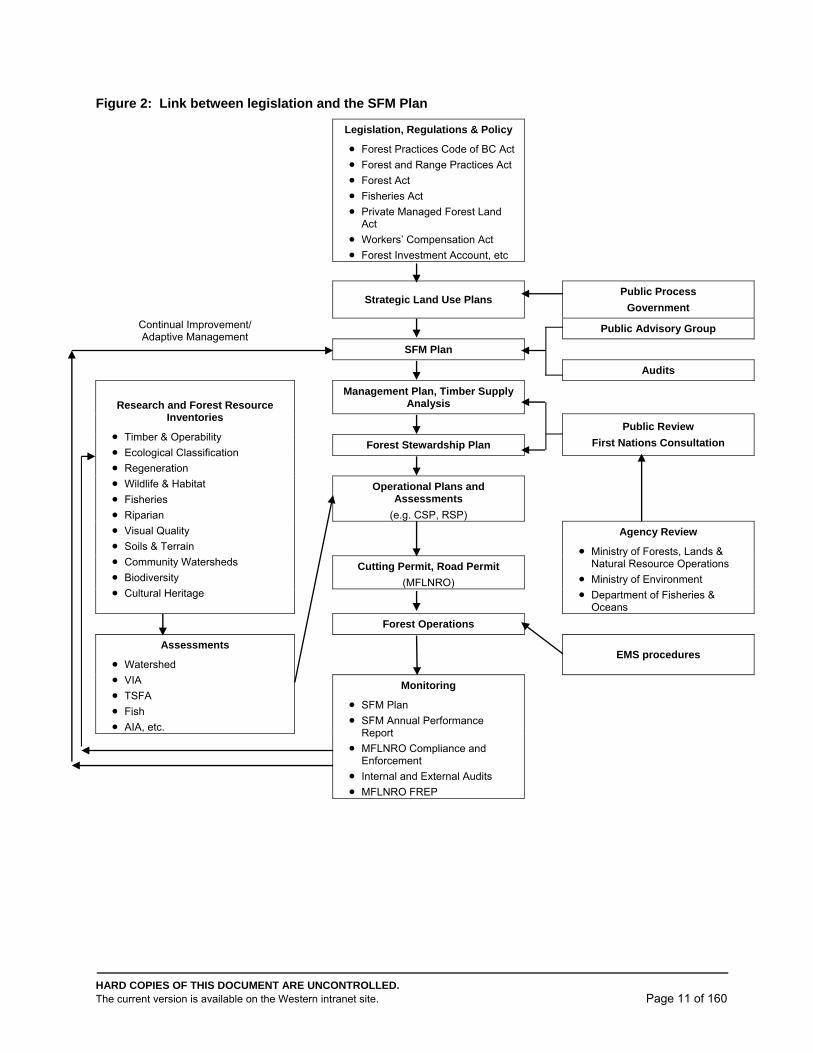
Links to Management Plans and Operational Plans The following diagram demonstrates the links between the SFM Plan, operational planning, and existing Management Plans, in relation to the BC Forest Practices Code (FPC), Forest and Range Practices Act (FRPA) and their corresponding regulations.
Figure 2 shows the flow of input and direction to operational plans, including Forest Development Plans and Site Plans. It does not show the feedback loops of monitoring and adaptive management that occurs from operations to the management plans and other higher level plans.
HARD COPIES OF THIS DOCUMENT ARE UNCONTROLLED. The current version is available on the Western intranet site. Page 11 of 160
Figure 2: Link between legislation and the SFM Plan
Legislation, Regulations & Policy
Forest Practices Code of BC Act
Forest and Range Practices Act
Forest Act
Fisheries Act
Private Managed Forest Land Act
Workers’ Compensation Act
Forest Investment Account, etc
Strategic Land Use Plans
Public Process
Government
Continual Improvement/ Adaptive Management
Public Advisory Group
SFM Plan
Audits
Research and Forest Resource Inventories
Timber & Operability
Ecological Classification
Regeneration
Wildlife & Habitat
Fisheries
Riparian
Visual Quality
Soils & Terrain
Community Watersheds
Biodiversity
Cultural Heritage
Management Plan, Timber Supply Analysis
Public Review
First Nations Consultation Forest Stewardship Plan
Operational Plans and Assessments
(e.g. CSP, RSP)
Agency Review
Ministry of Forests, Lands & Natural Resource Operations
Ministry of Environment
Department of Fisheries & Oceans
Cutting Permit, Road Permit
(MFLNRO)
Forest Operations
Assessments
Watershed
VIA
TSFA
Fish
AIA, etc.
EMS procedures
Monitoring
SFM Plan
SFM Annual Performance Report
MFLNRO Compliance and Enforcement
Internal and External Audits
MFLNRO FREP
HARD COPIES OF THIS DOCUMENT ARE UNCONTROLLED. The current version is available on the Western intranet site. Page 12 of 160
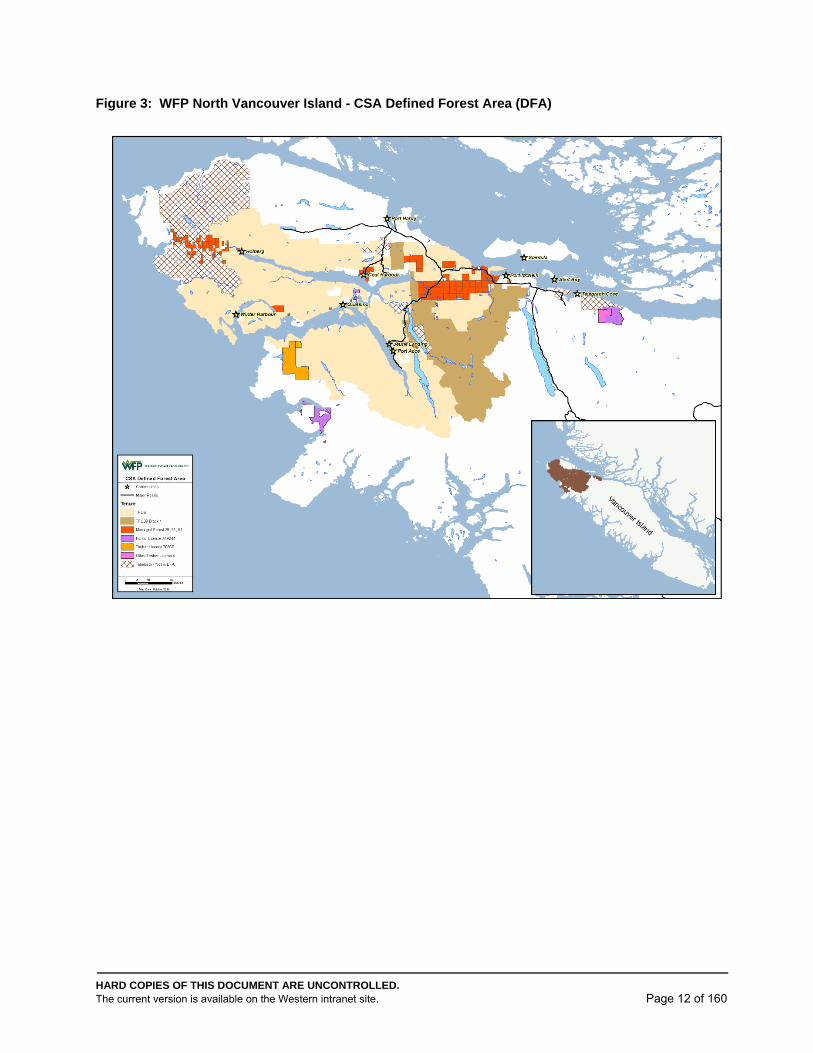
Figure 3: WFP North Vancouver Island - CSA Defined Forest Area (DFA)
HARD COPIES OF THIS DOCUMENT ARE UNCONTROLLED. The current version is available on the Western intranet site. Page 13 of 160
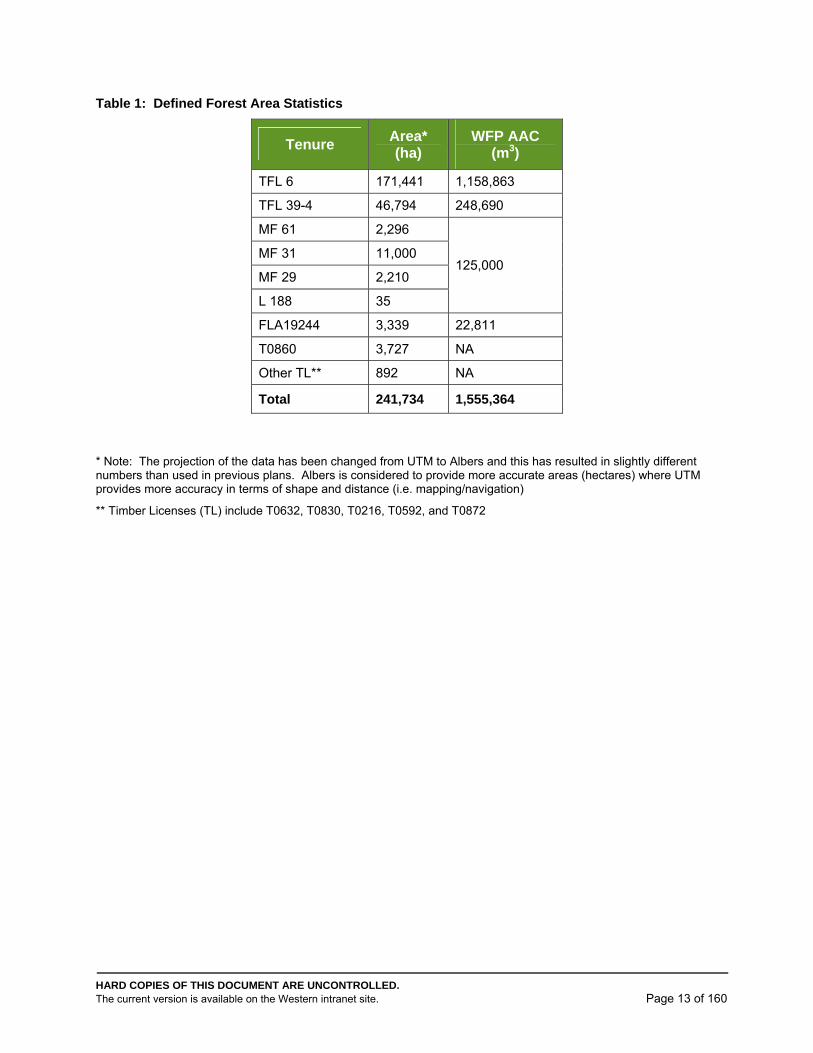
Table 1: Defined Forest Area Statistics
Tenure Area* (ha)
WFP AAC (m3)
TFL 6 171,441 1,158,863
TFL 39-4 46,794 248,690
MF 61 2,296
125,000 MF 31 11,000
MF 29 2,210
L 188 35
FLA19244 3,339 22,811
T0860 3,727 NA
Other TL** 892 NA
Total 241,734 1,555,364
* Note: The projection of the data has been changed from UTM to Albers and this has resulted in slightly different numbers than used in previous plans. Albers is considered to provide more accurate areas (hectares) where UTM provides more accuracy in terms of shape and distance (i.e. mapping/navigation)
** Timber Licenses (TL) include T0632, T0830, T0216, T0592, and T0872
HARD COPIES OF THIS DOCUMENT ARE UNCONTROLLED. The current version is available on the Western intranet site. Page 14 of 160
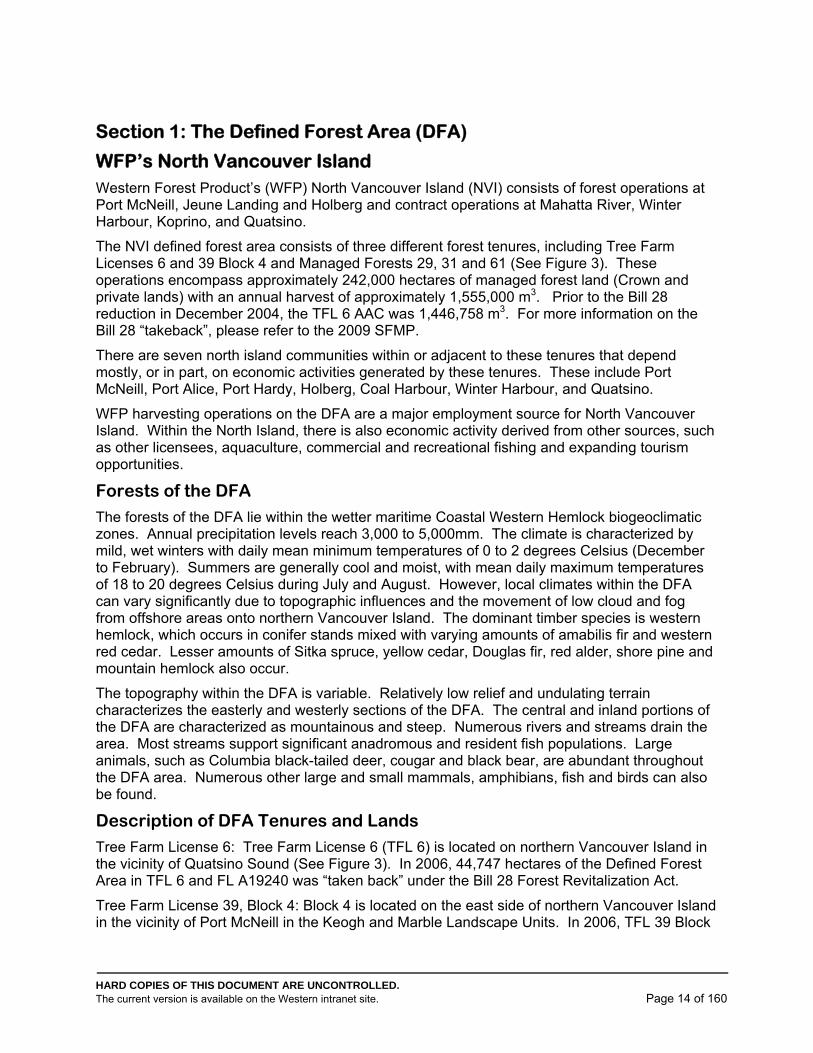
Section 1: The Defined Forest Area (DFA)
WFP’s North Vancouver Island Western Forest Product’s (WFP) North Vancouver Island (NVI) consists of forest operations at Port McNeill, Jeune Landing and Holberg and contract operations at Mahatta River, Winter Harbour, Koprino, and Quatsino.
The NVI defined forest area consists of three different forest tenures, including Tree Farm Licenses 6 and 39 Block 4 and Managed Forests 29, 31 and 61 (See Figure 3). These operations encompass approximately 242,000 hectares of managed forest land (Crown and private lands) with an annual harvest of approximately 1,555,000 m3. Prior to the Bill 28 reduction in December 2004, the TFL 6 AAC was 1,446,758 m3. For more information on the Bill 28 “takeback”, please refer to the 2009 SFMP.
There are seven north island communities within or adjacent to these tenures that depend mostly, or in part, on economic activities generated by these tenures. These include Port McNeill, Port Alice, Port Hardy, Holberg, Coal Harbour, Winter Harbour, and Quatsino.
WFP harvesting operations on the DFA are a major employment source for North Vancouver Island. Within the North Island, there is also economic activity derived from other sources, such as other licensees, aquaculture, commercial and recreational fishing and expanding tourism opportunities.
Forests of the DFA
The forests of the DFA lie within the wetter maritime Coastal Western Hemlock biogeoclimatic zones. Annual precipitation levels reach 3,000 to 5,000mm. The climate is characterized by mild, wet winters with daily mean minimum temperatures of 0 to 2 degrees Celsius (December to February). Summers are generally cool and moist, with mean daily maximum temperatures of 18 to 20 degrees Celsius during July and August. However, local climates within the DFA can vary significantly due to topographic influences and the movement of low cloud and fog from offshore areas onto northern Vancouver Island. The dominant timber species is western hemlock, which occurs in conifer stands mixed with varying amounts of amabilis fir and western red cedar. Lesser amounts of Sitka spruce, yellow cedar, Douglas fir, red alder, shore pine and mountain hemlock also occur.
The topography within the DFA is variable. Relatively low relief and undulating terrain characterizes the easterly and westerly sections of the DFA. The central and inland portions of the DFA are characterized as mountainous and steep. Numerous rivers and streams drain the area. Most streams support significant anadromous and resident fish populations. Large animals, such as Columbia black-tailed deer, cougar and black bear, are abundant throughout the DFA area. Numerous other large and small mammals, amphibians, fish and birds can also be found.
Description of DFA Tenures and Lands
Tree Farm License 6: Tree Farm License 6 (TFL 6) is located on northern Vancouver Island in the vicinity of Quatsino Sound (See Figure 3). In 2006, 44,747 hectares of the Defined Forest Area in TFL 6 and FL A19240 was “taken back” under the Bill 28 Forest Revitalization Act.
Tree Farm License 39, Block 4: Block 4 is located on the east side of northern Vancouver Island in the vicinity of Port McNeill in the Keogh and Marble Landscape Units. In 2006, TFL 39 Block
HARD COPIES OF THIS DOCUMENT ARE UNCONTROLLED. The current version is available on the Western intranet site. Page 15 of 160
4, FL A19244, and various Timber Licences were added to the DFA, as a result of the Western Forest Products’ acquisition of Cascadia Forest Products (See Figure 3).
Forest Licence A19244: This forest licence is in a number of small parcels located near Colony Lake, Kaikash Creek and Klaskish Inlet.
Timber Licenses T0632, T0830, T0592 and T0872: These are scattered around the DFA; primarily located on the West Coast. Timber License T0216 (located near Kaikash Creek) expired in 2012 and is no longer considered part of the DFA. Several other Timber Licenses were sold to another licensee in 2010 and are no longer considered part of the DFA.
Timber License T0860: This TL was added to the DFA in 2006, as a result of the Western Forest Products acquisition of Canadian Forest Products’ Englewood Operation.
Forest License A19240: This licence was removed from the DFA after Bill 28 in 2005. The area is now operated by BC Timber Sales. This area is now shown as “takeback” on the map.
Managed Forest 61: The lands managed in Managed Forest 61 (MF 61) consist of fifty-four parcels of private land forming an almost continuous block within the San Josef River drainage near Holberg on Northern Vancouver Island. The valley is fertile and provides good growing sites for western hemlock, western redcedar and Sitka spruce. These lands are regulated under the Private Managed Forest Land Act and Regulations.
Managed Forests 29 and 31: In 2007, private lands in Managed Forests 29 and 31 were removed from Tree Farm Licence 6 and became regulated under the BC Private Managed Forest Land Act and Regulations.
Management Responsibilities in the DFA TFL 6, TFL 39 Block 4, and FL A19244 are renewable tenures on Provincial Crown land and administered by the Ministry of Forests, Lands and Natural Resource Operations (MFLNRO) under the Forest Act. These tenures are managed by WFP in conjunction with the MFLNRO, Ministry of Environment and other agencies. The primary roles and responsibilities are defined under a variety of legislation including, but not limited to, the Ministry of Forests Act, the Forest Act, and the Forest and Range Practices Act.
The timber licenses located outside of the TFLs are non-renewable licenses within the Kingcome Timber Supply Area.
Managed Forests (MF) 29, 31 and 61 consist of fee simple private land owned and managed by WFP. Responsibilities are defined under a variety of legislation including the Private Managed Forest Land Act and Regulations and the Private Managed Forest Land Council. A Management Commitment for each of the MFs is maintained by WFP.
HARD COPIES OF THIS DOCUMENT ARE UNCONTROLLED. The current version is available on the Western intranet site. Page 16 of 160
Shared Management or Indicator Responsibilities
As the primary licensee in the DFA, WFP takes responsibility for the lead role in the undertaking to develop and implement the SFM System for the DFA. In the spirit of partnership building and the shared responsibility of all interested parties to take a role in sustainable forest management, WFP works with all interested parties in the planning and implementation of sustainable forest management on the DFA.
Where other parties are operating on the DFA (includes use of log dumps) that are not a part of this SFMP, timber harvested must be segregated from certified wood under this plan. This ensures that the Chain of Custody is maintained.
WFP Contractors
Contractors play a significant role in the implementation of the forest activities in the DFA. Contractors work in support of planning, and operational activities (includes road building and harvesting), which is an integral part of this plan. Work undertaken must comply with ISO and CSA certification requirements, and is overseen by WFP. It is their responsibility to ensure that they are working within the bounds of these systems, as well as within all legal framework (legislative and regulatory). In order to work on the DFA, all contractors which may through their actions impact the environment significantly, must be aware of and understand the requirements of the EMS and CSA SFMP, and carry out their work accordingly, taking all precautions to protect the environment.
Contractors must only hire employees that are competent and skilled in their role to fulfill their jobs. The contractors are responsible for supervision and direction of their employees in the implementation of forest activities, and must ensure that they conform to EMS and CSA requirements. No work may take place unless it is planned and approved by WFP, and must be authorized through a Pre-work meeting prior to works beginning. WFP will undertake monitoring and compliance inspections for review of contractor adherence to legislation, regulatory and certification requirements, as well as adherence to the approved plans they are following.
Stakeholders
WFP has an ongoing public involvement process, which has strengthened the creation and application of the SFM Plan. Public meetings, Public Advisory Group meetings, one-on-one communications with stakeholders have all contributed to sustainable forest management on the DFA. Although there are not any specific shared responsibilities between stakeholders and WFP, on-going input and communications serve to ensure that the shared use of the resources and economic opportunities are fair, reduce conflict and ensure the sustainable management of forest resources.
BC Timber Sales Program (BCTS)
The BCTS program (previously named the Small Business Forest Enterprise Program) consisted of 13,242 m3 annually inside TFL 6. Following Bill 28 take backs, this volume was incorporated into the take back area, and is no longer in TFL 6. As a result of the Nootka Island agreement, in 2001 WFP had the silviculture responsibility for about 70% of the remaining SBFEP cutblocks or 624 of the 892 SBFEP hectares. BCTS blocks within the WFP portion of TFLs were formerly reported in indicator data; however, when they left the VINWAG table, their practices would not necessarily conform to WFP’s obligations. These blocks are not formally removed from the DFA; however as BCTS is not bound to WFP’s CSA certification, indicator data will not be derived from any of their activities. In the future if WFP assumes silviculture liability for these lands, they will once again be included. Landscape level data derived from the TFL 6 Management Plan Timber Supply Analysis are already captured in SFM indicators.
HARD COPIES OF THIS DOCUMENT ARE UNCONTROLLED. The current version is available on the Western intranet site. Page 17 of 160
TSL A66259
This First Nation licence within the TFL was proposed by WFP through a “First Nations Timber Access Committee” in the MoFR Region. A non-renewable License of 43,345 m3 annually for 7 years was awarded from the Crown land portions of TFL 6. Timber Sale License (TSL) A66259 was awarded to three First Nations Bands with territories overlapping the DFA - Quatsino, Tlatlasikwala and Kwakiutl.
The TSL A66259 award was evaluated by the government on the basis of primary objectives of encouragement of participation of local communities including First Nations in the management of forest resources, and provision of employment and/or training opportunities. TSL A66259 was a “non-SBFEP” licence, but BCTS will be funding the silviculture. As with BCTS’ own blocks, WFP will not request SFM information for indicators from BCTS annually, as they are not obligated to conform to WFP’s CSA management style.
HARD COPIES OF THIS DOCUMENT ARE UNCONTROLLED. The current version is available on the Western intranet site. Page 18 of 160
First Nations and First Nations Treaty Process The Province of BC, the Government of Canada and First Nations groups are currently in the process of negotiating treaties together. This treaty process is based on the blueprint set-out in the 1991 Report of the BC Claims Task Force, and includes a six stage treaty process which is intended to help negotiate fair and durable treaties. The goal of creating treaties is to resolve conflict over land ownership between the Crown and aboriginal peoples, and to create certainty of jurisdiction over land and resources.
The six stages of BC Treaty negotiations under the BC Treaty Commission (BCTC) are as follows:
Stage 1: Statement of Intent to Negotiate
Stage 2: Readiness to Negotiate
Stage 3: Negotiations of a Framework Agreement
Stage 4: Negotiation of an Agreement in Principle
Stage 5: Negotiation to Finalize a Treaty
Stage 6: Implementation of a Treaty
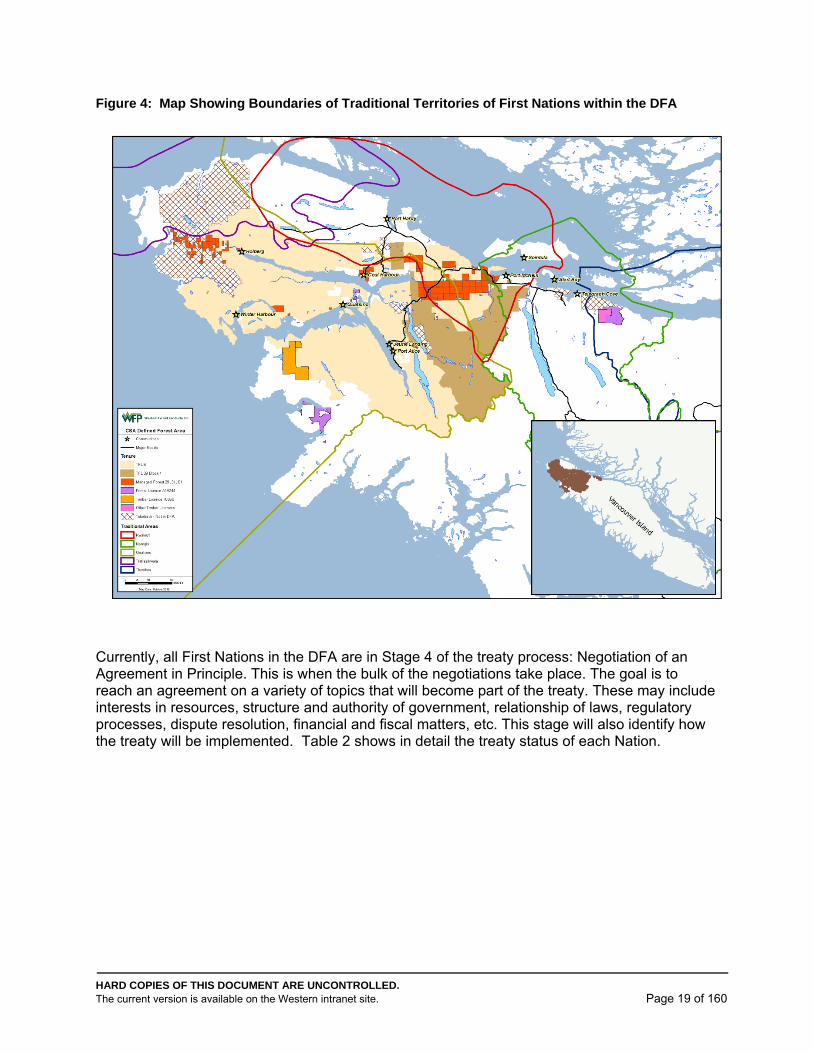
The SFM Plan DFA falls within the traditional territories of the following First Nations:
Quatsino First Nation
Kwakiutl First Nation
Tlowitsis First Nation
Tlatlasikwala First Nation
‘Namgis First Nation
HARD COPIES OF THIS DOCUMENT ARE UNCONTROLLED. The current version is available on the Western intranet site. Page 19 of 160
Figure 4: Map Showing Boundaries of Traditional Territories of First Nations within the DFA
Currently, all First Nations in the DFA are in Stage 4 of the treaty process: Negotiation of an Agreement in Principle. This is when the bulk of the negotiations take place. The goal is to reach an agreement on a variety of topics that will become part of the treaty. These may include interests in resources, structure and authority of government, relationship of laws, regulatory processes, dispute resolution, financial and fiscal matters, etc. This stage will also identify how the treaty will be implemented. Table 2 shows in detail the treaty status of each Nation.
HARD COPIES OF THIS DOCUMENT ARE UNCONTROLLED. The current version is available on the Western intranet site. Page 20 of 160
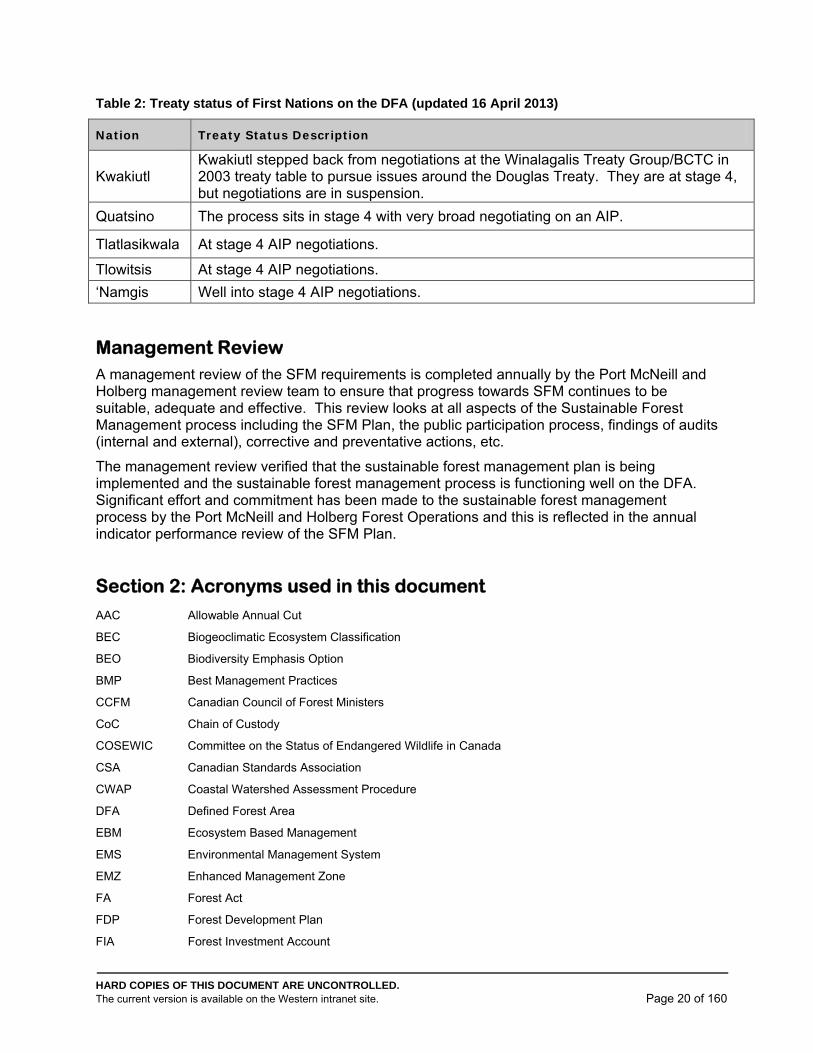
Table 2: Treaty status of First Nations on the DFA (updated 16 April 2013)
Nation Treaty Status Description
Kwakiutl Kwakiutl stepped back from negotiations at the Winalagalis Treaty Group/BCTC in 2003 treaty table to pursue issues around the Douglas Treaty. They are at stage 4, but negotiations are in suspension.
Quatsino The process sits in stage 4 with very broad negotiating on an AIP.
Tlatlasikwala At stage 4 AIP negotiations.
Tlowitsis At stage 4 AIP negotiations.
‘Namgis Well into stage 4 AIP negotiations.
Management Review A management review of the SFM requirements is completed annually by the Port McNeill and Holberg management review team to ensure that progress towards SFM continues to be suitable, adequate and effective. This review looks at all aspects of the Sustainable Forest Management process including the SFM Plan, the public participation process, findings of audits (internal and external), corrective and preventative actions, etc.
The management review verified that the sustainable forest management plan is being implemented and the sustainable forest management process is functioning well on the DFA. Significant effort and commitment has been made to the sustainable forest management process by the Port McNeill and Holberg Forest Operations and this is reflected in the annual indicator performance review of the SFM Plan.
Section 2: Acronyms used in this document
AAC Allowable Annual Cut
BEC Biogeoclimatic Ecosystem Classification
BEO Biodiversity Emphasis Option
BMP Best Management Practices
CCFM Canadian Council of Forest Ministers
CoC Chain of Custody
COSEWIC Committee on the Status of Endangered Wildlife in Canada
CSA Canadian Standards Association
CWAP Coastal Watershed Assessment Procedure
DFA Defined Forest Area
EBM Ecosystem Based Management
EMS Environmental Management System
EMZ Enhanced Management Zone
FA Forest Act
FDP Forest Development Plan
FIA Forest Investment Account
HARD COPIES OF THIS DOCUMENT ARE UNCONTROLLED. The current version is available on the Western intranet site. Page 21 of 160
FPC Forest Practices Code
FPPR Forest Practices and Procedures Regulation
FRBC Forest Renewal British Columbia
FRPA Forest Range and Practices Act
FSP Forest Stewardship Plan
GAR Government Actions Regulation
GMZ General Management Zone
GIS Geographic Information System
GMO Genetically modified organism
HCV High Conservation Value
ILMB Integrated Land Management Bureau
ISO International Organization for Standardization
LU Landscape Unit
MoE Ministry of Environment (formerly MoELP, MWLAP)
MF Managed Forest
MFR BC Ministry of Forests and Range (previously MoF)
MP Management Plan
NPP Net primary production
OGMA Old Growth Management Area
PAG Public Advisory Group
PEFC Program for endorsement of forest certification schemes
VINWAG Vancouver Island North Woodlands Advisory Group
NSR Not Satisfactorily Restocked
NTFP Non-Timber Forest Product
NTU Nephelometric Turbidity Unit
PFLA Private Forest Land Act
RMZ Riparian Management Zone
RRZ Riparian Reserve Zone
SARA Species at Risk Act
SFM Sustainable Forest Management
SMZ Special Management Zone
SP Silviculture Prescription or Site Plan
SCC Standards Council of Canada
TFL Tree Farm License
WHA Wildlife Habitat Area
WTP / WTRA Wildlife Tree Patch / Wildlife Tree Retention Area
HARD COPIES OF THIS DOCUMENT ARE UNCONTROLLED. The current version is available on the Western intranet site. Page 22 of 160
Glossary of Terms Aboriginal: “aboriginal peoples of Canada’ [which] includes Indian, Inuit and Métis peoples of Canada” (Constitution Act 1982 s35(2))
Aboriginal Right: “in order to be an Aboriginal right an activity must be an element of a practice, custom, or tradition (or an element thereof) integral to the distinctive culture of an Aboriginal group claiming that right”. [R. v. Van der Peet, 1996]
Aboriginal Title: “…is a right to the land itself, is a collective right to the land held by all members of an aboriginal organization. …encompasses the right to use the land pursuant to that title for a variety of purposes, which need not be aspects of those aboriginal practices, cultures and traditions which are integral to the distinctive aboriginal cultures”. [Delgamuukw v. British Columbia, 1997]
Aboriginal treaty rights “...are those contained in official agreements between the Crown and the native peoples”. [R. v. Badger 1996]
Accreditation: the procedure by which the Standards Council of Canada (SCC) gives formal recognition that a registrar (certifier) is deemed competent to carry out specific tasks.
Accreditation body: authoritative body that performs accreditation. Note: The authority of an accreditation body is generally derived from government [ISO/IEC 17000]
Adaptive Management: a learning approach to management that recognizes substantial uncertainties in managing forests and incorporates into decisions experience gained from the results of previous actions.
Allowable Annual Cut (AAC): the allowable rate of timber harvest from a specified area of land. The Chief Forester of British Columbia sets the AAC for woodlots, timber supply areas (TSAs) and tree farm licenses (TFLs) in accordance with section 8 of the Forest Act.
At-risk species: see Species at-risk
Auditor: a person qualified to undertake audits. Note: for SFM registration audit, auditors are qualified according to the requirements set out in CAN-P-14B and CAN-P-1518.
Biogeoclimatic Ecosystem Classification (BEC): developed in BC in 1965, the BEC System classifies areas of similar regional climate, expected climax plant communities and site factors such as soil moisture and soil nutrients. The subzone is the basic unit of this classification system. Within subzones, variants further identify more local climatic factors.
Biogeoclimatic zone: a geographic area having similar patterns of energy flow, vegetation and soils as a result of a broadly homogenous macroclimate.
Biogeoclimatic variant: see Biogeoclimatic Ecosystem Classification.
Biodiversity (Biological Diversity): “the variability among living organisms from all sources, including their inter alia, terrestrial, marine and other aquatic ecosystems and the ecological processes which they are part; this includes diversity within species, between species and ecosystems” (Environment Canada, Canadian Biodiversity Strategy).
Biomass: the total amount (mass) of living matter in a given ecosystem, population, or sample. Note: In the context of sustainable forest management, biomass usually refers to plant matter.
Blue-listed: refers to plants, animals, and plant communities assessed by the BC Conservation Data Center or COSEWIC to be vulnerable.
HARD COPIES OF THIS DOCUMENT ARE UNCONTROLLED. The current version is available on the Western intranet site. Page 23 of 160
CAN/CSA-ISO 14001: an internationally recognized environmental management system standard revised in 2004 by the International Organization for Standardization. Note: CAN/CSA-ISO 14001 has been approved as a National Standard of Canada by the Standards Council of Canada.
Clearcut: a silviculture system that removes the entire stand of trees in a single harvesting operation from an area that is one hectare or greater and at least two tree heights in width. In addition, the silviculture system is designed to manage the area as an even-aged stand. (Forest Practices Code of BC, Operational and Site Planning Regulation).
Certification: the result of a successful certification process in conformance with this Standard, whereby the certification body issues a certification certificate and adds the organization’s certification to a publicly available list maintained by the certification body. Note: Certification of a management system is sometimes also called registration.
Canadian Standards Association (CSA) Standard: refers to CSA Z809-02, a National Standard for Canada for a SFM System. It describes the components and performance objectives of a SFM system that when applied to a DFA will ensure that forest management objectives are set for the critical elements of the CCFM SFM criteria.
Certificate of Registration (Registration Certificate): the official document issued by a registrar to an organization upon successful completion of the registration process, including the registration audit.
Certification/Registration: the result of a successful registration audit to the CSA standard, whereby the registrar issues a certificate of registration and adds the organization’s registration to a publicly available list maintained by the registrar. The certification process is described in Annex A of the Z809-02 Standard.
Certification applicant: an organization that has applied to an accredited certification body for certification to this Standard.
Certification audit: a systematic and documented verification process used to obtain and evaluate evidence objectively in order to determine whether an organization meets the SFM requirements of this Standard.
Certification body: an independent third party that is accredited as being competent to certify organizations with respect to nationally and internationally recognized standards.
Certification certificate: the official document issued by a certification body to an organization upon successful completion of the certification process (including the certification audit).Certifier (Registrar): an independent third party that is accredited by the SCC as being competent to register organizations with respect to nationally and internationally recognized standards.
Chief Forester: the assistant deputy minister of the deputy minister of the Ministry of Forests who is responsible for determining allowable annual cuts (AACs).
Coarse woody debris: all large deadwood in various stages of decomposition. Note: Coarse woody debris includes standing dead trees, fallen wood, stumps, and roots.
Coastal Watershed Assessment Procedure (CWAP): assesses the impacts of forest practices on the hydrologic regime of a watershed. In particular, the potential for changes to peak stream flows, accelerated landslide activity, accelerated surface erosion, channel bank erosion and changes to channel morphology as a result of logging the riparian vegetation, and changes to the stream channel interaction from all these processes are assessed.
Complaint: an expression of dissatisfaction, other than an appeal, by any person or organization to a certification body or an accreditation body related to the activities of that body, where a
HARD COPIES OF THIS DOCUMENT ARE UNCONTROLLED. The current version is available on the Western intranet site. Page 24 of 160
response is expected. Note: In Canada, the accreditation body for certification bodies conducting audits to this Standard is the Standards Council of Canada.
Compliance: the conduct or results of activities in accordance with legal requirements.
Conformance: meeting non-legal requirements such as policies, work instructions or standards (including the CSA standard).
Continual Improvement: the ongoing process of enhancing SFM performance using
(a) experience;
(b) assessment of results;
(c) the incorporation of new knowledge in line with the organization’s SFM policy; and
(d) the application of SFM requirements.
Corrective Action: action to eliminate the cause of a detected nonconformity or other undesirable situation. Note: there can be more than one cause for a non-conformity. Corrective action is taken to prevent recurrence, whereas preventative action is taken to prevent occurrence.
Cutblock: is an area within which an agreement holder is authorized to harvest timber as identified within a cutting permit or within the agreement itself (if the agreement does not authorize cutting permits). (Forest and Range Practices Act, Forest Planning and Practices Regulation).
Cutting Permit (CP): authorizes harvesting on a cutblock. CPs are granted by the MoFR upon application by licensees. Licensees must also obtain road permits before they can construct roads to access cutblocks. Once the permits are issued, a licensee may then proceed with forest development (i.e., road construction, logging operations). If a site plan is to be prepared, CPs can be applied for prior to completion of the site plan, however, harvesting and road operations must not commence until a site plan has been completed.
Cultural Heritage Resource (CHR): an object, a site or the location of a traditional societal practice that is of historical, cultural or archaeological significance to the province, a community or an aboriginal people. Cultural heritage resources include archaeological sites, structural features, heritage landscape features and traditional use sites.
Defined Forest Area (DFA): a specific area of forest, including land and water (regardless of ownership or tenure) to which the requirements of the CSA standard apply. The DFA may or may not consist of one or more contiguous blocks or parcels.
Deforestation: “clearing an area of forest for another long-term use (The State of Canada’s Forests 2001/2002).
DFA-related worker: any individual employed by the organization to work for wages or a salary who does not have a significant or substantial share of the ownership in the employer’s organization and does not function as a manager of the organization.
District Manager: the manager of a Forest Service district office, with responsibilities as outlined in the Forest Act, Ministry of Forests Act, Range Act, Forest Practices Code of British Columbia Act and Forest and Range Practices Act.
Ecological Cycles: refers to the major nutrient cycles (i.e. carbon and nitrogen) and the hydrological cycle.
HARD COPIES OF THIS DOCUMENT ARE UNCONTROLLED. The current version is available on the Western intranet site. Page 25 of 160
Ecosystem: a dynamic complex of plants, animals and micro-organisms in their non-living environment, interacting as a functioning unit. Note: “the term ecosystem can describe small-scale units, such as a drop of water, as well as large-scale units, such as the biosphere” (Environment Canada, Canadian Biodiversity Strategy).
Ecosystem Based Management (EBM): approach to natural resource management that combines ecological, social and economic considerations toward achieving the goal of sustaining natural resources.
Element: the subcategory used to define the scope of each SFM criterion. Note: Each SFM criterion contains several elements. The SFM elements were derived from the national-scale elements developed by the CCFM for more specific local applications.
Environment: the surroundings in which an organization operates, including air, water, land, natural resources, flora, fauna, humans and the interrelations of these elements.
Environmentally Sensitive Area (ESA): area requiring special management attention to protect important scenic values, fish and wildlife resources, historical and cultural values, or other natural systems or processes. ESAs include unstable soils that may deteriorate unacceptably after harvesting, and areas of high value to non-timber resources such as fisheries, wildlife, water and recreation.
Environmental Management System (EMS): a structured system for identifying and ranking the environmental risk associated with management activities; creating and implementing control methods to manage that risk; monitoring and assessing performance; and taking corrective action to address deficiencies under a continual improvement program.
Fish habitat “spawning grounds and nursery, rearing, food supply, and migration areas on which fish depend directly or indirectly to carry out their life processes”. [Fisheries Act, 1985]
Focal species: species that warrant special conservation attention and are thus used to guide the management of ecosystems to conserve biodiversity. Note: Criteria for the selection of focal species can include ecological, socio-cultural, scientific, and economic considerations.
Forecast: An explicit statement of the expected future condition of an indicator.
Forest: an ecosystem dominated by trees and other woody vegetation growing more or less closely together, its related flora and fauna, and the values attributed to it.
Forest Condition: the state of the forest ecosystem as determined by a range of variables associated with forest structure, composition and processes.
Forest Development Plan (FDP): an FDP was an operational plan under the Forest Practices Code of BC that provided the public and government agencies with information about the location and scheduling of proposed roads and cutblocks for harvesting timber over a period of at least five years.
Forestland: land supporting forest growth or capable of doing so, or, if totally lacking forest growth, bearing evidence of former forest growth and now in disuse.
Forest License (FL): a renewable tenure to harvest a volume apportioned within a Timber Supply Area. Tenure term is up to 20 years. Chart areas define operating areas.
Forest Practices Code (FPC): the `Forest Practices Code’ is a term commonly used to refer to the former Forest Practices Code of British Columbia Act, the regulations made by Cabinet under the act and the standards established by the chief forester. The term may sometimes be used to refer to the guidebooks as well.
HARD COPIES OF THIS DOCUMENT ARE UNCONTROLLED. The current version is available on the Western intranet site. Page 26 of 160
Forest Stewardship Plan (FSP): a FSP is an operational plan under the Forest and Range Practices Act, which addresses the 11 FRPA objectives. It is approved by the Minister of Forests and Range. The FSP allows for delineation of Forest Development Units (FDUs) that demonstrate areas of future forest operations, and the results and strategies that apply.
Forest and Range Practices Act (FRPA): the Act and regulations introduced Jan. 31, 2004. Any activities already approved under the existing Forest Practices Code may continue and are governed by the Forest Practices Code of British Columbia Act and its regulations. After Dec. 31, 2005, all planning and on-the-ground work must comply with the Forest and Range Practices Act and regulations.
Free Growing (free to grow): a stand of healthy trees of ecologically suitable, commercially valuable species, the growth of which is not impeded by competition from plants, shrubs or other trees. Silviculture regulations and stocking standards define the criteria (e.g., species, density and size) that a regenerating forest must meet to be declared free growing.
Genetically modified organism (GMO) an organism that, through human intervention in a laboratory, has had its genome or genetic code deliberately altered through the mechanical insertion of a specific identified sequence of genetic coding material (generally DNA) that has been either manufactured or physically excised from the genome of another organism. Note: Genetic modification can be used to alter a wide range of traits, including insect and disease resistance, herbicide tolerance, tissue composition, and growth rate (adapted from Alberta Forest Genetic Resources Council statement).
Guidebook: guidebooks were one of the four components of the Forest Practices Code. Guidebooks consist of guidelines and recommendations intended to help users exercise their professional judgement in developing site-specific management strategies and prescriptions designed to accommodate resource management objectives. Guidebooks constitute part of the “non-legal” realm of FRPA, and MFR Guidebooks can be used or other guidance developed using appropriate expertise.
Higher Level Plan: some of the objectives for forest resources in a strategic land use plan can be “declared” as a legal requirement under the Government Actions Regulation (GAR).
Identified Wildlife: Identified Wildlife are species at risk that have been designated by the Chief Forester (Ministry of Forests) and Deputy Minister (MoE) as requiring special management attention during forest and range operational planning or higher level planning.
Identified Wildlife Management Strategy (IWMS): Its goal is to preserve elements of biodiversity that are not addressed through other components of the FPC. For the most part these are threatened and endangered species (i.e., Vancouver Island Marmots) or plant communities (i.e., Douglas-fir / Garry Oak - onion grass). The Identified Wildlife Management Strategy provides foresters and ranchers with best management practices for managing habitats for these species and plant communities. The management practices must be followed within areas set aside for a particular species or plant community. These areas are called "wildlife habitat areas" and are officially designated under the Government Actions Regulation (GAR).
Independent (impartial): free from bias. Note: a registrar is not considered independent (impartial) if, in the two years preceding an audit, it or any of its personnel, subcontractors or relate bodies provided or have provided assistance or consulting services to the organization being audited and, as a result of the audit, certified (see definition of Related body).
Indicator: a variable that measures or describes the state or condition of a value.
Inoperable: forested areas that are expected to be unsuited for commercial timber production due to high elevation, rugged topography, inaccessible location, low timber value, small average

HARD COPIES OF THIS DOCUMENT ARE UNCONTROLLED. The current version is available on the Western intranet site. Page 27 of 160
timber size, steep or unstable soils, protection of the environment, or difficulty to reforest. Areas designated as parks, wilderness areas, or other uses incompatible with timber harvest are included in many definitions.
Interested Party: an individual or organization interested in and affected by the activities of the management and DFA.
Invasive alien species: plants, animals, or micro-organisms that have been introduced by human action outside their natural past or present distribution, and whose introduction or spread threatens the environment, the economy, or society, including human health. [CFIA, 2006]
ISO 14001: an internationally recognized environmental management system standard published in 1996 by the International Organization for Standardization. The ISO 14001 Standard has been approved as a National Standard of Canada by the Standards Council of Canada.
Landing: an area modified as a place to accumulate logs before they are transported.
Landscape level: a watershed, or series of interacting watersheds or other natural ecological units. This term is used for conservation planning and is not associated with visual landscape management.
Landscape unit: a planning area, designated by a district manager under the FPC, delineated on the basis of geographic and/or ecological features such as watersheds. Once a district manager establishes a landscape unit, the district manager must also establish objectives. Typically they cover a watershed or series of watersheds, and range in size from 5000 to 100,000 ha.
Long-Term: in the context of making forecasts of forest structure and composition, at a minimum, twice the average life expectancy of the predominant trees in a DFA , up to a maximum of 300 years.
Managed Forest (MF): forest land that is being managed under a forest management plan. North Island’s MF 19 is an area of privately owned land designated for commercial forestry.
Management Plan (MP): TFL management plans usually cover a period of five years and specify proposed management to establish, tend, protect and harvest timber resources and to conserve other resource values. MPs include inventories of the forest, recreation, fisheries, wildlife, range and cultural heritage resources in the tree farm License area. They include a timber supply analysis that analyzes the short term and long term availability of timber for harvesting in the tree farm License area, including the impact of management practices on the availability of forest values.
Mature forest: generally, stands of timber where the age of the leading species is greater than the specified cutting age. Cutting ages are established to meet forest management objectives. In the Port McNeill SFM Plan, mature is defined as forest areas established before 1864 and includes old growth
Migratory bird: the sperm, eggs, embryos, tissue cultures, and other parts of a migratory bird as defined in the Migratory Birds Convention Act, 1994.
Native species: a species that occurs naturally in an area; a species that is not introduced.
Non-Timber Forest Products (NTFPs): all forest products except timber, including other materials obtained from trees such as resins and leaves, as well as any other plant and animal products.
HARD COPIES OF THIS DOCUMENT ARE UNCONTROLLED. The current version is available on the Western intranet site. Page 28 of 160
Not Satisfactorily Restocked (NSR): productive forest land that has been denuded and has not yet been regenerated to the specified stocking standards for the site.
Objective: a broad statement describing a desired future state or condition of a value.
Old growth: a forest that contains live and dead trees of various sizes, species, composition and age class structure. Old-growth forests, as part of a slowly changing but dynamic ecosystem, include climax forests but not sub-climax or mid-seral forests. The age and structure of old growth varies significantly by forest type and from one biogeoclimatic zone to another. As a rough measure, forests on the BC Coast that are aged 250 years or older and exhibit few or no signs of human intervention are generally termed old growth. (See also second growth and mature.)
Old-growth Management Area (OGMA): an area established under a higher-level plan that contains, or is managed to replace specific structural old-growth attributes and which are mapped out and treated as special management areas.
Opening: usually used synonymously with cutblock (see above) to include all of an area that has been harvested or is designated for harvesting, including the trees retained singly or in groups within the area. Less often, used to describe the actual cleared area(s) within a cutblock.
Organization: a company, corporation, firm, enterprise, authority, or combination thereof, whether incorporate or not, public or private, that has its own functions and administration and that, for the purpose of the CSA standard, applies for certification. Note: for organizations with more than one operating unit (for example, a division), a single operating unit may be defined as an organization.
Permanent Access Structure: a built structure, including a road, bridge, landing, gravel pit, etc.
Personnel: management, contractors and DFA-related workers employed by the organization.
Plantation: a forest area that does not follow natural succession patterns due to reforestation involving high-intensity silviculture practices. Notes: (1) Plantations are highly managed treed areas with few natural characteristics; they are generally managed for a single purpose. (2) Not all areas subjected to intensive silvicultural treatments are plantations.
Preventative Action: action to eliminate the cause of a potential non-conformity or other undesirable. Note: There can be more hat one cause for a potential non-conformity. Preventative action is taken to prevent occurrence whereas corrective action to take to prevent recurrence.
Private Woodlot Owner: an individual, or group of individuals, who privately own forestland. For the purposes of the CSA standard, private woodlots are those recognized as “woodlots” by the woodlot owner association in each province.
Productive Forest: forest land that is capable of producing a merchantable stand of timber within a defined period of time.
Productivity: the natural ability of a forest ecosystem to capture energy, support life forms and produce goods and services.
Protected area: an area of land and/or sea specifically dedicated to the protection and maintenance of biological diversity and of natural and associated cultural resources, and managed through legal or other effective means. [IUCN, 1994]
HARD COPIES OF THIS DOCUMENT ARE UNCONTROLLED. The current version is available on the Western intranet site. Page 29 of 160
Protected Area Strategy (PAS): a BC strategy to develop and expand the provincial protected area system. This includes representative examples of natural diversity, and special, natural, recreational, or cultural heritage features.
Red-listed: refers to plants, animals and plant communities assessed by the BC Conservation Data Centre or COSEWIC to be extirpated, endangered or threatened.
Reforestation: re-establishment of trees on forested land following natural (e.g., fire) or human (e.g., timber harvest) disturbance, by natural or artificial (e.g., planting) means.
Regional Land Use Plans (RLUP): the regional land use plan (RLUP) is a strategic land use plan that defines land and resource values, and provides goals for these values at a regional level. It provides a strategy to maintain and/or protect these values by establishing land-use categories, which define the type of resource management that will occur there. The Vancouver Island Land Use Plan is an example.
Registrar/Certifier: an independent third party that is accredited by the SCC as being competent to register organizations with respect to nationally and internationally recognized standards.
Registration Applicant: an organization that has applied to an accredited registrar for certification to the CSA standard.
Registration Audit: a systematic and documented verification process used to obtain and evaluate evidence objectively in order to determine whether the organization meets the SFM requirements set out in the CSA standard.
Registration/Certification: the result of a successful registration audit to the CSA standard, whereby the registrar issues a certificate of registration and adds the organization’s registration to a publicly available list maintained by the registrar. The certification process is described in Annex A of the Z809-02 Standard.
Related Body: a body linked to the registrar/certifier by common ownership or directors, contractual arrangement, a common name, informal understanding, or other means such that the related body has a vested interest in the outcome of an audit or has the potential ability to influence the outcome of an audit.
Reserve Zones: zones where timber harvesting is not permitted.
Riparian: an area of land adjacent to a stream, river, lake or wetland that contains vegetation that, due to the presence of water, is distinctly different from the vegetation of adjacent upland areas.
Riparian Management Zone (RMZ): an area of a width adjacent to streams or Riparian Reserve Zones in which management objectives for riparian or habitat attributes are considered. The width of these zones is determined by attributes and classification of streams, wetlands or lakes, and adjacent terrestrial ecosystems.
Riparian Reserve Zone (RRZ): an area of a width adjacent to streams in which harvest is restricted by regulation. The width of these zones is determined by attributes and classification of streams, wetlands or lakes, and adjacent terrestrial ecosystems.
Sensitive Soils: forest land areas that have a high to very high hazard (coastal forests) for soil compaction, erosion, or displacement.
Seral stage: an identifiable stage of vegetative recovery following a disturbance. Note: Disturbances include fire, blowdown, and timber harvest.
SFM Performance: the assessable results of SFM as measured by the level of achievement of the targets set for the DFA.
HARD COPIES OF THIS DOCUMENT ARE UNCONTROLLED. The current version is available on the Western intranet site. Page 30 of 160
SFM Policy: a statement by the organization of intentions and principles in relation to SFM, which provides a framework for objectives, targets, practices and actions.
SFM Requirements: the public participation, performance, and system requirements found in Clauses 4-7 of the CSA standard.
SFM System: the structure, responsibilities, practices, procedures, processes and time frames set by a registrar for implementing, maintaining and improving SFM.
Short-term Operational Plans: annual or five-year plans.
Silviculture: the art and science of controlling the establishment, growth, composition, health and quality of forests and woodlands. Silviculture entails the manipulation of forest and woodland vegetation in stands and on landscapes to meet the diverse needs and values of landowners and society on a sustainable basis.
Silviculture Prescription: a site-specific operational plan (under FPC) that describes the forest management objectives for harvesting and reforestation.
Silvicultural system: a planned program of treatments throughout the life of the stand to achieve defined objectives. A silviculture system includes harvesting, regeneration and stand tending. It covers all activities for the entire length of a rotation or cutting cycle. In BC this includes eight major categories: clearcut, clearcut with reserve, patch-cut, coppice, seed tree, shelterwood, retention and selection.
Site Plan (SP): a site-specific operational plan (under FPC or FRPA) that replaces the Silviculture Prescription. Content requirements are specified in regulation. Site Plans under the FPC are similar in content to the Silviculture Prescription. Site Plans under FRPA are designed to be more “results based” by describing how the results and strategies specified within the FSP apply to the site rather than specifying the results and strategies within the document itself.
Snag: A large, standing dead tree.
Special Management Zone (SMZ): an area under a strategic land use plan, where special management is needed to address sensitive values such as fish and wildlife habitat, visual quality, recreation, tourism and cultural heritage features. The management intent of SMZs is to maintain these values while allowing some level of compatible resource extractive use and development.
Species at-risk: the species considered "at risk" by the Committee on the Status of Endangered Wildlife in Canada (COSEWIC) are listed in five categories: Special Concern, Threatened, Endangered, Extirpated, and Extinct. These include, but are not limited to, Red and Blue listed species. Species at risk are found within the schedules of the federal Species at Risk Act.
Species At Risk Act (SARA): legislation introduced in order to protect species within Canada identified as “Species at Risk” under SARA.
Standard: a document, established by consensus and approved by a recognized body, that provides, for common and repeated use, rules, guidelines or specifications for activities or their results, aimed at the achievement of the optimum degree of consistency in a given context. Note: standards should be based on the consolidated findings of science, technology and experience and should be aimed at the promotion of optimum community benefits.
Stand level: level of forest management at which a relatively homogenous (usually small) land unit can be managed under a single prescription, or a set of treatments, to meet well-defined objectives.
Strategy: a coordinated action set designed to meet established targets.
HARD COPIES OF THIS DOCUMENT ARE UNCONTROLLED. The current version is available on the Western intranet site. Page 31 of 160
Strategic Land Use Plans: a plan at the regional, sub-regional, and, in some cases, at the local level, which results in land use allocation and/or resource management direction. Strategic land use planning at the regional and sub-regional level involves the preparation of resource management zones, objectives and strategies. Portions of these strategic plans may become designated as higher level plans under the FPC, if they meet set criteria.
Sustainable Forest Management (SFM): management to maintain and enhance the long-term health of forest ecosystems, while providing ecological, economic, social, and cultural opportunities for the benefit of present and future generations.
Sustainable Forest Management Performance: the assessable results of SFM as measured by the achievement or lack thereof of established objectives for a defined forest area.
Sustainable harvest level: the harvest level of forest products that, with consideration for ecological, economic, social, and cultural factors, leads to no significant reduction of the forest ecosystem’s capacity to support the same harvest level in perpetuity.
Target: a specific statement describing a desired future state or condition of an indicator. Targets should be clearly defined, time limited and quantified if possible.
Tenure: the terms under which a forest manager or owner possesses the rights and assumes the responsibilities to use, harvest or manage one or more forest resources in a specified forest area for a specified period of time. Note: private ownership of forestland is the strongest form of tenure as the rights and obligations rest solely with the forest owner. Forest tenures on public land in Canada fall into two main categories: area-based and volume-based. Area-based tenures not only confer timber harvest rights but also usually oblige the tenure holder to assume forest management responsibilities. Volume-based tenures normally give the holder the right to harvest specific volumes of timber in areas specified by the landowner or manager, but can also oblige holders to assume forest management responsibilities.
Timber Supply Analysis: an assessment of future timber supplies over long planning horizons by using timber supply models for different scenarios identified in the planning process. Timber supply analyses forecast the long term affects of management options on timber and forest values availability.
Timber supply area (TSA): an integrated resource management unit established in accordance with section 6 of the Forest Act.
Top Management: persons with decision-making authority regarding SFM policy, resource allocation and planning within the DFA.
Total Resource Plan: a plan for long-term use of the forest development that guides resource use, such as logging, road building and recreation activities, over an entire area (such as a watershed); and that describes how approved objectives for identified resource values will be achieved on the ground.
Tree Farm License (TFL): privately managed sustained yield units. TFLs are designed to enable owners of Crown-granted forestlands and old temporary tenures or the timber Licenses, which replace them; to combine these with enough unencumbered Crown land to form self-contained sustained yield management units. These Licenses commit the licensee to manage the entire area under the general supervision of the MoFR. Cutting from all lands requires MoFR approval through the issuance of cutting permits or road permits. TFLs should not be confused with Tree Farms under the Taxation Act; though some Tree Farm land (Crown-granted) may comprise a part of the TFL. A TFL is renewable and has a term of 25 years.
Value: a DFA characteristic, component or quality considered by an interested party to be important in relation to a CSA element or other locally identified element.
HARD COPIES OF THIS DOCUMENT ARE UNCONTROLLED. The current version is available on the Western intranet site. Page 32 of 160
Visual Quality Objective (VQO): an approved resource management objective that reflects a desired level of visual quality based on the physical and sociological characteristics of the area; refers to the degree of acceptable human alteration to the characteristic landscape.
Watershed: the total land area from which water drains into a particular stream or river. [Hubbard et al., 1998]
Wildlife Habitat Areas (WHA): designated areas of land and water that support specific wildlife or groups of wildlife.
Wildlife Tree: a standing live or dead tree with particular values, such as old-growth characteristics, tree size or structure, that provide or recruit valuable habitat for the conservation or enhancement of wildlife.
Wildlife Tree Patch (WTP) / Wildlife Tree Retention Area (WTRA): wildlife trees retained in or around cutblocks to achieve stand level biodiversity strategies.
Windthrow: trees uprooted as a result of wind events.
Yarding: in logging, the hauling of felled timber to the landing or temporary storage site from where trucks (usually) transport it to the mill site. Yarding methods include cable yarding, ground skidding, and aerial methods such as helicopter yarding.
HARD COPIES OF THIS DOCUMENT ARE UNCONTROLLED. The current version is available on the Western intranet site. Page 33 of 160
Section 3: SFM Criteria, Values, Objectives, Indicators & Targets (VOIT’s) and Annual Performance Reporting This section of the SFM Plan describes North Vancouver Islands’ (NVI) SFM Values, Objectives, Indicators and Targets. As appropriate, an Acceptable Variance is provided for the near term performance level of each Target and a forecasted future condition is provided for each Indicator. The section is organized according to the Criteria for Sustainable Forest Management, which was developed by the Canadian Council of Forest Ministers and adapted for the Canadian Standards Association’s Sustainable Forest Management standard (CAN/CSA-Z809-08).
As further explanation of the organization of this section:
The Criteria (e.g., below: 1.0 Conservation of Biological Diversity) and Critical Elements (e.g., 1.1 Ecosystem diversity) and their accompanying statements are derived from Defining Sustainable Forest Management: A Canadian Approach to Criteria and Indicators (Canadian Council of Forest Ministers, Ottawa, 1995).
The subsidiary Values, Objectives, Indicators, Targets, Acceptable Variances and Forecasts were developed for this plan during discussions among VINWAG and FNIEG members, NVI Forest Operation’s staff and other Western Forest Products staff.
As used in this plan:
Values are DFA characteristics, components, or qualities considered by the advisory groups to be important in relation to a CSA SFM element or other locally identified element.
Objectives are broad statements describing a desired future state or condition of a value.
Indicators are variables that measure or describe the state or condition of a value.
Targets are specific statements describing a desired future state of condition of an indicator. Where possible, targets are clearly defined, time-limited and quantified.
Acceptable Variances specify the range of performance results (+ and/or – relative to the Target) that is deemed to be an acceptable outcome. A result outside this range does not always indicate unacceptable performance. (For example, it could reflect: the impact of an uncontrollable event, such as a natural disaster; the fact that the Target was based on poor quality or inadequate data; or the effects of a responsible choice between two competing Objectives.) A result outside the Acceptable Variance range does, however, require review, assessment and, possibly, a revision of either the objective, target or management practices.
Forecasts are explicit statements of the expected future condition of an indicator.
Legal References are provided where they exist.
Performance Reporting On an annual basis, the SFM Plan will be updated to include performance reporting information in order to facilitate review of the actual outcomes of each indicator (this will be reported within Appendix 2). Most indicators, (but not all) are reported on an annual basis from January 1 – December 31. The monitoring report (Data Set) is completed by NVI Forest Operations Management, and presented for review to VINWAG and FNIEG each year. Western Forest Products maintains a matrix which assigns the responsibilities of each indicator to key staff.
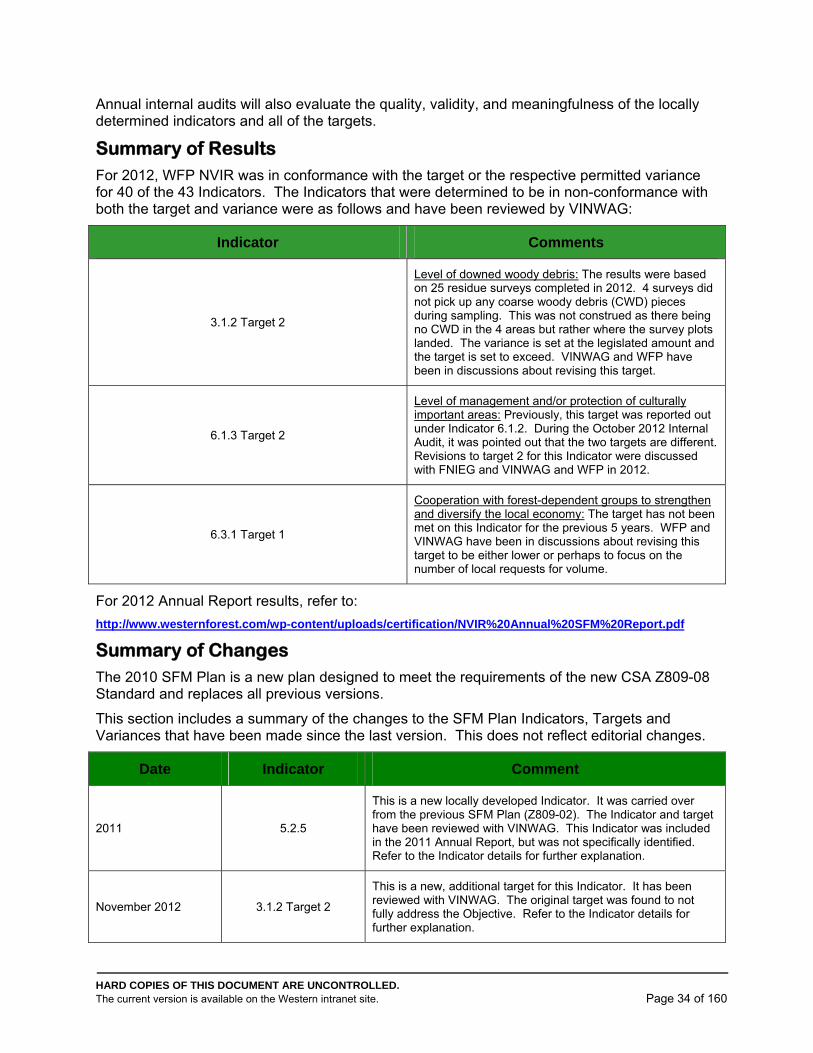
HARD COPIES OF THIS DOCUMENT ARE UNCONTROLLED. The current version is available on the Western intranet site. Page 34 of 160
Annual internal audits will also evaluate the quality, validity, and meaningfulness of the locally determined indicators and all of the targets.
Summary of Results For 2012, WFP NVIR was in conformance with the target or the respective permitted variance for 40 of the 43 Indicators. The Indicators that were determined to be in non-conformance with both the target and variance were as follows and have been reviewed by VINWAG:
Indicator Comments
3.1.2 Target 2
Level of downed woody debris: The results were based on 25 residue surveys completed in 2012. 4 surveys did not pick up any coarse woody debris (CWD) pieces during sampling. This was not construed as there being no CWD in the 4 areas but rather where the survey plots landed. The variance is set at the legislated amount and the target is set to exceed. VINWAG and WFP have been in discussions about revising this target.
6.1.3 Target 2
Level of management and/or protection of culturally important areas: Previously, this target was reported out under Indicator 6.1.2. During the October 2012 Internal Audit, it was pointed out that the two targets are different. Revisions to target 2 for this Indicator were discussed with FNIEG and VINWAG and WFP in 2012.
6.3.1 Target 1
Cooperation with forest-dependent groups to strengthen and diversify the local economy: The target has not been met on this Indicator for the previous 5 years. WFP and VINWAG have been in discussions about revising this target to be either lower or perhaps to focus on the number of local requests for volume.
For 2012 Annual Report results, refer to:
http://www.westernforest.com/wp-content/uploads/certification/NVIR%20Annual%20SFM%20Report.pdf
Summary of Changes The 2010 SFM Plan is a new plan designed to meet the requirements of the new CSA Z809-08 Standard and replaces all previous versions.
This section includes a summary of the changes to the SFM Plan Indicators, Targets and Variances that have been made since the last version. This does not reflect editorial changes.
Date Indicator Comment
2011 5.2.5
This is a new locally developed Indicator. It was carried over from the previous SFM Plan (Z809-02). The Indicator and target have been reviewed with VINWAG. This Indicator was included in the 2011 Annual Report, but was not specifically identified. Refer to the Indicator details for further explanation.
November 2012 3.1.2 Target 2
This is a new, additional target for this Indicator. It has been reviewed with VINWAG. The original target was found to not fully address the Objective. Refer to the Indicator details for further explanation.
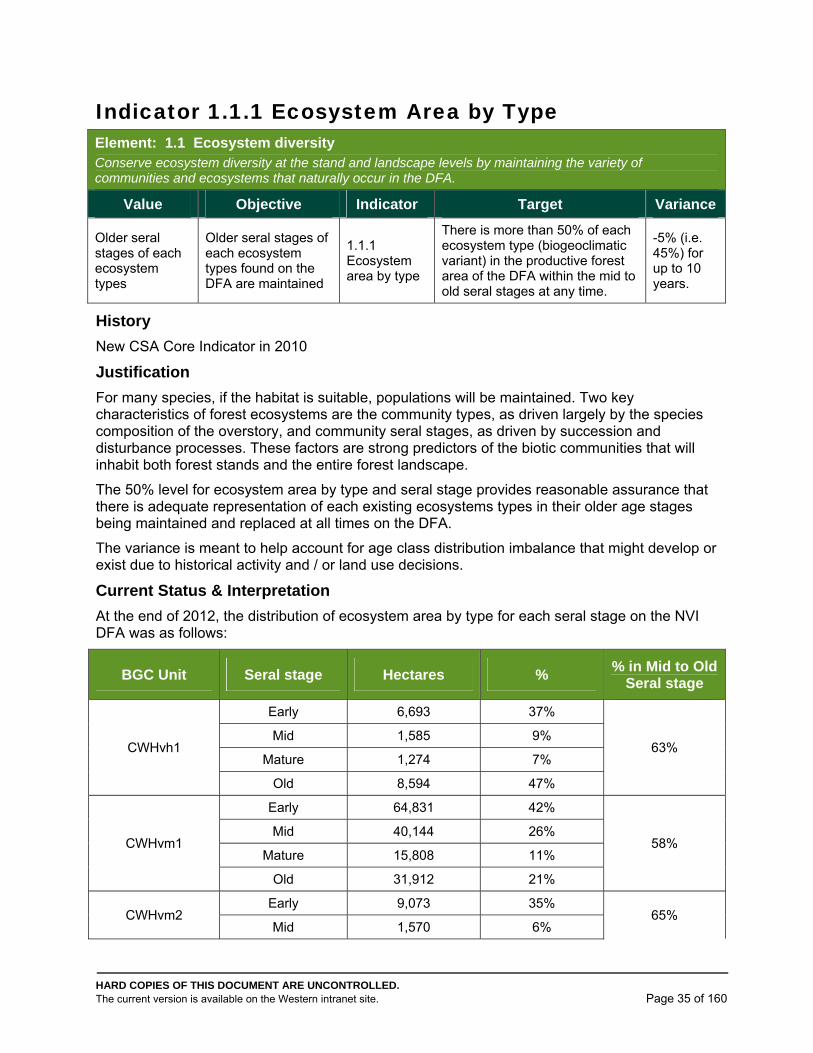
HARD COPIES OF THIS DOCUMENT ARE UNCONTROLLED. The current version is available on the Western intranet site. Page 35 of 160
Indicator 1.1.1 Ecosystem Area by Type Element: 1.1 Ecosystem diversity Conserve ecosystem diversity at the stand and landscape levels by maintaining the variety of communities and ecosystems that naturally occur in the DFA.
Value Objective Indicator Target Variance
Older seral stages of each ecosystem types
Older seral stages of each ecosystem types found on the DFA are maintained
1.1.1 Ecosystem area by type
There is more than 50% of each ecosystem type (biogeoclimatic variant) in the productive forest area of the DFA within the mid to old seral stages at any time.
-5% (i.e. 45%) for up to 10 years.
History
New CSA Core Indicator in 2010
Justification
For many species, if the habitat is suitable, populations will be maintained. Two key characteristics of forest ecosystems are the community types, as driven largely by the species composition of the overstory, and community seral stages, as driven by succession and disturbance processes. These factors are strong predictors of the biotic communities that will inhabit both forest stands and the entire forest landscape.
The 50% level for ecosystem area by type and seral stage provides reasonable assurance that there is adequate representation of each existing ecosystems types in their older age stages being maintained and replaced at all times on the DFA.
The variance is meant to help account for age class distribution imbalance that might develop or exist due to historical activity and / or land use decisions.
Current Status & Interpretation
At the end of 2012, the distribution of ecosystem area by type for each seral stage on the NVI DFA was as follows:
BGC Unit Seral stage Hectares % % in Mid to Old
Seral stage
CWHvh1
Early 6,693 37%
63% Mid 1,585 9%
Mature 1,274 7%
Old 8,594 47%
CWHvm1
Early 64,831 42%
58% Mid 40,144 26%
Mature 15,808 11%
Old 31,912 21%
CWHvm2 Early 9,073 35%
65% Mid 1,570 6%
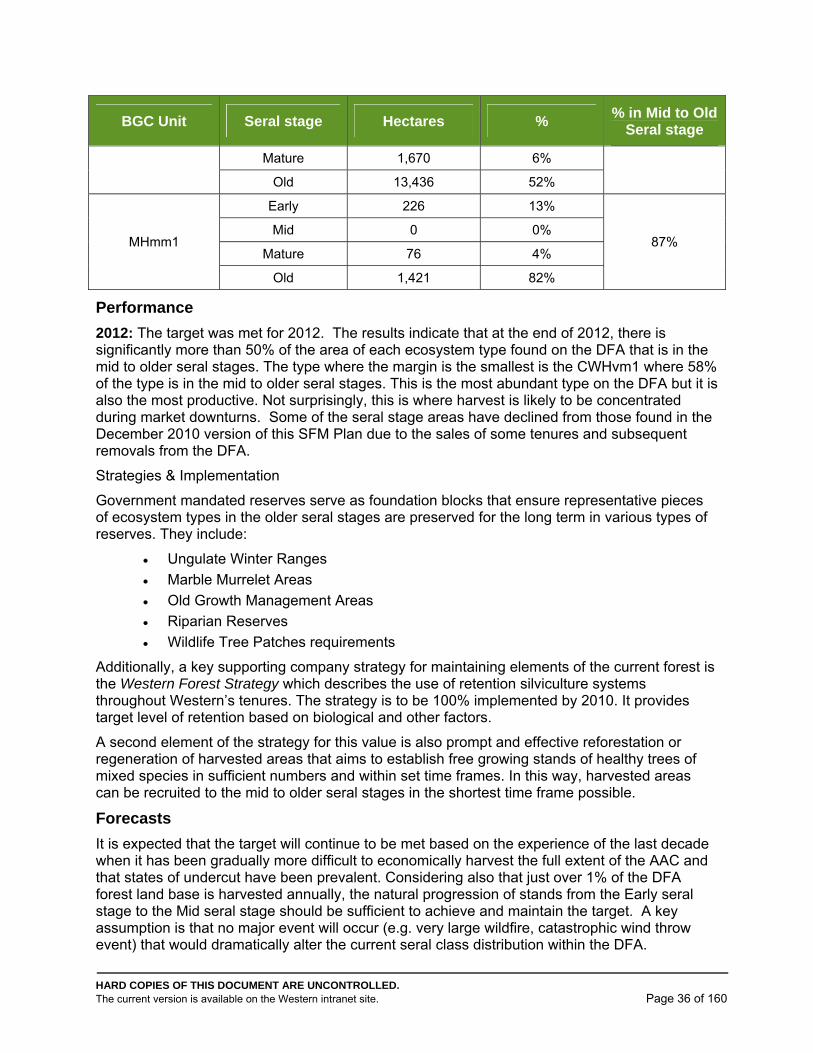
HARD COPIES OF THIS DOCUMENT ARE UNCONTROLLED. The current version is available on the Western intranet site. Page 36 of 160
BGC Unit Seral stage Hectares % % in Mid to Old
Seral stage
Mature 1,670 6%
Old 13,436 52%
MHmm1
Early 226 13%
87% Mid 0 0%
Mature 76 4%
Old 1,421 82%
Performance
2012: The target was met for 2012. The results indicate that at the end of 2012, there is significantly more than 50% of the area of each ecosystem type found on the DFA that is in the mid to older seral stages. The type where the margin is the smallest is the CWHvm1 where 58% of the type is in the mid to older seral stages. This is the most abundant type on the DFA but it is also the most productive. Not surprisingly, this is where harvest is likely to be concentrated during market downturns. Some of the seral stage areas have declined from those found in the December 2010 version of this SFM Plan due to the sales of some tenures and subsequent removals from the DFA.
Strategies & Implementation
Government mandated reserves serve as foundation blocks that ensure representative pieces of ecosystem types in the older seral stages are preserved for the long term in various types of reserves. They include:
Ungulate Winter Ranges
Marble Murrelet Areas
Old Growth Management Areas
Riparian Reserves
Wildlife Tree Patches requirements
Additionally, a key supporting company strategy for maintaining elements of the current forest is the Western Forest Strategy which describes the use of retention silviculture systems throughout Western’s tenures. The strategy is to be 100% implemented by 2010. It provides target level of retention based on biological and other factors.
A second element of the strategy for this value is also prompt and effective reforestation or regeneration of harvested areas that aims to establish free growing stands of healthy trees of mixed species in sufficient numbers and within set time frames. In this way, harvested areas can be recruited to the mid to older seral stages in the shortest time frame possible.
Forecasts
It is expected that the target will continue to be met based on the experience of the last decade when it has been gradually more difficult to economically harvest the full extent of the AAC and that states of undercut have been prevalent. Considering also that just over 1% of the DFA forest land base is harvested annually, the natural progression of stands from the Early seral stage to the Mid seral stage should be sufficient to achieve and maintain the target. A key assumption is that no major event will occur (e.g. very large wildfire, catastrophic wind throw event) that would dramatically alter the current seral class distribution within the DFA.
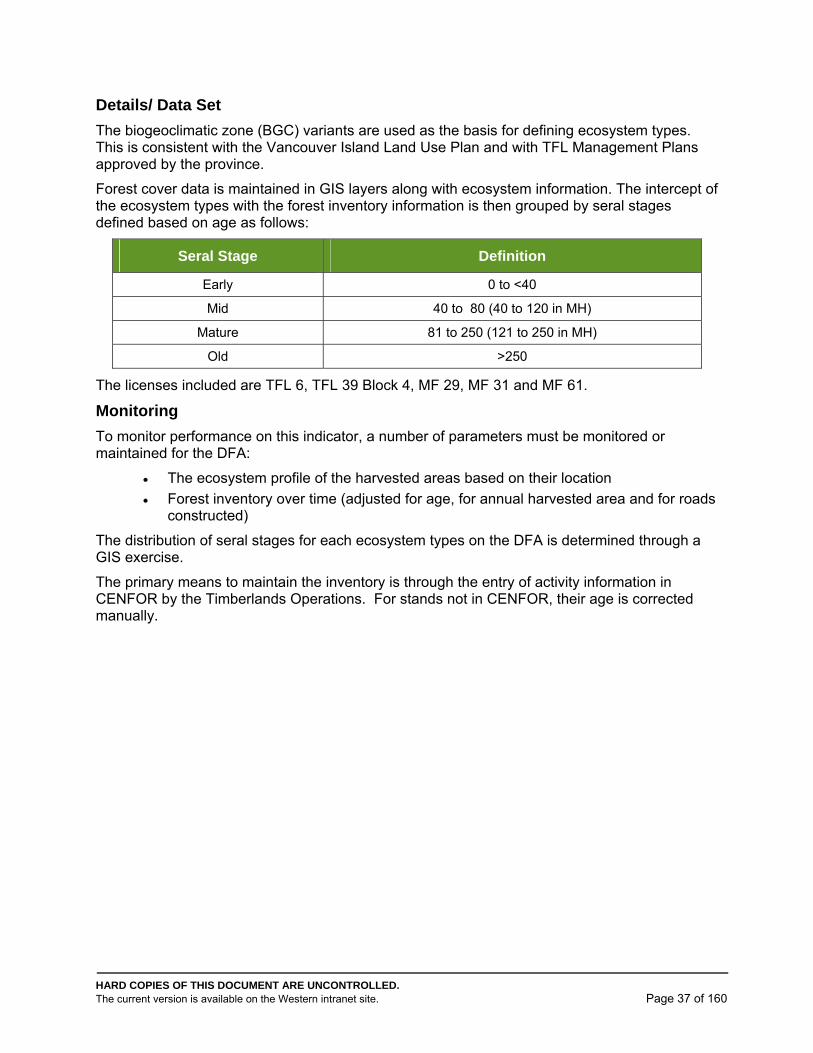
HARD COPIES OF THIS DOCUMENT ARE UNCONTROLLED. The current version is available on the Western intranet site. Page 37 of 160
Details/ Data Set
The biogeoclimatic zone (BGC) variants are used as the basis for defining ecosystem types. This is consistent with the Vancouver Island Land Use Plan and with TFL Management Plans approved by the province.
Forest cover data is maintained in GIS layers along with ecosystem information. The intercept of the ecosystem types with the forest inventory information is then grouped by seral stages defined based on age as follows:
Seral Stage Definition
Early 0 to <40
Mid 40 to 80 (40 to 120 in MH)
Mature 81 to 250 (121 to 250 in MH)
Old >250
The licenses included are TFL 6, TFL 39 Block 4, MF 29, MF 31 and MF 61.
Monitoring
To monitor performance on this indicator, a number of parameters must be monitored or maintained for the DFA:
The ecosystem profile of the harvested areas based on their location
Forest inventory over time (adjusted for age, for annual harvested area and for roads constructed)
The distribution of seral stages for each ecosystem types on the DFA is determined through a GIS exercise.
The primary means to maintain the inventory is through the entry of activity information in CENFOR by the Timberlands Operations. For stands not in CENFOR, their age is corrected manually.
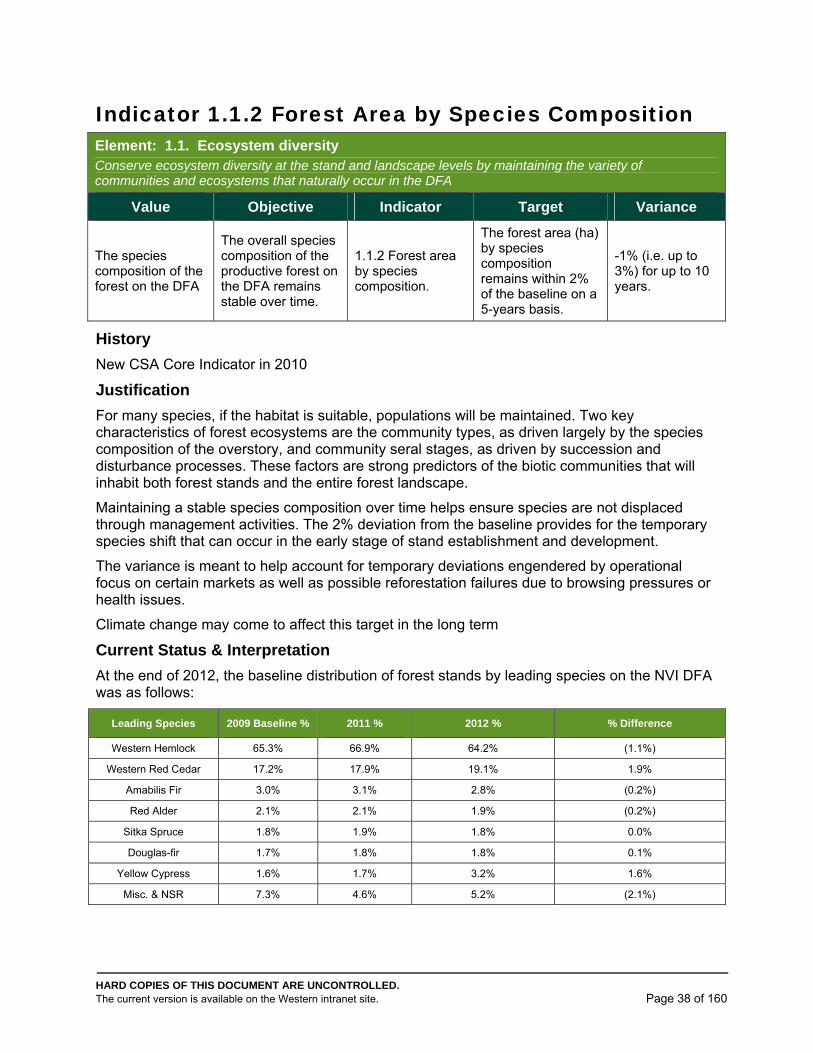
HARD COPIES OF THIS DOCUMENT ARE UNCONTROLLED. The current version is available on the Western intranet site. Page 38 of 160
Indicator 1.1.2 Forest Area by Species Composition Element: 1.1. Ecosystem diversity Conserve ecosystem diversity at the stand and landscape levels by maintaining the variety of communities and ecosystems that naturally occur in the DFA
Value Objective Indicator Target Variance
The species composition of the forest on the DFA
The overall species composition of the productive forest on the DFA remains stable over time.
1.1.2 Forest area by species composition.
The forest area (ha) by species composition remains within 2% of the baseline on a 5-years basis.
-1% (i.e. up to 3%) for up to 10 years.
History
New CSA Core Indicator in 2010
Justification
For many species, if the habitat is suitable, populations will be maintained. Two key characteristics of forest ecosystems are the community types, as driven largely by the species composition of the overstory, and community seral stages, as driven by succession and disturbance processes. These factors are strong predictors of the biotic communities that will inhabit both forest stands and the entire forest landscape.
Maintaining a stable species composition over time helps ensure species are not displaced through management activities. The 2% deviation from the baseline provides for the temporary species shift that can occur in the early stage of stand establishment and development.
The variance is meant to help account for temporary deviations engendered by operational focus on certain markets as well as possible reforestation failures due to browsing pressures or health issues.
Climate change may come to affect this target in the long term
Current Status & Interpretation
At the end of 2012, the baseline distribution of forest stands by leading species on the NVI DFA was as follows:
Leading Species 2009 Baseline % 2011 % 2012 % % Difference
Western Hemlock 65.3% 66.9% 64.2% (1.1%)
Western Red Cedar 17.2% 17.9% 19.1% 1.9%
Amabilis Fir 3.0% 3.1% 2.8% (0.2%)
Red Alder 2.1% 2.1% 1.9% (0.2%)
Sitka Spruce 1.8% 1.9% 1.8% 0.0%
Douglas-fir 1.7% 1.8% 1.8% 0.1%
Yellow Cypress 1.6% 1.7% 3.2% 1.6%
Misc. & NSR 7.3% 4.6% 5.2% (2.1%)
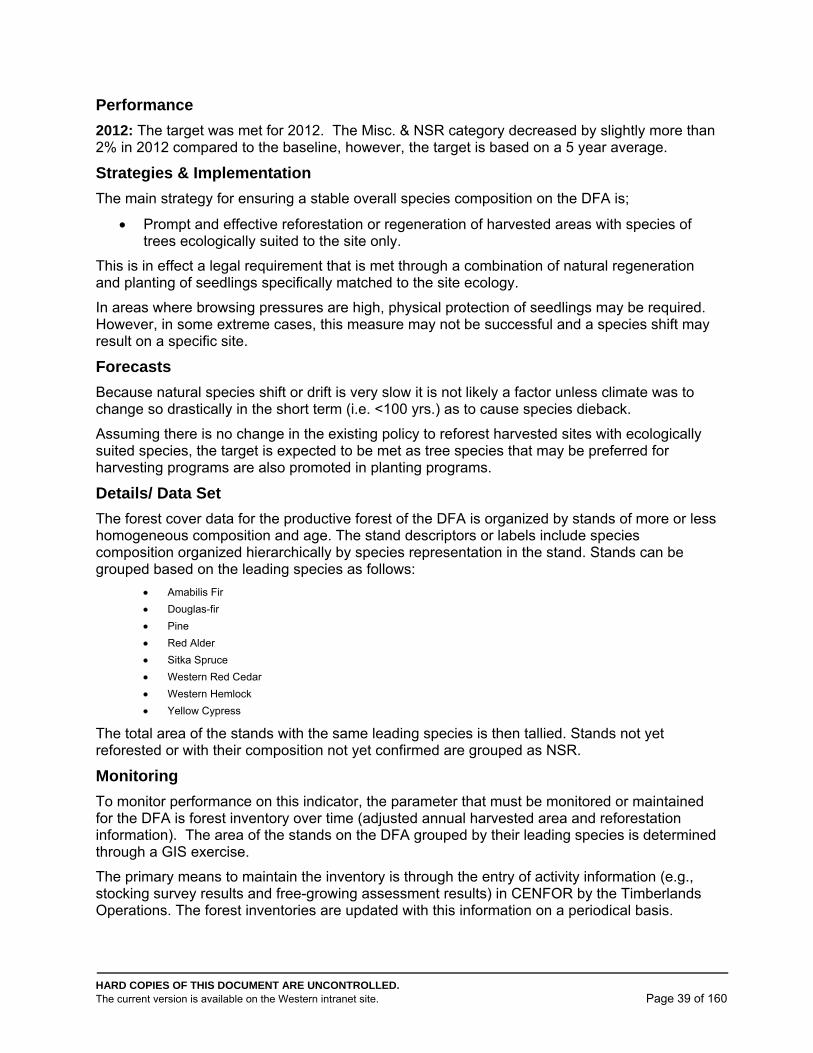
HARD COPIES OF THIS DOCUMENT ARE UNCONTROLLED. The current version is available on the Western intranet site. Page 39 of 160
Performance
2012: The target was met for 2012. The Misc. & NSR category decreased by slightly more than 2% in 2012 compared to the baseline, however, the target is based on a 5 year average.
Strategies & Implementation
The main strategy for ensuring a stable overall species composition on the DFA is;
Prompt and effective reforestation or regeneration of harvested areas with species of trees ecologically suited to the site only.
This is in effect a legal requirement that is met through a combination of natural regeneration and planting of seedlings specifically matched to the site ecology.
In areas where browsing pressures are high, physical protection of seedlings may be required. However, in some extreme cases, this measure may not be successful and a species shift may result on a specific site.
Forecasts
Because natural species shift or drift is very slow it is not likely a factor unless climate was to change so drastically in the short term (i.e. <100 yrs.) as to cause species dieback.
Assuming there is no change in the existing policy to reforest harvested sites with ecologically suited species, the target is expected to be met as tree species that may be preferred for harvesting programs are also promoted in planting programs.
Details/ Data Set
The forest cover data for the productive forest of the DFA is organized by stands of more or less homogeneous composition and age. The stand descriptors or labels include species composition organized hierarchically by species representation in the stand. Stands can be grouped based on the leading species as follows:
Amabilis Fir
Douglas-fir
Pine
Red Alder
Sitka Spruce
Western Red Cedar
Western Hemlock
Yellow Cypress
The total area of the stands with the same leading species is then tallied. Stands not yet reforested or with their composition not yet confirmed are grouped as NSR.
Monitoring
To monitor performance on this indicator, the parameter that must be monitored or maintained for the DFA is forest inventory over time (adjusted annual harvested area and reforestation information). The area of the stands on the DFA grouped by their leading species is determined through a GIS exercise.
The primary means to maintain the inventory is through the entry of activity information (e.g., stocking survey results and free-growing assessment results) in CENFOR by the Timberlands Operations. The forest inventories are updated with this information on a periodical basis.
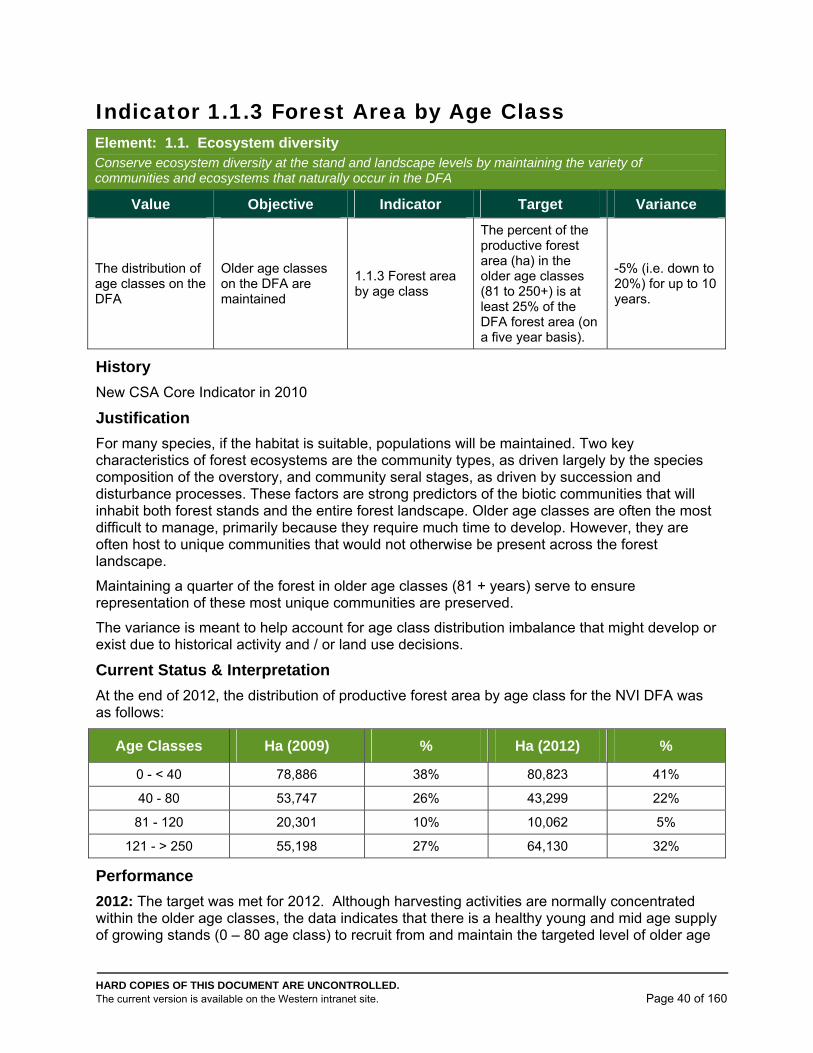
HARD COPIES OF THIS DOCUMENT ARE UNCONTROLLED. The current version is available on the Western intranet site. Page 40 of 160
Indicator 1.1.3 Forest Area by Age Class Element: 1.1. Ecosystem diversity Conserve ecosystem diversity at the stand and landscape levels by maintaining the variety of communities and ecosystems that naturally occur in the DFA
Value Objective Indicator Target Variance
The distribution of age classes on the DFA
Older age classes on the DFA are maintained
1.1.3 Forest area by age class
The percent of the productive forest area (ha) in the older age classes (81 to 250+) is at least 25% of the DFA forest area (on a five year basis).
-5% (i.e. down to 20%) for up to 10 years.
History
New CSA Core Indicator in 2010
Justification
For many species, if the habitat is suitable, populations will be maintained. Two key characteristics of forest ecosystems are the community types, as driven largely by the species composition of the overstory, and community seral stages, as driven by succession and disturbance processes. These factors are strong predictors of the biotic communities that will inhabit both forest stands and the entire forest landscape. Older age classes are often the most difficult to manage, primarily because they require much time to develop. However, they are often host to unique communities that would not otherwise be present across the forest landscape.
Maintaining a quarter of the forest in older age classes (81 + years) serve to ensure representation of these most unique communities are preserved.
The variance is meant to help account for age class distribution imbalance that might develop or exist due to historical activity and / or land use decisions.
Current Status & Interpretation
At the end of 2012, the distribution of productive forest area by age class for the NVI DFA was as follows:
Age Classes Ha (2009) % Ha (2012) %
0 - < 40 78,886 38% 80,823 41%
40 - 80 53,747 26% 43,299 22%
81 - 120 20,301 10% 10,062 5%
121 - > 250 55,198 27% 64,130 32%
Performance
2012: The target was met for 2012. Although harvesting activities are normally concentrated within the older age classes, the data indicates that there is a healthy young and mid age supply of growing stands (0 – 80 age class) to recruit from and maintain the targeted level of older age
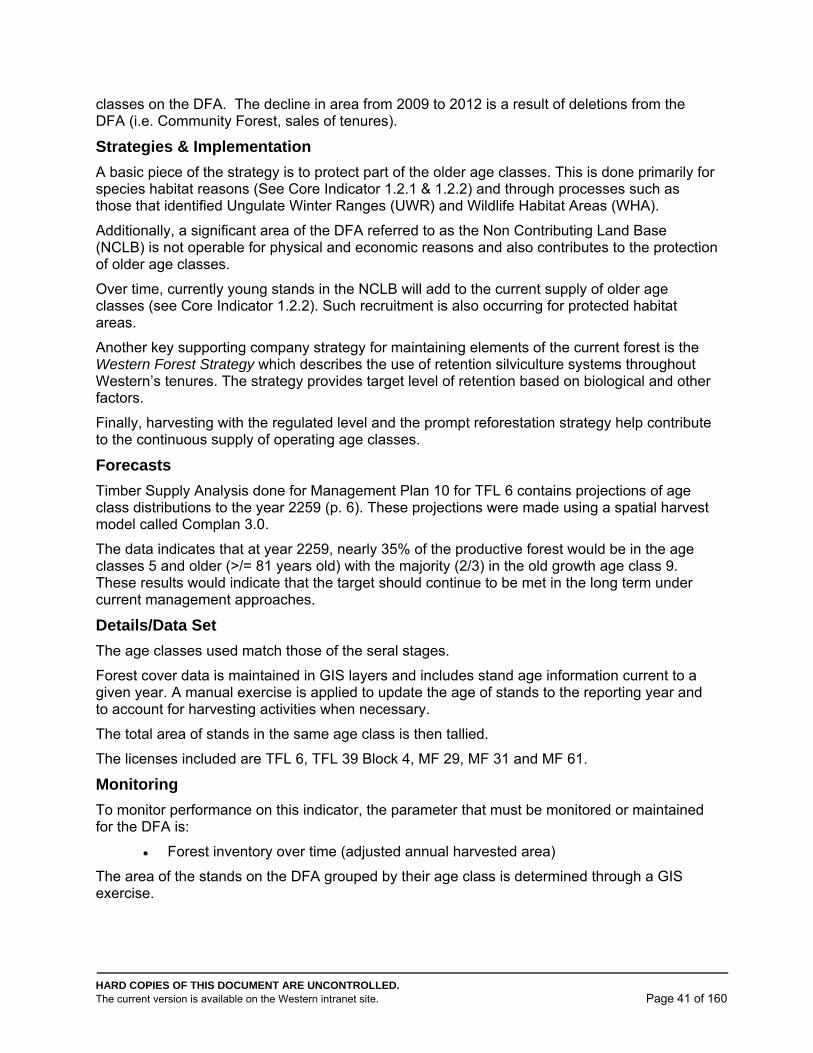
HARD COPIES OF THIS DOCUMENT ARE UNCONTROLLED. The current version is available on the Western intranet site. Page 41 of 160
classes on the DFA. The decline in area from 2009 to 2012 is a result of deletions from the DFA (i.e. Community Forest, sales of tenures).
Strategies & Implementation
A basic piece of the strategy is to protect part of the older age classes. This is done primarily for species habitat reasons (See Core Indicator 1.2.1 & 1.2.2) and through processes such as those that identified Ungulate Winter Ranges (UWR) and Wildlife Habitat Areas (WHA).
Additionally, a significant area of the DFA referred to as the Non Contributing Land Base (NCLB) is not operable for physical and economic reasons and also contributes to the protection of older age classes.
Over time, currently young stands in the NCLB will add to the current supply of older age classes (see Core Indicator 1.2.2). Such recruitment is also occurring for protected habitat areas.
Another key supporting company strategy for maintaining elements of the current forest is the Western Forest Strategy which describes the use of retention silviculture systems throughout Western’s tenures. The strategy provides target level of retention based on biological and other factors.
Finally, harvesting with the regulated level and the prompt reforestation strategy help contribute to the continuous supply of operating age classes.
Forecasts
Timber Supply Analysis done for Management Plan 10 for TFL 6 contains projections of age class distributions to the year 2259 (p. 6). These projections were made using a spatial harvest model called Complan 3.0.
The data indicates that at year 2259, nearly 35% of the productive forest would be in the age classes 5 and older (>/= 81 years old) with the majority (2/3) in the old growth age class 9. These results would indicate that the target should continue to be met in the long term under current management approaches.
Details/Data Set
The age classes used match those of the seral stages.
Forest cover data is maintained in GIS layers and includes stand age information current to a given year. A manual exercise is applied to update the age of stands to the reporting year and to account for harvesting activities when necessary.
The total area of stands in the same age class is then tallied.
The licenses included are TFL 6, TFL 39 Block 4, MF 29, MF 31 and MF 61.
Monitoring
To monitor performance on this indicator, the parameter that must be monitored or maintained for the DFA is:
Forest inventory over time (adjusted annual harvested area)
The area of the stands on the DFA grouped by their age class is determined through a GIS exercise.
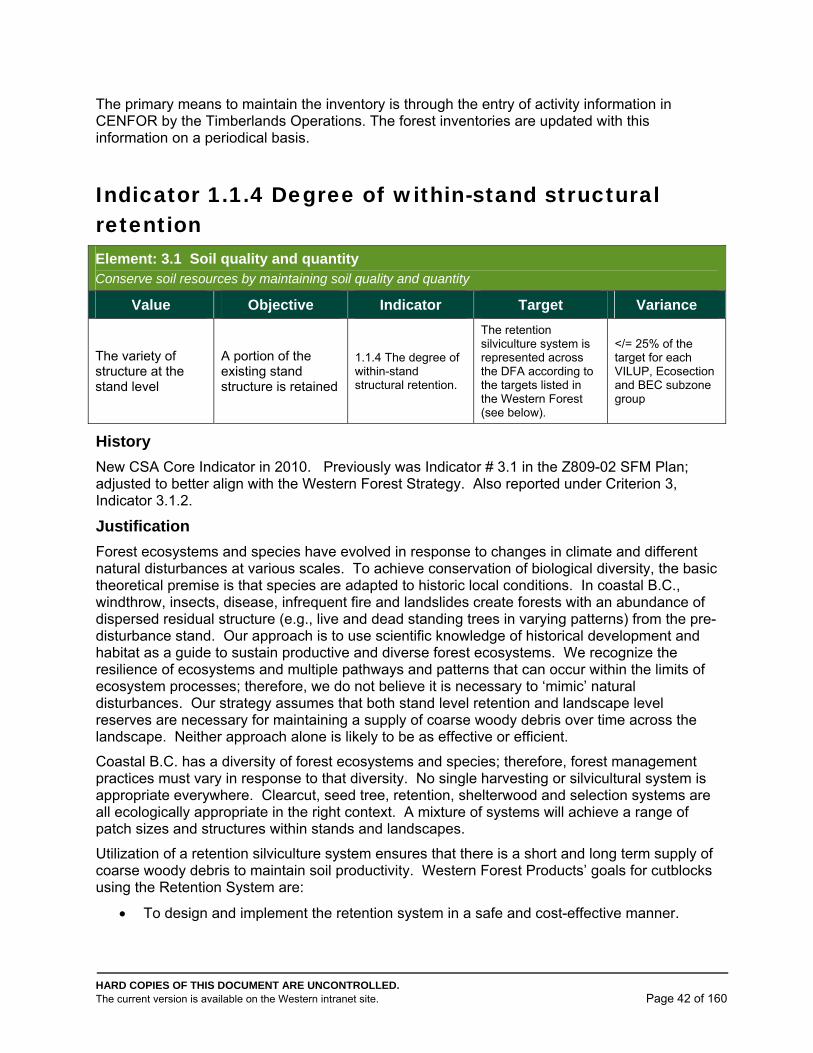
HARD COPIES OF THIS DOCUMENT ARE UNCONTROLLED. The current version is available on the Western intranet site. Page 42 of 160
The primary means to maintain the inventory is through the entry of activity information in CENFOR by the Timberlands Operations. The forest inventories are updated with this information on a periodical basis.
Indicator 1.1.4 Degree of within-stand structural retention Element: 3.1 Soil quality and quantity Conserve soil resources by maintaining soil quality and quantity
Value Objective Indicator Target Variance
The variety of structure at the stand level
A portion of the existing stand structure is retained
1.1.4 The degree of within-stand structural retention.
The retention silviculture system is represented across the DFA according to the targets listed in the Western Forest (see below).
</= 25% of the target for each VILUP, Ecosection and BEC subzone group
History
New CSA Core Indicator in 2010. Previously was Indicator # 3.1 in the Z809-02 SFM Plan; adjusted to better align with the Western Forest Strategy. Also reported under Criterion 3, Indicator 3.1.2.
Justification
Forest ecosystems and species have evolved in response to changes in climate and different natural disturbances at various scales. To achieve conservation of biological diversity, the basic theoretical premise is that species are adapted to historic local conditions. In coastal B.C., windthrow, insects, disease, infrequent fire and landslides create forests with an abundance of dispersed residual structure (e.g., live and dead standing trees in varying patterns) from the pre-disturbance stand. Our approach is to use scientific knowledge of historical development and habitat as a guide to sustain productive and diverse forest ecosystems. We recognize the resilience of ecosystems and multiple pathways and patterns that can occur within the limits of ecosystem processes; therefore, we do not believe it is necessary to ‘mimic’ natural disturbances. Our strategy assumes that both stand level retention and landscape level reserves are necessary for maintaining a supply of coarse woody debris over time across the landscape. Neither approach alone is likely to be as effective or efficient.
Coastal B.C. has a diversity of forest ecosystems and species; therefore, forest management practices must vary in response to that diversity. No single harvesting or silvicultural system is appropriate everywhere. Clearcut, seed tree, retention, shelterwood and selection systems are all ecologically appropriate in the right context. A mixture of systems will achieve a range of patch sizes and structures within stands and landscapes.
Utilization of a retention silviculture system ensures that there is a short and long term supply of coarse woody debris to maintain soil productivity. Western Forest Products’ goals for cutblocks using the Retention System are:
To design and implement the retention system in a safe and cost-effective manner.
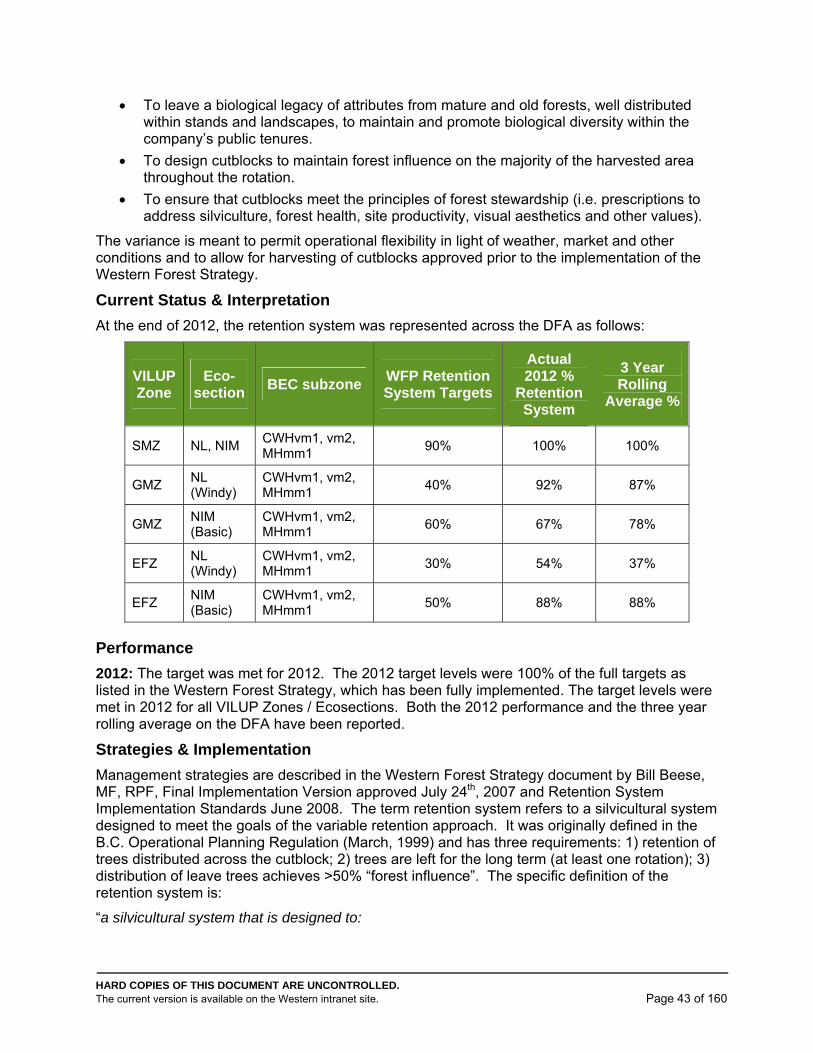
HARD COPIES OF THIS DOCUMENT ARE UNCONTROLLED. The current version is available on the Western intranet site. Page 43 of 160
To leave a biological legacy of attributes from mature and old forests, well distributed within stands and landscapes, to maintain and promote biological diversity within the company’s public tenures.
To design cutblocks to maintain forest influence on the majority of the harvested area throughout the rotation.
To ensure that cutblocks meet the principles of forest stewardship (i.e. prescriptions to address silviculture, forest health, site productivity, visual aesthetics and other values).
The variance is meant to permit operational flexibility in light of weather, market and other conditions and to allow for harvesting of cutblocks approved prior to the implementation of the Western Forest Strategy.
Current Status & Interpretation
At the end of 2012, the retention system was represented across the DFA as follows:
VILUP Zone
Eco-section
BEC subzone WFP Retention System Targets
Actual 2012 %
Retention System
3 Year Rolling
Average %
SMZ NL, NIM CWHvm1, vm2, MHmm1
90% 100% 100%
GMZ NL (Windy)
CWHvm1, vm2, MHmm1
40% 92% 87%
GMZ NIM (Basic)
CWHvm1, vm2, MHmm1
60% 67% 78%
EFZ NL (Windy)
CWHvm1, vm2, MHmm1
30% 54% 37%
EFZ NIM (Basic)
CWHvm1, vm2, MHmm1
50% 88% 88%
Performance
2012: The target was met for 2012. The 2012 target levels were 100% of the full targets as listed in the Western Forest Strategy, which has been fully implemented. The target levels were met in 2012 for all VILUP Zones / Ecosections. Both the 2012 performance and the three year rolling average on the DFA have been reported.
Strategies & Implementation
Management strategies are described in the Western Forest Strategy document by Bill Beese, MF, RPF, Final Implementation Version approved July 24th, 2007 and Retention System Implementation Standards June 2008. The term retention system refers to a silvicultural system designed to meet the goals of the variable retention approach. It was originally defined in the B.C. Operational Planning Regulation (March, 1999) and has three requirements: 1) retention of trees distributed across the cutblock; 2) trees are left for the long term (at least one rotation); 3) distribution of leave trees achieves >50% “forest influence”. The specific definition of the retention system is:
“a silvicultural system that is designed to:
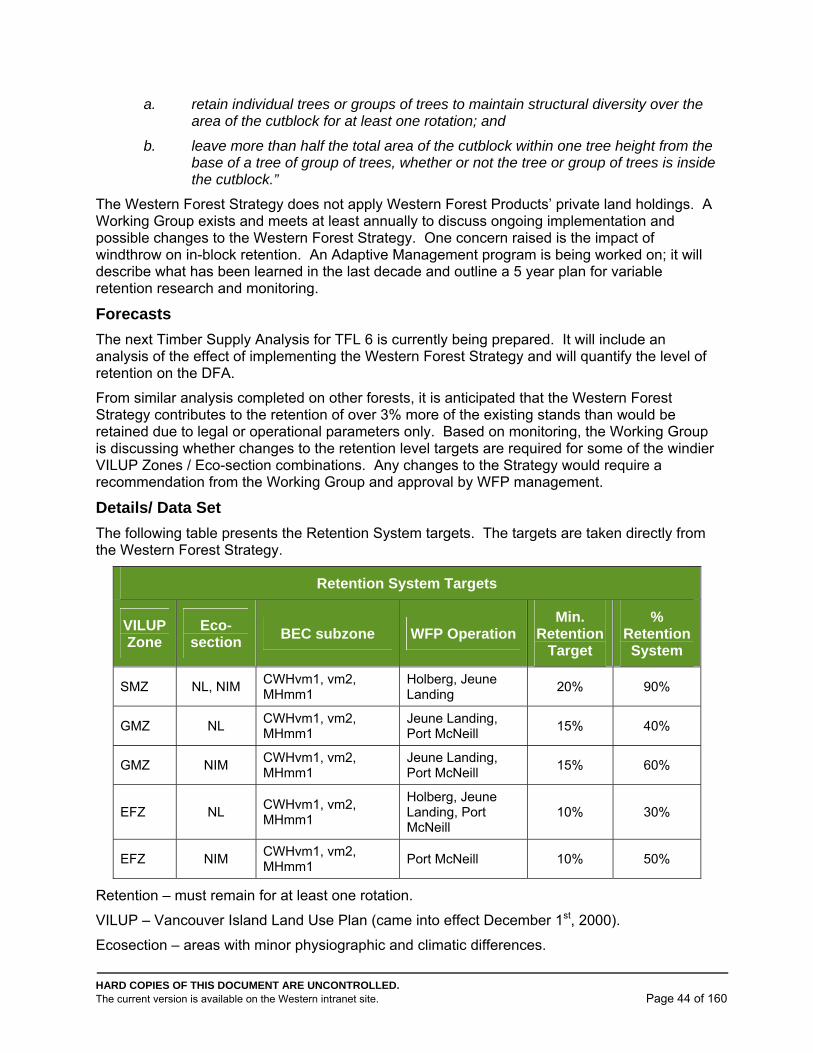
HARD COPIES OF THIS DOCUMENT ARE UNCONTROLLED. The current version is available on the Western intranet site. Page 44 of 160
a. retain individual trees or groups of trees to maintain structural diversity over the area of the cutblock for at least one rotation; and
b. leave more than half the total area of the cutblock within one tree height from the base of a tree of group of trees, whether or not the tree or group of trees is inside the cutblock.”
The Western Forest Strategy does not apply Western Forest Products’ private land holdings. A Working Group exists and meets at least annually to discuss ongoing implementation and possible changes to the Western Forest Strategy. One concern raised is the impact of windthrow on in-block retention. An Adaptive Management program is being worked on; it will describe what has been learned in the last decade and outline a 5 year plan for variable retention research and monitoring.
Forecasts
The next Timber Supply Analysis for TFL 6 is currently being prepared. It will include an analysis of the effect of implementing the Western Forest Strategy and will quantify the level of retention on the DFA.
From similar analysis completed on other forests, it is anticipated that the Western Forest Strategy contributes to the retention of over 3% more of the existing stands than would be retained due to legal or operational parameters only. Based on monitoring, the Working Group is discussing whether changes to the retention level targets are required for some of the windier VILUP Zones / Eco-section combinations. Any changes to the Strategy would require a recommendation from the Working Group and approval by WFP management.
Details/ Data Set
The following table presents the Retention System targets. The targets are taken directly from the Western Forest Strategy.
Retention System Targets
VILUP Zone
Eco-section
BEC subzone WFP Operation Min.
Retention Target
% Retention System
SMZ NL, NIM CWHvm1, vm2, MHmm1
Holberg, Jeune Landing
20% 90%
GMZ NL CWHvm1, vm2, MHmm1
Jeune Landing, Port McNeill
15% 40%
GMZ NIM CWHvm1, vm2, MHmm1
Jeune Landing, Port McNeill
15% 60%
EFZ NL CWHvm1, vm2, MHmm1
Holberg, Jeune Landing, Port McNeill
10% 30%
EFZ NIM CWHvm1, vm2, MHmm1
Port McNeill 10% 50%
Retention – must remain for at least one rotation.
VILUP – Vancouver Island Land Use Plan (came into effect December 1st, 2000).
Ecosection – areas with minor physiographic and climatic differences.
HARD COPIES OF THIS DOCUMENT ARE UNCONTROLLED. The current version is available on the Western intranet site. Page 45 of 160
BEC – Biogeoclimatic Ecosystem Classification system; provides for a multi scale classification framework.
Monitoring
The detailed monitoring and reporting procedures will be used in reporting this indicator as described in the Western Forest Strategy document and the associated Retention System Implementation Standards documents. The total area assigned as retention system must meet or exceed the percent targets by Vancouver Island Land Use Plan (VILUP) Zone, Ecosection and BEC subzone group. A spreadsheet is used to track harvest area assigned as retention system for each cutblock relative to the harvest area. Details on cutblock silviculture systems are also tracked in CENFOR. This data is summarized annually and included in the SFM Plan Annual Report.
The Operations Foresters with assistance from the Operations Engineers will ensure that data is compiled, and performance reported, in the SFM Plan Annual Report.
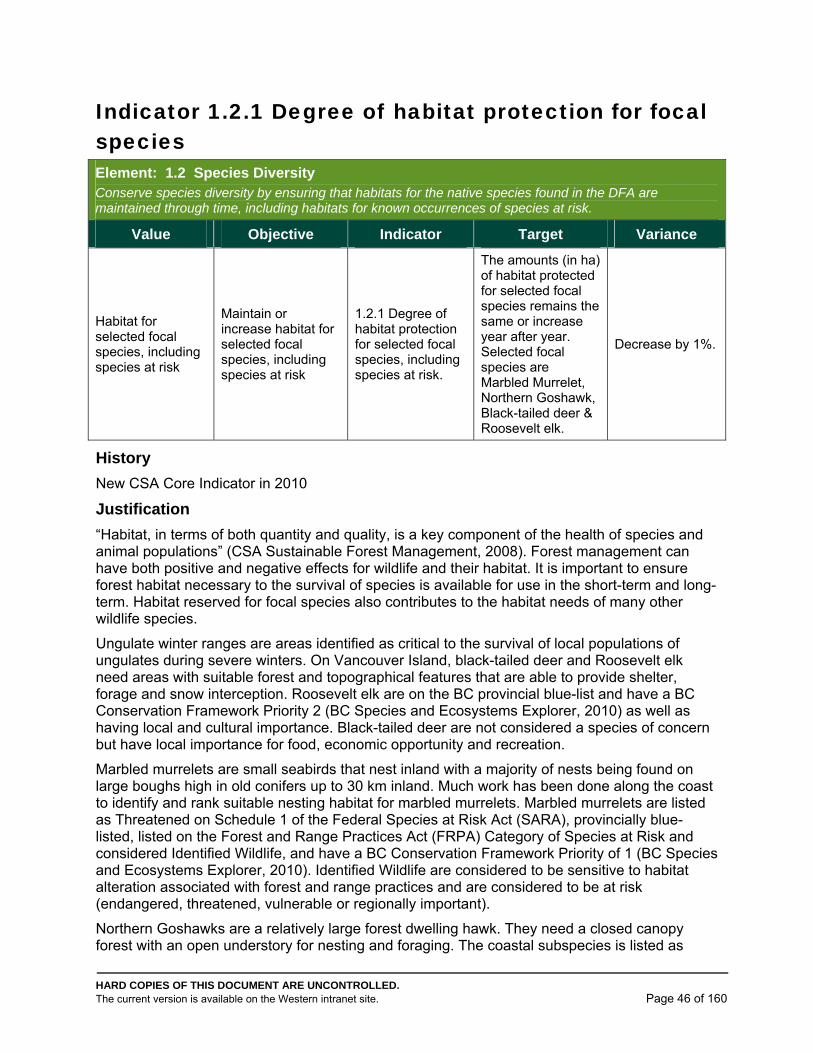
HARD COPIES OF THIS DOCUMENT ARE UNCONTROLLED. The current version is available on the Western intranet site. Page 46 of 160
Indicator 1.2.1 Degree of habitat protection for focal species Element: 1.2 Species Diversity Conserve species diversity by ensuring that habitats for the native species found in the DFA are maintained through time, including habitats for known occurrences of species at risk.
Value Objective Indicator Target Variance
Habitat for selected focal species, including species at risk
Maintain or increase habitat for selected focal species, including species at risk
1.2.1 Degree of habitat protection for selected focal species, including species at risk.
The amounts (in ha) of habitat protected for selected focal species remains the same or increase year after year. Selected focal species are Marbled Murrelet, Northern Goshawk, Black-tailed deer & Roosevelt elk.
Decrease by 1%.
History
New CSA Core Indicator in 2010
Justification
“Habitat, in terms of both quantity and quality, is a key component of the health of species and animal populations” (CSA Sustainable Forest Management, 2008). Forest management can have both positive and negative effects for wildlife and their habitat. It is important to ensure forest habitat necessary to the survival of species is available for use in the short-term and long-term. Habitat reserved for focal species also contributes to the habitat needs of many other wildlife species.
Ungulate winter ranges are areas identified as critical to the survival of local populations of ungulates during severe winters. On Vancouver Island, black-tailed deer and Roosevelt elk need areas with suitable forest and topographical features that are able to provide shelter, forage and snow interception. Roosevelt elk are on the BC provincial blue-list and have a BC Conservation Framework Priority 2 (BC Species and Ecosystems Explorer, 2010) as well as having local and cultural importance. Black-tailed deer are not considered a species of concern but have local importance for food, economic opportunity and recreation.
Marbled murrelets are small seabirds that nest inland with a majority of nests being found on large boughs high in old conifers up to 30 km inland. Much work has been done along the coast to identify and rank suitable nesting habitat for marbled murrelets. Marbled murrelets are listed as Threatened on Schedule 1 of the Federal Species at Risk Act (SARA), provincially blue-listed, listed on the Forest and Range Practices Act (FRPA) Category of Species at Risk and considered Identified Wildlife, and have a BC Conservation Framework Priority of 1 (BC Species and Ecosystems Explorer, 2010). Identified Wildlife are considered to be sensitive to habitat alteration associated with forest and range practices and are considered to be at risk (endangered, threatened, vulnerable or regionally important).
Northern Goshawks are a relatively large forest dwelling hawk. They need a closed canopy forest with an open understory for nesting and foraging. The coastal subspecies is listed as
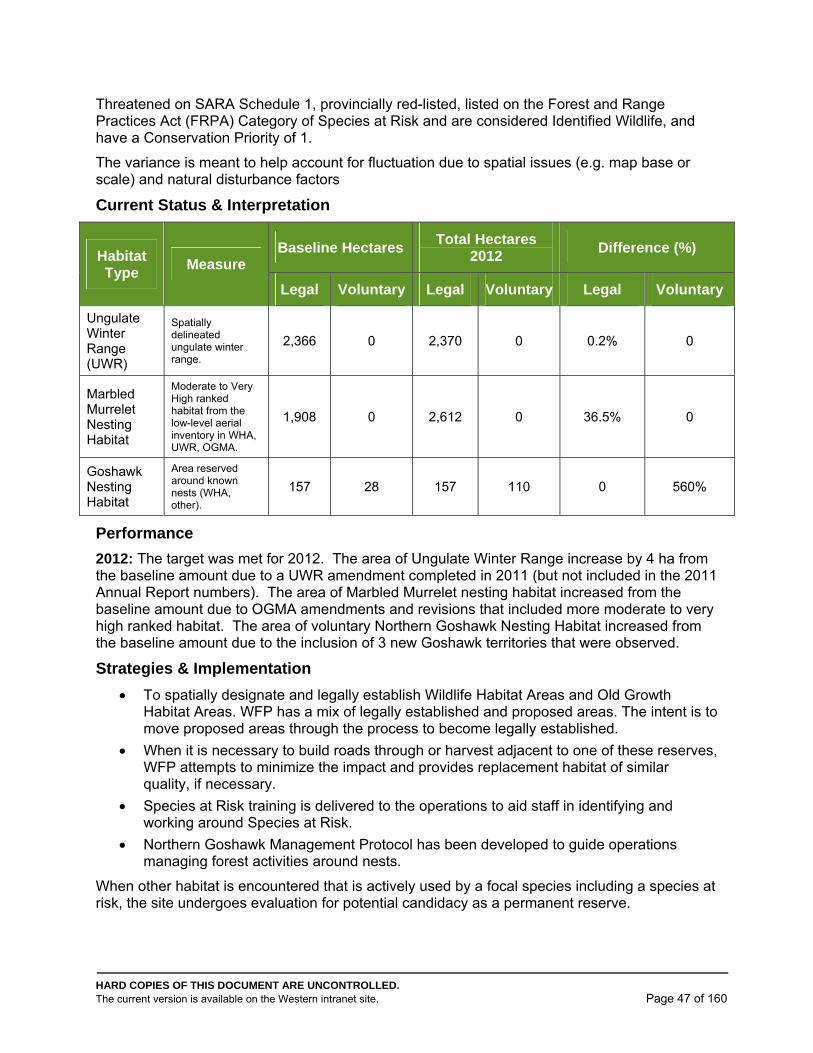
HARD COPIES OF THIS DOCUMENT ARE UNCONTROLLED. The current version is available on the Western intranet site. Page 47 of 160
Threatened on SARA Schedule 1, provincially red-listed, listed on the Forest and Range Practices Act (FRPA) Category of Species at Risk and are considered Identified Wildlife, and have a Conservation Priority of 1.
The variance is meant to help account for fluctuation due to spatial issues (e.g. map base or scale) and natural disturbance factors
Current Status & Interpretation
Habitat Type
Measure Baseline Hectares
Total Hectares 2012
Difference (%)
Legal Voluntary Legal Voluntary Legal Voluntary
Ungulate Winter Range (UWR)
Spatially delineated ungulate winter range.
2,366 0 2,370 0 0.2% 0
Marbled Murrelet Nesting Habitat
Moderate to Very High ranked habitat from the low-level aerial inventory in WHA, UWR, OGMA.
1,908 0 2,612 0 36.5% 0
Goshawk Nesting Habitat
Area reserved around known nests (WHA, other).
157 28 157 110 0 560%
Performance
2012: The target was met for 2012. The area of Ungulate Winter Range increase by 4 ha from the baseline amount due to a UWR amendment completed in 2011 (but not included in the 2011 Annual Report numbers). The area of Marbled Murrelet nesting habitat increased from the baseline amount due to OGMA amendments and revisions that included more moderate to very high ranked habitat. The area of voluntary Northern Goshawk Nesting Habitat increased from the baseline amount due to the inclusion of 3 new Goshawk territories that were observed.
Strategies & Implementation
To spatially designate and legally establish Wildlife Habitat Areas and Old Growth Habitat Areas. WFP has a mix of legally established and proposed areas. The intent is to move proposed areas through the process to become legally established.
When it is necessary to build roads through or harvest adjacent to one of these reserves, WFP attempts to minimize the impact and provides replacement habitat of similar quality, if necessary.
Species at Risk training is delivered to the operations to aid staff in identifying and working around Species at Risk.
Northern Goshawk Management Protocol has been developed to guide operations managing forest activities around nests.
When other habitat is encountered that is actively used by a focal species including a species at risk, the site undergoes evaluation for potential candidacy as a permanent reserve.
HARD COPIES OF THIS DOCUMENT ARE UNCONTROLLED. The current version is available on the Western intranet site. Page 48 of 160
Forecasts
As more reserves such as WHAs, UWRs and OGMAs become legally established the habitat conserved for focal species is expected to increase over the short-term.
Details/ Data Set
Ungulate Winter Ranges have been legally established for all tenures within the DFA. Ungulate Winter Range may also be available through other reserve areas (WHA, OGMA) but has not been spatially delineated as such. A total of 477 ha for TFL 39 Block 4 (U-1-006) and 1873 ha for TFL 6 (U-1-010) were spatially established in November 2004. Another 16 ha were established within the DFA from the Kingcome Order (U-1-011). The indicator is measured as the total area spatially delineated and conserved for ungulate winter range. This area must meet or exceed the target of 2366 ha.
Marbled Murrelet nesting habitat has been delineated within the DFA. Potentially suitable habitat was modelled and further assessed and ranked by low-level aerial surveys in 2005 and 2006. The surveys followed provincial standards ranking the habitat nil to very high quality. Habitat ranked moderate to very high is generally considered “suitable” habitat. In the short-term suitable habitat is protected in a variety of reserves. Some reserves, wildlife habitat areas, have been specifically delineated for marbled murrelets. Other species’ Wildlife Habitat Areas and Ungulate Winter Ranges may incidentally encompass suitable nesting habitat. Old Growth Management Areas (OGMA) are currently being delineated as part of the Landscape Unit Planning process. As of December 2011, two landscape units within the DFA, the San Josef landscape unit and the Marble landscape unit, have legally established OGMAs. The other landscape units have spatially defined proposed OGMAs. Direction has been given by government to consider marbled murrelet nesting habitat when delineating OGMAs. This indicator is a measure of the amount of inventoried suitable nesting habitat reserved within the DFA. The amount should be consistent or increase from the current state and not be less than 1908 ha.
Goshawk nesting habitat mapping is not available at this time. For the current process the amount of goshawk habitat is based solely on areas that will not be harvested due to the presence of goshawk nests. There are currently two known nest territories within the DFA. One was formally established in December 2005 as a 157 ha WHA while the other has been voluntarily conserved by WFP. This indicator is a measure of the amount of habitat reserved around known nests. The amount should be consistent or increase from the current state and not be less than 157 ha.
Monitoring
Reserves are mapped spatially in a layer of the GIS. Changes in boundaries are tracked by Corporate Forestry biologists.
All habitat supply will be monitored spatially relative to the target every year.
Nests are documented when they are located and appropriate management strategies are developed within site-level plans.
Known nests will be monitored for activity when forest management activities are planned nearby.
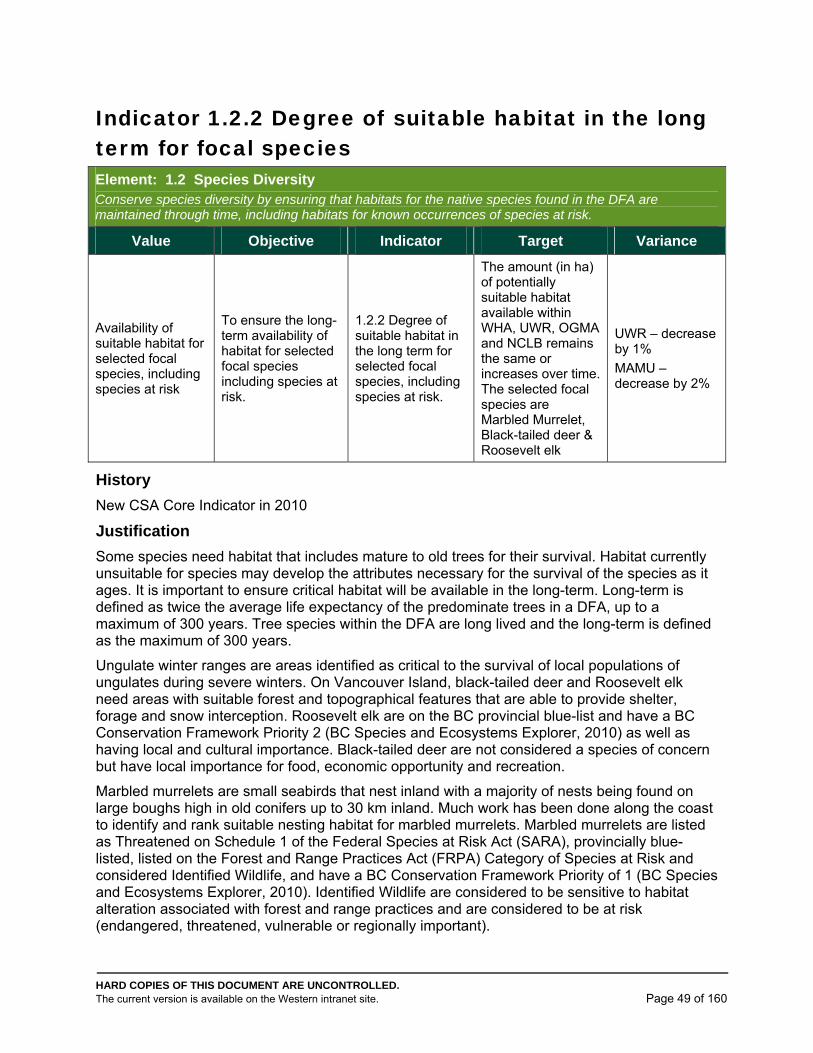
HARD COPIES OF THIS DOCUMENT ARE UNCONTROLLED. The current version is available on the Western intranet site. Page 49 of 160
Indicator 1.2.2 Degree of suitable habitat in the long term for focal species Element: 1.2 Species Diversity Conserve species diversity by ensuring that habitats for the native species found in the DFA are maintained through time, including habitats for known occurrences of species at risk.
Value Objective Indicator Target Variance
Availability of suitable habitat for selected focal species, including species at risk
To ensure the long-term availability of habitat for selected focal species including species at risk.
1.2.2 Degree of suitable habitat in the long term for selected focal species, including species at risk.
The amount (in ha) of potentially suitable habitat available within WHA, UWR, OGMA and NCLB remains the same or increases over time. The selected focal species are Marbled Murrelet, Black-tailed deer & Roosevelt elk
UWR – decrease by 1%
MAMU – decrease by 2%
History
New CSA Core Indicator in 2010
Justification
Some species need habitat that includes mature to old trees for their survival. Habitat currently unsuitable for species may develop the attributes necessary for the survival of the species as it ages. It is important to ensure critical habitat will be available in the long-term. Long-term is defined as twice the average life expectancy of the predominate trees in a DFA, up to a maximum of 300 years. Tree species within the DFA are long lived and the long-term is defined as the maximum of 300 years.
Ungulate winter ranges are areas identified as critical to the survival of local populations of ungulates during severe winters. On Vancouver Island, black-tailed deer and Roosevelt elk need areas with suitable forest and topographical features that are able to provide shelter, forage and snow interception. Roosevelt elk are on the BC provincial blue-list and have a BC Conservation Framework Priority 2 (BC Species and Ecosystems Explorer, 2010) as well as having local and cultural importance. Black-tailed deer are not considered a species of concern but have local importance for food, economic opportunity and recreation.
Marbled murrelets are small seabirds that nest inland with a majority of nests being found on large boughs high in old conifers up to 30 km inland. Much work has been done along the coast to identify and rank suitable nesting habitat for marbled murrelets. Marbled murrelets are listed as Threatened on Schedule 1 of the Federal Species at Risk Act (SARA), provincially blue-listed, listed on the Forest and Range Practices Act (FRPA) Category of Species at Risk and considered Identified Wildlife, and have a BC Conservation Framework Priority of 1 (BC Species and Ecosystems Explorer, 2010). Identified Wildlife are considered to be sensitive to habitat alteration associated with forest and range practices and are considered to be at risk (endangered, threatened, vulnerable or regionally important).
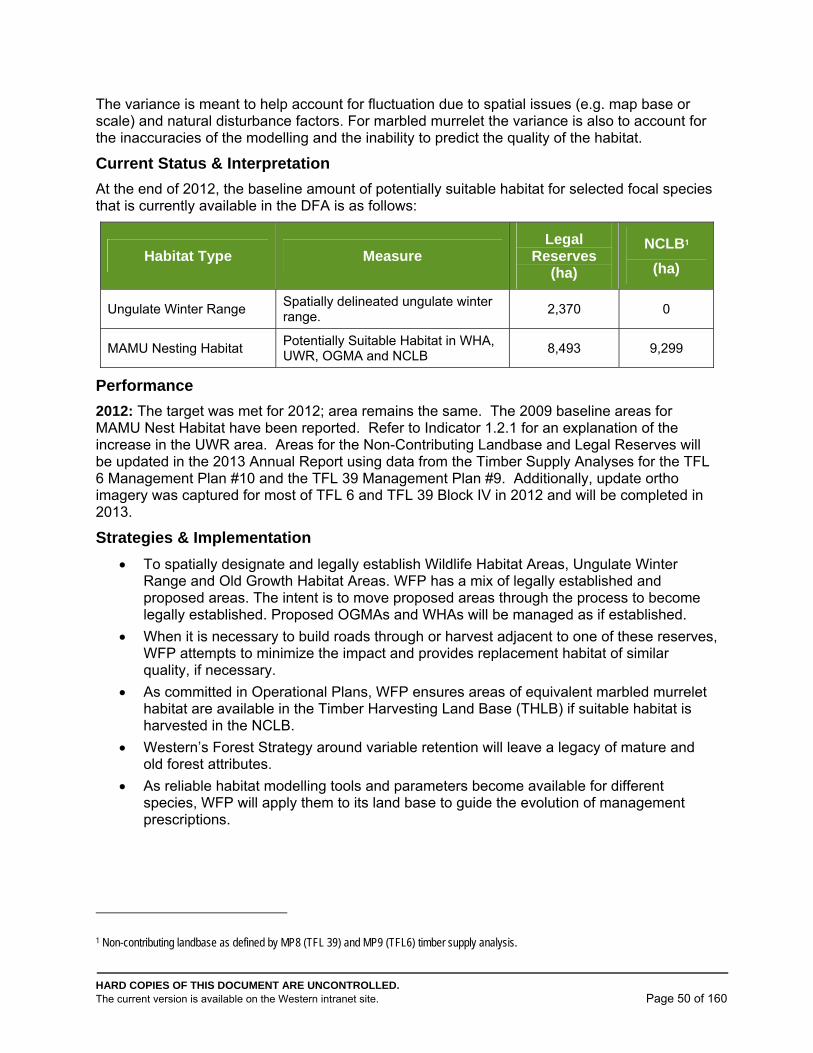
HARD COPIES OF THIS DOCUMENT ARE UNCONTROLLED. The current version is available on the Western intranet site. Page 50 of 160
The variance is meant to help account for fluctuation due to spatial issues (e.g. map base or scale) and natural disturbance factors. For marbled murrelet the variance is also to account for the inaccuracies of the modelling and the inability to predict the quality of the habitat.
Current Status & Interpretation
At the end of 2012, the baseline amount of potentially suitable habitat for selected focal species that is currently available in the DFA is as follows:
Habitat Type Measure Legal
Reserves (ha)
NCLB1
(ha)
Ungulate Winter Range Spatially delineated ungulate winter range.
2,370 0
MAMU Nesting Habitat Potentially Suitable Habitat in WHA, UWR, OGMA and NCLB
8,493 9,299
Performance
2012: The target was met for 2012; area remains the same. The 2009 baseline areas for MAMU Nest Habitat have been reported. Refer to Indicator 1.2.1 for an explanation of the increase in the UWR area. Areas for the Non-Contributing Landbase and Legal Reserves will be updated in the 2013 Annual Report using data from the Timber Supply Analyses for the TFL 6 Management Plan #10 and the TFL 39 Management Plan #9. Additionally, update ortho imagery was captured for most of TFL 6 and TFL 39 Block IV in 2012 and will be completed in 2013.
Strategies & Implementation
To spatially designate and legally establish Wildlife Habitat Areas, Ungulate Winter Range and Old Growth Habitat Areas. WFP has a mix of legally established and proposed areas. The intent is to move proposed areas through the process to become legally established. Proposed OGMAs and WHAs will be managed as if established.
When it is necessary to build roads through or harvest adjacent to one of these reserves, WFP attempts to minimize the impact and provides replacement habitat of similar quality, if necessary.
As committed in Operational Plans, WFP ensures areas of equivalent marbled murrelet habitat are available in the Timber Harvesting Land Base (THLB) if suitable habitat is harvested in the NCLB.
Western’s Forest Strategy around variable retention will leave a legacy of mature and old forest attributes.
As reliable habitat modelling tools and parameters become available for different species, WFP will apply them to its land base to guide the evolution of management prescriptions.
1 Non-contributing landbase as defined by MP8 (TFL 39) and MP9 (TFL6) timber supply analysis.
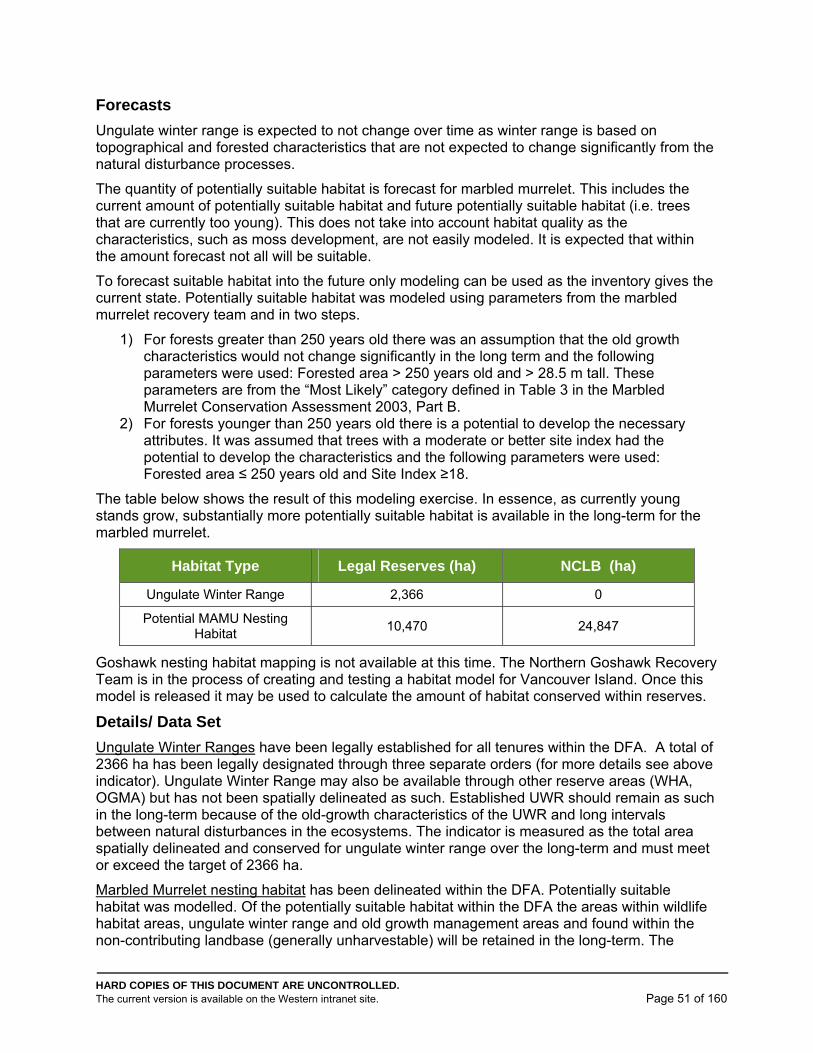
HARD COPIES OF THIS DOCUMENT ARE UNCONTROLLED. The current version is available on the Western intranet site. Page 51 of 160
Forecasts
Ungulate winter range is expected to not change over time as winter range is based on topographical and forested characteristics that are not expected to change significantly from the natural disturbance processes.
The quantity of potentially suitable habitat is forecast for marbled murrelet. This includes the current amount of potentially suitable habitat and future potentially suitable habitat (i.e. trees that are currently too young). This does not take into account habitat quality as the characteristics, such as moss development, are not easily modeled. It is expected that within the amount forecast not all will be suitable.
To forecast suitable habitat into the future only modeling can be used as the inventory gives the current state. Potentially suitable habitat was modeled using parameters from the marbled murrelet recovery team and in two steps.
1) For forests greater than 250 years old there was an assumption that the old growth characteristics would not change significantly in the long term and the following parameters were used: Forested area > 250 years old and > 28.5 m tall. These parameters are from the “Most Likely” category defined in Table 3 in the Marbled Murrelet Conservation Assessment 2003, Part B.
2) For forests younger than 250 years old there is a potential to develop the necessary attributes. It was assumed that trees with a moderate or better site index had the potential to develop the characteristics and the following parameters were used: Forested area ≤ 250 years old and Site Index ≥18.
The table below shows the result of this modeling exercise. In essence, as currently young stands grow, substantially more potentially suitable habitat is available in the long-term for the marbled murrelet.
Habitat Type Legal Reserves (ha) NCLB (ha)
Ungulate Winter Range 2,366 0
Potential MAMU Nesting Habitat
10,470 24,847
Goshawk nesting habitat mapping is not available at this time. The Northern Goshawk Recovery Team is in the process of creating and testing a habitat model for Vancouver Island. Once this model is released it may be used to calculate the amount of habitat conserved within reserves.
Details/ Data Set
Ungulate Winter Ranges have been legally established for all tenures within the DFA. A total of 2366 ha has been legally designated through three separate orders (for more details see above indicator). Ungulate Winter Range may also be available through other reserve areas (WHA, OGMA) but has not been spatially delineated as such. Established UWR should remain as such in the long-term because of the old-growth characteristics of the UWR and long intervals between natural disturbances in the ecosystems. The indicator is measured as the total area spatially delineated and conserved for ungulate winter range over the long-term and must meet or exceed the target of 2366 ha.
Marbled Murrelet nesting habitat has been delineated within the DFA. Potentially suitable habitat was modelled. Of the potentially suitable habitat within the DFA the areas within wildlife habitat areas, ungulate winter range and old growth management areas and found within the non-contributing landbase (generally unharvestable) will be retained in the long-term. The
HARD COPIES OF THIS DOCUMENT ARE UNCONTROLLED. The current version is available on the Western intranet site. Page 52 of 160
potentially suitable habitat available in reserves was calculated using the current legal and proposed WHA, UWR and OGMAs. The non-contributing landbase was calculated using data from the TFL 6 Management Plan 9 (2001) and TFL 39 Block 4 Management Plan 8 (2000) datasets created for the timber supply analysis. Areas will be updated for the 2012 Annual Report using information from the Timber Supply Analyses for Management Plan #10 for TFL 6 and Management Plan #9 for TFL 39.
This indicator is a measure of the amount of potentially suitable nesting habitat retained within the DFA over the long-term. The amount should be consistent or increase from the current state and not be less than 17,792 ha.
Monitoring
Reserves are mapped spatially in a layer of the GIS. Changes in boundaries are tracked by Corporate Forestry biologists.
Potential habitat supply will be monitored spatially relative to the target every 5 years.
Non-contributing landbase will be recalculated with new timber supply analysis
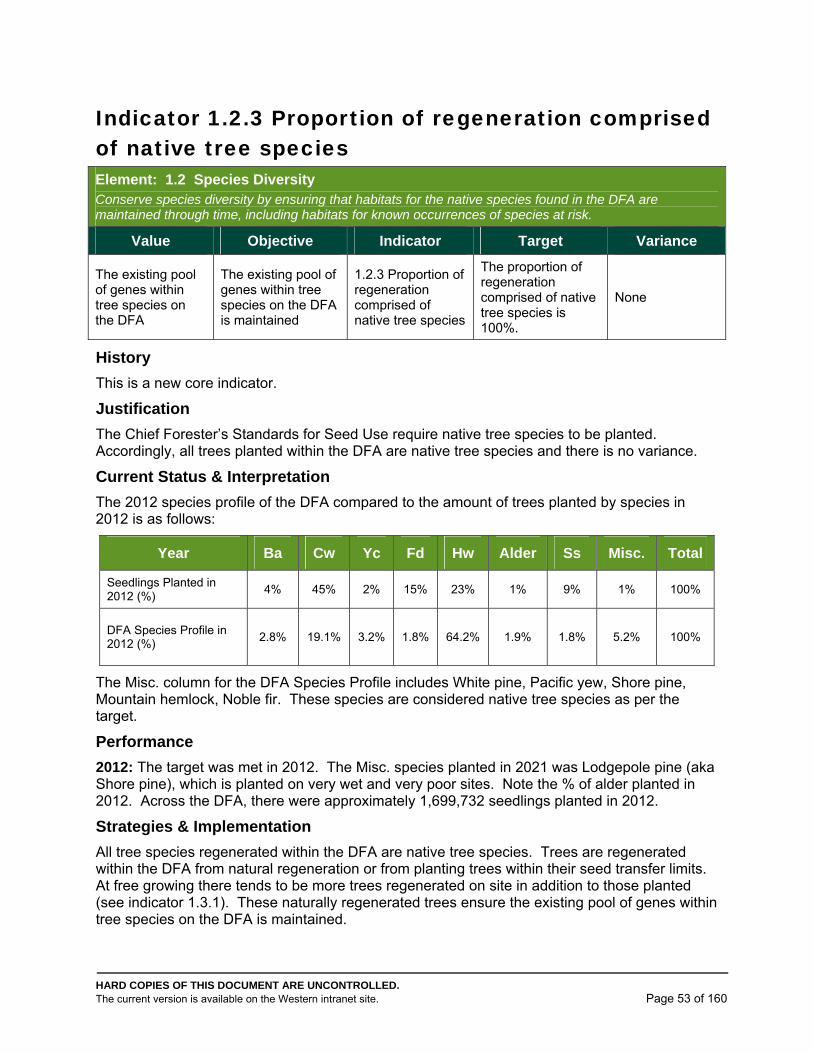
HARD COPIES OF THIS DOCUMENT ARE UNCONTROLLED. The current version is available on the Western intranet site. Page 53 of 160
Indicator 1.2.3 Proportion of regeneration comprised of native tree species Element: 1.2 Species Diversity Conserve species diversity by ensuring that habitats for the native species found in the DFA are maintained through time, including habitats for known occurrences of species at risk.
Value Objective Indicator Target Variance
The existing pool of genes within tree species on the DFA
The existing pool of genes within tree species on the DFA is maintained
1.2.3 Proportion of regeneration comprised of native tree species
The proportion of regeneration comprised of native tree species is 100%.
None
History
This is a new core indicator.
Justification
The Chief Forester’s Standards for Seed Use require native tree species to be planted. Accordingly, all trees planted within the DFA are native tree species and there is no variance.
Current Status & Interpretation
The 2012 species profile of the DFA compared to the amount of trees planted by species in 2012 is as follows:
Year Ba Cw Yc Fd Hw Alder Ss Misc. Total
Seedlings Planted in 2012 (%)
4% 45% 2% 15% 23% 1% 9% 1% 100%
DFA Species Profile in 2012 (%)
2.8% 19.1% 3.2% 1.8% 64.2% 1.9% 1.8% 5.2% 100%
The Misc. column for the DFA Species Profile includes White pine, Pacific yew, Shore pine, Mountain hemlock, Noble fir. These species are considered native tree species as per the target.
Performance
2012: The target was met in 2012. The Misc. species planted in 2021 was Lodgepole pine (aka Shore pine), which is planted on very wet and very poor sites. Note the % of alder planted in 2012. Across the DFA, there were approximately 1,699,732 seedlings planted in 2012.
Strategies & Implementation
All tree species regenerated within the DFA are native tree species. Trees are regenerated within the DFA from natural regeneration or from planting trees within their seed transfer limits. At free growing there tends to be more trees regenerated on site in addition to those planted (see indicator 1.3.1). These naturally regenerated trees ensure the existing pool of genes within tree species on the DFA is maintained.
HARD COPIES OF THIS DOCUMENT ARE UNCONTROLLED. The current version is available on the Western intranet site. Page 54 of 160
Forecasts
Assuming that climate change does not trigger species extirpation, it is expected that native tree species will continue to be planted and natural regeneration of trees will continue to significantly augment planted areas at historical levels and contribute to genetic diversity.
Also, there is no expectation of changes in regulation that would alter the current standard of reforestation with ecologically suited species and allow the introduction of exotic species.
Details/ Data Set
The number of trees planted by species during the annual spring and fall planting programs will demonstrate that only native species are planted. The species planted are generally Cw and Hw with lesser amounts of Ba, Yc, Fdc and Ss. Hemlock regenerates very well naturally across the DFA but to determine the amount of natural Hw regeneration is difficult. Sitka spruce tends not to be reforested in large numbers due to the Sitka spruce weevil. Resistant seed is becoming available and there may more be planted in the future.
Monitoring
The Operations Forester or designate manages the planting program. The number and species of trees planted are entered into CENFOR.
The Operations Forester or designate compiles the data from the CENFOR database and reports on the indicator performance in the SFM Plan Annual Report.
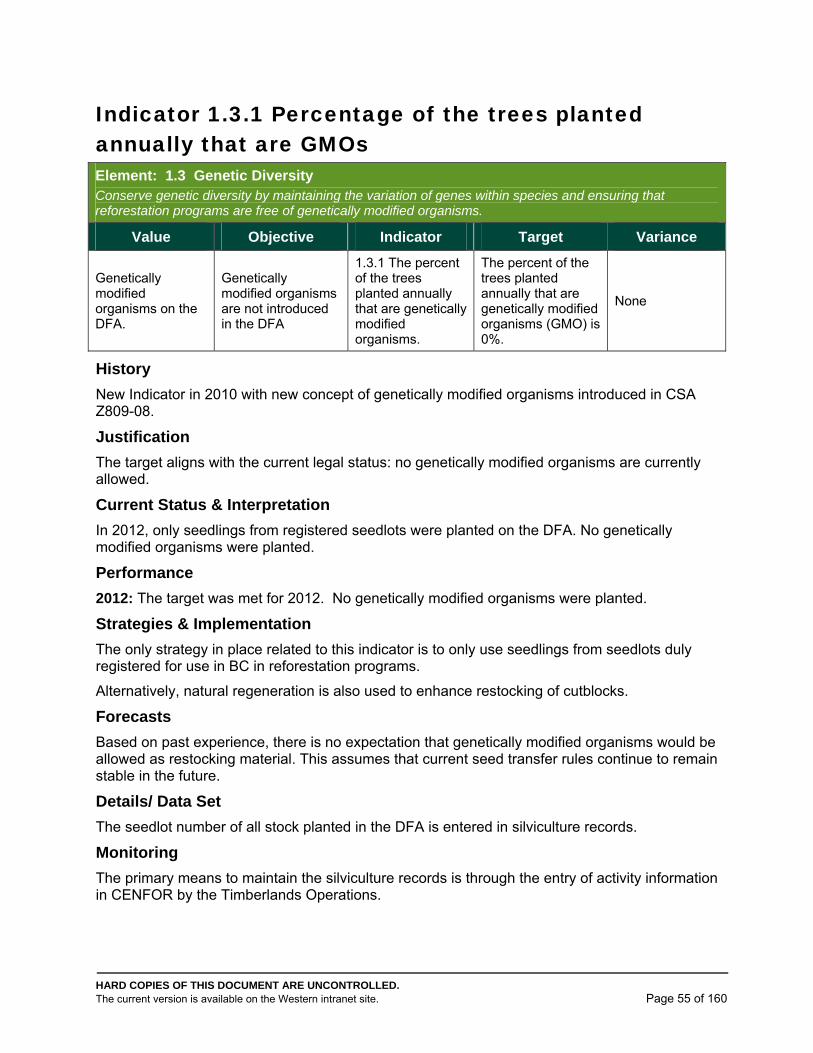
HARD COPIES OF THIS DOCUMENT ARE UNCONTROLLED. The current version is available on the Western intranet site. Page 55 of 160
Indicator 1.3.1 Percentage of the trees planted annually that are GMOs Element: 1.3 Genetic Diversity Conserve genetic diversity by maintaining the variation of genes within species and ensuring that reforestation programs are free of genetically modified organisms.
Value Objective Indicator Target Variance
Genetically modified organisms on the DFA.
Genetically modified organisms are not introduced in the DFA
1.3.1 The percent of the trees planted annually that are genetically modified organisms.
The percent of the trees planted annually that are genetically modified organisms (GMO) is 0%.
None
History
New Indicator in 2010 with new concept of genetically modified organisms introduced in CSA Z809-08.
Justification
The target aligns with the current legal status: no genetically modified organisms are currently allowed.
Current Status & Interpretation
In 2012, only seedlings from registered seedlots were planted on the DFA. No genetically modified organisms were planted.
Performance
2012: The target was met for 2012. No genetically modified organisms were planted.
Strategies & Implementation
The only strategy in place related to this indicator is to only use seedlings from seedlots duly registered for use in BC in reforestation programs.
Alternatively, natural regeneration is also used to enhance restocking of cutblocks.
Forecasts
Based on past experience, there is no expectation that genetically modified organisms would be allowed as restocking material. This assumes that current seed transfer rules continue to remain stable in the future.
Details/ Data Set
The seedlot number of all stock planted in the DFA is entered in silviculture records.
Monitoring
The primary means to maintain the silviculture records is through the entry of activity information in CENFOR by the Timberlands Operations.
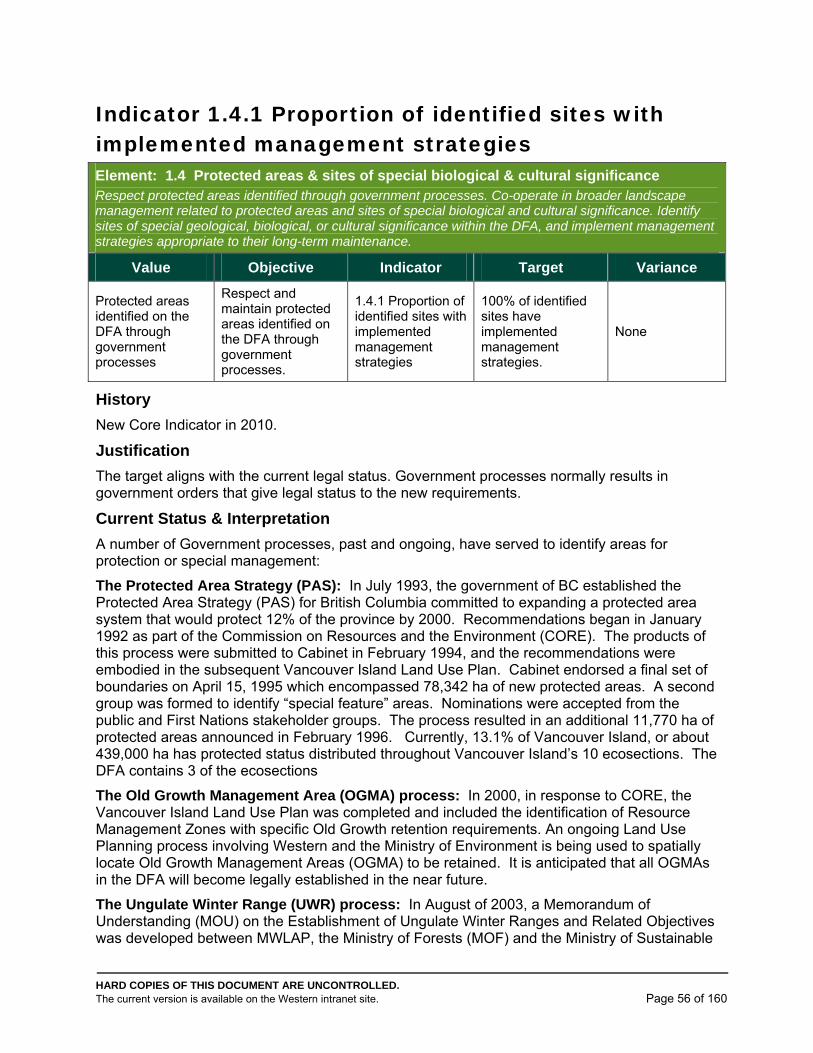
HARD COPIES OF THIS DOCUMENT ARE UNCONTROLLED. The current version is available on the Western intranet site. Page 56 of 160
Indicator 1.4.1 Proportion of identified sites with implemented management strategies Element: 1.4 Protected areas & sites of special biological & cultural significance Respect protected areas identified through government processes. Co-operate in broader landscape management related to protected areas and sites of special biological and cultural significance. Identify sites of special geological, biological, or cultural significance within the DFA, and implement management strategies appropriate to their long-term maintenance.
Value Objective Indicator Target Variance
Protected areas identified on the DFA through government processes
Respect and maintain protected areas identified on the DFA through government processes.
1.4.1 Proportion of identified sites with implemented management strategies
100% of identified sites have implemented management strategies.
None
History
New Core Indicator in 2010.
Justification
The target aligns with the current legal status. Government processes normally results in government orders that give legal status to the new requirements.
Current Status & Interpretation
A number of Government processes, past and ongoing, have served to identify areas for protection or special management:
The Protected Area Strategy (PAS): In July 1993, the government of BC established the Protected Area Strategy (PAS) for British Columbia committed to expanding a protected area system that would protect 12% of the province by 2000. Recommendations began in January 1992 as part of the Commission on Resources and the Environment (CORE). The products of this process were submitted to Cabinet in February 1994, and the recommendations were embodied in the subsequent Vancouver Island Land Use Plan. Cabinet endorsed a final set of boundaries on April 15, 1995 which encompassed 78,342 ha of new protected areas. A second group was formed to identify “special feature” areas. Nominations were accepted from the public and First Nations stakeholder groups. The process resulted in an additional 11,770 ha of protected areas announced in February 1996. Currently, 13.1% of Vancouver Island, or about 439,000 ha has protected status distributed throughout Vancouver Island’s 10 ecosections. The DFA contains 3 of the ecosections
The Old Growth Management Area (OGMA) process: In 2000, in response to CORE, the Vancouver Island Land Use Plan was completed and included the identification of Resource Management Zones with specific Old Growth retention requirements. An ongoing Land Use Planning process involving Western and the Ministry of Environment is being used to spatially locate Old Growth Management Areas (OGMA) to be retained. It is anticipated that all OGMAs in the DFA will become legally established in the near future.
The Ungulate Winter Range (UWR) process: In August of 2003, a Memorandum of Understanding (MOU) on the Establishment of Ungulate Winter Ranges and Related Objectives was developed between MWLAP, the Ministry of Forests (MOF) and the Ministry of Sustainable
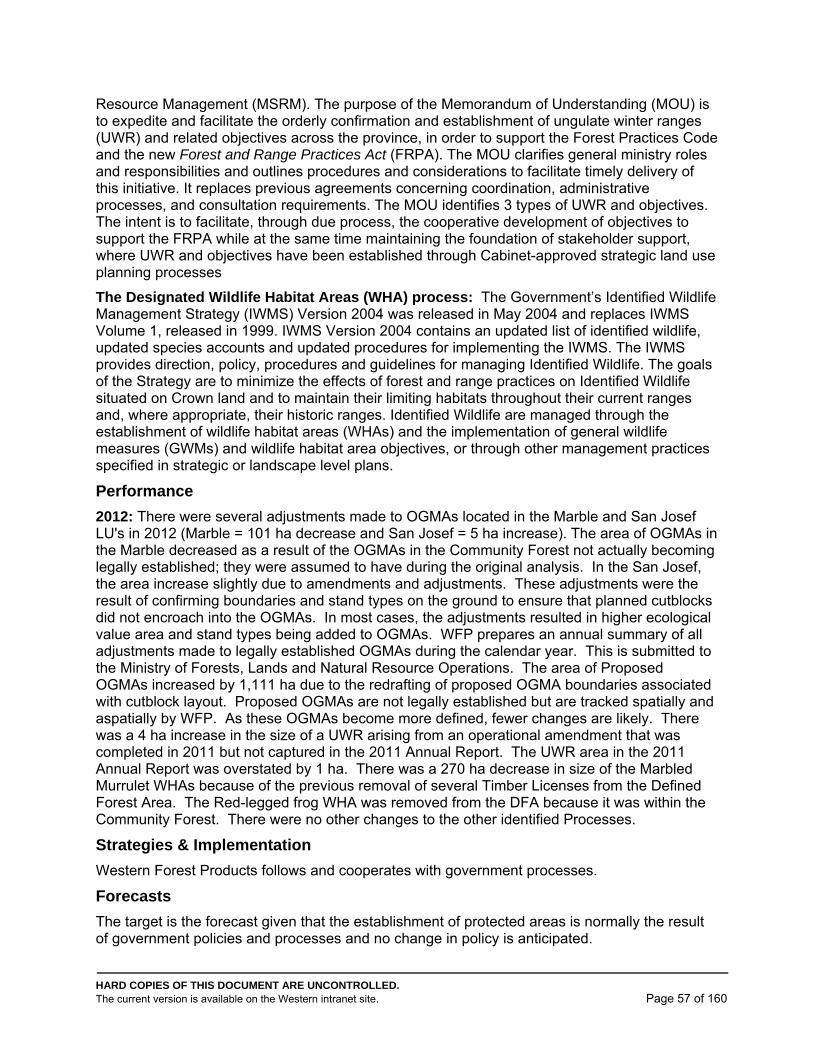
HARD COPIES OF THIS DOCUMENT ARE UNCONTROLLED. The current version is available on the Western intranet site. Page 57 of 160
Resource Management (MSRM). The purpose of the Memorandum of Understanding (MOU) is to expedite and facilitate the orderly confirmation and establishment of ungulate winter ranges (UWR) and related objectives across the province, in order to support the Forest Practices Code and the new Forest and Range Practices Act (FRPA). The MOU clarifies general ministry roles and responsibilities and outlines procedures and considerations to facilitate timely delivery of this initiative. It replaces previous agreements concerning coordination, administrative processes, and consultation requirements. The MOU identifies 3 types of UWR and objectives. The intent is to facilitate, through due process, the cooperative development of objectives to support the FRPA while at the same time maintaining the foundation of stakeholder support, where UWR and objectives have been established through Cabinet-approved strategic land use planning processes
The Designated Wildlife Habitat Areas (WHA) process: The Government’s Identified Wildlife Management Strategy (IWMS) Version 2004 was released in May 2004 and replaces IWMS Volume 1, released in 1999. IWMS Version 2004 contains an updated list of identified wildlife, updated species accounts and updated procedures for implementing the IWMS. The IWMS provides direction, policy, procedures and guidelines for managing Identified Wildlife. The goals of the Strategy are to minimize the effects of forest and range practices on Identified Wildlife situated on Crown land and to maintain their limiting habitats throughout their current ranges and, where appropriate, their historic ranges. Identified Wildlife are managed through the establishment of wildlife habitat areas (WHAs) and the implementation of general wildlife measures (GWMs) and wildlife habitat area objectives, or through other management practices specified in strategic or landscape level plans.
Performance
2012: There were several adjustments made to OGMAs located in the Marble and San Josef LU's in 2012 (Marble = 101 ha decrease and San Josef = 5 ha increase). The area of OGMAs in the Marble decreased as a result of the OGMAs in the Community Forest not actually becoming legally established; they were assumed to have during the original analysis. In the San Josef, the area increase slightly due to amendments and adjustments. These adjustments were the result of confirming boundaries and stand types on the ground to ensure that planned cutblocks did not encroach into the OGMAs. In most cases, the adjustments resulted in higher ecological value area and stand types being added to OGMAs. WFP prepares an annual summary of all adjustments made to legally established OGMAs during the calendar year. This is submitted to the Ministry of Forests, Lands and Natural Resource Operations. The area of Proposed OGMAs increased by 1,111 ha due to the redrafting of proposed OGMA boundaries associated with cutblock layout. Proposed OGMAs are not legally established but are tracked spatially and aspatially by WFP. As these OGMAs become more defined, fewer changes are likely. There was a 4 ha increase in the size of a UWR arising from an operational amendment that was completed in 2011 but not captured in the 2011 Annual Report. The UWR area in the 2011 Annual Report was overstated by 1 ha. There was a 270 ha decrease in size of the Marbled Murrulet WHAs because of the previous removal of several Timber Licenses from the Defined Forest Area. The Red-legged frog WHA was removed from the DFA because it was within the Community Forest. There were no other changes to the other identified Processes.
Strategies & Implementation
Western Forest Products follows and cooperates with government processes.
Forecasts
The target is the forecast given that the establishment of protected areas is normally the result of government policies and processes and no change in policy is anticipated.
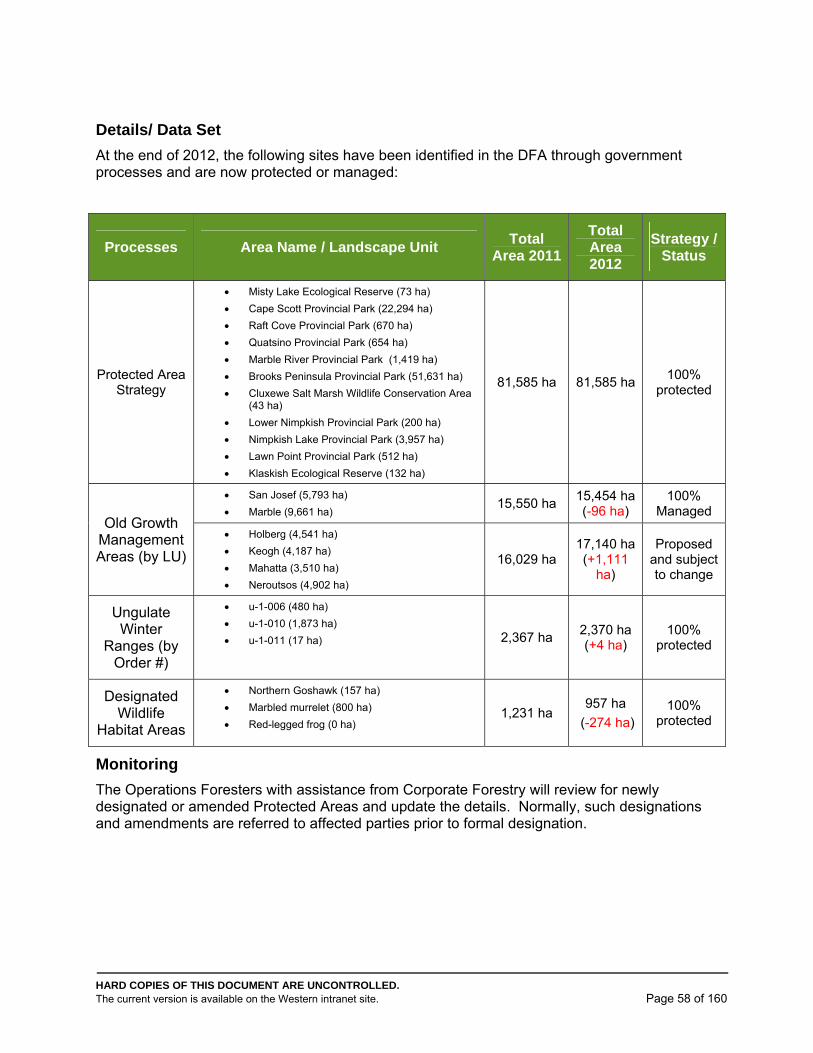
HARD COPIES OF THIS DOCUMENT ARE UNCONTROLLED. The current version is available on the Western intranet site. Page 58 of 160
Details/ Data Set
At the end of 2012, the following sites have been identified in the DFA through government processes and are now protected or managed:
Processes Area Name / Landscape Unit Total
Area 2011
Total Area 2012
Strategy / Status
Protected Area Strategy
Misty Lake Ecological Reserve (73 ha)
Cape Scott Provincial Park (22,294 ha)
Raft Cove Provincial Park (670 ha)
Quatsino Provincial Park (654 ha)
Marble River Provincial Park (1,419 ha)
Brooks Peninsula Provincial Park (51,631 ha)
Cluxewe Salt Marsh Wildlife Conservation Area (43 ha)
Lower Nimpkish Provincial Park (200 ha)
Nimpkish Lake Provincial Park (3,957 ha)
Lawn Point Provincial Park (512 ha)
Klaskish Ecological Reserve (132 ha)
81,585 ha 81,585 ha 100%
protected
Old Growth Management Areas (by LU)
San Josef (5,793 ha)
Marble (9,661 ha) 15,550 ha
15,454 ha (-96 ha)
100% Managed
Holberg (4,541 ha)
Keogh (4,187 ha)
Mahatta (3,510 ha)
Neroutsos (4,902 ha)
16,029 ha 17,140 ha (+1,111
ha)
Proposed and subject to change
Ungulate Winter
Ranges (by Order #)
u-1-006 (480 ha)
u-1-010 (1,873 ha)
u-1-011 (17 ha) 2,367 ha 2,370 ha (+4 ha)
100% protected
Designated Wildlife
Habitat Areas
Northern Goshawk (157 ha)
Marbled murrelet (800 ha)
Red-legged frog (0 ha) 1,231 ha
957 ha
(-274 ha) 100%
protected
Monitoring
The Operations Foresters with assistance from Corporate Forestry will review for newly designated or amended Protected Areas and update the details. Normally, such designations and amendments are referred to affected parties prior to formal designation.
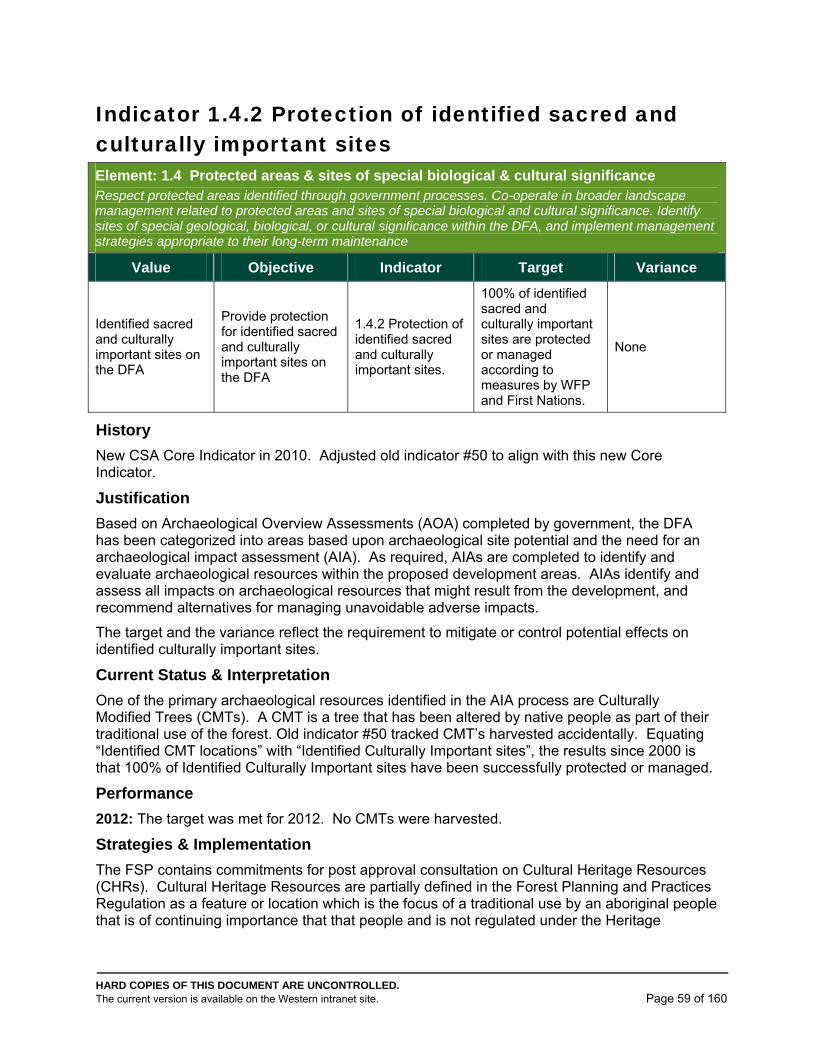
HARD COPIES OF THIS DOCUMENT ARE UNCONTROLLED. The current version is available on the Western intranet site. Page 59 of 160
Indicator 1.4.2 Protection of identified sacred and culturally important sites Element: 1.4 Protected areas & sites of special biological & cultural significance Respect protected areas identified through government processes. Co-operate in broader landscape management related to protected areas and sites of special biological and cultural significance. Identify sites of special geological, biological, or cultural significance within the DFA, and implement management strategies appropriate to their long-term maintenance
Value Objective Indicator Target Variance
Identified sacred and culturally important sites on the DFA
Provide protection for identified sacred and culturally important sites on the DFA
1.4.2 Protection of identified sacred and culturally important sites.
100% of identified sacred and culturally important sites are protected or managed according to measures by WFP and First Nations.
None
History
New CSA Core Indicator in 2010. Adjusted old indicator #50 to align with this new Core Indicator.
Justification
Based on Archaeological Overview Assessments (AOA) completed by government, the DFA has been categorized into areas based upon archaeological site potential and the need for an archaeological impact assessment (AIA). As required, AIAs are completed to identify and evaluate archaeological resources within the proposed development areas. AIAs identify and assess all impacts on archaeological resources that might result from the development, and recommend alternatives for managing unavoidable adverse impacts.
The target and the variance reflect the requirement to mitigate or control potential effects on identified culturally important sites.
Current Status & Interpretation
One of the primary archaeological resources identified in the AIA process are Culturally Modified Trees (CMTs). A CMT is a tree that has been altered by native people as part of their traditional use of the forest. Old indicator #50 tracked CMT’s harvested accidentally. Equating “Identified CMT locations” with “Identified Culturally Important sites”, the results since 2000 is that 100% of Identified Culturally Important sites have been successfully protected or managed.
Performance
2012: The target was met for 2012. No CMTs were harvested.
Strategies & Implementation
The FSP contains commitments for post approval consultation on Cultural Heritage Resources (CHRs). Cultural Heritage Resources are partially defined in the Forest Planning and Practices Regulation as a feature or location which is the focus of a traditional use by an aboriginal people that is of continuing importance that that people and is not regulated under the Heritage
HARD COPIES OF THIS DOCUMENT ARE UNCONTROLLED. The current version is available on the Western intranet site. Page 60 of 160
Conservation Act. The Heritage Conservation Act applies to operational activities. Additionally, a MFLNRO District letter on CP consultation guides cutting permit applications.
Forecasts
The target is anticipated to be met based on past policy and experience. Given the status of First Nations in BC, no change in company policy is anticipated and company cooperation with First Nations is expected to continue.
Details/ Data Set
This indicator will be determined by tallying the number of known CMTs or CHRs that were accidentally harvested during the reporting year. This has been reported since 2001.
Data will be tracked and compiled at the Forest Operation level. All occurrences will be recorded in the applicable block file.
Monitoring
The Operations Engineers report on the indicator in the SFM Plan Annual Report. The primary monitoring process will be through Cutblock Inspections and Post Harvest Assessments.
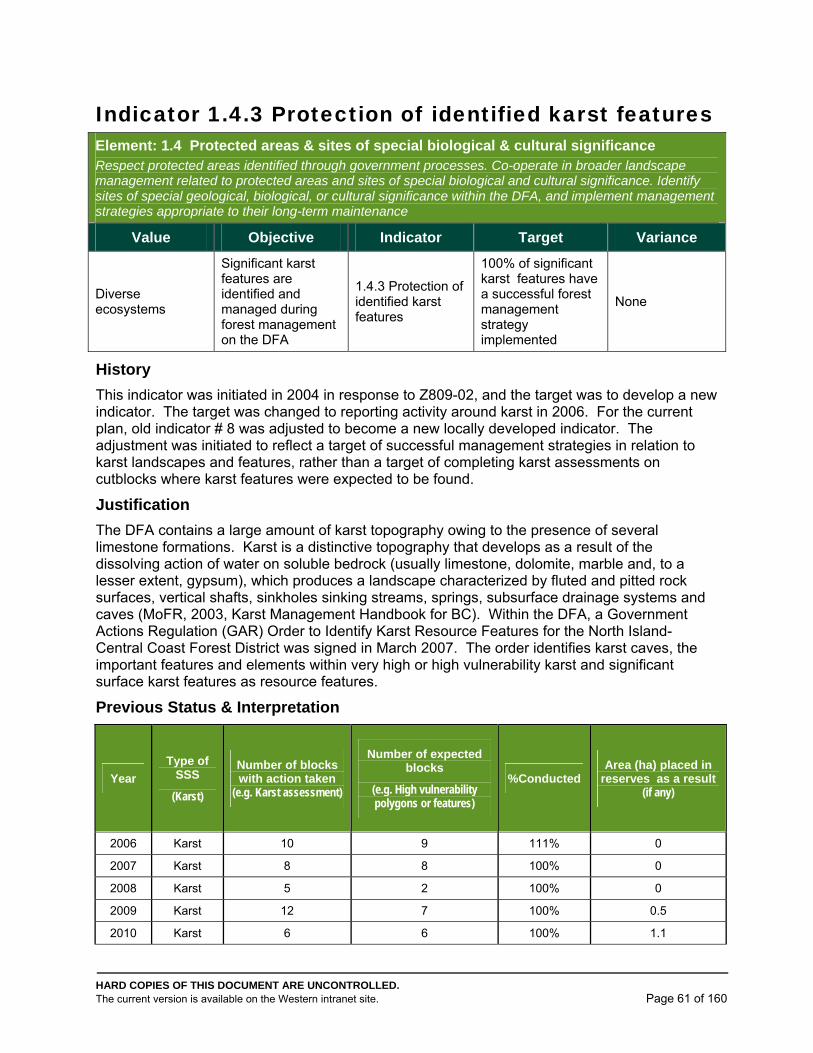
HARD COPIES OF THIS DOCUMENT ARE UNCONTROLLED. The current version is available on the Western intranet site. Page 61 of 160
Indicator 1.4.3 Protection of identified karst features Element: 1.4 Protected areas & sites of special biological & cultural significance Respect protected areas identified through government processes. Co-operate in broader landscape management related to protected areas and sites of special biological and cultural significance. Identify sites of special geological, biological, or cultural significance within the DFA, and implement management strategies appropriate to their long-term maintenance
Value Objective Indicator Target Variance
Diverse ecosystems
Significant karst features are identified and managed during forest management on the DFA
1.4.3 Protection of identified karst features
100% of significant karst features have a successful forest management strategy implemented
None
History
This indicator was initiated in 2004 in response to Z809-02, and the target was to develop a new indicator. The target was changed to reporting activity around karst in 2006. For the current plan, old indicator # 8 was adjusted to become a new locally developed indicator. The adjustment was initiated to reflect a target of successful management strategies in relation to karst landscapes and features, rather than a target of completing karst assessments on cutblocks where karst features were expected to be found.
Justification
The DFA contains a large amount of karst topography owing to the presence of several limestone formations. Karst is a distinctive topography that develops as a result of the dissolving action of water on soluble bedrock (usually limestone, dolomite, marble and, to a lesser extent, gypsum), which produces a landscape characterized by fluted and pitted rock surfaces, vertical shafts, sinkholes sinking streams, springs, subsurface drainage systems and caves (MoFR, 2003, Karst Management Handbook for BC). Within the DFA, a Government Actions Regulation (GAR) Order to Identify Karst Resource Features for the North Island- Central Coast Forest District was signed in March 2007. The order identifies karst caves, the important features and elements within very high or high vulnerability karst and significant surface karst features as resource features.
Previous Status & Interpretation
Year
Type of SSS
(Karst)
Number of blocks with action taken
(e.g. Karst assessment)
Number of expected blocks
(e.g. High vulnerability polygons or features)
%Conducted Area (ha) placed in
reserves as a result (if any)
2006 Karst 10 9 111% 0
2007 Karst 8 8 100% 0
2008 Karst 5 2 100% 0
2009 Karst 12 7 100% 0.5
2010 Karst 6 6 100% 1.1
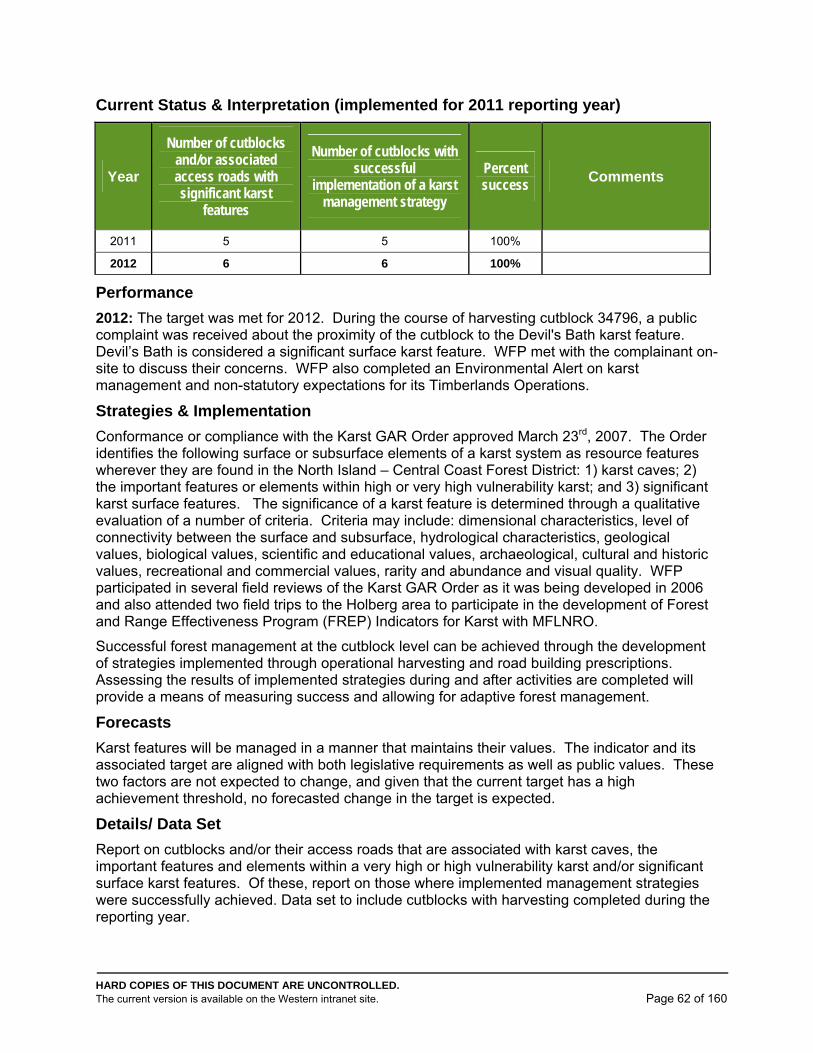
HARD COPIES OF THIS DOCUMENT ARE UNCONTROLLED. The current version is available on the Western intranet site. Page 62 of 160
Current Status & Interpretation (implemented for 2011 reporting year)
Year
Number of cutblocks and/or associated access roads with significant karst
features
Number of cutblocks with successful
implementation of a karst management strategy
Percent success
Comments
2011 5 5 100%
2012 6 6 100%
Performance
2012: The target was met for 2012. During the course of harvesting cutblock 34796, a public complaint was received about the proximity of the cutblock to the Devil's Bath karst feature. Devil’s Bath is considered a significant surface karst feature. WFP met with the complainant on-site to discuss their concerns. WFP also completed an Environmental Alert on karst management and non-statutory expectations for its Timberlands Operations.
Strategies & Implementation
Conformance or compliance with the Karst GAR Order approved March 23rd, 2007. The Order identifies the following surface or subsurface elements of a karst system as resource features wherever they are found in the North Island – Central Coast Forest District: 1) karst caves; 2) the important features or elements within high or very high vulnerability karst; and 3) significant karst surface features. The significance of a karst feature is determined through a qualitative evaluation of a number of criteria. Criteria may include: dimensional characteristics, level of connectivity between the surface and subsurface, hydrological characteristics, geological values, biological values, scientific and educational values, archaeological, cultural and historic values, recreational and commercial values, rarity and abundance and visual quality. WFP participated in several field reviews of the Karst GAR Order as it was being developed in 2006 and also attended two field trips to the Holberg area to participate in the development of Forest and Range Effectiveness Program (FREP) Indicators for Karst with MFLNRO.
Successful forest management at the cutblock level can be achieved through the development of strategies implemented through operational harvesting and road building prescriptions. Assessing the results of implemented strategies during and after activities are completed will provide a means of measuring success and allowing for adaptive forest management.
Forecasts
Karst features will be managed in a manner that maintains their values. The indicator and its associated target are aligned with both legislative requirements as well as public values. These two factors are not expected to change, and given that the current target has a high achievement threshold, no forecasted change in the target is expected.
Details/ Data Set
Report on cutblocks and/or their access roads that are associated with karst caves, the important features and elements within a very high or high vulnerability karst and/or significant surface karst features. Of these, report on those where implemented management strategies were successfully achieved. Data set to include cutblocks with harvesting completed during the reporting year.
HARD COPIES OF THIS DOCUMENT ARE UNCONTROLLED. The current version is available on the Western intranet site. Page 63 of 160
Monitoring
The Operations Engineers report on the indicator performance in the SFM Plan Annual Report. The primary monitoring process will be through road and/or cutblock inspections and Post Harvest Assessments.
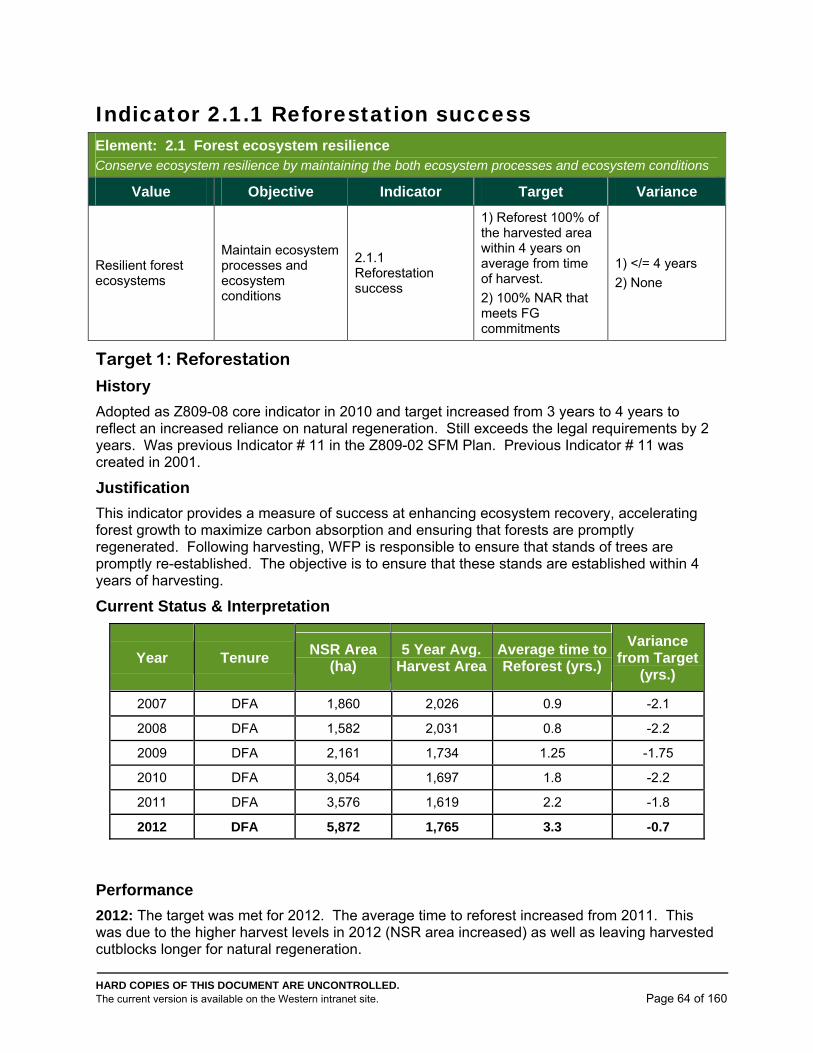
HARD COPIES OF THIS DOCUMENT ARE UNCONTROLLED. The current version is available on the Western intranet site. Page 64 of 160
Indicator 2.1.1 Reforestation success Element: 2.1 Forest ecosystem resilience Conserve ecosystem resilience by maintaining the both ecosystem processes and ecosystem conditions
Value Objective Indicator Target Variance
Resilient forest ecosystems
Maintain ecosystem processes and ecosystem conditions
2.1.1 Reforestation success
1) Reforest 100% of the harvested area within 4 years on average from time of harvest.
2) 100% NAR that meets FG commitments
1) </= 4 years
2) None
Target 1: Reforestation
History
Adopted as Z809-08 core indicator in 2010 and target increased from 3 years to 4 years to reflect an increased reliance on natural regeneration. Still exceeds the legal requirements by 2 years. Was previous Indicator # 11 in the Z809-02 SFM Plan. Previous Indicator # 11 was created in 2001.
Justification
This indicator provides a measure of success at enhancing ecosystem recovery, accelerating forest growth to maximize carbon absorption and ensuring that forests are promptly regenerated. Following harvesting, WFP is responsible to ensure that stands of trees are promptly re-established. The objective is to ensure that these stands are established within 4 years of harvesting.
Current Status & Interpretation
Year Tenure NSR Area
(ha) 5 Year Avg.
Harvest AreaAverage time to Reforest (yrs.)
Variance from Target
(yrs.)
2007 DFA 1,860 2,026 0.9 -2.1
2008 DFA 1,582 2,031 0.8 -2.2
2009 DFA 2,161 1,734 1.25 -1.75
2010 DFA 3,054 1,697 1.8 -2.2
2011 DFA 3,576 1,619 2.2 -1.8
2012 DFA 5,872 1,765 3.3 -0.7
Performance
2012: The target was met for 2012. The average time to reforest increased from 2011. This was due to the higher harvest levels in 2012 (NSR area increased) as well as leaving harvested cutblocks longer for natural regeneration.
HARD COPIES OF THIS DOCUMENT ARE UNCONTROLLED. The current version is available on the Western intranet site. Page 65 of 160
Strategies & Implementation
A series of steps are involved in managing regeneration: Approved FSP Stocking Standards, Cutblock Silviculture Instructions, Cenfor planning, project reporting, RESULTS reporting. Jeune Landing and Port McNeill Operations: Natural regeneration is primarily a strategy on zonal sites in the Northern Vancouver Island Mountains, versus Nahwitti lowlands areas which are dominated by more salal influence. Holberg Forest Operation: 20% Natural Regeneration Strategy: Historically (2008) there was a low reliance on natural regeneration, 4 year average = 17ha (2.5%). Risk reduction:
Reduced brushing - minimal foliar treatments done
Reduced fill planting – minimal fill plants
Easier/less planting layout – reduced time – reduced supervision
Salal “Transitional” sites– can be difficult to predict - short term growth loss but can affect FG hts, Green—up (GU) and Visually Effective Green-up (VEG). Safe to plant Cw
GU or VEG concerns – may not be immediately known
Future access to block may be unknown
Reduced block entries (treatments, surveys)
Simplified survey scheduling
Reduced reporting requirements
Mixed species regeneration
~20% of species planted is Hw/Ba
Initial strategies to employ:
1. Improve the reforestation regime in Silviculture Instructions:
Avoid generic or blanket prescriptions.
Describe specifically where natural regime can be used or where it should be assessed post-harvest for potential use.
2. Utilize a simple flowchart to narrow it down:
Identifies which factors are applicable or not.
Extensive experience or local knowledge not as critical.
Issues:
1. ~20% of species planted is Hw/Ba. To achieve 20% natural regeneration, a significant portion of the Hw/Ba area would have to be left. Is there enough that is suitable?
2. Diversification Strategy (mixed species) would be impacted. 3. Volume Strategy (high gain Hw) would be impacted.
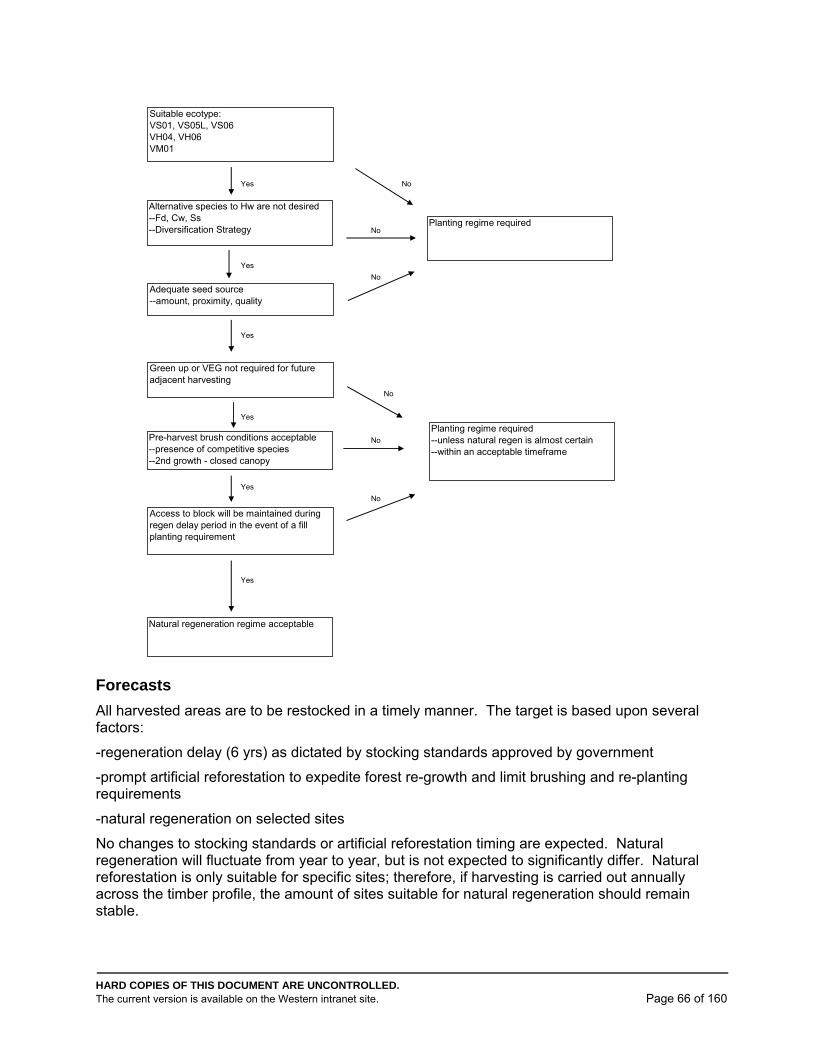
HARD COPIES OF THIS DOCUMENT ARE UNCONTROLLED. The current version is available on the Western intranet site. Page 66 of 160
Forecasts
All harvested areas are to be restocked in a timely manner. The target is based upon several factors:
-regeneration delay (6 yrs) as dictated by stocking standards approved by government
-prompt artificial reforestation to expedite forest re-growth and limit brushing and re-planting requirements
-natural regeneration on selected sites
No changes to stocking standards or artificial reforestation timing are expected. Natural regeneration will fluctuate from year to year, but is not expected to significantly differ. Natural reforestation is only suitable for specific sites; therefore, if harvesting is carried out annually across the timber profile, the amount of sites suitable for natural regeneration should remain stable.
Yes No
No
Yes
No
Yes
No
Yes
No
Yes
No
Yes
Pre-harvest brush conditions acceptable--presence of competitive species--2nd growth - closed canopy
Access to block will be maintained during regen delay period in the event of a fill planting requirement
Suitable ecotype: VS01, VS05L, VS06VH04, VH06 VM01
Alternative species to Hw are not desired--Fd, Cw, Ss--Diversification Strategy
Adequate seed source--amount, proximity, quality
Green up or VEG not required for future adjacent harvesting
Planting regime required--unless natural regen is almost certain--within an acceptable timeframe
Planting regime required
Natural regeneration regime acceptable
HARD COPIES OF THIS DOCUMENT ARE UNCONTROLLED. The current version is available on the Western intranet site. Page 67 of 160
Recent timber supply analyses have forecast the effect of varying regeneration delay assumptions on AAC.
Details/ Data Set
This indicator is determined by dividing total NSR area by the average harvest area over the past five years.
NSR area – is the total area (ha) that has been logged but not planted, or planted but subsequent survey reveals the plantation has failed. Harvest area – the average harvest area over the past 5 years. GIS analyses will note windfall or fire origin.
The 5 year average harvest area (ha) – supplied by Corporate GIS.
Then using the CENGEA database, each Operation finds the following:
The area (ha) planted; to be subtracted from the previous balance in the table below.
NSR survey area (ha); to be added to the previous balance in the table below.
Natural regeneration area (ha); to be added to the previous balance in the table below.
The result is the new NSR balance.
Calculate new closing balance
Monitoring
Stocking surveys are completed on all harvested areas to determine if the relevant stocking standard has been achieved and the area can be declared sufficiently restocked (SR). Walkthrough surveys may also be conducted to monitor regeneration performance. The Corporate Forestry Inventory Forester or designate will conduct a GIS analysis to compile harvest area data. The Operations Foresters will ensure that reforestation data is compiled. Operations Foresters will populate tables and report performance in the SFM Plan Annual Report.
Target 2: Free Growing Commitments
History
Adopted as Z809-08 core indicator in 2010. Was previous Indicator # 10 in the Z809-02 SFM Plan. The variance was reduced to zero from the previous Indicator to ensure alignment with legislated commitments.
Justification
This indicator provides a measure of success at minimizing the stresses associated with harvesting activities, and at enhancing ecosystem recovery. NAR describes the amount of area that WFP is committed to reforest following harvesting activities. Free-growing stands, as defined in the Forest Practices Code of British Columbia Act (FPC) and the Forest and Range Practices Act (FRPA), are stands of healthy trees of a commercially valuable species, meeting stocking standards, the growth of which is not impeded by competition from plants, shrubs or other trees.

HARD COPIES OF THIS DOCUMENT ARE UNCONTROLLED. The current version is available on the Western intranet site. Page 68 of 160
Current Status & Interpretation
Year FG Area
Expiring (ha) FG Commitments
met (ha) % NAR meeting FG
Commitment Variance from
Target (%)
2011 1,284.4 1,284.4 100% 0
2012 1,670.1 1,670.1 100% 0
Performance
2012: The target was met for 2012.
Strategies & Implementation
A series of steps are involved: FPC and FRPA stocking standards, CENGEA forward planning, RESULTS reporting to government.
Forecast
All harvested areas to meet free growing stocking standards within the prescribed timeline. Free growing stocking standards are a legislated requirement. Silvicultural activities and assessments following the harvest of a cutblock are scheduled such that free growing commitments will be met. Free growing declarations are the end result of a structured process for licensees to be relieved of silviculture liability on Crown land. Based upon past performance and the fact that no future change to free growing stocking standard commitments is expected, there is no expected future change to this indicator and its target and variance.
Details/ Data Set
For FPC cutblocks: Measured as a percent, this indicator is determined by dividing the total area meeting FG commitments (on a cutblock basis) in the reporting year by the total FG area expiring (on a cutblock basis, based on the latest SU) during the reporting year. If an amendment has been submitted, the block can be tallied as meeting requirements. In the event that the MoFR determines that an amendment did not constitute having met FPC requirements to establish a free growing stand within the Free Growing Assessment Period (FGAP), the area failing to meet commitments will be reported in the year this becomes known.
For FSP cutblocks, or FPC cutblocks approved to be brought under FRPA FSP standards, the late free growing date is 20 years. For Managed Forest cutblocks, the late free growing date is 15 years, measured from the date the cutblock is declared harvested in the Managed Forest Annual Declaration.
FG Area Expiring – a summary of cutblock area, including all blocks that have their latest SUs expiring in the reporting year.
Area meeting FG commitments – a summary of cutblock area, including all blocks whose FG commitments have been completed (all SU’s have achieved FG status).
Data will be tracked and compiled at the Operations level using CENGEA.
Monitoring
The Operations Forester or designate conducts surveys and maintains the currents status of all harvested areas in the CENGEA database. The Operations Forester or designate ensures that data is compiled and performance reported, in the SFM Plan Annual Report.
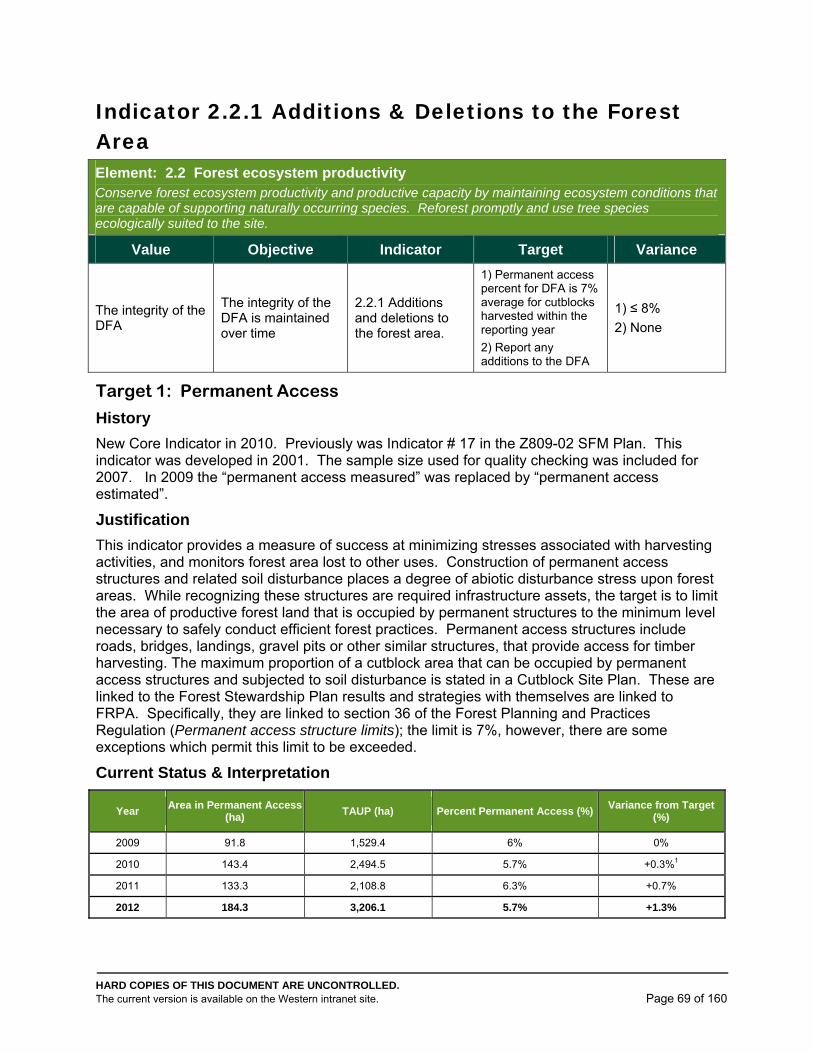
HARD COPIES OF THIS DOCUMENT ARE UNCONTROLLED. The current version is available on the Western intranet site. Page 69 of 160
Indicator 2.2.1 Additions & Deletions to the Forest Area Element: 2.2 Forest ecosystem productivity Conserve forest ecosystem productivity and productive capacity by maintaining ecosystem conditions that are capable of supporting naturally occurring species. Reforest promptly and use tree species ecologically suited to the site.
Value Objective Indicator Target Variance
The integrity of the DFA
The integrity of the DFA is maintained over time
2.2.1 Additions and deletions to the forest area.
1) Permanent access percent for DFA is 7% average for cutblocks harvested within the reporting year
2) Report any additions to the DFA
1) ≤ 8%
2) None
Target 1: Permanent Access
History
New Core Indicator in 2010. Previously was Indicator # 17 in the Z809-02 SFM Plan. This indicator was developed in 2001. The sample size used for quality checking was included for 2007. In 2009 the “permanent access measured” was replaced by “permanent access estimated”.
Justification
This indicator provides a measure of success at minimizing stresses associated with harvesting activities, and monitors forest area lost to other uses. Construction of permanent access structures and related soil disturbance places a degree of abiotic disturbance stress upon forest areas. While recognizing these structures are required infrastructure assets, the target is to limit the area of productive forest land that is occupied by permanent structures to the minimum level necessary to safely conduct efficient forest practices. Permanent access structures include roads, bridges, landings, gravel pits or other similar structures, that provide access for timber harvesting. The maximum proportion of a cutblock area that can be occupied by permanent access structures and subjected to soil disturbance is stated in a Cutblock Site Plan. These are linked to the Forest Stewardship Plan results and strategies with themselves are linked to FRPA. Specifically, they are linked to section 36 of the Forest Planning and Practices Regulation (Permanent access structure limits); the limit is 7%, however, there are some exceptions which permit this limit to be exceeded.
Current Status & Interpretation
Year Area in Permanent Access
(ha) TAUP (ha) Percent Permanent Access (%)
Variance from Target (%)
2009 91.8 1,529.4 6% 0%
2010 143.4 2,494.5 5.7% +0.3%1
2011 133.3 2,108.8 6.3% +0.7%
2012 184.3 3,206.1 5.7% +1.3%
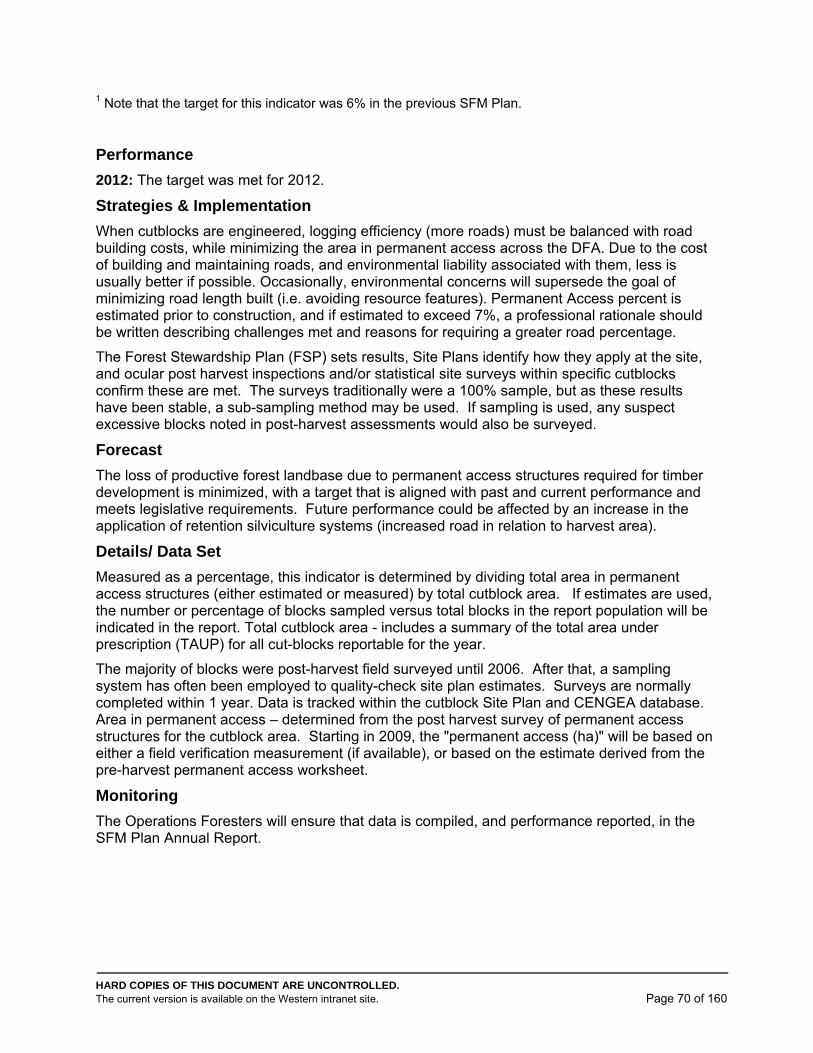
HARD COPIES OF THIS DOCUMENT ARE UNCONTROLLED. The current version is available on the Western intranet site. Page 70 of 160
1 Note that the target for this indicator was 6% in the previous SFM Plan.
Performance
2012: The target was met for 2012.
Strategies & Implementation
When cutblocks are engineered, logging efficiency (more roads) must be balanced with road building costs, while minimizing the area in permanent access across the DFA. Due to the cost of building and maintaining roads, and environmental liability associated with them, less is usually better if possible. Occasionally, environmental concerns will supersede the goal of minimizing road length built (i.e. avoiding resource features). Permanent Access percent is estimated prior to construction, and if estimated to exceed 7%, a professional rationale should be written describing challenges met and reasons for requiring a greater road percentage.
The Forest Stewardship Plan (FSP) sets results, Site Plans identify how they apply at the site, and ocular post harvest inspections and/or statistical site surveys within specific cutblocks confirm these are met. The surveys traditionally were a 100% sample, but as these results have been stable, a sub-sampling method may be used. If sampling is used, any suspect excessive blocks noted in post-harvest assessments would also be surveyed.
Forecast
The loss of productive forest landbase due to permanent access structures required for timber development is minimized, with a target that is aligned with past and current performance and meets legislative requirements. Future performance could be affected by an increase in the application of retention silviculture systems (increased road in relation to harvest area).
Details/ Data Set
Measured as a percentage, this indicator is determined by dividing total area in permanent access structures (either estimated or measured) by total cutblock area. If estimates are used, the number or percentage of blocks sampled versus total blocks in the report population will be indicated in the report. Total cutblock area - includes a summary of the total area under prescription (TAUP) for all cut-blocks reportable for the year.
The majority of blocks were post-harvest field surveyed until 2006. After that, a sampling system has often been employed to quality-check site plan estimates. Surveys are normally completed within 1 year. Data is tracked within the cutblock Site Plan and CENGEA database. Area in permanent access – determined from the post harvest survey of permanent access structures for the cutblock area. Starting in 2009, the "permanent access (ha)" will be based on either a field verification measurement (if available), or based on the estimate derived from the pre-harvest permanent access worksheet.
Monitoring
The Operations Foresters will ensure that data is compiled, and performance reported, in the SFM Plan Annual Report.
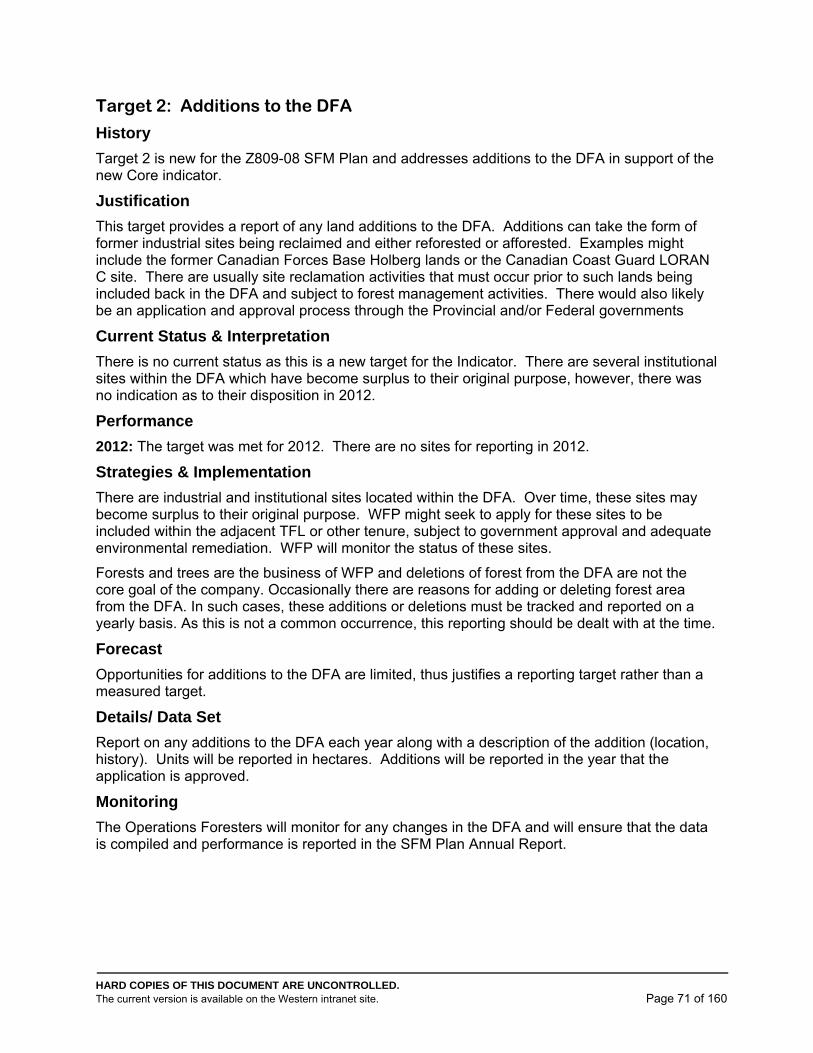
HARD COPIES OF THIS DOCUMENT ARE UNCONTROLLED. The current version is available on the Western intranet site. Page 71 of 160
Target 2: Additions to the DFA
History
Target 2 is new for the Z809-08 SFM Plan and addresses additions to the DFA in support of the new Core indicator.
Justification
This target provides a report of any land additions to the DFA. Additions can take the form of former industrial sites being reclaimed and either reforested or afforested. Examples might include the former Canadian Forces Base Holberg lands or the Canadian Coast Guard LORAN C site. There are usually site reclamation activities that must occur prior to such lands being included back in the DFA and subject to forest management activities. There would also likely be an application and approval process through the Provincial and/or Federal governments
Current Status & Interpretation
There is no current status as this is a new target for the Indicator. There are several institutional sites within the DFA which have become surplus to their original purpose, however, there was no indication as to their disposition in 2012.
Performance
2012: The target was met for 2012. There are no sites for reporting in 2012.
Strategies & Implementation
There are industrial and institutional sites located within the DFA. Over time, these sites may become surplus to their original purpose. WFP might seek to apply for these sites to be included within the adjacent TFL or other tenure, subject to government approval and adequate environmental remediation. WFP will monitor the status of these sites.
Forests and trees are the business of WFP and deletions of forest from the DFA are not the core goal of the company. Occasionally there are reasons for adding or deleting forest area from the DFA. In such cases, these additions or deletions must be tracked and reported on a yearly basis. As this is not a common occurrence, this reporting should be dealt with at the time.
Forecast
Opportunities for additions to the DFA are limited, thus justifies a reporting target rather than a measured target.
Details/ Data Set
Report on any additions to the DFA each year along with a description of the addition (location, history). Units will be reported in hectares. Additions will be reported in the year that the application is approved.
Monitoring
The Operations Foresters will monitor for any changes in the DFA and will ensure that the data is compiled and performance is reported in the SFM Plan Annual Report.
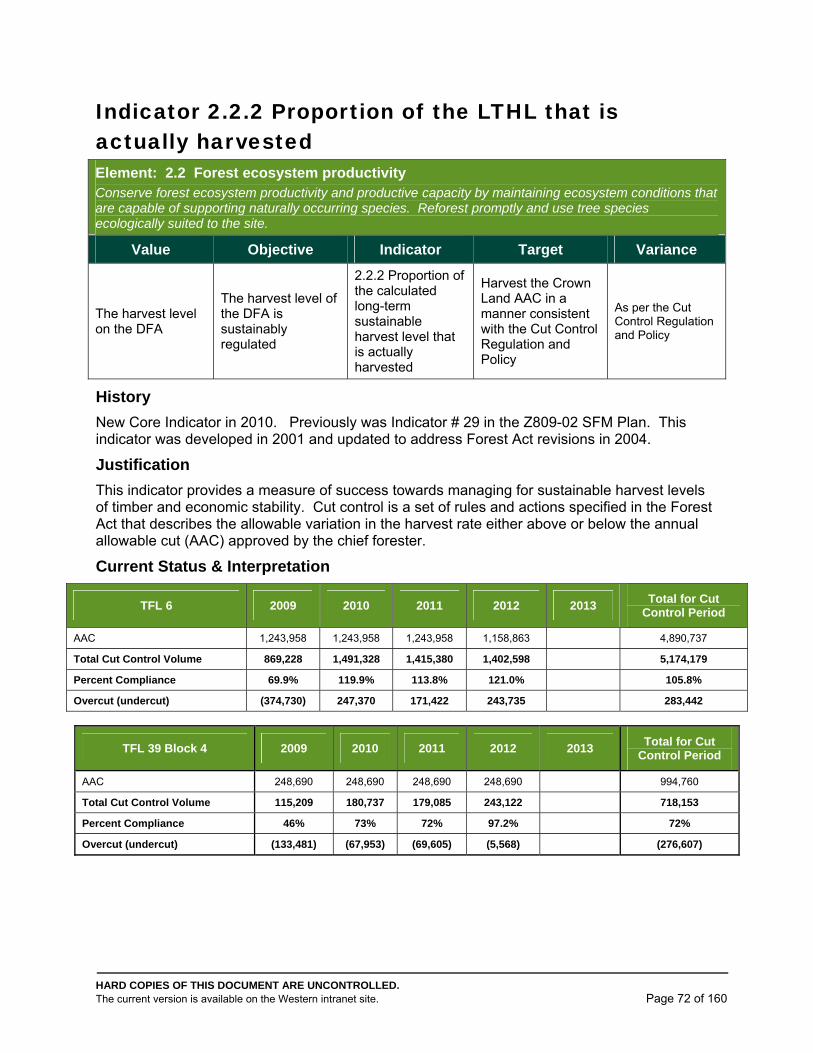
HARD COPIES OF THIS DOCUMENT ARE UNCONTROLLED. The current version is available on the Western intranet site. Page 72 of 160
Indicator 2.2.2 Proportion of the LTHL that is actually harvested Element: 2.2 Forest ecosystem productivity Conserve forest ecosystem productivity and productive capacity by maintaining ecosystem conditions that are capable of supporting naturally occurring species. Reforest promptly and use tree species ecologically suited to the site.
Value Objective Indicator Target Variance
The harvest level on the DFA
The harvest level of the DFA is sustainably regulated
2.2.2 Proportion of the calculated long-term sustainable harvest level that is actually harvested
Harvest the Crown Land AAC in a manner consistent with the Cut Control Regulation and Policy
As per the Cut Control Regulation and Policy
History
New Core Indicator in 2010. Previously was Indicator # 29 in the Z809-02 SFM Plan. This indicator was developed in 2001 and updated to address Forest Act revisions in 2004.
Justification
This indicator provides a measure of success towards managing for sustainable harvest levels of timber and economic stability. Cut control is a set of rules and actions specified in the Forest Act that describes the allowable variation in the harvest rate either above or below the annual allowable cut (AAC) approved by the chief forester.
Current Status & Interpretation
TFL 6 2009 2010 2011 2012 2013 Total for Cut
Control Period
AAC 1,243,958 1,243,958 1,243,958 1,158,863 4,890,737
Total Cut Control Volume 869,228 1,491,328 1,415,380 1,402,598 5,174,179
Percent Compliance 69.9% 119.9% 113.8% 121.0% 105.8%
Overcut (undercut) (374,730) 247,370 171,422 243,735 283,442
TFL 39 Block 4 2009 2010 2011 2012 2013 Total for Cut
Control Period
AAC 248,690 248,690 248,690 248,690 994,760
Total Cut Control Volume 115,209 180,737 179,085 243,122 718,153
Percent Compliance 46% 73% 72% 97.2% 72%
Overcut (undercut) (133,481) (67,953) (69,605) (5,568) (276,607)
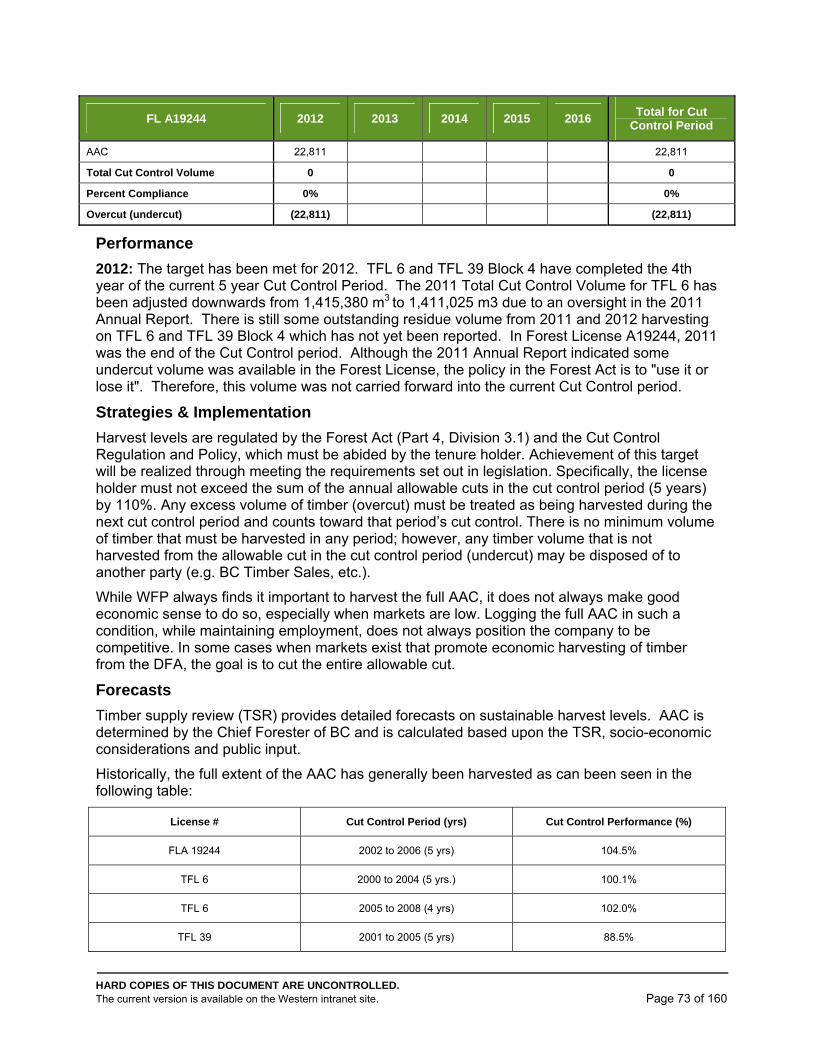
HARD COPIES OF THIS DOCUMENT ARE UNCONTROLLED. The current version is available on the Western intranet site. Page 73 of 160
FL A19244 2012 2013 2014 2015 2016 Total for Cut
Control Period
AAC 22,811 22,811
Total Cut Control Volume 0 0
Percent Compliance 0% 0%
Overcut (undercut) (22,811) (22,811)
Performance
2012: The target has been met for 2012. TFL 6 and TFL 39 Block 4 have completed the 4th year of the current 5 year Cut Control Period. The 2011 Total Cut Control Volume for TFL 6 has been adjusted downwards from 1,415,380 m3 to 1,411,025 m3 due to an oversight in the 2011 Annual Report. There is still some outstanding residue volume from 2011 and 2012 harvesting on TFL 6 and TFL 39 Block 4 which has not yet been reported. In Forest License A19244, 2011 was the end of the Cut Control period. Although the 2011 Annual Report indicated some undercut volume was available in the Forest License, the policy in the Forest Act is to "use it or lose it". Therefore, this volume was not carried forward into the current Cut Control period.
Strategies & Implementation
Harvest levels are regulated by the Forest Act (Part 4, Division 3.1) and the Cut Control Regulation and Policy, which must be abided by the tenure holder. Achievement of this target will be realized through meeting the requirements set out in legislation. Specifically, the license holder must not exceed the sum of the annual allowable cuts in the cut control period (5 years) by 110%. Any excess volume of timber (overcut) must be treated as being harvested during the next cut control period and counts toward that period’s cut control. There is no minimum volume of timber that must be harvested in any period; however, any timber volume that is not harvested from the allowable cut in the cut control period (undercut) may be disposed of to another party (e.g. BC Timber Sales, etc.).
While WFP always finds it important to harvest the full AAC, it does not always make good economic sense to do so, especially when markets are low. Logging the full AAC in such a condition, while maintaining employment, does not always position the company to be competitive. In some cases when markets exist that promote economic harvesting of timber from the DFA, the goal is to cut the entire allowable cut.
Forecasts
Timber supply review (TSR) provides detailed forecasts on sustainable harvest levels. AAC is determined by the Chief Forester of BC and is calculated based upon the TSR, socio-economic considerations and public input.
Historically, the full extent of the AAC has generally been harvested as can been seen in the following table:
License # Cut Control Period (yrs) Cut Control Performance (%)
FLA 19244 2002 to 2006 (5 yrs) 104.5%
TFL 6 2000 to 2004 (5 yrs.) 100.1%
TFL 6 2005 to 2008 (4 yrs) 102.0%
TFL 39 2001 to 2005 (5 yrs) 88.5%

HARD COPIES OF THIS DOCUMENT ARE UNCONTROLLED. The current version is available on the Western intranet site. Page 74 of 160
TFL 39 2006 to 2008 (3 yrs) 75.1%
However, it is evident that over the last few years it has proven difficult to economically harvest the full extent of the approved AAC. How the economic cycle for the forest industry overlaps with the cut control period is a major factor influencing performance in regards to this indicator. Although it is not possible to forecast the actual results for this indicator, it is expected that the Western’s policy will remain to harvest 100% of its AAC within each cut control period. Of note, the MFLNRO has further maintained a policy to allocate undercut volumes to First Nations or made it available through BC Timber Sales which also provide for economic activity.
Details/ Data Set
This indicator is determined by comparing actual annual harvest volume with allocated AAC for the same period.
Monitoring
The Official MFLNRO Scale Report is received annually by Corporate Forestry. The long-term sustainable harvest level for the DFA is tracked and kept current by Corporate Forestry.
The Operations Forester reports on the harvest volumes and current long-term sustainable harvest level in the SFM Plan Annual Report.
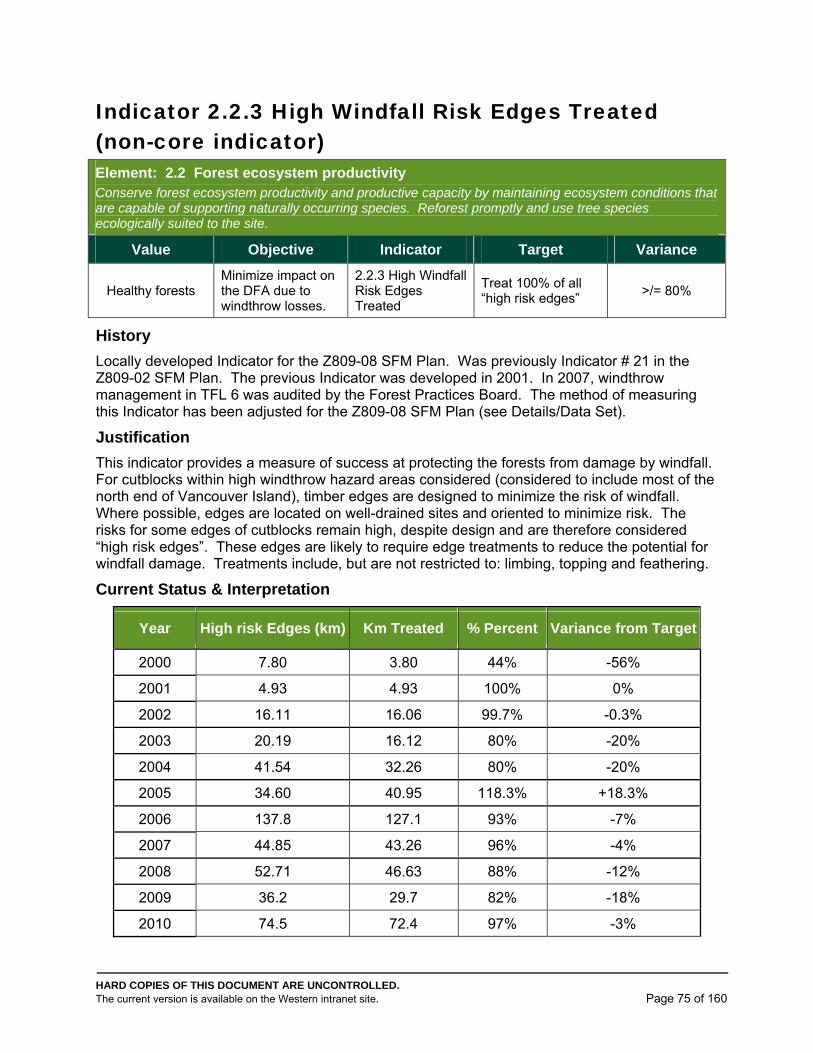
HARD COPIES OF THIS DOCUMENT ARE UNCONTROLLED. The current version is available on the Western intranet site. Page 75 of 160
Indicator 2.2.3 High Windfall Risk Edges Treated (non-core indicator) Element: 2.2 Forest ecosystem productivity Conserve forest ecosystem productivity and productive capacity by maintaining ecosystem conditions that are capable of supporting naturally occurring species. Reforest promptly and use tree species ecologically suited to the site.
Value Objective Indicator Target Variance
Healthy forests Minimize impact on the DFA due to windthrow losses.
2.2.3 High Windfall Risk Edges Treated
Treat 100% of all “high risk edges”
>/= 80%
History
Locally developed Indicator for the Z809-08 SFM Plan. Was previously Indicator # 21 in the Z809-02 SFM Plan. The previous Indicator was developed in 2001. In 2007, windthrow management in TFL 6 was audited by the Forest Practices Board. The method of measuring this Indicator has been adjusted for the Z809-08 SFM Plan (see Details/Data Set).
Justification
This indicator provides a measure of success at protecting the forests from damage by windfall. For cutblocks within high windthrow hazard areas considered (considered to include most of the north end of Vancouver Island), timber edges are designed to minimize the risk of windfall. Where possible, edges are located on well-drained sites and oriented to minimize risk. The risks for some edges of cutblocks remain high, despite design and are therefore considered “high risk edges”. These edges are likely to require edge treatments to reduce the potential for windfall damage. Treatments include, but are not restricted to: limbing, topping and feathering.
Current Status & Interpretation
Year High risk Edges (km) Km Treated % Percent Variance from Target
2000 7.80 3.80 44% -56%
2001 4.93 4.93 100% 0%
2002 16.11 16.06 99.7% -0.3%
2003 20.19 16.12 80% -20%
2004 41.54 32.26 80% -20%
2005 34.60 40.95 118.3% +18.3%
2006 137.8 127.1 93% -7%
2007 44.85 43.26 96% -4%
2008 52.71 46.63 88% -12%
2009 36.2 29.7 82% -18%
2010 74.5 72.4 97% -3%
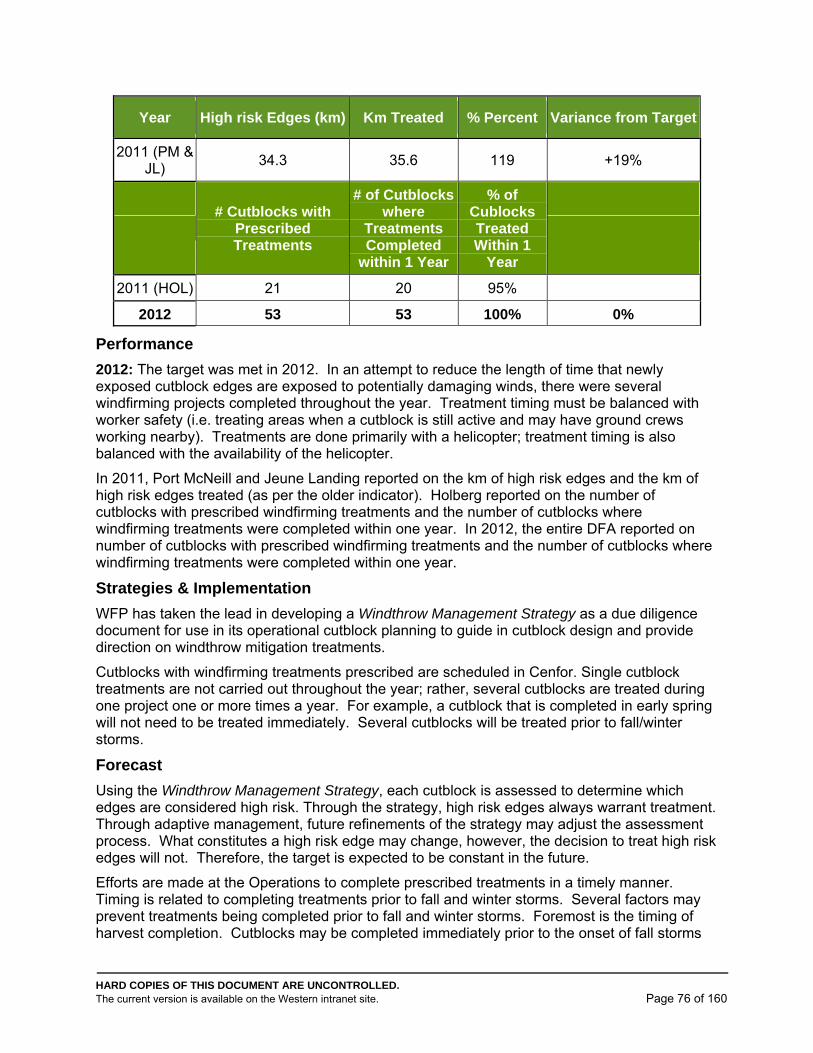
HARD COPIES OF THIS DOCUMENT ARE UNCONTROLLED. The current version is available on the Western intranet site. Page 76 of 160
Year High risk Edges (km) Km Treated % Percent Variance from Target
2011 (PM & JL)
34.3 35.6 119 +19%
# Cutblocks with
Prescribed Treatments
# of Cutblocks where
Treatments Completed
within 1 Year
% of Cublocks Treated Within 1
Year
2011 (HOL) 21 20 95%
2012 53 53 100% 0%
Performance
2012: The target was met in 2012. In an attempt to reduce the length of time that newly exposed cutblock edges are exposed to potentially damaging winds, there were several windfirming projects completed throughout the year. Treatment timing must be balanced with worker safety (i.e. treating areas when a cutblock is still active and may have ground crews working nearby). Treatments are done primarily with a helicopter; treatment timing is also balanced with the availability of the helicopter.
In 2011, Port McNeill and Jeune Landing reported on the km of high risk edges and the km of high risk edges treated (as per the older indicator). Holberg reported on the number of cutblocks with prescribed windfirming treatments and the number of cutblocks where windfirming treatments were completed within one year. In 2012, the entire DFA reported on number of cutblocks with prescribed windfirming treatments and the number of cutblocks where windfirming treatments were completed within one year.
Strategies & Implementation
WFP has taken the lead in developing a Windthrow Management Strategy as a due diligence document for use in its operational cutblock planning to guide in cutblock design and provide direction on windthrow mitigation treatments.
Cutblocks with windfirming treatments prescribed are scheduled in Cenfor. Single cutblock treatments are not carried out throughout the year; rather, several cutblocks are treated during one project one or more times a year. For example, a cutblock that is completed in early spring will not need to be treated immediately. Several cutblocks will be treated prior to fall/winter storms.
Forecast
Using the Windthrow Management Strategy, each cutblock is assessed to determine which edges are considered high risk. Through the strategy, high risk edges always warrant treatment. Through adaptive management, future refinements of the strategy may adjust the assessment process. What constitutes a high risk edge may change, however, the decision to treat high risk edges will not. Therefore, the target is expected to be constant in the future.
Efforts are made at the Operations to complete prescribed treatments in a timely manner. Timing is related to completing treatments prior to fall and winter storms. Several factors may prevent treatments being completed prior to fall and winter storms. Foremost is the timing of harvest completion. Cutblocks may be completed immediately prior to the onset of fall storms
HARD COPIES OF THIS DOCUMENT ARE UNCONTROLLED. The current version is available on the Western intranet site. Page 77 of 160
or may still be active through the fall and winter. There are Worksafe BC regulations relating to windfirming treatments and active harvesting due to the worker overhead hazards that may be created as a result of windfirming. A secondary factor is helicopter and crew availability, which may be limited during the spring and summer months. Finally, treatments are often difficult to complete during the fall and winter timeframe due to adverse weather constraints. Economics have not historically been a significant factor for completing treatments.
Details/ Data Set
Measured as a percentage, this indicator is determined by dividing the number of cutblocks with prescribed treatments (due to high risk edges) by the number of blocks where treatments are completed (within 1 year of harvest completion). Previously (under the Z809-02 SFM Plan), this indicator was measured by dividing the distance (km) of treated edges by the distance (km) of high risk windfall edges.
Monitoring
Operations Engineers to ensure that treatments are scheduled and reported as done in CENGEA when completed. EMS Cutblock Inspections and Post Harvest Assessments are used to refine treatment timing and identify any deficiencies in the assessment process and treatment prescriptions. Treatment prescriptions may also be adjusted at time of treatment. These changes are recorded on the “as-built” report for the cutblock.

HARD COPIES OF THIS DOCUMENT ARE UNCONTROLLED. The current version is available on the Western intranet site. Page 78 of 160
Indicator 2.2.4 Hectares of land withdrawn from forestry uses Element: 2.2 Forest ecosystem productivity Conserve forest ecosystem productivity and productive capacity by maintaining ecosystem conditions that are capable of supporting naturally occurring species. Reforest promptly and use tree species ecologically suited to the site.
Value Objective Indicator Target Variance
The integrity of the DFA
The integrity of the DFA is maintained
over time
2.2.4 Hectares of land withdrawn from forestry uses
Evaluate and respond to 100% of all formal requests/referrals
None
History
Locally developed Indicator for Z809-08 SFM Plan. Was previously Indicator # 28 in the Z809-02 SFM Plan. This Indicator was developed in 2001. In 2004, the scope of the Indicator was expanded to include Criterion 4 and a disposition table was added based on auditor feedback.
Justification
This indicator provides a measure of success at minimizing the conversion of forests to other uses, while still ensuring the availability of industrial land for resource businesses when valid formal requests have been made (Criterion 5). Responses to formal requests include a cost / benefit analysis that will determine if the withdrawal of forest lands from the DFA to be used for non-forests uses will benefit the Public. This analysis will help determine whether the land is best used as a growing forest or for other external industrial uses.
Current Status & Interpretation
No formal requests were received from communities in 2012. However, the following referrals/requests for other land based uses were responded to in 2012:
North Island Copper and Gold Inc.: Notice of Work for Mines Act Permit Amendment in Hushamu area of TFL 6 for exploration work and access construction. Proponent contacted WFP for safety coordination and Road Use Agreement.
Synex Energy Resources Ltd.: Referral to WFP about Victoria Lake hydro-electric project (TFL 6). WFP sent comment letter to Synex in May 2012. Synex sent a reply letter to WFP in June 2012.
Ministry of Forests, Lands and Natural Resource Operations: Construction of public recreation trail along edge of TFL 39 Block IV parallel to Campbell Way. WFP was supportive of construction of the trail by the Port McNeill Rotary Club.
Homegold Resources Ltd.: Mineral and Coal Exploration Notice of Work Application in Teihsum Creek area of TFL 6 for exploration work. Proponent contacted WFP for safety coordination and Road Use Agreement.
Performance
2012: The target was met for 2012.
HARD COPIES OF THIS DOCUMENT ARE UNCONTROLLED. The current version is available on the Western intranet site. Page 79 of 160
Strategies & Implementation
The indicator will also serve to identify that non-forest uses are made only where appropriate per Z809-08 Element 4.2 Forest Land Conversion (Forests can be turned into other types of ecosystems by a variety of activities, including those that relate directly to SFM [e.g., building roads and landings] and those outside the influence of forest managers [e.g., urban and industrial developments, utility corridors]. Forest managers should reduce, as much as possible, the amount of area they convert to non-forest ecosystems and should discourage unwarranted forest land conversions that are beyond their control).
WFP will evaluate all formal requests from outside parties regarding the conversion of parcels of forestland within the DFA to non-forest use for external industrial use. When a request is deemed likely to aid a viable business, and such benefits are considered to outweigh the forest use of the parcel, the land may be made available for the business venture. Government regulatory agencies and local government may also be involved.
WFP will identify pressures from other non-forest requests or uses as these arise (subject to any confidentiality considerations).
A tracking spreadsheet of all requests or referrals known and responded to is maintained. As Corporate Forestry or Operations identify or respond to referrals, they will update the tracking spreadsheet. The Ministry of Forests, Lands and Natural Resource Operations also refers proposals from other agencies to WFP for review and comment.
Forecast
Historically, WFP has responded to formal request/approvals. A continued increase of demand for conversion of forest to non-forest uses is expected. WFP is committed to minimizing this conversion where appropriate and possible in order to maintain its timber harvesting landbase.
Details/ Data Set
This indicator is determined by evaluating the number of requests that were received and responded to. Data will be tracked and compiled at the Timberlands level. Data will be reported as appropriate given that land requests and government agency reviews often extend over a number of years.
Monitoring
The Operations Foresters will monitor for any changes to the DFA and will ensure that data is compiled, and performance is reported in the SFM Plan Annual Report.
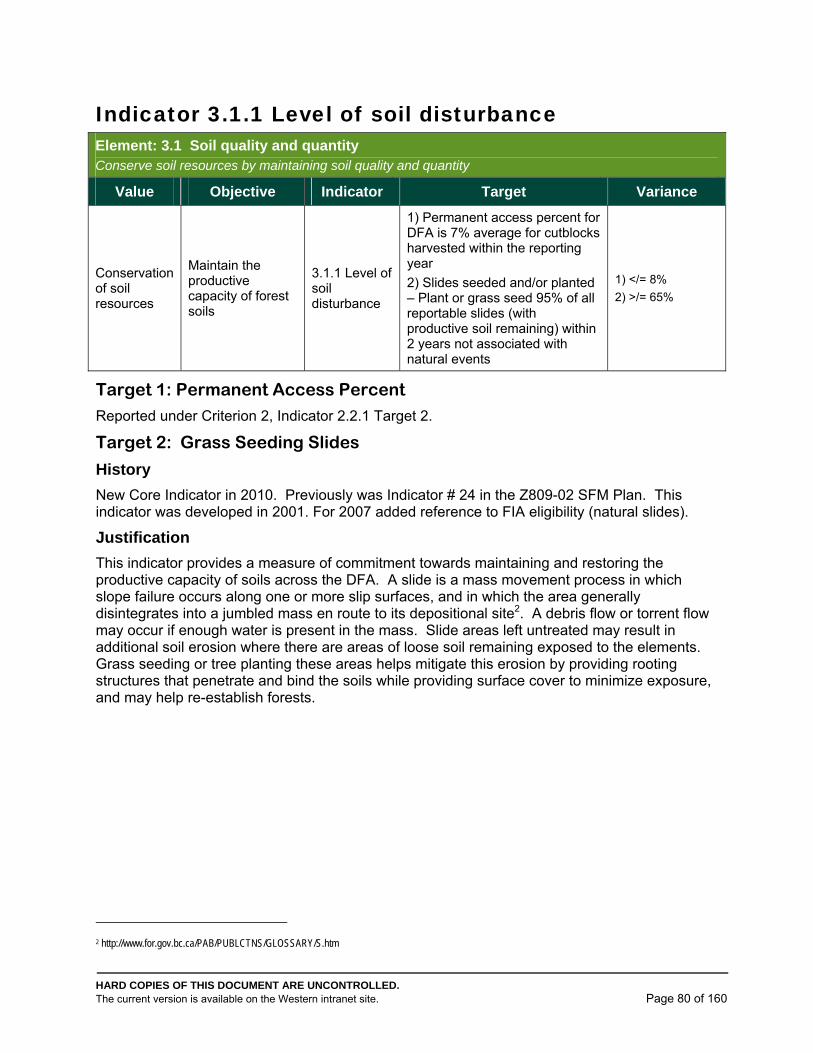
HARD COPIES OF THIS DOCUMENT ARE UNCONTROLLED. The current version is available on the Western intranet site. Page 80 of 160
Indicator 3.1.1 Level of soil disturbance Element: 3.1 Soil quality and quantity Conserve soil resources by maintaining soil quality and quantity
Value Objective Indicator Target Variance
Conservation of soil resources
Maintain the productive capacity of forest soils
3.1.1 Level of soil disturbance
1) Permanent access percent for DFA is 7% average for cutblocks harvested within the reporting year
2) Slides seeded and/or planted – Plant or grass seed 95% of all reportable slides (with productive soil remaining) within 2 years not associated with natural events
1) </= 8%
2) >/= 65%
Target 1: Permanent Access Percent
Reported under Criterion 2, Indicator 2.2.1 Target 2.
Target 2: Grass Seeding Slides
History
New Core Indicator in 2010. Previously was Indicator # 24 in the Z809-02 SFM Plan. This indicator was developed in 2001. For 2007 added reference to FIA eligibility (natural slides).
Justification
This indicator provides a measure of commitment towards maintaining and restoring the productive capacity of soils across the DFA. A slide is a mass movement process in which slope failure occurs along one or more slip surfaces, and in which the area generally disintegrates into a jumbled mass en route to its depositional site2. A debris flow or torrent flow may occur if enough water is present in the mass. Slide areas left untreated may result in additional soil erosion where there are areas of loose soil remaining exposed to the elements. Grass seeding or tree planting these areas helps mitigate this erosion by providing rooting structures that penetrate and bind the soils while providing surface cover to minimize exposure, and may help re-establish forests.
2 http://www.for.gov.bc.ca/PAB/PUBLCTNS/GLOSSARY/S.htm
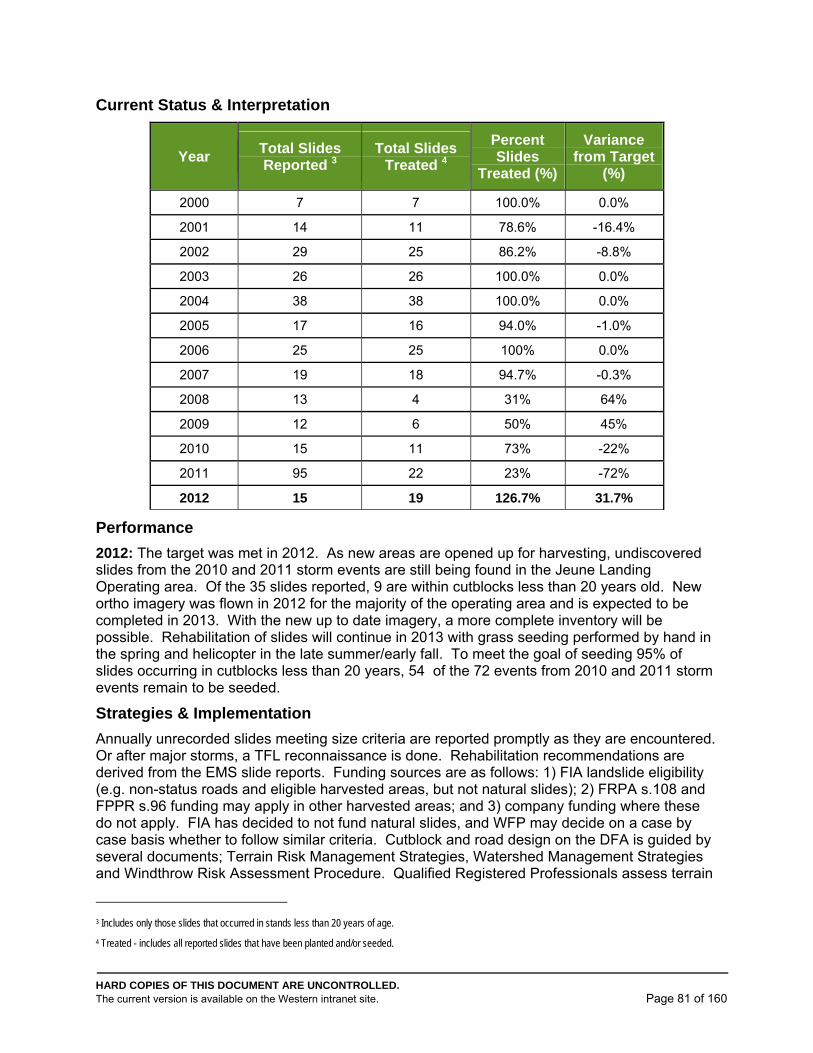
HARD COPIES OF THIS DOCUMENT ARE UNCONTROLLED. The current version is available on the Western intranet site. Page 81 of 160
Current Status & Interpretation
Year Total Slides Reported 3
Total Slides Treated 4
Percent Slides
Treated (%)
Variance from Target
(%)
2000 7 7 100.0% 0.0%
2001 14 11 78.6% -16.4%
2002 29 25 86.2% -8.8%
2003 26 26 100.0% 0.0%
2004 38 38 100.0% 0.0%
2005 17 16 94.0% -1.0%
2006 25 25 100% 0.0%
2007 19 18 94.7% -0.3%
2008 13 4 31% 64%
2009 12 6 50% 45%
2010 15 11 73% -22%
2011 95 22 23% -72%
2012 15 19 126.7% 31.7%
Performance
2012: The target was met in 2012. As new areas are opened up for harvesting, undiscovered slides from the 2010 and 2011 storm events are still being found in the Jeune Landing Operating area. Of the 35 slides reported, 9 are within cutblocks less than 20 years old. New ortho imagery was flown in 2012 for the majority of the operating area and is expected to be completed in 2013. With the new up to date imagery, a more complete inventory will be possible. Rehabilitation of slides will continue in 2013 with grass seeding performed by hand in the spring and helicopter in the late summer/early fall. To meet the goal of seeding 95% of slides occurring in cutblocks less than 20 years, 54 of the 72 events from 2010 and 2011 storm events remain to be seeded.
Strategies & Implementation
Annually unrecorded slides meeting size criteria are reported promptly as they are encountered. Or after major storms, a TFL reconnaissance is done. Rehabilitation recommendations are derived from the EMS slide reports. Funding sources are as follows: 1) FIA landslide eligibility (e.g. non-status roads and eligible harvested areas, but not natural slides); 2) FRPA s.108 and FPPR s.96 funding may apply in other harvested areas; and 3) company funding where these do not apply. FIA has decided to not fund natural slides, and WFP may decide on a case by case basis whether to follow similar criteria. Cutblock and road design on the DFA is guided by several documents; Terrain Risk Management Strategies, Watershed Management Strategies and Windthrow Risk Assessment Procedure. Qualified Registered Professionals assess terrain
3 Includes only those slides that occurred in stands less than 20 years of age.
4 Treated - includes all reported slides that have been planted and/or seeded.
HARD COPIES OF THIS DOCUMENT ARE UNCONTROLLED. The current version is available on the Western intranet site. Page 82 of 160
stability along with other factors in order to reduce the occurrence of slides within harvested cutblocks and from built roads.
Forecasts
The target is expected to be met into the future. Since the target is to rehabilitate (plant and/or grass seed) non-natural slides within two years of occurrence, flexibility exists to address any specific issues. A key assumption is that no major event will occur (e.g. catastrophic rain and/or wind storm) on the DFA. While it is nearly impossible to forecast the number of landslides that might occur, there are several strategies and tools which serve to minimize the number of landslides and their consequences.
Details/ Data Set
Measured as a percentage, this indicator is determined by dividing the number of slides where a treatment has been applied (planting and/or seeding) by the total number of slides reported in stands less than 20 years of age. A separate tracking spreadsheet of slides and action plans is maintained by the Assistant Forester. As new slides are found, details are entered onto the tracking spreadsheet and treatments are incorporated into annual projects (planting, grass seeding). When slides are found, a Slide Report is completed which includes an action plan (i.e. treatments) if applicable. These action plans are updated to the Incident Tracking System with deadlines to track them to completion.
Monitoring
The Assistant Forester will ensure that data is compiled, and performance reported, in the SFM Plan Annual Report. Data will be tracked and compiled at the Forest Operation level.
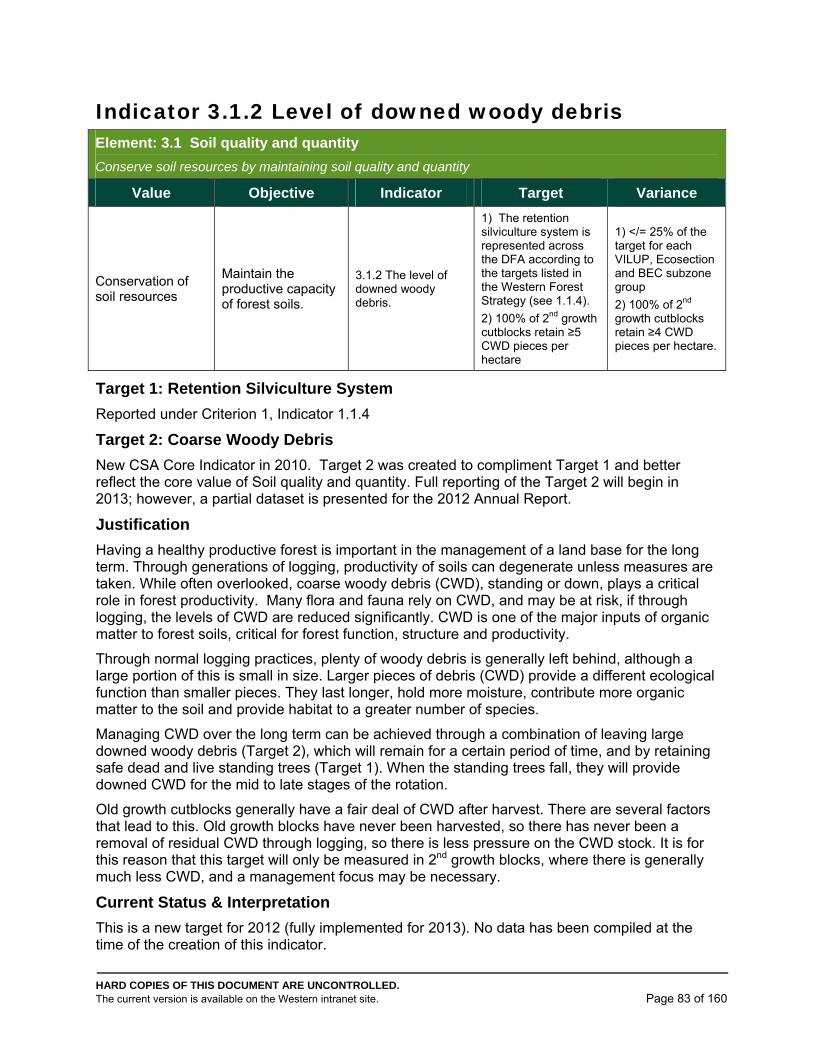
HARD COPIES OF THIS DOCUMENT ARE UNCONTROLLED. The current version is available on the Western intranet site. Page 83 of 160
Indicator 3.1.2 Level of downed woody debris Element: 3.1 Soil quality and quantity
Conserve soil resources by maintaining soil quality and quantity
Value Objective Indicator Target Variance
Conservation of soil resources
Maintain the productive capacity of forest soils.
3.1.2 The level of downed woody debris.
1) The retention silviculture system is represented across the DFA according to the targets listed in the Western Forest Strategy (see 1.1.4).
2) 100% of 2nd growth cutblocks retain ≥5 CWD pieces per hectare
1) </= 25% of the target for each VILUP, Ecosection and BEC subzone group
2) 100% of 2nd growth cutblocks retain ≥4 CWD pieces per hectare.
Target 1: Retention Silviculture System
Reported under Criterion 1, Indicator 1.1.4
Target 2: Coarse Woody Debris
New CSA Core Indicator in 2010. Target 2 was created to compliment Target 1 and better reflect the core value of Soil quality and quantity. Full reporting of the Target 2 will begin in 2013; however, a partial dataset is presented for the 2012 Annual Report.
Justification
Having a healthy productive forest is important in the management of a land base for the long term. Through generations of logging, productivity of soils can degenerate unless measures are taken. While often overlooked, coarse woody debris (CWD), standing or down, plays a critical role in forest productivity. Many flora and fauna rely on CWD, and may be at risk, if through logging, the levels of CWD are reduced significantly. CWD is one of the major inputs of organic matter to forest soils, critical for forest function, structure and productivity.
Through normal logging practices, plenty of woody debris is generally left behind, although a large portion of this is small in size. Larger pieces of debris (CWD) provide a different ecological function than smaller pieces. They last longer, hold more moisture, contribute more organic matter to the soil and provide habitat to a greater number of species.
Managing CWD over the long term can be achieved through a combination of leaving large downed woody debris (Target 2), which will remain for a certain period of time, and by retaining safe dead and live standing trees (Target 1). When the standing trees fall, they will provide downed CWD for the mid to late stages of the rotation.
Old growth cutblocks generally have a fair deal of CWD after harvest. There are several factors that lead to this. Old growth blocks have never been harvested, so there has never been a removal of residual CWD through logging, so there is less pressure on the CWD stock. It is for this reason that this target will only be measured in 2nd growth blocks, where there is generally much less CWD, and a management focus may be necessary.
Current Status & Interpretation
This is a new target for 2012 (fully implemented for 2013). No data has been compiled at the time of the creation of this indicator.
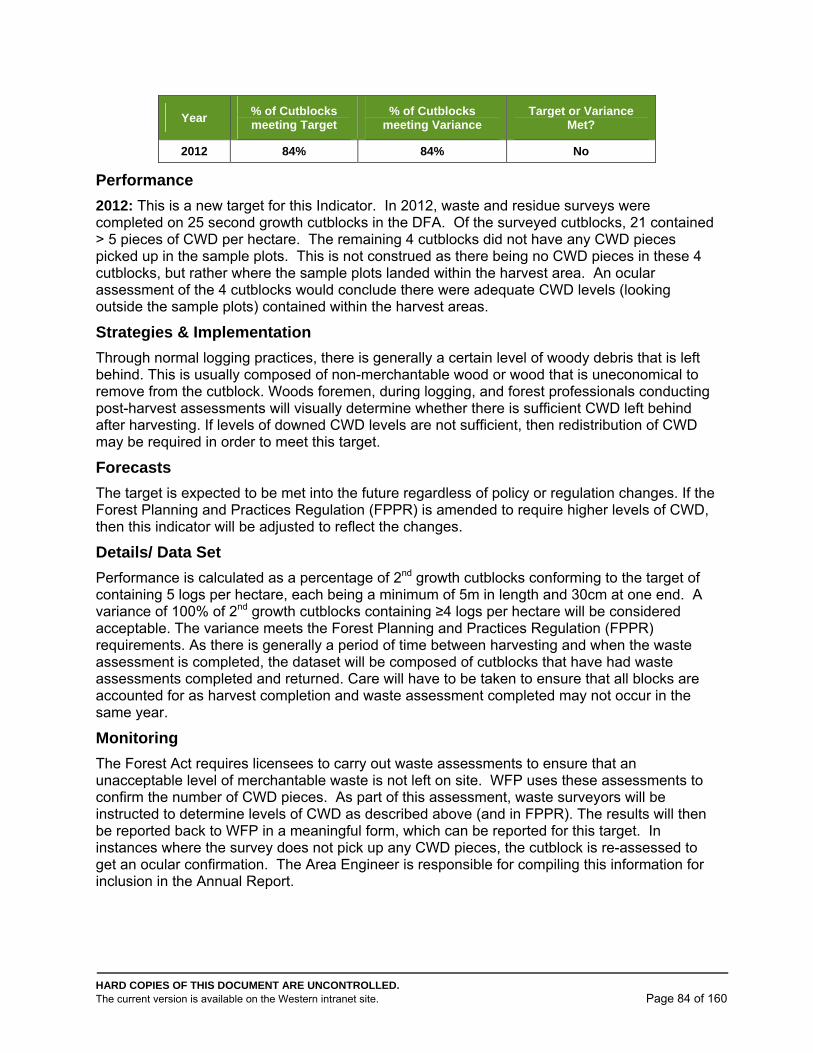
HARD COPIES OF THIS DOCUMENT ARE UNCONTROLLED. The current version is available on the Western intranet site. Page 84 of 160
Year % of Cutblocks meeting Target
% of Cutblocks meeting Variance
Target or Variance Met?
2012 84% 84% No
Performance
2012: This is a new target for this Indicator. In 2012, waste and residue surveys were completed on 25 second growth cutblocks in the DFA. Of the surveyed cutblocks, 21 contained > 5 pieces of CWD per hectare. The remaining 4 cutblocks did not have any CWD pieces picked up in the sample plots. This is not construed as there being no CWD pieces in these 4 cutblocks, but rather where the sample plots landed within the harvest area. An ocular assessment of the 4 cutblocks would conclude there were adequate CWD levels (looking outside the sample plots) contained within the harvest areas.
Strategies & Implementation
Through normal logging practices, there is generally a certain level of woody debris that is left behind. This is usually composed of non-merchantable wood or wood that is uneconomical to remove from the cutblock. Woods foremen, during logging, and forest professionals conducting post-harvest assessments will visually determine whether there is sufficient CWD left behind after harvesting. If levels of downed CWD levels are not sufficient, then redistribution of CWD may be required in order to meet this target.
Forecasts
The target is expected to be met into the future regardless of policy or regulation changes. If the Forest Planning and Practices Regulation (FPPR) is amended to require higher levels of CWD, then this indicator will be adjusted to reflect the changes.
Details/ Data Set
Performance is calculated as a percentage of 2nd growth cutblocks conforming to the target of containing 5 logs per hectare, each being a minimum of 5m in length and 30cm at one end. A variance of 100% of 2nd growth cutblocks containing ≥4 logs per hectare will be considered acceptable. The variance meets the Forest Planning and Practices Regulation (FPPR) requirements. As there is generally a period of time between harvesting and when the waste assessment is completed, the dataset will be composed of cutblocks that have had waste assessments completed and returned. Care will have to be taken to ensure that all blocks are accounted for as harvest completion and waste assessment completed may not occur in the same year.
Monitoring
The Forest Act requires licensees to carry out waste assessments to ensure that an unacceptable level of merchantable waste is not left on site. WFP uses these assessments to confirm the number of CWD pieces. As part of this assessment, waste surveyors will be instructed to determine levels of CWD as described above (and in FPPR). The results will then be reported back to WFP in a meaningful form, which can be reported for this target. In instances where the survey does not pick up any CWD pieces, the cutblock is re-assessed to get an ocular confirmation. The Area Engineer is responsible for compiling this information for inclusion in the Annual Report.
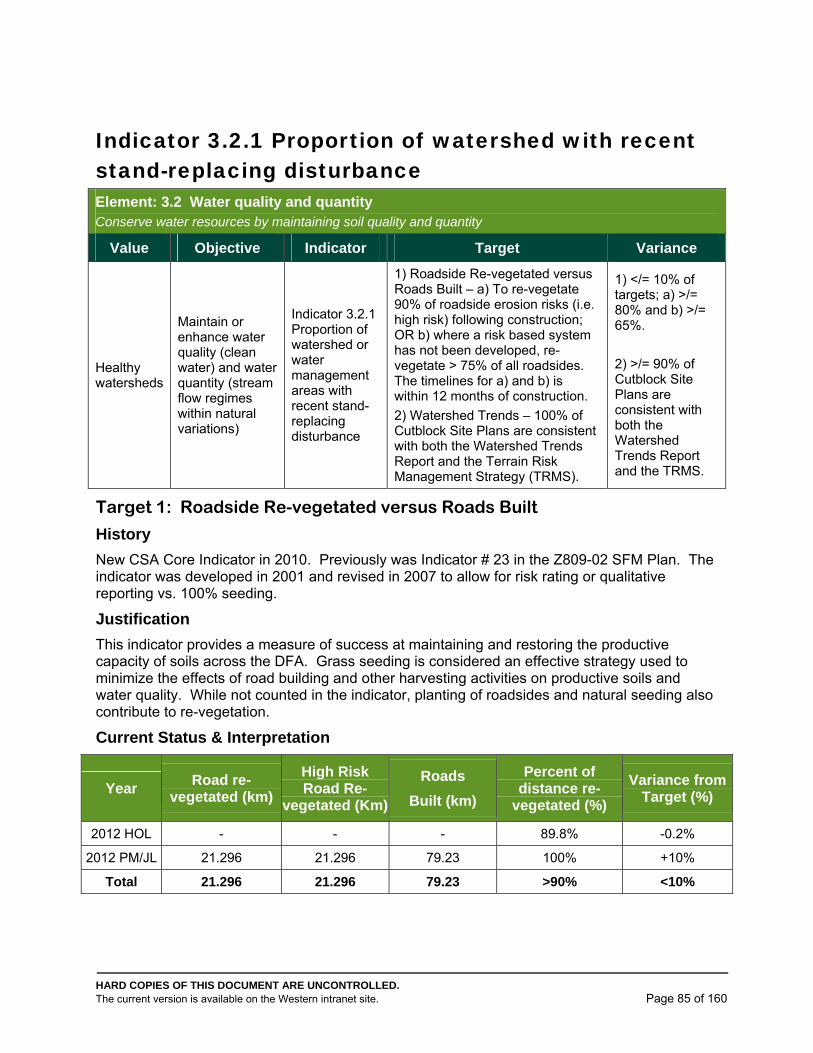
HARD COPIES OF THIS DOCUMENT ARE UNCONTROLLED. The current version is available on the Western intranet site. Page 85 of 160
Indicator 3.2.1 Proportion of watershed with recent stand-replacing disturbance Element: 3.2 Water quality and quantity Conserve water resources by maintaining soil quality and quantity
Value Objective Indicator Target Variance
Healthy watersheds
Maintain or enhance water quality (clean water) and water quantity (stream flow regimes within natural variations)
Indicator 3.2.1 Proportion of watershed or water management areas with recent stand-replacing disturbance
1) Roadside Re-vegetated versus Roads Built – a) To re-vegetate 90% of roadside erosion risks (i.e. high risk) following construction; OR b) where a risk based system has not been developed, re-vegetate > 75% of all roadsides. The timelines for a) and b) is within 12 months of construction.
2) Watershed Trends – 100% of Cutblock Site Plans are consistent with both the Watershed Trends Report and the Terrain Risk Management Strategy (TRMS).
1) </= 10% of targets; a) >/= 80% and b) >/= 65%.
2) >/= 90% of Cutblock Site Plans are consistent with both the Watershed Trends Report and the TRMS.
Target 1: Roadside Re-vegetated versus Roads Built
History
New CSA Core Indicator in 2010. Previously was Indicator # 23 in the Z809-02 SFM Plan. The indicator was developed in 2001 and revised in 2007 to allow for risk rating or qualitative reporting vs. 100% seeding.
Justification
This indicator provides a measure of success at maintaining and restoring the productive capacity of soils across the DFA. Grass seeding is considered an effective strategy used to minimize the effects of road building and other harvesting activities on productive soils and water quality. While not counted in the indicator, planting of roadsides and natural seeding also contribute to re-vegetation.
Current Status & Interpretation
Year Road re-
vegetated (km)
High Risk Road Re-
vegetated (Km)
Roads
Built (km)
Percent of distance re-
vegetated (%)
Variance from Target (%)
2012 HOL - - - 89.8% -0.2%
2012 PM/JL 21.296 21.296 79.23 100% +10%
Total 21.296 21.296 79.23 >90% <10%
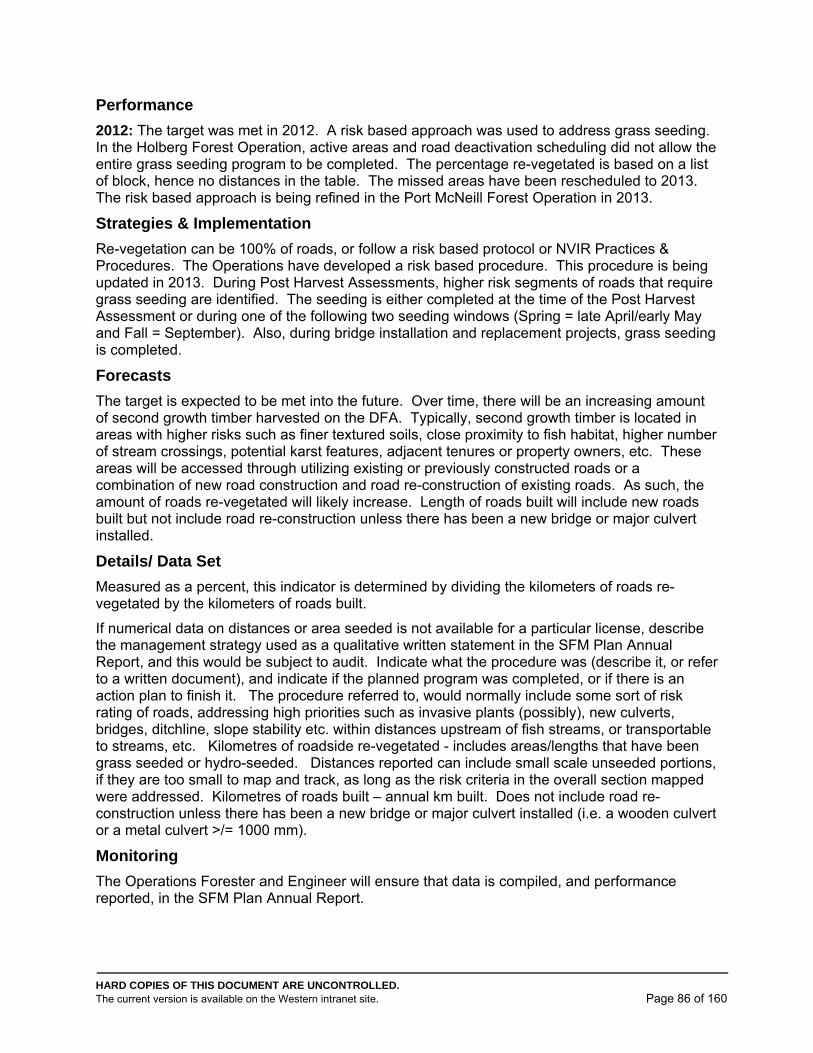
HARD COPIES OF THIS DOCUMENT ARE UNCONTROLLED. The current version is available on the Western intranet site. Page 86 of 160
Performance
2012: The target was met in 2012. A risk based approach was used to address grass seeding. In the Holberg Forest Operation, active areas and road deactivation scheduling did not allow the entire grass seeding program to be completed. The percentage re-vegetated is based on a list of block, hence no distances in the table. The missed areas have been rescheduled to 2013. The risk based approach is being refined in the Port McNeill Forest Operation in 2013.
Strategies & Implementation
Re-vegetation can be 100% of roads, or follow a risk based protocol or NVIR Practices & Procedures. The Operations have developed a risk based procedure. This procedure is being updated in 2013. During Post Harvest Assessments, higher risk segments of roads that require grass seeding are identified. The seeding is either completed at the time of the Post Harvest Assessment or during one of the following two seeding windows (Spring = late April/early May and Fall = September). Also, during bridge installation and replacement projects, grass seeding is completed.
Forecasts
The target is expected to be met into the future. Over time, there will be an increasing amount of second growth timber harvested on the DFA. Typically, second growth timber is located in areas with higher risks such as finer textured soils, close proximity to fish habitat, higher number of stream crossings, potential karst features, adjacent tenures or property owners, etc. These areas will be accessed through utilizing existing or previously constructed roads or a combination of new road construction and road re-construction of existing roads. As such, the amount of roads re-vegetated will likely increase. Length of roads built will include new roads built but not include road re-construction unless there has been a new bridge or major culvert installed.
Details/ Data Set
Measured as a percent, this indicator is determined by dividing the kilometers of roads re-vegetated by the kilometers of roads built.
If numerical data on distances or area seeded is not available for a particular license, describe the management strategy used as a qualitative written statement in the SFM Plan Annual Report, and this would be subject to audit. Indicate what the procedure was (describe it, or refer to a written document), and indicate if the planned program was completed, or if there is an action plan to finish it. The procedure referred to, would normally include some sort of risk rating of roads, addressing high priorities such as invasive plants (possibly), new culverts, bridges, ditchline, slope stability etc. within distances upstream of fish streams, or transportable to streams, etc. Kilometres of roadside re-vegetated - includes areas/lengths that have been grass seeded or hydro-seeded. Distances reported can include small scale unseeded portions, if they are too small to map and track, as long as the risk criteria in the overall section mapped were addressed. Kilometres of roads built – annual km built. Does not include road re-construction unless there has been a new bridge or major culvert installed (i.e. a wooden culvert or a metal culvert >/= 1000 mm).
Monitoring
The Operations Forester and Engineer will ensure that data is compiled, and performance reported, in the SFM Plan Annual Report.
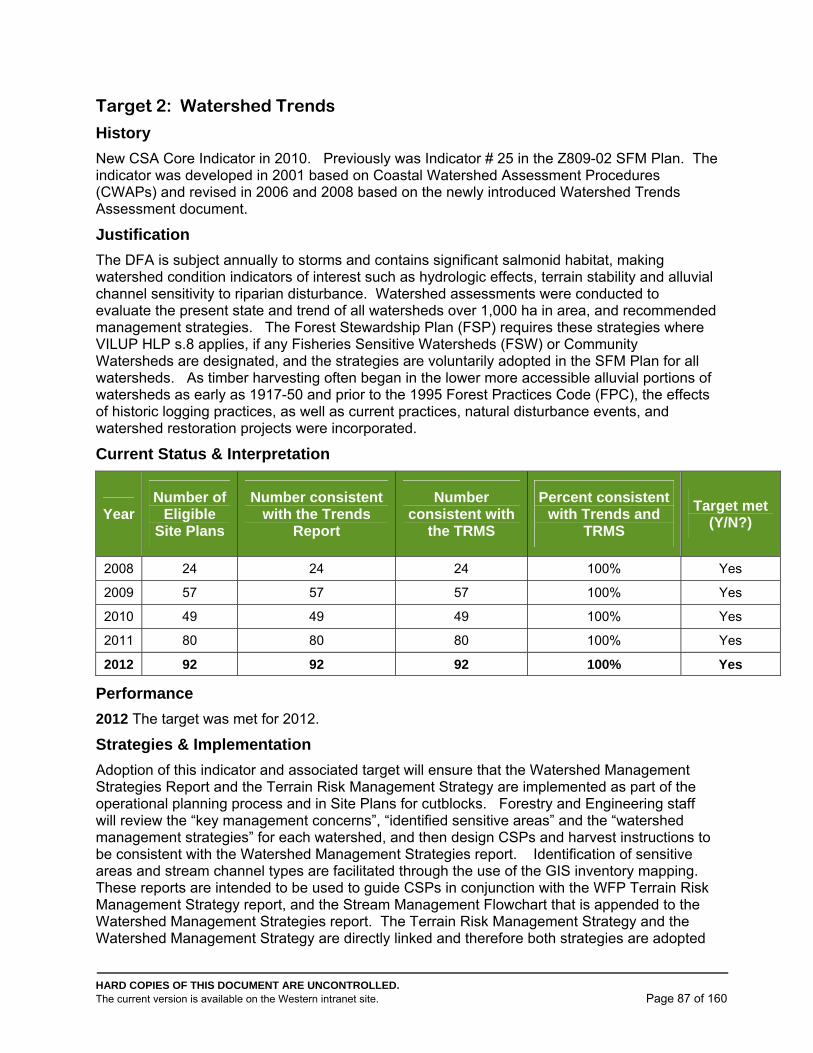
HARD COPIES OF THIS DOCUMENT ARE UNCONTROLLED. The current version is available on the Western intranet site. Page 87 of 160
Target 2: Watershed Trends
History
New CSA Core Indicator in 2010. Previously was Indicator # 25 in the Z809-02 SFM Plan. The indicator was developed in 2001 based on Coastal Watershed Assessment Procedures (CWAPs) and revised in 2006 and 2008 based on the newly introduced Watershed Trends Assessment document.
Justification
The DFA is subject annually to storms and contains significant salmonid habitat, making watershed condition indicators of interest such as hydrologic effects, terrain stability and alluvial channel sensitivity to riparian disturbance. Watershed assessments were conducted to evaluate the present state and trend of all watersheds over 1,000 ha in area, and recommended management strategies. The Forest Stewardship Plan (FSP) requires these strategies where VILUP HLP s.8 applies, if any Fisheries Sensitive Watersheds (FSW) or Community Watersheds are designated, and the strategies are voluntarily adopted in the SFM Plan for all watersheds. As timber harvesting often began in the lower more accessible alluvial portions of watersheds as early as 1917-50 and prior to the 1995 Forest Practices Code (FPC), the effects of historic logging practices, as well as current practices, natural disturbance events, and watershed restoration projects were incorporated.
Current Status & Interpretation
Year Number of
Eligible Site Plans
Number consistent with the Trends
Report
Number consistent with
the TRMS
Percent consistent with Trends and
TRMS
Target met (Y/N?)
2008 24 24 24 100% Yes
2009 57 57 57 100% Yes
2010 49 49 49 100% Yes
2011 80 80 80 100% Yes
2012 92 92 92 100% Yes
Performance
2012 The target was met for 2012.
Strategies & Implementation
Adoption of this indicator and associated target will ensure that the Watershed Management Strategies Report and the Terrain Risk Management Strategy are implemented as part of the operational planning process and in Site Plans for cutblocks. Forestry and Engineering staff will review the “key management concerns”, “identified sensitive areas” and the “watershed management strategies” for each watershed, and then design CSPs and harvest instructions to be consistent with the Watershed Management Strategies report. Identification of sensitive areas and stream channel types are facilitated through the use of the GIS inventory mapping. These reports are intended to be used to guide CSPs in conjunction with the WFP Terrain Risk Management Strategy report, and the Stream Management Flowchart that is appended to the Watershed Management Strategies report. The Terrain Risk Management Strategy and the Watershed Management Strategy are directly linked and therefore both strategies are adopted
HARD COPIES OF THIS DOCUMENT ARE UNCONTROLLED. The current version is available on the Western intranet site. Page 88 of 160
as part of this indicator. Implementation of these strategies is intended to help ensure that the Forecast is met. Although the management strategies within the Terrain Strategy and the Watershed Strategy reports are equally important to roads (i.e. slides, fan destabilization, road sedimentation issues etc.), and these reports should be used in road planning, the target results for this indicator will currently be based on CSPs only for ease of data collection. In the future, the target may be expanded to include Road Site Plans.
Current watershed conditions, changes to watershed conditions over time (watershed trends) and watershed risk ratings were reported by Glynnis Horel P.Eng in October 2007. The results are summarized in the 2007 FIA report entitled Tree Farm Licence 6 and 39-4 Watershed Indicators. This report developed a suite of watershed indicators to be tracked for different purposes (FSW evaluation, operational management strategies, watershed restoration prioritization). A summary indicator, number of watersheds in target condition, to monitor results of management strategies has been identified in the SFM Plan forecast.
A follow-up report entitled Tree Farm Licence 6, Tree Farm Licence 39 Block 4 and Tree Farm Licence 37 Watershed Management Strategies is the basis of the SFM Plan target. It provides the management strategies to guide ongoing forest development, and restoration priorities, in order to address the key concerns identified.
Forecasts
The watershed indicators have allowed comparison of pre-Code and post-Code management, particularly for terrain stability impact. The data show an order of magnitude reduction in landslides from roads constructed under FPC standards, and substantial reduction in events from harvested blocks. In addition, FPC stream buffers were effective in significantly reducing disturbance to alluvial channel reaches. The tracking of this indicator with respect to site plans, and Watershed Target Condition (A, B) is intended to ensure that strategies implemented achieve desired results for adaptive management.
The 2007 Watershed Trends Report indicates that 84% of watershed units are in target condition (A, B). In order for the Watershed Management Strategies to have future relevance, the attribute data upon which the strategies are based (i.e. potential terrain hazards, landside data and riparian condition etc.) needs to be periodically updated. Section 8 of the Watershed Management Strategies document indicates that inventories of potential terrain hazards and landslide information should be updated every 3 years. Watershed condition, watershed trends and watershed management strategies are recommended to be updated at 10 year intervals.
Forecasts of the watershed recovery rates are being prepared and should be ready sometime in 2013. As well, by following the terrain and watershed management strategies mentioned above, it is expected that the watershed trends data will be at or above the baseline conditions data (see Table) when it is updated in 10 years (2017). The table below summarizes watershed trends and target conditions as determined in October 2007.
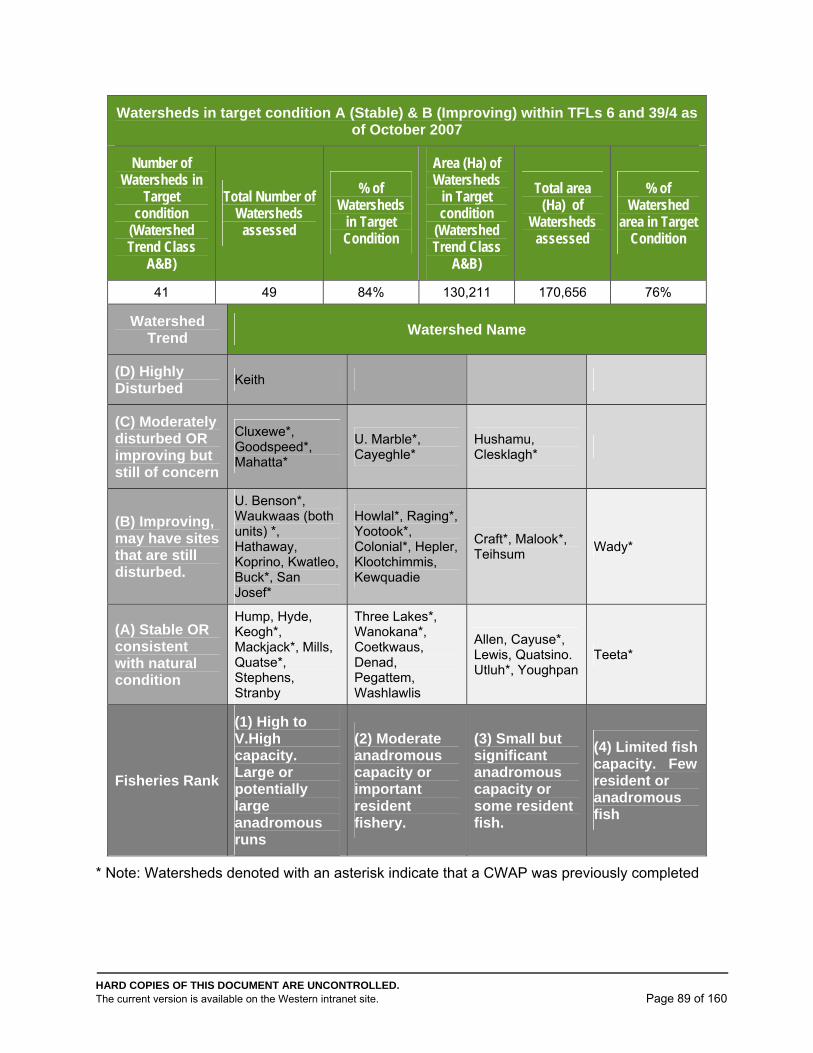
HARD COPIES OF THIS DOCUMENT ARE UNCONTROLLED. The current version is available on the Western intranet site. Page 89 of 160
Watersheds in target condition A (Stable) & B (Improving) within TFLs 6 and 39/4 as of October 2007
Number of Watersheds in
Target condition
(Watershed Trend Class
A&B)
Total Number of Watersheds
assessed
% of Watersheds
in Target Condition
Area (Ha) of Watersheds
in Target condition
(Watershed Trend Class
A&B)
Total area (Ha) of
Watersheds assessed
% of Watershed
area in Target Condition
41 49 84% 130,211 170,656 76%
Watershed Trend
Watershed Name
(D) Highly Disturbed
Keith
(C) Moderately disturbed OR improving but still of concern
Cluxewe*, Goodspeed*, Mahatta*
U. Marble*, Cayeghle*
Hushamu, Clesklagh*
(B) Improving, may have sites that are still disturbed.
U. Benson*, Waukwaas (both units) *, Hathaway, Koprino, Kwatleo, Buck*, San Josef*
Howlal*, Raging*, Yootook*, Colonial*, Hepler, Klootchimmis, Kewquadie
Craft*, Malook*, Teihsum
Wady*
(A) Stable OR consistent with natural condition
Hump, Hyde, Keogh*, Mackjack*, Mills, Quatse*, Stephens, Stranby
Three Lakes*, Wanokana*, Coetkwaus, Denad, Pegattem, Washlawlis
Allen, Cayuse*, Lewis, Quatsino. Utluh*, Youghpan
Teeta*
Fisheries Rank
(1) High to V.High capacity. Large or potentially large anadromous runs
(2) Moderate anadromous capacity or important resident fishery.
(3) Small but significant anadromous capacity or some resident fish.
(4) Limited fish capacity. Few resident or anadromous fish
* Note: Watersheds denoted with an asterisk indicate that a CWAP was previously completed
HARD COPIES OF THIS DOCUMENT ARE UNCONTROLLED. The current version is available on the Western intranet site. Page 90 of 160
Details/ Data Set
CSPs tallied are those signed during the reporting year, where the assessments were conducted after October 2008. Consistent with Trends Report means CSPs where the Watershed Management Strategies (Trends) report was referenced. Consistent with TRMS means that the TRMS or Terrain Management Code of Practice (TMCOP – earlier version of TRMS no longer maintained) was referenced in the Terrain Stability Assessment Report or the CSP.
Monitoring
The Operations Forester or designate will ensure that the data is compiled and reported in the SFM Plan Annual Report.
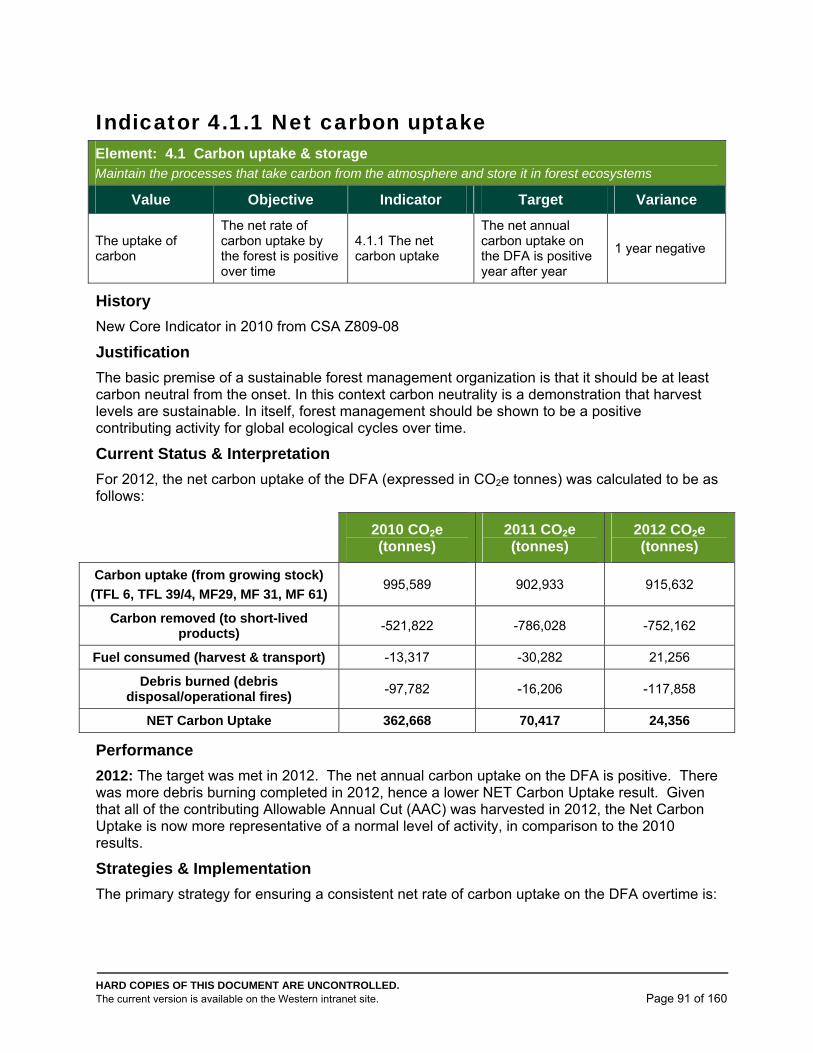
HARD COPIES OF THIS DOCUMENT ARE UNCONTROLLED. The current version is available on the Western intranet site. Page 91 of 160
Indicator 4.1.1 Net carbon uptake Element: 4.1 Carbon uptake & storage Maintain the processes that take carbon from the atmosphere and store it in forest ecosystems
Value Objective Indicator Target Variance
The uptake of carbon
The net rate of carbon uptake by the forest is positive over time
4.1.1 The net carbon uptake
The net annual carbon uptake on the DFA is positive year after year
1 year negative
History
New Core Indicator in 2010 from CSA Z809-08
Justification
The basic premise of a sustainable forest management organization is that it should be at least carbon neutral from the onset. In this context carbon neutrality is a demonstration that harvest levels are sustainable. In itself, forest management should be shown to be a positive contributing activity for global ecological cycles over time.
Current Status & Interpretation
For 2012, the net carbon uptake of the DFA (expressed in CO2e tonnes) was calculated to be as follows:
2010 CO2e (tonnes)
2011 CO2e (tonnes)
2012 CO2e (tonnes)
Carbon uptake (from growing stock)
(TFL 6, TFL 39/4, MF29, MF 31, MF 61) 995,589 902,933 915,632
Carbon removed (to short-lived products)
-521,822 -786,028 -752,162
Fuel consumed (harvest & transport) -13,317 -30,282 21,256
Debris burned (debris disposal/operational fires)
-97,782 -16,206 -117,858
NET Carbon Uptake 362,668 70,417 24,356
Performance
2012: The target was met in 2012. The net annual carbon uptake on the DFA is positive. There was more debris burning completed in 2012, hence a lower NET Carbon Uptake result. Given that all of the contributing Allowable Annual Cut (AAC) was harvested in 2012, the Net Carbon Uptake is now more representative of a normal level of activity, in comparison to the 2010 results.
Strategies & Implementation
The primary strategy for ensuring a consistent net rate of carbon uptake on the DFA overtime is:
HARD COPIES OF THIS DOCUMENT ARE UNCONTROLLED. The current version is available on the Western intranet site. Page 92 of 160
Prompt and effective reforestation or regeneration of harvested areas that aims to establish free growing stands of healthy trees of mixed species in sufficient numbers and within set time frames.
This is primarily achieved through a combination of natural regeneration and the planting of seedlings shortly after harvest is completed.
In certain circumstances, additional treatments may be required in support of this core strategy to achieve its goal including:
Site preparation such as spot or broadcast burns or mechanical debris scattering or removal to ensure a good distribution of the regeneration throughout the harvested area.
Fertilization at the time of planting to help initial seedling growth and establishment ahead of competing brush.
Physical protection of seedlings against browsing pressures from deer and/or elk.
Additional strategies that contribute to the consistent sequestration of carbon on the DFA include:
The use of improved seed for planted seedlings that have improved growth performance and/or insect or disease resistance.
Brushing treatments to relieve young trees from some of that competition.
Broadcast fertilization of stands to stimulate growth (e.g., SCHIRP) when funding is available.
Forest fire preparedness & response that aim at the prevention of fires and the prompt control and extinguishment of those that occur.
Modernizing or upgrading of equipment that result in improved fuel efficiencies.
Forecasts
Testing of different harvest levels in the spreadsheet model indicates that the annual net carbon uptake would remain positive for the DFA at the normal AAC level of harvest but could turn negative in a year where substantially more than the AAC is harvested to compensate for a year of undercut.
Details/ Data Set
The net carbon uptake on the DFA is simply defined as the difference between the total carbon uptake on the DFA by its growing stock, minus the net carbon removed from the DFA through harvest operations and the total carbon emitted through fuel consumption during forest management operations.
The net volume of carbon removed is a factor of the total volume harvested that accounts for the portion of the harvest that remains sequestered in long-life products such as building lumber and furniture.
Net carbon uptake can be expressed in a simple equation as follows:
Carbon uptake (from growing stock)
- Carbon removed (to short-lived products)
- Fuel consumed (harvest & transport)
- Debris burned (debris disposal/operational fires)
= Net carbon uptake
HARD COPIES OF THIS DOCUMENT ARE UNCONTROLLED. The current version is available on the Western intranet site. Page 93 of 160
Carbon uptake is calculated using the current growing stock on the DFA and applying the yield curves or growth estimates from the latest applicable timber supply analysis to the updated timber inventory. Growth is estimated by 10-year age classes from age 10 to 99, and then for broader age class 100 to 139 years. For simplicity, no growth on average is assumed for “old-growth” age classes greater than 139 years of age. Growth is distributed by species according to the species percentages recorded for each stand. The annual growth (in m3) is multiplied by the average carbon density estimates (kg/m3) by species to obtain the carbon uptake in tonnes of carbon.
The carbon removed is calculated based on the log volume production for each species. The annual log production (in m3) is multiplied by the average carbon density estimates (kg/m3) by species to obtain the gross carbon removed. This is then multiplied by a factor of 60% to estimate the tonnes of carbon removed to short-lived products. For simplicity, only stem-wood volume is considered in the calculation which is consistent with the results of yield curves.
The known fuel consumption is matched to the operational log production. When contractors independently purchase fuel, their consumption is assigned the average calculated rate (in L/m3) for the remaining of the operation’s log production to estimate the total amount of fuel they consumed. The sum total of fuels consumed (in L) is then multiplied by the average carbon density by fuel types (in t/L) to obtain the tonnes of carbon emitted through fuel consumption.
Finally, the carbon emitted through forest practices such as debris burning or through other operationally caused fires is estimated by multiplying the approximate volume of wood consumed (in m3) by the average carbon density estimates (kg/m3) of all of the entire harvested volume to obtain the carbon uptake in tonnes of carbon.
Monitoring
To monitor and calculate performance on this indicator, a number of parameters must be monitored or maintained for the DFA:
Growing stock inventory over time (adjusted for age and for annual harvested area)
The volume harvested annually
The species profile of the harvested volume
The age (i.e., old growth vs. 2nd growth) profile of the harvested volume
Total annual fuel consumption (gasoline, diesel fuel, aircraft fuel)
Annual area burnt in operationally caused forest fires
Annual area burnt in broadcast silviculture fires
Total number of debris piles burned annually for silviculture or fire abatement reasons and their average size.
The parameters listed above are entered in a spreadsheet built to calculate the carbon values emitted. It includes conversion factors extracted from recognized and credible international research literature. These factors include:
Carbon density (CO2e) of wood by species in tonnes/m3.
Carbon density of various fuel types in tonnes/L.
Proportion (%) of wood harvested that is stored in short-lived products.
HARD COPIES OF THIS DOCUMENT ARE UNCONTROLLED. The current version is available on the Western intranet site. Page 94 of 160
The Certification Forester is responsible for determining the net carbon uptake with assistance from Corporate Forestry. The results are provided to the Operations Forester for inclusion in the Annual Report.
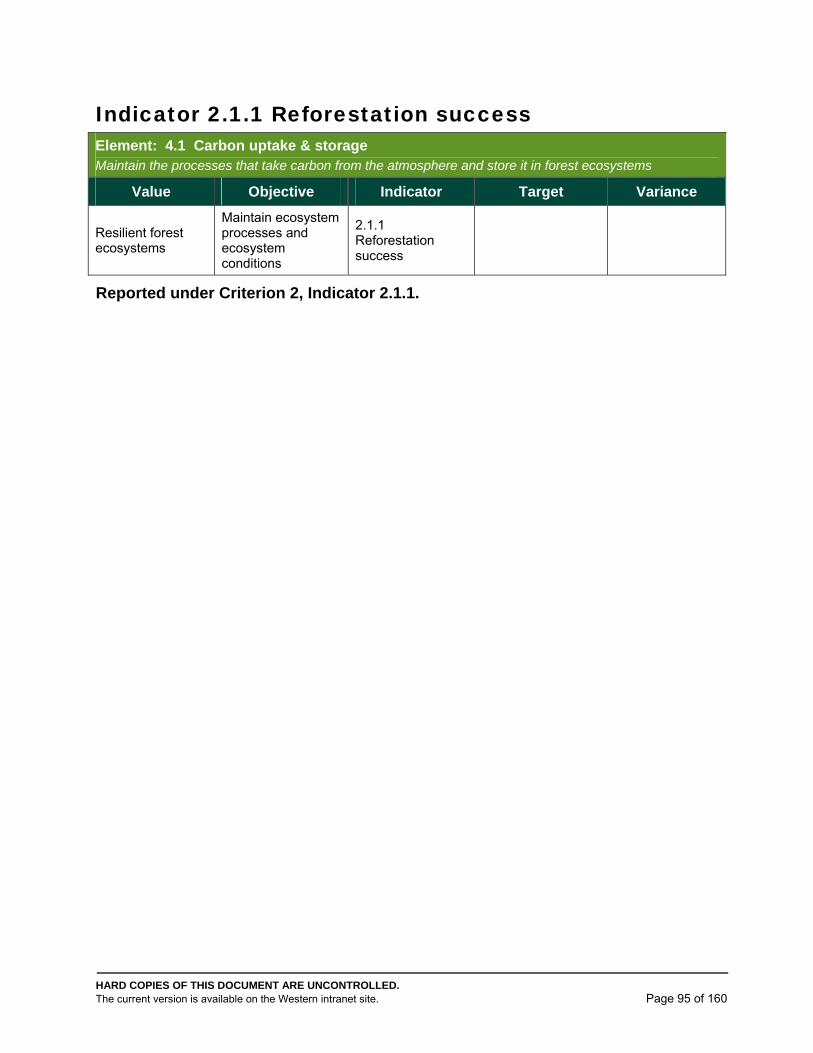
HARD COPIES OF THIS DOCUMENT ARE UNCONTROLLED. The current version is available on the Western intranet site. Page 95 of 160
Indicator 2.1.1 Reforestation success Element: 4.1 Carbon uptake & storage Maintain the processes that take carbon from the atmosphere and store it in forest ecosystems
Value Objective Indicator Target Variance
Resilient forest ecosystems
Maintain ecosystem processes and ecosystem conditions
2.1.1 Reforestation success
Reported under Criterion 2, Indicator 2.1.1.
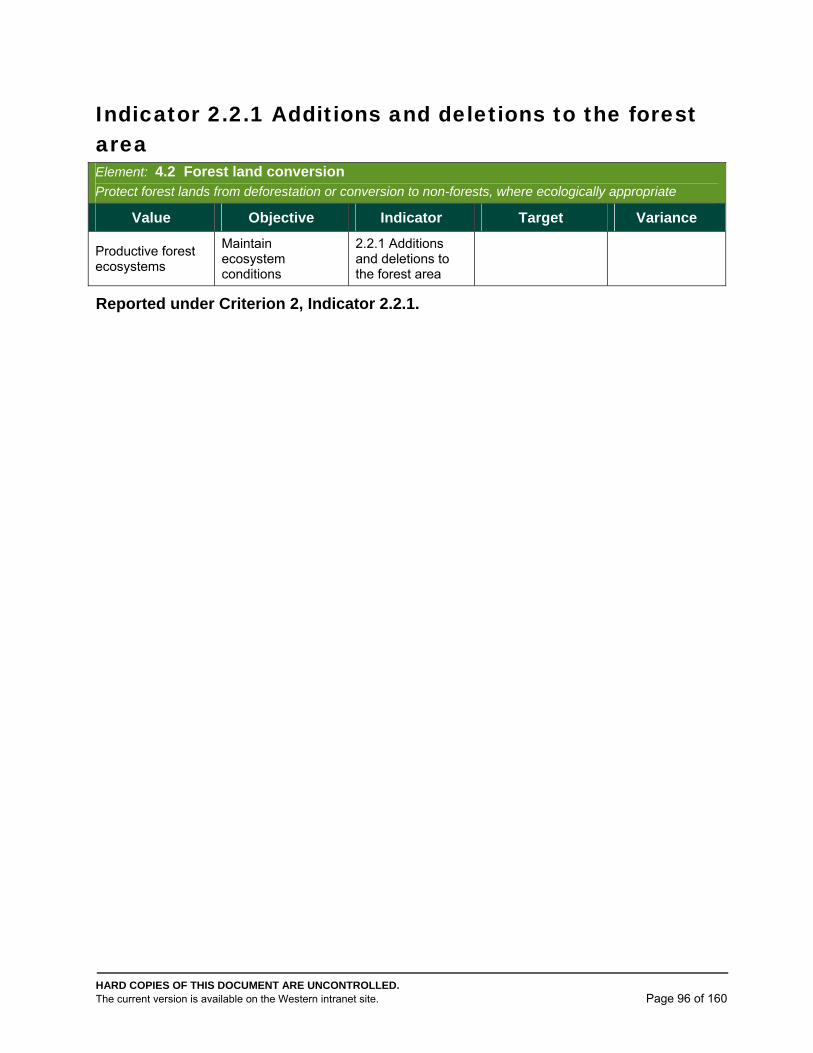
HARD COPIES OF THIS DOCUMENT ARE UNCONTROLLED. The current version is available on the Western intranet site. Page 96 of 160
Indicator 2.2.1 Additions and deletions to the forest area Element: 4.2 Forest land conversion Protect forest lands from deforestation or conversion to non-forests, where ecologically appropriate
Value Objective Indicator Target Variance
Productive forest ecosystems
Maintain ecosystem conditions
2.2.1 Additions and deletions to the forest area
Reported under Criterion 2, Indicator 2.2.1.
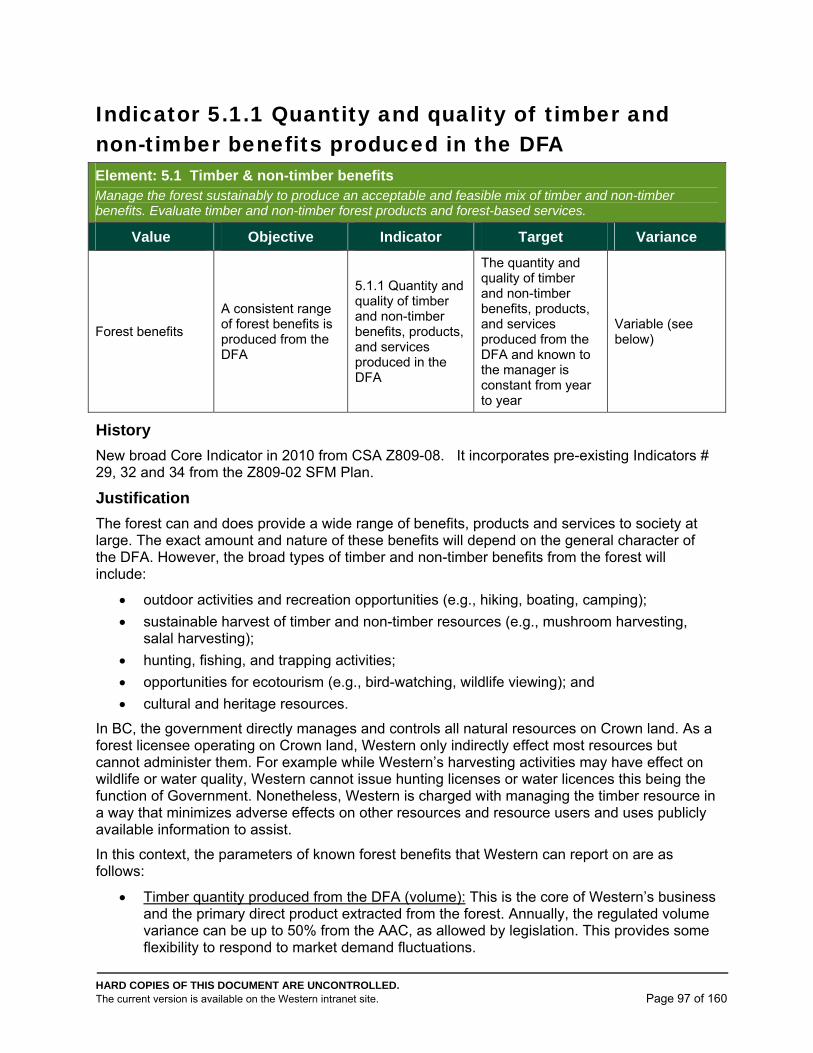
HARD COPIES OF THIS DOCUMENT ARE UNCONTROLLED. The current version is available on the Western intranet site. Page 97 of 160
Indicator 5.1.1 Quantity and quality of timber and non-timber benefits produced in the DFA Element: 5.1 Timber & non-timber benefits Manage the forest sustainably to produce an acceptable and feasible mix of timber and non-timber benefits. Evaluate timber and non-timber forest products and forest-based services.
Value Objective Indicator Target Variance
Forest benefits
A consistent range of forest benefits is produced from the DFA
5.1.1 Quantity and quality of timber and non-timber benefits, products, and services produced in the DFA
The quantity and quality of timber and non-timber benefits, products, and services produced from the DFA and known to the manager is constant from year to year
Variable (see below)
History
New broad Core Indicator in 2010 from CSA Z809-08. It incorporates pre-existing Indicators # 29, 32 and 34 from the Z809-02 SFM Plan.
Justification
The forest can and does provide a wide range of benefits, products and services to society at large. The exact amount and nature of these benefits will depend on the general character of the DFA. However, the broad types of timber and non-timber benefits from the forest will include:
outdoor activities and recreation opportunities (e.g., hiking, boating, camping);
sustainable harvest of timber and non-timber resources (e.g., mushroom harvesting, salal harvesting);
hunting, fishing, and trapping activities;
opportunities for ecotourism (e.g., bird-watching, wildlife viewing); and
cultural and heritage resources.
In BC, the government directly manages and controls all natural resources on Crown land. As a forest licensee operating on Crown land, Western only indirectly effect most resources but cannot administer them. For example while Western’s harvesting activities may have effect on wildlife or water quality, Western cannot issue hunting licenses or water licences this being the function of Government. Nonetheless, Western is charged with managing the timber resource in a way that minimizes adverse effects on other resources and resource users and uses publicly available information to assist.
In this context, the parameters of known forest benefits that Western can report on are as follows:
Timber quantity produced from the DFA (volume): This is the core of Western’s business and the primary direct product extracted from the forest. Annually, the regulated volume variance can be up to 50% from the AAC, as allowed by legislation. This provides some flexibility to respond to market demand fluctuations.
HARD COPIES OF THIS DOCUMENT ARE UNCONTROLLED. The current version is available on the Western intranet site. Page 98 of 160
EBITDA: For a business enterprise to be sustainable over time, it must be financially sound. The EBITDA (earnings before interest, tax, depreciation and amortization) is a common general measure of a business’ financial health. The target is to show a positive EBITDA year after year. The variance is 1 year of negative EBITDA. Any extended period of negative results would bring in question the sustainability of the business and ultimately engender major restructuring.
Net road access created (km): The provision of road access is the primary way in which use of the forest for recreation, sporting, tourism, cultural and harvesting of non-timber products activities can be directly affected. The large inventory of roads throughout the DFA is the asset that allows the use and enjoyment of most forest products and benefits. Western contributes to the maintenance and growth of this asset through its road construction and maintenance programs. On an on-going basis, roads are constructed or reconstructed to primarily provide access to timber. As well, roads are regularly decommissioned to remove an environmental risk and occasionally, rock ballast is removed for recycling purposes. The target is for the net effect of these activities to produce a positive increase in the overall road access available for any use on the DFA measured on a yearly basis. A variance of 1 year of a nil or negative increase would allow for the unlikely occurrence of such a negative business climate that no roads are constructed to preserve cash.
Recreation sites maintained (number): The primary responsibility for recreation sites falls on Government. Nonetheless, Western demonstrates its understanding of the importance of non-timber benefits and recreation by maintaining sites for public use. Recreation sites maintained include campsites, trails and picnic areas. The target is to maintain all the recreation sites (27) established in the DFA. A variance of 10 sites not maintained in a year allow for the fluctuations in resource available for recreation.
Trap-lines (number): In planning harvesting operations communications with registered trappers are occasionally carried out, even if not required, in order to provide them an opportunity for direct comments. From year to year there should not be any trap line lost or denied due to Westerns activities.
Limited entry tags available (number): The Ministry of Environment is the agency charged with regulating and managing hunting. However, a year after year allowance of hunting Elk in the DFA under limited entry hunting permits is evidence of an ongoing healthy population. Western’s forest management contributes in some degree to that health through the maintenance of ungulate winter ranges. The target is to have limited entry hunts in the DFA with a variance of 1 year without any to account for possible fluctuation in the elk population due to illness or poaching.
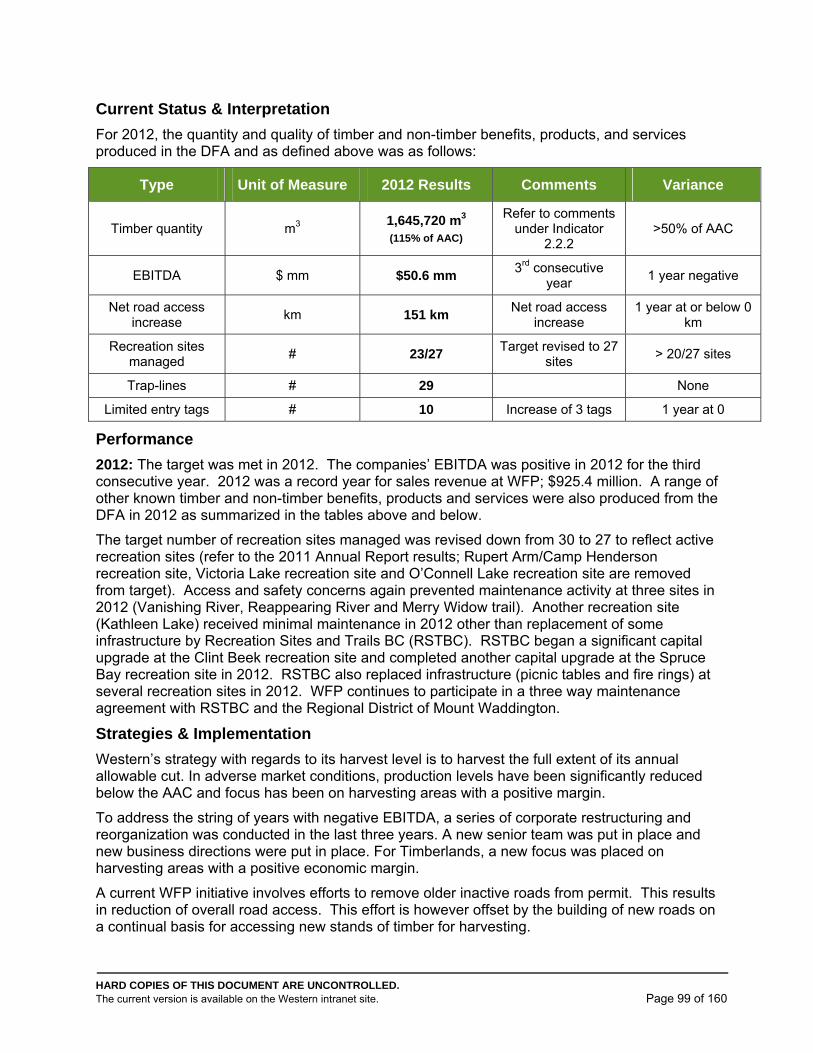
HARD COPIES OF THIS DOCUMENT ARE UNCONTROLLED. The current version is available on the Western intranet site. Page 99 of 160
Current Status & Interpretation
For 2012, the quantity and quality of timber and non-timber benefits, products, and services produced in the DFA and as defined above was as follows:
Type Unit of Measure 2012 Results Comments Variance
Timber quantity m3 1,645,720 m3 (115% of AAC)
Refer to comments under Indicator
2.2.2
>50% of AAC
EBITDA $ mm $50.6 mm 3rd consecutive
year 1 year negative
Net road access increase
km 151 km Net road access
increase 1 year at or below 0
km
Recreation sites managed
# 23/27 Target revised to 27
sites > 20/27 sites
Trap-lines # 29 None
Limited entry tags # 10 Increase of 3 tags 1 year at 0
Performance
2012: The target was met in 2012. The companies’ EBITDA was positive in 2012 for the third consecutive year. 2012 was a record year for sales revenue at WFP; $925.4 million. A range of other known timber and non-timber benefits, products and services were also produced from the DFA in 2012 as summarized in the tables above and below.
The target number of recreation sites managed was revised down from 30 to 27 to reflect active recreation sites (refer to the 2011 Annual Report results; Rupert Arm/Camp Henderson recreation site, Victoria Lake recreation site and O’Connell Lake recreation site are removed from target). Access and safety concerns again prevented maintenance activity at three sites in 2012 (Vanishing River, Reappearing River and Merry Widow trail). Another recreation site (Kathleen Lake) received minimal maintenance in 2012 other than replacement of some infrastructure by Recreation Sites and Trails BC (RSTBC). RSTBC began a significant capital upgrade at the Clint Beek recreation site and completed another capital upgrade at the Spruce Bay recreation site in 2012. RSTBC also replaced infrastructure (picnic tables and fire rings) at several recreation sites in 2012. WFP continues to participate in a three way maintenance agreement with RSTBC and the Regional District of Mount Waddington.
Strategies & Implementation
Western’s strategy with regards to its harvest level is to harvest the full extent of its annual allowable cut. In adverse market conditions, production levels have been significantly reduced below the AAC and focus has been on harvesting areas with a positive margin.
To address the string of years with negative EBITDA, a series of corporate restructuring and reorganization was conducted in the last three years. A new senior team was put in place and new business directions were put in place. For Timberlands, a new focus was placed on harvesting areas with a positive economic margin.
A current WFP initiative involves efforts to remove older inactive roads from permit. This results in reduction of overall road access. This effort is however offset by the building of new roads on a continual basis for accessing new stands of timber for harvesting.
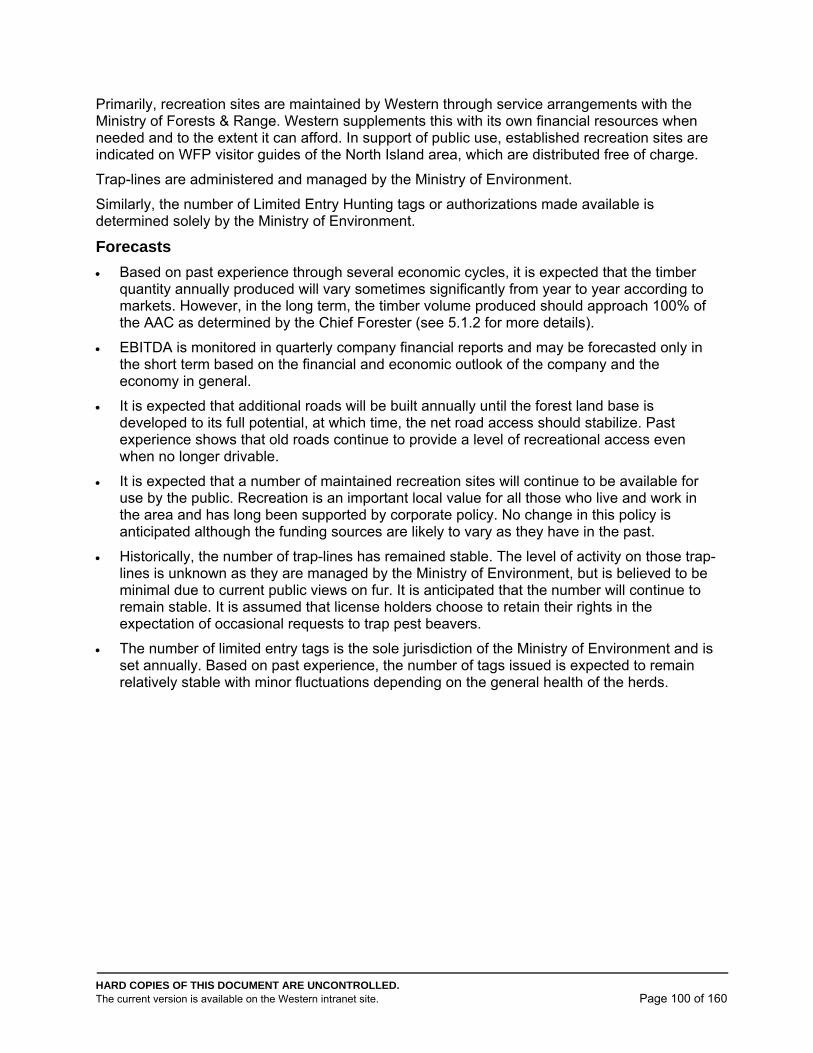
HARD COPIES OF THIS DOCUMENT ARE UNCONTROLLED. The current version is available on the Western intranet site. Page 100 of 160
Primarily, recreation sites are maintained by Western through service arrangements with the Ministry of Forests & Range. Western supplements this with its own financial resources when needed and to the extent it can afford. In support of public use, established recreation sites are indicated on WFP visitor guides of the North Island area, which are distributed free of charge.
Trap-lines are administered and managed by the Ministry of Environment.
Similarly, the number of Limited Entry Hunting tags or authorizations made available is determined solely by the Ministry of Environment.
Forecasts
Based on past experience through several economic cycles, it is expected that the timber quantity annually produced will vary sometimes significantly from year to year according to markets. However, in the long term, the timber volume produced should approach 100% of the AAC as determined by the Chief Forester (see 5.1.2 for more details).
EBITDA is monitored in quarterly company financial reports and may be forecasted only in the short term based on the financial and economic outlook of the company and the economy in general.
It is expected that additional roads will be built annually until the forest land base is developed to its full potential, at which time, the net road access should stabilize. Past experience shows that old roads continue to provide a level of recreational access even when no longer drivable.
It is expected that a number of maintained recreation sites will continue to be available for use by the public. Recreation is an important local value for all those who live and work in the area and has long been supported by corporate policy. No change in this policy is anticipated although the funding sources are likely to vary as they have in the past.
Historically, the number of trap-lines has remained stable. The level of activity on those trap-lines is unknown as they are managed by the Ministry of Environment, but is believed to be minimal due to current public views on fur. It is anticipated that the number will continue to remain stable. It is assumed that license holders choose to retain their rights in the expectation of occasional requests to trap pest beavers.
The number of limited entry tags is the sole jurisdiction of the Ministry of Environment and is set annually. Based on past experience, the number of tags issued is expected to remain relatively stable with minor fluctuations depending on the general health of the herds.

HARD COPIES OF THIS DOCUMENT ARE UNCONTROLLED. The current version is available on the Western intranet site. Page 101 of 160
Details/ Data Set
The current status of the DFA regulated cut expresses the quantity of timber produced and is as follows:
TFL 6 2009 2010 2011 2012 2013 Total for Cut
Control Period
AAC 1,243,958 1,243,958 1,243,958 1,158,863 4,890,737
Cut control volume 869,228 1,491,328 1,415,380 1,402,598 5,174,179
% compliance 69.9% 119.9% 113.8% 121.0% 105.8%
Overcut (undercut) -374,730 247,370 171,422 243,735 283,442
TFL 39, Block 4 2009 2010 2011 2012 2013 Total for Cut
Control Period
AAC 248,690 248,690 248,690 248,690 994,760
Cut control volume 115,209 180,737 179,085 243,122 718,153
% compliance 46% 73% 72% 97.8% 72%
Overcut (undercut) -133,481 -67,953 -69,605 -5,568 -525,297
FL A19244 2012 2013 2014 2015 2016 Total for Cut
Control Period
AAC 22,811 22,811
Overcut Carry Forward
0 0
Cut control volume 0 0
% compliance 0% 0%
Overcut (undercut) -22,811 -22,811
Earnings Before Interest, Tax, Depreciation and Amortization (EBITDA) is reported regularly for the whole company in its various public financial reports. The EBITDA reported in annual reports were as follows:
2006 2007 2008 2009 2010 2011 2012
EBITDA
(in mm$) $138.2 ($13.8) ($42.4) ($34.8) $48 $65 $50.6
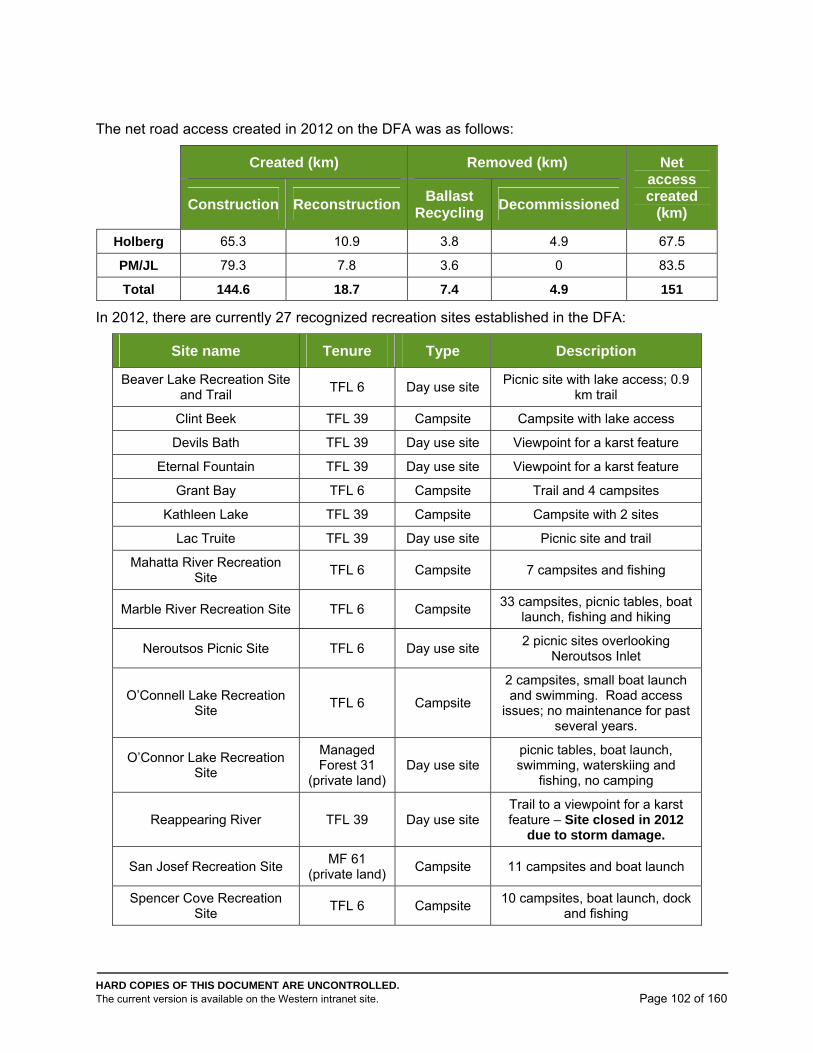
HARD COPIES OF THIS DOCUMENT ARE UNCONTROLLED. The current version is available on the Western intranet site. Page 102 of 160
The net road access created in 2012 on the DFA was as follows:
Created (km) Removed (km) Net access created
(km)
Construction ReconstructionBallast
RecyclingDecommissioned
Holberg 65.3 10.9 3.8 4.9 67.5
PM/JL 79.3 7.8 3.6 0 83.5
Total 144.6 18.7 7.4 4.9 151
In 2012, there are currently 27 recognized recreation sites established in the DFA:
Site name Tenure Type Description
Beaver Lake Recreation Site and Trail
TFL 6 Day use site Picnic site with lake access; 0.9
km trail
Clint Beek TFL 39 Campsite Campsite with lake access
Devils Bath TFL 39 Day use site Viewpoint for a karst feature
Eternal Fountain TFL 39 Day use site Viewpoint for a karst feature
Grant Bay TFL 6 Campsite Trail and 4 campsites
Kathleen Lake TFL 39 Campsite Campsite with 2 sites
Lac Truite TFL 39 Day use site Picnic site and trail
Mahatta River Recreation Site
TFL 6 Campsite 7 campsites and fishing
Marble River Recreation Site TFL 6 Campsite 33 campsites, picnic tables, boat
launch, fishing and hiking
Neroutsos Picnic Site TFL 6 Day use site 2 picnic sites overlooking
Neroutsos Inlet
O’Connell Lake Recreation Site
TFL 6 Campsite
2 campsites, small boat launch and swimming. Road access
issues; no maintenance for past several years.
O’Connor Lake Recreation Site
Managed Forest 31
(private land) Day use site
picnic tables, boat launch, swimming, waterskiing and
fishing, no camping
Reappearing River TFL 39 Day use site Trail to a viewpoint for a karst feature – Site closed in 2012
due to storm damage.
San Josef Recreation Site MF 61
(private land) Campsite 11 campsites and boat launch
Spencer Cove Recreation Site
TFL 6 Campsite 10 campsites, boat launch, dock
and fishing
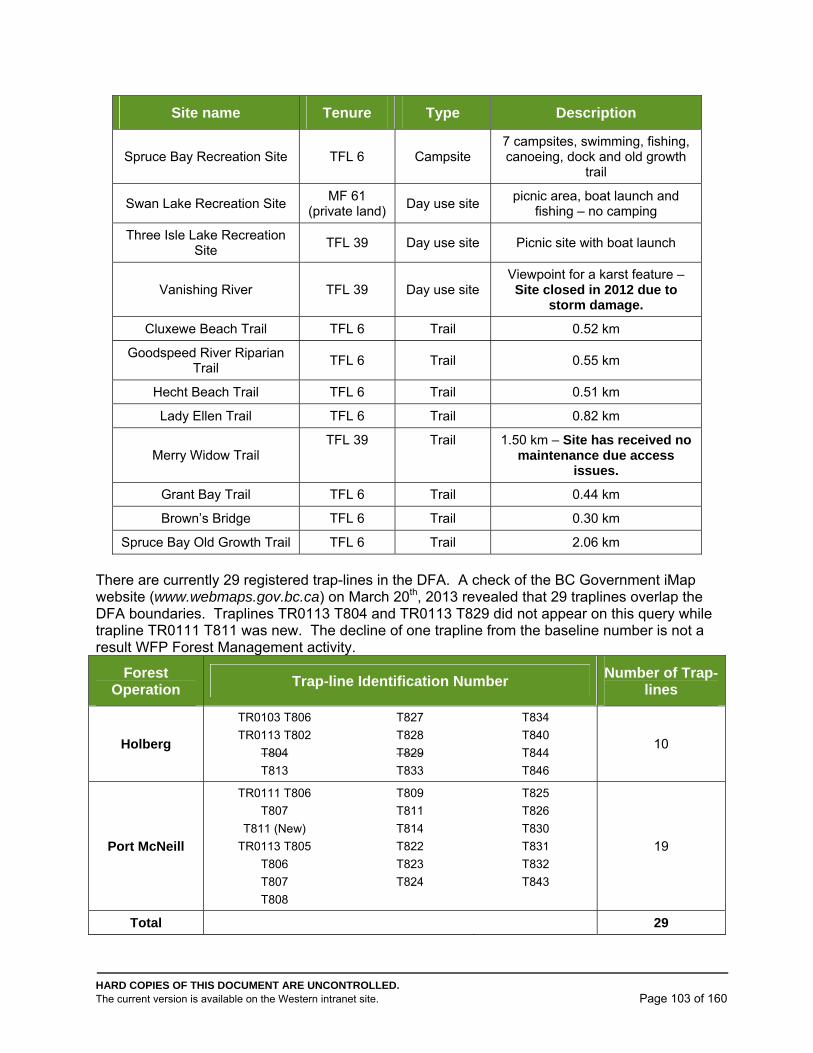
HARD COPIES OF THIS DOCUMENT ARE UNCONTROLLED. The current version is available on the Western intranet site. Page 103 of 160
Site name Tenure Type Description
Spruce Bay Recreation Site TFL 6 Campsite 7 campsites, swimming, fishing, canoeing, dock and old growth
trail
Swan Lake Recreation Site MF 61
(private land) Day use site
picnic area, boat launch and fishing – no camping
Three Isle Lake Recreation Site
TFL 39 Day use site Picnic site with boat launch
Vanishing River TFL 39 Day use site Viewpoint for a karst feature – Site closed in 2012 due to
storm damage.
Cluxewe Beach Trail TFL 6 Trail 0.52 km
Goodspeed River Riparian Trail
TFL 6 Trail 0.55 km
Hecht Beach Trail TFL 6 Trail 0.51 km
Lady Ellen Trail TFL 6 Trail 0.82 km
Merry Widow Trail TFL 39 Trail 1.50 km – Site has received no
maintenance due access issues.
Grant Bay Trail TFL 6 Trail 0.44 km
Brown’s Bridge TFL 6 Trail 0.30 km
Spruce Bay Old Growth Trail TFL 6 Trail 2.06 km
There are currently 29 registered trap-lines in the DFA. A check of the BC Government iMap website (www.webmaps.gov.bc.ca) on March 20th, 2013 revealed that 29 traplines overlap the DFA boundaries. Traplines TR0113 T804 and TR0113 T829 did not appear on this query while trapline TR0111 T811 was new. The decline of one trapline from the baseline number is not a result WFP Forest Management activity.
Forest Operation
Trap-line Identification Number Number of Trap-
lines
Holberg
TR0103 T806
TR0113 T802
T804
T813
T827
T828
T829
T833
T834
T840
T844
T846
10
Port McNeill
TR0111 T806
T807
T811 (New)
TR0113 T805
T806
T807
T808
T809
T811
T814
T822
T823
T824
T825
T826
T830
T831
T832
T843
19
Total 29
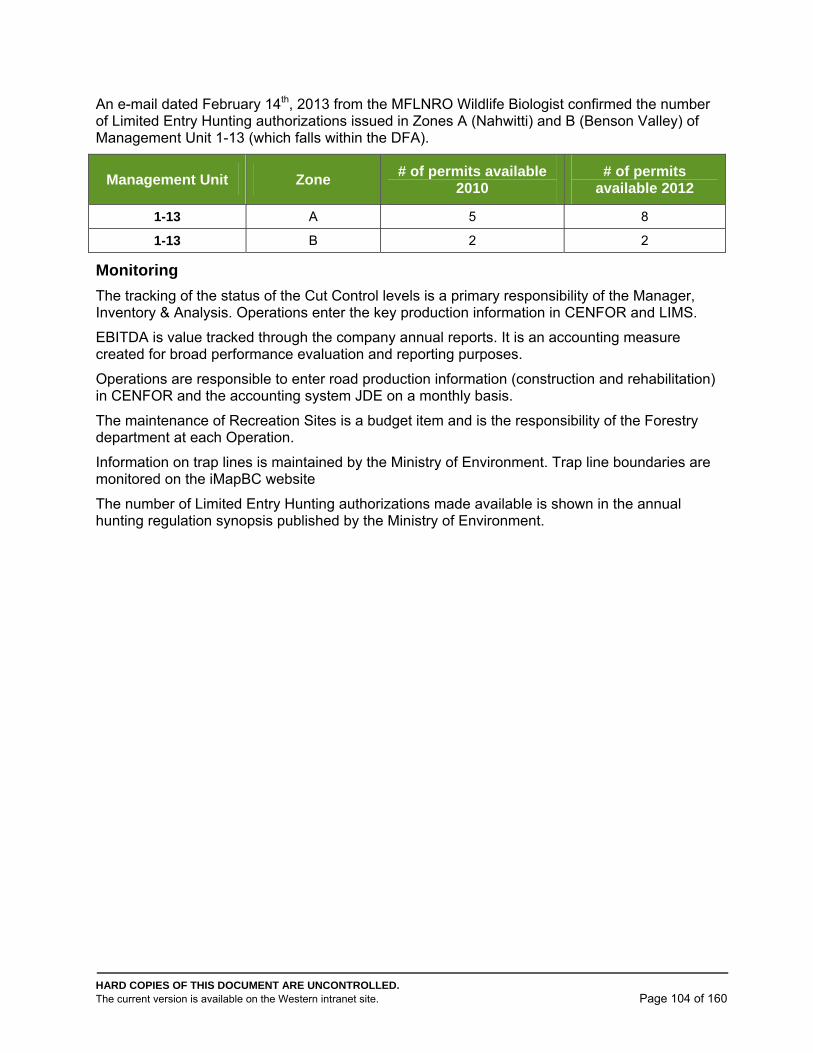
HARD COPIES OF THIS DOCUMENT ARE UNCONTROLLED. The current version is available on the Western intranet site. Page 104 of 160
An e-mail dated February 14th, 2013 from the MFLNRO Wildlife Biologist confirmed the number of Limited Entry Hunting authorizations issued in Zones A (Nahwitti) and B (Benson Valley) of Management Unit 1-13 (which falls within the DFA).
Management Unit Zone # of permits available
2010 # of permits
available 2012
1-13 A 5 8
1-13 B 2 2
Monitoring
The tracking of the status of the Cut Control levels is a primary responsibility of the Manager, Inventory & Analysis. Operations enter the key production information in CENFOR and LIMS.
EBITDA is value tracked through the company annual reports. It is an accounting measure created for broad performance evaluation and reporting purposes.
Operations are responsible to enter road production information (construction and rehabilitation) in CENFOR and the accounting system JDE on a monthly basis.
The maintenance of Recreation Sites is a budget item and is the responsibility of the Forestry department at each Operation.
Information on trap lines is maintained by the Ministry of Environment. Trap line boundaries are monitored on the iMapBC website
The number of Limited Entry Hunting authorizations made available is shown in the annual hunting regulation synopsis published by the Ministry of Environment.
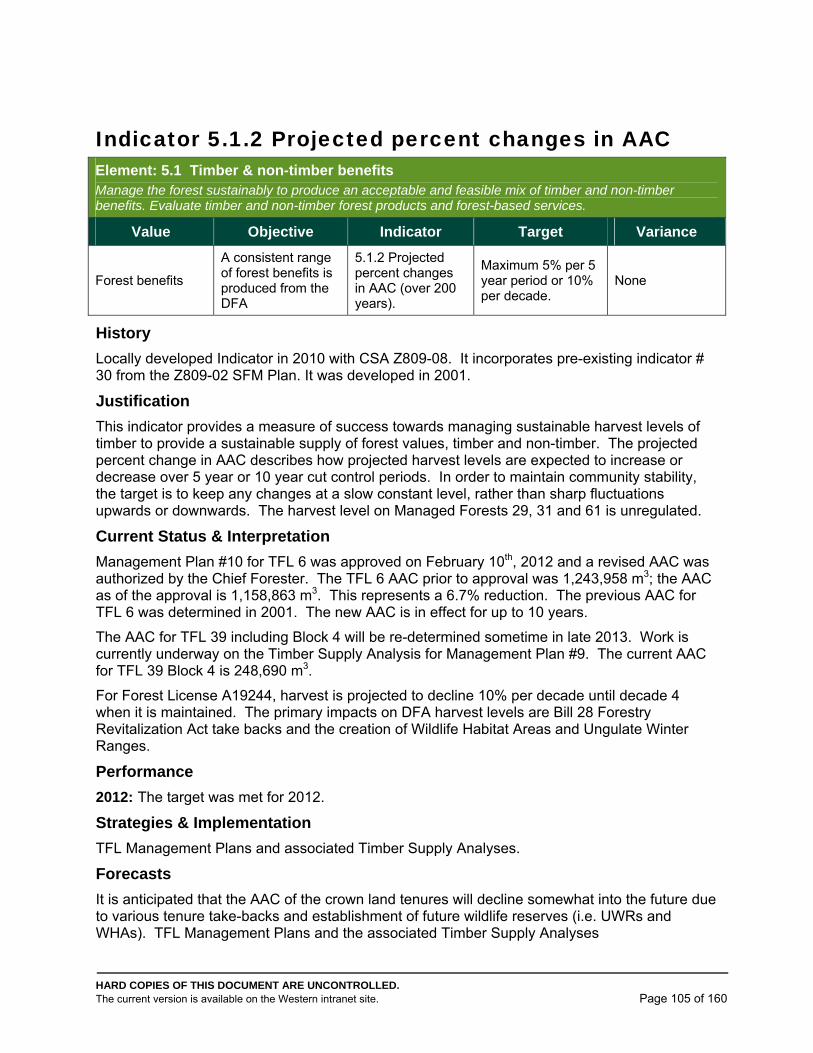
HARD COPIES OF THIS DOCUMENT ARE UNCONTROLLED. The current version is available on the Western intranet site. Page 105 of 160
Indicator 5.1.2 Projected percent changes in AAC Element: 5.1 Timber & non-timber benefits Manage the forest sustainably to produce an acceptable and feasible mix of timber and non-timber benefits. Evaluate timber and non-timber forest products and forest-based services.
Value Objective Indicator Target Variance
Forest benefits
A consistent range of forest benefits is produced from the DFA
5.1.2 Projected percent changes in AAC (over 200 years).
Maximum 5% per 5 year period or 10% per decade.
None
History
Locally developed Indicator in 2010 with CSA Z809-08. It incorporates pre-existing indicator # 30 from the Z809-02 SFM Plan. It was developed in 2001.
Justification
This indicator provides a measure of success towards managing sustainable harvest levels of timber to provide a sustainable supply of forest values, timber and non-timber. The projected percent change in AAC describes how projected harvest levels are expected to increase or decrease over 5 year or 10 year cut control periods. In order to maintain community stability, the target is to keep any changes at a slow constant level, rather than sharp fluctuations upwards or downwards. The harvest level on Managed Forests 29, 31 and 61 is unregulated.
Current Status & Interpretation
Management Plan #10 for TFL 6 was approved on February 10th, 2012 and a revised AAC was authorized by the Chief Forester. The TFL 6 AAC prior to approval was 1,243,958 m3; the AAC as of the approval is 1,158,863 m3. This represents a 6.7% reduction. The previous AAC for TFL 6 was determined in 2001. The new AAC is in effect for up to 10 years.
The AAC for TFL 39 including Block 4 will be re-determined sometime in late 2013. Work is currently underway on the Timber Supply Analysis for Management Plan #9. The current AAC for TFL 39 Block 4 is 248,690 m3.
For Forest License A19244, harvest is projected to decline 10% per decade until decade 4 when it is maintained. The primary impacts on DFA harvest levels are Bill 28 Forestry Revitalization Act take backs and the creation of Wildlife Habitat Areas and Ungulate Winter Ranges.
Performance
2012: The target was met for 2012.
Strategies & Implementation
TFL Management Plans and associated Timber Supply Analyses.
Forecasts
It is anticipated that the AAC of the crown land tenures will decline somewhat into the future due to various tenure take-backs and establishment of future wildlife reserves (i.e. UWRs and WHAs). TFL Management Plans and the associated Timber Supply Analyses
HARD COPIES OF THIS DOCUMENT ARE UNCONTROLLED. The current version is available on the Western intranet site. Page 106 of 160
Details/ Data Set
The projected percent change in AAC (over 200 years) is included as part of the forecasting completed for the TFL Management Planning process and in the Timber Supply Review (TSR) for the Forest Licence. New Management Plans and TSRs are completed up to every 10 years.
Monitoring
The Operations Foresters will ensure that the projected change in AAC (over 200 years) is reported in the SFM Annual Report. The Planning Forester in Corporate Forestry assists with reviewing the relevant Timber Supply Analysis.
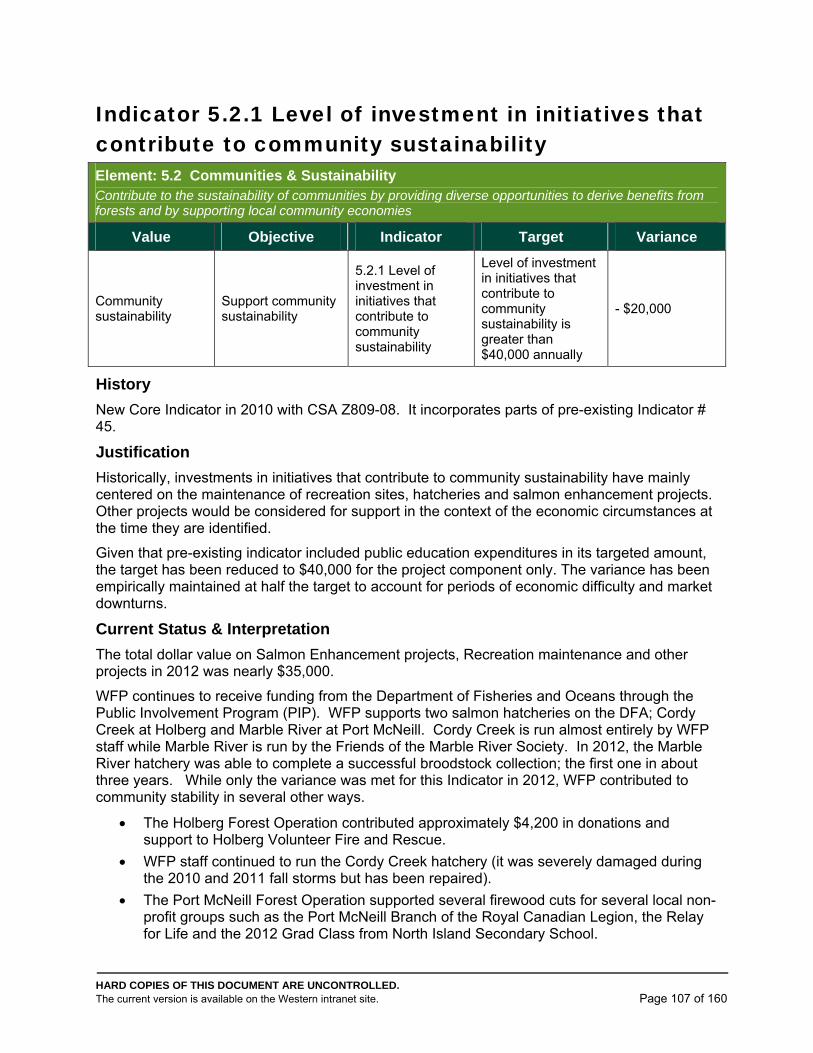
HARD COPIES OF THIS DOCUMENT ARE UNCONTROLLED. The current version is available on the Western intranet site. Page 107 of 160
Indicator 5.2.1 Level of investment in initiatives that contribute to community sustainability Element: 5.2 Communities & Sustainability Contribute to the sustainability of communities by providing diverse opportunities to derive benefits from forests and by supporting local community economies
Value Objective Indicator Target Variance
Community sustainability
Support community sustainability
5.2.1 Level of investment in initiatives that contribute to community sustainability
Level of investment in initiatives that contribute to community sustainability is greater than $40,000 annually
- $20,000
History
New Core Indicator in 2010 with CSA Z809-08. It incorporates parts of pre-existing Indicator # 45.
Justification
Historically, investments in initiatives that contribute to community sustainability have mainly centered on the maintenance of recreation sites, hatcheries and salmon enhancement projects. Other projects would be considered for support in the context of the economic circumstances at the time they are identified.
Given that pre-existing indicator included public education expenditures in its targeted amount, the target has been reduced to $40,000 for the project component only. The variance has been empirically maintained at half the target to account for periods of economic difficulty and market downturns.
Current Status & Interpretation
The total dollar value on Salmon Enhancement projects, Recreation maintenance and other projects in 2012 was nearly $35,000.
WFP continues to receive funding from the Department of Fisheries and Oceans through the Public Involvement Program (PIP). WFP supports two salmon hatcheries on the DFA; Cordy Creek at Holberg and Marble River at Port McNeill. Cordy Creek is run almost entirely by WFP staff while Marble River is run by the Friends of the Marble River Society. In 2012, the Marble River hatchery was able to complete a successful broodstock collection; the first one in about three years. While only the variance was met for this Indicator in 2012, WFP contributed to community stability in several other ways.
The Holberg Forest Operation contributed approximately $4,200 in donations and support to Holberg Volunteer Fire and Rescue.
WFP staff continued to run the Cordy Creek hatchery (it was severely damaged during the 2010 and 2011 fall storms but has been repaired).
The Port McNeill Forest Operation supported several firewood cuts for several local non-profit groups such as the Port McNeill Branch of the Royal Canadian Legion, the Relay for Life and the 2012 Grad Class from North Island Secondary School.
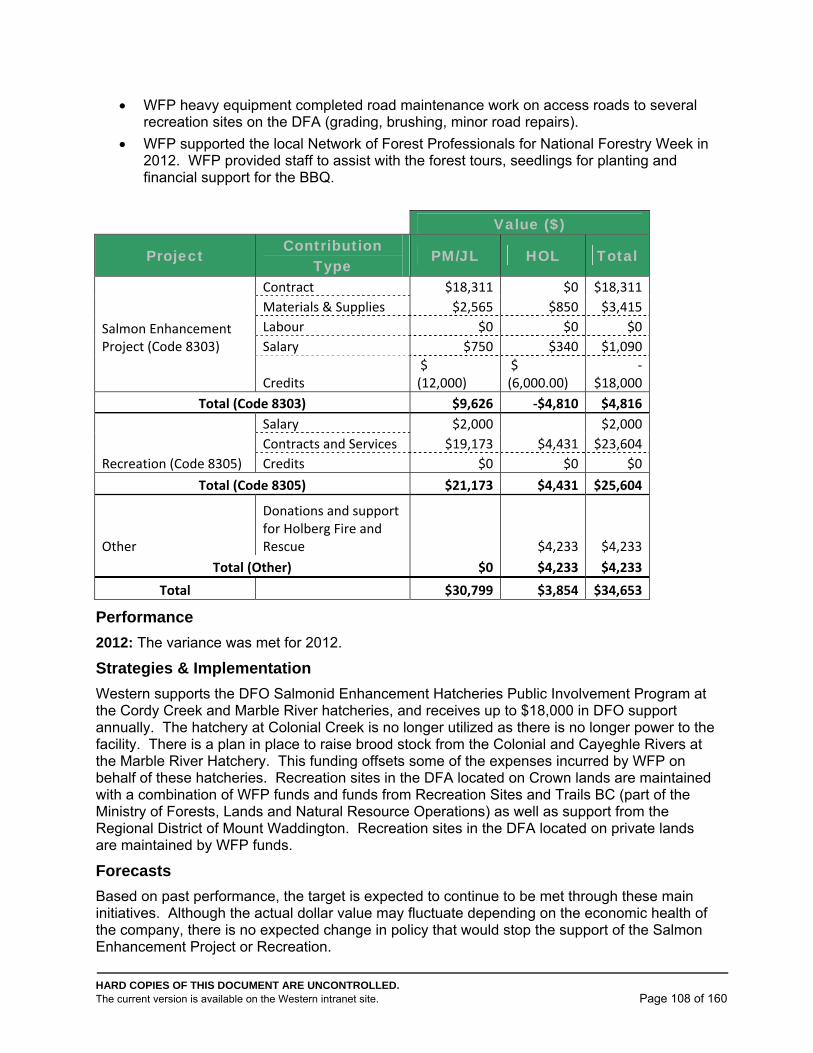
HARD COPIES OF THIS DOCUMENT ARE UNCONTROLLED. The current version is available on the Western intranet site. Page 108 of 160
WFP heavy equipment completed road maintenance work on access roads to several recreation sites on the DFA (grading, brushing, minor road repairs).
WFP supported the local Network of Forest Professionals for National Forestry Week in 2012. WFP provided staff to assist with the forest tours, seedlings for planting and financial support for the BBQ.
Value ($)
Project Contribution
Type PM/JL HOL Total
Salmon Enhancement Project (Code 8303)
Contract $18,311 $0 $18,311
Materials & Supplies $2,565 $850 $3,415
Labour $0 $0 $0
Salary $750 $340 $1,090
Credits $ (12,000)
$ (6,000.00)
‐$18,000
Total (Code 8303) $9,626 ‐$4,810 $4,816
Salary $2,000 $2,000
Contracts and Services $19,173 $4,431 $23,604
Recreation (Code 8305) Credits $0 $0 $0
Total (Code 8305) $21,173 $4,431 $25,604
Other
Donations and support for Holberg Fire and Rescue $4,233 $4,233
Total (Other) $0 $4,233 $4,233
Total $30,799 $3,854 $34,653
Performance
2012: The variance was met for 2012.
Strategies & Implementation
Western supports the DFO Salmonid Enhancement Hatcheries Public Involvement Program at the Cordy Creek and Marble River hatcheries, and receives up to $18,000 in DFO support annually. The hatchery at Colonial Creek is no longer utilized as there is no longer power to the facility. There is a plan in place to raise brood stock from the Colonial and Cayeghle Rivers at the Marble River Hatchery. This funding offsets some of the expenses incurred by WFP on behalf of these hatcheries. Recreation sites in the DFA located on Crown lands are maintained with a combination of WFP funds and funds from Recreation Sites and Trails BC (part of the Ministry of Forests, Lands and Natural Resource Operations) as well as support from the Regional District of Mount Waddington. Recreation sites in the DFA located on private lands are maintained by WFP funds.
Forecasts
Based on past performance, the target is expected to continue to be met through these main initiatives. Although the actual dollar value may fluctuate depending on the economic health of the company, there is no expected change in policy that would stop the support of the Salmon Enhancement Project or Recreation.
HARD COPIES OF THIS DOCUMENT ARE UNCONTROLLED. The current version is available on the Western intranet site. Page 109 of 160
Details/ Data Set
In-kind contributions include a dollar estimate of equipment time, personnel time, and facilities donated for the purpose of developing public projects.
Monitoring
Report annual company contributions, plus any reimbursements from other funding sources cost-shared or managed by WFP for these project types.
Dollars and in-kind contributions provided to public projects are determined by compiling the total dollars and in-kind contributions spent during the reporting year on public projects. Data is tracked at the Operation by the Operations Forester and Administrative Assistants using queries to the AP-Flo database (WFP invoice payment software, activity codes 8303 for Salmon Enhancement and 8305 for Recreation). “In-kind” volunteer time and other contributions may be extensive but are not necessarily able to be accurately captured, but are reported where possible.
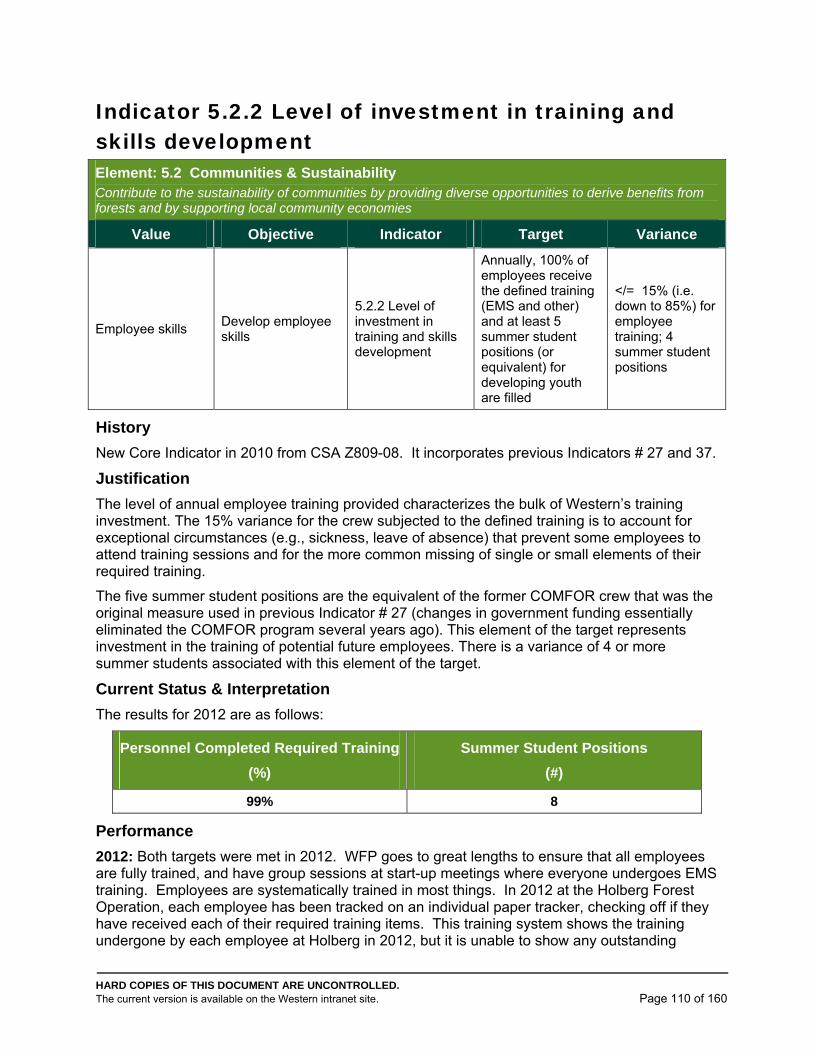
HARD COPIES OF THIS DOCUMENT ARE UNCONTROLLED. The current version is available on the Western intranet site. Page 110 of 160
Indicator 5.2.2 Level of investment in training and skills development Element: 5.2 Communities & Sustainability Contribute to the sustainability of communities by providing diverse opportunities to derive benefits from forests and by supporting local community economies
Value Objective Indicator Target Variance
Employee skills Develop employee skills
5.2.2 Level of investment in training and skills development
Annually, 100% of employees receive the defined training (EMS and other) and at least 5 summer student positions (or equivalent) for developing youth are filled
</= 15% (i.e. down to 85%) for employee training; 4 summer student positions
History
New Core Indicator in 2010 from CSA Z809-08. It incorporates previous Indicators # 27 and 37.
Justification
The level of annual employee training provided characterizes the bulk of Western’s training investment. The 15% variance for the crew subjected to the defined training is to account for exceptional circumstances (e.g., sickness, leave of absence) that prevent some employees to attend training sessions and for the more common missing of single or small elements of their required training.
The five summer student positions are the equivalent of the former COMFOR crew that was the original measure used in previous Indicator # 27 (changes in government funding essentially eliminated the COMFOR program several years ago). This element of the target represents investment in the training of potential future employees. There is a variance of 4 or more summer students associated with this element of the target.
Current Status & Interpretation
The results for 2012 are as follows:
Personnel Completed Required Training
(%)
Summer Student Positions
(#)
99% 8
Performance
2012: Both targets were met in 2012. WFP goes to great lengths to ensure that all employees are fully trained, and have group sessions at start-up meetings where everyone undergoes EMS training. Employees are systematically trained in most things. In 2012 at the Holberg Forest Operation, each employee has been tracked on an individual paper tracker, checking off if they have received each of their required training items. This training system shows the training undergone by each employee at Holberg in 2012, but it is unable to show any outstanding

HARD COPIES OF THIS DOCUMENT ARE UNCONTROLLED. The current version is available on the Western intranet site. Page 111 of 160
training at December 31st, 2012. To date, the program will only provide outstanding training reports for the current date (this was discovered during the reporting out on this Indicator). A solution to this is being sought, however, none have presented themselves as of yet. Outstanding training reports are printed on a monthly basis to ensure there is an accurate record month to month. Sometimes expired training is tolerated for a short period of time in order to fill up a course or in the case of EMS Level 1 training; a refresher course is scheduled when summer students arrive. In Port McNeill and Jeune Landing, training has been tracked reasonably well using the legacy tracking software. However, this software is no longer supported and is becoming increasingly susceptible to failure. Corporately, an Environmental Management Program has been created for the standardization and replacement of training tracking software across all Timberlands Operations with a planned roll-out in Q4 2013.
In 2012, there were 4 summer students in Holberg and 4 in Port McNeill & Jeune Landing hired to assist the Engineering and Forestry Departments during the busy summer field season. Two of the students were hired for 8 month terms and the remainder were hired for 4 month terms. In September 2012, Port McNeill Forest Operation hosted three students from the North Island College Woodlands Harvesting program for a 9 day work experience term. One of these students ended up being hired by WFP at the end of the work experience term and is working in the Yarding and Loading Department at Port McNeill.
Strategies & Implementation
The core elements of the required training for employees are described in the Timberlands EMS according to general employee positions. Further specialized training requirement for specific employees (e.g. firefighting, TDG, Safe Work Practices) is defined in the training record databases (e.g., INTRAC) maintained by the Operations. Often, the bulk of the defined training is carried out early in the year at the beginning of production operations following the winter shutdown period. Employees include staff, union and contract workers.
Western’s strategy has been to hire summer students to support higher production levels during the field season in the Forestry and Engineering Departments. This provides students with training opportunities and at the same time a chance for Western to assess prospective future employees.
Forecasts
Training levels are expected to remain constant into the future. EMS training requirements are not expected to change. Summer student hiring should remain fairly constant over the years but may see a gradual reduction in absolute numbers reflecting reduced harvest levels due to timber supply analysis and land base reductions due to land sales and tenure reallocation. Similarly, the opportunities in summer recreation employment will likely decline because of the increasing involvement of Recreation Sites and Trails BC in recreation site management.
Details/ Data Set
The training requirement for each employee is defined by the Operation and may include EMS training, Safety training and specialized training such as TDG training, spill response and firefighting training. Personnel are considered trained only when all required courses for the position are completed. All operations within the DFA conduct training needs assessments to verify achievement of target.
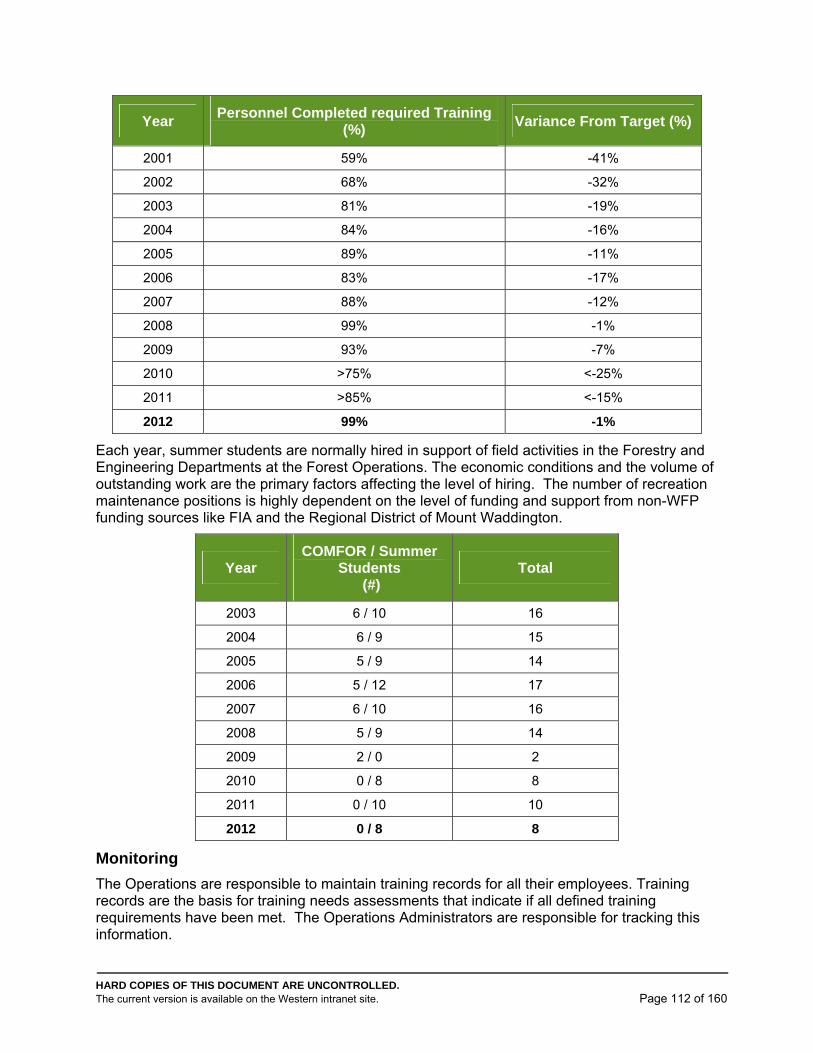
HARD COPIES OF THIS DOCUMENT ARE UNCONTROLLED. The current version is available on the Western intranet site. Page 112 of 160
Year Personnel Completed required Training
(%) Variance From Target (%)
2001 59% -41%
2002 68% -32%
2003 81% -19%
2004 84% -16%
2005 89% -11%
2006 83% -17%
2007 88% -12%
2008 99% -1%
2009 93% -7%
2010 >75% <-25%
2011 >85% <-15%
2012 99% -1%
Each year, summer students are normally hired in support of field activities in the Forestry and Engineering Departments at the Forest Operations. The economic conditions and the volume of outstanding work are the primary factors affecting the level of hiring. The number of recreation maintenance positions is highly dependent on the level of funding and support from non-WFP funding sources like FIA and the Regional District of Mount Waddington.
Year COMFOR / Summer
Students (#)
Total
2003 6 / 10 16
2004 6 / 9 15
2005 5 / 9 14
2006 5 / 12 17
2007 6 / 10 16
2008 5 / 9 14
2009 2 / 0 2
2010 0 / 8 8
2011 0 / 10 10
2012 0 / 8 8
Monitoring
The Operations are responsible to maintain training records for all their employees. Training records are the basis for training needs assessments that indicate if all defined training requirements have been met. The Operations Administrators are responsible for tracking this information.

HARD COPIES OF THIS DOCUMENT ARE UNCONTROLLED. The current version is available on the Western intranet site. Page 113 of 160
The number of summer student positions filled each year is compiled and reported by the Operations Foresters.
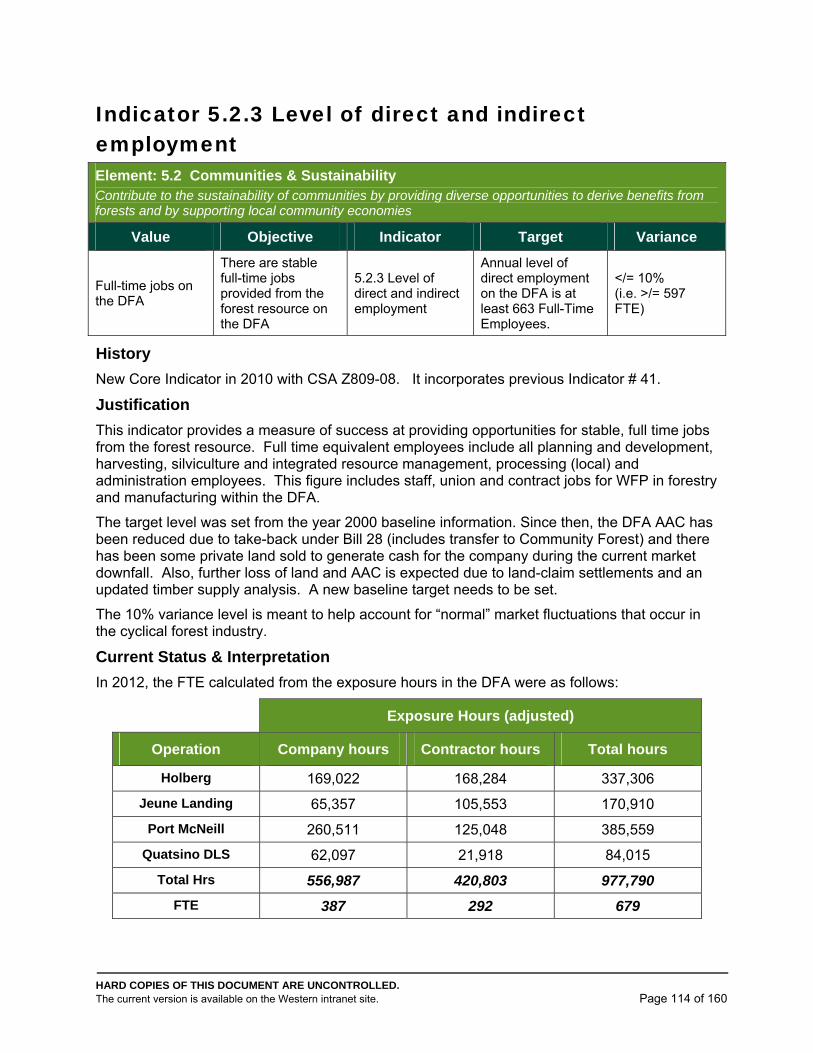
HARD COPIES OF THIS DOCUMENT ARE UNCONTROLLED. The current version is available on the Western intranet site. Page 114 of 160
Indicator 5.2.3 Level of direct and indirect employment Element: 5.2 Communities & Sustainability Contribute to the sustainability of communities by providing diverse opportunities to derive benefits from forests and by supporting local community economies
Value Objective Indicator Target Variance
Full-time jobs on the DFA
There are stable full-time jobs provided from the forest resource on the DFA
5.2.3 Level of direct and indirect employment
Annual level of direct employment on the DFA is at least 663 Full-Time Employees.
</= 10% (i.e. >/= 597 FTE)
History
New Core Indicator in 2010 with CSA Z809-08. It incorporates previous Indicator # 41.
Justification
This indicator provides a measure of success at providing opportunities for stable, full time jobs from the forest resource. Full time equivalent employees include all planning and development, harvesting, silviculture and integrated resource management, processing (local) and administration employees. This figure includes staff, union and contract jobs for WFP in forestry and manufacturing within the DFA.
The target level was set from the year 2000 baseline information. Since then, the DFA AAC has been reduced due to take-back under Bill 28 (includes transfer to Community Forest) and there has been some private land sold to generate cash for the company during the current market downfall. Also, further loss of land and AAC is expected due to land-claim settlements and an updated timber supply analysis. A new baseline target needs to be set.
The 10% variance level is meant to help account for “normal” market fluctuations that occur in the cyclical forest industry.
Current Status & Interpretation
In 2012, the FTE calculated from the exposure hours in the DFA were as follows:
Exposure Hours (adjusted)
Operation Company hours Contractor hours Total hours
Holberg 169,022 168,284 337,306
Jeune Landing 65,357 105,553 170,910
Port McNeill 260,511 125,048 385,559
Quatsino DLS 62,097 21,918 84,015
Total Hrs 556,987 420,803 977,790
FTE 387 292 679
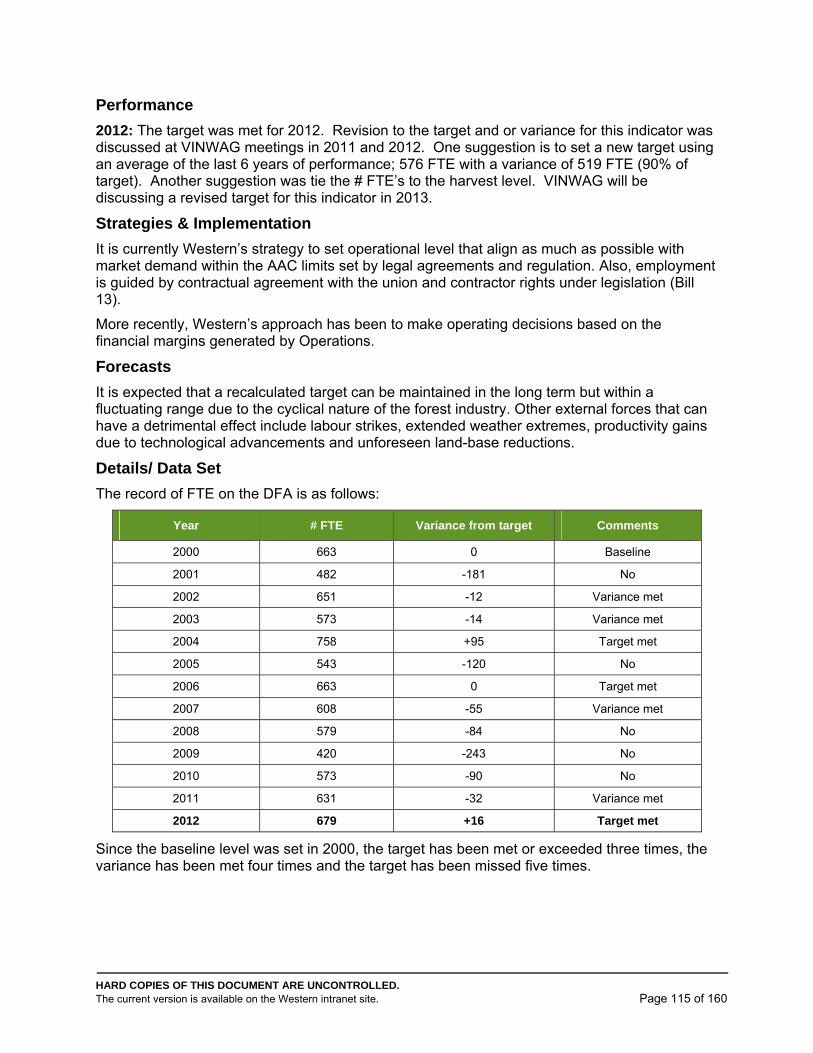
HARD COPIES OF THIS DOCUMENT ARE UNCONTROLLED. The current version is available on the Western intranet site. Page 115 of 160
Performance
2012: The target was met for 2012. Revision to the target and or variance for this indicator was discussed at VINWAG meetings in 2011 and 2012. One suggestion is to set a new target using an average of the last 6 years of performance; 576 FTE with a variance of 519 FTE (90% of target). Another suggestion was tie the # FTE’s to the harvest level. VINWAG will be discussing a revised target for this indicator in 2013.
Strategies & Implementation
It is currently Western’s strategy to set operational level that align as much as possible with market demand within the AAC limits set by legal agreements and regulation. Also, employment is guided by contractual agreement with the union and contractor rights under legislation (Bill 13).
More recently, Western’s approach has been to make operating decisions based on the financial margins generated by Operations.
Forecasts
It is expected that a recalculated target can be maintained in the long term but within a fluctuating range due to the cyclical nature of the forest industry. Other external forces that can have a detrimental effect include labour strikes, extended weather extremes, productivity gains due to technological advancements and unforeseen land-base reductions.
Details/ Data Set
The record of FTE on the DFA is as follows:
Year # FTE Variance from target Comments
2000 663 0 Baseline
2001 482 -181 No
2002 651 -12 Variance met
2003 573 -14 Variance met
2004 758 +95 Target met
2005 543 -120 No
2006 663 0 Target met
2007 608 -55 Variance met
2008 579 -84 No
2009 420 -243 No
2010 573 -90 No
2011 631 -32 Variance met
2012 679 +16 Target met
Since the baseline level was set in 2000, the target has been met or exceeded three times, the variance has been met four times and the target has been missed five times.
HARD COPIES OF THIS DOCUMENT ARE UNCONTROLLED. The current version is available on the Western intranet site. Page 116 of 160
Monitoring
The Full-Time Employees (FTE) number is calculated based on the data on exposure hours collected by Operations for safety statistics. Normally, the Operations Administrator is responsible to collect this information.
One FTE is equal to one employee working 8 hours per day for 180 days (= 1,440 hours per year).
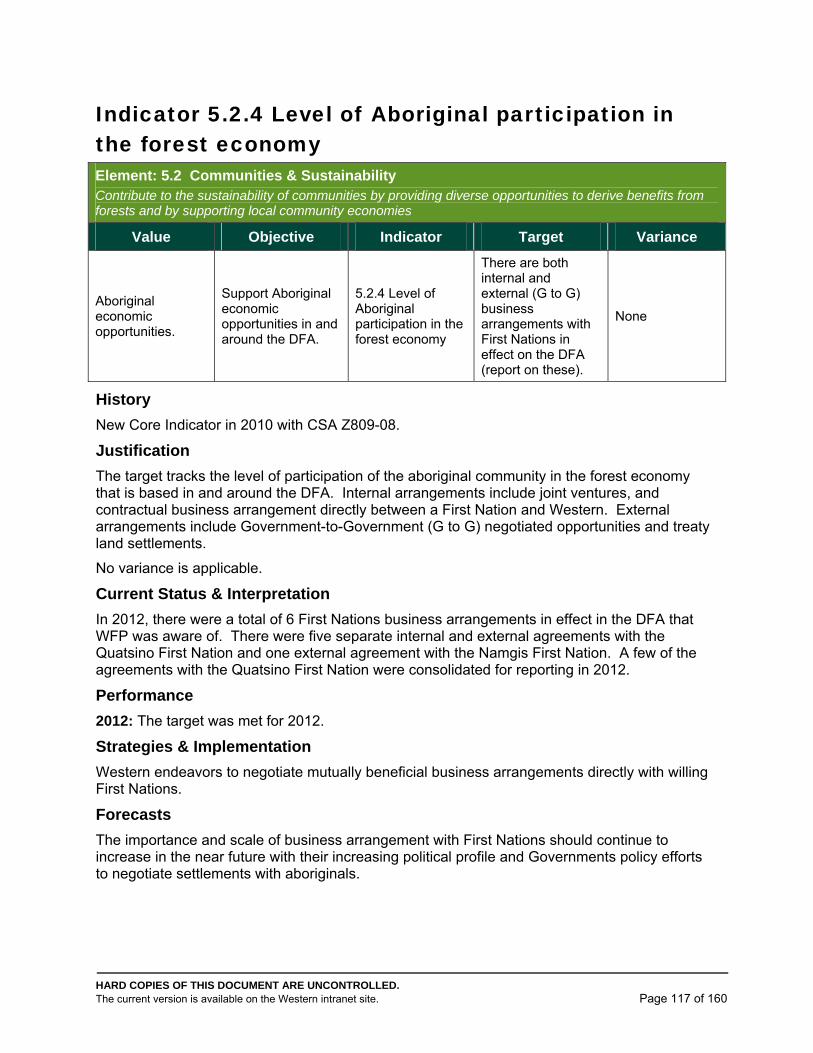
HARD COPIES OF THIS DOCUMENT ARE UNCONTROLLED. The current version is available on the Western intranet site. Page 117 of 160
Indicator 5.2.4 Level of Aboriginal participation in the forest economy Element: 5.2 Communities & Sustainability Contribute to the sustainability of communities by providing diverse opportunities to derive benefits from forests and by supporting local community economies
Value Objective Indicator Target Variance
Aboriginal economic opportunities.
Support Aboriginal economic opportunities in and around the DFA.
5.2.4 Level of Aboriginal participation in the forest economy
There are both internal and external (G to G) business arrangements with First Nations in effect on the DFA (report on these).
None
History
New Core Indicator in 2010 with CSA Z809-08.
Justification
The target tracks the level of participation of the aboriginal community in the forest economy that is based in and around the DFA. Internal arrangements include joint ventures, and contractual business arrangement directly between a First Nation and Western. External arrangements include Government-to-Government (G to G) negotiated opportunities and treaty land settlements.
No variance is applicable.
Current Status & Interpretation
In 2012, there were a total of 6 First Nations business arrangements in effect in the DFA that WFP was aware of. There were five separate internal and external agreements with the Quatsino First Nation and one external agreement with the Namgis First Nation. A few of the agreements with the Quatsino First Nation were consolidated for reporting in 2012.
Performance
2012: The target was met for 2012.
Strategies & Implementation
Western endeavors to negotiate mutually beneficial business arrangements directly with willing First Nations.
Forecasts
The importance and scale of business arrangement with First Nations should continue to increase in the near future with their increasing political profile and Governments policy efforts to negotiate settlements with aboriginals.
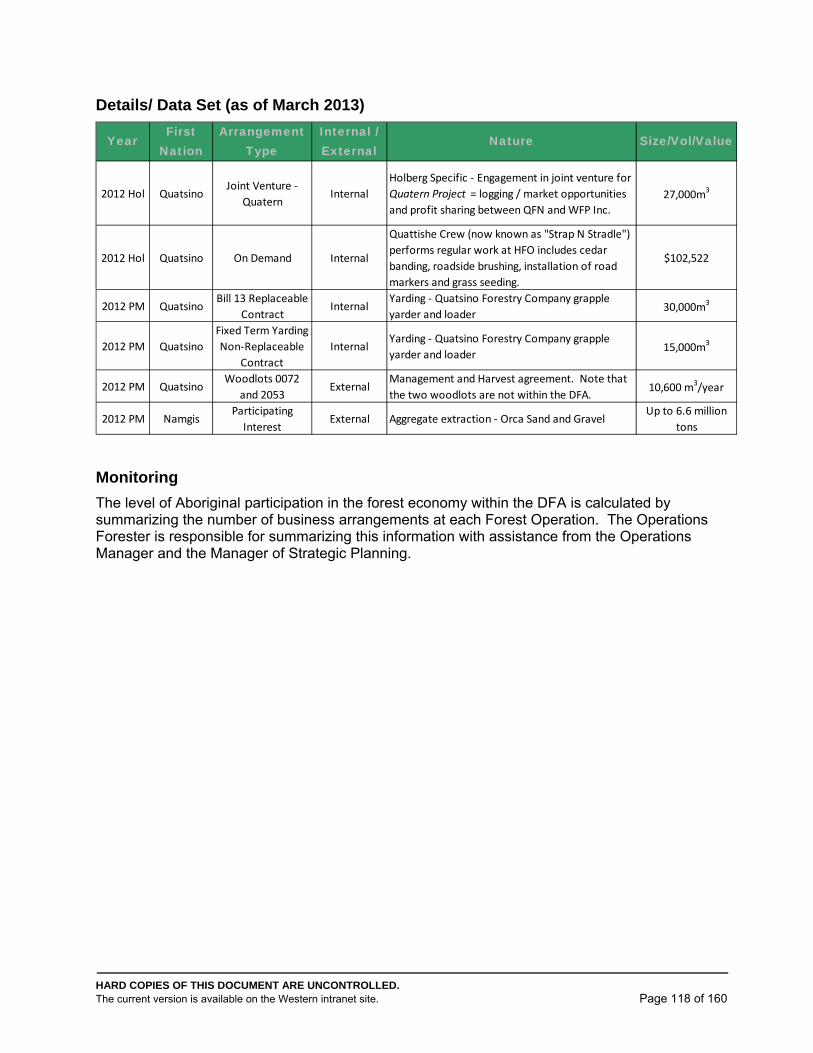
HARD COPIES OF THIS DOCUMENT ARE UNCONTROLLED. The current version is available on the Western intranet site. Page 118 of 160
Details/ Data Set (as of March 2013)
Monitoring
The level of Aboriginal participation in the forest economy within the DFA is calculated by summarizing the number of business arrangements at each Forest Operation. The Operations Forester is responsible for summarizing this information with assistance from the Operations Manager and the Manager of Strategic Planning.
YearFirst
NationArrangement
TypeInternal / External
Nature Size/Vol/Value
2012 Hol QuatsinoJoint Venture ‐
QuaternInternal
Holberg Specific ‐ Engagement in joint venture for
Quatern Project = logging / market opportunities
and profit sharing between QFN and WFP Inc.
27,000m3
2012 Hol Quatsino On Demand Internal
Quattishe Crew (now known as "Strap N Stradle")
performs regular work at HFO includes cedar
banding, roadside brushing, installation of road
markers and grass seeding.
$102,522
2012 PM QuatsinoBill 13 Replaceable
ContractInternal
Yarding ‐ Quatsino Forestry Company grapple
yarder and loader30,000m3
2012 PM Quatsino
Fixed Term Yarding
Non‐Replaceable
Contract
InternalYarding ‐ Quatsino Forestry Company grapple
yarder and loader15,000m3
2012 PM QuatsinoWoodlots 0072
and 2053External
Management and Harvest agreement. Note that
the two woodlots are not within the DFA.10,600 m3/year
2012 PM NamgisParticipating
Interest External Aggregate extraction ‐ Orca Sand and Gravel
Up to 6.6 million
tons
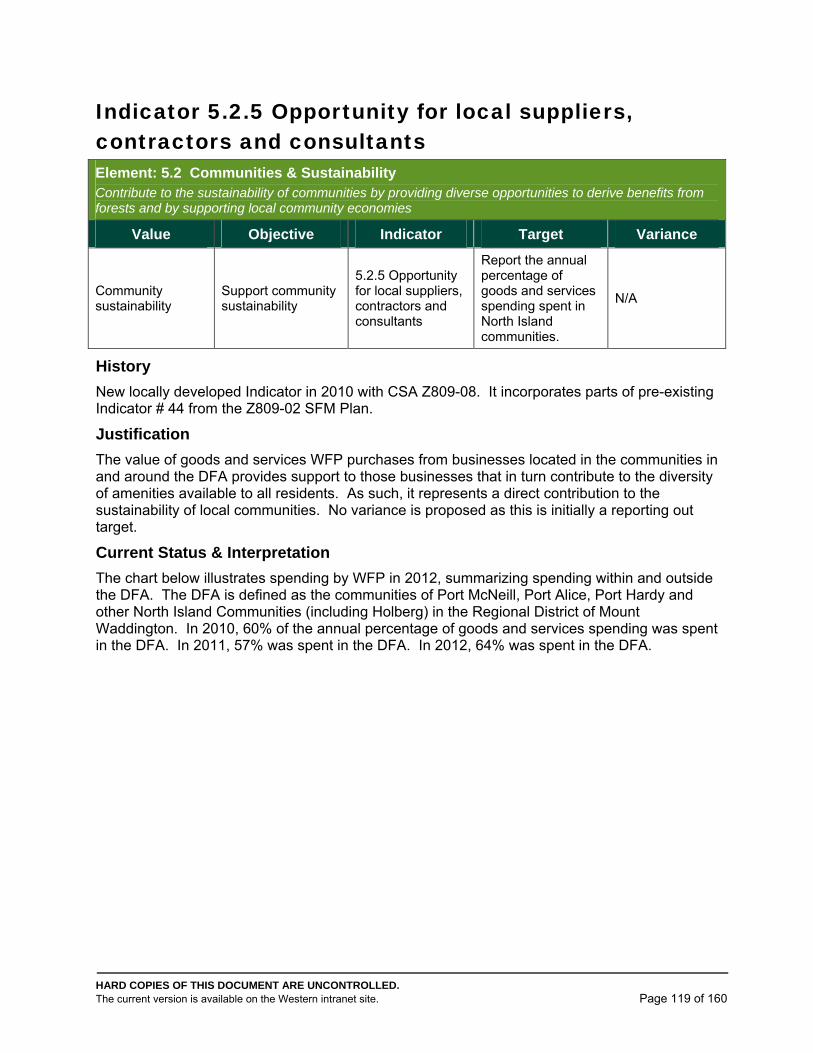
HARD COPIES OF THIS DOCUMENT ARE UNCONTROLLED. The current version is available on the Western intranet site. Page 119 of 160
Indicator 5.2.5 Opportunity for local suppliers, contractors and consultants Element: 5.2 Communities & Sustainability Contribute to the sustainability of communities by providing diverse opportunities to derive benefits from forests and by supporting local community economies
Value Objective Indicator Target Variance
Community sustainability
Support community sustainability
5.2.5 Opportunity for local suppliers, contractors and consultants
Report the annual percentage of goods and services spending spent in North Island communities.
N/A
History
New locally developed Indicator in 2010 with CSA Z809-08. It incorporates parts of pre-existing Indicator # 44 from the Z809-02 SFM Plan.
Justification
The value of goods and services WFP purchases from businesses located in the communities in and around the DFA provides support to those businesses that in turn contribute to the diversity of amenities available to all residents. As such, it represents a direct contribution to the sustainability of local communities. No variance is proposed as this is initially a reporting out target.
Current Status & Interpretation
The chart below illustrates spending by WFP in 2012, summarizing spending within and outside the DFA. The DFA is defined as the communities of Port McNeill, Port Alice, Port Hardy and other North Island Communities (including Holberg) in the Regional District of Mount Waddington. In 2010, 60% of the annual percentage of goods and services spending was spent in the DFA. In 2011, 57% was spent in the DFA. In 2012, 64% was spent in the DFA.
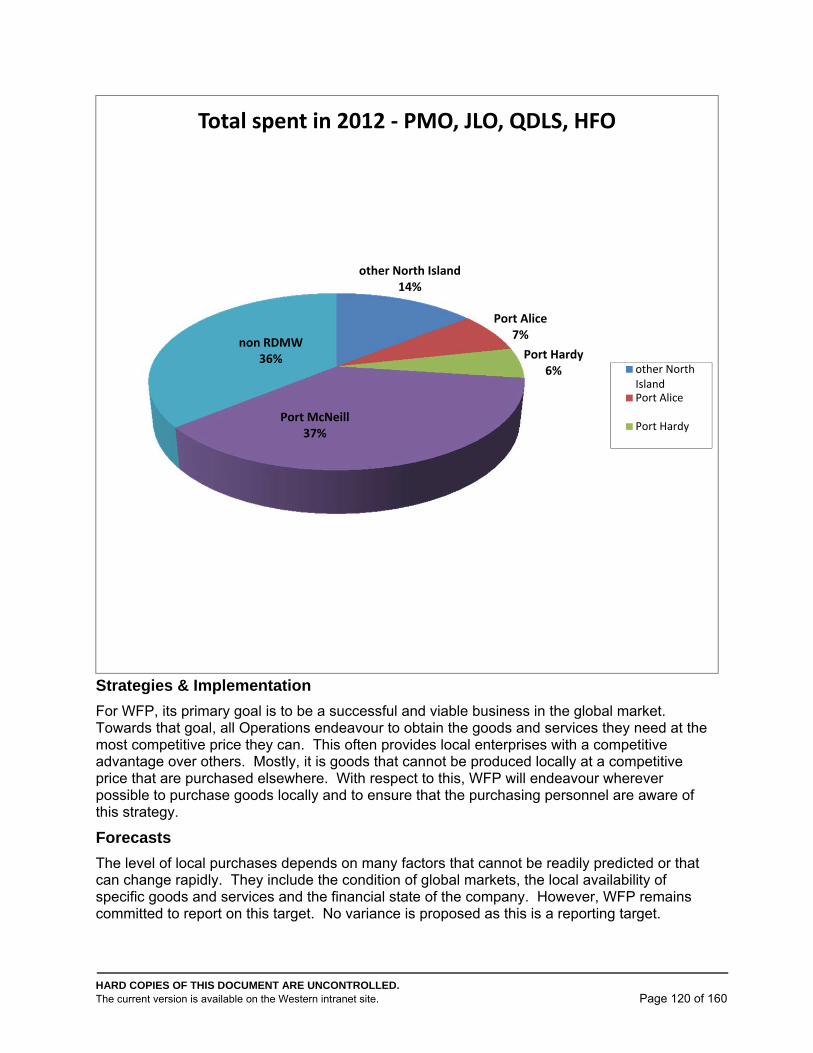
HARD COPIES OF THIS DOCUMENT ARE UNCONTROLLED. The current version is available on the Western intranet site. Page 120 of 160
Strategies & Implementation
For WFP, its primary goal is to be a successful and viable business in the global market. Towards that goal, all Operations endeavour to obtain the goods and services they need at the most competitive price they can. This often provides local enterprises with a competitive advantage over others. Mostly, it is goods that cannot be produced locally at a competitive price that are purchased elsewhere. With respect to this, WFP will endeavour wherever possible to purchase goods locally and to ensure that the purchasing personnel are aware of this strategy.
Forecasts
The level of local purchases depends on many factors that cannot be readily predicted or that can change rapidly. They include the condition of global markets, the local availability of specific goods and services and the financial state of the company. However, WFP remains committed to report on this target. No variance is proposed as this is a reporting target.
other North Island14%
Port Alice7%
Port Hardy6%
Port McNeill37%
non RDMW36%
Total spent in 2012 ‐ PMO, JLO, QDLS, HFO
other NorthIslandPort Alice
Port Hardy
HARD COPIES OF THIS DOCUMENT ARE UNCONTROLLED. The current version is available on the Western intranet site. Page 121 of 160
Details / Data Set
The source information is un-audited data from the JDE financial system and is based on the date of invoicing. The amounts used for the analysis include all sales tax (e.g. PST, GST, HST). The distribution is based on the location of the store or dealership the purchases were made from.
Monitoring
The goods and services purchases made by WFP in the NVIR DFA are documented through invoices. The invoices are processed and tracked in the AP-FLO financial system. A summary report provides the base un-audited data for reporting out on the target.
The Operations Forester with assistance from the Accounts Payable Administrative Assistants compiles the data and reports on the indicator performance in the annual SFM Plan report.
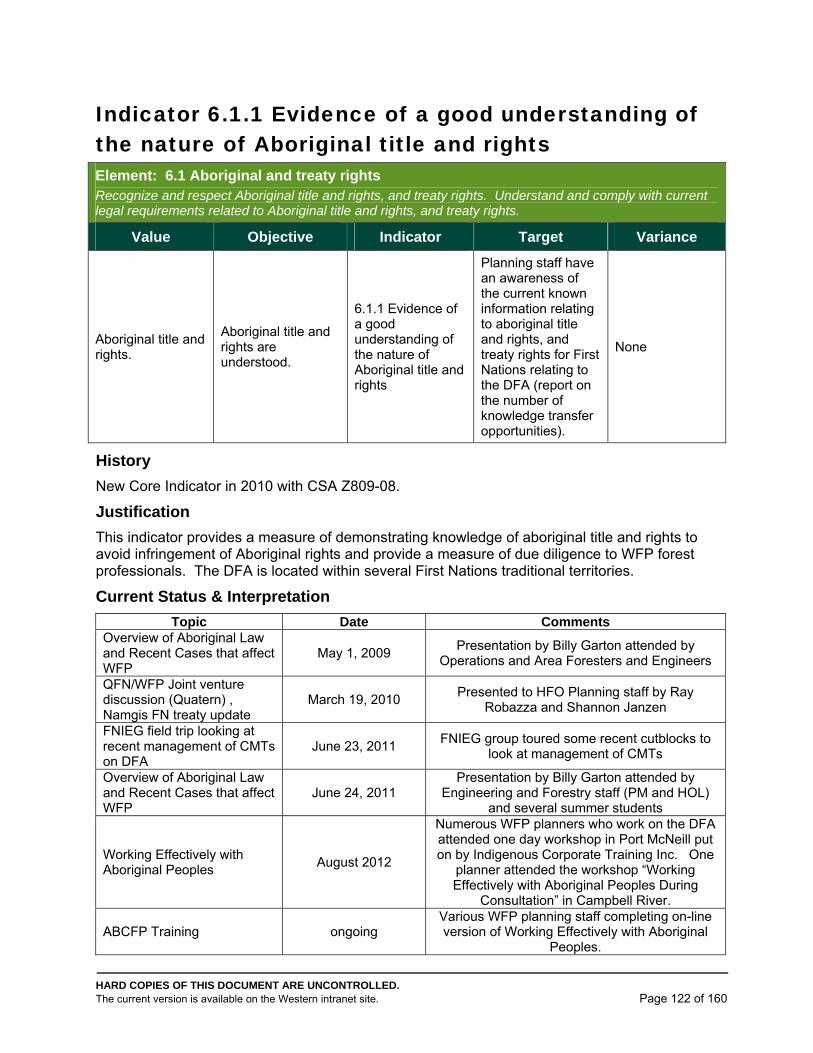
HARD COPIES OF THIS DOCUMENT ARE UNCONTROLLED. The current version is available on the Western intranet site. Page 122 of 160
Indicator 6.1.1 Evidence of a good understanding of the nature of Aboriginal title and rights Element: 6.1 Aboriginal and treaty rights Recognize and respect Aboriginal title and rights, and treaty rights. Understand and comply with current legal requirements related to Aboriginal title and rights, and treaty rights.
Value Objective Indicator Target Variance
Aboriginal title and rights.
Aboriginal title and rights are understood.
6.1.1 Evidence of a good understanding of the nature of Aboriginal title and rights
Planning staff have an awareness of the current known information relating to aboriginal title and rights, and treaty rights for First Nations relating to the DFA (report on the number of knowledge transfer opportunities).
None
History
New Core Indicator in 2010 with CSA Z809-08.
Justification
This indicator provides a measure of demonstrating knowledge of aboriginal title and rights to avoid infringement of Aboriginal rights and provide a measure of due diligence to WFP forest professionals. The DFA is located within several First Nations traditional territories.
Current Status & Interpretation
Topic Date Comments Overview of Aboriginal Law and Recent Cases that affect WFP
May 1, 2009 Presentation by Billy Garton attended by
Operations and Area Foresters and Engineers
QFN/WFP Joint venture discussion (Quatern) , Namgis FN treaty update
March 19, 2010 Presented to HFO Planning staff by Ray
Robazza and Shannon Janzen
FNIEG field trip looking at recent management of CMTs on DFA
June 23, 2011 FNIEG group toured some recent cutblocks to
look at management of CMTs
Overview of Aboriginal Law and Recent Cases that affect WFP
June 24, 2011 Presentation by Billy Garton attended by
Engineering and Forestry staff (PM and HOL) and several summer students
Working Effectively with Aboriginal Peoples
August 2012
Numerous WFP planners who work on the DFA attended one day workshop in Port McNeill put on by Indigenous Corporate Training Inc. One
planner attended the workshop “Working Effectively with Aboriginal Peoples During
Consultation” in Campbell River.
ABCFP Training ongoing Various WFP planning staff completing on-line version of Working Effectively with Aboriginal
Peoples.

HARD COPIES OF THIS DOCUMENT ARE UNCONTROLLED. The current version is available on the Western intranet site. Page 123 of 160
Performance
2012: The target was met in 2012. In August 2012, numerous WFP planners attended a one day "Working Effectively with Aboriginal Peoples" training workshop and one planner attended a one day "Working Effectively with Aboriginal Peoples During Consultation" training workshop. Both workshops were put on by Indigenous Corporate Training Inc.
Strategies & Implementation
Adequate training and awareness is essential for all forest planners planning and conducting activities within First Nation’s traditional territories. There are several methods of providing training and awareness. Formal training may be conducted. Workshops and meetings may be held. Individuals may also pursue their own information sources. Collectively, these methods, if employed, will raise an individual’s knowledge base regarding aboriginal title and rights. It is important that Operation Foresters and Operations Engineers clearly state this training and awareness expectation within their planning departments. Planners that have not received adequate training and awareness should be limited in their involvement with decision making regarding aboriginal title and rights, as it would not be within their scope of practice.
Forecast
Continue to facilitate training and awareness with regards to aboriginal title and rights. This is a dynamic issue that can be affected by changed legislation and evolving case law. Training and awareness must keep pace and thus this indicator is not forecasted to change.
Details/ Data Set
A tracking spreadsheet will be maintained that will document training and other methods of raising awareness.
Monitoring
Operations Foresters and Operations Engineers will be responsible for updating the tracking spreadsheet. Operations Administrators will provide training documentation Information will be compiled annual and incorporated within the SFM Plan Annual Report.
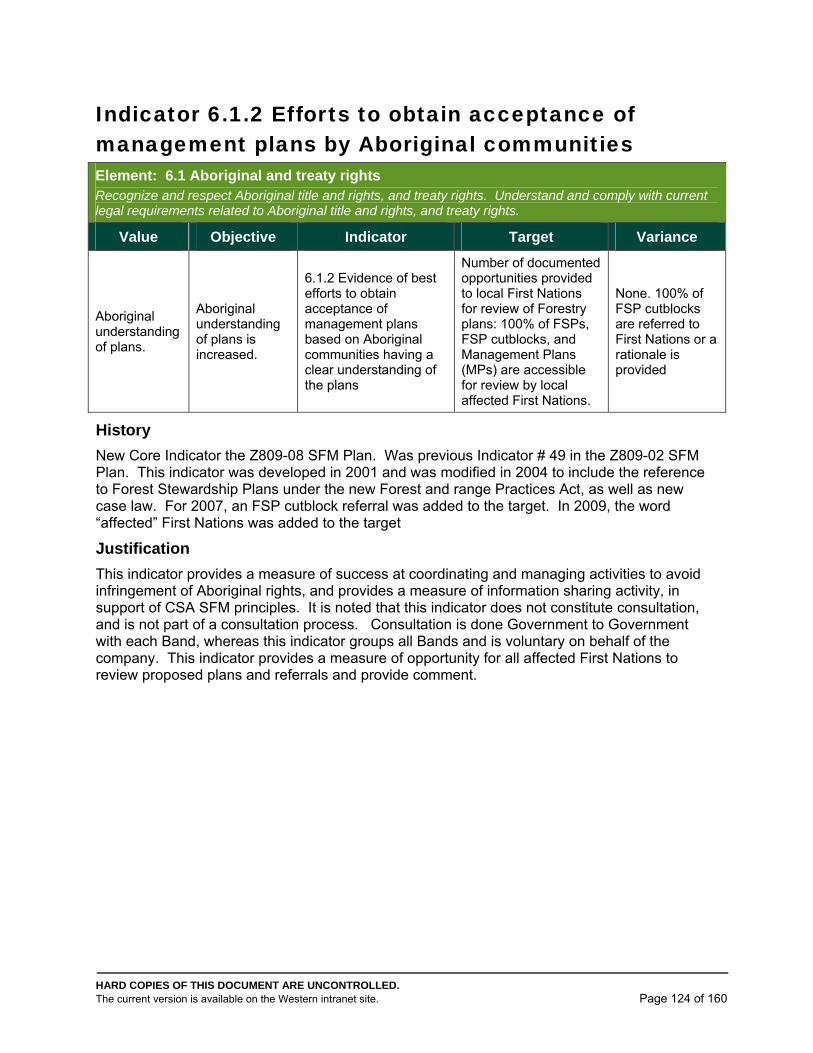
HARD COPIES OF THIS DOCUMENT ARE UNCONTROLLED. The current version is available on the Western intranet site. Page 124 of 160
Indicator 6.1.2 Efforts to obtain acceptance of management plans by Aboriginal communities Element: 6.1 Aboriginal and treaty rights Recognize and respect Aboriginal title and rights, and treaty rights. Understand and comply with current legal requirements related to Aboriginal title and rights, and treaty rights.
Value Objective Indicator Target Variance
Aboriginal understanding of plans.
Aboriginal understanding of plans is increased.
6.1.2 Evidence of best efforts to obtain acceptance of management plans based on Aboriginal communities having a clear understanding of the plans
Number of documented opportunities provided to local First Nations for review of Forestry plans: 100% of FSPs, FSP cutblocks, and Management Plans (MPs) are accessible for review by local affected First Nations.
None. 100% of FSP cutblocks are referred to First Nations or a rationale is provided
History
New Core Indicator the Z809-08 SFM Plan. Was previous Indicator # 49 in the Z809-02 SFM Plan. This indicator was developed in 2001 and was modified in 2004 to include the reference to Forest Stewardship Plans under the new Forest and range Practices Act, as well as new case law. For 2007, an FSP cutblock referral was added to the target. In 2009, the word “affected” First Nations was added to the target
Justification
This indicator provides a measure of success at coordinating and managing activities to avoid infringement of Aboriginal rights, and provides a measure of information sharing activity, in support of CSA SFM principles. It is noted that this indicator does not constitute consultation, and is not part of a consultation process. Consultation is done Government to Government with each Band, whereas this indicator groups all Bands and is voluntary on behalf of the company. This indicator provides a measure of opportunity for all affected First Nations to review proposed plans and referrals and provide comment.
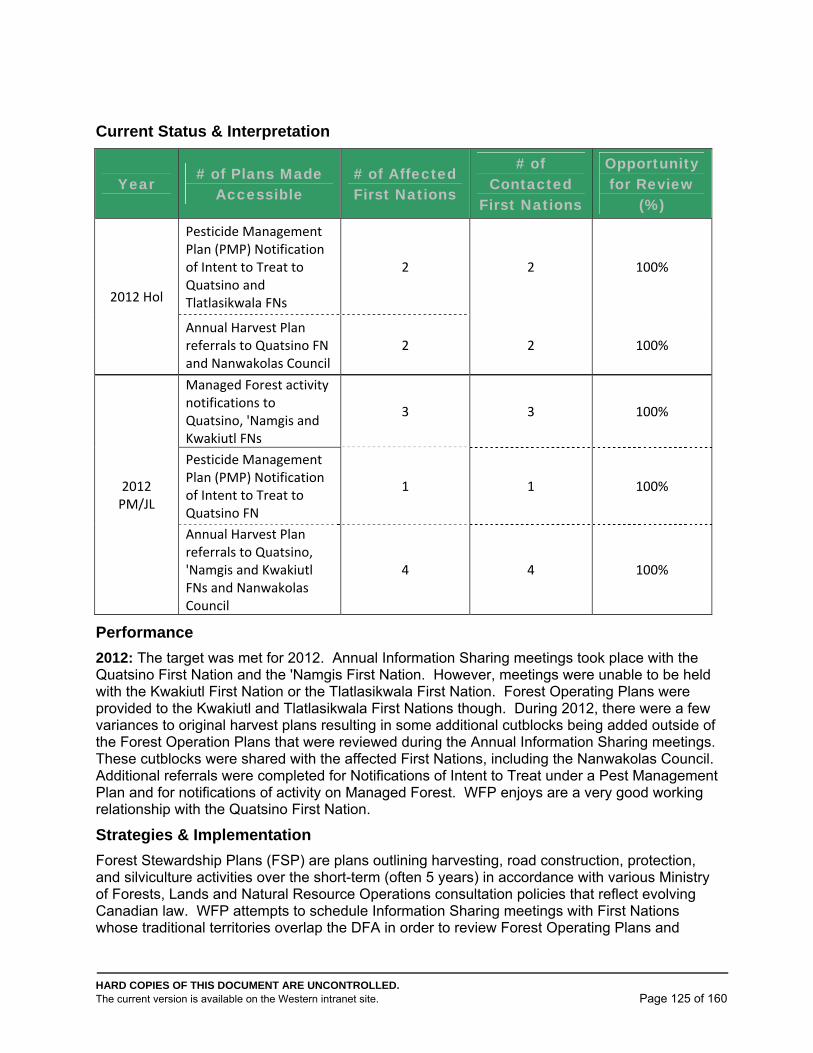
HARD COPIES OF THIS DOCUMENT ARE UNCONTROLLED. The current version is available on the Western intranet site. Page 125 of 160
Current Status & Interpretation
Year # of Plans Made
Accessible # of Affected First Nations
# of Contacted
First Nations
Opportunity for Review
(%)
2012 Hol
Pesticide Management Plan (PMP) Notification of Intent to Treat to Quatsino and Tlatlasikwala FNs
2 2 100%
Annual Harvest Plan referrals to Quatsino FN and Nanwakolas Council
2 2 100%
2012 PM/JL
Managed Forest activity notifications to Quatsino, 'Namgis and Kwakiutl FNs
3 3 100%
Pesticide Management Plan (PMP) Notification of Intent to Treat to Quatsino FN
1 1 100%
Annual Harvest Plan referrals to Quatsino, 'Namgis and Kwakiutl FNs and Nanwakolas Council
4 4 100%
Performance
2012: The target was met for 2012. Annual Information Sharing meetings took place with the Quatsino First Nation and the 'Namgis First Nation. However, meetings were unable to be held with the Kwakiutl First Nation or the Tlatlasikwala First Nation. Forest Operating Plans were provided to the Kwakiutl and Tlatlasikwala First Nations though. During 2012, there were a few variances to original harvest plans resulting in some additional cutblocks being added outside of the Forest Operation Plans that were reviewed during the Annual Information Sharing meetings. These cutblocks were shared with the affected First Nations, including the Nanwakolas Council. Additional referrals were completed for Notifications of Intent to Treat under a Pest Management Plan and for notifications of activity on Managed Forest. WFP enjoys are a very good working relationship with the Quatsino First Nation.
Strategies & Implementation
Forest Stewardship Plans (FSP) are plans outlining harvesting, road construction, protection, and silviculture activities over the short-term (often 5 years) in accordance with various Ministry of Forests, Lands and Natural Resource Operations consultation policies that reflect evolving Canadian law. WFP attempts to schedule Information Sharing meetings with First Nations whose traditional territories overlap the DFA in order to review Forest Operating Plans and
HARD COPIES OF THIS DOCUMENT ARE UNCONTROLLED. The current version is available on the Western intranet site. Page 126 of 160
answer any questions about forest management activities. Forest Operating Plans are still provided to First Nations in situations where meetings are unable to be arranged.
Forecasts
Information sharing is currently conducted with First Nations where activities are proposed within their traditional territory. There is no expected change to this indicator and target. The District Manager from the Ministry of Forests, Lands and Natural Resource Operation has previously provided guidance to forest licensees including WFP regarding their role in information gathering and assessment in the form of a letter dated January 23rd, 2007. The level of engagement with First Nations whose traditional territories overlap the DFA is expected to continue into the future as individual nations enhance their capacity and understanding in natural resource management.
Details/ Data Set
This indicator is determined by tallying the number of FDPs, FSPs and Management Plans made accessible to local First Nations for review during the reporting year. Measured as a percentage, the indicator is determined by dividing the number of First Nations affected by the number of First Nations contacted, for each plan. The Operations Foresters are responsible for compiling and reporting the results in the SFM Plan Annual Report.
Monitoring
The Operations Forester compiles the data and reports on the indicator performance in the SFM Plan Annual Report.
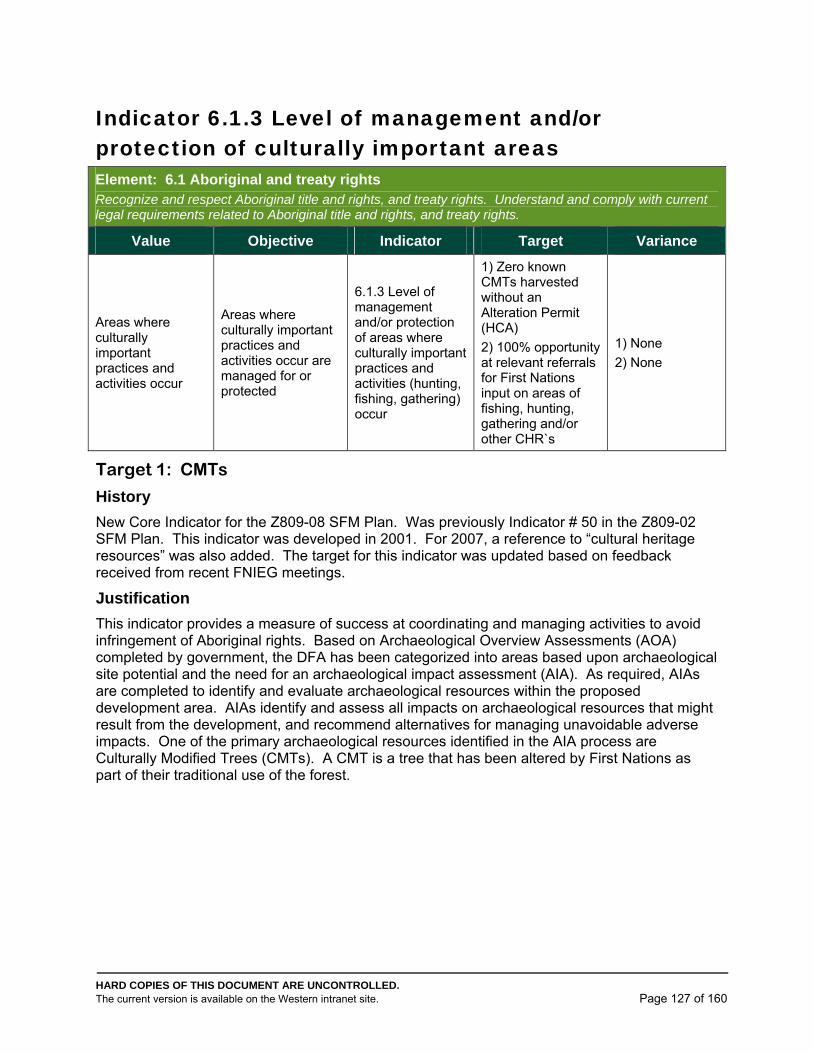
HARD COPIES OF THIS DOCUMENT ARE UNCONTROLLED. The current version is available on the Western intranet site. Page 127 of 160
Indicator 6.1.3 Level of management and/or protection of culturally important areas Element: 6.1 Aboriginal and treaty rights Recognize and respect Aboriginal title and rights, and treaty rights. Understand and comply with current legal requirements related to Aboriginal title and rights, and treaty rights.
Value Objective Indicator Target Variance
Areas where culturally important practices and activities occur
Areas where culturally important practices and activities occur are managed for or protected
6.1.3 Level of management and/or protection of areas where culturally important practices and activities (hunting, fishing, gathering) occur
1) Zero known CMTs harvested without an Alteration Permit (HCA)
2) 100% opportunity at relevant referrals for First Nations input on areas of fishing, hunting, gathering and/or other CHR`s
1) None
2) None
Target 1: CMTs
History
New Core Indicator for the Z809-08 SFM Plan. Was previously Indicator # 50 in the Z809-02 SFM Plan. This indicator was developed in 2001. For 2007, a reference to “cultural heritage resources” was also added. The target for this indicator was updated based on feedback received from recent FNIEG meetings.
Justification
This indicator provides a measure of success at coordinating and managing activities to avoid infringement of Aboriginal rights. Based on Archaeological Overview Assessments (AOA) completed by government, the DFA has been categorized into areas based upon archaeological site potential and the need for an archaeological impact assessment (AIA). As required, AIAs are completed to identify and evaluate archaeological resources within the proposed development area. AIAs identify and assess all impacts on archaeological resources that might result from the development, and recommend alternatives for managing unavoidable adverse impacts. One of the primary archaeological resources identified in the AIA process are Culturally Modified Trees (CMTs). A CMT is a tree that has been altered by First Nations as part of their traditional use of the forest.
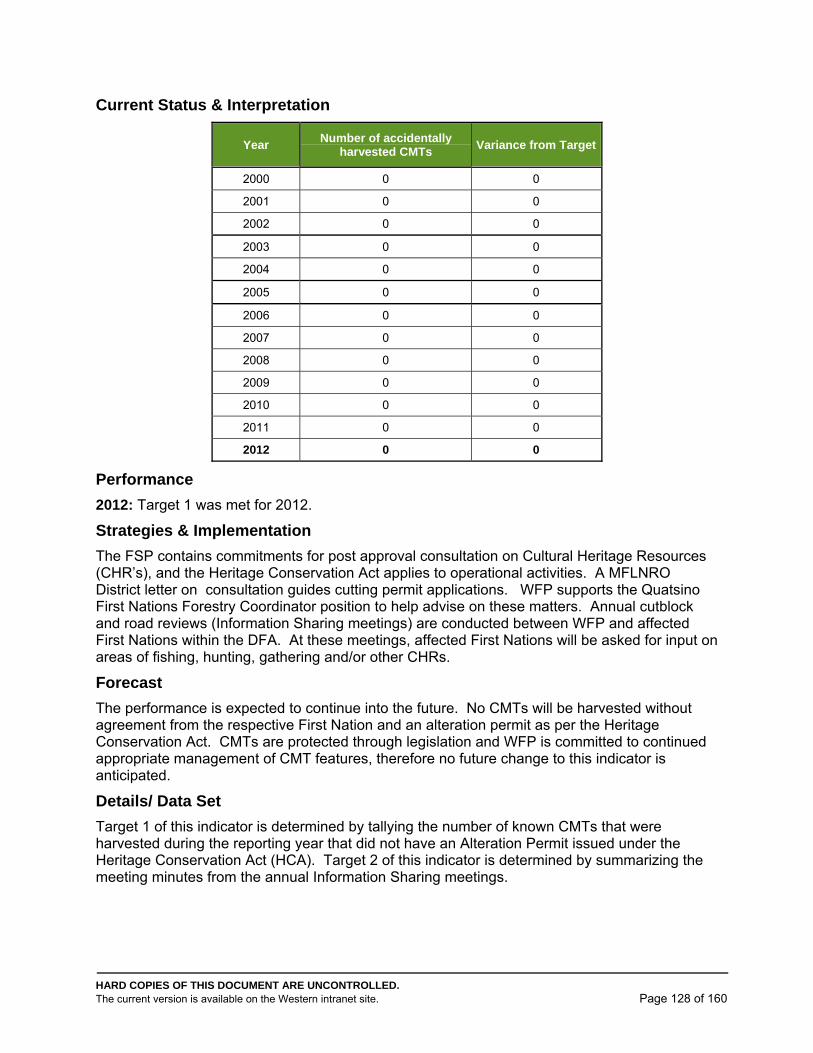
HARD COPIES OF THIS DOCUMENT ARE UNCONTROLLED. The current version is available on the Western intranet site. Page 128 of 160
Current Status & Interpretation
Year Number of accidentally
harvested CMTs Variance from Target
2000 0 0
2001 0 0
2002 0 0
2003 0 0
2004 0 0
2005 0 0
2006 0 0
2007 0 0
2008 0 0
2009 0 0
2010 0 0
2011 0 0
2012 0 0
Performance
2012: Target 1 was met for 2012.
Strategies & Implementation
The FSP contains commitments for post approval consultation on Cultural Heritage Resources (CHR’s), and the Heritage Conservation Act applies to operational activities. A MFLNRO District letter on consultation guides cutting permit applications. WFP supports the Quatsino First Nations Forestry Coordinator position to help advise on these matters. Annual cutblock and road reviews (Information Sharing meetings) are conducted between WFP and affected First Nations within the DFA. At these meetings, affected First Nations will be asked for input on areas of fishing, hunting, gathering and/or other CHRs.
Forecast
The performance is expected to continue into the future. No CMTs will be harvested without agreement from the respective First Nation and an alteration permit as per the Heritage Conservation Act. CMTs are protected through legislation and WFP is committed to continued appropriate management of CMT features, therefore no future change to this indicator is anticipated.
Details/ Data Set
Target 1 of this indicator is determined by tallying the number of known CMTs that were harvested during the reporting year that did not have an Alteration Permit issued under the Heritage Conservation Act (HCA). Target 2 of this indicator is determined by summarizing the meeting minutes from the annual Information Sharing meetings.
HARD COPIES OF THIS DOCUMENT ARE UNCONTROLLED. The current version is available on the Western intranet site. Page 129 of 160
Monitoring
The Operations Foresters will report on the number of known CMTs harvested without an Alternation Permit issued under the HCA and also on the results on Annual Information Sharing meetings in the SFM Plan Annual Report.
Target 2: Opportunity for First Nations input
Previously this target was reported under Criterion 6, Indicator 6.1.2. During the October 2012 Internal Audit, it was pointed out that target #2 for Indicator 6.1.2 was different from that for Indicator 6.1.3. Revision of target #2 for Indicator 6.1.3 was discussed with the First Nations Information Exchange Group (FNIEG) at the February 2013 meeting; suggestions were to modify the target for Indicator 1.4.2 to better address this. This will be looked at during 2013 and reported on in the 2013 Annual Report.
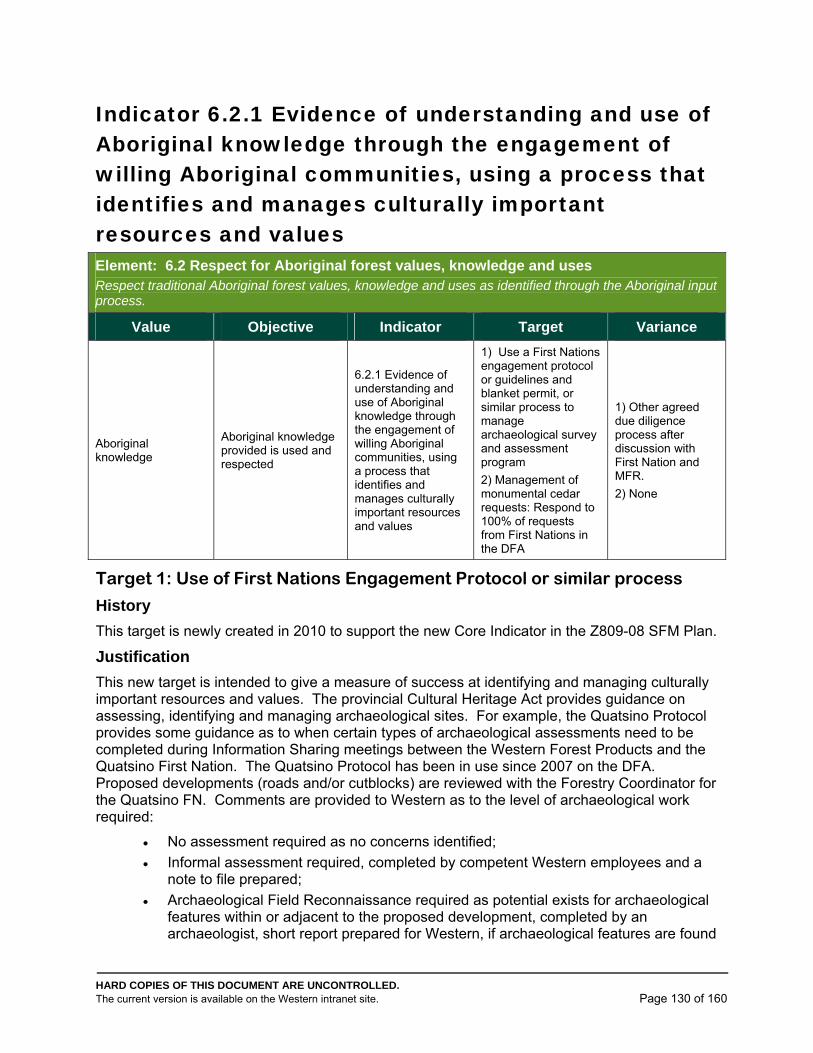
HARD COPIES OF THIS DOCUMENT ARE UNCONTROLLED. The current version is available on the Western intranet site. Page 130 of 160
Indicator 6.2.1 Evidence of understanding and use of Aboriginal knowledge through the engagement of willing Aboriginal communities, using a process that identifies and manages culturally important resources and values Element: 6.2 Respect for Aboriginal forest values, knowledge and uses Respect traditional Aboriginal forest values, knowledge and uses as identified through the Aboriginal input process.
Value Objective Indicator Target Variance
Aboriginal knowledge
Aboriginal knowledge provided is used and respected
6.2.1 Evidence of understanding and use of Aboriginal knowledge through the engagement of willing Aboriginal communities, using a process that identifies and manages culturally important resources and values
1) Use a First Nations engagement protocol or guidelines and blanket permit, or similar process to manage archaeological survey and assessment program
2) Management of monumental cedar requests: Respond to 100% of requests from First Nations in the DFA
1) Other agreed due diligence process after discussion with First Nation and MFR.
2) None
Target 1: Use of First Nations Engagement Protocol or similar process
History
This target is newly created in 2010 to support the new Core Indicator in the Z809-08 SFM Plan.
Justification
This new target is intended to give a measure of success at identifying and managing culturally important resources and values. The provincial Cultural Heritage Act provides guidance on assessing, identifying and managing archaeological sites. For example, the Quatsino Protocol provides some guidance as to when certain types of archaeological assessments need to be completed during Information Sharing meetings between the Western Forest Products and the Quatsino First Nation. The Quatsino Protocol has been in use since 2007 on the DFA. Proposed developments (roads and/or cutblocks) are reviewed with the Forestry Coordinator for the Quatsino FN. Comments are provided to Western as to the level of archaeological work required:
No assessment required as no concerns identified;
Informal assessment required, completed by competent Western employees and a note to file prepared;
Archaeological Field Reconnaissance required as potential exists for archaeological features within or adjacent to the proposed development, completed by an archaeologist, short report prepared for Western, if archaeological features are found
HARD COPIES OF THIS DOCUMENT ARE UNCONTROLLED. The current version is available on the Western intranet site. Page 131 of 160
the Reconnaissance turns into an Archaeological Impact Assessment;
Archaeological Impact Assessment (AIA) required as archaeological features known to exist or have a high potential to exist within or adjacent to the proposed development, completed by an archaeologist, Archaeological Impact Assessment report prepared with copies to the Provincial Archaeology Branch, Western and the Quatsino First Nation.
Current Status & Interpretation
There is a current, signed protocol agreement between WFP and the Quatsino First Nation. The protocol provides terms of reference and guidance on Archaeological assessments (Archaeological Impact Assessments, Archaeological Overview Assessments etc.) in Quatsino traditional territory.
This protocol also provides a basis for other First Nations that do not have protocols.
Performance
2012: The variance was achieved in 2012. Only one WFP-First Nation protocol is in place within the DFA (Quatsino Protocol, in place prior to the current SFM Plan); annual meetings are held with the Quatsino First Nation. Annual meetings held with another First Nation. Another First Nation is represented by the Nanwakolas Council Society, however there were no forest developments scheduled in their traditional territory so a meeting was not required. No meetings were held with 2 other First Nations (offers of meetings refused). Forest Operating Plans were still provided to these First Nations. Archaeological surveys follow guidelines from the provincial Archaeology Branch (part of the Ministry of Forests, Lands and Natural Resource Operations).
Strategies & Implementation
The Quatsino Protocol was developed by the Quatsino First Nation in conjunction with WFP and the Ministry of Forests, Lands and Natural Resource Operations (MFLNRO). Other First Nations have utilized the protocol. WFP also retains an archaeologist to apply for an Archaeological Inspection Permit that contains the procedures used in the case that AIAs are conducted.
Forecast
The current protocol clearly outlines the process to be followed with regards to archaeological assessments. To date, the protocol has been effective. Amendments to the protocol may be implemented in the future, but no alternative method of managing archaeological assessments is anticipated. It is anticipated that more First Nations Engagement Protocols will be signed in the future as First Nations increase their capacity and understanding of natural resource management as well as their involvement.
Details/ Data Set
This target is determined by summarizing and reporting on the different processes used for managing the annual Information Sharing process and the Archaeological Survey and Assessment programs.
Monitoring
The Operations Foresters will report on the processes used for Information Sharing with First Nations within the DFA in the SFM Plan Annual Report.
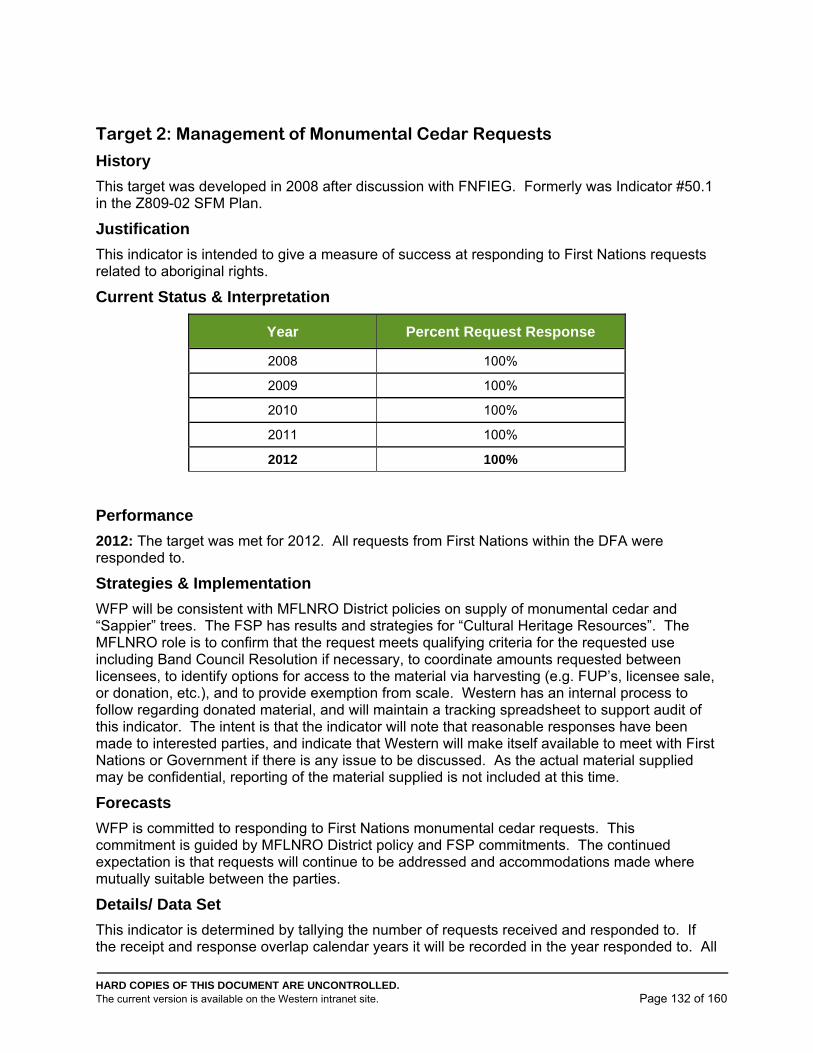
HARD COPIES OF THIS DOCUMENT ARE UNCONTROLLED. The current version is available on the Western intranet site. Page 132 of 160
Target 2: Management of Monumental Cedar Requests
History
This target was developed in 2008 after discussion with FNFIEG. Formerly was Indicator #50.1 in the Z809-02 SFM Plan.
Justification
This indicator is intended to give a measure of success at responding to First Nations requests related to aboriginal rights.
Current Status & Interpretation
Year Percent Request Response
2008 100%
2009 100%
2010 100%
2011 100%
2012 100%
Performance
2012: The target was met for 2012. All requests from First Nations within the DFA were responded to.
Strategies & Implementation
WFP will be consistent with MFLNRO District policies on supply of monumental cedar and “Sappier” trees. The FSP has results and strategies for “Cultural Heritage Resources”. The MFLNRO role is to confirm that the request meets qualifying criteria for the requested use including Band Council Resolution if necessary, to coordinate amounts requested between licensees, to identify options for access to the material via harvesting (e.g. FUP’s, licensee sale, or donation, etc.), and to provide exemption from scale. Western has an internal process to follow regarding donated material, and will maintain a tracking spreadsheet to support audit of this indicator. The intent is that the indicator will note that reasonable responses have been made to interested parties, and indicate that Western will make itself available to meet with First Nations or Government if there is any issue to be discussed. As the actual material supplied may be confidential, reporting of the material supplied is not included at this time.
Forecasts
WFP is committed to responding to First Nations monumental cedar requests. This commitment is guided by MFLNRO District policy and FSP commitments. The continued expectation is that requests will continue to be addressed and accommodations made where mutually suitable between the parties.
Details/ Data Set
This indicator is determined by tallying the number of requests received and responded to. If the receipt and response overlap calendar years it will be recorded in the year responded to. All
HARD COPIES OF THIS DOCUMENT ARE UNCONTROLLED. The current version is available on the Western intranet site. Page 133 of 160
occurrences will be recorded on a tracking spreadsheet. A request may be one or more pieces. A confidential table of responses and their disposition will be maintained.
Monitoring
The Operations Foresters will ensure that data is compiled, and performance reported, in the SFM Plan Annual Report. Data will be tracked and compiled at the Operations level, and summarized at Timberlands level. The Operations Managers and Dryland Sort Managers will maintain data and supply as necessary.
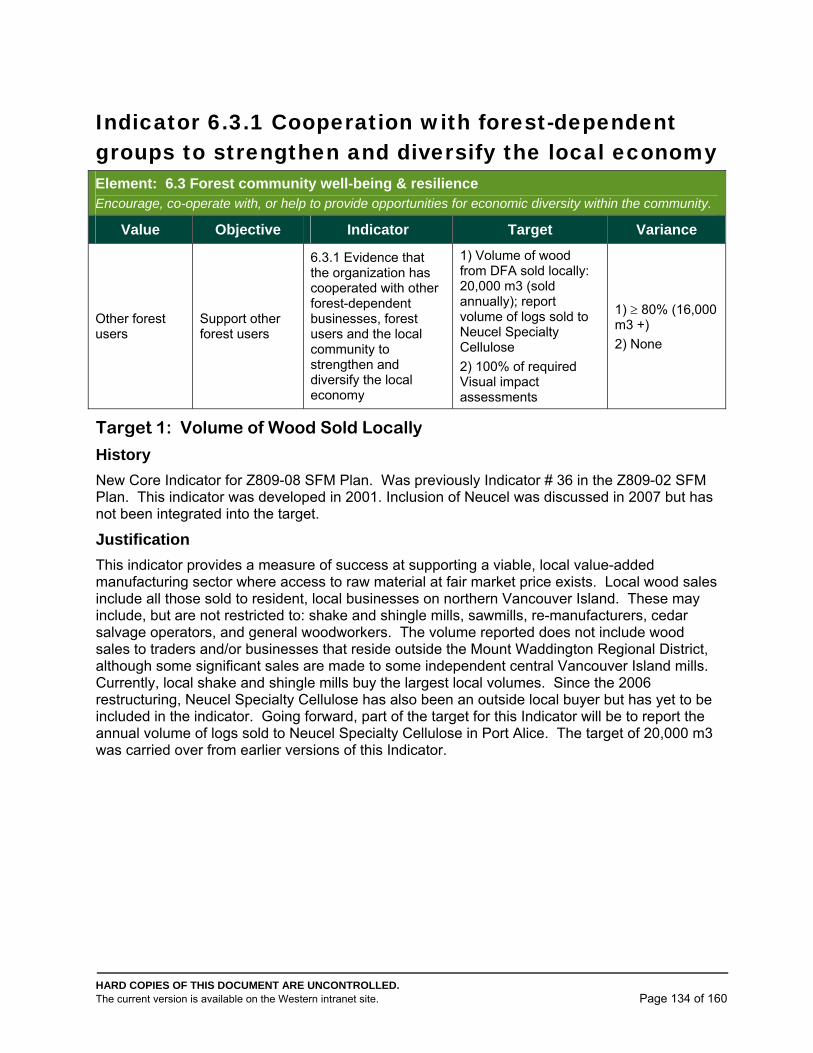
HARD COPIES OF THIS DOCUMENT ARE UNCONTROLLED. The current version is available on the Western intranet site. Page 134 of 160
Indicator 6.3.1 Cooperation with forest-dependent groups to strengthen and diversify the local economy Element: 6.3 Forest community well-being & resilience Encourage, co-operate with, or help to provide opportunities for economic diversity within the community.
Value Objective Indicator Target Variance
Other forest users
Support other forest users
6.3.1 Evidence that the organization has cooperated with other forest-dependent businesses, forest users and the local community to strengthen and diversify the local economy
1) Volume of wood from DFA sold locally: 20,000 m3 (sold annually); report volume of logs sold to Neucel Specialty Cellulose
2) 100% of required Visual impact assessments
1) 80% (16,000 m3 +)
2) None
Target 1: Volume of Wood Sold Locally
History
New Core Indicator for Z809-08 SFM Plan. Was previously Indicator # 36 in the Z809-02 SFM Plan. This indicator was developed in 2001. Inclusion of Neucel was discussed in 2007 but has not been integrated into the target.
Justification
This indicator provides a measure of success at supporting a viable, local value-added manufacturing sector where access to raw material at fair market price exists. Local wood sales include all those sold to resident, local businesses on northern Vancouver Island. These may include, but are not restricted to: shake and shingle mills, sawmills, re-manufacturers, cedar salvage operators, and general woodworkers. The volume reported does not include wood sales to traders and/or businesses that reside outside the Mount Waddington Regional District, although some significant sales are made to some independent central Vancouver Island mills. Currently, local shake and shingle mills buy the largest local volumes. Since the 2006 restructuring, Neucel Specialty Cellulose has also been an outside local buyer but has yet to be included in the indicator. Going forward, part of the target for this Indicator will be to report the annual volume of logs sold to Neucel Specialty Cellulose in Port Alice. The target of 20,000 m3 was carried over from earlier versions of this Indicator.
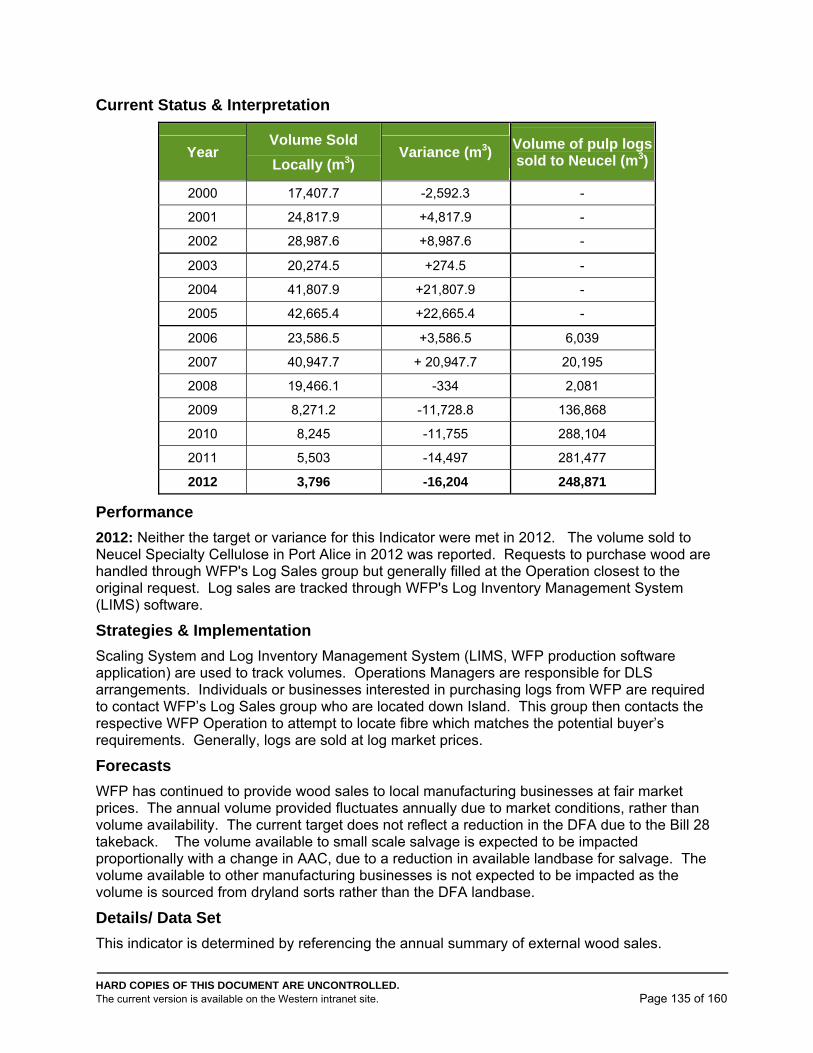
HARD COPIES OF THIS DOCUMENT ARE UNCONTROLLED. The current version is available on the Western intranet site. Page 135 of 160
Current Status & Interpretation
Year Volume Sold
Locally (m3) Variance (m3)
Volume of pulp logs sold to Neucel (m3)
2000 17,407.7 -2,592.3 -
2001 24,817.9 +4,817.9 -
2002 28,987.6 +8,987.6 -
2003 20,274.5 +274.5 -
2004 41,807.9 +21,807.9 -
2005 42,665.4 +22,665.4 -
2006 23,586.5 +3,586.5 6,039
2007 40,947.7 + 20,947.7 20,195
2008 19,466.1 -334 2,081
2009 8,271.2 -11,728.8 136,868
2010 8,245 -11,755 288,104
2011 5,503 -14,497 281,477
2012 3,796 -16,204 248,871
Performance
2012: Neither the target or variance for this Indicator were met in 2012. The volume sold to Neucel Specialty Cellulose in Port Alice in 2012 was reported. Requests to purchase wood are handled through WFP's Log Sales group but generally filled at the Operation closest to the original request. Log sales are tracked through WFP's Log Inventory Management System (LIMS) software.
Strategies & Implementation
Scaling System and Log Inventory Management System (LIMS, WFP production software application) are used to track volumes. Operations Managers are responsible for DLS arrangements. Individuals or businesses interested in purchasing logs from WFP are required to contact WFP’s Log Sales group who are located down Island. This group then contacts the respective WFP Operation to attempt to locate fibre which matches the potential buyer’s requirements. Generally, logs are sold at log market prices.
Forecasts
WFP has continued to provide wood sales to local manufacturing businesses at fair market prices. The annual volume provided fluctuates annually due to market conditions, rather than volume availability. The current target does not reflect a reduction in the DFA due to the Bill 28 takeback. The volume available to small scale salvage is expected to be impacted proportionally with a change in AAC, due to a reduction in available landbase for salvage. The volume available to other manufacturing businesses is not expected to be impacted as the volume is sourced from dryland sorts rather than the DFA landbase.
Details/ Data Set
This indicator is determined by referencing the annual summary of external wood sales.
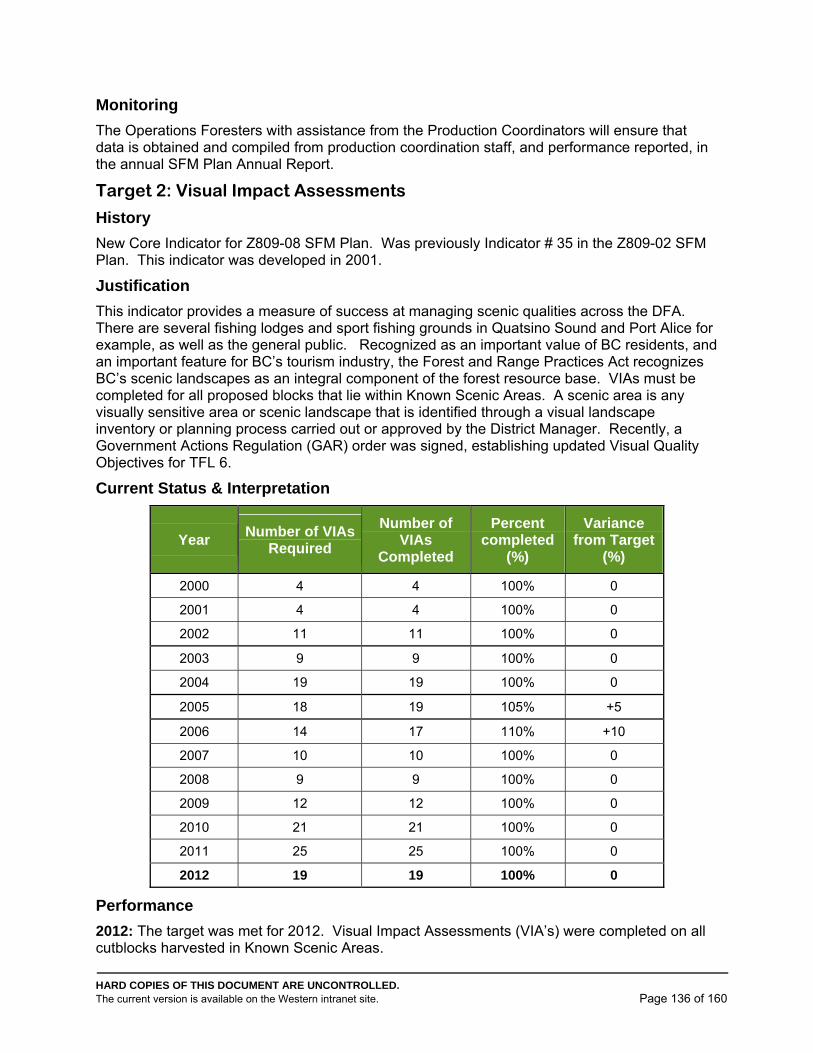
HARD COPIES OF THIS DOCUMENT ARE UNCONTROLLED. The current version is available on the Western intranet site. Page 136 of 160
Monitoring
The Operations Foresters with assistance from the Production Coordinators will ensure that data is obtained and compiled from production coordination staff, and performance reported, in the annual SFM Plan Annual Report.
Target 2: Visual Impact Assessments
History
New Core Indicator for Z809-08 SFM Plan. Was previously Indicator # 35 in the Z809-02 SFM Plan. This indicator was developed in 2001.
Justification
This indicator provides a measure of success at managing scenic qualities across the DFA. There are several fishing lodges and sport fishing grounds in Quatsino Sound and Port Alice for example, as well as the general public. Recognized as an important value of BC residents, and an important feature for BC’s tourism industry, the Forest and Range Practices Act recognizes BC’s scenic landscapes as an integral component of the forest resource base. VIAs must be completed for all proposed blocks that lie within Known Scenic Areas. A scenic area is any visually sensitive area or scenic landscape that is identified through a visual landscape inventory or planning process carried out or approved by the District Manager. Recently, a Government Actions Regulation (GAR) order was signed, establishing updated Visual Quality Objectives for TFL 6.
Current Status & Interpretation
Year Number of VIAs
Required
Number of VIAs
Completed
Percent completed
(%)
Variance from Target
(%)
2000 4 4 100% 0
2001 4 4 100% 0
2002 11 11 100% 0
2003 9 9 100% 0
2004 19 19 100% 0
2005 18 19 105% +5
2006 14 17 110% +10
2007 10 10 100% 0
2008 9 9 100% 0
2009 12 12 100% 0
2010 21 21 100% 0
2011 25 25 100% 0
2012 19 19 100% 0
Performance
2012: The target was met for 2012. Visual Impact Assessments (VIA’s) were completed on all cutblocks harvested in Known Scenic Areas.
HARD COPIES OF THIS DOCUMENT ARE UNCONTROLLED. The current version is available on the Western intranet site. Page 137 of 160
Strategies & Implementation
Forest Stewardship Plan backgrounder, and FRPA Planning checklists for Site Plans. A visual inventory is conducted every 5-10 years in conjunction with Management Plans and Timber Supply Analyses and Western reviews it with the public. Recently, a Government Actions Regulation (GAR) order was signed establishing updated Visual Quality Objectives for TFL 6 that incorporates the recently updated Visual Landscape Inventory for TFL 6 prepared by WFP.
Where visual concerns that are outside the Visual Quality Objectives and Known Scenic Area are brought to Western’s attention, Western considers the concern and responds.
Forecasts
Conduct Visual Impact Assessments (or their equivalent) on all areas to be harvested within the Known Scenic Area to verify that harvest alterations will be consistent with established Visual Quality Objectives. Historically, visual assessments have been completed for planned cutblocks within the Known Scenic Area. Assessments have also been completed in areas outside of the Known Scenic Area, but in the vicinity of locally known travel corridors. Visual Quality Objectives are legally designated through GAR, therefore visual assessments are necessary to ensure that these Visual Quality Objectives will be met and scenic values will be maintained for the public.
Details/ Data Set
This indicator is determined by dividing the number of VIAs completed by the number of VIAs required. VIAs (or their equivalent) are considered to be required for those cutblocks located within the Known Scenic Area. Cutblocks to be included in the reporting are those that have harvesting completed during the reporting year.
Monitoring
The Operations Foresters and Operations Engineers are responsible for ensuring that VIAs are completed where required and are responsible for compiling annual data. Post harvest monitoring may be carried out to assess cutblock design and the effectiveness of a VIA.
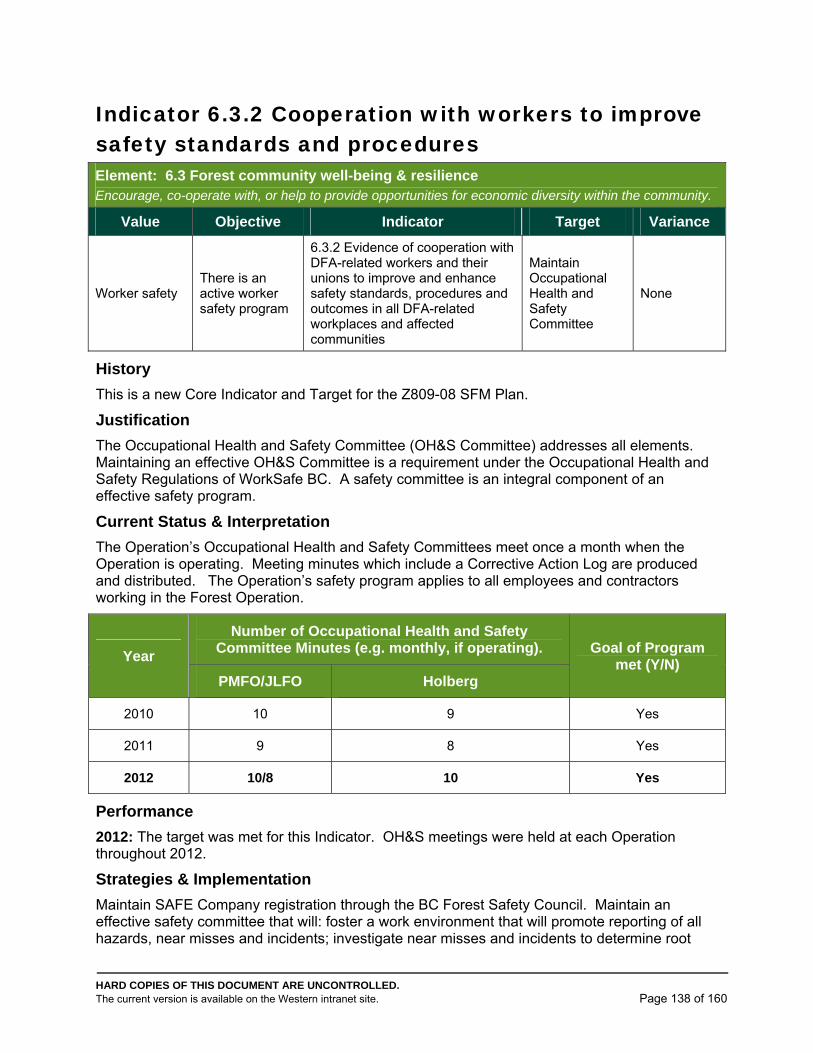
HARD COPIES OF THIS DOCUMENT ARE UNCONTROLLED. The current version is available on the Western intranet site. Page 138 of 160
Indicator 6.3.2 Cooperation with workers to improve safety standards and procedures Element: 6.3 Forest community well-being & resilience Encourage, co-operate with, or help to provide opportunities for economic diversity within the community.
Value Objective Indicator Target Variance
Worker safety There is an active worker safety program
6.3.2 Evidence of cooperation with DFA-related workers and their unions to improve and enhance safety standards, procedures and outcomes in all DFA-related workplaces and affected communities
Maintain Occupational Health and Safety Committee
None
History
This is a new Core Indicator and Target for the Z809-08 SFM Plan.
Justification
The Occupational Health and Safety Committee (OH&S Committee) addresses all elements. Maintaining an effective OH&S Committee is a requirement under the Occupational Health and Safety Regulations of WorkSafe BC. A safety committee is an integral component of an effective safety program.
Current Status & Interpretation
The Operation’s Occupational Health and Safety Committees meet once a month when the Operation is operating. Meeting minutes which include a Corrective Action Log are produced and distributed. The Operation’s safety program applies to all employees and contractors working in the Forest Operation.
Year
Number of Occupational Health and Safety Committee Minutes (e.g. monthly, if operating). Goal of Program
met (Y/N) PMFO/JLFO Holberg
2010 10 9 Yes
2011 9 8 Yes
2012 10/8 10 Yes
Performance
2012: The target was met for this Indicator. OH&S meetings were held at each Operation throughout 2012.
Strategies & Implementation
Maintain SAFE Company registration through the BC Forest Safety Council. Maintain an effective safety committee that will: foster a work environment that will promote reporting of all hazards, near misses and incidents; investigate near misses and incidents to determine root
HARD COPIES OF THIS DOCUMENT ARE UNCONTROLLED. The current version is available on the Western intranet site. Page 139 of 160
cause; make corrective actions and distribute and review findings with workers; review and address findings and worker’s concerns that arise from departmental safety meetings.
Forecasts
Regular (monthly) OH&S Committee meetings will continue to be held when the Operations are operating. WFP has maintained safety committees for many years. The committee’s functions and effectiveness can be shown to have evolved and improved over the years. An effective OH&S Committee is an integral component of an effective safety program. WFP is strongly committed to an effective safety program. There is no expected change in this indicator as WFP expectations of its Operation’s safety committees are not expected to change, although they will likely improve and evolve over time.
Details/ Data Set
OH&S Committee’s meeting minutes are documented and retained within the Operations.
Monitoring
The Operations Administrators will provide an annual summary of Operation’s OH&S Committee meetings (i.e. minutes). Operations are subject to audit by the BC Forest Safety Council as part of WFP’s SAFE Company Certification.
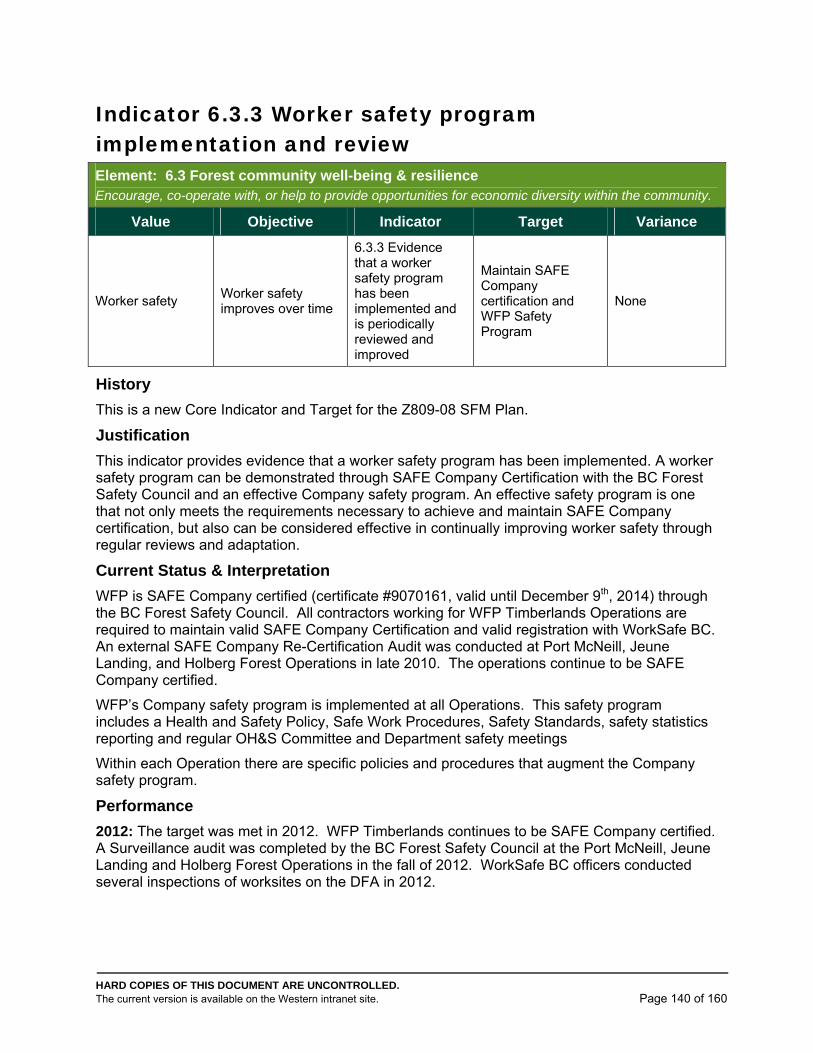
HARD COPIES OF THIS DOCUMENT ARE UNCONTROLLED. The current version is available on the Western intranet site. Page 140 of 160
Indicator 6.3.3 Worker safety program implementation and review Element: 6.3 Forest community well-being & resilience Encourage, co-operate with, or help to provide opportunities for economic diversity within the community.
Value Objective Indicator Target Variance
Worker safety Worker safety improves over time
6.3.3 Evidence that a worker safety program has been implemented and is periodically reviewed and improved
Maintain SAFE Company certification and WFP Safety Program
None
History
This is a new Core Indicator and Target for the Z809-08 SFM Plan.
Justification
This indicator provides evidence that a worker safety program has been implemented. A worker safety program can be demonstrated through SAFE Company Certification with the BC Forest Safety Council and an effective Company safety program. An effective safety program is one that not only meets the requirements necessary to achieve and maintain SAFE Company certification, but also can be considered effective in continually improving worker safety through regular reviews and adaptation.
Current Status & Interpretation
WFP is SAFE Company certified (certificate #9070161, valid until December 9th, 2014) through the BC Forest Safety Council. All contractors working for WFP Timberlands Operations are required to maintain valid SAFE Company Certification and valid registration with WorkSafe BC. An external SAFE Company Re-Certification Audit was conducted at Port McNeill, Jeune Landing, and Holberg Forest Operations in late 2010. The operations continue to be SAFE Company certified.
WFP’s Company safety program is implemented at all Operations. This safety program includes a Health and Safety Policy, Safe Work Procedures, Safety Standards, safety statistics reporting and regular OH&S Committee and Department safety meetings
Within each Operation there are specific policies and procedures that augment the Company safety program.
Performance
2012: The target was met in 2012. WFP Timberlands continues to be SAFE Company certified. A Surveillance audit was completed by the BC Forest Safety Council at the Port McNeill, Jeune Landing and Holberg Forest Operations in the fall of 2012. WorkSafe BC officers conducted several inspections of worksites on the DFA in 2012.
HARD COPIES OF THIS DOCUMENT ARE UNCONTROLLED. The current version is available on the Western intranet site. Page 141 of 160
Strategies & Implementation
Each Operation is responsible for implementing the Company safety program and continuing to meet the requirements of SAFE Company Certification and supporting Timberlands in maintaining this certification. The program is applicable to staff, union and contract workers. WFP Health and Safety advisors assist the Operations in maintaining and improving the safety program
Forecast
Continue to maintain SAFE Company Certification though the BC Forest Safety Council. Continue to maintain WFP’s Company safety program. WFP’s safety program has evolved over the last several years to become a world class safety system. WFP’s goal is to continually reduce its medical incident rate (MIR). MIR reduction can be directly linked to an effective safety program. There is no expected change in this indicator as WFP’s expectation of its Operation’s implementing its Company safety program is not expected to change, although the program is expected to improve and evolve over time.
Details/ Data Set
Report on SAFE Company Certification and BC Forest Safety Council audit results. WFP Health and Safety advisor reports. Report on significant innovations or improvements to the Company/Operation’s safety plans.
Monitoring
The Operations Administrators will provide evidence of continued certification with the BC Forest Safety Council (i.e. Internal and External Audits, reports from BC Forest Safety Council website). Operations Administrators will provide documentation related to any WFP Health and Safety advisor reports.
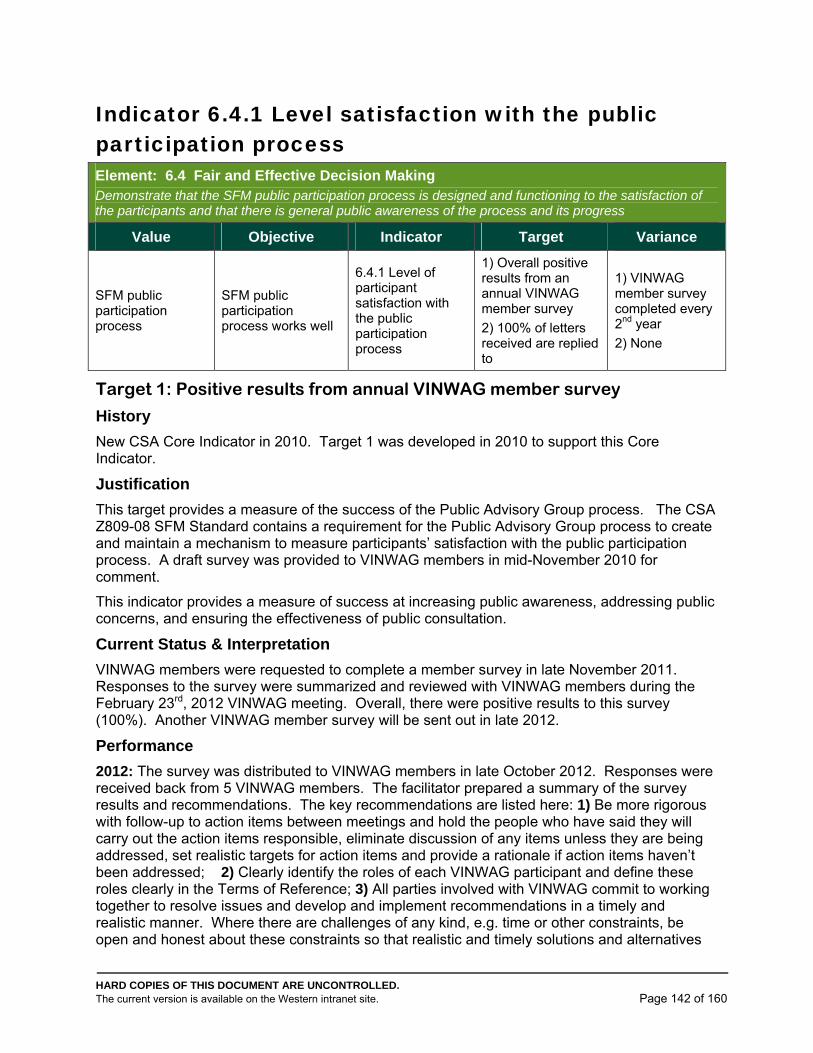
HARD COPIES OF THIS DOCUMENT ARE UNCONTROLLED. The current version is available on the Western intranet site. Page 142 of 160
Indicator 6.4.1 Level satisfaction with the public participation process Element: 6.4 Fair and Effective Decision Making Demonstrate that the SFM public participation process is designed and functioning to the satisfaction of the participants and that there is general public awareness of the process and its progress
Value Objective Indicator Target Variance
SFM public participation process
SFM public participation process works well
6.4.1 Level of participant satisfaction with the public participation process
1) Overall positive results from an annual VINWAG member survey
2) 100% of letters received are replied to
1) VINWAG member survey completed every 2nd year
2) None
Target 1: Positive results from annual VINWAG member survey
History
New CSA Core Indicator in 2010. Target 1 was developed in 2010 to support this Core Indicator.
Justification
This target provides a measure of the success of the Public Advisory Group process. The CSA Z809-08 SFM Standard contains a requirement for the Public Advisory Group process to create and maintain a mechanism to measure participants’ satisfaction with the public participation process. A draft survey was provided to VINWAG members in mid-November 2010 for comment.
This indicator provides a measure of success at increasing public awareness, addressing public concerns, and ensuring the effectiveness of public consultation.
Current Status & Interpretation
VINWAG members were requested to complete a member survey in late November 2011. Responses to the survey were summarized and reviewed with VINWAG members during the February 23rd, 2012 VINWAG meeting. Overall, there were positive results to this survey (100%). Another VINWAG member survey will be sent out in late 2012.
Performance
2012: The survey was distributed to VINWAG members in late October 2012. Responses were received back from 5 VINWAG members. The facilitator prepared a summary of the survey results and recommendations. The key recommendations are listed here: 1) Be more rigorous with follow-up to action items between meetings and hold the people who have said they will carry out the action items responsible, eliminate discussion of any items unless they are being addressed, set realistic targets for action items and provide a rationale if action items haven’t been addressed; 2) Clearly identify the roles of each VINWAG participant and define these roles clearly in the Terms of Reference; 3) All parties involved with VINWAG commit to working together to resolve issues and develop and implement recommendations in a timely and realistic manner. Where there are challenges of any kind, e.g. time or other constraints, be open and honest about these constraints so that realistic and timely solutions and alternatives
HARD COPIES OF THIS DOCUMENT ARE UNCONTROLLED. The current version is available on the Western intranet site. Page 143 of 160
can be found; 4) Under the survey heading ‘Meaningful Input’, change the current question: 'Is there accountability and feedback for the recommendations you make?' to ‘Are you satisfied with the way in which your recommendations are received and responded to?'; 5) Continue to seek new representatives for the mining and energy sectors and encourage existing sector representatives to identify alternates to attend if they cannot; 6) Add the following question to the 2013 participant satisfaction survey: 'What is the key accomplishment that has been achieved through the group since the last review?' Or, 'If this group were disbanded, what difference would it make to the operation and improvement of Sustainable Forest Management in the Defined Forest Area?'; 7) Consider the comments in this survey response regarding the CWD target and the indicator related to job creation and ask members of VINWAG whether they wish to revisit these matters by forming a subcommittee, or ask WFP and agency representatives to meet separately, to revise the targets related to these two indicators and present recommendations to VINWAG.
The survey summary and recommendations were reviewed with VINWAG at the first meeting of 2013.
Strategies & Implementation
A VINWAG member survey has been prepared and distributed to the group for the past three years. Typical timelines for survey distribution is at the last VINWAG meeting of the year. Members are asked to complete the survey and return to the Chair or WFP rep for compilation by mid-January of the following year. The results are compiled and reviewed during the first VINWAG meeting of the following year. VINWAG members will have the option of providing their names or remaining anonymous when submitting the survey.
Forecasts
The forecast is for the VINWAG member survey to generate positive results going forward. This is assuming that there continues to be public interest in the Public Participation Process and the VINWAG Terms of Reference and Procedures is followed and regularly reviewed.
Details/ Data Set
This target is determined by compiling the responses to the annual VINWAG member survey. The results will be presented showing the % of positive or favourable responses to each question. The acceptable variance for this target is to conduct a survey every second year.
Monitoring
The Operations Foresters will ensure that the survey results are obtained and compiled and results reported, in the SFM Plan Annual Report.
Target 2: 100% of Letters Received are Responded to
History
New CSA Core Indicator in 2010. Previously was Indicator # 53 in the Z809-02 SFM Plan. The indicator was developed in 2001.
Justification
This target provides a measure of success at increasing public awareness, addressing public concerns, and ensuring the effectiveness of public consultation. Throughout the planning and consultation process, the target is to provide a response to all letters of support or concern received from members of community or government related to Forest Development Plans
HARD COPIES OF THIS DOCUMENT ARE UNCONTROLLED. The current version is available on the Western intranet site. Page 144 of 160
(FDPs), Forest Stewardship Plans (FSPs), Management Plans (MPs), and any other plans that may have been advertised. VINWAG is another avenue for public input.
Current Status & Interpretation
This target has been in existence since 2001. In 2009, Port McNeill Forest Operation received a letter from a resident of Port Alice regarding harvesting adjacent to the Port Alice highway. The letter was forwarded to WFP via the Village of Port Alice municipal office. WFP representatives attended a Port Alice Council meeting in April 2009 to discuss the cutblock in question as well as future harvesting plans. Council sent a letter to WFP-PMFO thanking them for the meeting and inviting them back in 2010. WFP representatives attended Port Alice Council meetings in 2010, 2011 and 2012 to review future harvesting plans around Port Alice and the Port Alice highway and has a meeting scheduled for May 2013.
Performance
2012: In early December 2012, a surface blasting incident triggered a response from the community of Coal Harbour. Several complaints were directed to the Holberg Forest Operation via a notice of blasting that was posted in the town. Operation staff responded to the complaints on an individual basis and then attended a community meeting in December to explain what had happened and what WFP would do in the future if sand blasting was required to deal with a dangerous snag etc. At the end of the meeting most were satisfied with the results and WFP Holberg has taken action to ensure the community members don't relive the experience. In late September, Port McNeill Forest Operation received a public complaint via the WFP Corporate Forestry Office about harvesting adjacent to Devil's Bath. While this situation is not directly linked to the target of this Indicator, a letter was received from the complainant and responded to by WFP.
Strategies & Implementation
Each operation, which keeps copies of correspondence related to FSPs and other plans, will review all public letters received in response to advertised plans for the reporting year, and confirm that all which state concerns have been responded to. Total number of letters received (with concerns) and responded to will be reported. These are generally summarized in a FSP supplement document. Correspondence regarding MPs will be dealt with through the Corporate Office. Again, letters will be responded to, filed, and reported on an annual basis. Other correspondence will also be addressed.
Forecasts
The forecast is to continue to meet the target into the future; respond to all letters / correspondence with concerns. Public consultation is part of the “social licence” that WFP operates under. A key assumption is that the current legislative environment for forest management continues.
Details / Data Set
This target is determined by dividing the number of letters with concerns that are replied to by the number of letters with concerns received in response to plans. There is no variance for this target.
Monitoring
The Operations Foresters will track letters received and responded to and report the results in the SFM Plan Annual Report.
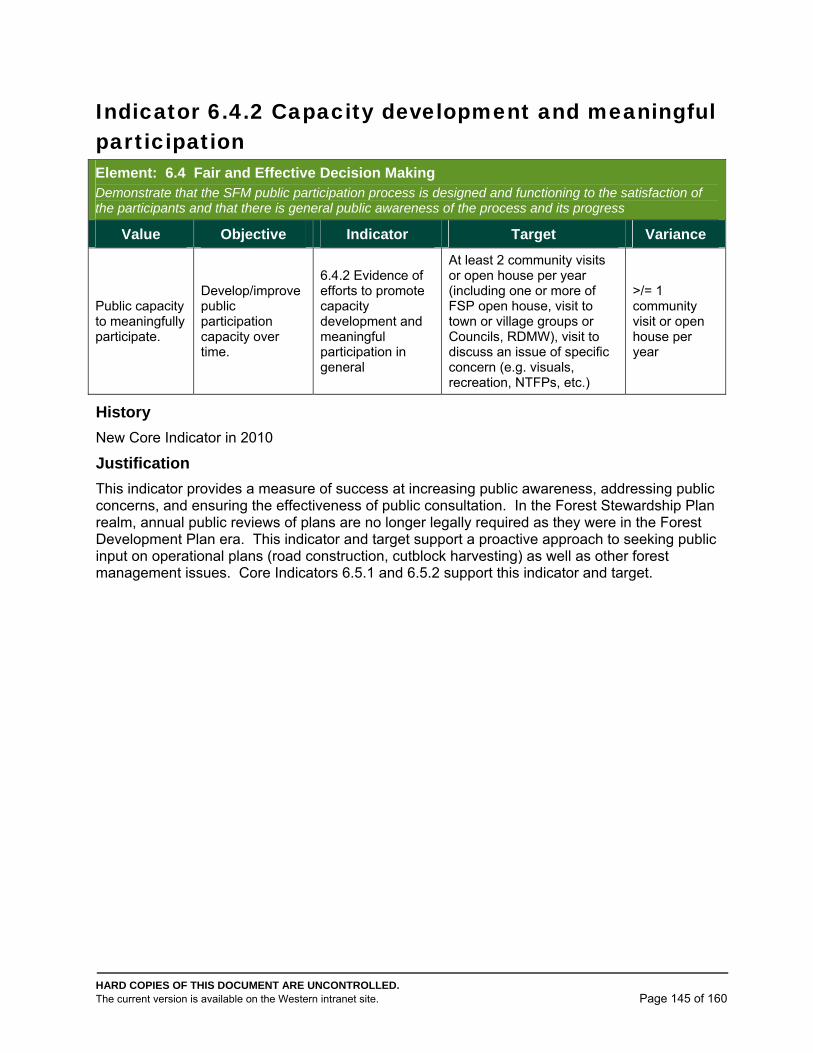
HARD COPIES OF THIS DOCUMENT ARE UNCONTROLLED. The current version is available on the Western intranet site. Page 145 of 160
Indicator 6.4.2 Capacity development and meaningful participation Element: 6.4 Fair and Effective Decision Making Demonstrate that the SFM public participation process is designed and functioning to the satisfaction of the participants and that there is general public awareness of the process and its progress
Value Objective Indicator Target Variance
Public capacity to meaningfully participate.
Develop/improve public participation capacity over time.
6.4.2 Evidence of efforts to promote capacity development and meaningful participation in general
At least 2 community visits or open house per year (including one or more of FSP open house, visit to town or village groups or Councils, RDMW), visit to discuss an issue of specific concern (e.g. visuals, recreation, NTFPs, etc.)
>/= 1 community visit or open house per year
History
New Core Indicator in 2010
Justification
This indicator provides a measure of success at increasing public awareness, addressing public concerns, and ensuring the effectiveness of public consultation. In the Forest Stewardship Plan realm, annual public reviews of plans are no longer legally required as they were in the Forest Development Plan era. This indicator and target support a proactive approach to seeking public input on operational plans (road construction, cutblock harvesting) as well as other forest management issues. Core Indicators 6.5.1 and 6.5.2 support this indicator and target.
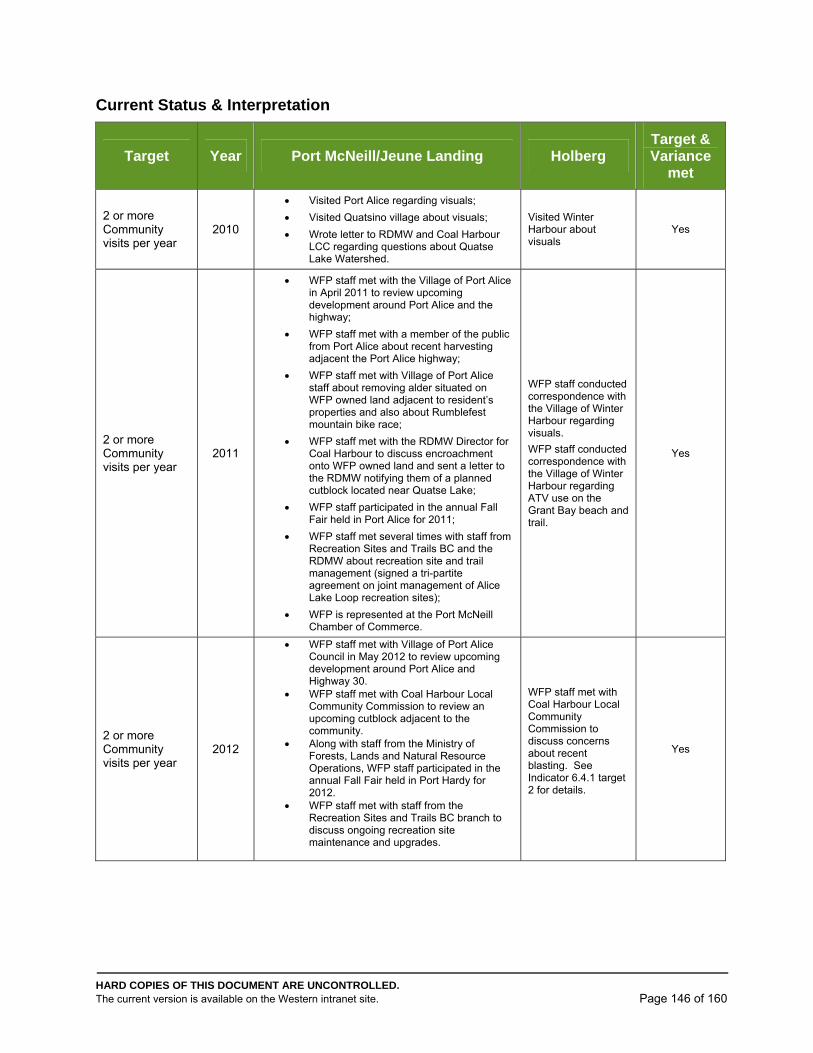
HARD COPIES OF THIS DOCUMENT ARE UNCONTROLLED. The current version is available on the Western intranet site. Page 146 of 160
Current Status & Interpretation
Target Year Port McNeill/Jeune Landing Holberg Target & Variance
met
2 or more Community visits per year
2010
Visited Port Alice regarding visuals;
Visited Quatsino village about visuals;
Wrote letter to RDMW and Coal Harbour LCC regarding questions about Quatse Lake Watershed.
Visited Winter Harbour about visuals
Yes
2 or more Community visits per year
2011
WFP staff met with the Village of Port Alice in April 2011 to review upcoming development around Port Alice and the highway;
WFP staff met with a member of the public from Port Alice about recent harvesting adjacent the Port Alice highway;
WFP staff met with Village of Port Alice staff about removing alder situated on WFP owned land adjacent to resident’s properties and also about Rumblefest mountain bike race;
WFP staff met with the RDMW Director for Coal Harbour to discuss encroachment onto WFP owned land and sent a letter to the RDMW notifying them of a planned cutblock located near Quatse Lake;
WFP staff participated in the annual Fall Fair held in Port Alice for 2011;
WFP staff met several times with staff from Recreation Sites and Trails BC and the RDMW about recreation site and trail management (signed a tri-partite agreement on joint management of Alice Lake Loop recreation sites);
WFP is represented at the Port McNeill Chamber of Commerce.
WFP staff conducted correspondence with the Village of Winter Harbour regarding visuals.
WFP staff conducted correspondence with the Village of Winter Harbour regarding ATV use on the Grant Bay beach and trail.
Yes
2 or more Community visits per year
2012
WFP staff met with Village of Port Alice Council in May 2012 to review upcoming development around Port Alice and Highway 30.
WFP staff met with Coal Harbour Local Community Commission to review an upcoming cutblock adjacent to the community.
Along with staff from the Ministry of Forests, Lands and Natural Resource Operations, WFP staff participated in the annual Fall Fair held in Port Hardy for 2012.
WFP staff met with staff from the Recreation Sites and Trails BC branch to discuss ongoing recreation site maintenance and upgrades.
WFP staff met with Coal Harbour Local Community Commission to discuss concerns about recent blasting. See Indicator 6.4.1 target 2 for details.
Yes
HARD COPIES OF THIS DOCUMENT ARE UNCONTROLLED. The current version is available on the Western intranet site. Page 147 of 160
Performance
2012: The target was met in 2012.
Strategies & Implementation
Each operation will attempt to annually contact communities (i.e. Port Alice, Winter Harbour, Quatsino, Coal Harbour) in which they operate to offer to meet to discuss operational plans and forest management. Contact can take the form of a phone call, e-mail, letter or face to face contact. In some years, this target will likely be met through “on-demand” visits to communities (a community has a specific request to discuss).
Forecasts
The forecast is to continue to meet the target into the future. Meeting with the public to discuss and review operational plans is part of the “social licence” that WFP operates under. A key assumption is that the current legislative environment for forest management continues and that there is continued public acceptance of offers to meet or participate in open houses.
Details/ Data Set
This indicator is determined by tallying the number of community visits completed in a calendar year along with a summary of what was discussed or presented. If an offer of a community visit is turned down or not responded to, this will be recorded and reported. The variance to this target is to conduct at least one community visit or open house per calendar year.
Monitoring
The Operations Foresters, with support from the Operations Engineers, will summarize the number of community visits completed in a calendar year along with an explanation of what was discussed, and report the results in the SFM Plan Annual Report.
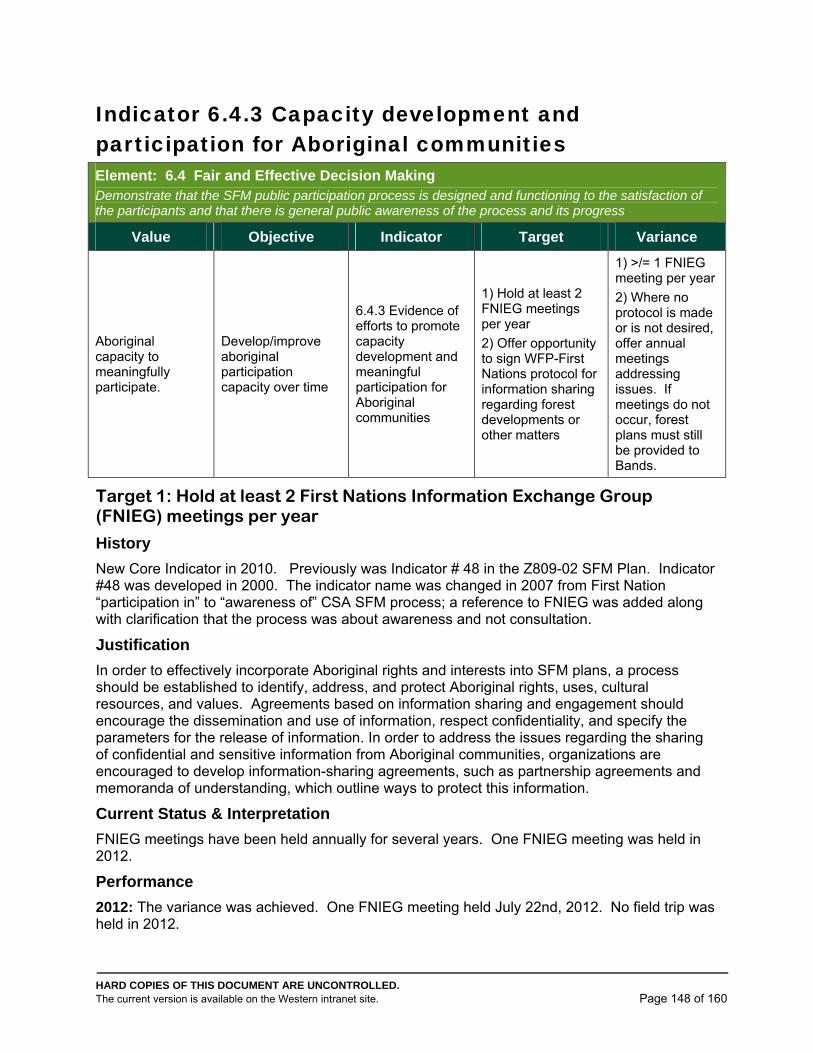
HARD COPIES OF THIS DOCUMENT ARE UNCONTROLLED. The current version is available on the Western intranet site. Page 148 of 160
Indicator 6.4.3 Capacity development and participation for Aboriginal communities Element: 6.4 Fair and Effective Decision Making Demonstrate that the SFM public participation process is designed and functioning to the satisfaction of the participants and that there is general public awareness of the process and its progress
Value Objective Indicator Target Variance
Aboriginal capacity to meaningfully participate.
Develop/improve aboriginal participation capacity over time
6.4.3 Evidence of efforts to promote capacity development and meaningful participation for Aboriginal communities
1) Hold at least 2 FNIEG meetings per year
2) Offer opportunity to sign WFP-First Nations protocol for information sharing regarding forest developments or other matters
1) >/= 1 FNIEG meeting per year
2) Where no protocol is made or is not desired, offer annual meetings addressing issues. If meetings do not occur, forest plans must still be provided to Bands.
Target 1: Hold at least 2 First Nations Information Exchange Group (FNIEG) meetings per year
History
New Core Indicator in 2010. Previously was Indicator # 48 in the Z809-02 SFM Plan. Indicator #48 was developed in 2000. The indicator name was changed in 2007 from First Nation “participation in” to “awareness of” CSA SFM process; a reference to FNIEG was added along with clarification that the process was about awareness and not consultation.
Justification
In order to effectively incorporate Aboriginal rights and interests into SFM plans, a process should be established to identify, address, and protect Aboriginal rights, uses, cultural resources, and values. Agreements based on information sharing and engagement should encourage the dissemination and use of information, respect confidentiality, and specify the parameters for the release of information. In order to address the issues regarding the sharing of confidential and sensitive information from Aboriginal communities, organizations are encouraged to develop information-sharing agreements, such as partnership agreements and memoranda of understanding, which outline ways to protect this information.
Current Status & Interpretation
FNIEG meetings have been held annually for several years. One FNIEG meeting was held in 2012.
Performance
2012: The variance was achieved. One FNIEG meeting held July 22nd, 2012. No field trip was held in 2012.
HARD COPIES OF THIS DOCUMENT ARE UNCONTROLLED. The current version is available on the Western intranet site. Page 149 of 160
Strategies & Implementation
The FNIEG is a group information sharing opportunity that mirrors VINWAG. Meeting agendas are prepared and distributed prior to meetings and minutes are kept and distributed to participants. Membership includes representatives from each of the five First Nations in the DFA plus WFP representatives, MFLNRO representatives, a facilitator and guest speakers when required. Often, there is an annual summer field trip for FNIEG members to review SFM Plan Indicators in the field and discuss cultural resources.
Forecasts
The forecast is to meet the target going into the future. The FNIEG process appears to be working well for discussing SFM related items outside of the Public Advisory Group. A key assumption is that there is continued interest in the FNIEG process by the five First Nations in the DFA.
Details/ Data Set
Meeting agendas and minutes are retained on file.
Monitoring
The Operations Foresters will summarize the number of FNIEG meetings held in a calendar year and report the results in the SFM Plan Annual Report. Copies of meeting agendas and minutes are maintained on file.
Target 2: Offer opportunity to sign WFP-First Nations protocol for information sharing regarding forest developments or other matters
History
New Core Indicator in 2010
Justification
In order to effectively incorporate Aboriginal rights and interests into SFM plans, a process should be established to identify, address, and protect Aboriginal rights, uses, cultural resources, and values. Agreements based on information sharing and engagement should encourage the dissemination and use of information, respect confidentiality, and specify the parameters for the release of information. In order to address the issues regarding the sharing of confidential and sensitive information from Aboriginal communities, organizations are encouraged to develop information-sharing agreements, such as partnership agreements and memoranda of understanding, which outline ways to protect this information.
Current Status & Interpretation
So far, there is only one signed WFP-First Nation protocol for information sharing; the Quatsino Protocol with the Quatsino First Nation.
HARD COPIES OF THIS DOCUMENT ARE UNCONTROLLED. The current version is available on the Western intranet site. Page 150 of 160
Performance
2012: The variance was achieved in 2012. Only one WFP-First Nation protocol is in place on the DFA (Quatsino Protocol, in place prior to the current SFM Plan); annual meetings are held with the Quatsino First Nation to review Forest Operating Plans. Meetings are held with the 'Namgis First Nation to review Forest Operating Plans, even though there is no protocol in place currently. To date, there have been no meetings with the Kwakiutl First Nation or the Tlatlasikwala First Nation, however, Forest Operating Plans are provided to them along with offers to meet.
Strategies & Implementation
The need for a protocol will be assessed on a case by case basis, and will consider MFLNRO input on consultation engagement. Protocols with First Nations are generally driven by the Corporate Forestry group. The FNIEG process serves to facilitate and compliment the work done at the Corporate Forestry level.
Forecasts
It is difficult to forecast this target into the future. The WFP-Quatsino First Nation protocol has been signed for several years and is expected to be maintained into the future. A key assumption is that the current Treaty process is continues (this is not offered as a negative comment). When treaties between the Crown and First Nations are concluded, the context of the relationship between the WFP and First Nations will likely be changed. It is difficult to say how this target (and other Indicators/targets in the SFM Plan) will be affected in a post-treaty world.
Details/ Data Set
Refer to Current Status for latest data.
Monitoring
Operations Foresters will summarize the number of protocol agreements in place and offers of protocol agreements as well as the number of annual meetings held and report the results in the SFM Plan Annual Report. FNIEG meeting minutes and draft or signed protocols are maintained on file.
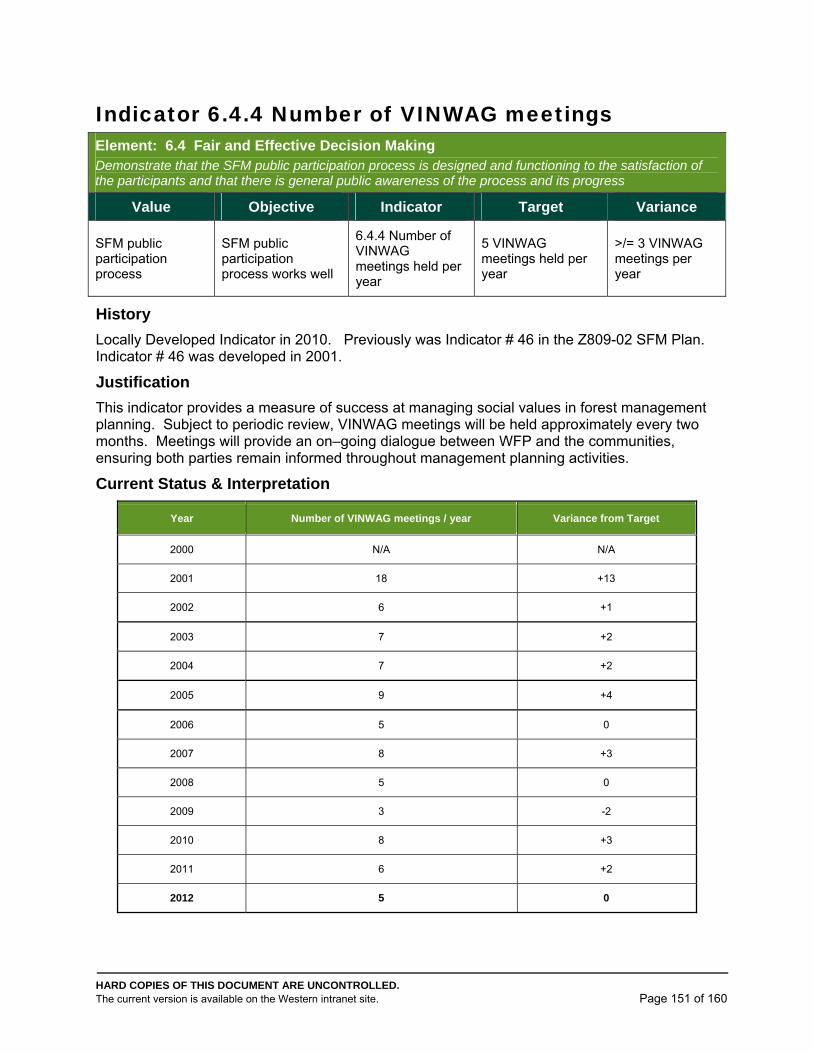
HARD COPIES OF THIS DOCUMENT ARE UNCONTROLLED. The current version is available on the Western intranet site. Page 151 of 160
Indicator 6.4.4 Number of VINWAG meetings Element: 6.4 Fair and Effective Decision Making Demonstrate that the SFM public participation process is designed and functioning to the satisfaction of the participants and that there is general public awareness of the process and its progress
Value Objective Indicator Target Variance
SFM public participation process
SFM public participation process works well
6.4.4 Number of VINWAG meetings held per year
5 VINWAG meetings held per year
>/= 3 VINWAG meetings per year
History
Locally Developed Indicator in 2010. Previously was Indicator # 46 in the Z809-02 SFM Plan. Indicator # 46 was developed in 2001.
Justification
This indicator provides a measure of success at managing social values in forest management planning. Subject to periodic review, VINWAG meetings will be held approximately every two months. Meetings will provide an on–going dialogue between WFP and the communities, ensuring both parties remain informed throughout management planning activities.
Current Status & Interpretation
Year Number of VINWAG meetings / year Variance from Target
2000 N/A N/A
2001 18 +13
2002 6 +1
2003 7 +2
2004 7 +2
2005 9 +4
2006 5 0
2007 8 +3
2008 5 0
2009 3 -2
2010 8 +3
2011 6 +2
2012 5 0
HARD COPIES OF THIS DOCUMENT ARE UNCONTROLLED. The current version is available on the Western intranet site. Page 152 of 160
Performance
2012: The target was met in 2012. There were 5 VINWAG meetings held in 2012 (February 23rd, April 26th, June 14th, September 13th and November 8th). There was one field trip held also (September 14th). An all PAG workshop was hosted by the Stillwater PAG in September 2012. Unfortunately, only the chair/facilitator and the WFP rep were able to attend on behalf of VINWAG.
Strategies & Implementation
CSA SFM System Manual for Z809-08. Refer to the latest version of the VINWAG Terms of Reference and Procedures for details on goals, tasks, roles and procedures. Meeting agendas are prepared and distributed prior to meetings and minutes are kept and distributed to participants. A facilitator and chairperson guide the meetings. Membership includes public advisory group members, First Nations observers, WFP representatives and occasionally representatives from government agencies as required. A typical VINWAG meeting includes review of previous meeting minutes, a presentation on some aspect of forest management or on a mandatory discussion item, reviewing and discussing the SFM Plan, reviewing and discussing membership and Terms of Reference and other business matters.
Forecasts
The forecast is that the target will continue to be met into the future. There were a higher number of meetings in 2010 owing to the requirement to update the SFM Plan to the Z809-08 Standard by the end of the year. A key assumption is that there is continued public interest in the SFM process
Details/ Data Set
Refer to Current Status for latest data.
Monitoring
Operations Foresters will summarize the number of VINWAG meetings held in each calendar year and report the results in the SFM Plan Annual Report. VINWAG meeting agendas and minutes and related correspondence are maintained on file.
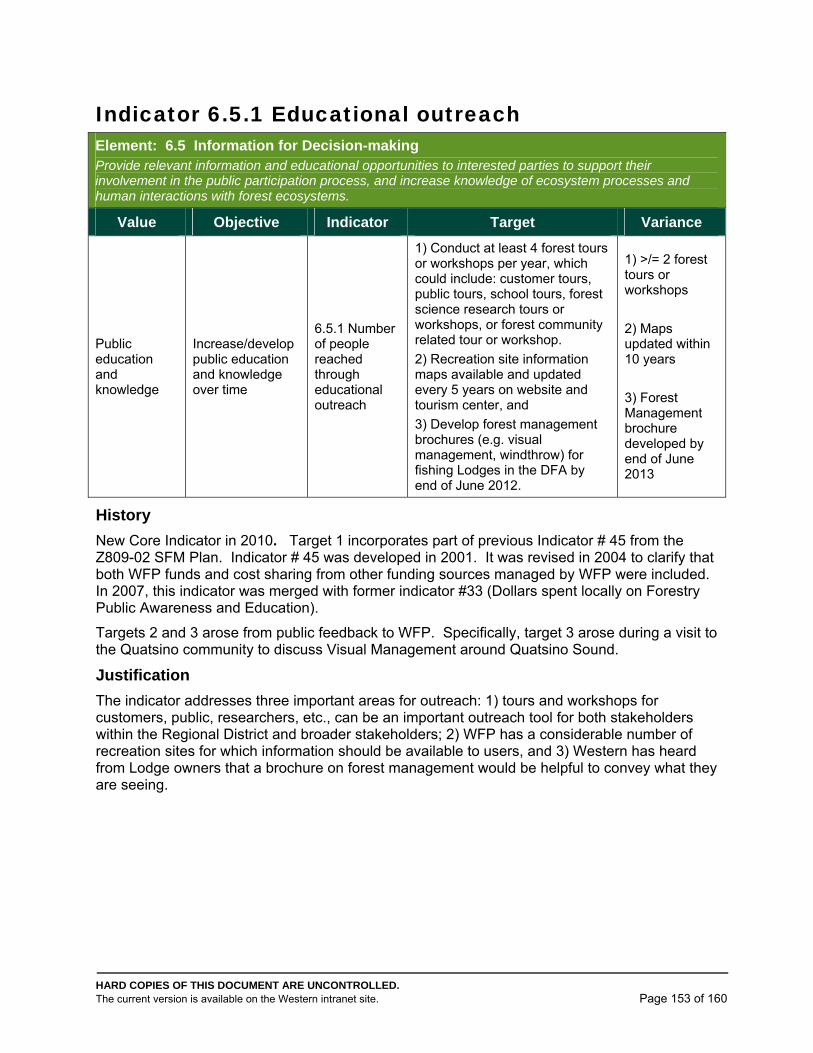
HARD COPIES OF THIS DOCUMENT ARE UNCONTROLLED. The current version is available on the Western intranet site. Page 153 of 160
Indicator 6.5.1 Educational outreach Element: 6.5 Information for Decision-making Provide relevant information and educational opportunities to interested parties to support their involvement in the public participation process, and increase knowledge of ecosystem processes and human interactions with forest ecosystems.
Value Objective Indicator Target Variance
Public education and knowledge
Increase/develop public education and knowledge over time
6.5.1 Number of people reached through educational outreach
1) Conduct at least 4 forest tours or workshops per year, which could include: customer tours, public tours, school tours, forest science research tours or workshops, or forest community related tour or workshop.
2) Recreation site information maps available and updated every 5 years on website and tourism center, and
3) Develop forest management brochures (e.g. visual management, windthrow) for fishing Lodges in the DFA by end of June 2012.
1) >/= 2 forest tours or workshops
2) Maps updated within 10 years
3) Forest Management brochure developed by end of June 2013
History
New Core Indicator in 2010. Target 1 incorporates part of previous Indicator # 45 from the Z809-02 SFM Plan. Indicator # 45 was developed in 2001. It was revised in 2004 to clarify that both WFP funds and cost sharing from other funding sources managed by WFP were included. In 2007, this indicator was merged with former indicator #33 (Dollars spent locally on Forestry Public Awareness and Education).
Targets 2 and 3 arose from public feedback to WFP. Specifically, target 3 arose during a visit to the Quatsino community to discuss Visual Management around Quatsino Sound.
Justification
The indicator addresses three important areas for outreach: 1) tours and workshops for customers, public, researchers, etc., can be an important outreach tool for both stakeholders within the Regional District and broader stakeholders; 2) WFP has a considerable number of recreation sites for which information should be available to users, and 3) Western has heard from Lodge owners that a brochure on forest management would be helpful to convey what they are seeing.
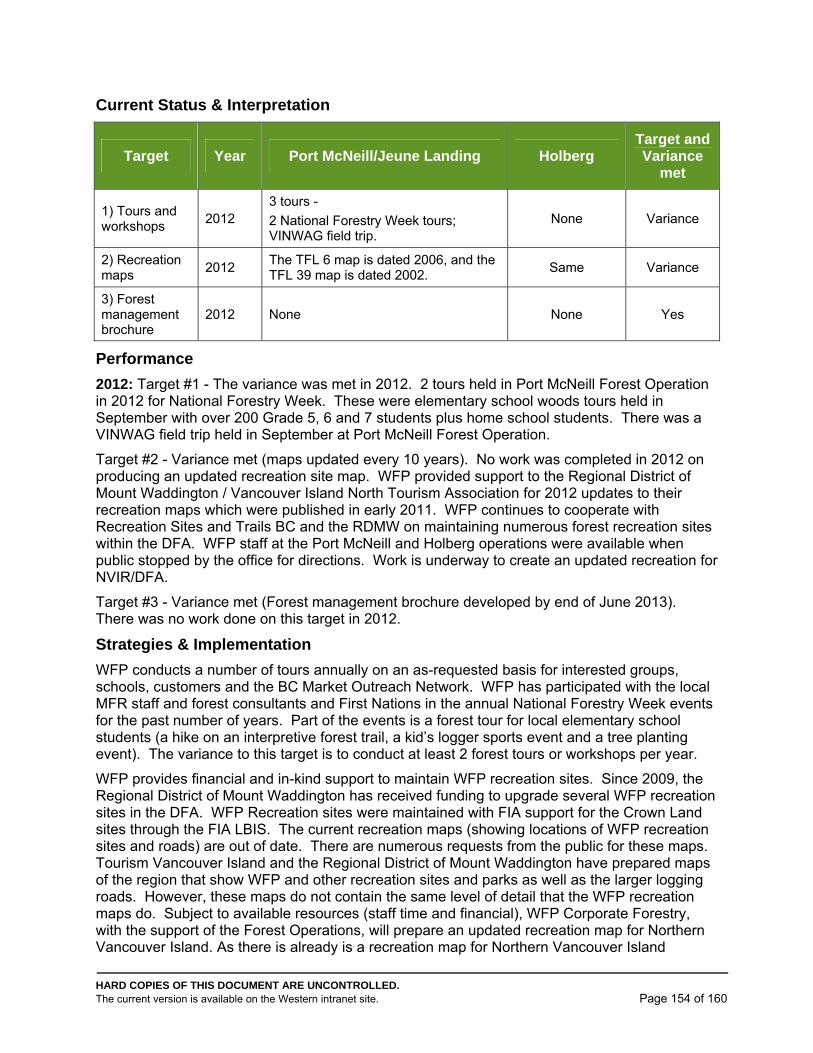
HARD COPIES OF THIS DOCUMENT ARE UNCONTROLLED. The current version is available on the Western intranet site. Page 154 of 160
Current Status & Interpretation
Target Year Port McNeill/Jeune Landing Holberg Target and Variance
met
1) Tours and workshops
2012 3 tours -
2 National Forestry Week tours; VINWAG field trip.
None Variance
2) Recreation maps
2012 The TFL 6 map is dated 2006, and the TFL 39 map is dated 2002.
Same Variance
3) Forest management brochure
2012 None None Yes
Performance
2012: Target #1 - The variance was met in 2012. 2 tours held in Port McNeill Forest Operation in 2012 for National Forestry Week. These were elementary school woods tours held in September with over 200 Grade 5, 6 and 7 students plus home school students. There was a VINWAG field trip held in September at Port McNeill Forest Operation.
Target #2 - Variance met (maps updated every 10 years). No work was completed in 2012 on producing an updated recreation site map. WFP provided support to the Regional District of Mount Waddington / Vancouver Island North Tourism Association for 2012 updates to their recreation maps which were published in early 2011. WFP continues to cooperate with Recreation Sites and Trails BC and the RDMW on maintaining numerous forest recreation sites within the DFA. WFP staff at the Port McNeill and Holberg operations were available when public stopped by the office for directions. Work is underway to create an updated recreation for NVIR/DFA.
Target #3 - Variance met (Forest management brochure developed by end of June 2013). There was no work done on this target in 2012.
Strategies & Implementation
WFP conducts a number of tours annually on an as-requested basis for interested groups, schools, customers and the BC Market Outreach Network. WFP has participated with the local MFR staff and forest consultants and First Nations in the annual National Forestry Week events for the past number of years. Part of the events is a forest tour for local elementary school students (a hike on an interpretive forest trail, a kid’s logger sports event and a tree planting event). The variance to this target is to conduct at least 2 forest tours or workshops per year.
WFP provides financial and in-kind support to maintain WFP recreation sites. Since 2009, the Regional District of Mount Waddington has received funding to upgrade several WFP recreation sites in the DFA. WFP Recreation sites were maintained with FIA support for the Crown Land sites through the FIA LBIS. The current recreation maps (showing locations of WFP recreation sites and roads) are out of date. There are numerous requests from the public for these maps. Tourism Vancouver Island and the Regional District of Mount Waddington have prepared maps of the region that show WFP and other recreation sites and parks as well as the larger logging roads. However, these maps do not contain the same level of detail that the WFP recreation maps do. Subject to available resources (staff time and financial), WFP Corporate Forestry, with the support of the Forest Operations, will prepare an updated recreation map for Northern Vancouver Island. As there is already is a recreation map for Northern Vancouver Island
HARD COPIES OF THIS DOCUMENT ARE UNCONTROLLED. The current version is available on the Western intranet site. Page 155 of 160
(although out of date), developing an updated version should be straightforward. The variance to this target is to update the recreation map within 10 years of the last revision; the current TFL 6 map was last updated in 2006 and the current TFL 39 map was last updated in 2002. Going forward, there will be one recreation map that covers all of WFP’s tenures on Northern Vancouver Island. Maps will be available at the Forest Operation offices and posted on the WFP website. Maps will also be made available to the local Ministry of Natural Resource Operations (formerly Ministry of Forests and Range) office and to tourism offices in Port Hardy, Port McNeill and Port Alice.
During a recent visit to the community of Quatsino, WFP heard a request from a Fishing Lodge owner to provide a brochure that gives a brief overview of forest management (specific to the Quatsino Sound area). Subject to available resources (staff time and financial), WFP Corporate Forestry, with the support of the Forest Operations, will prepare an overview brochure on forest management. Fishing lodges on Quatsino Sound will be contacted to see if they are interested in receiving copies of the brochure to have available for lodge guests. The variance for this target is to develop and distribute a Forest Management brochure by June 2013.
Forecasts
The forecast is to meet the targets into the future. The uptake of the forest tours associated with National Forestry Week has been excellent. This has turned into requests for school tours outside of National Forestry Week. Given the proximity of the Port McNeill Forest Operation to the working forest, it is an ideal location for tours. A key assumption of meeting these targets in the future is the availability of WFP resources (personnel and financial) as well as continued public interest in participating in forestry educational outreach programs.
Details/ Data Set
Refer to Current Status for latest data.
Monitoring
Operations Foresters will summarize the number of forest tours and/or workshops held in the calendar year along with a brief description and report the results in the SFM Plan Annual Report. Operations Foresters will report on the status of the recreation maps and the forest management brochures in the SFM Plan Annual Report.
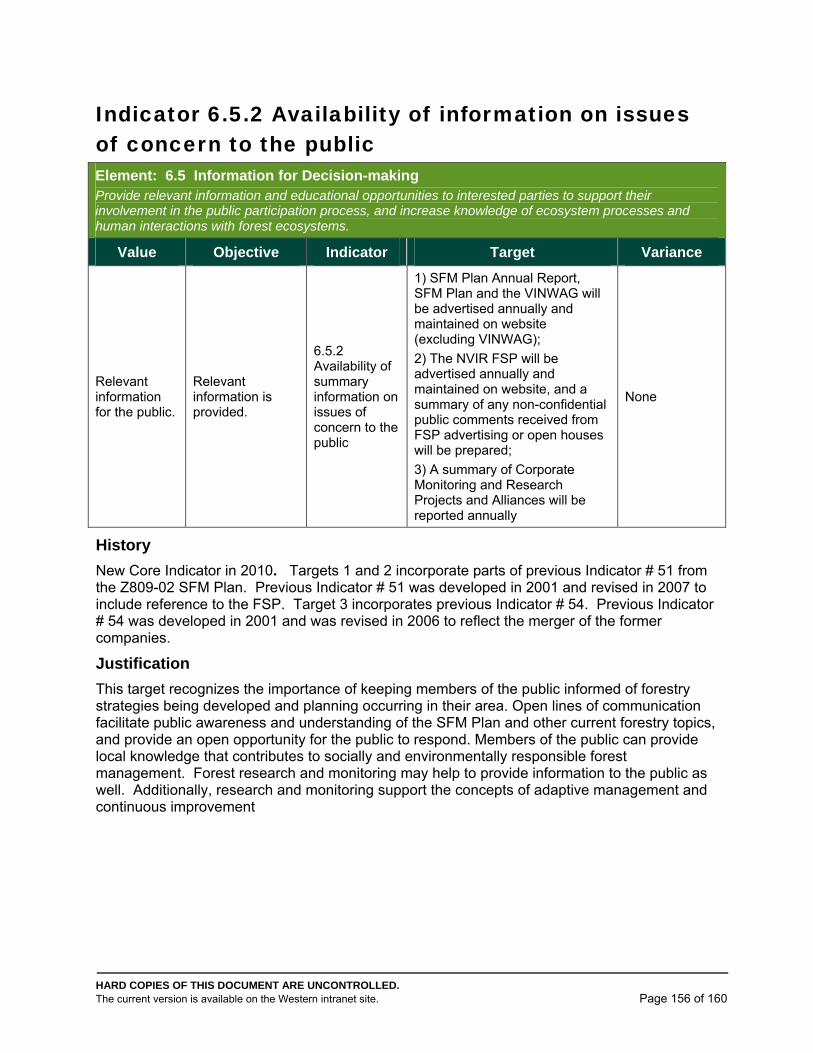
HARD COPIES OF THIS DOCUMENT ARE UNCONTROLLED. The current version is available on the Western intranet site. Page 156 of 160
Indicator 6.5.2 Availability of information on issues of concern to the public Element: 6.5 Information for Decision-making Provide relevant information and educational opportunities to interested parties to support their involvement in the public participation process, and increase knowledge of ecosystem processes and human interactions with forest ecosystems.
Value Objective Indicator Target Variance
Relevant information for the public.
Relevant information is provided.
6.5.2 Availability of summary information on issues of concern to the public
1) SFM Plan Annual Report, SFM Plan and the VINWAG will be advertised annually and maintained on website (excluding VINWAG);
2) The NVIR FSP will be advertised annually and maintained on website, and a summary of any non-confidential public comments received from FSP advertising or open houses will be prepared;
3) A summary of Corporate Monitoring and Research Projects and Alliances will be reported annually
None
History
New Core Indicator in 2010. Targets 1 and 2 incorporate parts of previous Indicator # 51 from the Z809-02 SFM Plan. Previous Indicator # 51 was developed in 2001 and revised in 2007 to include reference to the FSP. Target 3 incorporates previous Indicator # 54. Previous Indicator # 54 was developed in 2001 and was revised in 2006 to reflect the merger of the former companies.
Justification
This target recognizes the importance of keeping members of the public informed of forestry strategies being developed and planning occurring in their area. Open lines of communication facilitate public awareness and understanding of the SFM Plan and other current forestry topics, and provide an open opportunity for the public to respond. Members of the public can provide local knowledge that contributes to socially and environmentally responsible forest management. Forest research and monitoring may help to provide information to the public as well. Additionally, research and monitoring support the concepts of adaptive management and continuous improvement
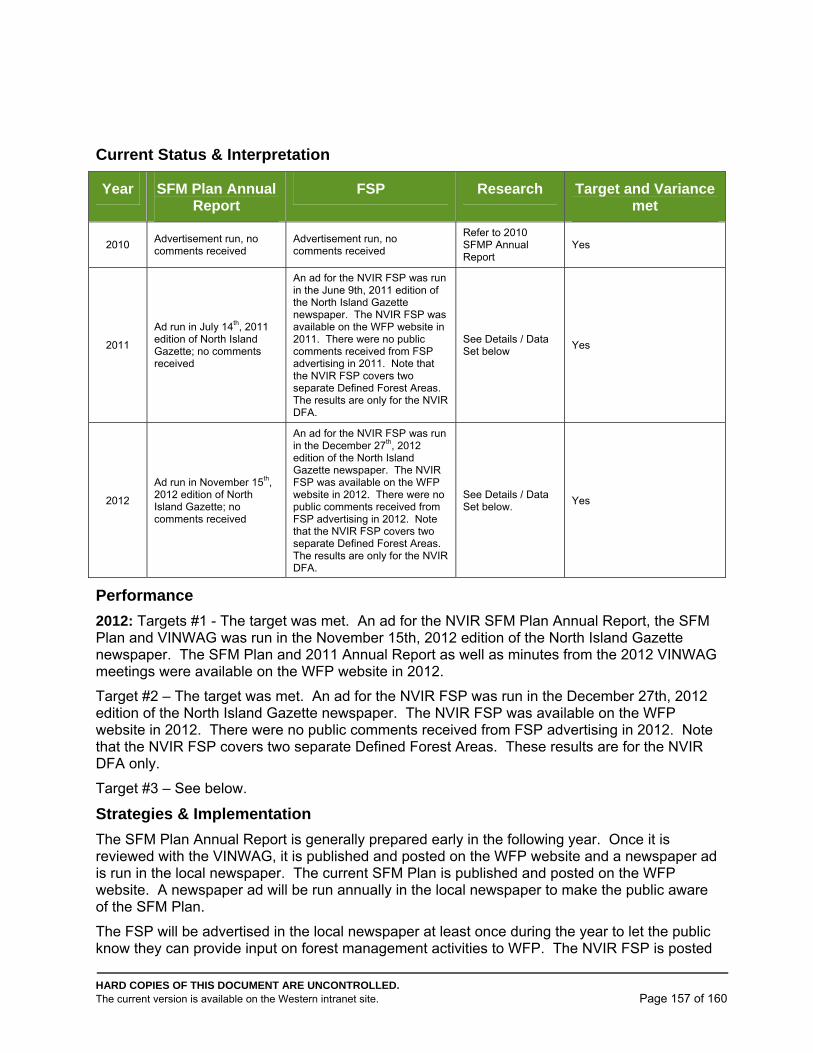
HARD COPIES OF THIS DOCUMENT ARE UNCONTROLLED. The current version is available on the Western intranet site. Page 157 of 160
Current Status & Interpretation
Year SFM Plan Annual Report
FSP Research Target and Variance met
2010 Advertisement run, no comments received
Advertisement run, no comments received
Refer to 2010 SFMP Annual Report
Yes
2011
Ad run in July 14th, 2011 edition of North Island Gazette; no comments received
An ad for the NVIR FSP was run in the June 9th, 2011 edition of the North Island Gazette newspaper. The NVIR FSP was available on the WFP website in 2011. There were no public comments received from FSP advertising in 2011. Note that the NVIR FSP covers two separate Defined Forest Areas. The results are only for the NVIR DFA.
See Details / Data Set below
Yes
2012
Ad run in November 15th, 2012 edition of North Island Gazette; no comments received
An ad for the NVIR FSP was run in the December 27th, 2012 edition of the North Island Gazette newspaper. The NVIR FSP was available on the WFP website in 2012. There were no public comments received from FSP advertising in 2012. Note that the NVIR FSP covers two separate Defined Forest Areas. The results are only for the NVIR DFA.
See Details / Data Set below.
Yes
Performance
2012: Targets #1 - The target was met. An ad for the NVIR SFM Plan Annual Report, the SFM Plan and VINWAG was run in the November 15th, 2012 edition of the North Island Gazette newspaper. The SFM Plan and 2011 Annual Report as well as minutes from the 2012 VINWAG meetings were available on the WFP website in 2012.
Target #2 – The target was met. An ad for the NVIR FSP was run in the December 27th, 2012 edition of the North Island Gazette newspaper. The NVIR FSP was available on the WFP website in 2012. There were no public comments received from FSP advertising in 2012. Note that the NVIR FSP covers two separate Defined Forest Areas. These results are for the NVIR DFA only.
Target #3 – See below.
Strategies & Implementation
The SFM Plan Annual Report is generally prepared early in the following year. Once it is reviewed with the VINWAG, it is published and posted on the WFP website and a newspaper ad is run in the local newspaper. The current SFM Plan is published and posted on the WFP website. A newspaper ad will be run annually in the local newspaper to make the public aware of the SFM Plan.
The FSP will be advertised in the local newspaper at least once during the year to let the public know they can provide input on forest management activities to WFP. The NVIR FSP is posted
HARD COPIES OF THIS DOCUMENT ARE UNCONTROLLED. The current version is available on the Western intranet site. Page 158 of 160
on the WFP website. Any non-confidential public comments received will be summarized and reported in the SFM Plan Annual Report.
Research, growth and yield and other trials are maintained by the WFP Inventory Forester and FIA Coordinator. WFP is a member of FERIC and is currently assisting with the “BC Coastal Forest Sector Hem-Fir Initiative” research program. WFP also supports university and government researchers when requested. A summary of research and/or monitoring projects that WFP is involved with or supports (alliances) will be prepared and reported in the SFM Plan Annual Report.
There is no variance for any of the targets in this indicator.
Forecasts
The forecast is to meet these targets into the future. Additional newspaper advertisements may be run if there are significant changes to the SFM Plan or to the NVIR FSP (i.e. FSP Amendments) to inform the public. The number of research and/or monitoring projects is expected to remain constant over time (older projects wrap up and new project are started).
Details/ Data Set
Target #3 - 2012 Monitoring and Research Projects – Western Forest Products
Active and Ongoing Projects
Variable Retention Adaptive Management
o R1217 Forest Structure Retention Monitoring (2012 – Sandford; $WFP)
o Regeneration performance
o Avian Communities, Carabid Beetles, Terrestrial Gastropods, Small Streams
o VR Operations’ Performance Report (2012 – Symetree, $WFP)
Salal Cedar Hemlock Integrated Research Program (SCHIRP)
o Big SCHIRP MScF Thesis (2012 – UBC – Prescott & Nery; $WFP, $NSERC6)
o Transitional Foliar Samples (2012 – MFLNRO – Negrave; $WFP, $MFLNRO)
o Kennedy Lake Measures & Foliars(2012 – MFLNRO – Negrave; $WFP, $MFLNRO)
o Suquash Sulphur fertilization effects (2012 – UBC – Grayston - $WFP, $NSERC)
o Vaccinium Trials, Demonstration Trials
o Ecosystem Function: Micorrhizal Communities; Carbon sequestration; Soil Moisture
Yellow Cypress Clonal Trials
o Manuscript (2012 – Baltunis; $TIB7)
o Genealogies
o Rootability (2012 - $WFP, $OTIP8)
6 NSERC: National Science and Engineering Research Council
7 TIB: Ministry Tree Improvement Branch
8 OTIP: Operational Tree Improvement Program

HARD COPIES OF THIS DOCUMENT ARE UNCONTROLLED. The current version is available on the Western intranet site. Page 159 of 160
Seed Orchard Pest Management
o Megastigmus population studies (2012 – UVic/CFS – VonAderkas & Clingen; $NSERC)
Pollination dynamics
o Douglas-fir PhD thesis (2012 – UBC – El Kassaby & Funda; $FGC9, $NSERC)
o Western redcedar (2012 – UBC – El Kassaby, $FGC, $NSERC)
Old-growth speckle-bellied Lichen
o OGS Lichen manuscript (2012 – VIU – Beese; $WFP)
Silviculture Practices for Climate Change
o Strategies and mitigation (2012 – VIU – Beese; $WFP)
Species at Risk
o Northern Goshawk (2012 – Manning; Horel; $WFP)
o Marbled Murrelet (2012 – Leigh-Spencer; $WFP)
Species Accounting System
o Species Groups Report (2012 – Bunnell, Kremsater, Vernier; $WFP)
Breeding Birds
o Report (2012 – Campbell; $WFP)
Regeneration Research
o Deer browse resistant redcedar (2012 - MFLNRO – Russell; $WFP, $MFLNRO)
o Fertilizing Douglas-fir for browse resistance
o Redcedar cold storage trials
Growth & Yield
Espacement Trials
Monitoring
The Operations Forester will plan for and track targets 1 and 2. Corporate Forestry will provide an annual research summary upon request for target 3. The Operations Forester will report the results of these targets in the SFM Plan Annual Report.
9 FGC: Forest Genetics Council