Embed Size (px)
Citation preview
1
b
SUSTAINABLE CONSUMPTION AND PRODUCTION INDICATORS FOR THE FUTURE SDGS UNEP Discussion Paper – March 2015
23 March 2015
2
_____________________________________ Copyright © United Nations Environment Programme, 2015 This publication may be reproduced in whole or in part and in any form for educational or non-‐profit purposes without special permission from the copyright holder, provided acknowledgement of the source is made. UNEP would appreciate receiving a copy of any publication that uses this publication as a source. No use of this publication may be made for resale or for any other commercial purpose whatsoever without prior permission in writing from the United Nations Environment Programme. Disclaimer The designations employed and the presentation of the material in this publication do not imply the expression of any opinion whatsoever on the part of the United Nations Environment Programme concerning the legal status of any country, territory, city or area or of its authorities, or concerning delimitation of its frontiers or boundaries. Moreover, the views expressed do not necessarily represent the decision or the stated policy of the United Nations Environment Programme, nor does citing of trade names or commercial processes constitute endorsement.

3
Acknowledgments
This report was developed by Livia Bizikova (IISD); Laszlo Pinter (CEU and IISD); Gabriel Huppe (IISD) and Heinz Schandl (CSIRO), with support from Charles Arden-‐Clarke, Sandra Averous, Alice Mansion and Clementine O’Connor (UNEP).
International Institute for Sustainable Development The International Institute for Sustainable Development (IISD) contributes to sustainable development by advancing policy recommendations on international trade and investment, economic policy, climate change and energy, and management of natural and social capital, as well as the enabling role of communication technologies in these areas. IISD also reports on international negotiations and disseminates knowledge gained through collaborative projects.
Website: www.iisd.org
Commonwealth Scientific and Industrial Research Organisation CSIRO, the Commonwealth Scientific and Industrial Research Organisation, is Australia's national science agency and one of the largest and most diverse research agencies in the world
Website: www.csiro.au United Nations Environment Programme The United Nations Environment Programme (UNEP) is the leading global environmental authority that sets the global environmental agenda, promotes the coherent implementation of the environmental dimension of sustainable development within the United Nations system and serves as an authoritative advocate for the global environment.
Website: www.unep.org
Sections of this report were reviewed by Stefan Bringezu (Wuppertal Institute, Germany), Laura Merrill (Ryerson University and IISD), Jeet Mistry (WWF), Cory Searcy (IISD), Peter Wooders (IISD), and UNEP (Maite Aldaya, Sara Castro, Garrette Clark, James Lomax, Tomas Marques, Fabienne Pierre, Pierre Quiblier, Helena Rey, Andrew Schmidt, Johanna Suikkanen, Elisa Tonda, Farid Yaker). We would like to thank the following for their valuable inputs: Julio Baena (MoE, Brazil); Raquel Breda (MoE, Brazil); Farrah Brown (Permanent Mission of Jamaica to the United Nations); Shaofeng Chen (Chinese Academy of Sciences); Jean-‐Pierre Cling and David Elkaïm (MoFA, France); Maria Cortes-‐Puch and Guido Schmidt-‐Traub (SDSN); Lambert Faabeluon (EPA, Ghana); Jochen Krimphoff (WWF, France); Annika Lindblom (MoE, Finland); Myriam Linster (OECD); Lars Mortensen (Copenhagen IRIS); Zeenat Niazi (Development Alternatives); Michael Obersteiner (International Institute for Applied Systems Analysis); Rodrigo Pizzaro (MoE, Chile); Hugo Schally (European Commission); (SDSN); Nick Schoon and Freya Seath (BioRegional); Mikkel Stenbæk Hansen (MoE, Denmark); Janos Zlinszki (Regional Environmental Centre – Hungary); and Stefanos Fotiou, Arab Hoballah, Jacqueline McGlade, Gisèle Muller, Ligia Noronha and Maryam Niamir-‐Füller (UNEP).
4
Contents EXECUTIVE SUMMARY ......................................................................................................................... 5 Introduction ........................................................................................................................................ 8 Summary of suggested indicators for targets relevant for SCP ............................................................ 10 Methodological approach ................................................................................................................... 13 Step 1: Identify those targets that contribute to making the shift to SCP patterns. .................. 14 Step 2: Identifying indicators which build synergies and complementarities between the
selected SCP-‐related targets, and have transformative potential for sustainable development .............................................................................................................................. 16
Step 3: Assessing data availability and identifying additional data and/or new indicators required by decision makers to guide the design of necessary response measures and to assess progress ........................................................................................................................... 19
Assessing the potential contributions of SCP-‐relevant targets to the Post-‐2015 Development Agenda and to Sustainable Development .................................................................................... 21
Overview and suggested indicators for the analysed targets ................................................................. 21 Targets in SDG 12 on SCP ........................................................................................................................... 21 Overview and suggested indicators for the analysed targets ................................................................. 49 Targets relevant for SCP in other SDGs ...................................................................................................... 49 Conclusions ........................................................................................................................................ 79
5
EXECUTIVE SUMMARY In the course of the ongoing discussions and negotiations on the post-‐2015 development agenda, a consensus emerged that current and future social, environmental and economic challenges are interlinked and must be addressed through an integrated approach. In the introduction of the outcome document of the 2012 United Nations Conference on Sustainable Development (Rio+20), The Future We Want, poverty eradication, the promotion of sustainable consumption and production (SCP) and the protection and management of natural resources are outlined as the “overarching objectives of and essential requirements for sustainable development” (UNGA Resolution 66/288, paragraph 4). In the same spirit of pursuing focused and coherent action on sustainable development, the intergovernmental Open Working Group (OWG) on the Sustainable Development Goals (SDGs) put forward, in July 2014, a proposal comprising 17 goals and 169 targets. The proposal makes achieving sustainable consumption and production (SCP) an integral component of the SDGs. SCP is reflected as a crosscutting enabler (in the form of both targets and means of implementation) for the achievement of many of the SDGs as well as in a stand-‐alone goal 12 on “ensuring sustainable consumption and production patterns”. Achieving the SDGs will first require translating the goals and targets into tangible and measurable objectives. A set of indicators is needed to monitor the interface between the economy, environment and society, and the resource use and waste flows that result from consumption and production activities. These indicators must also be designed to show whether and at what rate progress is being made towards sustainable consumption and production (SCP) patterns. There is a need to provide information to assist Member States in the identification of such indicators, strengthen the science base for designing policies and actions which support the shift to SCP patterns, and raise overall awareness of the sustainable development benefits that can be derived from a shift to SCP patterns. To this end, the present discussion paper highlights a number of potential indicators for a sub-‐set of the SCP-‐related targets in the proposed SDGs. The purpose is to contribute to the development of an integrated, science-‐based set of indicators to monitor progress towards SCP patterns which supports the achievement of the SDGs. An effort is made to identify indicators which can be applied to measure more than one target, and which contribute to making them transformative by building inter-‐linkages and complementarities between the targets and the goals which they underpin. The report also attempts to show that the use of positive indicators can help illustrate the return on investment in SCP. Wherever possible, positive indicators were selected in preference to others, to highlight benefits from SCP and to show that such progress could be the starter of virtuous circles of action. The report highlights the value of a stand-‐alone goal on ensuring SCP patterns, as well as the importance of having SCP-‐related targets in other goals, to ensure greater synergies between the goals. The report explores the lack of data availability for measuring progress and the technical and capacity issues faced by many countries with respect to collecting and reporting data necessary to operationalize SCP-‐related indicators for the SDGs. These challenges imply an elaborated and strengthened role on local and national monitoring and data collection for national statistical offices and relevant ministries, particularly Ministries of Environment.
6
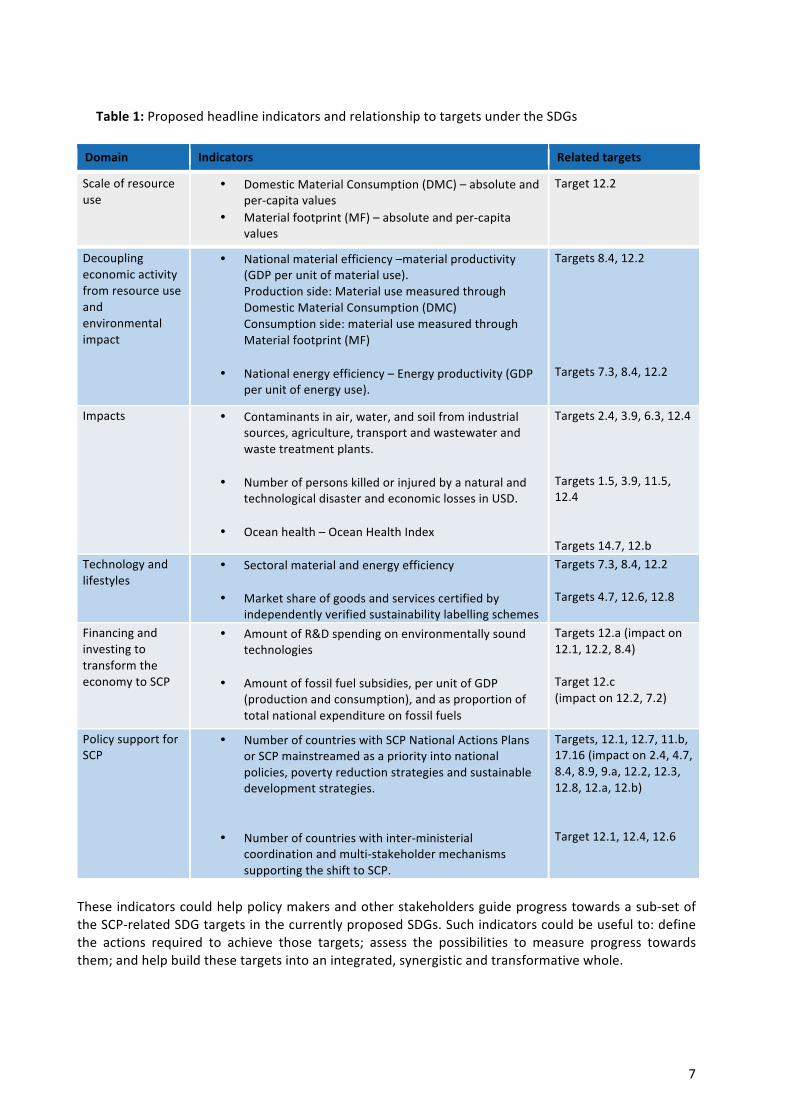
The report gives greater attention to identifying indicators for which data are currently available and also seeks to define which additional data and analysis are required. However in cases where specific indicators were seen as extremely relevant to measuring SCP-‐related targets, they are mentioned as important in the document, despite lack of information and data limitations. During the preparatory work for this report, a first analysis resulted in identification of around 200 indicators with multiple indicators for each target. To assist Member States and other stakeholders in considering potential indicators, these have been filtered and prioritized to reach a more manageable set of indicators, organized into six domains which can support a shift to SCP patterns. These domains include (1) scale of resource use, (2) decoupling, (3) environmental impact, (4) technology and lifestyles, (5) financing and investing for SCP, and (6) policy support for SCP. The following table summarises the six SCP domains outlined above, linking them through SCP-‐related indicators (second column). Every domain can be represented by a limited set of headline indicators which can serve as proxies for making progress towards SCP and the SDGs.
7
Table 1: Proposed headline indicators and relationship to targets under the SDGs
Domain Indicators Related targets
Scale of resource use
• Domestic Material Consumption (DMC) – absolute and per-‐capita values
• Material footprint (MF) – absolute and per-‐capita values
Target 12.2
Decoupling economic activity from resource use and environmental impact
• National material efficiency –material productivity (GDP per unit of material use). Production side: Material use measured through Domestic Material Consumption (DMC) Consumption side: material use measured through Material footprint (MF)
• National energy efficiency – Energy productivity (GDP
per unit of energy use).
Targets 8.4, 12.2 Targets 7.3, 8.4, 12.2
Impacts
• Contaminants in air, water, and soil from industrial sources, agriculture, transport and wastewater and waste treatment plants.
• Number of persons killed or injured by a natural and
technological disaster and economic losses in USD.
• Ocean health – Ocean Health Index
Targets 2.4, 3.9, 6.3, 12.4 Targets 1.5, 3.9, 11.5, 12.4 Targets 14.7, 12.b
Technology and lifestyles
• Sectoral material and energy efficiency
• Market share of goods and services certified by independently verified sustainability labelling schemes
Targets 7.3, 8.4, 12.2 Targets 4.7, 12.6, 12.8
Financing and investing to transform the economy to SCP
• Amount of R&D spending on environmentally sound technologies
• Amount of fossil fuel subsidies, per unit of GDP
(production and consumption), and as proportion of total national expenditure on fossil fuels
Targets 12.a (impact on 12.1, 12.2, 8.4) Target 12.c (impact on 12.2, 7.2)
Policy support for SCP
• Number of countries with SCP National Actions Plans or SCP mainstreamed as a priority into national policies, poverty reduction strategies and sustainable development strategies.
• Number of countries with inter-‐ministerial coordination and multi-‐stakeholder mechanisms supporting the shift to SCP.
Targets, 12.1, 12.7, 11.b, 17.16 (impact on 2.4, 4.7, 8.4, 8.9, 9.a, 12.2, 12.3, 12.8, 12.a, 12.b) Target 12.1, 12.4, 12.6
These indicators could help policy makers and other stakeholders guide progress towards a sub-‐set of the SCP-‐related SDG targets in the currently proposed SDGs. Such indicators could be useful to: define the actions required to achieve those targets; assess the possibilities to measure progress towards them; and help build these targets into an integrated, synergistic and transformative whole.
8
Introduction It has become ever more important to understand and help resolve the important social and environmental challenges of our time. This is the main aim of the sustainable development goals (SDGs); an aim shared by the concepts and practices of Sustainable Consumption and Production (SCP). The concept of SCP links economic processes to the environment and natural resources and provides policy instruments and tools to encourage cleaner production and responsible consumption. It arose out of a definitional process, based both on practice and on international negotiations that took place over several decades. A broadly and commonly accepted definition of SCP today refers to “the production and use of services and related products, which respond to basic needs and bring a better quality of life while minimizing the use of natural resources and toxic materials as well as the emissions of waste and pollutants over the life cycle of the service or product so as not to jeopardize the needs of future generations”. This is derived from a closely related definition of sustainable consumption generated in a multi-‐stakeholder workshop in Norway in 1994 (UNEP 2012; Norway Ministry of Environment 1994).1 The outcome document of the 2012 United Nations Conference on Sustainable Development (Rio+20), The Future We Want, calls for “protecting and managing the natural resource base for economic and social development”, providing renewed appreciation that natural resources and well-‐functioning ecosystems are a necessary condition of human development. Poverty eradication, the promotion of sustainable consumption and production (SCP), and the protection and management of natural resources are outlined as the “overarching objectives of and essential requirements for sustainable development” (United Nations General Assembly (UNGA) resolution 66/288, paragraph 4). Presently, SCP is seen as a fundamental instrument for mitigating environmental degradation and resource depletion that often result from economic growth. SCP policies and programmes summarized in the Ten Year Framework of Programmes on Sustainable Consumption and Production Patterns (10YFP) are helping to secure the resource base which underpins development by enhancing resource efficiency. Higher resource efficiency contributes to minimizing directly harmful effects on humans and to reducing pressure on ecosystems and their ability to provide essential goods and services. SCP thus is key in establishing the fundamentals for increasing quality of life for all (UNEP 2012). An important outcome from Rio+20 was the mandate to establish an inclusive and transparent intergovernmental process aiming to develop global sustainable development goals (SDGs). Covering high priority issues in all dimensions of sustainable development, the SDGs will be universally applicable to all UN Member States and will take the place of the expiring Millennium Development Goals (MDGs). The outcome document The Future We Want mandated the creation of an intergovernmental Open Working Group (OWG) tasked with putting together a proposal for SDGs for consideration by the General Assembly, and for adoption at the UN Sustainable Development Summit in New York meeting in September 2015. Established in 2013, the OWG met 13 times between March 2013 and July 2014. At its seventh session – dedicated to sustainable cities and human settlements, sustainable transport, sustainable consumption and production (including chemicals and waste), and to climate change and disaster risk reduction – member states acknowledged the need to decouple resource use from economic growth and environmental degradation as a central requirement for the shift towards SCP.
1 The original definition of sustainable consumption was developed during the Oslo Symposium on Sustainable Consumption in 1994.
9
In July 2014 the OWG put forward a proposal for SDGs comprising 17 goals and 169 targets (UN 2014).2 This proposal was further supported by the Synthesis Report of the Secretary-‐General on the Post-‐2015 agenda – “The Road to Dignity by 2030: Ending Poverty, Transforming All Lives and Protecting the Planet” – issued on 4 December 2014 (UN 2014)3. Embedding the objective of SCP in the SDGs can support a shift to sustainable patterns of production and consumption and improving systems of provision. Those patterns will in turn result in reduced environmental impacts due to more efficient resource consumption and reduced waste, and will enable countries to achieve their goals in poverty eradication without undermining the basis of human development. In the OWG proposal for the SDGs of 19th July 2014, the objective of SCP and the more specific objectives, functions and programmes of the Ten Year Framework of Programmes on Sustainable Consumption and Production Patterns (the “10YFP”) are reflected in targets in 13 out of the 17 proposed SDGs. The proposed Goal 12 explicitly refers to the need to “ensure sustainable consumption and production patterns”. Turning the SDGs into reality will require turning the goals’ general aspirations into tangible details and implementation measures. The intergovernmental negotiations on the Post-‐2015 Development Agenda have started in January 2015 in New York, with a view to having discussions also on the means of implementation (MoI) and global partnership. An important element of the Post-‐2015 negotiations is likely to focus on identifying indicators that are essential for effective and accountable governance. While general efforts to develop SDG indicators are under way (e.g., SDSN 2015; Pinter et al. 2014)4, there is a need for more detailed work that takes the specifics of SCP into account, helping to craft and implement SCP programs and policies relevant to the SDGs. Besides helping to specify the details of SCP, indicators built into policies and decisions can also serve as high-‐leverage starting points for achieving a transition and ultimately a transformation of inefficient and unsustainable production and consumption patterns into ones that support achievement of the SDGs and sustainable development generally. Thus, the purpose of this document is to:
-‐ Provide information to assist Member States to identify indicators for targets proposed under SDG 12 (“Ensure Sustainable Consumption and Production Patterns”) and for some of the SCP-‐related targets in the other proposed SDGs;
-‐ Suggest indicators that can contribute to making these targets transformative, and to developing inter-‐linkages and complementarities between them so as to simultaneously support the achievement of other goals and targets;
-‐ Make targets “actionable”, by identifying indicators for which data are currently available and by defining what additional data and analysis are required.
2 UN. (2014) Open Working Group Proposal for Sustainable Development Goals. New York: United Nations. Available at: https://sustainabledevelopment.un.org/index.php?page=view&type=400&nr=1579&menu=1300 3 UN. (2014a) The Road to Dignity by 2030: Ending Poverty, Transforming All Lives and Protecting the Planet. Synthesis Report of the Secretary-‐General on the Post-‐2015 Agenda. New York: UN. Available at: http://www.un.org/disabilities/documents/reports/SG_Synthesis_Report_Road_to_Dignity_by_2030.pdf 4 Pinter, L., D. Almassy and S. Hatakeyama. (2014) Sustainable development goals for a small planet: Connecting the global to the national level in 14 countries of Asia-‐Pacific and Europe. Part II: Measuring Sustainability. Singapore: Asia-‐Europe Foundation. Available at: http://www.asef.org/images/stories/publications/documents/ENVforum-‐Part_II-‐Measuring_Sustainability.pdf SDSN. (2015) Indicators and a Monitoring Framework for Sustainable Development Goals. Launching a Data Revolution for the SDGs. A report by the Leadership Council of the Sustainable Development Solutions Network. Revised working draft (Version 6), February 18, 2015
10
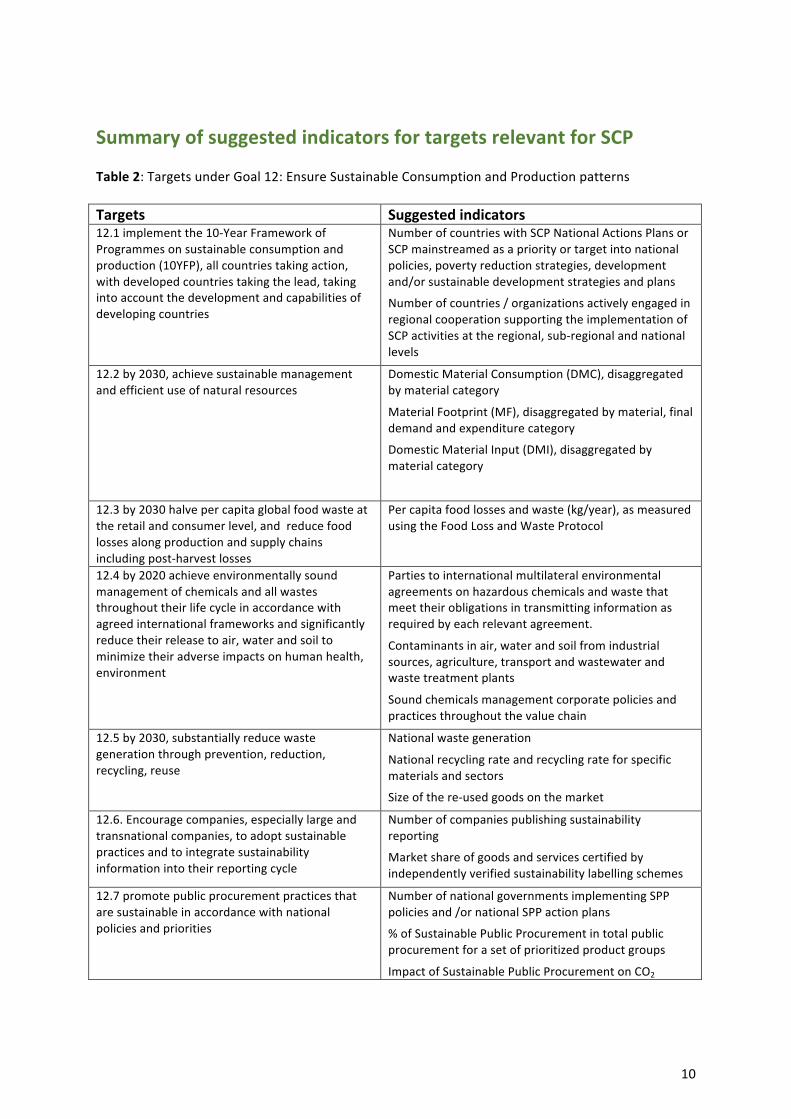
Summary of suggested indicators for targets relevant for SCP Table 2: Targets under Goal 12: Ensure Sustainable Consumption and Production patterns Targets Suggested indicators 12.1 implement the 10-‐Year Framework of Programmes on sustainable consumption and production (10YFP), all countries taking action, with developed countries taking the lead, taking into account the development and capabilities of developing countries
Number of countries with SCP National Actions Plans or SCP mainstreamed as a priority or target into national policies, poverty reduction strategies, development and/or sustainable development strategies and plans
Number of countries / organizations actively engaged in regional cooperation supporting the implementation of SCP activities at the regional, sub-‐regional and national levels
12.2 by 2030, achieve sustainable management and efficient use of natural resources
Domestic Material Consumption (DMC), disaggregated by material category
Material Footprint (MF), disaggregated by material, final demand and expenditure category
Domestic Material Input (DMI), disaggregated by material category
12.3 by 2030 halve per capita global food waste at the retail and consumer level, and reduce food losses along production and supply chains including post-‐harvest losses
Per capita food losses and waste (kg/year), as measured using the Food Loss and Waste Protocol
12.4 by 2020 achieve environmentally sound management of chemicals and all wastes throughout their life cycle in accordance with agreed international frameworks and significantly reduce their release to air, water and soil to minimize their adverse impacts on human health, environment
Parties to international multilateral environmental agreements on hazardous chemicals and waste that meet their obligations in transmitting information as required by each relevant agreement.
Contaminants in air, water and soil from industrial sources, agriculture, transport and wastewater and waste treatment plants
Sound chemicals management corporate policies and practices throughout the value chain
12.5 by 2030, substantially reduce waste generation through prevention, reduction, recycling, reuse
National waste generation
National recycling rate and recycling rate for specific materials and sectors
Size of the re-‐used goods on the market
12.6. Encourage companies, especially large and transnational companies, to adopt sustainable practices and to integrate sustainability information into their reporting cycle
Number of companies publishing sustainability reporting
Market share of goods and services certified by independently verified sustainability labelling schemes
12.7 promote public procurement practices that are sustainable in accordance with national policies and priorities
Number of national governments implementing SPP policies and /or national SPP action plans
% of Sustainable Public Procurement in total public procurement for a set of prioritized product groups
Impact of Sustainable Public Procurement on CO2

11
emissions2
12.8 by 2030, ensure that people everywhere have the relevant information and awareness for sustainable development and lifestyles in harmony with nature
SCP mainstreamed into formal education
Number of countries implementing the UN Guidelines for Consumer Protection
Market share of goods and services certified by independently verified sustainability labelling schemes
Frequency of researches online for key words with direct links with sustainable development and lifestyles
12.a Support developing countries to strengthen their scientific and technological capacity to move towards more sustainable patterns of consumption and production
Number of qualified green patent applications
R&D spending on environmentally sound technologies
International co-‐authorship in the field of SCP
12.b Develop and implement tools to monitor sustainable development impacts for sustainable tourism that creates jobs and promotes local culture and products
Adopted national policies to frame sustainability in tourism operation
Number of countries that monitor waste, energy, water, and emissions at sector level
12.c Rationalize inefficient fossil-‐fuel subsidies that encourage wasteful consumption by removing market distortions, in accordance with national circumstances, including by restructuring taxation and phasing out those harmful subsidies, where they exist, to reflect their environmental impacts, taking fully into account the specific needs and conditions of developing countries and minimizing the possible adverse impacts on their development in a manner that protects the poor and the affected communities
Amount of fossil fuel subsidies
Table 3: SCP related targets in other goals Targets Suggested indicators 1.5 by 2030 build the resilience of the poor and those in vulnerable situations, and reduce their exposure and vulnerability to climate-‐related extreme events and other economic, social and environmental shocks and disasters
Number of persons killed, or injured by a natural and technological disaster, and economic losses in USD
Number of environmental impact assessments for new investments that are integrating the reduction of vulnerability/ disaster risk reduction
Number of countries with national and local disaster risk reduction strategies
2.4 by 2030 ensure sustainable food production systems and implement resilient agricultural practices that increase productivity and production, that help maintain ecosystems, that strengthen capacity for adaptation to climate change, extreme weather, drought, flooding and other disasters, and that progressively improve land and soil quality
Land conversion rates
Crop nitrogen–use efficiency
Agricultural productivity
Proportion of land under climate smart and sustainable technologies and practices
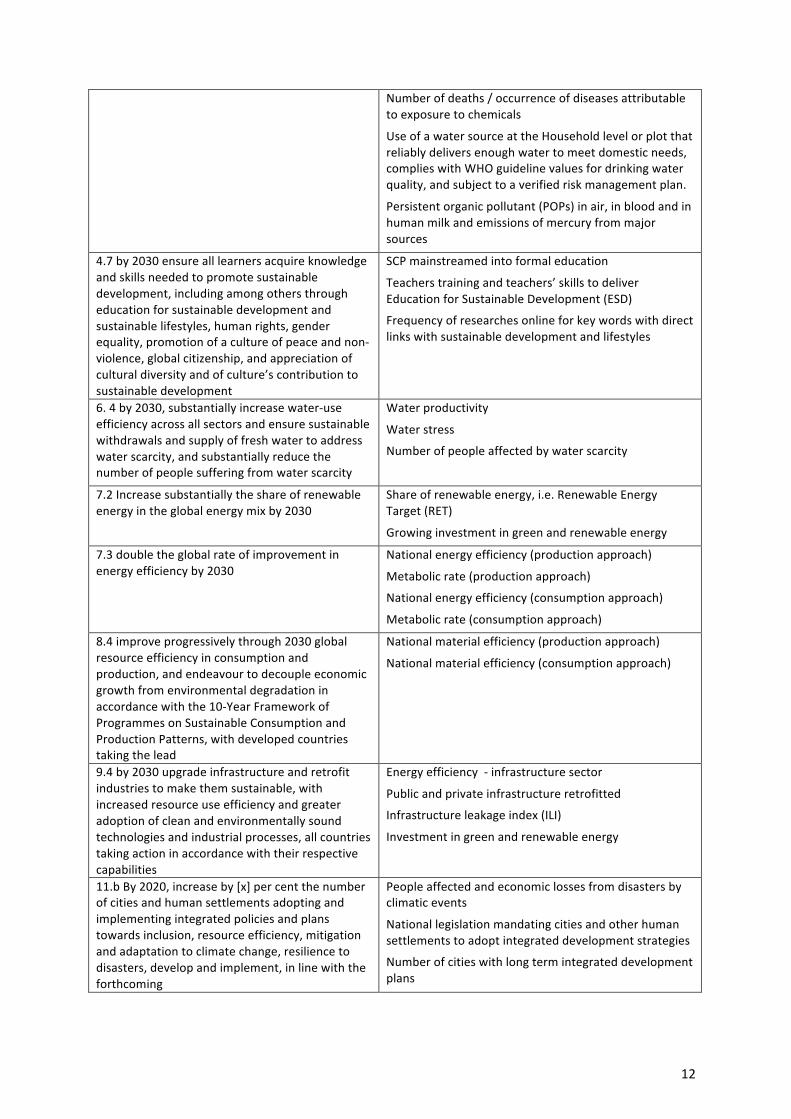
3.9 By 2030, substantially reduce the number of deaths and illnesses from hazardous chemicals and air, water and soil pollution and contamination
Number of premature deaths attributable to outdoor and indoor air pollution
12
Number of deaths / occurrence of diseases attributable to exposure to chemicals
Use of a water source at the Household level or plot that reliably delivers enough water to meet domestic needs, complies with WHO guideline values for drinking water quality, and subject to a verified risk management plan.
Persistent organic pollutant (POPs) in air, in blood and in human milk and emissions of mercury from major sources
4.7 by 2030 ensure all learners acquire knowledge and skills needed to promote sustainable development, including among others through education for sustainable development and sustainable lifestyles, human rights, gender equality, promotion of a culture of peace and non-‐violence, global citizenship, and appreciation of cultural diversity and of culture’s contribution to sustainable development
SCP mainstreamed into formal education
Teachers training and teachers’ skills to deliver Education for Sustainable Development (ESD)
Frequency of researches online for key words with direct links with sustainable development and lifestyles
6. 4 by 2030, substantially increase water-‐use efficiency across all sectors and ensure sustainable withdrawals and supply of fresh water to address water scarcity, and substantially reduce the number of people suffering from water scarcity
Water productivity
Water stress
Number of people affected by water scarcity
7.2 Increase substantially the share of renewable energy in the global energy mix by 2030
Share of renewable energy, i.e. Renewable Energy Target (RET)
Growing investment in green and renewable energy
7.3 double the global rate of improvement in energy efficiency by 2030
National energy efficiency (production approach)
Metabolic rate (production approach)
National energy efficiency (consumption approach)
Metabolic rate (consumption approach)
8.4 improve progressively through 2030 global resource efficiency in consumption and production, and endeavour to decouple economic growth from environmental degradation in accordance with the 10-‐Year Framework of Programmes on Sustainable Consumption and Production Patterns, with developed countries taking the lead
National material efficiency (production approach)
National material efficiency (consumption approach)
9.4 by 2030 upgrade infrastructure and retrofit industries to make them sustainable, with increased resource use efficiency and greater adoption of clean and environmentally sound technologies and industrial processes, all countries taking action in accordance with their respective capabilities
Energy efficiency -‐ infrastructure sector
Public and private infrastructure retrofitted
Infrastructure leakage index (ILI)
Investment in green and renewable energy
11.b By 2020, increase by [x] per cent the number of cities and human settlements adopting and implementing integrated policies and plans towards inclusion, resource efficiency, mitigation and adaptation to climate change, resilience to disasters, develop and implement, in line with the forthcoming
People affected and economic losses from disasters by climatic events
National legislation mandating cities and other human settlements to adopt integrated development strategies
Number of cities with long term integrated development plans
13
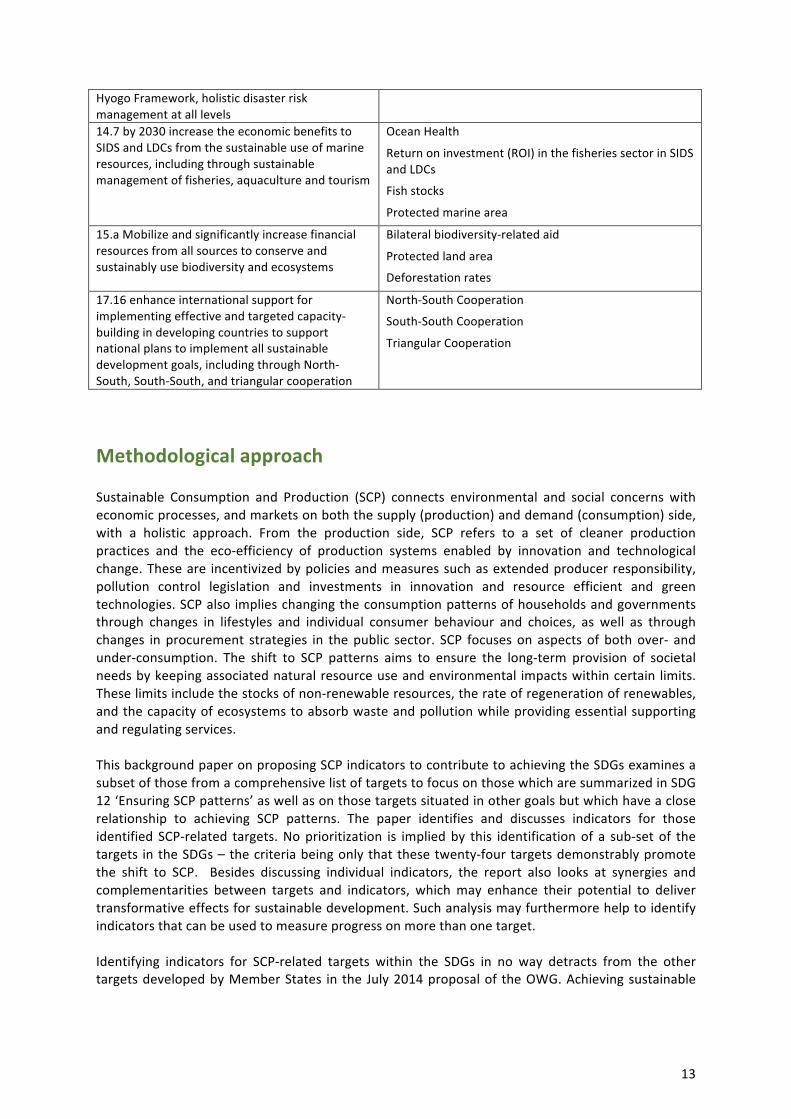
Hyogo Framework, holistic disaster risk management at all levels 14.7 by 2030 increase the economic benefits to SIDS and LDCs from the sustainable use of marine resources, including through sustainable management of fisheries, aquaculture and tourism
Ocean Health
Return on investment (ROI) in the fisheries sector in SIDS and LDCs
Fish stocks
Protected marine area
15.a Mobilize and significantly increase financial resources from all sources to conserve and sustainably use biodiversity and ecosystems
Bilateral biodiversity-‐related aid
Protected land area
Deforestation rates
17.16 enhance international support for implementing effective and targeted capacity-‐building in developing countries to support national plans to implement all sustainable development goals, including through North-‐South, South-‐South, and triangular cooperation
North-‐South Cooperation
South-‐South Cooperation
Triangular Cooperation
Methodological approach Sustainable Consumption and Production (SCP) connects environmental and social concerns with economic processes, and markets on both the supply (production) and demand (consumption) side, with a holistic approach. From the production side, SCP refers to a set of cleaner production practices and the eco-‐efficiency of production systems enabled by innovation and technological change. These are incentivized by policies and measures such as extended producer responsibility, pollution control legislation and investments in innovation and resource efficient and green technologies. SCP also implies changing the consumption patterns of households and governments through changes in lifestyles and individual consumer behaviour and choices, as well as through changes in procurement strategies in the public sector. SCP focuses on aspects of both over-‐ and under-‐consumption. The shift to SCP patterns aims to ensure the long-‐term provision of societal needs by keeping associated natural resource use and environmental impacts within certain limits. These limits include the stocks of non-‐renewable resources, the rate of regeneration of renewables, and the capacity of ecosystems to absorb waste and pollution while providing essential supporting and regulating services. This background paper on proposing SCP indicators to contribute to achieving the SDGs examines a subset of those from a comprehensive list of targets to focus on those which are summarized in SDG 12 ‘Ensuring SCP patterns’ as well as on those targets situated in other goals but which have a close relationship to achieving SCP patterns. The paper identifies and discusses indicators for those identified SCP-‐related targets. No prioritization is implied by this identification of a sub-‐set of the targets in the SDGs – the criteria being only that these twenty-‐four targets demonstrably promote the shift to SCP. Besides discussing individual indicators, the report also looks at synergies and complementarities between targets and indicators, which may enhance their potential to deliver transformative effects for sustainable development. Such analysis may furthermore help to identify indicators that can be used to measure progress on more than one target. Identifying indicators for SCP-‐related targets within the SDGs in no way detracts from the other targets developed by Member States in the July 2014 proposal of the OWG. Achieving sustainable
14
development will require an array of policies, private sector action, investment decisions and individual consumer and lifestyle choices that go well beyond those required to make the shift to SCP patterns. As such, the proposal of the OWG on SDGs delivered in July 2014 has a wider scope and application than the SCP-‐related targets and indicators discussed in the present paper. Nonetheless, by securing the natural resource base and environment on which development is founded, the achievement of SCP-‐related targets will also support and contribute to the achievement of all other goals and targets. Step 1: Identify those targets that contribute to making the shift to SCP patterns. In the OWG proposal there are 169 suggested SDG targets. Several capture aspects of SCP necessary to advance sustainable development in the future. Shifting towards SCP patterns and/or the objectives, functions and programmes laid out in the Ten Year Framework of Programmes on Sustainable Consumption and Production Patterns (the “10YFP”) are directly reflected in targets associated with 13 out of the 17 SDGs (listed in Table 1). One of those goals – proposed SDG 12 – focuses on “ensuring” SCP patterns explicitly, whereas other targets “mainstream” the objective of SCP into a number of the other SDGs.5 The International Council for Science (ICSU), in partnership with the International Social Science Council (ISSC) recently launched a “Review of Targets for the Sustainable Development Goals: The Science Perspective (2015)”6, which highlights, among others, the linkages between the goal 12 on SCP and targets in other goals. The ICSU analysis reveals this linkage between goal 12 and targets in other goals is due to the relevance of SCP to basic needs and improving quality of life. The report highlights that linkages with SCP “… are the most important links between the SDGs reviewed in this chapter and other goals and targets. These links will need to be accounted for in implementation and monitoring in order to have a successful outcome.” Targets in this paper were chosen after an assessment of the peer-‐reviewed literature on recommendations for advancing SCP. This assessment took place in June 2014, and was refined after the OWG proposal. The preliminary list of targets and indicators was then reviewed in a stakeholder workshop in December 2014 in Paris.
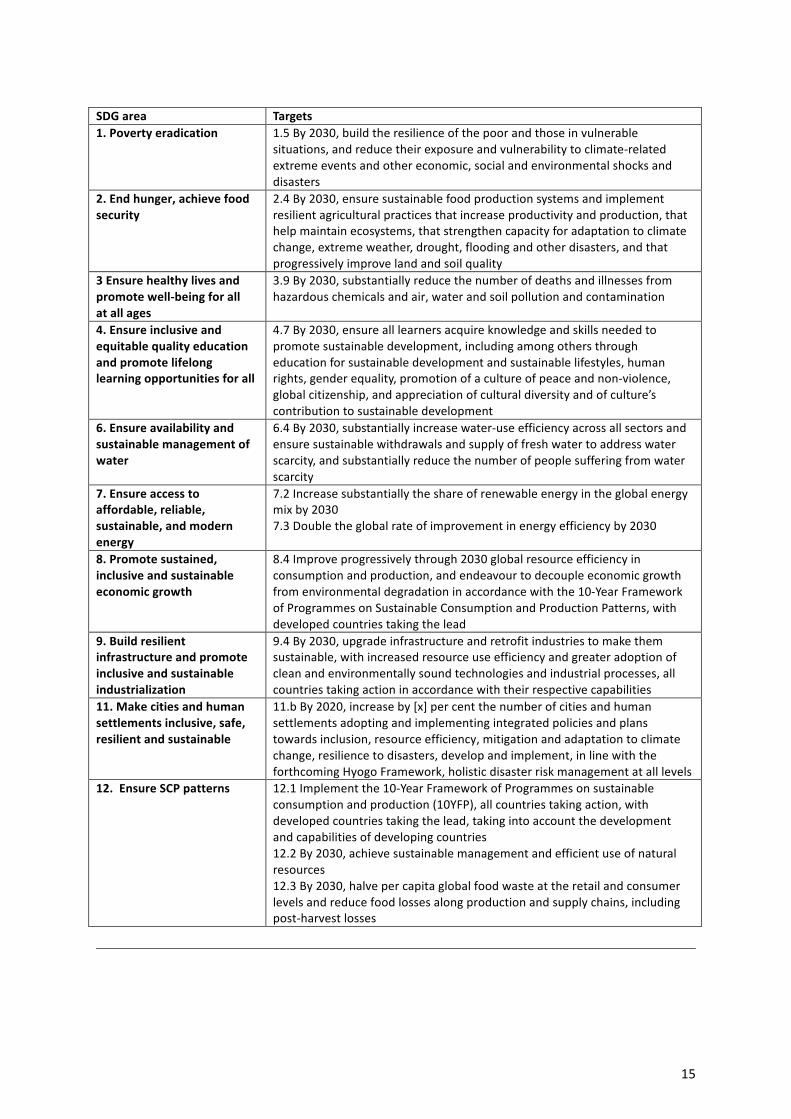
The selected targets include those that enable or indirectly relate to SCP through core pressures and impacts on ecosystems and the human population and also targets under SDG 12 with direct focus on SCP. The list of targets was intentionally restricted to a limited number in order to keep the discussion paper to a reasonable length. Table 4. Overview of the SDGs and relevant targets reviewed in this paper7
5 In this paper we focused on targets relevant for SCP directly or indirectly. In the next phases we consider crucial to look specifically on potential conflicts at the levels of targets and suggested indicators to ensure coherence in achieving SDG goals. 6 ICSU, ISSC (2015): Review of the Sustainable Development Goals: The Science Perspective. Paris: International Council for Science (ICSU). 7 Selected from: UN. (2014) Open Working Group Proposal for Sustainable Development Goals. New York: United Nations. Available at: https://sustainabledevelopment.un.org/index.php?page=view&type=400&nr=1579&menu=1300
15
SDG area Targets 1. Poverty eradication
1.5 By 2030, build the resilience of the poor and those in vulnerable situations, and reduce their exposure and vulnerability to climate-‐related extreme events and other economic, social and environmental shocks and disasters
2. End hunger, achieve food security
2.4 By 2030, ensure sustainable food production systems and implement resilient agricultural practices that increase productivity and production, that help maintain ecosystems, that strengthen capacity for adaptation to climate change, extreme weather, drought, flooding and other disasters, and that progressively improve land and soil quality
3 Ensure healthy lives and promote well-‐being for all at all ages
3.9 By 2030, substantially reduce the number of deaths and illnesses from hazardous chemicals and air, water and soil pollution and contamination
4. Ensure inclusive and equitable quality education and promote lifelong learning opportunities for all
4.7 By 2030, ensure all learners acquire knowledge and skills needed to promote sustainable development, including among others through education for sustainable development and sustainable lifestyles, human rights, gender equality, promotion of a culture of peace and non-‐violence, global citizenship, and appreciation of cultural diversity and of culture’s contribution to sustainable development
6. Ensure availability and sustainable management of water
6.4 By 2030, substantially increase water-‐use efficiency across all sectors and ensure sustainable withdrawals and supply of fresh water to address water scarcity, and substantially reduce the number of people suffering from water scarcity
7. Ensure access to affordable, reliable, sustainable, and modern energy
7.2 Increase substantially the share of renewable energy in the global energy mix by 2030 7.3 Double the global rate of improvement in energy efficiency by 2030
8. Promote sustained, inclusive and sustainable economic growth
8.4 Improve progressively through 2030 global resource efficiency in consumption and production, and endeavour to decouple economic growth from environmental degradation in accordance with the 10-‐Year Framework of Programmes on Sustainable Consumption and Production Patterns, with developed countries taking the lead
9. Build resilient infrastructure and promote inclusive and sustainable industrialization
9.4 By 2030, upgrade infrastructure and retrofit industries to make them sustainable, with increased resource use efficiency and greater adoption of clean and environmentally sound technologies and industrial processes, all countries taking action in accordance with their respective capabilities
11. Make cities and human settlements inclusive, safe, resilient and sustainable
11.b By 2020, increase by [x] per cent the number of cities and human settlements adopting and implementing integrated policies and plans towards inclusion, resource efficiency, mitigation and adaptation to climate change, resilience to disasters, develop and implement, in line with the forthcoming Hyogo Framework, holistic disaster risk management at all levels
12. Ensure SCP patterns 12.1 Implement the 10-‐Year Framework of Programmes on sustainable consumption and production (10YFP), all countries taking action, with developed countries taking the lead, taking into account the development and capabilities of developing countries 12.2 By 2030, achieve sustainable management and efficient use of natural resources 12.3 By 2030, halve per capita global food waste at the retail and consumer levels and reduce food losses along production and supply chains, including post-‐harvest losses
16
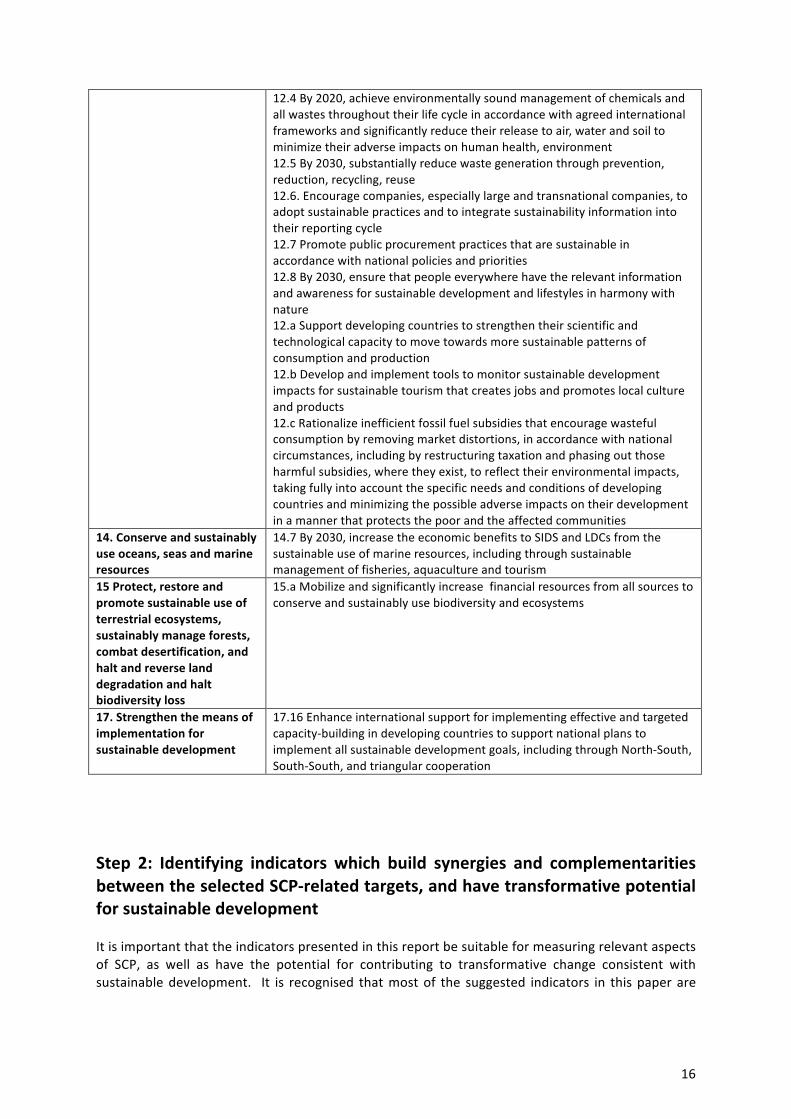
12.4 By 2020, achieve environmentally sound management of chemicals and all wastes throughout their life cycle in accordance with agreed international frameworks and significantly reduce their release to air, water and soil to minimize their adverse impacts on human health, environment 12.5 By 2030, substantially reduce waste generation through prevention, reduction, recycling, reuse 12.6. Encourage companies, especially large and transnational companies, to adopt sustainable practices and to integrate sustainability information into their reporting cycle 12.7 Promote public procurement practices that are sustainable in accordance with national policies and priorities 12.8 By 2030, ensure that people everywhere have the relevant information and awareness for sustainable development and lifestyles in harmony with nature 12.a Support developing countries to strengthen their scientific and technological capacity to move towards more sustainable patterns of consumption and production 12.b Develop and implement tools to monitor sustainable development impacts for sustainable tourism that creates jobs and promotes local culture and products 12.c Rationalize inefficient fossil fuel subsidies that encourage wasteful consumption by removing market distortions, in accordance with national circumstances, including by restructuring taxation and phasing out those harmful subsidies, where they exist, to reflect their environmental impacts, taking fully into account the specific needs and conditions of developing countries and minimizing the possible adverse impacts on their development in a manner that protects the poor and the affected communities
14. Conserve and sustainably use oceans, seas and marine resources
14.7 By 2030, increase the economic benefits to SIDS and LDCs from the sustainable use of marine resources, including through sustainable management of fisheries, aquaculture and tourism
15 Protect, restore and promote sustainable use of terrestrial ecosystems, sustainably manage forests, combat desertification, and halt and reverse land degradation and halt biodiversity loss
15.a Mobilize and significantly increase financial resources from all sources to conserve and sustainably use biodiversity and ecosystems
17. Strengthen the means of implementation for sustainable development
17.16 Enhance international support for implementing effective and targeted capacity-‐building in developing countries to support national plans to implement all sustainable development goals, including through North-‐South, South-‐South, and triangular cooperation
Step 2: Identifying indicators which build synergies and complementarities between the selected SCP-‐related targets, and have transformative potential for sustainable development It is important that the indicators presented in this report be suitable for measuring relevant aspects of SCP, as well as have the potential for contributing to transformative change consistent with sustainable development. It is recognised that most of the suggested indicators in this paper are

17
global in nature, aiming at being universally applicable, while they may have to be adapted to the needs and capabilities of countries, or complemented by national level indicators that are country specific. To address the need for indicators with these characteristics, the paper identified a series of properties and objectives that contribute to the achievement of SCP (see Table 2), and which are considered centrally important to the 10YFP. They are associated with the implementation of each target and its overall value to society, informing the selection of indicators so that they reflect these properties and objectives associated with the shift to SCP patterns. Assuming that for a given SCP-‐related target a reversal of present trends is desired (e.g., reducing pressures and impacts, for example, related to the emission of harmful by-‐products in an industrial manufacturing process), the target must take into account both the present base value and direction of trends (including inertia) of the SCP variable, and the progress desired (or sufficient) in the long term. It must also be feasible to achieve over the SDG implementation period. The properties also include a reference to critical thresholds associated with the SCP variable that should be avoided. The qualitative properties employed for indicator selection cover six critical aspects.
1. Resource and critical thresholds/carrying capacity: Critical thresholds and carrying capacity are notoriously difficult to establish and often only the collapse of ecosystems, sharp spikes in the impact of certain pollutants and other non-‐linear effects demonstrate that they exist. Nevertheless, identifying indicators that measure levels and trends associated with perturbations of critical Earth System processes that may contribute to crossing critical thresholds can be extremely important for policy. Even if they cannot pinpoint thresholds precisely, indicators can provide early warning and draw the attention of decision-‐makers and the public to the issue.
2. Decoupling: The need to decouple economic growth from escalating resource use and
environmental degradation and negative impacts on human health is increasingly evident. Decoupling has been put forward as a policy goal by the International Resource Panel (IRP) that distinguishes two types of decoupling (UNEP 2011)8:
1. A: Resource decoupling that commonly refers to the relationship between economic
growth (economic activity) and the level of primary resource use; and 1. B: Impact decoupling that refers to the relationship between economic activity and its
environmental impacts, as measured by impact and state indicators.
3. Social benefits encompasses the manner in which SCP contributes to a society’s improved access to better quality and more sustainable goods and services to meet its needs, while at
8 Moreover, the International Resource Panel distinguishes relative decoupling (the rate of resource use increase is lower than the rate of economic growth) from absolute decoupling (resource use declines while the economy grows): UNEP (2011) Decoupling natural resource use and environmental impacts from economic growth, A Report of the Working Group on Decoupling to the International Resource Panel. Fischer-‐Kowalski, M., Swilling, M., von Weizsäcker, E.U., Ren, Y., Moriguchi, Y., Crane, W., Krausmann, F., Eisenmenger, N., Giljum, S., Hennicke, P., Romero Lankao, P., Siriban Manalang, A., Sewerin, S.).
18
the same time reducing environmental degradation caused by consumption. The indicator set is assessed for its ability to measure the social benefits of SCP activities.
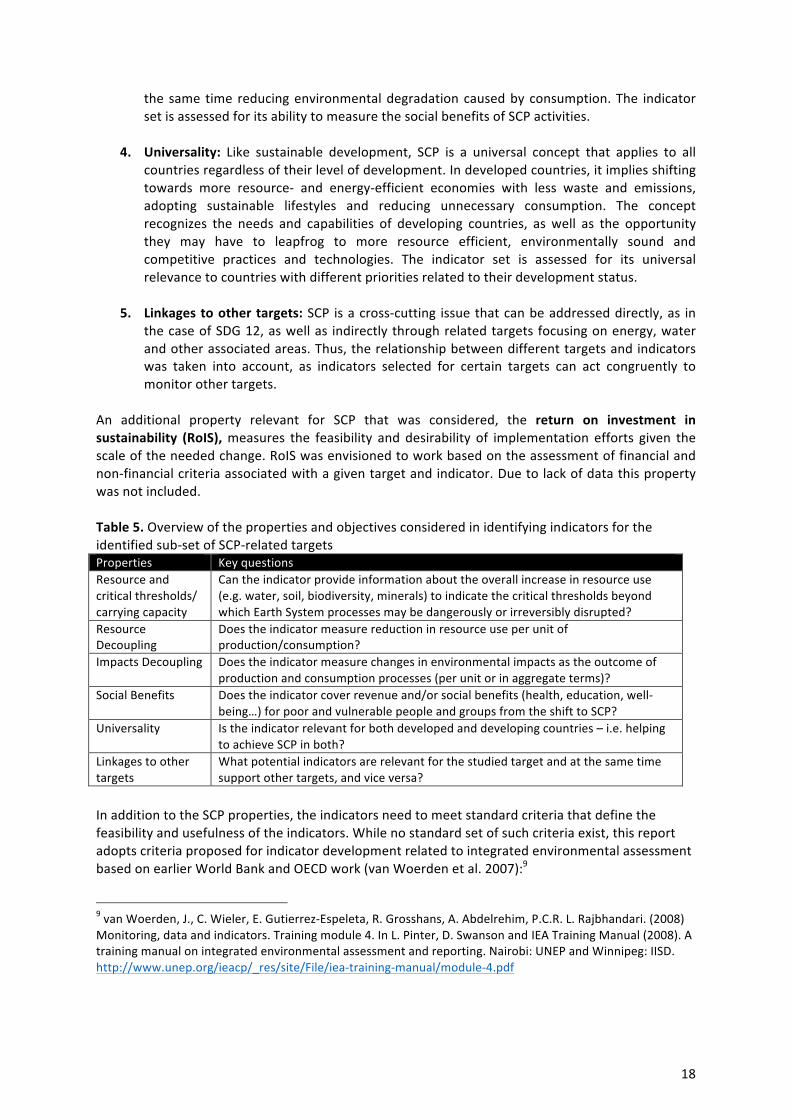
4. Universality: Like sustainable development, SCP is a universal concept that applies to all countries regardless of their level of development. In developed countries, it implies shifting towards more resource-‐ and energy-‐efficient economies with less waste and emissions, adopting sustainable lifestyles and reducing unnecessary consumption. The concept recognizes the needs and capabilities of developing countries, as well as the opportunity they may have to leapfrog to more resource efficient, environmentally sound and competitive practices and technologies. The indicator set is assessed for its universal relevance to countries with different priorities related to their development status.
5. Linkages to other targets: SCP is a cross-‐cutting issue that can be addressed directly, as in the case of SDG 12, as well as indirectly through related targets focusing on energy, water and other associated areas. Thus, the relationship between different targets and indicators was taken into account, as indicators selected for certain targets can act congruently to monitor other targets.
An additional property relevant for SCP that was considered, the return on investment in sustainability (RoIS), measures the feasibility and desirability of implementation efforts given the scale of the needed change. RoIS was envisioned to work based on the assessment of financial and non-‐financial criteria associated with a given target and indicator. Due to lack of data this property was not included. Table 5. Overview of the properties and objectives considered in identifying indicators for the identified sub-‐set of SCP-‐related targets Properties Key questions Resource and critical thresholds/ carrying capacity
Can the indicator provide information about the overall increase in resource use (e.g. water, soil, biodiversity, minerals) to indicate the critical thresholds beyond which Earth System processes may be dangerously or irreversibly disrupted?
Resource Decoupling
Does the indicator measure reduction in resource use per unit of production/consumption?
Impacts Decoupling Does the indicator measure changes in environmental impacts as the outcome of production and consumption processes (per unit or in aggregate terms)?
Social Benefits Does the indicator cover revenue and/or social benefits (health, education, well-‐being…) for poor and vulnerable people and groups from the shift to SCP?
Universality Is the indicator relevant for both developed and developing countries – i.e. helping to achieve SCP in both?
Linkages to other targets
What potential indicators are relevant for the studied target and at the same time support other targets, and vice versa?
In addition to the SCP properties, the indicators need to meet standard criteria that define the feasibility and usefulness of the indicators. While no standard set of such criteria exist, this report adopts criteria proposed for indicator development related to integrated environmental assessment based on earlier World Bank and OECD work (van Woerden et al. 2007):9
9 van Woerden, J., C. Wieler, E. Gutierrez-‐Espeleta, R. Grosshans, A. Abdelrehim, P.C.R. L. Rajbhandari. (2008) Monitoring, data and indicators. Training module 4. In L. Pinter, D. Swanson and IEA Training Manual (2008). A training manual on integrated environmental assessment and reporting. Nairobi: UNEP and Winnipeg: IISD. http://www.unep.org/ieacp/_res/site/File/iea-‐training-‐manual/module-‐4.pdf
19
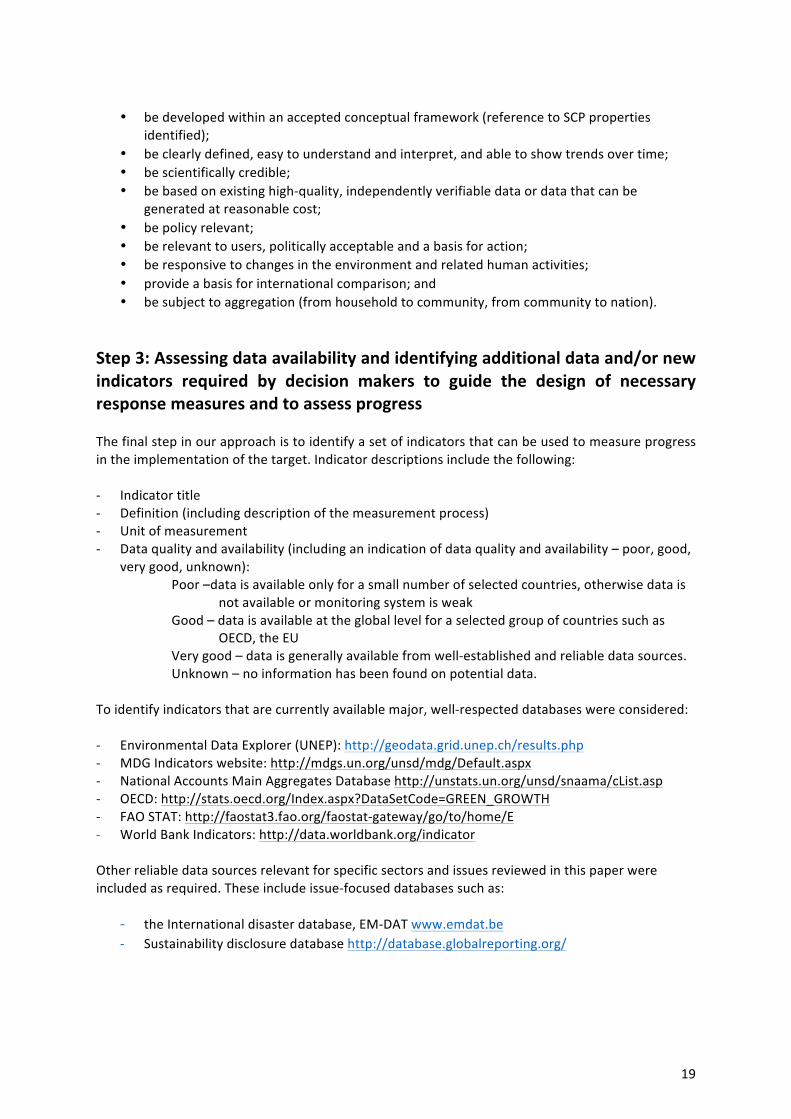
• be developed within an accepted conceptual framework (reference to SCP properties
identified); • be clearly defined, easy to understand and interpret, and able to show trends over time; • be scientifically credible; • be based on existing high-‐quality, independently verifiable data or data that can be
generated at reasonable cost; • be policy relevant; • be relevant to users, politically acceptable and a basis for action; • be responsive to changes in the environment and related human activities; • provide a basis for international comparison; and • be subject to aggregation (from household to community, from community to nation).
Step 3: Assessing data availability and identifying additional data and/or new indicators required by decision makers to guide the design of necessary response measures and to assess progress The final step in our approach is to identify a set of indicators that can be used to measure progress in the implementation of the target. Indicator descriptions include the following: -‐ Indicator title -‐ Definition (including description of the measurement process) -‐ Unit of measurement -‐ Data quality and availability (including an indication of data quality and availability – poor, good,
very good, unknown): Poor –data is available only for a small number of selected countries, otherwise data is
not available or monitoring system is weak Good – data is available at the global level for a selected group of countries such as
OECD, the EU Very good – data is generally available from well-‐established and reliable data sources. Unknown – no information has been found on potential data.
To identify indicators that are currently available major, well-‐respected databases were considered: -‐ Environmental Data Explorer (UNEP): http://geodata.grid.unep.ch/results.php -‐ MDG Indicators website: http://mdgs.un.org/unsd/mdg/Default.aspx -‐ National Accounts Main Aggregates Database http://unstats.un.org/unsd/snaama/cList.asp -‐ OECD: http://stats.oecd.org/Index.aspx?DataSetCode=GREEN_GROWTH -‐ FAO STAT: http://faostat3.fao.org/faostat-‐gateway/go/to/home/E -‐ World Bank Indicators: http://data.worldbank.org/indicator
Other reliable data sources relevant for specific sectors and issues reviewed in this paper were included as required. These include issue-‐focused databases such as:
-‐ the International disaster database, EM-‐DAT www.emdat.be -‐ Sustainability disclosure database http://database.globalreporting.org/
20
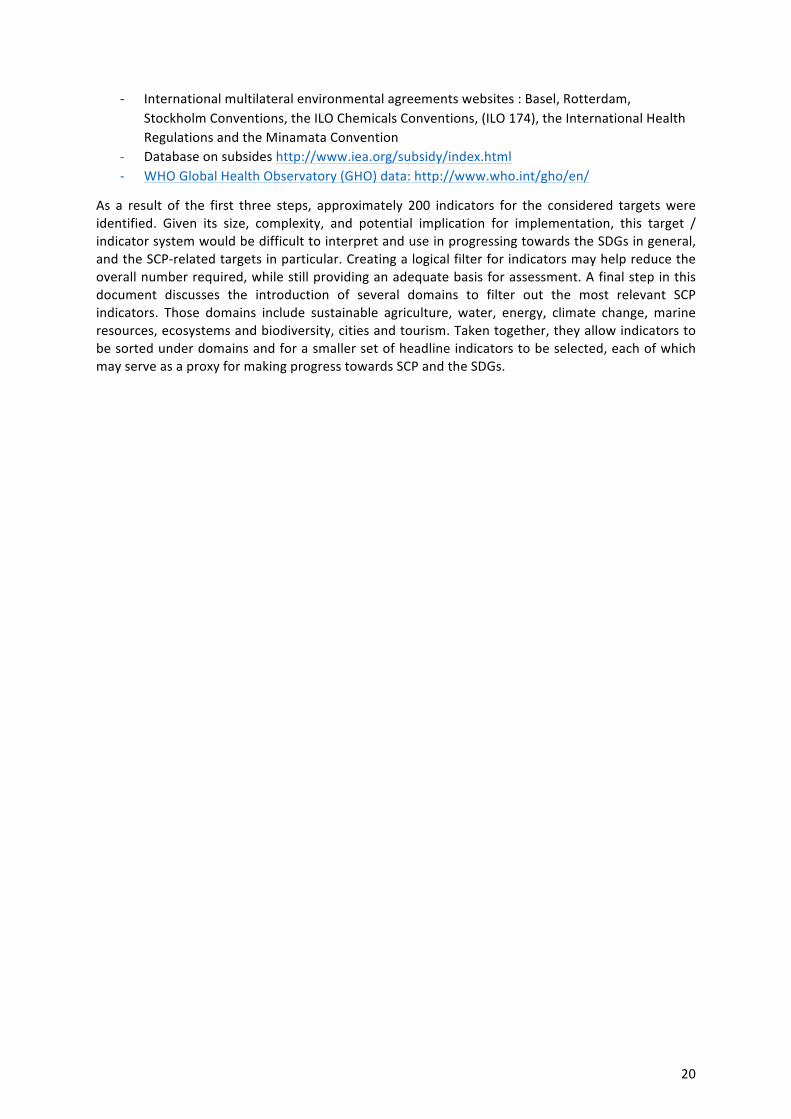
-‐ International multilateral environmental agreements websites : Basel, Rotterdam, Stockholm Conventions, the ILO Chemicals Conventions, (ILO 174), the International Health Regulations and the Minamata Convention
-‐ Database on subsides http://www.iea.org/subsidy/index.html -‐ WHO Global Health Observatory (GHO) data: http://www.who.int/gho/en/
As a result of the first three steps, approximately 200 indicators for the considered targets were identified. Given its size, complexity, and potential implication for implementation, this target / indicator system would be difficult to interpret and use in progressing towards the SDGs in general, and the SCP-‐related targets in particular. Creating a logical filter for indicators may help reduce the overall number required, while still providing an adequate basis for assessment. A final step in this document discusses the introduction of several domains to filter out the most relevant SCP indicators. Those domains include sustainable agriculture, water, energy, climate change, marine resources, ecosystems and biodiversity, cities and tourism. Taken together, they allow indicators to be sorted under domains and for a smaller set of headline indicators to be selected, each of which may serve as a proxy for making progress towards SCP and the SDGs.
21
Assessing the potential contributions of SCP-‐relevant targets to the Post-‐2015 Development Agenda and to Sustainable Development Overview and suggested indicators for the analysed targets in SDG 12 on SCP 12. Ensure SCP patterns
12.1 Implement the 10-‐Year Framework of Programmes on sustainable consumption and production (10YFP), all countries taking action, with developed countries taking the lead, taking into account the development and capabilities of developing countries.
This target is on effective implementation of the 10-‐Year Framework of Programmes on SCP (10YFP) and activities identified therein including consumer information, sustainable lifestyles and education, sustainable public procurement, sustainable buildings and construction, sustainable tourism, and sustainable food systems according to the needs and priorities of United Nations Member States. The 10YFP is a concrete and operational outcome of Rio+20, to support the achievement of sustainable development at international, regional and national levels10. This voluntary framework will deliver support for the implementation of SCP, primarily at national and regional levels. One of the objectives, under this target, will be to monitor the progress of both developed and developing countries in the development and implementation of SCP policies, plans and initiatives, as well as the institutional capacities in those countries to undertake these activities. To that end, the 10YFP is currently developing a Global Survey on National SCP policies and initiatives. The survey aims to develop baselines on SCP at the national level on the availability and implementation of SCP policies and initiatives in countries. This tool will be applied periodically and will need to be complemented by other indicators. Target 12.1 is transformative because it is an overarching target that encompasses the following objective of the 10YFP: contribute to resource efficiency and decoupling economic growth from environmental degradation and increasing resource use, while creating decent jobs and economic opportunities and contributing to poverty eradication and shared prosperity, by supporting regional and national policies and initiatives. Indicators to measure this target could evaluate specific outcomes of decoupling, noted above, as demonstrated in the following table. Indicators of social benefits are noted and could include job creation and poverty eradication. Such indicators may be applicable or closely linked to other targets in this goal and to some of the SCP-‐related targets in other goals.
10 UN Conference on Sustainable Development -‐ Rio+20 (2012) 10YFP adopted document A/CONF.216/5.

22
Table 6: Analysis of indicators and their properties and objectives
Title of the indicator
Number of countries with SCP National Action Plans, or SCP mainstreamed as a priority or target into national policies, poverty reduction, development and/or
sustainable development
strategies and plans
Number of countries with inter-‐ministerial coordination and multi-‐stakeholder
mechanisms supporting the shift to SCP
Number of country institutions with
increased knowledge and skills on issues related to SCP, as a result of training, capacity-‐building, and technical assistance, in particular in
developing countries
Number of countries/
organizations engaged in regional
cooperation actively supporting the implementation of SCP activities at the regional, sub-‐
regional and national levels
Properties & objectives
Reaching critical thresholds
X1
Resource Decoupling
X1
Impacts Decoupling X1 X
Social benefits X1 X2 X X Universality X1 X X X Linkages to other targets
2.4, 4.7, 8.4, 8.9, 9.a, 11.c, 12.3, 12.7, 12.8, 12.a, 12.b, 14.7, 17.16,
17.19 1,3
2.4, 4.7, 8.4, 8.9, 9.a, 11.c, 12.3, 12.7, 12.8, 12.a, 12.b, 14.7, 17.16,
17.19 3
2.4, 4.7, 8.4, 8.9, 9.a, 11.c, 12.3, 12.7, 12.8,
12.a, 12.b, 14.7, 17.16, 17.19 3
2.4, 4.7, 8.4, 8.9, 9.a, 11.c, 12.3, 12.7, 12.8, 12.a, 12.b, 14.7, 17.16,
17.19 3 1 Measurable policy changes in countries would, in effect, contribute to resource decoupling targets as well as to avoid reaching critical thresholds and reduce environmental pollution and other negative impacts of production and consumption. However, this depends on the effective implementation of these policies and plans in the countries – which would require time-‐bound measurement of at least 3 to 5 years. 2 Effective multi-‐stakeholder coordination would contribute to strengthening country and stakeholder cooperation, and enhance social benefits, especially in countries with weak multi-‐stakeholder cooperation. 3 Implementation of the 10YFP will de facto allow other goals and targets related to SCP to be reached. Furthermore, by providing a foundation for environmental sustainability, the achievement of SCP-‐related targets will also support and contribute to the achievement of all other goals and targets. Meeting the 10YFP implementation target would ensure that the countries contribute to all the criteria listed under this table. Other indicators considered:
• % Increase in number of countries integrating SCP into formal and non-‐formal education curricula at national level (included in 12.8)
• % Increase in number of countries that have adopted policies on sustainable public procurement (included in 12.7)
• % Increase in number of countries and institutions with increased access to financing and technology for the shift to SCP, in particular among developing countries
• % increase in number of countries that have developed incentives to engage the private sector in SCP (e.g. economic and fiscal instruments)
• Number of effective public-‐private partnerships aimed at promoting SCP shifts.

23
Table 7: Description of selected most relevant indicators
Title of the indicator Definition (incl. methodology)
Unit of Measurement Data availability and quality
Number of countries with SCP National Actions Plans or SCP mainstreamed as a priority or target into national policies, poverty reduction strategies, development and/or sustainable development strategies and plans11
Measuring integration of SCP into national policies.
# of countries Source: National
development plans, ministerial
proceedings, policy declarations,
parliamentary rulings, planning documents,
etc.
Good – Data not available currently – quantitative data will be provided by mid-‐2015 as a result of the first Global Survey on SCP, and conducted on a regular basis.
Number of countries / organizations actively engaged in regional cooperation supporting the implementation of SCP activities at the regional, sub-‐regional and national levels12
Measuring increased cooperation and networking among countries and all stakeholders on SCP.
# of countries, # of organizations.
Good – Data not available currently – quantitative data will be provided by mid-‐2015 as a result of the first Global Survey on SCP.
Additional indicators
Number of countries with inter-‐ministerial coordination and multi-‐stakeholder mechanisms supporting the shift to SCP13
Measuring multi-‐stakeholder engagement for SCP in countries.
10YFP Secretariat data; rate of communication
per country.
Good – Data not available currently – quantitative data will be provided by mid-‐2015 as a result of the first Global Survey on SCP.
11 10YFP Secretariat – Global Survey on SCP policies; Regional offices and reports of the regional roundtable on SCP 12 10YFP Secretariat -‐ Global Survey on SCP policies, Regional offices and reports of the regional roundtable on SCP, 10YFP Programmes reporting 13 10YFP Secretariat – Global Survey on SCP policies; Regional offices and reports of the regional roundtable on SCP
24
12. Ensure SCP patterns
12.2 by 2030, achieve sustainable management and efficient use of natural resources
For many natural resources, resource depletion will become a more pressing issue towards the middle of this century with some exceptions around renewable resources, specialty metals and fossil fuels which already show signs of greater effort and cost to supply them. The threshold for fossil fuel use is set by carbon emission targets, and for biomass by land availability, soil quality and water availability. The global economy is very close to (or beyond) both thresholds. There are no global limits for metals or non-‐metallic minerals which, however, face local supply challenges caused by imbalances between supply and demand, and related waste management challenges especially due to the large magnitudes of construction demolition waste. The availability of natural resources in a timely and affordable manner will be an important condition for meeting the human development goals laid out in the SDGs including raising material standards of living and reducing poverty. Current systems of production and consumption are geared to a yearly natural resource use of 70 billion tonnes and are on track to reach 180 billion tonnes by 2050 (Schandl et al. in print)14 if current trends continue. Such enormous growth in global resource use puts pressure on resource supply systems and has numerous unintended environmental and social consequences. The science of industrial ecology points to numerous ways in which resources can be used more efficiently through well designed natural resource management policies and practices. Sustainable management of resources would allow per capita global resource use to remain within 8–10 tonnes15 which would help avoid the very dramatic increase in resource extraction that would otherwise occur. These numbers refer to natural resources that fuel economic activities but do not account for the large amount of materials that are mobilized but are not economically used, such as earth and soil movements. In a recent study16, a corridor of 6-‐12 tonnes for abiotic resources and of 2 tonnes of biotic resources was suggested (including movement of resources) as a sustainability corridor for resource use, which would translate into a material footprint of consumption of 3-‐6 tonnes per capita. This is well below the suggested 8-‐10 tonnes and far below the current 25-‐30 tonnes per capita consumed in OECD countries17. Natural resources play different roles in the economic process: biomass underpins our food supply systems (including the livestock and dairy sectors), metals are used in buildings, transport and communication infrastructure and are a main component of many long lived consumer goods. Non-‐metallic minerals are used in buildings and roads, and fossil fuel powers the industrial system of production and consumption, to mention some of the main uses. It would be appropriate to identify indicators which keep track of the management and use of these important factors of production.
14 Schandl, H, S Hatfield-‐Dodds, T. Wiedmann, A Geschke, Y Cai, J West, D Newth, T Baynes, M Lenzen and A Owen (in print). Decoupling global environmental pressure and economic growth: scenarios for energy use, materials and carbon emissions. Journal of Cleaner Production. 15 UNEP (2011) Decoupling natural resource use and environmental impacts from economic growth, A Report of the Working Group on Decoupling to the International Resource Panel. Fischer-‐Kowalski, M., Swilling, M., von Weizsäcker, E.U., Ren, Y., Moriguchi, Y., Crane, W., Krausmann, F., Eisenmenger, N., Giljum, S., Hennicke, P., Romero Lankao, P., Siriban Manalang, A., Sewerin, S.). 16 Bringezu, S. 2015. Possible Target Corridor for Sustainable Use of Global Material Resources 4(1):25-‐54. 17 Wiedmann et al. 2013. The material footprint of nations. PNAS.
25
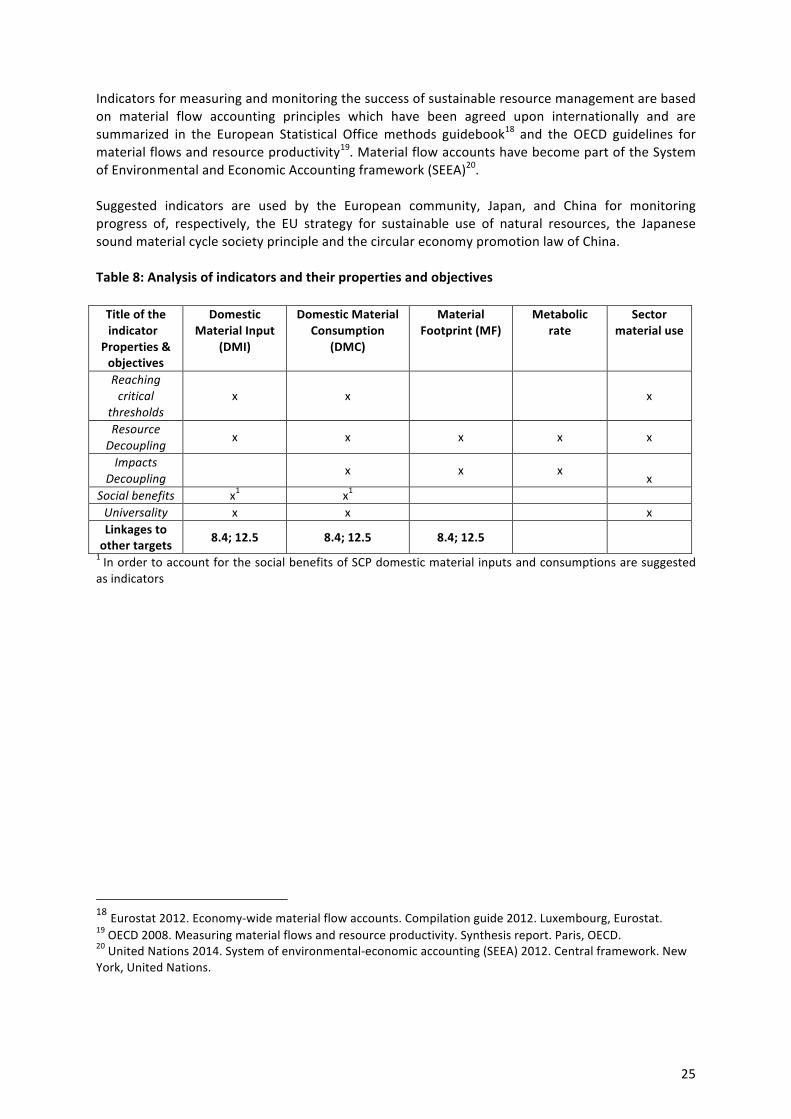
Indicators for measuring and monitoring the success of sustainable resource management are based on material flow accounting principles which have been agreed upon internationally and are summarized in the European Statistical Office methods guidebook18 and the OECD guidelines for material flows and resource productivity19. Material flow accounts have become part of the System of Environmental and Economic Accounting framework (SEEA)20. Suggested indicators are used by the European community, Japan, and China for monitoring progress of, respectively, the EU strategy for sustainable use of natural resources, the Japanese sound material cycle society principle and the circular economy promotion law of China. Table 8: Analysis of indicators and their properties and objectives Title of the indicator
Properties & objectives
Domestic Material Input
(DMI)
Domestic Material Consumption
(DMC)
Material Footprint (MF)
Metabolic rate
Sector material use
Reaching critical
thresholds x x x
Resource Decoupling
x x x x x
Impacts Decoupling
x x x x
Social benefits x1 x1 Universality x x x Linkages to other targets 8.4; 12.5 8.4; 12.5 8.4; 12.5 1 In order to account for the social benefits of SCP domestic material inputs and consumptions are suggested as indicators
18 Eurostat 2012. Economy-‐wide material flow accounts. Compilation guide 2012. Luxembourg, Eurostat. 19 OECD 2008. Measuring material flows and resource productivity. Synthesis report. Paris, OECD. 20 United Nations 2014. System of environmental-‐economic accounting (SEEA) 2012. Central framework. New York, United Nations.
26
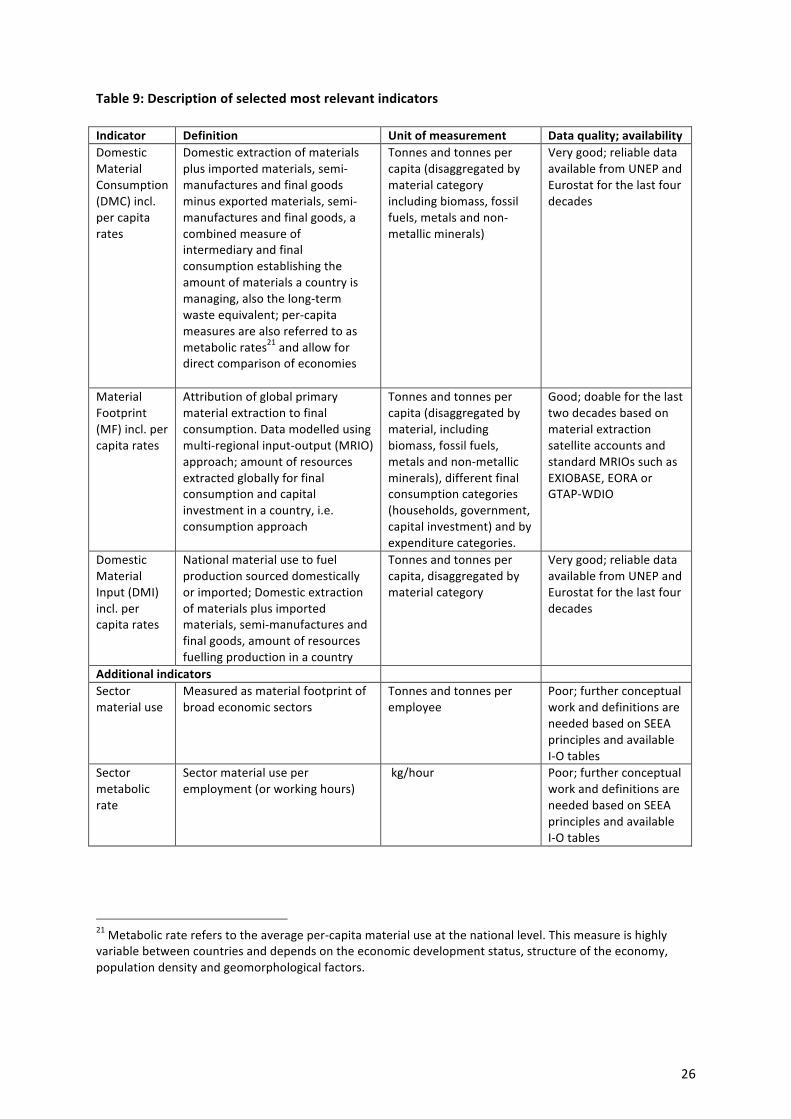
Table 9: Description of selected most relevant indicators Indicator Definition Unit of measurement Data quality; availability Domestic Material Consumption (DMC) incl. per capita rates
Domestic extraction of materials plus imported materials, semi-‐manufactures and final goods minus exported materials, semi-‐manufactures and final goods, a combined measure of intermediary and final consumption establishing the amount of materials a country is managing, also the long-‐term waste equivalent; per-‐capita measures are also referred to as metabolic rates21 and allow for direct comparison of economies
Tonnes and tonnes per capita (disaggregated by material category including biomass, fossil fuels, metals and non-‐metallic minerals)
Very good; reliable data available from UNEP and Eurostat for the last four decades
Material Footprint (MF) incl. per capita rates
Attribution of global primary material extraction to final consumption. Data modelled using multi-‐regional input-‐output (MRIO) approach; amount of resources extracted globally for final consumption and capital investment in a country, i.e. consumption approach
Tonnes and tonnes per capita (disaggregated by material, including biomass, fossil fuels, metals and non-‐metallic minerals), different final consumption categories (households, government, capital investment) and by expenditure categories.
Good; doable for the last two decades based on material extraction satellite accounts and standard MRIOs such as EXIOBASE, EORA or GTAP-‐WDIO
Domestic Material Input (DMI) incl. per capita rates
National material use to fuel production sourced domestically or imported; Domestic extraction of materials plus imported materials, semi-‐manufactures and final goods, amount of resources fuelling production in a country
Tonnes and tonnes per capita, disaggregated by material category
Very good; reliable data available from UNEP and Eurostat for the last four decades
Additional indicators Sector material use
Measured as material footprint of broad economic sectors
Tonnes and tonnes per employee
Poor; further conceptual work and definitions are needed based on SEEA principles and available I-‐O tables
Sector metabolic rate
Sector material use per employment (or working hours)
kg/hour Poor; further conceptual work and definitions are needed based on SEEA principles and available I-‐O tables
21 Metabolic rate refers to the average per-‐capita material use at the national level. This measure is highly variable between countries and depends on the economic development status, structure of the economy, population density and geomorphological factors.
27
12. Ensure SCP patterns
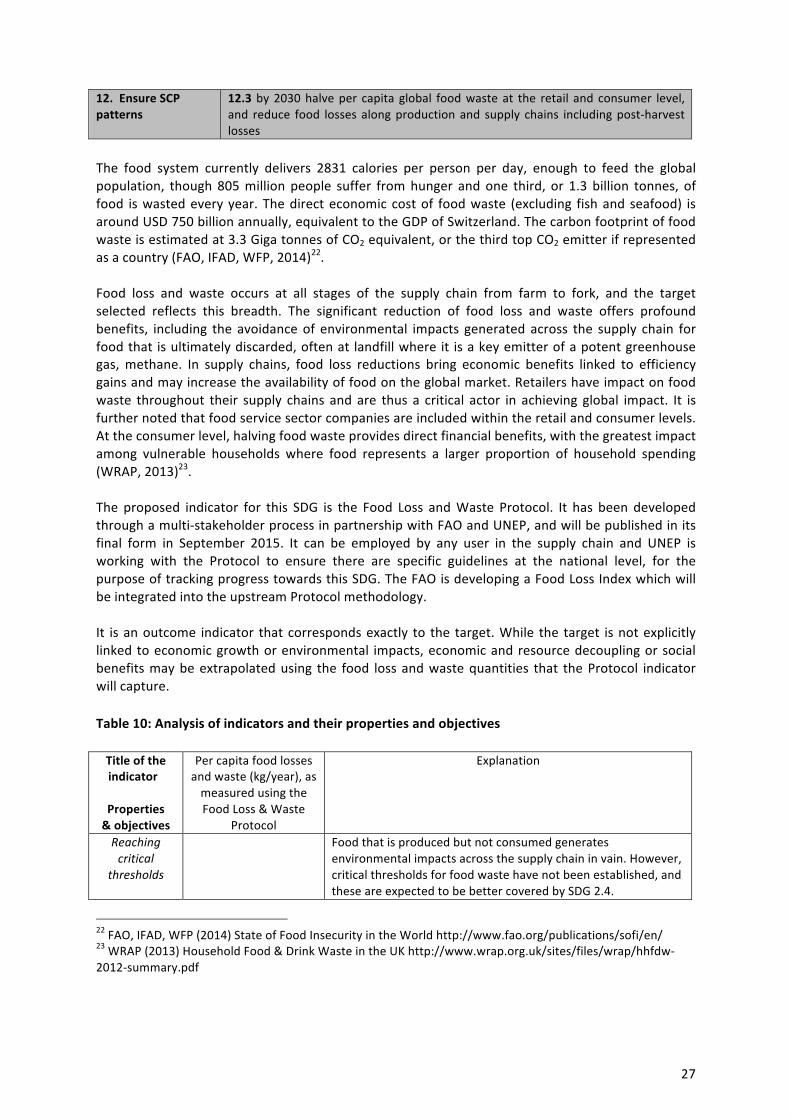
12.3 by 2030 halve per capita global food waste at the retail and consumer level, and reduce food losses along production and supply chains including post-‐harvest losses
The food system currently delivers 2831 calories per person per day, enough to feed the global population, though 805 million people suffer from hunger and one third, or 1.3 billion tonnes, of food is wasted every year. The direct economic cost of food waste (excluding fish and seafood) is around USD 750 billion annually, equivalent to the GDP of Switzerland. The carbon footprint of food waste is estimated at 3.3 Giga tonnes of CO2 equivalent, or the third top CO2 emitter if represented as a country (FAO, IFAD, WFP, 2014)22. Food loss and waste occurs at all stages of the supply chain from farm to fork, and the target selected reflects this breadth. The significant reduction of food loss and waste offers profound benefits, including the avoidance of environmental impacts generated across the supply chain for food that is ultimately discarded, often at landfill where it is a key emitter of a potent greenhouse gas, methane. In supply chains, food loss reductions bring economic benefits linked to efficiency gains and may increase the availability of food on the global market. Retailers have impact on food waste throughout their supply chains and are thus a critical actor in achieving global impact. It is further noted that food service sector companies are included within the retail and consumer levels. At the consumer level, halving food waste provides direct financial benefits, with the greatest impact among vulnerable households where food represents a larger proportion of household spending (WRAP, 2013)23. The proposed indicator for this SDG is the Food Loss and Waste Protocol. It has been developed through a multi-‐stakeholder process in partnership with FAO and UNEP, and will be published in its final form in September 2015. It can be employed by any user in the supply chain and UNEP is working with the Protocol to ensure there are specific guidelines at the national level, for the purpose of tracking progress towards this SDG. The FAO is developing a Food Loss Index which will be integrated into the upstream Protocol methodology. It is an outcome indicator that corresponds exactly to the target. While the target is not explicitly linked to economic growth or environmental impacts, economic and resource decoupling or social benefits may be extrapolated using the food loss and waste quantities that the Protocol indicator will capture. Table 10: Analysis of indicators and their properties and objectives Title of the indicator
Properties & objectives
Per capita food losses and waste (kg/year), as measured using the Food Loss & Waste
Protocol
Explanation
Reaching critical
thresholds
Food that is produced but not consumed generates environmental impacts across the supply chain in vain. However, critical thresholds for food waste have not been established, and these are expected to be better covered by SDG 2.4.
22 FAO, IFAD, WFP (2014) State of Food Insecurity in the World http://www.fao.org/publications/sofi/en/ 23 WRAP (2013) Household Food & Drink Waste in the UK http://www.wrap.org.uk/sites/files/wrap/hhfdw-‐2012-‐summary.pdf
28
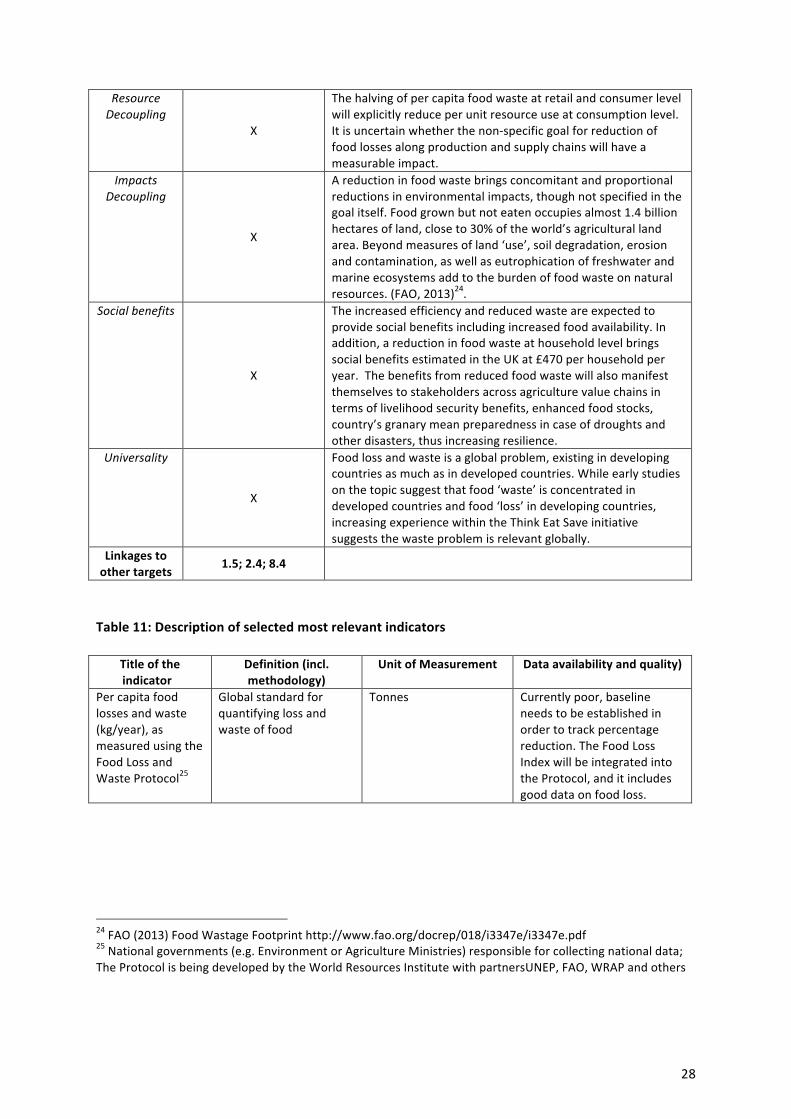
Resource Decoupling
X
The halving of per capita food waste at retail and consumer level will explicitly reduce per unit resource use at consumption level. It is uncertain whether the non-‐specific goal for reduction of food losses along production and supply chains will have a measurable impact.
Impacts Decoupling
X
A reduction in food waste brings concomitant and proportional reductions in environmental impacts, though not specified in the goal itself. Food grown but not eaten occupies almost 1.4 billion hectares of land, close to 30% of the world’s agricultural land area. Beyond measures of land ‘use’, soil degradation, erosion and contamination, as well as eutrophication of freshwater and marine ecosystems add to the burden of food waste on natural resources. (FAO, 2013)24.
Social benefits
X
The increased efficiency and reduced waste are expected to provide social benefits including increased food availability. In addition, a reduction in food waste at household level brings social benefits estimated in the UK at £470 per household per year. The benefits from reduced food waste will also manifest themselves to stakeholders across agriculture value chains in terms of livelihood security benefits, enhanced food stocks, country’s granary mean preparedness in case of droughts and other disasters, thus increasing resilience.
Universality
X
Food loss and waste is a global problem, existing in developing countries as much as in developed countries. While early studies on the topic suggest that food ‘waste’ is concentrated in developed countries and food ‘loss’ in developing countries, increasing experience within the Think Eat Save initiative suggests the waste problem is relevant globally.
Linkages to other targets
1.5; 2.4; 8.4
Table 11: Description of selected most relevant indicators
Title of the indicator
Definition (incl. methodology)
Unit of Measurement Data availability and quality)
Per capita food losses and waste (kg/year), as measured using the Food Loss and Waste Protocol25
Global standard for quantifying loss and waste of food
Tonnes Currently poor, baseline needs to be established in order to track percentage reduction. The Food Loss Index will be integrated into the Protocol, and it includes good data on food loss.
24 FAO (2013) Food Wastage Footprint http://www.fao.org/docrep/018/i3347e/i3347e.pdf 25 National governments (e.g. Environment or Agriculture Ministries) responsible for collecting national data; The Protocol is being developed by the World Resources Institute with partnersUNEP, FAO, WRAP and others
29
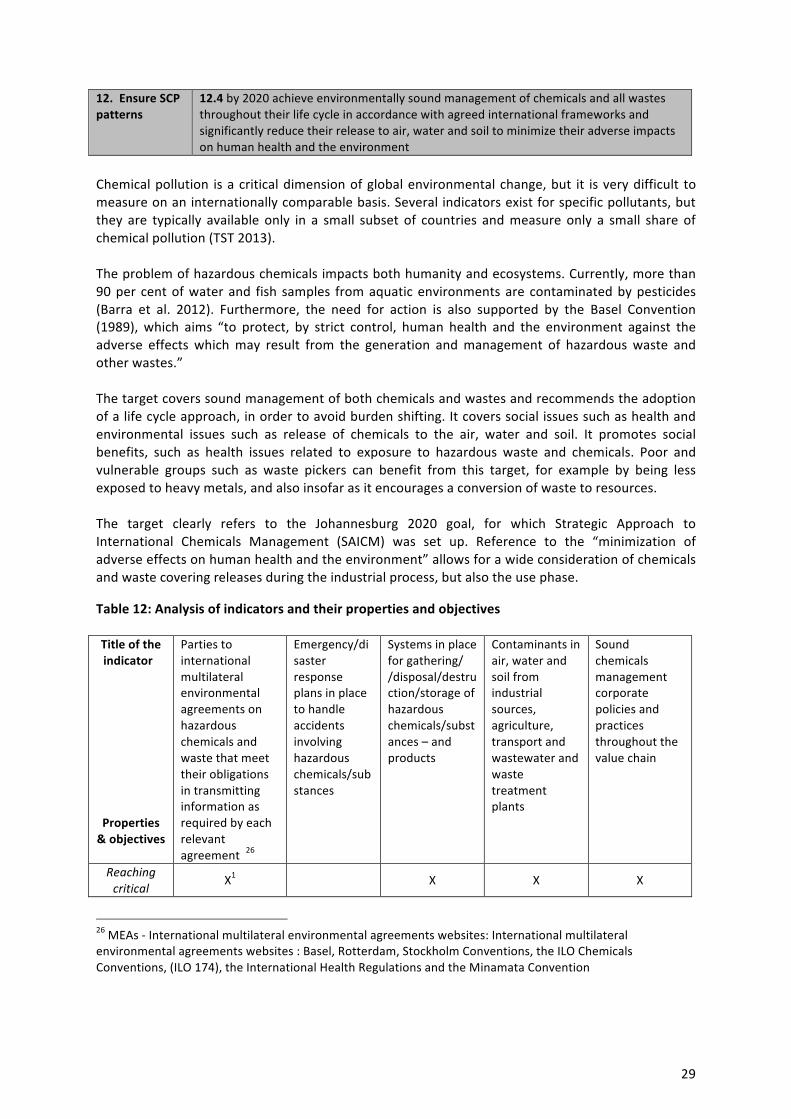
12. Ensure SCP patterns
12.4 by 2020 achieve environmentally sound management of chemicals and all wastes throughout their life cycle in accordance with agreed international frameworks and significantly reduce their release to air, water and soil to minimize their adverse impacts on human health and the environment
Chemical pollution is a critical dimension of global environmental change, but it is very difficult to measure on an internationally comparable basis. Several indicators exist for specific pollutants, but they are typically available only in a small subset of countries and measure only a small share of chemical pollution (TST 2013). The problem of hazardous chemicals impacts both humanity and ecosystems. Currently, more than 90 per cent of water and fish samples from aquatic environments are contaminated by pesticides (Barra et al. 2012). Furthermore, the need for action is also supported by the Basel Convention (1989), which aims “to protect, by strict control, human health and the environment against the adverse effects which may result from the generation and management of hazardous waste and other wastes.” The target covers sound management of both chemicals and wastes and recommends the adoption of a life cycle approach, in order to avoid burden shifting. It covers social issues such as health and environmental issues such as release of chemicals to the air, water and soil. It promotes social benefits, such as health issues related to exposure to hazardous waste and chemicals. Poor and vulnerable groups such as waste pickers can benefit from this target, for example by being less exposed to heavy metals, and also insofar as it encourages a conversion of waste to resources. The target clearly refers to the Johannesburg 2020 goal, for which Strategic Approach to International Chemicals Management (SAICM) was set up. Reference to the “minimization of adverse effects on human health and the environment” allows for a wide consideration of chemicals and waste covering releases during the industrial process, but also the use phase. Table 12: Analysis of indicators and their properties and objectives
Title of the indicator
Properties & objectives
Parties to international multilateral environmental agreements on hazardous chemicals and waste that meet their obligations in transmitting information as required by each relevant agreement 26
Emergency/disaster response plans in place to handle accidents involving hazardous chemicals/substances
Systems in place for gathering/ /disposal/destruction/storage of hazardous chemicals/substances – and products
Contaminants in air, water and soil from industrial sources, agriculture, transport and wastewater and waste treatment plants
Sound chemicals management corporate policies and practices throughout the value chain
Reaching critical
X1
X X X
26 MEAs -‐ International multilateral environmental agreements websites: International multilateral environmental agreements websites : Basel, Rotterdam, Stockholm Conventions, the ILO Chemicals Conventions, (ILO 174), the International Health Regulations and the Minamata Convention
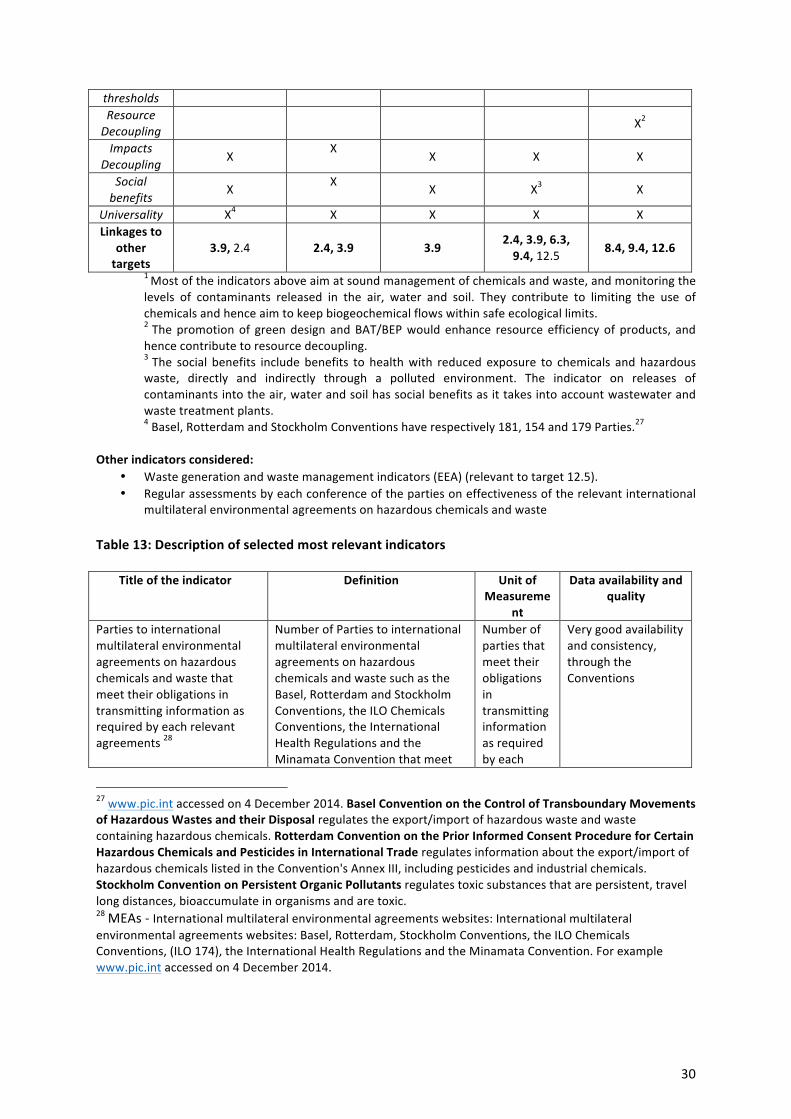
30
thresholds Resource Decoupling
X2
Impacts Decoupling X
X X X X
Social benefits
X X X X3 X
Universality X4 X X X X Linkages to
other targets
3.9, 2.4
2.4, 3.9 3.9 2.4, 3.9, 6.3, 9.4, 12.5 8.4, 9.4, 12.6
1 Most of the indicators above aim at sound management of chemicals and waste, and monitoring the levels of contaminants released in the air, water and soil. They contribute to limiting the use of chemicals and hence aim to keep biogeochemical flows within safe ecological limits. 2 The promotion of green design and BAT/BEP would enhance resource efficiency of products, and hence contribute to resource decoupling. 3 The social benefits include benefits to health with reduced exposure to chemicals and hazardous waste, directly and indirectly through a polluted environment. The indicator on releases of contaminants into the air, water and soil has social benefits as it takes into account wastewater and waste treatment plants. 4 Basel, Rotterdam and Stockholm Conventions have respectively 181, 154 and 179 Parties.27
Other indicators considered:
• Waste generation and waste management indicators (EEA) (relevant to target 12.5). • Regular assessments by each conference of the parties on effectiveness of the relevant international
multilateral environmental agreements on hazardous chemicals and waste Table 13: Description of selected most relevant indicators
Title of the indicator Definition Unit of
Measurement
Data availability and quality
Parties to international multilateral environmental agreements on hazardous chemicals and waste that meet their obligations in transmitting information as required by each relevant agreements 28
Number of Parties to international multilateral environmental agreements on hazardous chemicals and waste such as the Basel, Rotterdam and Stockholm Conventions, the ILO Chemicals Conventions, the International Health Regulations and the Minamata Convention that meet
Number of parties that meet their obligations in transmitting information as required by each
Very good availability and consistency, through the Conventions
27 www.pic.int accessed on 4 December 2014. Basel Convention on the Control of Transboundary Movements of Hazardous Wastes and their Disposal regulates the export/import of hazardous waste and waste containing hazardous chemicals. Rotterdam Convention on the Prior Informed Consent Procedure for Certain Hazardous Chemicals and Pesticides in International Trade regulates information about the export/import of hazardous chemicals listed in the Convention's Annex III, including pesticides and industrial chemicals. Stockholm Convention on Persistent Organic Pollutants regulates toxic substances that are persistent, travel long distances, bioaccumulate in organisms and are toxic. 28 MEAs -‐ International multilateral environmental agreements websites: International multilateral environmental agreements websites: Basel, Rotterdam, Stockholm Conventions, the ILO Chemicals Conventions, (ILO 174), the International Health Regulations and the Minamata Convention. For example www.pic.int accessed on 4 December 2014.

31
their obligations in transmitting information as required by each relevant agreements (e. g. national reports, national implementation plans, import responses, etc.)
relevant agreements
Contaminants in air, water and soil from industrial sources, agriculture, transport and wastewater and waste treatment plants29
Annual average levels of selected contaminants in air, water and soil from industrial sources, agriculture, transport and wastewater and waste treatment plants. Pollutant releases to air, water and land as well as off-‐site transfers of waste and of pollutants in wastewater include: heavy metals, pesticides, greenhouse gases and dioxins. Difference between pollutant release and transfer registers (PRTRs) such as the number and type of pollutants, sectors that are subject to reporting and the reporting thresholds.
Kg of contaminant
Poor, data from pollutant release and transfer registers (PRTRs) only covers releases from industrial facilities, and mainly developed countries. Environmental data on wastewater and treatment of wastewater are available
Sound chemicals management corporate policies and practices throughout the value chain30
Number of countries that developed sound chemicals management corporate policies and practices throughout the value chain, including extended producer responsibility, communication about chemical hazards and risks both for chemicals and chemicals in products as well as the promotion of green design and BAT/BEP31Part of SAICM 20 key indicators – data collected nationally and monitored at the regional and global levels.
Number of countries
Poor; not known yet
29 http://www2.env.go.jp/chemi/prtr/prtrdata/prtr/localstart.php 30 Strategic Approach to International Chemicals Management (SAICM) website: http://www.saicm.org/ 31 SAICM
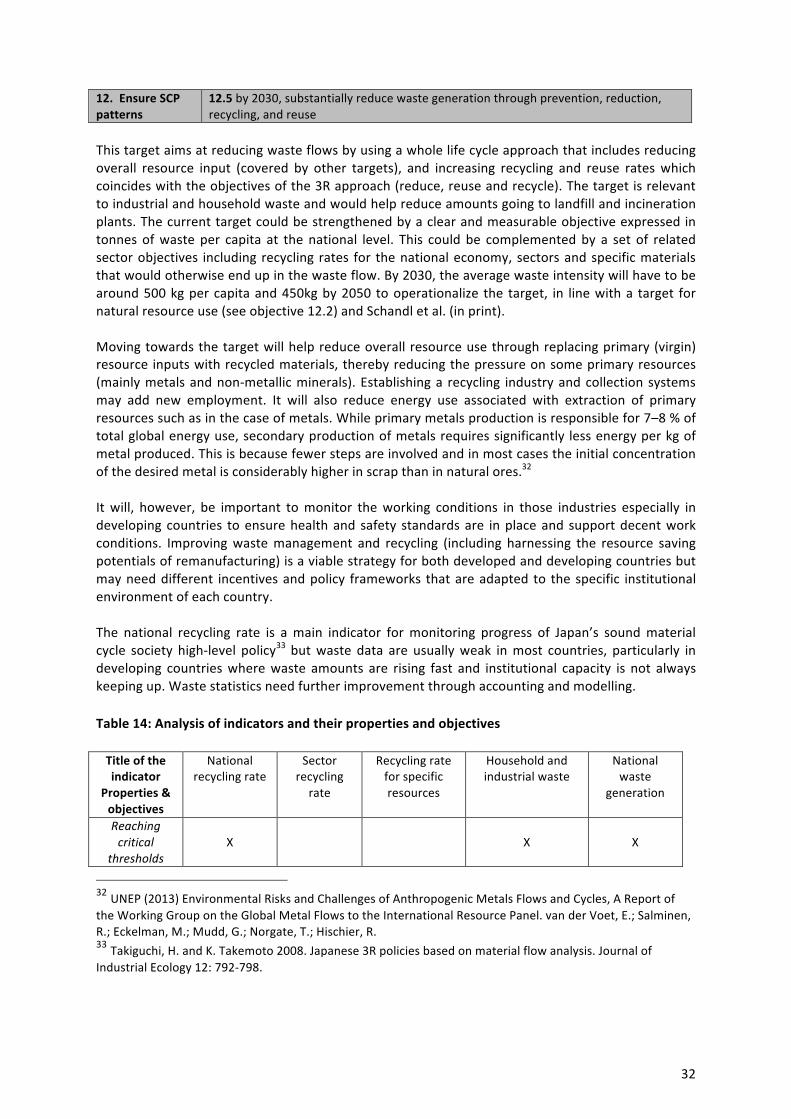
32
12. Ensure SCP patterns
12.5 by 2030, substantially reduce waste generation through prevention, reduction, recycling, and reuse
This target aims at reducing waste flows by using a whole life cycle approach that includes reducing overall resource input (covered by other targets), and increasing recycling and reuse rates which coincides with the objectives of the 3R approach (reduce, reuse and recycle). The target is relevant to industrial and household waste and would help reduce amounts going to landfill and incineration plants. The current target could be strengthened by a clear and measurable objective expressed in tonnes of waste per capita at the national level. This could be complemented by a set of related sector objectives including recycling rates for the national economy, sectors and specific materials that would otherwise end up in the waste flow. By 2030, the average waste intensity will have to be around 500 kg per capita and 450kg by 2050 to operationalize the target, in line with a target for natural resource use (see objective 12.2) and Schandl et al. (in print). Moving towards the target will help reduce overall resource use through replacing primary (virgin) resource inputs with recycled materials, thereby reducing the pressure on some primary resources (mainly metals and non-‐metallic minerals). Establishing a recycling industry and collection systems may add new employment. It will also reduce energy use associated with extraction of primary resources such as in the case of metals. While primary metals production is responsible for 7–8 % of total global energy use, secondary production of metals requires significantly less energy per kg of metal produced. This is because fewer steps are involved and in most cases the initial concentration of the desired metal is considerably higher in scrap than in natural ores.32 It will, however, be important to monitor the working conditions in those industries especially in developing countries to ensure health and safety standards are in place and support decent work conditions. Improving waste management and recycling (including harnessing the resource saving potentials of remanufacturing) is a viable strategy for both developed and developing countries but may need different incentives and policy frameworks that are adapted to the specific institutional environment of each country. The national recycling rate is a main indicator for monitoring progress of Japan’s sound material cycle society high-‐level policy33 but waste data are usually weak in most countries, particularly in developing countries where waste amounts are rising fast and institutional capacity is not always keeping up. Waste statistics need further improvement through accounting and modelling. Table 14: Analysis of indicators and their properties and objectives Title of the indicator
Properties & objectives
National recycling rate
Sector recycling rate
Recycling rate for specific resources
Household and industrial waste
National waste
generation
Reaching critical
thresholds X
X X
32 UNEP (2013) Environmental Risks and Challenges of Anthropogenic Metals Flows and Cycles, A Report of the Working Group on the Global Metal Flows to the International Resource Panel. van der Voet, E.; Salminen, R.; Eckelman, M.; Mudd, G.; Norgate, T.; Hischier, R. 33 Takiguchi, H. and K. Takemoto 2008. Japanese 3R policies based on material flow analysis. Journal of Industrial Ecology 12: 792-‐798.
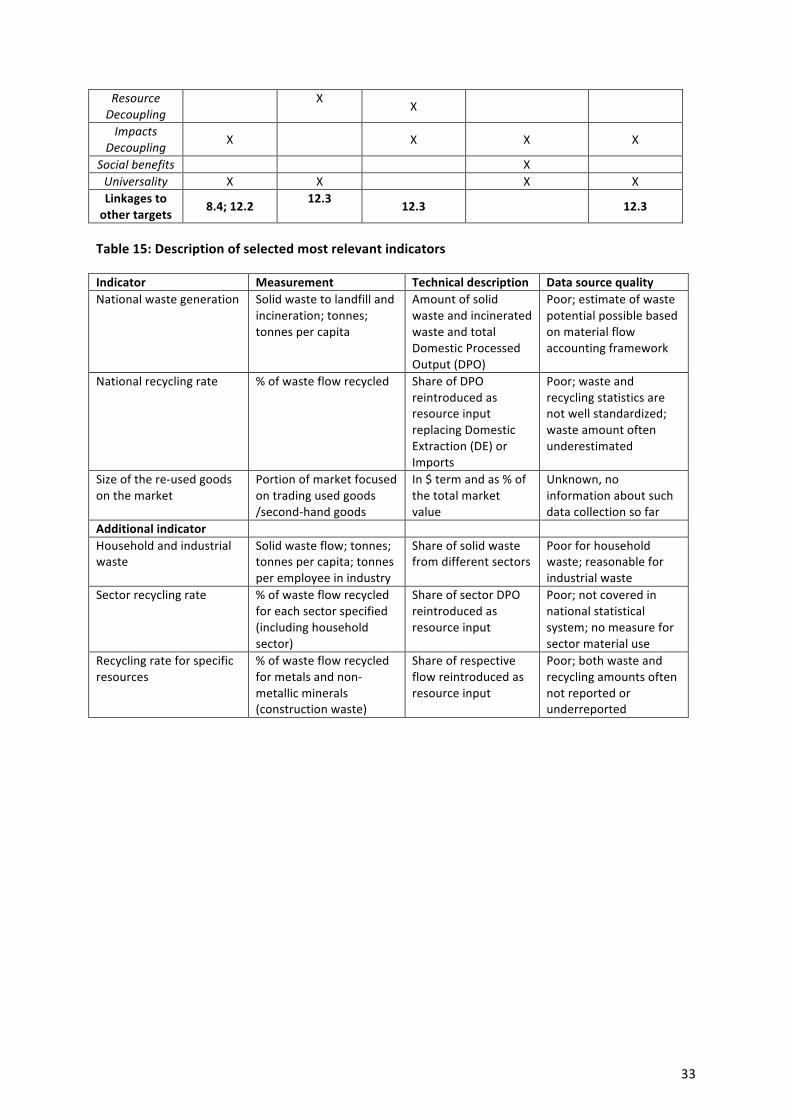
33
Resource Decoupling
X X
Impacts Decoupling X
X X X
Social benefits X Universality X X X X Linkages to other targets
8.4; 12.2 12.3 12.3 12.3
Table 15: Description of selected most relevant indicators Indicator Measurement Technical description Data source quality National waste generation
Solid waste to landfill and incineration; tonnes; tonnes per capita
Amount of solid waste and incinerated waste and total Domestic Processed Output (DPO)
Poor; estimate of waste potential possible based on material flow accounting framework
National recycling rate % of waste flow recycled Share of DPO reintroduced as resource input replacing Domestic Extraction (DE) or Imports
Poor; waste and recycling statistics are not well standardized; waste amount often underestimated
Size of the re-‐used goods on the market
Portion of market focused on trading used goods /second-‐hand goods
In $ term and as % of the total market value
Unknown, no information about such data collection so far
Additional indicator Household and industrial waste
Solid waste flow; tonnes; tonnes per capita; tonnes per employee in industry
Share of solid waste from different sectors
Poor for household waste; reasonable for industrial waste
Sector recycling rate % of waste flow recycled for each sector specified (including household sector)
Share of sector DPO reintroduced as resource input
Poor; not covered in national statistical system; no measure for sector material use
Recycling rate for specific resources
% of waste flow recycled for metals and non-‐metallic minerals (construction waste)
Share of respective flow reintroduced as resource input
Poor; both waste and recycling amounts often not reported or underreported
34
12. Ensure SCP patterns
12.6 Encourage companies, especially large and transnational companies, to adopt sustainable practices and to integrate sustainability information into their reporting cycle.
This target recognizes the critical role companies play in shifting towards more sustainable cleaner production (CP) patterns, the promotion of investment in sustainable development as well as their contribution to sustainable development in general. In 2013, the combined revenues of the world’s largest 500 companies were $31.1 trillion USD34. This was equal to approximately 41% of the world’s gross domestic product35. The operations of large transnational companies significantly influence global sustainable development from a number of perspectives, including the development and dissemination of new technologies, the shift in business model and strategy, the reduction in pressure exercised on natural resources through improved management practices, and the direct engagement and partnership with governments36. Furthermore, due to the scale of their operations, large transnational companies are also responsible for significant environmental and social impacts. A number of initiatives have emerged to help companies manage their environmental and social impacts, including organizations that have partnered with UNEP (e.g., the World Business Council for Sustainable Development37, the Resource Efficient and Cleaner Production Programme and the Green Industry Platform38). There is also a growing trend for large companies to integrate information related to their sustainability initiatives into their reporting cycle. A 2013 report by the consulting company KPMG found that 93% of the largest 250 companies in the world reported on some aspects of sustainability39. However, the structure and content of the information reported varies widely. In response to the growing interest in the sustainability of corporate practices and outcomes, many different organisations and actors around the world have been putting in place a variety of sustainability reporting schemes, systems and approaches. Research into the sustainability reporting arrangements in 45 countries found 180 standards or laws in place with some form of sustainability reporting requirement or guidance. Over 300 types of arrangements are in place around the world that directly or indirectly affect the way in which enterprises report on sustainability. Well-‐established frameworks and standards, along which the majority of sustainability reporting practices is developed, include the UN Global Compact COP, the Global Reporting Initiative reporting framework G3 and G4, the International Integrated Reporting Council (IIRC) framework and the Sustainability Accounting Standards Board (SABS) sectoral standards.40 However, more must be done to encourage large and transnational companies to 34 http://fortune.com/global500/ 35 World GDP (in nominal terms) for 2013 was $75.593 trillion (http://databank.worldbank.org/data/download/GDP.pdf); also suggested in and http://unsdsn.org/wp-‐content/uploads/2014/05/140522-‐SDSN-‐Indicator-‐Report.pdf 36 For example: UNCTAD (2014). Trade and Development Report 2014. UNCTAD. Available at: http://unctad.org/en/PublicationsLibrary/tdr2014overview_en.pdf. and Sustainable Development Solutions Network (2014). Indicators for Sustainable Development Goals. UNSDSN. Available at: http://unsdsn.org/wp-‐content/uploads/2014/05/140522-‐SDSN-‐Indicator-‐Report.pdf. 37 http://wbcsd.org/home.aspx 38 http://www.greenindustryplatform.org/ 39 KPMG (2013) The KPMG Survey of Corporate Responsibility Reporting. Available at: http://www.kpmg.com/Global/en/IssuesAndInsights/ArticlesPublications/corporate-‐responsibility/Documents/corporate-‐responsibility-‐reporting-‐survey-‐2013.pdf 40 UNEP et al. (2013b) Carrots and Sticks -‐ Sustainability reporting policies worldwide -‐ today's best practice, tomorrow's trends [Online]. Available from: http://www.unep.org/resourceefficiency/Portals/24147/scp/BIU%20documents/Reporting%20pages/Carrots-‐and-‐SticksIII.pdf
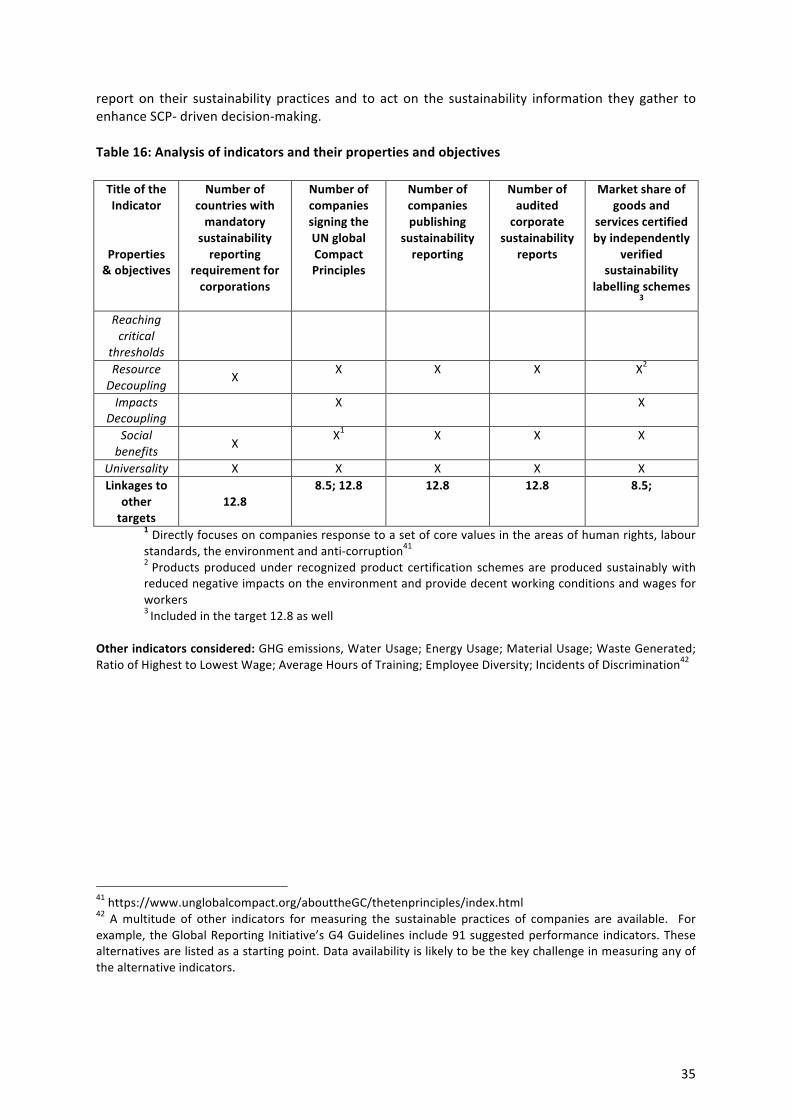
35
report on their sustainability practices and to act on the sustainability information they gather to enhance SCP-‐ driven decision-‐making. Table 16: Analysis of indicators and their properties and objectives Title of the Indicator
Properties & objectives
Number of countries with mandatory sustainability reporting
requirement for corporations
Number of companies signing the UN global Compact Principles
Number of companies publishing
sustainability reporting
Number of audited corporate
sustainability reports
Market share of goods and
services certified by independently
verified sustainability
labelling schemes 3
Reaching critical
thresholds
Resource Decoupling
X X X X X2
Impacts Decoupling X X
Social benefits X
X1 X X X
Universality X X X X X Linkages to
other targets
12.8 8.5; 12.8 12.8 12.8 8.5;
1 Directly focuses on companies response to a set of core values in the areas of human rights, labour standards, the environment and anti-‐corruption41 2 Products produced under recognized product certification schemes are produced sustainably with reduced negative impacts on the environment and provide decent working conditions and wages for workers 3 Included in the target 12.8 as well
Other indicators considered: GHG emissions, Water Usage; Energy Usage; Material Usage; Waste Generated; Ratio of Highest to Lowest Wage; Average Hours of Training; Employee Diversity; Incidents of Discrimination42
41 https://www.unglobalcompact.org/abouttheGC/thetenprinciples/index.html 42 A multitude of other indicators for measuring the sustainable practices of companies are available. For example, the Global Reporting Initiative’s G4 Guidelines include 91 suggested performance indicators. These alternatives are listed as a starting point. Data availability is likely to be the key challenge in measuring any of the alternative indicators.
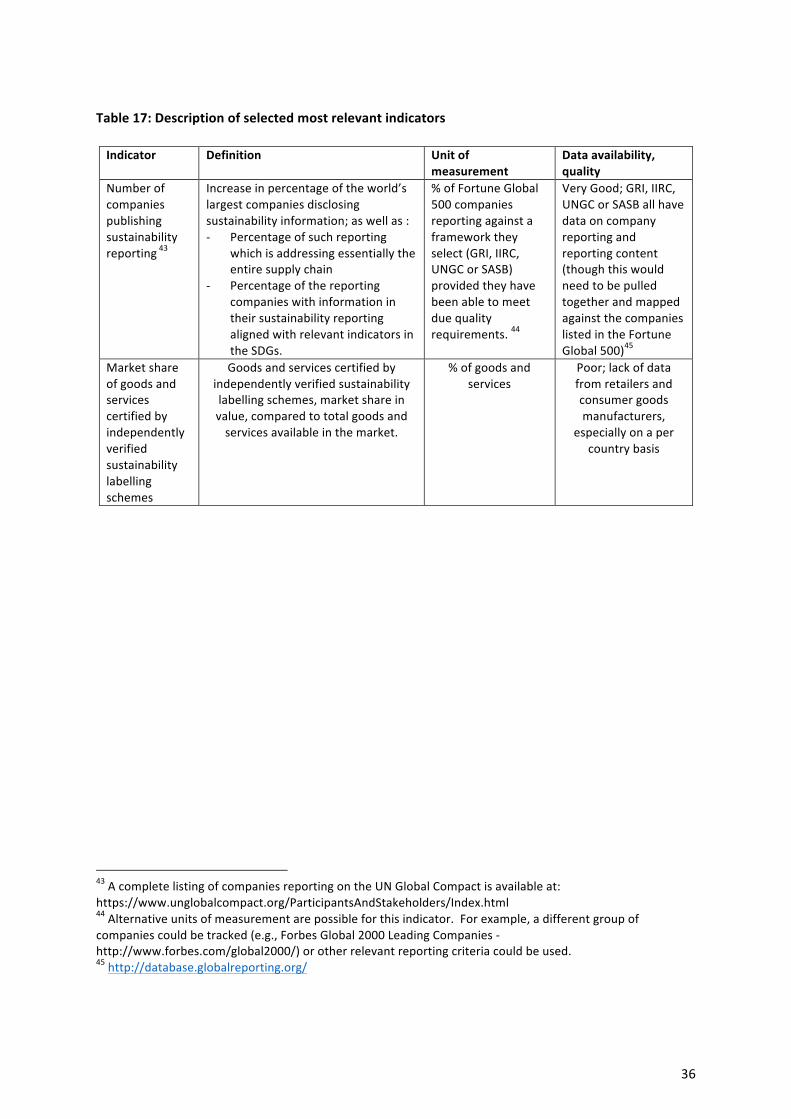
36
Table 17: Description of selected most relevant indicators Indicator Definition Unit of
measurement Data availability, quality
Number of companies publishing sustainability reporting 43
Increase in percentage of the world’s largest companies disclosing sustainability information; as well as : -‐ Percentage of such reporting
which is addressing essentially the entire supply chain
-‐ Percentage of the reporting companies with information in their sustainability reporting aligned with relevant indicators in the SDGs.
% of Fortune Global 500 companies reporting against a framework they select (GRI, IIRC, UNGC or SASB) provided they have been able to meet due quality requirements. 44
Very Good; GRI, IIRC, UNGC or SASB all have data on company reporting and reporting content (though this would need to be pulled together and mapped against the companies listed in the Fortune Global 500)45
Market share of goods and services certified by independently verified sustainability labelling schemes
Goods and services certified by independently verified sustainability labelling schemes, market share in value, compared to total goods and services available in the market.
% of goods and services
Poor; lack of data from retailers and consumer goods manufacturers,
especially on a per country basis
43 A complete listing of companies reporting on the UN Global Compact is available at: https://www.unglobalcompact.org/ParticipantsAndStakeholders/Index.html 44 Alternative units of measurement are possible for this indicator. For example, a different group of companies could be tracked (e.g., Forbes Global 2000 Leading Companies -‐ http://www.forbes.com/global2000/) or other relevant reporting criteria could be used. 45 http://database.globalreporting.org/

37
12. Ensure SCP patterns 12.7 Promote public procurement practices that are sustainable, in accordance with national policies and priorities
An increasing number of countries around the world consider the environmental and social impacts of their public spending and have implemented policies for Sustainable Public Procurement (SPP) or Green Public Procurement (GPP). As the amounts invested through public procurement are large and wide in scope, the potential to affect SCP is significant.46 As governments are responsible for a major share of national consumption, their procurement directly contributes to the consumption-‐side of SCP. The demand for more sustainable products, in turn, contributes to the production side of SCP by influencing manufacturing patterns in business. Moreover, when governments take the lead in demanding more sustainable products at scale, they can stimulate markets to produce these goods and demonstrate the feasibility of novel solutions that businesses often follow, also creating private-‐to-‐private markets for sustainable products. SPP is different from many other types of SCP policies by acting from the demand, rather than the supply-‐side. This can carry advantages in terms of exploiting innovation potentials and efficiencies of the private sector. Beyond increasing welfare from SPP through avoided social and environmental impacts and costs, it can also target the economic dimension of sustainable development. Realizing that SMEs form the backbone of most economies, including employment, many governments use procurement strategically to support the SME sector. Almost 70 per cent of OECD Member countries have strategies or policies to promote the use of procurement to support SMEs. Besides providing opportunities to pioneers of sustainable production in the present, the use of SPP may also position a national economy for the future, as international trade in sustainable goods and services is expected to strengthen, creating green economic development and employment opportunities. The indicators for Target 12.7 may measure the level of effort with regard to introducing SPP practices and their impact. Indicator options for GPP / SPP have been analysed by Hak (2009)47. The level of effort is related to the prevalence of SPP or GPP in a clearly defined group of public purchases, as analysed on the basis of actually delivered contracts. Impact-‐related indicators need to relate GPP/SPP practices to some high-‐priority impact variables, such as CO2 emissions.
46 UNEP, (2013) Sustainable Public Procurement: A global review, Paris, France. Accessible at: http://www.unep.org/resourceefficiency/Portals/24147/SPP_Full_Report_Dec2013_v2%20NEW%20(2).pdf In Europe, public procurement spending amounts to about 2 trillion Euros each year, or approximately 19 percent of GDP. (http://ec.europa.eu/environment/gpp/pdf/handbook.pdf) Across OECD countries, it accounts for up to 30 percent of GDP in some cases. In 2012, 72 percent of OECD countries had a strategy in support of green public procurement; and 26 percent of these countries had a GPP voluntary target. (source: http://www.oecd.org/gov/ethics/Mapping%20out%20good%20practices%20for%20promoting%20green%20public%20procurement%20GOV_PGC_ETH_2013_3.pdf). Outside of the OECD, China, Brazil and India have developed a national GPP/SPP program or policy. Other countries including Bulgaria, Chile, Costa Rica, Colombia, Israel, Lebanon, Mauritius, Romania, Tunisia and Slovenia also have such policies. the United States, Executive Orders (EO) EO 1342387 (2007) and EO 1351488 (2009) require that 95 percent of all new contracts require products or services that are “energy-‐efficient, water-‐efficient, bio-‐based, environmentally preferable, non-‐ozone depleting, contain recycled-‐content, or non-‐toxic or less-‐toxic alternatives, where practicable”. 4646 Hak, T. (2009). Indicator-based evaluation of interlinkages between different sustainable development objectives. INDI-LINK. Available at: http://seri.at/wp-content/uploads/2009/11/INDI-LINK_D-1.3.pdf 47 Hak, T. (2009). Indicator-‐based evaluation of interlinkages between different sustainable development objectives. INDI-‐LINK. Available at: http://seri.at/wp-‐content/uploads/2009/11/INDI-‐LINK_D-‐1.3.pdf

38
Table 18: Analysis of indicators and their properties and objectives Title of the indicator
Properties & objectives
Number of national governments implementing
Sustainable Public Procurement policies and action plans1
% of Sustainable Public Procurement
in total public procurement for a set of prioritized product groups
Impact of Sustainable Public Procurement on
CO2 emissions2 (for a set of prioritized product groups)
Product lifecycle cost impacts of
Sustainable Public Procurement (for a set of prioritized product groups)
Reaching critical
thresholds
Resource Decoupling
x x x Impacts
Decoupling x x x x
Social benefits x x x Universality x x x x Linkages to other targets
8.4, 12.2 8.4; 12.2 8.4; 7.2 8.4; 1 Includes adopted plans and policies according to national legislation requirements 2 Ideally, other impacts on the environment, such as energy consumption, water, should be measured,
however, CO2 emissions have the advantage of being available and measured more easily. Table 19: Description of selected most relevant indicators
Title of the indicator
Definition Unit of measurement
Data quality
Number of national governments implementing SPP policies and /or National SPP action plans
Number of national governments that have adopted an SPP policy and or National SPP Action plan and have started implementation
National governments that have adopted SPP policies and/or National SPP Action plans
Medium Easy access to adopted policies and action plans – more difficult to have proof of implementation
% of Sustainable Public Procurement in total public procurement for a set of prioritized product groups
Amount of public procurement spent for a set of prioritized product groups that meet specific sustainability criteria such as reduced environmental impacts and improved social benefits, and expresses the results as a % of total public procurement.
% of public procurement
Poor; developed at a pilot level. Issues with availability of procurement data, selection of criteria and product groups
Impact of SPP on CO2 emissions
The reduction in CO2 emissions in key product groups as a result of SPP, calculated on a lifecycle basis and expressed in % terms.
% Poor; developed at a pilot level. Issue with the availability of procurement data
Additional Indicator Product lifecycle cost impacts of SPP for society
The indicator relates the lifecycle cost of products purchased through SPP programmes with non-‐SPP programmes, thus showing if the adoption of SPP results in cost-‐savings or comes at additional costs for society. The difference is expressed in
% Poor; developed at a pilot level. Issue with the availability of procurement data
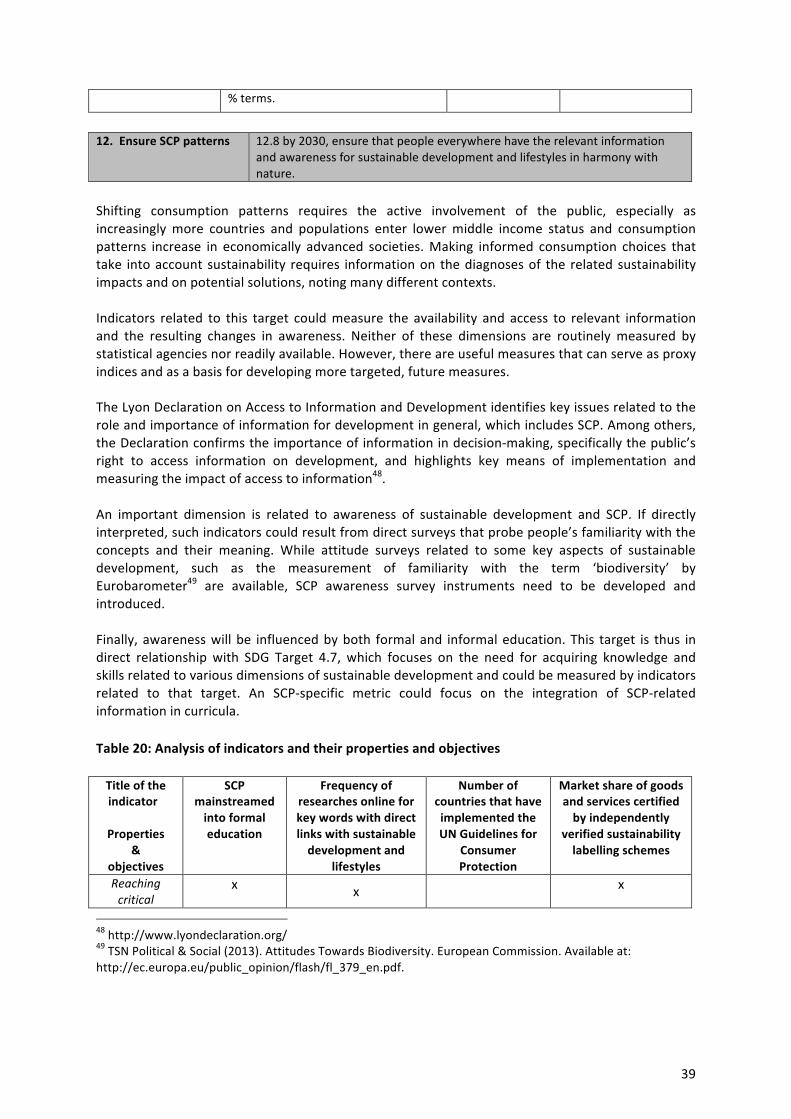
39
% terms.
12. Ensure SCP patterns 12.8 by 2030, ensure that people everywhere have the relevant information
and awareness for sustainable development and lifestyles in harmony with nature.
Shifting consumption patterns requires the active involvement of the public, especially as increasingly more countries and populations enter lower middle income status and consumption patterns increase in economically advanced societies. Making informed consumption choices that take into account sustainability requires information on the diagnoses of the related sustainability impacts and on potential solutions, noting many different contexts. Indicators related to this target could measure the availability and access to relevant information and the resulting changes in awareness. Neither of these dimensions are routinely measured by statistical agencies nor readily available. However, there are useful measures that can serve as proxy indices and as a basis for developing more targeted, future measures. The Lyon Declaration on Access to Information and Development identifies key issues related to the role and importance of information for development in general, which includes SCP. Among others, the Declaration confirms the importance of information in decision-‐making, specifically the public’s right to access information on development, and highlights key means of implementation and measuring the impact of access to information48. An important dimension is related to awareness of sustainable development and SCP. If directly interpreted, such indicators could result from direct surveys that probe people’s familiarity with the concepts and their meaning. While attitude surveys related to some key aspects of sustainable development, such as the measurement of familiarity with the term ‘biodiversity’ by Eurobarometer49 are available, SCP awareness survey instruments need to be developed and introduced. Finally, awareness will be influenced by both formal and informal education. This target is thus in direct relationship with SDG Target 4.7, which focuses on the need for acquiring knowledge and skills related to various dimensions of sustainable development and could be measured by indicators related to that target. An SCP-‐specific metric could focus on the integration of SCP-‐related information in curricula. Table 20: Analysis of indicators and their properties and objectives Title of the indicator
Properties
& objectives
SCP mainstreamed into formal education
Frequency of researches online for key words with direct links with sustainable development and
lifestyles
Number of countries that have implemented the UN Guidelines for
Consumer Protection
Market share of goods and services certified by independently
verified sustainability labelling schemes
Reaching critical
x x x
48 http://www.lyondeclaration.org/ 49 TSN Political & Social (2013). Attitudes Towards Biodiversity. European Commission. Available at: http://ec.europa.eu/public_opinion/flash/fl_379_en.pdf.
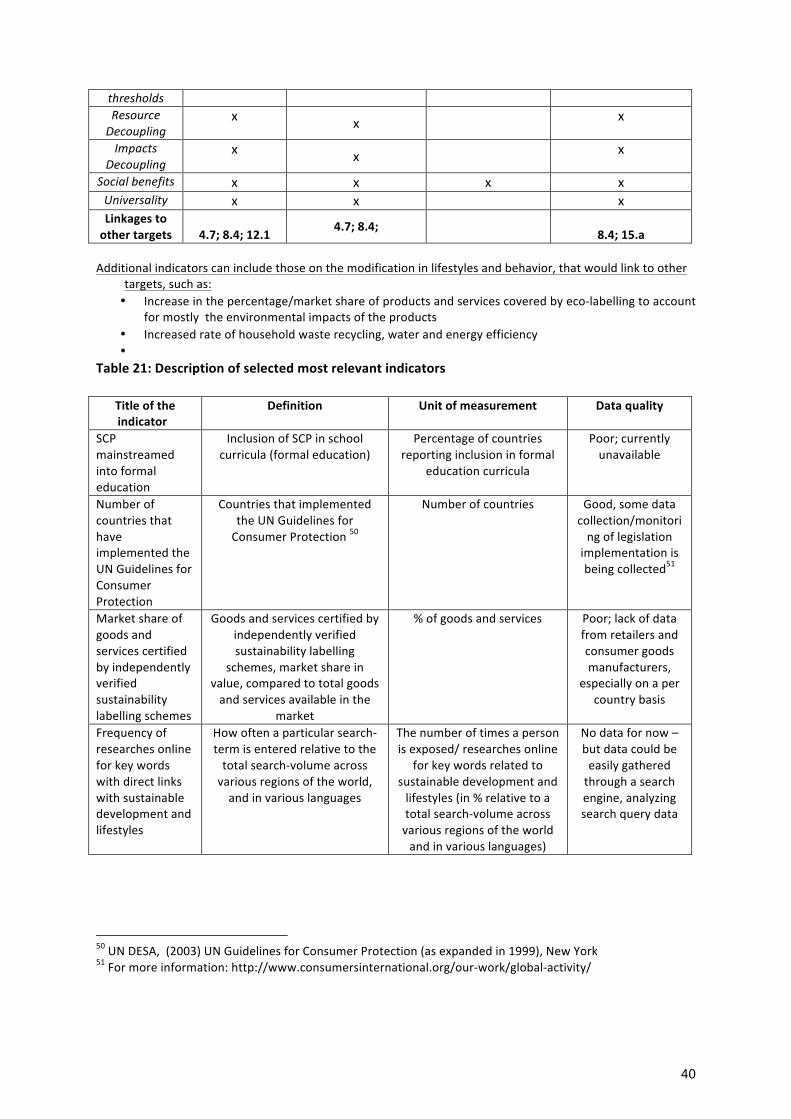
40
thresholds Resource Decoupling
x x x
Impacts Decoupling
x x x
Social benefits x x x x Universality x x x Linkages to other targets
4.7; 8.4; 12.1
4.7; 8.4; 8.4; 15.a
Additional indicators can include those on the modification in lifestyles and behavior, that would link to other
targets, such as: • Increase in the percentage/market share of products and services covered by eco-‐labelling to account
for mostly the environmental impacts of the products • Increased rate of household waste recycling, water and energy efficiency •
Table 21: Description of selected most relevant indicators
Title of the indicator
Definition Unit of measurement Data quality
SCP mainstreamed into formal education
Inclusion of SCP in school curricula (formal education)
Percentage of countries reporting inclusion in formal
education curricula
Poor; currently unavailable
Number of countries that have implemented the UN Guidelines for Consumer Protection
Countries that implemented the UN Guidelines for Consumer Protection 50
Number of countries Good, some data collection/monitoring of legislation implementation is being collected51
Market share of goods and services certified by independently verified sustainability labelling schemes
Goods and services certified by independently verified sustainability labelling
schemes, market share in value, compared to total goods and services available in the
market
% of goods and services Poor; lack of data from retailers and consumer goods manufacturers,
especially on a per country basis
Frequency of researches online for key words with direct links with sustainable development and lifestyles
How often a particular search-‐term is entered relative to the total search-‐volume across various regions of the world, and in various languages
The number of times a person is exposed/ researches online
for key words related to sustainable development and lifestyles (in % relative to a total search-‐volume across various regions of the world and in various languages)
No data for now – but data could be easily gathered through a search engine, analyzing search query data
50 UN DESA, (2003) UN Guidelines for Consumer Protection (as expanded in 1999), New York 51 For more information: http://www.consumersinternational.org/our-‐work/global-‐activity/
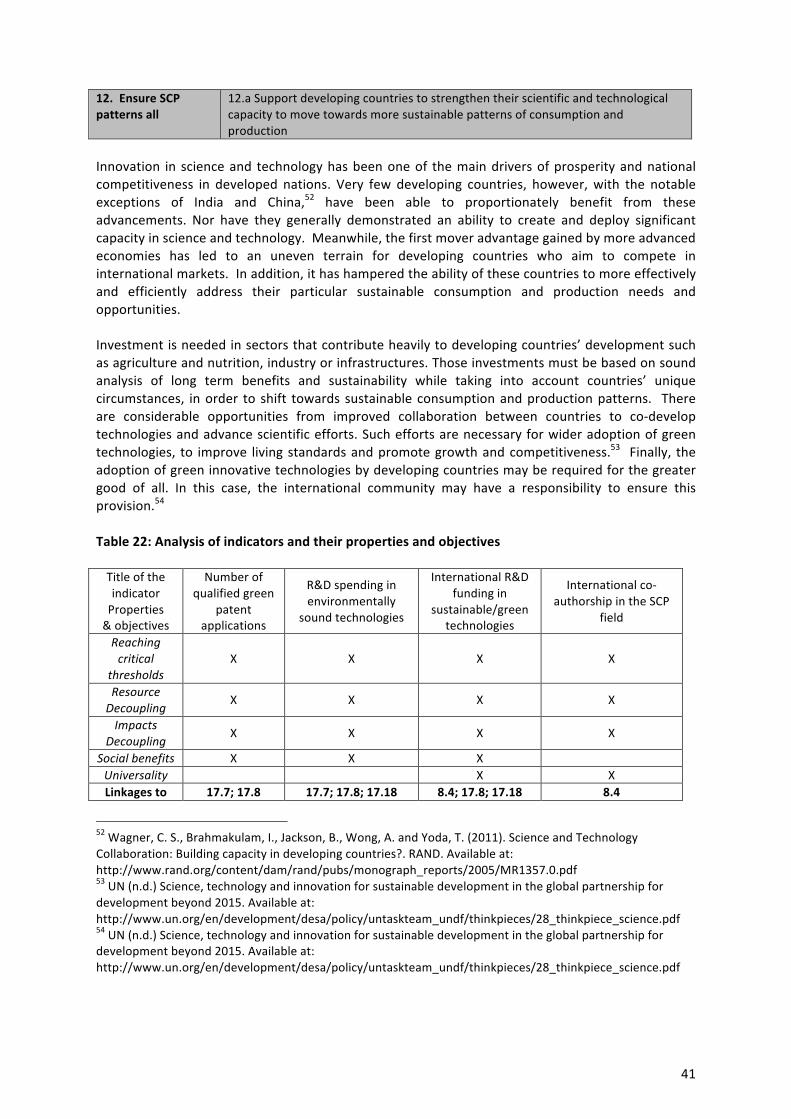
41
12. Ensure SCP patterns all
12.a Support developing countries to strengthen their scientific and technological capacity to move towards more sustainable patterns of consumption and production
Innovation in science and technology has been one of the main drivers of prosperity and national competitiveness in developed nations. Very few developing countries, however, with the notable exceptions of India and China,52 have been able to proportionately benefit from these advancements. Nor have they generally demonstrated an ability to create and deploy significant capacity in science and technology. Meanwhile, the first mover advantage gained by more advanced economies has led to an uneven terrain for developing countries who aim to compete in international markets. In addition, it has hampered the ability of these countries to more effectively and efficiently address their particular sustainable consumption and production needs and opportunities. Investment is needed in sectors that contribute heavily to developing countries’ development such as agriculture and nutrition, industry or infrastructures. Those investments must be based on sound analysis of long term benefits and sustainability while taking into account countries’ unique circumstances, in order to shift towards sustainable consumption and production patterns. There are considerable opportunities from improved collaboration between countries to co-‐develop technologies and advance scientific efforts. Such efforts are necessary for wider adoption of green technologies, to improve living standards and promote growth and competitiveness.53 Finally, the adoption of green innovative technologies by developing countries may be required for the greater good of all. In this case, the international community may have a responsibility to ensure this provision.54 Table 22: Analysis of indicators and their properties and objectives Title of the indicator Properties & objectives
Number of qualified green
patent applications
R&D spending in environmentally
sound technologies
International R&D funding in
sustainable/green technologies
International co-‐authorship in the SCP
field
Reaching critical
thresholds X X X X
Resource Decoupling
X X X X
Impacts Decoupling
X X X X
Social benefits X X X Universality X X Linkages to 17.7; 17.8 17.7; 17.8; 17.18 8.4; 17.8; 17.18 8.4
52 Wagner, C. S., Brahmakulam, I., Jackson, B., Wong, A. and Yoda, T. (2011). Science and Technology Collaboration: Building capacity in developing countries?. RAND. Available at: http://www.rand.org/content/dam/rand/pubs/monograph_reports/2005/MR1357.0.pdf 53 UN (n.d.) Science, technology and innovation for sustainable development in the global partnership for development beyond 2015. Available at: http://www.un.org/en/development/desa/policy/untaskteam_undf/thinkpieces/28_thinkpiece_science.pdf 54 UN (n.d.) Science, technology and innovation for sustainable development in the global partnership for development beyond 2015. Available at: http://www.un.org/en/development/desa/policy/untaskteam_undf/thinkpieces/28_thinkpiece_science.pdf
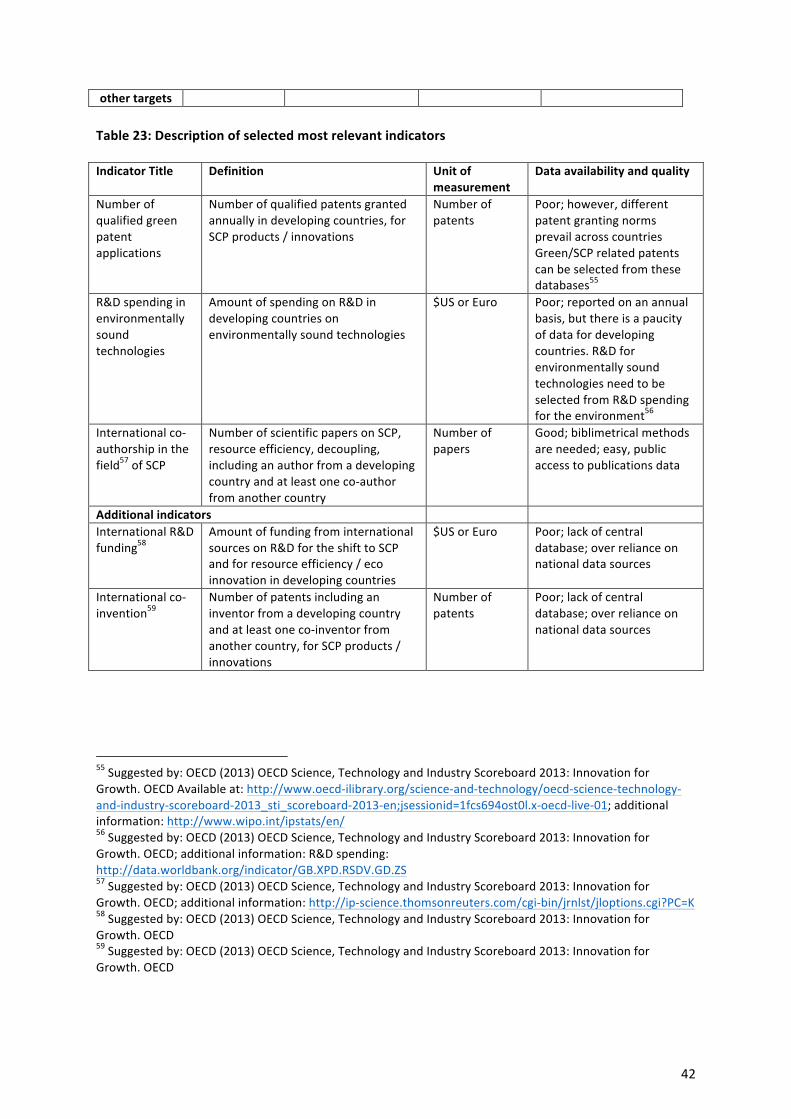
42
other targets Table 23: Description of selected most relevant indicators Indicator Title Definition Unit of
measurement Data availability and quality
Number of qualified green patent applications
Number of qualified patents granted annually in developing countries, for SCP products / innovations
Number of patents
Poor; however, different patent granting norms prevail across countries Green/SCP related patents can be selected from these databases55
R&D spending in environmentally sound technologies
Amount of spending on R&D in developing countries on environmentally sound technologies
$US or Euro Poor; reported on an annual basis, but there is a paucity of data for developing countries. R&D for environmentally sound technologies need to be selected from R&D spending for the environment56
International co-‐authorship in the field57 of SCP
Number of scientific papers on SCP, resource efficiency, decoupling, including an author from a developing country and at least one co-‐author from another country
Number of papers
Good; biblimetrical methods are needed; easy, public access to publications data
Additional indicators International R&D funding58
Amount of funding from international sources on R&D for the shift to SCP and for resource efficiency / eco innovation in developing countries
$US or Euro Poor; lack of central database; over reliance on national data sources
International co-‐invention59
Number of patents including an inventor from a developing country and at least one co-‐inventor from another country, for SCP products / innovations
Number of patents
Poor; lack of central database; over reliance on national data sources
55 Suggested by: OECD (2013) OECD Science, Technology and Industry Scoreboard 2013: Innovation for Growth. OECD Available at: http://www.oecd-‐ilibrary.org/science-‐and-‐technology/oecd-‐science-‐technology-‐and-‐industry-‐scoreboard-‐2013_sti_scoreboard-‐2013-‐en;jsessionid=1fcs694ost0l.x-‐oecd-‐live-‐01; additional information: http://www.wipo.int/ipstats/en/ 56 Suggested by: OECD (2013) OECD Science, Technology and Industry Scoreboard 2013: Innovation for Growth. OECD; additional information: R&D spending: http://data.worldbank.org/indicator/GB.XPD.RSDV.GD.ZS 57 Suggested by: OECD (2013) OECD Science, Technology and Industry Scoreboard 2013: Innovation for Growth. OECD; additional information: http://ip-‐science.thomsonreuters.com/cgi-‐bin/jrnlst/jloptions.cgi?PC=K 58 Suggested by: OECD (2013) OECD Science, Technology and Industry Scoreboard 2013: Innovation for Growth. OECD 59 Suggested by: OECD (2013) OECD Science, Technology and Industry Scoreboard 2013: Innovation for Growth. OECD
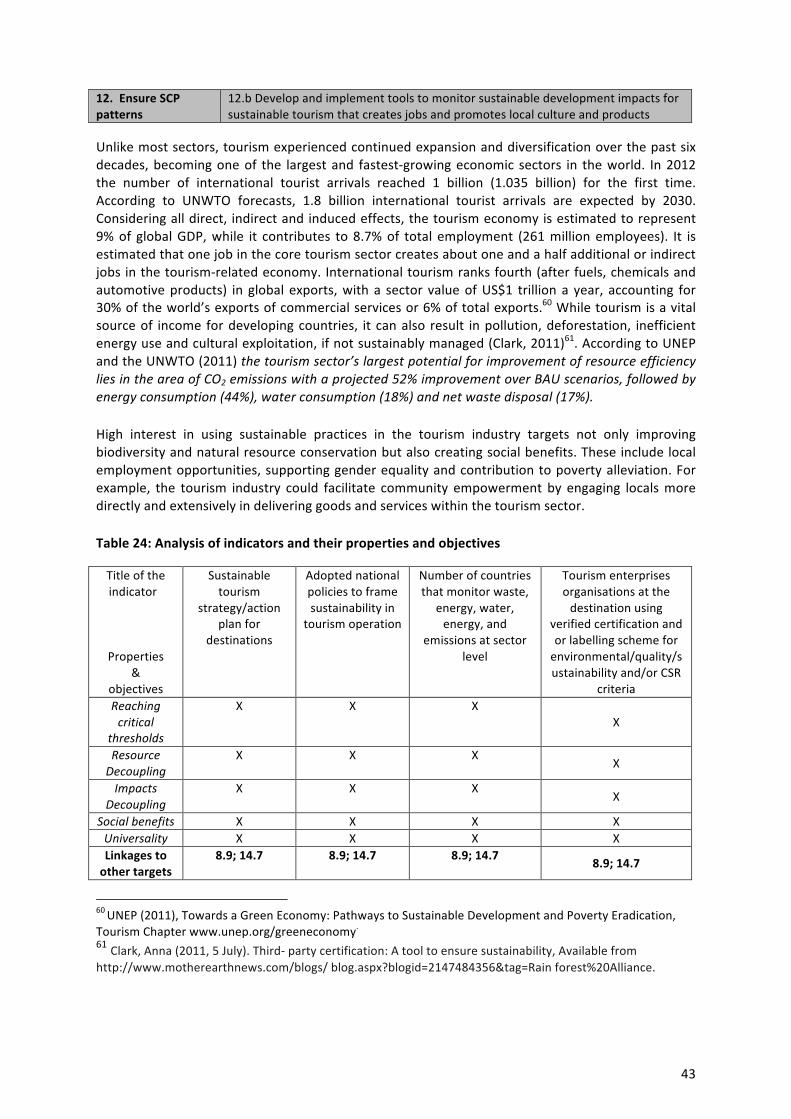
43
12. Ensure SCP patterns
12.b Develop and implement tools to monitor sustainable development impacts for sustainable tourism that creates jobs and promotes local culture and products
Unlike most sectors, tourism experienced continued expansion and diversification over the past six decades, becoming one of the largest and fastest-‐growing economic sectors in the world. In 2012 the number of international tourist arrivals reached 1 billion (1.035 billion) for the first time. According to UNWTO forecasts, 1.8 billion international tourist arrivals are expected by 2030. Considering all direct, indirect and induced effects, the tourism economy is estimated to represent 9% of global GDP, while it contributes to 8.7% of total employment (261 million employees). It is estimated that one job in the core tourism sector creates about one and a half additional or indirect jobs in the tourism-‐related economy. International tourism ranks fourth (after fuels, chemicals and automotive products) in global exports, with a sector value of US$1 trillion a year, accounting for 30% of the world’s exports of commercial services or 6% of total exports.60 While tourism is a vital source of income for developing countries, it can also result in pollution, deforestation, inefficient energy use and cultural exploitation, if not sustainably managed (Clark, 2011)61. According to UNEP and the UNWTO (2011) the tourism sector’s largest potential for improvement of resource efficiency lies in the area of CO2 emissions with a projected 52% improvement over BAU scenarios, followed by energy consumption (44%), water consumption (18%) and net waste disposal (17%). High interest in using sustainable practices in the tourism industry targets not only improving biodiversity and natural resource conservation but also creating social benefits. These include local employment opportunities, supporting gender equality and contribution to poverty alleviation. For example, the tourism industry could facilitate community empowerment by engaging locals more directly and extensively in delivering goods and services within the tourism sector. Table 24: Analysis of indicators and their properties and objectives Title of the indicator
Properties &
objectives
Sustainable tourism
strategy/action plan for
destinations
Adopted national policies to frame sustainability in
tourism operation
Number of countries that monitor waste,
energy, water, energy, and
emissions at sector level
Tourism enterprises organisations at the destination using
verified certification and or labelling scheme for environmental/quality/sustainability and/or CSR
criteria Reaching critical
thresholds
X X X X
Resource Decoupling
X X X X
Impacts Decoupling
X X X X
Social benefits X X X X Universality X X X X Linkages to other targets
8.9; 14.7 8.9; 14.7 8.9; 14.7 8.9; 14.7
60 UNEP (2011), Towards a Green Economy: Pathways to Sustainable Development and Poverty Eradication, Tourism Chapter www.unep.org/greeneconomy. 61 Clark, Anna (2011, 5 July). Third-‐ party certification: A tool to ensure sustainability, Available from http://www.motherearthnews.com/blogs/ blog.aspx?blogid=2147484356&tag=Rain forest%20Alliance.
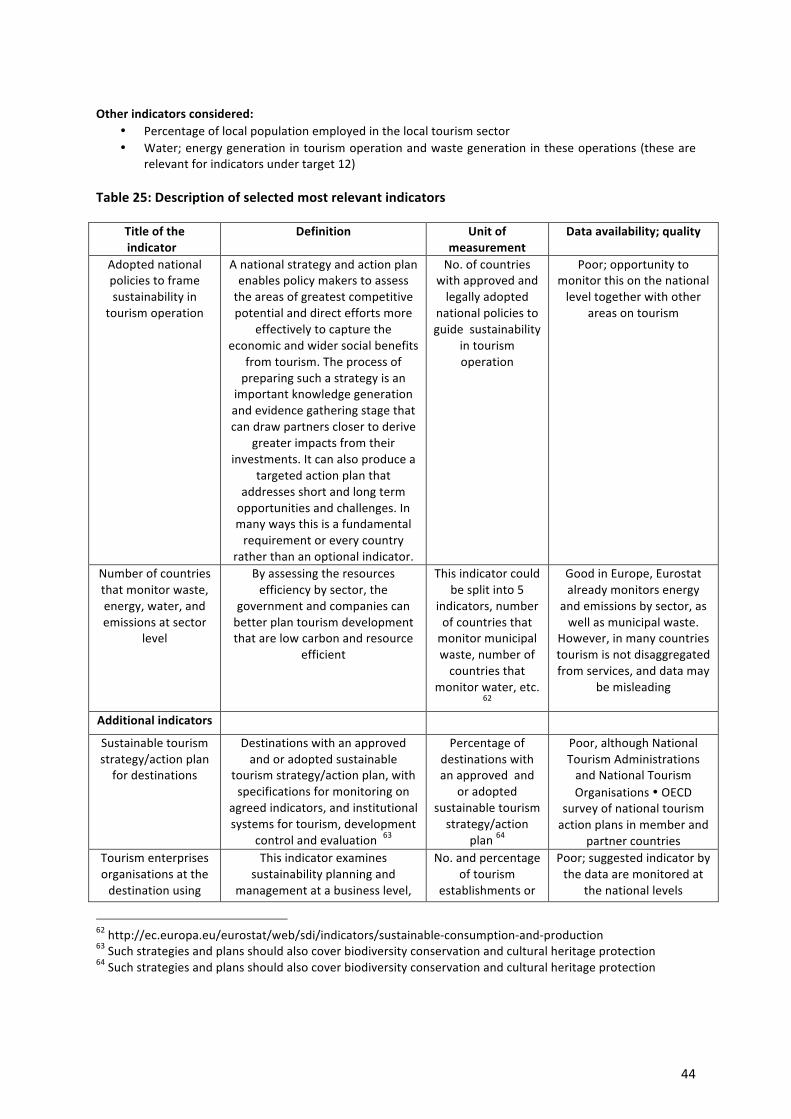
44
Other indicators considered:
• Percentage of local population employed in the local tourism sector • Water; energy generation in tourism operation and waste generation in these operations (these are
relevant for indicators under target 12) Table 25: Description of selected most relevant indicators
Title of the indicator
Definition Unit of measurement
Data availability; quality
Adopted national policies to frame sustainability in
tourism operation
A national strategy and action plan enables policy makers to assess the areas of greatest competitive potential and direct efforts more
effectively to capture the economic and wider social benefits
from tourism. The process of preparing such a strategy is an
important knowledge generation and evidence gathering stage that can draw partners closer to derive
greater impacts from their investments. It can also produce a
targeted action plan that addresses short and long term opportunities and challenges. In many ways this is a fundamental requirement or every country
rather than an optional indicator.
No. of countries with approved and legally adopted
national policies to guide sustainability
in tourism operation
Poor; opportunity to monitor this on the national level together with other
areas on tourism
Number of countries that monitor waste, energy, water, and emissions at sector
level
By assessing the resources efficiency by sector, the
government and companies can better plan tourism development that are low carbon and resource
efficient
This indicator could be split into 5
indicators, number of countries that monitor municipal waste, number of countries that
monitor water, etc. 62
Good in Europe, Eurostat already monitors energy
and emissions by sector, as well as municipal waste.
However, in many countries tourism is not disaggregated from services, and data may
be misleading
Additional indicators
Sustainable tourism strategy/action plan for destinations
Destinations with an approved and or adopted sustainable
tourism strategy/action plan, with specifications for monitoring on
agreed indicators, and institutional systems for tourism, development
control and evaluation 63
Percentage of destinations with an approved and
or adopted sustainable tourism strategy/action
plan 64
Poor, although National Tourism Administrations and National Tourism Organisations • OECD
survey of national tourism action plans in member and
partner countries Tourism enterprises organisations at the destination using
This indicator examines sustainability planning and
management at a business level,
No. and percentage of tourism
establishments or
Poor; suggested indicator by the data are monitored at
the national levels
62 http://ec.europa.eu/eurostat/web/sdi/indicators/sustainable-‐consumption-‐and-‐production 63 Such strategies and plans should also cover biodiversity conservation and cultural heritage protection 64 Such strategies and plans should also cover biodiversity conservation and cultural heritage protection
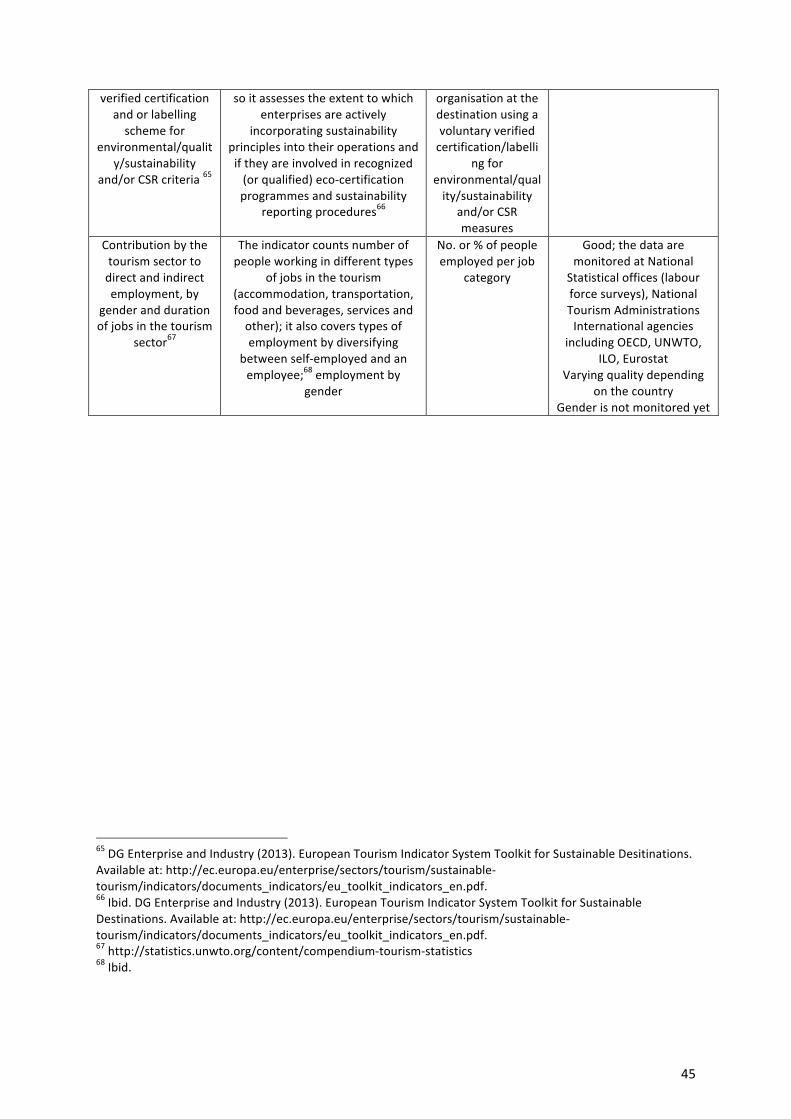
45
verified certification and or labelling scheme for
environmental/quality/sustainability
and/or CSR criteria 65
so it assesses the extent to which enterprises are actively
incorporating sustainability principles into their operations and if they are involved in recognized (or qualified) eco-‐certification programmes and sustainability
reporting procedures66
organisation at the destination using a voluntary verified certification/labelli
ng for environmental/quality/sustainability
and/or CSR measures
Contribution by the tourism sector to direct and indirect employment, by
gender and duration of jobs in the tourism
sector67
The indicator counts number of people working in different types
of jobs in the tourism (accommodation, transportation, food and beverages, services and other); it also covers types of employment by diversifying
between self-‐employed and an employee;68 employment by
gender
No. or % of people employed per job
category
Good; the data are monitored at National Statistical offices (labour force surveys), National Tourism Administrations International agencies
including OECD, UNWTO, ILO, Eurostat
Varying quality depending on the country
Gender is not monitored yet
65 DG Enterprise and Industry (2013). European Tourism Indicator System Toolkit for Sustainable Desitinations. Available at: http://ec.europa.eu/enterprise/sectors/tourism/sustainable-‐tourism/indicators/documents_indicators/eu_toolkit_indicators_en.pdf. 66 Ibid. DG Enterprise and Industry (2013). European Tourism Indicator System Toolkit for Sustainable Destinations. Available at: http://ec.europa.eu/enterprise/sectors/tourism/sustainable-‐tourism/indicators/documents_indicators/eu_toolkit_indicators_en.pdf. 67 http://statistics.unwto.org/content/compendium-‐tourism-‐statistics 68 Ibid.
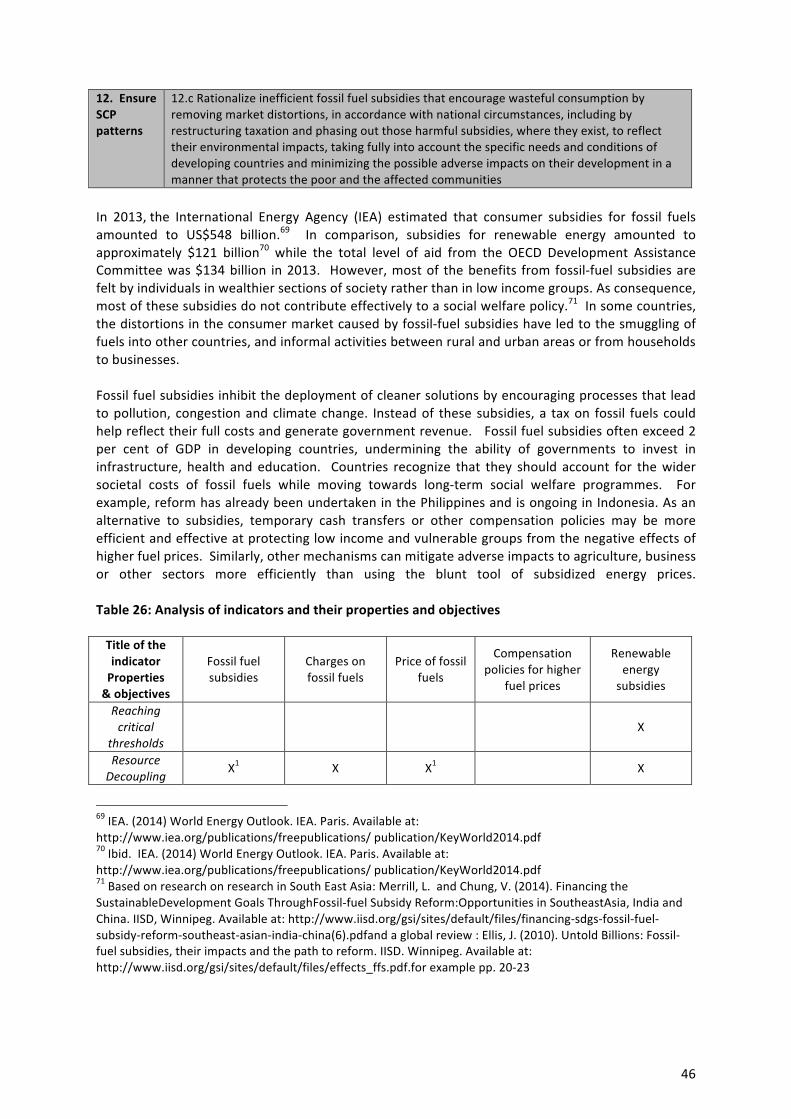
46
12. Ensure SCP patterns
12.c Rationalize inefficient fossil fuel subsidies that encourage wasteful consumption by removing market distortions, in accordance with national circumstances, including by restructuring taxation and phasing out those harmful subsidies, where they exist, to reflect their environmental impacts, taking fully into account the specific needs and conditions of developing countries and minimizing the possible adverse impacts on their development in a manner that protects the poor and the affected communities
In 2013, the International Energy Agency (IEA) estimated that consumer subsidies for fossil fuels amounted to US$548 billion.69 In comparison, subsidies for renewable energy amounted to approximately $121 billion70 while the total level of aid from the OECD Development Assistance Committee was $134 billion in 2013. However, most of the benefits from fossil-‐fuel subsidies are felt by individuals in wealthier sections of society rather than in low income groups. As consequence, most of these subsidies do not contribute effectively to a social welfare policy.71 In some countries, the distortions in the consumer market caused by fossil-‐fuel subsidies have led to the smuggling of fuels into other countries, and informal activities between rural and urban areas or from households to businesses. Fossil fuel subsidies inhibit the deployment of cleaner solutions by encouraging processes that lead to pollution, congestion and climate change. Instead of these subsidies, a tax on fossil fuels could help reflect their full costs and generate government revenue. Fossil fuel subsidies often exceed 2 per cent of GDP in developing countries, undermining the ability of governments to invest in infrastructure, health and education. Countries recognize that they should account for the wider societal costs of fossil fuels while moving towards long-‐term social welfare programmes. For example, reform has already been undertaken in the Philippines and is ongoing in Indonesia. As an alternative to subsidies, temporary cash transfers or other compensation policies may be more efficient and effective at protecting low income and vulnerable groups from the negative effects of higher fuel prices. Similarly, other mechanisms can mitigate adverse impacts to agriculture, business or other sectors more efficiently than using the blunt tool of subsidized energy prices. Table 26: Analysis of indicators and their properties and objectives Title of the indicator Properties & objectives
Fossil fuel subsidies
Charges on fossil fuels
Price of fossil fuels
Compensation policies for higher
fuel prices
Renewable energy subsidies
Reaching critical
thresholds X
Resource Decoupling
X1 X X1 X
69 IEA. (2014) World Energy Outlook. IEA. Paris. Available at: http://www.iea.org/publications/freepublications/ publication/KeyWorld2014.pdf 70 Ibid. IEA. (2014) World Energy Outlook. IEA. Paris. Available at: http://www.iea.org/publications/freepublications/ publication/KeyWorld2014.pdf 71 Based on research on research in South East Asia: Merrill, L. and Chung, V. (2014). Financing the SustainableDevelopment Goals ThroughFossil-‐fuel Subsidy Reform:Opportunities in SoutheastAsia, India and China. IISD, Winnipeg. Available at: http://www.iisd.org/gsi/sites/default/files/financing-‐sdgs-‐fossil-‐fuel-‐subsidy-‐reform-‐southeast-‐asian-‐india-‐china(6).pdfand a global review : Ellis, J. (2010). Untold Billions: Fossil-‐fuel subsidies, their impacts and the path to reform. IISD. Winnipeg. Available at: http://www.iisd.org/gsi/sites/default/files/effects_ffs.pdf.for example pp. 20-‐23
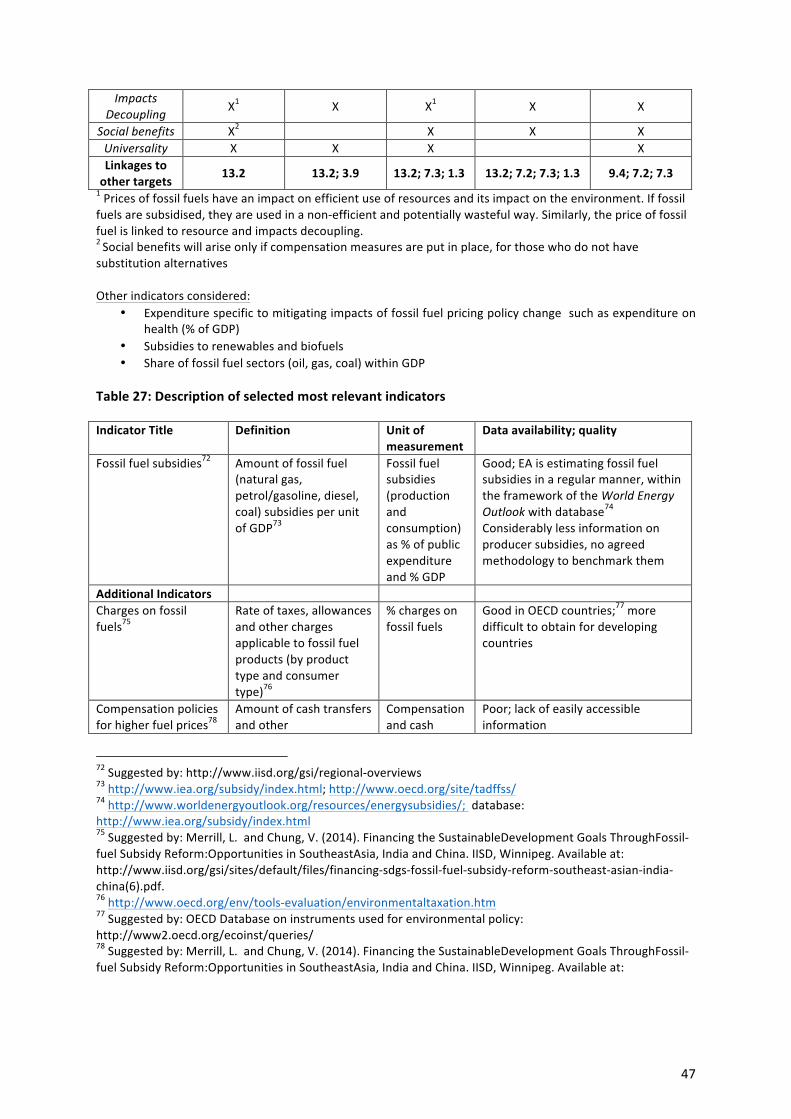
47
Impacts Decoupling X1 X X1 X X
Social benefits X2 X X X Universality X X X X Linkages to other targets
13.2 13.2; 3.9 13.2; 7.3; 1.3 13.2; 7.2; 7.3; 1.3 9.4; 7.2; 7.3 1 Prices of fossil fuels have an impact on efficient use of resources and its impact on the environment. If fossil fuels are subsidised, they are used in a non-‐efficient and potentially wasteful way. Similarly, the price of fossil fuel is linked to resource and impacts decoupling. 2 Social benefits will arise only if compensation measures are put in place, for those who do not have substitution alternatives Other indicators considered:
• Expenditure specific to mitigating impacts of fossil fuel pricing policy change such as expenditure on health (% of GDP)
• Subsidies to renewables and biofuels • Share of fossil fuel sectors (oil, gas, coal) within GDP
Table 27: Description of selected most relevant indicators Indicator Title Definition Unit of
measurement Data availability; quality
Fossil fuel subsidies72 Amount of fossil fuel (natural gas, petrol/gasoline, diesel, coal) subsidies per unit of GDP73
Fossil fuel subsidies (production and consumption) as % of public expenditure and % GDP
Good; EA is estimating fossil fuel subsidies in a regular manner, within the framework of the World Energy Outlook with database74 Considerably less information on producer subsidies, no agreed methodology to benchmark them
Additional Indicators Charges on fossil fuels75
Rate of taxes, allowances and other charges applicable to fossil fuel products (by product type and consumer type)76
% charges on fossil fuels
Good in OECD countries;77 more difficult to obtain for developing countries
Compensation policies for higher fuel prices78
Amount of cash transfers and other
Compensation and cash
Poor; lack of easily accessible information
72 Suggested by: http://www.iisd.org/gsi/regional-‐overviews 73 http://www.iea.org/subsidy/index.html; http://www.oecd.org/site/tadffss/ 74 http://www.worldenergyoutlook.org/resources/energysubsidies/; database: http://www.iea.org/subsidy/index.html 75 Suggested by: Merrill, L. and Chung, V. (2014). Financing the SustainableDevelopment Goals ThroughFossil-‐fuel Subsidy Reform:Opportunities in SoutheastAsia, India and China. IISD, Winnipeg. Available at: http://www.iisd.org/gsi/sites/default/files/financing-‐sdgs-‐fossil-‐fuel-‐subsidy-‐reform-‐southeast-‐asian-‐india-‐china(6).pdf. 76 http://www.oecd.org/env/tools-‐evaluation/environmentaltaxation.htm 77 Suggested by: OECD Database on instruments used for environmental policy: http://www2.oecd.org/ecoinst/queries/ 78 Suggested by: Merrill, L. and Chung, V. (2014). Financing the SustainableDevelopment Goals ThroughFossil-‐fuel Subsidy Reform:Opportunities in SoutheastAsia, India and China. IISD, Winnipeg. Available at:
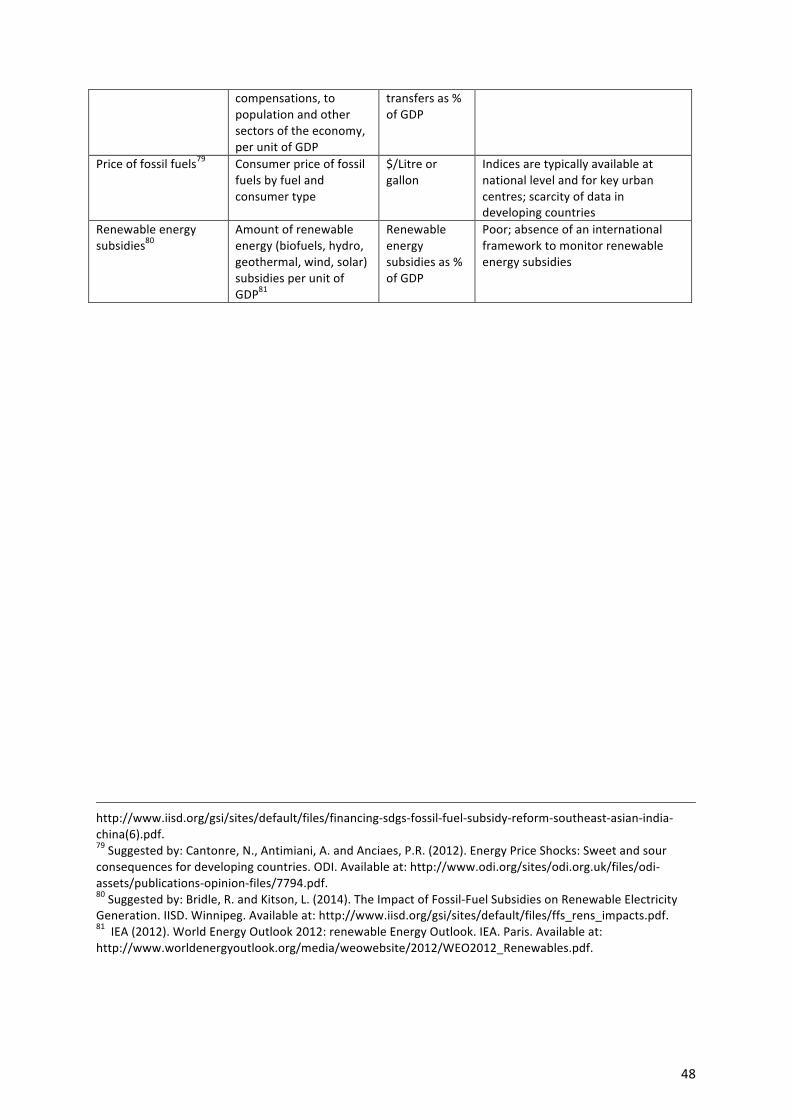
48
compensations, to population and other sectors of the economy, per unit of GDP
transfers as % of GDP
Price of fossil fuels79 Consumer price of fossil fuels by fuel and consumer type
$/Litre or gallon
Indices are typically available at national level and for key urban centres; scarcity of data in developing countries
Renewable energy subsidies80
Amount of renewable energy (biofuels, hydro, geothermal, wind, solar) subsidies per unit of GDP81
Renewable energy subsidies as % of GDP
Poor; absence of an international framework to monitor renewable energy subsidies
http://www.iisd.org/gsi/sites/default/files/financing-‐sdgs-‐fossil-‐fuel-‐subsidy-‐reform-‐southeast-‐asian-‐india-‐china(6).pdf. 79 Suggested by: Cantonre, N., Antimiani, A. and Anciaes, P.R. (2012). Energy Price Shocks: Sweet and sour consequences for developing countries. ODI. Available at: http://www.odi.org/sites/odi.org.uk/files/odi-‐assets/publications-‐opinion-‐files/7794.pdf. 80 Suggested by: Bridle, R. and Kitson, L. (2014). The Impact of Fossil-‐Fuel Subsidies on Renewable Electricity Generation. IISD. Winnipeg. Available at: http://www.iisd.org/gsi/sites/default/files/ffs_rens_impacts.pdf. 81 IEA (2012). World Energy Outlook 2012: renewable Energy Outlook. IEA. Paris. Available at: http://www.worldenergyoutlook.org/media/weowebsite/2012/WEO2012_Renewables.pdf.
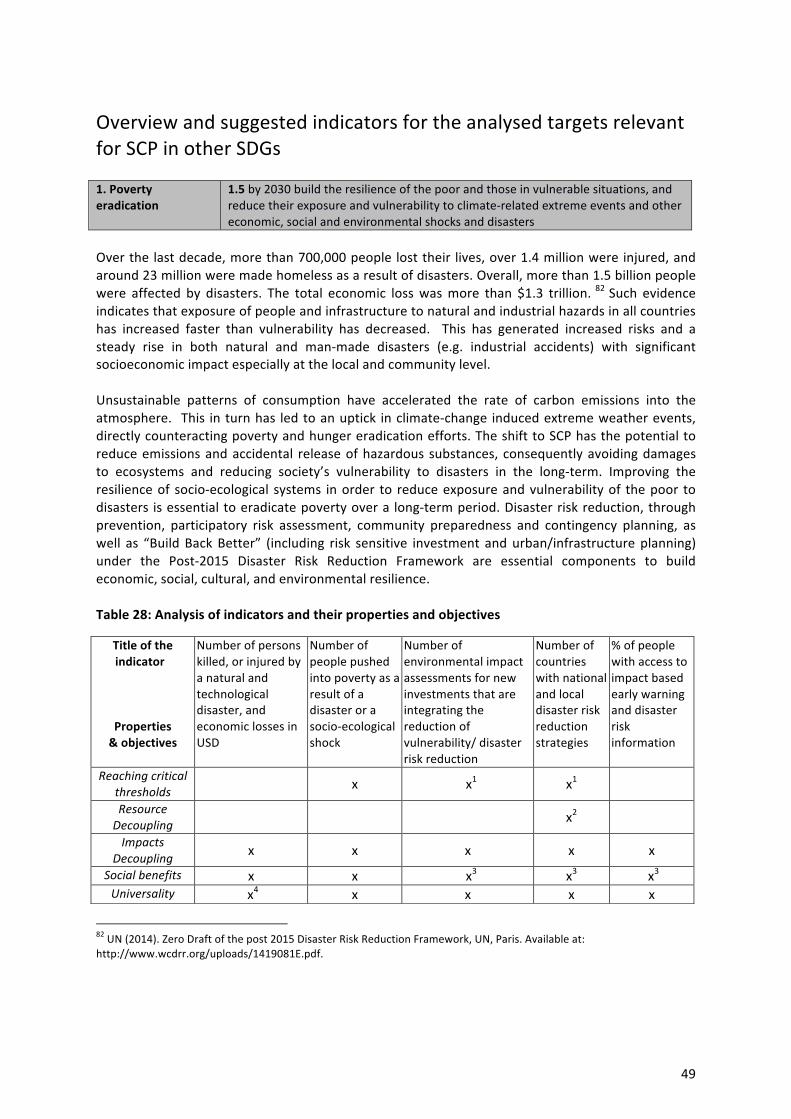
49
Overview and suggested indicators for the analysed targets relevant for SCP in other SDGs 1. Poverty eradication
1.5 by 2030 build the resilience of the poor and those in vulnerable situations, and reduce their exposure and vulnerability to climate-‐related extreme events and other economic, social and environmental shocks and disasters
Over the last decade, more than 700,000 people lost their lives, over 1.4 million were injured, and around 23 million were made homeless as a result of disasters. Overall, more than 1.5 billion people were affected by disasters. The total economic loss was more than $1.3 trillion. 82 Such evidence indicates that exposure of people and infrastructure to natural and industrial hazards in all countries has increased faster than vulnerability has decreased. This has generated increased risks and a steady rise in both natural and man-‐made disasters (e.g. industrial accidents) with significant socioeconomic impact especially at the local and community level. Unsustainable patterns of consumption have accelerated the rate of carbon emissions into the atmosphere. This in turn has led to an uptick in climate-‐change induced extreme weather events, directly counteracting poverty and hunger eradication efforts. The shift to SCP has the potential to reduce emissions and accidental release of hazardous substances, consequently avoiding damages to ecosystems and reducing society’s vulnerability to disasters in the long-‐term. Improving the resilience of socio-‐ecological systems in order to reduce exposure and vulnerability of the poor to disasters is essential to eradicate poverty over a long-‐term period. Disaster risk reduction, through prevention, participatory risk assessment, community preparedness and contingency planning, as well as “Build Back Better” (including risk sensitive investment and urban/infrastructure planning) under the Post-‐2015 Disaster Risk Reduction Framework are essential components to build economic, social, cultural, and environmental resilience. Table 28: Analysis of indicators and their properties and objectives
82 UN (2014). Zero Draft of the post 2015 Disaster Risk Reduction Framework, UN, Paris. Available at: http://www.wcdrr.org/uploads/1419081E.pdf.
Title of the indicator
Properties & objectives
Number of persons killed, or injured by a natural and technological disaster, and economic losses in USD
Number of people pushed into poverty as a result of a disaster or a socio-‐ecological shock
Number of environmental impact assessments for new investments that are integrating the reduction of vulnerability/ disaster risk reduction
Number of countries with national and local disaster risk reduction strategies
% of people with access to impact based early warning and disaster risk information
Reaching critical thresholds x x1 x1
Resource Decoupling x2
Impacts Decoupling x x x x x
Social benefits x x x3 x3 x3 Universality x4 x x x x

50
1 The indicators are relevant to critical environmental thresholds, as overuse of resources can lead to land degradation or desertification beyond the carrying capacity of the Earth, hence amplifying effects of disasters. If environmental impact assessments integrate reduced vulnerability, the adoption of SCP practices will be favoured to avoid damages to the ecosystems. Disaster risk reduction strategies could include elements of SCP for the same reasons.
2 Disaster risk reduction strategies can have a component on more efficient use of resources (esp. local) to increase resilience. For example protecting mangroves can enhance local resilience to storm surges.
3 The social element of all the indicators listed above is straightforward, as they all impact human lives. Some of the indicators will help bring social benefits, as they are not only focusing on the result of disasters, especially the last three indicators.
4 Extremely relevant for both developed and developing countries, even if developing countries tend to be more vulnerable to extreme weather events and to the consequences of industrial accidents. Nonetheless, disasters/accidents happen everywhere and their social, environmental and economic consequences affect both developed and developing countries. As such, all countries will benefit from improved resilience and more resilient socio-‐ecological systems.
5 If single out those technological accidents involving hazardous chemicals. Other indicators considered:
• Number of disasters (technological and natural) and related magnitude (included in target 11.c) Table 29: Description of selected most relevant indicators
Title of the indicator Definition Unit of Measurement
Data availability and quality
Number of persons killed, or injured by a natural and technological disaster, and economic losses in USD83
Combination of SDSN proposal and available data from International disaster database, EM-‐DAT Possible urban/rural disaggregation, as well as male/female.
In lives lost, in # of people injured, and in USD
Good data availability on # persons killed and injured, quality to be enhanced. Poor availability and quality on USD
Number of environmental impact assessments for new investments that are integrating the reduction of vulnerability/ disaster risk reduction
It has not been monitored yet on the global level.
Number of Environmental impact assessment integrating disaster risk reduction (DRR) as a component
Poor; no comprehensive monitoring yet
Number of countries with national and local disaster risk reduction strategies84
Count countries with national disaster risk reduction (DRR) strategies, or national platforms, as defined and coordinated by UNISDR. Count countries with local DRR strategies.
Number of countries
Good at national level, needs to be consolidated
83 The International disaster database, EM-‐DAT www.emdat.be 84 Monitored by UNISDR, and possibly under the post-‐2015 framework for DRR http://www.unisdr.org/partners/countries
Linkages to other targets
9, 12.45, 11.5 Inform goal 1, 2.4, 11b
2.4, 3.9, 6.4, 9.4, 11b, 12.6
9.4, 11.b 3.9, 11.b
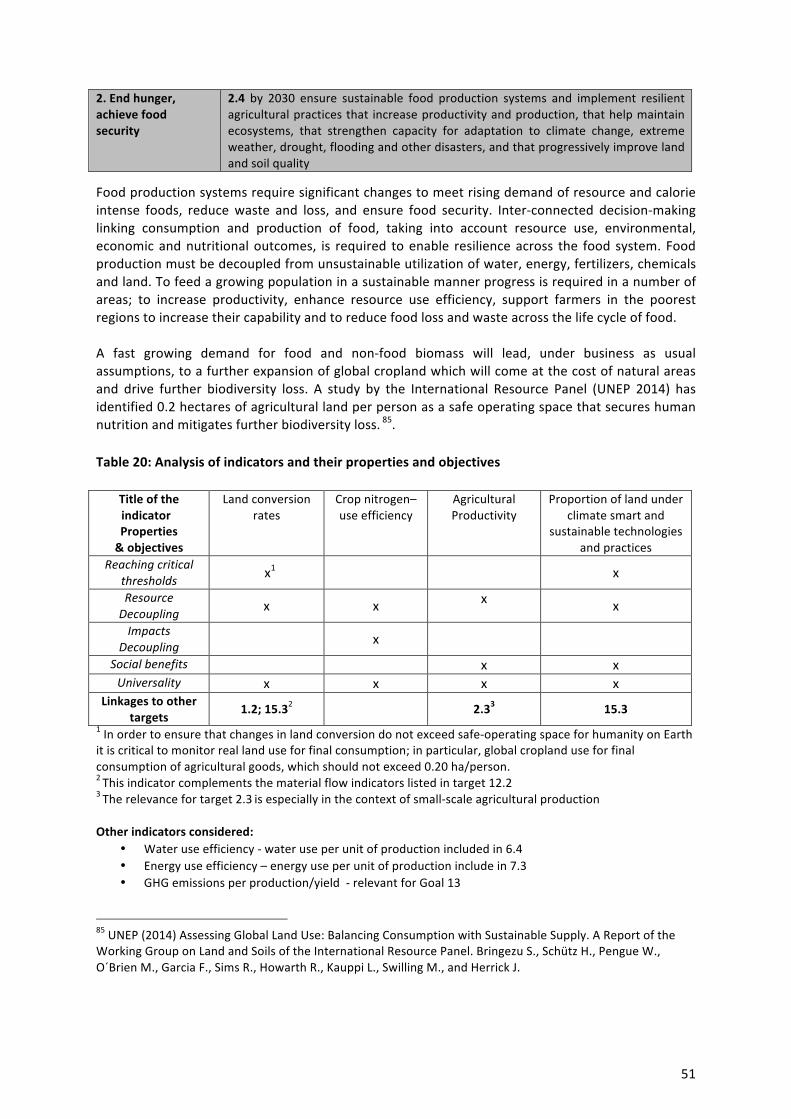
51
2. End hunger, achieve food security
2.4 by 2030 ensure sustainable food production systems and implement resilient agricultural practices that increase productivity and production, that help maintain ecosystems, that strengthen capacity for adaptation to climate change, extreme weather, drought, flooding and other disasters, and that progressively improve land and soil quality
Food production systems require significant changes to meet rising demand of resource and calorie intense foods, reduce waste and loss, and ensure food security. Inter-‐connected decision-‐making linking consumption and production of food, taking into account resource use, environmental, economic and nutritional outcomes, is required to enable resilience across the food system. Food production must be decoupled from unsustainable utilization of water, energy, fertilizers, chemicals and land. To feed a growing population in a sustainable manner progress is required in a number of areas; to increase productivity, enhance resource use efficiency, support farmers in the poorest regions to increase their capability and to reduce food loss and waste across the life cycle of food. A fast growing demand for food and non-‐food biomass will lead, under business as usual assumptions, to a further expansion of global cropland which will come at the cost of natural areas and drive further biodiversity loss. A study by the International Resource Panel (UNEP 2014) has identified 0.2 hectares of agricultural land per person as a safe operating space that secures human nutrition and mitigates further biodiversity loss. 85. Table 20: Analysis of indicators and their properties and objectives
Title of the indicator Properties & objectives
Land conversion rates
Crop nitrogen–use efficiency
Agricultural Productivity
Proportion of land under climate smart and
sustainable technologies and practices
Reaching critical thresholds x1 x
Resource Decoupling x x x x
Impacts Decoupling x
Social benefits x x Universality x x x x
Linkages to other targets
1.2; 15.32 2.33 15.3 1 In order to ensure that changes in land conversion do not exceed safe-‐operating space for humanity on Earth it is critical to monitor real land use for final consumption; in particular, global cropland use for final consumption of agricultural goods, which should not exceed 0.20 ha/person. 2 This indicator complements the material flow indicators listed in target 12.2 3 The relevance for target 2.3 is especially in the context of small-‐scale agricultural production Other indicators considered:
• Water use efficiency -‐ water use per unit of production included in 6.4 • Energy use efficiency – energy use per unit of production include in 7.3 • GHG emissions per production/yield -‐ relevant for Goal 13
85 UNEP (2014) Assessing Global Land Use: Balancing Consumption with Sustainable Supply. A Report of the Working Group on Land and Soils of the International Resource Panel. Bringezu S., Schütz H., Pengue W., O´Brien M., Garcia F., Sims R., Howarth R., Kauppi L., Swilling M., and Herrick J.
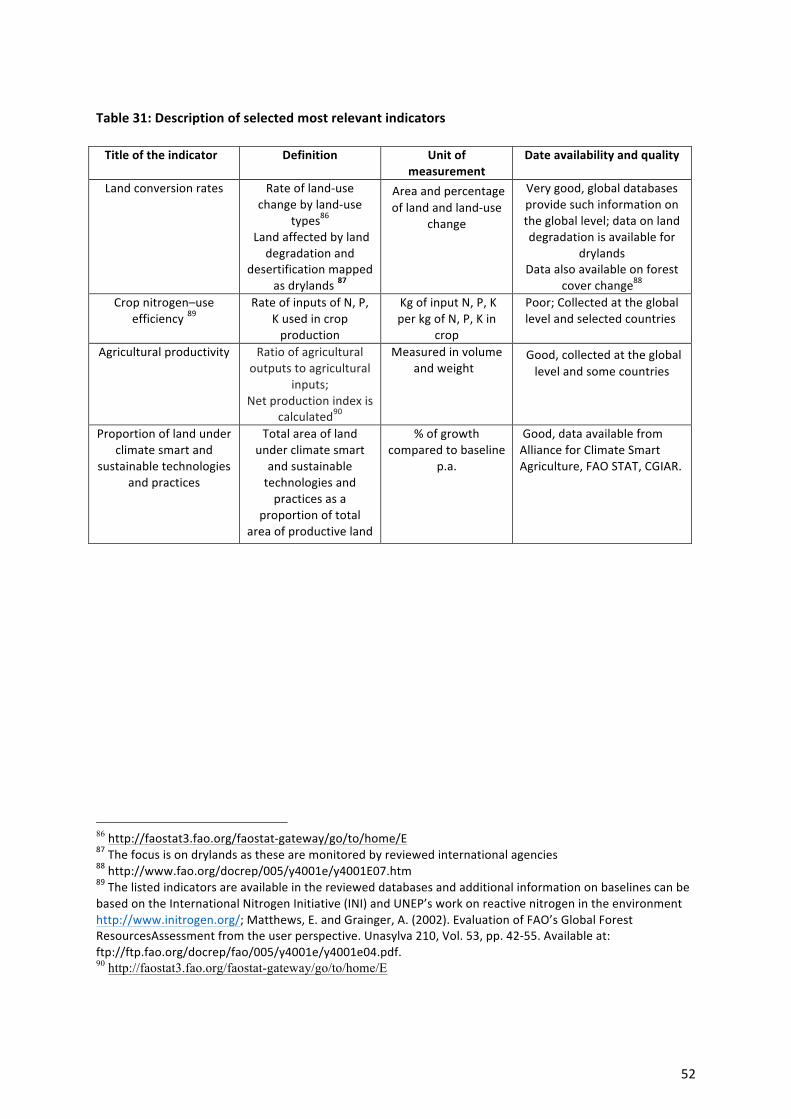
52
Table 31: Description of selected most relevant indicators Title of the indicator Definition Unit of
measurement Date availability and quality
Land conversion rates Rate of land-‐use change by land-‐use
types86 Land affected by land
degradation and desertification mapped
as drylands 87
Area and percentage of land and land-‐use
change
Very good, global databases provide such information on the global level; data on land degradation is available for
drylands Data also available on forest
cover change88 Crop nitrogen–use
efficiency 89 Rate of inputs of N, P,
K used in crop production
Kg of input N, P, K per kg of N, P, K in
crop
Poor; Collected at the global level and selected countries
Agricultural productivity Ratio of agricultural outputs to agricultural
inputs; Net production index is
calculated90
Measured in volume and weight
Good, collected at the global level and some countries
Proportion of land under climate smart and
sustainable technologies and practices
Total area of land under climate smart and sustainable technologies and practices as a
proportion of total area of productive land
% of growth compared to baseline
p.a.
Good, data available from Alliance for Climate Smart Agriculture, FAO STAT, CGIAR.
86 http://faostat3.fao.org/faostat-‐gateway/go/to/home/E 87 The focus is on drylands as these are monitored by reviewed international agencies 88 http://www.fao.org/docrep/005/y4001e/y4001E07.htm 89 The listed indicators are available in the reviewed databases and additional information on baselines can be based on the International Nitrogen Initiative (INI) and UNEP’s work on reactive nitrogen in the environment http://www.initrogen.org/; Matthews, E. and Grainger, A. (2002). Evaluation of FAO’s Global Forest ResourcesAssessment from the user perspective. Unasylva 210, Vol. 53, pp. 42-‐55. Available at: ftp://ftp.fao.org/docrep/fao/005/y4001e/y4001e04.pdf. 90 http://faostat3.fao.org/faostat-gateway/go/to/home/E

53
3. Ensure healthy lives and promote well-‐being
3.9 by 2030 substantially reduce the number of deaths and illnesses from hazardous chemicals and air, water, and soil pollution and contamination
This target covers different sectors, for example taking into account excessive use of nutrients and pesticides for agriculture, or consequences of industrial processes which contaminate groundwater and soils. It highlights the risk posed to human health, including death which results from unsustainable production and consumption practices releasing pollution to air, soil and water beyond acceptable levels. Air pollution exposure resulted in 7 million premature death per year, as estimated in 2012: 4.3 million due to household air pollution exposure, and 3.7 million due to ambient air pollution exposure in both urban and rural areas worldwide. Air pollution is now the world’s largest single environmental health risk (WHO March 2014)91. Outdoor pollution effects on health are mainly caused by particulate matters, called PM10 and PM2.5 because they measure respectively 10 microns or less, and 2.5 microns or less, in diameter. Hazardous chemicals, including water pollution and soil pollution and contamination also causes millions of illnesses and deaths worldwide, even if their measurement is more localized. For example, exposure to lead caused more than 8 million DALY in 200492. In some areas and/or in relation to occupational health, other chemicals, for example mercury and lead, lead to significant negative effects on health. One of the main effects of hazardous chemicals and air, water, and soil pollution is the associated damage to ecosystems, including ecosystems important for food production, such as waters and seas. Reducing pollutant emissions from energy consumption and industrial processes through resource efficiency approaches, will contribute to reducing negative impacts on the environment (which will in turn reduce human health impacts). Policy responses to achieve sustainable cities (urban areas gather more activities, hence more ambient air pollution) or to reduce the excessive use of fertilizers and pesticides will also help to reduce environmental and health impacts.
91 WHO, 2014, Fact sheet N°313 on “Ambient (outdoor) air quality and health”, and Fact Sheet N°292, on “Household air pollution and health”, Updated March 2014
92 Disability -Adjusted Life Years (or DALYs) are a summary measure of population health that combine (i) the years of life lost as a result of premature death and (ii) the years lived with a disease. (WHO definition)
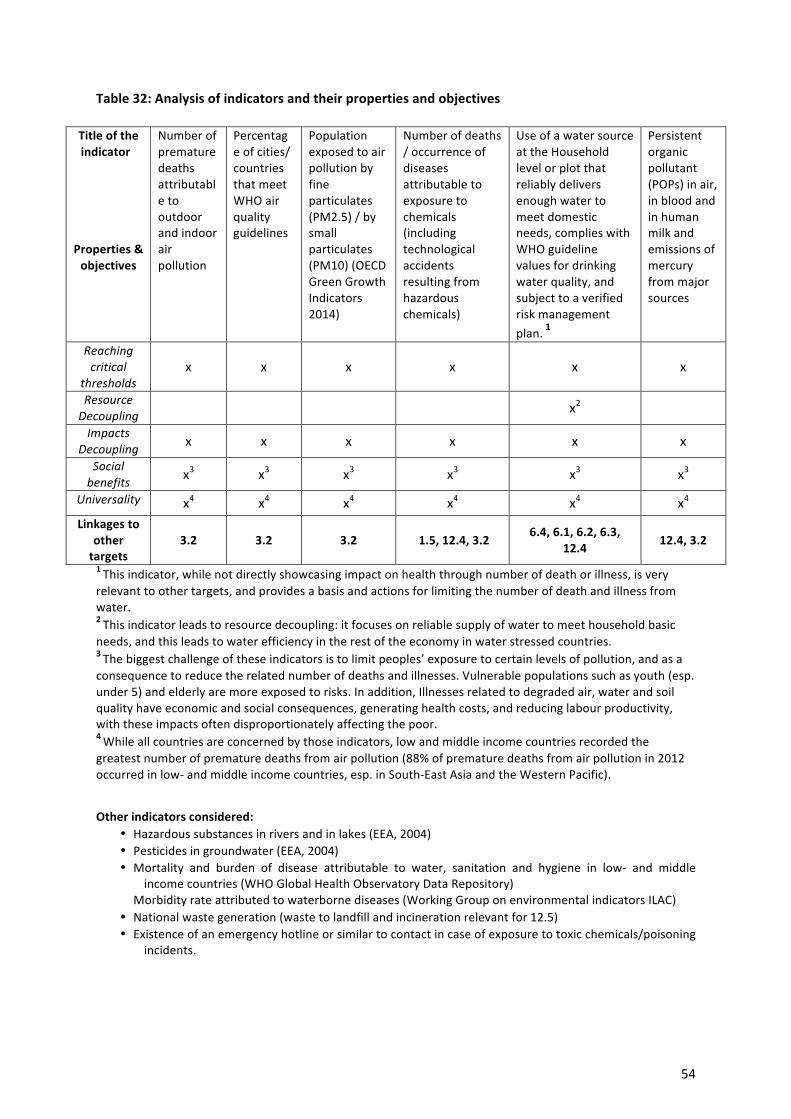
54
Table 32: Analysis of indicators and their properties and objectives
Title of the indicator
Properties & objectives
Number of premature deaths attributable to outdoor and indoor air pollution
Percentage of cities/ countries that meet WHO air quality guidelines
Population exposed to air pollution by fine particulates (PM2.5) / by small particulates (PM10) (OECD Green Growth Indicators 2014)
Number of deaths / occurrence of diseases attributable to exposure to chemicals (including technological accidents resulting from hazardous chemicals)
Use of a water source at the Household level or plot that reliably delivers enough water to meet domestic needs, complies with WHO guideline values for drinking water quality, and subject to a verified risk management plan. 1
Persistent organic pollutant (POPs) in air, in blood and in human milk and emissions of mercury from major sources
Reaching critical
thresholds x x x x x x
Resource Decoupling x2
Impacts Decoupling x x x x x x
Social benefits x3 x3 x3 x3 x3 x3
Universality x4 x4 x4 x4 x4 x4 Linkages to
other targets
3.2 3.2 3.2 1.5, 12.4, 3.2 6.4, 6.1, 6.2, 6.3,
12.4 12.4, 3.2
1 This indicator, while not directly showcasing impact on health through number of death or illness, is very relevant to other targets, and provides a basis and actions for limiting the number of death and illness from water. 2 This indicator leads to resource decoupling: it focuses on reliable supply of water to meet household basic needs, and this leads to water efficiency in the rest of the economy in water stressed countries. 3 The biggest challenge of these indicators is to limit peoples’ exposure to certain levels of pollution, and as a consequence to reduce the related number of deaths and illnesses. Vulnerable populations such as youth (esp. under 5) and elderly are more exposed to risks. In addition, Illnesses related to degraded air, water and soil quality have economic and social consequences, generating health costs, and reducing labour productivity, with these impacts often disproportionately affecting the poor. 4 While all countries are concerned by those indicators, low and middle income countries recorded the greatest number of premature deaths from air pollution (88% of premature deaths from air pollution in 2012 occurred in low-‐ and middle income countries, esp. in South-‐East Asia and the Western Pacific). Other indicators considered:
• Hazardous substances in rivers and in lakes (EEA, 2004) • Pesticides in groundwater (EEA, 2004) • Mortality and burden of disease attributable to water, sanitation and hygiene in low-‐ and middle
income countries (WHO Global Health Observatory Data Repository) Morbidity rate attributed to waterborne diseases (Working Group on environmental indicators ILAC)
• National waste generation (waste to landfill and incineration relevant for 12.5) • Existence of an emergency hotline or similar to contact in case of exposure to toxic chemicals/poisoning
incidents.
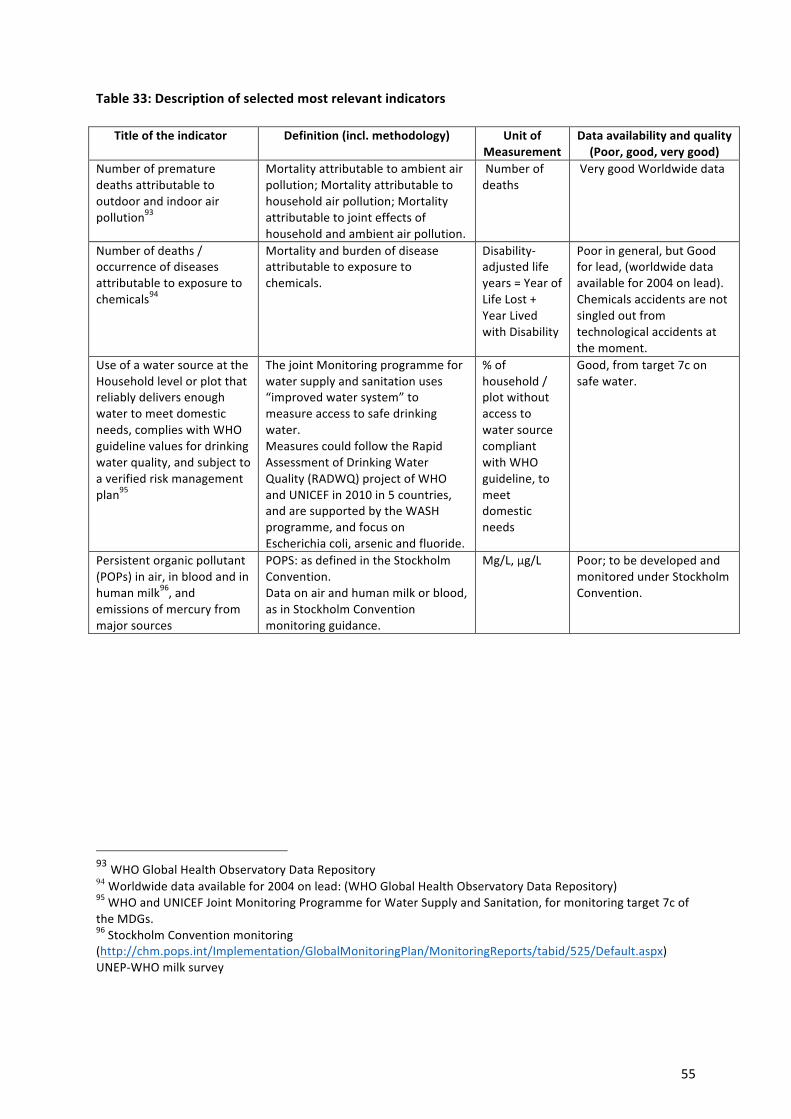
55
Table 33: Description of selected most relevant indicators
Title of the indicator Definition (incl. methodology) Unit of Measurement
Data availability and quality (Poor, good, very good)
Number of premature deaths attributable to outdoor and indoor air pollution93
Mortality attributable to ambient air pollution; Mortality attributable to household air pollution; Mortality attributable to joint effects of household and ambient air pollution.
Number of deaths
Very good Worldwide data
Number of deaths / occurrence of diseases attributable to exposure to chemicals94
Mortality and burden of disease attributable to exposure to chemicals.
Disability-‐adjusted life years = Year of Life Lost + Year Lived with Disability
Poor in general, but Good for lead, (worldwide data available for 2004 on lead). Chemicals accidents are not singled out from technological accidents at the moment.
Use of a water source at the Household level or plot that reliably delivers enough water to meet domestic needs, complies with WHO guideline values for drinking water quality, and subject to a verified risk management plan95
The joint Monitoring programme for water supply and sanitation uses “improved water system” to measure access to safe drinking water. Measures could follow the Rapid Assessment of Drinking Water Quality (RADWQ) project of WHO and UNICEF in 2010 in 5 countries, and are supported by the WASH programme, and focus on Escherichia coli, arsenic and fluoride.
% of household / plot without access to water source compliant with WHO guideline, to meet domestic needs
Good, from target 7c on safe water.
Persistent organic pollutant (POPs) in air, in blood and in human milk96, and emissions of mercury from major sources
POPS: as defined in the Stockholm Convention. Data on air and human milk or blood, as in Stockholm Convention monitoring guidance.
Mg/L, µg/L Poor; to be developed and monitored under Stockholm Convention.
93 WHO Global Health Observatory Data Repository 94 Worldwide data available for 2004 on lead: (WHO Global Health Observatory Data Repository) 95 WHO and UNICEF Joint Monitoring Programme for Water Supply and Sanitation, for monitoring target 7c of the MDGs. 96 Stockholm Convention monitoring (http://chm.pops.int/Implementation/GlobalMonitoringPlan/MonitoringReports/tabid/525/Default.aspx) UNEP-‐WHO milk survey
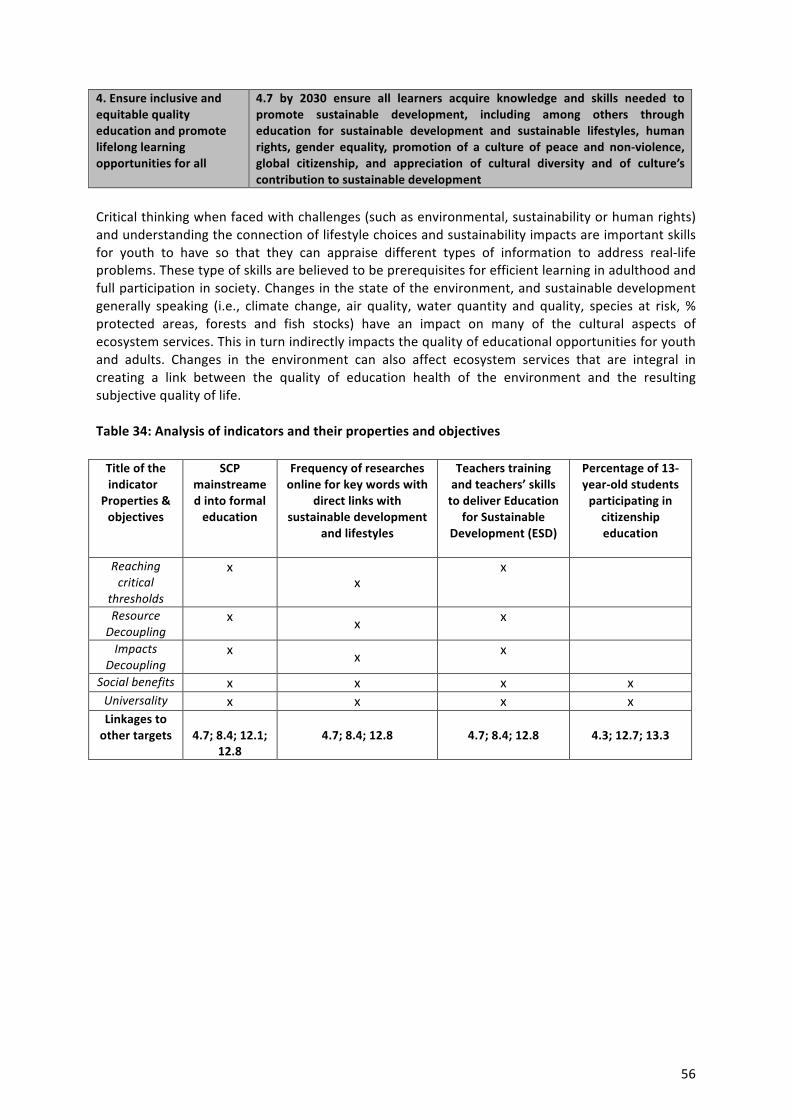
56
4. Ensure inclusive and equitable quality education and promote lifelong learning opportunities for all
4.7 by 2030 ensure all learners acquire knowledge and skills needed to promote sustainable development, including among others through education for sustainable development and sustainable lifestyles, human rights, gender equality, promotion of a culture of peace and non-‐violence, global citizenship, and appreciation of cultural diversity and of culture’s contribution to sustainable development
Critical thinking when faced with challenges (such as environmental, sustainability or human rights) and understanding the connection of lifestyle choices and sustainability impacts are important skills for youth to have so that they can appraise different types of information to address real-‐life problems. These type of skills are believed to be prerequisites for efficient learning in adulthood and full participation in society. Changes in the state of the environment, and sustainable development generally speaking (i.e., climate change, air quality, water quantity and quality, species at risk, % protected areas, forests and fish stocks) have an impact on many of the cultural aspects of ecosystem services. This in turn indirectly impacts the quality of educational opportunities for youth and adults. Changes in the environment can also affect ecosystem services that are integral in creating a link between the quality of education health of the environment and the resulting subjective quality of life. Table 34: Analysis of indicators and their properties and objectives Title of the indicator
Properties & objectives
SCP mainstreamed into formal education
Frequency of researches online for key words with
direct links with sustainable development
and lifestyles
Teachers training and teachers’ skills to deliver Education
for Sustainable Development (ESD)
Percentage of 13-‐year-‐old students participating in citizenship education
Reaching critical
thresholds
x x
x
Resource Decoupling
x x x
Impacts Decoupling
x x x
Social benefits x x x x Universality x x x x Linkages to other targets
4.7; 8.4; 12.1;
12.8 4.7; 8.4; 12.8
4.7; 8.4; 12.8 4.3; 12.7; 13.3
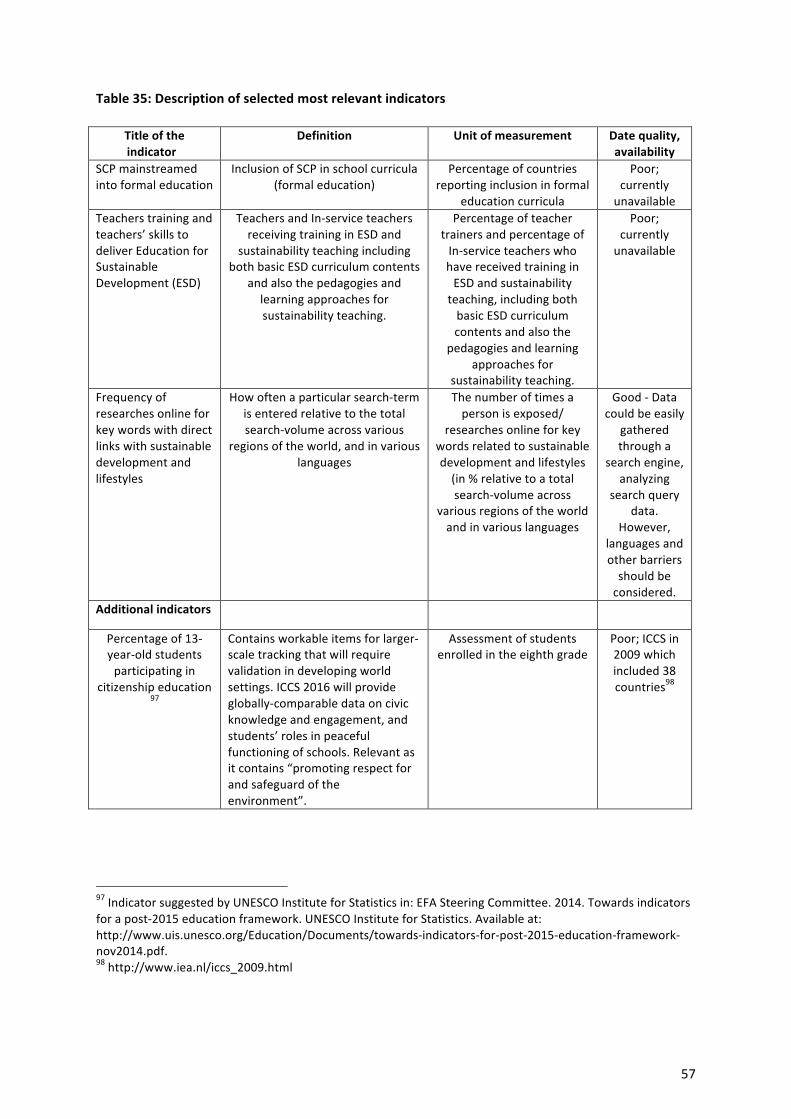
57
Table 35: Description of selected most relevant indicators
Title of the indicator
Definition Unit of measurement Date quality, availability
SCP mainstreamed into formal education
Inclusion of SCP in school curricula (formal education)
Percentage of countries reporting inclusion in formal
education curricula
Poor; currently unavailable
Teachers training and teachers’ skills to deliver Education for Sustainable Development (ESD)
Teachers and In-‐service teachers receiving training in ESD and
sustainability teaching including both basic ESD curriculum contents
and also the pedagogies and learning approaches for sustainability teaching.
Percentage of teacher trainers and percentage of In-‐service teachers who have received training in ESD and sustainability teaching, including both basic ESD curriculum contents and also the
pedagogies and learning approaches for
sustainability teaching.
Poor; currently unavailable
Frequency of researches online for key words with direct links with sustainable development and lifestyles
How often a particular search-‐term is entered relative to the total search-‐volume across various
regions of the world, and in various languages
The number of times a person is exposed/
researches online for key words related to sustainable development and lifestyles (in % relative to a total search-‐volume across
various regions of the world and in various languages
Good -‐ Data could be easily
gathered through a
search engine, analyzing
search query data.
However, languages and other barriers should be considered.
Additional indicators
Percentage of 13-‐year-‐old students participating in
citizenship education 97
Contains workable items for larger-‐scale tracking that will require validation in developing world settings. ICCS 2016 will provide globally-‐comparable data on civic knowledge and engagement, and students’ roles in peaceful functioning of schools. Relevant as it contains “promoting respect for and safeguard of the environment”.
Assessment of students enrolled in the eighth grade
Poor; ICCS in 2009 which included 38 countries98
97 Indicator suggested by UNESCO Institute for Statistics in: EFA Steering Committee. 2014. Towards indicators for a post-‐2015 education framework. UNESCO Institute for Statistics. Available at: http://www.uis.unesco.org/Education/Documents/towards-‐indicators-‐for-‐post-‐2015-‐education-‐framework-‐nov2014.pdf. 98 http://www.iea.nl/iccs_2009.html
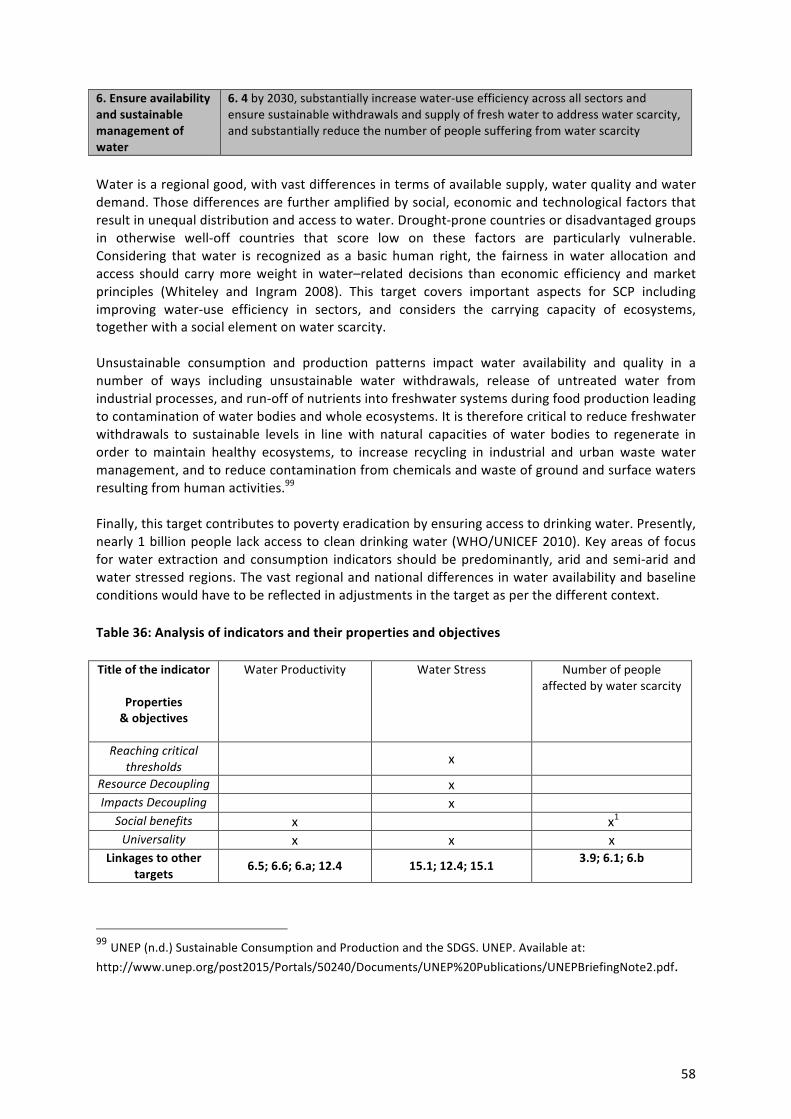
58
6. Ensure availability and sustainable management of water
6. 4 by 2030, substantially increase water-‐use efficiency across all sectors and ensure sustainable withdrawals and supply of fresh water to address water scarcity, and substantially reduce the number of people suffering from water scarcity
Water is a regional good, with vast differences in terms of available supply, water quality and water demand. Those differences are further amplified by social, economic and technological factors that result in unequal distribution and access to water. Drought-‐prone countries or disadvantaged groups in otherwise well-‐off countries that score low on these factors are particularly vulnerable. Considering that water is recognized as a basic human right, the fairness in water allocation and access should carry more weight in water–related decisions than economic efficiency and market principles (Whiteley and Ingram 2008). This target covers important aspects for SCP including improving water-‐use efficiency in sectors, and considers the carrying capacity of ecosystems, together with a social element on water scarcity. Unsustainable consumption and production patterns impact water availability and quality in a number of ways including unsustainable water withdrawals, release of untreated water from industrial processes, and run-‐off of nutrients into freshwater systems during food production leading to contamination of water bodies and whole ecosystems. It is therefore critical to reduce freshwater withdrawals to sustainable levels in line with natural capacities of water bodies to regenerate in order to maintain healthy ecosystems, to increase recycling in industrial and urban waste water management, and to reduce contamination from chemicals and waste of ground and surface waters resulting from human activities.99 Finally, this target contributes to poverty eradication by ensuring access to drinking water. Presently, nearly 1 billion people lack access to clean drinking water (WHO/UNICEF 2010). Key areas of focus for water extraction and consumption indicators should be predominantly, arid and semi-‐arid and water stressed regions. The vast regional and national differences in water availability and baseline conditions would have to be reflected in adjustments in the target as per the different context. Table 36: Analysis of indicators and their properties and objectives Title of the indicator
Properties & objectives
Water Productivity Water Stress Number of people affected by water scarcity
Reaching critical thresholds x
Resource Decoupling x Impacts Decoupling x
Social benefits x x1
Universality x x x Linkages to other
targets 6.5; 6.6; 6.a; 12.4 15.1; 12.4; 15.1 3.9; 6.1; 6.b
99 UNEP (n.d.) Sustainable Consumption and Production and the SDGS. UNEP. Available at: http://www.unep.org/post2015/Portals/50240/Documents/UNEP%20Publications/UNEPBriefingNote2.pdf.
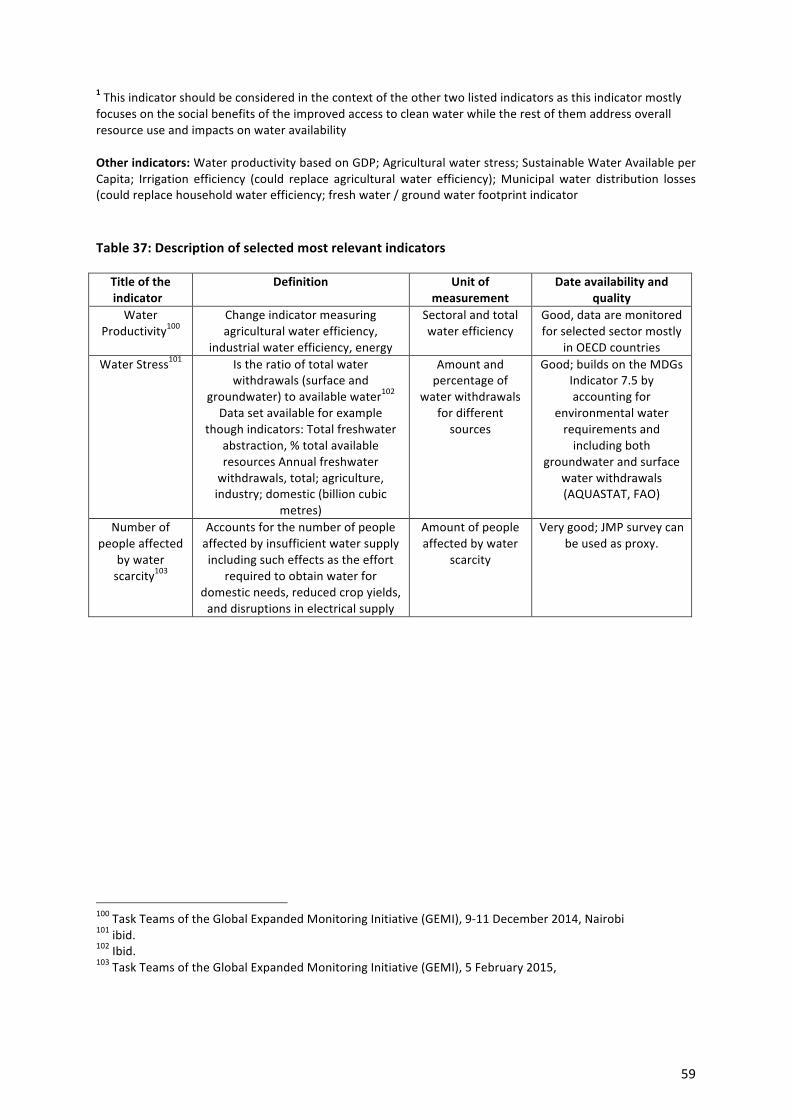
59
1 This indicator should be considered in the context of the other two listed indicators as this indicator mostly focuses on the social benefits of the improved access to clean water while the rest of them address overall resource use and impacts on water availability Other indicators: Water productivity based on GDP; Agricultural water stress; Sustainable Water Available per Capita; Irrigation efficiency (could replace agricultural water efficiency); Municipal water distribution losses (could replace household water efficiency; fresh water / ground water footprint indicator Table 37: Description of selected most relevant indicators
Title of the indicator
Definition Unit of measurement
Date availability and quality
Water Productivity100
Change indicator measuring agricultural water efficiency,
industrial water efficiency, energy
Sectoral and total water efficiency
Good, data are monitored for selected sector mostly
in OECD countries Water Stress101 Is the ratio of total water
withdrawals (surface and groundwater) to available water102 Data set available for example
though indicators: Total freshwater abstraction, % total available resources Annual freshwater withdrawals, total; agriculture, industry; domestic (billion cubic
metres)
Amount and percentage of
water withdrawals for different sources
Good; builds on the MDGs Indicator 7.5 by accounting for
environmental water requirements and including both
groundwater and surface water withdrawals (AQUASTAT, FAO)
Number of people affected
by water scarcity103
Accounts for the number of people affected by insufficient water supply including such effects as the effort
required to obtain water for domestic needs, reduced crop yields, and disruptions in electrical supply
Amount of people affected by water
scarcity
Very good; JMP survey can be used as proxy.
100 Task Teams of the Global Expanded Monitoring Initiative (GEMI), 9-‐11 December 2014, Nairobi 101 ibid. 102 Ibid. 103 Task Teams of the Global Expanded Monitoring Initiative (GEMI), 5 February 2015,
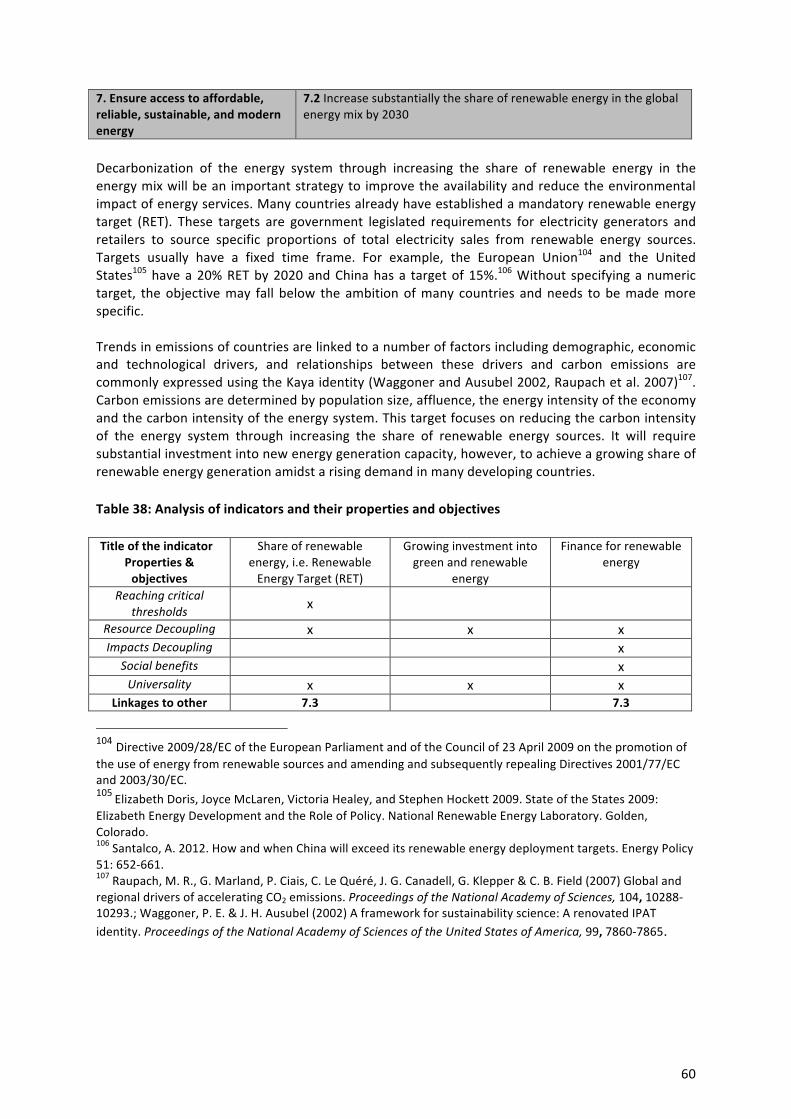
60
7. Ensure access to affordable, reliable, sustainable, and modern energy
7.2 Increase substantially the share of renewable energy in the global energy mix by 2030
Decarbonization of the energy system through increasing the share of renewable energy in the energy mix will be an important strategy to improve the availability and reduce the environmental impact of energy services. Many countries already have established a mandatory renewable energy target (RET). These targets are government legislated requirements for electricity generators and retailers to source specific proportions of total electricity sales from renewable energy sources. Targets usually have a fixed time frame. For example, the European Union104 and the United States105 have a 20% RET by 2020 and China has a target of 15%.106 Without specifying a numeric target, the objective may fall below the ambition of many countries and needs to be made more specific. Trends in emissions of countries are linked to a number of factors including demographic, economic and technological drivers, and relationships between these drivers and carbon emissions are commonly expressed using the Kaya identity (Waggoner and Ausubel 2002, Raupach et al. 2007)107. Carbon emissions are determined by population size, affluence, the energy intensity of the economy and the carbon intensity of the energy system. This target focuses on reducing the carbon intensity of the energy system through increasing the share of renewable energy sources. It will require substantial investment into new energy generation capacity, however, to achieve a growing share of renewable energy generation amidst a rising demand in many developing countries. Table 38: Analysis of indicators and their properties and objectives Title of the indicator
Properties & objectives
Share of renewable energy, i.e. Renewable Energy Target (RET)
Growing investment into green and renewable
energy
Finance for renewable energy
Reaching critical thresholds x
Resource Decoupling x x x Impacts Decoupling x
Social benefits x Universality x x x
Linkages to other 7.3 7.3
104 Directive 2009/28/EC of the European Parliament and of the Council of 23 April 2009 on the promotion of the use of energy from renewable sources and amending and subsequently repealing Directives 2001/77/EC and 2003/30/EC. 105 Elizabeth Doris, Joyce McLaren, Victoria Healey, and Stephen Hockett 2009. State of the States 2009: Elizabeth Energy Development and the Role of Policy. National Renewable Energy Laboratory. Golden, Colorado. 106 Santalco, A. 2012. How and when China will exceed its renewable energy deployment targets. Energy Policy 51: 652-‐661. 107 Raupach, M. R., G. Marland, P. Ciais, C. Le Quéré, J. G. Canadell, G. Klepper & C. B. Field (2007) Global and regional drivers of accelerating CO2 emissions. Proceedings of the National Academy of Sciences, 104, 10288-‐10293.; Waggoner, P. E. & J. H. Ausubel (2002) A framework for sustainability science: A renovated IPAT identity. Proceedings of the National Academy of Sciences of the United States of America, 99, 7860-‐7865.
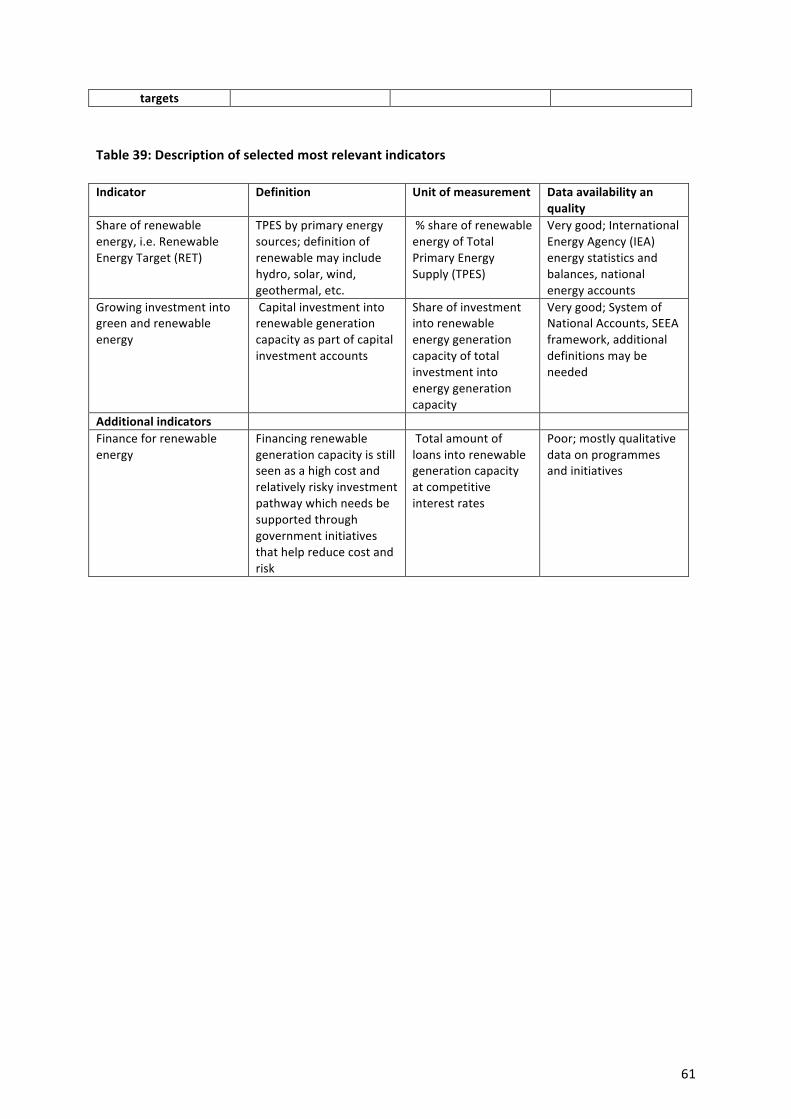
61
targets Table 39: Description of selected most relevant indicators Indicator Definition Unit of measurement Data availability an
quality Share of renewable energy, i.e. Renewable Energy Target (RET)
TPES by primary energy sources; definition of renewable may include hydro, solar, wind, geothermal, etc.
% share of renewable energy of Total Primary Energy Supply (TPES)
Very good; International Energy Agency (IEA) energy statistics and balances, national energy accounts
Growing investment into green and renewable energy
Capital investment into renewable generation capacity as part of capital investment accounts
Share of investment into renewable energy generation capacity of total investment into energy generation capacity
Very good; System of National Accounts, SEEA framework, additional definitions may be needed
Additional indicators Finance for renewable energy
Financing renewable generation capacity is still seen as a high cost and relatively risky investment pathway which needs be supported through government initiatives that help reduce cost and risk
Total amount of loans into renewable generation capacity at competitive interest rates
Poor; mostly qualitative data on programmes and initiatives
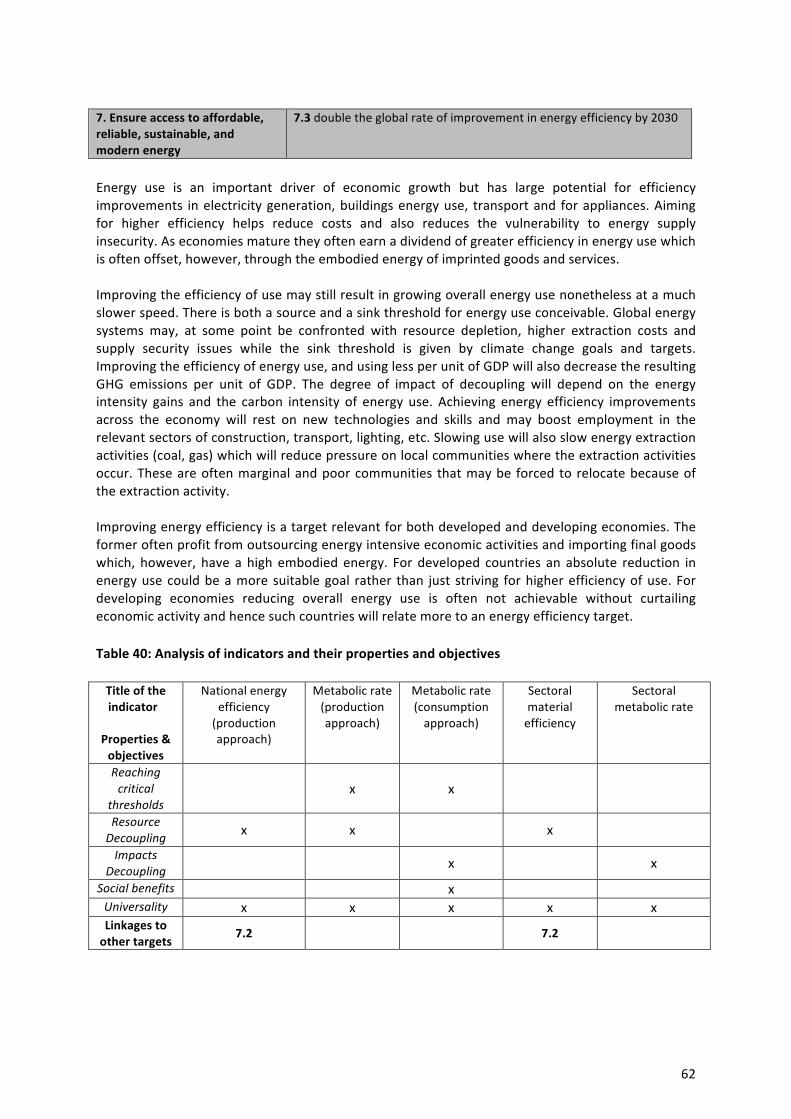
62
7. Ensure access to affordable, reliable, sustainable, and modern energy
7.3 double the global rate of improvement in energy efficiency by 2030
Energy use is an important driver of economic growth but has large potential for efficiency improvements in electricity generation, buildings energy use, transport and for appliances. Aiming for higher efficiency helps reduce costs and also reduces the vulnerability to energy supply insecurity. As economies mature they often earn a dividend of greater efficiency in energy use which is often offset, however, through the embodied energy of imprinted goods and services. Improving the efficiency of use may still result in growing overall energy use nonetheless at a much slower speed. There is both a source and a sink threshold for energy use conceivable. Global energy systems may, at some point be confronted with resource depletion, higher extraction costs and supply security issues while the sink threshold is given by climate change goals and targets. Improving the efficiency of energy use, and using less per unit of GDP will also decrease the resulting GHG emissions per unit of GDP. The degree of impact of decoupling will depend on the energy intensity gains and the carbon intensity of energy use. Achieving energy efficiency improvements across the economy will rest on new technologies and skills and may boost employment in the relevant sectors of construction, transport, lighting, etc. Slowing use will also slow energy extraction activities (coal, gas) which will reduce pressure on local communities where the extraction activities occur. These are often marginal and poor communities that may be forced to relocate because of the extraction activity. Improving energy efficiency is a target relevant for both developed and developing economies. The former often profit from outsourcing energy intensive economic activities and importing final goods which, however, have a high embodied energy. For developed countries an absolute reduction in energy use could be a more suitable goal rather than just striving for higher efficiency of use. For developing economies reducing overall energy use is often not achievable without curtailing economic activity and hence such countries will relate more to an energy efficiency target. Table 40: Analysis of indicators and their properties and objectives Title of the indicator
Properties & objectives
National energy efficiency (production approach)
Metabolic rate (production approach)
Metabolic rate (consumption approach)
Sectoral material efficiency
Sectoral metabolic rate
Reaching critical
thresholds x x
Resource Decoupling x x x
Impacts Decoupling x x
Social benefits x Universality x x x x x Linkages to other targets
7.2 7.2
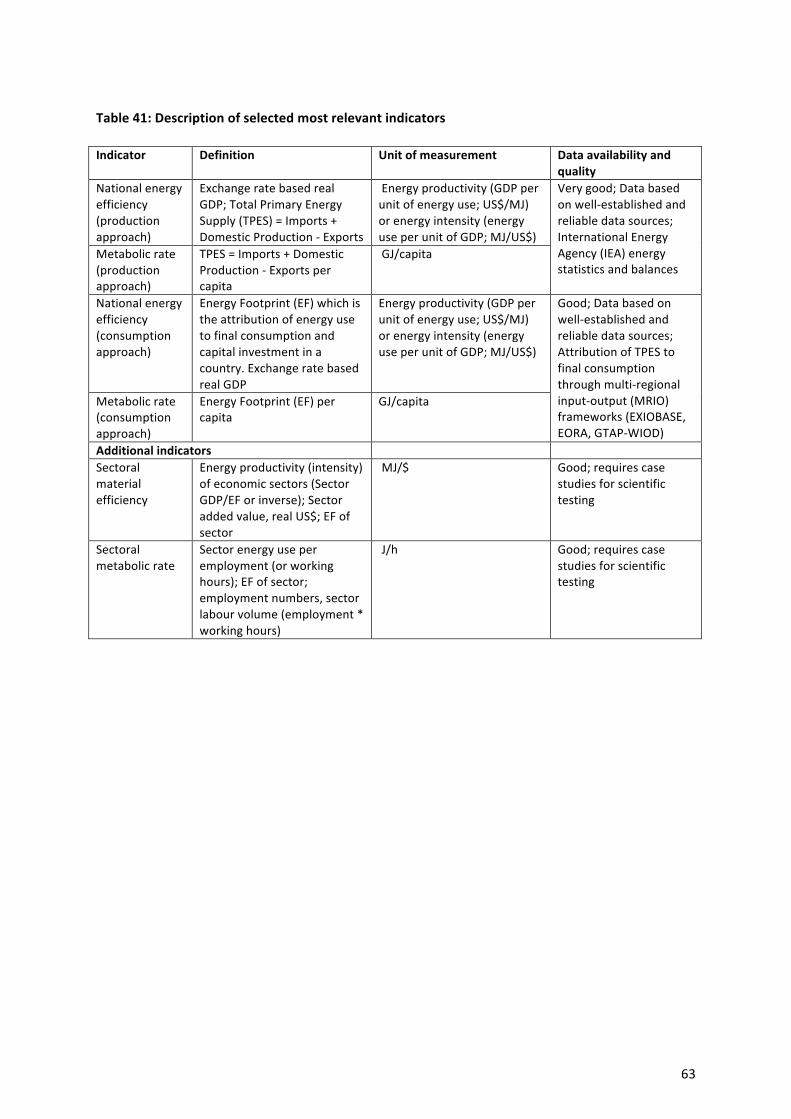
63
Table 41: Description of selected most relevant indicators Indicator Definition Unit of measurement Data availability and
quality National energy efficiency (production approach)
Exchange rate based real GDP; Total Primary Energy Supply (TPES) = Imports + Domestic Production -‐ Exports
Energy productivity (GDP per unit of energy use; US$/MJ) or energy intensity (energy use per unit of GDP; MJ/US$)
Very good; Data based on well-‐established and reliable data sources; International Energy Agency (IEA) energy statistics and balances
Metabolic rate (production approach)
TPES = Imports + Domestic Production -‐ Exports per capita
GJ/capita
National energy efficiency (consumption approach)
Energy Footprint (EF) which is the attribution of energy use to final consumption and capital investment in a country. Exchange rate based real GDP
Energy productivity (GDP per unit of energy use; US$/MJ) or energy intensity (energy use per unit of GDP; MJ/US$)
Good; Data based on well-‐established and reliable data sources; Attribution of TPES to final consumption through multi-‐regional input-‐output (MRIO) frameworks (EXIOBASE, EORA, GTAP-‐WIOD)
Metabolic rate (consumption approach)
Energy Footprint (EF) per capita
GJ/capita
Additional indicators Sectoral material efficiency
Energy productivity (intensity) of economic sectors (Sector GDP/EF or inverse); Sector added value, real US$; EF of sector
MJ/$ Good; requires case studies for scientific testing
Sectoral metabolic rate
Sector energy use per employment (or working hours); EF of sector; employment numbers, sector labour volume (employment * working hours)
J/h Good; requires case studies for scientific testing
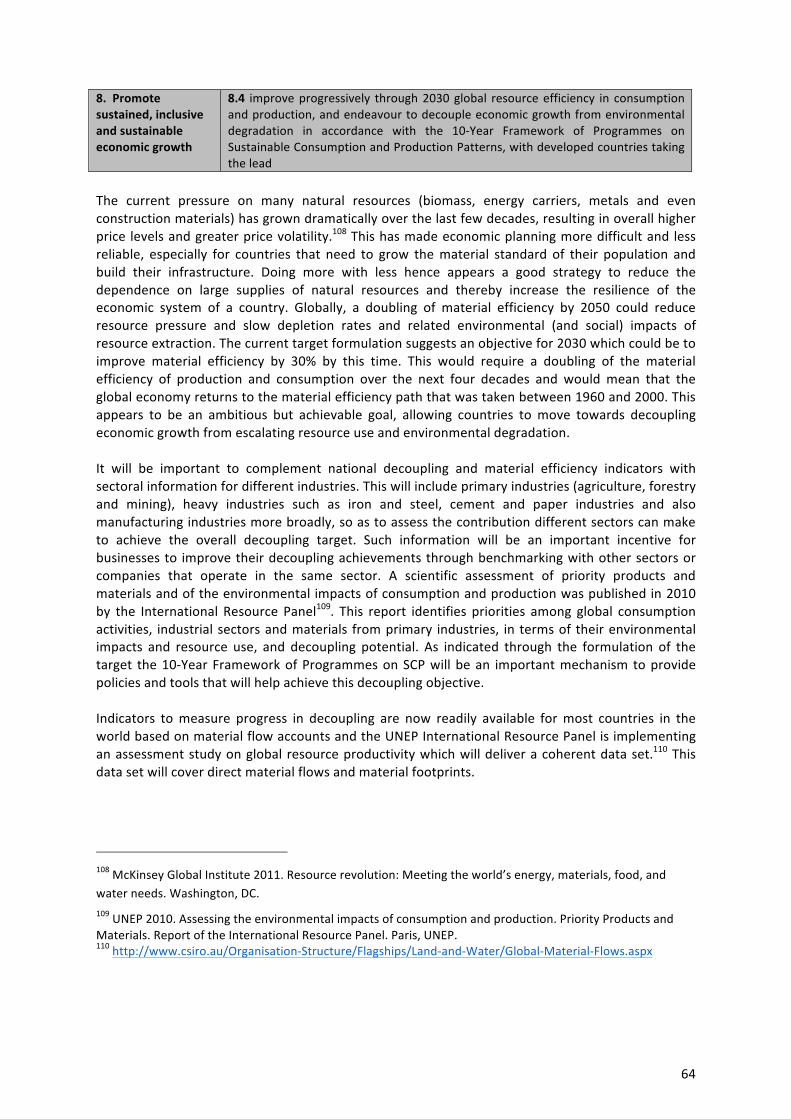
64
8. Promote sustained, inclusive and sustainable economic growth
8.4 improve progressively through 2030 global resource efficiency in consumption and production, and endeavour to decouple economic growth from environmental degradation in accordance with the 10-‐Year Framework of Programmes on Sustainable Consumption and Production Patterns, with developed countries taking the lead
The current pressure on many natural resources (biomass, energy carriers, metals and even construction materials) has grown dramatically over the last few decades, resulting in overall higher price levels and greater price volatility.108 This has made economic planning more difficult and less reliable, especially for countries that need to grow the material standard of their population and build their infrastructure. Doing more with less hence appears a good strategy to reduce the dependence on large supplies of natural resources and thereby increase the resilience of the economic system of a country. Globally, a doubling of material efficiency by 2050 could reduce resource pressure and slow depletion rates and related environmental (and social) impacts of resource extraction. The current target formulation suggests an objective for 2030 which could be to improve material efficiency by 30% by this time. This would require a doubling of the material efficiency of production and consumption over the next four decades and would mean that the global economy returns to the material efficiency path that was taken between 1960 and 2000. This appears to be an ambitious but achievable goal, allowing countries to move towards decoupling economic growth from escalating resource use and environmental degradation. It will be important to complement national decoupling and material efficiency indicators with sectoral information for different industries. This will include primary industries (agriculture, forestry and mining), heavy industries such as iron and steel, cement and paper industries and also manufacturing industries more broadly, so as to assess the contribution different sectors can make to achieve the overall decoupling target. Such information will be an important incentive for businesses to improve their decoupling achievements through benchmarking with other sectors or companies that operate in the same sector. A scientific assessment of priority products and materials and of the environmental impacts of consumption and production was published in 2010 by the International Resource Panel109. This report identifies priorities among global consumption activities, industrial sectors and materials from primary industries, in terms of their environmental impacts and resource use, and decoupling potential. As indicated through the formulation of the target the 10-‐Year Framework of Programmes on SCP will be an important mechanism to provide policies and tools that will help achieve this decoupling objective. Indicators to measure progress in decoupling are now readily available for most countries in the world based on material flow accounts and the UNEP International Resource Panel is implementing an assessment study on global resource productivity which will deliver a coherent data set.110 This data set will cover direct material flows and material footprints.
108 McKinsey Global Institute 2011. Resource revolution: Meeting the world’s energy, materials, food, and water needs. Washington, DC. 109 UNEP 2010. Assessing the environmental impacts of consumption and production. Priority Products and Materials. Report of the International Resource Panel. Paris, UNEP. 110 http://www.csiro.au/Organisation-‐Structure/Flagships/Land-‐and-‐Water/Global-‐Material-‐Flows.aspx
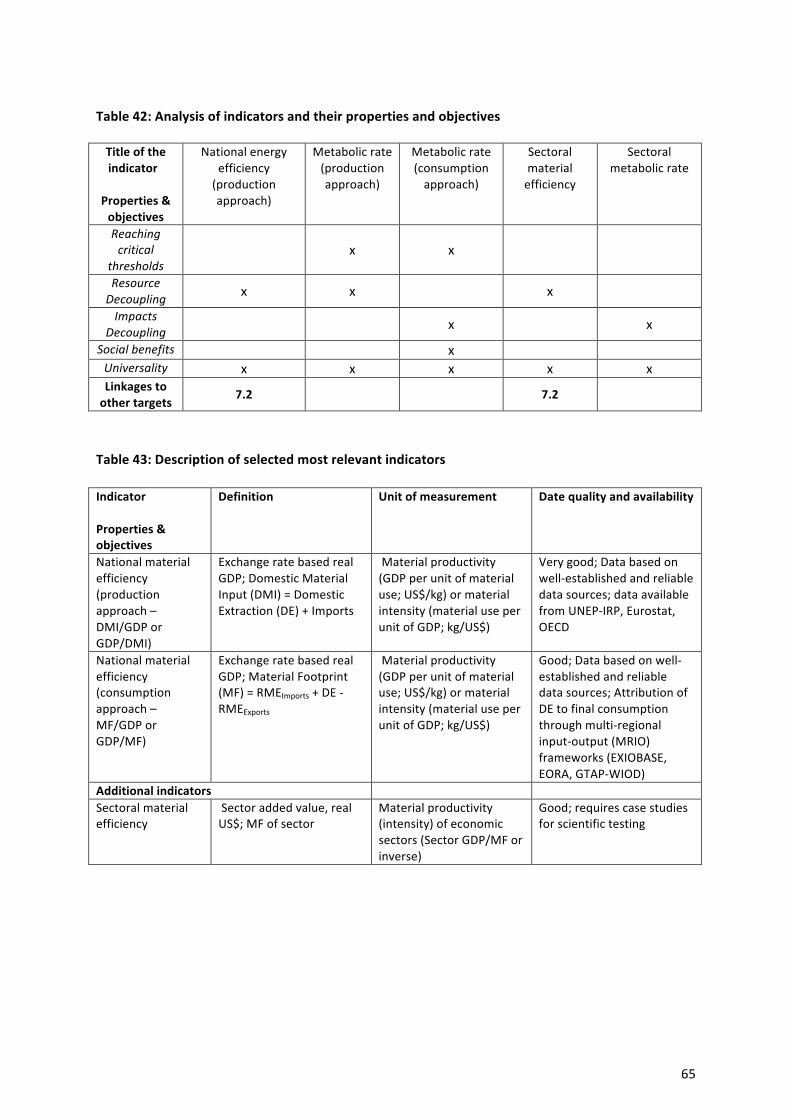
65
Table 42: Analysis of indicators and their properties and objectives Title of the indicator
Properties & objectives
National energy efficiency (production approach)
Metabolic rate (production approach)
Metabolic rate (consumption approach)
Sectoral material efficiency
Sectoral metabolic rate
Reaching critical
thresholds x x
Resource Decoupling x x x
Impacts Decoupling x x
Social benefits x Universality x x x x x Linkages to other targets
7.2 7.2
Table 43: Description of selected most relevant indicators Indicator Properties & objectives
Definition Unit of measurement Date quality and availability
National material efficiency (production approach – DMI/GDP or GDP/DMI)
Exchange rate based real GDP; Domestic Material Input (DMI) = Domestic Extraction (DE) + Imports
Material productivity (GDP per unit of material use; US$/kg) or material intensity (material use per unit of GDP; kg/US$)
Very good; Data based on well-‐established and reliable data sources; data available from UNEP-‐IRP, Eurostat, OECD
National material efficiency (consumption approach – MF/GDP or GDP/MF)
Exchange rate based real GDP; Material Footprint (MF) = RMEImports + DE -‐ RMEExports
Material productivity (GDP per unit of material use; US$/kg) or material intensity (material use per unit of GDP; kg/US$)
Good; Data based on well-‐established and reliable data sources; Attribution of DE to final consumption through multi-‐regional input-‐output (MRIO) frameworks (EXIOBASE, EORA, GTAP-‐WIOD)
Additional indicators Sectoral material efficiency
Sector added value, real US$; MF of sector
Material productivity (intensity) of economic sectors (Sector GDP/MF or inverse)
Good; requires case studies for scientific testing
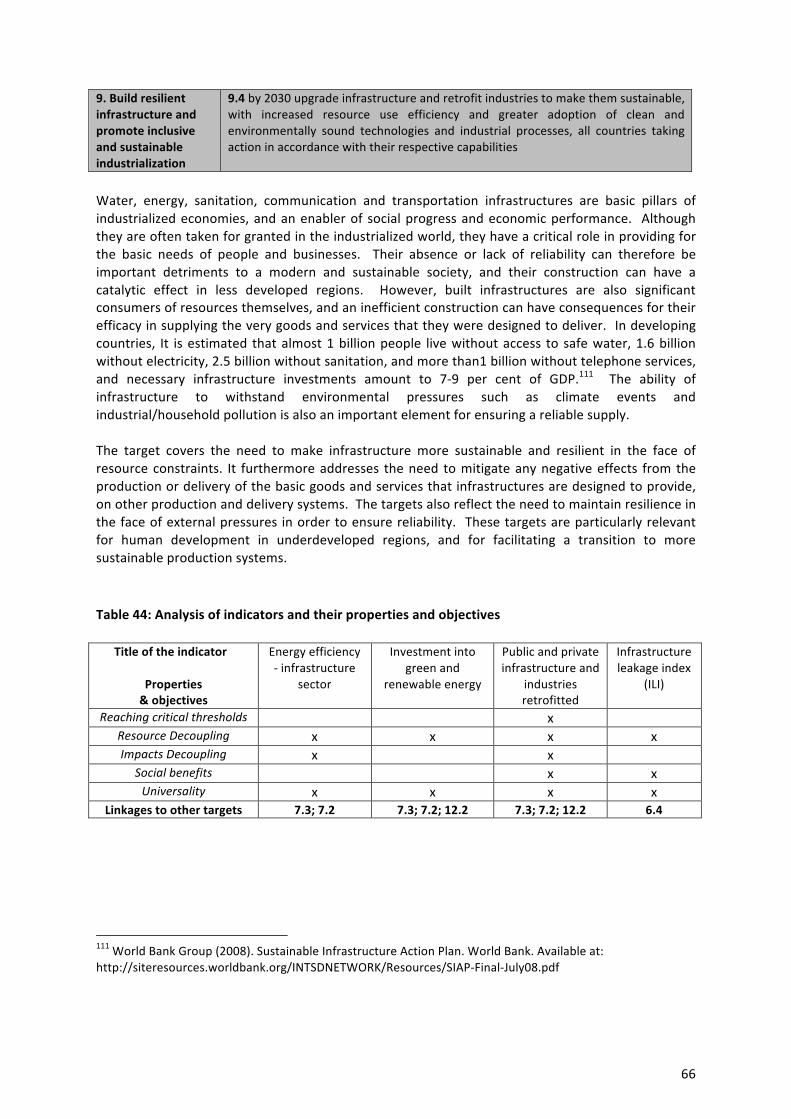
66
9. Build resilient infrastructure and promote inclusive and sustainable industrialization
9.4 by 2030 upgrade infrastructure and retrofit industries to make them sustainable, with increased resource use efficiency and greater adoption of clean and environmentally sound technologies and industrial processes, all countries taking action in accordance with their respective capabilities
Water, energy, sanitation, communication and transportation infrastructures are basic pillars of industrialized economies, and an enabler of social progress and economic performance. Although they are often taken for granted in the industrialized world, they have a critical role in providing for the basic needs of people and businesses. Their absence or lack of reliability can therefore be important detriments to a modern and sustainable society, and their construction can have a catalytic effect in less developed regions. However, built infrastructures are also significant consumers of resources themselves, and an inefficient construction can have consequences for their efficacy in supplying the very goods and services that they were designed to deliver. In developing countries, It is estimated that almost 1 billion people live without access to safe water, 1.6 billion without electricity, 2.5 billion without sanitation, and more than1 billion without telephone services, and necessary infrastructure investments amount to 7-‐9 per cent of GDP.111 The ability of infrastructure to withstand environmental pressures such as climate events and industrial/household pollution is also an important element for ensuring a reliable supply. The target covers the need to make infrastructure more sustainable and resilient in the face of resource constraints. It furthermore addresses the need to mitigate any negative effects from the production or delivery of the basic goods and services that infrastructures are designed to provide, on other production and delivery systems. The targets also reflect the need to maintain resilience in the face of external pressures in order to ensure reliability. These targets are particularly relevant for human development in underdeveloped regions, and for facilitating a transition to more sustainable production systems. Table 44: Analysis of indicators and their properties and objectives
Title of the indicator
Properties & objectives
Energy efficiency -‐ infrastructure
sector
Investment into green and
renewable energy
Public and private infrastructure and
industries retrofitted
Infrastructure leakage index
(ILI)
Reaching critical thresholds x Resource Decoupling x x x x Impacts Decoupling x x
Social benefits x x Universality x x x x
Linkages to other targets 7.3; 7.2 7.3; 7.2; 12.2 7.3; 7.2; 12.2 6.4
111 World Bank Group (2008). Sustainable Infrastructure Action Plan. World Bank. Available at: http://siteresources.worldbank.org/INTSDNETWORK/Resources/SIAP-‐Final-‐July08.pdf

67
Table 45: Description of selected most relevant indicators
Title of the indicator
Definition Unit of measurement
Date quality
Energy efficiency -‐ infrastructure sector
Energy efficiency in specific sectors that are being retrofitted
Rate per type of infrastructure
Poor; national monitoring data available only
Investment in green and renewable energy
Share of investment into renewable energy generation capacity of total investment into energy generation capacity
Capital investment into renewable generation capacity as part of capital investment accounts
Very good; System of National Accounts, SEEA framework, additional definitions may be needed
Public and private infrastructure and
industries retrofitted
Types of and no. of Public and private infrastructure and industries retrofitted to make them sustainable
Types and no. of infrastructure
Poor; national monitoring data available only , unknown for information on sustainability
Infrastructure leakage index (ILI)
The ratio between current annual real losses of water and the unavoidable annual real losses of water.
% of water volume
Good; many of the big cities compile this information, but there is no central database

68
11. Make cities and human settlements inclusive and sustainable
11.b By 2020, increase by [x] per cent the number of cities and human settlements adopting and implementing integrated policies and plans towards inclusion, resource efficiency, mitigation and adaptation to climate change, resilience to disasters, develop and implement, in line with the forthcoming Hyogo Framework, holistic disaster risk management at all levels
Cities are expected to absorb between 2 and 3 billion additional people by the year 2050. Whether they manage to do so sustainably depends heavily on whether they harness the efficiency advantages of agglomeration. Planning and management for inclusive and sustainable urbanization supports compact, connected, integrated and overall resource efficient cities. Appropriate human settlement planning and management will therefore be a transformative factor for the life of more than 50% of the global human population, already living in cities, a percentage expected to rise to 67 per cent by 2050, as well as those who may be affected by land-‐use change associated with urbanization.112 The target covers institutional actions on adoption of actual strategies to advance sustainable development and resilience at the city-‐level. It emphasizes the importance of integrated planning that overcomes sectoral silos, taking an integrated approach to address current and future challenges including growing population, resource demand and climate change. Table 46: Analysis of indicators and their properties and objectives Title of the indicator
Properties & objectives
People affected and economic losses from
disasters by climatic events
National legislation mandating cities and other human
settlements to adopt integrated development strategies1
Number of cities with long term integrated development plans1
Reaching critical
thresholds x x
x
Resource Decoupling x x
Impacts Decoupling x x x
Social benefits Universality x x x Linkages to other targets
1.5; 11.2; 11.5; 11.6; 13.1 11.1; 11.3 x
1 By ‘integrated’ we mean that aspects relevant for SCP are covered such as recourse efficiency, impacts decoupling including air quality, pollution reduction and waste generation, recycling and re-‐use, considering several aspects, such as transport, housing and others.
112 UN-‐HABITAT (United Nations Human Settlements Programme). 2012. Sustainable housing for sustainable cities: a policy framework for developing countries. Nairobi.
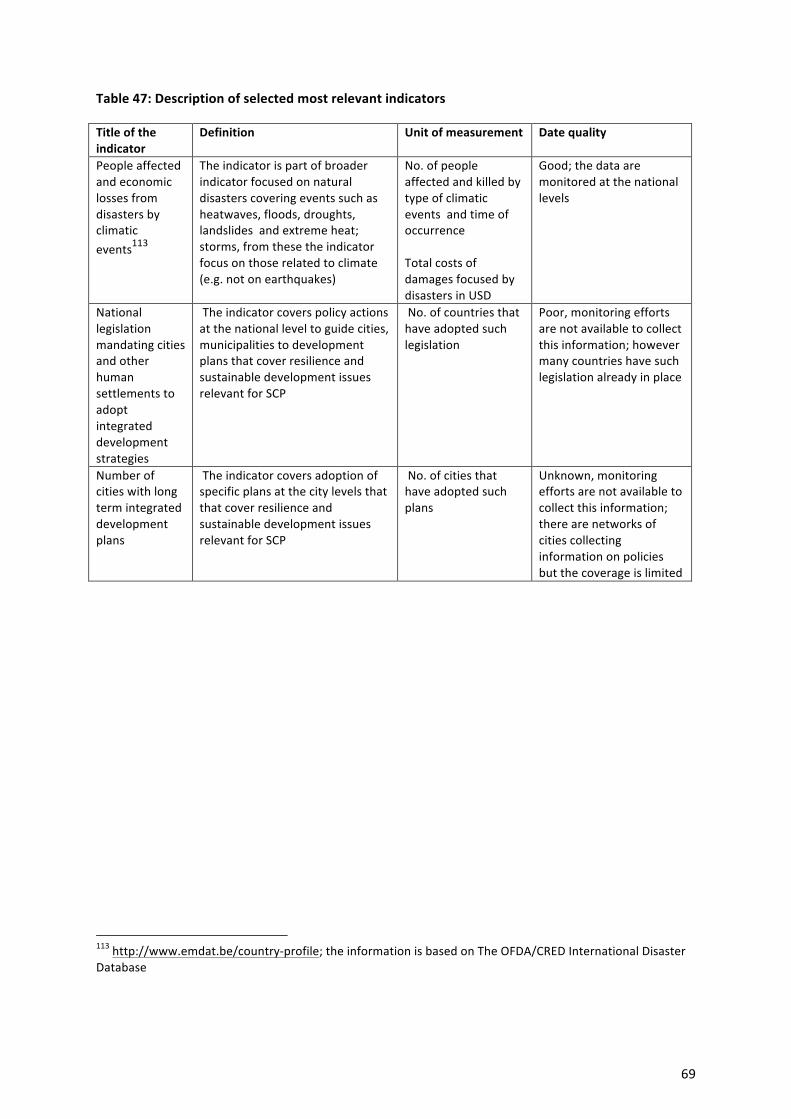
69
Table 47: Description of selected most relevant indicators Title of the indicator
Definition Unit of measurement Date quality
People affected and economic losses from disasters by climatic events113
The indicator is part of broader indicator focused on natural disasters covering events such as heatwaves, floods, droughts, landslides and extreme heat; storms, from these the indicator focus on those related to climate (e.g. not on earthquakes)
No. of people affected and killed by type of climatic events and time of occurrence Total costs of damages focused by disasters in USD
Good; the data are monitored at the national levels
National legislation mandating cities and other human settlements to adopt integrated development strategies
The indicator covers policy actions at the national level to guide cities, municipalities to development plans that cover resilience and sustainable development issues relevant for SCP
No. of countries that have adopted such legislation
Poor, monitoring efforts are not available to collect this information; however many countries have such legislation already in place
Number of cities with long term integrated development plans
The indicator covers adoption of specific plans at the city levels that that cover resilience and sustainable development issues relevant for SCP
No. of cities that have adopted such plans
Unknown, monitoring efforts are not available to collect this information; there are networks of cities collecting information on policies but the coverage is limited
113 http://www.emdat.be/country-‐profile; the information is based on The OFDA/CRED International Disaster Database
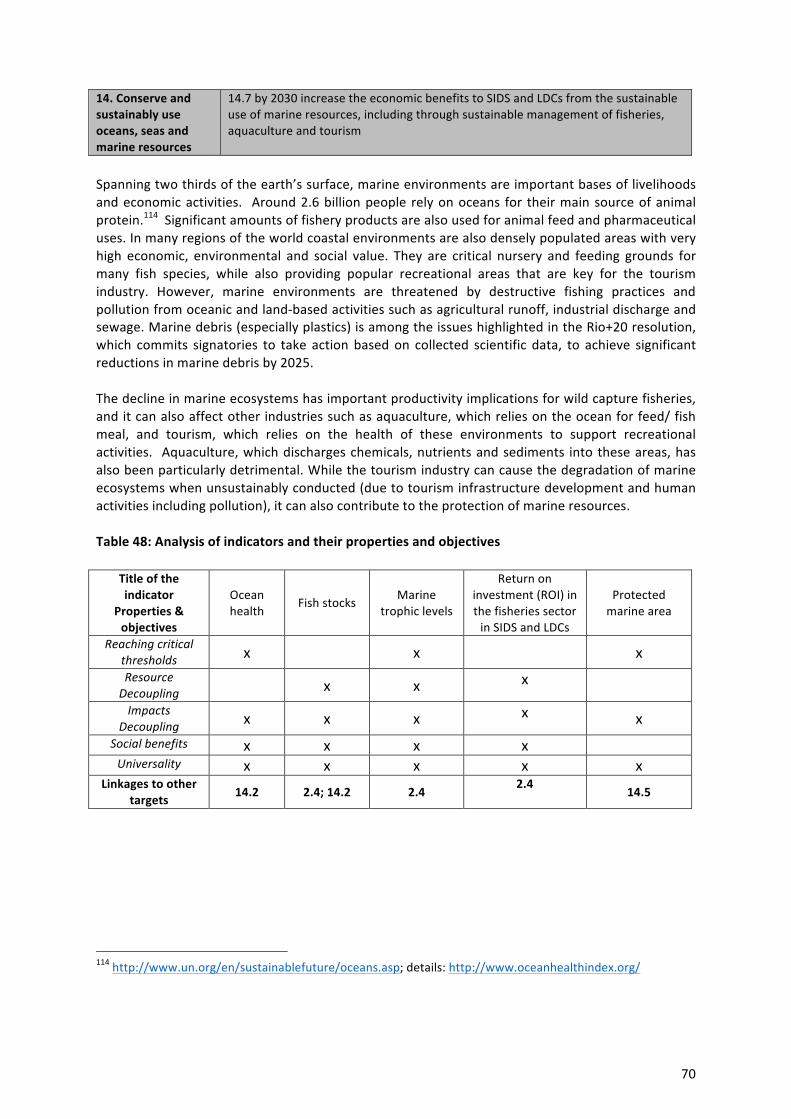
70
14. Conserve and sustainably use oceans, seas and marine resources
14.7 by 2030 increase the economic benefits to SIDS and LDCs from the sustainable use of marine resources, including through sustainable management of fisheries, aquaculture and tourism
Spanning two thirds of the earth’s surface, marine environments are important bases of livelihoods and economic activities. Around 2.6 billion people rely on oceans for their main source of animal protein.114 Significant amounts of fishery products are also used for animal feed and pharmaceutical uses. In many regions of the world coastal environments are also densely populated areas with very high economic, environmental and social value. They are critical nursery and feeding grounds for many fish species, while also providing popular recreational areas that are key for the tourism industry. However, marine environments are threatened by destructive fishing practices and pollution from oceanic and land-‐based activities such as agricultural runoff, industrial discharge and sewage. Marine debris (especially plastics) is among the issues highlighted in the Rio+20 resolution, which commits signatories to take action based on collected scientific data, to achieve significant reductions in marine debris by 2025. The decline in marine ecosystems has important productivity implications for wild capture fisheries, and it can also affect other industries such as aquaculture, which relies on the ocean for feed/ fish meal, and tourism, which relies on the health of these environments to support recreational activities. Aquaculture, which discharges chemicals, nutrients and sediments into these areas, has also been particularly detrimental. While the tourism industry can cause the degradation of marine ecosystems when unsustainably conducted (due to tourism infrastructure development and human activities including pollution), it can also contribute to the protection of marine resources. Table 48: Analysis of indicators and their properties and objectives
Title of the indicator
Properties & objectives
Ocean health
Fish stocks Marine trophic levels
Return on investment (ROI) in the fisheries sector in SIDS and LDCs
Protected marine area
Reaching critical thresholds x x x Resource Decoupling x x x Impacts
Decoupling x x x x x Social benefits x x x x Universality x x x x x
Linkages to other targets 14.2 2.4; 14.2 2.4
2.4 14.5
114 http://www.un.org/en/sustainablefuture/oceans.asp; details: http://www.oceanhealthindex.org/
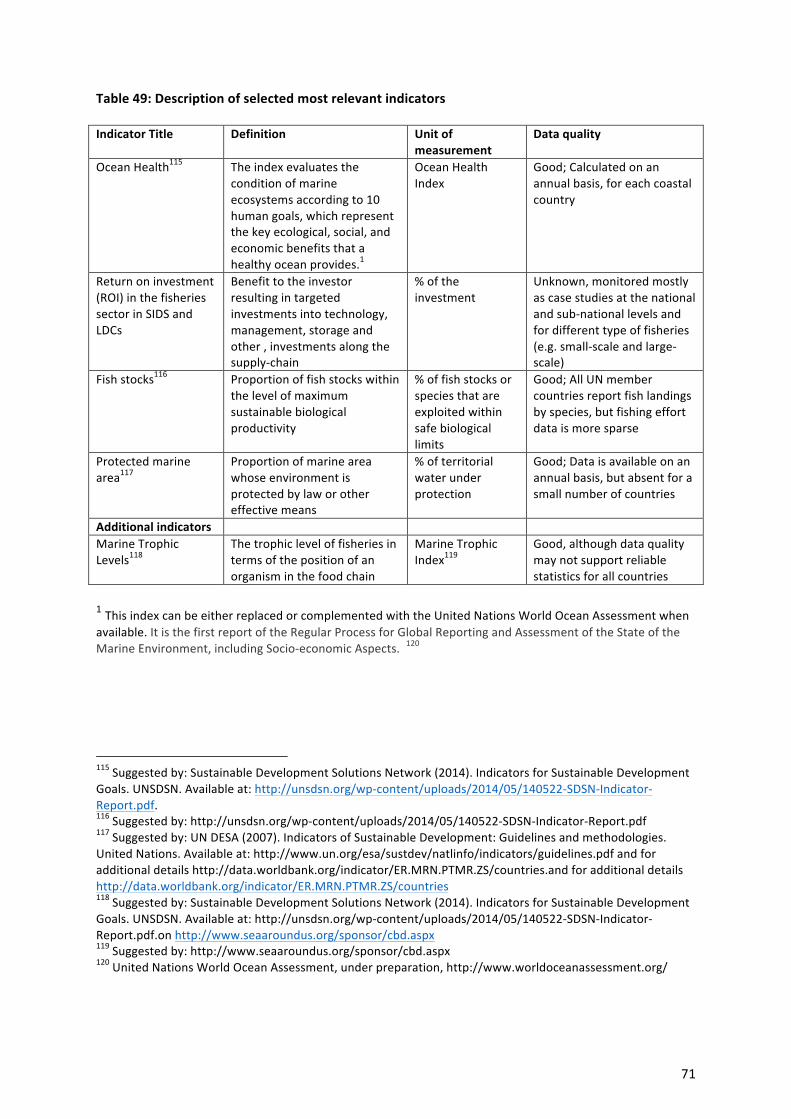
71
Table 49: Description of selected most relevant indicators Indicator Title Definition Unit of
measurement Data quality
Ocean Health115 The index evaluates the condition of marine ecosystems according to 10 human goals, which represent the key ecological, social, and economic benefits that a healthy ocean provides.1
Ocean Health Index
Good; Calculated on an annual basis, for each coastal country
Return on investment (ROI) in the fisheries sector in SIDS and LDCs
Benefit to the investor resulting in targeted investments into technology, management, storage and other , investments along the supply-‐chain
% of the investment
Unknown, monitored mostly as case studies at the national and sub-‐national levels and for different type of fisheries (e.g. small-‐scale and large-‐scale)
Fish stocks116 Proportion of fish stocks within the level of maximum sustainable biological productivity
% of fish stocks or species that are exploited within safe biological limits
Good; All UN member countries report fish landings by species, but fishing effort data is more sparse
Protected marine area117
Proportion of marine area whose environment is protected by law or other effective means
% of territorial water under protection
Good; Data is available on an annual basis, but absent for a small number of countries
Additional indicators Marine Trophic Levels118
The trophic level of fisheries in terms of the position of an organism in the food chain
Marine Trophic Index119
Good, although data quality may not support reliable statistics for all countries
1 This index can be either replaced or complemented with the United Nations World Ocean Assessment when available. It is the first report of the Regular Process for Global Reporting and Assessment of the State of the Marine Environment, including Socio-‐economic Aspects. 120
115 Suggested by: Sustainable Development Solutions Network (2014). Indicators for Sustainable Development Goals. UNSDSN. Available at: http://unsdsn.org/wp-‐content/uploads/2014/05/140522-‐SDSN-‐Indicator-‐Report.pdf. 116 Suggested by: http://unsdsn.org/wp-‐content/uploads/2014/05/140522-‐SDSN-‐Indicator-‐Report.pdf 117 Suggested by: UN DESA (2007). Indicators of Sustainable Development: Guidelines and methodologies. United Nations. Available at: http://www.un.org/esa/sustdev/natlinfo/indicators/guidelines.pdf and for additional details http://data.worldbank.org/indicator/ER.MRN.PTMR.ZS/countries.and for additional details http://data.worldbank.org/indicator/ER.MRN.PTMR.ZS/countries 118 Suggested by: Sustainable Development Solutions Network (2014). Indicators for Sustainable Development Goals. UNSDSN. Available at: http://unsdsn.org/wp-‐content/uploads/2014/05/140522-‐SDSN-‐Indicator-‐Report.pdf.on http://www.seaaroundus.org/sponsor/cbd.aspx 119 Suggested by: http://www.seaaroundus.org/sponsor/cbd.aspx 120 United Nations World Ocean Assessment, under preparation, http://www.worldoceanassessment.org/
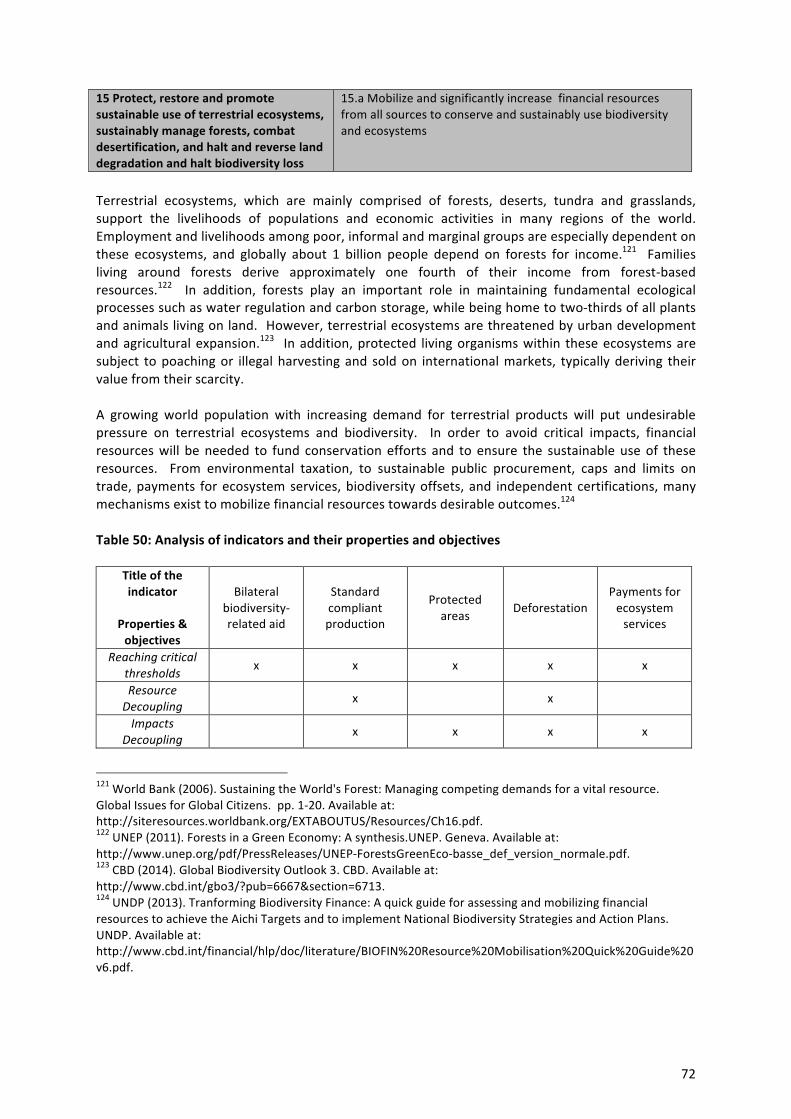
72
15 Protect, restore and promote sustainable use of terrestrial ecosystems, sustainably manage forests, combat desertification, and halt and reverse land degradation and halt biodiversity loss
15.a Mobilize and significantly increase financial resources from all sources to conserve and sustainably use biodiversity and ecosystems
Terrestrial ecosystems, which are mainly comprised of forests, deserts, tundra and grasslands, support the livelihoods of populations and economic activities in many regions of the world. Employment and livelihoods among poor, informal and marginal groups are especially dependent on these ecosystems, and globally about 1 billion people depend on forests for income.121 Families living around forests derive approximately one fourth of their income from forest-‐based resources.122 In addition, forests play an important role in maintaining fundamental ecological processes such as water regulation and carbon storage, while being home to two-‐thirds of all plants and animals living on land. However, terrestrial ecosystems are threatened by urban development and agricultural expansion.123 In addition, protected living organisms within these ecosystems are subject to poaching or illegal harvesting and sold on international markets, typically deriving their value from their scarcity. A growing world population with increasing demand for terrestrial products will put undesirable pressure on terrestrial ecosystems and biodiversity. In order to avoid critical impacts, financial resources will be needed to fund conservation efforts and to ensure the sustainable use of these resources. From environmental taxation, to sustainable public procurement, caps and limits on trade, payments for ecosystem services, biodiversity offsets, and independent certifications, many mechanisms exist to mobilize financial resources towards desirable outcomes.124 Table 50: Analysis of indicators and their properties and objectives
Title of the indicator
Properties & objectives
Bilateral biodiversity-‐related aid
Standard compliant production
Protected areas Deforestation
Payments for ecosystem services
Reaching critical thresholds x x x x x
Resource Decoupling
x x
Impacts Decoupling
x x x x
121 World Bank (2006). Sustaining the World's Forest: Managing competing demands for a vital resource. Global Issues for Global Citizens. pp. 1-‐20. Available at: http://siteresources.worldbank.org/EXTABOUTUS/Resources/Ch16.pdf. 122 UNEP (2011). Forests in a Green Economy: A synthesis.UNEP. Geneva. Available at: http://www.unep.org/pdf/PressReleases/UNEP-‐ForestsGreenEco-‐basse_def_version_normale.pdf. 123 CBD (2014). Global Biodiversity Outlook 3. CBD. Available at: http://www.cbd.int/gbo3/?pub=6667§ion=6713. 124 UNDP (2013). Tranforming Biodiversity Finance: A quick guide for assessing and mobilizing financial resources to achieve the Aichi Targets and to implement National Biodiversity Strategies and Action Plans. UNDP. Available at: http://www.cbd.int/financial/hlp/doc/literature/BIOFIN%20Resource%20Mobilisation%20Quick%20Guide%20v6.pdf.
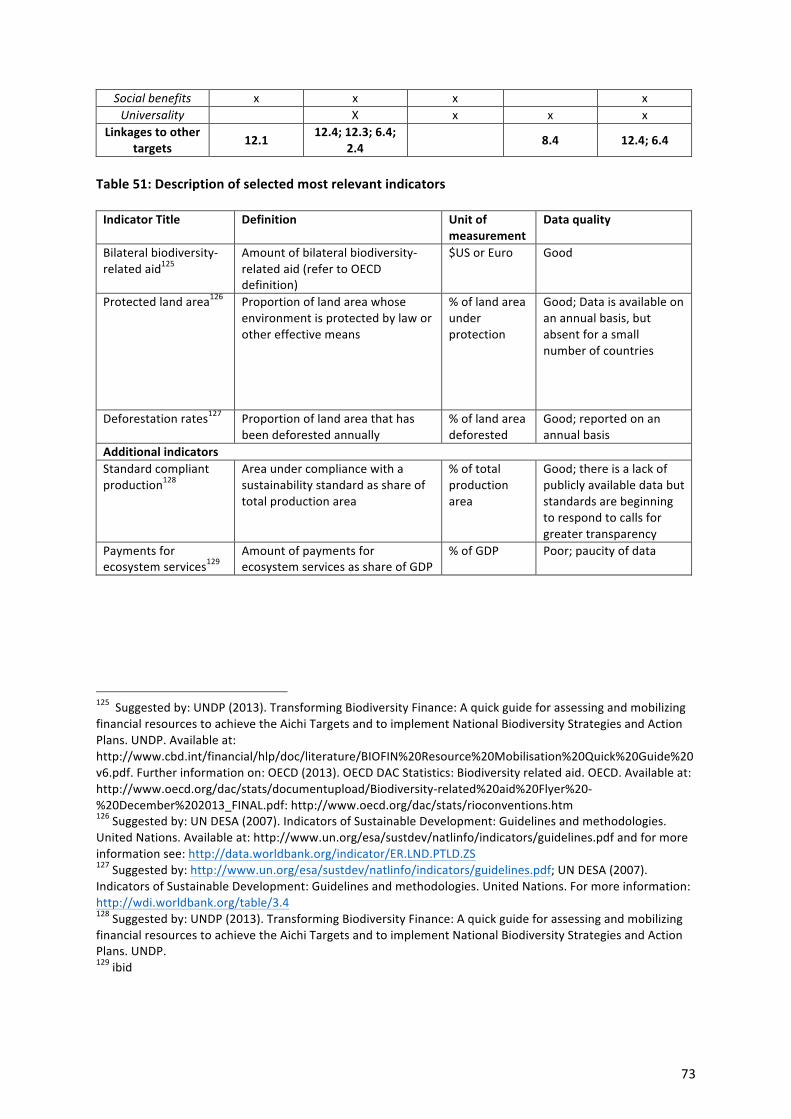
73
Social benefits x x x x Universality X x x x
Linkages to other targets 12.1
12.4; 12.3; 6.4; 2.4 8.4 12.4; 6.4
Table 51: Description of selected most relevant indicators Indicator Title Definition Unit of
measurement Data quality
Bilateral biodiversity-‐related aid125
Amount of bilateral biodiversity-‐related aid (refer to OECD definition)
$US or Euro Good
Protected land area126 Proportion of land area whose environment is protected by law or other effective means
% of land area under protection
Good; Data is available on an annual basis, but absent for a small number of countries
Deforestation rates127
Proportion of land area that has been deforested annually
% of land area deforested
Good; reported on an annual basis
Additional indicators Standard compliant production128
Area under compliance with a sustainability standard as share of total production area
% of total production area
Good; there is a lack of publicly available data but standards are beginning to respond to calls for greater transparency
Payments for ecosystem services129
Amount of payments for ecosystem services as share of GDP
% of GDP Poor; paucity of data
125 Suggested by: UNDP (2013). Transforming Biodiversity Finance: A quick guide for assessing and mobilizing financial resources to achieve the Aichi Targets and to implement National Biodiversity Strategies and Action Plans. UNDP. Available at: http://www.cbd.int/financial/hlp/doc/literature/BIOFIN%20Resource%20Mobilisation%20Quick%20Guide%20v6.pdf. Further information on: OECD (2013). OECD DAC Statistics: Biodiversity related aid. OECD. Available at: http://www.oecd.org/dac/stats/documentupload/Biodiversity-‐related%20aid%20Flyer%20-‐%20December%202013_FINAL.pdf: http://www.oecd.org/dac/stats/rioconventions.htm 126 Suggested by: UN DESA (2007). Indicators of Sustainable Development: Guidelines and methodologies. United Nations. Available at: http://www.un.org/esa/sustdev/natlinfo/indicators/guidelines.pdf and for more information see: http://data.worldbank.org/indicator/ER.LND.PTLD.ZS 127 Suggested by: http://www.un.org/esa/sustdev/natlinfo/indicators/guidelines.pdf; UN DESA (2007). Indicators of Sustainable Development: Guidelines and methodologies. United Nations. For more information: http://wdi.worldbank.org/table/3.4 128 Suggested by: UNDP (2013). Transforming Biodiversity Finance: A quick guide for assessing and mobilizing financial resources to achieve the Aichi Targets and to implement National Biodiversity Strategies and Action Plans. UNDP. 129 ibid
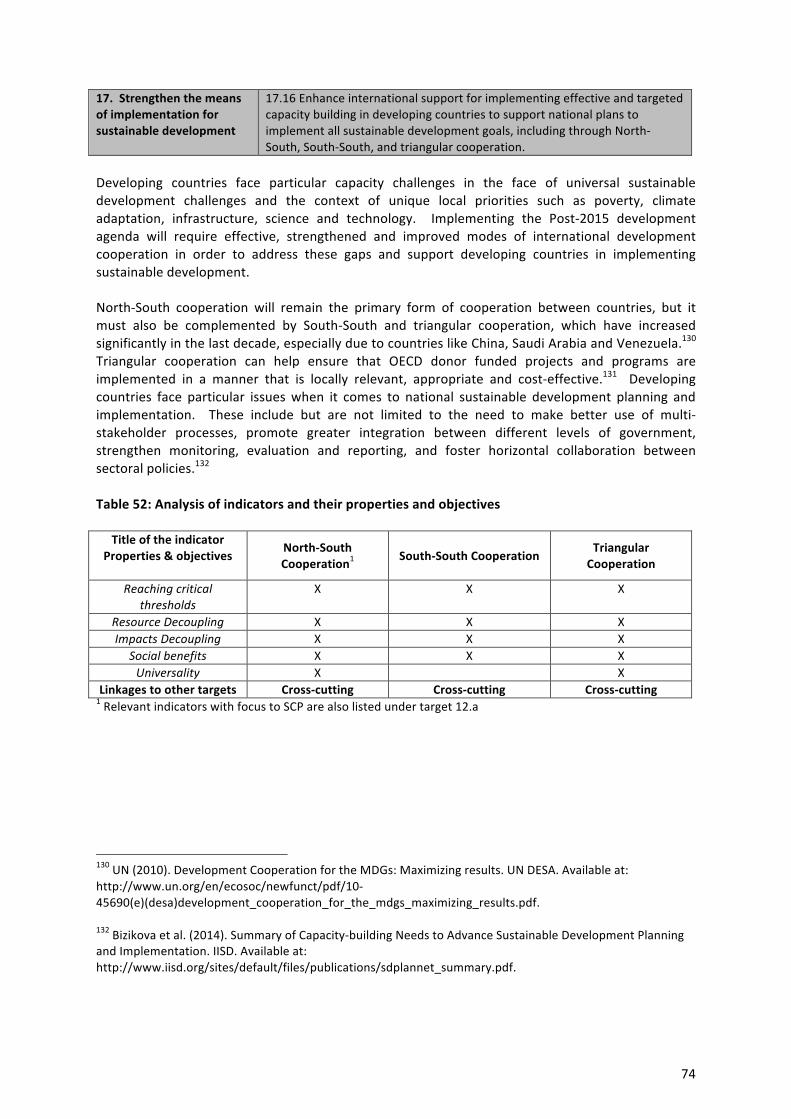
74
17. Strengthen the means of implementation for sustainable development
17.16 Enhance international support for implementing effective and targeted capacity building in developing countries to support national plans to implement all sustainable development goals, including through North-‐South, South-‐South, and triangular cooperation.
Developing countries face particular capacity challenges in the face of universal sustainable development challenges and the context of unique local priorities such as poverty, climate adaptation, infrastructure, science and technology. Implementing the Post-‐2015 development agenda will require effective, strengthened and improved modes of international development cooperation in order to address these gaps and support developing countries in implementing sustainable development. North-‐South cooperation will remain the primary form of cooperation between countries, but it must also be complemented by South-‐South and triangular cooperation, which have increased significantly in the last decade, especially due to countries like China, Saudi Arabia and Venezuela.130 Triangular cooperation can help ensure that OECD donor funded projects and programs are implemented in a manner that is locally relevant, appropriate and cost-‐effective.131 Developing countries face particular issues when it comes to national sustainable development planning and implementation. These include but are not limited to the need to make better use of multi-‐stakeholder processes, promote greater integration between different levels of government, strengthen monitoring, evaluation and reporting, and foster horizontal collaboration between sectoral policies.132 Table 52: Analysis of indicators and their properties and objectives
Title of the indicator Properties & objectives
North-‐South Cooperation1 South-‐South Cooperation
Triangular Cooperation
Reaching critical thresholds
X X X
Resource Decoupling X X X Impacts Decoupling X X X
Social benefits X X X Universality X X
Linkages to other targets Cross-‐cutting Cross-‐cutting Cross-‐cutting 1 Relevant indicators with focus to SCP are also listed under target 12.a
130 UN (2010). Development Cooperation for the MDGs: Maximizing results. UN DESA. Available at: http://www.un.org/en/ecosoc/newfunct/pdf/10-‐45690(e)(desa)development_cooperation_for_the_mdgs_maximizing_results.pdf. 132 Bizikova et al. (2014). Summary of Capacity-‐building Needs to Advance Sustainable Development Planning and Implementation. IISD. Available at: http://www.iisd.org/sites/default/files/publications/sdplannet_summary.pdf.
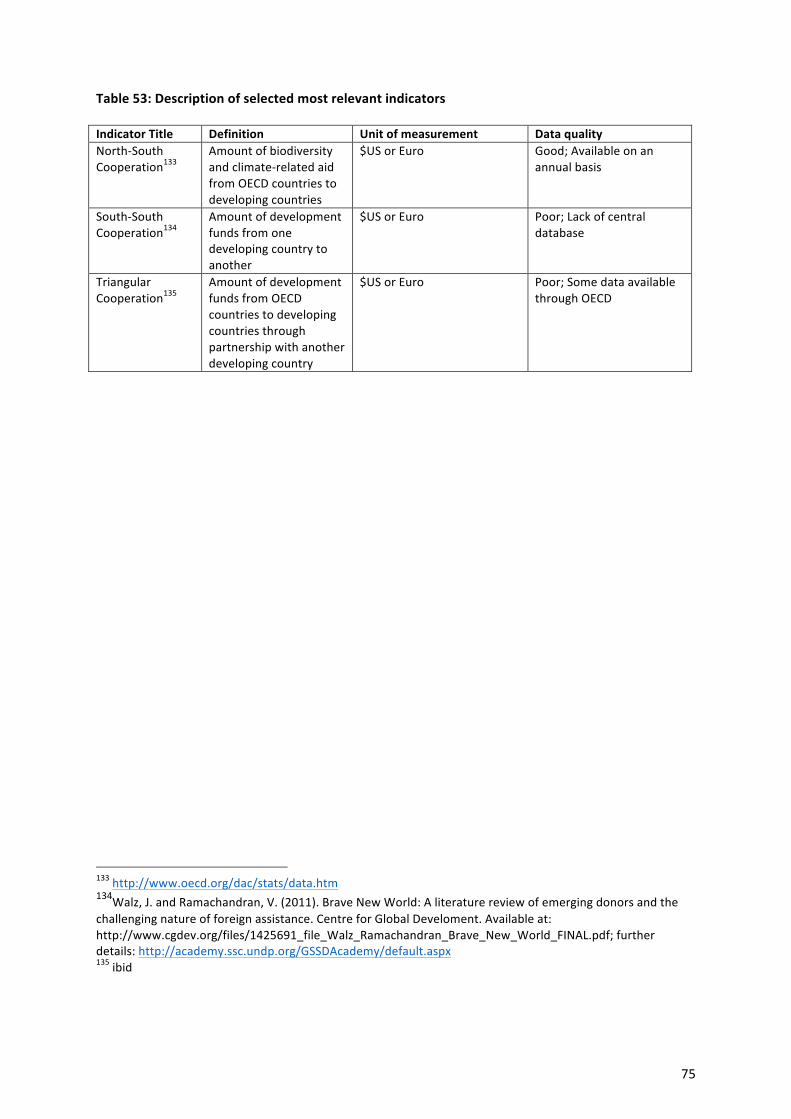
75
Table 53: Description of selected most relevant indicators Indicator Title Definition Unit of measurement Data quality North-‐South Cooperation133
Amount of biodiversity and climate-‐related aid from OECD countries to developing countries
$US or Euro Good; Available on an annual basis
South-‐South Cooperation134
Amount of development funds from one developing country to another
$US or Euro Poor; Lack of central database
Triangular Cooperation135
Amount of development funds from OECD countries to developing countries through partnership with another developing country
$US or Euro Poor; Some data available through OECD
133 http://www.oecd.org/dac/stats/data.htm 134Walz, J. and Ramachandran, V. (2011). Brave New World: A literature review of emerging donors and the challenging nature of foreign assistance. Centre for Global Develoment. Available at: http://www.cgdev.org/files/1425691_file_Walz_Ramachandran_Brave_New_World_FINAL.pdf; further details: http://academy.ssc.undp.org/GSSDAcademy/default.aspx 135 ibid
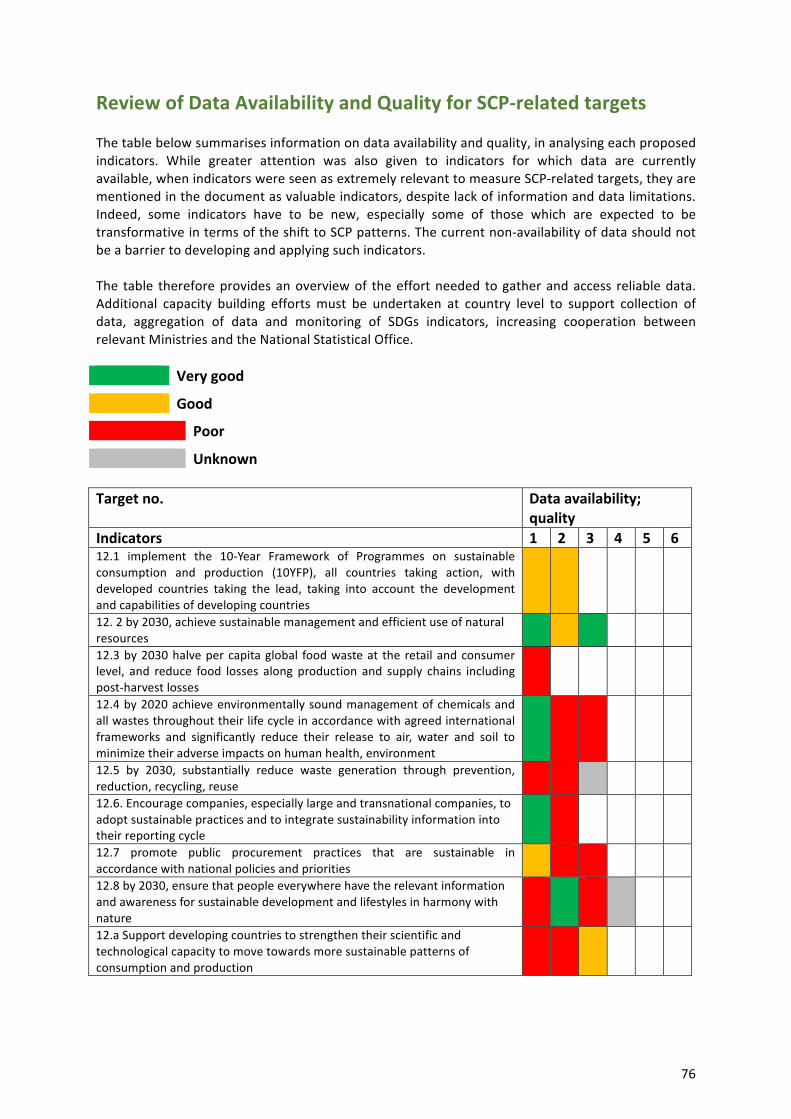
76
Review of Data Availability and Quality for SCP-‐related targets The table below summarises information on data availability and quality, in analysing each proposed indicators. While greater attention was also given to indicators for which data are currently available, when indicators were seen as extremely relevant to measure SCP-‐related targets, they are mentioned in the document as valuable indicators, despite lack of information and data limitations. Indeed, some indicators have to be new, especially some of those which are expected to be transformative in terms of the shift to SCP patterns. The current non-‐availability of data should not be a barrier to developing and applying such indicators. The table therefore provides an overview of the effort needed to gather and access reliable data. Additional capacity building efforts must be undertaken at country level to support collection of data, aggregation of data and monitoring of SDGs indicators, increasing cooperation between relevant Ministries and the National Statistical Office. Very good
Good
Poor
Unknown Target no. Data availability;
quality Indicators 1 2 3 4 5 6 12.1 implement the 10-‐Year Framework of Programmes on sustainable consumption and production (10YFP), all countries taking action, with developed countries taking the lead, taking into account the development and capabilities of developing countries
12. 2 by 2030, achieve sustainable management and efficient use of natural resources
12.3 by 2030 halve per capita global food waste at the retail and consumer level, and reduce food losses along production and supply chains including post-‐harvest losses
12.4 by 2020 achieve environmentally sound management of chemicals and all wastes throughout their life cycle in accordance with agreed international frameworks and significantly reduce their release to air, water and soil to minimize their adverse impacts on human health, environment
12.5 by 2030, substantially reduce waste generation through prevention, reduction, recycling, reuse
12.6. Encourage companies, especially large and transnational companies, to adopt sustainable practices and to integrate sustainability information into their reporting cycle
12.7 promote public procurement practices that are sustainable in accordance with national policies and priorities
12.8 by 2030, ensure that people everywhere have the relevant information and awareness for sustainable development and lifestyles in harmony with nature
12.a Support developing countries to strengthen their scientific and technological capacity to move towards more sustainable patterns of consumption and production
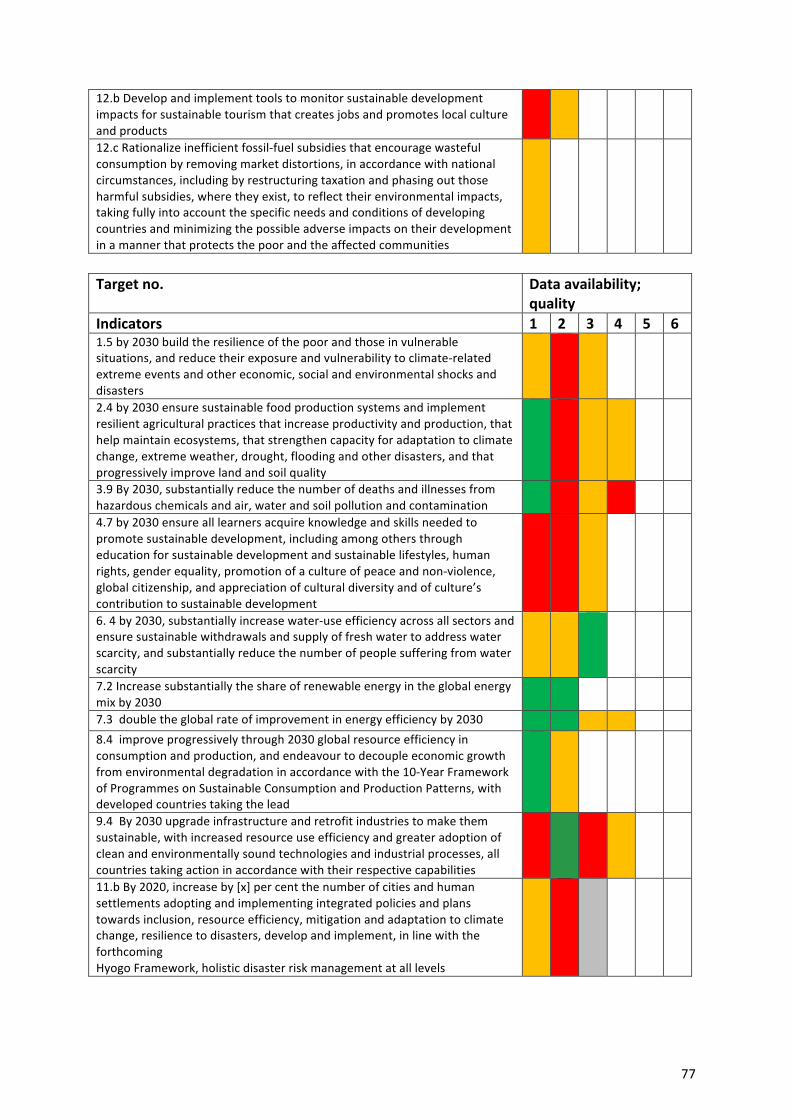
77
12.b Develop and implement tools to monitor sustainable development impacts for sustainable tourism that creates jobs and promotes local culture and products
12.c Rationalize inefficient fossil-‐fuel subsidies that encourage wasteful consumption by removing market distortions, in accordance with national circumstances, including by restructuring taxation and phasing out those harmful subsidies, where they exist, to reflect their environmental impacts, taking fully into account the specific needs and conditions of developing countries and minimizing the possible adverse impacts on their development in a manner that protects the poor and the affected communities
Target no. Data availability;
quality Indicators 1 2 3 4 5 6 1.5 by 2030 build the resilience of the poor and those in vulnerable situations, and reduce their exposure and vulnerability to climate-‐related extreme events and other economic, social and environmental shocks and disasters
2.4 by 2030 ensure sustainable food production systems and implement resilient agricultural practices that increase productivity and production, that help maintain ecosystems, that strengthen capacity for adaptation to climate change, extreme weather, drought, flooding and other disasters, and that progressively improve land and soil quality
3.9 By 2030, substantially reduce the number of deaths and illnesses from hazardous chemicals and air, water and soil pollution and contamination
4.7 by 2030 ensure all learners acquire knowledge and skills needed to promote sustainable development, including among others through education for sustainable development and sustainable lifestyles, human rights, gender equality, promotion of a culture of peace and non-‐violence, global citizenship, and appreciation of cultural diversity and of culture’s contribution to sustainable development
6. 4 by 2030, substantially increase water-‐use efficiency across all sectors and ensure sustainable withdrawals and supply of fresh water to address water scarcity, and substantially reduce the number of people suffering from water scarcity
7.2 Increase substantially the share of renewable energy in the global energy mix by 2030
7.3 double the global rate of improvement in energy efficiency by 2030 8.4 improve progressively through 2030 global resource efficiency in consumption and production, and endeavour to decouple economic growth from environmental degradation in accordance with the 10-‐Year Framework of Programmes on Sustainable Consumption and Production Patterns, with developed countries taking the lead
9.4 By 2030 upgrade infrastructure and retrofit industries to make them sustainable, with increased resource use efficiency and greater adoption of clean and environmentally sound technologies and industrial processes, all countries taking action in accordance with their respective capabilities
11.b By 2020, increase by [x] per cent the number of cities and human settlements adopting and implementing integrated policies and plans towards inclusion, resource efficiency, mitigation and adaptation to climate change, resilience to disasters, develop and implement, in line with the forthcoming Hyogo Framework, holistic disaster risk management at all levels
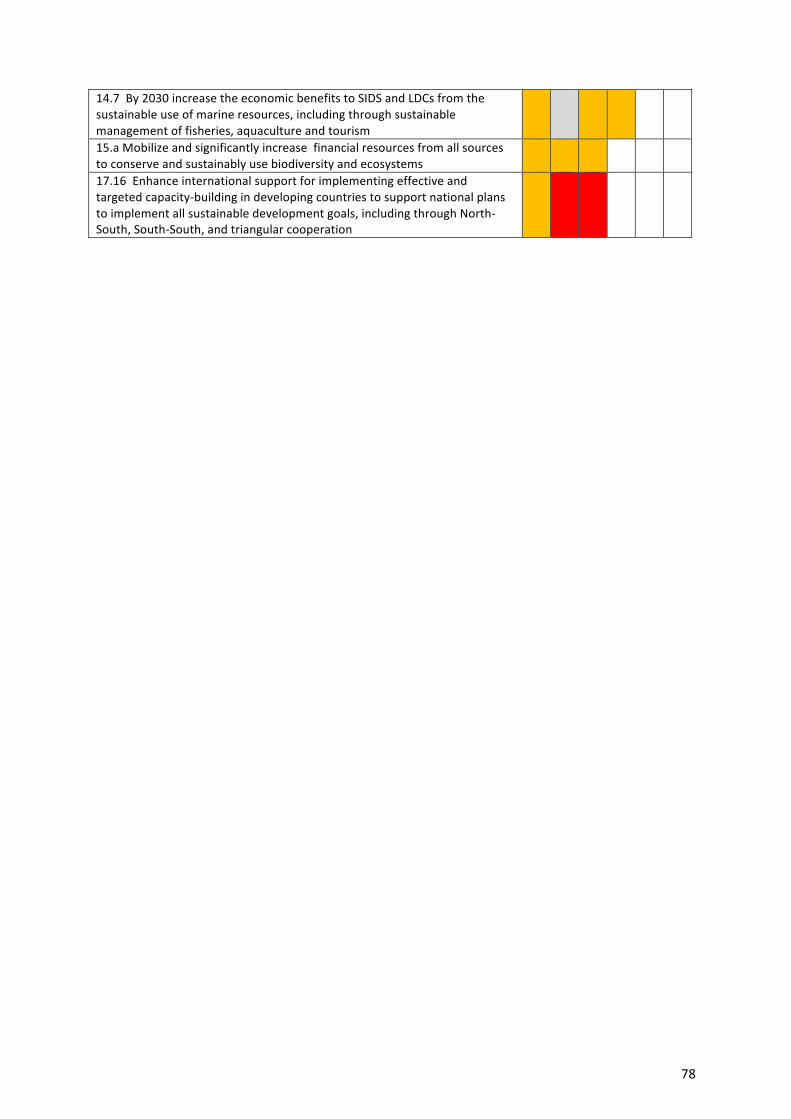
78
14.7 By 2030 increase the economic benefits to SIDS and LDCs from the sustainable use of marine resources, including through sustainable management of fisheries, aquaculture and tourism
15.a Mobilize and significantly increase financial resources from all sources to conserve and sustainably use biodiversity and ecosystems
17.16 Enhance international support for implementing effective and targeted capacity-‐building in developing countries to support national plans to implement all sustainable development goals, including through North-‐South, South-‐South, and triangular cooperation
79
Conclusions Achieving progress in the new sustainable development goals (SDGs) is fundamentally linked to the ways in which the global economy and society function. The Rio+20 outcome documents note that any achievement in human development will depend on the availability of natural resources and the capacity of ecosystems to absorb waste and emissions, and provide essential supporting and regulating services. It will also depend on the availability of infrastructure to extract, supply and distribute the goods and services derived from those resources in a timely and affordable manner, and the capacity of public social institutions and markets to ensure the equitable distribution of economic and social benefits flowing from natural resource use. Economic, social and distributional outcomes of human development can be measured using an array of socioeconomic indicators that are available at global, regional, national and sub-‐national scale for most countries in the world. These readily available data sets and indicators reported by national statistical offices and international organizations will inform many of the SDG targets that address socioeconomic development outcomes. A set of indicators is needed to monitor the interface between economy and the environment, and the resource and waste flows that result from economic activity. These indicators must also monitor how the organization of the economy and society can contribute to achieving sustainable development, with a particular focus on attaining sustainable consumption and production (SCP) patterns. Indicators proposed in this discussion paper can be organized into six domains to provide a comprehensive indicator set that can support a shift to SCP patterns. These domains are (1) scale of resource use, (2) decoupling, (3) environmental impact, (4) technology and lifestyles, (5) financing and investing for SCP, and (6) policy support for SCP. 1 Scale of resource use The notion of scale, put forward by the World Bank economist Herman Daly, refers to the total amount of natural resource use, waste and emissions mobilized in the economic process. Scale indicators report the total volume of natural resource flows, i.e. the matter-‐energy throughput taken from the environment as low-‐entropy resources and returned to the environment as high-‐entropy waste and emissions. Scale is relative to environmental carrying capacity, the natural resource base (source function) and the absorptive capacity of ecosystems (sink function). Data and indicators that monitor the scale of the economy are closely linked to economic activities and are often reported as satellite accounts to the system of national accounts following the conceptual logic of the SEEA. Methodological guidelines and data sets are now readily available for most resource categories and for emissions for most countries in the world. Hence, indicators that measure the scale of resource use are readily available for use in analysing data from the past four decades. 2 Decoupling economic activity from resource use and environmental impact The notion of decoupling focuses on the opportunities that exist to achieve more with less, making use of the efficiency potential that exists in many areas of provision such as food and agriculture, mobility and transport, and housing and construction. The UNEP International Resource Panel (UNEP 2011) refers to two aspects of decoupling, resource and impact decoupling, both of which are very relevant for achieving the desired SDG outcomes through SCP. Decoupling is measured as resource productivity, i.e. the amount of economic output (GDP) that is achieved with a certain level of resource use (e.g. energy use or material use) or the economic output for a certain level of emissions. Ideally, decoupling could also be assessed by replacing GDP with an indicator for human-‐wellbeing (UNEP 2011) -‐ however there is no obvious candidate indicator at this point. Indicators for
80
decoupling combine standard economic indicators with indicators for the physical scale of the economy and/or environmental impact to present a compound measure. Achieving decoupling and greater resource efficiency is a necessary (but not sufficient) condition for sustainable development. Perturbations of critical Earth System processes must also be kept below thresholds beyond which these processes may be dangerously or irreversibly disrupted. 3 Impacts Environmental impacts, such as changes in climate, or in water, soil and air quality are caused by the way the economic process is organized, the technologies that are applied, and the mitigating strategies taken by society. Reducing environmental impact through decoupling is another very important strategy to achieve greater human well-‐being at lower environmental cost. The flagship report of the United Nations Environment Programme, the Global Environmental Outlook136, is a rich source of data and indicators for monitoring environmental impact caused by economic activity. Similar reporting exists for other environmental impacts on which indicators for SDG targets may rely. 4 Technology and lifestyles Technology and lifestyles are the two main mediating factors in consumption and production systems. Producers may decide between alternative technologies which can be analysed in terms of their need for fuels, structural materials and biomass and the way in which they are transformed into useful products and services and waste and emissions. The development of new technologies that advance SCP will depend on human capital, the knowledge base and ingenuity of business leaders and workers alike. Advances likewise will depend on the education and training systems that help establish and maintain a good knowledge base across society as a whole. Households make choices among alternative lifestyles which will lead to different environmental and social outcomes and create different demands on the economy and production system. Hence the importance of participatory sustainability policies and incentives targeted to consumers. 5 Financing and investing to transform the economy to SCP Facilitating a process by which economies may transition to more sustainable patterns of consumption and production will depend on the ways in which societies and economies invest in future infrastructure and productive capital. There needs to be a shift in investment to new systems of production, provision and consumption that support an equitable and environmentally sound human development path for all. This implies a shift away from those types of investment that counter efforts to enhance equity and increase resource efficiency and environmental sustainability. For example, major investments will be needed to establish the renewable energy generation capacity that will support our economies in the decades to come. At the same time, subsidies for energy use that counteract energy efficiency measures and generate pollution need to be eliminated or re-‐directed to avoid those negative effects. Equally large amounts of investment will be needed to establish energy-‐efficient buildings, public transport systems, and water and sewerage supplies in fast growing cities in the developing world. This investment is also needed to refurbish established cities to the new efficiency standards required to reduce overall resource use and combat rising carbon emissions. Indicators are required to monitor availability of and access to finances and the share of investment that contributes to the shift to SCP patterns. These same indicators must also identify and measure those investments which counteract this shift.
136 http://www.unep.org/geo/

81
6 Policy support for SCP Policy decisions that favour SCP and strengthening the implementation capacity for such policies will be other important factors in the shift to SCP. Ultimately, support for the achievement of the SDGs may require, in addition to policies, others tools and instruments, capacity strengthening, regional collaboration, and monitoring and evaluation mechanisms. Achieving a shift to SCP will depend on reform or adjustment of many current economic policies and practices, which create incentives for high resource use and environmental impact. Scaling up and replicating SCP best practices around the world will need specific attention from policy-‐makers, to correct market failures and establish nationally appropriate enabling policy frameworks and strengthened and capacitated institutions. One important element of policy support is the level of coordination achieved by government agencies jointly responsible for promoting the shift to SCP patterns. Of equal importance are the the level of ownership of sectoral ministries of this objective and the level of participation of actors from outside the policy community. The notion of governance encompasses the fact that a shift towards SCP will need broad involvement of actors form outside government including businesses and civil society, and well-‐designed policies that guide and incentivize such involvement137. Ultimately, achieving the shift to SCP patterns and attaining the SDG’s that rely upon sustainable resource management will depend on the capacity of the policy community and society at large to understand the issues, to design and implement solutions in a collaborative manner, and to evaluate implementation outcomes. The following table summarises the six SCP domains outlined above, linking them through SCP-‐related indicators (second column) to a number of the currently proposed targets in the SDGs (third column). Every domain can be represented by a limited set of headline indicators which can be used as proxies for monitoring progress in the relevant domain. For instance, material use could be used as a headline indicator which also includes important aspects of energy use and of waste flows. Carbon emissions could be used as another headline indicator covering some aspects of energy use as well. Such an approach would help to keep the overall number of indicators to a manageable amount by addressing a larger number of targets with a smaller number of headline indicators. These headline indicators are a selection from the indicators identified in this SCP indicators paper. They represent a starting point to develop a comprehensive set of headline indicators to monitor and support the shift to SCP patterns, in the context of the SDGs. This list of indicators also demonstrates that the targets formulated by the OWG cover all main aspects of SCP.
137 Hajer, M. et al (2015). Beyond Cockpit-‐ism: Four Insights to Enhance the Transformative Potential of the Sustainable Development Goals
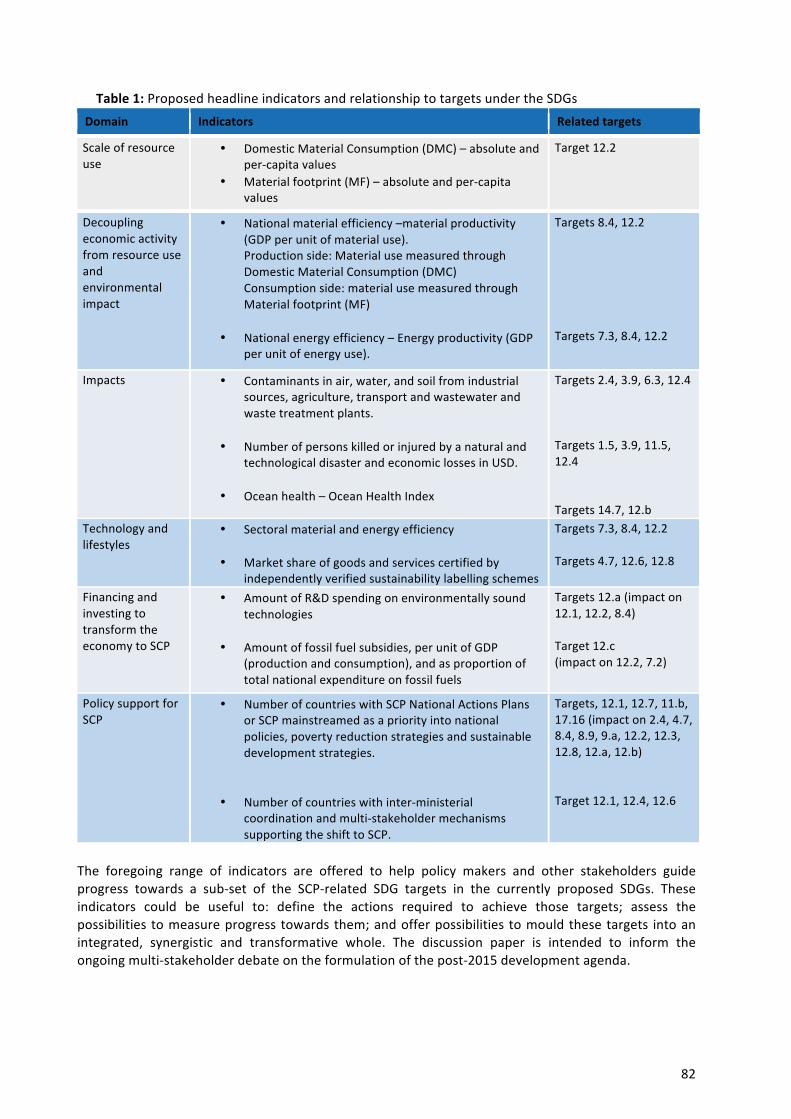
82
Table 1: Proposed headline indicators and relationship to targets under the SDGs Domain Indicators Related targets
Scale of resource use
• Domestic Material Consumption (DMC) – absolute and per-‐capita values
• Material footprint (MF) – absolute and per-‐capita values
Target 12.2
Decoupling economic activity from resource use and environmental impact
• National material efficiency –material productivity (GDP per unit of material use). Production side: Material use measured through Domestic Material Consumption (DMC) Consumption side: material use measured through Material footprint (MF)
• National energy efficiency – Energy productivity (GDP
per unit of energy use).
Targets 8.4, 12.2 Targets 7.3, 8.4, 12.2
Impacts
• Contaminants in air, water, and soil from industrial sources, agriculture, transport and wastewater and waste treatment plants.
• Number of persons killed or injured by a natural and
technological disaster and economic losses in USD.
• Ocean health – Ocean Health Index
Targets 2.4, 3.9, 6.3, 12.4 Targets 1.5, 3.9, 11.5, 12.4 Targets 14.7, 12.b
Technology and lifestyles
• Sectoral material and energy efficiency
• Market share of goods and services certified by independently verified sustainability labelling schemes
Targets 7.3, 8.4, 12.2 Targets 4.7, 12.6, 12.8
Financing and investing to transform the economy to SCP
• Amount of R&D spending on environmentally sound technologies
• Amount of fossil fuel subsidies, per unit of GDP
(production and consumption), and as proportion of total national expenditure on fossil fuels
Targets 12.a (impact on 12.1, 12.2, 8.4) Target 12.c (impact on 12.2, 7.2)
Policy support for SCP
• Number of countries with SCP National Actions Plans or SCP mainstreamed as a priority into national policies, poverty reduction strategies and sustainable development strategies.
• Number of countries with inter-‐ministerial coordination and multi-‐stakeholder mechanisms supporting the shift to SCP.
Targets, 12.1, 12.7, 11.b, 17.16 (impact on 2.4, 4.7, 8.4, 8.9, 9.a, 12.2, 12.3, 12.8, 12.a, 12.b) Target 12.1, 12.4, 12.6
The foregoing range of indicators are offered to help policy makers and other stakeholders guide progress towards a sub-‐set of the SCP-‐related SDG targets in the currently proposed SDGs. These indicators could be useful to: define the actions required to achieve those targets; assess the possibilities to measure progress towards them; and offer possibilities to mould these targets into an integrated, synergistic and transformative whole. The discussion paper is intended to inform the ongoing multi-‐stakeholder debate on the formulation of the post-‐2015 development agenda.
83
Bibliography Bizikova et al. (2014). Summary of Capacity-‐building Needs to Advance Sustainable Development Planning and Implementation. IISD. Available at: http://www.iisd.org/sites/default/files/publications/sdplannet_summary.pdf.
Bridle, R. and Kitson, L. (2014). The Impact of Fossil-‐Fuel Subsidies on Renewable Electricity Generation. IISD. Winnipeg. Available at: http://www.iisd.org/gsi/sites/default/files/ffs_rens_impacts.pdf.
Bringezu, S. (2015). Possible Target Corridor for Sustainable Use of Global Material Resources 4(1):25-‐54.
Cantonre, N., Antimiani, A. and Anciaes, P.R. (2012). Energy Price Shocks: Sweet and sour consequences for developing countries. ODI. Available at: http://www.odi.org/sites/odi.org.uk/files/odi-‐assets/publications-‐opinion-‐files/7794.pdf.
CBD (2014). Global Biodiversity Outlook 3. CBD. Available at: http://www.cbd.int/gbo3/?pub=6667§ion=6713.
Clark, Anna (2011, 5 July). Third-‐ party certification: A tool to ensure sustainability, Available from http://www.motherearthnews.com/blogs/ blog.aspx?blogid=2147484356&tag=Rain forest%20Alliance. DG Enterprise and Industry (2013). European Tourism Indicator System Toolkit for Sustainable Desitinations. Available at: http://ec.europa.eu/enterprise/sectors/tourism/sustainable-‐tourism/indicators/documents_indicators/eu_toolkit_indicators_en.pdf.
EFA Steering Committee. (2014). Towards indicators for a post-‐2015 education framework. UNESCO Institute for Statistics. Available at: http://www.uis.unesco.org/Education/Documents/towards-‐indicators-‐for-‐post-‐2015-‐education-‐framework-‐nov2014.pdf.
Elizabeth Doris, Joyce McLaren, Victoria Healey, and Stephen Hockett (2009). State of the States 2009: Elizabeth Energy Development and the Role of Policy. National Renewable Energy Laboratory. Golden, Colorado.
Ellis, J. (2010). Untold Billions: Fossil-‐fuel subsidies, their impacts and the path to reform. IISD. Winnipeg. Available at: http://www.iisd.org/gsi/sites/default/files/effects_ffs.pdf.
Eurostat (2012). Economy-‐wide material flow accounts. Compilation guide 2012. Luxembourg, Eurostat.
FAO (2013) Food Wastage Footprint http://www.fao.org/docrep/018/i3347e/i3347e.pdf
FAO, IFAD, WFP (2014) State of Food Insecurity in the World http://www.fao.org/publications/sofi/en/
Hak, T. (2009). Indicator-‐based evaluation of interlinkages between different sustainable development objectives. INDI-‐LINK. Available at: http://seri.at/wp-‐content/uploads/2009/11/INDI-‐LINK_D-‐1.3.pdf

84
Hajer, M. et al (2015). Beyond Cockpit-‐ism: Four Insights to Enhance the Transformative Potential of the Sustainable Development Goals
ICSU, ISSC (2015): Review of the Sustainable Development Goals: The Science Perspective. Paris: International Council for Science (ICSU)
IEA (2012). World Energy Outlook 2012: renewable Energy Outlook. IEA. Paris. Available at: http://www.worldenergyoutlook.org/media/weowebsite/2012/WEO2012_Renewables.pdf.
IEA. (2014) World Energy Outlook. IEA. Paris. Available at: http://www.iea.org/publications/freepublications/ publication/KeyWorld2014.pdf
KPMG (2013) The KPMG Survey of Corporate Responsibility Reporting. Available at: http://www.kpmg.com/Global/en/IssuesAndInsights/ArticlesPublications/corporate-‐responsibility/Documents/corporate-‐responsibility-‐reporting-‐survey-‐2013.pdf
Matthews, E. and Grainger, A. (2002). Evaluation of FAO’s Global Forest Resources Assessment from the user perspective. Unasylva 210, Vol. 53, pp. 42-‐55. Available at: ftp://ftp.fao.org/docrep/fao/005/y4001e/y4001e04.pdf.
McKinsey Global Institute (2011). Resource revolution: Meeting the world’s energy, materials, food, and water needs. Washington, DC.
MEAs -‐ International multilateral environmental agreements websites: Basel, Rotterdam, Stockholm Conventions, the ILO Chemicals Conventions, (ILO 174), the International Health Regulations and the Minamata Convention. For example: World www.pic.int, accessed on 4 December 2014.
Merrill, L. and Chung, V. (2014). Financing the SustainableDevelopment Goals ThroughFossil-‐fuel Subsidy Reform:Opportunities in SoutheastAsia, India and China. IISD, Winnipeg. Available at: http://www.iisd.org/gsi/sites/default/files/financing-‐sdgs-‐fossil-‐fuel-‐subsidy-‐reform-‐southeast-‐asian-‐india-‐china(6).pdf.
OECD (2013) OECD Science, Technology and Industry Scoreboard 2013: Innovation for Growth. OECD Available at: http://www.oecd-‐ilibrary.org/science-‐and-‐technology/oecd-‐science-‐technology-‐and-‐industry-‐scoreboard-‐2013_sti_scoreboard-‐2013-‐en;jsessionid=1fcs694ost0l.x-‐oecd-‐live-‐01.
OECD (2008). Measuring material flows and resource productivity. Synthesis report. Paris, OECD.
OECD (2013). OECD DAC Statistics: Biodiversity related aid. OECD. Available at: http://www.oecd.org/dac/stats/documentupload/Biodiversity-‐related%20aid%20Flyer%20-‐%20December%202013_FINAL.pdf.
Pinter, L., D. Almassy and S. Hatakeyama. (2014) Sustainable development goals for a small planet: Connecting the global to the national level in 14 countries of Asia-‐Pacific and Europe. Part II: Measuring Sustainability. Singapore: Asia-‐Europe Foundation. Availabel at: http://www.asef.org/images/stories/publications/documents/ENVforum-‐Part_II-‐Measuring_Sustainability.pdf
Raupach, M. R., G. Marland, P. Ciais, C. Le Quéré, J. G. Canadell, G. Klepper & C. B. Field (2007). Global and regional drivers of accelerating CO2 emissions. Proceedings of the National Academy of Sciences, 104, 10288-‐10293.
85
Strategic Approach to International Chemicals Management (SAICM) website http://www.saicm.org/
Santalco, A. (2012). How and when China will exceed its renewable energy deployment targets. Energy Policy 51: 652-‐661.
Schandl, H, S Hatfield-‐Dodds, T. Wiedmann, A Geschke, Y Cai, J West, D Newth, T Baynes, M Lenzen and A Owen (in print). Decoupling global environmental pressure and economic growth: scenarios for energy use, materials and carbon emissions. Journal of Cleaner Production.
SDSN (2014). Indicators for Sustainable Development Goals. UNSDSN. Available at: http://unsdsn.org/wp-‐content/uploads/2014/05/140522-‐SDSN-‐Indicator-‐Report.pdf.
SDSN. (2015) Indicators and a Monitoring Framework for Sustainable Development Goals. Launching a Data Revolution for the SDGs. A report by the Leadership Council of the Sustainable Development Solutions Network. Revised working draft (version 6), February 18, 2015
Takiguchi, H. and K. Takemoto (2008). Japanese 3R policies based on material flow analysis. Journal of Industrial Ecology 12: 792-‐798.
TSN Political & Social (2013). Attitudes Towards Biodiversity. European Commission. Available at: http://ec.europa.eu/public_opinion/flash/fl_379_en.pdf
UN (2010). Development Cooperation for the MDGs: Maximizing results. UN DESA. Available at: http://www.un.org/en/ecosoc/newfunct/pdf/10-‐45690(e)(desa)development_cooperation_for_the_mdgs_maximizing_results.pdf.
UN Conference for Sustainable Development – RIO+20 (2012), 10YFP adopted document A/CONF.216/5.
UN (2014). Zero Draft of the post 2015 Disaster Risk Reduction Framework, UN, Paris. Available at: http://www.wcdrr.org/uploads/1419081E.pdf.
UN (n.d.) Science, technology and innovation for sustainable development in the global partnership for development beyond 2015. Available at: http://www.un.org/en/development/desa/policy/untaskteam_undf/thinkpieces/28_thinkpiece_science.pdf
UN DESA, (2003) UN Guidelines for Consumer Protection (as expanded in 1999), New York
UN DESA (2007). Indicators of Sustainable Development: Guidelines and methodologies. United Nations. Available at: http://www.un.org/esa/sustdev/natlinfo/indicators/guidelines.pdf and for additional details http://data.worldbank.org/indicator/ER.MRN.PTMR.ZS/countries.
UN. (2014) Open Working Group Proposal for Sustainable Development Goals. New York: United Nations. Available at: https://sustainabledevelopment.un.org/index.php?page=view&type=400&nr=1579&menu=1300.
UN (2014). System of environmental-‐economic accounting 2012. Central framework. New York, United Nations.
UN (2014a) The Road to Dignity by 2030: Ending Poverty, Transforming All Lives and Protecting the Planet. Synthesis Report of the Secretary-‐General on the Post-‐2015 Agenda. New York: UN. Available
86
at: http://www.un.org/disabilities/documents/reports/SG_Synthesis_Report_Road_to_Dignity_by_2030.pdf
United Nations World Ocean Assessment, under preparation, http://www.worldoceanassessment.org/ UNCTAD (2014). Trade and Development Report 2014. UNCTAD. Available at: http://unctad.org/en/PublicationsLibrary/tdr2014overview_en.pdf.
UNDP (2013). Tranforming Biodiversity Finance: A quick guide for assessing and mobilizing financial resources to achieve the Aichi Targets and to implement National Biodiversity Strategies and Action Plans. UNDP. Available at: http://www.cbd.int/financial/hlp/doc/literature/BIOFIN%20Resource%20Mobilisation%20Quick%20Guide%20v6.pdf.
UNEP (2011). Forests in a Green Economy: A synthesis.UNEP. Geneva. Available at: http://www.unep.org/pdf/PressReleases/UNEP-‐ForestsGreenEco-‐basse_def_version_normale.pdf.
UNEP (2011) Decoupling natural resource use and environmental impacts from economic growth, A Report of the Working Group on Decoupling to the International Resource Panel. Fischer-‐Kowalski, M., Swilling, M., von Weizsäcker, E.U., Ren, Y., Moriguchi, Y., Crane, W., Krausmann, F., Eisenmenger, N., Giljum, S., Hennicke, P., Romero Lankao, P., Siriban Manalang, A., Sewerin, S.).
UNEP (2013) Environmental Risks and Challenges of Anthropogenic Metals Flows and Cycles, A Report of the Working Group on the Global Metal Flows to the International Resource Panel. van der Voet, E.; Salminen, R.; Eckelman, M.; Mudd, G.; Norgate, T.; Hischier, R.
UNEP (2014) Assessing Global Land Use: Balancing Consumption with Sustainable Supply. A Report of the Working Group on Land and Soils of the International Resource Panel. Bringezu S., Schütz H., Pengue W., O´Brien M., Garcia F., Sims R., Howarth R., Kauppi L., Swilling M., and Herrick J.
UNEP (n.d.) Sustainable Consumption and Production and the SDGS. UNEP. Available at: http://www.unep.org/post2015/Portals/50240/Documents/UNEP%20Publications/UNEPBriefingNote2.pdf.
UNEP (2010). Assessing the environmental impacts of consumption and production. Priority Products and Materials. Report of the International Resource Panel. Paris, UNEP.
UNEP (2011), Towards a Green Economy: Pathways to Sustainable Development and Poverty Eradication, Tourism Chapter www.unep.org/greeneconomy.
UNEP et al. (2013b). Carrots and Sticks -‐ Sustainability reporting policies worldwide -‐ today's best practice, tomorrow's trends [Online]. Available from: http://www.unep.org/resourceefficiency/Portals/24147/scp/BIU%20documents/Reporting%20pages/Carrots-‐and-‐SticksIII.pdf
UNEP, (2013) Sustainable Public Procurement: A global review, Paris, France. Accessible at: http://www.unep.org/resourceefficiency/Portals/24147/SPP_Full_Report_Dec2013_v2%20NEW%20(2).pdf
87
UN-‐HABITAT (2012). Sustainable housing for sustainable cities: a policy framework for developing countries. Nairobi.
van Woerden, J., C. Wieler, E. Gutierrez-‐Espeleta, R. Grosshans, A. Abdelrehim, P.C.R. L. Rajbhandari. (2008). Monitoring, data and indicators. Training module 4. In L. Pinter, D. Swanson and IEA Training Manual (2008). A training manual on integrated environmental assessment and reporting. Nairobi: UNEP and Winnipeg: IISD. http://www.unep.org/ieacp/_res/site/File/iea-‐training-‐manual/module-‐4.pdf.
Waggoner, P. E. & J. H. Ausubel (2002). A framework for sustainability science: A renovated IPAT identity. Proceedings of the National Academy of Sciences of the United States of America, 99, 7860-‐7865.
Wagner, C. S., Brahmakulam, I., Jackson, B., Wong, A. and Yoda, T. (2011). Science and Technology Collaboration: Building capacity in developing countries?. RAND. Available at: http://www.rand.org/content/dam/rand/pubs/monograph_reports/2005/MR1357.0.pdf.
Walz, J. and Ramachandran, V. (2011). Brave New World: A literature review of emerging donors and the challenging nature of foreign assistance. Centre for Global Develoment. Available at: http://www.cgdev.org/files/1425691_file_Walz_Ramachandran_Brave_New_World_FINAL.pdf.
WHO (2014). Fact sheet N°313 on “Ambient (outdoor) air quality and health”, and Fact Sheet N°292, on “Household air pollution and health”, Updated March 2014.
Wiedmann et al. (2013). The material footprint of nations. PNAS.
World Bank (2006). Sustaining the World's Forest: Managing competing demands for a vital resource. Global Issues for Global Citizens. pp. 1-‐20. Available at: http://siteresources.worldbank.org/EXTABOUTUS/Resources/Ch16.pdf.
World Bank Group (2008). Sustainable Infrastructure Action Plan. World Bank. Available at: http://siteresources.worldbank.org/INTSDNETWORK/Resources/SIAP-‐Final-‐July08.pdf.
WRAP (2013) Household Food & Drink Waste in the UK http://www.wrap.org.uk/sites/files/wrap/hhfdw-‐2012-‐summary.pdf.
88
About the UNEP Division of Technology, Industry and Economics
Set up in 1975, three years after UNEP was created, the Division of Technology, Industry and Economics (DTIE) provides solutions to policy-makers and helps change the business environment by offering platforms for dialogue and co-operation, innovative policy options, pilot projects and creative market mechanisms. DTIE plays a leading role in three of the seven UNEP strategic priorities: climate change, chemicals and waste, resource efficiency. DTIE is also actively contributing to the Green Economy Initiative launched by UNEP in 2008. This aims to shift national and world economies on to a new path, in which jobs and output growth are driven by increased investment in green sectors, and by a switch of consumers’ preferences towards environmentally friendly goods and services. Moreover, DTIE is responsible for fulfilling UNEP’s mandate as an implementing agency for the Montreal Protocol Multilateral Fund and plays an executing role for a number of UNEP projects financed by the Global Environment Facility.
The Office of the Director, located in Paris, coordinates activities through: > The International Environmental Technology Centre - IETC (Osaka), which promotes the collection and
dissemination of knowledge on Environmentally Sound Technologies with a focus on waste management. The broad objective is to enhance the understanding of converting waste into a resource and thus reduce impacts on human health and the environment (land, water and air).
> Sustainable Lifestyles, Cities and Industry (Paris), which delivers support to the shift to sustainable consumption and production patterns as a core contribution to sustainable development.
> Chemicals (Geneva), which catalyses global actions to bring about the sound management of chemicals and the improvement of chemical safety worldwide.
> Energy (Paris and Nairobi), which fosters energy and transport policies for sustainable development and encourages investment in renewable energy and energy efficiency. > OzonAction (Paris), which supports the phase-out of ozone depleting substances in developing countries
and countries with economies in transition to ensure implementation of the Montreal Protocol. > Economics and Trade (Geneva), which helps countries to integrate environmental considerations into economic and trade policies, and works with the finance sector to incorporate sustainable development policies. This branch is also charged with producing green economy reports.
DTIE works with many partners (other UN agencies and programmes, international organizations,
governments, non-governmental organizations, business, industry, the media and the public) to raise
awareness, improve the transfer of knowledge and information, foster technological cooperation and
implement international conventions and agreements.
89
The purpose of this document is to assist Member States in identifying potential indicators for targets proposed under SDG 12 (“Ensure Sustainable Consumption and Production Patterns”) and for related targets in twelve of the other proposed SDGs. This discussion paper aims to contribute to the development of an integrated, science-based set of indicators to monitor progress towards sustainable consumption and production (SCP) patterns which support achievement of the SDGs. The paper highlights a number of potential indicators which can serve for different goals and targets and which thus contribute to making the targets more actionable and transformative, by promoting an integrated approach to shifting towards SCP patterns and achieving the SDGs.
For more information, contact: 10YFP Secretariat, Division of Technology Industry and Economics, UNEP DTIE 15 rue de Milan 75441 Paris Cedex 09 France Tel: +33 1 44 37 14 50 Fax: +33 1 44 37 14 74 Email: [email protected] ; [email protected] www.unep.org/resourceefficiency