Embed Size (px)
Citation preview

Surface Urban Heat Island Across 419 Global Big CitiesShushi Peng,† Shilong Piao,*,†,‡ Philippe Ciais,§ Pierre Friedlingstein,∥ Catherine Ottle,§
Francois-Marie Breon,§ Huijuan Nan,† Liming Zhou,# and Ranga B. Myneni⊥
†College of Urban and Environmental Sciences, Peking University, Beijing 100871, China‡Institute of Tibetan Plateau Research, Chinese Academy of Sciences, Beijing 100085, China§Laboratoire des Sciences du Climat et de l’Environnement, CEA CNRS UVSQ, 91191 Gif-sur-Yvette, France∥School of Engineering, Computing and Mathematics, University of Exeter, Exeter EX4 4QF, U.K.#Department of Atmospheric and Environmental Sciences, University at Albany State University of New York, 1400 WashingtonAvenue Albany, NY 12222, United States⊥Department of Geography and Environment, Boston University, Boston, Massachusetts 02215, United States
*S Supporting Information
ABSTRACT: Urban heat island is among the most evident aspects ofhuman impacts on the earth system. Here we assess the diurnal andseasonal variation of surface urban heat island intensity (SUHII)defined as the surface temperature difference between urban area andsuburban area measured from the MODIS. Differences in SUHII areanalyzed across 419 global big cities, and we assess several potentialbiophysical and socio-economic driving factors. Across the big cities, weshow that the average annual daytime SUHII (1.5 ± 1.2 °C) is higherthan the annual nighttime SUHII (1.1 ± 0.5 °C) (P < 0.001). But nocorrelation is found between daytime and nighttime SUHII across bigcities (P = 0.84), suggesting different driving mechanisms between dayand night. The distribution of nighttime SUHII correlates positivelywith the difference in albedo and nighttime light between urban areaand suburban area, while the distribution of daytime SUHII correlates negatively across cities with the difference of vegetationcover and activity between urban and suburban areas. Our results emphasize the key role of vegetation feedbacks in attenuatingSUHII of big cities during the day, in particular during the growing season, further highlighting that increasing urban vegetationcover could be one effective way to mitigate the urban heat island effect.
1. INTRODUCTIONUrbanization is among the most evident aspects of humanimpact on the earth system.1 It is well-known that urban centersexperience higher temperatures than surrounding suburban andrural areas, a phenomenon known as the urban heat islandeffect.2−8 As urbanization is accelerating across the world,9
especially in developing countries such as China and India,9−11
this urban heat island effect has gained in importance.3,4 In thecontext of global warming it has been suggested that warmingtrends observed at continental weather stations could be partlyinfluenced by local urban heat islands, thus reducing thecontribution of greenhouse gases to global warming,5 althoughthis has been disputed by several studies.6 On the other side,urban heat island also has negative impacts on the quality of thecity life from the aspects of energy consumption, air and waterquality, and human health.12 Therefore, better understandingthe drivers of urban heat island intensity is of criticalimportance for climate research and impacts studies, whichhas strong implications for urban planning.12,13
Urban heat island intensity is often quantified by thedifference in air temperature between a weather station located
in an urban center and one in a less urbanized outskirt,7,8 whichis usually called air urban heat island.13 Because the density ofin situ weather station networks is sparse and potentiallyinfluenced by very local conditions, it is difficult to rely on thesedata alone for obtaining information about urban heat island atthe spatial scale of a city. Satellite remote sensing now offers theopportunity to characterize spatial and temporal structures ofland surface temperature (LST),14 with sufficient resolution todistinguish between urban centers and rural surroundings(Figure 1).15,16 Remote sensing LST difference between urbanand suburban areas is usually defined as surface urban heatisland.13,14 Until now, there are many studies using satellite-derived LST to study surface urban heat island focusing onsingle or several big cities over a region,15,17,18 as more satelliteproducts are available such as MODerate-resolution ImagingSpectroradiometer (MODIS) LST and Landsat TM/ETM+.
Received: August 31, 2011Revised: December 5, 2011Accepted: December 5, 2011Published: December 5, 2011
Article
pubs.acs.org/est
© 2011 American Chemical Society 696 dx.doi.org/10.1021/es2030438 | Environ. Sci. Technol. 2012, 46, 696−703

For example, Hung et al. (2006)17 used MODIS LST to report18 Asian mega cities surface urban heat island which iscorrelated with city population, building up density andvegetation cover. Imhoff et al. (2010)15 also indicated thatthere is diurnal and seasonal cycle of surface urban heat islandand summer surface urban heat island (4.3 °C) is larger thanwinter surface urban heat island (1.3 °C) over 38 mostpopulous cities across USA using MODIS LST. However, asystematic evaluation of surface urban heat island for the globalbig cities using a common method is still missing.In this study, we use the latest Version 5 of Land Surface
Temperature (LST) data set from the EOS-Aqua-MODIS(MODIS-Aqua) during the period 2003−2008 to determinethe intensity of the surface urban heat island over 419 big cities(with a population of more than 1 million). The primaryobjective is to quantify the diurnal, seasonal variations, andbetween-city differences in surface urban heat island and to gaininsights on its linkage to biophysical drivers such as vegetationgreenness, albedo and mean climate, and to socio-economicdrivers such as nighttime lights and population density. Weseparate the analysis of urban heat island mechanisms betweendaytime and nighttime.
2. DATA SETS AND METHODS2.1. Data Sets. Land Surface Temperature (LST) data at a
spatial resolution of 1 km and 8-day interval was obtained fromEOS-Aqua-MODIS V5 composite products (MYD11A2). TheLST data include daytime (∼13:30) and nighttime (∼01:30)temperature observations from 2003 to 2008. The retrieval ofsurface temperature was further improved by correcting noisedue to cloud contamination, topographic differences, andzenith angle changes.16 Data quality assessed by Wan (2008)16
indicates that the MODIS V5 LST are consistent with in situLST measurements, within a root mean squares difference ofless than 0.5 K across 39 tested cases. In addition, Wang et al.(2007)18 reported high accuracy of MODIS LST products onBeijing city based on the surface emissivity evaluations.We selected 428 big cities with a population larger than 1
million according to population data for year 2007.19 Thelocation of each big city was determined from a geographicaldatabase.20 Urban and nonurban areas over each city wereseparated according to the MODIS Global Land Cover Map21
at 1 km spatial resolution, consistent with the LST data.To explore the global drivers of surface urban heat islands,
we combine satellite observations of vegetation index, albedo,climate, and several socio-economic indexes. The contrast ofvegetation and albedo between urban area and suburban areaare defined using the MODIS Vegetation Continuous Fields(VCF, essentially the tree cover fraction), the EnhancedVegetation Index (EVI), and the Bidirectional ReflectanceDistribution Function (BRDF) albedo data, respectively. TheVCF data are available at 1 km spatial resolution for year2004,22 and the EVI data at 1 km spatial resolution and 16-dayinterval are available from 2003 to 2008.23 The MODIS albedoproducts used in this study include black sky albedo (BSA) andwhite sky albedo (WSA) over shortwave broadband (0.3−5.0μm) with 1 km spatial resolution and 8-day interval for year2005.24 The climate data including air temperature andprecipitation are derived from Climatic Research Unit (CRU)TS3.0 data sets with 0.5° spatial resolution during the period1971−2000.25The population density of each city and its suburban area
were extracted from the Gridded Population of the WorldVersion 3 (GPWv3) provided by the Center for International
Figure 1. Beijing area maps of (A) MODIS data derived land cover/use, (B) Landsat ETM+ true color image with spatial resolution 30 m × 30 m inAugust, 2005, (C) annual mean daytime land surface temperature (LST) (°C), and (D) annual mean nighttime LST (°C). The magenta, green, darkgreen, and blue lines stand for the borders of Beijing urban areas, suburban with 50% of urban areas, suburban with 100% of urban areas, andsuburban with 150% of urban areas, respectively.
Environmental Science & Technology Article
dx.doi.org/10.1021/es2030438 | Environ. Sci. Technol. 2012, 46, 696−703697

Earth Science Information Network of Columbia University.26
This data set is based on UN population statistics in 2005, witha spatial resolution of 2.5′. Finally, remotely sensed nighttimelight data, formerly recognized as a proxy of socio-economicactivities27,28 were compiled for each urban and suburban areafrom the stable nighttime light Version 4 data set,29 the latestversion produced by the NOAA National Geophysical DataCenter (NGDC). This nighttime light data set spans the periodfrom 2003 to 2008, at a spatial resolution of 30″.2.2. Analyses. We define the Surface Urban Heat Island
Intensity (SUHII) as the difference of land surface temperaturebetween urban area and suburban area. For each city, wecalculate the difference of urban LST minus suburban LST.Urban area is determined by the City Clustering Algorithm,30
according to the MODIS land cover map (see detailedalgorithm of city clustering in the Supporting Information(SI)). Since the City Clustering Algorithm could not besuccessfully applied in 9 cities of the tropical regions (becauseurban pixels are very discrete), we analyzed only 419 of 428cities in this study (Table S1). After urban area is determined,suburban area is defined as all of the nonurban pixels(excluding water pixels) within the ring zone around theurban area, which covers the same amount of land as urbanarea. To test the impact of different suburban area definitionson SUHII, we also showed similar results from a smallersuburban area (as 50% of the urban area) and a larger suburbanarea (as 150% of the urban area) (Figure 1, SI Figure S1).Daytime and nighttime SUHII were calculated separately fromEOS-Aqua-MODIS LST in the early afternoon (∼13:30) and atnight (∼01:30), respectively.16 Both seasonal and annualaveraged daytime and nighttime SUHII were computed. Thespatial differences of SUHII among big cities are studied duringthe period 2003−2008.In parallel with daytime and nighttime SUHII, we define two
vegetation parameters, two albedo parameters, three climateparameters, and two density parameters for each big city. Thegreening parameters are calculated as the VCF difference(δVCF) and the EVI difference (δEVI) between urban andsuburban pixels. The albedo parameters are estimated by thedifference between urban and suburban pixels in (1) the blacksky albedo (δBSA) and (2) the white sky albedo (δWSA) (BSAis linear with WSA and shows similar results to WSA, so onlyWSA is shown here). The climate parameters for each big cityincluding mean annual air temperature (MAT), mean annualprecipitation (MAP), and mean air temperature for the monthswhen air temperature exceeds 0 °C (MT0) were extracted fromCRU TS3.0 data sets. Note that such climate parameters mayindirectly explain the spatial patterns of SUHII throughexplaining the conditions of variable intensities of SUHII.The density parameters are estimated by the difference betweenurban and suburban pixels in (1) the nighttime light intensitydifference (δNL) and (2) the population density difference(δPD) between urban and suburban pixels. In order to identifythe drivers of daytime and nighttime SUHII, the six predictorvariables, δVCF, δEVI, δBSA, δWSA, δNL, and δPD, wereregressed against SUHII using the major axis Model IIregressions.31 Across the Northern Hemisphere, summer isdefined as the period from June to August (JJA), while winter isdefined as the period from December to February (DJF). In theSouthern Hemisphere, summer is defined as the period fromDecember to February (DJF), while winter is defined as thehperiod from June to August (JJA).
3. RESULTS AND DISCUSSION
Figure 2 shows that the annual mean daytime SUHII is positiveover most cities (92%). The city of Medellin (Colombia) has a
record positive daytime SUHII of 7.0 °C, followed by Tokyo(Japan), Nagoya (Japan), Sao Paulo (Brazil), and Bogota (Columbia) (>5 °C). Only a few cities surrounded by desert,such as Jeddah in Saudi-Arabia and Mosul in Iraq, show anegative daytime SUHII. In these places, the inner-city daytimetemperature is lower than the surrounding desert (Figure 2A).This feature could be due to evaporative cooling by thevegetation of urban area.32 The annual nighttime SUHIIs overmost (95%) of the 419 big cities are between 0 and 2 °C(Figure 2B), and Mexico City has the record high nighttimeSUHII of 3.4 °C.Table 1 summarizes the average annual, summer and winter
SUHII across six continents. The average annual daytime andnighttime SUHII is largest in South America and then NorthAmerica, while Africa shows the lowest annual daytime andnighttime SUHII (Table 1; Figure 2). If the 419 big cities weredivided into developed and developing countries based on theUnited Nations Framework Convention on Climate ChangeAnnex I and II, we found that the annual daytime SUHII overdeveloped countries (2.1 ± 1.1 °C, n = 116) is significantlyhigher than that over developing countries (1.3 ± 1.1 °C, n =303) (P < 0.001), but the annual nighttime SUHII overdeveloped countries (1.0 ± 0.4 °C) is close to annual nighttimeSUHII over developing countries (1.1 ± 0.6 °C) (P = 0.014).The annual SUHII during nighttime (1.1 ± 0.5 °C, n = 419), asdisplayed in Figure 2B and Table 1, is on average lower thanthat during daytime (1.5 ± 1.2 °C, n = 419) (P < 0.001). Yet,
Figure 2. Spatial distribution of (A) annual mean daytime SUHII (°C)and (B) annual mean nighttime SUHII (°C) averaged over the period2003−2008 across 419 global big cities.
Environmental Science & Technology Article
dx.doi.org/10.1021/es2030438 | Environ. Sci. Technol. 2012, 46, 696−703698
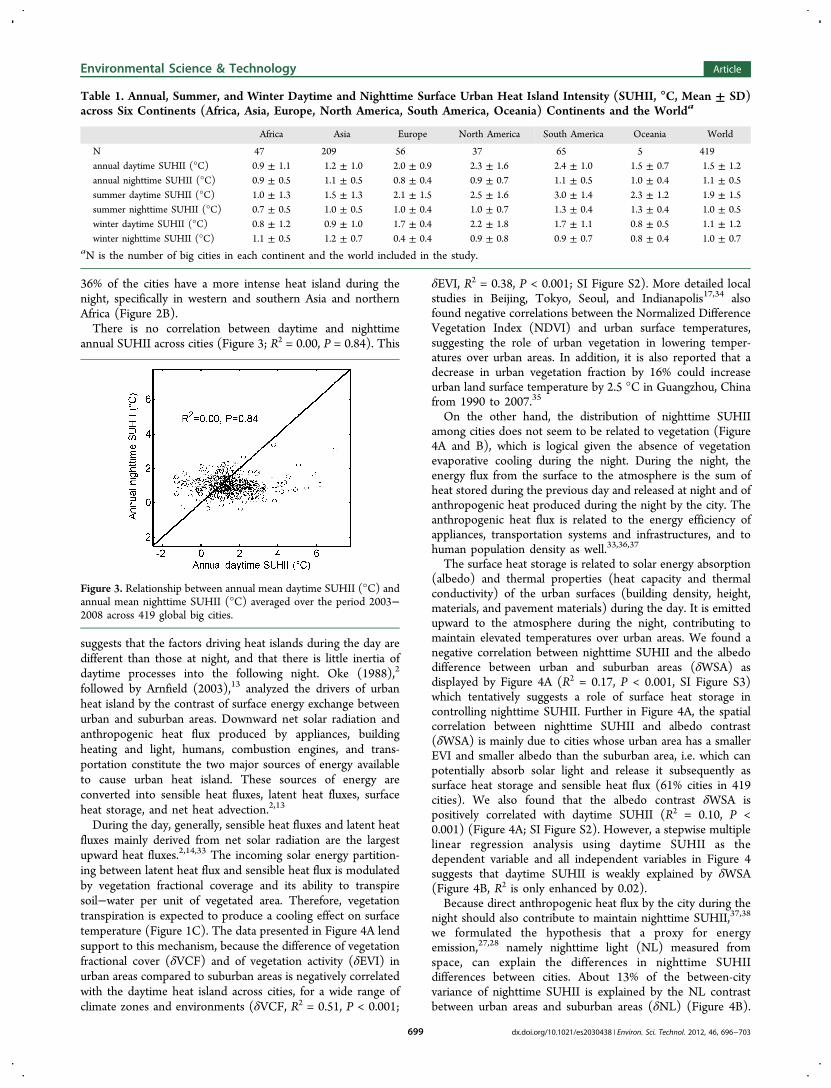
36% of the cities have a more intense heat island during thenight, specifically in western and southern Asia and northernAfrica (Figure 2B).There is no correlation between daytime and nighttime
annual SUHII across cities (Figure 3; R2 = 0.00, P = 0.84). This
suggests that the factors driving heat islands during the day aredifferent than those at night, and that there is little inertia ofdaytime processes into the following night. Oke (1988),2
followed by Arnfield (2003),13 analyzed the drivers of urbanheat island by the contrast of surface energy exchange betweenurban and suburban areas. Downward net solar radiation andanthropogenic heat flux produced by appliances, buildingheating and light, humans, combustion engines, and trans-portation constitute the two major sources of energy availableto cause urban heat island. These sources of energy areconverted into sensible heat fluxes, latent heat fluxes, surfaceheat storage, and net heat advection.2,13
During the day, generally, sensible heat fluxes and latent heatfluxes mainly derived from net solar radiation are the largestupward heat fluxes.2,14,33 The incoming solar energy partition-ing between latent heat flux and sensible heat flux is modulatedby vegetation fractional coverage and its ability to transpiresoil−water per unit of vegetated area. Therefore, vegetationtranspiration is expected to produce a cooling effect on surfacetemperature (Figure 1C). The data presented in Figure 4A lendsupport to this mechanism, because the difference of vegetationfractional cover (δVCF) and of vegetation activity (δEVI) inurban areas compared to suburban areas is negatively correlatedwith the daytime heat island across cities, for a wide range ofclimate zones and environments (δVCF, R2 = 0.51, P < 0.001;
δEVI, R2 = 0.38, P < 0.001; SI Figure S2). More detailed localstudies in Beijing, Tokyo, Seoul, and Indianapolis17,34 alsofound negative correlations between the Normalized DifferenceVegetation Index (NDVI) and urban surface temperatures,suggesting the role of urban vegetation in lowering temper-atures over urban areas. In addition, it is also reported that adecrease in urban vegetation fraction by 16% could increaseurban land surface temperature by 2.5 °C in Guangzhou, Chinafrom 1990 to 2007.35
On the other hand, the distribution of nighttime SUHIIamong cities does not seem to be related to vegetation (Figure4A and B), which is logical given the absence of vegetationevaporative cooling during the night. During the night, theenergy flux from the surface to the atmosphere is the sum ofheat stored during the previous day and released at night and ofanthropogenic heat produced during the night by the city. Theanthropogenic heat flux is related to the energy efficiency ofappliances, transportation systems and infrastructures, and tohuman population density as well.33,36,37
The surface heat storage is related to solar energy absorption(albedo) and thermal properties (heat capacity and thermalconductivity) of the urban surfaces (building density, height,materials, and pavement materials) during the day. It is emittedupward to the atmosphere during the night, contributing tomaintain elevated temperatures over urban areas. We found anegative correlation between nighttime SUHII and the albedodifference between urban and suburban areas (δWSA) asdisplayed by Figure 4A (R2 = 0.17, P < 0.001, SI Figure S3)which tentatively suggests a role of surface heat storage incontrolling nighttime SUHII. Further in Figure 4A, the spatialcorrelation between nighttime SUHII and albedo contrast(δWSA) is mainly due to cities whose urban area has a smallerEVI and smaller albedo than the suburban area, i.e. which canpotentially absorb solar light and release it subsequently assurface heat storage and sensible heat flux (61% cities in 419cities). We also found that the albedo contrast δWSA ispositively correlated with daytime SUHII (R2 = 0.10, P <0.001) (Figure 4A; SI Figure S2). However, a stepwise multiplelinear regression analysis using daytime SUHII as thedependent variable and all independent variables in Figure 4suggests that daytime SUHII is weakly explained by δWSA(Figure 4B, R2 is only enhanced by 0.02).Because direct anthropogenic heat flux by the city during the
night should also contribute to maintain nighttime SUHII,37,38
we formulated the hypothesis that a proxy for energyemission,27,28 namely nighttime light (NL) measured fromspace, can explain the differences in nighttime SUHIIdifferences between cities. About 13% of the between-cityvariance of nighttime SUHII is explained by the NL contrastbetween urban areas and suburban areas (δNL) (Figure 4B).
Table 1. Annual, Summer, and Winter Daytime and Nighttime Surface Urban Heat Island Intensity (SUHII, °C, Mean ± SD)across Six Continents (Africa, Asia, Europe, North America, South America, Oceania) Continents and the Worlda
Africa Asia Europe North America South America Oceania World
N 47 209 56 37 65 5 419annual daytime SUHII (°C) 0.9 ± 1.1 1.2 ± 1.0 2.0 ± 0.9 2.3 ± 1.6 2.4 ± 1.0 1.5 ± 0.7 1.5 ± 1.2annual nighttime SUHII (°C) 0.9 ± 0.5 1.1 ± 0.5 0.8 ± 0.4 0.9 ± 0.7 1.1 ± 0.5 1.0 ± 0.4 1.1 ± 0.5summer daytime SUHII (°C) 1.0 ± 1.3 1.5 ± 1.3 2.1 ± 1.5 2.5 ± 1.6 3.0 ± 1.4 2.3 ± 1.2 1.9 ± 1.5summer nighttime SUHII (°C) 0.7 ± 0.5 1.0 ± 0.5 1.0 ± 0.4 1.0 ± 0.7 1.3 ± 0.4 1.3 ± 0.4 1.0 ± 0.5winter daytime SUHII (°C) 0.8 ± 1.2 0.9 ± 1.0 1.7 ± 0.4 2.2 ± 1.8 1.7 ± 1.1 0.8 ± 0.5 1.1 ± 1.2winter nighttime SUHII (°C) 1.1 ± 0.5 1.2 ± 0.7 0.4 ± 0.4 0.9 ± 0.8 0.9 ± 0.7 0.8 ± 0.4 1.0 ± 0.7
aN is the number of big cities in each continent and the world included in the study.
Figure 3. Relationship between annual mean daytime SUHII (°C) andannual mean nighttime SUHII (°C) averaged over the period 2003−2008 across 419 global big cities.
Environmental Science & Technology Article
dx.doi.org/10.1021/es2030438 | Environ. Sci. Technol. 2012, 46, 696−703699

δNL, however, does not explain daytime SUHII differencesbetween cities (Figure 4A; R2 = 0.01), most likely because theanthropogenic heat flux is dwarfed during daytime by sensibleheat and latent heat emissions.2,12,37
We also tested whether the heat islands of cities are related totheir population density and their size. Figure 4 shows thatSUHII difference between cities is not explained by thedifference in population density (δPD) between urban areasand suburban areas. This indicates that metabolic heating,about 100 W per person,37 accounts for only a very smallfraction of the urban anthropogenic heat flux.37 Finally, there isno obvious effect of city size: the urban area of each cityobtained from MODIS land cover21 explains less than 3% ofheat island differences between cities on global scale (Figure4B). Previous studies found larger urban heat island intensity inbigger cities2,15 in one country or region. In our study, becausethe 419 big cities are from different countries, different climaticzones, and different economic development, the effects of citysize on SUHII could be masked by these factors. If the 56European cities are extracted to test the relationship between
city size and SUHII, city size shows a significant and positivecorrelation with annual daytime SUHII (R2 = 0.16, P = 0.003).Except for albedo and nighttime light, city structure such as
building density, height, and surface materials could also affectthe nighttime surface energy exchange, thus impact thenighttime SUHII.14,17 This is the possible reason why albedoand nighttime light could only explain part of the spatialvariation of nighttime SUHII (R2 = 0.17 for albedo, R2 = 0.12for nighttime light) across 419 big cities in our study. Duringthe daytime, evaportranspiration depends on both vegetationand soil moisture, hence, soil moisture could also be related toSUHII. Unfortunately, there are no global uniform and highresolution data sets to test the impacts of these physicalvariables on nighttime SUHII. Future studies need to focus onthe most important physical variables related to surface energyexchange and study the processes and mechanisms of urbanheat islands using detailed observations and models for a singleor several typical cities.The heat island intensity also varies seasonally.15,18 The
summer to winter amplitude of SUHII is shown in Figure 5.Daytime SUHII has larger summer to winter amplitude than
Figure 4. (A) The square of linear correlation coefficients (R2 ) of annual daytime and nighttime SUHII and its seasonal amplitude with eachvariable and (B) stepwise multiple linear regression derived explanation of each variable on the spatial gradient of annual, summer (June-August(JJA) in Northern Hemisphere and December-February (DJF) in Southern Hemisphere), and winter (DJF in Northern Hemisphere and JJA inSouthern Hemisphere) daytime and nighttime SUHII as well as its seasonal amplitude (the difference between summer and winter) across 419 cities.The independent variables are as follows: MAT, MAP, MT0, and Pcity stand for mean annual air temperature, mean annual precipitation, meantemperature for the months when air temperature exceeds 0 °C, and area of the urban area; δVCF, δEVI, δWSA, δNL, and δPD stand for thedifference between urban area and suburban area for VCF (δVCF), EVI (δEVI), white sky albedo (δWSA), nighttime light (δNL), and populationdensity (δPD); AδEVI, AδWSA, and AT stand for the average difference between summer and winter for δEVI, δWSA, and air temperature, respectively.Square and circle backgrounds indicate that positive and negative correlation, respectively. A diamond background indicates the total explanation (R2
) of stepwise regression. An asterisk (*) indicates statistically nonsignificant (P > 0.05).
Environmental Science & Technology Article
dx.doi.org/10.1021/es2030438 | Environ. Sci. Technol. 2012, 46, 696−703700

nighttime SUHII in the temperate regions over the NorthernHemisphere, and there are remarkable latitudinal variations indaytime SUHII (Figure 5). Mid-to-high latitude cities (e.g.,Beijing, Vancouver) have larger seasonal amplitude of daytimeSUHII than their low latitude sisters (Figure 5A). Theevaporative cooling effects of the vegetation during the growingseason may partly explain why the seasonal amplitude of heatislands differs between cities. For instance, the spatialdistribution of the daytime SUHII seasonal amplitude issignificantly correlated with the δEVI seasonal amplitude(Figure 4; SI Figure S4); cities with a more seasonal greeningcontrast between urban area and suburban area also have amore seasonal urban heat island. As shown in SI Figure S6,tropical cities where vegetation is active all year round, show aflat seasonal profile of daytime SUHII throughout the year.The nighttime SUHII exhibits a small summer to winter
amplitude of less than 1 °C for more than 86% of the big cities(Figure 5B). The seasonal amplitude of nighttime SUHII is alsomore pronounced in cold regions (high latitudes) compared towarm regions (low latitudes). This variation is not explained byvegetation differences across cities (R2 = 0.02 with δVCF or R2
= 0.01 with δEVI; Figure 4B and Figure S5). However, theseasonal amplitude of nighttime SUHII negatively correlateswith both the mean temperature for the months when airtemperature exceeds 0 °C (MT0) and mean annual temper-ature (R2 = 0.26, P < 0.001, and R2 = 0.15, P < 0.001,respectively; Figure S5). This result is consistent with the largersolar radiation energy transformed into SUHII in summer overhigh latitude regions (Figure 4).39
Although LST has different physical meanings from surfaceair temperature,40 they have close and complex relation.
Generally under clear sky conditions, larger LST means largersensible heat flux which could result in larger surface airtemperature and higher urban boundary layer,13,14 while LSThas larger diurnal amplitude than surface air temperature, andthere is a time lag effect between them.40 Likewise, surfaceurban heat island magnitude and diurnal amplitude is largerthan that of air urban heat island.12 In addition, it should benoted that although Wang et al. (2007)18 verified the accuracyof emissivities in MODIS LST products over Beijing city andWan et al. (2008)16 tested MODIS LST products with groundLST measurement over lakes, grasslands, and agriculture fields,there is no comparison between direct ground urban LSTmeasurements with MODIS LST products over urban regionsyet. Future evaluation of MODIS LST products over urbanregions is needed by urban heat island and other disciplinarystudies.Note that the 419 big cities with a population larger than 1
million19 include some large urban agglomerations (e.g., WestYorkshire) consisting of several smaller cities,20 where the CityClustering Algorithm30 defining urban area may have causeuncertainties of SUHII derived in this study. In addition, recentstudy has highlighted the importance of effects of climateconditions such as wind speed and cloud cover on themagnitude of the heat island effect at high spatiotemporalresolution.41 Such effects should be addressed in future studieswhen high spatiotemporal resolution data set on those climatevariables become available.In recent years, rapid global warming and extreme climate
events have become one of the most urgent, yet complicated,issues facing both scientists and politicians. According to therecent report of IPCC,42 since the industrial revolution, global
Figure 5. Spatial distribution of (A) average daytime SUHII difference between summer and winter (°C) and (B) average nighttime SUHIIdifference between summer and winter (°C) averaged over the period 2003−2008 across 419 global big cities. The two right plots beside (A) and(B) map are the latitudinal average of daytime and nighttime SUHII difference between summer and winter (°C), respectively. The black lineindicates the average value, and the gray shaded areas are the uncertainty range indicated by mean ± SD.
Environmental Science & Technology Article
dx.doi.org/10.1021/es2030438 | Environ. Sci. Technol. 2012, 46, 696−703701

land mean temperature increased by 0.84 ± 0.37 °C, and warmnight frequency also increased. The large SUHII in summer notonly undoubtedly increases the cooling power consumption inurban areas12 but also could increase the risk of heatwaveextreme events over urban areas, as urban areas are affected byboth global and local climate forcing.43 A big challengepresented to the scientists now is to separate the contributionof urbanization and global climate forcing (greenhouse gasesincrease, pollutants and aerosol concentration changes) to theurban temperature trends as well as urban extreme climateevents and figure out how to adapt and mitigate seriousheatwave events induced by climate change and urban heatisland. At regional scale, fine-scale modeling studies44,45 will benecessary to understand the effects of urbanization on regionalclimate by accounting for urban-specific energy exchangeproperties, urban vegetation distribution, and ability to partitionnet radiation into latent or sensible heat.13,33,43 In addition, themagnitude of the daytime heat island seems to be significantlycontrolled by vegetation evaporative cooling. This adds anotheradvantage to greener cities − better adaptation to climatechange.
■ ASSOCIATED CONTENT*S Supporting InformationList of 419 big cities, detailed methods and figures forrelationships between SUHII and explanation variables andspatial patterns of summer and winter SUHII. This material isavailable free of charge via the Internet at http://pubs.acs.org.
■ AUTHOR INFORMATIONCorresponding Author*Phone: 86-10-6276-5578. Fax: 86-10-6275-6560. E-mail:[email protected]. Corresponding author address: PekingUniversity, Beijing 100871, China.
■ ACKNOWLEDGMENTSThis study was supported by the National Natural ScienceFoundation of China (41125004 and 31021001).
■ ABBREVIATION LISTBRDF, Bidirectional Reflectance Distribution FunctionBSA, black sky albedoCRU, Climate Research UnitEVI, Enhanced Vegetation IndexIPCC, Intergovernmental Panel on Climate ChangeLST, land surface temperatureMAP, mean annual precipitationMAT, mean annual temperatureMODIS, MODerate-resolution Imaging SpectroradiometerMT0, mean air temperature for the months when airtemperature exceeds 0 °CNDVI, Normalized Difference Vegetation IndexNL, nighttime lightNOAA, National Oceanic and Atmospheric AdministrationPD, population densityVCF, vegetation cover fieldsWSA, white sky albedo
■ REFERENCES(1) DeFries, R. Terrestrial Vegetation in the Coupled Human-EarthSystem: Contributions of Remote Sensing. Annu. Rev. Environ. Resour.2008, 33 (1), 369−390.
(2) Oke, T. R. The urban energy balance. Prog. Phys. Geog. 1988, 12(4), 471−508.(3) Kalnay, E.; Cai, M. Impact of urbanization and land-use changeon climate. Nature 2003, 423 (6939), 528−531.(4) Zhou, L. M.; Dickinson, R. E.; Tian, Y. H.; Fang, J. Y.; Li, Q. X.;Kaufmann, R. K.; Tucker, C. J.; Myneni, R. B. Evidence for asignificant urbanization effect on climate in China. Proc. Natl. Acad. Sci.U.S.A. 2004, 101 (26), 9540−9544.(5) Jones, P. D.; Lister, D. H.; Li, Q. Urbanization effects in large-scale temperature records, with an emphasis on China. J. Geophys. Res.2008, 113, D16122.(6) Parker, D. E. Urban heat island effects on estimates of observedclimate change. Wiley Interdiscip. Rev.: Clim. Change 2010, 1 (1), 123−133.(7) Fujibe, F. Detection of urban warming in recent temperaturetrends in Japan. Int. J. Clim. 2009, 29 (12), 1811−1822.(8) Stone, B. Urban and rural temperature trends in proximity tolarge US cities: 1951−2000. Int. J. Clim. 2007, 27 (13), 1801−1807.(9) Grimm, N. B.; Faeth, S. H.; Golubiewski, N. E.; Redman, C. L.;Wu, J.; Bai, X.; Briggs, J. M. Global Change and the Ecology of Cities.Science 2008, 319 (5864), 756−760.(10) National Bureau of Statistics. China Statistical Yearbook; ChinaStatistics Press: Beijing, 2008.(11) DeFries, R.; Pandey, D. Urbanization, the energy ladder andforest transitions in India’s emerging economy. Land Use Policy 2010,27 (2), 130−138.(12) Rizwan, A. M.; Dennis, L. Y. C.; Liu, C. A review on thegeneration, determination and mitigation of Urban Heat Island. J.Environ. Sci. 2008, 20 (1), 120−128.(13) Arnfield, A. J. Two decades of urban climate research: A reviewof turbulence, exchanges of energy and water, and the urban heatisland. Int. J. Climatol. 2003, 23 (1), 1−26.(14) Voogt, J. A.; Oke, T. R. Thermal remote sensing of urbanclimates. Remote Sens. Environ. 2003, 86 (3), 370−384.(15) Imhoff, M. L.; Zhang, P.; Wolfe, R. E.; Bounoua, L. Remotesensing of the urban heat island effect across biomes in the continentalUSA. Remote Sens. Environ. 2010, 114 (3), 504−513.(16) Wan, Z. New refinements and validation of the MODIS Land-Surface Temperature/Emissivity products. Remote Sens. Environ. 2008,112 (1), 59−74.(17) Hung, T.; Uchihama, D.; Ochi, S.; Yasuoka, Y. Assessment withsatellite data of the urban heat island effects in Asian mega cities. Int. J.Appl. Earth Obs. Geoinf. 2006, 8, 34−48.(18) Wang, K.; Wang, J.; Wang, P.; Sparrow, M.; Yang, J.; Chen, H.,Influences of urbanization on surface characteristics as derived fromthe Moderate-Resolution Imaging Spectroradiometer: A case study forthe Beijing metropolitan area. J. Geophys. Res. 2007, 112 (D22), doi:10.1029/2006jd007997.(19) United Nations, World Urbanization Prospects: The 2007Revision, 2008.(20) Available at: http://www.geonames.org (accessed August 10,2009).(21) Friedl, M. A.; McIver, D. K.; Hodges, J. C. F.; Zhang, X. Y.;Muchoney, D.; Strahler, A. H.; Woodcock, C. E.; Gopal, S.; Schneider,A.; Cooper, A.; Baccini, A.; Gao, F.; Schaaf, C. Global land covermapping from MODIS: algorithms and early results. Remote Sens.Environ. 2002, 83 (1−2), 287−302.(22) Hansen, M. C.; Defries, R. S.; Townshend, J. R. G.; Carroll, M.;Dimiceli, C.; Sohlberg, R. A. Global percent tree cover at a spatialresolution of 500 meters: First results of the MODIS vegetationcontinuous fields algorithm. Earth Interact. 2003, 7, 1−15.(23) Huete, A.; Didan, K.; Miura, T.; Rodriguez, E. P.; Gao, X.;Ferreira, L. G. Overview of the radiometric and biophysicalperformance of the MODIS vegetation indices. Remote Sens. Environ.2002, 83, 195−213.(24) Schaaf, C. B.; Gao, F.; Strahler, A. H.; Lucht, W.; Li, X. W.;Tsang, T.; Strugnell, N. C.; Zhang, X. Y.; Jin, Y. F.; Muller, J. P.; Lewis,P.; Barnsley, M.; Hobson, P.; Disney, M.; Roberts, G.; Dunderdle, M.;Doll, C.; d’Entremont, R. P.; Hu, B. X.; Liang, S. L.; Privette, J. L.; Roy,
Environmental Science & Technology Article
dx.doi.org/10.1021/es2030438 | Environ. Sci. Technol. 2012, 46, 696−703702

D. First operational BRDF, albedo nadir reflectance products fromMODIS. Remote Sens. Environ. 2002, 83, 135−148.(25) Mitchell, T. D.; Jones, P. D., An improved method ofconstructing a database of monthly climate observations andassociated high-resolution grids. Int. J. Climatol. 2005, 25, 693-712.Available at: http://badc.nerc.ac.uk/data/cru/ (accessed November 8,2007).(26) Center for International Earth Science Information Network(CIESIN). Gridded Population of the World, version 3 (GPWv3); 2010.Available at: http://sedac.ciesin.columbia.edu/gpw/ (accessed August10, 2009).(27) Doll, C. H.; Muller, J.-P.; Elvidge, C. D. Night-time Imagery as aTool for Global Mapping of Socioeconomic Parameters andGreenhouse Gas Emissions. AMBIO 2000, 29 (3), 157−162.(28) Elvidge, C. D.; Baugh, K. E.; Kihn, E. A.; Kroehl, H. W.; Davis,E. R.; Davis, C. W. Relation between satellite observed visible-nearinfrared emissions, population, economic activity and electric powerconsumption. Int. J. Remote Sens. 1997, 18 (6), 1373−1379.(29) Elvidge, C. D.; Erwin, E. H.; Baugh, K. E.; Ziskin, D.; Tuttle, B.T.; Ghosh, T.; Sutton, P. C. In Overview of DMSP nightime lights andfuture possibilities, Urban Remote Sensing Event, 2009 Joint, 20−22May 2009; pp 1−5.(30) Rozenfeld, H. D.; Rybski, D.; Andrade, J. S.; Batty, M.; Stanley,H. E.; Makse, H. A. Laws of population growth. Proc. Natl. Acad. Sci.2008, 105 (48), 18702−18707.(31) Ricker, W. E. Linear regressions in fisheries research. J. Fish. Res.Board Can. 1973, 30, 409−434.(32) Stabler, L. B.; Martin, C. A.; Brazel, A. J. Microclimates in adesert city were related to land use and vegetation index. UrbanForestry Urban Greening 2005, 3 (3−4), 137−147.(33) Grimmond, C. S. B. The suburban energy balance:methodological considerations and results for a mid-latitude westcoast city under winter and spring conditions. Int. J. Clim. 1992, 12(5), 481−497.(34) Weng, Q. H.; Lu, D. S.; Schubring, J. Estimation of land surfacetemperature-vegetation abundance relationship for urban heat islandstudies. Remote Sens. Environ. 2004, 89 (4), 467−483.(35) Hu, Y.; Jia, G. Influence of land use change on urban heat islandderived from multi-sensor data. Int. J. Climatol. 2010, 30 (9), 1382−1395.(36) Taha, H. Urban climates and heat islands: Albedo,evapotranspiration, and anthropogenic heat. Energy Build. 1997, 25(2), 99−103.(37) Sailor, D. J. A review of methods for estimating anthropogenicheat and moisture emissions in the urban environment. Int. J. Climatol.2011, 31 (2), 189−199.(38) Rizwan, A. M.; Dennis, L. Y. C.; Liu, C. An investigation ofurban heat island intensity (UHII) as an indicator of urban heating.Atmos. Res. 2009, 94 (3), 491−500.(39) Wilby, R. L. Past and projected trends in London’s urban heatisland. Weather 2003, 58, 251−260.(40) Jin, M.; Dickinson, R. E. Land surface skin temperatureclimatology: benefitting from the strengths of satellite observations.Environ. Res. Lett. 2010, 5 (4), 044004.(41) Tomlinson, C. J.; Chapman, L.; Thornes, J. E.; Baker, C. J.Derivation of Birmingham’s summer surface urban heat island fromMODIS satellite images. Int. J. Climatol. 2010, DOI: 10.1002/joc.2261.(42) IPCC. Climate Change 2007: The Physical Science Basis;Cambridge Univ. Press: Cambridge, U.K., 2007.(43) McCarthy, M. P.; Best, M. J.; Betts, R. A. Climate change incities due to global warming and urban effects. Geophys. Res. Lett.2010, 37 (9), L09705.(44) Oleson, K. W.; Bonan, G. B.; Feddema, J.; Vertenstein, M. Anurban parameterization for a global climate model. Part II: Sensitivityto input parameters and the simulated urban heat island in offlineSimulations. J. Appl. Meteorol. Climatol. 2008, 47, 1061−1076.(45) Oleson, K. W.; Bonan, G. B.; Feddema, J. Effects of white roofson urban temperature in a global climate model. Geophys. Res. Lett.2010, 37, L03701.
Environmental Science & Technology Article
dx.doi.org/10.1021/es2030438 | Environ. Sci. Technol. 2012, 46, 696−703703