Embed Size (px)
Citation preview

1Tstho(
tsthtfFirfatgpmp
msot
sabsh[
1228 J. Opt. Soc. Am. B/Vol. 26, No. 6 /June 2009 Gadsdon et al.
Surface plasmon polaritons on deep,narrow-ridged rectangular gratings
M. R. Gadsdon,* I. R. Hooper, A. P. Hibbins, and J. R. Sambles
School of Physics, University of Exeter, Exeter, Devon, EX4 4QL, United Kingdom*Corresponding author: [email protected]
Received January 6, 2009; revised April 16, 2009; accepted April 17, 2009;posted April 27, 2009 (Doc. ID 105719); published May 19, 2009
The dispersion diagrams of surface plasmon polaritons have been calculated for rectangular gratings, withvery narrow wires, of varying depths. For gratings with a moderate height a family of vertical-standing-waveresonances may be excited, which consist of surface plasmons, oscillating on either vertical surface, couplingtogether through the metal wires. These modes evolve similarly to the manner in which shallow-gratingsurface-plasmon dispersion curves evolve into cavity modes in the grooves of the structure. However, on fur-ther increase in grating height these vertical standing waves evolve into a second resonant feature, which isindependent of yet further increases in height. This new mode is shown to be equivalent to the resonancesfound on infinite multilayer metal/dielectric structures illuminated at normal incidence. © 2009 Optical So-ciety of America
OCIS codes: 240.6680, 050.6624, 230.4170.
fpnli
ptccms
liwpmioPeecclPmifr
efsfi
. INTRODUCTIONhe primary differences between the electromagnetic re-ponse of a thick planar metal film and a thick metal filmhat has shallow periodic perturbations on its surfaceave long been understood as the emergence of diffractiverders and the excitation of surface plasmon polaritonsSPPs) [1–3].
It had been thought that SPPs could not be excited inhe subwavelength regime, where the periodicity of theurface relief perturbation (grating) is significantly lesshan the wavelength of the incident radiation. However, itas been shown that surface plasmons may be excited inhe zero-order region of the spectrum, as they evolve toorm cavity modes in the grooves of the structure [4–6].urther work has also examined the nature of these cav-
ty modes on gratings whose ridges are sufficiently nar-ow that the surface plasmon modes on each vertical sur-ace may also interact through the metal ridges, as well ascross the grooves [7,8]. These cavity modes are essen-ially the same as the TEM cavity mode in a singleroove, except that their evolution from normal surfacelasmon modes, due to the periodicity of the structure,eans that there are some subtle differences in their dis-
ersion curves from the well-known TEM mode.There has also been significant research into planarultilayered metal/dielectric stacks, where the transmis-
ion coefficient through such stacks may be several ordersf magnitude larger than that through a single layer ofhe metal film [9].
The spectral response of such structures comprises of aeries of bandpass regions, where transmissivity is highnd reflectivity low, separated by a series of photonicand gaps where the opposite is true. It has been demon-trated that, near either band edge, there is a large en-ancement of the field intensity due to localization effects10,11]. Near the high-frequency band edge of the lowest
0740-3224/09/061228-10/$15.00 © 2
requency bandpass region, the electromagnetic field isredominantly confined to the dielectric regions in a man-er similar to a stack of Fabry–Perot cavities, while at the
ow-frequency band edge, the fields are more concentratedn the metal regions [10,12,13].
Recently, we have explained the formation of the band-ass regions as being due to the matching of the tangen-ial electric and magnetic fields associated with standingavity modes in the dielectric, which may have either aos or a sin wave character, and evanescent standingodes in the metal, which may have either a cosh or a
inh distribution function [10].It was shown that the low-frequency band edge of the
owest-frequency bandpass region is formed by the match-ng of cosh fields in the metal layers and cos standingaves in the cavities, with adjacent cavities oscillating inhase. The high-frequency edge is then formed by theatching of sinh fields in the metal layers with cos stand-
ng waves in the dielectric layers, with adjacent cavitiesscillating out of phase—much like a series of Fabry–erot cavities. The boundary conditions imposed by thevanescent standing modes may significantly modify theffective cavity length that the standing waves in theavities experience. The sinh fields result in an effectiveavity length that is very similar to the physical cavityength, such that the stack behaves as a series of Fabry–erot cavities. The cosh standing waves are able to give auch larger effective cavity length than the physical cav-
ty thickness, this significantly redshifts the low-requency edge of the normal single-cavity Fabry–Perotesonance, thereby opening up a large bandpass region.
The next bandpass region is formed in the same way,xcept that the fields inside the cavities have a sin waveunction. Subsequent bandpass regions are then the re-ult of cavity harmonics matching to either cosh or sinhelds in the metal layers. Of course, this is only exactly
009 Optical Society of America
tiloswfi
scvtrvmd
2AoFipriwtespstttm
uom
atapig
ctvvfa
ubtltg
ccaapt(tsmtmt
m=nticaAvtHsilasn
3Igb
Gadsdon et al. Vol. 26, No. 6 /June 2009/J. Opt. Soc. Am. B 1229
rue for structures with an infinite number of layers, as its only then that the fields inside the metal and dielectricayers can form profiles with exactly cosh or sinh, and cosr sin functions, respectively. In addition, it has beenhown that the multilayer structures also support SPPshen illuminated in an attenuated total reflection con-guration [14,15].The present work examines the electromagnetic re-
ponse of a surface relief grating, with a rectangularross-section profile, as the ridges of the grating are madeery thin and then made very high. It is shown that ver-ical standing waves, that are coupled across the metalidges rather than the grooves, exist when the ridges areery narrow. As the grating height is increased, theseodes evolve into the same modes that exist on metal/
ielectric multilayered stacks.
. THEORETICAL MODELll of the modelling in the present work utilizes the rig-rous coupled-wave analysis technique, also called theourier modal method [16]. In this technique the system
s split into three regions, as in Fig. 1. The permittivityrofile in the x-direction is approximated as a Floquet se-ies expansion. In each region, the electromagnetic waves described as the superposition of “upward” and “down-ard” waves in the y-direction. Each of these waves is
hen described as a Rayleigh expansion of eigenmodes,ach of which is also expanded according to the Floqueteries expansion associated with the approximation of theermittivity profile. Maxwell’s equations are explicityolved in each region according to the description above ofhe electromagnetic fields. The resultant solutions arehen used to match the electromagnetic boundary condi-ions, at the interface between each region, using the nu-erically stable scattering matrix [17].Figure 1 gives a schematic representation of the model
sed in this work. Region 2 is the grating layer consistingf silver and air with grating height h, period d, andark-to-space ratio f. Region 1, the incidence medium is
Fig. 1. Schematic representation of the theoretical model.
ir, and region 3 is silver such that the structure is a con-inuous surface relief grating. The incident radiation k ist an angle � to the interface, normal with the incidentlane containing the grating vector. It is linearly polar-zed with the E-field perpendicular to the long axis of therating wires, TM (in the plane of incidence).
A practical determination of the convergence of theode can be specified by the absolute difference betweenhe approximate and exact (very high truncation order M)alues. Thus the code can be determined to have con-erged once the difference between the values obtainedor M and M+1 are lower than an arbitrary value, chosens
��M+1 − �M�
��M+1�� 0.001. �1�
The difference between the exact and approximate val-es will be different for every single point of a given plotecause it will be dependent not only on the geometry ofhe structure, but also on the permittivity and wave-ength. Evidently then, a different truncation order inves-igation will be required for every point to ensure conver-ence has been achieved.
Of course, it would be very inefficient to establish theseriteria for every single point of every single plot. Theompromise, for the sake of practicability, is to implementlow-resolution plot over the parameter space of interest,t a moderate truncation order, which will reveal the ap-roximate location of the resonance(s) of interest. Then,he convergence criteria are determined, according to Eq.1), for the maxima or minima of the resonance(s). Finally,he full resolution plot is calculated for the parameterpace using a truncation order at least as high as theinimum that is required according to the previously de-
ermined convergence criteria. This process was imple-ented for every plot given in the present work, and it
ypically resulted in truncation orders M�80.The permittivity of silver is specified by the Drudeodel, using the parameters �p=1.32�1016 s−1 and �D1.45�10−14 s, taken from Nash and Sambles [18]. Oneeeds to be aware that the permittivities in the case of ahin wire, as in region 2, may be different from those of annfinite film. It has been discussed elsewhere that thelassical macroscopic approach of electrical permittivity isdequate for particle dimensions as small as 2 nm [19].s a bulk metal is reduced in thickness towards thisalue, the mean free path of the electrons decreases ashe electron surface scattering becomes more important.owever, it has been shown that, for such silver wires as
tudied here, only the imaginary part of the permittivityncreases slightly [19]. Thus, it is the present authors’ be-ief that the underlying physics presented here is soundnd that the changes in permittivity will only result in alight broadening and reduction in magnitude of the reso-ances.
. RESULTSn order to examine the optical response of a rectangularrating with a large amplitude and very narrow wires, weegin with a grating with thick wires, which supports cav-

ilaitwt�rls
(wwmcwdcenbmrtifif
wf�Ft=
tsl
meoegamhcg
niat
Foerrrs
FFf
1230 J. Opt. Soc. Am. B/Vol. 26, No. 6 /June 2009 Gadsdon et al.
ty modes and then vary the width of the wires. This evo-ution is shown in Fig. 2, where the reflection efficiency ofgrating of height h=350 nm and period d=200 nm, that
s illuminated at �=4.89°, is presented, while the mark-o-space ratio is varied in the range 0.05� f�0.95. Theavelength range is 370 nm��850 nm, which equates
o a frequency range of 2.22�1015 rad·s−1���5.11015 rad·s−1. The slight dotted effect is due to a lower
esolution for f and d than for �. Note that the dottedines indicate the location of the subsequent field plotshown in Figs. 3 and 5.
At the high f values of Fig. 2 there is a family of modesincluding the lowest-frequency mode for 0.5� f�0.9),hich increase in frequency as f reduces, that is as theires narrow and the grooves broaden. This family ofodes exists even for optically thick wires; therefore, they
annot be a family of surface plasmons coupled across theires. For cavity modes in a single groove in a perfect con-uctor, it has been shown that end effects lead to a de-rease in frequency as the groove is broadened [20]. How-ver, it has been discussed elsewhere [21] that, for veryarrow grooves in a finite conductor, as the groove isroadened there is an increase in frequency of the cavityode due to the finite conductivity, and that in the optical
egime, this effect dominates [22]. It is therefore expectedhat cavity modes, on the structure presented here, willncrease in frequency as the grooves are broadened, andurthermore, that the resonance will broaden and dimin-sh. This is clearly the case for the family of modes at highvalues, identifying these as a family of cavity modes.To confirm this hypothesis, the �Hz�-fields associated
ith the two lowest frequency resonances observable at=0.93 are presented in Fig. 3. Figure 3(a) gives theHz�-fields for the higher-frequency reflection minimum inig. 2 at f=0.93 and �=3.77�1015 rad·s−1; Fig. 3(b) gives
he �Hz�-fields for the lowest reflection minimum at f0.93 and �=2.90�1015 rad·s−1. The black line indicates
fx
ω(1
015ra
d.s
−1)
(λ(n
m))
2.22
(850)
3.66
(515)
5.1
(370)
0.05 0.5 0.95
3.77
2.9
4.71
4.24
0.0
0.5
1.0
ig. 2. Reflection efficiency response of the grating as a functionf both the incident frequency and f. The fixed grating param-ters are d=200 nm, h=350 nm, and �=4.89°. The wavelengthange is 370 nm��850 nm, which equates to a frequencyange of 2.22�1015 rad·s−1���5.1�1015 rad·s−1. f is in theange 0.05� f�0.95. The dotted lines indicate the location of theubsequent field plots (Figs. 3 and 5).
he location of the surface of the grating. Note that thecales are different and that the lower-order mode has aarger maximum field enhancement.
Clearly, the two reflection minima are adjacent har-onics of the fundamental cavity mode resonance that
xists in the grooves of the structure when the wires areptically thick and the grooves are narrow. Furthermore,xamining the dependence of this family of modes on therating height, and examining their dispersion diagramss the height is varied, shows that they evolve from nor-al surface plasmon modes and, subsequently, they be-ave in exactly the same way as the cavity modes dis-ussed in a similar investigation into surface reliefratings with a Gaussian cross-section [6].
Returning to Fig. 2, we now consider the family of reso-ances that occur for low values of f and which decrease
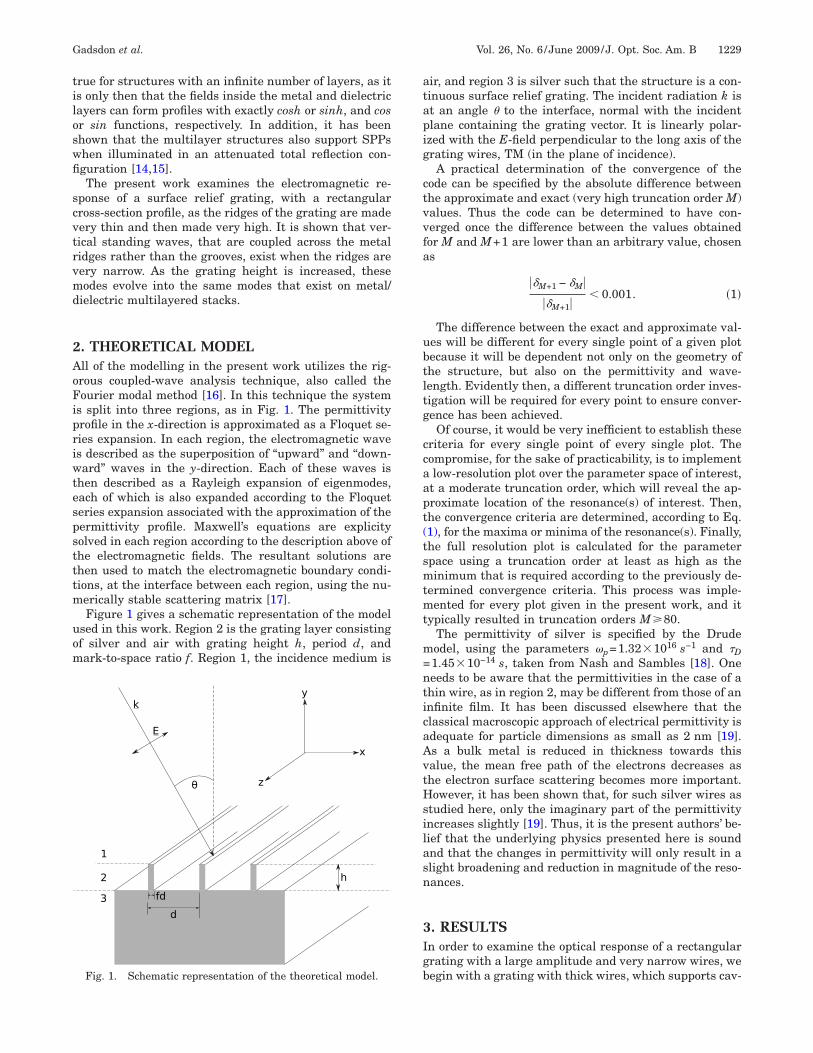
n frequency as the wires are narrowed (and the groovesre broadened). Figure 4 presents a similar investigationo that given in Fig. 2, except that the period is allowed to
x (nm)
y(n
m)
−226
0
226
−100 0 100
x (nm)
y(n
m)
−226
0
226
−100 0 100
0
5.3
10.6
0
3.6
7.3
(a)
(b)
ig. 3. �Hz� for the two lowest-frequency reflection minima inig. 2 for f=0.93. The black line indicates the location of the sur-
ace of the grating.
v−1
wiTec
nf�l�stpm
mtcftIvfcwgdo
pnima
qpcimtma
iocto
FoiTt
Fmb
Gadsdon et al. Vol. 26, No. 6 /June 2009/J. Opt. Soc. Am. B 1231
ary such that the groove width is held constant, at �1f�d=166 nm, as the wire width is varied in the rangenm� fd�50 nm.When the wire width is varied for a constant groove
idth, the family of resonances behaves in an almostdentical way to when the groove width is allowed to vary.his indicates that the groove width has little or no influ-nce on the resonance, and hence, the resonance is not aavity mode.
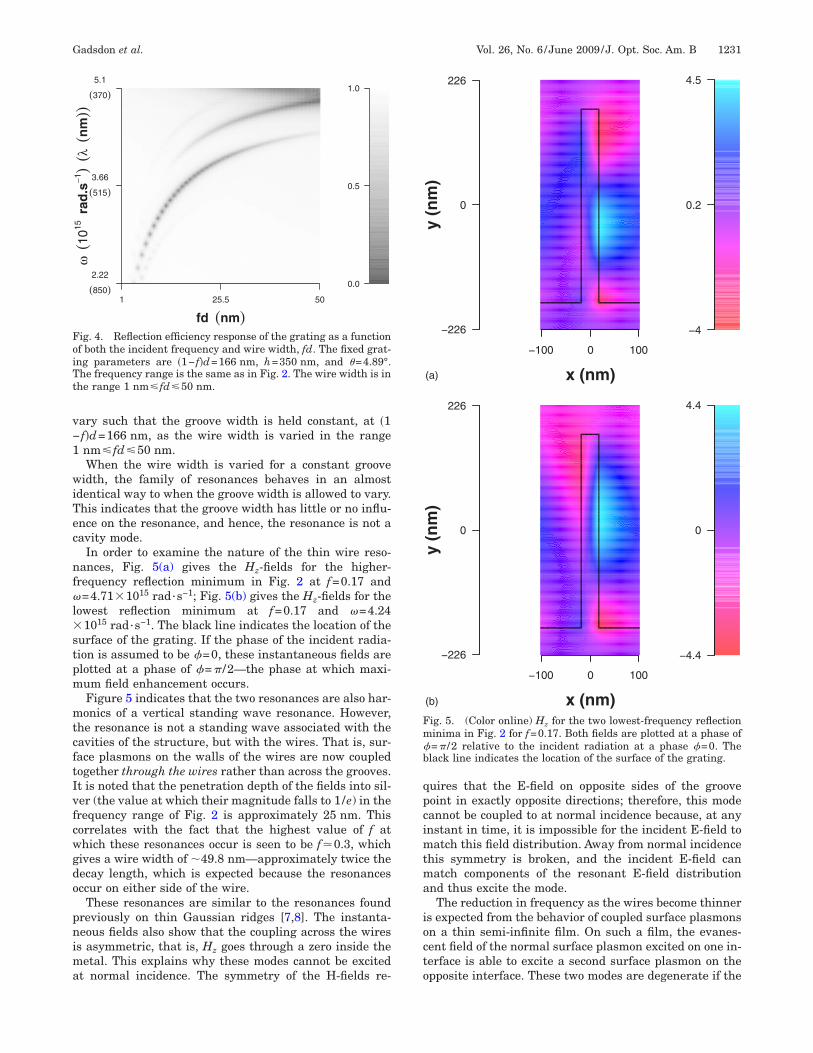
In order to examine the nature of the thin wire reso-ances, Fig. 5(a) gives the Hz-fields for the higher-
requency reflection minimum in Fig. 2 at f=0.17 and=4.71�1015 rad·s−1; Fig. 5(b) gives the Hz-fields for the
owest reflection minimum at f=0.17 and �=4.241015 rad·s−1. The black line indicates the location of the
urface of the grating. If the phase of the incident radia-ion is assumed to be =0, these instantaneous fields arelotted at a phase of =� /2—the phase at which maxi-um field enhancement occurs.Figure 5 indicates that the two resonances are also har-onics of a vertical standing wave resonance. However,
he resonance is not a standing wave associated with theavities of the structure, but with the wires. That is, sur-ace plasmons on the walls of the wires are now coupledogether through the wires rather than across the grooves.t is noted that the penetration depth of the fields into sil-er (the value at which their magnitude falls to 1/e) in therequency range of Fig. 2 is approximately 25 nm. Thisorrelates with the fact that the highest value of f athich these resonances occur is seen to be f�0.3, whichives a wire width of �49.8 nm—approximately twice theecay length, which is expected because the resonancesccur on either side of the wire.
These resonances are similar to the resonances foundreviously on thin Gaussian ridges [7,8]. The instanta-eous fields also show that the coupling across the wires
s asymmetric, that is, Hz goes through a zero inside theetal. This explains why these modes cannot be excited
t normal incidence. The symmetry of the H-fields re-
fd (nm)
ω(1
015ra
d.s
−1)
(λ(n
m))
2.22
(850)
3.66
(515)
5.1
(370)
1 25.5 50
0.0
0.5
1.0
ig. 4. Reflection efficiency response of the grating as a functionf both the incident frequency and wire width, fd. The fixed grat-ng parameters are �1− f�d=166 nm, h=350 nm, and �=4.89°.he frequency range is the same as in Fig. 2. The wire width is in
he range 1 nm� fd�50 nm.
uires that the E-field on opposite sides of the grooveoint in exactly opposite directions; therefore, this modeannot be coupled to at normal incidence because, at anynstant in time, it is impossible for the incident E-field to
atch this field distribution. Away from normal incidencehis symmetry is broken, and the incident E-field canatch components of the resonant E-field distribution
nd thus excite the mode.The reduction in frequency as the wires become thinner
s expected from the behavior of coupled surface plasmonsn a thin semi-infinite film. On such a film, the evanes-ent field of the normal surface plasmon excited on one in-erface is able to excite a second surface plasmon on thepposite interface. These two modes are degenerate if the
x (nm)
y(n
m)
−226
0
226
−100 0 100
x (nm)
y(n
m)
−226
0
226
−100 0 100
−4
0.2
4.5
−4.4
0
4.4
(a)
(b)
ig. 5. (Color online) Hz for the two lowest-frequency reflectioninima in Fig. 2 for f=0.17. Both fields are plotted at a phase of=� /2 relative to the incident radiation at a phase =0. Thelack line indicates the location of the surface of the grating.
ascffTrfTitcitcwr
iwtatboi
vdhfpsWodin
tfiwheaqhapdiapriff
tpawhsgmfi
isdfvptnacgtmbpfsmatafl
nigdgwcHte
Fog=i
1232 J. Opt. Soc. Am. B/Vol. 26, No. 6 /June 2009 Gadsdon et al.
djacent dielectrics are the same. As they become moretrongly coupled, the normal surface plasmon dispersionurve undergoes a splitting into a high- and a low-requency branch, each of which increase and decrease inrequency, respectively, as the film is made thinner [23].he high-frequency branch is associated with a symmet-ic distribution of Hz across the film, while the low-requency branch has an asymmetric distribution [24].he fraction of the fields of the symmetric mode that exist
nside the metal, where absorption dominates, reduces ashe film is made thinner; therefore, absorption losses de-rease and the resonances’ propagation lengthncreases—the long-range, coupled SPP. The opposite isrue for the asymmetric resonance—the short-range,oupled SPP [25]. Therefore, as the coupling across theires is asymmetric, it is expected that the resonance will
edshift in frequency as the wire becomes thinner.This analysis also corroborates the discussed increase
n frequency of the cavity mode resonance as the groove isidened. Surface plasmons coupled across a dielectric be-
ween two metals behave in the opposite sense to the situ-tion described above. It is well known for cavity modeshat the coupling is symmetric across the gap; therefore,ecause the symmetric/asymmetric modes behave in thepposite sense, it is expected that the mode will increasen frequency as the groove is broadened.
The nature of the low f standing waves may now be in-estigated further. We first examine the spectral depen-ence of these modes on grating height to ascertain if theyave the 1/h frequency response that would be expectedor vertical standing waves, while taking into account theossibility of dispersion curve anticrossing that has beenhown to arise for cavity resonances on deep gratings [6].e then proceed with a similar investigation as carried
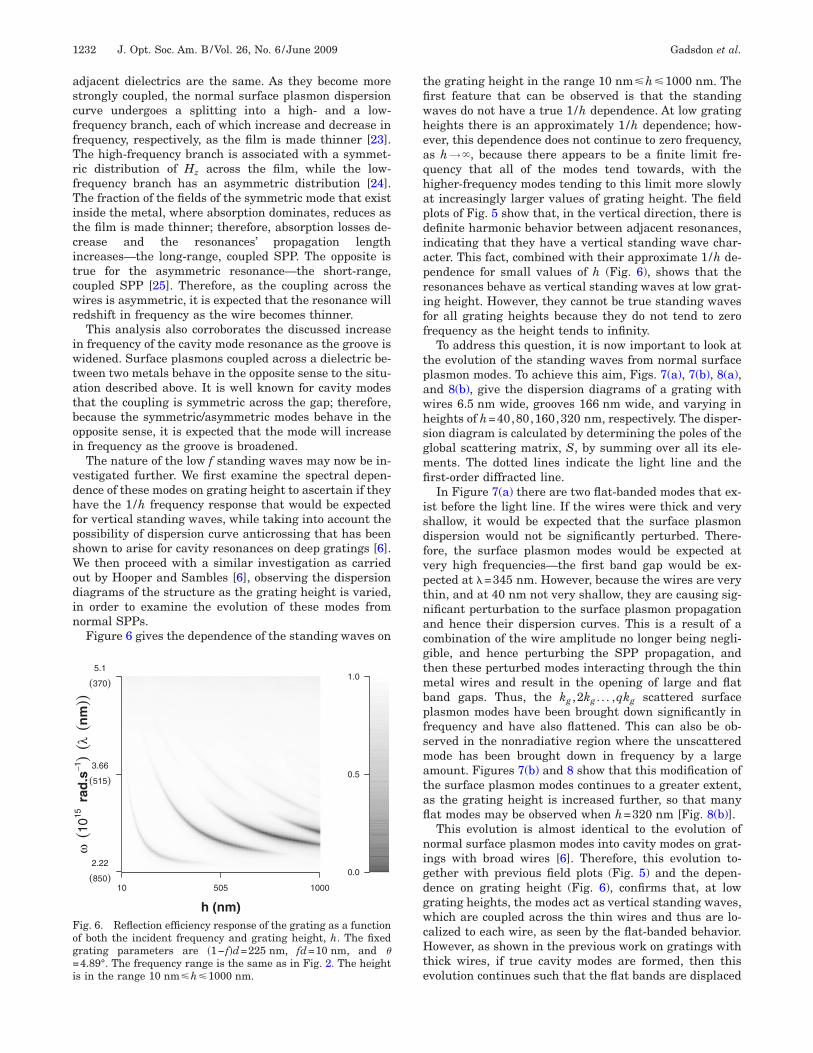
ut by Hooper and Sambles [6], observing the dispersioniagrams of the structure as the grating height is varied,n order to examine the evolution of these modes fromormal SPPs.Figure 6 gives the dependence of the standing waves on
h (nm)
ω(1
015ra
d.s
−1)
(λ(n
m))
2.22
(850)
3.66
(515)
5.1
(370)
10 505 1000
0.0
0.5
1.0
ig. 6. Reflection efficiency response of the grating as a functionf both the incident frequency and grating height, h. The fixedrating parameters are �1− f�d=225 nm, fd=10 nm, and �4.89°. The frequency range is the same as in Fig. 2. The height
s in the range 10 nm�h�1000 nm.
he grating height in the range 10 nm�h�1000 nm. Therst feature that can be observed is that the standingaves do not have a true 1/h dependence. At low gratingeights there is an approximately 1/h dependence; how-ver, this dependence does not continue to zero frequency,s h→�, because there appears to be a finite limit fre-uency that all of the modes tend towards, with theigher-frequency modes tending to this limit more slowlyt increasingly larger values of grating height. The fieldlots of Fig. 5 show that, in the vertical direction, there isefinite harmonic behavior between adjacent resonances,ndicating that they have a vertical standing wave char-cter. This fact, combined with their approximate 1/h de-endence for small values of h (Fig. 6), shows that theesonances behave as vertical standing waves at low grat-ng height. However, they cannot be true standing wavesor all grating heights because they do not tend to zerorequency as the height tends to infinity.
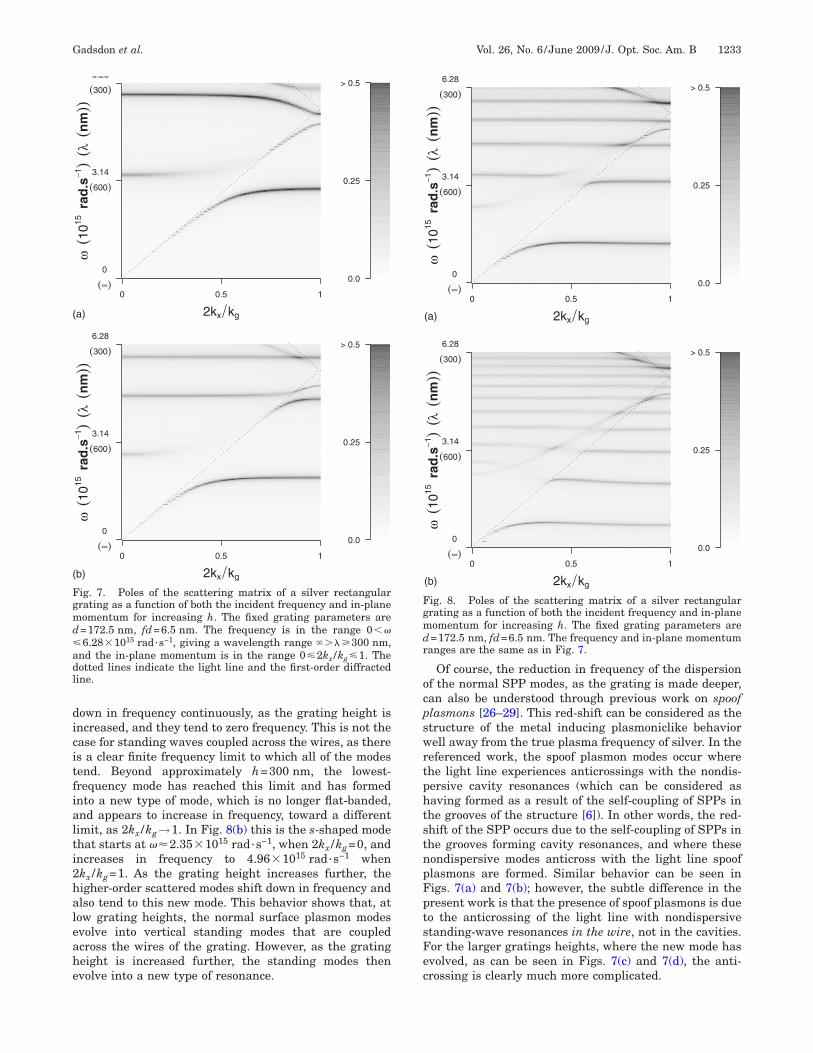
To address this question, it is now important to look athe evolution of the standing waves from normal surfacelasmon modes. To achieve this aim, Figs. 7(a), 7(b), 8(a),nd 8(b), give the dispersion diagrams of a grating withires 6.5 nm wide, grooves 166 nm wide, and varying ineights of h=40,80,160,320 nm, respectively. The disper-ion diagram is calculated by determining the poles of thelobal scattering matrix, S, by summing over all its ele-ents. The dotted lines indicate the light line and therst-order diffracted line.In Figure 7(a) there are two flat-banded modes that ex-
st before the light line. If the wires were thick and veryhallow, it would be expected that the surface plasmonispersion would not be significantly perturbed. There-ore, the surface plasmon modes would be expected atery high frequencies—the first band gap would be ex-ected at =345 nm. However, because the wires are veryhin, and at 40 nm not very shallow, they are causing sig-ificant perturbation to the surface plasmon propagationnd hence their dispersion curves. This is a result of aombination of the wire amplitude no longer being negli-ible, and hence perturbing the SPP propagation, andhen these perturbed modes interacting through the thinetal wires and result in the opening of large and flat
and gaps. Thus, the kg ,2kg . . . ,qkg scattered surfacelasmon modes have been brought down significantly inrequency and have also flattened. This can also be ob-erved in the nonradiative region where the unscatteredode has been brought down in frequency by a large
mount. Figures 7(b) and 8 show that this modification ofhe surface plasmon modes continues to a greater extent,s the grating height is increased further, so that manyat modes may be observed when h=320 nm [Fig. 8(b)].This evolution is almost identical to the evolution of
ormal surface plasmon modes into cavity modes on grat-ngs with broad wires [6]. Therefore, this evolution to-ether with previous field plots (Fig. 5) and the depen-ence on grating height (Fig. 6), confirms that, at lowrating heights, the modes act as vertical standing waves,hich are coupled across the thin wires and thus are lo-
alized to each wire, as seen by the flat-banded behavior.owever, as shown in the previous work on gratings with
hick wires, if true cavity modes are formed, then thisvolution continues such that the flat bands are displaced
dicitfialti2haleahe
ocpswrtphtstnpFptsFec
(
(
Fgmd�adl
Fgmdr
Gadsdon et al. Vol. 26, No. 6 /June 2009/J. Opt. Soc. Am. B 1233
own in frequency continuously, as the grating height isncreased, and they tend to zero frequency. This is not thease for standing waves coupled across the wires, as theres a clear finite frequency limit to which all of the modesend. Beyond approximately h=300 nm, the lowest-requency mode has reached this limit and has formednto a new type of mode, which is no longer flat-banded,nd appears to increase in frequency, toward a differentimit, as 2kx /kg→1. In Fig. 8(b) this is the s-shaped modehat starts at ��2.35�1015 rad·s−1, when 2kx /kg=0, andncreases in frequency to 4.96�1015 rad·s−1 whenkx /kg=1. As the grating height increases further, theigher-order scattered modes shift down in frequency andlso tend to this new mode. This behavior shows that, atow grating heights, the normal surface plasmon modesvolve into vertical standing modes that are coupledcross the wires of the grating. However, as the gratingeight is increased further, the standing modes thenvolve into a new type of resonance.
2kx kg
ω(1
015ra
d.s
−1)
(λ(n
m))
0
(∞)
3.14
(600)
6.28
(300)
0 0.5 1
0.0
0.25
> 0.5
2kx kg
ω(1
015ra
d.s
−1)
(λ(n
m))
0
(∞)
3.14
(600)
6.28
(300)
0 0.5 1
0.0
0.25
> 0.5
a)
b)
ig. 7. Poles of the scattering matrix of a silver rectangularrating as a function of both the incident frequency and in-planeomentum for increasing h. The fixed grating parameters are=172.5 nm, fd=6.5 nm. The frequency is in the range 0��6.28�1015 rad·s−1, giving a wavelength range � �300 nm,
nd the in-plane momentum is in the range 0�2kx /kg�1. Theotted lines indicate the light line and the first-order diffractedine.
Of course, the reduction in frequency of the dispersionf the normal SPP modes, as the grating is made deeper,an also be understood through previous work on spooflasmons [26–29]. This red-shift can be considered as thetructure of the metal inducing plasmoniclike behaviorell away from the true plasma frequency of silver. In the
eferenced work, the spoof plasmon modes occur wherehe light line experiences anticrossings with the nondis-ersive cavity resonances (which can be considered asaving formed as a result of the self-coupling of SPPs inhe grooves of the structure [6]). In other words, the red-hift of the SPP occurs due to the self-coupling of SPPs inhe grooves forming cavity resonances, and where theseondispersive modes anticross with the light line spooflasmons are formed. Similar behavior can be seen inigs. 7(a) and 7(b); however, the subtle difference in theresent work is that the presence of spoof plasmons is dueo the anticrossing of the light line with nondispersivetanding-wave resonances in the wire, not in the cavities.or the larger gratings heights, where the new mode hasvolved, as can be seen in Figs. 7(c) and 7(d), the anti-rossing is clearly much more complicated.
2kx kg
ω(1
015ra
d.s
−1)
(λ(n
m))
0
(∞)
3.14
(600)
6.28
(300)
0 0.5 1
0.0
0.25
> 0.5
2kx kg
ω(1
015ra
d.s
−1)
(λ(n
m))
0
(∞)
3.14
(600)
6.28
(300)
0 0.5 1
0.0
0.25
> 0.5
(a)
(b)
ig. 8. Poles of the scattering matrix of a silver rectangularrating as a function of both the incident frequency and in-planeomentum for increasing h. The fixed grating parameters are=172.5 nm, fd=6.5 nm. The frequency and in-plane momentumanges are the same as in Fig. 7.
ihmtostIblms[
ti1[pttttsdee
a
T�i
wlpbsspFdfltcsf
alvf�llspvlp
taptdiachmsh
sEhsscfvif
abtae
Ftslmi
1234 J. Opt. Soc. Am. B/Vol. 26, No. 6 /June 2009 Gadsdon et al.
This new resonance is independent of further increasesn grating height, this implies that, beyond a certaineight, the structure is effectively acting as a multilayeretal/dielectric structure with each layer being (effec-
ively) infinitely wide, and the whole structure consistingf an infinite number of layers at least to the lowest-ordertanding wave. The grating height must be increased fur-her to act this way for the higher-order standing waves.t is possible to investigate whether the grating is indeedehaving as an infinite multilayer structure, to theowest-order mode, by comparing the response of this
ode to the theory, which has recently been presented de-cribing the behavior of truly infinite multilayer stacks10].
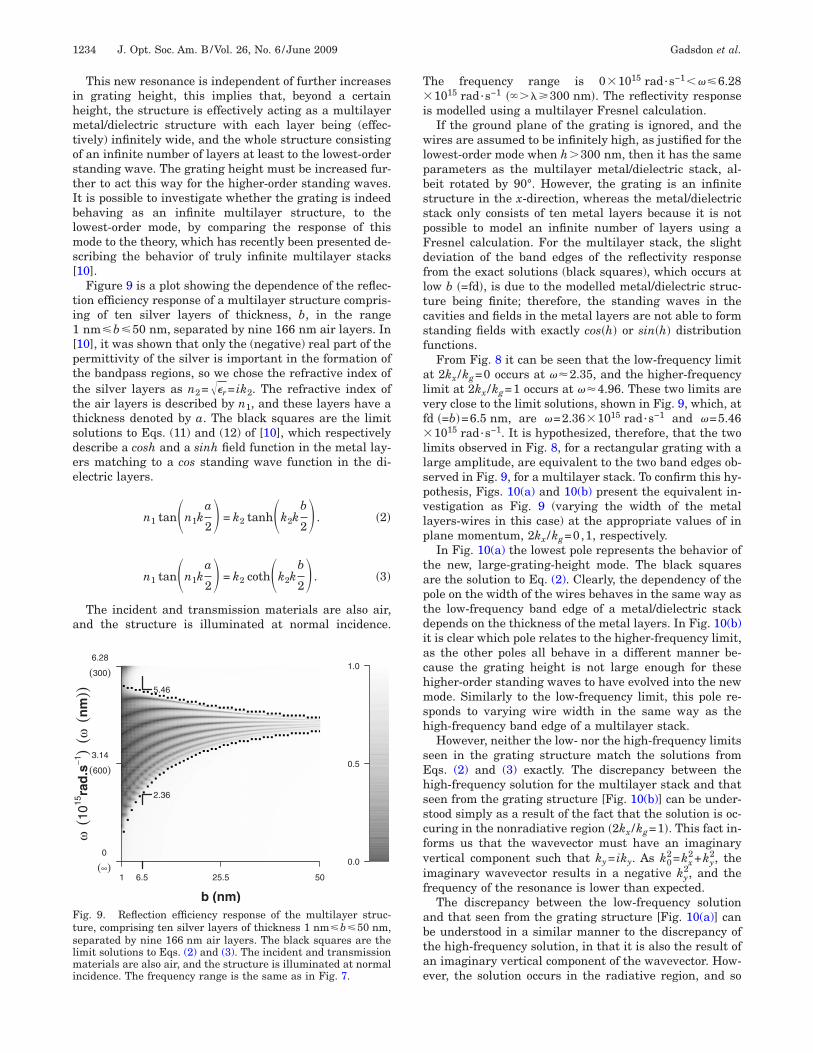
Figure 9 is a plot showing the dependence of the reflec-ion efficiency response of a multilayer structure compris-ng of ten silver layers of thickness, b, in the range
nm�b�50 nm, separated by nine 166 nm air layers. In10], it was shown that only the (negative) real part of theermittivity of the silver is important in the formation ofhe bandpass regions, so we chose the refractive index ofhe silver layers as n2=��r= ik2. The refractive index ofhe air layers is described by n1, and these layers have ahickness denoted by a. The black squares are the limitolutions to Eqs. (11) and (12) of [10], which respectivelyescribe a cosh and a sinh field function in the metal lay-rs matching to a cos standing wave function in the di-lectric layers.
n1 tan�n1ka
2 = k2 tanh�k2kb
2 . �2�
n1 tan�n1ka
2 = k2 coth�k2kb
2 . �3�
The incident and transmission materials are also air,nd the structure is illuminated at normal incidence.
b (nm)
ω(1
015ra
d.s
−1)
(ω(n
m))
0
(∞)
3.14
(600)
6.28
(300)
1 25.5 506.5
2.36
5.46
0.0
0.5
1.0
ig. 9. Reflection efficiency response of the multilayer struc-ure, comprising ten silver layers of thickness 1 nm�b�50 nm,eparated by nine 166 nm air layers. The black squares are theimit solutions to Eqs. (2) and (3). The incident and transmission
aterials are also air, and the structure is illuminated at normalncidence. The frequency range is the same as in Fig. 7.
he frequency range is 0�1015 rad·s−1���6.281015 rad·s−1 �� �300 nm�. The reflectivity response
s modelled using a multilayer Fresnel calculation.If the ground plane of the grating is ignored, and the
ires are assumed to be infinitely high, as justified for theowest-order mode when h 300 nm, then it has the samearameters as the multilayer metal/dielectric stack, al-eit rotated by 90°. However, the grating is an infinitetructure in the x-direction, whereas the metal/dielectrictack only consists of ten metal layers because it is notossible to model an infinite number of layers using aresnel calculation. For the multilayer stack, the slighteviation of the band edges of the reflectivity responserom the exact solutions (black squares), which occurs atow b �=fd�, is due to the modelled metal/dielectric struc-ure being finite; therefore, the standing waves in theavities and fields in the metal layers are not able to formtanding fields with exactly cos�h� or sin�h� distributionunctions.
From Fig. 8 it can be seen that the low-frequency limitt 2kx /kg=0 occurs at ��2.35, and the higher-frequencyimit at 2kx /kg=1 occurs at ��4.96. These two limits areery close to the limit solutions, shown in Fig. 9, which, atd �=b�=6.5 nm, are �=2.36�1015 rad·s−1 and �=5.46
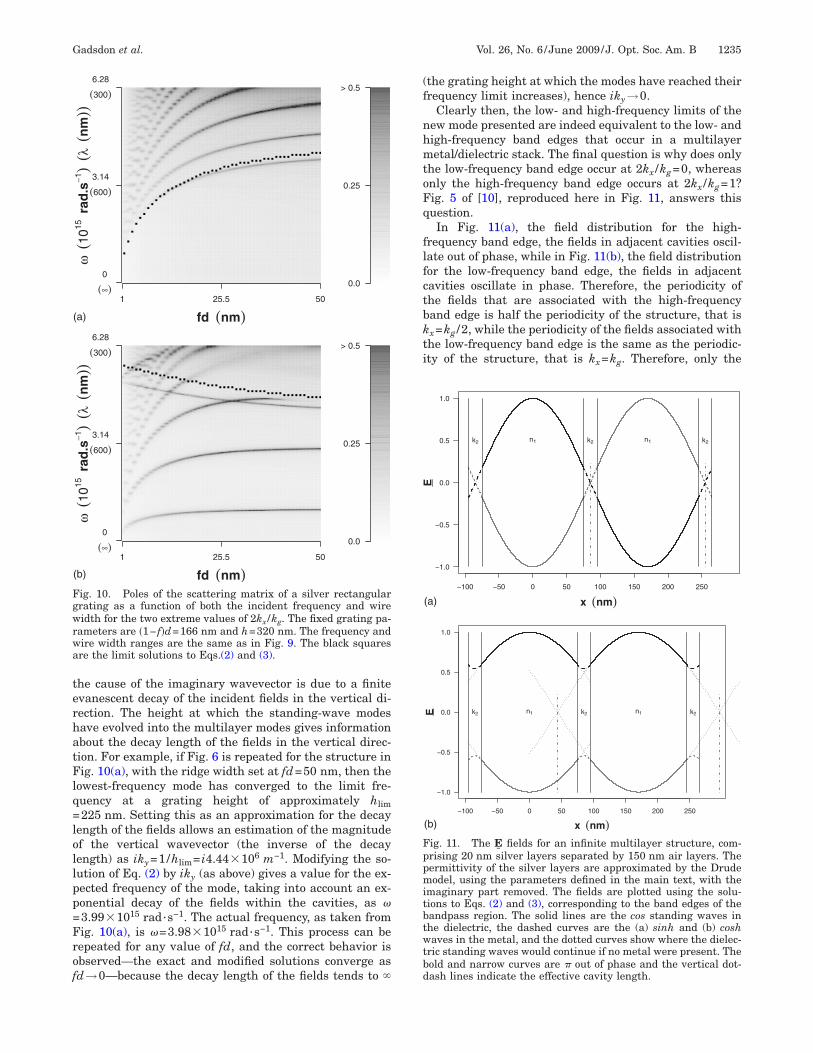
1015 rad·s−1. It is hypothesized, therefore, that the twoimits observed in Fig. 8, for a rectangular grating with aarge amplitude, are equivalent to the two band edges ob-erved in Fig. 9, for a multilayer stack. To confirm this hy-othesis, Figs. 10(a) and 10(b) present the equivalent in-estigation as Fig. 9 (varying the width of the metalayers-wires in this case) at the appropriate values of inlane momentum, 2kx /kg=0,1, respectively.In Fig. 10(a) the lowest pole represents the behavior of
he new, large-grating-height mode. The black squaresre the solution to Eq. (2). Clearly, the dependency of theole on the width of the wires behaves in the same way ashe low-frequency band edge of a metal/dielectric stackepends on the thickness of the metal layers. In Fig. 10(b)t is clear which pole relates to the higher-frequency limit,s the other poles all behave in a different manner be-ause the grating height is not large enough for theseigher-order standing waves to have evolved into the newode. Similarly to the low-frequency limit, this pole re-
ponds to varying wire width in the same way as theigh-frequency band edge of a multilayer stack.However, neither the low- nor the high-frequency limits
een in the grating structure match the solutions fromqs. (2) and (3) exactly. The discrepancy between theigh-frequency solution for the multilayer stack and thateen from the grating structure [Fig. 10(b)] can be under-tood simply as a result of the fact that the solution is oc-uring in the nonradiative region �2kx /kg=1�. This fact in-orms us that the wavevector must have an imaginaryertical component such that ky= iky. As k0
2=kx2+ky
2, themaginary wavevector results in a negative ky
2, and therequency of the resonance is lower than expected.
The discrepancy between the low-frequency solutionnd that seen from the grating structure [Fig. 10(a)] cane understood in a similar manner to the discrepancy ofhe high-frequency solution, in that it is also the result ofn imaginary vertical component of the wavevector. How-ver, the solution occurs in the radiative region, and so
terhatFlq=lollpp=Frof
(f
nhmtoFq
flfctbkti
Fgwrwa
Fppmitbtwtbd
Gadsdon et al. Vol. 26, No. 6 /June 2009/J. Opt. Soc. Am. B 1235
he cause of the imaginary wavevector is due to a finitevanescent decay of the incident fields in the vertical di-ection. The height at which the standing-wave modesave evolved into the multilayer modes gives informationbout the decay length of the fields in the vertical direc-ion. For example, if Fig. 6 is repeated for the structure inig. 10(a), with the ridge width set at fd=50 nm, then the
owest-frequency mode has converged to the limit fre-uency at a grating height of approximately hlim225 nm. Setting this as an approximation for the decay
ength of the fields allows an estimation of the magnitudef the vertical wavevector (the inverse of the decayength) as iky=1/hlim= i4.44�106 m−1. Modifying the so-ution of Eq. (2) by iky (as above) gives a value for the ex-ected frequency of the mode, taking into account an ex-onential decay of the fields within the cavities, as �3.99�1015 rad·s−1. The actual frequency, as taken fromig. 10(a), is �=3.98�1015 rad·s−1. This process can beepeated for any value of fd, and the correct behavior isbserved—the exact and modified solutions converge asd→0—because the decay length of the fields tends to �
fd (nm)
ω(1
015ra
d.s
−1)
(λ(n
m))
0
(∞)
3.14
(600)
6.28
(300)
1 25.5 50
0.0
0.25
> 0.5
fd (nm)
ω(1
015ra
d.s
−1)
(λ(n
m))
0
(∞)
3.14
(600)
6.28
(300)
1 25.5 50
0.0
0.25
> 0.5
(a)
(b)
ig. 10. Poles of the scattering matrix of a silver rectangularrating as a function of both the incident frequency and wireidth for the two extreme values of 2kx /kg. The fixed grating pa-
ameters are �1− f�d=166 nm and h=320 nm. The frequency andire width ranges are the same as in Fig. 9. The black squaresre the limit solutions to Eqs.(2) and (3).
the grating height at which the modes have reached theirrequency limit increases), hence iky→0.
Clearly then, the low- and high-frequency limits of theew mode presented are indeed equivalent to the low- andigh-frequency band edges that occur in a multilayeretal/dielectric stack. The final question is why does only
he low-frequency band edge occur at 2kx /kg=0, whereasnly the high-frequency band edge occurs at 2kx /kg=1?ig. 5 of [10], reproduced here in Fig. 11, answers thisuestion.In Fig. 11(a), the field distribution for the high-
requency band edge, the fields in adjacent cavities oscil-ate out of phase, while in Fig. 11(b), the field distributionor the low-frequency band edge, the fields in adjacentavities oscillate in phase. Therefore, the periodicity ofhe fields that are associated with the high-frequencyand edge is half the periodicity of the structure, that isx=kg /2, while the periodicity of the fields associated withhe low-frequency band edge is the same as the periodic-ty of the structure, that is kx=kg. Therefore, only the
−1.0
−0.5
0.0
0.5
1.0
x (nm)
E
−100 −50 0 50 100 150 200 250
k2 n1 k2 n1 k2
−1.0
−0.5
0.0
0.5
1.0
x (nm)
E
−100 −50 0 50 100 150 200 250
k2 n1 k2 n1 k2
(a)
(b)
ig. 11. The E� fields for an infinite multilayer structure, com-rising 20 nm silver layers separated by 150 nm air layers. Theermittivity of the silver layers are approximated by the Drudeodel, using the parameters defined in the main text, with the
maginary part removed. The fields are plotted using the solu-ions to Eqs. (2) and (3), corresponding to the band edges of theandpass region. The solid lines are the cos standing waves inhe dielectric, the dashed curves are the (a) sinh and (b) coshaves in the metal, and the dotted curves show where the dielec-
ric standing waves would continue if no metal were present. Theold and narrow curves are � out of phase and the vertical dot-ash lines indicate the effective cavity length.
hofo
4TfwcbrvihfcvbwsfaHtal
fttdmotcrtipfss
onwnIsnpstmnrtns
ATSr
R
1
1
1
1
1
1
1
1
1
1
1236 J. Opt. Soc. Am. B/Vol. 26, No. 6 /June 2009 Gadsdon et al.
igh-frequency edge may exist at 2kx /kg=1 and may onlyccur for grazing incidence as expected, while the low-requency band edge occurs for kx /kg=1 and thus can onlyccur at 2kx /kg=0 as a result of a kg scattering.
. CONCLUSIONShe electromagnetic response of silver, rectangular sur-
ace relief gratings with a large amplitude and narrowires has been explored. By analyzing the dispersion
urves of the system for varying grating heights, it haseen shown that at moderate grating heights a family ofesonance exists that has much the same character asertical standing waves in the grooves of the structure,.e., cavity modes. These well-known cavity resonancesave been shown to form from the deformation of the sur-
ace plasmon dispersion curve as the grating height is in-reased, due to self-coupling of surface plasmons on eitherertical surface across the dielectric in the groove. It haseen shown that the new family of modes presented here,hich occur when the wires are narrow, evolve in a very
imilar manner, except that they are standing wavesormed by the coupling of surface plasmons oscillatinglong the vertical surfaces, through the metal wires.owever, these new vertical standing waves cannot be
rue standing waves as they do not show 1/h behavior forll large h, because they tend to a finite low-frequencyimit as h→�.
It is shown that for very large h a second new mode isormed, which is independent of h, by further evolution ofhe vertical standing waves. By comparing the behavior ofhis new mode with that of infinite multilayer metal/ielectric structures, it is shown that this second newode is equivalent to the resonant states that may exist
n such a multilayer structure. Therefore, it is shown thathe severe modification of the surface plasmon dispersionurves, due to large grating heights and very thin wires,esults in the diffractive coupling to the same resonanceshat occur on multilayer structures illuminated at normalncidence. This allows the possibility of diffractive cou-ling to these multilayer resonances when there is an ef-ectively infinite number of layers—something not pos-ible in either theory or practice using planar multilayertructures.
This equivalence is not surprising, because the theoryf multilayer stacks states that it is the matching of eva-escent fields inside the metal layers, with standingaves in the dielectic layers, which determine the reso-ances the structure can support. It was mentioned in thentroduction that previous studies have also observedimilar bandpass regions on multilayer structures illumi-ated in an ATR configuration, thereby exciting surfacelasmons on the first interface that couple through thetructure [14,15]. The equivalence presented here, be-ween the resonances formed by simple illumination ofultilayer stacks and the surface plasmon resonances on
arrow wire (and large height) gratings, proves that theesonances formed on multilayer stacks illuminated inhe ATR configuration are also equivalent to the reso-ances formed by simple illumination of such multilayertacks.
CKNOWLEDGMENTShe authors acknowledge the Engineering and Physicalciences Research Council (EPSRC) and Sharp Laborato-ies Europe for their financial support.
EFERENCES1. R. W. Wood, “On a remarkable case of uneven distribution
of light in a diffraction grating spectrum,” Philos. Mag. 4,396–400 (1902).
2. U. Fano, “The theory of anomalous diffraction gratings andof quasi-stationary waves on metallic surfaces(Sommerfeld’s waves),” J. Opt. Soc. Am. 31, 213–222(1941).
3. H. Raether, Surface Plasmons on Smooth and RoughSurfaces (Springer-Verlag, 1988).
4. M. B. Sobnack, W. C. Tan, N. P. Wanstall, T. W. Preist, andJ. R. Sambles, “Stationary surface plasmons on a zero-order metal grating,” Phys. Rev. Lett. 80, 5667–5670(1998).
5. W.-C. Tan, T. W. Preist, J. R. Sambles, and N. P. Wanstall,“Flat surface-plasmon-polariton bands and resonant opticalabsorption on short-pitch metal gratings,” Phys. Rev. B 59,12661–12666 (1999).
6. I. R. Hooper and J. R. Sambles, “Dispersion of surfaceplasmon polaritons on short-pitch metal gratings,” Phys.Rev. B 65, 165432 (2002).
7. I. R. Hooper and J. R. Sambles, “Surface plasmonpolaritons on narrow-ridged short-pitch metal gratings,”Phys. Rev. B 66, 205408 (2002).
8. I. R. Hooper and J. R. Sambles, “Surface plasmonpolaritons on narrow-ridged short-pitch metal gratings inthe conical mount,” J. Opt. Soc. Am. A 20, 836–843 (2003).
9. M. Scalora, M. J. Bloemer, and C. M. Bowden, “Laminatedphotonic band structures with high conductivity and hightransparency: Metals under a new light,” Opt. PhotonicsNews 10, 23–27 (1998).
0. M. R. Gadsdon, J. Parsons, and J. R. Sambles,“Electromagnetic resonances of a multilayer metal-dielectric stack,” J. Opt. Soc. Am. B 26, 734–742 (2009).
1. J. M. Bendickson, J. P. Dowling, and M. Scalora, “Analyticexpressions for the electromagnetic mode density in finite,one-dimensional, photonic band-gap structures,” Phys. Rev.E 53, 4107–4121 (1996).
2. M. C. Larciprete, C. Sibilia, S. Paolini, and M. Bertolotti,“Accessing the optical limiting properties of metallo-dielectric photonic band gap structures,” J. Appl. Phys. 93,5013–5017 (2003).
3. M. Scalora, G. D’Aguanno, N. Mattiucci, M. J. Bloemer, D.de Ceglia, M. Centini, A. Mandatori, C. Sibilia, N. Akozbek,M. G. Cappeddu, M. Fowler, and J. W. Haus, “Negativerefraction and sub-wavelength focusing in the visible rangeusing transparent metallo-dielectric stacks,” Opt. Express15, 508–523 (2007).
4. A. Bichri, J. Lafait, and H. Welsch, “Visible and infraredoptical properties of Ag/SiO2 multilayers: radiative virtualmodes and coupling effects,” J. Phys.: Condens. Matter 5,7361–7374 (1993).
5. A. Bichri, J. Lafait, H. Welsch, and M. Abd-Lefdil,“Characterization of Berreman modes in metal/dielectricand multilayers,” J. Phys.: Condens. Matter 9, 6523–6532(1997).
6. M. G. Moharam, E. B. Grann, D. A. Pommet, and T. K.Gaylord, “Formulation for stable and efficientimplementation of the rigorous coupled-wave analysis ofbinary gratings,” J. Opt. Soc. Am. A 12, 1068–1076 (1995).
7. L. Li, “Formulation and comparison of two recursive matrixalgorithms for modeling layered diffraction gratings,” J.Opt. Soc. Am. A 13, 1024–1035 (1996).
8. D. Nash and J. R. Sambles, “Surface plasmon -polaritonstudy of the optical dielectric function of silver,” J. Mod.Opt. 43, 81–91 (1996).
9. J. P. Kottmann, O. J. F. Martin, D. R. Smith, and S.

2
2
2
2
2
2
2
2
2
2
Gadsdon et al. Vol. 26, No. 6 /June 2009/J. Opt. Soc. Am. B 1237
Schultz, “Plasmon resonances of silver nanowires with anonregular cross section,” Phys. Rev. B 64, 235402 (2001).
0. Y. Takakura, “Optical resonance in a narrow slit in a thickmetallic screen,” Phys. Rev. Lett. 86, 5601–5603 (2001).
1. J. R. Suckling, A. P. Hibbins, M. J. Lockyear, T. W. Preist,J. R. Sambles, and C. R. Lawrence, “Finite conductancegoverns the resonance transmission of thin metal slits atmicrowave frequencies,” Phys. Rev. Lett. 92, 147401 (2004).
2. M. R. Gadsdon, I. R. Hooper, and J. R. Sambles, “Opticalresonances on sub-wavelength silver lamellar gratings,”Opt. Express 16, 22003–22028 (2008).
3. E. N. Economou, “Surface plasmons in thin films,” Phys.Rev. 182, 539–554 (1969).
4. J. J. Burke, G. I. Stegeman, and T. Tamir, “Surface-polariton-like waves guided by thin, lossy metal films,”Phys. Rev. B 33, 5186–5201 (1986).
5. D. Sarid, “Long-range surface-plasma waves on very thinmetal films,” Phys. Rev. Lett. 47, 1927–1930 (1981).
6. J. B. Pendry, L. Martin-Moreno, and F. J. Garcia-Vidal,“Mimicking surface plasmons with structured surfaces,”Science 305, 847–848 (2004).
7. F. J. Garcia-Vidal, L. Martin-Moreno, and J. B. Pendry,“Surfaces with holes in them: new plasmonicmetamaterials,” J. Opt. A, Pure Appl. Opt. 7, S97–S101(2005).
8. A. P. Hibbins, E. Hendry, M. J. Lockyear, and J. R.Sambles, “Prism coupling to ’designer’ surface plasmons,”Opt. Express 16, 20441–20447 (2008).
9. M. J. Lockyear, A. P. Hibbins, and J. R. Sambles,“Microwave surface-plasmon-like modes on thinmetamaterials,” Phys. Rev. Lett. 102, 073901 (2009).