Embed Size (px)
Citation preview
Experimental Studies on Cr(VI) Removal from Wastewater by
Adsorption using Pig Iron Sludge and Biochar
THESIS
Submitted in partial fulfilment
of the requirements for the degree of
DOCTOR OF PHILOSOPHY
by
SURENDRAN.G.
Under the Supervision of
Prof. Saroj Sundar Baral
DEPARTMENT OF CHEMICAL ENGINEERING
BIRLA INSTITUTE OF TECHNOLOGY AND SCIENCE
PILANI (RAJASTHAN) INDIA
2016

i
Dedicated to
Shri Sadhguru Jaggi Vasudev (Isha Foundation)
and
Shirdi Saibaba
ii
Acknowledgement
I wish to record my sincere gratitude to Prof. Saroj Sundar Baral, my research supervisor,
for his role in shaping my thought process. His knowledge, keen interest, constant
encouragement, help, constructive criticism, endless patience and unstinting
encouragement have contributed greatly to making this doctoral study a successful and
enjoyable journey. I record my sincere gratitude to Prof. Srinivas Krishnaswamy & Prof.
S.D. Manjare for their constant encouragement and advice as DAC members during the
thesis work. Special thanks to Prof. Saibal Ganguly, Head, Department of Chemical
Engineering, BITS Pilani- K. K. Birla Goa Campus for his encouragement and for
sharing with me thoughts on matters beyond my imagination. I record my sincere
gratitude to Prof. P. K. Das, Associate Dean, Academic Research Division, BITS Pilani-
K. K. Birla Goa Campus, for helping in all administrative support during the research.
I wish to offer my sincere thanks to Prof.G.Raghurama, Director, BITS Pilani- K. K.
Birla Goa Campus, for his constant encouragement and support. I am grateful to Prof.
Souvik Bhatacharya, Vice Chancellor, BITS Pilani, for granting me an opportunity to
conduct research at this renowned institute and also for assuring the availability of
necessary infrastructure and facilities to carry out my work. The role of my department
colleagues in cheering me on and helping me face life with equanimity can never be
overstated. All of them have provided more than their share of emotional support.
My wife has been instrumental in motivating me from time to time. I am indebted to her
for giving me a happy and joyous environment at home and for her silent sacrifices. I
would forever be indebted to my parents, my brother and my uncle (S. Muthuvinayagam)
for their constant love, confidence, prayers, strong support and good wishes. I owe it all
to them.
Surendran G.
iii
Abstract
The present study explores the use of easily available natural and industrial adsorbents
for the treatment of Cr(VI) contaminated wastewater. In the initial part of the study,
Cr(VI) adsorption studies have been carried out using two representative bio-sorbent viz
Sorghastrum Nutans L. Nash and Cocos Nucifera. The effect of various parameters such
as initial pH of adsorbate solution, initial concentration of Cr(VI), dosage, time and
particle size has been studied. The adsorbent Sorghastrum Nutans L. Nash was
characterized before and after adsorption using FTIR, SEM, EDAX, and XRD analysis.
Among different functional groups present in the adsorbent, OH bending, CN
stretching/bending and NH stretching plays a major role in Cr(VI) adsorption. Batch
experiments shows that adsorption coupled reduction i.e. indirect reduction is the
mechanism of Cr(VI) removal by the biomaterial. Adsorbent surface became highly
positively charged at lower pH, adsorption rate of Cr(VI) is faster and reduction reaction
also accelerates at lower pH since, the binding of negatively charged Cr(VI) ion species
to the cationic groups is enhanced and protons take part in this reaction.
In case of Sorghastrum Nutans L. Nash, it was observed that the adsorption capacity was
high at pH 1 whereas, the adsorption capacity was very low at higher pH. In case of
Cocos Nucifera, the adsorption capacity was significantly high at higher pH as compared
to Sorghastrum Nutans L. Nash. However, in both the cases, the effluent pH was highly
acidic and hence required further neutralization steps which may not be economical.
Further, these adsorbents in their present form cannot be regenerated or recycled for
industrial use. In addition, the water-soluble compounds present in the bio-sorbents can
leach-out to the effluent which may create further environmental problem.
To overcome the above problem, pig iron sludge is explored as an adsorbent for the
treatment of Cr(VI) contaminated wastewater. From the batch adsorption experiments it
was observed that, the uptake capacity of the adsorbent was low as compared to the bio-
sorbent. Whereas, the effluent pH in case of using pig iron sludge was higher compared
to the bio-sorbents. Further, this adsorbent in its present form can be recycled to
ferrochrome manufacturing process.
iv
Since the uptake capacity of the pig iron sludge is very less, biochar prepared from
Sorghastrum Nutans L. Nash was used as an adsorbent. It was observed that the
adsorption capacity of biochar is higher than other three adsorbents at higher solution pH.
In addition, the effluent pH is also higher than the other three cases and the Cr(VI)
adsorbed biochar can be recycled as a raw material to ferrochrome or steel manufacturing
industry. In this study, a process flow sheet for ferrochrome industry is proposed showing
the possible location of using the biochar. Adsorption kinetics, isotherms and rate
limiting steps have been established for all the adsorbents used in this study. From the
study, it was found that, adsorption process followed pseudo 2nd order kinetics and
Langmuir adsorption isotherm and surface diffusion is the rate limiting step.
To optimize the operating conditions, a full factorial design of experiment was used
within pH, adsorbent dosage, adsorbate concentration and contact time as the
independent variable and percentage of adsorption as the response variable. Empirical
model was developed using factorial design of experiment and use of different tools like
MINITAB, MATLAB and LabVIEW to simulate or analyze the empirical model. From
the normal probability, residual, contour, 3D surface, main effect and interaction plot
along with t test, ANOVA and F-test, it is observed that initial solution pH has the most
significant effect on the percentage removal followed by adsorbent dosage, time and
adsorbate concentration. The interaction effects of independent variables are evaluated
and found to be significant.
There is a requirement of easy, organized and rational methods to choose an adsorbent
among the large options available by considering all possible factors and their interaction.
In this study, fuzzy logic method is used for selection of a suitable adsorbent for the
Cr(VI) removal. Multiple attribute decision making (MADM) is used to determine the
corresponding weighting values for the selected adsorbent. The preference index is
calculated by using the subjective and objective weights. The normalized value
associated with each parameter has given on the basis of effect of each parameter on the
Cr(VI) removal and uptake capacity of each material. The associated MADM method
results and the limitations of the approaches are discussed to lay the foundation for
further improvement.
v
Table of Contents
Acknowledgement ii
Abstract iii
Table of contents v
List of figures x
List of tables xii
Chapter 1: Introduction and Literature Review 1-13
1.1 Introduction 2
1.2 Redox Reaction of Chromium 2 `
1.3 Importance of harmful effects 3
1.4 Sources of Chromium(VI) in Wastewater 3
1.5 Chromium (VI) contaminated wastewater Treatment Technologies 5
1.5.1 Chemical precipitation 5
1.5.2 Chemical Reduction 7
1.5.3 Photo catalysis 7
1.5.4 Membrane Filtration 7
1.5.5 Electro-dialysis 8
1.5.6 Biopolymer 8
1.5.7 Adsorption and Bio-adsorption 9
1.5.8 Mechanism of bio-sorption 10
1.5.9 Adsorption of chromium (VI) by industrial waste 10
1.6 Conclusion 10
Chapter 2: Bio-sorption of Cr(VI) from wastewater using Sorghastrum Nutans L.
Nash
14-39
2.1 Materials 15
2.2 Methods 15
2.3 Results and Discussion 16
vi
2.3.1. Characterizations 16
2.3.2 Effect of Contact time on Cr(VI) adsorption 17
2.3.3 Effects of pH on Cr(VI) adsorption 18
2.3.4 Effect of Adsorbent dose 20
2.3.5 Effects of Initial adsorbate concentration 20
2.3.6 Effects of particle size on Cr(VI) adsorption 21
2.4 Kinetic of adsorption 21
2.4.1. Lagergren’ spseudo first-ordermodel 22
2.4.2. Ritchie’s second order model 22
2.4.3. First Order Reversible model 23
2.4.4. Pseudo second order model 23
2.5. Rate controlling mechanism 24
2.6. Equilibrium Adsorption Isotherm 25
2.6.1. Freundlich isotherm model 25
2.6.2. Langmuir isotherm model 26
2.6.3. Temkin Isotherm 26
2.7. Conclusions 27
Chapter 3: Removal of Cr(VI) from wastewater using Cocos Nucifera 40-51
3.1 Introduction 41
3.2 Materials 41
3.3 Methods 41
3.4 Results and Discussion 42
3.4.1 Effect of Contact time 42
3.4.2 Effect of pH 42
3.4.3 Effect of dose 43
3.4.4 Effect of Particle size 43
3.4.5 Effect of Initial Cr(VI) concentration 43
3.4.6 Kinetic Model 44
3.4.7 Equilibrium Adsorption Isotherm 44
vii
3.4.8 Rate controlling mechanism 45
3.5 Conclusion 45
Chapter 4: Removal of Cr(VI) from wastewater using pig iron sludge 52-68
4.1 Introduction 53
4.2 Materials 55
4.3 Methods 55
4.4 Results and discussion 55
4.4.1 Characterization: SEM image and EDAX analysis 55
4.4.2 Effect of Contact time and pH 56
4.4.3 Effect of Dose 57
4.4.4 Effect of Initial Concentration 57
4.4.5 Kinetics of adsorption 57
4.4.6 Rate controlling mechanism 58
4.4.7 Equilibrium Adsorption Isotherm 58
4.5 Conclusion 58
Chapter 5: Removal of Cr(VI) from wastewater using Carbonized Grass
69-84
5.1 Introduction 70
5.2 Manufacturing Process of Ferrochrome 71
5.3 Materials and Methods 71
5.4 Result and Discussion 72
5.4.1 Effect of Contact time 72
5.4.2 Effect of Initial pH of Solution 72
5.4.3 Effect of Adsorbent Dose 73
5.4.4 Effect of Initial Cr(VI) concentration 73
5.5 Kinetic Model 74
5.6 Equilibrium Adsorption Isotherm 74
5.7 Rate controlling mechanism 75
5.8 Comparison among adsorbents 75
5.9 Conclusion 76
viii
Chapter 6: Optimizing adsorption parameters using statistical design of
experiments
85-114
6.1 Factorial design of experiments 86
6.2 Design of experiment for the treatment of Cr(VI) contaminated water using
Sorghastrum Nutans L. Nash 88
6.2.1 Students‘t’ test for signifying the coefficient and Fisher’s adequacy test
90
6.2.2 Regression Analysis 90
6.2.3 Normal Probability plot of residuals 91
6.2.4 Residual graph 91
6.2.5 Main and interaction effects 92
6.2.6 Contour plot and 3D Surface plot 92
6.3 Modeling and simulation for the adsorptive removal of Cr(VI) from aqueous
solution
93
6.3.1 Development of mathematical model 93
6.3.2. Simulation using MATLAB 94
6.3.3 Simulation using LabVIEW 95
6.3.4 Comparison between MATLAB and LabVIEW 97
6.4 Error analysis 98
6.5 Conclusion 99
Chapter 7: Selection of suitable adsorbent for the removal of Cr(VI) by using
Objective Based Multiple Attribute Decision Making method 115-129
7.1 Introduction 116
7.2 Multiple attributes decision-making methodology 119
7.3 Decision making table 119
7.4 Objective weight of importance of attributes 120
ix
7.5 Preference index determination 121
7.6 Result and Discussion 121
Chapter 8: Conclusion & Recommendations 130-135
8.1 Conclusion 131
8.2 Scope for Further Study 135
References 136-149
List of papers published
Biodata of Candidate
Biodata of Supervisor
x
List of Figures
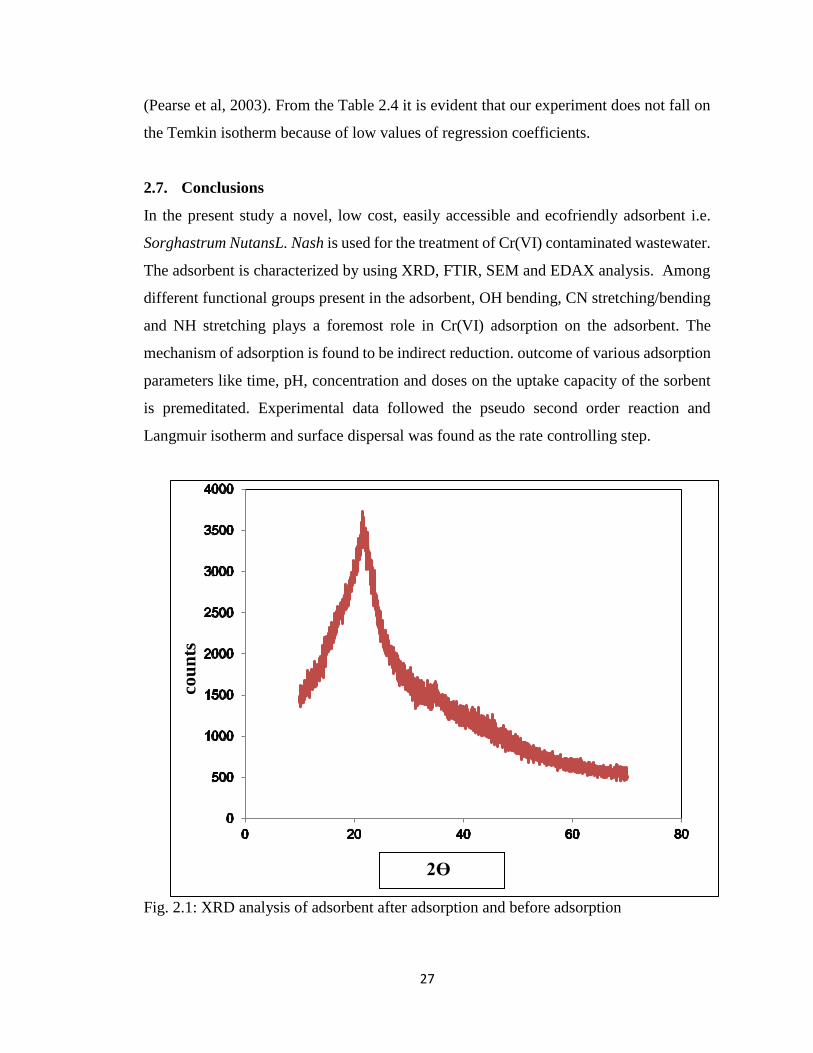
Fig. 2.1: XRD analysis of adsorbent after adsorption and before adsorption
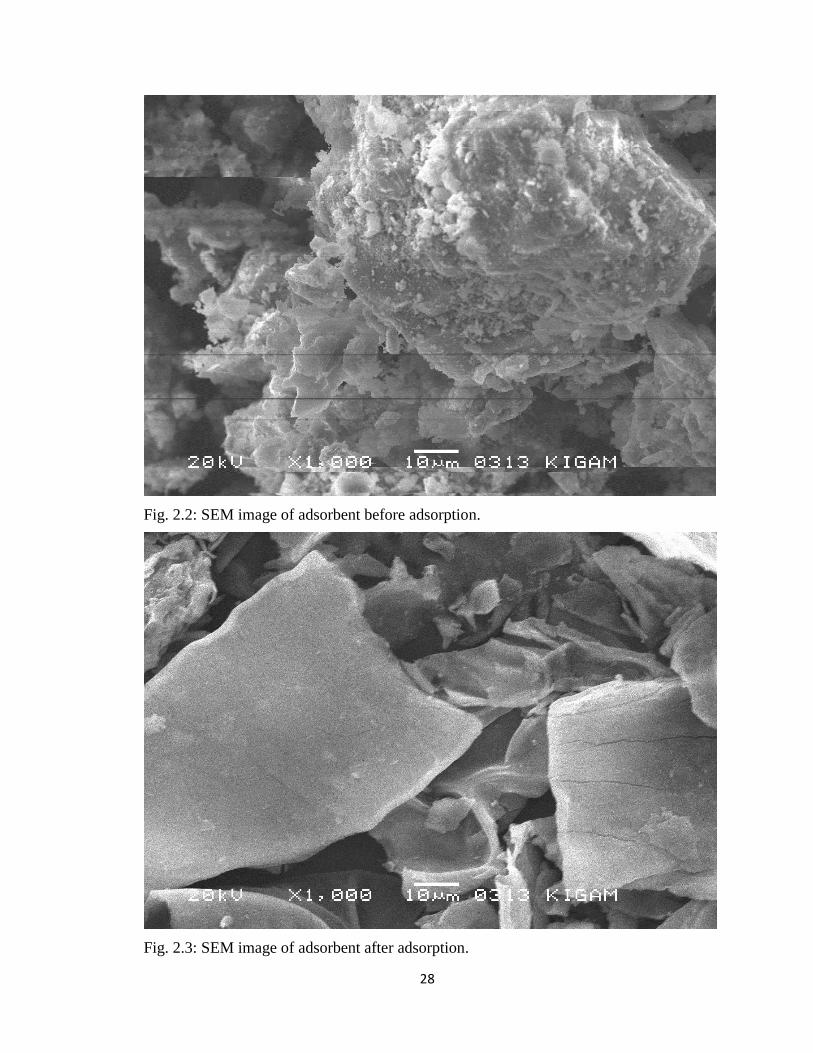
Fig. 2.2: SEM image of adsorbent before adsorption.
Fig. 2.3: SEM image of adsorbent after adsorption.
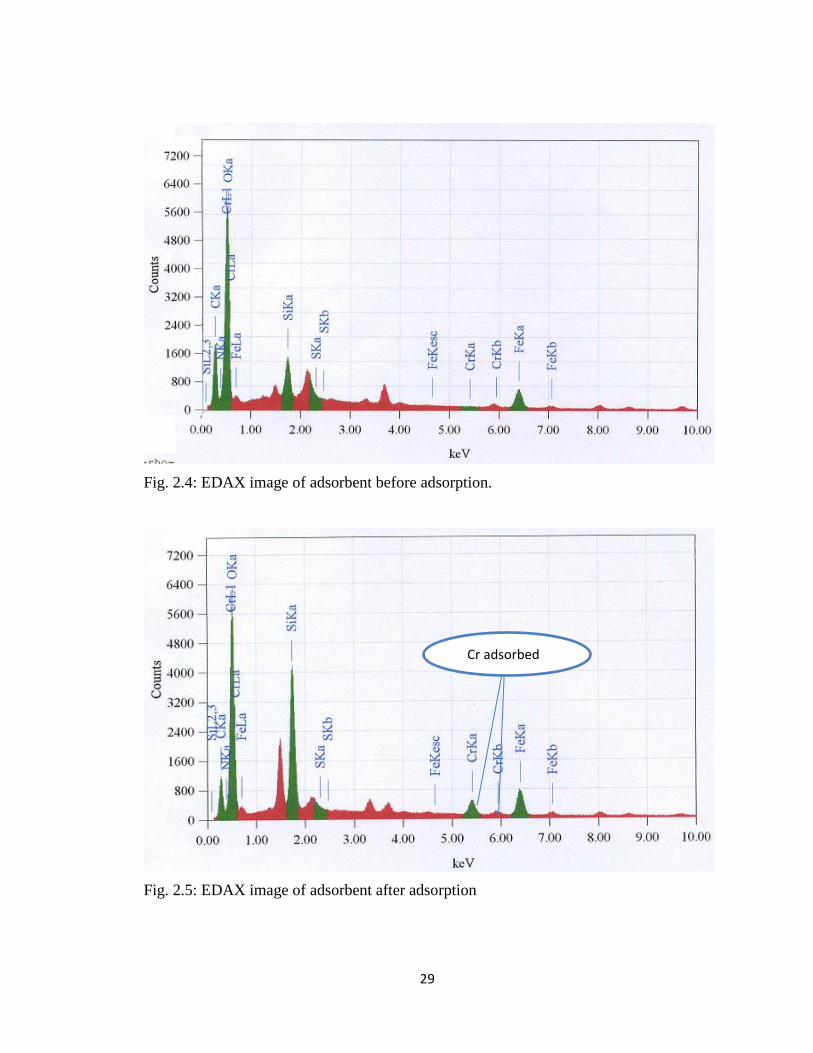
Fig. 2.4: EDAX image of adsorbent before adsorption.
Fig. 2.5: EDAX image of adsorbent after adsorption
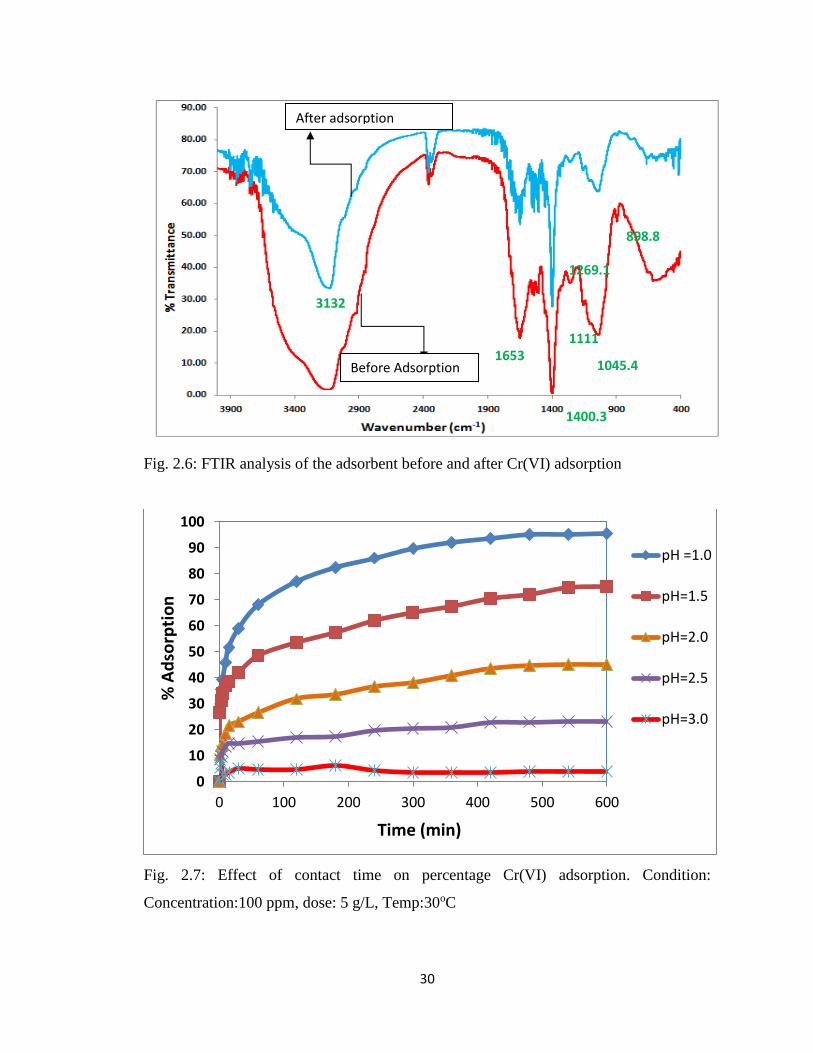
Fig. 2.6: FTIR analysis of the adsorbent before and after Cr(VI) adsorption
Fig. 2.7: Effect of contact time and dosage on percentage Cr(VI) adsorption
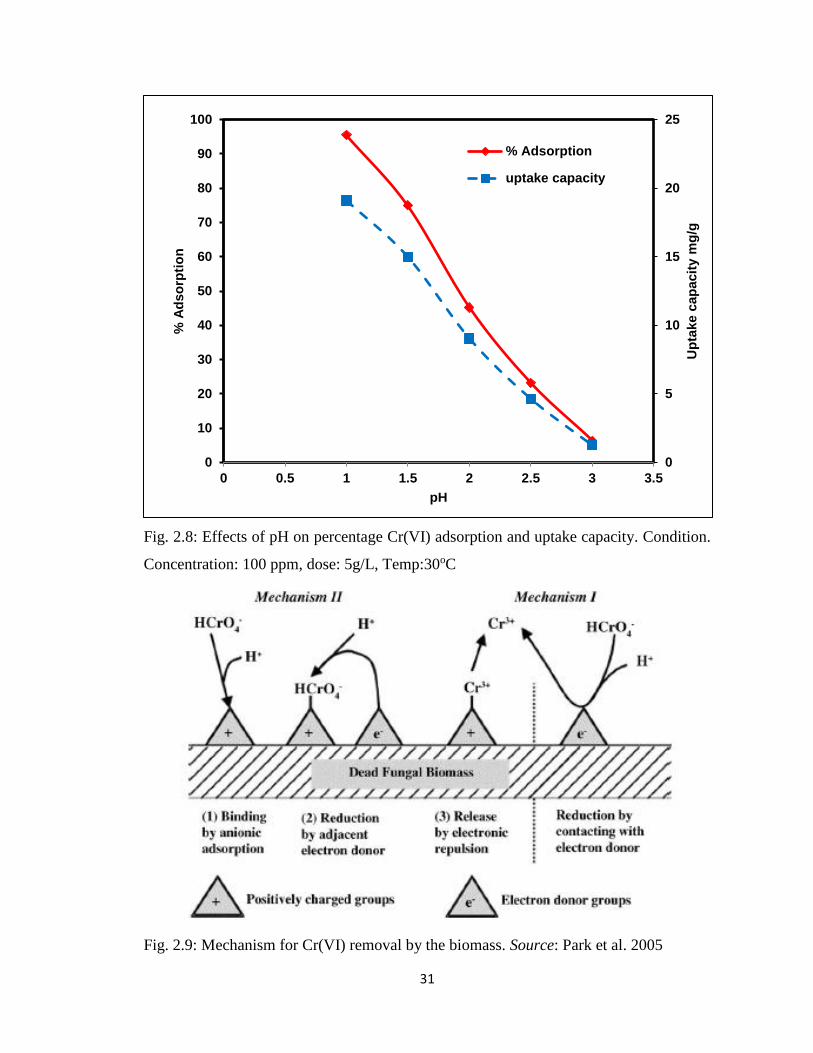
Fig. 2.8: Effect of pH on percentage Cr(VI) adsorption and uptake capacity
Fig. 2.9: Mechanism for Cr(VI) removal by the biomass. Source: Park et al. 2005
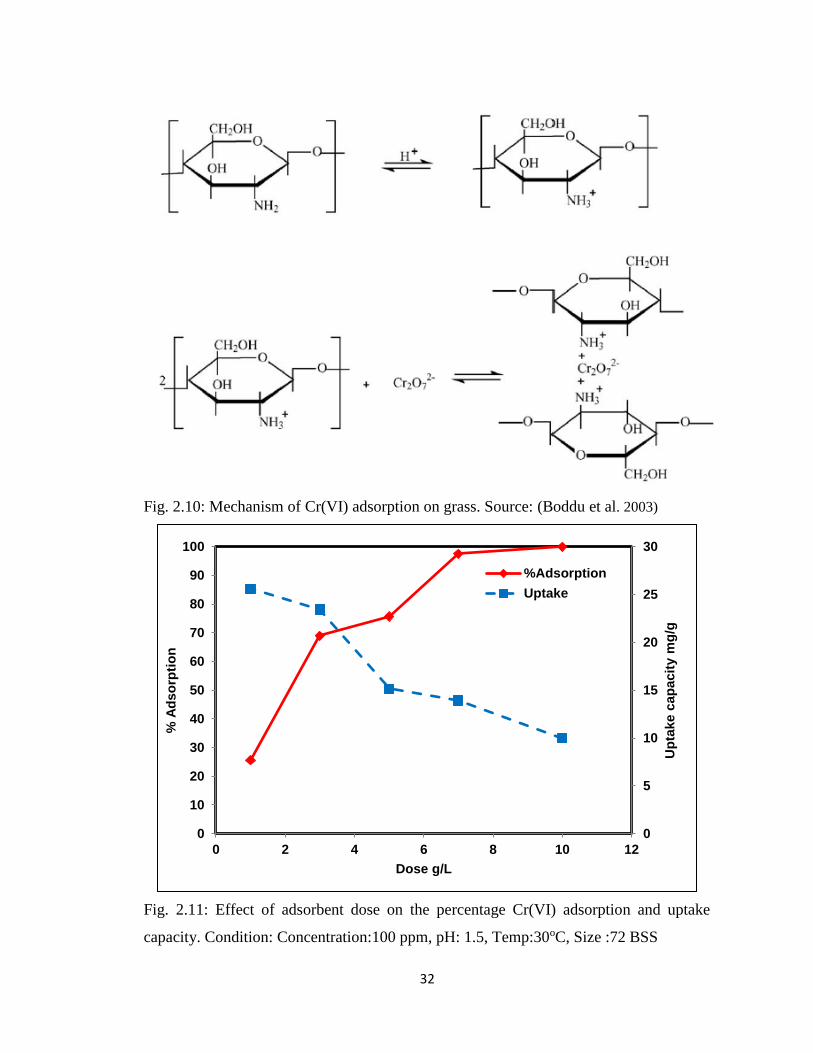
Fig. 2.10: Mechanism of Cr(VI) adsorption on grass. Source: Boddu et al. 2003
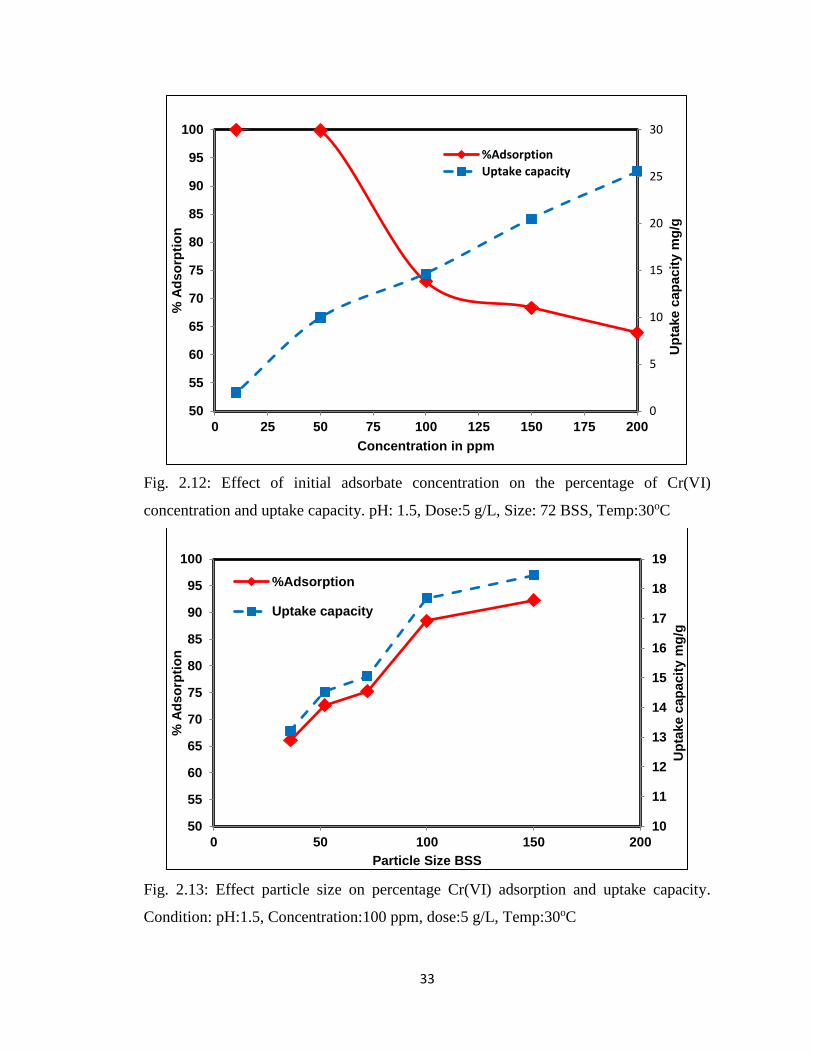
Fig. 2.11: Effect of adsorbent dose on the percentage Cr(VI) adsorption and uptake
capacity
Fig. 2.12: Effect of initial adsorbate concentration on the percentage of adsorption of
Cr(VI) and uptake capacity
Fig. 2.13: Effect particle size on percentage Cr(VI) adsorption and uptake capacity
Fig. 3.1: Effect of contact time on percentage of Cr(VI) adsorption
Fig. 3.2: Effect of pH on percentage of Cr(VI) adsorption
Fig. 3.3: Effect of Adsorbent Dose on percentage of Cr(VI) adsorption
Fig. 3.4: Effect of Particle Size on percentage of Cr(VI) adsorption
Fig. 3.5: Effect of Initial Cr(VI) Concentration on percentage of Cr(VI) adsorption
Fig. 4.1: Flowchart of existing Pig iron manufacturing unit
Fig. 4.2: Proposed flowchart for Pig Iron Manufacturing Unit
Fig. 4.3: SEM image before adsorption
Fig. 4.4: SEM image after Adsorption
Fig. 4.5: EDAX image before Adsorption
Fig. 4.6: EDAX image after adsorption
Fig. 4.7: Effect of contact time on percentage of Cr(VI) adsorption
Fig. 4.8: Effect of pH on percentage of Cr(VI) adsorption
Fig. 4.9: Effect of Adsorbent Dose
xi
Fig. 4.10: Effect of Initial Cr(VI) Concentration
Fig. 5.1: Production of Ferrochrome
Fig. 5.2: Experimental Setup for Carbonization of Grass
Fig. 5.3: Effect of contact time on percentage of Cr(VI) adsorption
Fig. 5.4: Effect of pH on percentage of Cr(VI) adsorption
Fig. 5.5: Effect of Adsorbent Dose on percentage of Cr(VI) adsorption
Fig. 5.6: Effect of Initial Cr(VI) Concentration on percentage of Cr(VI) adsorption
Fig. 6.1: Normal Probability chart for Cr(VI) adsorption
Fig. 6.2: Histogram for the factorial design of experiments
Fig. 6.3: Residual graph for percentage Cr(VI) adsorption
Fig. 6.4: Main effects between the independent variables and percentage Cr(VI) removal
Fig.6.5: Interaction effects between the independent variables and percentage Cr(VI)
adsorption.
Fig. 6.6: Contour Plot for the percentage Cr(VI) adsorption vs independent variables
Fig. 6.7: 3-Dimensional Surface Plot for the response vs independent variables
Fig. 6.8: The configuration of the VI system
Fig. 6.9: The configuration of front panel window input/output
Fig. 7.1. Materials and their properties selection
xii
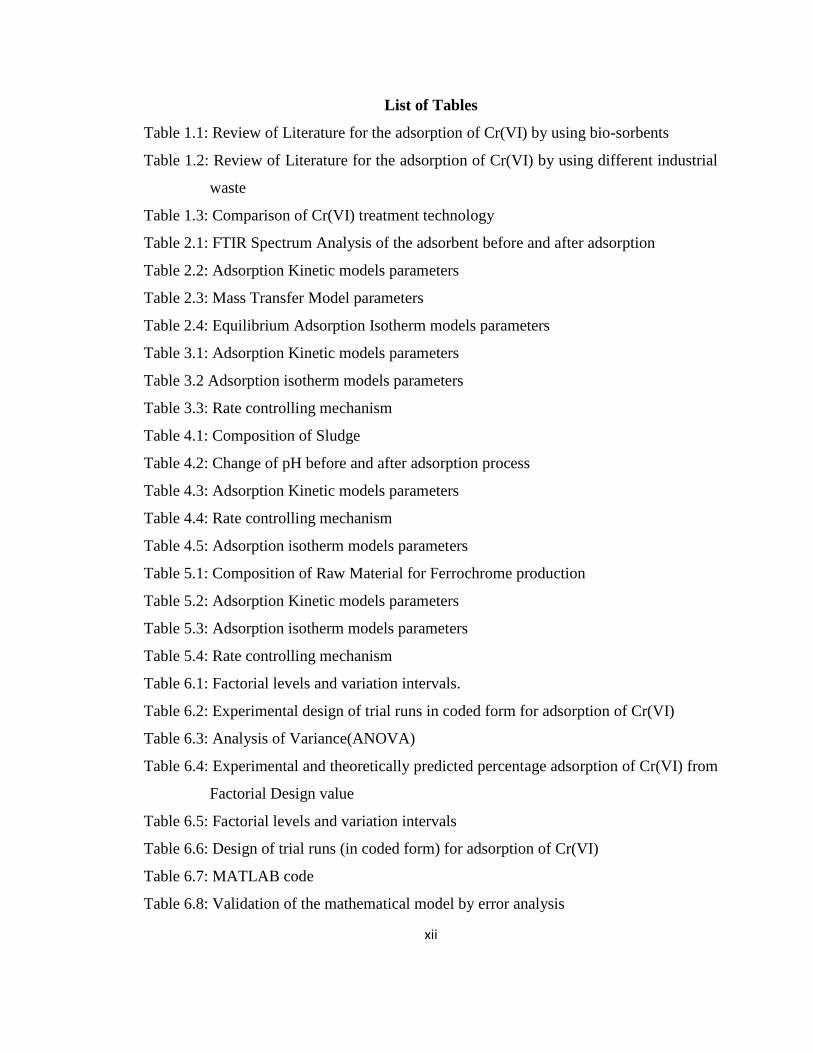
List of Tables
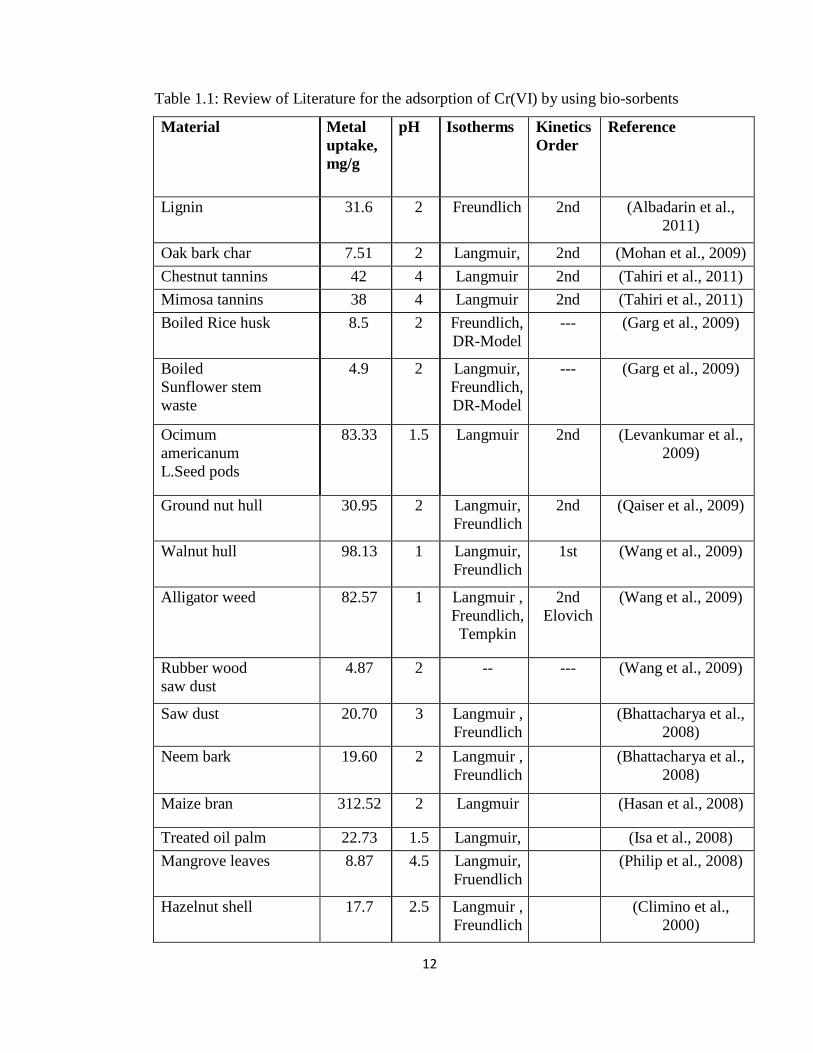
Table 1.1: Review of Literature for the adsorption of Cr(VI) by using bio-sorbents
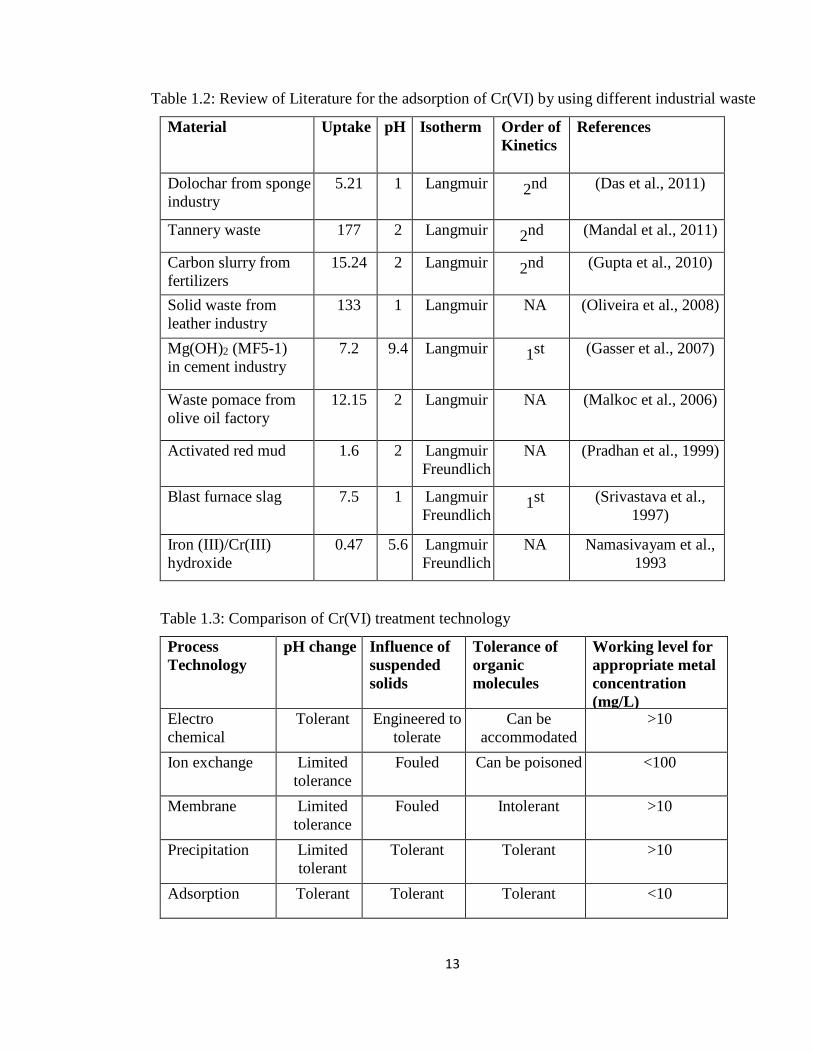
Table 1.2: Review of Literature for the adsorption of Cr(VI) by using different industrial
waste
Table 1.3: Comparison of Cr(VI) treatment technology
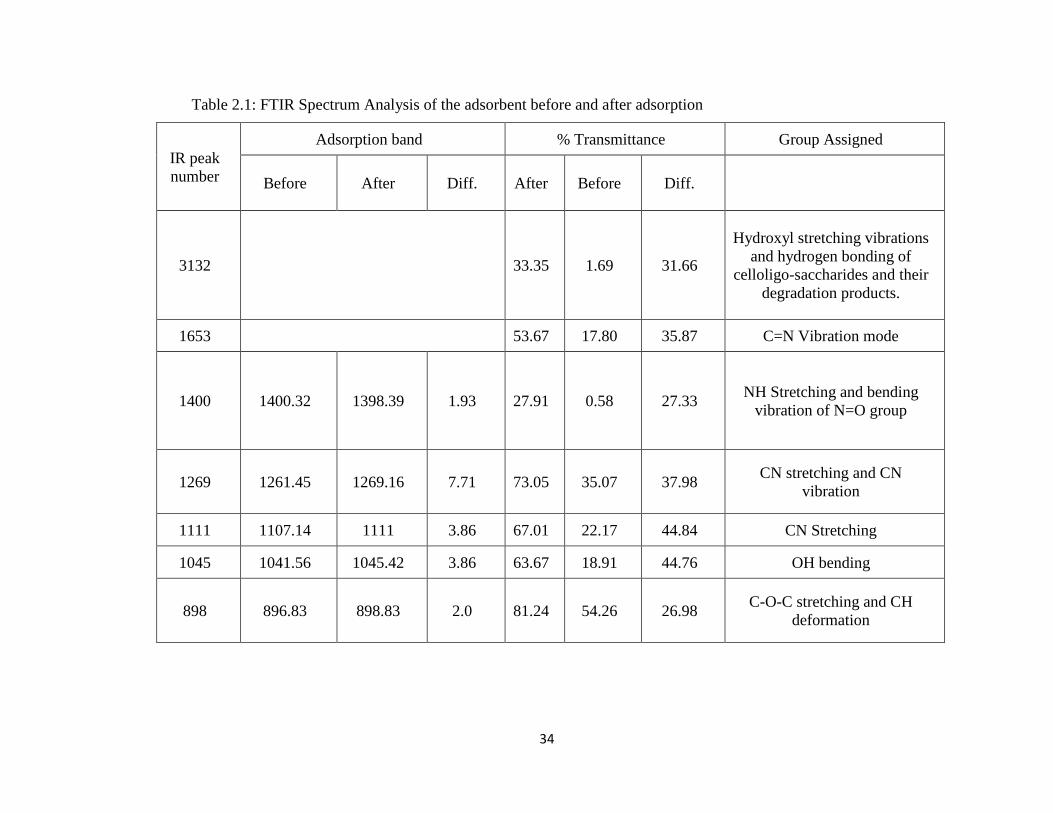
Table 2.1: FTIR Spectrum Analysis of the adsorbent before and after adsorption
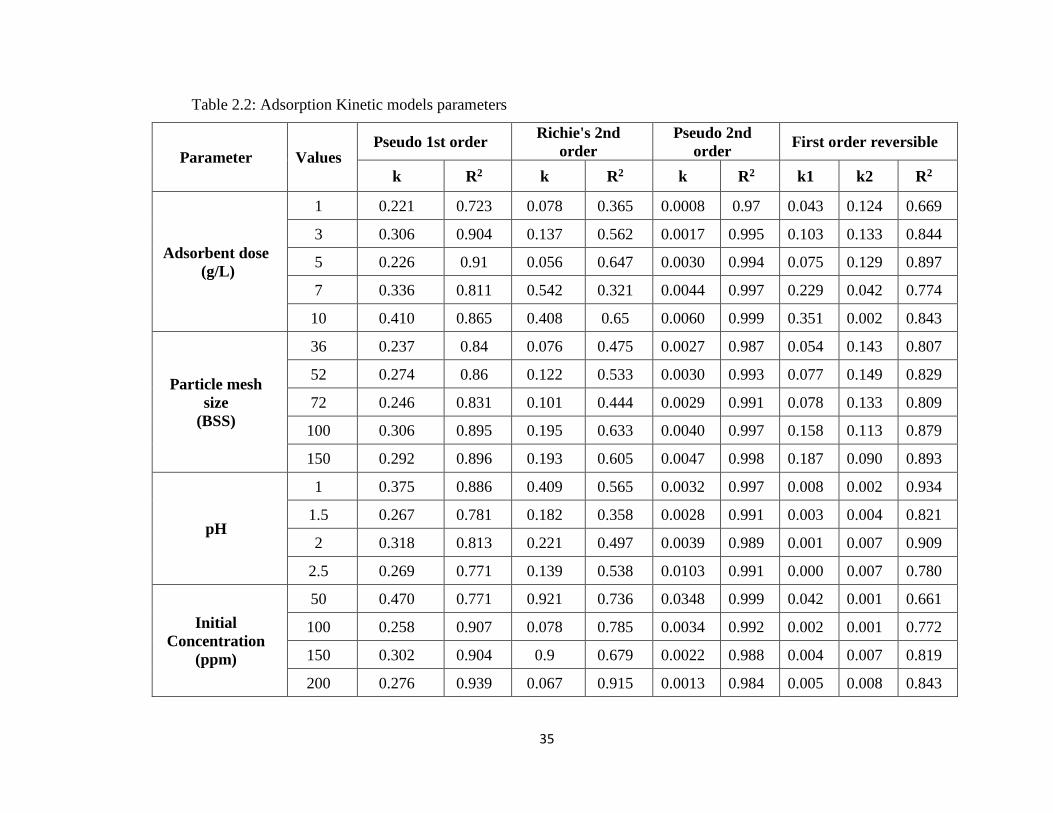
Table 2.2: Adsorption Kinetic models parameters
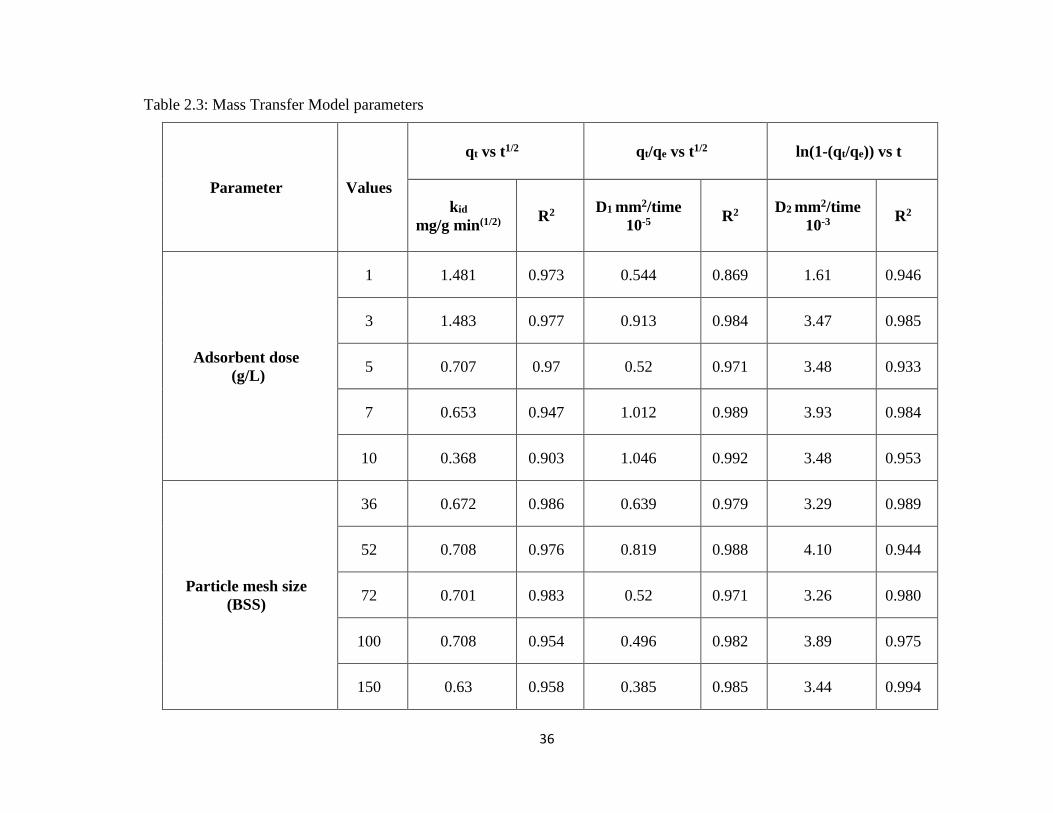
Table 2.3: Mass Transfer Model parameters
Table 2.4: Equilibrium Adsorption Isotherm models parameters
Table 3.1: Adsorption Kinetic models parameters
Table 3.2 Adsorption isotherm models parameters
Table 3.3: Rate controlling mechanism
Table 4.1: Composition of Sludge
Table 4.2: Change of pH before and after adsorption process
Table 4.3: Adsorption Kinetic models parameters
Table 4.4: Rate controlling mechanism
Table 4.5: Adsorption isotherm models parameters
Table 5.1: Composition of Raw Material for Ferrochrome production
Table 5.2: Adsorption Kinetic models parameters
Table 5.3: Adsorption isotherm models parameters
Table 5.4: Rate controlling mechanism
Table 6.1: Factorial levels and variation intervals.
Table 6.2: Experimental design of trial runs in coded form for adsorption of Cr(VI)
Table 6.3: Analysis of Variance(ANOVA)
Table 6.4: Experimental and theoretically predicted percentage adsorption of Cr(VI) from
Factorial Design value
Table 6.5: Factorial levels and variation intervals
Table 6.6: Design of trial runs (in coded form) for adsorption of Cr(VI)
Table 6.7: MATLAB code
Table 6.8: Validation of the mathematical model by error analysis
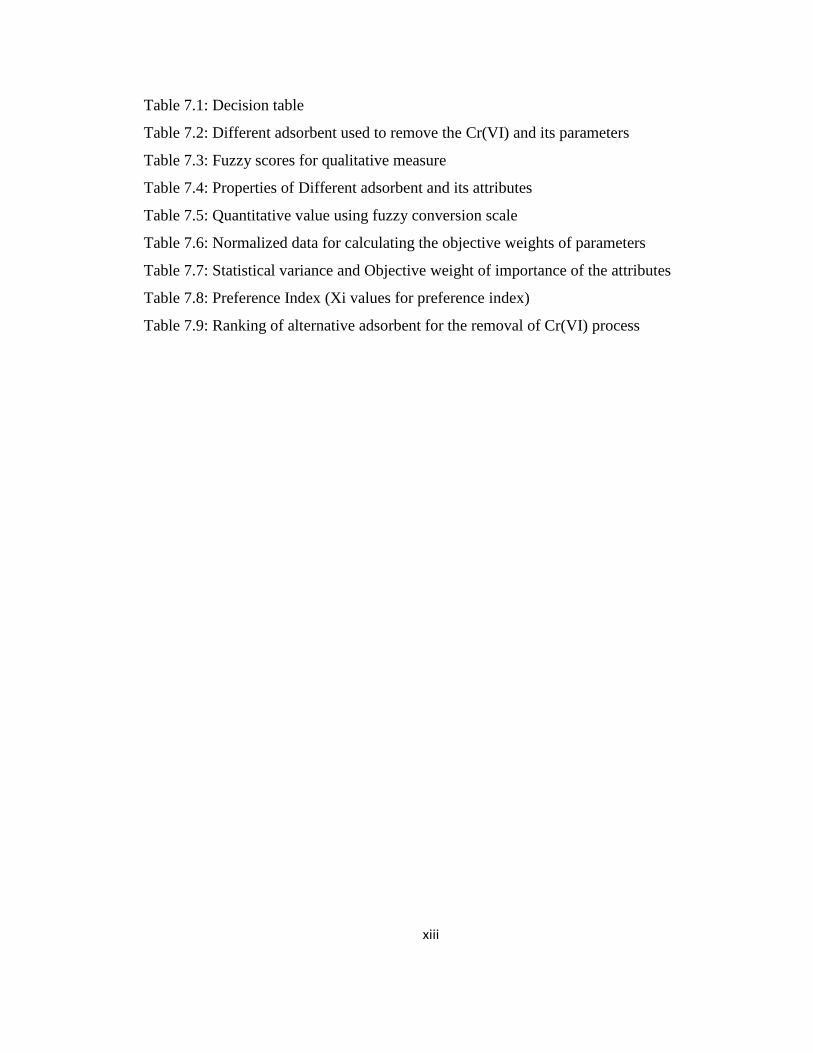
xiii
Table 7.1: Decision table
Table 7.2: Different adsorbent used to remove the Cr(VI) and its parameters
Table 7.3: Fuzzy scores for qualitative measure
Table 7.4: Properties of Different adsorbent and its attributes
Table 7.5: Quantitative value using fuzzy conversion scale
Table 7.6: Normalized data for calculating the objective weights of parameters
Table 7.7: Statistical variance and Objective weight of importance of the attributes
Table 7.8: Preference Index (Xi values for preference index)
Table 7.9: Ranking of alternative adsorbent for the removal of Cr(VI) process

1
Chapter-1
Introduction and Literature
Review
2
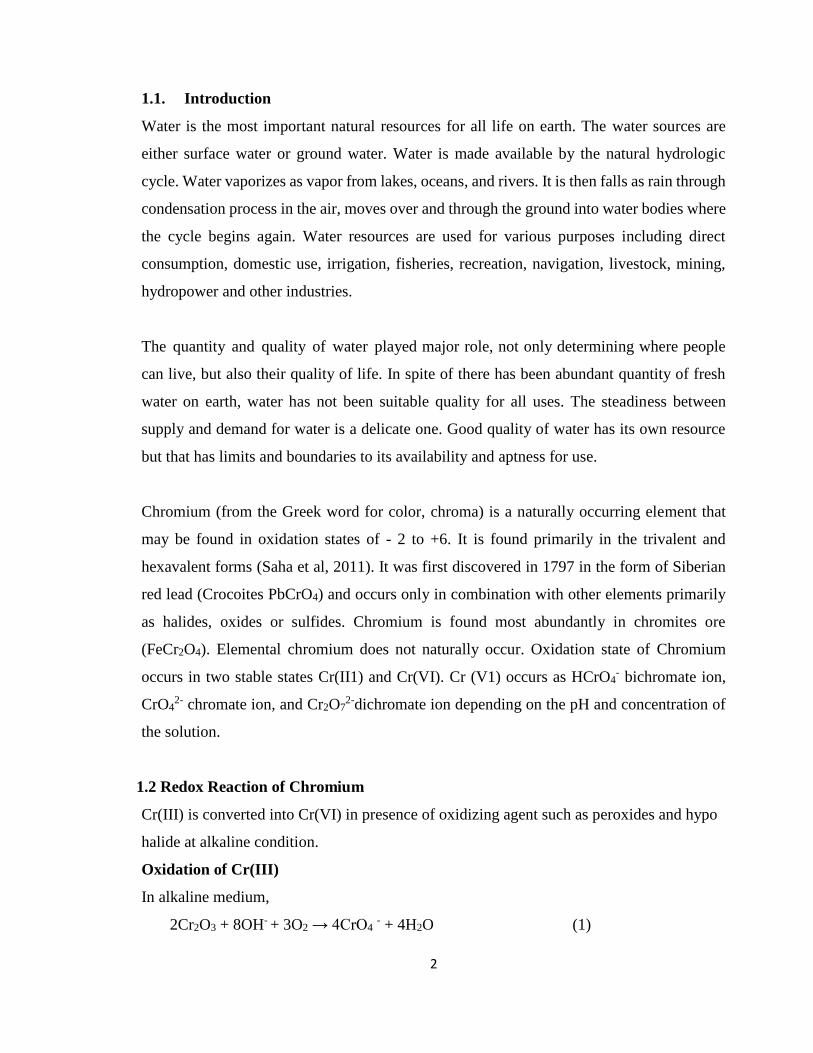
1.1. Introduction
Water is the most important natural resources for all life on earth. The water sources are
either surface water or ground water. Water is made available by the natural hydrologic
cycle. Water vaporizes as vapor from lakes, oceans, and rivers. It is then falls as rain through
condensation process in the air, moves over and through the ground into water bodies where
the cycle begins again. Water resources are used for various purposes including direct
consumption, domestic use, irrigation, fisheries, recreation, navigation, livestock, mining,
hydropower and other industries.
The quantity and quality of water played major role, not only determining where people
can live, but also their quality of life. In spite of there has been abundant quantity of fresh
water on earth, water has not been suitable quality for all uses. The steadiness between
supply and demand for water is a delicate one. Good quality of water has its own resource
but that has limits and boundaries to its availability and aptness for use.
Chromium (from the Greek word for color, chroma) is a naturally occurring element that
may be found in oxidation states of - 2 to +6. It is found primarily in the trivalent and
hexavalent forms (Saha et al, 2011). It was first discovered in 1797 in the form of Siberian
red lead (Crocoites PbCrO4) and occurs only in combination with other elements primarily
as halides, oxides or sulfides. Chromium is found most abundantly in chromites ore
(FeCr2O4). Elemental chromium does not naturally occur. Oxidation state of Chromium
occurs in two stable states Cr(II1) and Cr(VI). Cr (V1) occurs as HCrO4- bichromate ion,
CrO42- chromate ion, and Cr2O7
2-dichromate ion depending on the pH and concentration of
the solution.
1.2 Redox Reaction of Chromium
Cr(III) is converted into Cr(VI) in presence of oxidizing agent such as peroxides and hypo
halide at alkaline condition.
Oxidation of Cr(III)
In alkaline medium,
2Cr2O3 + 8OH- + 3O2 → 4CrO4 - + 4H2O (1)
3
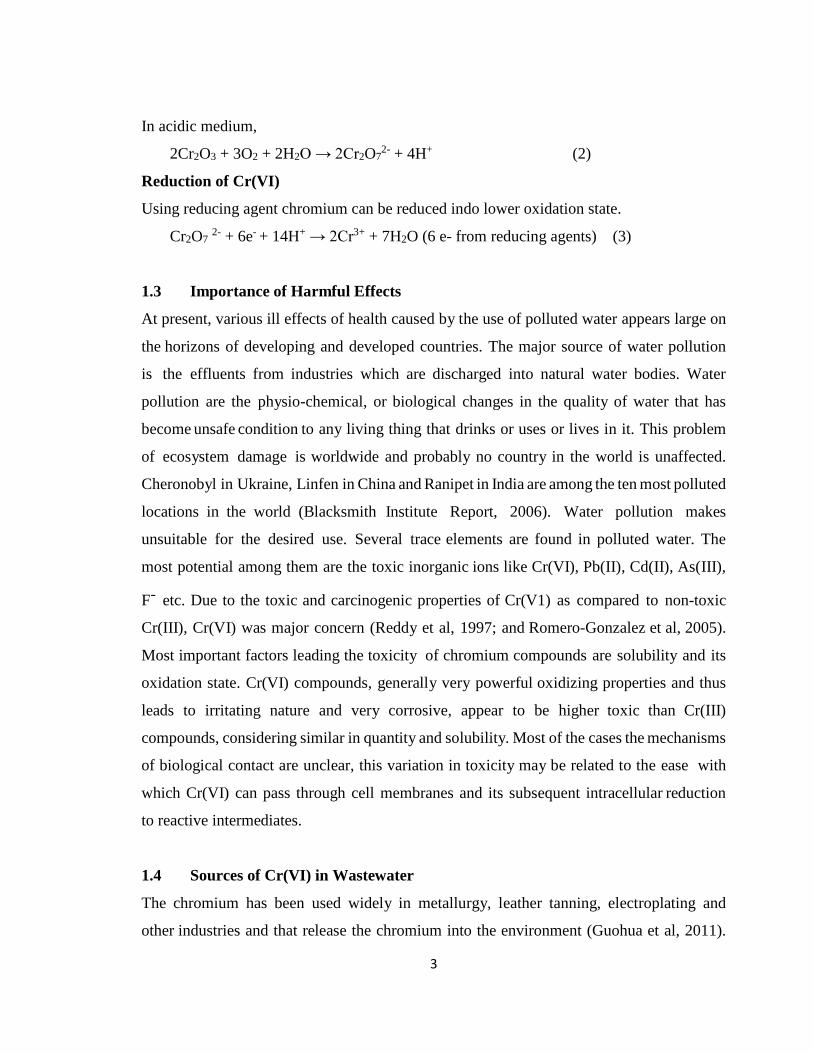
In acidic medium,
2Cr2O3 + 3O2 + 2H2O → 2Cr2O72- + 4H+ (2)
Reduction of Cr(VI)
Using reducing agent chromium can be reduced indo lower oxidation state.
Cr2O7 2- + 6e- + 14H+ → 2Cr3+ + 7H2O (6 e- from reducing agents) (3)
1.3 Importance of Harmful Effects
At present, various ill effects of health caused by the use of polluted water appears large on
the horizons of developing and developed countries. The major source of water pollution
is the effluents from industries which are discharged into natural water bodies. Water
pollution are the physio-chemical, or biological changes in the quality of water that has
become unsafe condition to any living thing that drinks or uses or lives in it. This problem
of ecosystem damage is worldwide and probably no country in the world is unaffected.
Cheronobyl in Ukraine, Linfen in China and Ranipet in India are among the ten most polluted
locations in the world (Blacksmith Institute Report, 2006). Water pollution makes
unsuitable for the desired use. Several trace elements are found in polluted water. The
most potential among them are the toxic inorganic ions like Cr(VI), Pb(II), Cd(II), As(III),
F- etc. Due to the toxic and carcinogenic properties of Cr(V1) as compared to non-toxic
Cr(III), Cr(VI) was major concern (Reddy et al, 1997; and Romero-Gonzalez et al, 2005).
Most important factors leading the toxicity of chromium compounds are solubility and its
oxidation state. Cr(VI) compounds, generally very powerful oxidizing properties and thus
leads to irritating nature and very corrosive, appear to be higher toxic than Cr(III)
compounds, considering similar in quantity and solubility. Most of the cases the mechanisms
of biological contact are unclear, this variation in toxicity may be related to the ease with
which Cr(VI) can pass through cell membranes and its subsequent intracellular reduction
to reactive intermediates.
1.4 Sources of Cr(VI) in Wastewater
The chromium has been used widely in metallurgy, leather tanning, electroplating and
other industries and that release the chromium into the environment (Guohua et al, 2011).
4
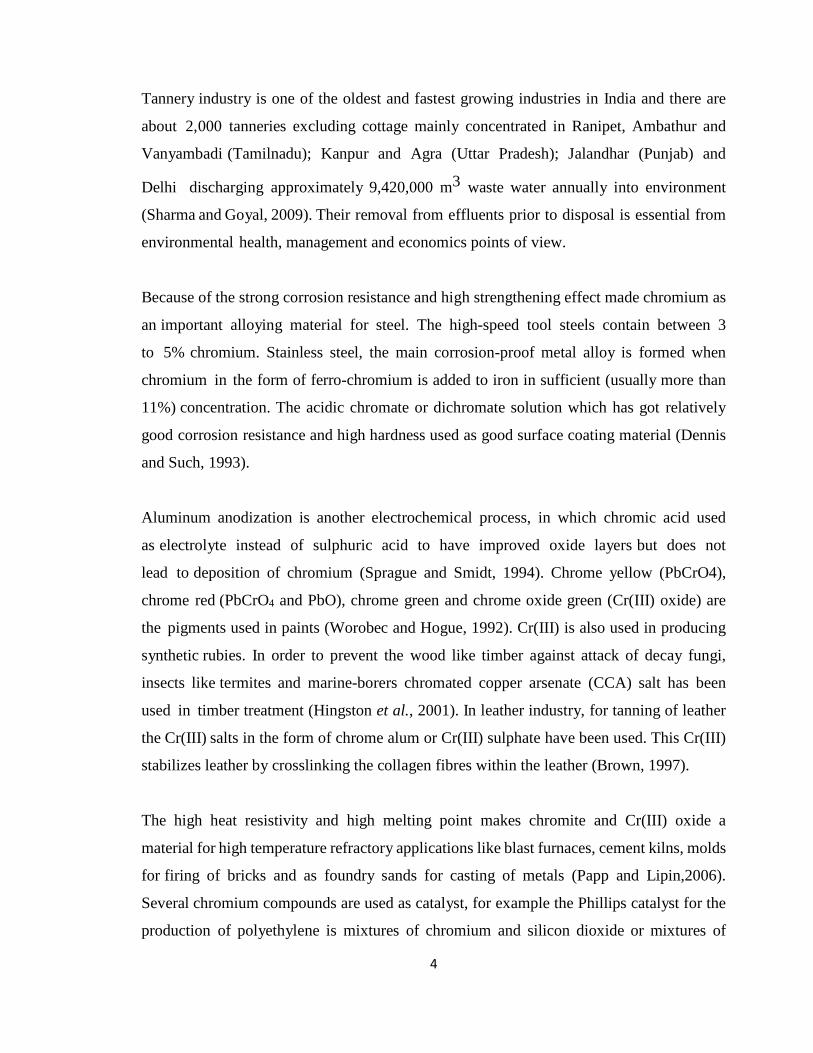
Tannery industry is one of the oldest and fastest growing industries in India and there are
about 2,000 tanneries excluding cottage mainly concentrated in Ranipet, Ambathur and
Vanyambadi (Tamilnadu); Kanpur and Agra (Uttar Pradesh); Jalandhar (Punjab) and
Delhi discharging approximately 9,420,000 m3 waste water annually into environment
(Sharma and Goyal, 2009). Their removal from effluents prior to disposal is essential from
environmental health, management and economics points of view.
Because of the strong corrosion resistance and high strengthening effect made chromium as
an important alloying material for steel. The high-speed tool steels contain between 3
to 5% chromium. Stainless steel, the main corrosion-proof metal alloy is formed when
chromium in the form of ferro-chromium is added to iron in sufficient (usually more than
11%) concentration. The acidic chromate or dichromate solution which has got relatively
good corrosion resistance and high hardness used as good surface coating material (Dennis
and Such, 1993).
Aluminum anodization is another electrochemical process, in which chromic acid used
as electrolyte instead of sulphuric acid to have improved oxide layers but does not
lead to deposition of chromium (Sprague and Smidt, 1994). Chrome yellow (PbCrO4),
chrome red (PbCrO4 and PbO), chrome green and chrome oxide green (Cr(III) oxide) are
the pigments used in paints (Worobec and Hogue, 1992). Cr(III) is also used in producing
synthetic rubies. In order to prevent the wood like timber against attack of decay fungi,
insects like termites and marine-borers chromated copper arsenate (CCA) salt has been
used in timber treatment (Hingston et al., 2001). In leather industry, for tanning of leather
the Cr(III) salts in the form of chrome alum or Cr(III) sulphate have been used. This Cr(III)
stabilizes leather by crosslinking the collagen fibres within the leather (Brown, 1997).
The high heat resistivity and high melting point makes chromite and Cr(III) oxide a
material for high temperature refractory applications like blast furnaces, cement kilns, molds
for firing of bricks and as foundry sands for casting of metals (Papp and Lipin,2006).
Several chromium compounds are used as catalyst, for example the Phillips catalyst for the
production of polyethylene is mixtures of chromium and silicon dioxide or mixtures of
5
chromium, titanium and aluminium oxide (Weckhuysen, 1999).
Chromic acid is a powerful oxidizing agent and is a useful compound for cleaning
laboratory glassware of any trace of organic compounds. Potassium dichromate is used as
a mordant for dyes in fabric. The multifarious uses of chromium and its compounds have
made it an indispensable part of industrial world these days. The increased usage of
Chromium has led to a great growth in chromium based industries.
Another major industrial source of Cr(VI) is from production of Ferrochrome industries,
which in turn, used for making stainless steel. The ferrochrome in the following categories
are being used for the production of stainless steel based on the content of carbon. (Goel,
1997)
➢ High carbon ferrochromium :(Cr: >60%, C: 6-9%)
➢ Charge chrome: (Cr: 50-60%, C: 6-9%)
➢ Medium carbon ferrochromium: (Cr: 56-70%, C: 1-4%) and
➢ Low carbon ferrochromium: (Cr 56-70%, C: 0.015-1.0%)
There are two operation places where Chromium can be discharged with effluent one is
that during Grinding and Filtering stage and another is flue gas during heating in Arc
Furnace. Our main focus is that finding the possibilities of using natural adsorbent to
remove the 100% Chromium from the any industrial effluent by normal adsorption process
and feed this chromium adsorbed adsorbent along with feed material for production
ferrochrome in sintering operation.
1.5 Cr(VI) contaminated wastewater Treatment Technologies
Selection of method depends on the different factors such as type of industrial effluent,
concentration of Cr, form of Cr in solution i.e. Cr(III) or Cr(VI), cost of method, efficiency
of method, etc. Following are some methods used for removal of chromium.
1.5.1 Chemical precipitation
It is the process for formulation of separate solid material from the solution, either by
6
converting the metal ion into insoluble form or by changing the oxidation state metal to reduce
the solubility of the compound formed. The removal of chromium from effluent can be done
by precipitation method. Cr(VI) can be precipitated as Cr(III) after reduction of Cr(VI)
to Cr(III) by using suitable reducing agent such as ferrous sulphate, Fe metal, sodium
sulphite, hydrogen peroxide, etc. At alkaline medium Cr(III) get converted into its hydroxide
form which is water insoluble. Like hydroxide, Cr(III) can be precipitated as chromium
sulphide, chromium phosphate, etc. Chemical precipitation methods required addition of
other chemicals, this finally generated high content of sludge. The deposits are collected
and disposed of to land dumps or oceans or by incineration.
Precipitation process required low cost, and can be used at high concentration of Cr(III) in
solution. The speed and completeness of the reduction of Cr(VI) to Cr(III) mainly depends
on pH value. The greatest speed is observed in an acidic medium at a pH 2-2.5 and it
usually requires additional acidification of the wastewater. In practice, this is carried out by
Sulphuric and other mineral acids. When metallic iron is used for the acidification of
chromium containing waste water, the water is filtered through a layer of iron shavings in the
reactor. By using iron shavings as reducer, solid phase content in formed deposits increases
four-fold as 1 part (by 16 weight) of Cr(OH)3 and 3.12 parts (by weight) of Fe(OH)3
(Smirnov and Genkin, 1989) will be deposited at the same time. All the chemical methods
have a common disadvantage where a great deal of slime is formed.
Ferrous iron is used for reduction of chromium from higher state to lower state from
aqueous solution (Scott, 1996). The stoichiometrically and kinetically reduction of
hexavalent chromium from aqueous solution by hydrogen sulfide is feasible. Hexavalent
chromium can be reduced by sodium sulphide in stabilization processes in pilot scale. In
this process cement, lime and gypsum is used as the stabilizing agents. With the help
reducing agent such as sodium meta- bisulphite and ferrous sulphate the reduction of
hexavalent chromium to trivalent chromium can be takes place, and completely reduction
of chromium done with the help of precipitating reagent by using base (Karale et. al.,
2007). The reduction of hexavalent chromium from aqueous solution can be done by
using sodium sulphide and sodium meta-bisulphite at pH 2 (Beukes et. al., 1999).
7
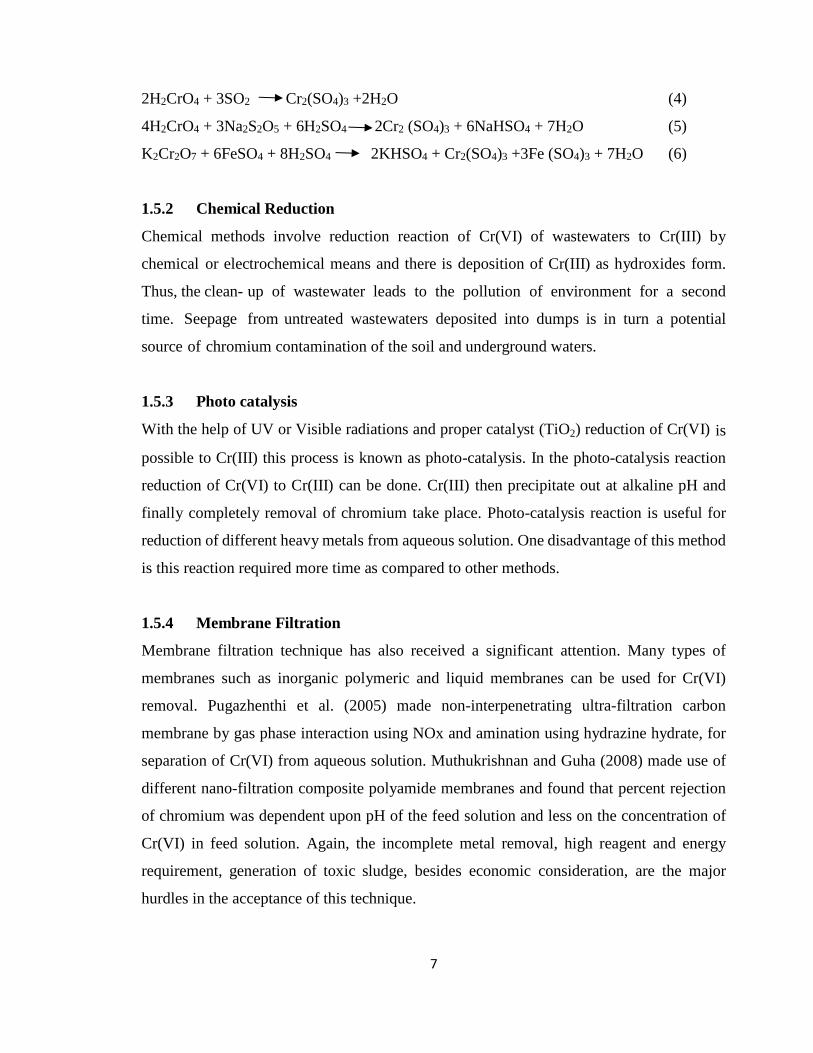
2H2CrO4 + 3SO2 Cr2(SO4)3 +2H2O (4)
4H2CrO4 + 3Na2S2O5 + 6H2SO4 2Cr2 (SO4)3 + 6NaHSO4 + 7H2O (5)
K2Cr2O7 + 6FeSO4 + 8H2SO4 2KHSO4 + Cr2(SO4)3 +3Fe (SO4)3 + 7H2O (6)
1.5.2 Chemical Reduction
Chemical methods involve reduction reaction of Cr(VI) of wastewaters to Cr(III) by
chemical or electrochemical means and there is deposition of Cr(III) as hydroxides form.
Thus, the clean- up of wastewater leads to the pollution of environment for a second
time. Seepage from untreated wastewaters deposited into dumps is in turn a potential
source of chromium contamination of the soil and underground waters.
1.5.3 Photo catalysis
With the help of UV or Visible radiations and proper catalyst (TiO2) reduction of Cr(VI) is
possible to Cr(III) this process is known as photo-catalysis. In the photo-catalysis reaction
reduction of Cr(VI) to Cr(III) can be done. Cr(III) then precipitate out at alkaline pH and
finally completely removal of chromium take place. Photo-catalysis reaction is useful for
reduction of different heavy metals from aqueous solution. One disadvantage of this method
is this reaction required more time as compared to other methods.
1.5.4 Membrane Filtration
Membrane filtration technique has also received a significant attention. Many types of
membranes such as inorganic polymeric and liquid membranes can be used for Cr(VI)
removal. Pugazhenthi et al. (2005) made non-interpenetrating ultra-filtration carbon
membrane by gas phase interaction using NOx and amination using hydrazine hydrate, for
separation of Cr(VI) from aqueous solution. Muthukrishnan and Guha (2008) made use of
different nano-filtration composite polyamide membranes and found that percent rejection
of chromium was dependent upon pH of the feed solution and less on the concentration of
Cr(VI) in feed solution. Again, the incomplete metal removal, high reagent and energy
requirement, generation of toxic sludge, besides economic consideration, are the major
hurdles in the acceptance of this technique.
8
1.5.5 Electro-dialysis
Removal of hexavalent chromium from aqueous solution was done with the help of iron and
aluminium electrodes by electro coagulation process. By electro coagulation process
completely reduction of heavy metals from industrial and synthetic wastewater can be done.
The disadvantages of electro-dialysis method are it required high cost, required highly
trained human resources, the fouling and scaling of membranes.
Electro-dialysis is the process in which electrical current is applied for generation of ions
with the help of electrode. In this method ions are transported through ion permeable
membranes under the influence of potential gradients from one solution to another solution.
The electrical charge on the ion is responsible for transfer of ions through the membrane
made-up from ion- exchange polymers. Selection of membrane depends on the ability to
transport ions having positive or negative charges. In the electro-dialysis method, the
ion permeable membranes sheets of ion-exchange resins are used, in some cases
polymer is also used to increases mechanical strength and elasticity.
1.5.6 Biopolymer
Physico-chemical methods presently in use have several disadvantages such as
unpredictable metal removal, high chemical requirements and formation of sludge and its
disposal. Further, the installation and operational cost of the processes are very high (Deepa
et al., 2006). Search for newer treatment technologies for removal of toxic metals from
waste water has directed attention to bio-sorption. The review of literature, thus supports
the drawbacks of the existing conventional treatment methods for Cr(VI) contaminated
surface and ground waters as any one of the following:
➢ High energy expenditure in the process,
➢ Use of expensive and toxic chemical reductant,
➢ Inefficient removal of low Cr(VI) concentrations in wastewater,
➢ Economically non-viable, and generation of secondary waste needs further
disposal methods (Zvinowanda et al., 2009).
9
Therefore, none of these techniques is entirely satisfactory, one being a temporary
solution, simply immobilizing the contaminant and others being costly when applied on
large scale (Adriano et al, 1995).
1.5.7 Adsorption and Bio-adsorption
Adsorption means liquid or gas phase substance can be accumulated on surface of solid
phase. Chromium in the form of Cr(III) and Cr(VI) can be removed using a different
adsorbent. Among all these methods, adsorption process is considered better than other
methods because of convenience, easy operation and simplicity of design. Further, this
process can remove/ minimize different types of pollutants and thus have wider
applicability in water pollution control. A fundamentally important characteristic of good
adsorbents is their high porosity and consequent larger surface area with more specific
adsorption sites (Bhatnagar, 2006). The different adsorbents that can be used are activated
charcoal, Fe2O3, chemically treated biomasses, etc. Adsorption can occur either by chemical
adsorption or physical adsorption or a combination of both. For adsorption of chromium
various adsorbents are used. Activated charcoal is one of the most important and effective
way to remove the chromium from industrial effluents. Activated charcoal is derived from
various raw materials such as nut shell, sawdust and coconut shells. As particle size of
adsorbent decreases, increases the removal efficiency of Cr(VI) (Hamadi et. al., 2001).
Adsorption capacity of chromium highly depends on pH of solution (Natale et. al., 2007).
Biosorption is a process in which living or inactive, dead, microbial biomass can be used
for removal of heavy metals from aqueous solutions. Bio-sorption use functional groups
for bio- sorption are –COOH, -NH2, -CO, -OH etc. For the removal of chromium or heavy
metals the advantages of bio-sorption process is that these are technically feasible, low cost
and ecological. This method has less intensity of bio-sorption and can be used at low
concentration of metal ion solution. Conventional methods are ineffective in the removal of
low concentrations of chromium metal ions. Different biosorbent used for the treatment
of Cr(VI) contaminated wastewater is summarized in Table 1.1.
10
1.5.8 Mechanism of bio-sorption
The active mechanisms of bio-sorption are complex and often selective. They have not
been completely elucidated, are not yet well understood and still unclear. Bio-sorption has a
chemical, equilibrated and saturation mechanism (Dilek, et al 2002). Such a process
includes active participation of several ligands present on the bio-sorbent like amino,
phosphoryl, carboxyl, sulfhydryl and hydroxyl groups to biosorb metal ions. They differ
depending on the bio-sorbent species, the origin and processing of the bio-sorbent and
solution chemistry. Despite the complexity of the bio-sorption process which includes
several mechanisms, adsorption isotherms have been used to characterize metal uptake and
they appear to be of use for projected industrial applications (Tsezos and Volesky, 1981). A
rich literature on the biosorption of heavy metals by various bio-sorbents is readily available.
Bio-sorption of some heavy metals, their concentrations, bio-sorbents used and the extent
of biosorption from their aqueous solutions played major role for the removal of toxic
substances in solution.
1.5.9 Adsorption of Cr(VI) by using various industrial waste
Wide spread industrial activities are producing large amount of solid waste materials. Some
of these materials are being put to use while others find no proper utilization and are
dumped elsewhere. The industrial waste material is available almost free of cost and
causes major disposal problem. If the solid wastes could be used as low cost adsorbents, it
will provide a two- fold advantage in reducing the pollution. Firstly, the volume of waste
materials could be partly reduced and secondly the developed low-cost adsorbent can reduce
the pollution of wastewaters at a reasonable cost. A number of industrial wastes have been
investigated with or without treatment as adsorbents for the removal pollutants from
wastewaters. Important industrial wastes with their metal uptake, pH, adsorption kinetics
and isotherms for various industrial wastes were compared in the Table 1.2. But in all the
cases, there is no proper explanation about reuse of adsorbent.
1.6 Conclusion
Many technologies adopted for the removal of chromium from industrial wastewaters
include precipitation, membrane filtration, solvent extraction with amines; ion-exchange,
activated carbon adsorption, electro-deposition, and various biological processes. Most of
11
these methods suffer set-backs because of high capital and operational cost and lack of
skilled personnel problem. Adsorption process has been extensively used for the removal
of toxic metals. Recently various natural adsorbents such as agriculture wastes and
activated carbon prepared from agriculture wastes, have been used for the removal of toxic
metals from aquatic environment. The technologies available for the removal/recovery of
chromium metal ions and the operating conditions are listed in Table 1.3. The versatility,
simplicity and other technology characteristics will contribute to the overall process costs,
both capital and operational.
In present study, it is intended to find the suitability of various adsorbents like bio-
sorbent, sludge and carbonized Biochar used to remove the Cr(VI) from aqueous solution.
➢ It is proposed to study the effect of different parameters like pH, initial
concentration of Chromium, dosage, time and particle size.
➢ Suitability of various adsorption isotherm and to establish the kinetics and rate
limiting mechanism of Chromium adsorption.
➢ Mathematical and statistical techniques useful for developing, improving and
optimizing the process condition and can be used to evaluate the relative
significance of several affecting factors individually and also combined.
➢ Possibility of recycle and reuse of adsorbed Chromium by industrial recycle like
Pig iron sludge.
➢ Use the Carbonized Biochar as adsorbent to remove the Cr(VI) and finding
the possible location in Ferrochrome industry.
12
Table 1.1: Review of Literature for the adsorption of Cr(VI) by using bio-sorbents
Material Metal
uptake,
mg/g
pH Isotherms Kinetics
Order
Reference
Lignin 31.6 2 Freundlich 2nd (Albadarin et al.,
2011)
Oak bark char 7.51 2 Langmuir, 2nd (Mohan et al., 2009)
Chestnut tannins 42 4 Langmuir 2nd (Tahiri et al., 2011)
Mimosa tannins 38 4 Langmuir 2nd (Tahiri et al., 2011)
Boiled Rice husk 8.5 2 Freundlich,
DR-Model
--- (Garg et al., 2009)
Boiled
Sunflower stem
waste
4.9 2 Langmuir,
Freundlich,
DR-Model
--- (Garg et al., 2009)
Ocimum
americanum
L.Seed pods
83.33 1.5 Langmuir 2nd (Levankumar et al.,
2009)
Ground nut hull 30.95 2 Langmuir,
Freundlich
2nd (Qaiser et al., 2009)
Walnut hull 98.13 1 Langmuir,
Freundlich
1st (Wang et al., 2009)
Alligator weed 82.57 1 Langmuir ,
Freundlich,
Tempkin
2nd
Elovich
(Wang et al., 2009)
Rubber wood
saw dust
4.87 2 -- --- (Wang et al., 2009)
Saw dust 20.70 3 Langmuir ,
Freundlich
(Bhattacharya et al.,
2008)
Neem bark 19.60 2 Langmuir ,
Freundlich
(Bhattacharya et al.,
2008)
Maize bran 312.52 2 Langmuir (Hasan et al., 2008)
Treated oil palm 22.73 1.5 Langmuir, (Isa et al., 2008)
Mangrove leaves 8.87 4.5 Langmuir,
Fruendlich
(Philip et al., 2008)
Hazelnut shell 17.7 2.5 Langmuir ,
Freundlich
(Climino et al.,
2000)
13
Table 1.2: Review of Literature for the adsorption of Cr(VI) by using different industrial waste
Material Uptake pH Isotherm Order of
Kinetics
References
Dolochar from sponge
industry
5.21 1 Langmuir 2nd (Das et al., 2011)
Tannery waste 177 2 Langmuir 2nd (Mandal et al., 2011)
Carbon slurry from
fertilizers
15.24 2 Langmuir 2nd (Gupta et al., 2010)
Solid waste from
leather industry
133 1 Langmuir NA (Oliveira et al., 2008)
Mg(OH)2 (MF5-1)
in cement industry
7.2 9.4 Langmuir 1st (Gasser et al., 2007)
Waste pomace from
olive oil factory
12.15 2 Langmuir NA (Malkoc et al., 2006)
Activated red mud 1.6 2 Langmuir
Freundlich
NA (Pradhan et al., 1999)
Blast furnace slag 7.5 1 Langmuir
Freundlich 1st (Srivastava et al.,
1997)
Iron (III)/Cr(III)
hydroxide
0.47 5.6 Langmuir
Freundlich
NA Namasivayam et al.,
1993
Table 1.3: Comparison of Cr(VI) treatment technology
Process
Technology
pH change Influence of
suspended
solids
Tolerance of
organic
molecules
Working level for
appropriate metal
concentration
(mg/L) Electro
chemical
Tolerant Engineered to
tolerate
Can be
accommodated
>10
Ion exchange Limited
tolerance
Fouled Can be poisoned <100
Membrane Limited
tolerance
Fouled Intolerant >10
Precipitation Limited
tolerant
Tolerant Tolerant >10
Adsorption Tolerant Tolerant Tolerant <10
14
Chapter-2
Bio-sorption of Cr(VI) from
wastewater using Sorghastrum
Nutans L. Nash
15
2.1. Materials
The adsorbent used in this study is a natural grass known as Sorghastrum Nutans L-Nash
which grows profusely in our campus. The grass was collected and cleaned with distilled
water thrice and dried for 48 hours. In order to remove the remaining moisture after
drying, the grass was kept in an oven at 600C for 8 hours. The dried grass was then ground
into powder form and sieved (British Standard Screens) to different size fractions. The
sieved powdered grass samples were then stored in an airtight container for further use.
A stock solution was then prepared by dissolving known quantity of potassium
dichromate in double distilled water. In order to meet the prescribed concentration for
experiments, the solution was further diluted as required. The initial pH of the solution
was maintained by adding the dilute HCl or NaOH (concentration of 0.1 N) made as
appropriate before adsorption. The complexing agent, Di-Phenyl Carbazide (DPC)
solution was ready by dissolving requisite amount of Di-phenyl Carbazide in acetone and
kept in an air tight volumetric flask in a dark place until further use. 6N H2SO4 solution
was prepared from the concentrated solution by using the appropriate amount of distilled
water and kept in a standard flask for use in the spectrophotometric analysis of Cr(VI)
concentration. All the chemicals used for experiments were obtained from Merck of
standard analytical grade.
2.2. Methods
Adsorption experiments were conducted by using 500 ml prepared chromium known
concentration solution in a beaker at constant temperature. The mixtures were well mixed
using a magnetic stirrer (REMI maker) with speed controller. 5 ml of sample was
collected at regular time intervals and filtered through a Whatman42 filter paper. In order
to maintain the solid to liquid ratio, the samples were collected under dynamic conditions.
The residual Cr(VI) concentration in the filtrate was analysed using an UV spectrometer
(Hach DR5000, model 1201) at a wavelength of 540 nm after complexing with metal ion
by 1,5 Di-Phenyl Carbazide under acidic conditions (Baral et al, 2009). Percentage
adsorption of Cr(VI) was calculated as follows
% Adso. =(Co−Ct)
Co ×100 (2.1)
16
where E, Co and Ct denote percentage adsorption and Cr(VI) concentration (mg L-1) at the
beginning and after time t respectively. The uptake capacity (mg/g) of chromium at
equilibrium was calculated from the difference of metal concentration in the solution
before and after adsorption, according to the equation below:
𝑞𝑒 =𝑉(𝐶𝑜−𝐶𝑒)
𝑊 (2.2)
where V is the volume (L) of the solution and Ce is equilibrium chromium concentration
respectively.
2.3. Results and Discussion
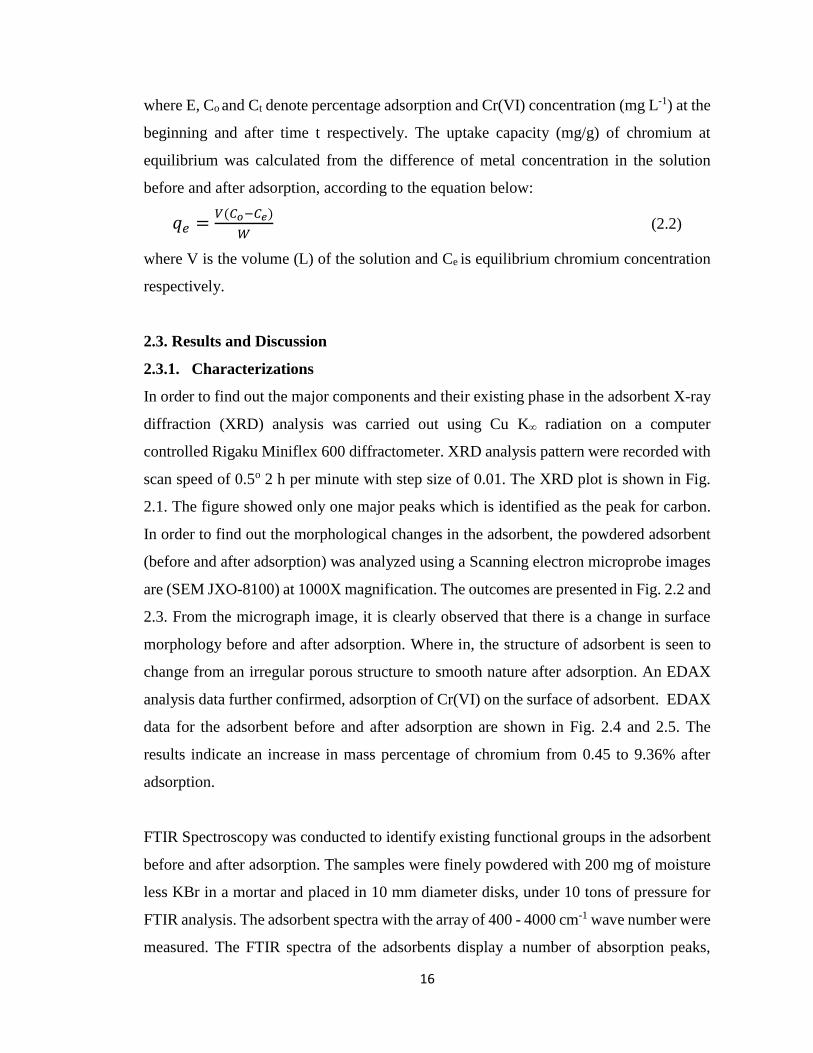
2.3.1. Characterizations
In order to find out the major components and their existing phase in the adsorbent X-ray
diffraction (XRD) analysis was carried out using Cu K∞ radiation on a computer
controlled Rigaku Miniflex 600 diffractometer. XRD analysis pattern were recorded with
scan speed of 0.5o 2 h per minute with step size of 0.01. The XRD plot is shown in Fig.
2.1. The figure showed only one major peaks which is identified as the peak for carbon.
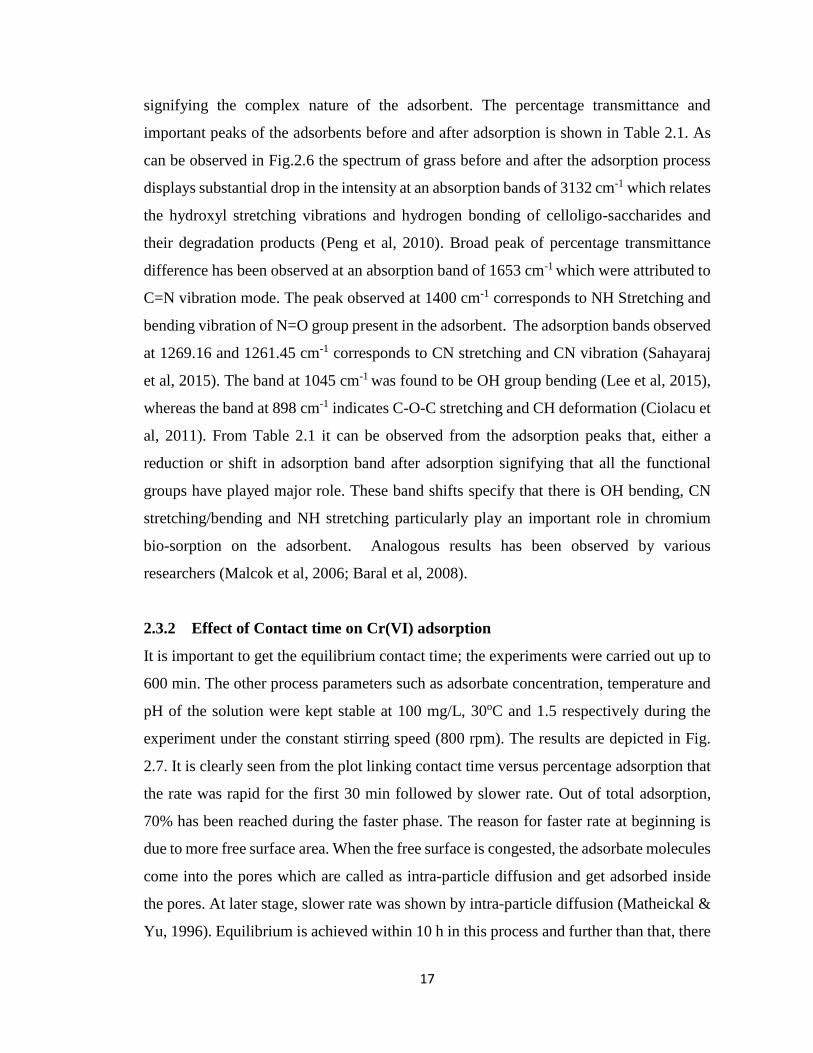
In order to find out the morphological changes in the adsorbent, the powdered adsorbent
(before and after adsorption) was analyzed using a Scanning electron microprobe images
are (SEM JXO-8100) at 1000X magnification. The outcomes are presented in Fig. 2.2 and
2.3. From the micrograph image, it is clearly observed that there is a change in surface
morphology before and after adsorption. Where in, the structure of adsorbent is seen to
change from an irregular porous structure to smooth nature after adsorption. An EDAX
analysis data further confirmed, adsorption of Cr(VI) on the surface of adsorbent. EDAX
data for the adsorbent before and after adsorption are shown in Fig. 2.4 and 2.5. The
results indicate an increase in mass percentage of chromium from 0.45 to 9.36% after
adsorption.
FTIR Spectroscopy was conducted to identify existing functional groups in the adsorbent
before and after adsorption. The samples were finely powdered with 200 mg of moisture
less KBr in a mortar and placed in 10 mm diameter disks, under 10 tons of pressure for
FTIR analysis. The adsorbent spectra with the array of 400 - 4000 cm-1 wave number were
measured. The FTIR spectra of the adsorbents display a number of absorption peaks,
17
signifying the complex nature of the adsorbent. The percentage transmittance and
important peaks of the adsorbents before and after adsorption is shown in Table 2.1. As
can be observed in Fig.2.6 the spectrum of grass before and after the adsorption process
displays substantial drop in the intensity at an absorption bands of 3132 cm-1 which relates
the hydroxyl stretching vibrations and hydrogen bonding of celloligo-saccharides and
their degradation products (Peng et al, 2010). Broad peak of percentage transmittance
difference has been observed at an absorption band of 1653 cm-1 which were attributed to
C=N vibration mode. The peak observed at 1400 cm-1 corresponds to NH Stretching and
bending vibration of N=O group present in the adsorbent. The adsorption bands observed
at 1269.16 and 1261.45 cm-1 corresponds to CN stretching and CN vibration (Sahayaraj
et al, 2015). The band at 1045 cm-1 was found to be OH group bending (Lee et al, 2015),
whereas the band at 898 cm-1 indicates C-O-C stretching and CH deformation (Ciolacu et
al, 2011). From Table 2.1 it can be observed from the adsorption peaks that, either a
reduction or shift in adsorption band after adsorption signifying that all the functional
groups have played major role. These band shifts specify that there is OH bending, CN
stretching/bending and NH stretching particularly play an important role in chromium
bio-sorption on the adsorbent. Analogous results has been observed by various
researchers (Malcok et al, 2006; Baral et al, 2008).
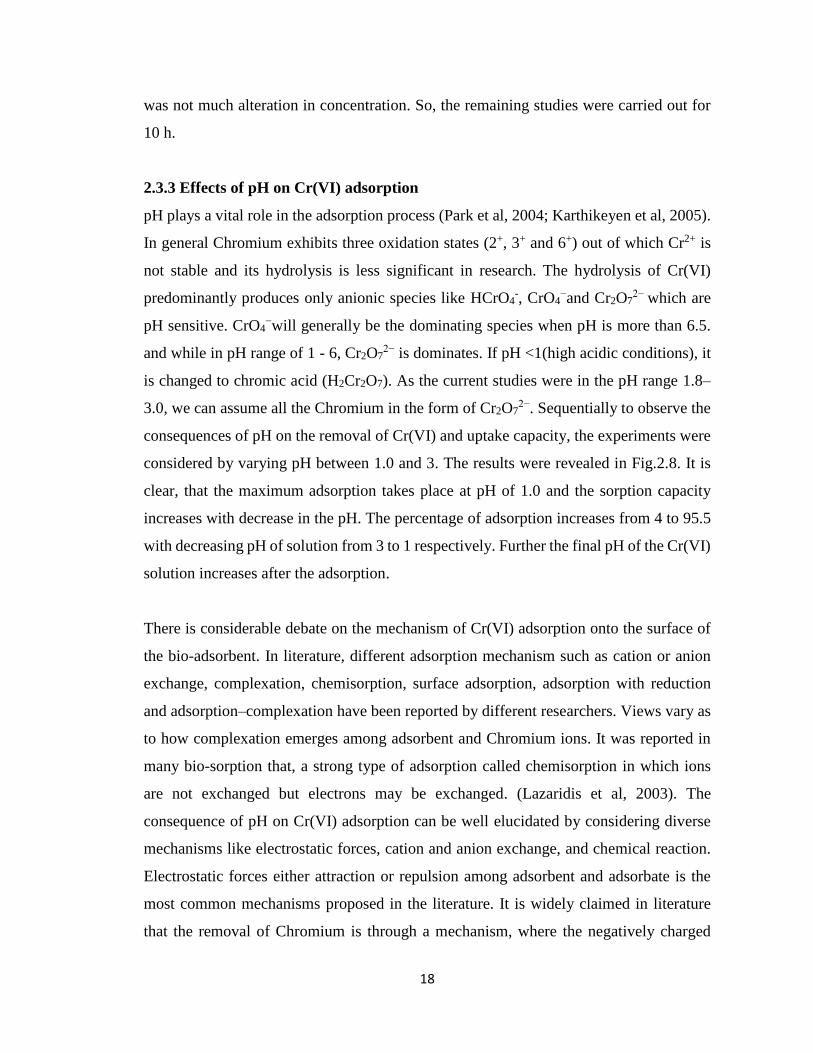
2.3.2 Effect of Contact time on Cr(VI) adsorption
It is important to get the equilibrium contact time; the experiments were carried out up to
600 min. The other process parameters such as adsorbate concentration, temperature and
pH of the solution were kept stable at 100 mg/L, 30oC and 1.5 respectively during the
experiment under the constant stirring speed (800 rpm). The results are depicted in Fig.
2.7. It is clearly seen from the plot linking contact time versus percentage adsorption that
the rate was rapid for the first 30 min followed by slower rate. Out of total adsorption,
70% has been reached during the faster phase. The reason for faster rate at beginning is
due to more free surface area. When the free surface is congested, the adsorbate molecules
come into the pores which are called as intra-particle diffusion and get adsorbed inside
the pores. At later stage, slower rate was shown by intra-particle diffusion (Matheickal &
Yu, 1996). Equilibrium is achieved within 10 h in this process and further than that, there
18
was not much alteration in concentration. So, the remaining studies were carried out for
10 h.
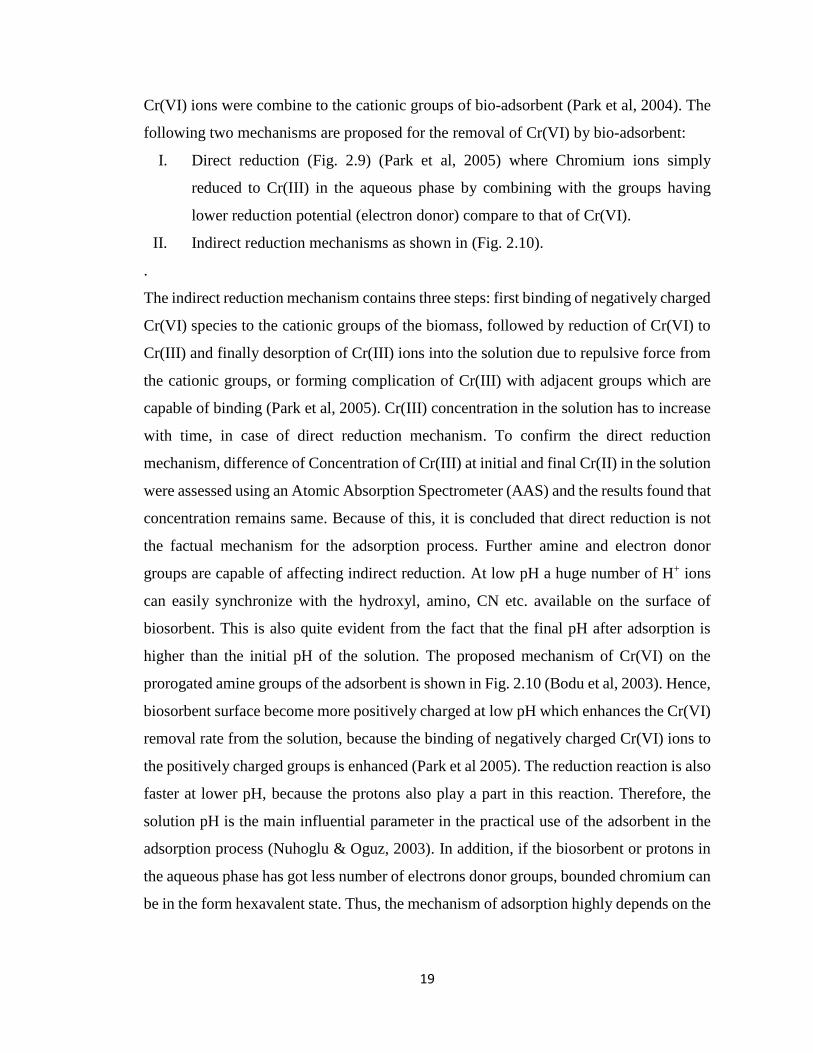
2.3.3 Effects of pH on Cr(VI) adsorption
pH plays a vital role in the adsorption process (Park et al, 2004; Karthikeyen et al, 2005).
In general Chromium exhibits three oxidation states (2+, 3+ and 6+) out of which Cr2+ is
not stable and its hydrolysis is less significant in research. The hydrolysis of Cr(VI)
predominantly produces only anionic species like HCrO4-, CrO4
−and Cr2O72− which are
pH sensitive. CrO4−will generally be the dominating species when pH is more than 6.5.
and while in pH range of 1 - 6, Cr2O72− is dominates. If pH <1(high acidic conditions), it
is changed to chromic acid (H2Cr2O7). As the current studies were in the pH range 1.8–
3.0, we can assume all the Chromium in the form of Cr2O72−. Sequentially to observe the
consequences of pH on the removal of Cr(VI) and uptake capacity, the experiments were
considered by varying pH between 1.0 and 3. The results were revealed in Fig.2.8. It is
clear, that the maximum adsorption takes place at pH of 1.0 and the sorption capacity
increases with decrease in the pH. The percentage of adsorption increases from 4 to 95.5
with decreasing pH of solution from 3 to 1 respectively. Further the final pH of the Cr(VI)
solution increases after the adsorption.
There is considerable debate on the mechanism of Cr(VI) adsorption onto the surface of
the bio-adsorbent. In literature, different adsorption mechanism such as cation or anion
exchange, complexation, chemisorption, surface adsorption, adsorption with reduction
and adsorption–complexation have been reported by different researchers. Views vary as
to how complexation emerges among adsorbent and Chromium ions. It was reported in
many bio-sorption that, a strong type of adsorption called chemisorption in which ions
are not exchanged but electrons may be exchanged. (Lazaridis et al, 2003). The
consequence of pH on Cr(VI) adsorption can be well elucidated by considering diverse
mechanisms like electrostatic forces, cation and anion exchange, and chemical reaction.
Electrostatic forces either attraction or repulsion among adsorbent and adsorbate is the
most common mechanisms proposed in the literature. It is widely claimed in literature
that the removal of Chromium is through a mechanism, where the negatively charged
19
Cr(VI) ions were combine to the cationic groups of bio-adsorbent (Park et al, 2004). The
following two mechanisms are proposed for the removal of Cr(VI) by bio-adsorbent:
I. Direct reduction (Fig. 2.9) (Park et al, 2005) where Chromium ions simply
reduced to Cr(III) in the aqueous phase by combining with the groups having
lower reduction potential (electron donor) compare to that of Cr(VI).
II. Indirect reduction mechanisms as shown in (Fig. 2.10).
.
The indirect reduction mechanism contains three steps: first binding of negatively charged
Cr(VI) species to the cationic groups of the biomass, followed by reduction of Cr(VI) to
Cr(III) and finally desorption of Cr(III) ions into the solution due to repulsive force from
the cationic groups, or forming complication of Cr(III) with adjacent groups which are
capable of binding (Park et al, 2005). Cr(III) concentration in the solution has to increase
with time, in case of direct reduction mechanism. To confirm the direct reduction
mechanism, difference of Concentration of Cr(III) at initial and final Cr(II) in the solution
were assessed using an Atomic Absorption Spectrometer (AAS) and the results found that
concentration remains same. Because of this, it is concluded that direct reduction is not
the factual mechanism for the adsorption process. Further amine and electron donor
groups are capable of affecting indirect reduction. At low pH a huge number of H+ ions
can easily synchronize with the hydroxyl, amino, CN etc. available on the surface of
biosorbent. This is also quite evident from the fact that the final pH after adsorption is
higher than the initial pH of the solution. The proposed mechanism of Cr(VI) on the
prorogated amine groups of the adsorbent is shown in Fig. 2.10 (Bodu et al, 2003). Hence,
biosorbent surface become more positively charged at low pH which enhances the Cr(VI)
removal rate from the solution, because the binding of negatively charged Cr(VI) ions to
the positively charged groups is enhanced (Park et al 2005). The reduction reaction is also
faster at lower pH, because the protons also play a part in this reaction. Therefore, the
solution pH is the main influential parameter in the practical use of the adsorbent in the
adsorption process (Nuhoglu & Oguz, 2003). In addition, if the biosorbent or protons in
the aqueous phase has got less number of electrons donor groups, bounded chromium can
be in the form hexavalent state. Thus, the mechanism of adsorption highly depends on the
20
adsorption process parameters like solution pH, dose, Chromium concentration and
temperature (Park et al, 2005).
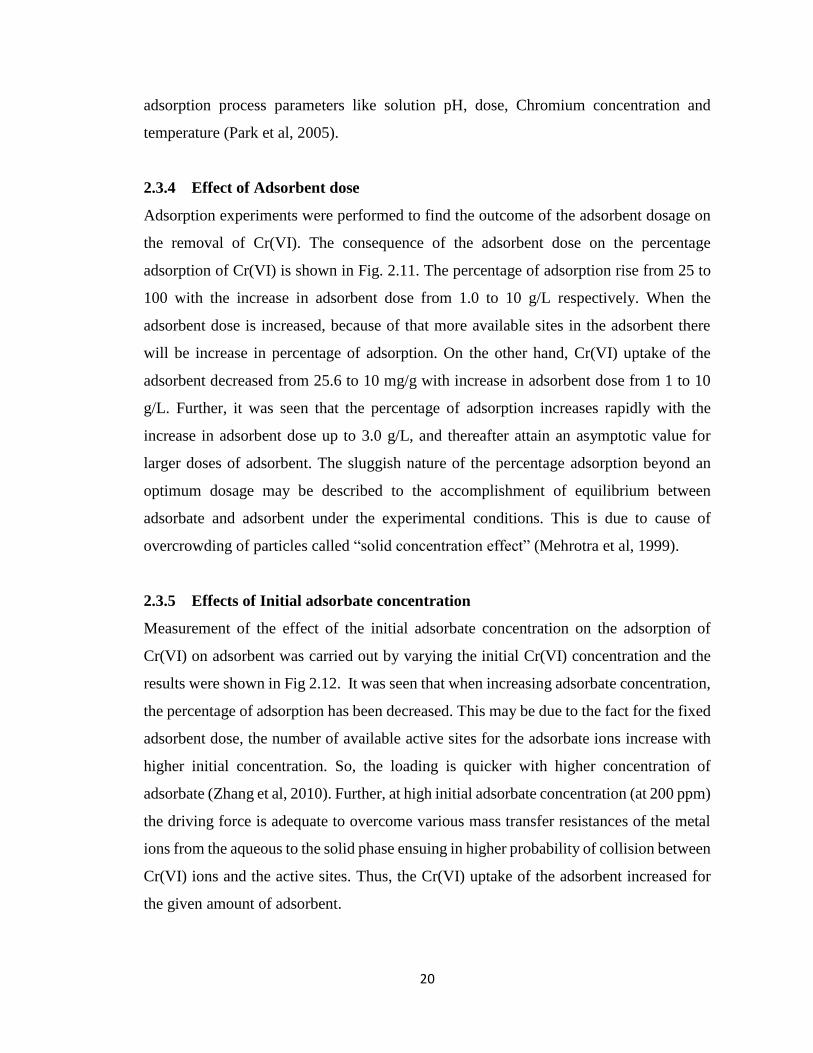
2.3.4 Effect of Adsorbent dose
Adsorption experiments were performed to find the outcome of the adsorbent dosage on
the removal of Cr(VI). The consequence of the adsorbent dose on the percentage
adsorption of Cr(VI) is shown in Fig. 2.11. The percentage of adsorption rise from 25 to
100 with the increase in adsorbent dose from 1.0 to 10 g/L respectively. When the
adsorbent dose is increased, because of that more available sites in the adsorbent there
will be increase in percentage of adsorption. On the other hand, Cr(VI) uptake of the
adsorbent decreased from 25.6 to 10 mg/g with increase in adsorbent dose from 1 to 10
g/L. Further, it was seen that the percentage of adsorption increases rapidly with the
increase in adsorbent dose up to 3.0 g/L, and thereafter attain an asymptotic value for
larger doses of adsorbent. The sluggish nature of the percentage adsorption beyond an
optimum dosage may be described to the accomplishment of equilibrium between
adsorbate and adsorbent under the experimental conditions. This is due to cause of
overcrowding of particles called “solid concentration effect” (Mehrotra et al, 1999).
2.3.5 Effects of Initial adsorbate concentration
Measurement of the effect of the initial adsorbate concentration on the adsorption of
Cr(VI) on adsorbent was carried out by varying the initial Cr(VI) concentration and the
results were shown in Fig 2.12. It was seen that when increasing adsorbate concentration,
the percentage of adsorption has been decreased. This may be due to the fact for the fixed
adsorbent dose, the number of available active sites for the adsorbate ions increase with
higher initial concentration. So, the loading is quicker with higher concentration of
adsorbate (Zhang et al, 2010). Further, at high initial adsorbate concentration (at 200 ppm)
the driving force is adequate to overcome various mass transfer resistances of the metal
ions from the aqueous to the solid phase ensuing in higher probability of collision between
Cr(VI) ions and the active sites. Thus, the Cr(VI) uptake of the adsorbent increased for
the given amount of adsorbent.
21
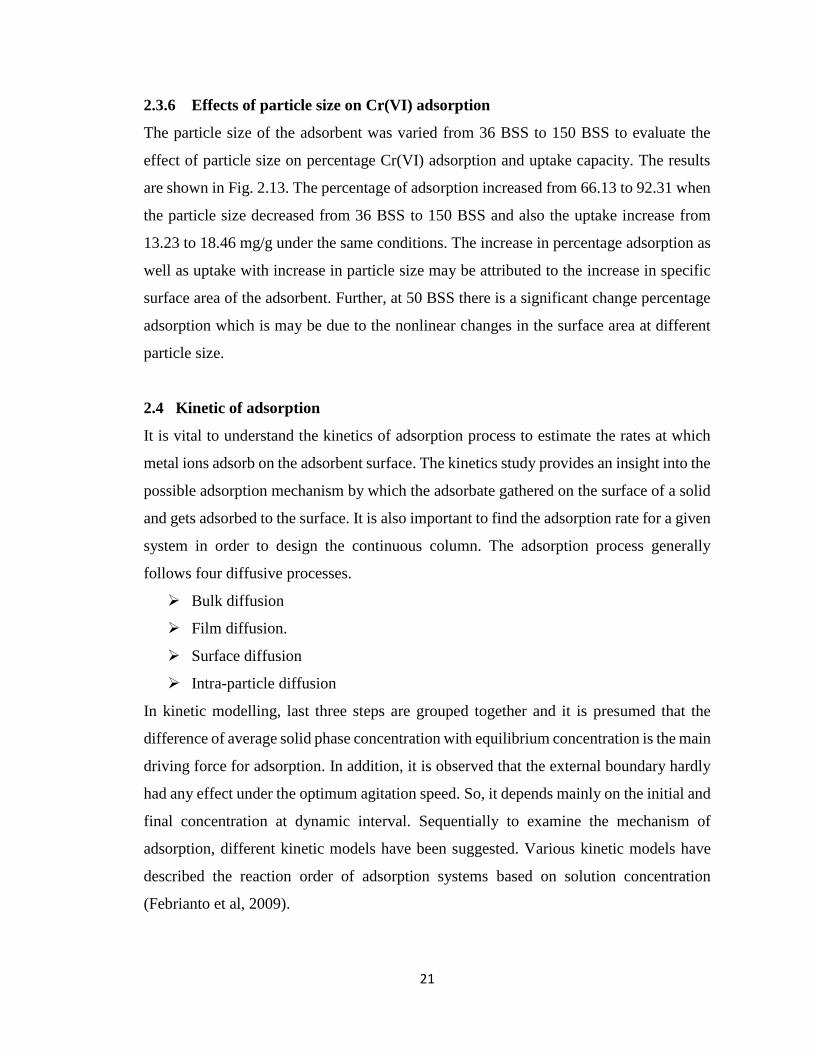
2.3.6 Effects of particle size on Cr(VI) adsorption
The particle size of the adsorbent was varied from 36 BSS to 150 BSS to evaluate the
effect of particle size on percentage Cr(VI) adsorption and uptake capacity. The results
are shown in Fig. 2.13. The percentage of adsorption increased from 66.13 to 92.31 when
the particle size decreased from 36 BSS to 150 BSS and also the uptake increase from
13.23 to 18.46 mg/g under the same conditions. The increase in percentage adsorption as
well as uptake with increase in particle size may be attributed to the increase in specific
surface area of the adsorbent. Further, at 50 BSS there is a significant change percentage
adsorption which is may be due to the nonlinear changes in the surface area at different
particle size.
2.4 Kinetic of adsorption
It is vital to understand the kinetics of adsorption process to estimate the rates at which
metal ions adsorb on the adsorbent surface. The kinetics study provides an insight into the
possible adsorption mechanism by which the adsorbate gathered on the surface of a solid
and gets adsorbed to the surface. It is also important to find the adsorption rate for a given
system in order to design the continuous column. The adsorption process generally
follows four diffusive processes.
➢ Bulk diffusion
➢ Film diffusion.
➢ Surface diffusion
➢ Intra-particle diffusion
In kinetic modelling, last three steps are grouped together and it is presumed that the
difference of average solid phase concentration with equilibrium concentration is the main
driving force for adsorption. In addition, it is observed that the external boundary hardly
had any effect under the optimum agitation speed. So, it depends mainly on the initial and
final concentration at dynamic interval. Sequentially to examine the mechanism of
adsorption, different kinetic models have been suggested. Various kinetic models have
described the reaction order of adsorption systems based on solution concentration
(Febrianto et al, 2009).
22
2.4.1. Lagergren’ spseudo first-ordermodel
The Lagergren equation is possibly the earliest known rate law describing the rate of
adsorption in the liquid-phase systems. This model describes liquid-solid phase
adsorption systems and is derived based on the adsorption capacity of the adsorbent. This
equation (Lagergren & Zur, 1898) has been widely used for the adsorption in liquid and
solid phase particularly for sorption of a solute from a liquid solution. According to
Lagergren, the overall rate of uptake capacity is directly proportional to the difference in
equilibrium uptake and uptake at any time. So, the kinetic equation expressed as follows:
𝑑𝑞
𝑑𝑡= 𝑘 (𝑞𝑒 − 𝑞) (2.3)
Where qeis the uptake at equilibrium, q is uptake at any time t, k is the rate constant.
Equation (2.3) integrated with boundary condition resulted in the following equation:
log(𝑞𝑒 − 𝑞) = log 𝑞𝑒 −𝑘
2.303𝑡 (2.4)
The values of ‘k’ were interpreted from the slope of the graph between log(qe−q) and ‘t’
for different adsorption parameters under the experiments has been studied. The
correlation coefficients and rate constants are given in Table 2.2. The correlation
coefficients were in acquiescence with the pseudo first-order kinetics.
2.4.2. Ritchie’s second order model
Ritchie reported model for the adsorption of gases and liquid systems. Considering that
the rate of adsorption depends exclusively on the fraction of sites which are empty at time
t, then
𝑑𝜃
𝑑𝑡= 𝑘 (1 − 𝜃)𝑛 (2.5)
Where, θ is fraction of surface occupied, k is the rate constant, n is the number of surface
sites occupied and t is the time (in minutes). After integrating with Boundary condition
and introducing the uptake capacity (mg of adsorbate/g of adsorbent), the equation (2.5)
becomes
𝑞𝑒
𝑞𝑒−𝑞𝑡= 1 + 𝑘𝑡 (2.6)
Where qe is the uptake capacity at equilibrium, qt is the uptake capacity at any time t. The
above equation was fitted to the investigational dataand model parameters were calculated
23
along with the R2 values. The evaluated value of the kinetic model parameters has been
presented with correlation coefficient R2 in Table 2.2.
2.4.3. First Order Reversible model
The following bio-sorption reaction mechanism assumed that, Chromium adsorption
follows the first order reversible reaction, which gives as
A ↔B
In turn, the rate equation for the reaction is expressed as
𝑑𝐶𝐵
𝑑𝑡= −
𝑑𝐶𝐴
𝑑𝑡= 𝑘1𝐶𝐴 − 𝑘2𝐶𝐵 = 𝑘1(𝐶𝐴0 − 𝐶𝐴0𝑋𝐴) − 𝑘2(𝐶𝐵0 − 𝐶𝐴0) (2.7)
Solving the above equation with Boundary condition yields,
ln(1 − 𝑈𝑡) = −(𝑘1 + 𝑘2)𝑡 (2.8)
Where 𝑈𝑡 =(𝐶𝐴0−𝐶𝐴)
(𝐶𝐴0−𝐶𝐴𝑒)
and CA is concentration of the adsorbate in solution (mg/L), CAO is initial concentration
of the adsorbate, and CAe is concentration of the adsorbate in the solution at equilibrium
condition. Model parameters and R2 values are calculated from the graph between ln (1-
Ut) vs t and shown in Table 2.2.
2.4.4. Pseudo second order model
The pseudo second order kinetics is usually associated with the situation where the rate
of uptake capacity depends on the square of the driving force, that is nothing but the
accessible fraction of the active sites. The rate of reaction depends on the quantity of metal
ions on the surface of the adsorbent and the quantity of metal ions adsorbed at equilibrium.
The rate expression for the adsorption is illustrated as (Ho, 2006):
dq
dt= k[qe − q]2 (2.9)
Where qe is the quantity of Cr(VI) ions adsorbed at equilibrium, q is the amount of Cr(VI)
ions adsorbed at any time t and k is the rate constant.
Integrating the equation (2.9) with boundary condition t=0 to t=t and q=0 to q=q
𝑡
𝑞=
1
𝑘2𝑞𝑒2
−𝑡
𝑞𝑒 (2.10)
24
The values of model parameters along with R2 are calculated from the plot between t/q vs
t/qe and is reported in Table 2.2. From the R2 values in the table shows and confirming
that the adsorption process is pseudo second order kinetics (R2= 0.999).
2.5. Rate controlling mechanism
On porous adsorbents, the adsorption of Cr(VI) is governed by four steps in series. The
four steps are bulk diffusion in solution followed by film diffusion, surface diffusion and
intra-particle diffusion. Either of the above individual steps or combinations of the steps
may control the rate. In case of low stirring speed, the mixing is poor and hence external
transport, i.e., bulk diffusion and film diffusion can be the rate limiting steps. In the current
adsorption process, the adsorbent used is porous in nature and therefore pore diffusion is
also anticipated additionally to surface diffusion. The time variation experimental data can
be used to find out the rate limiting step in the sorption procedure (Baral et al, 2009). In
order to minimise the resistance to external transport, batch adsorption is carried out at
higher agitation speeds. At higher stirring speeds, the resistance to the external transport
reduces significantly due to reduction in thickness of the film adjoining the adsorbent.
Thus, at this stirring speed, it can be safely assumed that external transport isn’t the rate
limiting step. Therefore, either intra-particle or surface diffusion is the rate-determining
step. As they happen simultaneously, among the two transport processes, the slower one
will be the rate limiting step. The intra-particle diffusion model can be interpreted (Baral
et al, 2009) as follows:
𝑞𝑡 = 𝑘𝑖𝑑𝑡1/2 (2.11)
where qt= mg of adsorbate adsorbed per gram of adsorbent (mg/g), t = time of contact (min)
and kid = coefficient for intra-particle diffusion (mg/g min1/2). Linear plots are drawn
between qt versus t1/2 and the kid values are determined from the slope. Outcome of various
experiments are given in Table 2.3. The R2 values in the table specify that, intra-particle
diffusion is the rate determining steps for the adsorption process. Further analysis of data
shows non-linear behaviour of time versus percentage adsorption plot for different sorption
parameters. Therefore, it is assumed that numerous steps may well influence the Cr(VI)
sorption process. So, the entire sorption process is occurring in two different steps: the
early curved portion is the surface diffusion and the latter linear portion is the intra-particle
25
diffusion. With the assumption that adsorbent particles are spherical in geometry the
following equations can be used for surface and intra-particle diffusion:
𝑞𝑡
𝑞𝑒= 6 (
𝐷1
𝜋𝑎2)1/2
𝑡1/2 (2.12)
𝑙𝑛 (1 −𝑞𝑡
𝑞𝑒) = 𝑙𝑛 (
6
𝜋2) − (𝐷2𝜋2𝑡
𝑎2 ) (2.13)
For equation 2.13, a plot between qt/qe and t1/2 is drawn for the initial curved portion. The
values of diffusivity for surface diffusion ‘D1’ and regression coefficient R2 at different
sorption parameter are calculated from the slope of the curve and are shown in Table 2.3.
In order to calculate, ‘D2’ values, plots were drawn between ln(1−qt/qe) and ‘t’ under
diverse adsorption parameters. The values of D2 were calculated from the slope of the curve
and are given in Table 2.3, which showed D2 is always greater than that of the D1.
Therefore, surface diffusion is the slowest steps and hence is the rate limiting steps.
2.6. Equilibrium Adsorption Isotherm
The equilibrium partition between the two phases is an important criterion to be
considered for the successful representation of the dynamic adsorptive separation of the
solute from solution into an adsorbent (Akkaya & Ozer, 2005). An adsorption isotherm
plays a major role, which relates the surface properties and resemblance of the adsorbent
to compare various pollutants uptake capacity (Dursun et al, 2005). Sequentially to find
out the mechanism of Cr(VI) adsorption by the grass and determine the relationship the
experimental data were applied to different isotherm equations.
2.6.1. Freundlich isotherm model
Freundlich isotherm which relates the uptake capacity with equilibrium concentration
widely used isotherms for including bio-sorbents. This equation is outlined below
log qe = log KF +1
n logCe (2.14)
where, KF and 1/n are the Freundlich constants. The qe (mg/g) is the uptake capacity and
Ce (mg/L) is the adsorbate concentration in solution at equilibrium correspondingly. The
values of Freundlich constants are calculated from the graph between log qe vs. log Ce
26
and are shown in Table 2.4. From the table values it clear that it is not following the
Frendlich Isotherm model.
2.6.2. Langmuir isotherm model
The equilibrium relationship between a bulk liquid phase and coverage of molecules on a
solid phase at a fixed temperature was given by Langmuir isotherm (Davis et al, 2003).
There are three important assumptions on the basis of which the Langmuir adsorption was
derived. The assumptions are:
▪ On the adsorbent surface, only monolayer is possible.
▪ All surface sites are same in physical nature.
▪ The adsorption of a molecule on a given site is not dependent on its adjacent sites
occupancy.
Based on the above assumptions, the Langmuir equation is given by:
𝐶𝑒
𝑞𝑒 =
1
𝑄0𝐾 +
𝐶𝑒
𝑄0 (2.15)
Where, Ce and qe are the concentration(mg/L), uptake capacity (mg/g) at equilibrium. Q0
and K are related to uptake capacity and energy of adsorption and are the Langmuir
constants. The model parameters along with the regression coefficients are calculated
from the plot between Ce/qe vs Ce and are shown in Table 2.4. From the table it is observed
that experimental data follows the Langmuir isotherm model, as the R2 values are close
to 1. 0.
2.6.3. Temkin Isotherm
Temkin Isotherm is derived based on the assumption that the heat of adsorption decreases
linearly. The equation for Temkin isotherm model is given by:
𝑞𝑒 =𝑅𝑇
𝑏 𝑙𝑛𝐴 +
𝑅𝑇
𝐵ln 𝐶𝑒 (2.16)
𝑞𝑒 = 𝐵 𝑙𝑛 𝐴 + 𝐵 𝑙𝑛 𝐶𝑒 (2.17)
Where, qe is the uptake capacity in mg/g, Ce is the equilibrium adsorbate concentration
in mg/L and B= RT/b. in the model equation T (K) is the absolute temperature and R is
the universal gas constant. The constant b is related to the heat of Cr(VI) adsorption
27
(Pearse et al, 2003). From the Table 2.4 it is evident that our experiment does not fall on
the Temkin isotherm because of low values of regression coefficients.
2.7. Conclusions
In the present study a novel, low cost, easily accessible and ecofriendly adsorbent i.e.
Sorghastrum NutansL. Nash is used for the treatment of Cr(VI) contaminated wastewater.
The adsorbent is characterized by using XRD, FTIR, SEM and EDAX analysis. Among
different functional groups present in the adsorbent, OH bending, CN stretching/bending
and NH stretching plays a foremost role in Cr(VI) adsorption on the adsorbent. The
mechanism of adsorption is found to be indirect reduction. outcome of various adsorption
parameters like time, pH, concentration and doses on the uptake capacity of the sorbent
is premeditated. Experimental data followed the pseudo second order reaction and
Langmuir isotherm and surface dispersal was found as the rate controlling step.
Fig. 2.1: XRD analysis of adsorbent after adsorption and before adsorption
cou
nts
2Ɵ
28
Fig. 2.2: SEM image of adsorbent before adsorption.
Fig. 2.3: SEM image of adsorbent after adsorption.
29
Fig. 2.4: EDAX image of adsorbent before adsorption.
Fig. 2.5: EDAX image of adsorbent after adsorption
Cr adsorbed
30
Fig. 2.6: FTIR analysis of the adsorbent before and after Cr(VI) adsorption
Fig. 2.7: Effect of contact time on percentage Cr(VI) adsorption. Condition:
Concentration:100 ppm, dose: 5 g/L, Temp:30oC
0
10
20
30
40
50
60
70
80
90
100
0 100 200 300 400 500 600
% A
dso
rpti
on
Time (min)
pH =1.0
pH=1.5
pH=2.0
pH=2.5
pH=3.0
After adsorption
Before Adsorption
3132
1653
1400.3
1269.1
1111
1045.4
898.8
31
Fig. 2.8: Effects of pH on percentage Cr(VI) adsorption and uptake capacity. Condition.
Concentration: 100 ppm, dose: 5g/L, Temp:30oC
Fig. 2.9: Mechanism for Cr(VI) removal by the biomass. Source: Park et al. 2005
0
5
10
15
20
25
0
10
20
30
40
50
60
70
80
90
100
0 0.5 1 1.5 2 2.5 3 3.5
Up
take c
ap
acit
y m
g/g
% A
dso
rpti
on
pH
% Adsorption
uptake capacity
32
Fig. 2.10: Mechanism of Cr(VI) adsorption on grass. Source: (Boddu et al. 2003)
Fig. 2.11: Effect of adsorbent dose on the percentage Cr(VI) adsorption and uptake
capacity. Condition: Concentration:100 ppm, pH: 1.5, Temp:30oC, Size :72 BSS
0
5
10
15
20
25
30
0
10
20
30
40
50
60
70
80
90
100
0 2 4 6 8 10 12
Up
take c
ap
acit
y m
g/g
% A
dso
rpti
on
Dose g/L
%Adsorption
Uptake
33
Fig. 2.12: Effect of initial adsorbate concentration on the percentage of Cr(VI)
concentration and uptake capacity. pH: 1.5, Dose:5 g/L, Size: 72 BSS, Temp:30oC
Fig. 2.13: Effect particle size on percentage Cr(VI) adsorption and uptake capacity.
Condition: pH:1.5, Concentration:100 ppm, dose:5 g/L, Temp:30oC
0
5
10
15
20
25
30
50
55
60
65
70
75
80
85
90
95
100
0 25 50 75 100 125 150 175 200
Up
take c
ap
acit
y m
g/g
% A
dso
rpti
on
Concentration in ppm
%Adsorption
Uptake capacity
10
11
12
13
14
15
16
17
18
19
50
55
60
65
70
75
80
85
90
95
100
0 50 100 150 200
Up
take c
ap
acit
y m
g/g
% A
dso
rpti
on
Particle Size BSS
%Adsorption
Uptake capacity
34
Table 2.1: FTIR Spectrum Analysis of the adsorbent before and after adsorption
IR peak
number
Adsorption band % Transmittance Group Assigned
Before After Diff. After Before Diff.
3132 33.35 1.69 31.66
Hydroxyl stretching vibrations
and hydrogen bonding of
celloligo-saccharides and their
degradation products.
1653 53.67 17.80 35.87 C=N Vibration mode
1400 1400.32 1398.39 1.93 27.91 0.58 27.33 NH Stretching and bending
vibration of N=O group
1269 1261.45 1269.16 7.71 73.05 35.07 37.98 CN stretching and CN
vibration
1111 1107.14 1111 3.86 67.01 22.17 44.84 CN Stretching
1045 1041.56 1045.42 3.86 63.67 18.91 44.76 OH bending
898 896.83 898.83 2.0 81.24 54.26 26.98 C-O-C stretching and CH
deformation
35
Table 2.2: Adsorption Kinetic models parameters
Parameter Values Pseudo 1st order
Richie's 2nd
order
Pseudo 2nd
order First order reversible
k R2 k R2 k R2 k1 k2 R2
Adsorbent dose
(g/L)
1 0.221 0.723 0.078 0.365 0.0008 0.97 0.043 0.124 0.669
3 0.306 0.904 0.137 0.562 0.0017 0.995 0.103 0.133 0.844
5 0.226 0.91 0.056 0.647 0.0030 0.994 0.075 0.129 0.897
7 0.336 0.811 0.542 0.321 0.0044 0.997 0.229 0.042 0.774
10 0.410 0.865 0.408 0.65 0.0060 0.999 0.351 0.002 0.843
Particle mesh
size
(BSS)
36 0.237 0.84 0.076 0.475 0.0027 0.987 0.054 0.143 0.807
52 0.274 0.86 0.122 0.533 0.0030 0.993 0.077 0.149 0.829
72 0.246 0.831 0.101 0.444 0.0029 0.991 0.078 0.133 0.809
100 0.306 0.895 0.195 0.633 0.0040 0.997 0.158 0.113 0.879
150 0.292 0.896 0.193 0.605 0.0047 0.998 0.187 0.090 0.893
pH
1 0.375 0.886 0.409 0.565 0.0032 0.997 0.008 0.002 0.934
1.5 0.267 0.781 0.182 0.358 0.0028 0.991 0.003 0.004 0.821
2 0.318 0.813 0.221 0.497 0.0039 0.989 0.001 0.007 0.909
2.5 0.269 0.771 0.139 0.538 0.0103 0.991 0.000 0.007 0.780
Initial
Concentration
(ppm)
50 0.470 0.771 0.921 0.736 0.0348 0.999 0.042 0.001 0.661
100 0.258 0.907 0.078 0.785 0.0034 0.992 0.002 0.001 0.772
150 0.302 0.904 0.9 0.679 0.0022 0.988 0.004 0.007 0.819
200 0.276 0.939 0.067 0.915 0.0013 0.984 0.005 0.008 0.843
36
Table 2.3: Mass Transfer Model parameters
Parameter Values
qt vs t1/2 qt/qe vs t1/2 ln(1-(qt/qe)) vs t
kid
mg/g min(1/2) R2
D1 mm2/time
10-5 R2
D2 mm2/time
10-3 R2
Adsorbent dose
(g/L)
1 1.481 0.973 0.544 0.869 1.61 0.946
3 1.483 0.977 0.913 0.984 3.47 0.985
5 0.707 0.97 0.52 0.971 3.48 0.933
7 0.653 0.947 1.012 0.989 3.93 0.984
10 0.368 0.903 1.046 0.992 3.48 0.953
Particle mesh size
(BSS)
36 0.672 0.986 0.639 0.979 3.29 0.989
52 0.708 0.976 0.819 0.988 4.10 0.944
72 0.701 0.983 0.52 0.971 3.26 0.980
100 0.708 0.954 0.496 0.982 3.89 0.975
150 0.63 0.958 0.385 0.985 3.44 0.994
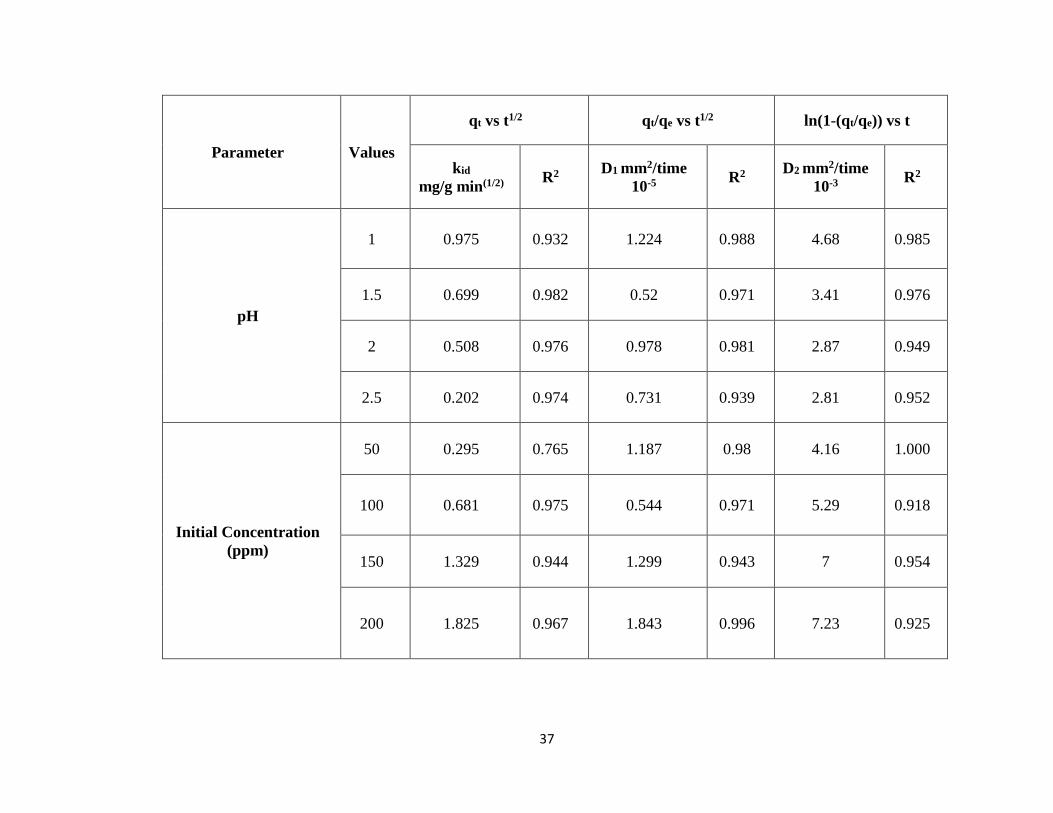
37
Parameter Values
qt vs t1/2 qt/qe vs t1/2 ln(1-(qt/qe)) vs t
kid
mg/g min(1/2) R2
D1 mm2/time
10-5 R2
D2 mm2/time
10-3 R2
pH
1 0.975 0.932 1.224 0.988 4.68 0.985
1.5 0.699 0.982 0.52 0.971 3.41 0.976
2 0.508 0.976 0.978 0.981 2.87 0.949
2.5 0.202 0.974 0.731 0.939 2.81 0.952
Initial Concentration
(ppm)
50 0.295 0.765 1.187 0.98 4.16 1.000
100 0.681 0.975 0.544 0.971 5.29 0.918
150 1.329 0.944 1.299 0.943 7 0.954
200 1.825 0.967 1.843 0.996 7.23 0.925
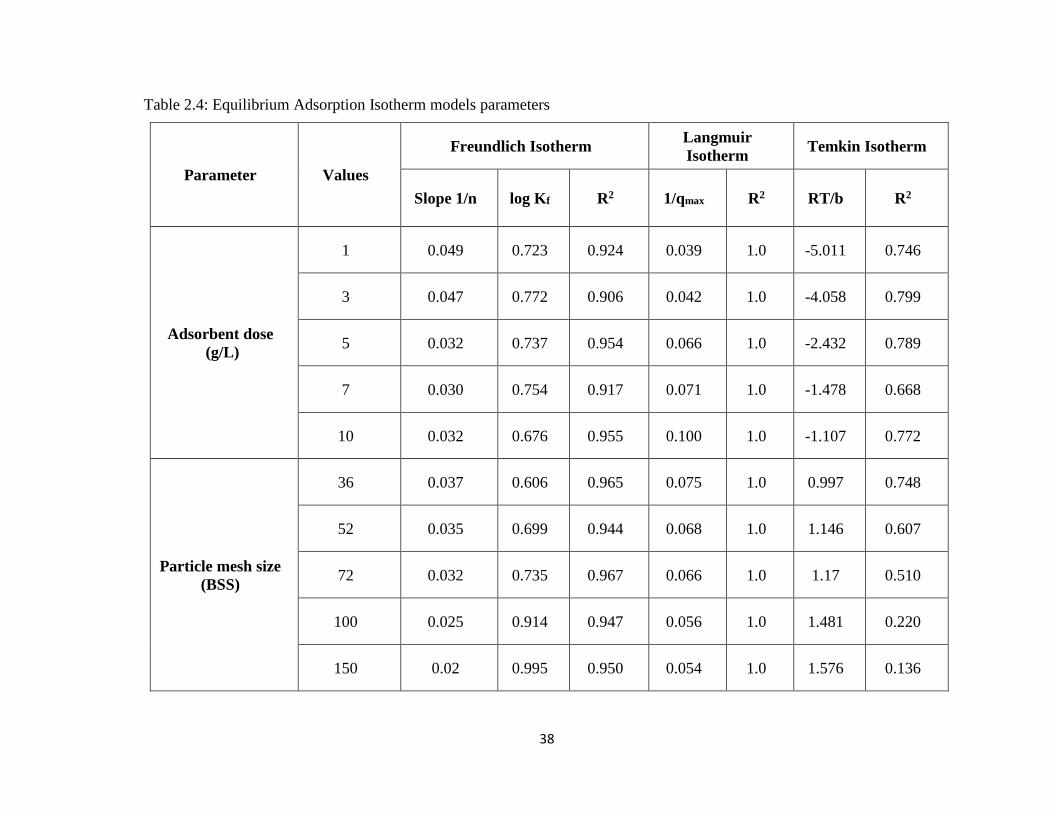
38
Table 2.4: Equilibrium Adsorption Isotherm models parameters
Parameter Values
Freundlich Isotherm Langmuir
Isotherm Temkin Isotherm
Slope 1/n log Kf R2 1/qmax R2 RT/b R2
Adsorbent dose
(g/L)
1 0.049 0.723 0.924 0.039 1.0 -5.011 0.746
3 0.047 0.772 0.906 0.042 1.0 -4.058 0.799
5 0.032 0.737 0.954 0.066 1.0 -2.432 0.789
7 0.030 0.754 0.917 0.071 1.0 -1.478 0.668
10 0.032 0.676 0.955 0.100 1.0 -1.107 0.772
Particle mesh size
(BSS)
36 0.037 0.606 0.965 0.075 1.0 0.997 0.748
52 0.035 0.699 0.944 0.068 1.0 1.146 0.607
72 0.032 0.735 0.967 0.066 1.0 1.17 0.510
100 0.025 0.914 0.947 0.056 1.0 1.481 0.220
150 0.02 0.995 0.950 0.054 1.0 1.576 0.136
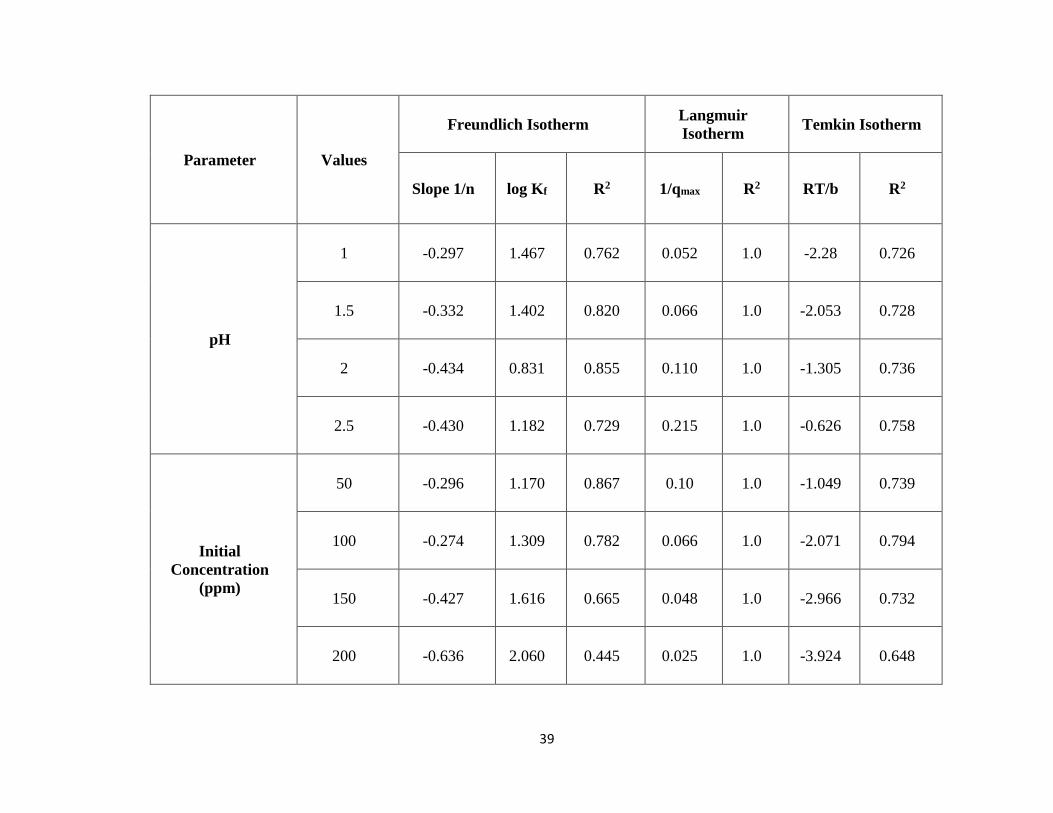
39
Parameter Values
Freundlich Isotherm Langmuir
Isotherm Temkin Isotherm
Slope 1/n log Kf R2 1/qmax R2 RT/b R2
pH
1 -0.297 1.467 0.762 0.052 1.0 -2.28 0.726
1.5 -0.332 1.402 0.820 0.066 1.0 -2.053 0.728
2 -0.434 0.831 0.855 0.110 1.0 -1.305 0.736
2.5 -0.430 1.182 0.729 0.215 1.0 -0.626 0.758
Initial
Concentration
(ppm)
50 -0.296 1.170 0.867 0.10 1.0 -1.049 0.739
100 -0.274 1.309 0.782 0.066 1.0 -2.071 0.794
150 -0.427 1.616 0.665 0.048 1.0 -2.966 0.732
200 -0.636 2.060 0.445 0.025 1.0 -3.924 0.648
40
Chapter-3
Removal of Cr(VI) from
wastewater using Cocos Nucifera
41
3.1 Introduction
In the previous study, Sorghastrum Nutans L. Nash is used for the treatment of Cr(VI)
contaminated wastewater. From the experiments it was observed that the percentage of
Cr(VI) removal at pH 3 was only 4 %. Hence the adsorption capacity of the adsorbent was
very low at higher pH. There is a significant increase in percentage adsorption as well as
uptake capacity of the adsorbent with decrease in pH. Although the adsorption capacity is
significant at lower pH, but adsorption at lower pH will produce acidic effluent which
requires acid neutralization steps which may not be economical and environmental
friendly. Further, using of inorganic acid for the initial pH adjustment can lead to increase
of total solids in the effluent. Therefore, the aim of this study was to explore a new
adsorbent which will have high adsorption capacity at higher pH. The present study
explored the use of natural, environmental friendly and easily available coconut tree
(Cocos Nucifera) leaves as an adsorbent to remove the Cr(VI) from wastewater. Batch
adsorption experiments were carried out in-order to study the effect of different parameters
on adsorption process. The influence of pH, contact time, initial chromium concentration
and adsorbent dosage on the removal of Cr(VI) from the solutions has been investigated.
The removal efficiency and uptake capacity have been correlated with the initial Cr(VI)
concentration, adsorbent dosage as well as the contact time.
3.2 Materials
The adsorbent used in this study is a Coconut leaf which grows in most of the coastal part
of India. The leaves collected from the campus was washed with water thrice to remove
the adherent substance and kept for drying. In order to remove the remaining moisture
after sun drying, the leaves were kept in an oven at 800C for 24 hours. The dried leaves
then grounded to powder form and sieved to different size fractions. The sieved powdered
samples were kept in airtight container for further use.
3.3 Methods
The preparation of representative samples of different Cr(VI) concentration were done as
explained in chapter-2. The pH of the solution was maintained at desired value by adding
weak organic acid i.e. acetic acid (instead of strong inorganic acid in the previous studies)
42
before adsorption. All the chemicals used were of analytical reagent grade and were
obtained from Merck. Adsorption experiments were conducted at a constant temperature
30oC in 500 ml beaker using 250 ml of Cr(VI) solution. The mixtures were agitated by a
magnetic stirrer with speed regulator. 5 ml of samples were collected (by using different
tips) at dynamic condition in a regular time interval and it has been analyzed. The mixture
was filtered through filter paper. The residual Cr(VI) concentration in the filtrate and
uptake was analyzed same as like in the case of grass.
3.4 Results and Discussion
3.4.1 Effect of Contact time
Adsorption experiments were carried out over 600 min to find the equilibrium contact time.
During the experiment, the other adsorption parameters such as stirring speed, adsorbate
concentration, dose, particle size and temperature of the solution were kept constant 100
ppm, 20g/L, 52 BSS and 30 0C, respectively. The results are shown in Fig 3.1. It can be
seen from the figure that the kinetics was very fast during the first 30 min followed by a
slower kinetics. During the faster phase, 80% of the total adsorption was reached. The
adsorption process attained equilibrium within 6 h and beyond that there was hardly any
change in concentration. The initial faster rate may be due to the higher free surface
available initially (Prasad, 2013). Once the available free surface is clogged, then the
adsorbate molecules penetrate through the pores and get adsorbed inside the pore, which is
known as intra-particle diffusion. The intra-particle diffusion accounts for the slower
kinetics at the later stage
3.4.2 Effect of pH
pH is an important parameter affecting the adsorption process. Experiments were carried
out by varying pH between 1.0 and 3 to find out its effect on the percentage of adsorption
and Cr(VI) uptake capacity of the adsorbent (Huang, 2015; Aliabadi, 2006). The results
are shown in Fig.3.2 below. It was observed that the maximum adsorption takes place at
pH of 1.0. Sorption capacity also increases with decreasing the pH. The reason for increase
in adsorption with increase in pH was elaborated in chapter 2. The percentage adsorption
as well as Cr(VI) uptake capacity was maximum at pH 1.0 however, the effluent after
adsorption is highly acidic pH of 2.2. Acidic effluent is not environmental friendly and
43
hence required acid neutralization steps. Further, neutralization of effluent can lead to
increase in total solid and the may not be cost effective process. Therefore, the rest of the
experiments were carried out at pH 3.0.
3.4.3 Effect of dose
The trend of adsorption at varying doses of adsorbent is shown in Fig. 3.3. The percentage
of Cr(VI) removal increased from 45 to 100 with increase in adsorbent dose from 1.0 to 10
g/L. The trend was as per expectations since more active sites of adsorbent were exposed
when the adsorbent dose increased. However, the Cr(VI) uptake capacity of the adsorbent
decreased from 4.4 mg/g to 1 mg/g when the adsorbent increases from 1 g/L to 10 g/L.
This is mainly because of the fact that with increase in adsorbent dose the number of active
site available for adsorption increases whereas limited number of adsorbate molecule
present for the adsorption
3.4.4 Effect of Particle size
The effect of adsorbent particle size was studied under constant initial Cr(VI)
concentration, pH, speed, dosage and temperature. Initially the crushed coconut leaves
have been screened in BSS (British Standard Screen) sieves with different mesh screen.
Experiments were carried out by varying the particle size between 52 BSS to 150 BSS. It
was found that initial the percentage adsorption as well as uptake increases with decrease
in particle size whereas afterword there is no change in percentage adsorption. This is may
be due to the fact that limited number of adsorbate particle present for the large adsorbent
surface. Particles size 100– 150 mesh shows in Fig 3.4, the maximum adsorption capacity.
The percentage adsorption is increases from 91.9% to 100% with increase in mesh size
from 52 BSS to 150 BSS and the Cr(VI) uptake increases from 1.8 mg/g to 2 mg/g.
3.4.5 Effect of Initial Cr(VI) concentration
Assessment of the effect of initial concentration on the adsorption of Cr(VI) on coconut
leaves was carried out by varying the initial Cr(VI) concentration from 10 mg/L to 100
mg/L and the results is shown in Fig 3.5. It was observed that the percentage adsorption
decreased with the increase of adsorbate concentration whereas uptake capacity increases
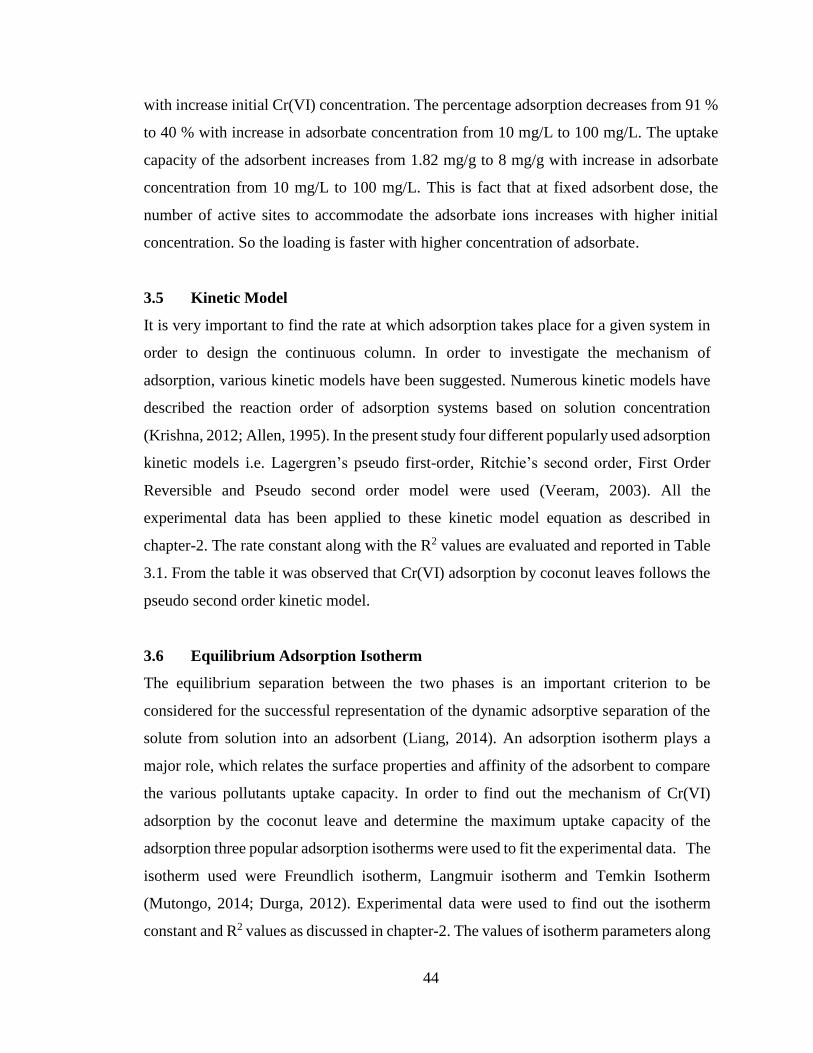
44
with increase initial Cr(VI) concentration. The percentage adsorption decreases from 91 %
to 40 % with increase in adsorbate concentration from 10 mg/L to 100 mg/L. The uptake
capacity of the adsorbent increases from 1.82 mg/g to 8 mg/g with increase in adsorbate
concentration from 10 mg/L to 100 mg/L. This is fact that at fixed adsorbent dose, the
number of active sites to accommodate the adsorbate ions increases with higher initial
concentration. So the loading is faster with higher concentration of adsorbate.
3.5 Kinetic Model
It is very important to find the rate at which adsorption takes place for a given system in
order to design the continuous column. In order to investigate the mechanism of
adsorption, various kinetic models have been suggested. Numerous kinetic models have
described the reaction order of adsorption systems based on solution concentration
(Krishna, 2012; Allen, 1995). In the present study four different popularly used adsorption
kinetic models i.e. Lagergren’s pseudo first-order, Ritchie’s second order, First Order
Reversible and Pseudo second order model were used (Veeram, 2003). All the
experimental data has been applied to these kinetic model equation as described in
chapter-2. The rate constant along with the R2 values are evaluated and reported in Table
3.1. From the table it was observed that Cr(VI) adsorption by coconut leaves follows the
pseudo second order kinetic model.
3.6 Equilibrium Adsorption Isotherm
The equilibrium separation between the two phases is an important criterion to be
considered for the successful representation of the dynamic adsorptive separation of the
solute from solution into an adsorbent (Liang, 2014). An adsorption isotherm plays a
major role, which relates the surface properties and affinity of the adsorbent to compare
the various pollutants uptake capacity. In order to find out the mechanism of Cr(VI)
adsorption by the coconut leave and determine the maximum uptake capacity of the
adsorption three popular adsorption isotherms were used to fit the experimental data. The
isotherm used were Freundlich isotherm, Langmuir isotherm and Temkin Isotherm
(Mutongo, 2014; Durga, 2012). Experimental data were used to find out the isotherm
constant and R2 values as discussed in chapter-2. The values of isotherm parameters along
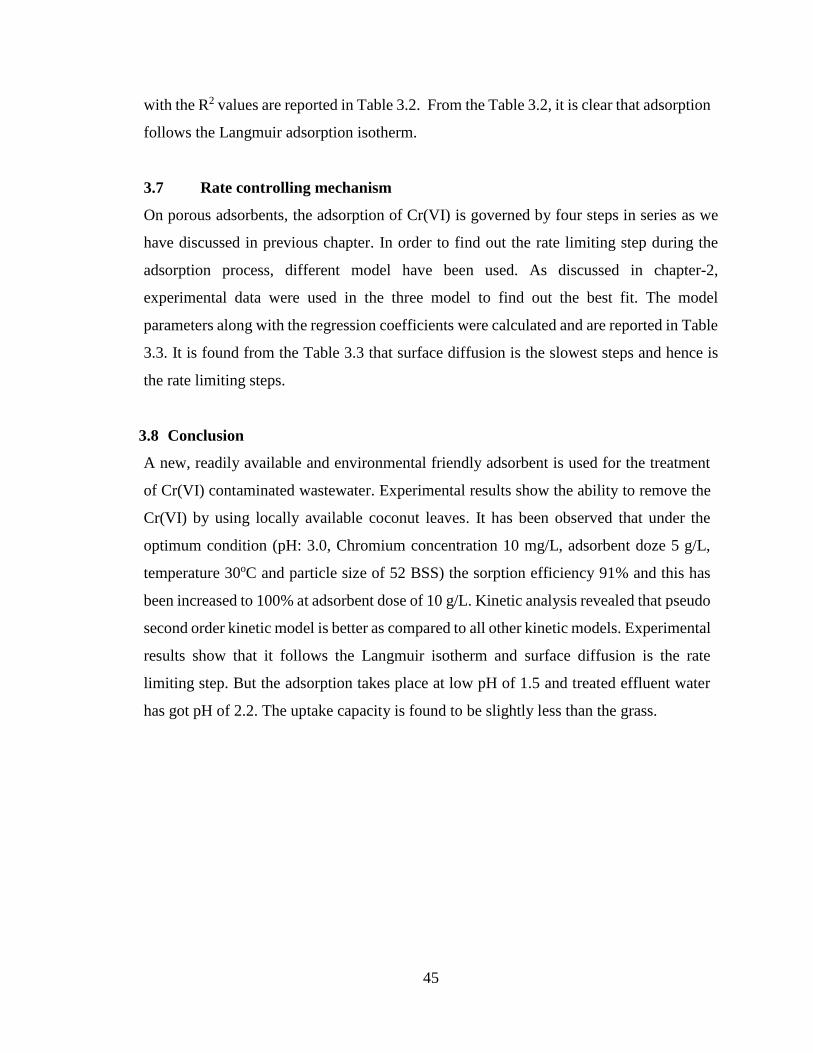
45
with the R2 values are reported in Table 3.2. From the Table 3.2, it is clear that adsorption
follows the Langmuir adsorption isotherm.
3.7 Rate controlling mechanism
On porous adsorbents, the adsorption of Cr(VI) is governed by four steps in series as we
have discussed in previous chapter. In order to find out the rate limiting step during the
adsorption process, different model have been used. As discussed in chapter-2,
experimental data were used in the three model to find out the best fit. The model
parameters along with the regression coefficients were calculated and are reported in Table
3.3. It is found from the Table 3.3 that surface diffusion is the slowest steps and hence is
the rate limiting steps.
3.8 Conclusion
A new, readily available and environmental friendly adsorbent is used for the treatment
of Cr(VI) contaminated wastewater. Experimental results show the ability to remove the
Cr(VI) by using locally available coconut leaves. It has been observed that under the
optimum condition (pH: 3.0, Chromium concentration 10 mg/L, adsorbent doze 5 g/L,
temperature 30oC and particle size of 52 BSS) the sorption efficiency 91% and this has
been increased to 100% at adsorbent dose of 10 g/L. Kinetic analysis revealed that pseudo
second order kinetic model is better as compared to all other kinetic models. Experimental
results show that it follows the Langmuir isotherm and surface diffusion is the rate
limiting step. But the adsorption takes place at low pH of 1.5 and treated effluent water
has got pH of 2.2. The uptake capacity is found to be slightly less than the grass.
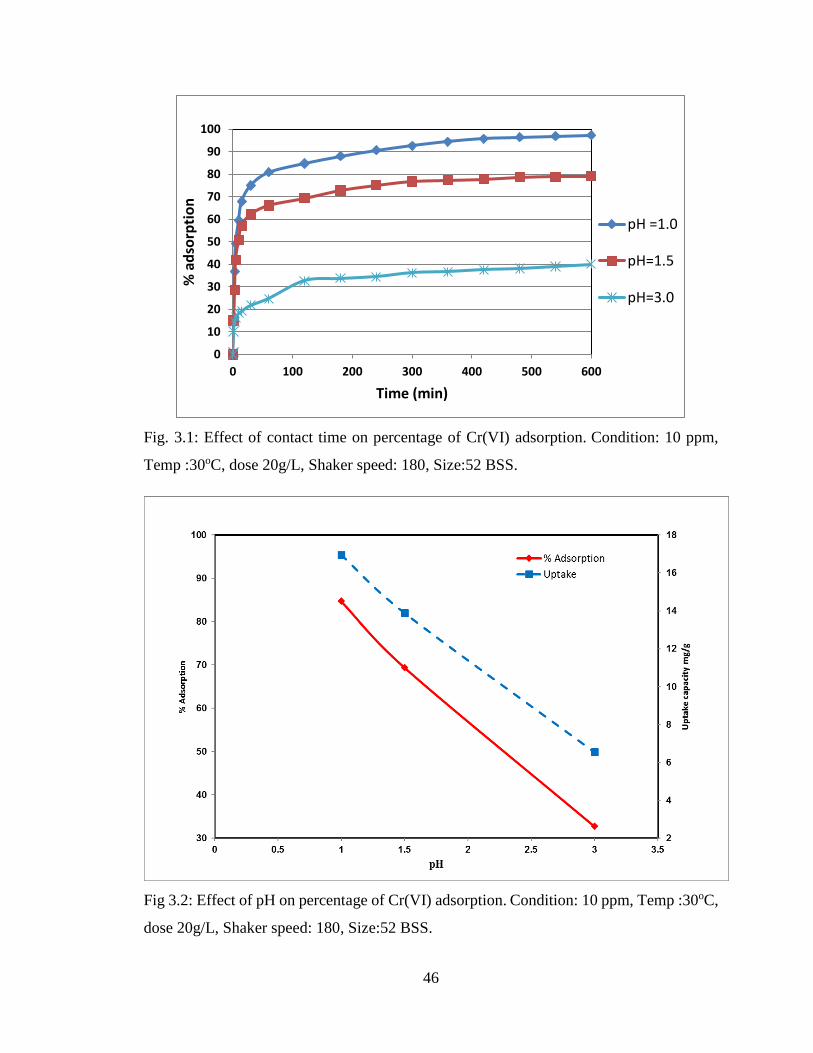
46
Fig. 3.1: Effect of contact time on percentage of Cr(VI) adsorption. Condition: 10 ppm,
Temp :30oC, dose 20g/L, Shaker speed: 180, Size:52 BSS.
Fig 3.2: Effect of pH on percentage of Cr(VI) adsorption. Condition: 10 ppm, Temp :30oC,
dose 20g/L, Shaker speed: 180, Size:52 BSS.
0
10
20
30
40
50
60
70
80
90
100
0 100 200 300 400 500 600
% a
dso
rpti
on
Time (min)
pH =1.0
pH=1.5
pH=3.0
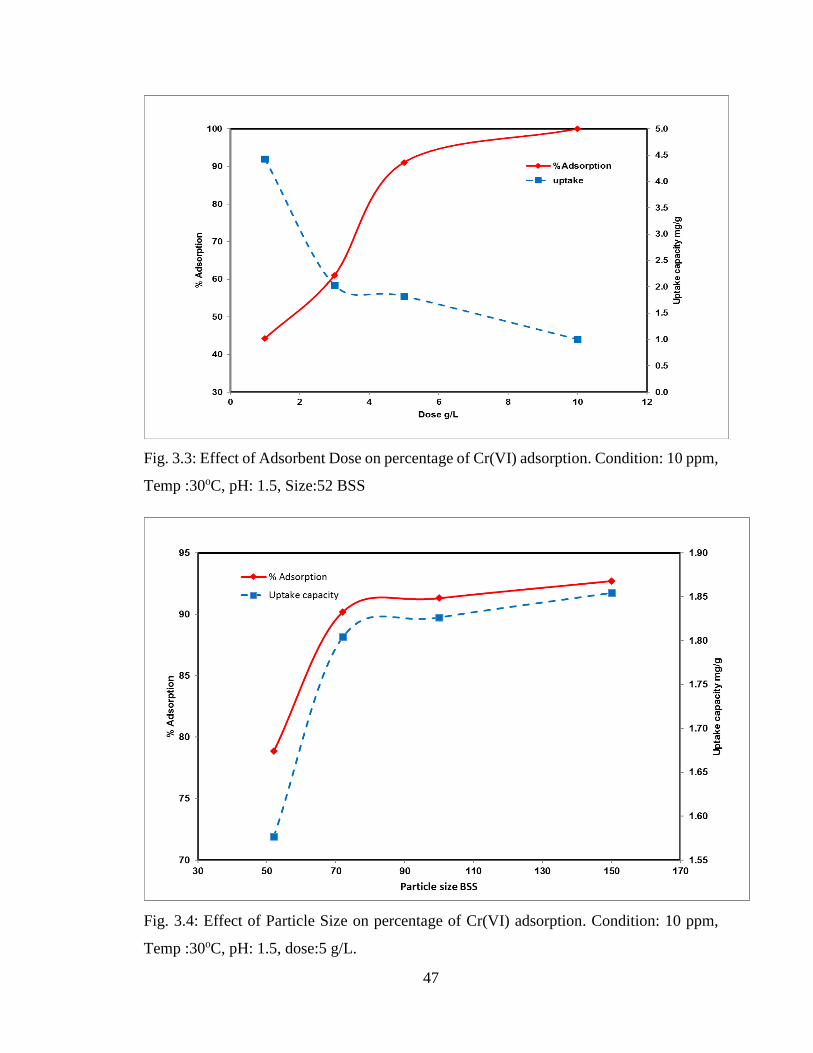
47
Fig. 3.3: Effect of Adsorbent Dose on percentage of Cr(VI) adsorption. Condition: 10 ppm,
Temp :30oC, pH: 1.5, Size:52 BSS
Fig. 3.4: Effect of Particle Size on percentage of Cr(VI) adsorption. Condition: 10 ppm,
Temp :30oC, pH: 1.5, dose:5 g/L.
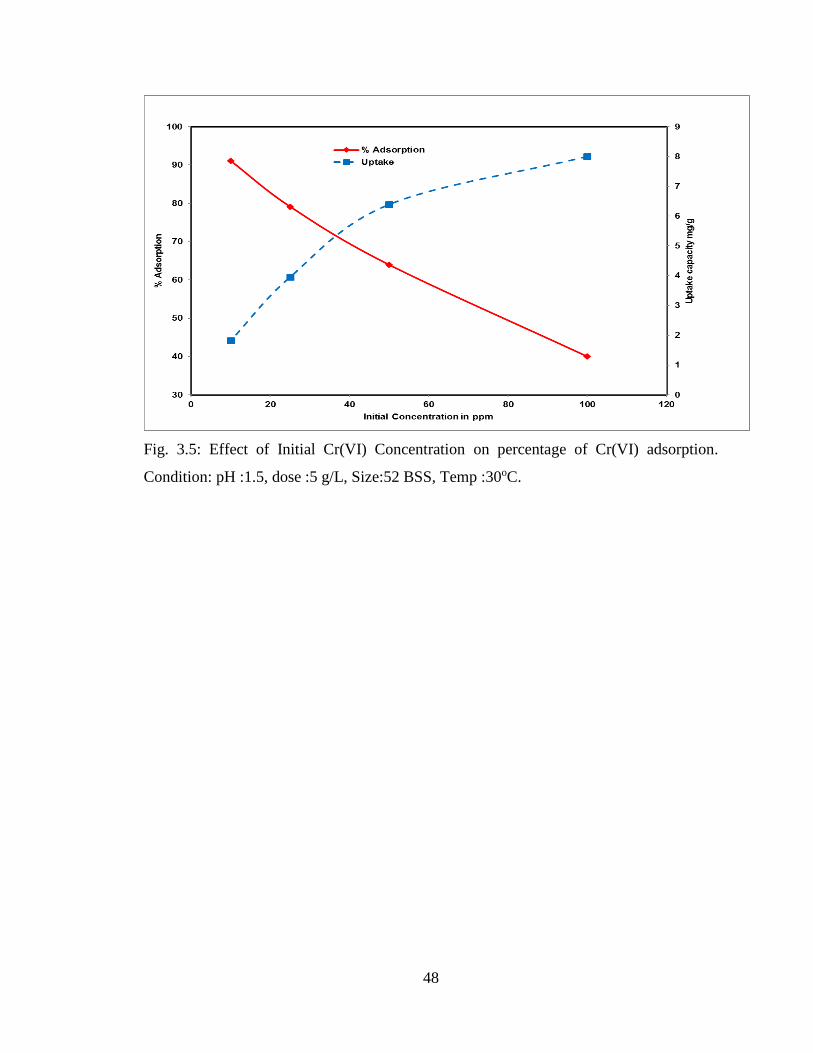
48
Fig. 3.5: Effect of Initial Cr(VI) Concentration on percentage of Cr(VI) adsorption.
Condition: pH :1.5, dose :5 g/L, Size:52 BSS, Temp :30oC.
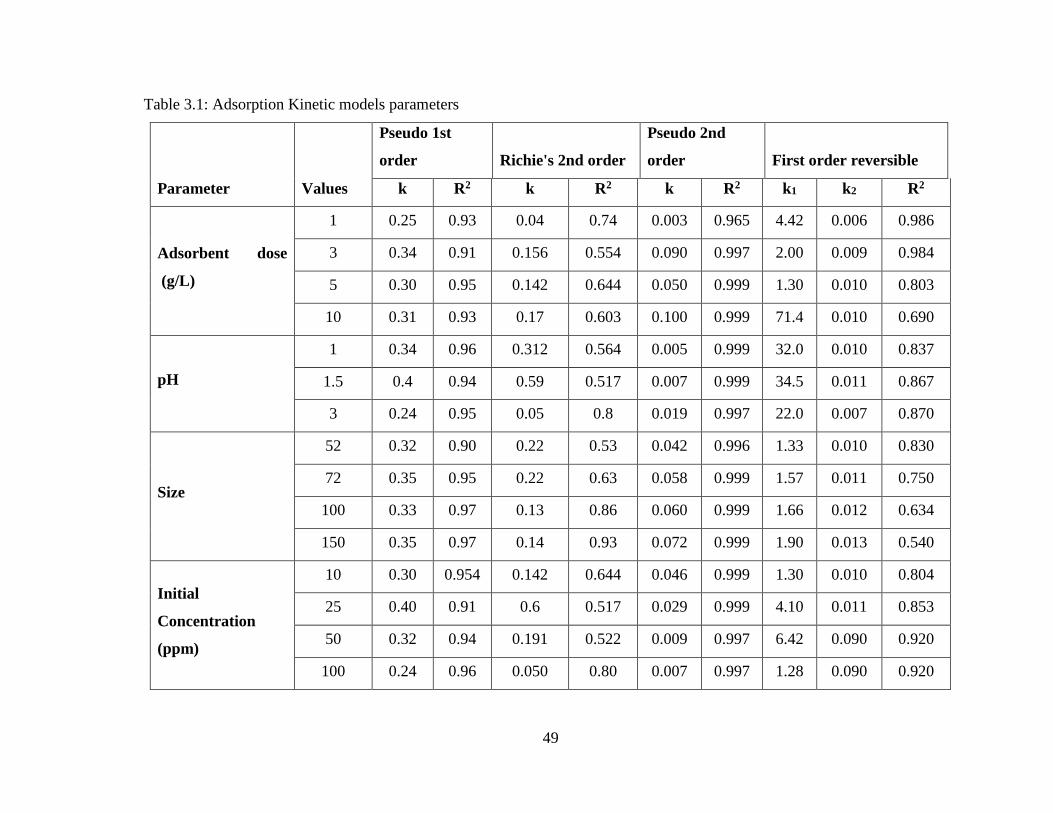
49
Table 3.1: Adsorption Kinetic models parameters
Parameter Values
Pseudo 1st
order Richie's 2nd order
Pseudo 2nd
order First order reversible
k R2 k R2 k R2 k1 k2 R2
Adsorbent dose
(g/L)
1 0.25 0.93 0.04 0.74 0.003 0.965 4.42 0.006 0.986
3 0.34 0.91 0.156 0.554 0.090 0.997 2.00 0.009 0.984
5 0.30 0.95 0.142 0.644 0.050 0.999 1.30 0.010 0.803
10 0.31 0.93 0.17 0.603 0.100 0.999 71.4 0.010 0.690
pH
1 0.34 0.96 0.312 0.564 0.005 0.999 32.0 0.010 0.837
1.5 0.4 0.94 0.59 0.517 0.007 0.999 34.5 0.011 0.867
3 0.24 0.95 0.05 0.8 0.019 0.997 22.0 0.007 0.870
Size
52 0.32 0.90 0.22 0.53 0.042 0.996 1.33 0.010 0.830
72 0.35 0.95 0.22 0.63 0.058 0.999 1.57 0.011 0.750
100 0.33 0.97 0.13 0.86 0.060 0.999 1.66 0.012 0.634
150 0.35 0.97 0.14 0.93 0.072 0.999 1.90 0.013 0.540
Initial
Concentration
(ppm)
10 0.30 0.954 0.142 0.644 0.046 0.999 1.30 0.010 0.804
25 0.40 0.91 0.6 0.517 0.029 0.999 4.10 0.011 0.853
50 0.32 0.94 0.191 0.522 0.009 0.997 6.42 0.090 0.920
100 0.24 0.96 0.050 0.80 0.007 0.997 1.28 0.090 0.920
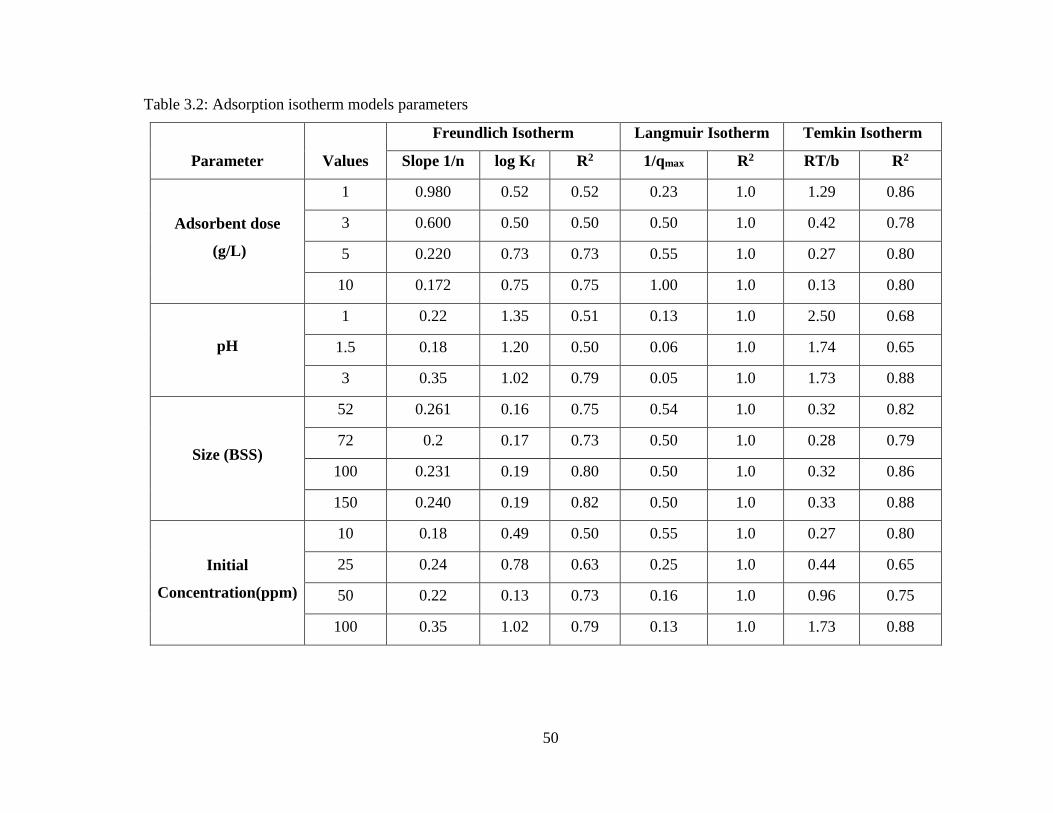
50
Table 3.2: Adsorption isotherm models parameters
Parameter Values
Freundlich Isotherm Langmuir Isotherm Temkin Isotherm
Slope 1/n log Kf R2 1/qmax R2 RT/b R2
Adsorbent dose
(g/L)
1 0.980 0.52 0.52 0.23 1.0 1.29 0.86
3 0.600 0.50 0.50 0.50 1.0 0.42 0.78
5 0.220 0.73 0.73 0.55 1.0 0.27 0.80
10 0.172 0.75 0.75 1.00 1.0 0.13 0.80
pH
1 0.22 1.35 0.51 0.13 1.0 2.50 0.68
1.5 0.18 1.20 0.50 0.06 1.0 1.74 0.65
3 0.35 1.02 0.79 0.05 1.0 1.73 0.88
Size (BSS)
52 0.261 0.16 0.75 0.54 1.0 0.32 0.82
72 0.2 0.17 0.73 0.50 1.0 0.28 0.79
100 0.231 0.19 0.80 0.50 1.0 0.32 0.86
150 0.240 0.19 0.82 0.50 1.0 0.33 0.88
Initial
Concentration(ppm)
10 0.18 0.49 0.50 0.55 1.0 0.27 0.80
25 0.24 0.78 0.63 0.25 1.0 0.44 0.65
50 0.22 0.13 0.73 0.16 1.0 0.96 0.75
100 0.35 1.02 0.79 0.13 1.0 1.73 0.88
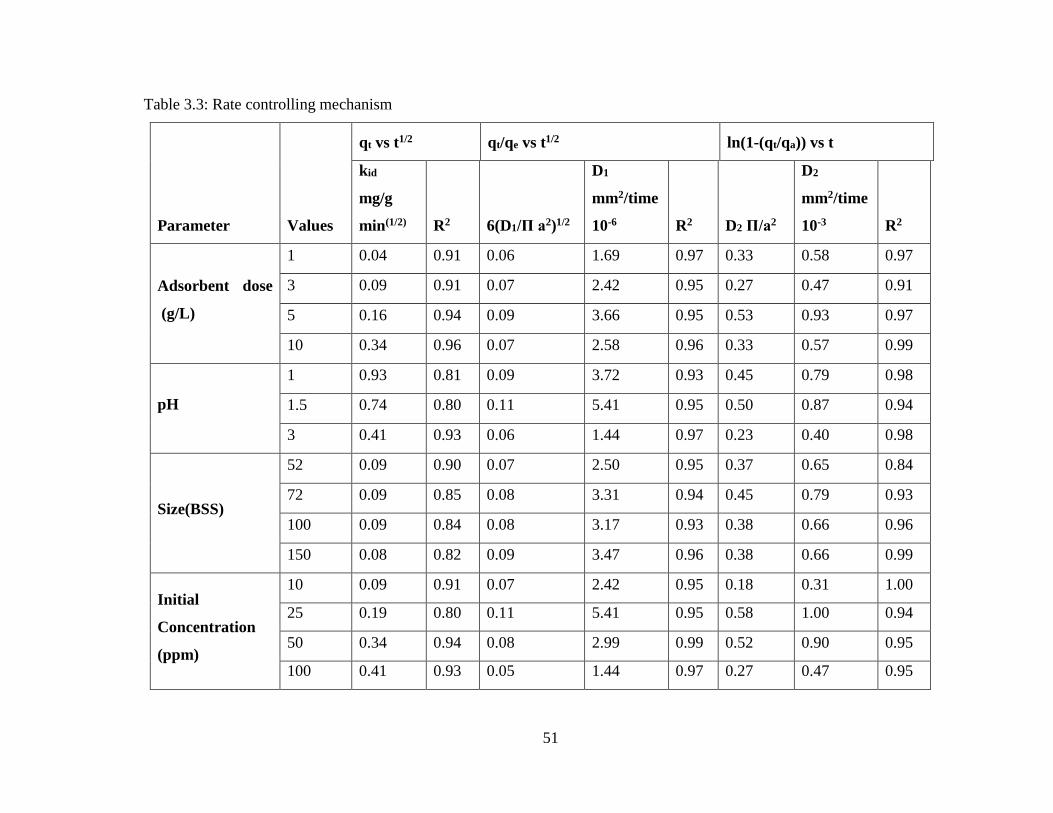
51
Table 3.3: Rate controlling mechanism
Parameter Values
qt vs t1/2 qt/qe vs t1/2 ln(1-(qt/qa)) vs t
kid
mg/g
min(1/2) R2 6(D1/Π a2)1/2
D1
mm2/time
10-6 R2 D2 Π/a2
D2
mm2/time
10-3 R2
Adsorbent dose
(g/L)
1 0.04 0.91 0.06 1.69 0.97 0.33 0.58 0.97
3 0.09 0.91 0.07 2.42 0.95 0.27 0.47 0.91
5 0.16 0.94 0.09 3.66 0.95 0.53 0.93 0.97
10 0.34 0.96 0.07 2.58 0.96 0.33 0.57 0.99
pH
1 0.93 0.81 0.09 3.72 0.93 0.45 0.79 0.98
1.5 0.74 0.80 0.11 5.41 0.95 0.50 0.87 0.94
3 0.41 0.93 0.06 1.44 0.97 0.23 0.40 0.98
Size(BSS)
52 0.09 0.90 0.07 2.50 0.95 0.37 0.65 0.84
72 0.09 0.85 0.08 3.31 0.94 0.45 0.79 0.93
100 0.09 0.84 0.08 3.17 0.93 0.38 0.66 0.96
150 0.08 0.82 0.09 3.47 0.96 0.38 0.66 0.99
Initial
Concentration
(ppm)
10 0.09 0.91 0.07 2.42 0.95 0.18 0.31 1.00
25 0.19 0.80 0.11 5.41 0.95 0.58 1.00 0.94
50 0.34 0.94 0.08 2.99 0.99 0.52 0.90 0.95
100 0.41 0.93 0.05 1.44 0.97 0.27 0.47 0.95
52
Chapter-4
Removal of Cr(VI) from
wastewater using pig iron
sludge
53
4.1 Introduction
From the extensive literature survey, it is observed that naturally available, low cost bio-
sorbents have a potential for the treatment of Cr(VI) contaminated wastewater. But from
our previous studies, it was observed that the adsorption capacity of the bio-sorbents is
high at lower pH. Adsorptive removal of Cr(VI) at lower pH is not environmental friendly
and requires further neutralization steps which may not be environmental friendly in terms
of TDS increase. Further, the tannin and lignin presents in the biomaterials may leach out
and create environmental pollution and hence requires suitable pre-treatment which may
not be economical and environmental friendly. In addition, the economics of an adsorption
process is dependent on the number of adsorption-desorption cycle of each adsorbent. The
amine and electron donor groups presence in the biomaterials leads indirect reduction and
increases the chemisorption. As the pH of the aqueous phase is lowered, a large number of
hydrogen ions can easily coordinate with the amino, hydroxyl, CN and react with the
Cr2O72- which is irreversible. Therefore, regeneration of the adsorbents is not possible and
hence the use of such adsorbents may not be economically feasible and thus can lead to
disposal problems. Therefore, the present study aimed at finding a pig iron sludge as an
adsorbent which can be recycled along with the adsorbed Cr(VI).
The present study explored the use of pig iron sludge as adsorbent to remove the Cr(VI)
from wastewater. Batch adsorption process was carried out in-order to study the effect of
different parameters on adsorption process. The study of different parameters like pH,
contact time, initial Cr(VI) concentration and adsorbent dose, on the removal of Cr (VI)
from the solutions has been investigated. The removal efficiency has been correlated with
all the parameters.
Generally Iron ore in the form of hematite (Fe2O3) or magnetite (Fe3O4). Natural Ores
contain high quantity of hematite or magnetite (greater than 60% Fe) implying that they
can be used directly in blast furnaces for iron making. Pig Iron which is produced from this
Iron ore is the main resources for the production of steel. Approximately 98% of this mined
iron ore is used to produce steel. Also, most Indian ores are low in Phosphorous content
54
and hence are ideally suited for smelting in iron and steel. (Indian Minerials Year Book,
2012, part III).
Goa is the fourth largest producer of iron ore in India. Goa produces about 18 per cent of
the total iron ore of the country. The iron ore of north Goa is of superior quality. The main
deposits and mining centers are at Pirna-Adolpale-Asnora, Sanquelim Onda, Kundem-
Surla, and Sirigao-Bicholim-Dalda in north Goa. The nearby Marmagao seaport is a big
advantage to these mines for the export of iron ore. The iron ore is exported mainly to
Japan and Iran. The mining area in Goa covers 700 sq. km approximately.
Capacity of this plant is 2,50,000 tons as per 2014 data and there will be a expansion in
2017. The following is the overall reaction involved in the production of Pig Iron
manufacturing unit.
Fe2O3 + 3C 2Fe + 3CO
Fig. 4.1 represents the sequence of operation involved in the ore mining and pig iron
manufacturing plant.
Iron bearing minerals namely biotite, hematite, pyrite, magnetite etc., have also
demonstrated their effectiveness in Cr(VI) removal (Eary & Rai, 1989; Ilton & Veblen,
1994; Bidoglio et al, 1993; Peterson et al, 1996; Peterson et al, 1997). During the
production of Pig iron in open cast furnace, a large quantity of fine particles used to come
out as an overhead product. This fine particle of ore is wet-scrubbed and the sludge is
recycling back to the initial stage i.e. filtering stage. We have used sludge as an adsorbent
to remove the Cr(VI) and recycle this adsorbent along with the adsorbed Cr(VI) into the
pig iron processing unit. This paper discusses the process of recycling these dumped sludge
(containing moisture with high iron content) in the plant. This sludge is dehydrated and
combined with the raw material in the processing stage of filtering. The proposed flow
diagram (Fig. 4.2) shows that how to use the sludge as a raw material to remove the Cr(VI)
present in the industrial effluent and recycle back to the filtering stage.
55
4.2 Materials
The adsorbent used in this study was collected from the pig iron manufacture industry of
Sesa Goa, Vedanta limited. Vedanta has large iron ore mines in Goa and Karnataka and a
pig iron plant in Goa, and consists of exploration, mining and processing of iron ore, pig
iron and metallurgical coke and power generation. The Sesa Goa is located at Amona, Goa
which 40 km from BITS Pilani K. K. Birla Goa Campus. In order to remove the moisture,
the adsorbent is dried at 1000C in an oven for 24 hours. The composition of the sludge is
shown in Table 4.1. The dried sludge which was in the powdered form was sieved (BSS
standard screens) to different size fraction and were kept in airtight container for further
use. A stock Cr(VI) solution and complexing agent solution was prepared as discussed in
chapter 2. In order to meet the desired and maintain the value pH of the solution done by
adding diluted organic acid (concentration of 0.1 N) solution before adsorption. All the
chemicals used were of Merck analytical reagent grade.
4.3 Methods
Adsorption experiments were conducted at a constant temperature in 250 ml beaker using
200 ml of Cr(VI) solution. In order to make uniform concentration along the beaker, the
mixtures were stirred with speed regulator. 5 ml of samples were collected (by using
different tips) under dynamic condition in a regular time interval and it has been analyzed.
Whatman 42 filter paper has been used to collect the filtered solution. The residual filtrate
Cr(VI) concentration has been analyzed spectrophotometrically after complexation of
Cr(VI) ion with 1,5 Di-Phenyl Carbazide in acidic condition. UV/Visible
Spectrophotometer (Hach DR 5000, model: 1201) was used to find the Absorbance and it
is recorded at 540 nm.
4.4 Results and Discussion
4.4.1 Characterization of Adsorbent
In order to find out the morphological changes in the adsorbent, the powdered adsorbent
both before and after adsorption was investigated by the Scanning electron microprobe
images are (SEM JXO-8100) at 1000X magnification. These results were presented in Fig.
4.3 and 4.4. From the micrograph image, it is clearly observed that there is a change in
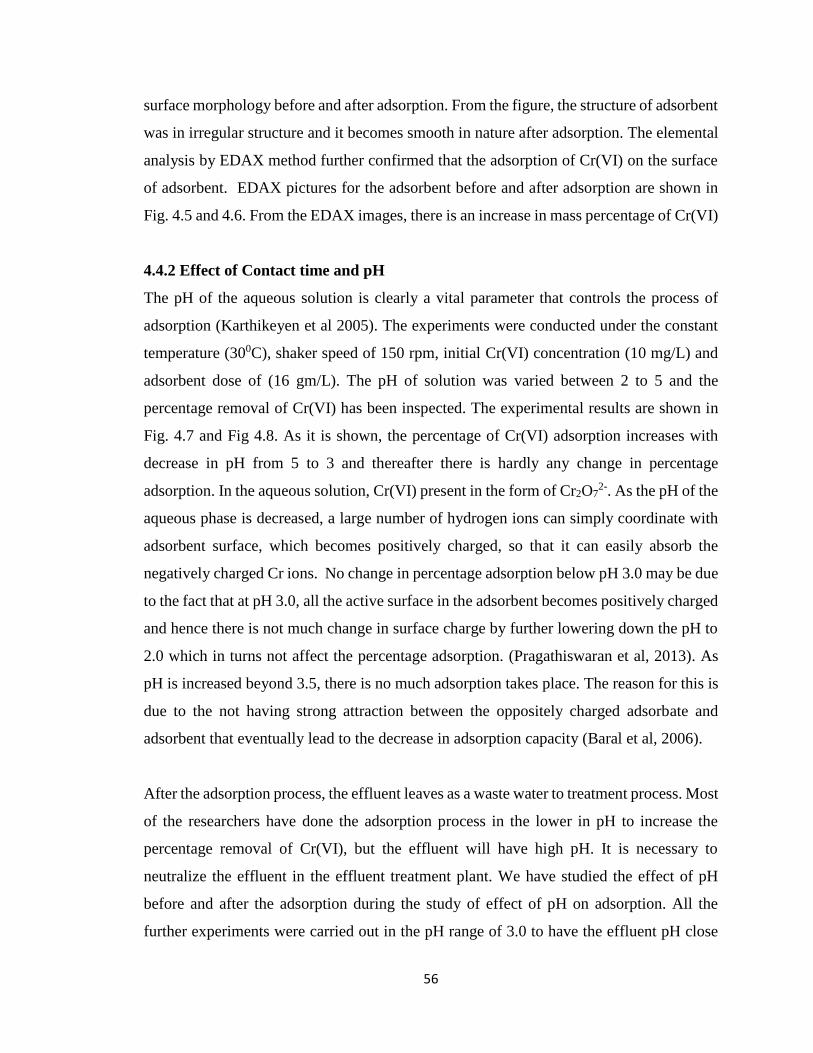
56
surface morphology before and after adsorption. From the figure, the structure of adsorbent
was in irregular structure and it becomes smooth in nature after adsorption. The elemental
analysis by EDAX method further confirmed that the adsorption of Cr(VI) on the surface
of adsorbent. EDAX pictures for the adsorbent before and after adsorption are shown in
Fig. 4.5 and 4.6. From the EDAX images, there is an increase in mass percentage of Cr(VI)
4.4.2 Effect of Contact time and pH
The pH of the aqueous solution is clearly a vital parameter that controls the process of
adsorption (Karthikeyen et al 2005). The experiments were conducted under the constant
temperature (300C), shaker speed of 150 rpm, initial Cr(VI) concentration (10 mg/L) and
adsorbent dose of (16 gm/L). The pH of solution was varied between 2 to 5 and the
percentage removal of Cr(VI) has been inspected. The experimental results are shown in
Fig. 4.7 and Fig 4.8. As it is shown, the percentage of Cr(VI) adsorption increases with
decrease in pH from 5 to 3 and thereafter there is hardly any change in percentage
adsorption. In the aqueous solution, Cr(VI) present in the form of Cr2O72-. As the pH of the
aqueous phase is decreased, a large number of hydrogen ions can simply coordinate with
adsorbent surface, which becomes positively charged, so that it can easily absorb the
negatively charged Cr ions. No change in percentage adsorption below pH 3.0 may be due
to the fact that at pH 3.0, all the active surface in the adsorbent becomes positively charged
and hence there is not much change in surface charge by further lowering down the pH to
2.0 which in turns not affect the percentage adsorption. (Pragathiswaran et al, 2013). As
pH is increased beyond 3.5, there is no much adsorption takes place. The reason for this is
due to the not having strong attraction between the oppositely charged adsorbate and
adsorbent that eventually lead to the decrease in adsorption capacity (Baral et al, 2006).
After the adsorption process, the effluent leaves as a waste water to treatment process. Most
of the researchers have done the adsorption process in the lower in pH to increase the
percentage removal of Cr(VI), but the effluent will have high pH. It is necessary to
neutralize the effluent in the effluent treatment plant. We have studied the effect of pH
before and after the adsorption during the study of effect of pH on adsorption. All the
further experiments were carried out in the pH range of 3.0 to have the effluent pH close
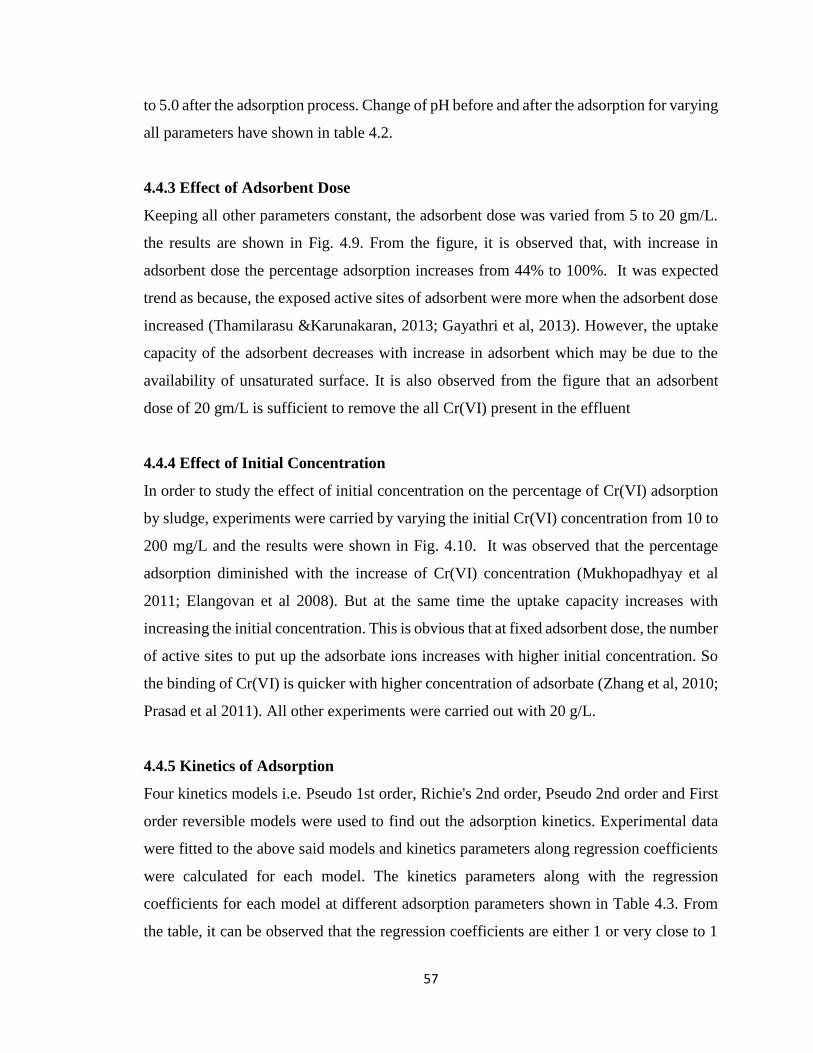
57
to 5.0 after the adsorption process. Change of pH before and after the adsorption for varying
all parameters have shown in table 4.2.
4.4.3 Effect of Adsorbent Dose
Keeping all other parameters constant, the adsorbent dose was varied from 5 to 20 gm/L.
the results are shown in Fig. 4.9. From the figure, it is observed that, with increase in
adsorbent dose the percentage adsorption increases from 44% to 100%. It was expected
trend as because, the exposed active sites of adsorbent were more when the adsorbent dose
increased (Thamilarasu &Karunakaran, 2013; Gayathri et al, 2013). However, the uptake
capacity of the adsorbent decreases with increase in adsorbent which may be due to the
availability of unsaturated surface. It is also observed from the figure that an adsorbent
dose of 20 gm/L is sufficient to remove the all Cr(VI) present in the effluent
4.4.4 Effect of Initial Concentration
In order to study the effect of initial concentration on the percentage of Cr(VI) adsorption
by sludge, experiments were carried by varying the initial Cr(VI) concentration from 10 to
200 mg/L and the results were shown in Fig. 4.10. It was observed that the percentage
adsorption diminished with the increase of Cr(VI) concentration (Mukhopadhyay et al
2011; Elangovan et al 2008). But at the same time the uptake capacity increases with
increasing the initial concentration. This is obvious that at fixed adsorbent dose, the number
of active sites to put up the adsorbate ions increases with higher initial concentration. So
the binding of Cr(VI) is quicker with higher concentration of adsorbate (Zhang et al, 2010;
Prasad et al 2011). All other experiments were carried out with 20 g/L.
4.4.5 Kinetics of Adsorption
Four kinetics models i.e. Pseudo 1st order, Richie's 2nd order, Pseudo 2nd order and First
order reversible models were used to find out the adsorption kinetics. Experimental data
were fitted to the above said models and kinetics parameters along regression coefficients
were calculated for each model. The kinetics parameters along with the regression
coefficients for each model at different adsorption parameters shown in Table 4.3. From
the table, it can be observed that the regression coefficients are either 1 or very close to 1
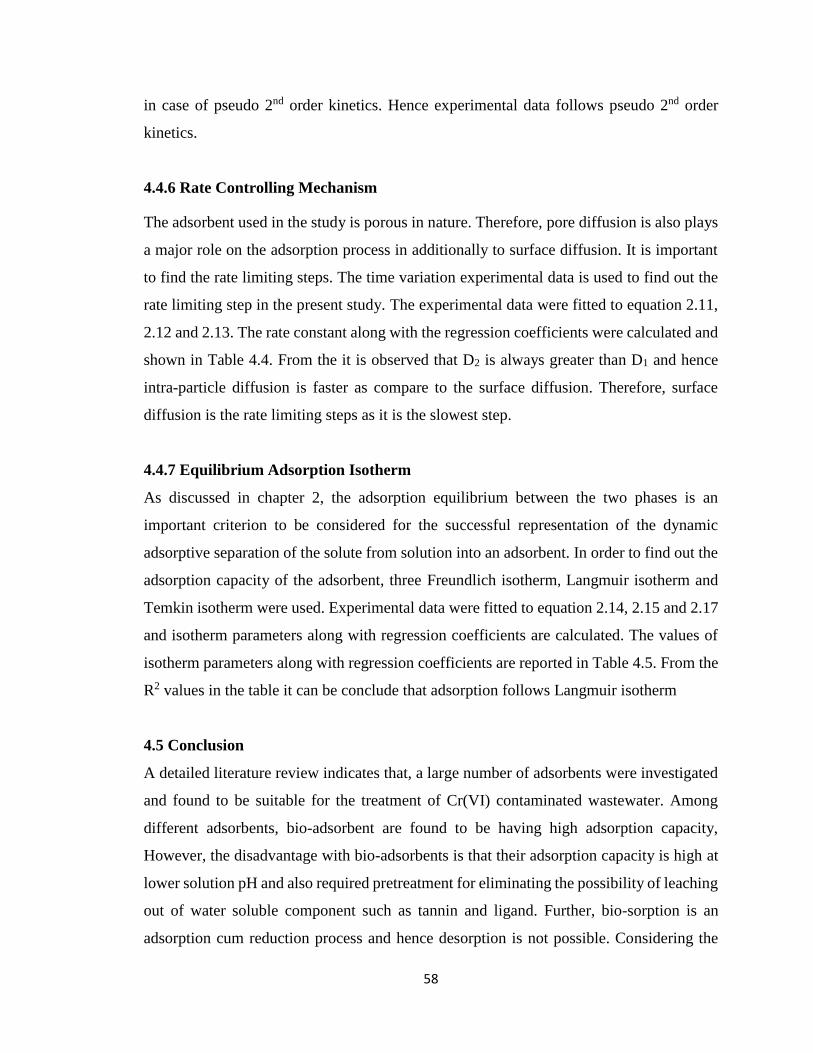
58
in case of pseudo 2nd order kinetics. Hence experimental data follows pseudo 2nd order
kinetics.
4.4.6 Rate Controlling Mechanism
The adsorbent used in the study is porous in nature. Therefore, pore diffusion is also plays
a major role on the adsorption process in additionally to surface diffusion. It is important
to find the rate limiting steps. The time variation experimental data is used to find out the
rate limiting step in the present study. The experimental data were fitted to equation 2.11,
2.12 and 2.13. The rate constant along with the regression coefficients were calculated and
shown in Table 4.4. From the it is observed that D2 is always greater than D1 and hence
intra-particle diffusion is faster as compare to the surface diffusion. Therefore, surface
diffusion is the rate limiting steps as it is the slowest step.
4.4.7 Equilibrium Adsorption Isotherm
As discussed in chapter 2, the adsorption equilibrium between the two phases is an
important criterion to be considered for the successful representation of the dynamic
adsorptive separation of the solute from solution into an adsorbent. In order to find out the
adsorption capacity of the adsorbent, three Freundlich isotherm, Langmuir isotherm and
Temkin isotherm were used. Experimental data were fitted to equation 2.14, 2.15 and 2.17
and isotherm parameters along with regression coefficients are calculated. The values of
isotherm parameters along with regression coefficients are reported in Table 4.5. From the
R2 values in the table it can be conclude that adsorption follows Langmuir isotherm
4.5 Conclusion
A detailed literature review indicates that, a large number of adsorbents were investigated
and found to be suitable for the treatment of Cr(VI) contaminated wastewater. Among
different adsorbents, bio-adsorbent are found to be having high adsorption capacity,
However, the disadvantage with bio-adsorbents is that their adsorption capacity is high at
lower solution pH and also required pretreatment for eliminating the possibility of leaching
out of water soluble component such as tannin and ligand. Further, bio-sorption is an
adsorption cum reduction process and hence desorption is not possible. Considering the
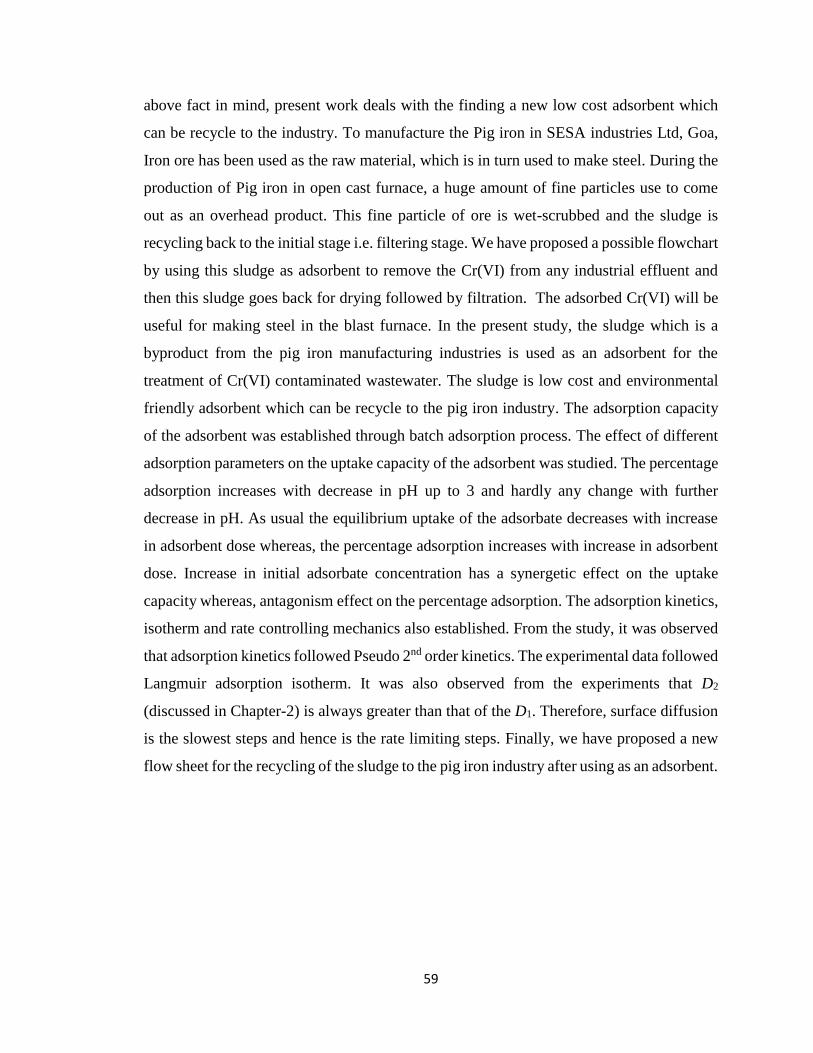
59
above fact in mind, present work deals with the finding a new low cost adsorbent which
can be recycle to the industry. To manufacture the Pig iron in SESA industries Ltd, Goa,
Iron ore has been used as the raw material, which is in turn used to make steel. During the
production of Pig iron in open cast furnace, a huge amount of fine particles use to come
out as an overhead product. This fine particle of ore is wet-scrubbed and the sludge is
recycling back to the initial stage i.e. filtering stage. We have proposed a possible flowchart
by using this sludge as adsorbent to remove the Cr(VI) from any industrial effluent and
then this sludge goes back for drying followed by filtration. The adsorbed Cr(VI) will be
useful for making steel in the blast furnace. In the present study, the sludge which is a
byproduct from the pig iron manufacturing industries is used as an adsorbent for the
treatment of Cr(VI) contaminated wastewater. The sludge is low cost and environmental
friendly adsorbent which can be recycle to the pig iron industry. The adsorption capacity
of the adsorbent was established through batch adsorption process. The effect of different
adsorption parameters on the uptake capacity of the adsorbent was studied. The percentage
adsorption increases with decrease in pH up to 3 and hardly any change with further
decrease in pH. As usual the equilibrium uptake of the adsorbate decreases with increase
in adsorbent dose whereas, the percentage adsorption increases with increase in adsorbent
dose. Increase in initial adsorbate concentration has a synergetic effect on the uptake
capacity whereas, antagonism effect on the percentage adsorption. The adsorption kinetics,
isotherm and rate controlling mechanics also established. From the study, it was observed
that adsorption kinetics followed Pseudo 2nd order kinetics. The experimental data followed
Langmuir adsorption isotherm. It was also observed from the experiments that D2
(discussed in Chapter-2) is always greater than that of the D1. Therefore, surface diffusion
is the slowest steps and hence is the rate limiting steps. Finally, we have proposed a new
flow sheet for the recycling of the sludge to the pig iron industry after using as an adsorbent.
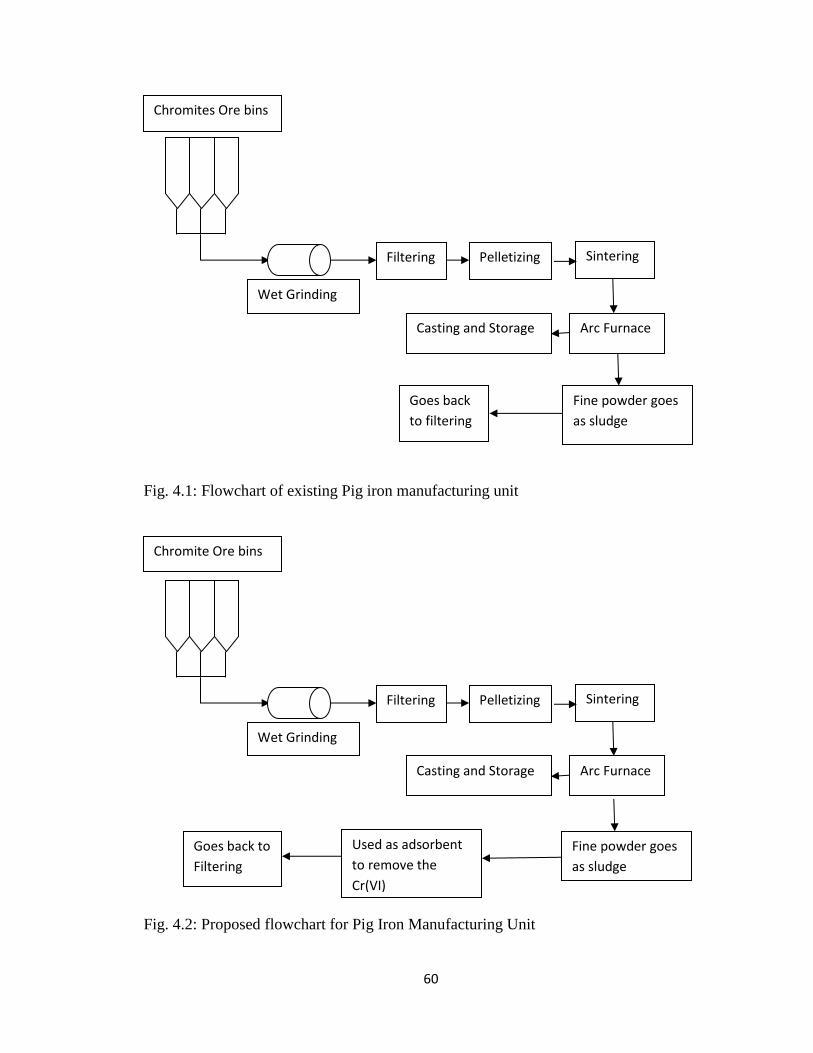
60
Fig. 4.1: Flowchart of existing Pig iron manufacturing unit
Fig. 4.2: Proposed flowchart for Pig Iron Manufacturing Unit
Chromites Ore bins
Fine powder goes
as sludge
Goes back
to filtering
Wet Grinding
Filtering Pelletizing Sintering
Arc Furnace Casting and Storage
Fine powder goes
as sludge
Chromite Ore bins
Wet Grinding
Filtering Pelletizing Sintering
Arc Furnace Casting and Storage
Used as adsorbent
to remove the
Cr(VI)
Goes back to
Filtering
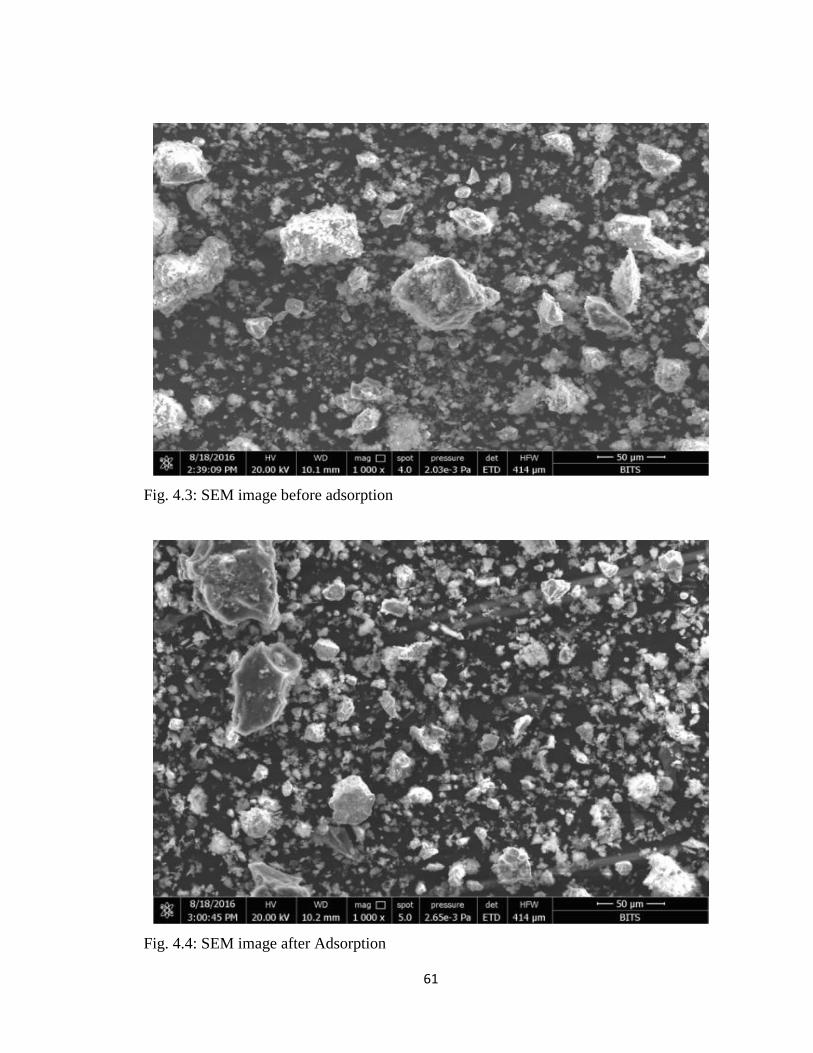
61
Fig. 4.3: SEM image before adsorption
Fig. 4.4: SEM image after Adsorption
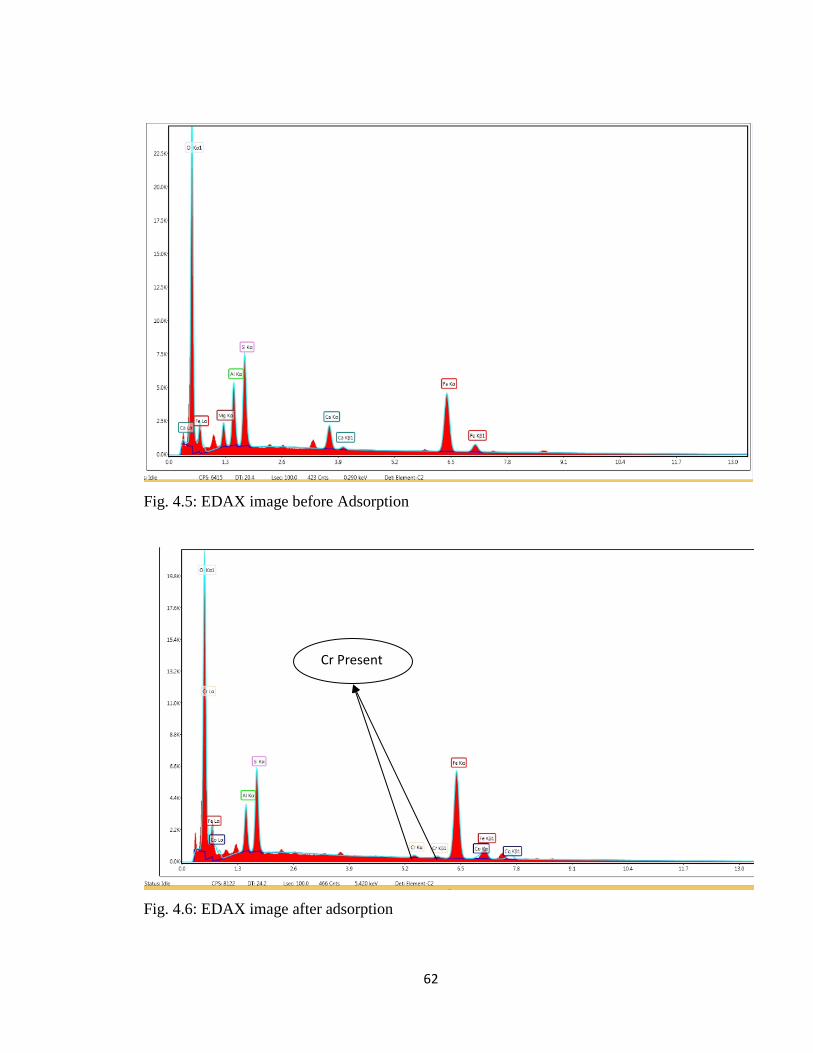
62
Fig. 4.5: EDAX image before Adsorption
Fig. 4.6: EDAX image after adsorption
Cr Present
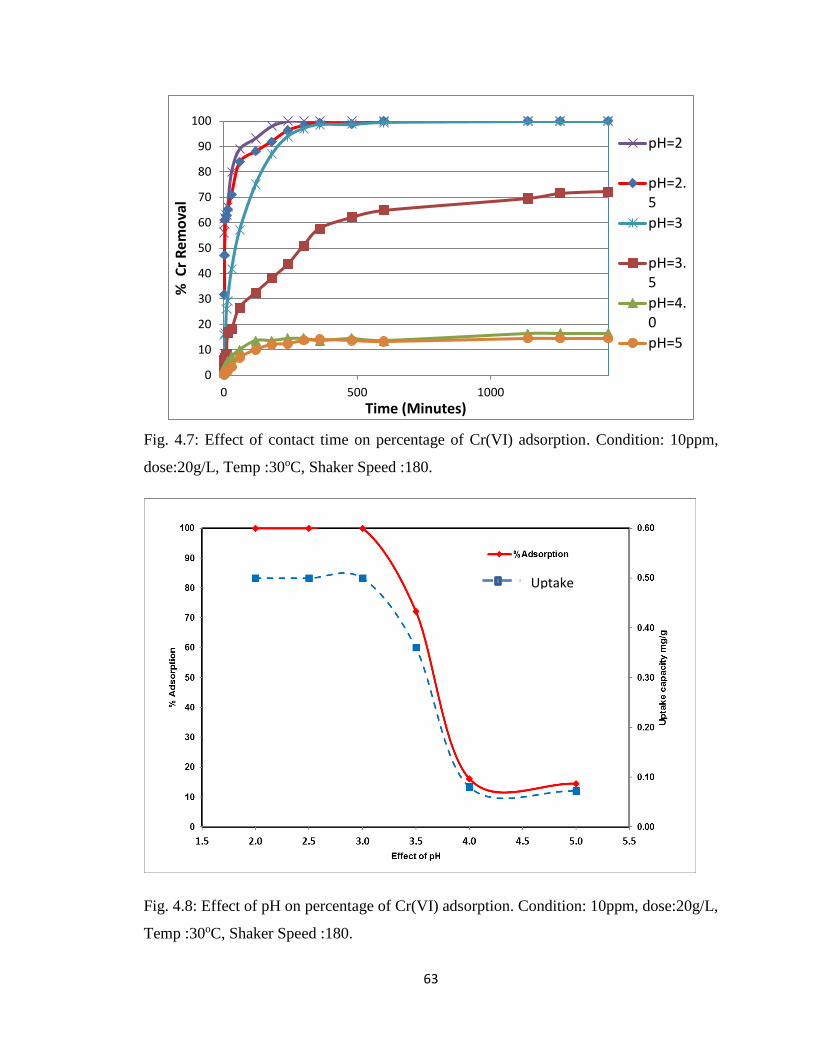
63
Fig. 4.7: Effect of contact time on percentage of Cr(VI) adsorption. Condition: 10ppm,
dose:20g/L, Temp :30oC, Shaker Speed :180.
Fig. 4.8: Effect of pH on percentage of Cr(VI) adsorption. Condition: 10ppm, dose:20g/L,
Temp :30oC, Shaker Speed :180.
0
10
20
30
40
50
60
70
80
90
100
0 500 1000
% C
r R
emo
val
Time (Minutes)
pH=2
pH=2.5
pH=3
pH=3.5
pH=4.0
pH=5
Uptake
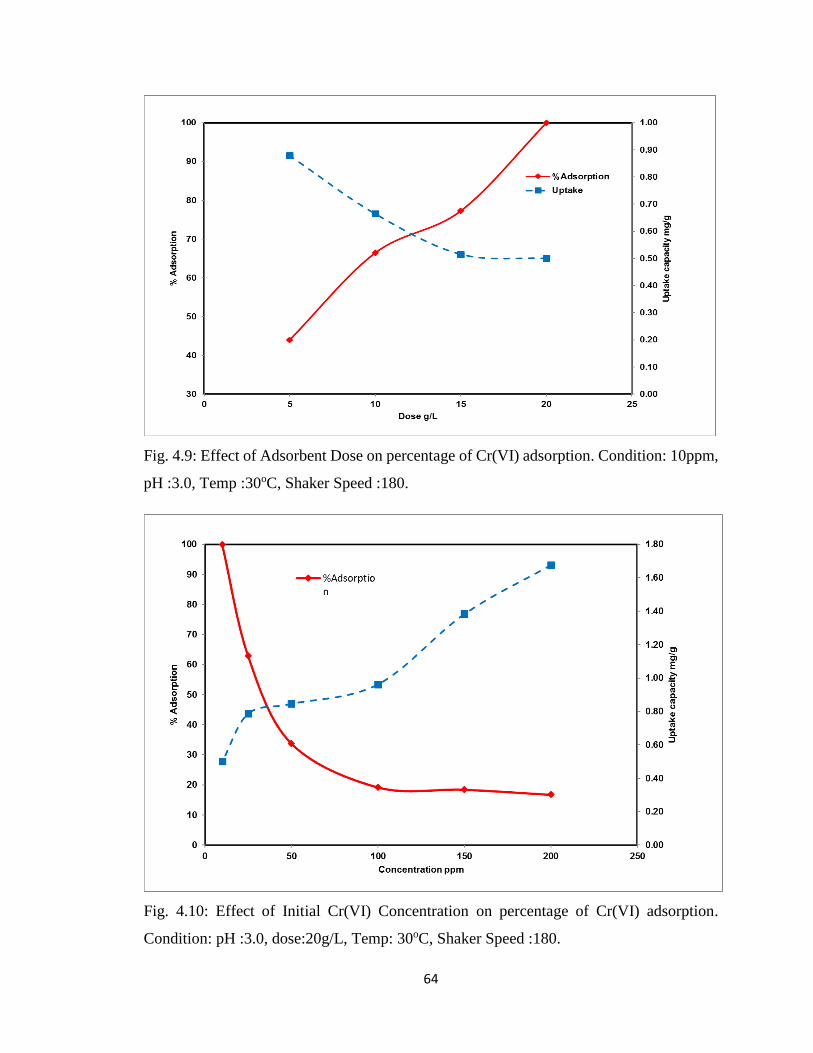
64
Fig. 4.9: Effect of Adsorbent Dose on percentage of Cr(VI) adsorption. Condition: 10ppm,
pH :3.0, Temp :30oC, Shaker Speed :180.
Fig. 4.10: Effect of Initial Cr(VI) Concentration on percentage of Cr(VI) adsorption.
Condition: pH :3.0, dose:20g/L, Temp: 30oC, Shaker Speed :180.
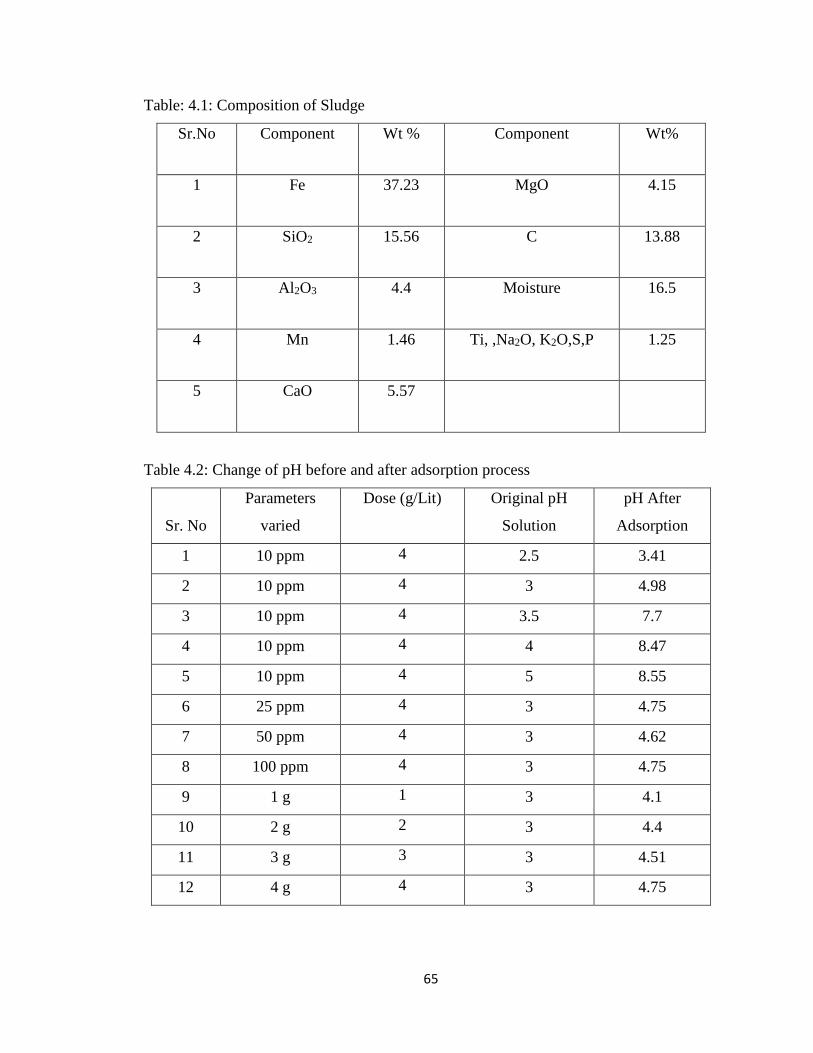
65
Table: 4.1: Composition of Sludge
Sr.No Component Wt % Component Wt%
1 Fe 37.23 MgO 4.15
2 SiO2 15.56 C 13.88
3 Al2O3 4.4 Moisture 16.5
4 Mn 1.46 Ti, ,Na2O, K2O,S,P 1.25
5 CaO 5.57
Table 4.2: Change of pH before and after adsorption process
Sr. No
Parameters
varied
Dose (g/Lit) Original pH
Solution
pH After
Adsorption
1 10 ppm 4 2.5 3.41
2 10 ppm 4 3 4.98
3 10 ppm 4 3.5 7.7
4 10 ppm 4 4 8.47
5 10 ppm 4 5 8.55
6 25 ppm 4 3 4.75
7 50 ppm 4 3 4.62
8 100 ppm 4 3 4.75
9 1 g 1 3 4.1
10 2 g 2 3 4.4
11 3 g 3 3 4.51
12 4 g 4 3 4.75
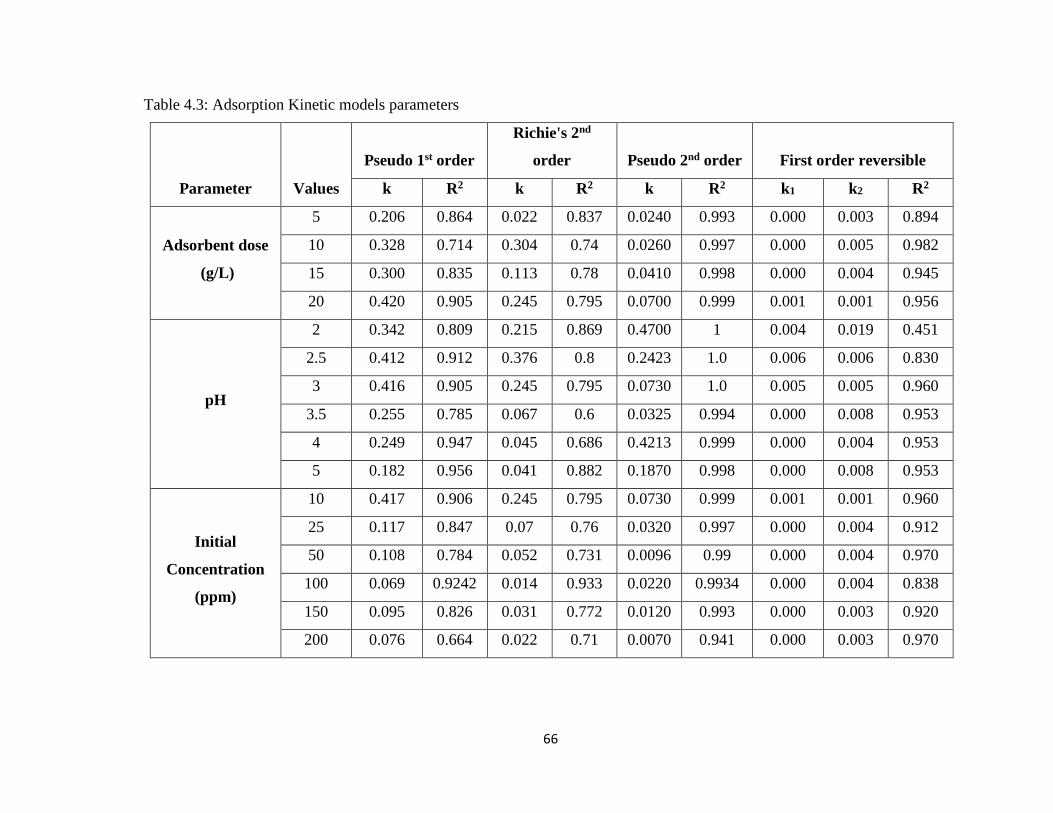
66
Table 4.3: Adsorption Kinetic models parameters
Parameter Values
Pseudo 1st order
Richie's 2nd
order Pseudo 2nd order First order reversible
k R2 k R2 k R2 k1 k2 R2
Adsorbent dose
(g/L)
5 0.206 0.864 0.022 0.837 0.0240 0.993 0.000 0.003 0.894
10 0.328 0.714 0.304 0.74 0.0260 0.997 0.000 0.005 0.982
15 0.300 0.835 0.113 0.78 0.0410 0.998 0.000 0.004 0.945
20 0.420 0.905 0.245 0.795 0.0700 0.999 0.001 0.001 0.956
pH
2 0.342 0.809 0.215 0.869 0.4700 1 0.004 0.019 0.451
2.5 0.412 0.912 0.376 0.8 0.2423 1.0 0.006 0.006 0.830
3 0.416 0.905 0.245 0.795 0.0730 1.0 0.005 0.005 0.960
3.5 0.255 0.785 0.067 0.6 0.0325 0.994 0.000 0.008 0.953
4 0.249 0.947 0.045 0.686 0.4213 0.999 0.000 0.004 0.953
5 0.182 0.956 0.041 0.882 0.1870 0.998 0.000 0.008 0.953
Initial
Concentration
(ppm)
10 0.417 0.906 0.245 0.795 0.0730 0.999 0.001 0.001 0.960
25 0.117 0.847 0.07 0.76 0.0320 0.997 0.000 0.004 0.912
50 0.108 0.784 0.052 0.731 0.0096 0.99 0.000 0.004 0.970
100 0.069 0.9242 0.014 0.933 0.0220 0.9934 0.000 0.004 0.838
150 0.095 0.826 0.031 0.772 0.0120 0.993 0.000 0.003 0.920
200 0.076 0.664 0.022 0.71 0.0070 0.941 0.000 0.003 0.970
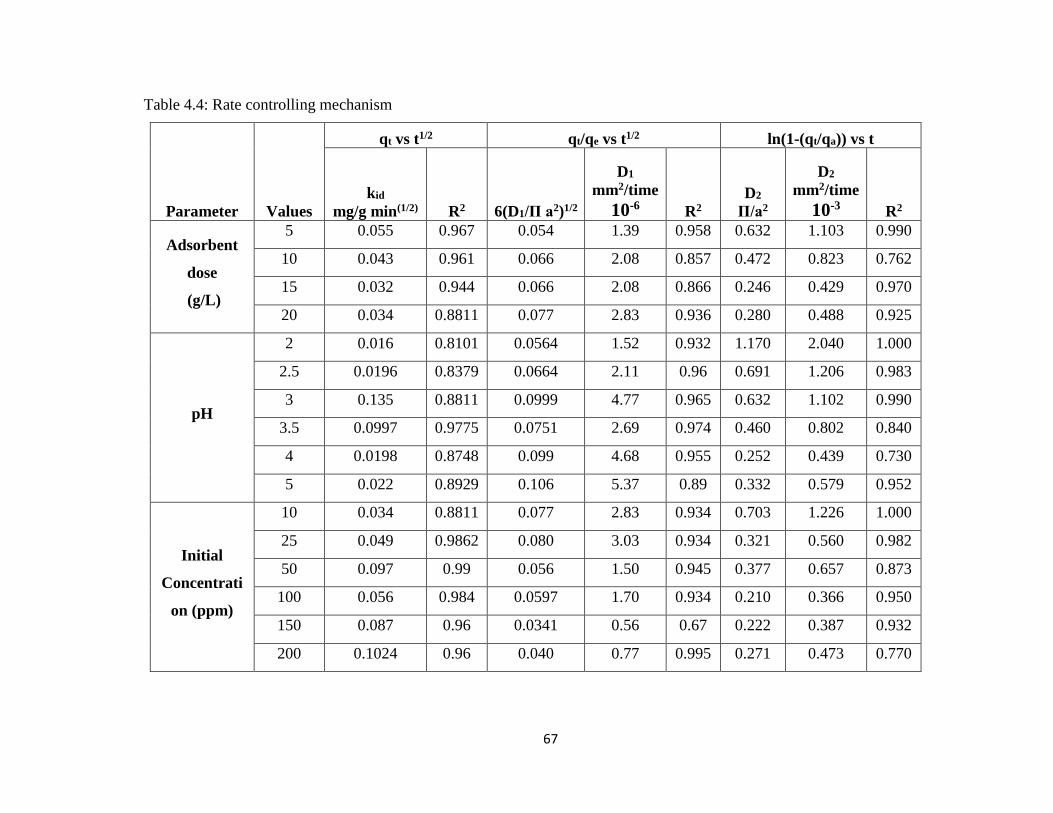
67
Table 4.4: Rate controlling mechanism
Parameter Values
qt vs t1/2 qt/qe vs t1/2 ln(1-(qt/qa)) vs t
kid
mg/g min(1/2) R2 6(D1/Π a2)1/2
D1
mm2/time
10-6 R2
D2
Π/a2
D2
mm2/time
10-3 R2
Adsorbent
dose
(g/L)
5 0.055 0.967 0.054 1.39 0.958 0.632 1.103 0.990
10 0.043 0.961 0.066 2.08 0.857 0.472 0.823 0.762
15 0.032 0.944 0.066 2.08 0.866 0.246 0.429 0.970
20 0.034 0.8811 0.077 2.83 0.936 0.280 0.488 0.925
pH
2 0.016 0.8101 0.0564 1.52 0.932 1.170 2.040 1.000
2.5 0.0196 0.8379 0.0664 2.11 0.96 0.691 1.206 0.983
3 0.135 0.8811 0.0999 4.77 0.965 0.632 1.102 0.990
3.5 0.0997 0.9775 0.0751 2.69 0.974 0.460 0.802 0.840
4 0.0198 0.8748 0.099 4.68 0.955 0.252 0.439 0.730
5 0.022 0.8929 0.106 5.37 0.89 0.332 0.579 0.952
Initial
Concentrati
on (ppm)
10 0.034 0.8811 0.077 2.83 0.934 0.703 1.226 1.000
25 0.049 0.9862 0.080 3.03 0.934 0.321 0.560 0.982
50 0.097 0.99 0.056 1.50 0.945 0.377 0.657 0.873
100 0.056 0.984 0.0597 1.70 0.934 0.210 0.366 0.950
150 0.087 0.96 0.0341 0.56 0.67 0.222 0.387 0.932
200 0.1024 0.96 0.040 0.77 0.995 0.271 0.473 0.770
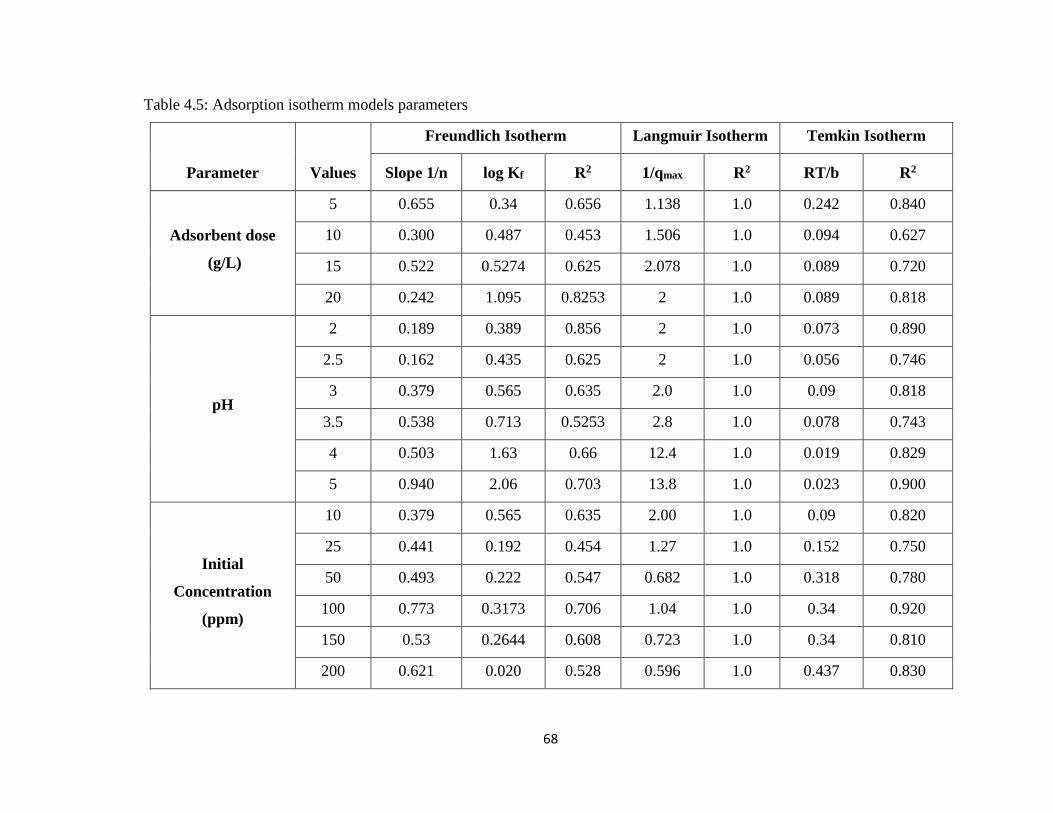
68
Table 4.5: Adsorption isotherm models parameters
Parameter Values
Freundlich Isotherm Langmuir Isotherm Temkin Isotherm
Slope 1/n log Kf R2 1/qmax R2 RT/b R2
Adsorbent dose
(g/L)
5 0.655 0.34 0.656 1.138 1.0 0.242 0.840
10 0.300 0.487 0.453 1.506 1.0 0.094 0.627
15 0.522 0.5274 0.625 2.078 1.0 0.089 0.720
20 0.242 1.095 0.8253 2 1.0 0.089 0.818
pH
2 0.189 0.389 0.856 2 1.0 0.073 0.890
2.5 0.162 0.435 0.625 2 1.0 0.056 0.746
3 0.379 0.565 0.635 2.0 1.0 0.09 0.818
3.5 0.538 0.713 0.5253 2.8 1.0 0.078 0.743
4 0.503 1.63 0.66 12.4 1.0 0.019 0.829
5 0.940 2.06 0.703 13.8 1.0 0.023 0.900
Initial
Concentration
(ppm)
10 0.379 0.565 0.635 2.00 1.0 0.09 0.820
25 0.441 0.192 0.454 1.27 1.0 0.152 0.750
50 0.493 0.222 0.547 0.682 1.0 0.318 0.780
100 0.773 0.3173 0.706 1.04 1.0 0.34 0.920
150 0.53 0.2644 0.608 0.723 1.0 0.34 0.810
200 0.621 0.020 0.528 0.596 1.0 0.437 0.830
69
Chapter-5
Removal of Cr(VI) from
wastewater using Carbonized Grass
70
5.1 Introduction
From the literature, it is evident that bio-sorbents have high Cr(VI) uptake capacity as
compare to other adsorbents. However, the disadvantages with the bio-sorbent is that, the
adsorption capacity is higher at lower pH, treatment at lower pH requires neutralization
steps which are not economic and environmental friendly and regeneration is not possible
because of adsorption cum reduction mechanism. Therefore, a new industrial waste was
used in the chapter four with an aim to reuse the adsorbent along with the adsorbed Cr(VI)
in the production of ferrochrome. From the experimental results, it is observed that the
adsorption capacity of the adsorbent was very low at higher pH. Therefore, the present
study aimed at finding an alternative adsorbent i.e. Biochar to remove the Cr(VI) from the
wastewater and use this chromium adsorbed Biochar in Ferrochrome industry.
Ferrochrome is a major intermediate raw material for the production of stainless steel.
Worldwide more than 80% of the ferrochrome production is used in steel industry (Goel,
1997; Montiano et al, 2014). During the process of manufacture of steel generate large
amount of CO2 due to their use of fossil fuels either as a reductant or as a fuel (Wiklund et
al, 2012; Norgate et al, 2009; Norgate et al, 2012). The potential of Biochar has been
assessed in terms of its CO2 abatement potential and economic viewpoint. The results
indicate the potential for 18-40% mitigation of CO2 (Bruzual, 2014; Ariyama, 2005). Apart
from the CO2 reduction, the experience of charcoal based iron making reveals following
benefits to the process (Bruzual, 2014).
1. Lower impurity content – Biochar contains less sulphur and phosphor content than
coke.
2. Ash content – ash in Biochar can be lower than in coke.
3. High reactivity – Biochar is highly porous, with a large specific area, this improves
combustion rates.
Finding from the economic point of view Biochar cannot compete with fossil coal on price,
but the amount of Biochar addition is very small percentage so the effect of cost will be
negligible. In order to study the effect of different parameters on adsorption of Biochar,
batch adsorption process was carried out. The study of effect of different parameter like
pH, contact time, initial Cr(VI) concentration and adsorbent dose, on the removal of Cr(VI)
71
from the solutions has been investigated by using this Biochar. The removal efficiency has
been correlated with all the parameters.
5.2 Manufacturing Process of Ferrochrome
The Fig. 5.1 explains the process flow for Ferrochrome production. The Composition of
Raw Material for Ferrochrome production is shown in Table 5.1. The chromite ore input
in the form of Friable and Lumpy ore is processed through Grinding, Filtering, Palletizing
and Sintering (GFPS) to make pellets. Initially the chrome ore was grounded in the grinding
mill after adding the water and the slurry is filtered in a drum filter unit then pellets are
formed in the palletizing disc, the pellets are then sintered in the shaft furnace called
sintering operation. This pellets along with chrome lumps, coke as a reductant, and
quartzite as flux are added to submerged arc furnace-8. The smelting is done in the
Submerged Arc furnace (Samaradivakera and Sahu, 2013). It is a closed type furnace. After
smelting, the molten metal and slag are tapped from the furnace. The molten metal is casted
in the casting bed. The present study is exploring the possibility of using biochar as an
adsorbent for the treatment of Cr(VI) contaminated wastewater. The advantages of using
Biochar as an adsorbent is that, the used Biochar can be reused in a ferrochrome industry
as a source of carbon i.e. fuel. Further, the adsorbed Cr(VI) can be used as a raw material
for the ferrochrome production.
5.3 Materials and Methods
In order to make Biochar from Sorghastrum Nutans (L) Nash (grass) which is having
higher uptake capacity as compared to other bio-sorbent we have used, were heated in a
Muffle furnace at 7000C. Experimental set-up is shown in Fig 5.2 which consist of
cylindrical pipe made of cast iron (length of 60 cm and diameter of 7.6 cm ID) with one
end closed and other side i.e. front side is flange threaded to main frame which is packed
with glass wool as heat resistance medium. Through the outer flange, a small copper tube
(6 mm ID) inserted with length of 50 cm through which N2 gas was supplied. The N2 gas
used as inert medium. The dried powder form of adsorbent was carbonized at a temperature
of 7000C in inert atmosphere (N2 gas and this gas exit as a flue gas). The flow rate of N2
adjusted from N2 gas cylinder with purity of 99.9 % by using proper flow control valve.
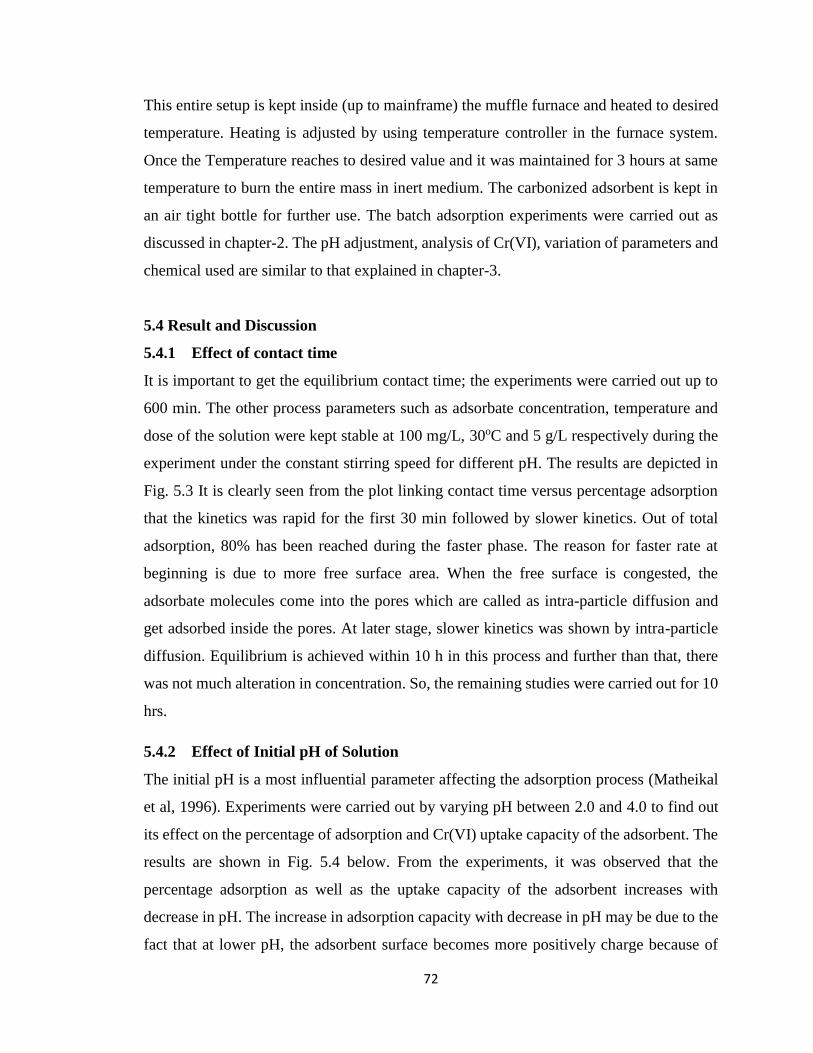
72
This entire setup is kept inside (up to mainframe) the muffle furnace and heated to desired
temperature. Heating is adjusted by using temperature controller in the furnace system.
Once the Temperature reaches to desired value and it was maintained for 3 hours at same
temperature to burn the entire mass in inert medium. The carbonized adsorbent is kept in
an air tight bottle for further use. The batch adsorption experiments were carried out as
discussed in chapter-2. The pH adjustment, analysis of Cr(VI), variation of parameters and
chemical used are similar to that explained in chapter-3.
5.4 Result and Discussion
5.4.1 Effect of contact time
It is important to get the equilibrium contact time; the experiments were carried out up to
600 min. The other process parameters such as adsorbate concentration, temperature and
dose of the solution were kept stable at 100 mg/L, 30oC and 5 g/L respectively during the
experiment under the constant stirring speed for different pH. The results are depicted in
Fig. 5.3 It is clearly seen from the plot linking contact time versus percentage adsorption
that the kinetics was rapid for the first 30 min followed by slower kinetics. Out of total
adsorption, 80% has been reached during the faster phase. The reason for faster rate at
beginning is due to more free surface area. When the free surface is congested, the
adsorbate molecules come into the pores which are called as intra-particle diffusion and
get adsorbed inside the pores. At later stage, slower kinetics was shown by intra-particle
diffusion. Equilibrium is achieved within 10 h in this process and further than that, there
was not much alteration in concentration. So, the remaining studies were carried out for 10
hrs.
5.4.2 Effect of Initial pH of Solution
The initial pH is a most influential parameter affecting the adsorption process (Matheikal
et al, 1996). Experiments were carried out by varying pH between 2.0 and 4.0 to find out
its effect on the percentage of adsorption and Cr(VI) uptake capacity of the adsorbent. The
results are shown in Fig. 5.4 below. From the experiments, it was observed that the
percentage adsorption as well as the uptake capacity of the adsorbent increases with
decrease in pH. The increase in adsorption capacity with decrease in pH may be due to the
fact that at lower pH, the adsorbent surface becomes more positively charge because of
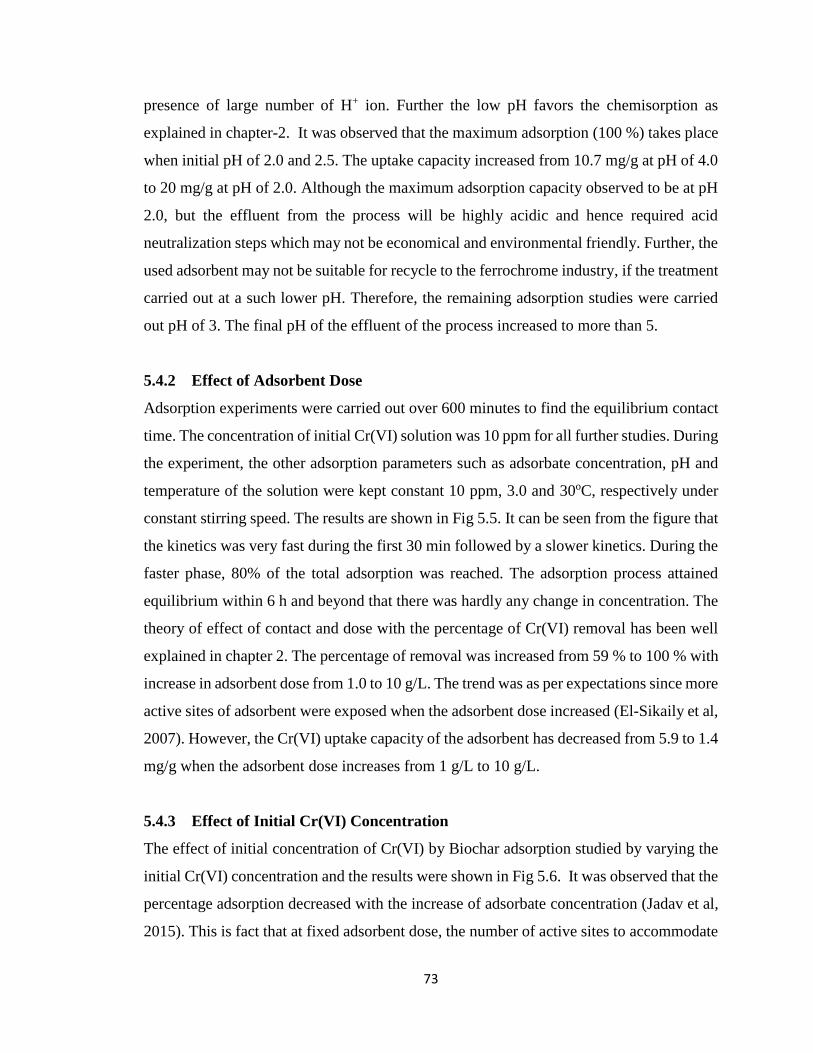
73
presence of large number of H+ ion. Further the low pH favors the chemisorption as
explained in chapter-2. It was observed that the maximum adsorption (100 %) takes place
when initial pH of 2.0 and 2.5. The uptake capacity increased from 10.7 mg/g at pH of 4.0
to 20 mg/g at pH of 2.0. Although the maximum adsorption capacity observed to be at pH
2.0, but the effluent from the process will be highly acidic and hence required acid
neutralization steps which may not be economical and environmental friendly. Further, the
used adsorbent may not be suitable for recycle to the ferrochrome industry, if the treatment
carried out at a such lower pH. Therefore, the remaining adsorption studies were carried
out pH of 3. The final pH of the effluent of the process increased to more than 5.
5.4.2 Effect of Adsorbent Dose
Adsorption experiments were carried out over 600 minutes to find the equilibrium contact
time. The concentration of initial Cr(VI) solution was 10 ppm for all further studies. During
the experiment, the other adsorption parameters such as adsorbate concentration, pH and
temperature of the solution were kept constant 10 ppm, 3.0 and 30oC, respectively under
constant stirring speed. The results are shown in Fig 5.5. It can be seen from the figure that
the kinetics was very fast during the first 30 min followed by a slower kinetics. During the
faster phase, 80% of the total adsorption was reached. The adsorption process attained
equilibrium within 6 h and beyond that there was hardly any change in concentration. The
theory of effect of contact and dose with the percentage of Cr(VI) removal has been well
explained in chapter 2. The percentage of removal was increased from 59 % to 100 % with
increase in adsorbent dose from 1.0 to 10 g/L. The trend was as per expectations since more
active sites of adsorbent were exposed when the adsorbent dose increased (El-Sikaily et al,
2007). However, the Cr(VI) uptake capacity of the adsorbent has decreased from 5.9 to 1.4
mg/g when the adsorbent dose increases from 1 g/L to 10 g/L.
5.4.3 Effect of Initial Cr(VI) Concentration
The effect of initial concentration of Cr(VI) by Biochar adsorption studied by varying the
initial Cr(VI) concentration and the results were shown in Fig 5.6. It was observed that the
percentage adsorption decreased with the increase of adsorbate concentration (Jadav et al,
2015). This is fact that at fixed adsorbent dose, the number of active sites to accommodate
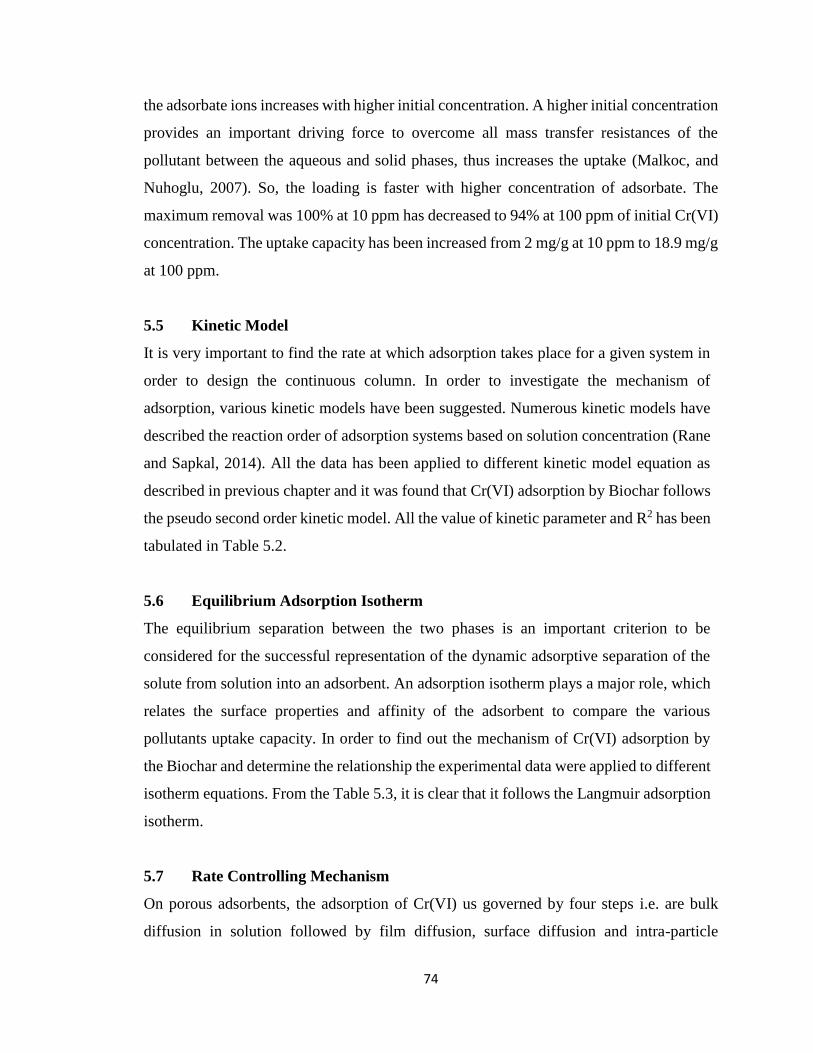
74
the adsorbate ions increases with higher initial concentration. A higher initial concentration
provides an important driving force to overcome all mass transfer resistances of the
pollutant between the aqueous and solid phases, thus increases the uptake (Malkoc, and
Nuhoglu, 2007). So, the loading is faster with higher concentration of adsorbate. The
maximum removal was 100% at 10 ppm has decreased to 94% at 100 ppm of initial Cr(VI)
concentration. The uptake capacity has been increased from 2 mg/g at 10 ppm to 18.9 mg/g
at 100 ppm.
5.5 Kinetic Model
It is very important to find the rate at which adsorption takes place for a given system in
order to design the continuous column. In order to investigate the mechanism of
adsorption, various kinetic models have been suggested. Numerous kinetic models have
described the reaction order of adsorption systems based on solution concentration (Rane
and Sapkal, 2014). All the data has been applied to different kinetic model equation as
described in previous chapter and it was found that Cr(VI) adsorption by Biochar follows
the pseudo second order kinetic model. All the value of kinetic parameter and R2 has been
tabulated in Table 5.2.
5.6 Equilibrium Adsorption Isotherm
The equilibrium separation between the two phases is an important criterion to be
considered for the successful representation of the dynamic adsorptive separation of the
solute from solution into an adsorbent. An adsorption isotherm plays a major role, which
relates the surface properties and affinity of the adsorbent to compare the various
pollutants uptake capacity. In order to find out the mechanism of Cr(VI) adsorption by
the Biochar and determine the relationship the experimental data were applied to different
isotherm equations. From the Table 5.3, it is clear that it follows the Langmuir adsorption
isotherm.
5.7 Rate Controlling Mechanism
On porous adsorbents, the adsorption of Cr(VI) us governed by four steps i.e. are bulk
diffusion in solution followed by film diffusion, surface diffusion and intra-particle
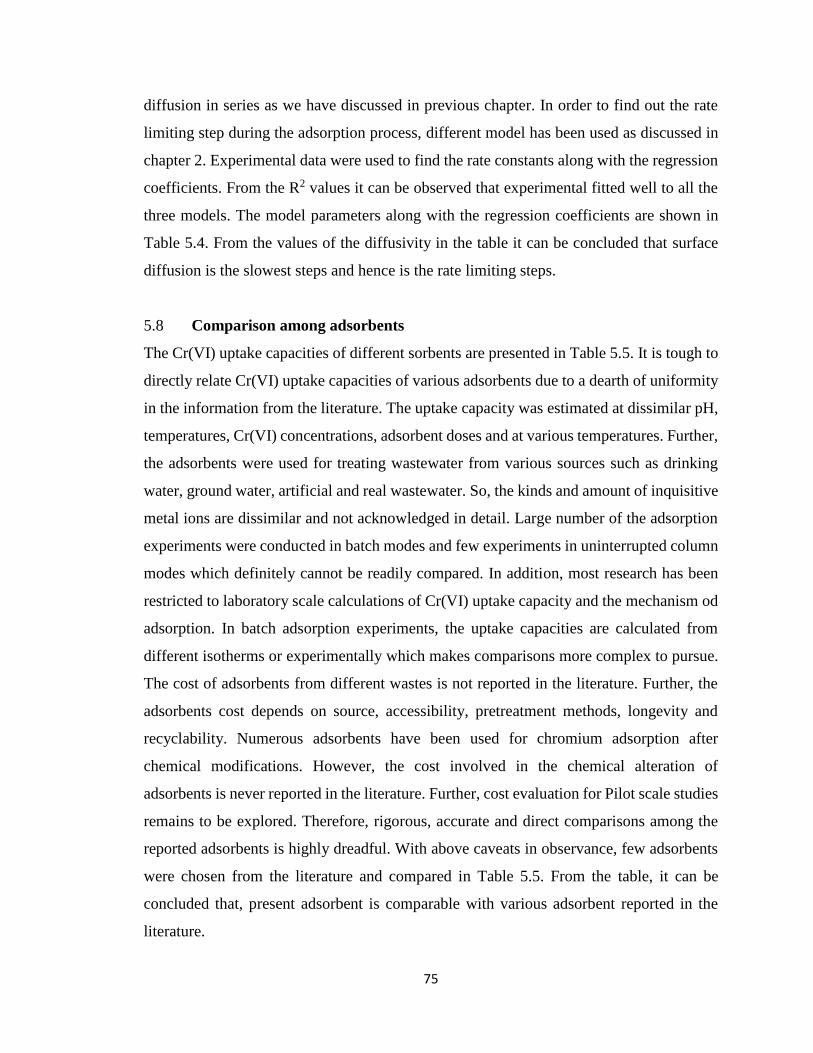
75
diffusion in series as we have discussed in previous chapter. In order to find out the rate
limiting step during the adsorption process, different model has been used as discussed in
chapter 2. Experimental data were used to find the rate constants along with the regression
coefficients. From the R2 values it can be observed that experimental fitted well to all the
three models. The model parameters along with the regression coefficients are shown in
Table 5.4. From the values of the diffusivity in the table it can be concluded that surface
diffusion is the slowest steps and hence is the rate limiting steps.
5.8 Comparison among adsorbents
The Cr(VI) uptake capacities of different sorbents are presented in Table 5.5. It is tough to
directly relate Cr(VI) uptake capacities of various adsorbents due to a dearth of uniformity
in the information from the literature. The uptake capacity was estimated at dissimilar pH,
temperatures, Cr(VI) concentrations, adsorbent doses and at various temperatures. Further,
the adsorbents were used for treating wastewater from various sources such as drinking
water, ground water, artificial and real wastewater. So, the kinds and amount of inquisitive
metal ions are dissimilar and not acknowledged in detail. Large number of the adsorption
experiments were conducted in batch modes and few experiments in uninterrupted column
modes which definitely cannot be readily compared. In addition, most research has been
restricted to laboratory scale calculations of Cr(VI) uptake capacity and the mechanism od
adsorption. In batch adsorption experiments, the uptake capacities are calculated from
different isotherms or experimentally which makes comparisons more complex to pursue.
The cost of adsorbents from different wastes is not reported in the literature. Further, the
adsorbents cost depends on source, accessibility, pretreatment methods, longevity and
recyclability. Numerous adsorbents have been used for chromium adsorption after
chemical modifications. However, the cost involved in the chemical alteration of
adsorbents is never reported in the literature. Further, cost evaluation for Pilot scale studies
remains to be explored. Therefore, rigorous, accurate and direct comparisons among the
reported adsorbents is highly dreadful. With above caveats in observance, few adsorbents
were chosen from the literature and compared in Table 5.5. From the table, it can be
concluded that, present adsorbent is comparable with various adsorbent reported in the
literature.
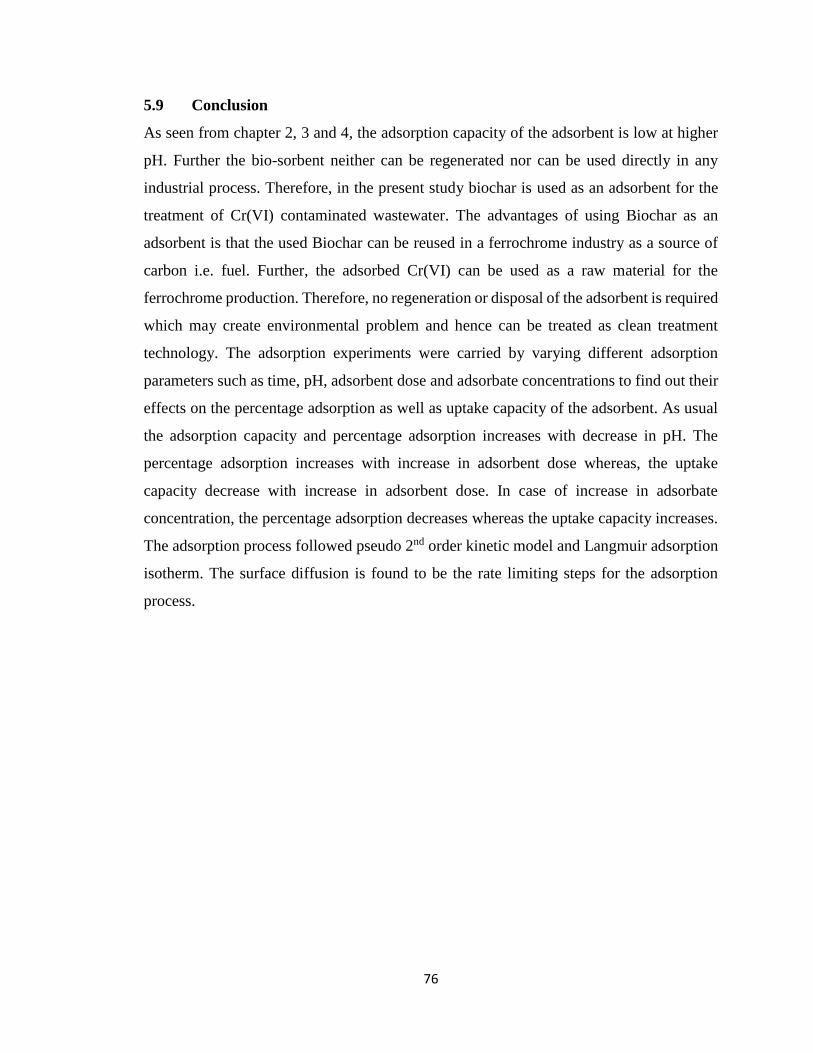
76
5.9 Conclusion
As seen from chapter 2, 3 and 4, the adsorption capacity of the adsorbent is low at higher
pH. Further the bio-sorbent neither can be regenerated nor can be used directly in any
industrial process. Therefore, in the present study biochar is used as an adsorbent for the
treatment of Cr(VI) contaminated wastewater. The advantages of using Biochar as an
adsorbent is that the used Biochar can be reused in a ferrochrome industry as a source of
carbon i.e. fuel. Further, the adsorbed Cr(VI) can be used as a raw material for the
ferrochrome production. Therefore, no regeneration or disposal of the adsorbent is required
which may create environmental problem and hence can be treated as clean treatment
technology. The adsorption experiments were carried by varying different adsorption
parameters such as time, pH, adsorbent dose and adsorbate concentrations to find out their
effects on the percentage adsorption as well as uptake capacity of the adsorbent. As usual
the adsorption capacity and percentage adsorption increases with decrease in pH. The
percentage adsorption increases with increase in adsorbent dose whereas, the uptake
capacity decrease with increase in adsorbent dose. In case of increase in adsorbate
concentration, the percentage adsorption decreases whereas the uptake capacity increases.
The adsorption process followed pseudo 2nd order kinetic model and Langmuir adsorption
isotherm. The surface diffusion is found to be the rate limiting steps for the adsorption
process.
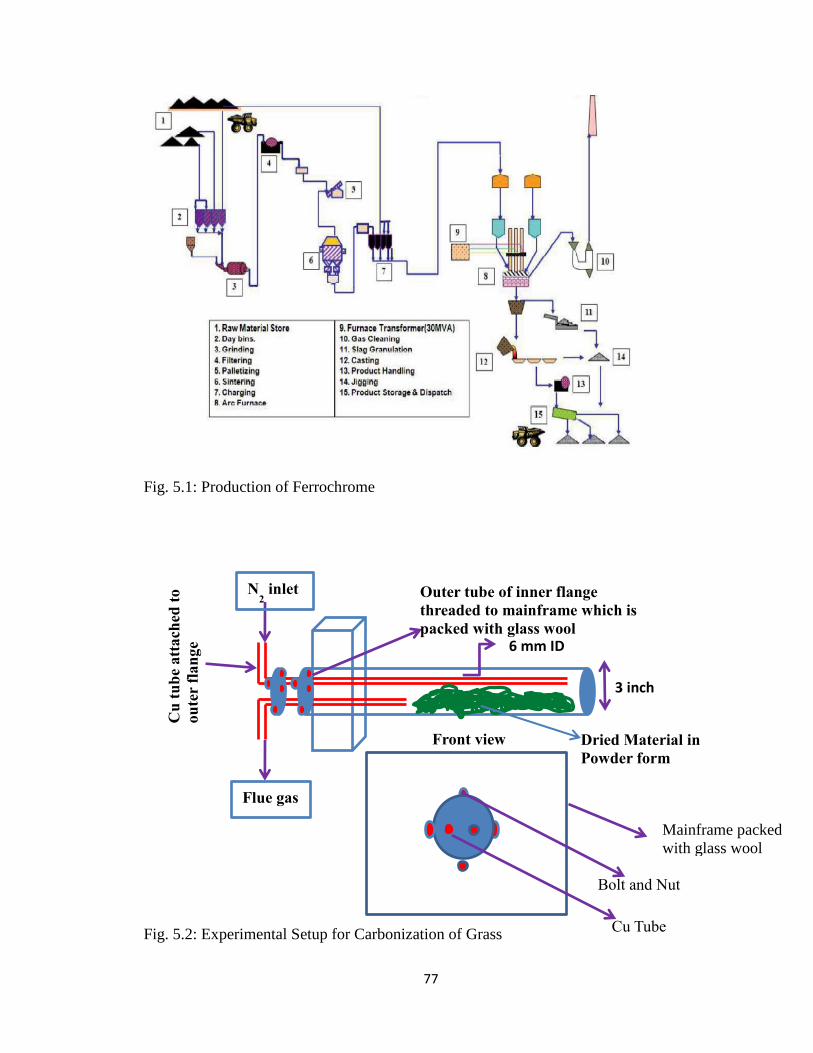
77
Fig. 5.1: Production of Ferrochrome
Fig. 5.2: Experimental Setup for Carbonization of Grass
Dried Material in
Powder form
Flue gas
N2 inlet
Cu
tu
be
att
ach
ed t
o
ou
ter
flan
ge
Outer tube of inner flange
threaded to mainframe which is
packed with glass wool
3 inch
6 mm ID
Front view
Bolt and Nut
Cu Tube
Mainframe packed
with glass wool
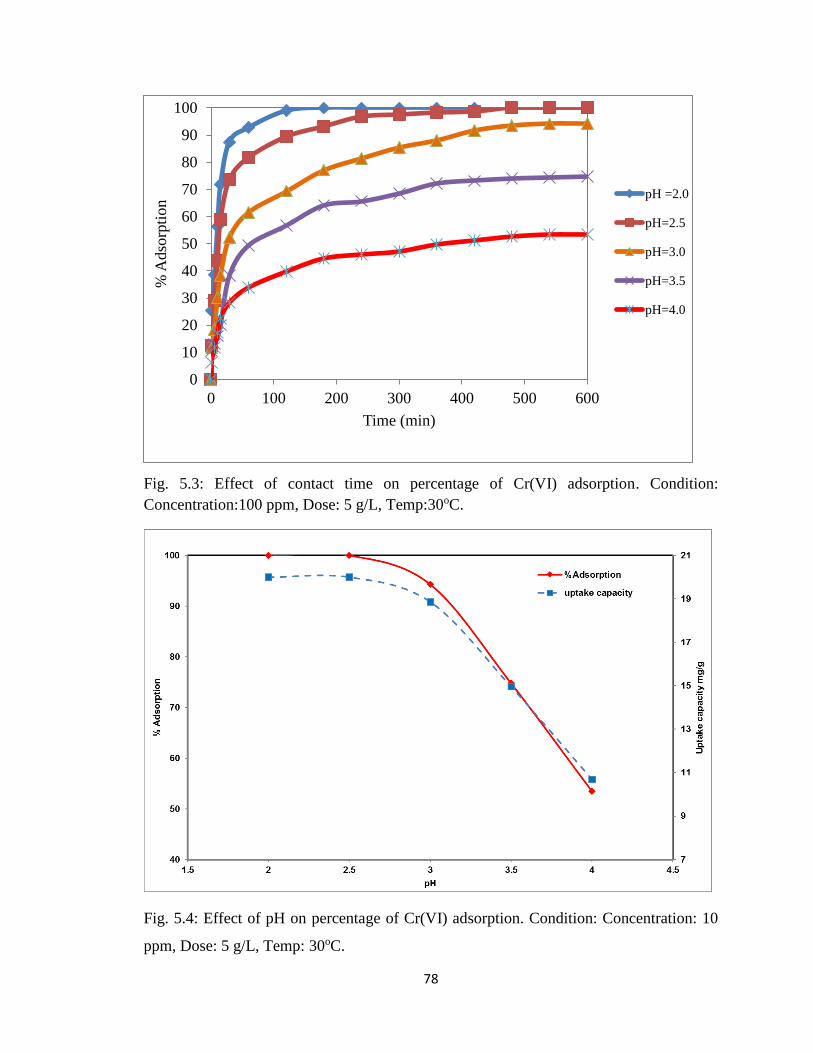
78
Fig. 5.3: Effect of contact time on percentage of Cr(VI) adsorption. Condition:
Concentration:100 ppm, Dose: 5 g/L, Temp:30oC.
Fig. 5.4: Effect of pH on percentage of Cr(VI) adsorption. Condition: Concentration: 10
ppm, Dose: 5 g/L, Temp: 30oC.
0
10
20
30
40
50
60
70
80
90
100
0 100 200 300 400 500 600
% A
dso
rpti
on
Time (min)
pH =2.0
pH=2.5
pH=3.0
pH=3.5
pH=4.0
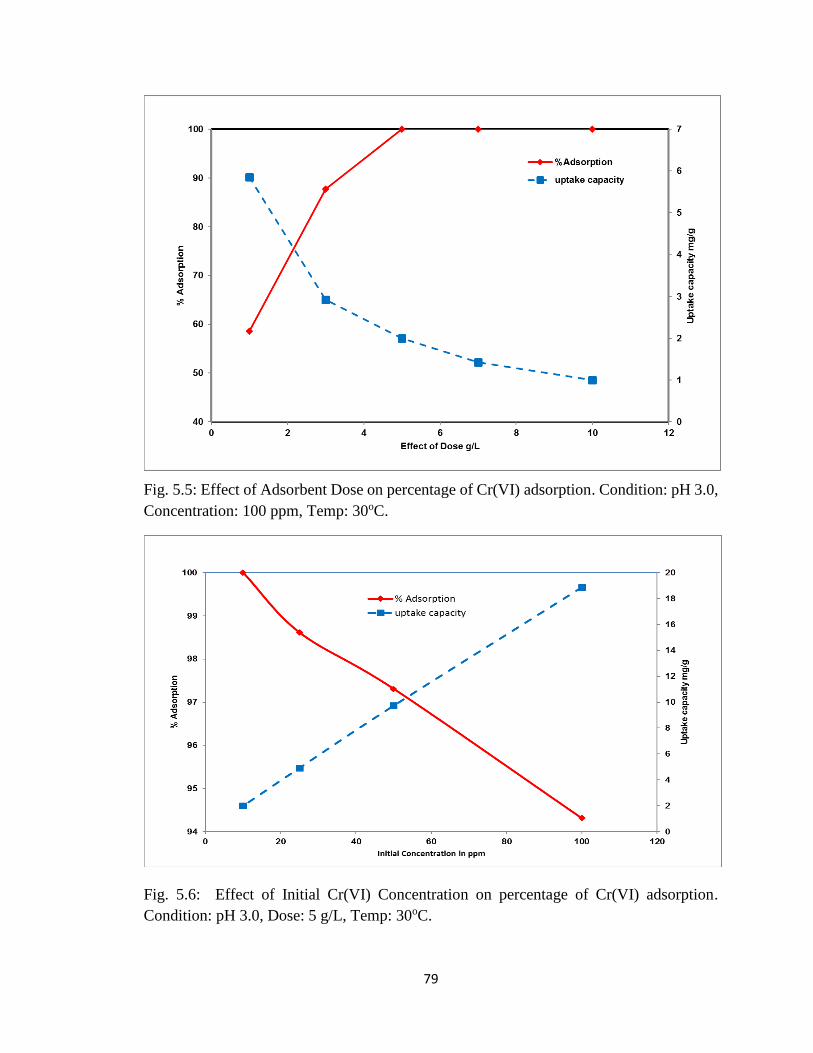
79
Fig. 5.5: Effect of Adsorbent Dose on percentage of Cr(VI) adsorption. Condition: pH 3.0,
Concentration: 100 ppm, Temp: 30oC.
Fig. 5.6: Effect of Initial Cr(VI) Concentration on percentage of Cr(VI) adsorption.
Condition: pH 3.0, Dose: 5 g/L, Temp: 30oC.
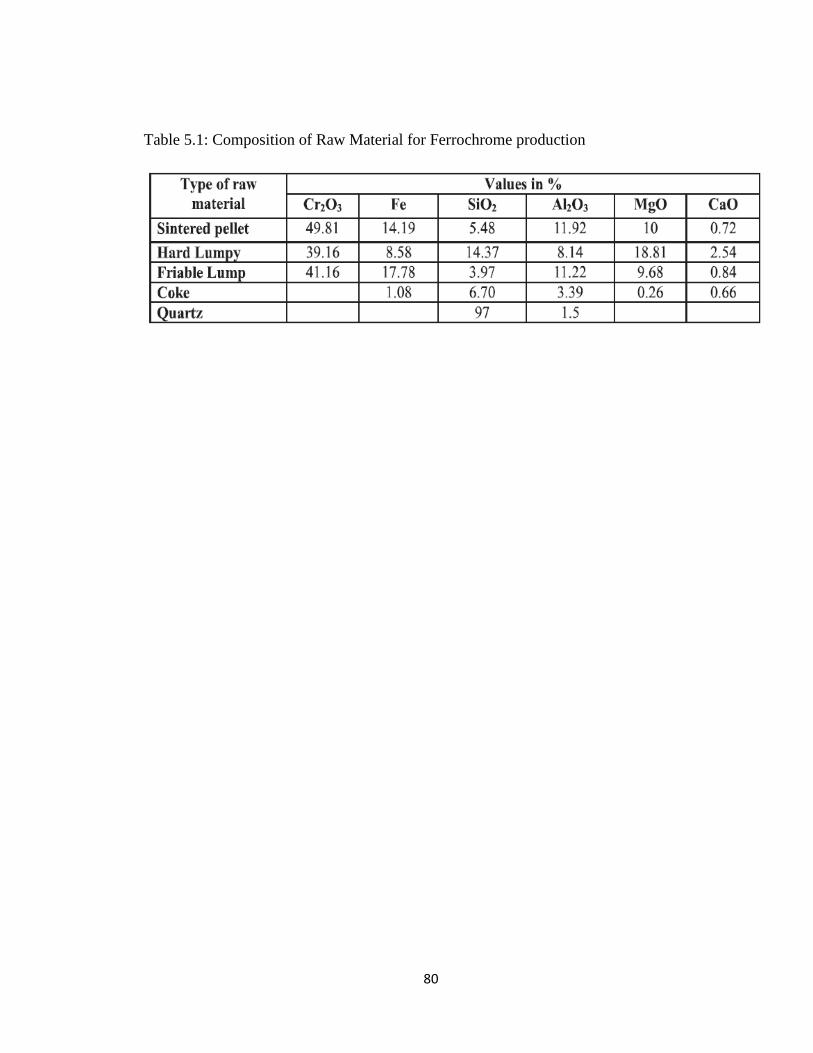
80
Table 5.1: Composition of Raw Material for Ferrochrome production
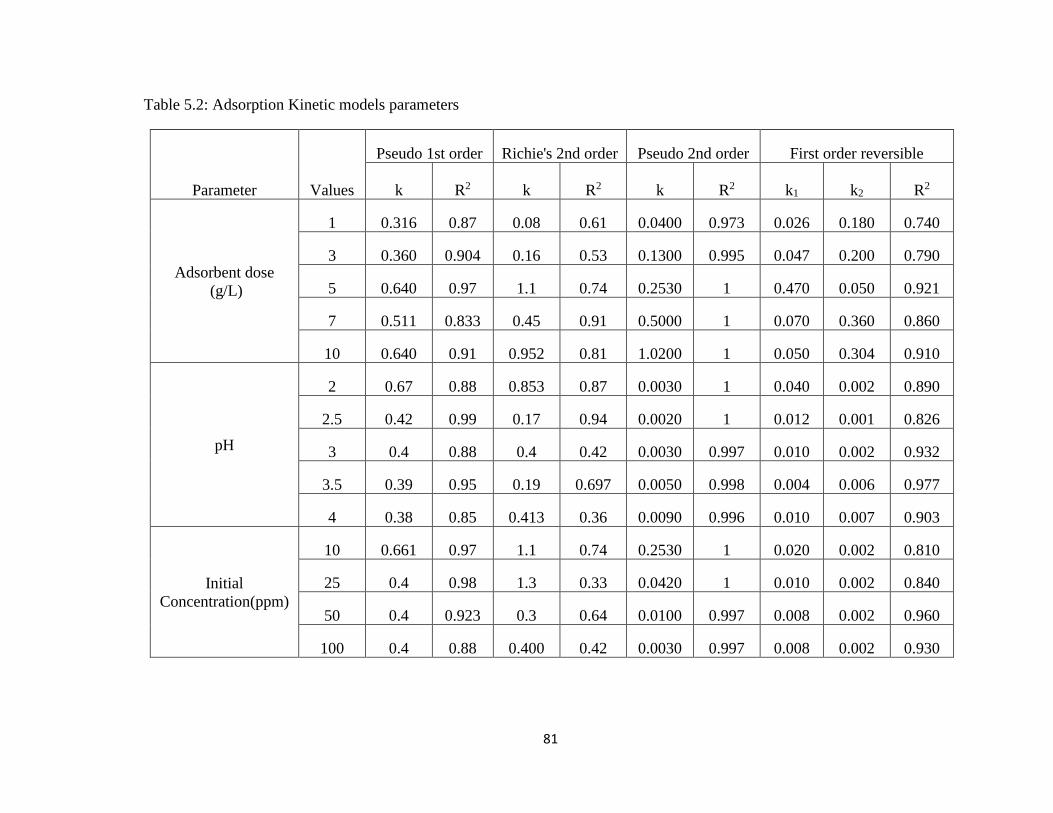
81
Table 5.2: Adsorption Kinetic models parameters
Parameter Values
Pseudo 1st order Richie's 2nd order Pseudo 2nd order First order reversible
k R2 k R2 k R2 k1 k2 R2
Adsorbent dose
(g/L)
1 0.316 0.87 0.08 0.61 0.0400 0.973 0.026 0.180 0.740
3 0.360 0.904 0.16 0.53 0.1300 0.995 0.047 0.200 0.790
5 0.640 0.97 1.1 0.74 0.2530 1 0.470 0.050 0.921
7 0.511 0.833 0.45 0.91 0.5000 1 0.070 0.360 0.860
10 0.640 0.91 0.952 0.81 1.0200 1 0.050 0.304 0.910
pH
2 0.67 0.88 0.853 0.87 0.0030 1 0.040 0.002 0.890
2.5 0.42 0.99 0.17 0.94 0.0020 1 0.012 0.001 0.826
3 0.4 0.88 0.4 0.42 0.0030 0.997 0.010 0.002 0.932
3.5 0.39 0.95 0.19 0.697 0.0050 0.998 0.004 0.006 0.977
4 0.38 0.85 0.413 0.36 0.0090 0.996 0.010 0.007 0.903
Initial
Concentration(ppm)
10 0.661 0.97 1.1 0.74 0.2530 1 0.020 0.002 0.810
25 0.4 0.98 1.3 0.33 0.0420 1 0.010 0.002 0.840
50 0.4 0.923 0.3 0.64 0.0100 0.997 0.008 0.002 0.960
100 0.4 0.88 0.400 0.42 0.0030 0.997 0.008 0.002 0.930
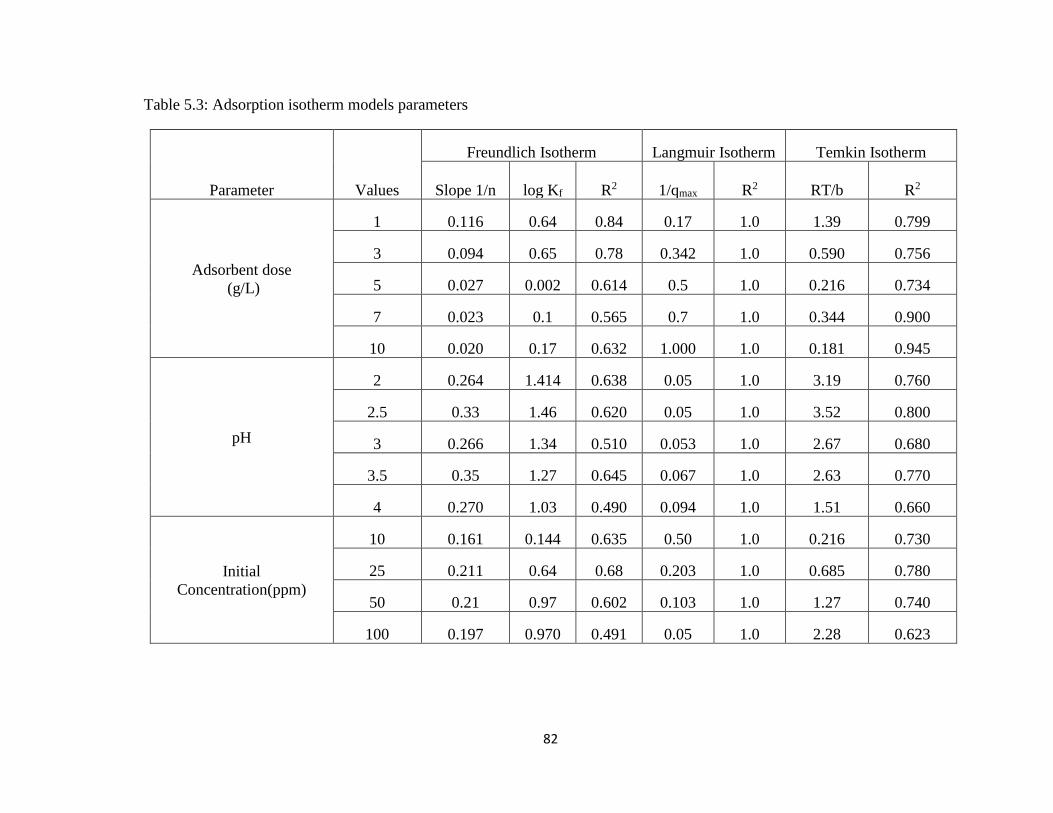
82
Table 5.3: Adsorption isotherm models parameters
Parameter Values
Freundlich Isotherm Langmuir Isotherm Temkin Isotherm
Slope 1/n log Kf R2 1/qmax R2 RT/b R2
Adsorbent dose
(g/L)
1 0.116 0.64 0.84 0.17 1.0 1.39 0.799
3 0.094 0.65 0.78 0.342 1.0 0.590 0.756
5 0.027 0.002 0.614 0.5 1.0 0.216 0.734
7 0.023 0.1 0.565 0.7 1.0 0.344 0.900
10 0.020 0.17 0.632 1.000 1.0 0.181 0.945
pH
2 0.264 1.414 0.638 0.05 1.0 3.19 0.760
2.5 0.33 1.46 0.620 0.05 1.0 3.52 0.800
3 0.266 1.34 0.510 0.053 1.0 2.67 0.680
3.5 0.35 1.27 0.645 0.067 1.0 2.63 0.770
4 0.270 1.03 0.490 0.094 1.0 1.51 0.660
Initial
Concentration(ppm)
10 0.161 0.144 0.635 0.50 1.0 0.216 0.730
25 0.211 0.64 0.68 0.203 1.0 0.685 0.780
50 0.21 0.97 0.602 0.103 1.0 1.27 0.740
100 0.197 0.970 0.491 0.05 1.0 2.28 0.623
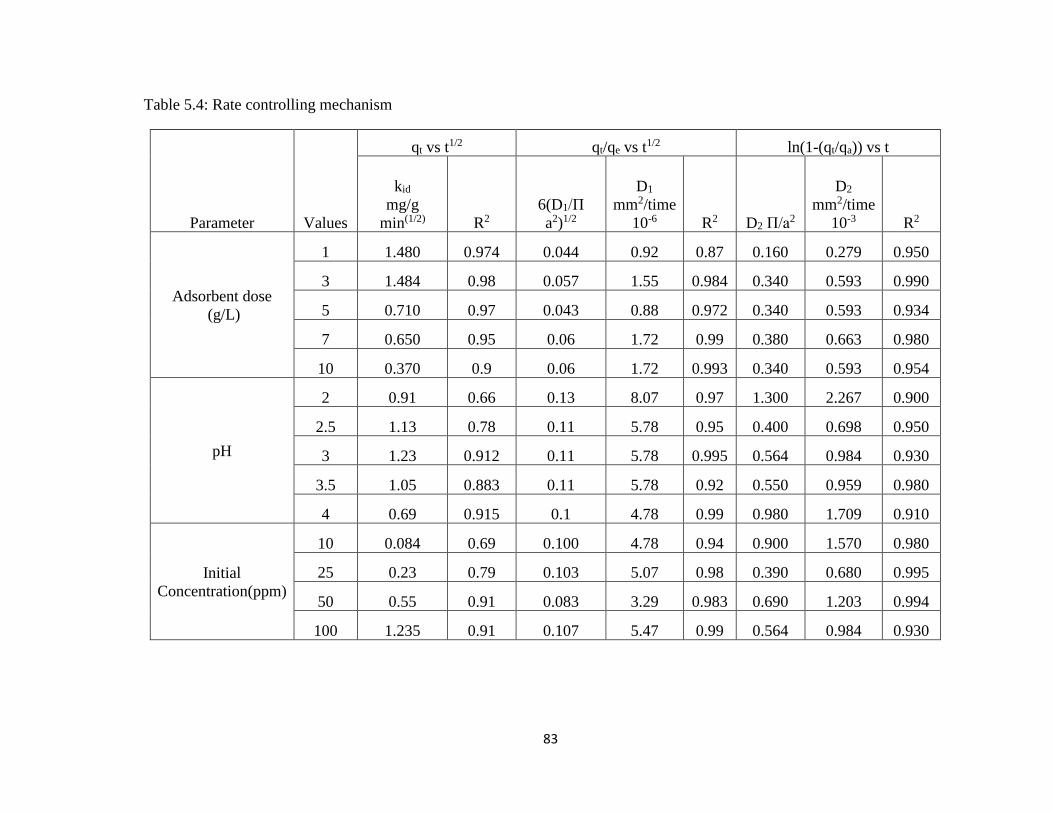
83
Table 5.4: Rate controlling mechanism
Parameter Values
qt vs t1/2 qt/qe vs t1/2 ln(1-(qt/qa)) vs t
kid
mg/g
min(1/2) R2
6(D1/Π
a2)1/2
D1
mm2/time
10-6 R2 D2 Π/a2
D2
mm2/time
10-3 R2
Adsorbent dose
(g/L)
1 1.480 0.974 0.044 0.92 0.87 0.160 0.279 0.950
3 1.484 0.98 0.057 1.55 0.984 0.340 0.593 0.990
5 0.710 0.97 0.043 0.88 0.972 0.340 0.593 0.934
7 0.650 0.95 0.06 1.72 0.99 0.380 0.663 0.980
10 0.370 0.9 0.06 1.72 0.993 0.340 0.593 0.954
pH
2 0.91 0.66 0.13 8.07 0.97 1.300 2.267 0.900
2.5 1.13 0.78 0.11 5.78 0.95 0.400 0.698 0.950
3 1.23 0.912 0.11 5.78 0.995 0.564 0.984 0.930
3.5 1.05 0.883 0.11 5.78 0.92 0.550 0.959 0.980
4 0.69 0.915 0.1 4.78 0.99 0.980 1.709 0.910
Initial
Concentration(ppm)
10 0.084 0.69 0.100 4.78 0.94 0.900 1.570 0.980
25 0.23 0.79 0.103 5.07 0.98 0.390 0.680 0.995
50 0.55 0.91 0.083 3.29 0.983 0.690 1.203 0.994
100 1.235 0.91 0.107 5.47 0.99 0.564 0.984 0.930
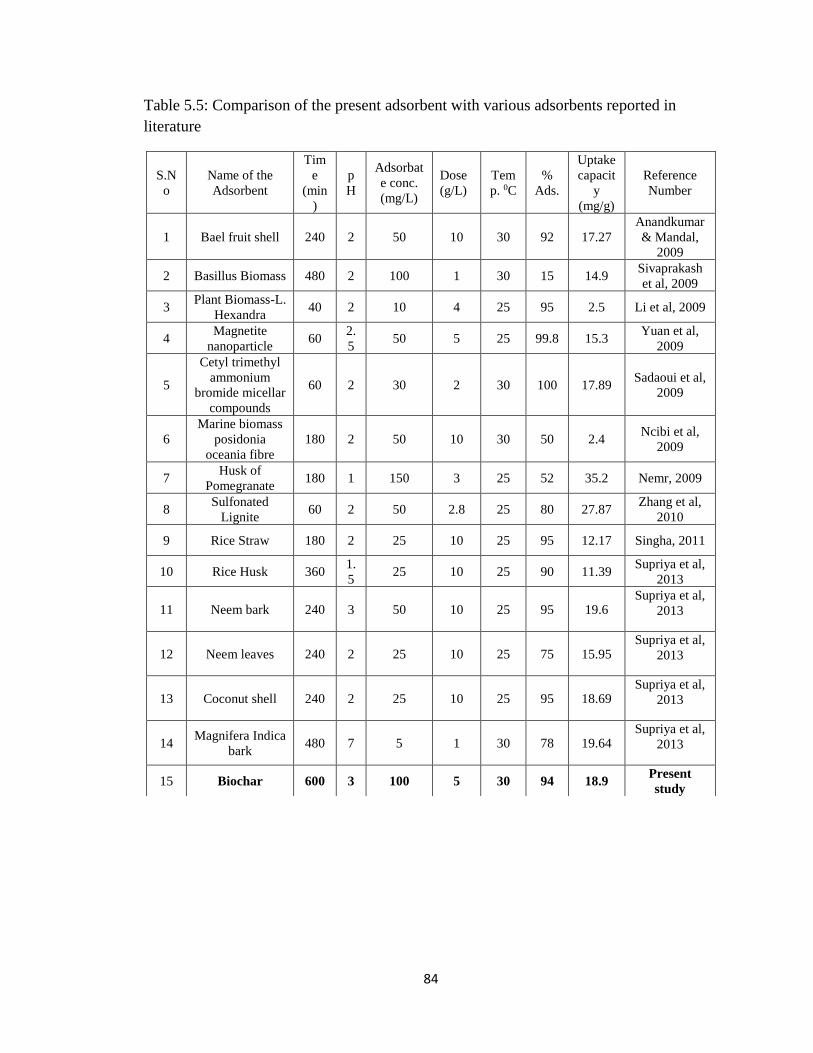
84
Table 5.5: Comparison of the present adsorbent with various adsorbents reported in
literature
S.N
o
Name of the
Adsorbent
Tim
e
(min
)
p
H
Adsorbat
e conc.
(mg/L)
Dose
(g/L)
Tem
p. 0C
%
Ads.
Uptake
capacit
y
(mg/g)
Reference
Number
1 Bael fruit shell 240 2 50 10 30 92 17.27
Anandkumar
& Mandal,
2009
2 Basillus Biomass 480 2 100 1 30 15 14.9 Sivaprakash
et al, 2009
3 Plant Biomass-L.
Hexandra 40 2 10 4 25 95 2.5 Li et al, 2009
4 Magnetite
nanoparticle 60
2.
5 50 5 25 99.8 15.3
Yuan et al,
2009
5
Cetyl trimethyl
ammonium
bromide micellar
compounds
60 2 30 2 30 100 17.89 Sadaoui et al,
2009
6
Marine biomass
posidonia
oceania fibre
180 2 50 10 30 50 2.4 Ncibi et al,
2009
7 Husk of
Pomegranate 180 1 150 3 25 52 35.2 Nemr, 2009
8 Sulfonated
Lignite 60 2 50 2.8 25 80 27.87
Zhang et al,
2010
9 Rice Straw 180 2 25 10 25 95 12.17 Singha, 2011
10 Rice Husk 360 1.
5 25 10 25 90 11.39
Supriya et al,
2013
11 Neem bark 240 3 50 10 25 95 19.6 Supriya et al,
2013
12 Neem leaves 240 2 25 10 25 75 15.95 Supriya et al,
2013
13 Coconut shell 240 2 25 10 25 95 18.69 Supriya et al,
2013
14 Magnifera Indica
bark 480 7 5 1 30 78 19.64
Supriya et al,
2013
15 Biochar 600 3 100 5 30 94 18.9 Present
study
85
Chapter-6 Optimizing adsorption
parameters using statistical
design of experiments
86
6.1 Factorial Design of Experiments
In order to plan an adsorption process, a number of influencing parameters such as contact
time, pH, adsorbate concentration, adsorbent dose, stirring speed, particle size and
temperature are need to be studied. But the process of studying each and every variance
separately is quite tedious as well as time consuming. Further, conventional and classical
methods of studying the effect of different factors involved in the adsorption process at an
unspecified constant level dose not depict the combined effect of all the factors involved
(Ravikumar et al, 2005). This method requires a large number of experiments to determine
the optimal levels, which are unreliable. Thus, the optimization of all the affecting
parameters collectively by using different mathematical models can minimize the above
difficulties (Elibol, 2002; Gun et al, 2002). Objectives of the present study is basically to
determine those variables which are the most influential on the response
developing empirical models based on the independent variable so that the
response is almost always near the desired maximal/minimal value
minimize the effect of uncontrollable variable inputs
find out the optimal process parameters
Experimental design method is an important tool in the engineering science for achieving
better results with minimal effort. It has also been applied extensively in the development
of new processes. Application of this method in the process development can result in
improved yield, reduced variability and firm confirmation to nominal or target
requirements, reduced development time and reduced overall cost (Montgomary, 1991).
Further, pre-design of experiments determines which factors have important bearings on
an expected response as well as how the effect of one factor varies with the level of other
factors (Arenas et al, 2006; Statistical home page, 2006; Montgomary, 2001; Box et al,
1978). A factorial experiment is the important source to quantitatively assess the individual
independent terms including interaction effects of different coefficients and factors.
Engineering design plays a major role in optimizing the process parameters, where new
products are developed and existing ones are improved. Some applications of engineering
design are;
➢ Evaluation and comparison of basic design configuration
87
➢ Evaluation of material alteration
➢ Selection of designing parameters so that the product will work well under a
wide variety of field conditions
➢ Determination of key product design parameters which have impact on the
product performance
Application of statistical approach in designing and analyzing an experiment requires that
everyone involved with the experiment should have a clear idea about the parameters to be
studied, collection of data and at least a qualitative understanding of how the data are to be
analyzed. An outline of the recommended procedure is stated in brief (Montgomery, D. C.,
1991)
➢ Recognition and state of the problem: Clear statements of the problem often
contribute substantially to a better understanding of the phenomena and the final
solution of the problem.
➢ Choice of factors and levels: At the beginning of a study, choice should be
made about the factors to be varied in the experiments, the ranges over which this
factors will be varied, and a specific level at which runs will be made. Consideration
must also be given to how these factors are to be controlled at the desired values
and how these are to be measured.
➢ Selection of the response variable: In selecting the response variables, it must
be ascertained that this variable really provides useful information about the
process.
➢ Choice of experimental design: If the first three steps are performed correctly
this step becomes relatively easy. Choice of design involves consideration of
sample size (number of replicates) and selection of a suitable number of trials. In
selecting the design, it is important to keep experimental objectives in mind.
➢ Performing the experiment: While running the experiments, it is essential to
monitor the process carefully to ensure that everything is being done as per plan.
Errors in experimental procedure at this stage will usually destroy experimental
validity.
➢ Data analysis: Statistical method should be used to analyze the data so that the
results and conclusions are objectives rather than conclusive in nature. If the
88
experiments have been designed correctly and if it has been performed according
to the design, then the statistical methods required are not elaborate.
➢ Conclusion and recommendation: Once the data have been analyzed, practical
conclusions about the results are drawn and a course of action is recommended.
In the present study, full factorial designed is used to optimize the adsorption parameters
for the treatment of Cr(VI) contaminated wastewater. This chapter is broadly divided in to
two parts. In the 1st part of the study, a full factorial design is used to find the effect of
different adsorption parameters on the Cr(VI) adsorption capacity using Sorghastrum
Nutans L. Nash. Experiments were designed using statistical design of experiments and
carried out in the laboratory at the desired level of adsorption parameters. MINITAB
software is used to develop the empirical model. The model is analyze using various
statistical techniques such as the normal probability, residual, contour, 3D surface, main
effect and interaction plot, t-test, ANOVA and F-test. In the 2nd part of the study, data were
collected from the literature and analyzed using designed of experiment. Matrix method is
used to develop the empirical equation relating the dependent variable and independent
variables. MATLAB and LabVIEW is used to simulate the empirical model. Finally, a
comparison is made among MATLAB and LabVIEW.
6.2 Design of Experiment for the Treatment of Cr(VI) Contaminated Water using
Sorghastrum Nutans L. Nash
Full factorial design of 24 type was employed for the optimization of adsorption parameters
and also to find out the most significant factor among the parameters. Where four
parameters and two levels for each parameter is used to optimized the process. The four
factors pH, adsorbent dose, initial concentration and time were selected as independent
variables and % Cr(VI) sorption is chosen as the response variables. The independent
variables are varied at two levels as shown in Table 6.1 to investigate their effects on the
Cr(VI) removal. The effect of an independent factor on the response variable is known as
the main effect. In some cases, it is found that the variation in the response between level
of one factor is not the same at all levels of the other factors, which is known as an
interaction effect between independent variables (Wu & Hamada, 2009). A full factorial
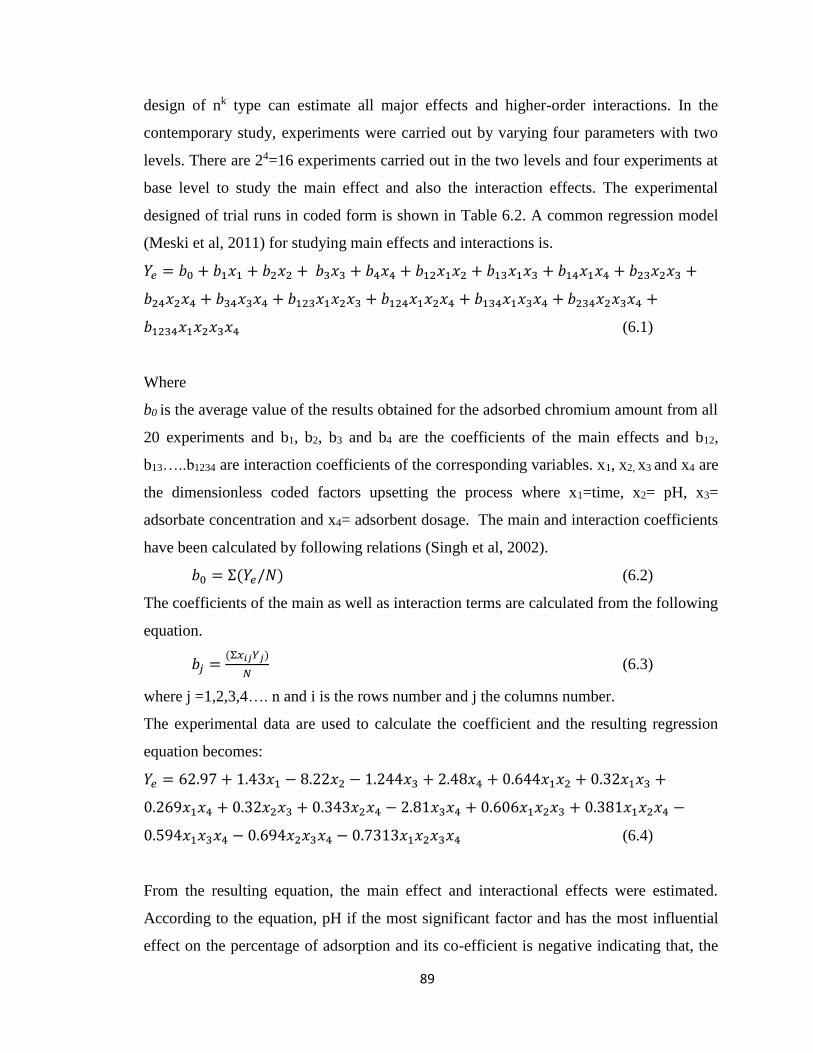
89
design of nk type can estimate all major effects and higher-order interactions. In the
contemporary study, experiments were carried out by varying four parameters with two
levels. There are 24=16 experiments carried out in the two levels and four experiments at
base level to study the main effect and also the interaction effects. The experimental
designed of trial runs in coded form is shown in Table 6.2. A common regression model
(Meski et al, 2011) for studying main effects and interactions is.
𝑌𝑒 = 𝑏0 + 𝑏1𝑥1 + 𝑏2𝑥2 + 𝑏3𝑥3 + 𝑏4𝑥4 + 𝑏12𝑥1𝑥2 + 𝑏13𝑥1𝑥3 + 𝑏14𝑥1𝑥4 + 𝑏23𝑥2𝑥3 +
𝑏24𝑥2𝑥4 + 𝑏34𝑥3𝑥4 + 𝑏123𝑥1𝑥2𝑥3 + 𝑏124𝑥1𝑥2𝑥4 + 𝑏134𝑥1𝑥3𝑥4 + 𝑏234𝑥2𝑥3𝑥4 +
𝑏1234𝑥1𝑥2𝑥3𝑥4 (6.1)
Where
b0 is the average value of the results obtained for the adsorbed chromium amount from all
20 experiments and b1, b2, b3 and b4 are the coefficients of the main effects and b12,
b13…..b1234 are interaction coefficients of the corresponding variables. x1, x2, x3 and x4 are
the dimensionless coded factors upsetting the process where x1=time, x2= pH, x3=
adsorbate concentration and x4= adsorbent dosage. The main and interaction coefficients
have been calculated by following relations (Singh et al, 2002).
𝑏0 = Σ(𝑌𝑒/𝑁) (6.2)
The coefficients of the main as well as interaction terms are calculated from the following
equation.
𝑏𝑗 =(Σ𝑥𝑖𝑗𝑌𝑗)
𝑁 (6.3)
where j =1,2,3,4…. n and i is the rows number and j the columns number.
The experimental data are used to calculate the coefficient and the resulting regression
equation becomes:
𝑌𝑒 = 62.97 + 1.43𝑥1 − 8.22𝑥2 − 1.244𝑥3 + 2.48𝑥4 + 0.644𝑥1𝑥2 + 0.32𝑥1𝑥3 +
0.269𝑥1𝑥4 + 0.32𝑥2𝑥3 + 0.343𝑥2𝑥4 − 2.81𝑥3𝑥4 + 0.606𝑥1𝑥2𝑥3 + 0.381𝑥1𝑥2𝑥4 −
0.594𝑥1𝑥3𝑥4 − 0.694𝑥2𝑥3𝑥4 − 0.7313𝑥1𝑥2𝑥3𝑥4 (6.4)
From the resulting equation, the main effect and interactional effects were estimated.
According to the equation, pH if the most significant factor and has the most influential
effect on the percentage of adsorption and its co-efficient is negative indicating that, the
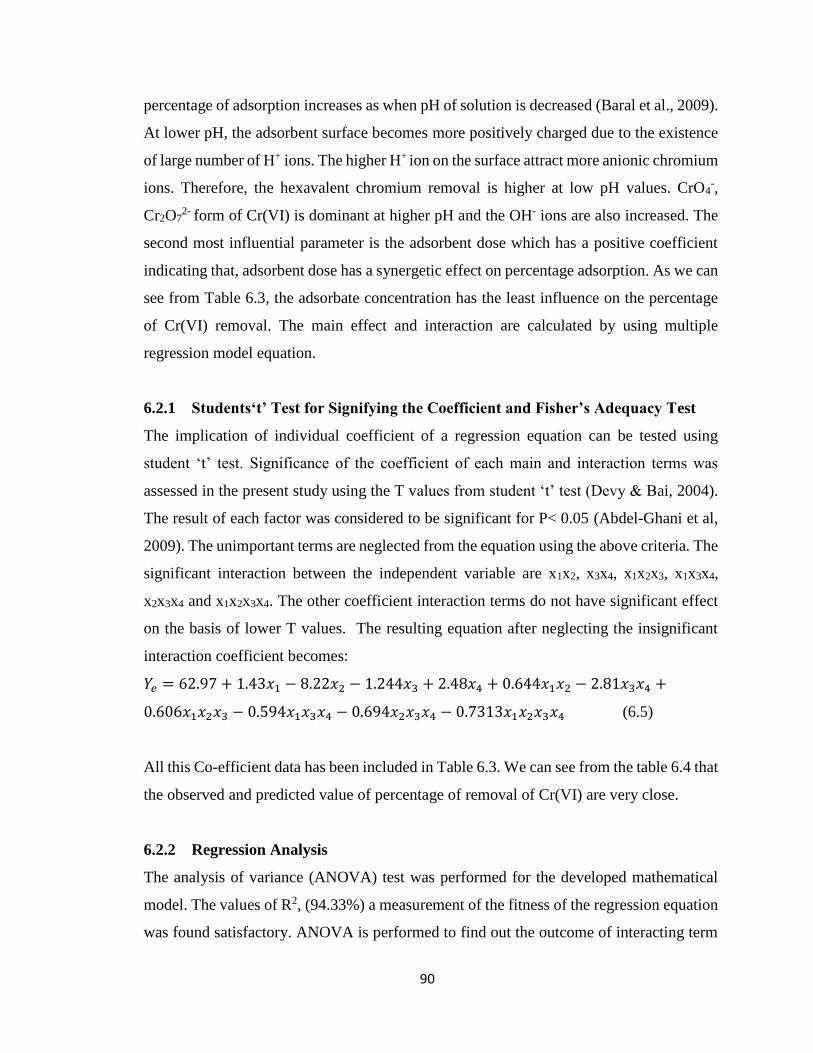
90
percentage of adsorption increases as when pH of solution is decreased (Baral et al., 2009).
At lower pH, the adsorbent surface becomes more positively charged due to the existence
of large number of H+ ions. The higher H+ ion on the surface attract more anionic chromium
ions. Therefore, the hexavalent chromium removal is higher at low pH values. CrO4-,
Cr2O72- form of Cr(VI) is dominant at higher pH and the OH- ions are also increased. The
second most influential parameter is the adsorbent dose which has a positive coefficient
indicating that, adsorbent dose has a synergetic effect on percentage adsorption. As we can
see from Table 6.3, the adsorbate concentration has the least influence on the percentage
of Cr(VI) removal. The main effect and interaction are calculated by using multiple
regression model equation.
6.2.1 Students‘t’ Test for Signifying the Coefficient and Fisher’s Adequacy Test
The implication of individual coefficient of a regression equation can be tested using
student ‘t’ test. Significance of the coefficient of each main and interaction terms was
assessed in the present study using the T values from student ‘t’ test (Devy & Bai, 2004).
The result of each factor was considered to be significant for P< 0.05 (Abdel-Ghani et al,
2009). The unimportant terms are neglected from the equation using the above criteria. The
significant interaction between the independent variable are x1x2, x3x4, x1x2x3, x1x3x4,
x2x3x4 and x1x2x3x4. The other coefficient interaction terms do not have significant effect
on the basis of lower T values. The resulting equation after neglecting the insignificant
interaction coefficient becomes:
𝑌𝑒 = 62.97 + 1.43𝑥1 − 8.22𝑥2 − 1.244𝑥3 + 2.48𝑥4 + 0.644𝑥1𝑥2 − 2.81𝑥3𝑥4 +
0.606𝑥1𝑥2𝑥3 − 0.594𝑥1𝑥3𝑥4 − 0.694𝑥2𝑥3𝑥4 − 0.7313𝑥1𝑥2𝑥3𝑥4 (6.5)
All this Co-efficient data has been included in Table 6.3. We can see from the table 6.4 that
the observed and predicted value of percentage of removal of Cr(VI) are very close.
6.2.2 Regression Analysis
The analysis of variance (ANOVA) test was performed for the developed mathematical
model. The values of R2, (94.33%) a measurement of the fitness of the regression equation
was found satisfactory. ANOVA is performed to find out the outcome of interacting term
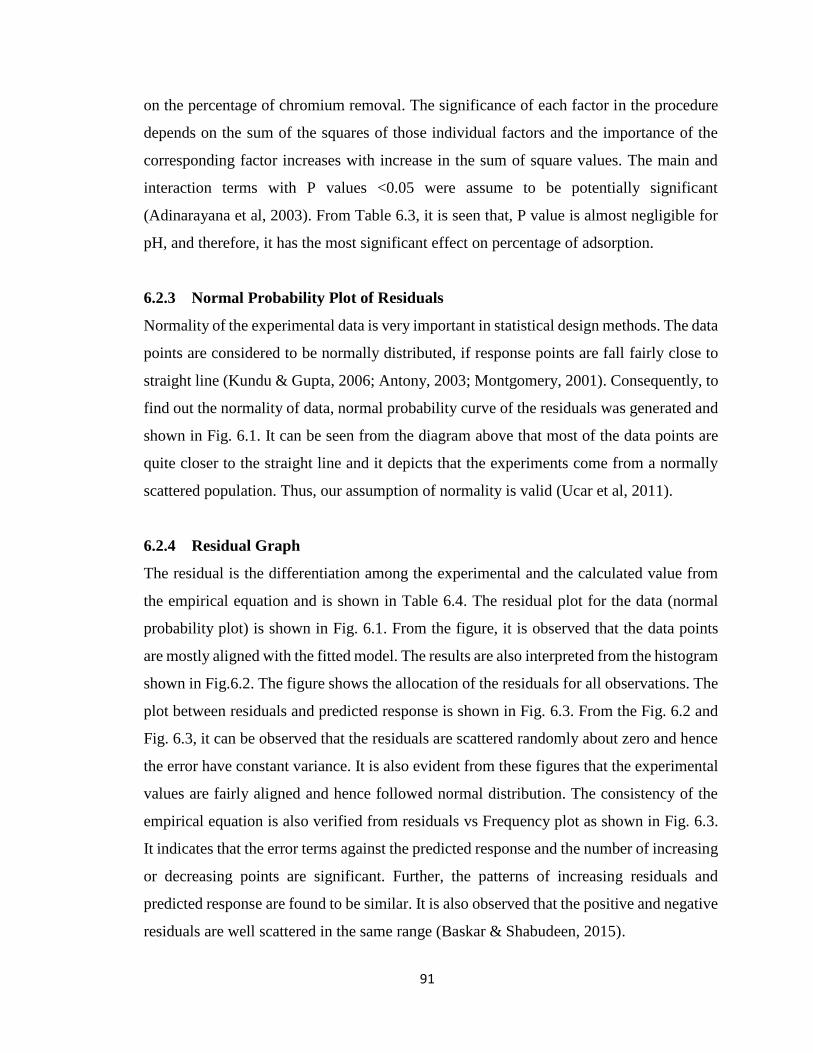
91
on the percentage of chromium removal. The significance of each factor in the procedure
depends on the sum of the squares of those individual factors and the importance of the
corresponding factor increases with increase in the sum of square values. The main and
interaction terms with P values <0.05 were assume to be potentially significant
(Adinarayana et al, 2003). From Table 6.3, it is seen that, P value is almost negligible for
pH, and therefore, it has the most significant effect on percentage of adsorption.
6.2.3 Normal Probability Plot of Residuals
Normality of the experimental data is very important in statistical design methods. The data
points are considered to be normally distributed, if response points are fall fairly close to
straight line (Kundu & Gupta, 2006; Antony, 2003; Montgomery, 2001). Consequently, to
find out the normality of data, normal probability curve of the residuals was generated and
shown in Fig. 6.1. It can be seen from the diagram above that most of the data points are
quite closer to the straight line and it depicts that the experiments come from a normally
scattered population. Thus, our assumption of normality is valid (Ucar et al, 2011).
6.2.4 Residual Graph
The residual is the differentiation among the experimental and the calculated value from
the empirical equation and is shown in Table 6.4. The residual plot for the data (normal
probability plot) is shown in Fig. 6.1. From the figure, it is observed that the data points
are mostly aligned with the fitted model. The results are also interpreted from the histogram
shown in Fig.6.2. The figure shows the allocation of the residuals for all observations. The
plot between residuals and predicted response is shown in Fig. 6.3. From the Fig. 6.2 and
Fig. 6.3, it can be observed that the residuals are scattered randomly about zero and hence
the error have constant variance. It is also evident from these figures that the experimental
values are fairly aligned and hence followed normal distribution. The consistency of the
empirical equation is also verified from residuals vs Frequency plot as shown in Fig. 6.3.
It indicates that the error terms against the predicted response and the number of increasing
or decreasing points are significant. Further, the patterns of increasing residuals and
predicted response are found to be similar. It is also observed that the positive and negative
residuals are well scattered in the same range (Baskar & Shabudeen, 2015).
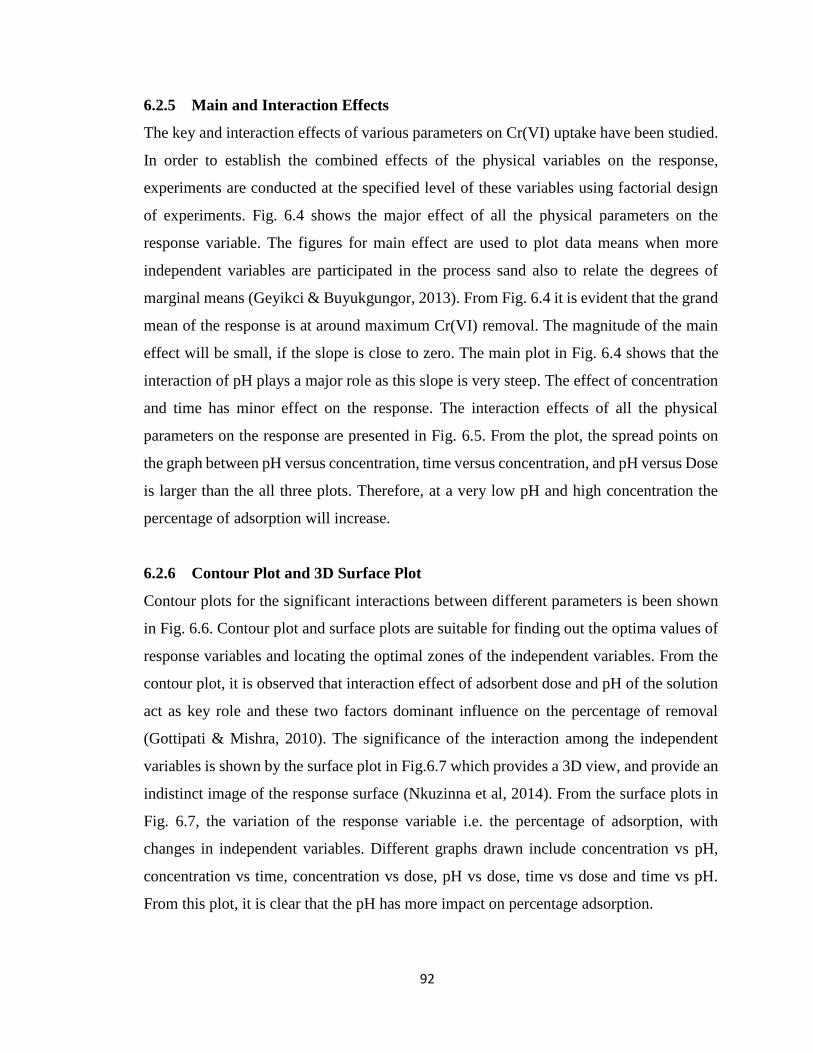
92
6.2.5 Main and Interaction Effects
The key and interaction effects of various parameters on Cr(VI) uptake have been studied.
In order to establish the combined effects of the physical variables on the response,
experiments are conducted at the specified level of these variables using factorial design
of experiments. Fig. 6.4 shows the major effect of all the physical parameters on the
response variable. The figures for main effect are used to plot data means when more
independent variables are participated in the process sand also to relate the degrees of
marginal means (Geyikci & Buyukgungor, 2013). From Fig. 6.4 it is evident that the grand
mean of the response is at around maximum Cr(VI) removal. The magnitude of the main
effect will be small, if the slope is close to zero. The main plot in Fig. 6.4 shows that the
interaction of pH plays a major role as this slope is very steep. The effect of concentration
and time has minor effect on the response. The interaction effects of all the physical
parameters on the response are presented in Fig. 6.5. From the plot, the spread points on
the graph between pH versus concentration, time versus concentration, and pH versus Dose
is larger than the all three plots. Therefore, at a very low pH and high concentration the
percentage of adsorption will increase.
6.2.6 Contour Plot and 3D Surface Plot
Contour plots for the significant interactions between different parameters is been shown
in Fig. 6.6. Contour plot and surface plots are suitable for finding out the optima values of
response variables and locating the optimal zones of the independent variables. From the
contour plot, it is observed that interaction effect of adsorbent dose and pH of the solution
act as key role and these two factors dominant influence on the percentage of removal
(Gottipati & Mishra, 2010). The significance of the interaction among the independent
variables is shown by the surface plot in Fig.6.7 which provides a 3D view, and provide an
indistinct image of the response surface (Nkuzinna et al, 2014). From the surface plots in
Fig. 6.7, the variation of the response variable i.e. the percentage of adsorption, with
changes in independent variables. Different graphs drawn include concentration vs pH,
concentration vs time, concentration vs dose, pH vs dose, time vs dose and time vs pH.
From this plot, it is clear that the pH has more impact on percentage adsorption.
93
6.3 Modeling and Simulation for the Adsorptive Removal of Cr(VI)
In this part of the study experimental data collected from literature (Baral et al, 2008) and
used for the optimization of adsorption parameters. The basic objective is to develop
different alternatives techniques for modeling and simulation of Cr(VI) adsorption process.
A full factorial design of the type nk has been used for the literature data, where n is the
number of levels and k is the number of factors under verification. Here time, pH and
temperature were chosen as three independent factors/variables (k=3 and n=2) and the
percentage of adsorption as the dependent out-put response variable. A 23 full-factorial
experimental design (Montgomary, 2001) with number of 3 triplicates at the center point
and thus a total of 11 experiments were employed in this study. For statistical calculation,
the base level, which is the average of two level were calculated using the following
relation
X
XXx i
i
0 (6.6)
The behavior of the system was explained by the following
3211231331322321123322110 xxxbxxbxxbxxbxbxbxbbY (6.7)
where b0, b1… b123 are the regression interaction coefficients of the concerned variables
and x1, x2 and x3 are the dimensionless coded factor affecting the process. Here x1=time,
x2=pH and x3=temperature. The factorial levels and variation interval of the coded factor
are shown in Table 6.5. The parameters varied were time (5-15min), pH (1.6-1.8) and
temperature (30-40oC). The variable parameters in two levels, their coded values and the
condition for the base level experiments are given in Table 6.6. The +, - and 0 designations
were given to the higher, lower and base levels respectively.
6.3.1 Development of Mathematical Model
Equation 6.8 is a representation of Table 6.6. X is obtained by interpolating columns 2-8
of Table 6.6 into matrix form excluding the base values. Thus, X is an 8×8 matrix obtained
for all the possible combinations of x1, x2 and x3, as shown in equation 6.10. Further the
regression coefficients are represented by an 8×1 matrix B as shown in equation 6.11. Thus,
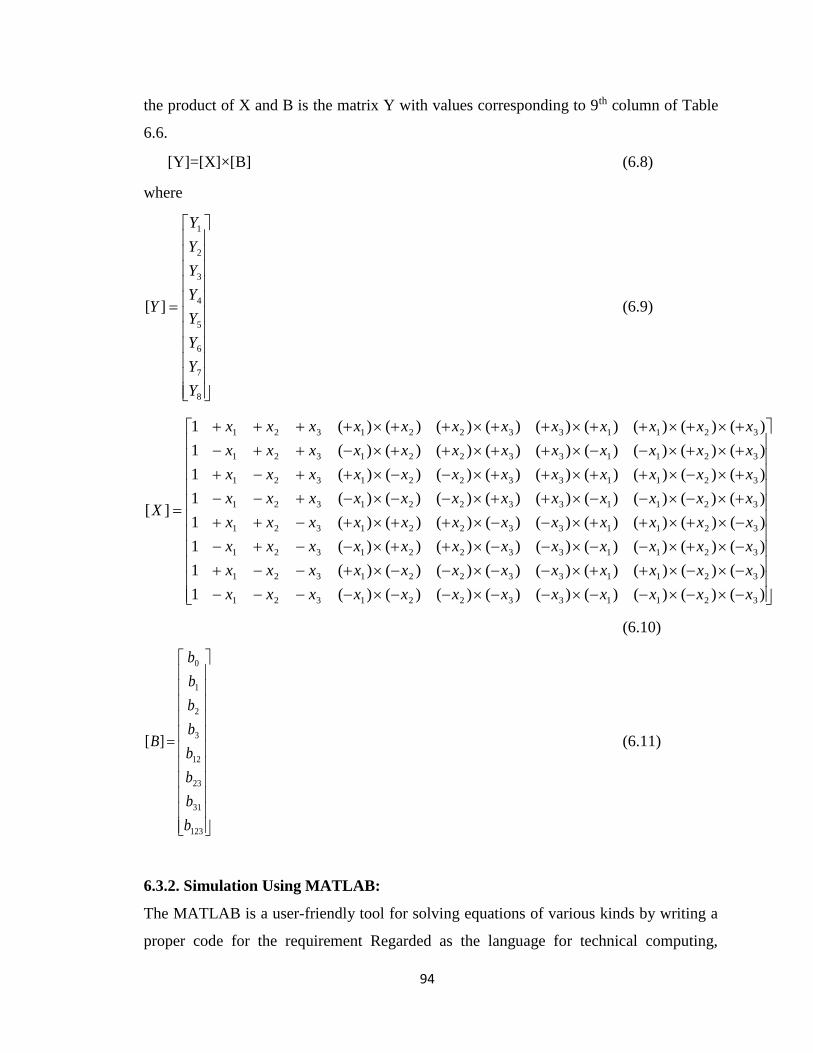
94
the product of X and B is the matrix Y with values corresponding to 9th column of Table
6.6.
[Y]=[X]×[B] (6.8)
where
8
7
6
5
4
3
2
1
][
Y
Y
Y
Y
Y
Y
Y
Y
Y (6.9)
)()()()()()()()()(1
)()()()()()()()()(1
)()()()()()()()()(1
)()()()()()()()()(1
)()()()()()()()()(1
)()()()()()()()()(1
)()()()()()()()()(1
)()()()()()()()()(1
][
321133221321
321133221321
321133221321
321133221321
321133221321
321133221321
321133221321
321133221321
xxxxxxxxxxxx
xxxxxxxxxxxx
xxxxxxxxxxxx
xxxxxxxxxxxx
xxxxxxxxxxxx
xxxxxxxxxxxx
xxxxxxxxxxxx
xxxxxxxxxxxx
X
(6.10)
123
31
23
12
3
2
1
0
][
b
b
b
b
b
b
b
b
B (6.11)
6.3.2. Simulation Using MATLAB:
The MATLAB is a user-friendly tool for solving equations of various kinds by writing a
proper code for the requirement Regarded as the language for technical computing,
95
MATLAB has also been widely used by researchers in industrial and applied mathematics,
as well as engineers, scientists and economists because of its efficiency in dealing with
matrices and matrix algebra (Ang, 2008). In addition, the availability of special purpose
toolboxes (such as Signal Processing, Optimization and Financial Toolboxes) has made it
easier for researchers to use MATLAB in their work. It can be used to finish our task of
solving equations easily provided the code is correct. Besides using it as a mathematical
tool for solving equations MATLAB can be used as a language to write algorithms for
various software like LabVIEW simulation software. Also, programming languages like C
can also be coded using MATLAB. In the present study, we have used matrix method to
develop a mathematical model for the adsorption process. We have written a code using
MATLAB to simulate the developed mathematical model.
Simulation of adsorption process would best be implemented with a tool that can perform
matrix computations efficiently, carry out numerical analysis conveniently and produce a
desired output accurately. MATLAB is one such tool that can do all these computations
concomitantly. In the succeeding section the development of code using MATLAB for
solving equation 6.8 is outlined.
Matrices developed in section 6.3 were solved to obtain the regression interaction
coefficients b0, b1… b123 of equation 6.12. Equation 6.8 was solved using MATLAB and
the corresponding code is given in Table 6.7. The variation levels of parameters obtained
from Table 6.5 were defined as xp, xo and xn where p, n and 0 represents +, - and base
values. Equation 6.10 as discussed earlier is defined for all the possible combinations of
the adsorption parameters obtained from Table 6.6. By executing the code as given in Table
6.7, we obtain the values of regression interaction coefficients b0, b1… b123. Thus, equation
6.7 can be represented as:
321133221321 5787.07837.09812.00087.0073.4593.48.289.38 xxxxxxxxxxxxY
(6.12)
6.3.3 Simulation Using LabVIEW
LabVIEW is an integrated data acquisition, analysis and presentation package for the
graphical programming of scientific and engineering applications in the areas of
96
measurement, simulation and control using the computer. User-written LabVIEW
programs are called ‘‘virtual instruments’’(VIs). VIs has three main parts: the front panel,
block diagram, and icon=connector. The front panel provides the user an interface for data
inputs and outputs. The user operates the front panel by using the computer’s keyboard and
mouse. Behind the front panel is the block diagram that is responsible for the actual data
flow between the inputs and outputs. The icon=connector defines data flow between
subroutines. LabVIEW includes device driver functions for serial and parallel interfaces
and a wide range of mathematical, logic, timing and digital signal generation, processing
and analysis functions. LabVIEW has been used in areas such as simulation, automated
testing, data acquisition and analysis, and process control.
It is possible for amateur programmers to design programs of high quality by using
LabVIEW, and it suits the thinking methods of scientists and engineers so that it can be
honored with the name of engineering language (Wang et al, 2007). LabVIEW has wide
application in the fields of aerospace, communications, automobile engineering,
biomedicine, and so forth. However, to our knowledge, it has not yet been reported on
frequently in the field of Chemical Engineering (Li et al, 2005). LabVIEW graphical
programming relieves the user of writing and debugging code in conventional
programming languages and replaces this with the simple and intuitive task of
interconnecting functional blocks and control structures. The iconic presentation of blocks
and structures and the familiar block diagram layout make the application almost self-
explanatory with little need for additional documentation. The hierarchical nature of the VI
concept allows complex systems to be divided into a set of more manageable sub-systems
in a structured.
The block diagram was developed with an assumption that the adsorption parameters are
variables. Considering the matrix approach as discussed earlier in section 6.2, the equations
were solved using block diagram approach. Generally, LabVIEW accepts variables in array
format only. To obtain a constant or a variable in an array format, a function for formatting
these constants and variables into arrays was needed. For this, LabVIEW has a built-in
application that is used for array formation. A window called “FUNCTIONS” panel which
97
appears in the block diagram has several mathematical applications and tools required for
developing a block diagram. A tool called “ARRAY” from the functions panel was used
for formatting these variables and constants into arrays. Later by using matrix-templates
obtained from the same panel, these arrays were arranged into their corresponding matrix
forms. Thus, a block diagram as shown in Fig. 6.8 was developed.
The front panel of the virtual instrument is an interface between user and computer. Besides
friendly interface and easy control, the corresponding test function can be started up by a
simple manipulation. It should also be able to finish user’s task successfully. Software is a
key section of the virtual instrument. Fig. 6.9 shows the front panel window where
provision for the three-adsorption parameter x1, x2 and x3 is provided. The values of (+x1,
+x2 ,+x3) & (+x12, +x22, +x32) correspond to the variation values as given in Table 6.5. The
real matrix and the inverse matrix obtained are shown in Fig 6.9. Result icon in the front
panel window of Fig.6.9 is the desired output Y. The block diagram of the process between
the inputs and output is delineated in Fig.6.8.
For further verification of the model developed, we defined three different variables x1, x2
and x3, and their respective experimental Y value known in preempt. The new matrix X
and the matrix B obtained from earlier calculations were used in equation 6.8 to evaluate
the corresponding theoretical value of Y. Next the values of all the adsorption parameters
were inputted in the front panel window and by execution we obtained the theoretical value
of Y.
6.3.4 Comparison Between MATLAB and LabVIEW
In the MATLAB method of solution, our main aim was to obtain the values of regression
interaction coefficients. There were a few disadvantages with MATLAB approach of
solving the mathematical model. If there is a need to change the parameters which are
considered as the basis for this mathematical model, the coded matrix has to be changed
followed by the complete change in values of Table 6.6. This indeed requires a complete
change of the code given in Table 6.7. To avoid this tedious approach of solving equation
6.7, a much user friendly method was developed using LabVIEW. In this model the values
98
of parameters were inputted in the front panel window. The results were immediately
obtained without any manual calculation in the same front panel window.
6.4 Error Analysis
In order to verify the goodness of fit of the developed mathematical models to the
experimental values, it is necessary to examine the data using error analysis. A number of
error analysis methods such as the sum of the square of the error (SSE), the sum of the
absolute error (SAE), average relative error (ARE) and the average relative standard error
(ARS) were used in the present study to verify which mathematical model is best fit to the
experimental observations. The expressions for the above said error functions are as
follows (Lazaridis et al, 2003; Leyva et al, 2005; Aksu and Isoglu, 2005; Kundu and Gupta,
2006):
➢ The sum of the square of the error (SSE)
n
i
iec YYSSE1
2)( (6.13)
➢ The sum of the absolute error (SAE)
n
iiec YYSAE
1
(6.14)
➢ The average relative error (ARE)
n
i e
ec
Y
YY
nARE
1
1 (6.15)
➢ The average relative standard error (ARS)
1
]/)[(1
2
n
YYY
ARS
n
i
eec
(6.16)
where ‘n’ is the number of experimental data points, ‘yc’ is the predicted (calculated) data,
‘ye’ is the experimental data and ‘y’ represents the percentage of adsorption. The above
statistical error expressions were applied to the mathematical model developed for different
values of adsorption parameters. The above statistical criteria are applied to the equation
99
6.5 and 6.12. The value of the errors along with the predicted values are shown here in
Table 6.4 and 6.8. It is quite evident from the values of the statistical parameters that trial
data fit well to the mathematical model. It can be concluded from the values of the
statistical parameters that the experimental data fit well to the mathematical model.
6.5 Conclusion
The objective of the present chapter was to develop empirical model using factorial design
of experiment and use different tools MINITAB, MATLAB and LabVIEW to simulate or
analyze the empirical model. In the 1st part of study, full factorial design of experiment is
used for the optimization of Cr(VI) adsorption using Sorghastrum Nutans L. Nash.
Factorial design of 24 type is employed with contact time, initial pH of the solution,
adsorbent doge and initial Cr(VI) concentration as independent parameters and % of Cr(VI)
adsorption as the response variable. Different statistical analysis such as probability,
residual, contour, 3D surface, main effect and interaction plot along with t-test, ANOVA
and F-test were used to optimize the operating parameters of the process. From the
statistical analysis, it was found that the pH has a negative effect and is the most influential
parameter, as pH decreases, the percentage of adsorption increases significantly. The
second most important parameter is doses which has a positive effect as the percentage of
adsorption increases with dosage. The maximum removal was obtained at pH of 1.3,
concentration 100 mg/L and adsorbent dose of 7 g/L. The present adsorbent is compared
with different low cost adsorbents reported in the literature and was found to be
comparable. In the second part of the optimization process, Data is collected from the
literature and a 23 type factorial design is used to design the experiment. Empirical
mathematical model was developed using matrix method. In the mathematical model,
percentage adsorption of Cr(VI) was represented as a function of process variables like
contact time, initial pH of the solution and temperature. The significance of different
adsorption parameters along with their combined effect on the process was studied. Error
analysis using statistical method indicated that the experimental values were well fitted to
the mathematical model. Later the empirical model was simulated using MATLAB and
LabVIEW. Among the two simulating tool the latter one was found to be much user
friendly. From the analysis, it was concluded that pH had the most influential effect on the

100
adsorption process followed by contact time. Temperature had the least influential effect
on the adsorption process. Among all possible combined effects, the effect of pH and
contact time was the most influential one.
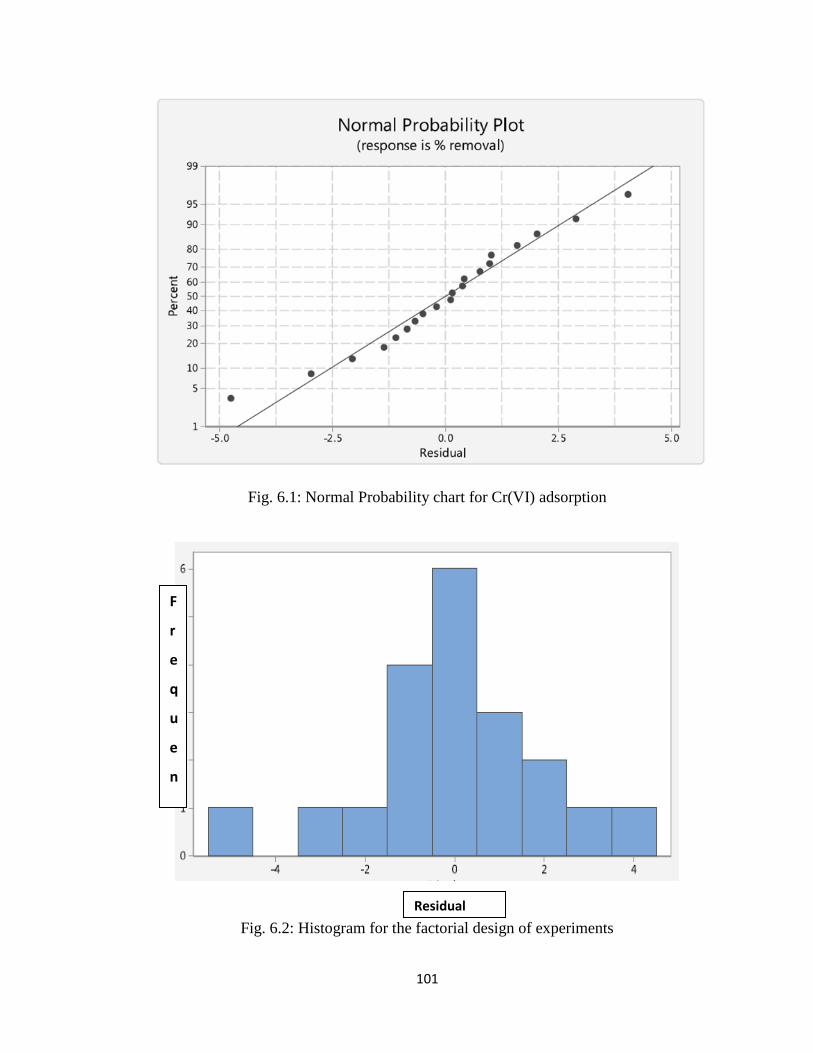
101
Fig. 6.1: Normal Probability chart for Cr(VI) adsorption
Fig. 6.2: Histogram for the factorial design of experiments
F
r
e
q
u
e
n
c
y
Residual
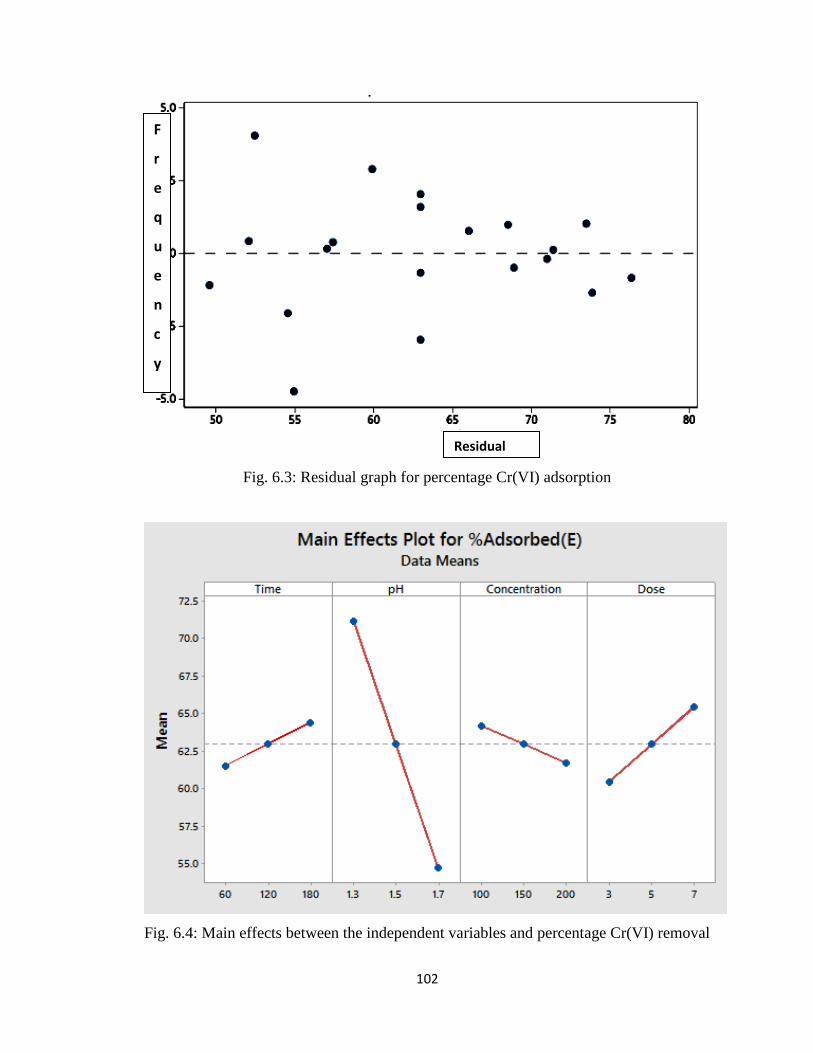
102
Fig. 6.3: Residual graph for percentage Cr(VI) adsorption
Fig. 6.4: Main effects between the independent variables and percentage Cr(VI) removal
Residual
F
r
e
q
u
e
n
c
y
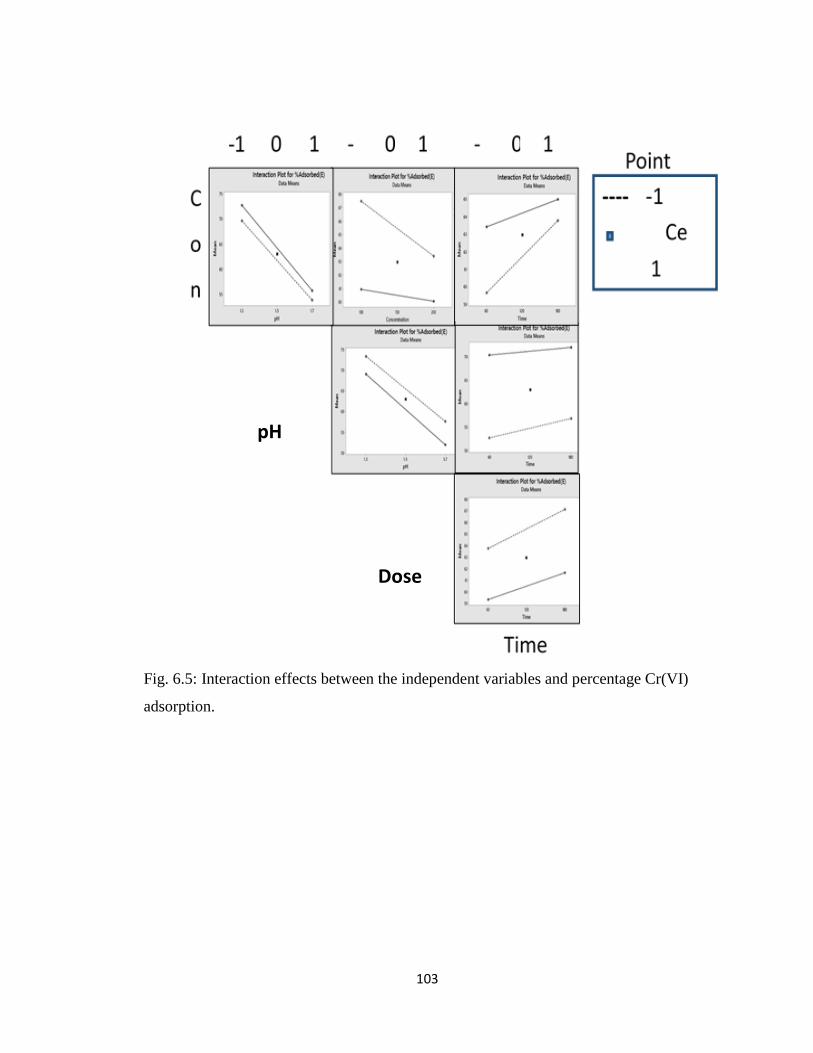
103
Fig. 6.5: Interaction effects between the independent variables and percentage Cr(VI)
adsorption.
pH
Dose
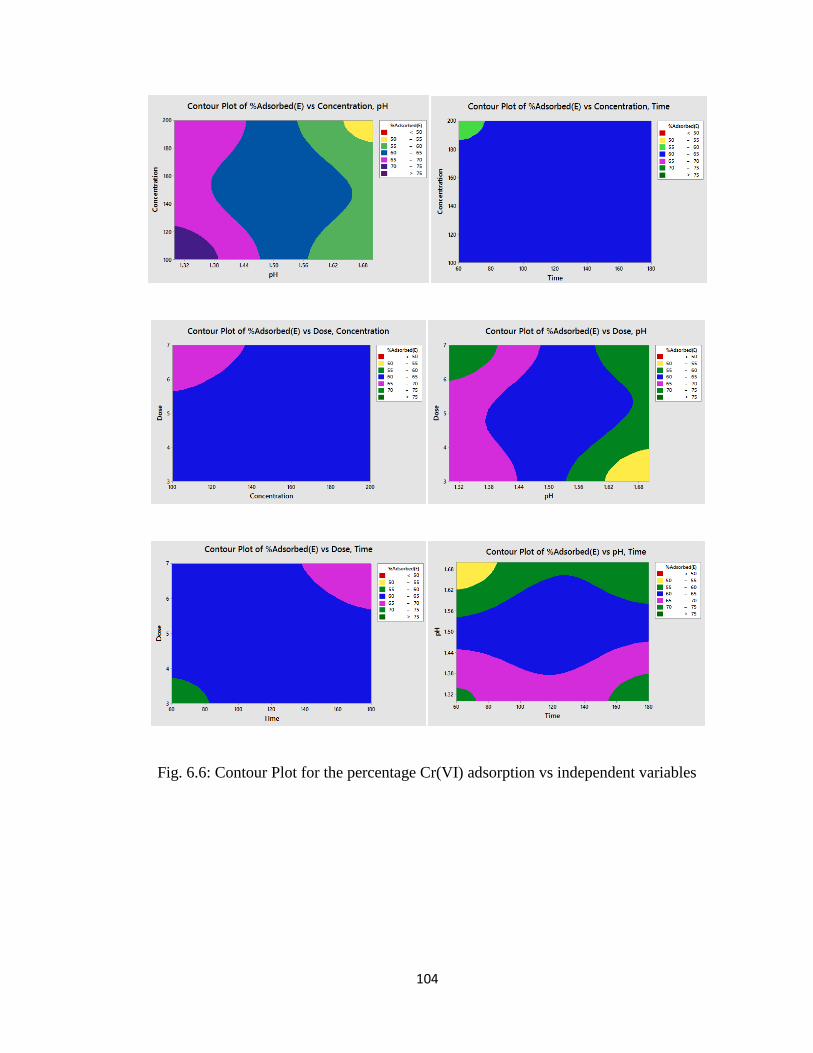
104
Fig. 6.6: Contour Plot for the percentage Cr(VI) adsorption vs independent variables
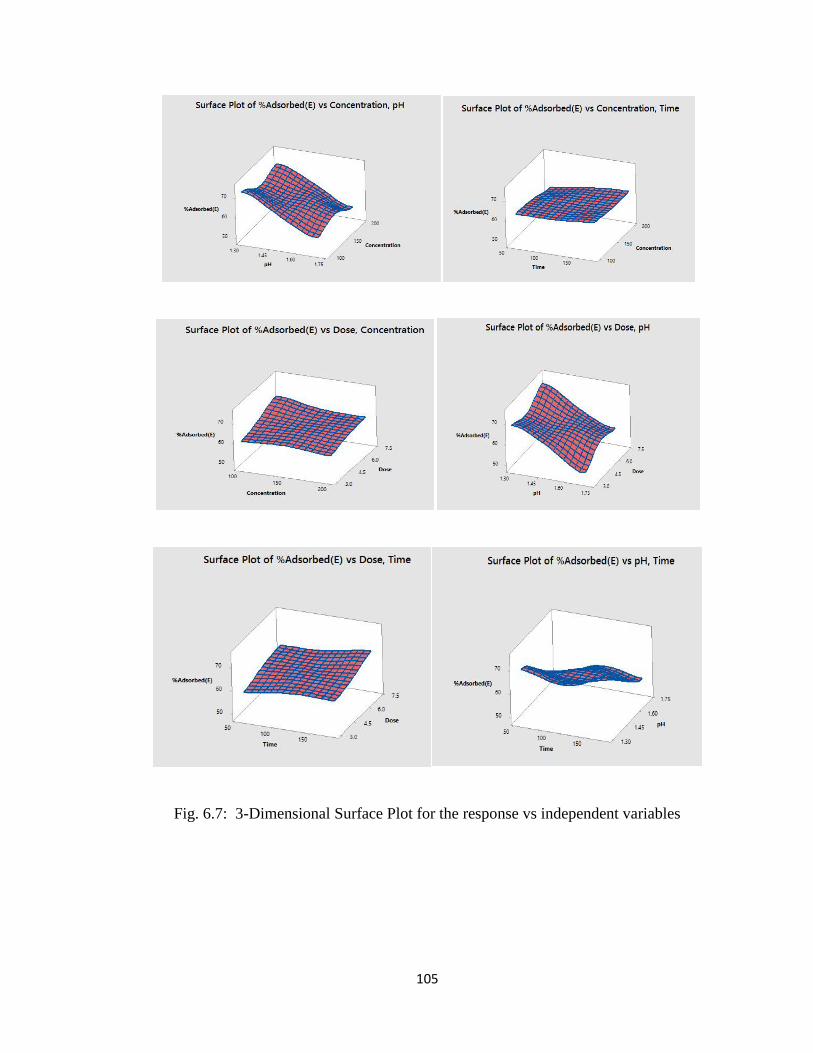
105
Fig. 6.7: 3-Dimensional Surface Plot for the response vs independent variables
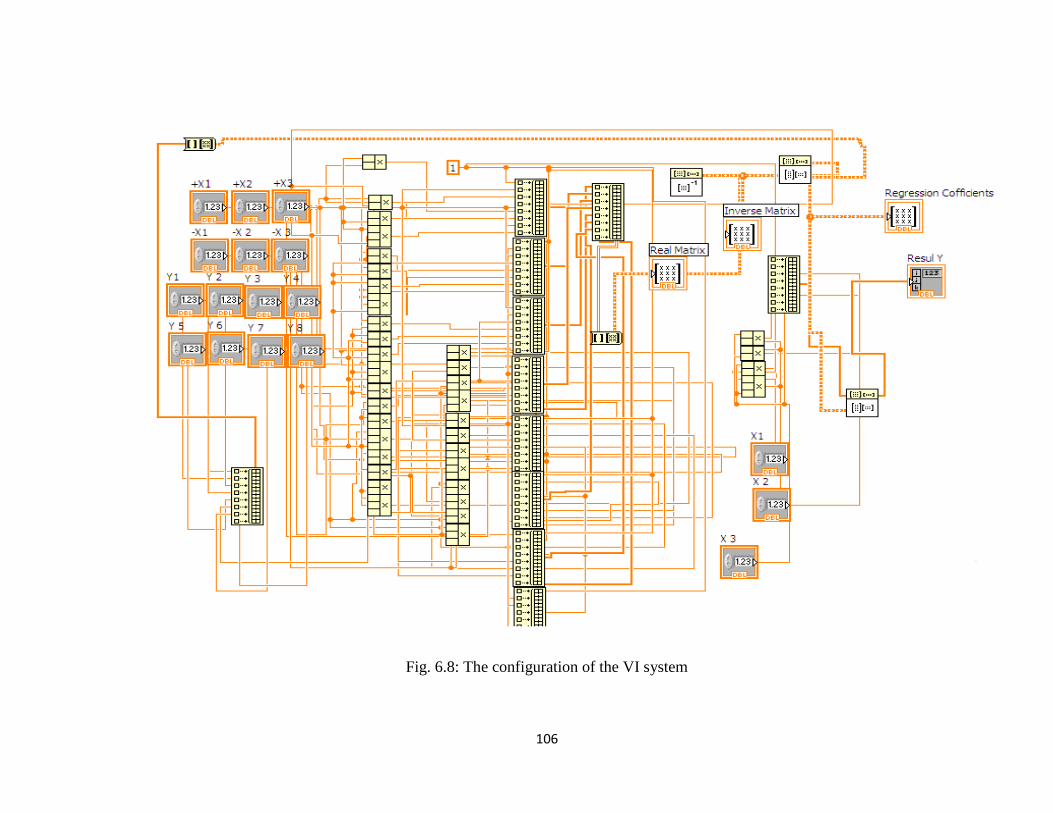
106
Fig. 6.8: The configuration of the VI system
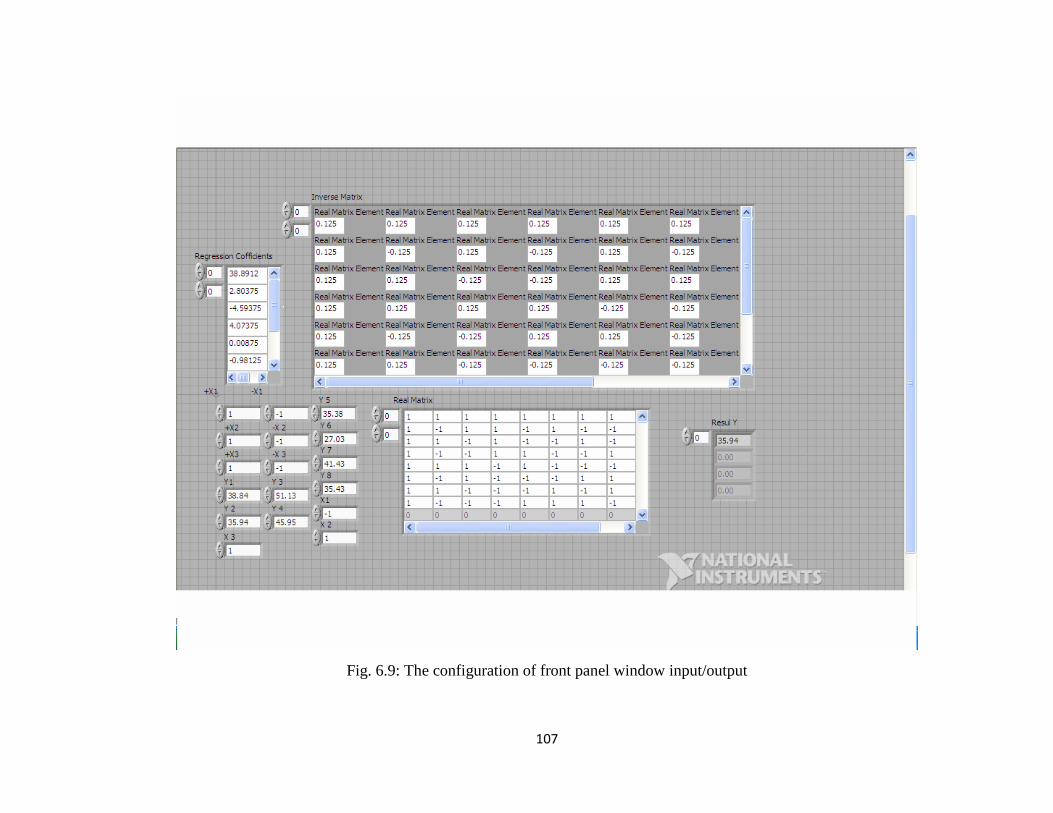
107
Fig. 6.9: The configuration of front panel window input/output
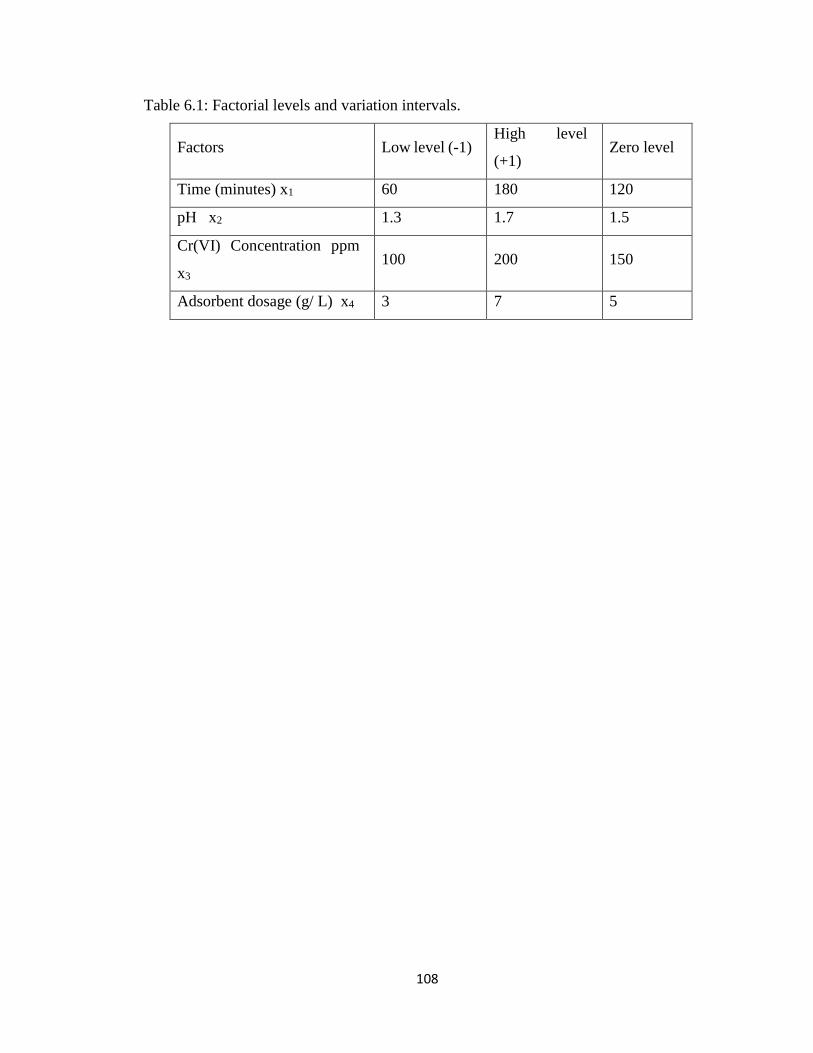
108
Table 6.1: Factorial levels and variation intervals.
Factors Low level (-1) High level
(+1) Zero level
Time (minutes) x1 60 180 120
pH x2 1.3 1.7 1.5
Cr(VI) Concentration ppm
x3 100 200 150
Adsorbent dosage (g/ L) x4 3 7 5
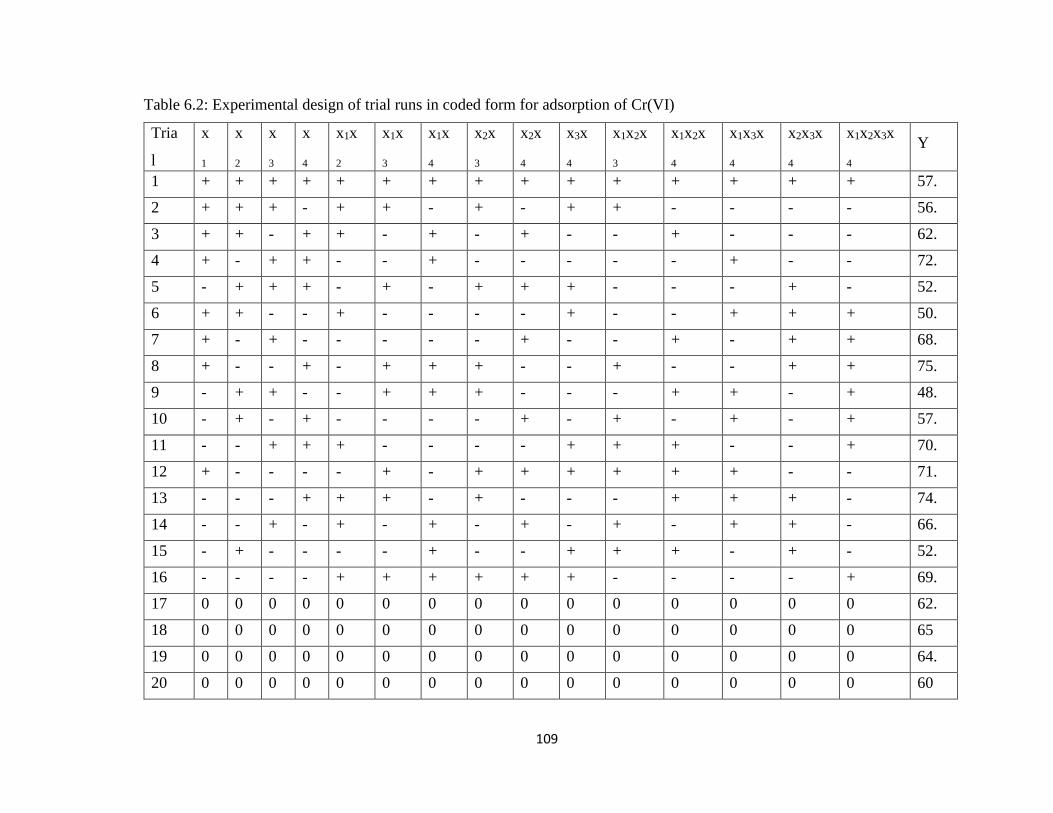
109
Table 6.2: Experimental design of trial runs in coded form for adsorption of Cr(VI)
Tria
l
No.
x
1
x
2
x
3
x
4
x1x
2
x1x
3
x1x
4
x2x
3
x2x
4
x3x
4
x1x2x
3
x1x2x
4
x1x3x
4
x2x3x
4
x1x2x3x
4 Y
1 + + + + + + + + + + + + + + + 57.
8 2 + + + - + + - + - + + - - - - 56.
5 3 + + - + + - + - + - - + - - - 62.
8 4 + - + + - - + - - - - - + - - 72.
5 5 - + + + - + - + + + - - - + - 52.
5 6 + + - - + - - - - + - - + + + 50.
2 7 + - + - - - - - + - - + - + + 68.
4 8 + - - + - + + + - - + - - + + 75.
5 9 - + + - - + + + - - - + + - + 48.
5 10 - + - + - - - - + - + - + - + 57.
2 11 - - + + + - - - - + + + - - + 70.
8 12 + - - - - + - + + + + + + - - 71.
5 13 - - - + + + - + - - - + + + - 74.
5 14 - - + - + - + - + - + - + + - 66.
8 15 - + - - - - + - - + + + - + - 52.
5 16 - - - - + + + + + + - - - - + 69.
5 17 0 0 0 0 0 0 0 0 0 0 0 0 0 0 0 62.
3 18 0 0 0 0 0 0 0 0 0 0 0 0 0 0 0 65
19 0 0 0 0 0 0 0 0 0 0 0 0 0 0 0 64.
6 20 0 0 0 0 0 0 0 0 0 0 0 0 0 0 0 60
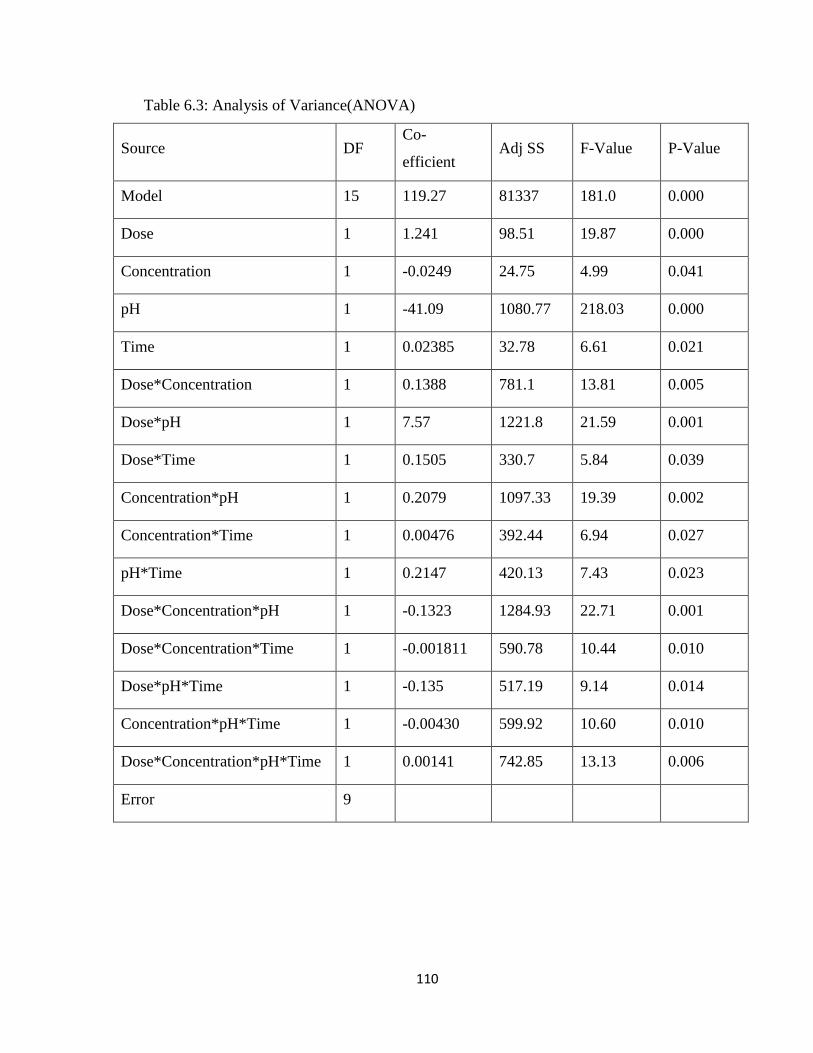
110
Table 6.3: Analysis of Variance(ANOVA)
Source DF Co-
efficient Adj SS F-Value P-Value
Model 15 119.27 81337 181.0 0.000
Dose 1 1.241 98.51 19.87 0.000
Concentration 1 -0.0249 24.75 4.99 0.041
pH 1 -41.09 1080.77 218.03 0.000
Time 1 0.02385 32.78 6.61 0.021
Dose*Concentration 1 0.1388 781.1 13.81 0.005
Dose*pH 1 7.57 1221.8 21.59 0.001
Dose*Time 1 0.1505 330.7 5.84 0.039
Concentration*pH 1 0.2079 1097.33 19.39 0.002
Concentration*Time 1 0.00476 392.44 6.94 0.027
pH*Time 1 0.2147 420.13 7.43 0.023
Dose*Concentration*pH 1 -0.1323 1284.93 22.71 0.001
Dose*Concentration*Time 1 -0.001811 590.78 10.44 0.010
Dose*pH*Time 1 -0.135 517.19 9.14 0.014
Concentration*pH*Time 1 -0.00430 599.92 10.60 0.010
Dose*Concentration*pH*Time 1 0.00141 742.85 13.13 0.006
Error 9
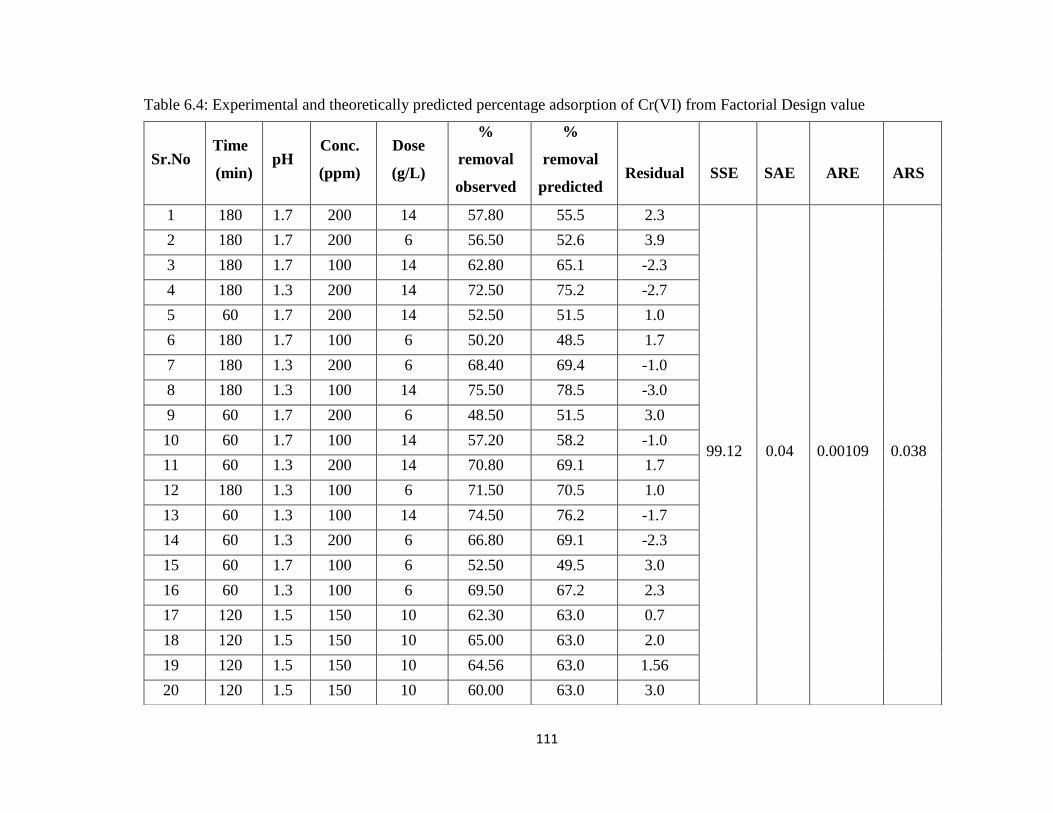
111
Table 6.4: Experimental and theoretically predicted percentage adsorption of Cr(VI) from Factorial Design value
Sr.No Time
(min) pH
Conc.
(ppm)
Dose
(g/L)
%
removal
observed
%
removal
predicted
Residual
SSE
SAE
ARE
ARS
1 180 1.7 200 14 57.80 55.5 2.3
99.12 0.04 0.00109 0.038
2 180 1.7 200 6 56.50 52.6 3.9
3 180 1.7 100 14 62.80 65.1 -2.3
4 180 1.3 200 14 72.50 75.2 -2.7
5 60 1.7 200 14 52.50 51.5 1.0
6 180 1.7 100 6 50.20 48.5 1.7
7 180 1.3 200 6 68.40 69.4 -1.0
8 180 1.3 100 14 75.50 78.5 -3.0
9 60 1.7 200 6 48.50 51.5 3.0
10 60 1.7 100 14 57.20 58.2 -1.0
11 60 1.3 200 14 70.80 69.1 1.7
12 180 1.3 100 6 71.50 70.5 1.0
13 60 1.3 100 14 74.50 76.2 -1.7
14 60 1.3 200 6 66.80 69.1 -2.3
15 60 1.7 100 6 52.50 49.5 3.0
16 60 1.3 100 6 69.50 67.2 2.3
17 120 1.5 150 10 62.30 63.0 0.7
18 120 1.5 150 10 65.00 63.0 2.0
19 120 1.5 150 10 64.56 63.0 1.56
20 120 1.5 150 10 60.00 63.0 3.0
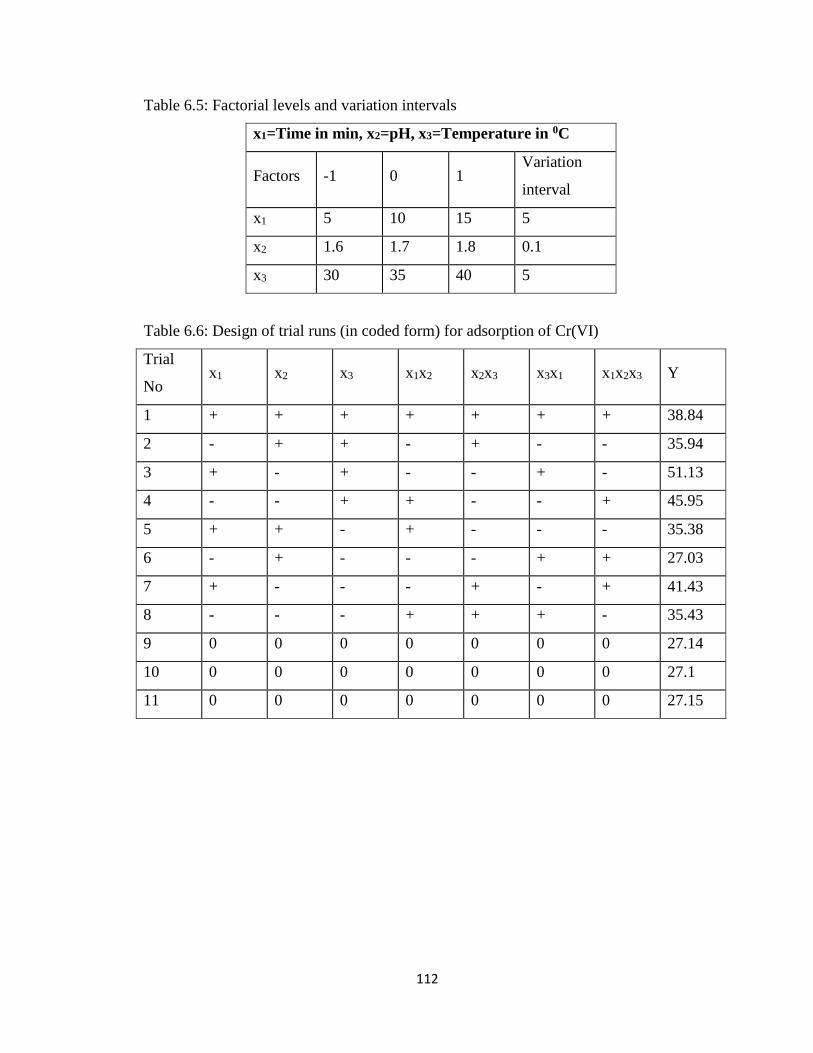
112
Table 6.5: Factorial levels and variation intervals
x1=Time in min, x2=pH, x3=Temperature in 0C
Factors -1 0 1 Variation
interval
x1 5 10 15 5
x2 1.6 1.7 1.8 0.1
x3 30 35 40 5
Table 6.6: Design of trial runs (in coded form) for adsorption of Cr(VI)
Trial
No x1 x2 x3 x1x2 x2x3 x3x1 x1x2x3 Y
1 + + + + + + + 38.84
2 - + + - + - - 35.94
3 + - + - - + - 51.13
4 - - + + - - + 45.95
5 + + - + - - - 35.38
6 - + - - - + + 27.03
7 + - - - + - + 41.43
8 - - - + + + - 35.43
9 0 0 0 0 0 0 0 27.14
10 0 0 0 0 0 0 0 27.1
11 0 0 0 0 0 0 0 27.15
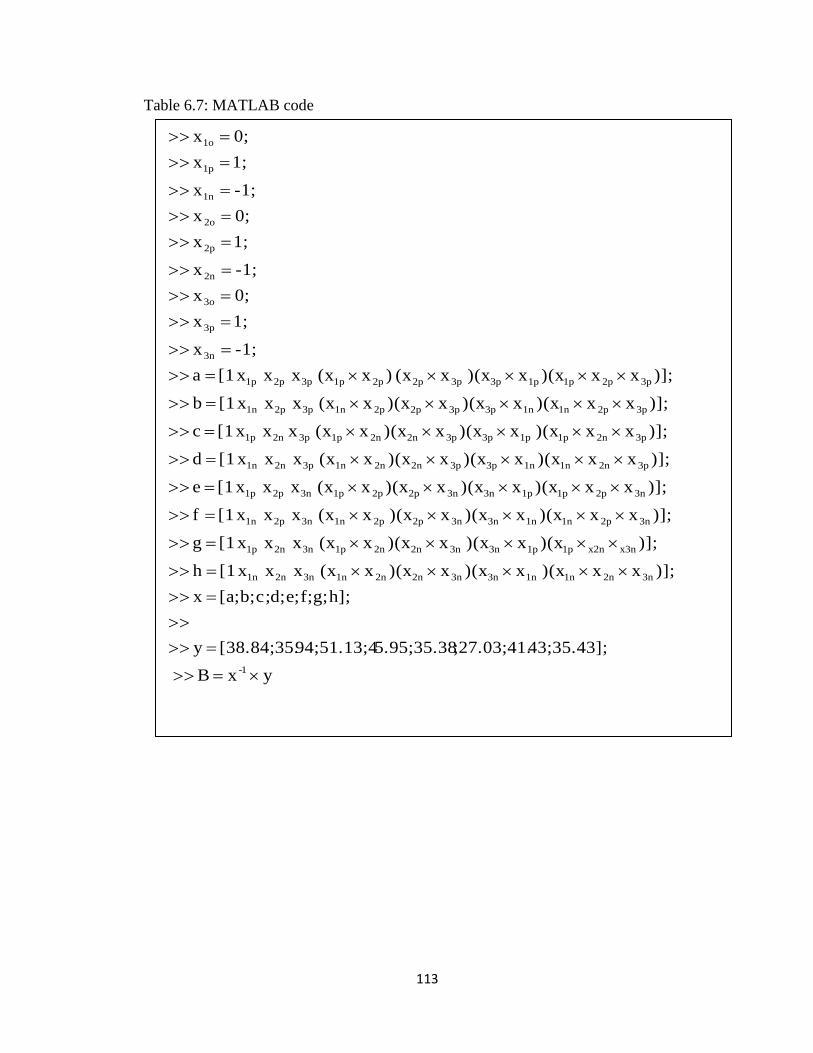
113
Table 6.7: MATLAB code
y xB
43;35.43];;27.03;41.5.95;35.3894;51.13;4[38.84;35.y
h];g;f;e;d;c;b;[a;x
)];xx)(xx)(xx)(xx(x x x x[1h
)];)(xx)(xx)(xx(x x x x[1g
)];xx)(xx)(xx)(xx(x x x x[1f
)];xx)(xx)(xx)(xx(x x x x[1e
)];xx)(xx)(xx)(xx(x x x x[1d
)];xx)(xx)(xx)(xx(x x x x[1c
)];xx)(xx)(xx)(xx(x x x x[1b
)];xx)(xx)(x x(x )x(x x x x[1a
-1;x
1;x
0;x
-1;x
1;x
0;x
-1;x
1;x
0;x
1-
3n2n1n1n 3n3n2n2n1n3n2n1n
x3nx2n1p1p3n3n 2n2n1p3n2n1p
3n2p1n1n3n3n2p 2p1n3n2p1n
3n2p1p1p3n3n2p2p1p3n2p1p
3p2n1n1n3p3p2n2n1n3p2n1n
3p2n1p 1p3p3p2n2n1p3p2n 1p
3p2p1n1n3p3p2p2p1n3p2p1n
3p2p1p1p3p3p2p2p1p3p2p1p
3n
3p
3o
2n
2p
2o
1n
1p
1o
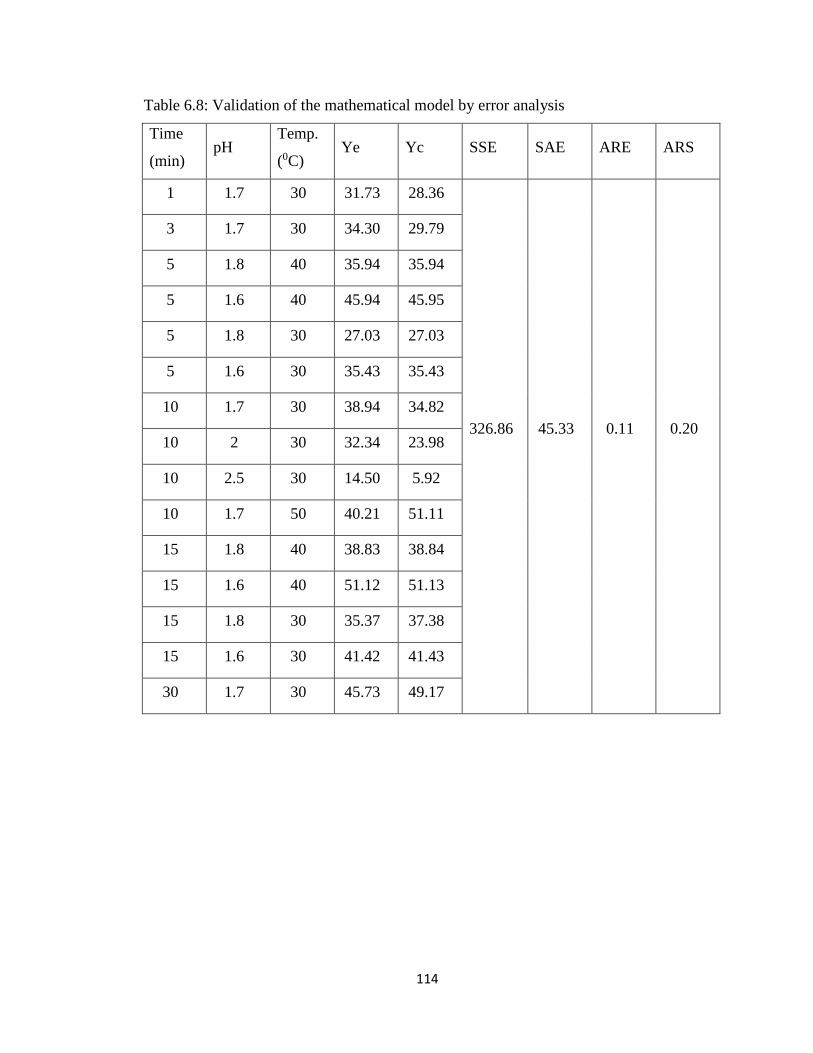
114
Table 6.8: Validation of the mathematical model by error analysis
Time
(min) pH
Temp.
(0C) Ye Yc SSE SAE ARE ARS
1 1.7 30 31.73 28.36
326.86
45.33
0.11
0.20
3 1.7 30 34.30 29.79
5 1.8 40 35.94 35.94
5 1.6 40 45.94 45.95
5 1.8 30 27.03 27.03
5 1.6 30 35.43 35.43
10 1.7 30 38.94 34.82
10 2 30 32.34 23.98
10 2.5 30 14.50 5.92
10 1.7 50 40.21 51.11
15 1.8 40 38.83 38.84
15 1.6 40 51.12 51.13
15 1.8 30 35.37 37.38
15 1.6 30 41.42 41.43
30 1.7 30 45.73 49.17
115
Chapter-7 Selection of suitable adsorbent for
the removal of Cr(VI) by using
Objective Based Multiple Attribute
Decision Making method
116
7.1 Introduction
In the last few decades, adsorption has emerged as popular process in the context of its
application to wastewater treatment. The commercial success of the adsorption process in
wastewater treatment has resulted in extensive research that has led to the discovery of a
broad range of adsorbent materials. There are wide varieties of absorbent materials
available in the market for the treatment of Cr(VI) contaminated wastewater (discussed in
Chapter 1) which ensure that there is a task-specific material for the application. These
adsorbents are typically micro-porous materials such as activated carbon, adsorbent from
agricultural product, industrial waste, domestic waste etc., They are used either in their
original form or as modified by techniques such as ion exchange. During process
development, several adsorbents may be identified as suitable materials for Cr(VI) removal
from aqueous solution. The preliminary viability can be judged by comparing the
isotherms, kinetics or/and the uptake rates of Cr(VI) from simulated solution. However, a
cursory visual inspection can be misleading and does not quantify the merit of the
efficiency of the adsorbent for the separation under consideration. Further, sometimes too
much choice can make it more difficult to choose and help is needed to select the right
absorbent. There are a large number of criteria available which has to be considered for the
selection of a suitable adsorbent.
A critical literature review indicates that the literature related to the selection of adsorbent
is rather scanty. In this paper, it is attempted to critically review the attributes of adsorbent
for the treatment of Cr(VI) contaminated wastewater. Further, attribute based multi
attribute decision making approach is used to evaluate and select the best adsorbent for the
Cr(VI) adsorption process. A three-stage procedure including the elimination search is
proposed to evaluate the available alternatives with the help of attributes.
From the extensive literature survey, it is observed that naturally available, low cost bio-
adsorbents has very high adsorption capacity. However, the tannin and lignin presents in
the biomaterials may leach out and create environmental pollution and hence required
suitable pre-treatment which may not be economical and environmental friendly. Further,
economy of an adsorption process dependent on the number of adsorption-desorption cycle
117
of each adsorbent. The amine and electron donor groups presence in the biomaterials leads
indirect reduction and increases the chemisorption. As the pH of the aqueous phase is
lowered, a large number of hydrogen ions can easily coordinate with the amino, hydroxyl,
CN and react with the Cr2O72- which is irreversible. Therefore, regeneration of the
adsorbents is not possible and hence the adsorbents may not be economical and also can
create disposal problem. The adsorption capacity of some of the adsorbent is high but at
lower pH and other adsorbents has very low adsorption capacity. From the above
discussion, it is evident that some of the attributes in the adsorption may be of conflicting
in nature i.e., for certain attributes larger values are preferred and for other attributes
smaller values are preferred. Then trade-off between the attributes is required, because
properties/nature of attributes is changing from case to case. Hence an expert system which
will eliminate the human error and is capable of handling this type of problem is needed.
Multiple Attribute Decision Making (MADM) system is a well-established expert decision
system when there exist conflicting criteria to evaluate a product/system among the
available options. MADM is a tool generally used to conciliate multiple evaluation criteria,
taking into account the preferences of a decision-maker. In MADM method, the attribute
information is processed in order to arrive at a choice.
In selecting an absorbent, a number of factors should be considered out of which few are
outline bellow:
The absorbent should encapsulate the Cr(VI) - adsorb into the particle itself and not
just adhere to the outside surface of adsorbent.
The absorbent should absorb most of the Cr(VI) in the waste water.
The absorbent should be low cost where possible.
The absorbent should meet all environmental requirements.
The absorbent should have high adsorption capacity.
The absorbent should also be safe to use on the designated fluid and not react to cause
a hazard for the user and environment.
All the factors above must be used in conjunction with other important properties to select
an appropriate adsorbent.
118
The design engineers have to consider numerous factors, like pH, initial concentration of
Cr(VI), dosage, Temperature, duration and agitation speed etc. while choosing the best
suitable adsorbent for adsorption process, which makes the choosing the process little bit
complex than the (Ljungberg & Edwards, 2003; Ashby et al, 2004; Edwards, 2005). For
the selection, proper material, where several available choices and with many influencing
norms, a more appropriate mathematical methodology is needed. For the above said
situation, multi-criteria decision making (MCDM) or multiple attribute decision making
(MADM) methodology is useful for choosing the particular adsorbent on a numerous set
of parameters/attributes. This approach/methodology (MADM) has been used in many
different areas like plant layout selection (Yang & Hung, 2007), selection of electroplating
system (Abhishek & Agrawal, 2009), selection of supplier (Li et al, 2007) and selection
mechatronic systems (Kiran et al). This approach initially implemented by Zhang et al.
(2011) which integrating both subjective and also objective information and also explained
with the illustrative example by the author.
Maniya and Bhatt (2011) has proposed this method (MCDM), which was very effective
and systematic and also by Jain and Raj (2013) proposed method for the selection, on the
basis of preference selection index (PSI). This method MCDM technique based on
Technique for Order of Preference by Similarity to Ideal Solutions (TOPSIS) which was
projected by Senthil Kumar and Thirumalai (2013). TOPSIS method can be used to explore
the suitable adsorption parameter and their inter relation between the parameter by fitting
a polynomial equation to this experimental data in a multiple regression analysis.
Chatterjee and Chakrabort (2013) have explored MCDM method based on organization.
This method has been applied in Mechanical engineering in many areas like advanced
manufacturing system (AMS) like in a Robot industies, Flexible manufacturing system,
Rapid prototyping process, Suitable machine for flexible manufacturing cell and Non-
traditional machining process.
In this paper, a MADM method is used to deal with proper adsorbent selection, considering
quantitative attributes is applied in evaluating and optimizing the selection adsorbent for
the Cr(VI) removal. A fuzzy conversion scale has been used to convert the qualitative
119
attributes like pH, cost, and concentration to a judgement rank value. The projected method
gives an idea for the selection of adsorbent based importance of the objective weight of
attributes. In order to explain the methodology a demonstrative example is given. The step
by step procedure of this method has been explained which is used friendly and easily
understandable.
7.2 Multiple attributes decision-making methodology
In order to solve the problems of choosing from a fixed number of alternatives, the simple
and systematic steps was proposed by Rao and Patel (2010) has been applied. Different
adsorbent such as Marine Strains Yeast (Ncibi et al, 2009), Aspergillus Niger (Khambhaty,
2009), Hydrilla Verticillate seed (Baral et al, 2009), Salvinia Cucutta (Baral et al, 2008),
Fungal biomaterial Coriolus versicolor (Sanghi et al, 2009) and Pomegranate husk (Nemr,
2009) from material database and along with that our research work with Pig iron sludge
have been selected for the selection of better choice of adsorbent for adsorption as per
MADM method. The six properties such as pH, adsorbent dose in g/L, adsorbate
concentration in ppm, Speed in RPM, temperature in 0C and duration in minutes has been
taken in the present research work. The methodology is given below.
7.3 Decision making table
Identify the relevant measured parameters for the considered adsorbent problem and
choose the adsorbent based on the easily identifiable attributes (parameters) satisfying the
necessities. The attributes are divided into two types, one is beneficial where the greater
values are most desired one and non-beneficial where lesser values are most desired. The
accepted limiting values either in terms of qualitative or quantitative has been assigned to
each parameter for the considered problem. Here we more concerned about removal of
Cr(VI). After choosing the alternative adsorbent parameter and find the values associated
with the parameters (Zij), a decision table, analogues one which is given in Table 7.1
containing the values of all parameters for the considered adsorbent, can be prepared.
The actual decision table for different kind of adsorbent that we have selected has been
shown in Table 7.2. To change the elements in decision table into measurable and unit less
120
quantity, then it is important to normalize their values. These values are linked with each
parameters (Zij) might be in dissimilar units like Concentration in mg/L, pH, Speed in
RPM, Cost etc. The normalized value of each element in decision table is obtained by the
following expression rij as
𝑟𝑖𝑗 =𝑍𝑖𝑗
∑ 𝑍𝑖𝑗𝑛𝑖=1
(7.1)
Where, rij is the normalized value of Zij and ∑ 𝑍𝑖𝑗𝑛𝑖=1 is the total value of jth parameter for
n different adsorbents or in general different alternatives.
Equation 7.1 will deal the quantitative measurement of different attributes, but for
qualitative measurement of attributes there must be a method to converts this into
quantitative value as in our illustrative example like pH. We have used Crisp score assigned
for each fuzzy number conversion scale to change qualitative parameter in to equal
quantitative value. This approach was introduced by Chen and Hwang (1992). An 11-point
scale is recommended for better understanding. Table 7.3 signifies the selected parameter
in a qualitative scale can be converted to quantitative by using fuzzy number.
Based on the value of fuzzy numbers associated with each attribute, we have obtained the
Table 7.4 and 7.5 which are indicating the crisp score value for each parameter of different
adsorbent. After obtaining the fuzzy conversion table, our aim is to calculate the
normalized data table to find the objective weight of attributes. These values have been
shown in Table 7.6.
7.4 Objective weight of importance of attributes
The importance of objective weight of each parameter is found by using statistical variance.
The following equation is used to estimate the importance of each parameter weightage.
𝑉𝐽 = (1
𝑛) ∑ (𝑟𝑖𝑗 − (𝑟𝑖𝑗𝑚𝑒𝑎𝑛))2𝑛
𝑖=1 (7.2)
where, Vj is the statistical variance of the data matching to the jth parameter
(rij)mean is the is the mean value of rij. VJ measures the distribution of each data points nearby
their mean value. The objective weight of the jth attribute Qj0 can be calculated by the
statistical variance of each parameter divided by the total statistical variances of all the
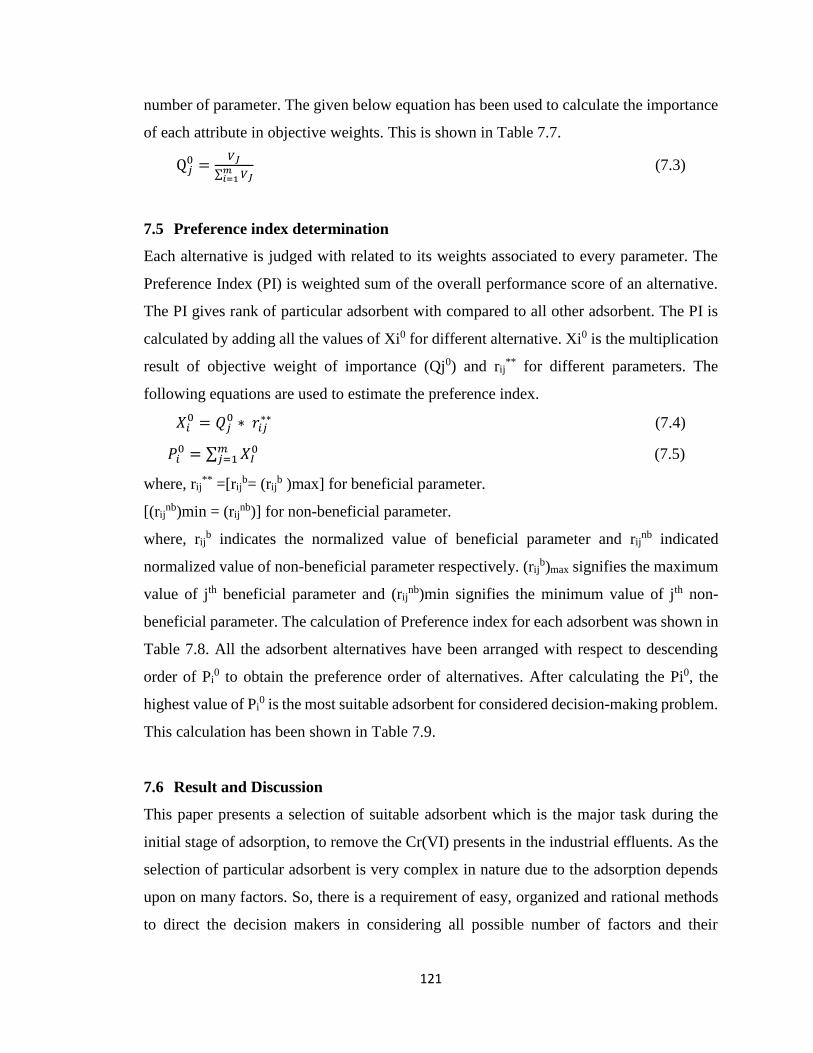
121
number of parameter. The given below equation has been used to calculate the importance
of each attribute in objective weights. This is shown in Table 7.7.
Q𝑗0 =
𝑉𝐽
∑ 𝑉𝐽𝑚𝑖=1
(7.3)
7.5 Preference index determination
Each alternative is judged with related to its weights associated to every parameter. The
Preference Index (PI) is weighted sum of the overall performance score of an alternative.
The PI gives rank of particular adsorbent with compared to all other adsorbent. The PI is
calculated by adding all the values of Xi0 for different alternative. Xi0 is the multiplication
result of objective weight of importance (Qj0) and rij** for different parameters. The
following equations are used to estimate the preference index.
𝑋𝑖0 = 𝑄𝑗
0 ∗ 𝑟𝑖𝑗∗∗ (7.4)
𝑃𝑖0 = ∑ 𝑋𝐼
0𝑚𝑗=1 (7.5)
where, rij** =[rij
b= (rijb )max] for beneficial parameter.
[(rijnb)min = (rij
nb)] for non-beneficial parameter.
where, rijb indicates the normalized value of beneficial parameter and rij
nb indicated
normalized value of non-beneficial parameter respectively. (rijb)max signifies the maximum
value of jth beneficial parameter and (rijnb)min signifies the minimum value of jth non-
beneficial parameter. The calculation of Preference index for each adsorbent was shown in
Table 7.8. All the adsorbent alternatives have been arranged with respect to descending
order of Pi0 to obtain the preference order of alternatives. After calculating the Pi0, the
highest value of Pi0 is the most suitable adsorbent for considered decision-making problem.
This calculation has been shown in Table 7.9.
7.6 Result and Discussion
This paper presents a selection of suitable adsorbent which is the major task during the
initial stage of adsorption, to remove the Cr(VI) presents in the industrial effluents. As the
selection of particular adsorbent is very complex in nature due to the adsorption depends
upon on many factors. So, there is a requirement of easy, organized and rational methods
to direct the decision makers in considering all possible number of factors and their
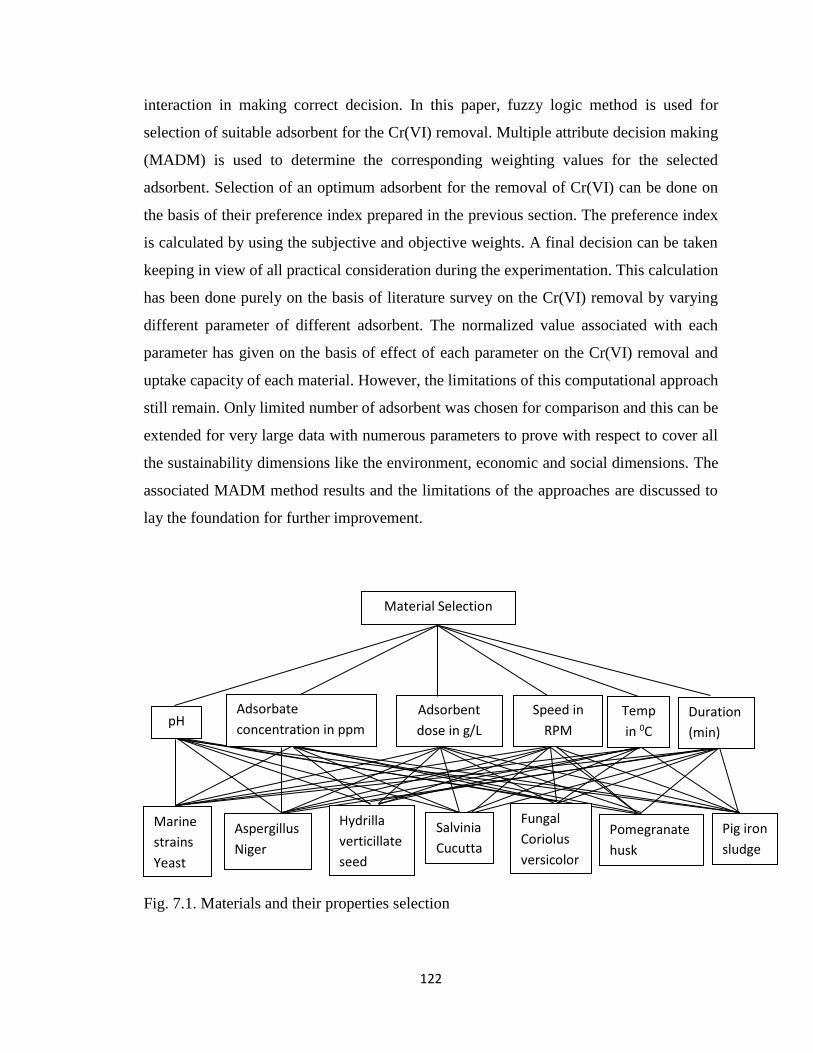
122
interaction in making correct decision. In this paper, fuzzy logic method is used for
selection of suitable adsorbent for the Cr(VI) removal. Multiple attribute decision making
(MADM) is used to determine the corresponding weighting values for the selected
adsorbent. Selection of an optimum adsorbent for the removal of Cr(VI) can be done on
the basis of their preference index prepared in the previous section. The preference index
is calculated by using the subjective and objective weights. A final decision can be taken
keeping in view of all practical consideration during the experimentation. This calculation
has been done purely on the basis of literature survey on the Cr(VI) removal by varying
different parameter of different adsorbent. The normalized value associated with each
parameter has given on the basis of effect of each parameter on the Cr(VI) removal and
uptake capacity of each material. However, the limitations of this computational approach
still remain. Only limited number of adsorbent was chosen for comparison and this can be
extended for very large data with numerous parameters to prove with respect to cover all
the sustainability dimensions like the environment, economic and social dimensions. The
associated MADM method results and the limitations of the approaches are discussed to
lay the foundation for further improvement.
Fig. 7.1. Materials and their properties selection
Marine
strains
Yeast
Aspergillus
Niger
Hydrilla
verticillate
seed
Salvinia
Cucutta
Fungal
Coriolus
versicolor
Pomegranate
husk
Pig iron
sludge
pH Adsorbate
concentration in ppm
Adsorbent
dose in g/L
Speed in
RPM
Temp
in 0C
Duration
(min)
Material Selection
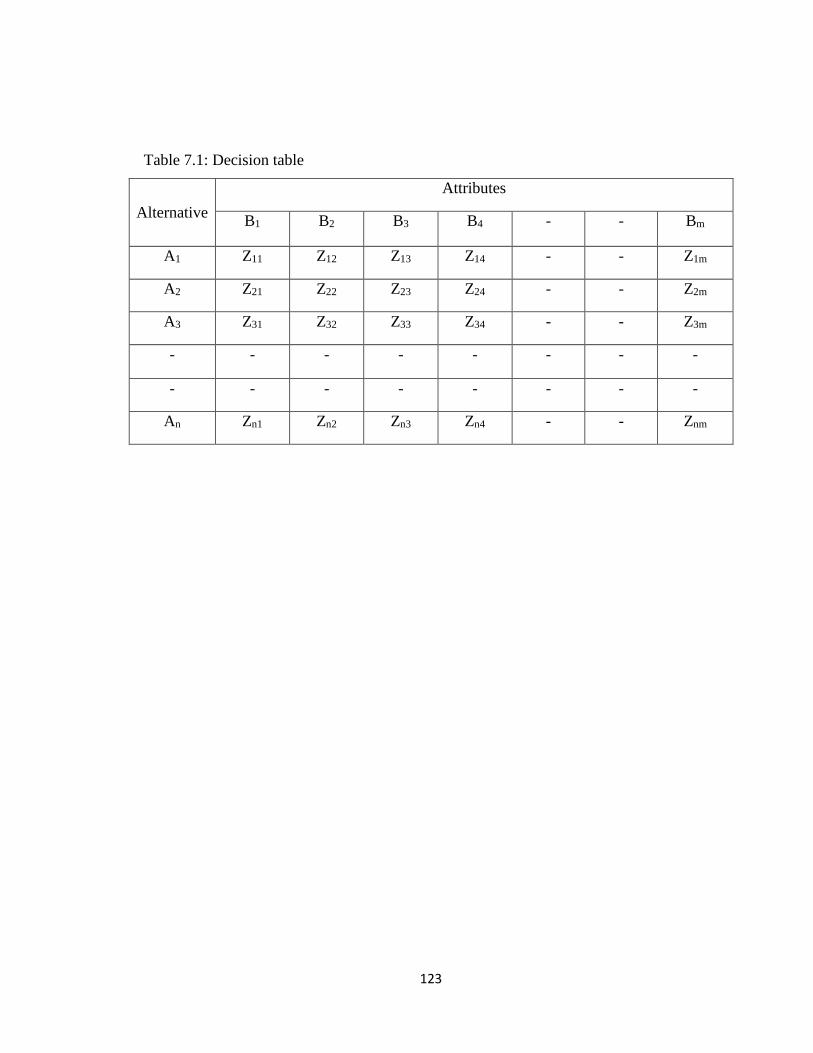
123
Table 7.1: Decision table
Alternative
Attributes
B1 B2 B3 B4 - - Bm
A1 Z11 Z12 Z13 Z14 - - Z1m
A2 Z21 Z22 Z23 Z24 - - Z2m
A3 Z31 Z32 Z33 Z34 - - Z3m
- - - - - - - -
- - - - - - - -
An Zn1 Zn2 Zn3 Zn4 - - Znm
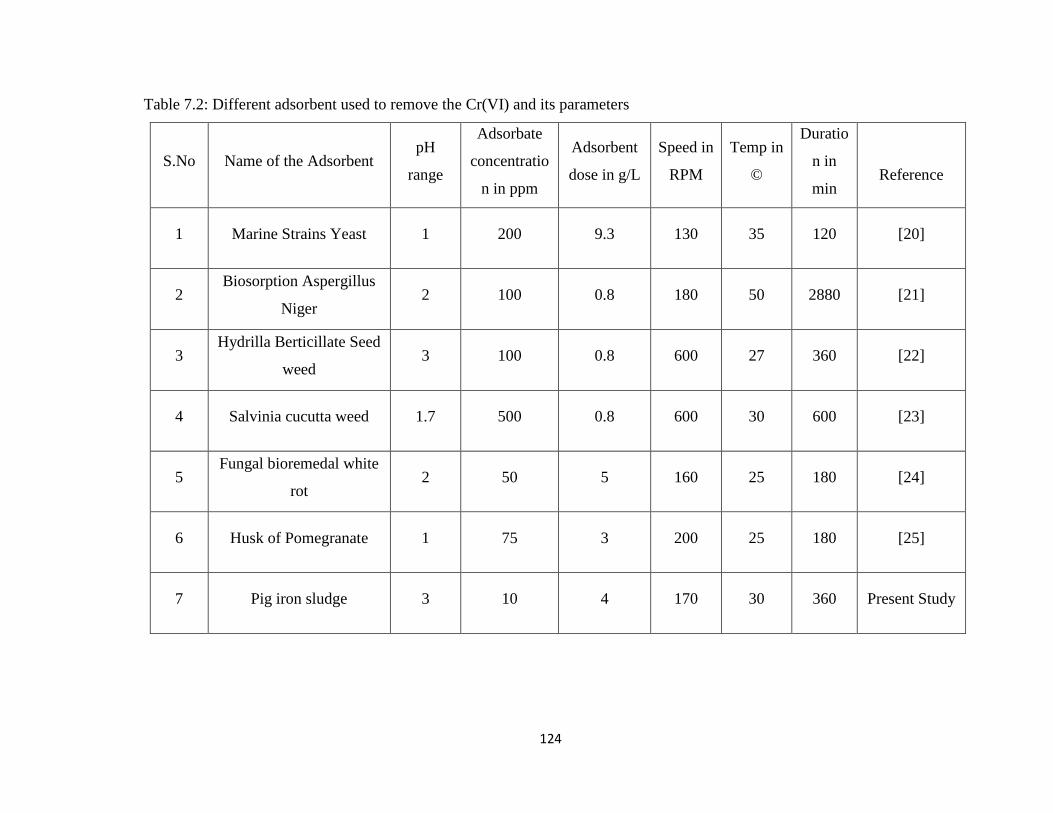
124
Table 7.2: Different adsorbent used to remove the Cr(VI) and its parameters
S.No Name of the Adsorbent pH
range
Adsorbate
concentratio
n in ppm
Adsorbent
dose in g/L
Speed in
RPM
Temp in
©
Duratio
n in
min
Reference
1 Marine Strains Yeast 1 200 9.3 130 35 120 [20]
2 Biosorption Aspergillus
Niger 2 100 0.8 180 50 2880 [21]
3 Hydrilla Berticillate Seed
weed 3 100 0.8 600 27 360 [22]
4 Salvinia cucutta weed 1.7 500 0.8 600 30 600 [23]
5 Fungal bioremedal white
rot 2 50 5 160 25 180 [24]
6 Husk of Pomegranate 1 75 3 200 25 180 [25]
7 Pig iron sludge 3 10 4 170 30 360 Present Study
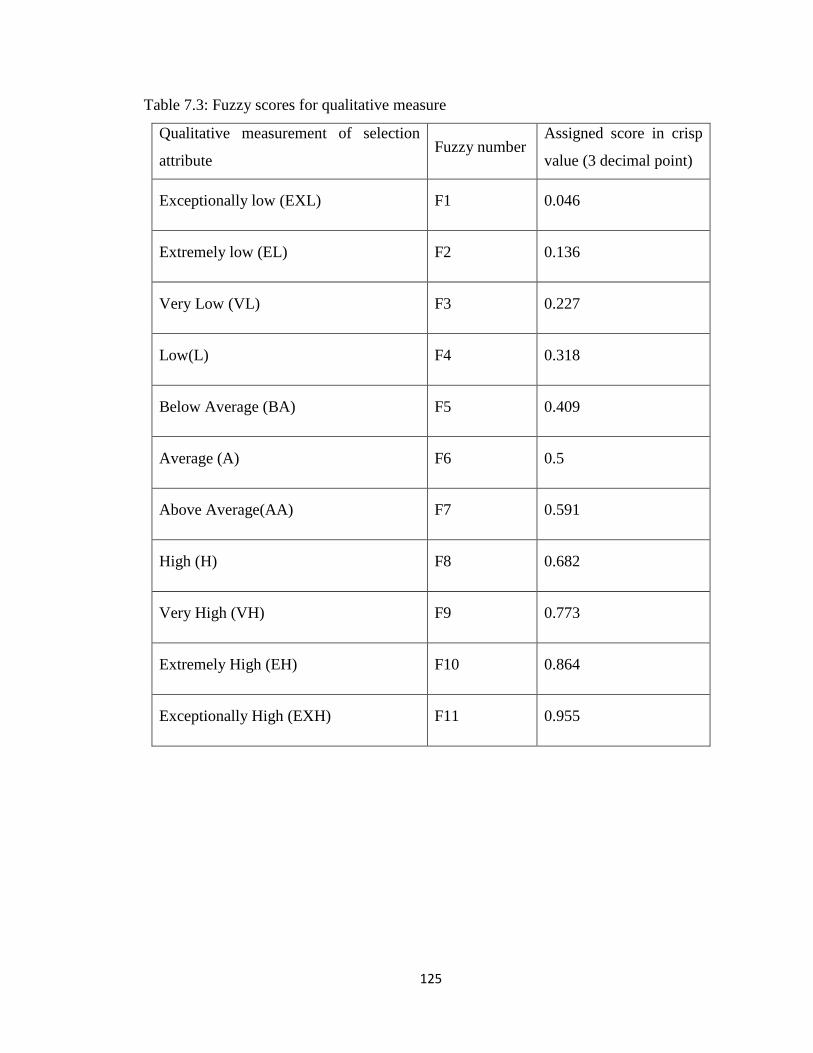
125
Table 7.3: Fuzzy scores for qualitative measure
Qualitative measurement of selection
attribute Fuzzy number
Assigned score in crisp
value (3 decimal point)
Exceptionally low (EXL) F1 0.046
Extremely low (EL) F2 0.136
Very Low (VL) F3 0.227
Low(L) F4 0.318
Below Average (BA) F5 0.409
Average (A) F6 0.5
Above Average(AA) F7 0.591
High (H) F8 0.682
Very High (VH) F9 0.773
Extremely High (EH) F10 0.864
Exceptionally High (EXH) F11 0.955
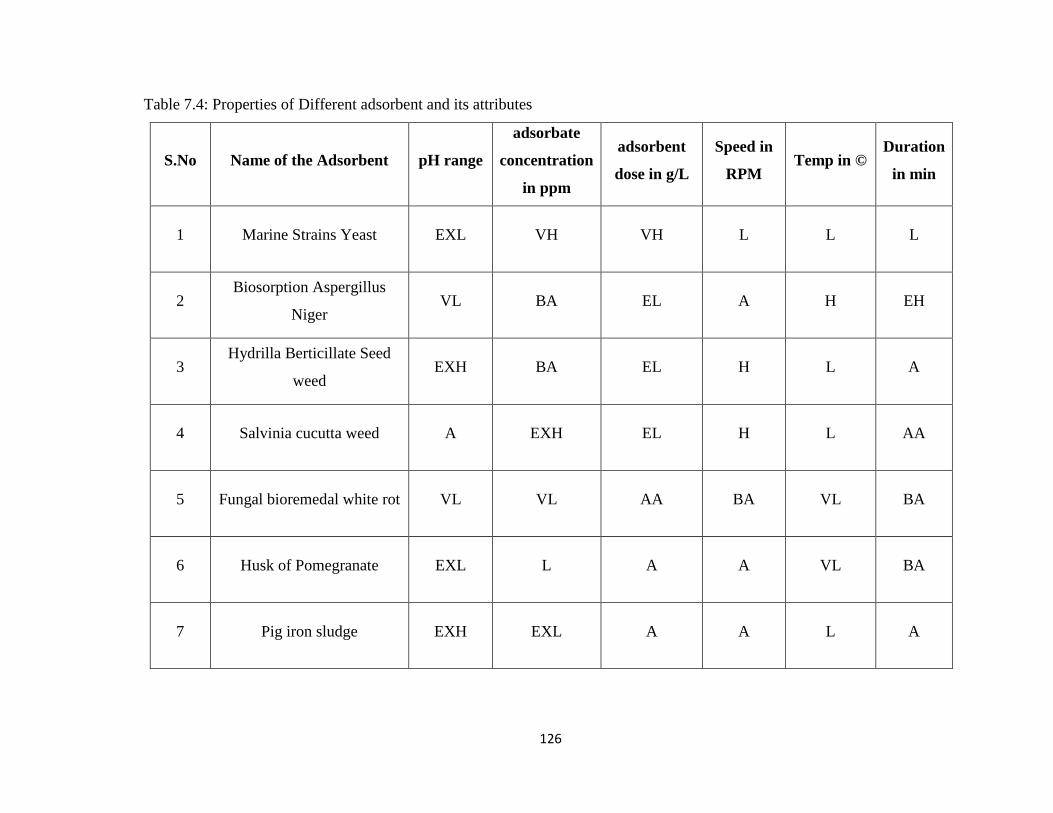
126
Table 7.4: Properties of Different adsorbent and its attributes
S.No Name of the Adsorbent pH range
adsorbate
concentration
in ppm
adsorbent
dose in g/L
Speed in
RPM Temp in ©
Duration
in min
1 Marine Strains Yeast EXL VH VH L L L
2 Biosorption Aspergillus
Niger VL BA EL A H EH
3 Hydrilla Berticillate Seed
weed EXH BA EL H L A
4 Salvinia cucutta weed A EXH EL H L AA
5 Fungal bioremedal white rot VL VL AA BA VL BA
6 Husk of Pomegranate EXL L A A VL BA
7 Pig iron sludge EXH EXL A A L A
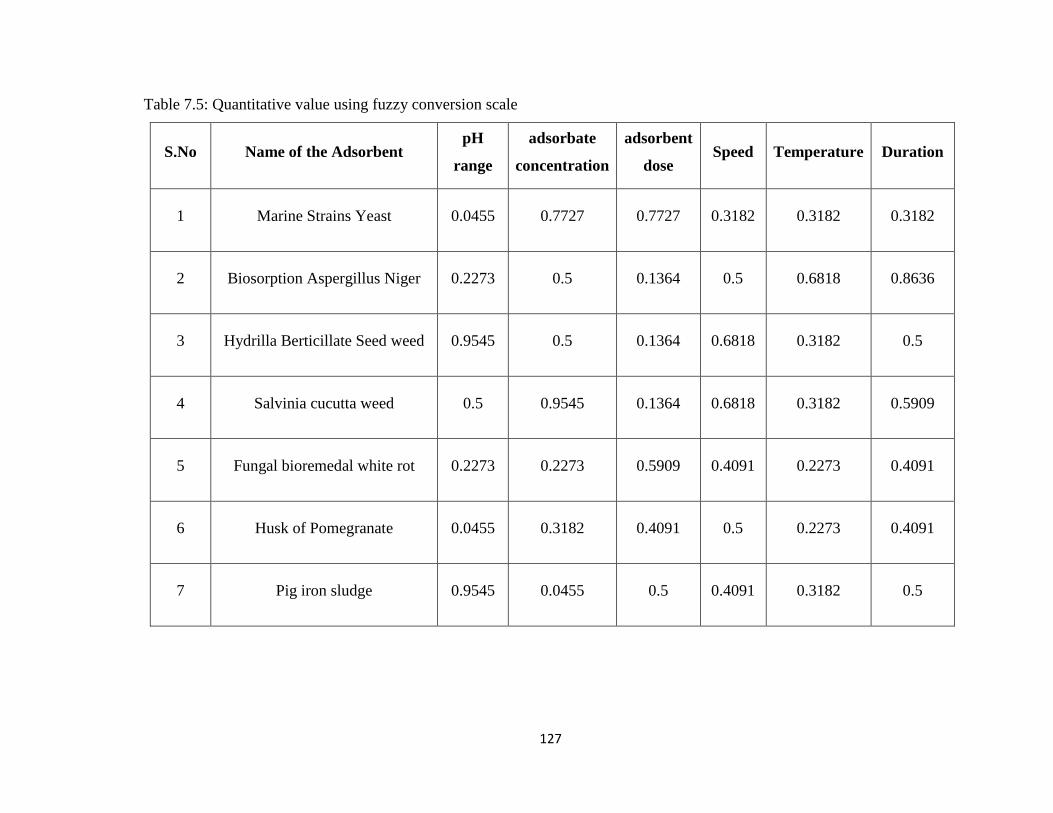
127
Table 7.5: Quantitative value using fuzzy conversion scale
S.No Name of the Adsorbent pH
range
adsorbate
concentration
adsorbent
dose Speed Temperature Duration
1 Marine Strains Yeast 0.0455 0.7727 0.7727 0.3182 0.3182 0.3182
2 Biosorption Aspergillus Niger 0.2273 0.5 0.1364 0.5 0.6818 0.8636
3 Hydrilla Berticillate Seed weed 0.9545 0.5 0.1364 0.6818 0.3182 0.5
4 Salvinia cucutta weed 0.5 0.9545 0.1364 0.6818 0.3182 0.5909
5 Fungal bioremedal white rot 0.2273 0.2273 0.5909 0.4091 0.2273 0.4091
6 Husk of Pomegranate 0.0455 0.3182 0.4091 0.5 0.2273 0.4091
7 Pig iron sludge 0.9545 0.0455 0.5 0.4091 0.3182 0.5
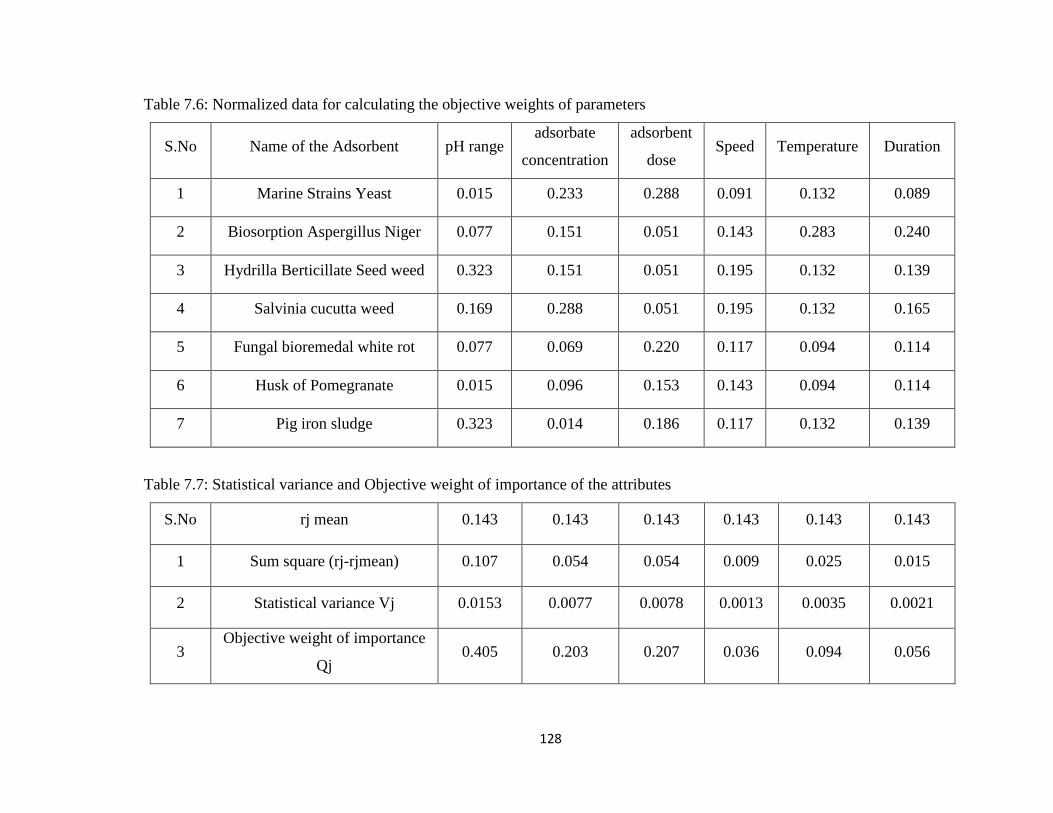
128
Table 7.6: Normalized data for calculating the objective weights of parameters
S.No Name of the Adsorbent pH range adsorbate
concentration
adsorbent
dose Speed Temperature Duration
1 Marine Strains Yeast 0.015 0.233 0.288 0.091 0.132 0.089
2 Biosorption Aspergillus Niger 0.077 0.151 0.051 0.143 0.283 0.240
3 Hydrilla Berticillate Seed weed 0.323 0.151 0.051 0.195 0.132 0.139
4 Salvinia cucutta weed 0.169 0.288 0.051 0.195 0.132 0.165
5 Fungal bioremedal white rot 0.077 0.069 0.220 0.117 0.094 0.114
6 Husk of Pomegranate 0.015 0.096 0.153 0.143 0.094 0.114
7 Pig iron sludge 0.323 0.014 0.186 0.117 0.132 0.139
Table 7.7: Statistical variance and Objective weight of importance of the attributes
S.No rj mean 0.143 0.143 0.143 0.143 0.143 0.143
1 Sum square (rj-rjmean) 0.107 0.054 0.054 0.009 0.025 0.015
2 Statistical variance Vj 0.0153 0.0077 0.0078 0.0013 0.0035 0.0021
3 Objective weight of importance
Qj 0.405 0.203 0.207 0.036 0.094 0.056
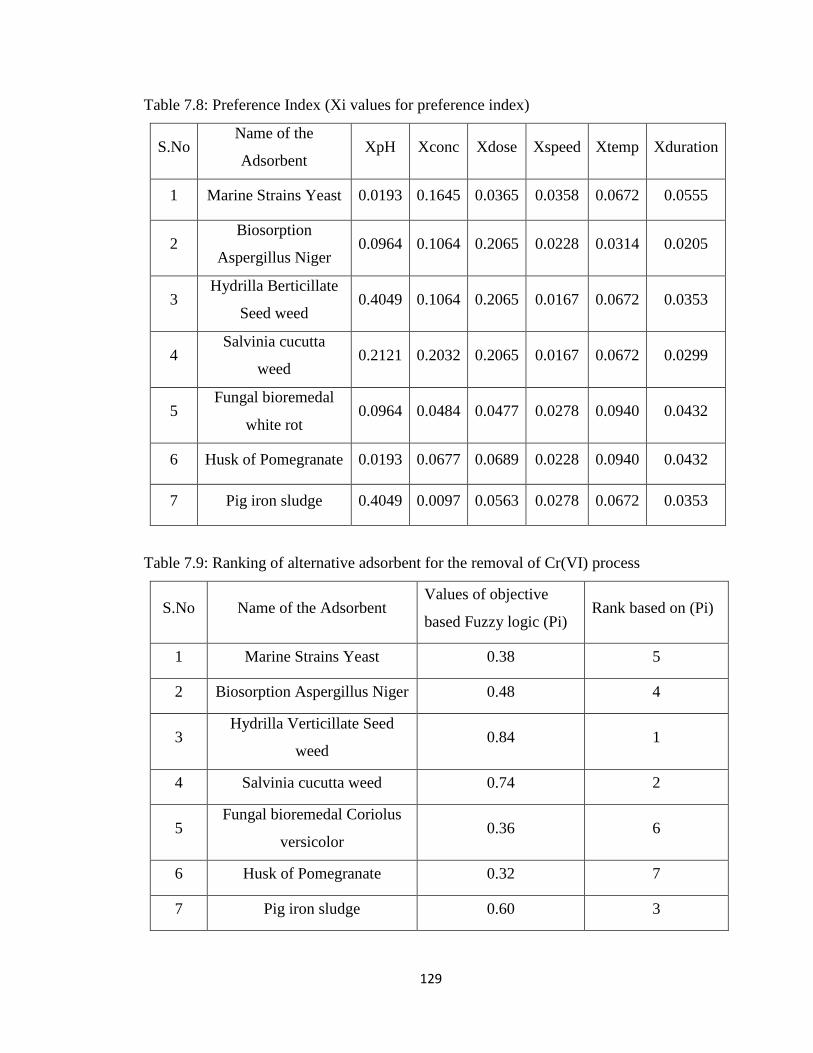
129
Table 7.8: Preference Index (Xi values for preference index)
S.No Name of the
Adsorbent XpH Xconc Xdose Xspeed Xtemp Xduration
1 Marine Strains Yeast 0.0193 0.1645 0.0365 0.0358 0.0672 0.0555
2 Biosorption
Aspergillus Niger 0.0964 0.1064 0.2065 0.0228 0.0314 0.0205
3 Hydrilla Berticillate
Seed weed 0.4049 0.1064 0.2065 0.0167 0.0672 0.0353
4 Salvinia cucutta
weed 0.2121 0.2032 0.2065 0.0167 0.0672 0.0299
5 Fungal bioremedal
white rot 0.0964 0.0484 0.0477 0.0278 0.0940 0.0432
6 Husk of Pomegranate 0.0193 0.0677 0.0689 0.0228 0.0940 0.0432
7 Pig iron sludge 0.4049 0.0097 0.0563 0.0278 0.0672 0.0353
Table 7.9: Ranking of alternative adsorbent for the removal of Cr(VI) process
S.No Name of the Adsorbent Values of objective
based Fuzzy logic (Pi) Rank based on (Pi)
1 Marine Strains Yeast 0.38 5
2 Biosorption Aspergillus Niger 0.48 4
3 Hydrilla Verticillate Seed
weed 0.84 1
4 Salvinia cucutta weed 0.74 2
5 Fungal bioremedal Coriolus
versicolor 0.36 6
6 Husk of Pomegranate 0.32 7
7 Pig iron sludge 0.60 3
130
Chapter-8
Conclusion
131
8.1 Conclusion
An in-depth literature survey shows that, though incredible efforts have been taken
worldwide to discover new adsorbents, finding inexpensive adsorbents with high uptake
capacity is remains an area of research and development. The increased adsorption capacity
of different adsorption in majority cases are not well explained. Again, the pre-treatment
of adsorbents to obtain high adsorption capacity in some cases may not be economically
feasible. Further, very few papers reported the optimization of adsorption parameters using
full factorial design of experiments. There is no research reported on the methodology for
selection of adsorbent among the large numbers of options available. The present study
aims to explore the use of low cost, environmental friendly and easily available materials
as adsorbent to remove the Cr(VI) from wastewater. The adsorption parameters are
optimized using a full factorial design of experiments. Fuzzy logic which is one of the
multi-attribute decision making method is used for the selection of adsorbents among
various options available.
Sorghastrum Nutans L. Nash (grass) and Cocos Nucifera (coconut leave) were used as low
cost adsorbent for the treatment of Cr(VI) contaminated wastewater. The XRD analysis of
the adsorbent shows single pick which is identified as carbon. FTIR analysis of the
adsorbent before and after adsorption shows the presence of various functional groups.
Among different functional groups present in the adsorbent, OH bending, CN
stretching/bending and NH stretching plays an important role in Cr(VI) adsorption. Various
mechanisms of adsorption were considered for the process and it has been found that
indirect reduction is the primary adsorption mechanism. Effects of different adsorption
parameters such as time, pH, adsorbate concentration, adsorbent dose and particle size on
the percentage of Cr(VI) adsorption has been studied. It is observed that with decrease in
pH from 3.0 to 1.0, adsorption percentage increased from 4% to 95.5% and uptake capacity
increased from 0.97 mg/g to 19.1 mg/g. The size of the particle is varied between 36 to 150
BSS and it is found that percentage of Cr(VI) increases 66 % to 92.3% and uptake capacity
of the adsorbent increases from 13.2 mg/g to 18.46. The percentage of Cr(VI) adsorption
decreases from 100% to 63.9% and uptake capacity increases from 2 mg/g to 23.2 mg/g
when the adsorbate concentration increases from 10 ppm to 100 ppm. The percentage of
132
Cr(VI) adsorption increases from 74% to 100% and uptake capacity decreases from 25.6
mg/g to 10 mg/g with increase in adsorbent dose from 1 g/L to 10 g/L.
The disadvantage with the previous adsorbents used were that the adsorption capacity was
very less at higher pH. Although the adsorption capacity increases with decrease in pH, but
adsorption at lower pH produces acidic effluent and hence acid neutralization step is
required which may not be economical and environmental friendly. Therefore, the aim of
this study was to explore a new adsorbent which will have high adsorption capacity at
higher pH. In this part of the study, Coconut leaves is used as an adsorbent for the treatment
of Cr(VI) contaminated wastewater. Percentage of Cr(VI) adsorption increases 40% to
97.3% and uptake capacity increases from 8 mg/g to 19.5 mg/g with decrease in pH from
3 to1. The percentage adsorption increases from 44% to 100% with increase in adsorbent
dose from 1 g/L to 10 g/L whereas, uptake capacity decreases from 4.4 mg/g to 1 mg/g.
Particle size has the antagonism effect on both percentage Cr(VI) adsorption and uptake
capacity.
Among different adsorbents, bio-adsorbents are found to be having high adsorption
capacity. However, the disadvantage with bio-adsorbents is that their adsorption capacity
is high at lower solution pH and also required pretreatment for eliminating the possibility
of leaching out of water soluble component such as tannin and ligand. Further, bio-sorption
is an adsorption cum reduction process and hence desorption is not possible. Considering
the above fact in mind, a new adsorbent pig iron sludge which can be recycle to the industry
was used for treatment of Cr(VI) contaminated waste water. The adsorbed Cr(VI) will be
useful for making steel in the blast furnace. The adsorption capacity of the adsorbent was
established through batch adsorption process. The effect of different adsorption parameters
on the uptake capacity of the adsorbent was studied. The percentage adsorption increases
with decrease in pH up to 3 and hardly any change with further decrease in pH. As usual
the equilibrium uptake of the adsorbate decreases with increase in adsorbent dose whereas,
the percentage adsorption increases with increase in adsorbent dose. Increase in initial
adsorbate concentration has a synergetic effect on the uptake capacity whereas, antagonism
effect on the percentage adsorption.
133
From our previous experimental results, it is observed that the adsorption capacity of the
pig iron industry sludge was very low at higher pH. Hence, the adsorption process may not
be economical. Therefore, the present study aimed at finding an alternative adsorbent i.e.
Biochar (carbonised grass) is to remove the Cr(VI) from the wastewater and use this
chromium adsorbed Biochar in Ferrochrome industry. The advantage of using biochar is
that the biochar along with the adsorbed Cr(VI) can be used in either ferrochrome or steel
making process. The Cr(VI) will be used as a raw material whereas, biochar will be used
as a source of energy and reducing agent to ferrous/ferric oxide. Therefore, no regeneration
or disposal of the adsorbent is required which may create environmental problem and hence
it can be treated as clean treatment technology. Biochar is prepared from the grass which
was used in chapter 4. It was observed that the maximum adsorption (100 %) takes place
when initial pH of 2.0 and 2.5. The uptake capacity increased from 10.7 mg/g at pH of 4.0
to 20 mg/g at pH of 2.0. The percentage of removal was increased from 59 % to 100 %
with increase in adsorbent dose from 1.0 to 10 g/L. However, the Cr(VI) uptake capacity
of the adsorbent has decreased from 5.9 to 1.4 mg/g when the adsorbent dose increased
from 1 g/L to 10 g/L. The maximum removal was 100% at 10 ppm has decreased to 94%
at 100 ppm of initial Cr(VI) concentration. The uptake capacity has been increased from 2
mg/g at 10 ppm to 18.9 mg/g at 100 ppm. From the experimental results, it was observed
that the adsorption capacity of biochar is higher than other three (grass, coconut leave and
pig iron sludge) adsorbents. Further use of biochar can eliminate the disadvantages of using
the other three adsorbent as this can be reused in ferrochrome or steel making processes.
In order to find out the rate kinetics four different kinetic models such as Lagergren’s
pseudo first-order model, Ritchie’s second order model, First order reversible model,
Pseudo second order model were used. The plots were drawn for each kinetic model and
the values of model parameters along with R2 are calculated. From the R2 values it was
observed that for all the four adsorbents, adsorption process followed pseudo second order
kinetics. The time variation experimental data was used to find out the rate limiting step in
the sorption procedure. It was observed that in all cases the values of diffusivity for surface
diffusion ‘D1’ is always smaller than the diffusivity for intra-particle diffusion ‘D2’.
134
Therefore, it was concluded that surface diffusion is the slowest steps and hence is the rate
limiting steps. In order to find out the maximum uptake capacity of all the adsorbents three
adsorption isotherms were used to fit into the experimental data. The isotherms used were
Freundlich isotherm, Langmuir isotherm and Temkin Isotherm. Experimental data were
used to plot the different isotherm model and the isotherm constant along with R2 values
were calculated. From the values of R2 values it was clear that adsorption follows the
Langmuir adsorption isotherm in all the four cases.
A nK type of factorial design method is used to develop empirical model and different tools
such as MINITAB, MATLAB and LabVIEW are used to simulate and analyze the
empirical model. In the 1st part of study, full factorial design of experiment is used for the
optimization of Cr(VI) adsorption using Sorghastrum Nutans L. Nash. Factorial design of
24 type is employed with contact time, initial pH of the solution, adsorbent dose and initial
Cr(VI) concentration as independent parameters and % of Cr(VI) adsorption as the
response variable. Different statistical analysis such as probability, residual, contour, 3D
surface, main effect and interaction plot along with t-test, ANOVA and F-test were used to
optimize the operating parameters of the process. From the statistical analysis, it was found
that the pH has a negative effect and is the most influential parameter, as pH decreases, the
percentage of adsorption increases significantly. The second most important parameter is
doses which has a positive effect as the percentage of adsorption increases with dosage.
The maximum removal was obtained at pH of 1.3, concentration 100 mg/L and adsorbent
dose of 7 g/L. In the second part of the optimization process, Data is collected from the
literature and a 23 type factorial design is used to design the experiment. Empirical
mathematical model was developed using matrix method. The empirical model was
simulated using MATLAB and LabVIEW. Among the two simulating tools the latter one
was found to be much user friendly. From the analysis, it was concluded that pH had the
most influential effect on the adsorption process followed by contact time. Among all
possible combined effects, the effect of pH and contact time was the most influential one.
As the selection of particular adsorbent is very complex in nature as because the adsorption
depends upon on many factors. So there is a requirement of easy, organized and rational
135
methods to direct the decision makers in considering all possible number of factors and
their interaction in making correct decision. In this study, fuzzy logic method is used for
selection of suitable adsorbent for the Cr(VI) removal. Multiple attribute decision making
(MADM) is used to determine the corresponding weighting values for the selected
adsorbents. Selection of an optimum adsorbent for the removal of Cr(VI) can be done on
the basis of their preference index prepared in the previous section. The preference index
is calculated by using the subjective and objective weights. A final decision can be taken
keeping in view of all practical consideration during the experimentation. This calculation
has been done purely on the basis of literature survey on the Cr(VI) removal by varying
different parameter of different adsorbents. The normalized value associated with each
parameter has given on the basis of effect of each parameter on the Cr(VI) removal and
uptake capacity of each material. However, the limitations of this computational approach
still remain. Only limited number of adsorbents was chosen for comparison and this can be
extended for very large data with numerous parameters to prove with respect to cover all
the sustainability dimensions like the environment, economic and social dimensions. The
associated MADM method results and the limitations of the approaches are discussed to
lay the foundation for further improvement.
8.2 Scope for Further Study
As discussed before, the adsorptive removal of Cr(VI) would be environmental friendly
and economical only if the adsorbed Cr(VI) along with the adsorbent can be reused.
Therefore, we have proposed a possible potential option of using the adsorbent along with
adsorbed Cr(VI) as a raw material for the production of steel or ferrochrome. But the
techno-economic of the process suggested in the thesis needs to be analysed in details. The
objective needs of proposed study would be carried out for the scale up and implication in
the industry are:
➢ To develop a detailed flow sheet using different simulation software.
➢ To conduct economic evaluation of the flow sheet through the process simulation.
➢ Characterizing the Biochar and comparing it with the coke for possible use in the
blast furnace.
➢ Studying the carbothermic reduction capacity of the Cr(VI) adsorbed biochar.
136
References
Abdel-Ghani N.T., Hegazy A.K., El-Chaghaby G.A., Lima E.C., Factorial experimental
Design for bio-sorption of iron and zinc using Typhadomingensis phytomass,
Desalination, 249 (2009) 343–347.
Abhishek K., Agrawal, V.P., Attribute based specification, comparison and selection of
electroplating system using MADM approach, Expert System with Application, 36(8)
(2009) 10815–10827.
Adinarayana K., Ellaiah P., Srinivasulu B., Devi B., Adinarayana G., Response surface
methodological approach to optimize the nutritional parameters for neomycin
production by Streptomyces marinensis under solid-state fermentation, Proc.
Biochem., 38 (2003) 1565 - 1572.
Adriano D.C., Chlopecka A., Kapland D.I., Clijsters H., Vangrosvelt J., Soil contamination
and remediation philosophy, Science and technology. In: Prost, R.(Ed.), Contaminated
Soils. INRA, Paris, (1995) 466 –504.
Akkaya G., Ozer A., Adsorption of Acid Red 274 (AR274) on Dicranellavaria:
Determination of Equilibrium and kinetic model parameters, Process Biochem., 40
(2005) 3559-3568.
Aksu Z., Isoglu I.A., Removal of copper(II) ions from aqueous solution by biosorption
onto agricultural waste sugar beet pulp, Process Biochemistry, 40 (2005) 3031–3044.
Albadarin A.B., AlMuhtaseb A.A.H., Al-laqtah, N.A., Walker G.M., Allen S.J., Ahmad
N.M., Biosorption of toxic chromium from aqueous phase by lignin: Mechanism,
effect of other metal ions and salts, Chemical Engineering Journal, 169(1-3) (2011)
20-30.
Aliabadi M., Morshedzadeh K., Soheyli H., Removal of hexavalent chromium from
aqueous solution by lignocellulosic solid wastes, Int. J. Env. Sci. and Tech., 3 (2006)
321–325.
Allen S.J., Brown P.A., Isotherm analyses for single component and multi-component
metal sorption onto lignite, J. Chem. Tech. Biotechnol., 62(1995) 17-24.
Anandkumar J., Mandal B., Removal of Cr(VI) from aqueous solution using Bael fruit
(Aegle marmelos correa) shell as an adsorbent, J. Hazard. Mater., 168 (2009) 633-
640.
137
Ang K.C., Introducing the boundary element method with MATLAB, International Journal
of Mathematical Education in Science and Technology, 39 (2008) 505–519
Antony J., Design of Experiments for Engineers and Scientists, Second ed., Buterworth-
Heinemann, New York, (2003).
Arenas L.T., Lima E.C., Santos A.A.D., Vaghetti J.C.P., Coasta T.M.H., Benvenutti E.V.,
Use of statistical design of experiments to evaluate the sorption capacity of 1,4-
diazoniabicycle [2.2.2] octane/silica chloride for Cr(VI) adsorption, colloids and
Surfaces A: Physiochemical Engineering Aspect., 297 (2006) 240-248.
Ariyama T., Murai R., Ishii J., Sato M., Reduction of CO2 emissions from integrated steel
works and its subjects for a future study, ISIJ Int., 45 (2005) 1371–1378.
Ashby M.F., Brechet Y.J.M., Cebon D., Selection strategies for materials and processes, J.
Mater. Des., 25 (2004) 51–67.
Bansal M., Garg U., Singh D., Garg V.K., Removal of Cr(VI) from aqueous solutions using
pre-consumer processing agricultural waste: a case study of rice husk, J. Hazard.
Mater., 161 (2009) 312-320.
Baral S.S., Das S.N., Chaudhury G.R., Swamy Y.V., Rath P., Adsorption of Cr(VI) using
thermally activated weed Salvinia Cucullate, Che. Eng. J., 139 (2008) 245-255.
Baral S.S., Das N., Chaudhary R.G., Das S.N., A preliminary study on the adsorptive
removal of Cr(VI) using seaweed, Hydrilla Verticillata, J. Hazard. Mater., 171 (2009)
358-369.
Baral S.S., Das S.N., Rath P., Hexavalent chromium removal from aqueous solution by
adsorption on treated sawdust, Biochem. Eng. J., 31 (2006) 216-222.
Baskar A., Shabudeen P.S.S., Factorial design of experiment model enables to optimize
the variables in wastewater decolorization process by using areca husk activated
carbon fibre, J. Chem. and Pharm. Res., 7 (2015) 1500-1511.
Beukes J.P., Pienaar J.J, Lachmann G., Giesekke E.W., The reduction of hexavalent
chromium by sulphite in wastewater, Water SA., 25 (1999) 363-370.
Bhatnagar A., Minocha A.K., “Conventional and nonconventional adsorbents for removal
of pollutants from water- A review”, Indian Journal of Chemical Technology, 13
(2006) 203-217.
138
Bhattacharya A.K., Naiya, T.K., Mandal, S.N., Das S.K., Adsorption, kinetics and
equilibrium studies on removal of Cr (VI) from aqueous solutions using different low-
cost adsorbents, Chem. Eng. J., 137 (3) (2008) 529–541
Bidoglio G., Gibson P.N., Gorma M., Roberts K.J., X-ray absorption spectroscopy
investigation of surface redox transformations of thallium and chromium on colloidal
mineral oxides, Geochim Cosmochim Acta, 57 (1993) 2389-2394.
Boddu V.M., Abburi K., Talbott J.L., Smith E.D., Removal of hexavalent chromium from
wastewater using a new composite chitosan bio-sorbent, Environ. Sci. Technol., 37
(2003) 4449–4456.
Box G.E.P., Hunter W.G., Hunter J.S., Statistics for Experimenters—An Introduction to
Design, Data Analysis and Model Building, John Wiley and Sons, New York, (1978)
Brown E.M., A Conformational Study of Collagen as Affected by Tanning Procedures",
Journal of the American Leather Chemists Association, 92 (1992) 225–233.
Bruzual C.F., Charcoal injection in blast furnaces (Bio-PCI): CO2 reduction potential and
economic propects, Jr. Mat. Res. and Tech., 3 (2014) 233-243.
Chabaane S., Tahiri A., Albizane M., Krati M.L., Cervera M., Guardia D., Immobilization
of Vegetable tannins on tannery chrome shavings and their use for the removal of
hexavalent chromium from contaminated water, Chem. Engg. J., 174 (2011) 310-317.
Chatterjee P., Chakrabort S., Advanced manufacturing systems selection using ORESTE
method, International Journal of Advanced Operational Management, 5 (2013) 337–
361.
Chen S.J., Hwang C.L., Fuzzy multiple attribute decision making-methods and
applications, Lecture Notes in Economics and Mathematical Systems, Springer-
Verlag, Berlin, (1992).
Cimino, G., Passerini A., Toscano G., Removal of toxic cations and Cr(VI) from aqueous
solution by hazelnut shell, Water Research, 34 (11) (2000) 2955-2962.
Ciolacu D., Ciolacu F., Popa V.I., Amorphous Cellulose –Structure and Characterization,
Cellulose Chem. and Technol., 45 (2011) 13-21.
Davis T.A., Volesky B., Mucci A., A review of the bio-chemistry of heavy metal bio-
sorption by brown algae, Water Res., 37 (2003) 4331-4330.
139
Deepa K.K., Sathishkumar M., Binupriya A.R., Murugesan G.S., Swaminathan K., Yun
S.E., Sorption of Cr(VI) from dilute solutions and wastewater by live and pretreated
biomass of Aspergillus flavus, Chemosphere, 62(5) (2006) 833-840.
Dennis J.K., Such T.E., Nickel and Chromium plating, Woodhead Publishing, 1993.
Devy S., Bai R., Removal of trivalent and hexavalent chromium with aminated
polyacrylonitrile fibers: performance and mechanism, Water Res., 38 (2004) 2424-
2432.
Dilek F.B., Erbay A., Yetis U., Ni(II) biosorption by Polyporous versicolor, Process
Biochemistry, 37 (2002) 723–726.
Durga P.C., Krishna P.S.P., Srinivas C., Equilibrium studies on biosorption of chromium
on Psidium guajava leaves powder, Journal of Chemical and Pharmaceutical Research,
4(4) (2012) 1868–1879.
Dursun G., Cicek H., Dursun A.Y., Adsorption of phenol from aqueous solution by using
carbonized beet pulp, J. Hazard. Mater., B125 (2005) 175-182.
Eary L.E., Rai D., Kinetics of Chromate Reduction by Ferrous Ions Derived from Hematite
and Biotite at 25°C, American Journal of Science, 289 (1989) 180-213.
Edwards K.L., Selecting materials for optimum use in engineering components, J. Mater.
Des., 26 (2005) 469–472.
Elangovan R., Philip L., Chandraraj K., Biosorption of Hexavalent and Trivalent
Chromium by Palm Flower (Borassus aethiopum), Chem. Eng. J., 141 (2008) 99–111.
Elangovan R., Philip, L., Chandraraj K., Biosorption of chromium species by aquatic
weeds: kinetics and mechanism studies. J. Hazard. Mat., 152 (2008) 100 -112
El-Sikaily A., El Nemr A., Khaled A., Abdelwehab Q., Removal of toxic chromium from
wastewater using green alga Ulva lactuca and its activated carbon, J. Hazard. Mat.,
148 (2007) 216-228.
Febrianto J., Kosasih A.N., Sunarso J., Ju Y.H., Indraswati N., Ismadji S., Equilibrium and
kinetic studies in adsorption of heavy metals using bio-sorbent: A summary of recent
studies, J. Hazard. Mater., 162 (2009) 616-645.
Gasser M.S., Morad G.H.A., Aly H.F., Batch kinetics and thermodynamics of chromium
ions removal from waste solutions using synthetic adsorbents, Journal of Hazardous
Materials, 142 (2007) 118–129.
140
Gayathri R., Thirumarimurugan M., Kannadasan T., A study on adsorption of
Chromium(VI) ions from aqueous solution by Ficus religiosa leaves as adsorbent, Der
Chemica Sinica, Pelagia research Library, 4 (2013) 79-87.
Geyikci F., Buyukgungor H., Factorial experimental design for adsorption silver ions from
water onto montmorillonite, ACTA Geodyn Geomater, 10 (2013) 363-370.
Goel R.P., Smelting Technologies for Ferrochromium Production-Recent Trends, Ferro
Alloy Industries in the Liberalised Economy, (1997) 37-50.
Gottipati R., Mishra S., Process optimization of adsorption of Cr(VI) on activated carbons
prepared from plant precursors by a two-level full factorial design, Chem. Eng. J., 160
(2010) 99-107.
Gun A.M., Gupta M.K., Dasgupta B., Designs of experiments, Fundamental of Statistic,
The World Press Private Ltd., Calcutta, 2 (2002) 62-164.
Gupta V.K., Rastogi A., Nayak A., Removal of Cr(VI) from aqueous solutions by
adsorption onto hazelnut shell activated carbon:kinetic and equilibrium studies,
Bioresource Technol., 91 (2004) 317–321.
Hamadi N.K., Chen X.D., Farid M.M., Lu M.G.Q., Adsorption kinetics for the removal of
chromium(VI) from aqueous solution by adsorbents derived from used tyres and
sawdust, Chemical Engineering Journal, 84(2) 95–105.
Hasan S.H., Singh K.K., Prakash O., Talat M., Hoc Y.S., Removal of Cr (VI) from aqueous
Hingston, J., Leaching of chromated copper arsenate wood preservatives: a review,
Environmental Pollution, 111 (1) (2001) 53–66.
Ho Y.S., Review of second-order models for adsorption systems, J. Hazard. Mater., 36
(2006) 681-689.
Huang K., Xiu Y., Zhu H., Removal of hexavalent chromium from aqueous solution by
crosslinked Mangostem peel biosorbent, Int. J. Environ. Sci. Technol., 12 (2015)
2485–2492
Ilton E.S., Veblen D.R., Chromium sorption by phlogopite and biotite in acidic solution at
250C .Insight from the X-ray photoelectron Spectroscopy and electron microscopy,
Geochim Cosmochim Acta, 58 (1994) 2777-2788.
141
Ilton E.S., Veblen D.R., Moses C.O., Raeburn S.P., The catalytic effect of sodium and
lithium ions on coupled sorption-reduction of chromate at biotite edge fluid interface,
Geochim Cosmochim Acta, 61 (1997) 3543-3563.
Isa M.H., Ibrahim N., Aziz H.A., Adlan M.N., Sabiani N.H.M., Zinatizadeh A.A.L., Kutty
S.R.M., Removal of chromium (VI) from aqueous solution using treated oil palm fibre,
J. Hazard. Mater., 152 (2008) 662–668
Jagruti N.J., Sandip D.M., Bhalerao S.A., use of terminalia catappa l. Leaves for effective
removal of chromium (VI) from aqueous solutions, Int. J. Curr. Res. Chem. Pharma.
Sci., 2 (2015) 48–62.
Jain M., Garg V.K., Kadirvelu K., Chromium(VI) removal from aqueous system using
Helianthus annuus (sunflower) stem waste, J. Hazard. Mater., 162(1) (2009) 365-72.
Jain V., Raj T., Ranking of flexibility in flexible manufacturing system by using a
combined multiple attribute decision making method, Journal of Flexible Systems
Management, 14 (2013) 125–141.
Jing G., Zhou Z., Song L., Dong M., Ultrasound enhanced adsorption and desorption of
chromium (VI) on activated carbon and polymeric resin, Desalination, 2011.
Karale R.S., Wadkar D.V., Nangare P.B., Removal and recovery of hexavalent Chromium
from industrial waste water by precipitation with due consideration to cost
optimization, J. Envirnt. Res. and Dev., 2 (2) (2007) 209-216.
Karthikeyen S., Rajgopal S., Miranda L.R., Cr(VI) adsorption from aqueous solution by
Hevea brasilinesis saw dust activated carbon, J. Hazard. Mater., 124 (2005) 192–199.
Khambhaty Y., Mody K., Shaikbasha, Bio-sorption of Cr(VI) onto marine Aspergillus
Niger: experimental studies and pseudo-second order kinetics, World J. Microbial
Biotechnol., 25 (2009) 1414-1442.
Kiran C.P., Clement S., Agrawal V.P., Coding, evaluation and optimal selection of a
mechatronic system, Expert System with Application, 38(8) (2011) 9704–9712.
Krishna V.V., Ravindhranath. K., Removal of chromium (VI) from polluted waters using
powders of leaves or their ashes of some herbal plants, J. Experimental Sci., 3 (2012)
1-9.
142
Kundu S., Gupta A.K., Arsenic adsorption onto iron oxide-coated cement (IOCC):
regression analysis of equilibrium data with several isotherm models and their
optimization, Chem. Eng. J., 122 (2006) 93–106.
Lagergren S., Zur theorie der sogenannten adsorption gelöster stoffe, Kungliga Svenska
Vetenskapsakademiens, Handlingar, Band, 24 (1898) 1-39.
Lazaridis N.K., Karapantsios T.D., Georgantas D., Kinetic analysis for the removal of a
reactive dye from aqueous solution onto hydro-calcite by adsorption, Water Res., 37
(2003) 3023–3033.
Lee H.W., Prasetyo R.D., Prajitno H., Sitompul J., Molecular Weight and Structural
Properties of Biodegradable PLA synthesized with Different catalysts by direct melt
poly-condensation, J. Eng. Technol. Sci., 47 (2015) 364-373.
Levankumar L., Muthukumaran V., Gobinath M.B., Batch adsorption and kinetics of
chromium (VI) removal from aqueous solutions by Ocimum americanum L. seed pods,
J. Hazard. Mater., 161(2–3) (2009)709–713.
Leyva, R.R., Bernal, J.L.A., Acosta. R.I., Adsorption of cadmium(II) from aqueous
solution on natural and oxidized corncob, Sep. Purif. Technol., 45 (2005) 41–49.
Li G.D., Yamaguchi D., Nagai M.A., Grey-based decision making approach to the supplier
selection problem, Mathematical and Computer Modelling, 46 (2007) 573–581.
Li J., Lin Q., Zhang X., Yan Y., Kinetic parameters and mechanisms of the batch bio-
sorption of Cr(VI) and Cr(III) onto Leersia hexandra Swartzbiomass, J. Colloid
Interface Sci., 333 (2009) 71-77.
Li J.Y., Wang W.B., Li Y.W., Liu Z. R., Cai D. C., LabVIEWTM7 express-based virtual
instrument for drawing binary phase diagrams, Computer and Applied Chemistry, 22
(2005) 623–626.
Liang S., Guo X., Lautner S., Saake B., Removal of hexavalent chromium by different
modified spruce bark adsorbents, Journal of Wood Chemistry and Technology, 34
(2014) 273–290.
Ljungberg L.Y., Edwards K.L., Design, materials selection and marketing of successful
products, J. Mater. Des., 24 (2003) 519–529.
Malkoc E., Nuhoglu Y., Dundar M., Adsorption of chromium(VI) on pomace—An oliveoil
industry waste: Batch and column studies, J. Hazard. Mater., B138 (2006) 142–151.
143
Malkoc E., Nuhoglu Y., Dundar M., Adsorption of Cr(VI) on pomace an olive oil industry
waste: batch and column studies, J. Hazard. Mater., B138 (2006) 142–151.
Malkoc E., Nuhoglu Y., Potential of tea factory waste for chromium (VI) removal from
aqueous solutions: Thermodynamic and kinetic studies, Sep. Puri. Technol., 54 (2007)
291–298.
Mandal B.K., Vankayala R., Kumar U.L., Speciation of Chromium in Soil and Sludge in
the Surrounding Tannery Region, Ranipet, Tamil Nadu, International Scholarly
Research Network, 2011 (2011) 10.
Mandal T., Maity S., Dasgupta D., Datta S., Advanced oxidation process and biotreatment:
Their roles in combined industrial wastewater treatment, Desalination, 250 (2010) 87-
94.
Maniya K.D., Bhatt M.G., The selection of flexible manufacturing system using preference
selection index method, International Journal of Industrial and Systems Engineering,
9 (2011) 330–349.
Matheickal J.T., Yu Q., Bio-sorption of lead from aqueous solutions by marine algae
Ecklonia radiate, Water Sci. Technol., 34 (1996) 1–7.
Mehrotra A., Gopal K., Seth P.K., Annual Report VIO Hyderabad State Indian Council of
Agriculture Research, ICAR, New Delhi, (1999).
Meski S., Ziani S., Khireddine H., Boudboub S., Zaidi S., Factorial design analysis for
sorption of zinc on hydroxyapatite, J. Hazard. Mater.,186 (2011) 1007-1017.
Mohan D., Rajput S., Singh V.K., Steele P.H., Pittman C.U. Jr, Modeling and evaluation
of chromium remediation from water using low cost bio-char, a green adsorbent. J.
Hazard. Mater., 188(1-3) (2011)319-333.
Montgomary D.C., Design and analysis of experiments, 3rd ed. J. Wiley & Sons, New
York, (1991).
Montgomery D.C., Design and Analysis of Experiments, 5th ed., John Wiley and Sons,
New York, (2001).
Montiano M.G., Diaz-Faes E., Barriocanal C., and R. Alvarez, Influence of biomass on
metallurgical coke quality, Fuel, 116 (2014) 175-182.
144
Mukhopadhyay M., Noronha S.B., Suraishkumar G.K., A review on experimental studies
of biosorption of heavy metals by Aspergillus niger, The Canadian J. Chemical
Engineering, 89 (2011) 889-900.
Muthukrishnan M., Guha B.K., Effect of pH on rejection of Cr(VI) by Nanofiltration,
Desalination, 219 (1–3) (2008). 171–178.
Mutongo F., Kuipa O., Kuipa K.P., Removal of Cr(VI) from Aqueous Solutions Using
Powder of Potato Peelings as a Low Cost Sorbent, Bioinorganic Chemistry and
Applications, (2014) 7.
Namasivayam C., Adsorbents for the treatment of wastewaters in Encyclopedia of
Environmental Pollution and Control, Edited by R. K. Trivedy, Enviromedia, Karad,
1 (1995) 30-49.
Natale F.D., Lancia A., Molino A., Musmarra D., Removal of chromium ions from aqueous
solutions by adsorption on activated carbon and char. J. Hazard. Mater., 145(3) (2007)
381–390.
Ncibi M.C., Mahjoub B., Seffen M., Brouers F., Gaspard S., Sorption dynamic
investigation of Chromium(VI) onto Posidonia oceanica fibres: Kinetic modelling
using new generalized fractal equation, Biochem. Eng. J., 46 (2009) 141–146.
Nemr A.E., Potential of pomegranate husk carbon for Cr(VI) removal from wastewater:
Kinetic and isotherm studies, J. Hazard. Mater., 161 (2009) 132–141.
Nkuzinna O.C., Menkiti M.C., Onukwuli O.D., Mbah G.O., Okolo B. I., Egbujor M.C.,
Mike R.G., Application of Factorial Design of Experiment for Optimization of
Inhibition Effect of Acid Extract of Gnetumafricanaon Copper Corrosion, Natural
Resour., 5 (2014) 299-307.
Norgate T., Haque S., Somerville M., and Jahanshahi S., Biomass as a source of renewable
carbon for iron and steelmaking, ISIJ Int., 52 (2012) 1472–1481.
Norgate T., Langberg D., Environmental and economic aspects of charcoal use in
steelmaking, ISIJ Int., 48 (2009) 587–595.
Nuhoglu Y., Oguz E., Removal of copper (II) from aqueous solutions by bio-sorption on
the cone biomass of Thujaorientalis, Process Biochem., 38 (2003) 1627–1631.
145
Oliveira D.Q.L., Goncalves, M., Oliveira L.C.A., Guilherme, L.R.G., Removal of As(V)
and Cr(VI) from aqueous solutions using solid waste from leather industry, J. Hazard.
Mater., 151, (2008a) 280.
Panda L., Das B., Rao D.S., Mishra B.K., Application of dolochar in the removal of
cadmium and hexavalent chromium ions from aqueous solutions, J. Hazard. Mater.,
192 (2011) 822-831.
Papp J.F., Lipin, B.R., Chromite Industrial Minerals & Rocks: Commodities, Markets, and
Uses, 7th ed., SME, (2006).
Park D., Yun S.Y., Park J.M., Studies on hexavalent chromium bio-sorption by chemically
treated biomass of Eckloniasp, Chemosphere., 60 (2005) 1356–1364.
Park D., Yun Y.S., Jo J.H., Park J.M., Mechanism of hexavalent chromium removal by
dead fungal biomass of Aspergillus Niger, Water Res., 39 (2005) 533.
Park D., Yun Y.S., Park J.M., Reduction of hexavalent chromium with the brown seaweed
Ecklonia biomass, Environ. Sci. Technol., 38 (2004) 4860–4864.
Pearse C.I., Lloyd J.R., Guthrie J.T., The removal of colour from textile waste water using
whole bacterial cells: a review, Dyes Pigments, 58 (2003) 179-196.
Peng H., Sen Y., Zhanga J., Lin L., Cellooligo saccharide degradation, Bio Resour., 5
(2010) 616-633.
Peterson M.L., Brown G.E., Parks G.A., Direct XAFS evidence for heterogeneous redox
reaction at the aqueous chromium/magnetite interface, Colloids Surf A., 107 (1996)
77–88.
Peterson M.L., White A.F., Brown G.E., Parks G.A., Surface passivation of magnetite by
reaction with aqueous Cr(VI): XAFS and TEM results, Environ. Sci. Technol., 31
(1997) 1573–1576.
Pradhan J., Das S.N., Thakur J., Adsorption of Hexavalent Chromium from Aqueous
Solution by Using Activated Red Mud, Journal of Colloidal Interface Science, 217
(1999) 137-141.
Pragathiswaran C., Sibi S., Sivanesan P., Adsorption of Hexavalent chromium from
aqueous solutions by Aloe vera leaf, International Journal of Research in Pharmacy
and Chemistry, 3 (2013) 876-880.
146
Prasad L., Thirumalisamy S., Evaluation of the use of Acacia nilotica leaf as an ecofriendly
adsorbent for Cr (VI) and its suitability in real waste water: study of residual errors,
Journal of Chemistry, 7 (2013).
Prasad P.V.V.V., Das C., Golder A.K., Reduction of Cr (VI) to Cr (III) and removal of
total chromium from wastewater using scrap iron in the form of zerovalent iron (ZVI):
Batch and column studies, The Canadian Journal of Chemical Engineering, 89 (2011)
1575-1582.
Pugazhenthi G., Sachan S., Kishore N., Kumar A., Separation of chromium (VI) using
modified ultrafiltration charged carbon membrane and its mathematical modeling,
Journal of Membrane Science, 254(1–2) (2005) 229–239.
Qaiser S., Saleemi A.R., Umar M.,Biosorption of lead (II) and chromium (VI) on
groundnut hull: Equilibrium, kinetics and thermodynamics study, Electronic Journal
of Biotechnology, 12 (4) (2009) 3-4.
Rane N.M., Sapkal R.S., Chromium(VI) removal by using orange peel powder in batch
adsorption, Int. J. Chem. Sci. and App., 5(2) (2014) 22-29
Rao R.V., Patel B.K., A subjective and objective integrated multiple attribute decision
making method for material selection, Materials and Design, 31 (2010) 4738–4747.
Ravikumar K., Pakshirajan K., Swaminathan T., Balu K., Optimization of batch process
parameters using response surface methodology for dye removal by novel adsorbent.
Chem. Eng. J., 105 (2005) 131-138.
Reddy K., Effects of soil composition on the removal of chromium by electro-kinetics, J.
Hazard. Mater., 55 (1997)135-158.
Romero-Gonzalez J., Peralta-Videa J.R., Rodriguez E., Ramirez S.L., Gardea-Torresdey
J.L., Determination of thermodynamic parameters of Cr(VI) adsorption from aqueous
solution onto Agave lechuguilla biomass, J. Chem. Thermodyn., 37 (2005) 343.
Sadaoui Z., Hemidouche S., Allalou O., Removal of hexavalent chromium from aqueous
solutions by micellar compounds, Desalination, 249 (2009) 768-773.
Saha R., Nandi R., Saha B., Sources and toxicity of hexavalent Chromium, J. Coord.
Chem., 64 (2011) 1782.
147
Sahayaraj P.A., Gowri J., Dharmalingam V., Shobana R., Prema A.A., Phytochemical
screening by FTIR spectroscopic analysis of leaf and stem Extracts of wedeliabiflora,
International J. Nano Corrosion Sci. and Eng., 2 (2015) 322-334.
Samaradivakera L., Sahu G.P., Opportunities to reduce carbon foot print in high carbon
Ferrochrome production process in a Submerged Arc Furnace, The 13th International
Ferroalloys Congress, (2013).
Sanghi R., Sankararamakrishnan N., Dave B.C., Fungal bioremediation of chromates:
Conformational changes of biomass during sequestration, binding, and reduction of
hexavalent chromium ions, J. Hazard Mat., 169 (2009) 1074-1080.
Scott E. Fendorf, Guangchao Li, Kinetics of Chromate Reduction by Ferrous Iron, Soil
Science Division, Environ. Sci. Technol., 30 (5) (1996) 1614–1617.
Sharma G., Kinetic modeling: Chromium(III) removal from aqueous solution by microbial
waste biomass, Journal of Scientific & Industrial Research, 68 (2009) 640-646.
Singh B.P., Besra L., Bhattacharjee S., Factorial design of experiments on the effect of
surface charges on stability of aqueous colloidal ceramic suspension, Colloids and
Surfaces: A Physicochemical and Eng. Aspects, 204 (2002)175-181.
Singha B., Naiya T.K., Bhattacharya A.K., Das S.K., Cr(VI) Ions Removal from Aqueous
Solutions Using Natural Adsorbents—FTIR Studies, J. Environ. Protection, 2 (2011)
729-735.
Sivaprakash A., Aravindhan R., Rao J.R., Nair B.U., kinetics and equilibrium studies on
the bio-sorption of hexavalent chromium from aqueous solutions using bacillus
subtilis biomass, Appl. Ecol. and Environ. Res., 7 (2009) 45-57.
Smirnov D.N., Genkin V.E., Cleaning of Effluents is in the processes of treatment of
metals, Moscow, Metallurgiya, 224.
Hasan S.H., Singh K.K., Prakash O., Talat M., Ho Y.S., Removal of Cr(VI) from
aqueous solutions using agricultural waste 'maize bran, J. Hazard. Mater.,152 (2008)
356-365.
Sprague J.A., Smidt F.A., ASM Handbook: Surface Engineering, ASM International
Retrieved, 2009 (1994).
Srivastava S.K., Gupta V.K., Mohan D., Removal of lead and chromium from activated
slag-a blast furnace waste, J. Envir. Engg. ASCE, 123 (5) (1997b) 461-468.
148
Supriya S., Tripathi A., Srivastava S.K., Prakash R., Removal of Hexavalent Chromium
by Using Mangifera Indica Bark (Bio-sorption), Int. J. Res. Chem. and Environ., 3
(2013) 61-67.
Thamilarasu P., Karunakaran K., Kinetic, equilibrium and thermodynamic studies on
removal of Cr(VI) by activated carbon prepared from Ricinus communis seed shell,
The Canadian Journal of Chemical Engineering, 91 (2013) 9–18.
The Statistic homepage. http://www.statsoft.com/textbook/stathome.html, Experimental
Design link, website visited on May 26, (2006).
The World’s Worst Polluted Places: The Top Ten, Report by Blacksmith Institute,
Available from: www.blacksmithinstitute.org
Thirumalai R., Senthilkumaar J.S., Multi-criteria decision making in the selection of
machining parameters for Inconel 718, Journal of Mechanical Science and
Technology, 27 (2013) 1109–1116.
Tsezos M., Volesky B., Biosorption of uranium and thorium, Biotechnol. Bioeng., 23
(1981) 583-604.
Veeram B., Talbot J., Andedgard S., Removal of hexavalent chromium from wastewater
using a new composite chitosan biosorbent, Environmental Science & Technology, 37
(2003) 4449–4456.
Wang J., Chen C., Biosorbents for heavy metals removal and their future, Biotechnol. Adv.,
27 (2009) 195–226,
Wang X.S., Li Z.Z., Tao S.R., Removal of chromium (VI) from aqueous solution using
walnut hull, J. Environ. Manage., 90(2) (2009) 721-729.
Wang, W.B., Li J.Y., Wu Q.J., The Design of a Chemical Virtual Instrument Based on
LabVIEW for Determining Temperatures and Pressures, Journal of Automated
Methods and Management in Chemistry, 2007 (2007) 1-7.
Weckhuysen B.M., Schoonheydt R.A., Olefin polymerization over supported chromium
oxide catalysts, Catalysis Today, 51 (2) (2009) 215–221.
Wiklund C.M., Pettersson F., Saxen H., Optimal resource allocation in integrated
steelmaking with biomass as auxiliary reductant in the blast furnace, ISIJ Int., 52
(2012) 35–44.
149
Worobec, Mary D., Hogue, Cheryl Toxic Substances Controls Guide: Federal Regulation
of Chemicals in the Environment, Washington, D.C.: BNA Books. p. 13. (1992).
Wu C.F.J., Hamada M., Experiments: Planning, Analysis and Parameter Design
Optimization, 2nd edition, Wiley, New York, (2009).
Yang T., Hung C.C., Multiple-attribute decision making methods for plant layout design
problem, Robotics and Computer-Integrated Manufacturing, 23 (2007) 126–137.
Yuan P., Fan M., Yang D., He H., Liu D., Yuan A., Zhu J., Chen T., Montmorillonite-
supported magnetite nanoparticles for the removal of hexavalent chromium Cr(VI)
from aqueous solutions, J. Hazard. Mater., 166 (2009) 821-829.
Zhang Q., Chen J.C.H., He Y.Q., Ma J., Zhou D.N., Multiple attribute decision making:
approach integrating subjective and objective information, International Journal of
Manufacturing Technology and Management, 5 (2011) 338–361.
Zhang R., Wang B., Ma H., Studies on Chromium (VI) adsorption on sulfonated lignite,
Desalination, 255 (2010) 61-66.
Zvinowanda C.M., Okonkwo J.O., Shabalala P.N., Agyei N.M., A novel adsorbent for
heavy metal remediation in aqueous environments, Int. J. Environ. Sci. Tech., 6 (3)
(2009) 425-434.
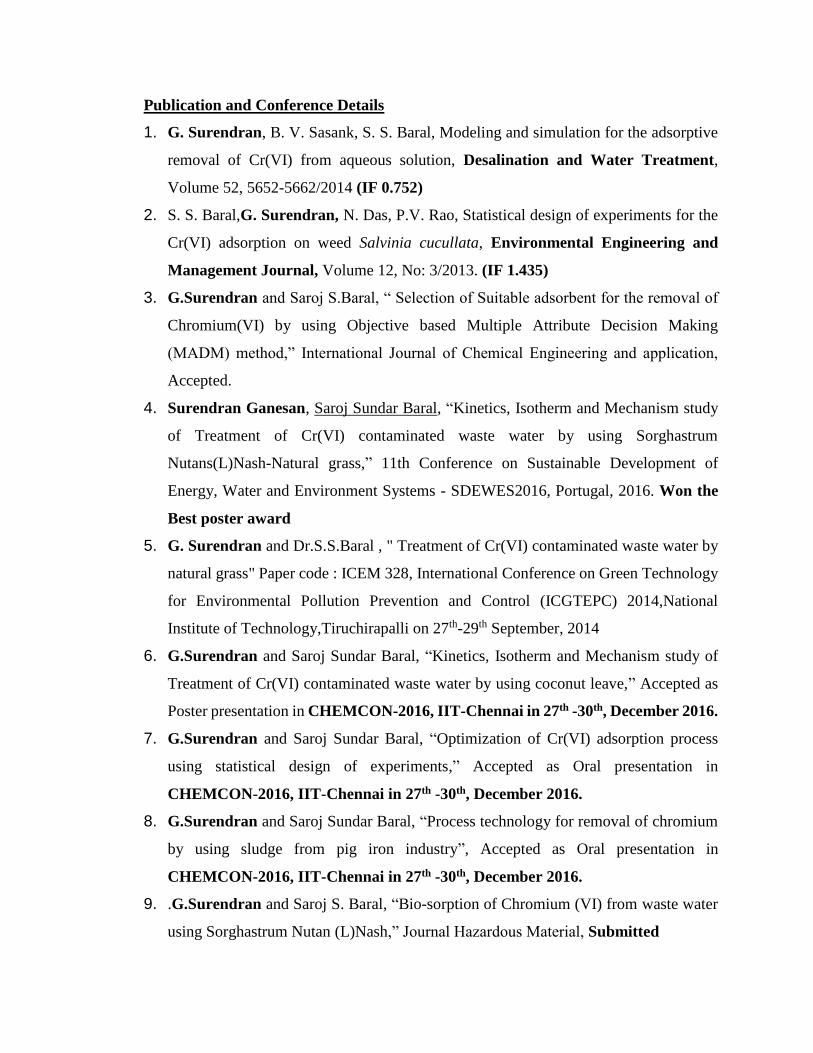
Publication and Conference Details
1. G. Surendran, B. V. Sasank, S. S. Baral, Modeling and simulation for the adsorptive
removal of Cr(VI) from aqueous solution, Desalination and Water Treatment,
Volume 52, 5652-5662/2014 (IF 0.752)
2. S. S. Baral,G. Surendran, N. Das, P.V. Rao, Statistical design of experiments for the
Cr(VI) adsorption on weed Salvinia cucullata, Environmental Engineering and
Management Journal, Volume 12, No: 3/2013. (IF 1.435)
3. G.Surendran and Saroj S.Baral, “ Selection of Suitable adsorbent for the removal of
Chromium(VI) by using Objective based Multiple Attribute Decision Making
(MADM) method,” International Journal of Chemical Engineering and application,
Accepted.
4. Surendran Ganesan, Saroj Sundar Baral, “Kinetics, Isotherm and Mechanism study
of Treatment of Cr(VI) contaminated waste water by using Sorghastrum
Nutans(L)Nash-Natural grass,” 11th Conference on Sustainable Development of
Energy, Water and Environment Systems - SDEWES2016, Portugal, 2016. Won the
Best poster award
5. G. Surendran and Dr.S.S.Baral , " Treatment of Cr(VI) contaminated waste water by
natural grass" Paper code : ICEM 328, International Conference on Green Technology
for Environmental Pollution Prevention and Control (ICGTEPC) 2014,National
Institute of Technology,Tiruchirapalli on 27th-29th September, 2014
6. G.Surendran and Saroj Sundar Baral, “Kinetics, Isotherm and Mechanism study of
Treatment of Cr(VI) contaminated waste water by using coconut leave,” Accepted as
Poster presentation in CHEMCON-2016, IIT-Chennai in 27th -30th, December 2016.
7. G.Surendran and Saroj Sundar Baral, “Optimization of Cr(VI) adsorption process
using statistical design of experiments,” Accepted as Oral presentation in
CHEMCON-2016, IIT-Chennai in 27th -30th, December 2016.
8. G.Surendran and Saroj Sundar Baral, “Process technology for removal of chromium
by using sludge from pig iron industry”, Accepted as Oral presentation in
CHEMCON-2016, IIT-Chennai in 27th -30th, December 2016.
9. .G.Surendran and Saroj S. Baral, “Bio-sorption of Chromium (VI) from waste water
using Sorghastrum Nutan (L)Nash,” Journal Hazardous Material, Submitted
Curriculum Vitae of Mr. Surendran G.
I did my B.Tech in Chemical Engineering from N.I.T.Trichy and M.Tech in Petroleum
Refining and Petrochemicals from A.C.Tech, Anna University in 1997. I have got 3 years
of Industrial Experience in United Phosphorus Ltd, Gujarat. Currently working as a
Lecturer in Department of Chemical Engineering, BITS-Pilani, KK Birla Goa campus from
September 2008. I have published my Doctoral work in three international publications
and six international conferences. One of the poster has been awarded as a best poster in
Lisbon, Portugal 11th Conference on Sustainable Development of Energy, Water and
Environment Systems (SDEWES2016) held in Lisbon from September 4-9, 2016.
Curriculum Vitae of Prof. Saroj S. Baral
Dr. Saroj Sundar Baral is the Associate professor in Chemical Engineering group at Birla
Institute of Technology and Science (BITS), Pilani- K. K. Birla Goa Campus. He received
a Ph.D. in Chemical Engineering jointly from National Institute of Technology, Rourkela
and Institute of Minerals and Materials Technology (CSIR), Bhubaneswar in 2008. He
completed his B.E. Chemical Engineering from Indira Gandhi Institute of Technology,
Sarang in 2001. He joins as assistant professor in chemical engineering group of BITS in
2008. He was working as an assistant professor in chemical engineering department of
Maharashtra Academy of Engineering for one year. He was also working in Institute of
Minerals and Materials Technology (CSIR), Bhubaneswar for five years.
At BITS Pilani, K.K. Birla Goa Campus he has taught a wide variety of courses which
include process control, mass transfer operation, advanced process control, computer aided
process plant design, chemical process technology, measurement technique-II and process
plant simulation.
His research interest includes waste water treatment, separation processes, atmospheric
precipitation, emission of greenhouse gases and renewable energy. Much of his research
in waste water treatment has emphasized the development of new low cost adsorbents for
the treatment of Cr(VI) contaminated waste water. Apart from waste water treatment, he is
also attached to various environment related programs like chemical composition of
aerosol, rainwater, emission of greenhouse gases from agricultural activities and anaerobic
digestion of sewage sludge for biogas production.
Dr. Baral has published a number of research papers in different international journal of
repute. He also presented a number of papers in different national and international
conference. He has also published two books and one book chapter under different
international publisher like Willey and VDM. At present, he is guiding Two students for
their Ph.D and one student completed his Ph.D. under his guidance. He has guided several
M.E. thesis at BITS Pilani. He is also got two project from Department of Biotechnology,
Government of India.