Embed Size (px)
Citation preview
Suppression of neutrophil and T cell mediated inflammation
through plasma cell IL-10


To My Parents

Hereby I declare that I have written the present dissertation without any assistance of
third parties and have not used outside sources without declaration in the text. Any
concepts or quotations applicable to these sources are clearly attributed to them.
This dissertation has not been submitted in the same or similar version, not even in part,
to any other authority for grading.
Upasana Anand Kulkarni
CONTENTS
Table of Contents
ABSTRACT………………………………………………………………………………………………………... 1
Abstract (English)……………………………………………………………………………………………… 1
Abstract (German)……………………………………………………………………………………………... 2
1. INTRODUCTION……………………………………………………………………………………….. 4
1.1 Immune System………………………………………………………………………………………… 4
1.2 Innate and Adaptive Immunity…………………………………………………………………... 4
1.3 Organs of the Immune System……………………………………………………………………. 5
1.4 B and T lymphocytes………………………………………………………………………………..... 5
1.5 T dependent and T independent B cell activation………………………………………... 6
1.6 Plasma Cell Development…………………………………………………………………………... 7
1.6.1 Overview………………………………………………………………………………………….. 7
1.6.2 Extrafollicular early plasma cell response………………………………………….. 8
1.6.3 Germinal center reaction…………………………………………………………………… 8
1.6.4 Long lived plasma cells……………………………………………………………………… 8
1.7 Antibodies………………………………………………………………………………………………… 9
1.8 Cytokines………………………………………………………………………………………………….. 11
1.8.1 IL-10………………………………………………………………………………………………… 12
1.9 Regulatory T cells……………………………………………………………………………………… 13
1.10 B Lineage Cells as Cytokine Producing Cells……………………………………………...... 14
1.10.1 Regulatory B cells……………………………………………………………………………. 14
1.10.2 Some indications of plasma cell IL-10……………………………………………..... 16
1.11 Plasmacytosis and Associated Immune Deficiency……………………………………… 17
1.11.1 Multiple myeloma and associated immunosuppression……………………. 18
1.12 Complement System…………………………………………………………………………………. 19
1.12.1 Complement component 5a (C5a)…………………………………………………… 19
1.13 Neutrophils………………………………………………………………………………………………. 20
1.14 Epidermolysis Bullosa Acquisita (EBA)……………………………………………………… 22
1.14.1 Mouse models for EBA…………………………………………………………………….. 22
1.14.2 Loss of tolerance to COL7 and pathogenesis of EBA………………………….. 23
1.14.3 Treatment options…………………………………………………………………………... 24
2. MATERIALS AND METHODS…………………………………………………………………….. 25
2.1 Overview of Materials……………………………………………………………………………….... 25
2.2 Mice and Mouse Handling…………………………………………………………………………... 31
2.2.1 Mice…………………………………………………………………………………………………... 31
2.2.2 Collection of blood and its processing…………………………………………………. 31
2.2.3 Mouse dissection and collection of tissues…………………………………………... 31
2.2.4 Induction of plasmacytosis in mice……………………………………………………... 32
2.2.4.1 GMD injection………………………………………………………………………….. 32
2.2.4.2 Induction of multiple myeloma………………………………………………… 33
CONTENTS
2.2.5 Induction of EBA and evaluation of the disease.................................................... 34
2.3 Preparation of single cell suspension from mouse tissues.......................................... 35
2.3.1 Spleen and lymph nodes.................................................................................................. 35
2.3.2 Bone Marrow.................................................................................................................. ...... 36
2.4 Flow Cytometry.............................................................................................................................. 36
2.4.1 Overview of the method.................................................................................................. 36
2.4.2 Surface staining............................................................................................................. ...... 37
2.4.3 Intracellular staining of cytokines.............................................................................. 37
2.4.4 Detection of antigen (mCOL7c-GST) specific plasma cells............................... 38
2.4.5 Detection of antigen specific T cells........................................................................... 39
2.4.6 Foxp3 staining............................................................................................................... ...... 40
2.4.7 Analysis of flow cytometry data................................................................................... 40
2.5 B Cell Isolation and Plasma Cell Culture.............................................................................. 41
2.6 Enzyme Linked Immunosorbent Assays (ELISAs).......................................................... 42
2.6.1 Analysis of IL-10 concentration in cell culture and serum............................... 42
2.6.1.1 IL-10 ELISA on culture supernatants.......................................................... 42
2.6.1.2 IL-10 ELISA on serum........................................................................................ 43
2.6.2 mCOL7c specific serum antibody ELISA................................................................... 44
2.6.3 Measurement of myeloma specific proteins........................................................... 45
2.7 Analysis of Neutrophil Migration........................................................................................... 45
2.7.1 Boyden Chamber assay.................................................................................................... 46
2.7.2 C5a mediated peritoneal inflammation.................................................................... 46
2.8 Evaluation of Neutrophil Infiltration in Ears of Mice..................................................... 47
2.8.1 Myeloperoxidase assay.................................................................................................... 47
2.8.2 Quantitative reverse transcriptase-polymerase chain reaction.................... 47
2.9 Immunohistochemistry.............................................................................................................. 49
2.10 Statistics................................................................................................................... .......................... 50
3. RESULTS............................................................................................................................................. 51
3.1 IL-10 is expressed by plasma cells.......................................................................................... 51
3.1.1 IL-10 expression by plasma cells induced by T dependent activation of
B cells via GMD.....................................................................................................................
51
3.1.2 Increased serum IL-10 levels after GMD treatment............................................. 57
3.1.3 IL-10 expression by plasma cells induced by T independent activation
of B cells via LPS...................................................................................................................
58
3.2 Polyclonal activation of B cells leads to an expansion of IL-10+ CD4+ Foxp3-
and Foxp3+ regulatory T cells...................................................................................................
60
3.2.1 Induction of IL-10+ Foxp3+/- CD4+ T cells following B cell stimulation via
GMD............................................................................................................................................
60
3.2.2 B lineage derived IL-10 promotes IL-10+ T cells following GMD injection 62
3.3 GMD induced and neoplastic plasmacytosis result in IL-10 mediated
suppression of neutrophil migration towards C5a..........................................................
65
3.3.1 High plasma cell loads are associated with a change in neutrophil
compartment.........................................................................................................................
65
CONTENTS
3.3.2 GMD induced plasmacytosis inhibits neutrophil migration towards
C5a..............................................................................................................................................
68
3.3.3 Murine MOPC315.BM myeloma model inhibits neutrophil migration
towards C5a............................................................................................................................
70
3.4 High IL-10 concentration in close vicinity of plasma cells can directly
suppress neutrophil migration towards C5a......................................................................
72
3.4.1 High IL-10 concentrations block neutrophil migration towards C5a........... 72
3.4.2 Plasma cells block neutrophil migration towards C5a........................................ 72
3.4.3 IL-10 from B lineage cells can block neutrophil migration towards C5a.... 74
3.4.4 Plasma cells and neutrophils co-localize................................................................... 75
3.5 Polyclonal activation via GMD does not induce pathogenic antibodies but
induces an anti-inflammatory IL-10 response with therapeutic potential in a
neutrophil mediated autoimmune skin disease................................................................
76
3.5.1 EBA skin disease is controlled by IL-10..................................................................... 76
3.5.2 Scheme of Treatment......................................................................................................... 78
3.5.3 GMD treated mice are protected from EBA.............................................................. 79
3.5.4 Activation of B cells via GMD did not increase the mCOL7c-GST specific
plasma cell response and autoantibody titers........................................................
80
3.5.5 Reduced tendency of neutrophil infiltration in skin of mice after GMD
treatment.................................................................................................................................
82
3.5.6 Effect of GMD treatment on T cell cytokine profile in EBA model................. 83
4. DISCUSSION...................................................................................................................................... 86
4.1 Overview..................................................................................................................... ....................... 86
4.2 IL-10 expression by normal and neoplastic plasma cells............................................. 87
4.2.1 Confirmation of the hypothesis: Plasma cells produce IL-10........................... 87
4.2.2 Some evidence of IL-10 expression by malignant plasma cells...................... 87
4.2.3 Reasoning behind expression of IL-10 by myeloma cells.................................. 88
4.2.4 IL-10 expression observed in early plasma cells................................................... 88
4.2.5 Reasoning behind plasma cells as source of IL-10................................................ 89
4.2.6 Plasma cells with an immunosuppressive phenotype........................................ 89
4.3 GMD treatment promotes IL-10 in T cells........................................................................... 90
4.3.1 Maintenance/induction of regulatory T cell population by B cells............... 90
4.3.2 Induction of Foxp3+ or Foxp3- regulatory T cells: through cytokines or
cell-cell contact................................................................................................................. ....
91
4.3.3 Th1 cell regulation by IL-10............................................................................................ 91
4.4 Inhibition of neutrophil migration towards C5a during plasmacytosis................. 92
4.4.1 Physiological relevance in antibody/immune complex mediated
inflammation................................................................................................................. ........
92
4.4.2 Physiological relevance in plasmacytosis associated immunodeficiency.. 93
4.5 Inhibition of neutrophil migration towards C5a via IL-10........................................... 94
4.5.1 First study showing a direct effect of IL-10 on C5a mediated neutrophil
migration.................................................................................................................... ...........
94
4.5.2 First study demonstrating effect of high concentrations of IL-10 from
CONTENTS
plasma cells on neutrophils............................................................................................ 95
4.5.3 Physiological relevance..................................................................................................... 95
4.6 Suppression of neutrophil mediated skin autoimmune disease through GMD
induced plasmacytosis........................................................................................................ .........
96
4.6.1 Role of IL-10 in EBA explained...................................................................................... 96
4.6.2 The effectiveness of GMD treatment is through IL-10 and inhibition of
complement mediated neutrophil migration and not via other IVIG like
effects...................................................................................................................... .................
97
4.6.3 Effect of GMD on CD4 T cells and its possible relevance in EBA..................... 97
5. OUTLOOK/ FUTURE PLANS.................................................................................................... 99
6. REFERENCES.................................................................................................................................... 100
List of Figures............................................................................................................................................. 110
List of Tables............................................................................................................... ............................... 112
Abbreviations............................................................................................................................................. 113
Acknowledgement................................................................................................................................... 116
ABSTRACT
1
Abstract
Background: B cell activation eventually results in plasma cell formation and
production of antibodies necessary for immune protection, but which can also cause
immune complex initiated inflammation and tissue destruction. B lineage cells can also
modulate the immune system by producing cytokines like interleukin (IL)-10 that
exhibit prominent immunosuppressive capacities. Although IL-10 expression by plasma
cells has been reported in few studies, its effect on the cells of the innate and adaptive
immune system is not well defined. In this thesis, the IL-10 expression in normal and
neoplastic plasma cells was observed and the effect of high plasma cell response
(plasmacytosis) particularly on neutrophil migration towards complement component
5a (C5a) was examined.
Results: Specific activation of B cells was achieved by crosslinking the B cell receptor via
injection of goat-anti-mouse immunoglobulin (Ig)D (GMD). Injection of GMD led to a
massive plasma cell response and production of IL-10 mainly by plasma cells/plasma
cell precursors and by Foxp3+ and Foxp3- CD4+ T cells, indicating that the primary
activation of B cells results in a massive IL-10 response. In mice, such plasmacytosis-
associated IL-10 induced neutrophil dysfunction and suppressed neutrophil influx into
the peritoneum after injection of anaphylatoxin C5a. Neutrophil migration was also
suppressed in an IL-10 dependent manner in a model for multiple myeloma. In vitro
assay showed that, IL-10 directly inhibited neutrophil migration towards C5a. Moreover,
autoantibody/immune complex initiated and neutrophil mediated skin inflammation
was effectively blocked in an IL-10 dependent manner following B cell activation.
Conclusion: Massive plasma cell responses observed during severe infections and
autoimmune diseases can lead to unwanted immune complex and neutrophil mediated
inflammation and tissue destruction which is counterbalanced and limited by a so far
unknown IL-10 mediated negative feedback mechanism initiated during B cell
activation/plasma cell differentiation. On the other hand, plasma cell IL-10 might also
contribute to immunosuppression. The results obtained in this thesis suggest IL-10 as a
probable causative link between plasmacytosis and immunodeficiency, and encourage
further studies in autoimmune and neoplastic conditions like SLE and multiple myeloma
where patients also suffer from severe bacterial infections.
ABSTRACT
2
Abstract
Hintergrund: Die Aktivierung von B-Zellen führt zur Ausbildung von Plasmazellen und
der Sekretion von Antikörpern, die einerseits für einen ausreichenden Immunschutz
erforderlich sind, andererseits aber auch Immunkomplexe initiieren können, die zu
einer gewebedestruierenden Entzündung führen können. Aktivierte B-Zellen wirken
auch modulierend auf das Immunsystem, indem sie Zytokine, wie das stark
immunsuppressive Interleukin (IL)-10, produzieren. Die Produktion von IL-10 durch
Plasmazellen wurde bereits in einigen Studien beschrieben. Jedoch ist noch ungenügend
über dessen Wirkung auf die Zellen des angeborenen und erworbenen Immunsystems
bekannt. In dieser Arbeit wurde die IL-10-Expression in normalen und in neoplastischen
Plasmazellen beobachtet und die Wirkung der starken Plasmazellantwort
(Plasmazytose), vor allem in Hinsicht auf die Complement-Faktor 5a getriggerte
Migration von neutrophilen Granulozyten untersucht.
Ergebnisse: Die spezifische Aktivierung von B-Zellen wurde durch die Injektion von
goat anti-mouse Immunoglobulin (Ig)D (GMD) erreicht, wobei es zur Quervernetzung
der B-Zellrezeptoren kam. Diese Injektion von GMD führte zur einer massiven Plasma-
Zell-Antwort und einer gesteigerten Produktion von IL-10 vor allem durch Plasmazellen
/ Plasma-Zell-Vorläufer und durch FoxP3+ und FoxP3- CD4+ T-Zellen. Daher ist
anzunehmen, dass die primäre Aktivierung von B-Zellen eine massiven IL-10-Antwort
zur Folge hat. In Mäusen induziert dieses Plasmozytose-assoziierte IL-10 eine
Dysfunktion der Neutrophilen und unterdrückt die Einwanderung derselben in das
Peritoneum, in das vorher das Anaphylatoxin C5a injiziert wurde. Die Neutrophilen-
Migration wurde auch durch IL-10 im Modell des multiplen Myeloms unterdrückt. Ein
In-vitro-Test zeigte, dass IL-10 direkt die C5a getriggerte Einwanderung von
Neutrophilen hemmt. Darüber hinaus verhinderte das aus B-Zell Aktivierung
resultierende IL-10 effektiv eine Autoantikörper / Immunkomplex initiierte und
Neutrophilen vermittelte Entzündung der Haut.
Fazit: Die im Zuge einer schweren Infektion und Autoimmunkrankheit beobachtete
massive Plasmazellantwort kann zu ungewollten Immunkomplexen und durch
Neutrophile vermittelte Entzündungsreaktionen und Gewebszerstörungen führen. Dem
jedoch steht ein begrenzter, bislang unbekannter IL-10 Feedback Mechanismus
entgegen, der wiederum durch B-Zell-Aktivierung und Plasmazelldifferenzierung
initialisiert wird. Andererseits könnte das IL-10 der Plasmazellen auch zur

ABSTRACT
3
Immunsuppression beitragen. Die Ergebnisse dieser Arbeit weisen auf eine potenzielle
kausale Verbindung zwischen Plasmazytose und Immundefizienz hin und regen weitere
Versuche an, welche die neoplastischen und Autoimmunerkrankungen, wie multiples
Myelom und SLE, untersuchen könnten, bei denen Patienten eine erhöhte Anfälligkeit
gegenüber schweren bakteriellen Infektionen aufweisen.

INTRODUCTION
4
1. Introduction
1.1 Immune System
The immune system comprises of enormous variety of cells and molecules that provide
defense against limitless variety of invading pathogens and maintains tissue
homeostasis in an organism. These cells and molecules act together in a dynamic
network to specifically recognize foreign pathogens and to mount an effector response
to eliminate the pathogen and protect against disease. In some circumstances, disorders
can arise due to defects in the immune system, e.g. autoimmune diseases can occur
when the immune system turns against its own host and immunodeficiency can arise
when certain elements of the immune system are less active than normal.
1.2 Innate and Adaptive Immunity
The immune system can be broadly classified into innate and adaptive components. The
innate immune system is an organism’s first line of defense against foreign pathogen. It
provides an immediate but less specific response. It is found in all plants and animals.
The innate immune system comprises of physical barriers like skin and mucous
membrane that lines the respiratory, alimentary and urogenital tracts, physiological
barriers like temperature and pH, soluble factors like serum proteins called
complement, and certain white blood cells (leukocytes) such as monocytes,
macrophages and neutrophils. These cells are also called ‘phagocytes’ a term coined by
Elie Metchnikoff in 1883, since they can engulf (phagocytose) a foreign pathogen and
destroy it by activity of digestive enzymes or free radicals. The components of the innate
immunity exhibit the property of ‘pattern recognition’ i.e. they have the ability to
recognize certain class of molecules that are unique to pathogens e.g. lipopolysaccharide
(LPS) present in the cell wall of Gram-negative bacteria. Molecules with pattern
recognition ability can be soluble like complement system or they may be cell surface
receptors e.g. Toll-like receptors (TLRs). If a pathogen successfully evades the innate
immune defense, a more complex immune response called ‘adaptive immune response’
is activated in vertebrates. In this case, the immune system improves its response by
recognizing the pathogen (commonly referred as antigen) with a high degree of
specificity. The adaptive immune response is also retained in an organism in the form of
immunological memory, i.e. exposure to the same antigen in future leads to a rapid,
heightened response generated immediately by the components of the adaptive immune
INTRODUCTION
5
system. Lymphocytes are a type of white blood cells that play a major role in both
primary and memory adaptive immune response. The innate and adaptive systems work
in cohesion to eliminate a foreign invader and provide protection.
1.3 Organs of the immune system
The mammalian immune system consists of many different organs spread across the
entire body. Functionally these organs can be mainly classified as primary and
secondary lymphoid organs that are connected by blood and lymphatic vessels. Primary
lymphoid organs provide appropriate microenvironment for the production,
development and maturation of the immune system. These include bone marrow and
thymus. All blood cells including the white blood cells which are the cells of the immune
system arise from hematopoietic stem cells residing in the bone marrow. Secondary
lymphoid organs such as spleen, various lymph nodes, mucosal associated lymphoid
tissue (MALT), serve mainly as antigen capturing sites, where the mature lymphoid cells
can interact with an antigen.
1.4 B and T lymphocytes
B and T lymphocytes are the two major populations of cells that play significant role in
an adaptive immune response. Both B and T cells are generated in the bone marrow
from hematopoietic stem cells. While B cells develop and mature within bone marrow
and spleen [1], T cells migrate to thymus gland to mature. During maturation the
lymphocytes undergo negative selection i.e. the cells that can recognize self-antigens are
deleted, edited or become functionally anergic (unable to mount an immune response).
This selection process helps to ensure that self-reactive cells are not produced. Mature B
and T cells then circulate in blood and lymphatic system and reside in various lymphoid
organs. Both B and T cells carry unique receptor molecules that identify a specific
foreign molecule also called an antigen. These receptors can bind to a vast array of
antigens including those displayed on the surface of pathogens as well as soluble
proteins, glycoproteins, polysaccharides and lipopolysaccharides that have been
secreted from pathogens. The antigen binding receptor on B cells called ‘B cell receptor’
(BCR) or membrane bound antibody can directly identify an antigen alone, but the ‘T cell
receptor’ (TCR) present on T cells can recognize only antigen that is bound to special cell
membrane glycoproteins called major histocompatibility complex (MHC) molecules.
This recognition event is termed as ‘antigen presentation’, after which a T cell gets
INTRODUCTION
6
activated and proliferates into memory T cells and various effector T cells. T cells are
further mainly classified into two subpopulations: T helper (Th) cells and T cytotoxic
(Tc) cells, which can be distinguished between each other by the presence of either CD4
or CD8 glycoprotein on their surface respectively. While CD8 T cells (Tc cells) recognize
antigen bound to class I MHC molecules that are expressed by all nucleated cells of
vertebrate species, T cells bearing CD4 (Th cells) recognize antigen bound to class II
MHC molecules that are expressed only by special antigen presenting cells (APCs) such
as B cells, dendritic cells and macrophages.
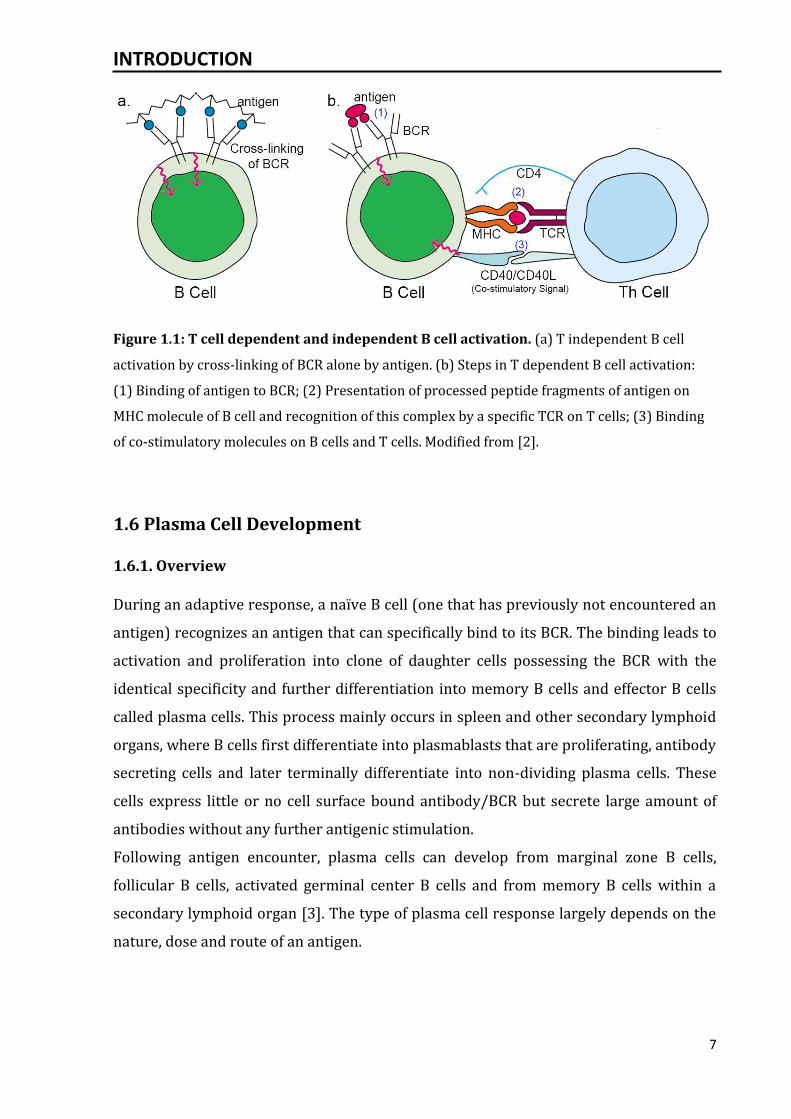
1.5 T dependent and T independent B cell activation
Depending on the nature of an antigen, B cell activation takes place in two different
ways: one that is dependent on Th cells and one that is independent of Th cells. The B
cell activation where direct contact with Th cells is required is called T-dependent
activation. This is a complex process where following sequence of events takes place.
The antigen first binds to BCR followed by internalization of the complex. It is then
degraded and the processed peptide fragments are represented on the MHC molecules
of B cells. The antigen-MHC complex is recognized by Th cells and they get activated due
to the antigen specific and other co-stimulatory signals. Thus, a T-B complex is formed
and the direct contact with Th cells along with cytokines produced by them activates B
cells which later proliferate and differentiate.
Sometimes, the binding of antigen itself is enough to effectively activate B cells without
any need of binding of the co-stimulatory molecules on the surface of the B cells with T
cells. In this case, B cells are activated via BCR in combination with signals transduced
from pattern recognition receptors like TLRs or via cross-linking of BCRs alone by
repetitive structures. The antigens able to induce a T-independent B cell response
include LPS from bacterial cell wall or complex molecules with repetitive patterns like
polymeric proteins e.g. bacterial flagellin.
INTRODUCTION
7
Figure 1.1: T cell dependent and independent B cell activation. (a) T independent B cell
activation by cross-linking of BCR alone by antigen. (b) Steps in T dependent B cell activation:
(1) Binding of antigen to BCR; (2) Presentation of processed peptide fragments of antigen on
MHC molecule of B cell and recognition of this complex by a specific TCR on T cells; (3) Binding
of co-stimulatory molecules on B cells and T cells. Modified from [2].
1.6 Plasma Cell Development
1.6.1. Overview
During an adaptive response, a naïve B cell (one that has previously not encountered an
antigen) recognizes an antigen that can specifically bind to its BCR. The binding leads to
activation and proliferation into clone of daughter cells possessing the BCR with the
identical specificity and further differentiation into memory B cells and effector B cells
called plasma cells. This process mainly occurs in spleen and other secondary lymphoid
organs, where B cells first differentiate into plasmablasts that are proliferating, antibody
secreting cells and later terminally differentiate into non-dividing plasma cells. These
cells express little or no cell surface bound antibody/BCR but secrete large amount of
antibodies without any further antigenic stimulation.
Following antigen encounter, plasma cells can develop from marginal zone B cells,
follicular B cells, activated germinal center B cells and from memory B cells within a
secondary lymphoid organ [3]. The type of plasma cell response largely depends on the
nature, dose and route of an antigen.
INTRODUCTION
8
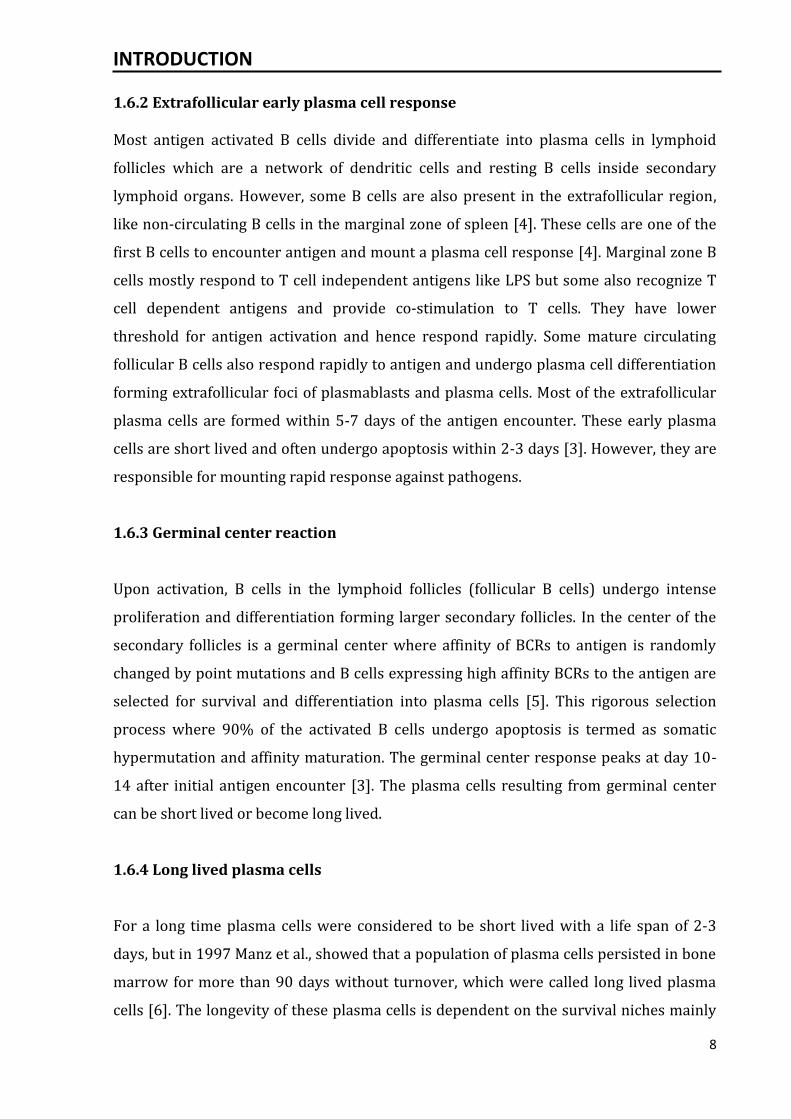
1.6.2 Extrafollicular early plasma cell response Most antigen activated B cells divide and differentiate into plasma cells in lymphoid
follicles which are a network of dendritic cells and resting B cells inside secondary
lymphoid organs. However, some B cells are also present in the extrafollicular region,
like non-circulating B cells in the marginal zone of spleen [4]. These cells are one of the
first B cells to encounter antigen and mount a plasma cell response [4]. Marginal zone B
cells mostly respond to T cell independent antigens like LPS but some also recognize T
cell dependent antigens and provide co-stimulation to T cells. They have lower
threshold for antigen activation and hence respond rapidly. Some mature circulating
follicular B cells also respond rapidly to antigen and undergo plasma cell differentiation
forming extrafollicular foci of plasmablasts and plasma cells. Most of the extrafollicular
plasma cells are formed within 5-7 days of the antigen encounter. These early plasma
cells are short lived and often undergo apoptosis within 2-3 days [3]. However, they are
responsible for mounting rapid response against pathogens.
1.6.3 Germinal center reaction
Upon activation, B cells in the lymphoid follicles (follicular B cells) undergo intense
proliferation and differentiation forming larger secondary follicles. In the center of the
secondary follicles is a germinal center where affinity of BCRs to antigen is randomly
changed by point mutations and B cells expressing high affinity BCRs to the antigen are
selected for survival and differentiation into plasma cells [5]. This rigorous selection
process where 90% of the activated B cells undergo apoptosis is termed as somatic
hypermutation and affinity maturation. The germinal center response peaks at day 10-
14 after initial antigen encounter [3]. The plasma cells resulting from germinal center
can be short lived or become long lived.
1.6.4 Long lived plasma cells
For a long time plasma cells were considered to be short lived with a life span of 2-3
days, but in 1997 Manz et al., showed that a population of plasma cells persisted in bone
marrow for more than 90 days without turnover, which were called long lived plasma
cells [6]. The longevity of these plasma cells is dependent on the survival niches mainly
INTRODUCTION
9
present in bone marrow [7]. The survival niches comprise of distinct cytokines,
chemokines and cell surface receptors that help in the maintenance of plasma cells in a
tissue [7]. There is also some evidence suggesting that long lived plasma cells are
present in spleen [8]. Long lived plasma cells are responsible for long term production of
antibodies. While, this is good to maintain humoral immunity against most pathogens,
continuous production of antibodies against self-antigens can cause chronic
autoimmune diseases, e.g. systemic lupus erythematosus (SLE) [9].
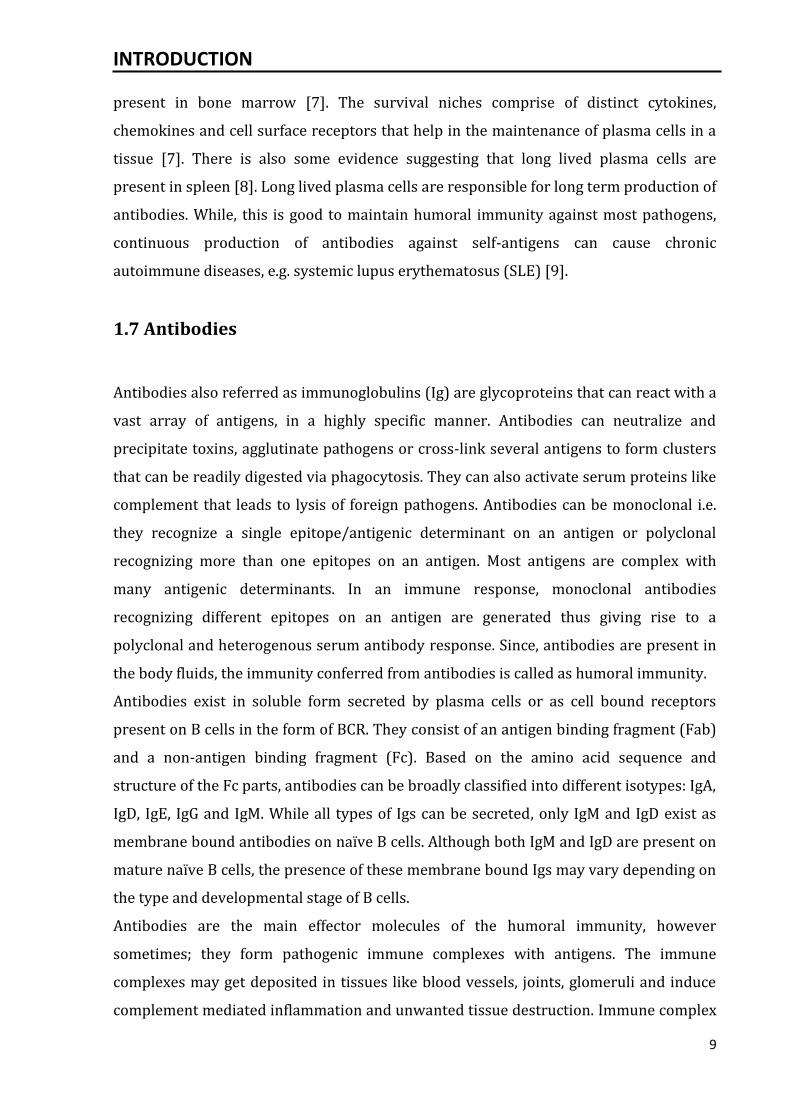
1.7 Antibodies
Antibodies also referred as immunoglobulins (Ig) are glycoproteins that can react with a
vast array of antigens, in a highly specific manner. Antibodies can neutralize and
precipitate toxins, agglutinate pathogens or cross-link several antigens to form clusters
that can be readily digested via phagocytosis. They can also activate serum proteins like
complement that leads to lysis of foreign pathogens. Antibodies can be monoclonal i.e.
they recognize a single epitope/antigenic determinant on an antigen or polyclonal
recognizing more than one epitopes on an antigen. Most antigens are complex with
many antigenic determinants. In an immune response, monoclonal antibodies
recognizing different epitopes on an antigen are generated thus giving rise to a
polyclonal and heterogenous serum antibody response. Since, antibodies are present in
the body fluids, the immunity conferred from antibodies is called as humoral immunity.
Antibodies exist in soluble form secreted by plasma cells or as cell bound receptors
present on B cells in the form of BCR. They consist of an antigen binding fragment (Fab)
and a non-antigen binding fragment (Fc). Based on the amino acid sequence and
structure of the Fc parts, antibodies can be broadly classified into different isotypes: IgA,
IgD, IgE, IgG and IgM. While all types of Igs can be secreted, only IgM and IgD exist as
membrane bound antibodies on naïve B cells. Although both IgM and IgD are present on
mature naïve B cells, the presence of these membrane bound Igs may vary depending on
the type and developmental stage of B cells.
Antibodies are the main effector molecules of the humoral immunity, however
sometimes; they form pathogenic immune complexes with antigens. The immune
complexes may get deposited in tissues like blood vessels, joints, glomeruli and induce
complement mediated inflammation and unwanted tissue destruction. Immune complex
INTRODUCTION
10
mediated tissue destruction is often observed in autoimmune diseases like SLE and
rheumatoid arthritis [10].
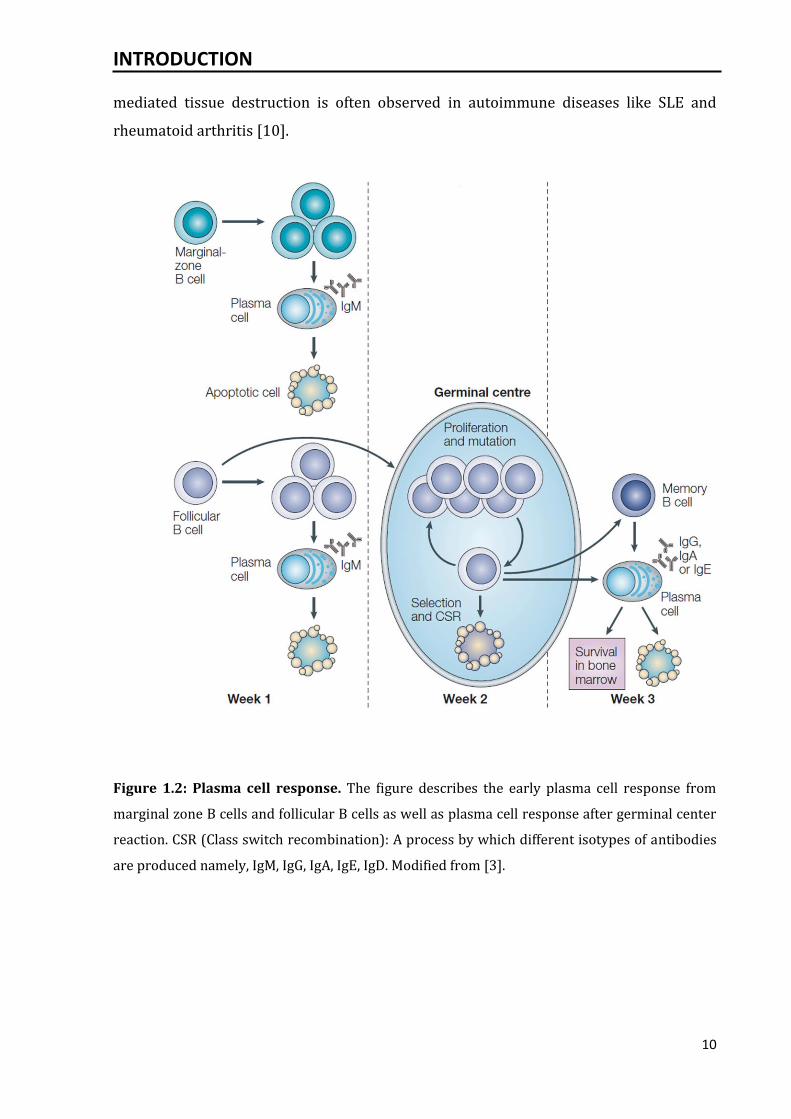
Figure 1.2: Plasma cell response. The figure describes the early plasma cell response from
marginal zone B cells and follicular B cells as well as plasma cell response after germinal center
reaction. CSR (Class switch recombination): A process by which different isotypes of antibodies
are produced namely, IgM, IgG, IgA, IgE, IgD. Modified from [3].
INTRODUCTION
11
1.8 Cytokines
Cytokines are a group of proteins secreted by white blood cells and also other cells of
the body, in response to various stimuli. They play a major part in cell-to-cell
communication, thus regulating the complex interaction among various cells of the
immune system. The binding of cytokine to its specific receptor on a target cell, initiates
a signal transduction pathway that ultimately alters gene expression in the target cell.
Cytokines and their receptors exhibit very high affinity towards each other. Therefore,
cytokines can mediate their biological effects on a target cell at picomolar
concentrations. A particular cytokine may bind to its receptor on the same cell that
secreted it (autocrine action), or it can bind to a target cell in the close vicinity
(paracrine action) or in few cases it may also bind to target cells present in the distant
parts of the body (endocrine action). Cytokines also exhibit the properties of pleiotropy,
synergy, redundancy, antagonism and in some cases cascade induction. A cytokine that
can exert different biological effects on different target cells is termed as pleiotropic.
Cytokines are called synergic when the combined effect of two or more cytokines is
more efficient than the effect of an individual cytokine. Cytokine redundancy occurs
when two cytokines mediate similar functions and antagonism occurs when one
cytokine inhibits the effect of another. Binding of a cytokine to its receptor also leads to
expression of more receptors on the target cell and secretion of cytokines that affect
other target cells, thus leading to a cascade of reactions which eventually influence
numerous cells involved in an immune response.
The type of immune response is highly dependent on the pattern of cytokines produced
by Th or other immune cells since cytokines can regulate the activation, differentiation
and proliferation of various cells. There are over 200 different types of cytokines, most
of which can be included in one of the following families: interleukins (IL), interferons
(IFN), tumor necrosis factors (TNF), hematopoietins and chemokines. While some
cytokines are broadly known to activate the overall immune response, e.g. IFN-γ, IL-17;
cytokines like IL-10 and transforming growth factor (TGF)β have been known to
regulate immunity by predominantly playing a general suppressive role in the overall
immune response.
Based on the type of cytokine expressed by a particular Th cell, the Th cells can be
classified into Th1, Th2, and Th17 cells. The pattern of cytokines secreted by Th cells
largely governs the immune response towards a particular antigenic challenge. IFN-γ,
INTRODUCTION
12
IL-2, TNF-β are the defining cytokines of the Th1 subset and their secretion accounts for
the association of Th1 cells with an inflammatory phenotype [11]. IL-4 and IL-5 are the
characteristic cytokines secreted by Th2 cells. A Th2 response is often seen in case of
helminth infections and allergies. IL-17, a cytokine shown to play major role in tissue
damage especially in autoimmunity is secreted by Th17 cells [12].
Since cytokines can significantly modulate various immune responses by regulating the
development of immune cells and inflammation, therapies targeting cytokines or
cytokine receptors are becoming increasingly common in clinical practice. E.g.
Recombinant human interleukin-11 (Oprelvekin) is used to stimulate production of
platelets [13], Infliximab (Trade name: Remicade): a monoclonal antibody against TNF-α
receptor is used to treat autoimmune diseases like rheumatoid arthritis [14] and
Crohn’s disease [15].
1.8.1 IL-10
IL-10 is mainly regarded as an anti-inflammatory cytokine with multiple functions on
various hematopoietic cell types. It has been shown to be expressed by various cells of
the immune system including T cells, neutrophils, keratinocytes, monocytes, mast cells
and B cells [16]. It was initially described as cytokine synthesis inhibitory factor and
recognized for its capacity to inhibit activation of and cytokine production by Th1 cells
[17]. It can suppress synthesis of pro-inflammatory cytokines like IFN-γ, IL-2,
granulocyte monocyte cell stimulating factor (GMCSF), TNF-α [18]. The action of IL-10
on T cells is indirect via inhibition of antigen presentation ability of cells by down-
regulating MHC and co-stimulatory molecules such as CD80/CD86 [17, 19, 20]. It
mediates its regulatory effects by high affinity binding with a special receptor expressed
on the surface of the cells called IL-10 receptor. In addition to its anti-inflammatory
activities, IL-10 can also regulate growth and differentiation of B cells, dendritic cells, T
cells, tumor cells and granulocytes [21]. The principle function of this cytokine, however,
is to reduce the magnitude of an inflammatory response as shown by various studies in
IL-10 deficient mice which show exaggerated inflammatory conditions, e.g. mice lacking
IL-10 develop enterocolitis and other symptoms similar to Crohn’s disease [22].
Due to its potent anti-inflammatory properties, IL-10 has attracted much attention for
potential clinical application in reducing the unwanted hyperactive immune responses.
For instance, treatment of Crohn’s disease patients with transgenic bacteria expressing
INTRODUCTION
13
human IL-10 led to decrease in the disease activity [23]. However, IL-10 therapy has led
to only modest clinical responses possibly due to instability of IL-10 in patients [18]. The
clinical manipulation of IL-10 needs to be carefully regulated as long-term application of
IL-10 could cause immunodeficiency, while continuous blocking of IL-10 may lead to
hyperimmune responses. Nevertheless, various studies have shown that the modulation
of IL-10 holds great promise as therapy [21]. Some investigations in the past decade also
demonstrate the effectiveness of modulation of IL-10 producing cells mostly regulatory
T cells and regulatory B cells in treatment of inflammatory conditions [24, 25].
1.9 Regulatory T cells
Over the past 30 years many different subsets of T cells have been identified. Among
them are regulatory T cells (Tregs) that play crucial role in maintenance of
immunological self-tolerance (unresponsiveness of the immune system to self-antigens),
regulation of immune response and prevention of autoimmunity [25]. The first
indication of a subtype of T cells with a regulatory/suppressive function came when it
was shown that inoculation of normal CD4+CD8- thymocytes in animals that have
undergone thymectomy inhibits autoimmunity that is observed post-thymectomy [26].
Since then various studies have shown correlation between the absence in development
and/or function of Tregs and development of autoimmunity in different mouse models
as well as humans [27]. Initial studies identified Tregs as CD25+CD4+ cells since transfer
of T cells depleted of CD25+ T cells led to autoimmune disease in athymic nude mice
whereas transfer of CD25+CD4+ T cells inhibited autoimmunity [28]. In 2003, Hori et al.,
identified a transcription factor specific for Tregs namely forkhead box P3 (Foxp3) [29].
Besides the naturally occurring Tregs that arise as functionally mature cells from
thymus, naïve T cells can also be induced to become Foxp3+ Tregs in the periphery. Such
induction is usually dependent on the presence of particular cytokines. E.g. in vitro
antigenic stimulation of naïve T cells in the presence of TGF-β, IL-2 and retinoic acid
leads to Foxp3+ Treg induction [30-32]. The induction of Tregs in the periphery can also
be hampered by presence of certain cytokines like IL-6, which usually leads to
transformation of naïve T cells into IL-17 producing pro-inflammatory T cells instead of
Tregs [33].
Apart from the Foxp3+ Tregs, there are other types of regulatory T cells that can be
induced in the periphery. For instance, the IL-10 and TGF-β secreting CD4+ T cells called
INTRODUCTION
14
type 1 regulatory T cells (Tr1) cells that are induced in vitro by antigenic stimulation of
naïve T cells in the presence of IL-10. Tr1 cells do not express Foxp3, yet they act as
regulatory T cells [34].
Different mechanisms have been suggested for the suppressive action of Tregs. The data
taken together from various studies suggest that antigen specific Tregs swiftly migrate
toward APCs and inhibit binding of antigen specific naïve T cells to APCs, thus
suppressing the proliferation and differentiation of naïve T cells into effector T cells
[27]. Additionally, Tregs can also inhibit effector functions of B cells, dendritic cells, NK
cells and osteoclasts via cell contact dependent suppression or via immunosuppressive
cytokines like IL-10 and TGF- β (reviewed in [27]).
Induction or depletion of Tregs for attenuation of various immune mediated diseases
has been a focus of clinical research in the past decade. Manipulation of balance between
T effector cells and Tregs has been tried in some studies to control physiological and
pathological conditions [33, 34]. Biological drugs like monoclonal antibodies targeting
antigens differentially expressed on Tregs and T effector cells could be used as a
therapeutic strategy to control this balance.
1.10 B lineage Cells as Cytokine Producing Cells
Many different studies have suggested that B cells regulate adaptive immunity by
provision of cytokines. While B cells have been shown to produce different cytokines
like IL-6 [35], IL-17 [36], TGF-β [37]; the most extensively studied B cell derived
cytokine in mouse models as well as in humans is IL-10.
1.10.1 Regulatory B cells
For a long time immunologists were interested in cellular and molecular mechanisms
underlying the induction of immune response via B cells. However, in the past decade
there has been significant increase in the studies demonstrating the negative regulation
of immune response by B cells especially by provision of a well-known
immunosuppressive cytokine: IL-10. The IL-10 expressing B cells have been termed
‘regulatory B cells’ (Bregs) since they can negatively regulate immune responses [38].
Bregs have been shown to attenuate autoimmune conditions like rheumatoid arthritis,
multiple sclerosis, lupus as well as allergies in different mouse models and in humans
[24]. The regulatory role played by B cells can also explain the exacerbated disease
INTRODUCTION
15
observed after rituximab treatment in humans in case of ulcerative colitis [39] and
psoriasis [40] and also in a mouse model for multiple sclerosis [41].
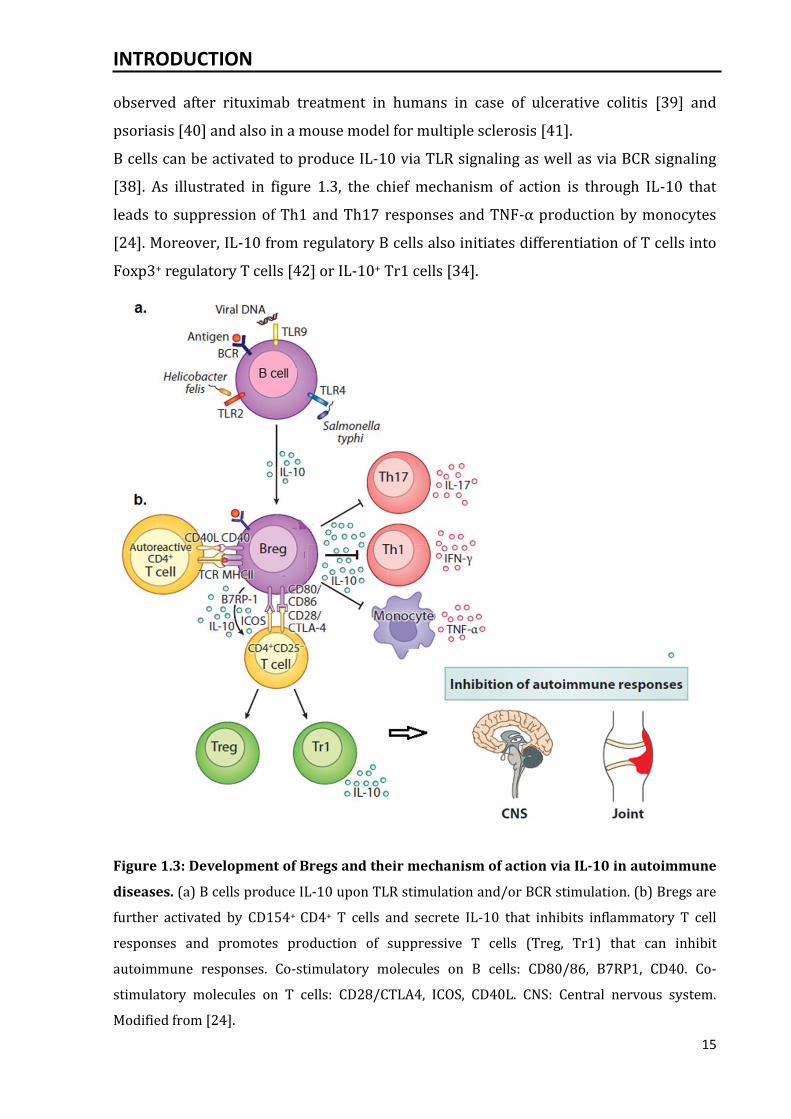
B cells can be activated to produce IL-10 via TLR signaling as well as via BCR signaling
[38]. As illustrated in figure 1.3, the chief mechanism of action is through IL-10 that
leads to suppression of Th1 and Th17 responses and TNF-α production by monocytes
[24]. Moreover, IL-10 from regulatory B cells also initiates differentiation of T cells into
Foxp3+ regulatory T cells [42] or IL-10+ Tr1 cells [34].
Figure 1.3: Development of Bregs and their mechanism of action via IL-10 in autoimmune
diseases. (a) B cells produce IL-10 upon TLR stimulation and/or BCR stimulation. (b) Bregs are
further activated by CD154+ CD4+ T cells and secrete IL-10 that inhibits inflammatory T cell
responses and promotes production of suppressive T cells (Treg, Tr1) that can inhibit
autoimmune responses. Co-stimulatory molecules on B cells: CD80/86, B7RP1, CD40. Co-
stimulatory molecules on T cells: CD28/CTLA4, ICOS, CD40L. CNS: Central nervous system.
Modified from [24].
INTRODUCTION
16
Different phenotypes have been associated with immunoregulatory functions of B cells
[24]. Some studies in mice characterize regulatory B cells with the CD1dhiCD5+CD19hi
phenotype [43] while some other studies suggest them to have
CD1dhiCD21hiCD23hiCD24hiIgMhiIgDlo phenotype [44]. Due to such different phenotypes
suggested by various studies, it is not clear if these IL-10 producing B cells are a specific
subtype of B cells or certain developmental stages induced under various immunological
conditions. Interestingly, one prominent mouse regulatory B cell type characterized by
CD1dhiCD5+CD19hi phenotype was shown to resemble plasma cell precursors [45].
1.10.2 Some indications of plasma cell IL-10
Other studies provide evidence that IL-10 expression is not only detectable in plasma
cell precursors but maintained at least to an early plasma cell stage. In an attempt to
convert naïve spleen B cells from mice into regulatory B cells using a fusokine of GM-CSF
and IL-15 called GIFT-15, it was shown that the developed regulatory B cells
upregulated the plasma cell marker CD138 and downregulated the transcription factor
PAX5 which is required for development and maintenance of a B cell phenotype but lost
in plasma cells [46]. In an another study, by using the IL-10 transcriptional eGFP-
reporter Vert-X mice it was shown that B cells with a plasmablast/plasma cell
phenotype predominantly express IL-10 in peripheral lymphoid tissues [16]. In the
same study the lack of B cell derived IL-10 increased virus specific CD8+ T cells and
plasma cell numbers during murine cytomegalovirus infection. Hence, suggesting that
the IL-10 from plasma cells has an impact on the cytotoxic T cell response. Whether IL-
10 from plasmablasts/plasma cells acts directly on T cells or provides an immune
regulatory activity at the level of other antigen presenting cells, is not yet known. IL-10+
CD138hi plasma cells also develop in mice one day post Salmonella infection. Mice
lacking IL-10 specifically in B cells display improved survival after infection with this
pathogen. Together, these data suggest that IL-10 from plasma cells may suppress
immunity against the infection [47]. Apart from infection models the IL-10+ plasma cells
are observed in Lyn kinase deficient mice that develop autoimmune disease similar to
SLE [48]. In IL-10 reporter lyn knockout (KO) mice, CD138hi plasma cells are the
producers of IL-10. Adoptive transfer of CD19+ B cells from wild-type (WT) but not from
IL-10 KO mice reduces lupus like disease in lyn deficient mice suggesting that the
protective effect from B cells is IL-10 dependent.
INTRODUCTION
17
B cells and plasma cells were so far primarily considered as playing a pivotal role in
initiating an adaptive immune response through production of antibodies. However, as
discussed above, studies performed primarily in the last decade have demonstrated an
even more significant role played by these cells as drivers and regulators of immunity
via secretion of cytokines like IL-10. These functions of B lineage cells have helped us in
a better understanding of the various different inflammatory conditions. So far, most of
the studies discussed above were not able to clearly distinguish between plasmablasts
and plasma cells. Because both cell types differ in their susceptibility to
immunomodulatory drugs, such discrimination would be important to become an idea
about the possible impact of therapy on plasmablast/plasma cell derived cytokines.
Further investigations could provide potential therapies and drug targets for the
treatment of infectious diseases, autoimmune conditions and cancer.
Note: The section 1.10 has been taken from a self-written review [8].
1.11 Plasmacytosis and Associated Immune Deficiency
Although plasma cells are crucial for an effective immune response, their uncontrolled
production can also lead to pathological conditions like autoimmunity and multiple
myeloma. Under physiological conditions and in the absence of severe infections plasma
cell frequencies are tightly limited, not exceeding approximately 0.5% of all nucleated
cells in bone marrow and peripheral lymphoid tissues. However, plasmacytosis – an
increase of plasma cell frequencies above the homeostatic level – may occur during
severe infectious diseases like human immunodeficiency virus (HIV) infection and
dengue [49, 50], autoimmune disorders such as SLE [51, 52], and in plasma cell
neoplasia such as multiple myeloma [53].
These conditions are also associated with multiple immunological defects leading to
increased susceptibility to severe infections which resemble the leading cause of death
in multiple myeloma [54], and remain a clinical problem in SLE [55]. Although therapy
based immunosuppression contributes to this effect, SLE and multiple myeloma are also
directly associated with immune defects [54, 55], but the underlying mechanisms are
only poorly understood.
INTRODUCTION
18
1.11.1 Multiple myeloma and associated immune suppression
Multiple myeloma is a tumor of plasma cells, in which the cancerous plasma cells
accumulate in the bone marrow and interfere with the production of normal blood cells.
This further leads to anaemia, skeletal destruction, hypercalcaemia, increase in serum
antibodies (monoclonal gammopathy), renal failure, immune suppression and infection.
Bone marrow microenvironment plays a crucial role in myeloma pathogenesis. Myeloma
cells interact with bone marrow stromal cells via adhesion molecules and cytokine
networks to promote their survival, drug resistance and angiogenesis. E.g. cytokines that
promote myeloma growth and maintenance include TGF-β, IL-10, IL-6 [56-58]. Myeloma
cells produce TGF-β which inhibits T cell responses against tumor cells by suppression
of IL-2 autocrine pathway in T cells and stimulation of Treg proliferation [57]. IL-6 is
produced by bone marrow stromal cells and induces a paracrine myeloma growth by
inducing Th2 polarization and inhibiting anti-tumor Th1 responses [59].
Immune dysfunction is the major feature of the disease and leads to infectious diseases;
particularly bacterial infections are the leading cause of death in multiple myeloma
patients [54]. Common infectious agents during myeloma pathogenesis include S.
aureus, S. pneumoniae, H. influenzae, E. coli and other Gram-negative bacteria. The risk of
infection is highest during active disease when patients are most immunosuppressed
due to disease as well as immunosuppressive treatment. The immune defects during
myeloma are seen in dendritic cells, B cells, CD4 and CD8 T cells, natural killer cells
(reviewed from [60]). Although the total Ig level is increased during multiple myeloma,
most of the Igs are monoclonal antibodies from the clonal plasma cells which are
ineffective in fighting the infection. The various factors underlying the increased
susceptibility of myeloma patients to infections include hypogammaglobulinaemia,
impaired lymphocyte function, steroid-related immunosuppression and neutropenia
secondary to chemotherapy or marrow infiltration. Some studies also suggest the
potential role of infections in the growth and survival of myeloma. Human myeloma cells
express a range of TLRs and the stimulation of these receptors by pathogen associated
molecular patterns induces tumor growth and inhibits apoptosis via triggering an
autocrine IL-6 pathway [61]. Since infections are the main cause of morbidity and
mortality among myeloma patients, in depth studies dealing with the immune defects
underlying these infections and potential therapies targeting them would be useful.
INTRODUCTION
19
1.12 Complement System
As mentioned in section 1.2, complement is a group of serum proteins that circulate in
an inactive state. The term ‘complement’ was coined by Paul Ehrlich defining the action
of these serum proteins as ‘complementing the role of antibodies’. The biological
activities of this system immensely affect both innate and adaptive immunity as the
deficiency of complement components has been associated with high degree of
infections as well as complex diseases like SLE [62]. Complement system can be
activated either by direct interaction of complement molecules with certain components
of microbial cell wall or it can be triggered by binding of antibodies to certain cell
surfaces and immune complex formation. The activation of the system leads to a cascade
of reactions among the complement proteins (classical pathway, alternative pathway
and lectin pathway) that eventually leads to effective eradication of pathogens from the
body. Once activated by proteolytic cleavage, complement proteins can damage the cell
wall of the pathogens and destroy them or facilitate their clearance via phagocytosis.
Reaction of complement molecules with certain cell receptors can also trigger migration
(chemotaxis) of the cells of the immune system towards the site of infection or injury.
The complement components are designated with numerals (C1-C9), and peptide
fragments formed by activation of a component are denoted with small letters. The
small fragment formed after the cleavage of the component is termed as ‘a’ while the
larger fragment termed ‘b’. The larger fragments bind to a nearby target, whereas the
smaller fragments diffuse from the site.
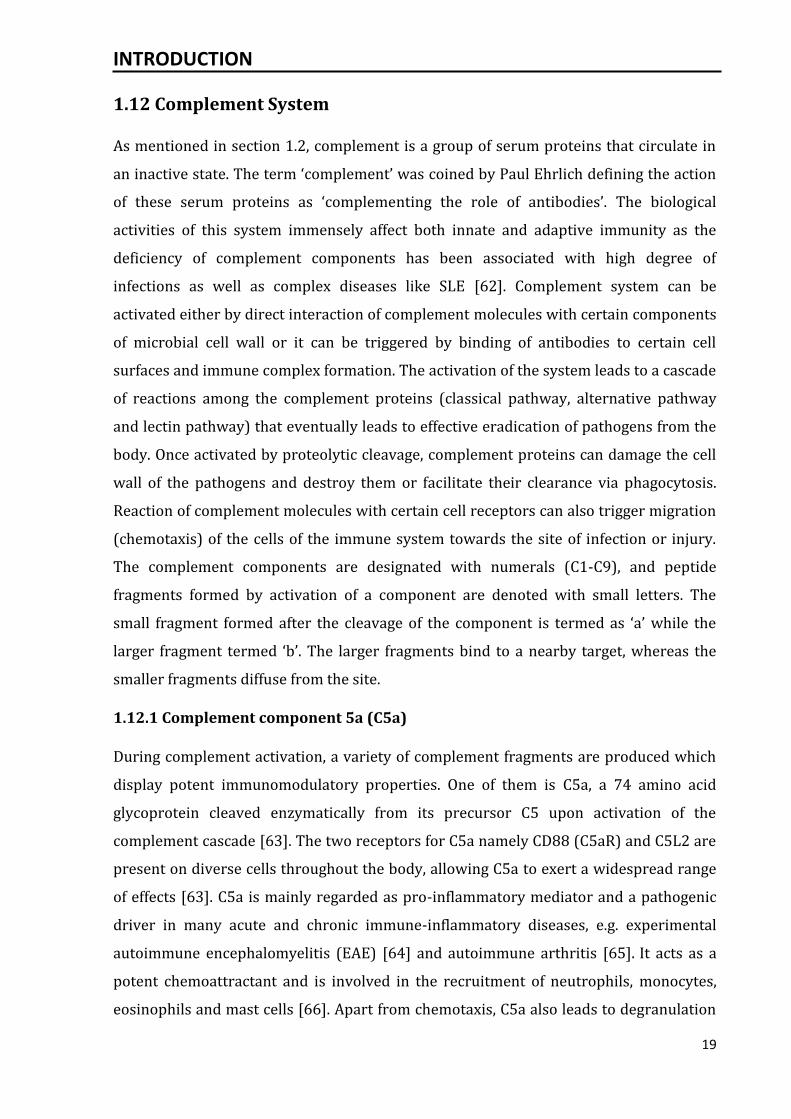
1.12.1 Complement component 5a (C5a)
During complement activation, a variety of complement fragments are produced which
display potent immunomodulatory properties. One of them is C5a, a 74 amino acid
glycoprotein cleaved enzymatically from its precursor C5 upon activation of the
complement cascade [63]. The two receptors for C5a namely CD88 (C5aR) and C5L2 are
present on diverse cells throughout the body, allowing C5a to exert a widespread range
of effects [63]. C5a is mainly regarded as pro-inflammatory mediator and a pathogenic
driver in many acute and chronic immune-inflammatory diseases, e.g. experimental
autoimmune encephalomyelitis (EAE) [64] and autoimmune arthritis [65]. It acts as a
potent chemoattractant and is involved in the recruitment of neutrophils, monocytes,
eosinophils and mast cells [66]. Apart from chemotaxis, C5a also leads to degranulation
INTRODUCTION
20
and activation of oxidative metabolism in neutrophils, basophils, mast cells and
monocytes [66]. Moreover, C5a causes histamine release, smooth muscle contraction
and enhanced vascular permeability [63]. Role of C5a has also been shown in controlling
the effector T cell responses as absence of C5a signaling in CD4+ T cells leads to
induction of Foxp3+ Tregs through autoinductive TGF-β1 signaling [67]. Also, C5a
signaling promotes Th1 and Th17 response [68]. Due to its potential in amplifying
inflammatory reactions, C5a is considered as an important mediator produced during
complement activation and its role in various pathological conditions has been an
interesting topic of biological research.
1.13 Neutrophils
Life of a neutrophil: Neutrophils are most abundant type of phagocytes that are formed
continuously in bone marrow from myeloid precursors. Their production in the bone
marrow is controlled by garanulocyte colony stimulating factor (G-CSF) which is in turn
under the control of IL-23 synthesized by tissue resident macrophages and dendritic
cells [69]. Morphologically neutrophils can be identified with a multilobed nucleus and a
granulated cytoplasm. They represent 50-70% of the total circulating leukocytes in
humans, whereas only 10-25% in mice. They have relatively a short circulating life span
of 5.4 days in humans and 12.5 h in mice [70]. During inflammation, neutrophils get
activated and their life span increases by several fold, ensuring their presence in the
inflamed tissues. Under physiological conditions, neutrophils are located in bone
marrow, spleen, liver and lung.
Killing Mechanisms: Neutrophils are generally the first leukocytes to migrate at the site
of infection or injury by a process called chemotaxis [70]. They are generally attracted to
the site of inflammation by chemotactic factors that include complement, cytokines
released from various immune cells and the components of the blood clotting system.
Once at the site of inflammation, neutrophils can kill pathogens by both intra- and extra-
cellular means. After encountering a microorganism, neutrophils engulf it and mediate
their phagocytic activity by undergoing respiratory burst. Respiratory burst results in
the activation of oxidases that catalyze the reduction of oxygen to reactive oxygen
species (ROS) that are highly toxic to ingested antigen. The activated neutrophils also
synthesize various hydrolytic enzymes which are responsible for degradation of
INTRODUCTION
21
antigen/pathogen. Highly activated neutrophils can entrap and kill an extracellular
pathogen by releasing neutrophil extracellular traps (NETs) [71]. NETs are made up of
core DNA proteins to which histones, anti-bacterial proteins (like lactoferrins) and
enzymes (e.g. myeloperoxidase, neutrophil elastase) that are released from neutrophil
granules are attached [71].
Role of neutrophils in tissue injury: The deficiency of neutrophils or loss of their
function is often associated with severe immunodeficiency. On the other hand, excessive
neutrophil action and their persistence in the tissues lead to host tissue damage.
Neutrophils are also relevant for driving acute and chronic inflammation associated with
autoimmune diseases [72]. Neutrophil migration to the affected tissue is a prerequisite
for their anti-microbial and pro-inflammatory functions. The complement fragment C5a
belongs to the most potent neutrophil chemoattractants and is formed during the
classical complement cascade initiated by tissue bound antibodies or immune
complexes. Blockade of complement components: C5a, C5aR, C3a or complement
deficiency leads to reduced neutrophil infiltration in certain models of immune complex
mediated diseases [72, 73]. Similarly, a significant role of FcγRs in neutrophil
recruitment is shown by reduced neutrophil migration in Fcγ chain deficient mice in
various models of inflammation [74]. The current understanding of the accumulation of
neutrophils in immune complex mediated inflammation is as follows: (i) resident cells
sense immune complexes through FcγRs and complement receptors, (ii) this induces
chemotactic chemokines which activate endothelial cells, (iii) endothelial cells express
adhesion receptors and surface bound chemokines which results in neutrophil
recruitment through a multi-step process requiring selectin mediated rolling and
integrin mediated adhesion and transmigration (reviewed from [72]).
Antibodies/immune complexes generated in the course of autoimmune diseases or
produced as a byproduct of severe infections such as Schistosoma, malaria or hepatitis C
virus infections are potent activators of complement and neutrophil mediated
inflammation. Accordingly, the arthus reaction that resembles the prototype of an
immune complex mediated inflammation is dependent on both C5a receptor signaling
and neutrophil infiltration and function [73]. Targeting neutrophil trafficking could be a
potential therapeutic strategy in reducing immune complex/complement mediated
inflammation.
INTRODUCTION
22
1.14 Epidermolysis Bullosa Acquisita (EBA)
EBA is a severe chronic autoimmune skin blistering disease in which autoantibodies are
produced against non-collagenous domain (NC-1) of type VII collagen (COL7): a protein
present in the dermal-epidermal junction of skin [75]. COL7 forms anchoring fibrils that
are essential for the adherence of the epidermal layer onto the dermal layer of the skin.
EBA is a rare disease with an incidence of 0.2-0.5 new cases per million, per year [75].
Clinically the disease is characterized by sub-epidermal blistering in skin.
1.14.1 Mouse models for EBA
In the past decade, both active and passive mouse models have been generated to study
the loss of tolerance, pathogenesis and different treatments in EBA.
Passive Model: In the passive transfer model, mice are injected with rabbit antibodies
[76] against murine or human [77] COL7 or affinity purified autoantibodies against
COL7 from EBA patients [78]. The development of skin lesions namely erythema,
formation of blisters, skin erosion and hair loss takes 2-4 days following antibody-
transfer. This model is suitable for investigation of the effector phase of the disease i.e.
autoantibody induced tissue injury.
Active Model: In the active model, mice are immunized with the immunodominant NC-1
domain of COL7. Unlike the passive model, this model can replicate both the
autoimmune response to COL7 as well as the tissue injury and blister formation that
follows the autoantibody induction. The mice show disease symptoms four to five weeks
after the immunization with COL7. Although the injection of this self-antigen leads to
break of tolerance, and production of anti-COL7 autoantibodies in almost all stains, the
tissue damage is restricted to certain strains [79]. The development of the disease
symptoms in the active model requires MHC-haplotype H2s [80]. Hence, SJL is the most
commonly used strain of mice, in case of the active model of EBA. Apart from the role
played by genetic background, these experimental mouse models have also provided
critical evidence of the role played by B cells, T cells, cytokines, complement and
neutrophils in mediating the loss of tolerance towards COL7 and in the pathogenesis of
the disease.
INTRODUCTION
23
EBA has well defined antigen-autoantibody system, therefore the above models
represent as model systems and important tool to understand the molecular
mechanisms of autoantibody mediated autoimmune diseases as well as for the
development of new treatments.
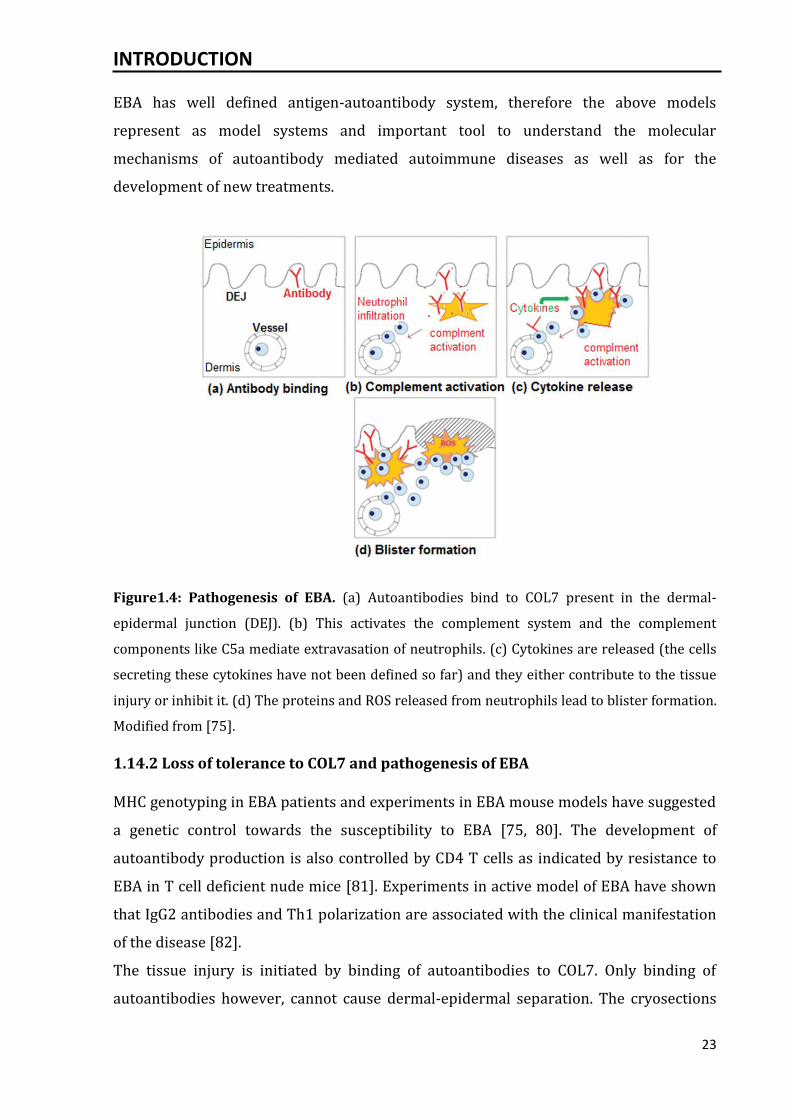
Figure1.4: Pathogenesis of EBA. (a) Autoantibodies bind to COL7 present in the dermal-
epidermal junction (DEJ). (b) This activates the complement system and the complement
components like C5a mediate extravasation of neutrophils. (c) Cytokines are released (the cells
secreting these cytokines have not been defined so far) and they either contribute to the tissue
injury or inhibit it. (d) The proteins and ROS released from neutrophils lead to blister formation.
Modified from [75].
1.14.2 Loss of tolerance to COL7 and pathogenesis of EBA
MHC genotyping in EBA patients and experiments in EBA mouse models have suggested
a genetic control towards the susceptibility to EBA [75, 80]. The development of
autoantibody production is also controlled by CD4 T cells as indicated by resistance to
EBA in T cell deficient nude mice [81]. Experiments in active model of EBA have shown
that IgG2 antibodies and Th1 polarization are associated with the clinical manifestation
of the disease [82].
The tissue injury is initiated by binding of autoantibodies to COL7. Only binding of
autoantibodies however, cannot cause dermal-epidermal separation. The cryosections
INTRODUCTION
24
of human skin show that autoantibodies specific to COL7 recruit and activate leukocytes
especially neutrophils that release ROS which eventually leads to blister formation [83].
Neutrophils are considered as main effector cells in mediating blister formation in EBA,
since their depletion completely protects mice from the disease [84]. Following
extravasation to the skin, neutrophils get activated by binding to the Fc regions of the
autoantibodies. The role of Fc receptor binding in the pathogenesis of EBA has been
demonstrated in many studies, such as, removal of terminal sugar residues on IgG,
which alters its binding to Fcγ receptors, protects mice from EBA following passive
transfer of anti-COL7 IgGs. Also, the injection of rabbit anti-COL7 IgG causes skin
blistering in mice, whereas injection of corresponding Fab fragments does not induce
the blistering [76]. C5a deficient mice are completely protected from experimental EBA
induced by passive transfer of autoantibodies, suggesting that complement activation is
essential for tissue injury in EBA [76]. Other than autoantibodies, neutrophils and
complement, cytokines also play a differential role in the pathogenesis of EBA. While
cytokines like GM-CSF, CXCL (C-X-C motif ligand) 1 and CXCL2 have been shown to be
pro-inflammatory, cytokines like IL-6 play an anti-inflammatory role [75].
1.14.3 Treatment options
The drugs used in the treatment of EBA include corticosteroids, azathioprine and
cyclosporine. Apart from these drugs, high dose intravenous immunoglobulin (IVIG)
therapy that is commonly used in many autoimmune diseases is also developing as an
effective therapy in EBA [85]. Based on the current knowledge of the pathogenesis of
EBA, several potential therapies can be generated that target various molecules involved
in blister formation. The experimental mouse models have helped a great deal in
development of new treatment options.
MATERIALS AND METHODS
25
2. Materials and Methods
2.1 Overview of Materials
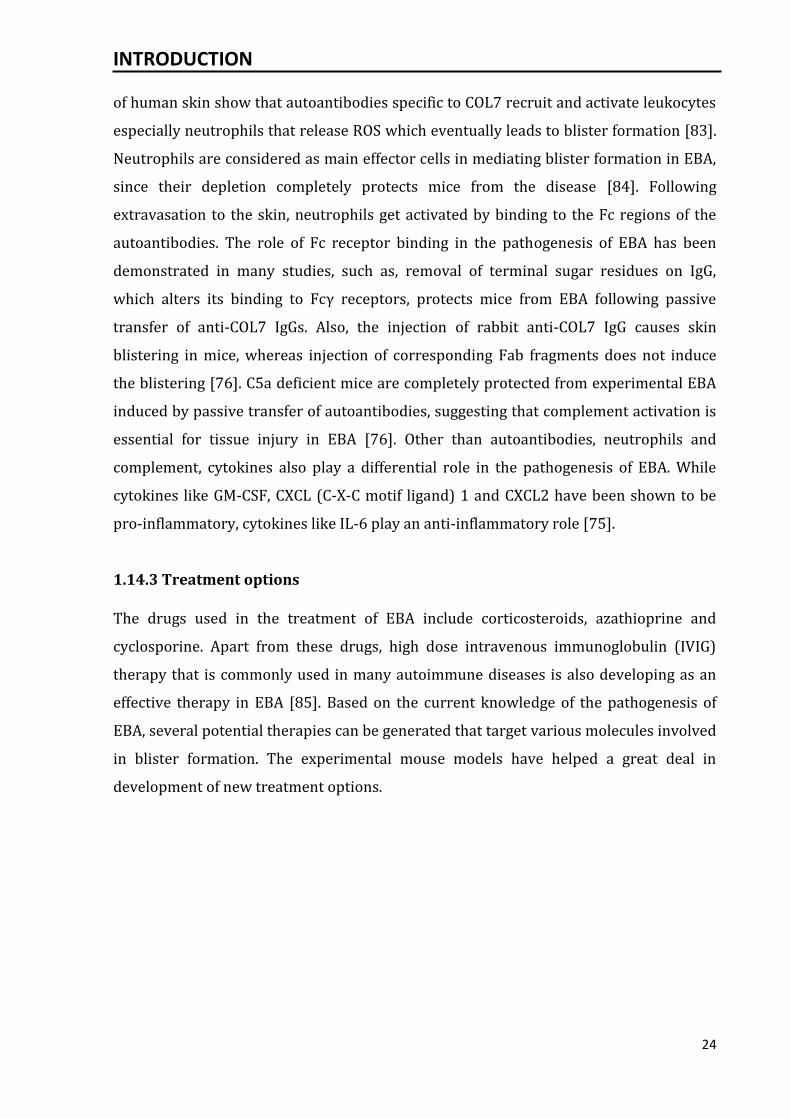
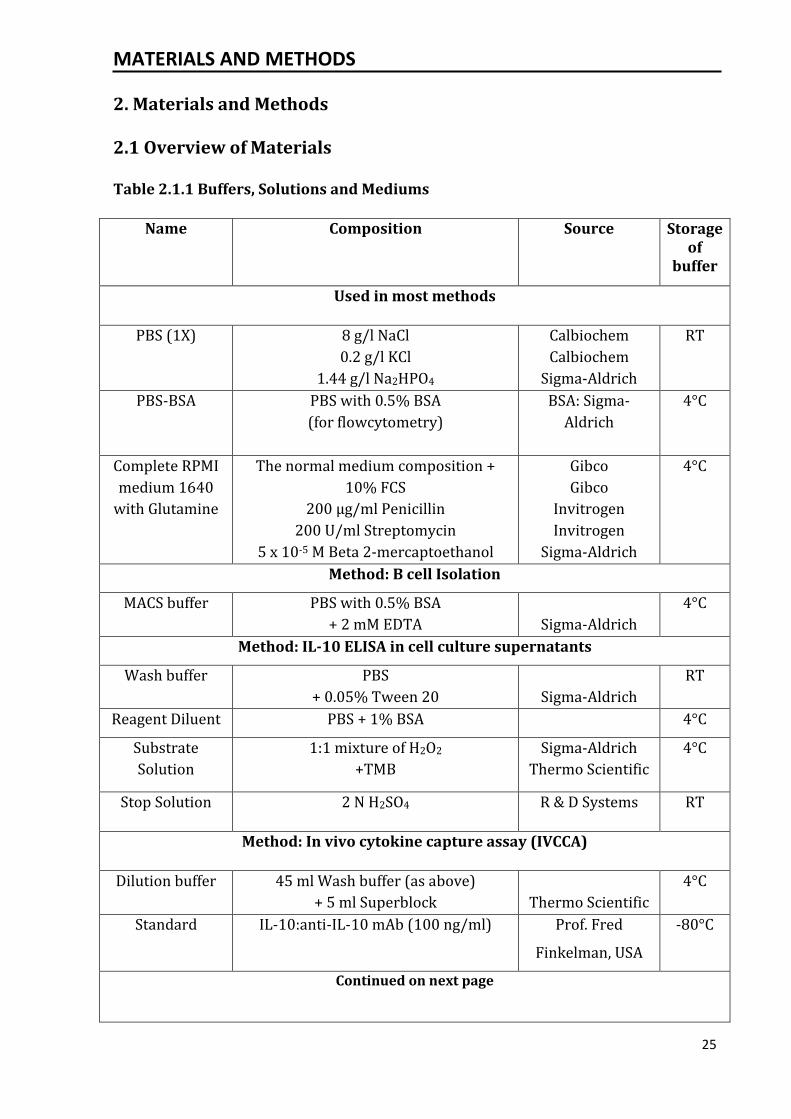
Table 2.1.1 Buffers, Solutions and Mediums
Name Composition Source Storage of
buffer
Used in most methods
PBS (1X) 8 g/l NaCl
0.2 g/l KCl
1.44 g/l Na2HPO4
Calbiochem
Calbiochem
Sigma-Aldrich
RT
PBS-BSA PBS with 0.5% BSA
(for flowcytometry)
BSA: Sigma-
Aldrich
4°C
Complete RPMI
medium 1640
with Glutamine
The normal medium composition +
10% FCS
200 µg/ml Penicillin
200 U/ml Streptomycin
5 x 10⁻⁵ M Beta 2-mercaptoethanol
Gibco
Gibco
Invitrogen
Invitrogen
Sigma-Aldrich
4°C
Method: B cell Isolation
MACS buffer PBS with 0.5% BSA
+ 2 mM EDTA
Sigma-Aldrich
4°C
Method: IL-10 ELISA in cell culture supernatants
Wash buffer PBS
+ 0.05% Tween 20
Sigma-Aldrich
RT
Reagent Diluent PBS + 1% BSA 4°C
Substrate
Solution
1:1 mixture of H2O2
+TMB
Sigma-Aldrich
Thermo Scientific
4°C
Stop Solution 2 N H2SO4 R & D Systems RT
Method: In vivo cytokine capture assay (IVCCA)
Dilution buffer 45 ml Wash buffer (as above)
+ 5 ml Superblock
Thermo Scientific
4°C
Standard IL-10:anti-IL-10 mAb (100 ng/ml) Prof. Fred
Finkelman, USA
-80°C
Continued on next page
MATERIALS AND METHODS
26
Method: Serum Antibody ELISA
Bicarbonate
buffer (pH 9.6)
8.4 g/l NaHCO3 Sigma-Aldrich 4°C
Method: Chemotaxis Assay
Chemotaxis
medium
GBSS medium + 2% BSA Sigma-Aldrich 4°C
Method: MPO Assay
Extraction buffer 15.7 g/l Tris-HCl
+ 8.9 g/l NaCl
Calbiochem 4°C
Potassium-
phosphate buffer
27 g/l KH2PO4
+ 35 g/l K2HPO4
Calbiochem
Calbiochem
4°C
Table 2.1.2 Kits
Method Name of Kit Kit composition Source Stora
-ge
B cell
Isolation
MACS Mouse B cell
Isolation Kit
1. Biotin Antibody
Cocktail
2. Anti-Biotin
MicroBeads
Miltenyi
Biotec,
Germany
4°C
Foxp3
staining
Foxp3 Fix/Perm Buffer set 1. Foxp3 Fix/Perm
2. Foxp3 Perm buffer
Biolegend,
Germany
4°C
IL-10 ELISA DuoSet ELISA 1. Recombinent
mouse IL-10
2. Mouse IL-10
capture antibody
3. Mouse IL-10
detection antibody
4. Streptavidin-HRP
R & D
Systems,
UK
4°C
Intracellular
staining
BD Cytofix/Cytoperm
Fixation/Permeabilization
Solution Kit
1. BDCytofix/
Cytoperm
2. BD Perm/Wash
BD
Biosciences
Germany
4°C
RNA isolation InnuPREP RNA Mini Kit 1. Lysis Buffer
2. RNA extraction
column
3. RNase free water
Analytik
Jena,
Germany
RT
MATERIALS AND METHODS
27
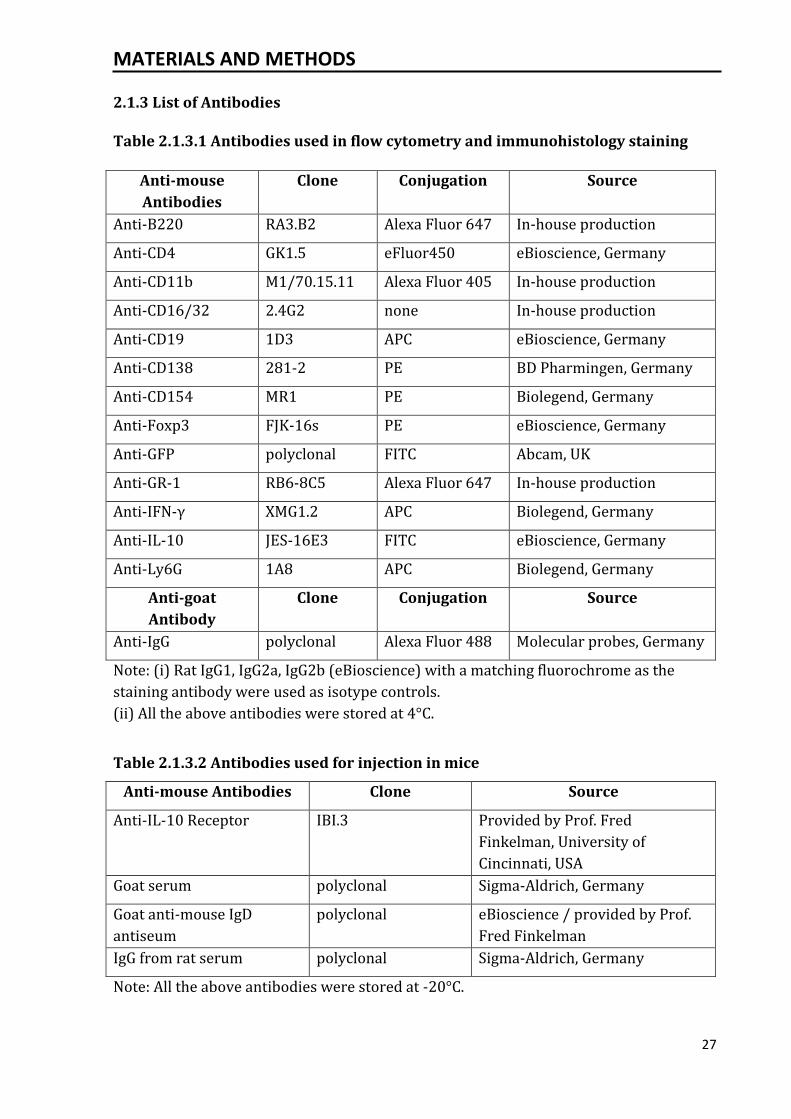
2.1.3 List of Antibodies
Table 2.1.3.1 Antibodies used in flow cytometry and immunohistology staining
Anti-mouse
Antibodies
Clone Conjugation Source
Anti-B220 RA3.B2 Alexa Fluor 647 In-house production
Anti-CD4 GK1.5 eFluor450 eBioscience, Germany
Anti-CD11b M1/70.15.11 Alexa Fluor 405 In-house production
Anti-CD16/32 2.4G2 none In-house production
Anti-CD19 1D3 APC eBioscience, Germany
Anti-CD138 281-2 PE BD Pharmingen, Germany
Anti-CD154 MR1 PE Biolegend, Germany
Anti-Foxp3 FJK-16s PE eBioscience, Germany
Anti-GFP polyclonal FITC Abcam, UK
Anti-GR-1 RB6-8C5 Alexa Fluor 647 In-house production
Anti-IFN-γ XMG1.2 APC Biolegend, Germany
Anti-IL-10 JES-16E3 FITC eBioscience, Germany
Anti-Ly6G 1A8 APC Biolegend, Germany
Anti-goat
Antibody
Clone Conjugation Source
Anti-IgG polyclonal Alexa Fluor 488 Molecular probes, Germany
Note: (i) Rat IgG1, IgG2a, IgG2b (eBioscience) with a matching fluorochrome as the
staining antibody were used as isotype controls.
(ii) All the above antibodies were stored at 4°C.
Table 2.1.3.2 Antibodies used for injection in mice
Anti-mouse Antibodies Clone Source
Anti-IL-10 Receptor IBI.3 Provided by Prof. Fred
Finkelman, University of
Cincinnati, USA
Goat serum polyclonal Sigma-Aldrich, Germany
Goat anti-mouse IgD
antiseum
polyclonal eBioscience / provided by Prof.
Fred Finkelman
IgG from rat serum polyclonal Sigma-Aldrich, Germany
Note: All the above antibodies were stored at -20°C.
MATERIALS AND METHODS
28
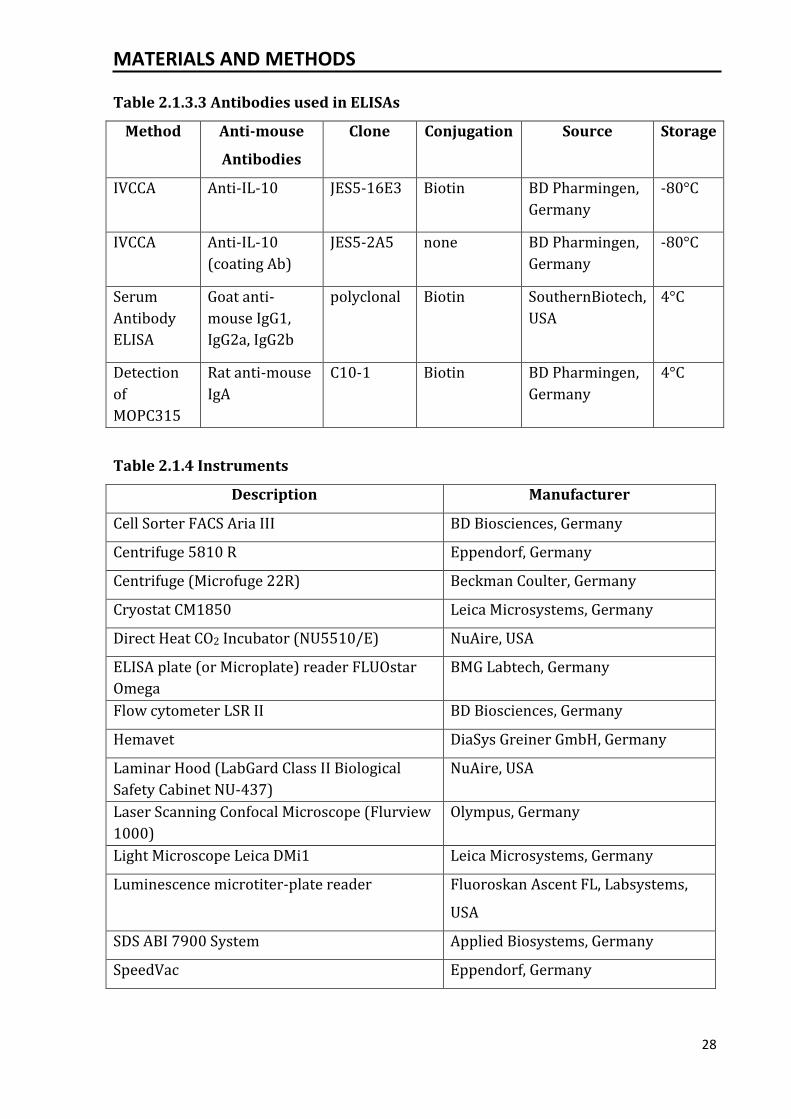
Table 2.1.3.3 Antibodies used in ELISAs
Method Anti-mouse
Antibodies
Clone Conjugation Source Storage
IVCCA Anti-IL-10 JES5-16E3 Biotin BD Pharmingen,
Germany
-80°C
IVCCA Anti-IL-10
(coating Ab)
JES5-2A5 none BD Pharmingen,
Germany
-80°C
Serum
Antibody
ELISA
Goat anti-
mouse IgG1,
IgG2a, IgG2b
polyclonal Biotin SouthernBiotech,
USA
4°C
Detection
of
MOPC315
Rat anti-mouse
IgA
C10-1 Biotin BD Pharmingen,
Germany
4°C
Table 2.1.4 Instruments
Description Manufacturer
Cell Sorter FACS Aria III BD Biosciences, Germany
Centrifuge 5810 R Eppendorf, Germany
Centrifuge (Microfuge 22R) Beckman Coulter, Germany
Cryostat CM1850 Leica Microsystems, Germany
Direct Heat CO2 Incubator (NU5510/E) NuAire, USA
ELISA plate (or Microplate) reader FLUOstar
Omega
BMG Labtech, Germany
Flow cytometer LSR II BD Biosciences, Germany
Hemavet DiaSys Greiner GmbH, Germany
Laminar Hood (LabGard Class II Biological
Safety Cabinet NU-437)
NuAire, USA
Laser Scanning Confocal Microscope (Flurview
1000)
Olympus, Germany
Light Microscope Leica DMi1 Leica Microsystems, Germany
Luminescence microtiter-plate reader Fluoroskan Ascent FL, Labsystems,
USA
SDS ABI 7900 System Applied Biosystems, Germany
SpeedVac Eppendorf, Germany
MATERIALS AND METHODS
29
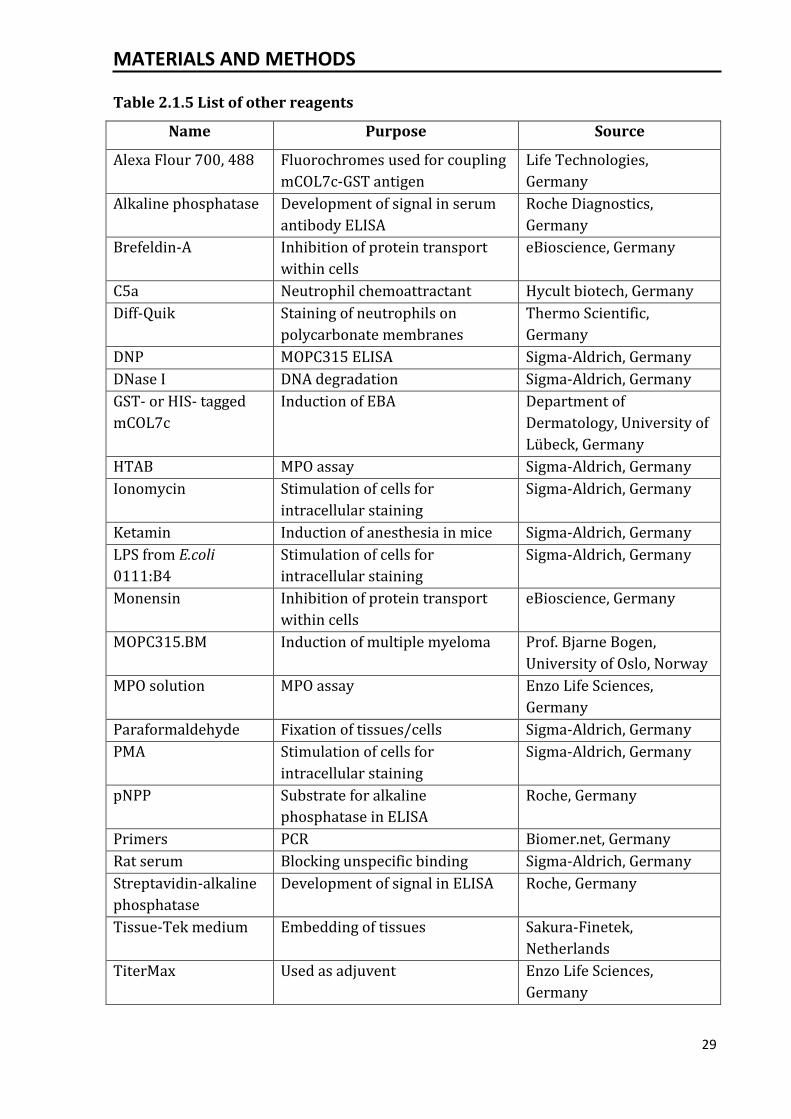
Table 2.1.5 List of other reagents
Name Purpose Source
Alexa Flour 700, 488 Fluorochromes used for coupling
mCOL7c-GST antigen
Life Technologies,
Germany
Alkaline phosphatase Development of signal in serum
antibody ELISA
Roche Diagnostics,
Germany
Brefeldin-A Inhibition of protein transport
within cells
eBioscience, Germany
C5a Neutrophil chemoattractant Hycult biotech, Germany
Diff-Quik Staining of neutrophils on
polycarbonate membranes
Thermo Scientific,
Germany
DNP MOPC315 ELISA Sigma-Aldrich, Germany
DNase I DNA degradation Sigma-Aldrich, Germany
GST- or HIS- tagged
mCOL7c
Induction of EBA Department of
Dermatology, University of
Lübeck, Germany
HTAB MPO assay Sigma-Aldrich, Germany
Ionomycin Stimulation of cells for
intracellular staining
Sigma-Aldrich, Germany
Ketamin Induction of anesthesia in mice Sigma-Aldrich, Germany
LPS from E.coli
0111:B4
Stimulation of cells for
intracellular staining
Sigma-Aldrich, Germany
Monensin Inhibition of protein transport
within cells
eBioscience, Germany
MOPC315.BM Induction of multiple myeloma Prof. Bjarne Bogen,
University of Oslo, Norway
MPO solution MPO assay Enzo Life Sciences,
Germany
Paraformaldehyde Fixation of tissues/cells Sigma-Aldrich, Germany
PMA Stimulation of cells for
intracellular staining
Sigma-Aldrich, Germany
pNPP Substrate for alkaline
phosphatase in ELISA
Roche, Germany
Primers PCR Biomer.net, Germany
Rat serum Blocking unspecific binding Sigma-Aldrich, Germany
Streptavidin-alkaline
phosphatase
Development of signal in ELISA Roche, Germany
Tissue-Tek medium Embedding of tissues Sakura-Finetek,
Netherlands
TiterMax Used as adjuvent Enzo Life Sciences,
Germany
MATERIALS AND METHODS
30
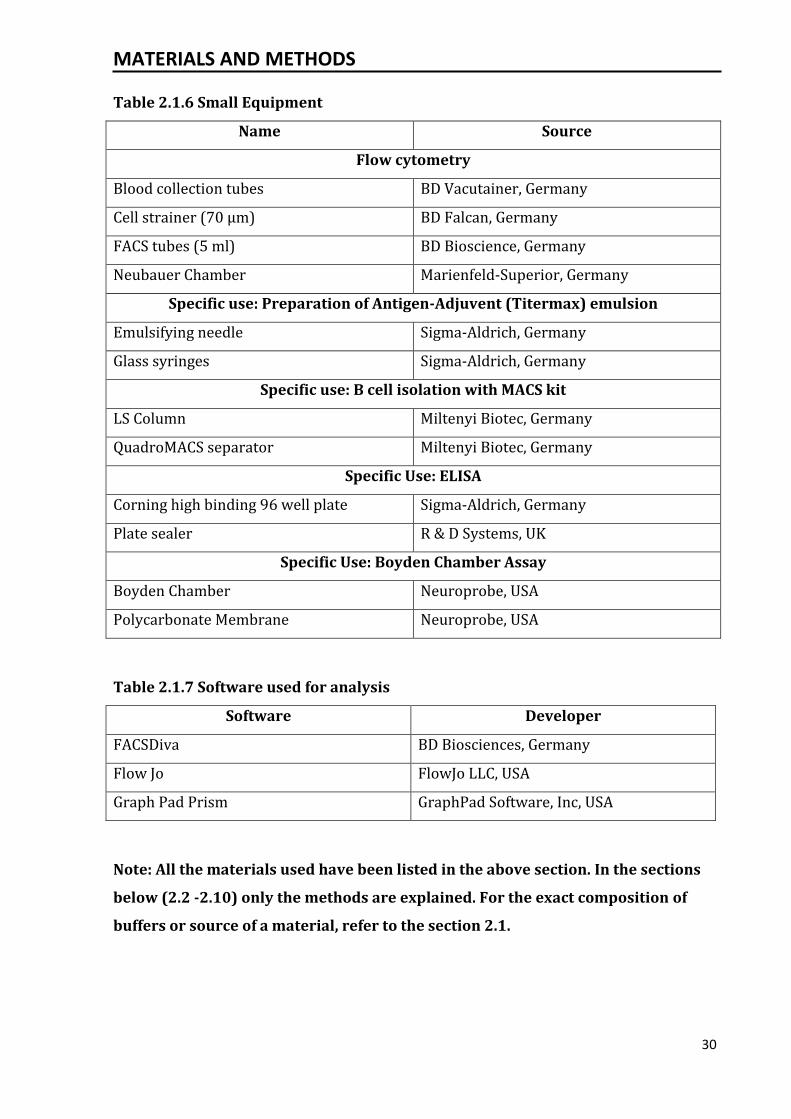
Table 2.1.6 Small Equipment
Name Source
Flow cytometry
Blood collection tubes BD Vacutainer, Germany
Cell strainer (70 µm) BD Falcan, Germany
FACS tubes (5 ml) BD Bioscience, Germany
Neubauer Chamber Marienfeld-Superior, Germany
Specific use: Preparation of Antigen-Adjuvent (Titermax) emulsion
Emulsifying needle Sigma-Aldrich, Germany
Glass syringes Sigma-Aldrich, Germany
Specific use: B cell isolation with MACS kit
LS Column Miltenyi Biotec, Germany
QuadroMACS separator Miltenyi Biotec, Germany
Specific Use: ELISA
Corning high binding 96 well plate Sigma-Aldrich, Germany
Plate sealer R & D Systems, UK
Specific Use: Boyden Chamber Assay
Boyden Chamber Neuroprobe, USA
Polycarbonate Membrane Neuroprobe, USA
Table 2.1.7 Software used for analysis
Software Developer
FACSDiva BD Biosciences, Germany
Flow Jo FlowJo LLC, USA
Graph Pad Prism GraphPad Software, Inc, USA
Note: All the materials used have been listed in the above section. In the sections
below (2.2 -2.10) only the methods are explained. For the exact composition of
buffers or source of a material, refer to the section 2.1.
MATERIALS AND METHODS
31
2.2 Mice and Mouse Handling
2.2.1 Mice
8-week-old SJL, C57BL/6, BALB/c mice were purchased from Charles River Laboratories
(Sulzfeld, Germany). IL-10 reporter (Vert-X) mice and IL-10FL/FLCD19Cre+ mice were
provided by Prof. Axel Roers, Technische Universität Dresden, Germany. Foxp3 reporter
(Foxp3EGFP) mice were provided by Prof. Jörg Köhl, University of Lübeck, Germany.
Experiments were performed at the animal facility of University of Lübeck. The
experiments were approved by the respective local Committee on the Ethics of Animal
Experiments of the state Schleswig-Holstein (Ministerium für Landwirtschaft, Umwelt
und ländliche Räume des Landes Schleswig Holstein), and performed by certified
personnel.
2.2.2 Collection of blood and its processing
Blood was collected from the facial vein of live mice. Each mouse was held firmly by
holding the skin on back, such that the forelegs stick out to the sides, the mouth is open
and eyes are bulging out of their sockets. Mice were then pricked using a 4-5 mm lancet
at the hairless freckle on the side of the jaw and immediately 3-4 drops of blood was
collected either in EDTA (anticoagulant) coated tubes for flow cytometry or tubes
containing clot activator and gel for separation of serum.
Separation of serum: Blood collected from mice was centrifuged at 350 g for 15 min.
The liquid non-cellular part (serum) was collected and transferred in fresh Eppendorf
tubes and stored at -80 °C.
2.2.3 Mouse dissection and collection of tissues
Mice were killed by cervical dislocation. Their arms and legs were pinned to a dissection
board with their belly facing up. Some 70% ethanol was sprayed on mice to protect the
tissues from artifacts caused by hair and to sterilize. Skin was cut along the ventral
midline from groin to thoracic part. Another incision was made starting from the first
incision downward towards knees on both sides such that an incision that looked like an
upside down Y-shape was obtained. The organs of the immune system like spleen, femur
MATERIALS AND METHODS
32
and tibia (for bone marrow) and different lymph nodes were thereafter carefully
dissected and stored in PBS-BSA (PBS with 0.5% BSA) at 4°C until the preparation of
single cell suspension.
Dissection of spleen and lymph nodes was simply performed by grasping them with a
curved forceps and gently pulling them such that they are removed from the connective
tissue present behind them. Dissection of bone legs (femur and tibia) was performed
carefully by first removing all the skin and muscles around leg so that bones were
completely exposed. A cut was made above the hip joint while making sure that the top
of the femur is not removed since a cut in the bone might affect the sterility of bone
marrow.
2.2.4 Induction of plasmacytosis in mice
2.2.4.1 GMD injection
Overview: Goat anti-mouse IgD antiserum (GMD) is a polyclonal antibody that binds to
surface bound antibody: IgD (BCR) that is mainly present on naïve B cells. Due to its
polyclonal nature, the antibody can effectively bind to multiple epitopes on IgD, thus
leading to cross-linking of the receptor and potent activation of B cells. The massive
plasma cell response following GMD injection has been previously shown [16].
Moreover, unlike IgM that is secreted in large amounts by plasma cells, IgD is present
mostly as surface bound antibody on B cells; reducing the possibility of immune complex
formation in serum upon GMD injection in mice.
Method: Mice were injected intraperitoneally (i.p.) with 200 µl of GMD. High plasma cell
load in spleen was seen seven days post injection. Goat serum or phosphate buffer saline
(PBS) were injected in control mice. For i.p. injection, each mouse was held firmly by
holding the skin on its back such that its eyes bulge out, mouth stays open and both
forearms and hind legs stick out to the sides. The mouse was tilted so that the head faces
downwards and the posterior end is elevated. The needle and syringe were kept almost
parallel to the vertebral column of mouse in order to avoid accidental insertion in the
viscera. The shaft of the needle was entered to a depth of about half a centimeter. The
injection was performed with a 27 G needle in the lower quadrant of the abdomen but
close to the midline. The injection was considered successful if no blood (penetration in
MATERIALS AND METHODS
33
blood vessel), no yellow fluid (penetration in urinary bladder) or no greenish-brown
fluid (penetration in intestine) came out of the punctured area. In this way injection in
the peritoneum was ensured and any harm to the tissue inside was avoided.
IL-10 receptor blockade: IL-10 receptor in mice was blocked by i.p. injection of 0.5 mg
anti-IL-10 receptor (R) (clone: IBI.3) antibody in each mouse. The antibody was diluted
in PBS to obtain a concentration of 2.5 mg/ml and 200 µl was injected in a mouse such
that each mouse received 0.5 mg of the antibody. In order to avoid formation of immune
complexes between two antibodies, IL-10 receptor blockade was performed 2 days after
mice were treated with GMD or goat serum. Similar concentration of rat IgG was injected
in mice used as controls.
2.2.4.2 Induction of multiple myeloma
Overview: Plasmacytomas can in be induced in the peritoneal cavity of certain strains of
mice by i.p. injection of mineral oil, adjuvants or alkanes. Such mineral oil induced
plasmacytomas (MOPCs) can be transplanted i.p. and are used extensively in tumor
studies. However, they typically grow only at the site of injection and infrequently do not
metastasize to the bone marrow. Due to their local growth, the use of MOPCs as a good
model representing human multiple myeloma is questionable since multiple myeloma is
characterized by clonal expansion of malignant plasma cells in bone marrow. Therefore,
Hofgaard et al, developed a new stable variant of MOPCs called MOPC315.BM [86].
MOPC315.BM cells can be grown in vitro, exhibit tropism towards bone marrow on in
vivo transfer and cause osteolytic lesions thus recapitulating human disease. Moreover,
this model employs common laboratory mouse strain: BALB/c, therefore this model is
not technically challenging and does not require large investments.
Method: MOPC315.BM cell line was a generous gift from Prof. Bjarne Bogen, University
of Oslo, Norway. The cells were labelled with GFP with retroviral transfection for their
easy detection in mouse tissue [87]. Cells were cultured in vitro (37°C, 5% CO2) in
complete RPMI 1640 medium and harvested when growing exponentially. The cells
were counted, centrifuged at 300 g for 7 min and re-suspended in sterile PBS such that
the final concentration was 1 x 10⁶ to 5 x 10⁶ per ml.
For i.v. injection, first the vessels in the tail of each mouse were dilated either by
immersing the tail in warm water (40-45°C) or keeping mice under a lamp. A 1 ml
MATERIALS AND METHODS
34
syringe was carefully filled with the cell suspension, removing any air bubbles. The mice
were then put in a restraining device and 105 to 5 x 10⁵ cells in 100 ul were injected in
the lateral tail vein using a 27 G needle. While injecting, the needle was inserted parallel
to the tail vein penetrating 2–4 mm into the lumen while keeping the bevel of the needle
facing upwards. After i.v. administration, the injection site was immediately pressed
with a swab to avoid back-flow of the injected fluid and/or blood. The injection was
considered successful when no resistance was observed, since a resistance is usually
observed when the needle has been inserted in the surrounding tissue and not in the
vein. Subsequently, mice were bled every week for measurement of M315 myeloma
protein by ELISA (section 2.6.3). Symptoms of (i) paraplegia (a sign of spinal cord
compression) (ii) visible tumor size and (iii) weight loss could be seen in mice, 6-7
weeks following MOPC315.BM injection. Mice which developed myeloma specific serum
protein levels of 2-6 µg/ml were used for experiments.
2.2.5 Induction of EBA and evaluation of the disease
EBA active model overview: As mentioned in section 1.14.1, the active model of EBA is
induced by injection of recombinant COL7, the specific target of autoimmunity in EBA.
This initiates an autoimmune response in mice resulting in pathology and clinical signs
similar to the human disease. Genetic background of mice strongly influences the
development of symptoms like blistering. C57BL/6 and SKH-1 mice are completely
resistant to the induction of EBA by immunization, whereas 50% BALB/c mice develop a
mild-disease [79]. SJL mice are the highest responders with an incidence of 80-100%
and therefore were used for induction of active EBA in the thesis. The active EBA model
has been well studied with respect to development of autoantibodies, deposition of IgG
and complement C3 at the dermal-epidermal junction and also in some treatment
studies [75].
Production of mCOL7c: mCOL7c (amino acids 757-967) was expressed as glutathione-
S-transferase (GST) fusion protein in a prokaryotic expression system and purified by
glutathione affinity chromatography as described [76]. The fusion protein was obtained
from Department of Dermatology, University of Lübeck, Germany.
Preparation of emulsion of the antigen and adjuvant: Prior to emulsification, the
adjuvant: TiterMax was vortexed such that a homogenous suspension was formed.
MATERIALS AND METHODS
35
TiterMax and GST-mCOL7c were then loaded in separate 1 ml siliconized glass syringes.
The two syringes were connected via an 18 gauge double hub emulsifying needle. The
aqueous antigen phase (mCOL7c-GST) was pushed first into the oil phase of TiterMax
and then vice versa. The materials in the syringes were forced back and forth through
the needle for approximately 5 min. Thus, a whipped cream like 50:50 water-in-oil
emulsion of GST-mCOL7c and TiterMax was prepared. In order to check stability of the
emulsion, a drop was expelled on the surface of water; when the drop held together and
did not disintegrate, the emulsion was considered ready to be injected in SJL mice.
Induction of EBA: Mice were first anesthesyzed by i.p. injection of Ketamin (2
mg/mouse) followed by subcutaneous injection in the hind footpads with 60 µl emulsion
containing 60 µg of recombinant murine type VII collagen (GST-mCOL7c) in TiterMax
[88]. The disease score was evaluated weekly, in a blinded manner by determining the
percentage of body surface area covered with lesions (i.e. erythema, blisters, erosions,
crusts and hair loss). The disease score was assigned to each mouse based on the
percentage of the area that was affected e.g. a disease score of 1 represents that 1% of
the body surface is affected.
GMD treatment in EBA experimental mice: Following immunization, mice develop
autoantibodies in 2 weeks and start showing symptoms approximately 4 weeks after
immunization. This time point was chosen to perform GMD treatment and to analyze if
the treatment had any effect in the effector phase of the disease.
2.3 Preparation of single cell suspension from mouse tissues
2.3.1 Spleen and lymph nodes
Single cell suspensions were prepared from freshly isolated tissues by mashing the
organs in between two slides. The cells were suspended in 0.5% BSA in PBS (PBS-BSA)
and filtered through a 70 µm cell strainer. Additional cell clumps were macerated
through the filter by using back of a syringe. The cells in the suspension were counted
using Neubauer-chamber. The cells were centrifuged at 300 g for 10 min and re-
suspended in PBS-BSA such that required concentration was obtained.
MATERIALS AND METHODS
36
2.3.2 Bone Marrow
Method I: A small cut was made on both sides of bones (femur/tibia). Bone marrow
cells were collected by repeatedly flushing the shaft with 5 ml syringe with a 24 or 26 G
needle filled with PBS. Cells were disaggregated by gently pipetting up and down several
times. The cell suspension was filtered through a 70 µm cell strainer and re-suspended
as mentioned above. This method was mainly used when performing migration assays
on bone marrow neutrophils.
Method II: A small slanting cut was made on one side of bone (femur/ tibia-fibula). The
bones were kept in 1 ml Eppendorf tubes containing 50 µl PBS-BSA, such that the cut
side faces downwards. The tubes were centrifuged at 10000 g for 1 min such that all the
bone marrow was flushed in the tubes. The bone marrow cells were counted and
resuspended in appropriate amount of PBS-BSA to get desired concentration. This
method was used when performing flow cytometry on bone marrow samples.
2.4 Flow Cytometry
2.4.1 Overview of the method
Flow cytometry is a laser based technology often employed especially in the field of
immunology for identification of cell populations and cell sorting. The cells are first
stained (either cell surface receptors or intracellular) by a flurochrome labeled antibody.
They are then passed through a flow cytometer that consists of a flow chamber, laser,
light detector, filters and color detectors. Cells flow through the flow chamber one at a
time at high speed in sheath fluid. A small laser beam hits the cells and the way the light
bounces off gives information about the cell’s physical characteristics. The light detector
processes the light signal. Forward scatter represents the size of a cell while side scatter
represents the amount of granulation in a cell. Many cells of the immune system can be
recognized by their position in the forward and side scatter. The various filters direct
the light emitted by fluorochromes to the color detectors. As the cells pass through the
laser, the fluorochromes attached to them absorb the light and emit a specific color of
light that is collected by color detectors and sent to a computer. The computer processes
the signal and represents it in the form of graphs that can be analyzed by different
MATERIALS AND METHODS
37
softwares like FACSDiva and FlowJo. The data generated from flow cytometers can be
plotted in a single dimension, in the form of a histogram or two-dimensional dot plots or
in three-dimensions.
2.4.2 Surface staining
Around 1 million cells from the single cell suspensions prepared from spleen, lymph
nodes and bone marrow were used for surface staining. The cells were centrifuged at
300 g for 10 min and the Fcγ receptors on the cells were blocked with 50 µl anti-
CD16/CD32 (FcγR block) antibody with a concentration of 10 µg/ml. The cells were
incubated in FcγR block for 10 min on ice. This step is essential for blocking non-specific
binding of staining antibodies to Fc receptors.
Preparation of staining solution (master-mix): A master-mix containing all the
desired fluorochrome conjugated antibodies in a concentration of 2-5 µg/ml was
prepared in PBS-BSA containing 10 µg/ml FcγR block. A BD fluorescence spectrum
viewer was used to analyze the emission spectrums of the fluorochromes and use of
fluorochromes with highly overlapping emission spectrums was avoided. The spectrum
viewer is available on the following website:
https://www.bdbiosciences.com/research/multicolor/spectrum_viewer/index.jsp
The cells were stained with 50 µl master-mix added on top of the FcγR block solution for
10-15 min on ice. The cells were washed once in PBS-BSA by centrifugation at 300 g for
10 min and resuspended in 500 µl PBS-BSA. The stained cell suspension was then
acquired on flow cytometer (LSR II, BD Biosciences).
2.4.3 Intracellular staining of cytokines
Overview: During the course of the thesis, cytokines like IL-10 and IFN-γ were stained
within B and T cells and analyzed via flow cytometry. The intracellular cytokine staining
on freshly prepared single cell suspensions is often weak and not easy to detect by flow
cytometry. In order to enhance the signal/noise ratio, the mature cytokine competent
cells are induced to express the cytokines by first culturing the cells for 5 h with
monensin [89], phorbol 12-myristate 13-acetate (PMA) (a phorbol ester; a protein
kinase C activator), ionomycin (an ionophore that triggers calcium release) and LPS
MATERIALS AND METHODS
38
(only for B cells) [90] followed by staining. Monensin is used to interrupt the
intracellular transport processes leading to accumulation of the cytokine in the Golgi
complex [89]. While staining, cells need to be fixed with a buffer containing
paraformaldehyde and permeabilized with saponin, so that the antibodies can penetrate
the cells and stain the desired cytokines. Saponins are steroid or triterpenoid glycosides
that can complex with cholesterol to form pores in cell membrane.
Method: The single cell suspension from spleen was resuspended (107 cells/ml) in
complete RPMI medium, ionomycin (500 ng/ml, final concentration), LPS (10 µg/ml,
final concentration), and monensin (2 mM, final concentration) for 5 h in 48-well flat-
bottom plates. Beta 2-mercaptoethanol is added to this culture because it acts as a
reducing agent that can break down many toxic metabolites produced by the cells, thus
improving the culture conditions. Another reason is that it reduces the cystine present in
the medium to cysteine, which is required for cell growth. Following 5 h culture, the cells
from each well were harvested in a separate FACS tubes. While surface staining, Fc
receptors were blocked with anti-CD16/CD32, cells were incubated for 15 min with
conjugated monoclonal antibodies against cell surface markers. The cells were washed
once in PBS by centrifugation at 300 g for 10 min. (Note: The use of PBS-BSA was
avoided in this washing step because BSA can interfere in the fixation of cells that
follows). The supernatant was removed and the cells in each sample were fixed with 250
µl of BD Cytofix/Cytoperm cell fixation buffer for 20 min on ice. The cells were washed
with BD Perm/Wash buffer containing saponin by centrifugation at 350 g for 10 min and
the supernatant was discarded. After this permeabilization step, the cells were stained
intracellular with the fluorescently labeled monoclonal antibodies against the desired
cytokines for 30 min on ice. The cells were washed again with the Perm/Wash as before
and resuspended in 300 µl PBS-BSA. The cells were acquired in a flow cytometer (LSRII)
and subsequently analyzed using FlowJo software.
2.4.4 Detection of antigen (mCOL7c-GST) specific plasma cells
The recombinant fragments of mCOL7c-GST and GST were produced using a prokaryotic
system as explained in section 2.2.5. The proteins were coupled to Alexa Flour 700 and
Alexa Flour 488 according to protocols provided by the manufacturer.
MATERIALS AND METHODS
39
Single cell suspensions from draining lymph nodes, spleen and bone marrow were
directly (without any culture) stained for the surface markers B220 and CD138, fixed
with Cytofix/Cytoperm and subsequently stained intracellularly (as explained in section
2.4.3) with fluorochrome labeled GST and mCOL7c-GST, similar to what was described
for staining of plasma cells specific for these antigens [88].
2.4.5 Detection of antigen specific T cells
Overview: An immune response towards a particular antigen or pathogen is mainly
dependent on the T cells recognizing this antigen. However, identification of this small
population of a particular antigen-specific T cells from a large pool of T cells remained
technically a challenge for a large period of time in the history of immunological
research, until recognition of CD154 as a specific marker for antigen activated T cells.
Unlike other T cell activation markers like CD25 and CD69 that are also expressed on
TCR independent activation, CD154 is specific for short term antigen activated T cells
[91]. Therefore, the detection of cytokine producing Th cells specific for a defined
antigen was performed according to CD154 expression induced after in vitro stimulation
as described [91]. CD154 is only transiently expressed on the surface of T cells in the
course of Th cell activation due to its degradation upon interaction with its ligand CD40
on APCs. Hence, CD154 needs to be detected based on its intracellular expression. This is
achieved by culturing splenic cells in the presence of a defined antigen along with
brefeldin A for 5-6 h, before their final analysis. Brefeldin A inhibits protein transport
from endoplasmic reticulum to Golgi apparatus thus blocking the transport of CD154 to
the cell surface [92]. Inhibition of protein transport to the cell surface can also be
achieved by addition of Monensin as described in section 2.4.3.
Method: Ex vivo restimulation of single cell suspensions from draining lymph nodes
(popliteal and inguinal in case of EBA) or spleen (107 cells/ml) was performed with 100
µg of mCOL7c-GST, polyhistidine (HIS)-tagged mCOL7c or GST in complete RPMI1640
medium in 48 well flat bottom plates. As a negative control, 100 µg of ovalbumin or 100
µl PBS was used for restimulation. High level CD154 expression as positive control was
achieved by PMA and ionomycin stimulation. To detect the expression of CD154 on CD4
T cells, cells were thus restimulated in the presence of monensin or brefeldin A and the
antigen, followed by fixation and intracellular staining as described in section 2.4.3.
MATERIALS AND METHODS
40
2.4.6 Foxp3 staining
Overview: Foxp3 is a transcription regulator that is selectively expressed in Treg cells,
is required for Treg development and function and is sufficient to induce a Treg
phenotype in CD4+ cells. It is considered as the key marker for Tregs and is utilized to
identify Tregs by flow cytometry. Since, Foxp3 is a transcription regulator; it is present
within the nucleus of the cells. Therefore, the intracellular staining of Foxp3 requires use
of special buffers that can permeabilize the cell membrane as well as the nuclear
envelope without affecting the surface fluorochrome staining.
Method: The surface staining was performed as described in section 2.4.2. The buffers
provided in Foxp3 Fix/Perm buffer set were first diluted in PBS to make a 1X solution as
instructed by the provider. The cells were fixed with 1 ml 1X Biolegend’s Fix/Perm
solution for 20 min in dark on ice. The cells were washed first with PBS-BSA by
centrifugation at 250 g for 5 min followed by washing once with 1 ml 1X Biolegend’s
Foxp3 Perm buffer. For effective permeabilization, the cells were resuspended in the
Foxp3 Perm buffer an incubated in dark for 15 min. The cells were centrifuged as before
and resuspended in 100 µl Foxp3 Perm buffer containing anti-mouse Foxp3 antibody in
the concentration of 2-5 µg/ml. After 30 min incubation in dark, on ice, the cells were
washed with PBS-BSA and resuspended in 300 µl PBS-BSA. These were analyzed by flow
cytometry.
Note: In case of IL-10 staining along with Foxp3 staining, the cells were cultured for 5 h
(section 2.4.3) prior to the above staining protocol.
2.4.7 Analysis of flow cytometry data: While analyzing data obtained from flow
cytometry, frequency of a particular cell type was determined by applying a gate to the
staining based on an unstained or isotype control (Result section: Fig. 3.9, 3.10). An
isotype control antibody does not target a specific cell type but retains all other non-
specific characteristics of an antibody. Thus, by using an isotype control antibody that
matches staining antibody’s host species, isotype and fluorochrome, any unspecific
interactions of the staining antibody can be determined.
During analysis, the spillover due to overlap between the emission spectra of two
flurochromes was removed by carrying out manual compensation of the samples. Via
manual compensation, the median of the populations was aligned using serial
MATERIALS AND METHODS
41
subtraction process available in FACSDiva software. Due to the use of less than four
fluorochromes in a sample, manual compensation was possible. The compensation was
carried out in most cases between PE and FITC channels that spill into each other.
2.5 B cell Isolation and Plasma Cell Culture
Splenic B cells were isolated from the splenic cells using magnetic activated cell sorting
(MACS) negative isolation kit.
Principle: The B cell isolation via MACS negative isolation kit is done by depletion of
non-B cells. Non-B cells are magnetically labelled with a cocktail of biotin-conjugated
monoclonal antibodies against CD43 (Ly48) (isotype: rat IgG2a), CD4 (L3T4) (isotype:
rat IgG2b), and Ter-119 (isotype: rat IgG2b). Anti-biotin antibodies conjugated to
MicroBeads are then added as secondary labelling reagent. When added to a MACS
column in the magnetic field of a MACS Separator, the magnetically labelled non-B cells
are retained while the unlabeled B cells run through the column.
Method: (i) Magnetic Labelling: The entire process of B cell isolation was performed
fast, sterile and on ice. The cool temperatures and shorter incubation times avoid any
non-specific cell labelling. The single cell suspensions from spleens were centrifuged and
cells from each spleen were resuspended in 40 µl MACS buffer. Cells from a spleen were
incubated with 10 µl Biotin-Antibody Cocktail for 5 min in refrigerator (2-8°C). Without
any washing step, 30 µl MACS buffer and 20 µl Anti-Biotin MicroBeads were added, and
the cells were incubated for 10 min in the refrigerator. Additional MACS buffer was
added such that the final volume was at least 1 ml. (Note: the above indicated volumes
are for cells from one spleen. In case of more than 1 spleen, the volumes of the reagents
were adjusted accordingly).
(ii) Magnetic Separation: LS columns were placed in the magnetic field of QuadroMACS
Separator. Each LS column was first rinsed with 3 ml MACS buffer. The cell suspension
was carefully added to the samples, avoiding any formation of bubbles. The column was
washed once with 3 ml MACS buffer. The flow-through that contained the unlabeled
enriched B cells was collected and stained with fluorochrome labeled anti-CD19
antibody and analyzed by flow cytometry. The B cell isolation was considered successful
if the CD19+ cells constituted more than 90% of the flow-through.
MATERIALS AND METHODS
42
In order to collect the magnetically labelled non-B cells, the column was removed from
the separator and the cells were flushed out from the column with an appropriate
amount of MACS buffer.
Cell Culture: The isolated B cells were centrifuged at 300 g for 10 min and resuspended
in complete RPMI medium along with 10 µg/ml LPS with a concentration of 2 x 10⁵
cells/ml. Plasma cells were analysed by flow cytometry on day 4,5,6 of the culture. The
plasma cells were further separated from the culture using fluorescence activated cell
sorting (FACS).
2.6 Enzyme Linked Immunosorbent Assays (ELISAs)
2.6.1 Analysis of IL-10 concentrations in culture and serum
2.6.1.1 IL-10 ELISA on culture supernatants
IL-10 in the supernatant of the mouse B cell and myeloma cultures was measured using
mouse IL-10 ELISA kit that can determine IL-10 concentrations between 31.3-2000
pg/ml.
Overview: IL-10 concentration in the culture supernatants was determined by a regular
ELISA assay. In this assay, IL-10 is captured on a high binding microtiter plate with a
specific capture antibody and detected using a biotin coupled detection antibody specific
for another epitope on IL-10. Strepavidin-Horseradish Peroxidase (HRP) binds
specifically to the biotinylated detection antibody. The addition of 3, 3’, 5, 5’-
tetramethylbenzidene (TMB) substrate reduces peroxide to water which turns the
solution blue. The color intensity is proportional to the amount of HRP activity which is
in turn dependent on the amount of analyte (in this case IL-10). The reaction and color
development is stopped by addition of sulphuric acid (H2SO4) which turns the color
yellow that can be measured at 450 nm using a spectrophotometer. The concentration of
IL-10 is determined based on the absorbance obtained from serial dilutions of a
standard whose concentration is known.
Method: A 96-well microplate was coated with 100 µl per well with rat anti-mouse IL-
10 antibody (capture antibody) with a concentration of 4 µg/ml in PBS. The plate was
incubated overnight at room temperature (RT) for a firm attachment of antibody. The
unbound antibody was washed off by washing the plate three times with 400 µl wash
MATERIALS AND METHODS
43
buffer. In the last washing step any remaining wash buffer was removed by blotting the
plate on a clean paper towels. In order to avoid any unspecific binding of the capture
antibody with the proteins in the cell supernatant, the plate was blocked by adding 300
µl of 1% BSA in PBS to each well. The plate was incubated at RT for 1 h after which it
was washed as explained before. A 100 µl of standard (recombinant mouse IL-10) and
samples were added to each well. Two-fold serial dilutions of the standard and the
samples were carried out in 1% BSA in PBS. The plate was covered with adhesive strip
and incubated at RT for 2 h. The plate was washed as before and 100 µl of biotynatled
goat anti-mouse IL-10 antibody (detection antibody) with a concentration of 300 ng/ml
was added to each well. The plate was covered and incubated at RT for 20 min in dark.
The plate was washed as before and 100 µl of substrate solution (1:1 H2O2 + TMB) was
added to each well, followed with incubation at RT for 20 min in dark. The reaction was
stopped by addition of 50 µl stop solution (2 N H2SO4) to each well and tapping the plate
for through mixing. The optical density (O.D.) of each well was determined immediately
in microplate reader set to 450 nm.
Calculation of Results: The O.D. readings from the duplicates of the samples and the
standard were averaged and subtracted from the reading of the blank control (a control
well without any sample). A standard curve was created by plotting the mean
absorbance of each dilution of the standard on the y-axis against the concentration on x-
axis and a best fit curve was drawn through the points on the graph. The concentration
of the samples was determined through this graph, based on their O.D.
2.6.1.2 IL-10 ELISA on serum: For measurement of systemic IL-10 following GMD
injection, in vivo cytokine capture assay (IVCCA) was used. The assay was performed as
described [93].
Overview: Measurement of certain cytokines in serum is difficult, since cytokines are
either utilized or catabolized shortly after their secretion. In order to circumvent this
phenomenon, in this special assay the half-life of a cytokine is increased by injection of
biotinylated anti-cytokine monoclonal IgG antibody. The binding of the antibody specific
for a cytokine, prevents it from being utilized or degraded [94]. These biotinylated
antibodies sample a cytokine without neutralizing it, thus causing no hindrance in the
biological effect of a cytokine. The IgG antibodies are used instead of any other isotype
because they have longer in vivo half-lives and they can penetrate easily into the extra-
MATERIALS AND METHODS
44
cellular space of an animal. Cytokine-antibody complexes accumulated in blood are
measured by ELISA, by coating a microtiter plate with an antibody to a second epitope
on the same cytokine. The coated antibody binds the cytokine-biotinylated antibody
complex, which can be quantified by enzyme-streptavidin conjugate followed by a
substrate as described in 2.6.1.1. The sensitivity of IVCCA is 30-1000 times higher
compared to normal ELISA [93].
Method: Mice were injected i.p. with 10 µg of biotinylated anti-mouse IL-10 antibody
(free of endotoxin) in 200 µl of 1% mouse serum in PBS. Mice were bled 24 h later and
the complex formed between the antibody and the cytokine was detected from serum
with ELISA. A seven-step 1:4 serial dilution of 100 ng/ml IL-10: anti-IL-10 antibody was
performed on a 96 well microplate. Similar dilution was performed for the serum
samples. Another 96 well high binding microtiter plate was coated with 50 µl coating
antibody (concentration: 2 µg/ml in PBS) and incubated at 2-8°C. The plate was washed
four times with washing buffer. A 25 µl of diluted serum samples and standard were
added from the other 96 well plate to the coated plate in duplicates and incubated at RT
for 30 min. The plate was washed six times as before and 25 µl of streptavidin-HRP
(concentration: 50 ng/ml in dilution buffer) was added to each well. The plate was
incubated at RT for 20 min. During this time, streptavidin-HRP binds to the biotinylated
anti-IL-10 antibody. The plate was washed ten times, and the development of the signal
as well as the data obtained was analyzed by comparing O.D. obtained for samples with
those obtained for standard as explained in section 2.6.1.1.
Note: In IVCCA ELISA all the buffers except the dilution buffer were same as the one
used in IL-10 ELISA explained in 2.6.1.1.
2.6.2 mCOL7c specific serum antibody ELISA
For detection of serum antibody levels specific to a particular antigen, the principle of
ELISA is same as explained in section 2.6.1.1 with a small exception: the 96 well
microtiter plate is coated with a specific antigen instead of a specific antibody.
Each well of a 96 well plate was coated with 500 ng of recombinant HIS-tagged mCOL7c
in 0.1 M bicarbonate buffer and incubated overnight at 2-8°C. Blocking of unspecific
binding due to Fc receptors was performed with 1% BSA in PBS for 30 min at RT. The
wells were incubated with a 150-fold dilution of mouse sera (samples) at RT for 60 min.
MATERIALS AND METHODS
45
Bound antibodies were detected using a 500-fold dilution of a biotinylated goat anti-
mouse IgG1/IgG2a/IgG2b antibody (1 h at RT), a 3000-fold dilution of streptavidin
coupled alkaline phosphatase and para-nitrophenylphosphate (pNPP) (development of
reaction takes 10 to 120 min at RT). The reaction between alkaline phosphatase and
pNPP gives a yellow water soluble reaction product. In between incubation steps, the
plate was washed three times with washing buffer (same as in IL-10 ELISA). Readout
was performed at 405 nm in a microplate reader and the results were analysed as
explained in section 2.6.1.1.
Note: The volume of all the added reagents was 100 µl/well.
2.6.3 Measurement of myeloma specific proteins
Measurement of M315 myeloma protein was performed as previously described [86].
Mice were longitudinally monitored for the presence of MOPC315.BM myeloma-specific
anti-DNP IgA antibodies in serum by ELISA. Briefly, 96 well plates were coated with
10 µg/ml 2,4-Dinitrophenol (DNP) (1 h/RT). After washing the plates three times with
PBS, nonspecific binding was blocked with 1 mg/ml of 5% BSA in PBS (1 h/RT).
Subsequently, sera were incubated in serial dilutions for 1 h/RT. Biotinylated detection
antibody (Goat anti-mouse IgA; 1 µg/ml) was then added, and later, a 3000-fold dilution
of streptavidin coupled alkaline phosphatase and finally pNPP. MOPC315.BM derived
monoclonal Ab were used as a standard. In-between incubation steps, plates were
washed three to five times with washing buffer. Readout was performed at 405 nm in a
microplate reader and the results were analysed as explained in section 2.6.1.1.
Note: The dilution buffer and wash buffer were same as in IL-10 ELISA (Section: 2.1.1).
All the reagents were added 100 µl/well.
2.7 Analysis of Neutrophil Migration
C5a is a strong proinflammatory and immunomodulatory mediator. One of the main
effector functions associated with C5a-C5aR binding is the increased cell motility and
ligand specific cell migration. In the thesis, C5a mediated effector functions on
neutrophils in vitro and in vivo were analyzed by two assays: (i) in vitro migration of
murine bone marrow derived neutrophils towards C5a using Boyden Chamber; (ii) in
MATERIALS AND METHODS
46
vivo infiltration of murine circulating neutrophils towards peritoneal cavity upon
intraperitoneal C5a injection.
2.7.1 Boyden chamber assay
Overview: This assay was first introduced by Boyden for the analysis of leukocyte
chemotaxis. The assay includes a chamber with two compartments separated by a
microporous membrane. The upper compartment consists of cells, while the lower
compartment is filled with a chemotactic agent. The cells are allowed to migrate through
the pores for an appropriate incubation time after which the membrane is stained and
the number of cells migrated to the lower side of the membrane is determined by
counting under a light microscope.
Method: Bone marrow–derived cells were resuspended in Gey’s Balanced Salt Solution
(GBSS) medium at a density of 6 × 10⁶ cells/ml. In some cases, prior to assay, cells were
incubated with 12 or 50 ng/ml IL-10, anti-IL10R antibody, sorted plasma cells or B cells,
MOPC315.BM for 45 minutes at 37°C. The chemoattractant C5a (10−8 M diluted in GBSS
medium) was placed in the bottom wells of a micro Boyden chemotaxis chamber and
overlaid with a 3-μm polycarbonate membrane. Then, 50 μl of the cells were placed in
the top wells and incubated for 30 min at 37°C. Subsequently, the membranes were
removed and the cells on the bottom side of the membrane were stained with Diff-Quik.
The numbers of migrated neutrophils in five high-power fields were counted, and the
number of neutrophils per mm2 was calculated by computer assisted light microscopy.
The neutrophils could be easily identified under light microscope due to their
multilobed nucleus. Results were determined from triplicate samples.
2.7.2 C5a mediated peritoneal inflammation
Mice were injected with C5a (200 nM, 100 μl, i.p.). After 4 h, mice were killed and the
peritoneal lavage fluid was extracted by flushing the peritoneal cavity with 5 ml sterile
PBS. Neutrophil numbers in peritoneal lavage fluid were determined by surface staining
and flow cytometry (Section 2.4.2). Neutrophils were either identified as GR1hiCD11b+
or Ly6ghi cells.
MATERIALS AND METHODS
47
2.8 Evaluation of Neutrophil Infiltration in Ears of Mice
2.8.1 Myeloperoxidase assay
Overview: This method utilizes myeloperoxidase (MPO), which is one of the enzymes
present in neutrophils as a marker for tissue neutrophil content. To extract and
solubilize MPO from neutrophils or skin, a detergent treatment with hexadecyl-
trimethylammonium bromide (HTAB) is performed. The MPO content determined by
this assay is directly related to the neutrophil number [95].
Method: MPO was extracted from both ears of mice by homogenization on ice first in
extraction buffer (450 µl), followed by 0.5% HTAB (500 µl). For effective extraction the
samples were frozen and thawed thrice at -80°C for 5 min each. To remove the ear tissue
the samples were centrifuged at 14000 rpm at 4°C for 15 min. MPO activity in the
supernatant fraction was measured by ELISA. Serial dilutions of the samples (starting
with 1:5) and a standard MPO solution (MPO from human leukocytes) (starting
concentration 1666 mU/ml) were performed in potassium-phosphate buffer. The
peroxidase activity was determined by addition of 50 µl TMB to 50 µl sample and the
reaction was stopped by adding 20% H2SO4 (as explained in section 2.6.1.1). The optical
density was measured at 450 nm. A standard reference curve was established using
known concentrations of standard MPO solution and concentration of MPO in the
samples was determined with reference to the standard curve as explained in section
2.6.1.1.
2.8.2 Quantitative reverse transcriptase-polymerase chain reaction (RT-PCR)
Overview: This technique was used to determine the RNA expression levels of
neutrophils as well as cytokines in the ears of the mice with experimental EBA. The basic
principles include extraction of ribonucleic acid (RNA) followed by reverse transcription
of RNA to complementary deoxyribonucleic acid (cDNA). A quantitative polymerase
chain reaction (PCR) using specific forward and reverse primers then makes multiple
copies of a particular DNA sequence. The amplified DNA is quantified in real time using
TaqMan probes. TaqMan probes are oligonucleotides with a fluorophore attached to the
5’ end and a quencher at the 3’ end. These probes attach to a target sequence and during
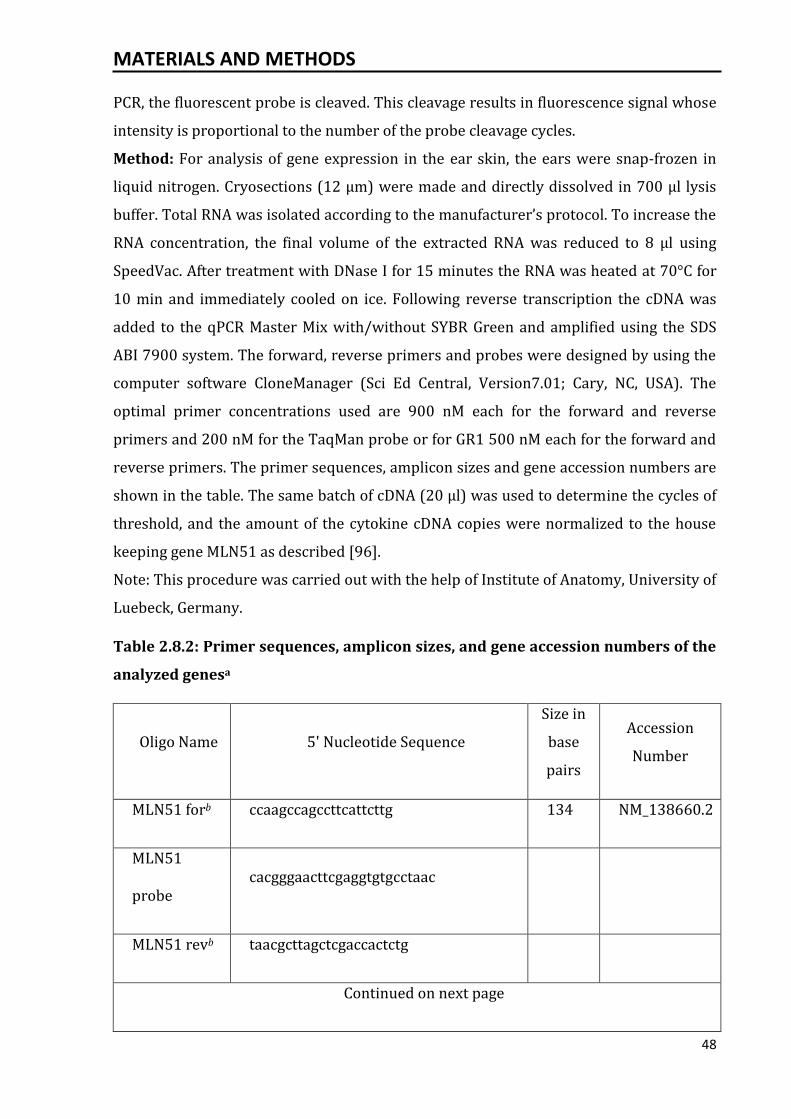
MATERIALS AND METHODS
48
PCR, the fluorescent probe is cleaved. This cleavage results in fluorescence signal whose
intensity is proportional to the number of the probe cleavage cycles.
Method: For analysis of gene expression in the ear skin, the ears were snap-frozen in
liquid nitrogen. Cryosections (12 µm) were made and directly dissolved in 700 µl lysis
buffer. Total RNA was isolated according to the manufacturer’s protocol. To increase the
RNA concentration, the final volume of the extracted RNA was reduced to 8 µl using
SpeedVac. After treatment with DNase I for 15 minutes the RNA was heated at 70°C for
10 min and immediately cooled on ice. Following reverse transcription the cDNA was
added to the qPCR Master Mix with/without SYBR Green and amplified using the SDS
ABI 7900 system. The forward, reverse primers and probes were designed by using the
computer software CloneManager (Sci Ed Central, Version7.01; Cary, NC, USA). The
optimal primer concentrations used are 900 nM each for the forward and reverse
primers and 200 nM for the TaqMan probe or for GR1 500 nM each for the forward and
reverse primers. The primer sequences, amplicon sizes and gene accession numbers are
shown in the table. The same batch of cDNA (20 µl) was used to determine the cycles of
threshold, and the amount of the cytokine cDNA copies were normalized to the house
keeping gene MLN51 as described [96].
Note: This procedure was carried out with the help of Institute of Anatomy, University of
Luebeck, Germany.
Table 2.8.2: Primer sequences, amplicon sizes, and gene accession numbers of the
analyzed genesa
Oligo Name 5' Nucleotide Sequence
Size in
base
pairs
Accession
Number
MLN51 forb ccaagccagccttcattcttg 134 NM_138660.2
MLN51
probe cacgggaacttcgaggtgtgcctaac
MLN51 revb taacgcttagctcgaccactctg
Continued on next page
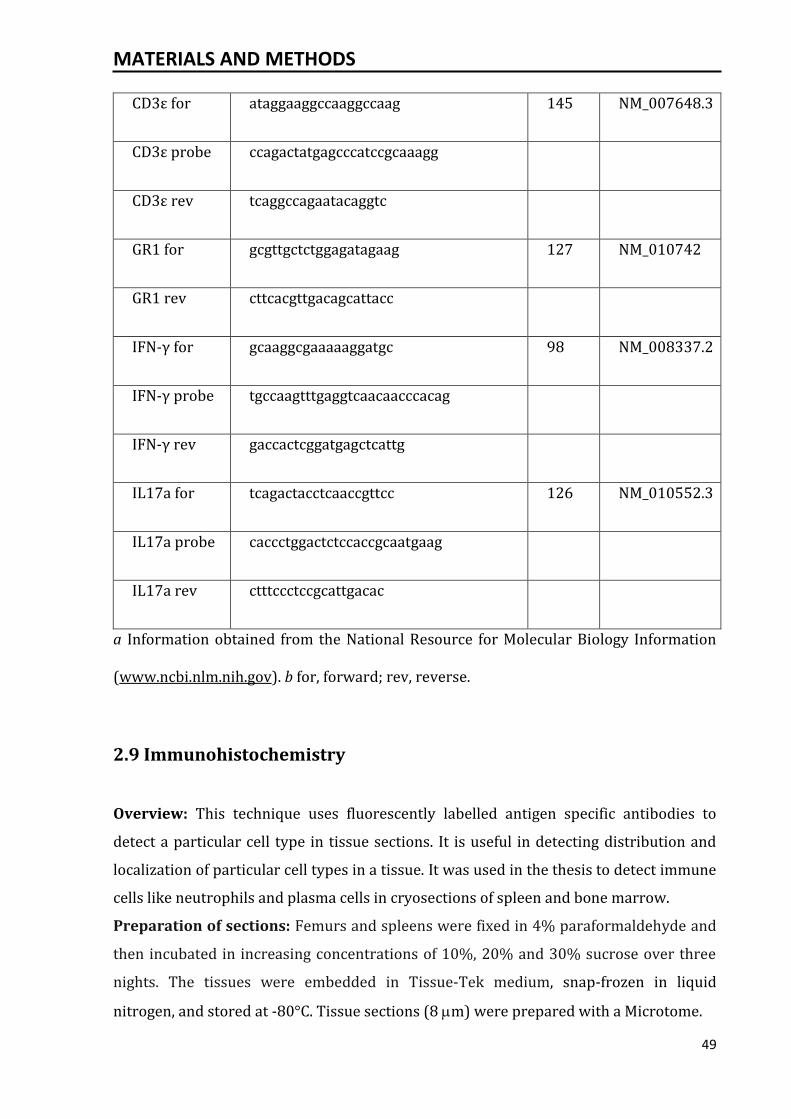
MATERIALS AND METHODS
49
CD3ε for ataggaaggccaaggccaag 145 NM_007648.3
CD3ε probe ccagactatgagcccatccgcaaagg
CD3ε rev tcaggccagaatacaggtc
GR1 for gcgttgctctggagatagaag 127 NM_010742
GR1 rev cttcacgttgacagcattacc
IFN-γ for gcaaggcgaaaaaggatgc 98 NM_008337.2
IFN-γ probe tgccaagtttgaggtcaacaacccacag
IFN-γ rev gaccactcggatgagctcattg
IL17a for tcagactacctcaaccgttcc 126 NM_010552.3
IL17a probe caccctggactctccaccgcaatgaag
IL17a rev ctttccctccgcattgacac
a Information obtained from the National Resource for Molecular Biology Information
(www.ncbi.nlm.nih.gov). b for, forward; rev, reverse.
2.9 Immunohistochemistry
Overview: This technique uses fluorescently labelled antigen specific antibodies to
detect a particular cell type in tissue sections. It is useful in detecting distribution and
localization of particular cell types in a tissue. It was used in the thesis to detect immune
cells like neutrophils and plasma cells in cryosections of spleen and bone marrow.
Preparation of sections: Femurs and spleens were fixed in 4% paraformaldehyde and
then incubated in increasing concentrations of 10%, 20% and 30% sucrose over three
nights. The tissues were embedded in Tissue-Tek medium, snap-frozen in liquid
nitrogen, and stored at -80°C. Tissue sections (8 m) were prepared with a Microtome.
MATERIALS AND METHODS
50
Staining: Sections were washed in PBS and nonspecific binding was blocked by
preincubation with 10% rat serum in PBS and anti-CD16/CD32. Staining with antibodies
and secondary reagents was performed for 1 hour and 30 min at room temperature,
respectively. In case of staining of samples containing GFP labelled cells, the GFP was
first stained with goat anti-mouse GFP antibody, followed by Alexa Fluor 488 labelled
donkey anti-goat IgG. The slides were washed thrice with PBS in between the staining.
The stained slides were stored at 4°C. Sections were analyzed by confocal microscopy
using Olympus IX81 microscope.
2.10 Statistics
Statistical calculations were performed using GraphPad Prism. Experiments with two
groups were analyzed by unpaired two-sided Student’s t test. Comparisons involving
multiple groups were analyzed in a two-stage procedure by one-way ANOVA. If the
ANOVA indicated a significant difference between the groups (P < 0.05), all groups were
further compared pairwise by Tukey's multiple comparison test. In case of comparisons
involving multiple groups with non-parametric data, Kruskal-Wallis test was performed.
* P < 0.05, ** P < 0.01, *** P < 0.001. In case of bar plots, data are expressed as mean ±
SEM as indicated in the figure legends.
For analysis of dose-dependency, Gnu R open source statistical software was used. Dose-
response curves were fitted using a logistic regression model, allowing determination of
the EC50 value. To check whether the overall assumption of a dose-dependency was
correct, Jonckheere Terpstra testing (package clinfun) was used.
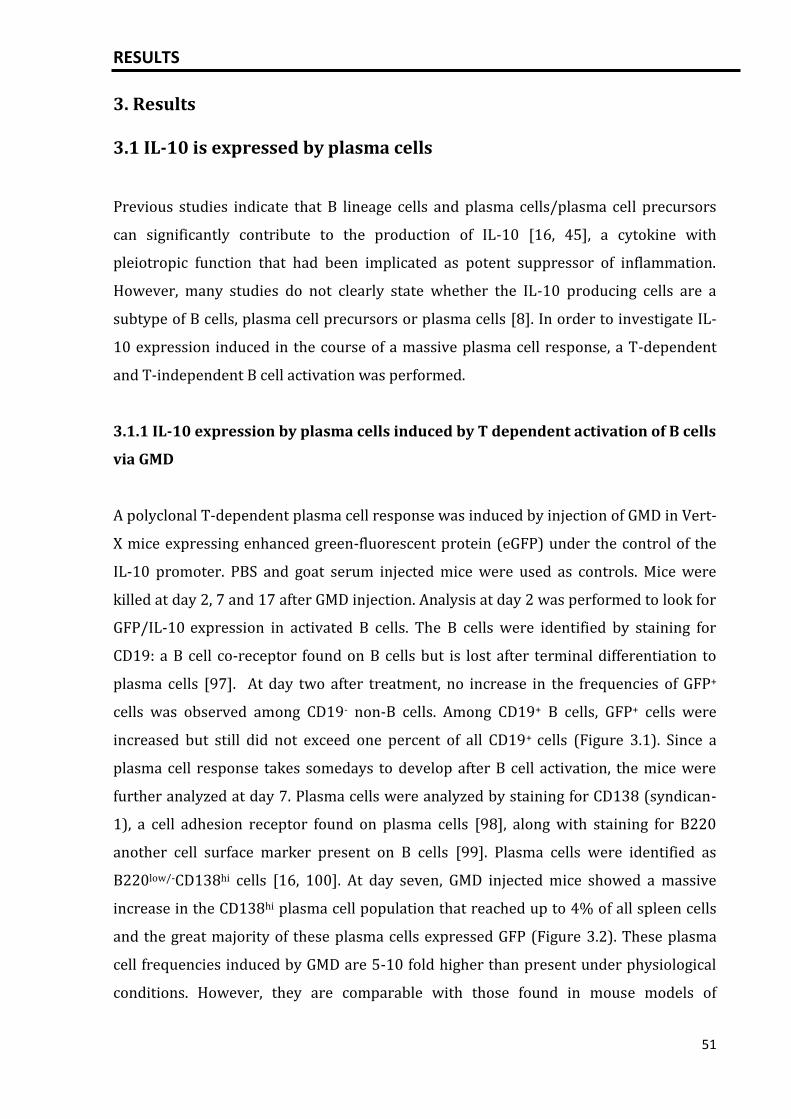
RESULTS
51
3. Results
3.1 IL-10 is expressed by plasma cells
Previous studies indicate that B lineage cells and plasma cells/plasma cell precursors
can significantly contribute to the production of IL-10 [16, 45], a cytokine with
pleiotropic function that had been implicated as potent suppressor of inflammation.
However, many studies do not clearly state whether the IL-10 producing cells are a
subtype of B cells, plasma cell precursors or plasma cells [8]. In order to investigate IL-
10 expression induced in the course of a massive plasma cell response, a T-dependent
and T-independent B cell activation was performed.
3.1.1 IL-10 expression by plasma cells induced by T dependent activation of B cells
via GMD
A polyclonal T-dependent plasma cell response was induced by injection of GMD in Vert-
X mice expressing enhanced green-fluorescent protein (eGFP) under the control of the
IL-10 promoter. PBS and goat serum injected mice were used as controls. Mice were
killed at day 2, 7 and 17 after GMD injection. Analysis at day 2 was performed to look for
GFP/IL-10 expression in activated B cells. The B cells were identified by staining for
CD19: a B cell co-receptor found on B cells but is lost after terminal differentiation to
plasma cells [97]. At day two after treatment, no increase in the frequencies of GFP+
cells was observed among CD19- non-B cells. Among CD19+ B cells, GFP+ cells were
increased but still did not exceed one percent of all CD19+ cells (Figure 3.1). Since a
plasma cell response takes somedays to develop after B cell activation, the mice were
further analyzed at day 7. Plasma cells were analyzed by staining for CD138 (syndican-
1), a cell adhesion receptor found on plasma cells [98], along with staining for B220
another cell surface marker present on B cells [99]. Plasma cells were identified as
B220low/-CD138hi cells [16, 100]. At day seven, GMD injected mice showed a massive
increase in the CD138hi plasma cell population that reached up to 4% of all spleen cells
and the great majority of these plasma cells expressed GFP (Figure 3.2). These plasma
cell frequencies induced by GMD are 5-10 fold higher than present under physiological
conditions. However, they are comparable with those found in mouse models of
RESULTS
52
autoimmune systemic lupus [51] or plasma cell frequencies induced by bacterial LPS or
through severe infection [49].
The frequencies of GFP+ cells were not increased among CD19+ B cells that did not
express CD138, but GMD injected mice showed a moderate increase in GFP+ cells in the
CD4+ T cell population (Figure 3.3). GMD primarily activates follicular B cells via cross-
linking of their antigen receptors. Although goat serum proteins other than anti-IgD
antibody contained in the GMD can potentially initiate T cell responses in mice, no
increase of GFP+ T cells was observed in the goat serum control compared to mice
injected with PBS, suggesting that IL-10 production by CD4 T cells was initiated by IgD-
activated B lineage cells. However, plasma cells accounted for the great majority of the
increase in GFP+ cell numbers (Figure 3.4).
Notably, this percentage might be an underestimation, because the whole population of
CD138hi plasma cells was shifted instead of splitting into two subpopulations of GFP+
and GFP- cells which indicates that most of the plasma cells express GFP. No increase in
plasma cells or GFP+ plasma cells was seen in the goat serum injected mice, suggesting
that the goat serum proteins present in the GMD cannot lead to a huge plasma cell
response and the response is specific to the anti-IgD proteins. The different cell types in
spleen were further assessed on day 17, to see if the increase in plasma cells and GFP
expression was long lasting. At day 17, a small increase in the frequencies of
GFP+CD138hi plasma cells was observed in GMD injected mice. Thus, the great majority
of GFP+ cells in this T-dependent B cell response were plasma cells which accounted for
most of the GFP/IL-10 expression on day 7 i.e. at the peak of the plasma cell response.
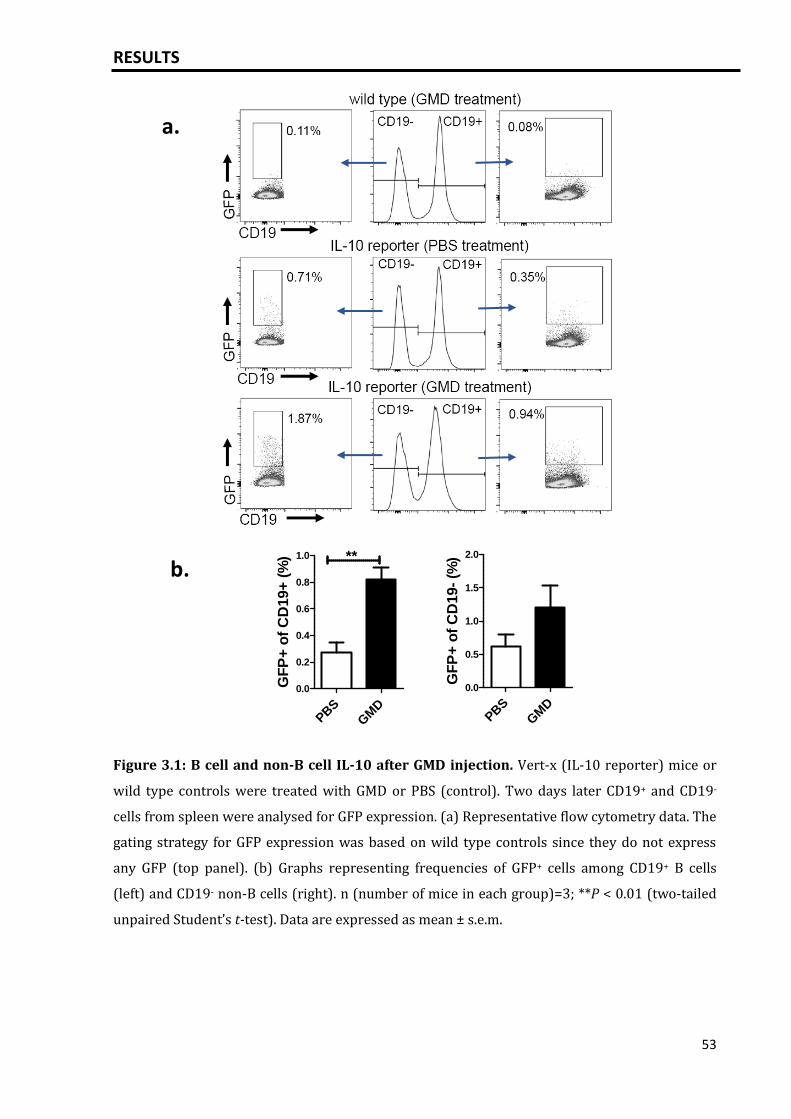
RESULTS
53
Figure 3.1: B cell and non-B cell IL-10 after GMD injection. Vert-x (IL-10 reporter) mice or
wild type controls were treated with GMD or PBS (control). Two days later CD19+ and CD19-
cells from spleen were analysed for GFP expression. (a) Representative flow cytometry data. The
gating strategy for GFP expression was based on wild type controls since they do not express
any GFP (top panel). (b) Graphs representing frequencies of GFP+ cells among CD19+ B cells
(left) and CD19- non-B cells (right). n (number of mice in each group)=3; **P < 0.01 (two-tailed
unpaired Student’s t-test). Data are expressed as mean ± s.e.m.
a.
b.
PBS
GM
D
0.0
0.5
1.0
1.5
2.0
GF
P+
of
CD
19-
(%)
PBS
GM
D
0.0
0.2
0.4
0.6
0.8
1.0 **
GF
P+
of
CD
19+
(%
)
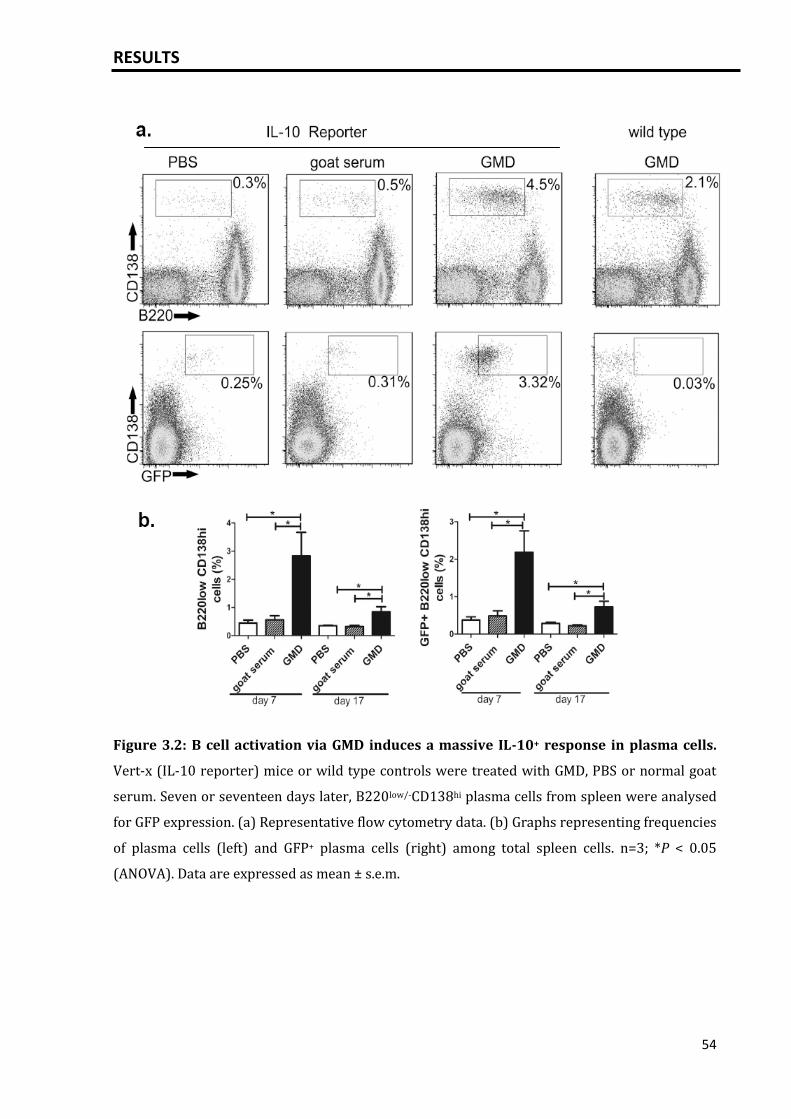
RESULTS
54
Figure 3.2: B cell activation via GMD induces a massive IL-10+ response in plasma cells.
Vert-x (IL-10 reporter) mice or wild type controls were treated with GMD, PBS or normal goat
serum. Seven or seventeen days later, B220low/-CD138hi plasma cells from spleen were analysed
for GFP expression. (a) Representative flow cytometry data. (b) Graphs representing frequencies
of plasma cells (left) and GFP+ plasma cells (right) among total spleen cells. n=3; *P < 0.05
(ANOVA). Data are expressed as mean ± s.e.m.
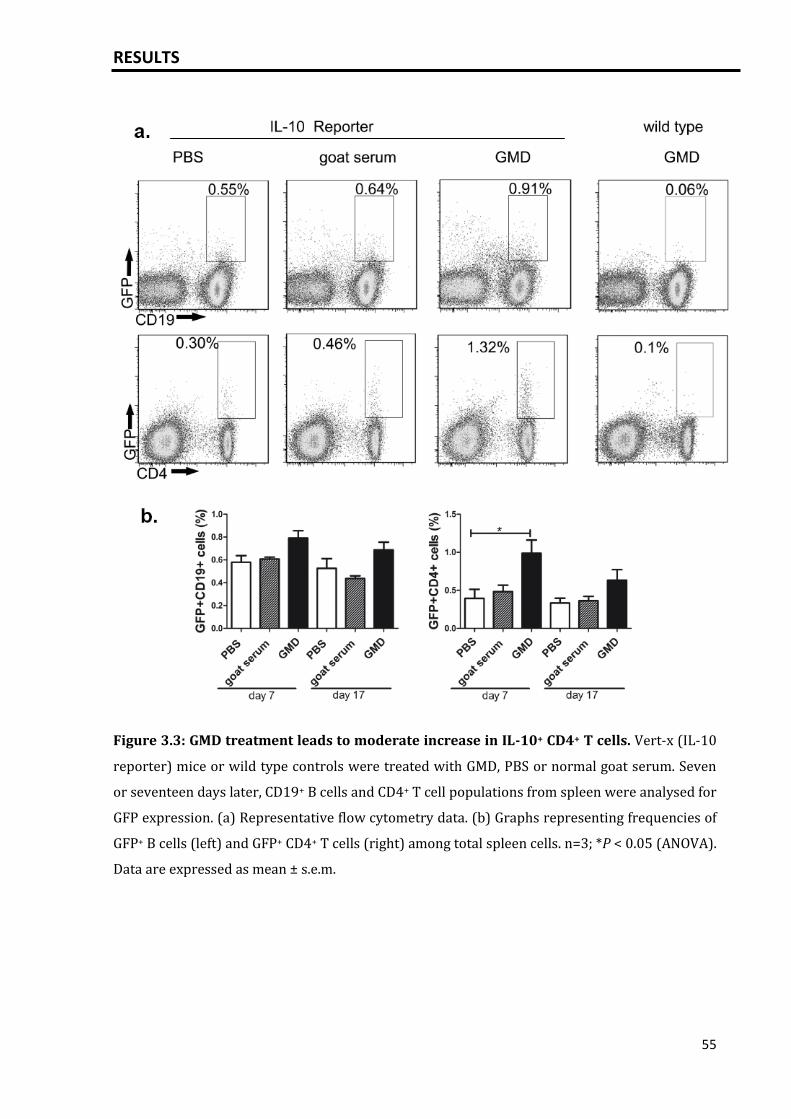
RESULTS
55
Figure 3.3: GMD treatment leads to moderate increase in IL-10+ CD4+ T cells. Vert-x (IL-10
reporter) mice or wild type controls were treated with GMD, PBS or normal goat serum. Seven
or seventeen days later, CD19+ B cells and CD4+ T cell populations from spleen were analysed for
GFP expression. (a) Representative flow cytometry data. (b) Graphs representing frequencies of
GFP+ B cells (left) and GFP+ CD4+ T cells (right) among total spleen cells. n=3; *P < 0.05 (ANOVA).
Data are expressed as mean ± s.e.m.
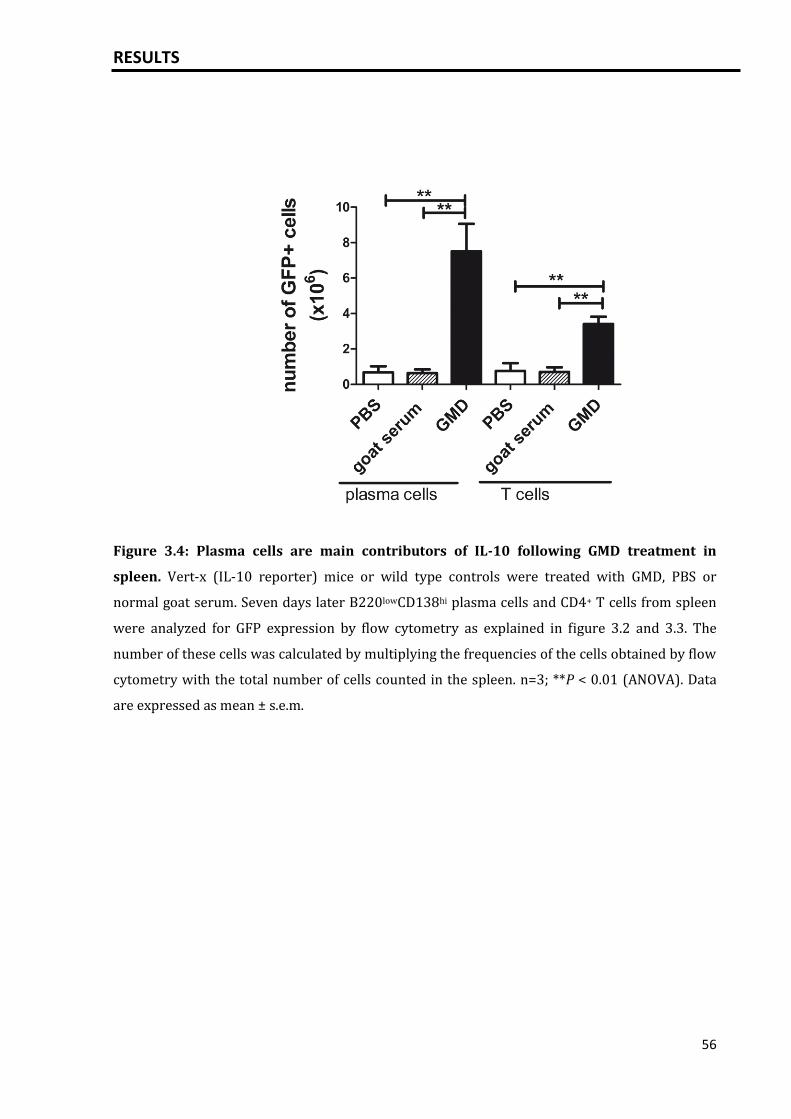
RESULTS
56
Figure 3.4: Plasma cells are main contributors of IL-10 following GMD treatment in
spleen. Vert-x (IL-10 reporter) mice or wild type controls were treated with GMD, PBS or
normal goat serum. Seven days later B220lowCD138hi plasma cells and CD4+ T cells from spleen
were analyzed for GFP expression by flow cytometry as explained in figure 3.2 and 3.3. The
number of these cells was calculated by multiplying the frequencies of the cells obtained by flow
cytometry with the total number of cells counted in the spleen. n=3; **P < 0.01 (ANOVA). Data
are expressed as mean ± s.e.m.
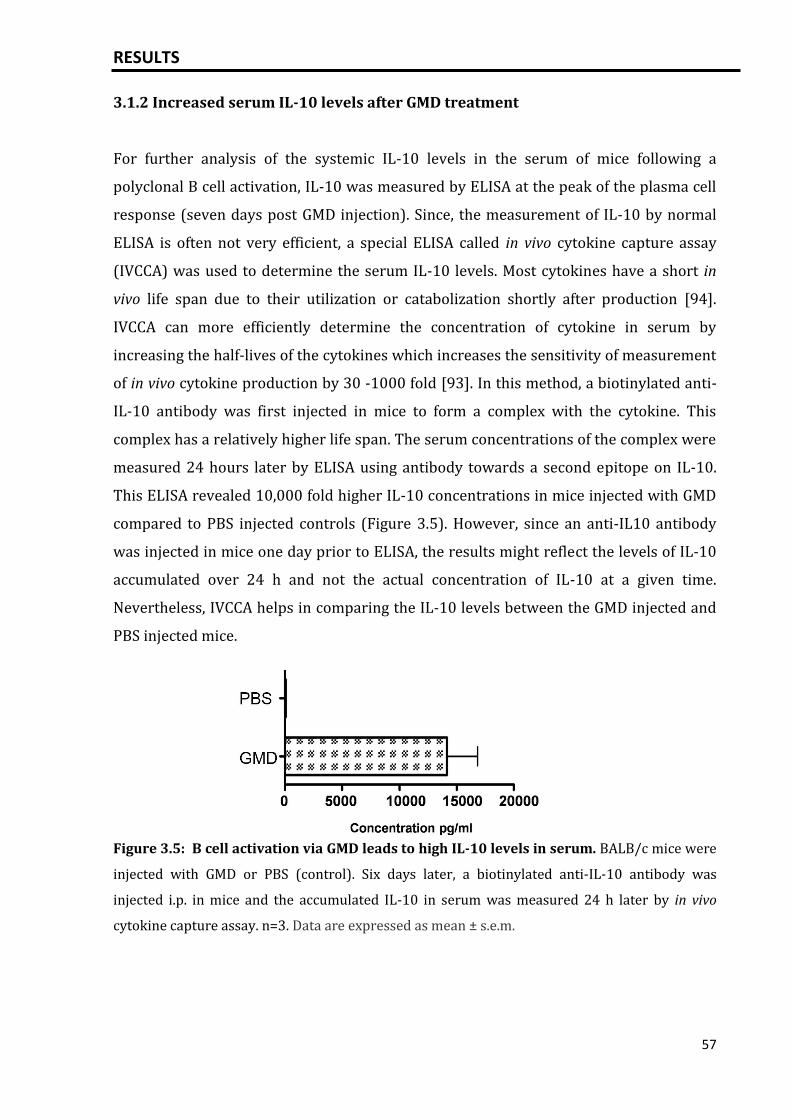
RESULTS
57
3.1.2 Increased serum IL-10 levels after GMD treatment
For further analysis of the systemic IL-10 levels in the serum of mice following a
polyclonal B cell activation, IL-10 was measured by ELISA at the peak of the plasma cell
response (seven days post GMD injection). Since, the measurement of IL-10 by normal
ELISA is often not very efficient, a special ELISA called in vivo cytokine capture assay
(IVCCA) was used to determine the serum IL-10 levels. Most cytokines have a short in
vivo life span due to their utilization or catabolization shortly after production [94].
IVCCA can more efficiently determine the concentration of cytokine in serum by
increasing the half-lives of the cytokines which increases the sensitivity of measurement
of in vivo cytokine production by 30 -1000 fold [93]. In this method, a biotinylated anti-
IL-10 antibody was first injected in mice to form a complex with the cytokine. This
complex has a relatively higher life span. The serum concentrations of the complex were
measured 24 hours later by ELISA using antibody towards a second epitope on IL-10.
This ELISA revealed 10,000 fold higher IL-10 concentrations in mice injected with GMD
compared to PBS injected controls (Figure 3.5). However, since an anti-IL10 antibody
was injected in mice one day prior to ELISA, the results might reflect the levels of IL-10
accumulated over 24 h and not the actual concentration of IL-10 at a given time.
Nevertheless, IVCCA helps in comparing the IL-10 levels between the GMD injected and
PBS injected mice.
Figure 3.5: B cell activation via GMD leads to high IL-10 levels in serum. BALB/c mice were
injected with GMD or PBS (control). Six days later, a biotinylated anti-IL-10 antibody was
injected i.p. in mice and the accumulated IL-10 in serum was measured 24 h later by in vivo
cytokine capture assay. n=3. Data are expressed as mean ± s.e.m.
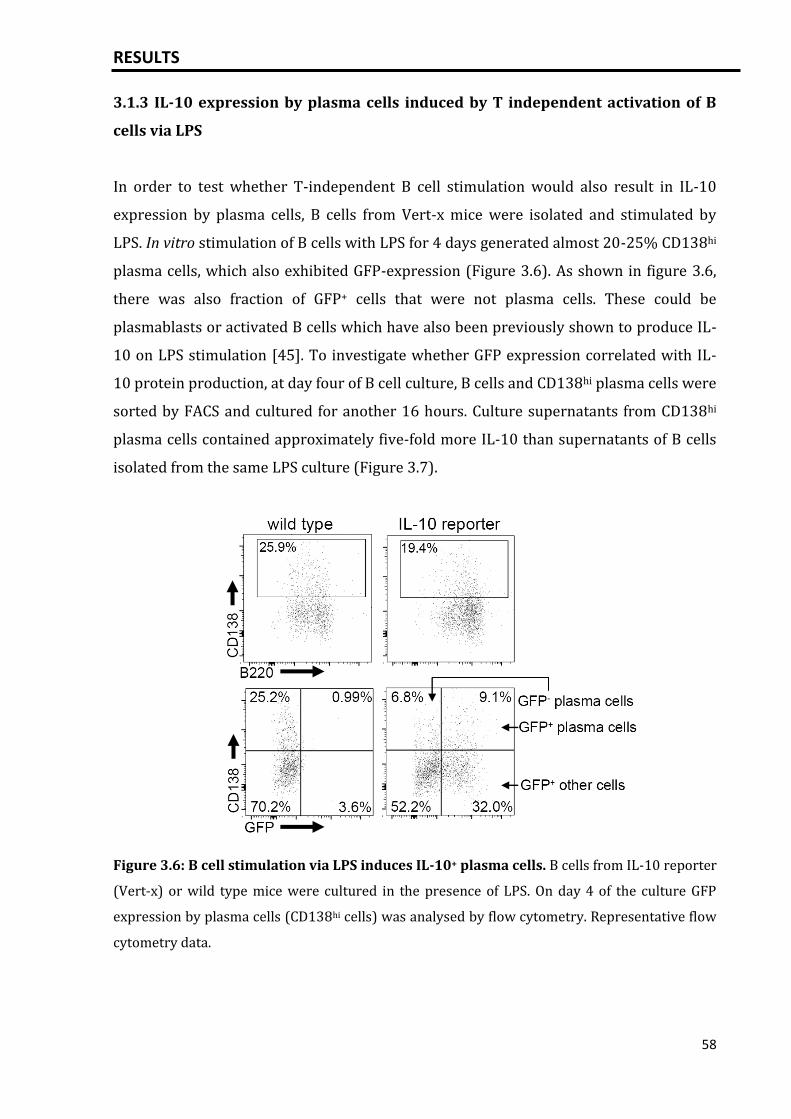
RESULTS
58
3.1.3 IL-10 expression by plasma cells induced by T independent activation of B
cells via LPS
In order to test whether T-independent B cell stimulation would also result in IL-10
expression by plasma cells, B cells from Vert-x mice were isolated and stimulated by
LPS. In vitro stimulation of B cells with LPS for 4 days generated almost 20-25% CD138hi
plasma cells, which also exhibited GFP-expression (Figure 3.6). As shown in figure 3.6,
there was also fraction of GFP+ cells that were not plasma cells. These could be
plasmablasts or activated B cells which have also been previously shown to produce IL-
10 on LPS stimulation [45]. To investigate whether GFP expression correlated with IL-
10 protein production, at day four of B cell culture, B cells and CD138hi plasma cells were
sorted by FACS and cultured for another 16 hours. Culture supernatants from CD138hi
plasma cells contained approximately five-fold more IL-10 than supernatants of B cells
isolated from the same LPS culture (Figure 3.7).
Figure 3.6: B cell stimulation via LPS induces IL-10+ plasma cells. B cells from IL-10 reporter
(Vert-x) or wild type mice were cultured in the presence of LPS. On day 4 of the culture GFP
expression by plasma cells (CD138hi cells) was analysed by flow cytometry. Representative flow
cytometry data.
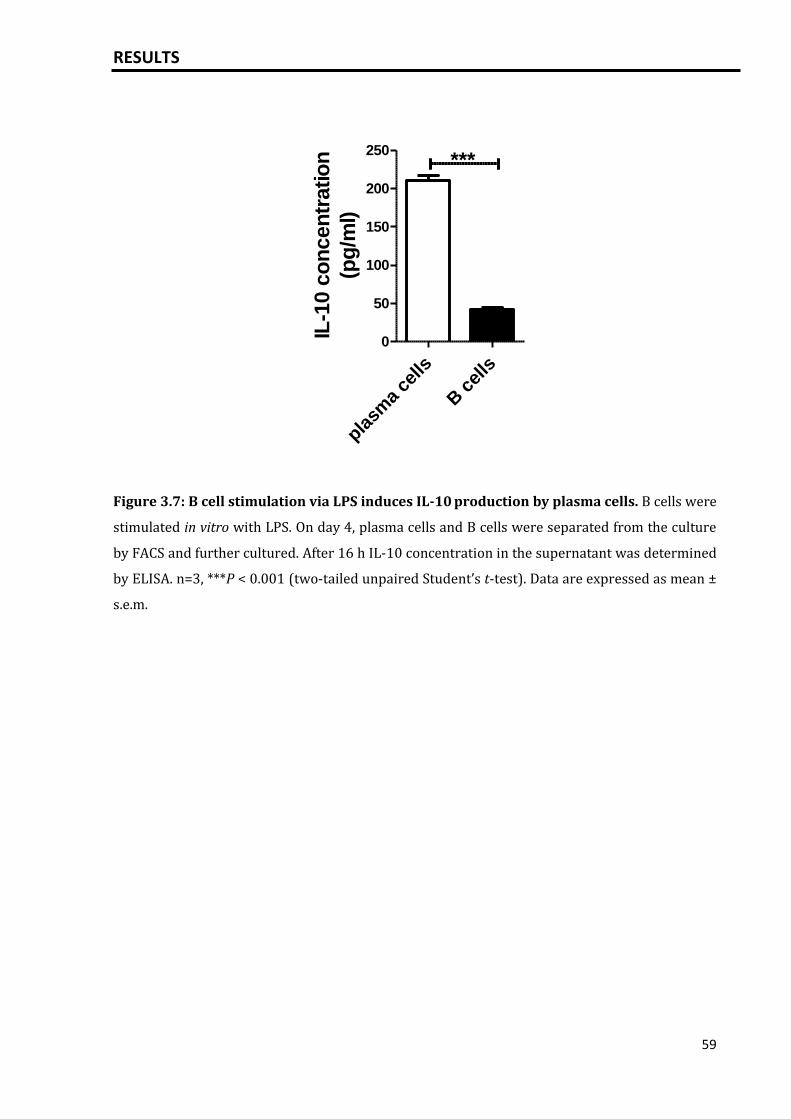
RESULTS
59
Figure 3.7: B cell stimulation via LPS induces IL-10 production by plasma cells. B cells were
stimulated in vitro with LPS. On day 4, plasma cells and B cells were separated from the culture
by FACS and further cultured. After 16 h IL-10 concentration in the supernatant was determined
by ELISA. n=3, ***P < 0.001 (two-tailed unpaired Student’s t-test). Data are expressed as mean ±
s.e.m.
plasm
a ce
lls
B c
ells
0
50
100
150
200
250***
IL-1
0 c
on
cen
tratio
n
(pg
/ml)
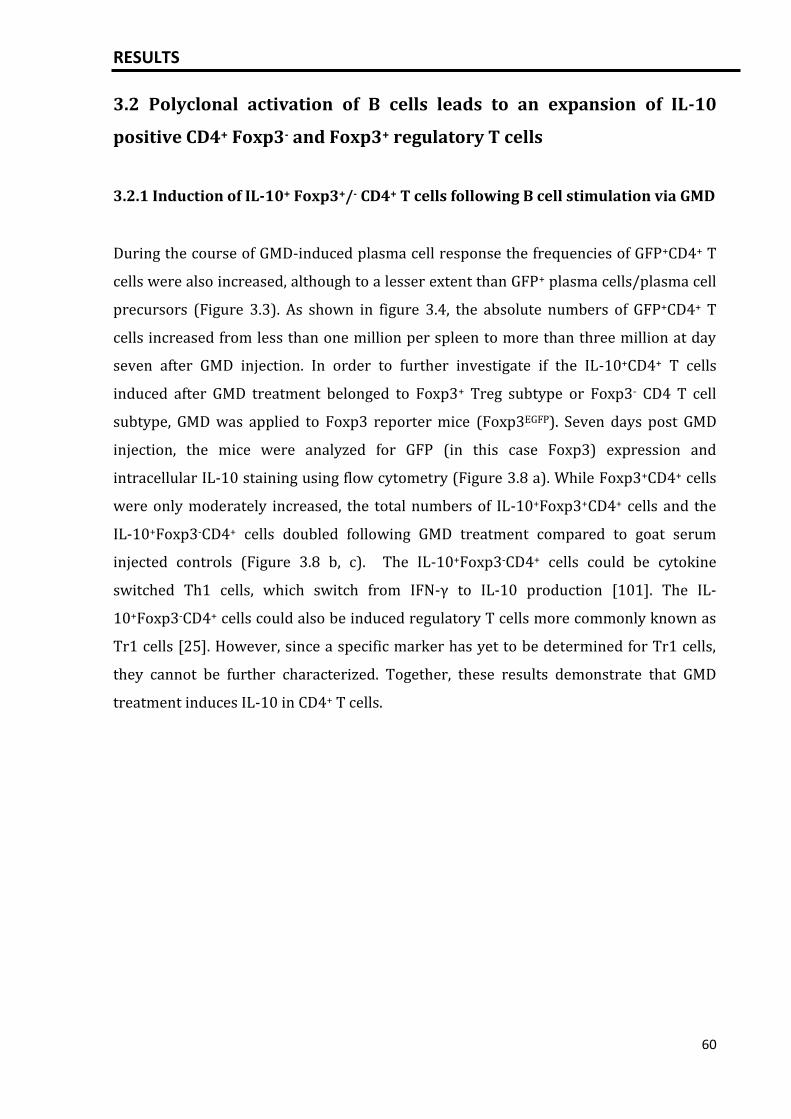
RESULTS
60
3.2 Polyclonal activation of B cells leads to an expansion of IL-10
positive CD4+ Foxp3- and Foxp3+ regulatory T cells
3.2.1 Induction of IL-10+ Foxp3+/- CD4+ T cells following B cell stimulation via GMD
During the course of GMD-induced plasma cell response the frequencies of GFP+CD4+ T
cells were also increased, although to a lesser extent than GFP+ plasma cells/plasma cell
precursors (Figure 3.3). As shown in figure 3.4, the absolute numbers of GFP+CD4+ T
cells increased from less than one million per spleen to more than three million at day
seven after GMD injection. In order to further investigate if the IL-10+CD4+ T cells
induced after GMD treatment belonged to Foxp3+ Treg subtype or Foxp3- CD4 T cell
subtype, GMD was applied to Foxp3 reporter mice (Foxp3EGFP). Seven days post GMD
injection, the mice were analyzed for GFP (in this case Foxp3) expression and
intracellular IL-10 staining using flow cytometry (Figure 3.8 a). While Foxp3+CD4+ cells
were only moderately increased, the total numbers of IL-10+Foxp3+CD4+ cells and the
IL-10+Foxp3-CD4+ cells doubled following GMD treatment compared to goat serum
injected controls (Figure 3.8 b, c). The IL-10+Foxp3-CD4+ cells could be cytokine
switched Th1 cells, which switch from IFN-γ to IL-10 production [101]. The IL-
10+Foxp3-CD4+ cells could also be induced regulatory T cells more commonly known as
Tr1 cells [25]. However, since a specific marker has yet to be determined for Tr1 cells,
they cannot be further characterized. Together, these results demonstrate that GMD
treatment induces IL-10 in CD4+ T cells.
RESULTS
61
Figure 3.8: GMD treatment augments IL-10 production in Foxp3+ and Foxp3- CD4 T cells.
Foxp3EGFP mice were treated with GMD or goat serum. Seven days later Foxp3+CD4+ (Treg) cells,
IL-10+Foxp3+CD4+ (IL-10+ Treg) cells, IL-10+Foxp3-CD4+ cell populations were analyzed in
spleen. (a) Representative flow cytometry data. (b) Graphs representing frequencies of Foxp3+
Tregs among CD4+ T cells (left), IL-10+ cells among Foxp3+CD4+ Tregs (middle) and IL-10+ cells
among FoxP3-CD4+ cells (right). (c) Graphs representing the total number of Foxp3+CD4+ T cells
(left), IL-10+Foxp3+CD4+ cells (middle), IL-10+Foxp3-CD4+ cells (right) in spleen. The total
number of cells was calculated by multiplying the frequencies of the cells obtained by flow
cytometry with the total number of cells counted in the spleen. Representative data are shown
for one of two experiments. n=3; *P < 0.05, **P < 0.01, ***P < 0.001 (two-tailed unpaired
Student’s t-test). Data are expressed as mean ± s.e.m.
b.
c.
a.
RESULTS
62
3.2.2 B lineage derived IL-10 promotes IL-10+ T cells following GMD injection
GMD induced plasmacytosis led to increase in IL-10+ CD4+ T cells as well as CD4+ Foxp3+
Tregs. In order to investigate if the increased frequencies of these cells were specifically
due to high amount of IL-10 produced by large numbers of plasma cells in this model,
GMD injection was performed in B cell specific IL-10 KO mice (IL-10FL/FLCD19-Cre+). IL-
10 is well known for inhibiting IFN-γ expression in T cells [101]. Therefore, the splenic
CD4 T cells were analyzed for IL-10 as well as IFN-γ expression, 1 week post GMD
treatment. The frequencies of IL-10+ CD4 T cells in IL-10FL/FLCD19-Cre- controls were 2-
fold higher than in B cell specific IL-10 KO mice. On the other hand, the frequencies of
IFN-γ+ CD4 T cells were halved in the controls (Figure 3.9). Consequently, the ratio of the
IFN-g+/IL-10+ CD4 T cells was 2.5 times higher in B cell specific IL-10 KO mice compared
to controls. This observation suggests that the increase in IL-10+ CD4 T cells following
GMD treatment is induced by increase in IL-10 among plasma cells as illustrated in
section 3.1. However, since a control with no GMD injection was not used in the
experiment, the possibility that there is induction of IL-10+ CD4 T cells also in B cell
specific IL-10 KO mice but lower than the induction observed in IL-10FL/FLCD19-Cre-
controls cannot be excluded. Due to lack of enough mice during the course of the thesis,
the experiment could not be repeated. Nevertheless, the result shows the significance of
B lineage cell IL-10 in induction of IL-10+ CD4 T cells. Although a change in frequency of
IL-10+ and IFN-γ+ CD4 T cells was observed, the frequencies of Foxp3+ Tregs remained
unchanged among the two groups (Figure 3.10) suggesting that Treg induction following
GMD treatment is not dependent on IL-10 from B lineage cells. The B cell activation via
GMD could be sufficient for the increase in Tregs.
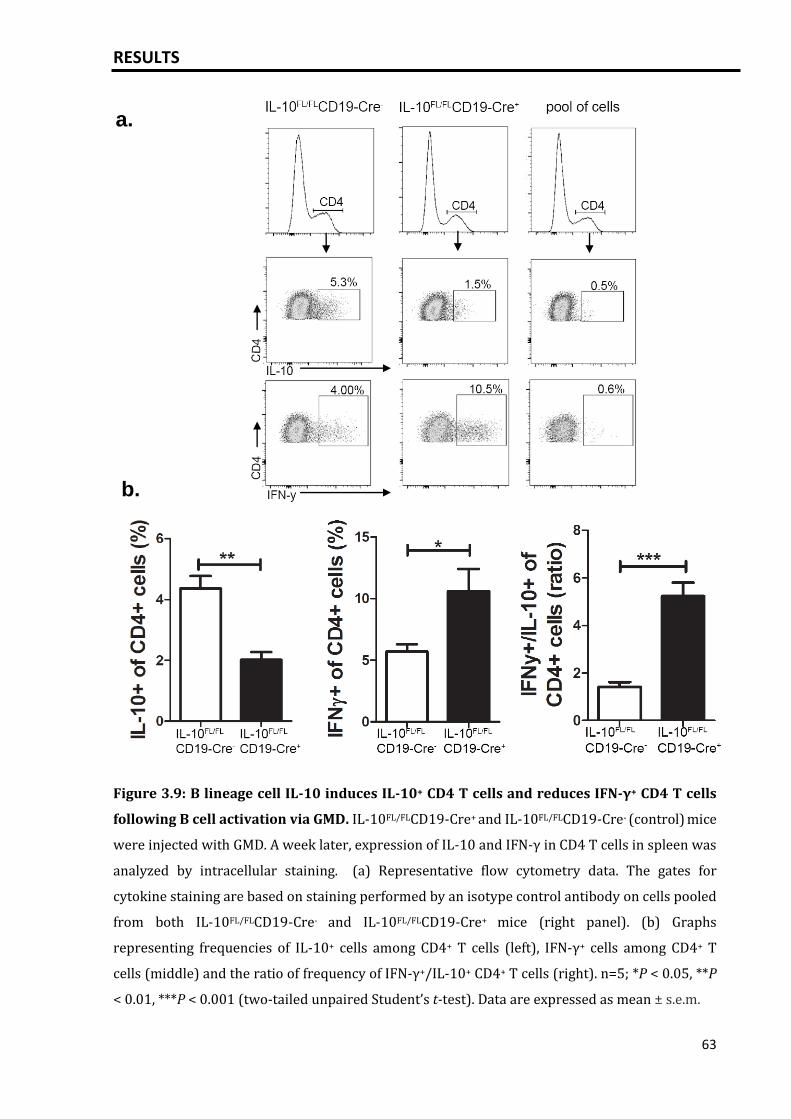
RESULTS
63
Figure 3.9: B lineage cell IL-10 induces IL-10+ CD4 T cells and reduces IFN-γ+ CD4 T cells
following B cell activation via GMD. IL-10FL/FLCD19-Cre+ and IL-10FL/FLCD19-Cre- (control) mice
were injected with GMD. A week later, expression of IL-10 and IFN-γ in CD4 T cells in spleen was
analyzed by intracellular staining. (a) Representative flow cytometry data. The gates for
cytokine staining are based on staining performed by an isotype control antibody on cells pooled
from both IL-10FL/FLCD19-Cre- and IL-10FL/FLCD19-Cre+ mice (right panel). (b) Graphs
representing frequencies of IL-10+ cells among CD4+ T cells (left), IFN-γ+ cells among CD4+ T
cells (middle) and the ratio of frequency of IFN-γ+/IL-10+ CD4+ T cells (right). n=5; *P < 0.05, **P
< 0.01, ***P < 0.001 (two-tailed unpaired Student’s t-test). Data are expressed as mean ± s.e.m.
a.
b.
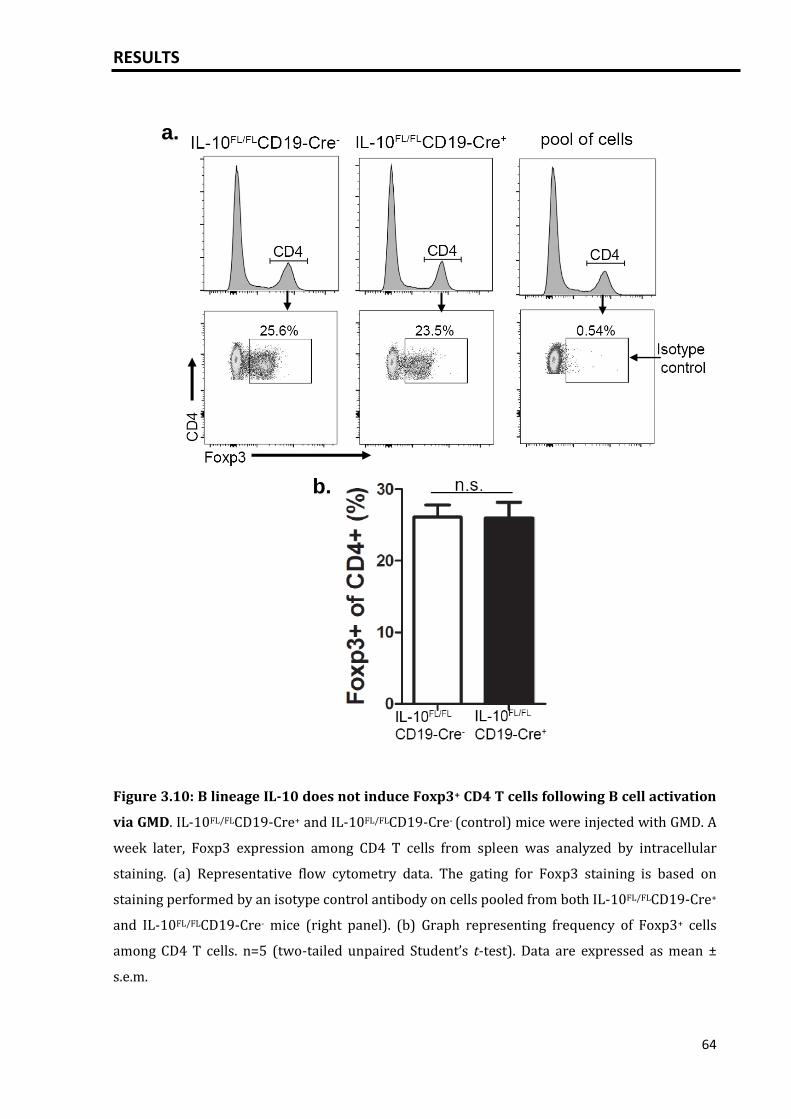
RESULTS
64
Figure 3.10: B lineage IL-10 does not induce Foxp3+ CD4 T cells following B cell activation
via GMD. IL-10FL/FLCD19-Cre+ and IL-10FL/FLCD19-Cre- (control) mice were injected with GMD. A
week later, Foxp3 expression among CD4 T cells from spleen was analyzed by intracellular
staining. (a) Representative flow cytometry data. The gating for Foxp3 staining is based on
staining performed by an isotype control antibody on cells pooled from both IL-10FL/FLCD19-Cre+
and IL-10FL/FLCD19-Cre- mice (right panel). (b) Graph representing frequency of Foxp3+ cells
among CD4 T cells. n=5 (two-tailed unpaired Student’s t-test). Data are expressed as mean ±
s.e.m.
a.
b.
RESULTS
65
3.3 GMD induced and neoplastic plasmacytosis result in IL-10
mediated suppression of neutrophil migration towards C5a
3.3.1 High plasma cell loads are associated with a change in neutrophil
compartment
In the present study, at the peak of high plasma cell response (at day 7) after GMD
injection, apart from B and T cells other immune cells like dendritic cells, macrophages
and neutrophils were also analyzed. While there was no difference in the frequencies of
dendritic cells and macrophages between GMD injected and goat serum injected control
mice, increase in the neutrophil populations in bone marrow and spleen was observed
at the peak of plasma cell response (Figure 3.11). The neutrophils were detected either
with anti-GR-1 (Ly6G/C) antibody or with anti-Ly6G antibody. Both antibodies are
widely accepted to analyze neutrophils via flow cytometry [70, 102].
In order to investigate if high plasma cell frequencies found in case of multiple myeloma
could also lead to similar effect on neutrophil frequencies, the neutrophils were
analyzed in a mouse model for multiple myeloma. The disease was induced in mice by
adoptive transfer of a variant of mineral oil induced plasmacytomas (MOPC) called
MOPC315.BM cells. The MOPC315.BM cells have been previously shown to develop a
phenotype similar to multiple myeloma in mice [86]. The disease development was
monitored by measuring myeloma specific titers in the serum. Neutrophil frequencies in
spleen increased with myeloma progression (Figure 3.12 c), indicating that high plasma
cell loads can modulate neutrophil compartments. Interestingly, no change was
observed in neutrophil frequencies in bone marrow with myeloma progression (Figure
3.12 c). Out of the three mice with myeloma, the two mice with moderate myeloma load
showed increase in neutrophil frequencies in bone marrow, however one mouse with
very high myeloma load displayed decreased neutrophil frequencies compared to
controls with no myeloma disease (Figure 3.12 a, b). This indicates that, since
MOPC315.BM cells exhibit tropism to bone marrow, high loads of these cells could
exploit the bone marrow, leading to reduced neutrophil frequencies in bone marrow.
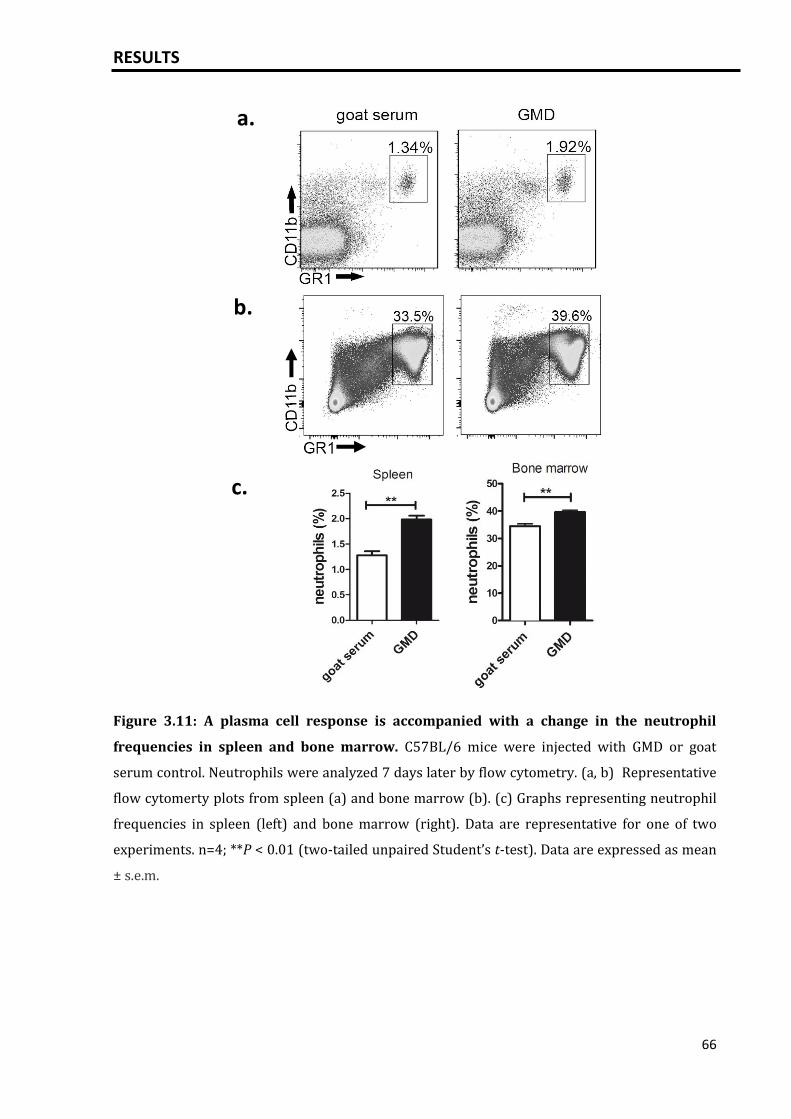
RESULTS
66
Figure 3.11: A plasma cell response is accompanied with a change in the neutrophil
frequencies in spleen and bone marrow. C57BL/6 mice were injected with GMD or goat
serum control. Neutrophils were analyzed 7 days later by flow cytometry. (a, b) Representative
flow cytomerty plots from spleen (a) and bone marrow (b). (c) Graphs representing neutrophil
frequencies in spleen (left) and bone marrow (right). Data are representative for one of two
experiments. n=4; **P < 0.01 (two-tailed unpaired Student’s t-test). Data are expressed as mean
± s.e.m.
a.
b.
c.
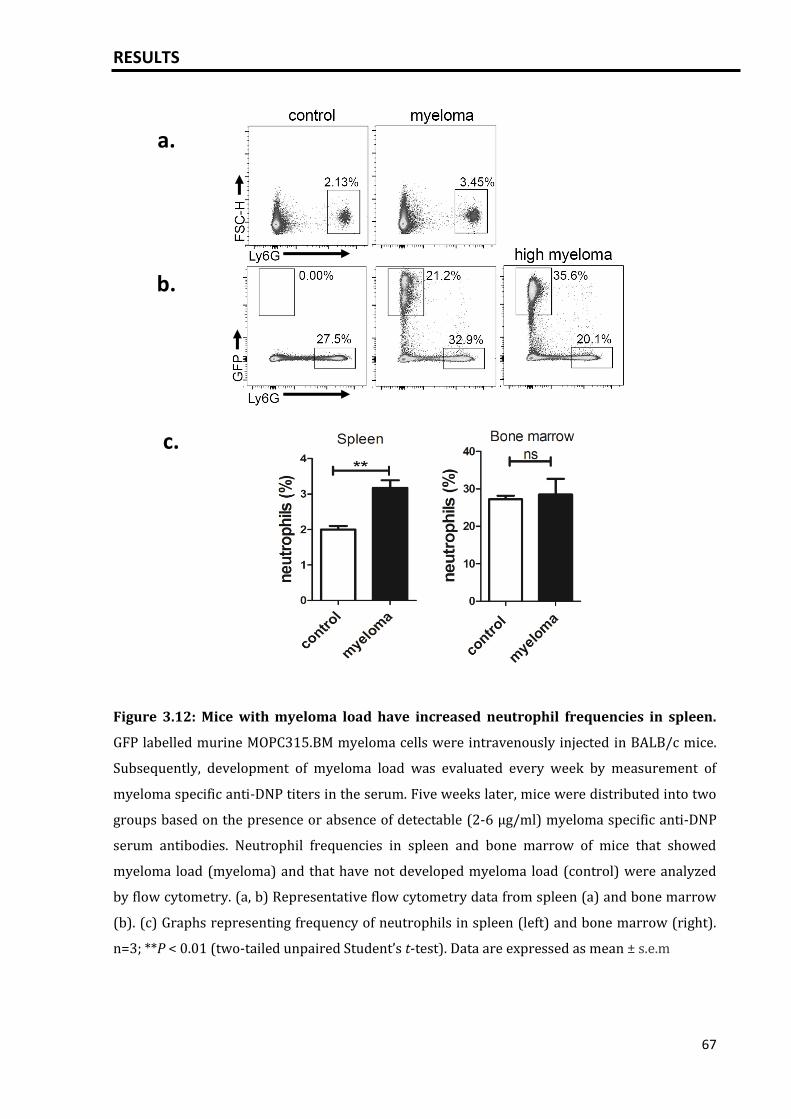
RESULTS
67
Figure 3.12: Mice with myeloma load have increased neutrophil frequencies in spleen.
GFP labelled murine MOPC315.BM myeloma cells were intravenously injected in BALB/c mice.
Subsequently, development of myeloma load was evaluated every week by measurement of
myeloma specific anti-DNP titers in the serum. Five weeks later, mice were distributed into two
groups based on the presence or absence of detectable (2-6 µg/ml) myeloma specific anti-DNP
serum antibodies. Neutrophil frequencies in spleen and bone marrow of mice that showed
myeloma load (myeloma) and that have not developed myeloma load (control) were analyzed
by flow cytometry. (a, b) Representative flow cytometry data from spleen (a) and bone marrow
(b). (c) Graphs representing frequency of neutrophils in spleen (left) and bone marrow (right).
n=3; **P < 0.01 (two-tailed unpaired Student’s t-test). Data are expressed as mean ± s.e.m
a.
b.
c.
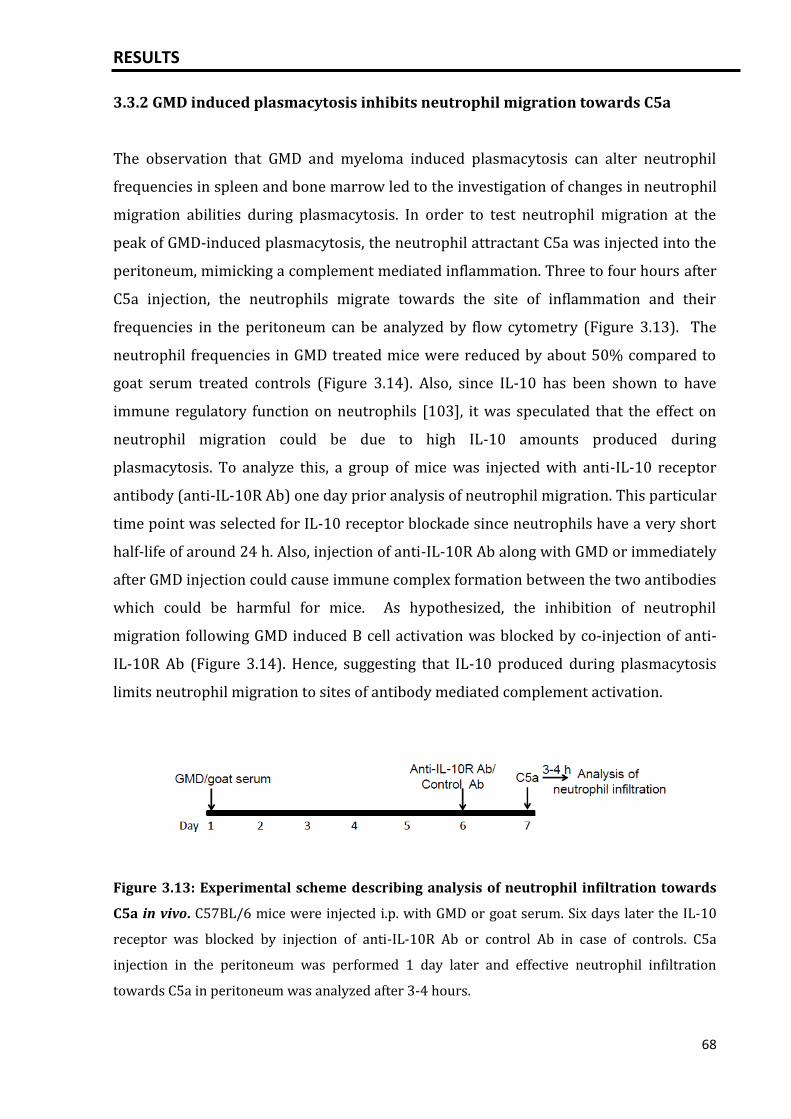
RESULTS
68
3.3.2 GMD induced plasmacytosis inhibits neutrophil migration towards C5a
The observation that GMD and myeloma induced plasmacytosis can alter neutrophil
frequencies in spleen and bone marrow led to the investigation of changes in neutrophil
migration abilities during plasmacytosis. In order to test neutrophil migration at the
peak of GMD-induced plasmacytosis, the neutrophil attractant C5a was injected into the
peritoneum, mimicking a complement mediated inflammation. Three to four hours after
C5a injection, the neutrophils migrate towards the site of inflammation and their
frequencies in the peritoneum can be analyzed by flow cytometry (Figure 3.13). The
neutrophil frequencies in GMD treated mice were reduced by about 50% compared to
goat serum treated controls (Figure 3.14). Also, since IL-10 has been shown to have
immune regulatory function on neutrophils [103], it was speculated that the effect on
neutrophil migration could be due to high IL-10 amounts produced during
plasmacytosis. To analyze this, a group of mice was injected with anti-IL-10 receptor
antibody (anti-IL-10R Ab) one day prior analysis of neutrophil migration. This particular
time point was selected for IL-10 receptor blockade since neutrophils have a very short
half-life of around 24 h. Also, injection of anti-IL-10R Ab along with GMD or immediately
after GMD injection could cause immune complex formation between the two antibodies
which could be harmful for mice. As hypothesized, the inhibition of neutrophil
migration following GMD induced B cell activation was blocked by co-injection of anti-
IL-10R Ab (Figure 3.14). Hence, suggesting that IL-10 produced during plasmacytosis
limits neutrophil migration to sites of antibody mediated complement activation.
Figure 3.13: Experimental scheme describing analysis of neutrophil infiltration towards
C5a in vivo. C57BL/6 mice were injected i.p. with GMD or goat serum. Six days later the IL-10
receptor was blocked by injection of anti-IL-10R Ab or control Ab in case of controls. C5a
injection in the peritoneum was performed 1 day later and effective neutrophil infiltration
towards C5a in peritoneum was analyzed after 3-4 hours.
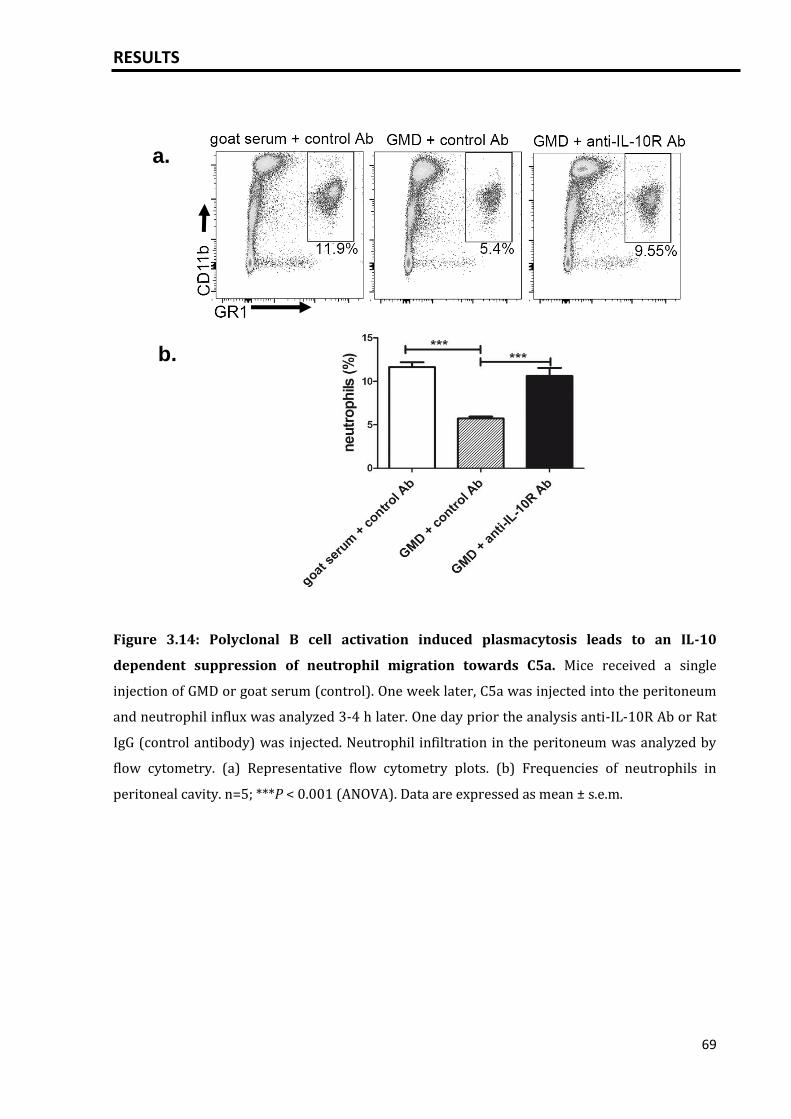
RESULTS
69
Figure 3.14: Polyclonal B cell activation induced plasmacytosis leads to an IL-10
dependent suppression of neutrophil migration towards C5a. Mice received a single
injection of GMD or goat serum (control). One week later, C5a was injected into the peritoneum
and neutrophil influx was analyzed 3-4 h later. One day prior the analysis anti-IL-10R Ab or Rat
IgG (control antibody) was injected. Neutrophil infiltration in the peritoneum was analyzed by
flow cytometry. (a) Representative flow cytometry plots. (b) Frequencies of neutrophils in
peritoneal cavity. n=5; ***P < 0.001 (ANOVA). Data are expressed as mean ± s.e.m.
b.
.
a.
..
RESULTS
70
3.3.3 Murine MOPC315.BM myeloma model inhibits neutrophil migration towards
C5a
IL-10 is produced by several human myeloma cell lines [104, 105] and also by cells of
the murine MOPC315.BM myeloma model used in this study (500 pg/ml, measured once
by ELISA). Moreover, bacterial infections are often the presenting feature of myeloma
patients [54, 60]. Neutrophils represent a main effector mechanism controlling such
infections [70]. Therefore, whether neutrophil function might be suppressed in multiple
myeloma in an IL-10 dependent manner was tested. MOPC315.BM cells were injected
into BALB/c mice which induces a disease resembling the phenotype of multiple
myeloma (methods section 2.2.4.2). Mice were distributed into two groups showing
similar myeloma specific serum protein and were injected with either IL-10 receptor
blocking antibody or control antibody one day before the final analysis. On the day of the
final analysis, C5a was injected in the peritoneum of mice and the neutrophil influx in
peritoneum was thereafter checked by flow cytometry. A control group did not receive
myeloma cells but only the control antibody. C5a induced neutrophil influx into the
peritoneum was completely abolished in myeloma bearing mice compared to the control
mice that had not received myeloma cells (Figure 3.15). Myeloma mediated suppression
of neutrophil migration was completely restored by blockade of the IL-10 receptor.
Injection of anti-IL-10R Ab even increased neutrophil influx in mice bearing myeloma
compared to the controls (Figure 3.15). A possible explanation could be that the
physiological levels of IL-10 present in the control mice could also reduce the neutrophil
influx while this effect is blocked in mice injected with anti-IL-10R Ab. These results
demonstrate that murine myeloma such as MOPC315.BM can completely abolish
neutrophil migration. Also, myeloma induced immune suppression is partly mediated by
IL-10. This study encourages further investigations addressing the question whether IL-
10 dependent inhibition of neutrophil migration by myeloma may also contribute to
increased susceptibility to bacterial infections often observed in myeloma patients.
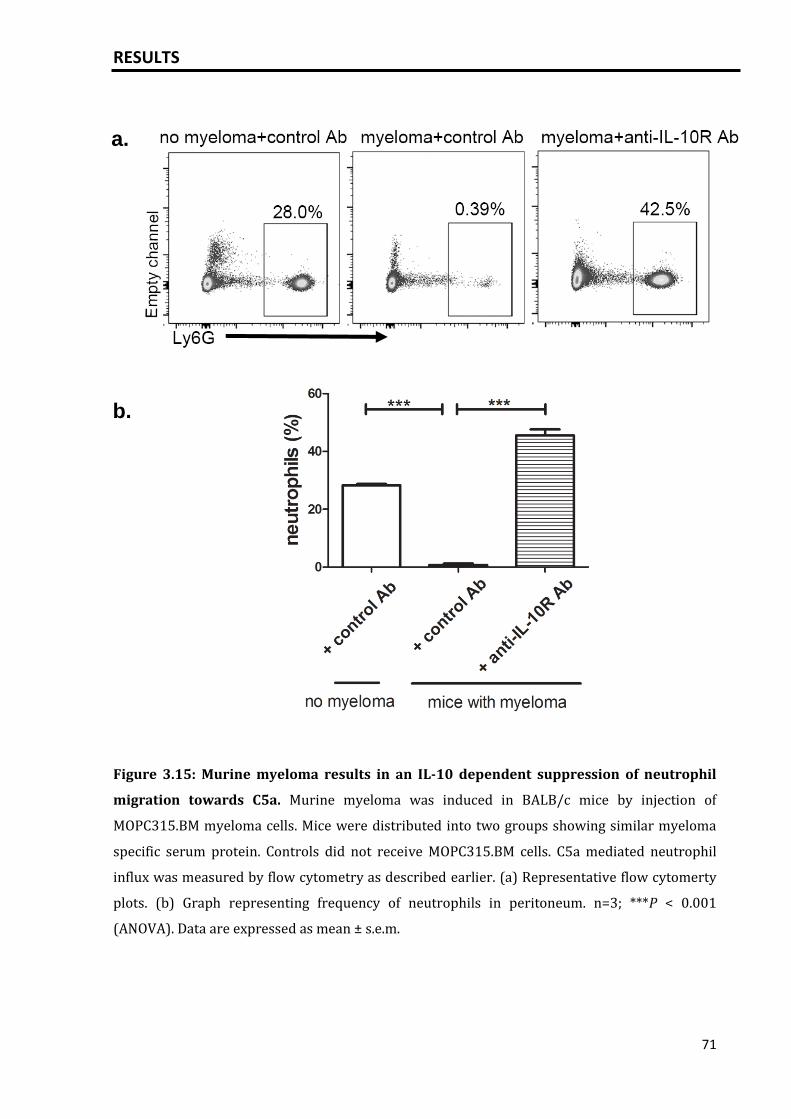
RESULTS
71
Figure 3.15: Murine myeloma results in an IL-10 dependent suppression of neutrophil
migration towards C5a. Murine myeloma was induced in BALB/c mice by injection of
MOPC315.BM myeloma cells. Mice were distributed into two groups showing similar myeloma
specific serum protein. Controls did not receive MOPC315.BM cells. C5a mediated neutrophil
influx was measured by flow cytometry as described earlier. (a) Representative flow cytomerty
plots. (b) Graph representing frequency of neutrophils in peritoneum. n=3; ***P < 0.001
(ANOVA). Data are expressed as mean ± s.e.m.
a.
b.
a.
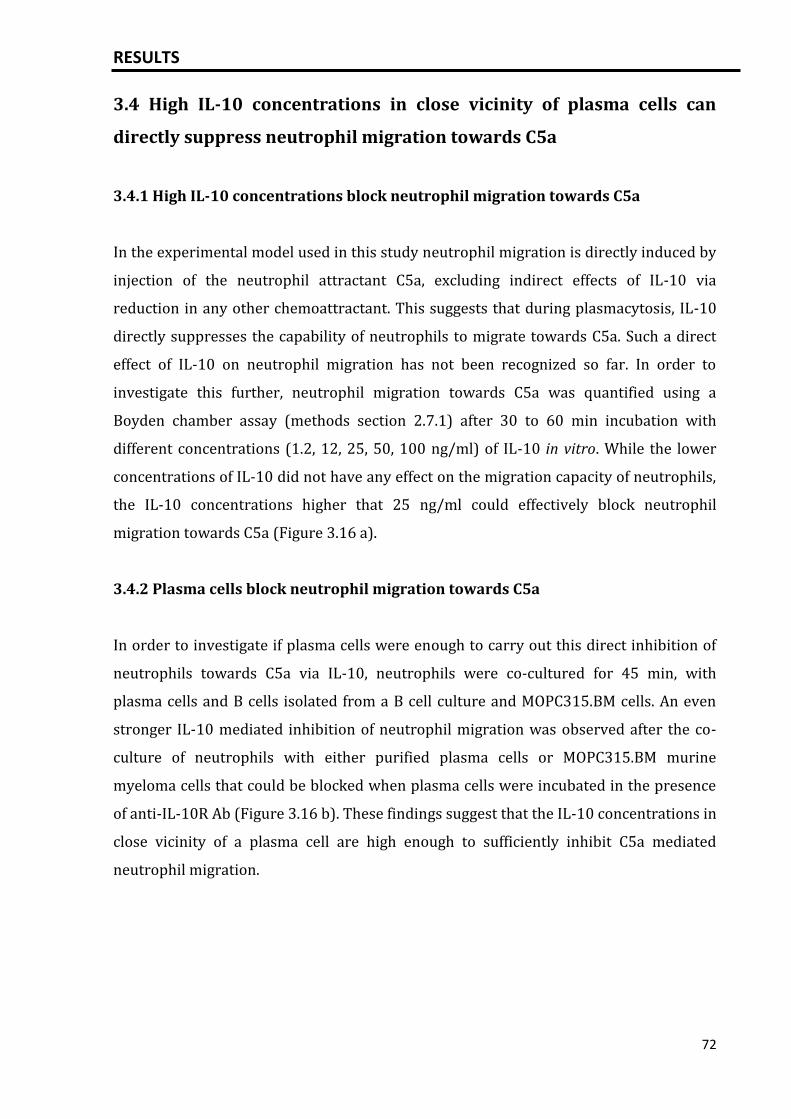
RESULTS
72
3.4 High IL-10 concentrations in close vicinity of plasma cells can
directly suppress neutrophil migration towards C5a
3.4.1 High IL-10 concentrations block neutrophil migration towards C5a
In the experimental model used in this study neutrophil migration is directly induced by
injection of the neutrophil attractant C5a, excluding indirect effects of IL-10 via
reduction in any other chemoattractant. This suggests that during plasmacytosis, IL-10
directly suppresses the capability of neutrophils to migrate towards C5a. Such a direct
effect of IL-10 on neutrophil migration has not been recognized so far. In order to
investigate this further, neutrophil migration towards C5a was quantified using a
Boyden chamber assay (methods section 2.7.1) after 30 to 60 min incubation with
different concentrations (1.2, 12, 25, 50, 100 ng/ml) of IL-10 in vitro. While the lower
concentrations of IL-10 did not have any effect on the migration capacity of neutrophils,
the IL-10 concentrations higher that 25 ng/ml could effectively block neutrophil
migration towards C5a (Figure 3.16 a).
3.4.2 Plasma cells block neutrophil migration towards C5a
In order to investigate if plasma cells were enough to carry out this direct inhibition of
neutrophils towards C5a via IL-10, neutrophils were co-cultured for 45 min, with
plasma cells and B cells isolated from a B cell culture and MOPC315.BM cells. An even
stronger IL-10 mediated inhibition of neutrophil migration was observed after the co-
culture of neutrophils with either purified plasma cells or MOPC315.BM murine
myeloma cells that could be blocked when plasma cells were incubated in the presence
of anti-IL-10R Ab (Figure 3.16 b). These findings suggest that the IL-10 concentrations in
close vicinity of a plasma cell are high enough to sufficiently inhibit C5a mediated
neutrophil migration.
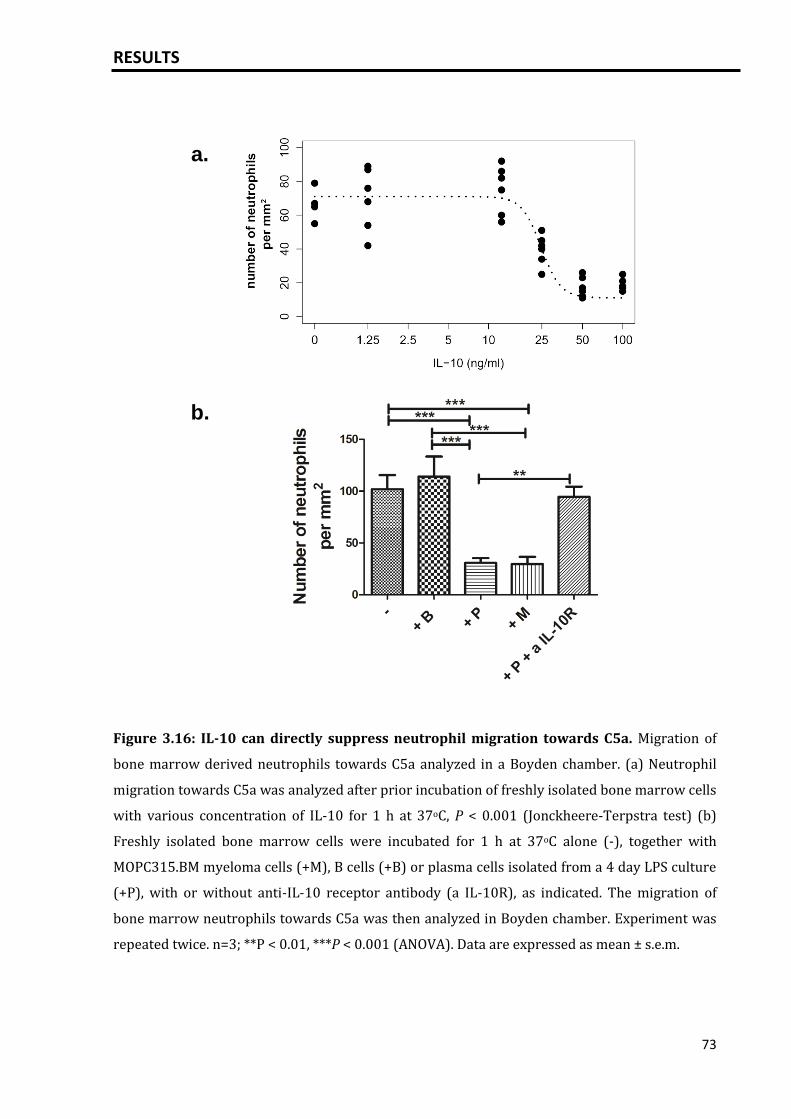
RESULTS
73
Figure 3.16: IL-10 can directly suppress neutrophil migration towards C5a. Migration of
bone marrow derived neutrophils towards C5a analyzed in a Boyden chamber. (a) Neutrophil
migration towards C5a was analyzed after prior incubation of freshly isolated bone marrow cells
with various concentration of IL-10 for 1 h at 37oC, P < 0.001 (Jonckheere-Terpstra test) (b)
Freshly isolated bone marrow cells were incubated for 1 h at 37oC alone (-), together with
MOPC315.BM myeloma cells (+M), B cells (+B) or plasma cells isolated from a 4 day LPS culture
(+P), with or without anti-IL-10 receptor antibody (a IL-10R), as indicated. The migration of
bone marrow neutrophils towards C5a was then analyzed in Boyden chamber. Experiment was
repeated twice. n=3; **P < 0.01, ***P < 0.001 (ANOVA). Data are expressed as mean ± s.e.m.
a.
b.
RESULTS
74
3.4.3 IL-10 from B lineage cells can block neutrophil migration towards C5a
Although the in vitro studies mentioned in section 3.4.2 suggest that plasma cells are
sufficient to inhibit neutrophil migration towards C5a, the data still clearly do not
indicate that IL-10 from plasma cells is sufficient to carry out this blockade in vivo. To
study this in depth, neutrophil infiltration towards C5a was analyzed in B cell specific IL-
10 KO (IL-10FL/FLCD19-Cre+) mice in the GMD induced plasmacytosis model. At the peak
of plasmacytosis (i.e. 7 days post GMD injection), mice were injected with C5a in the
peritoneum, leading to compliment mediated neutrophil infiltration and peritonitis. The
neutrophil infiltration was almost five fold higher in B cell specific IL-10 KO mice
compared to controls (IL-10FL/FLCD19-Cre-) (Figure 3.17) indicating that IL-10 from B
lineage cells is required to inhibit neutrophil migration towards C5a. Since, plasma cells
are the main IL-10 expressing cells at day 7 following GMD treatment (section 3.1), the
above results indicate that IL-10 from plasma cells is required to inhibit neutrophil
migration towards C5a.
Figure 3.17: B lineage cell IL-10 blocks neutrophil migration towards C5a. IL-10FL/FLCD19-
Cre+ mice and IL-10FL/FLCD19-Cre- controls were injected with GMD and seven days later C5a
was injected in the peritoneum of the mice. The complement mediated neutrophil influx in the
peritoneum was analyzed 3 hours later by flow cytometry. (a) Representative flow cytometry
plots. (b) Graph representing the frequency of Ly6Ghi neutrophils in the peritoneum. n=5; *P <
0.05 (two-tailed unpaired Student’s t-test). Data are expressed as mean ± s.e.m.
b. a.
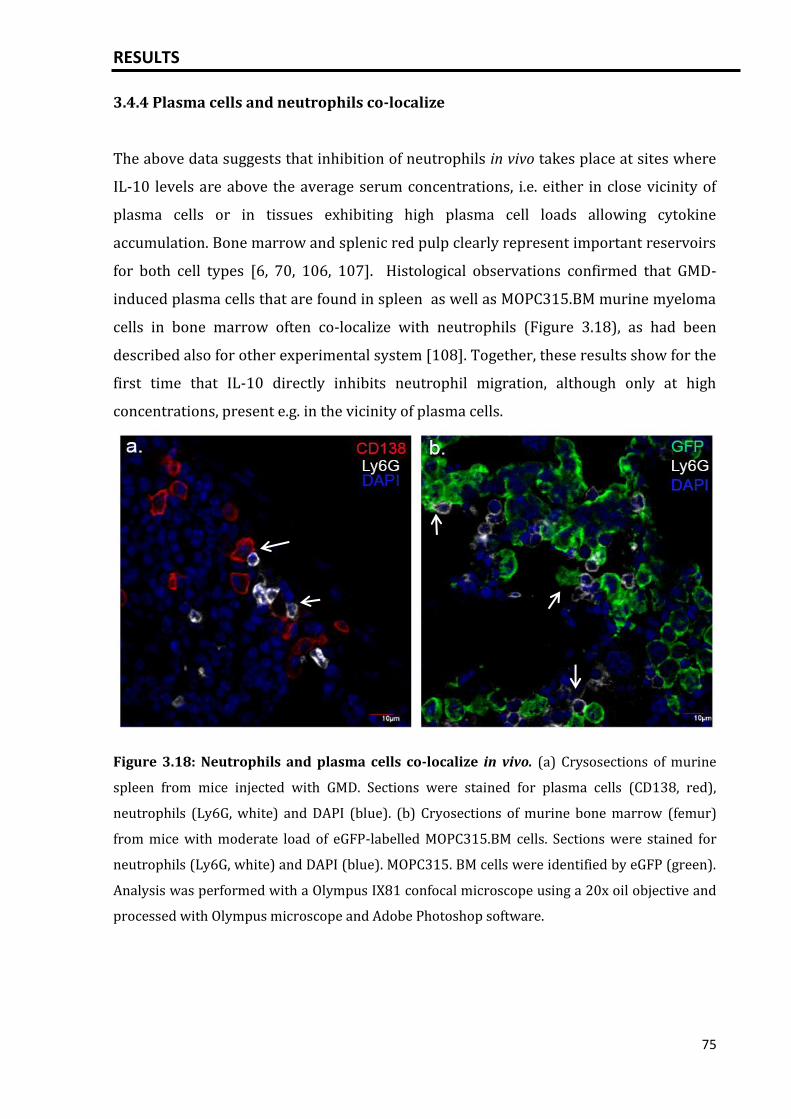
RESULTS
75
3.4.4 Plasma cells and neutrophils co-localize
The above data suggests that inhibition of neutrophils in vivo takes place at sites where
IL-10 levels are above the average serum concentrations, i.e. either in close vicinity of
plasma cells or in tissues exhibiting high plasma cell loads allowing cytokine
accumulation. Bone marrow and splenic red pulp clearly represent important reservoirs
for both cell types [6, 70, 106, 107]. Histological observations confirmed that GMD-
induced plasma cells that are found in spleen as well as MOPC315.BM murine myeloma
cells in bone marrow often co-localize with neutrophils (Figure 3.18), as had been
described also for other experimental system [108]. Together, these results show for the
first time that IL-10 directly inhibits neutrophil migration, although only at high
concentrations, present e.g. in the vicinity of plasma cells.
Figure 3.18: Neutrophils and plasma cells co-localize in vivo. (a) Crysosections of murine
spleen from mice injected with GMD. Sections were stained for plasma cells (CD138, red),
neutrophils (Ly6G, white) and DAPI (blue). (b) Cryosections of murine bone marrow (femur)
from mice with moderate load of eGFP-labelled MOPC315.BM cells. Sections were stained for
neutrophils (Ly6G, white) and DAPI (blue). MOPC315. BM cells were identified by eGFP (green).
Analysis was performed with a Olympus IX81 confocal microscope using a 20x oil objective and
processed with Olympus microscope and Adobe Photoshop software.
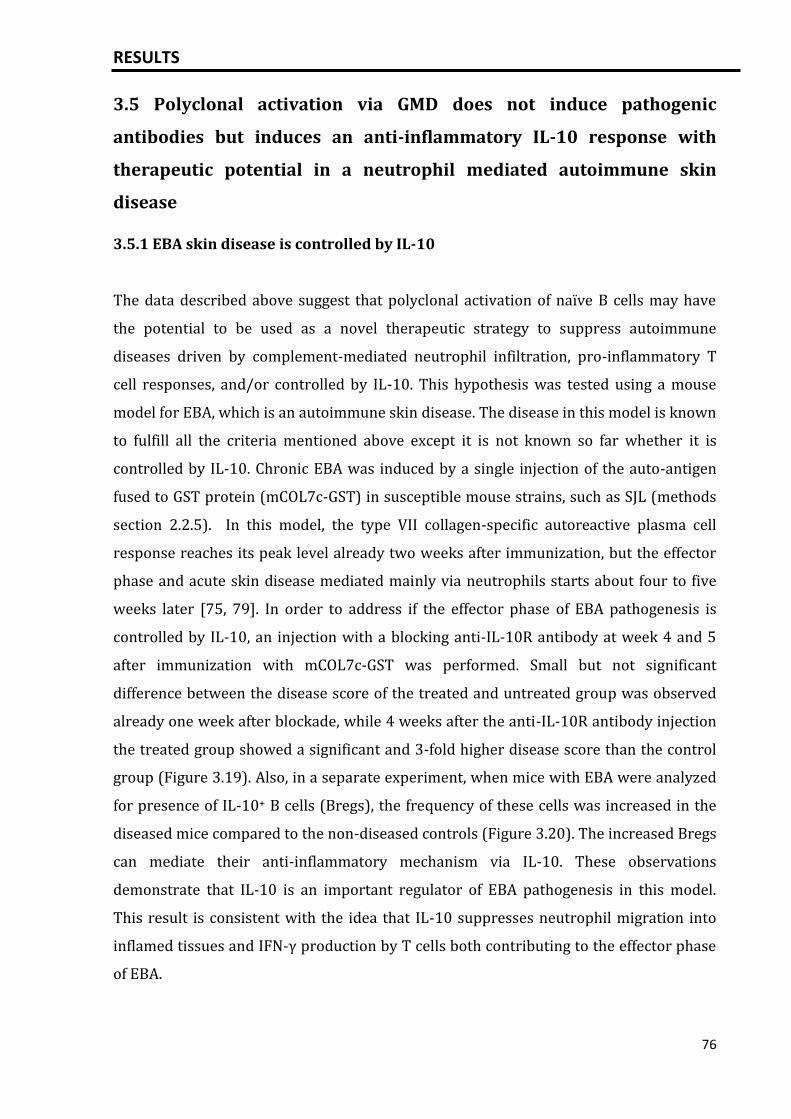
RESULTS
76
3.5 Polyclonal activation via GMD does not induce pathogenic
antibodies but induces an anti-inflammatory IL-10 response with
therapeutic potential in a neutrophil mediated autoimmune skin
disease
3.5.1 EBA skin disease is controlled by IL-10
The data described above suggest that polyclonal activation of naïve B cells may have
the potential to be used as a novel therapeutic strategy to suppress autoimmune
diseases driven by complement-mediated neutrophil infiltration, pro-inflammatory T
cell responses, and/or controlled by IL-10. This hypothesis was tested using a mouse
model for EBA, which is an autoimmune skin disease. The disease in this model is known
to fulfill all the criteria mentioned above except it is not known so far whether it is
controlled by IL-10. Chronic EBA was induced by a single injection of the auto-antigen
fused to GST protein (mCOL7c-GST) in susceptible mouse strains, such as SJL (methods
section 2.2.5). In this model, the type VII collagen-specific autoreactive plasma cell
response reaches its peak level already two weeks after immunization, but the effector
phase and acute skin disease mediated mainly via neutrophils starts about four to five
weeks later [75, 79]. In order to address if the effector phase of EBA pathogenesis is
controlled by IL-10, an injection with a blocking anti-IL-10R antibody at week 4 and 5
after immunization with mCOL7c-GST was performed. Small but not significant
difference between the disease score of the treated and untreated group was observed
already one week after blockade, while 4 weeks after the anti-IL-10R antibody injection
the treated group showed a significant and 3-fold higher disease score than the control
group (Figure 3.19). Also, in a separate experiment, when mice with EBA were analyzed
for presence of IL-10+ B cells (Bregs), the frequency of these cells was increased in the
diseased mice compared to the non-diseased controls (Figure 3.20). The increased Bregs
can mediate their anti-inflammatory mechanism via IL-10. These observations
demonstrate that IL-10 is an important regulator of EBA pathogenesis in this model.
This result is consistent with the idea that IL-10 suppresses neutrophil migration into
inflamed tissues and IFN-γ production by T cells both contributing to the effector phase
of EBA.
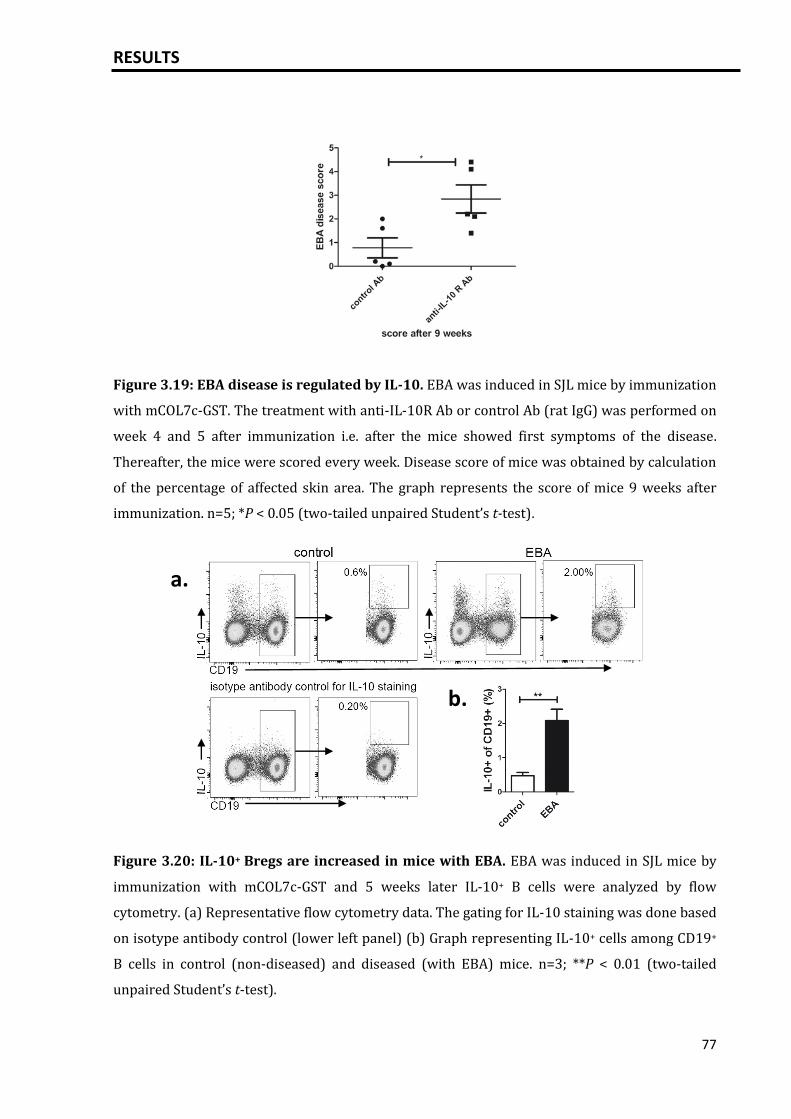
RESULTS
77
Figure 3.19: EBA disease is regulated by IL-10. EBA was induced in SJL mice by immunization
with mCOL7c-GST. The treatment with anti-IL-10R Ab or control Ab (rat IgG) was performed on
week 4 and 5 after immunization i.e. after the mice showed first symptoms of the disease.
Thereafter, the mice were scored every week. Disease score of mice was obtained by calculation
of the percentage of affected skin area. The graph represents the score of mice 9 weeks after
immunization. n=5; *P < 0.05 (two-tailed unpaired Student’s t-test).
Figure 3.20: IL-10+ Bregs are increased in mice with EBA. EBA was induced in SJL mice by
immunization with mCOL7c-GST and 5 weeks later IL-10+ B cells were analyzed by flow
cytometry. (a) Representative flow cytometry data. The gating for IL-10 staining was done based
on isotype antibody control (lower left panel) (b) Graph representing IL-10+ cells among CD19+
B cells in control (non-diseased) and diseased (with EBA) mice. n=3; **P < 0.01 (two-tailed
unpaired Student’s t-test).
a.
b.
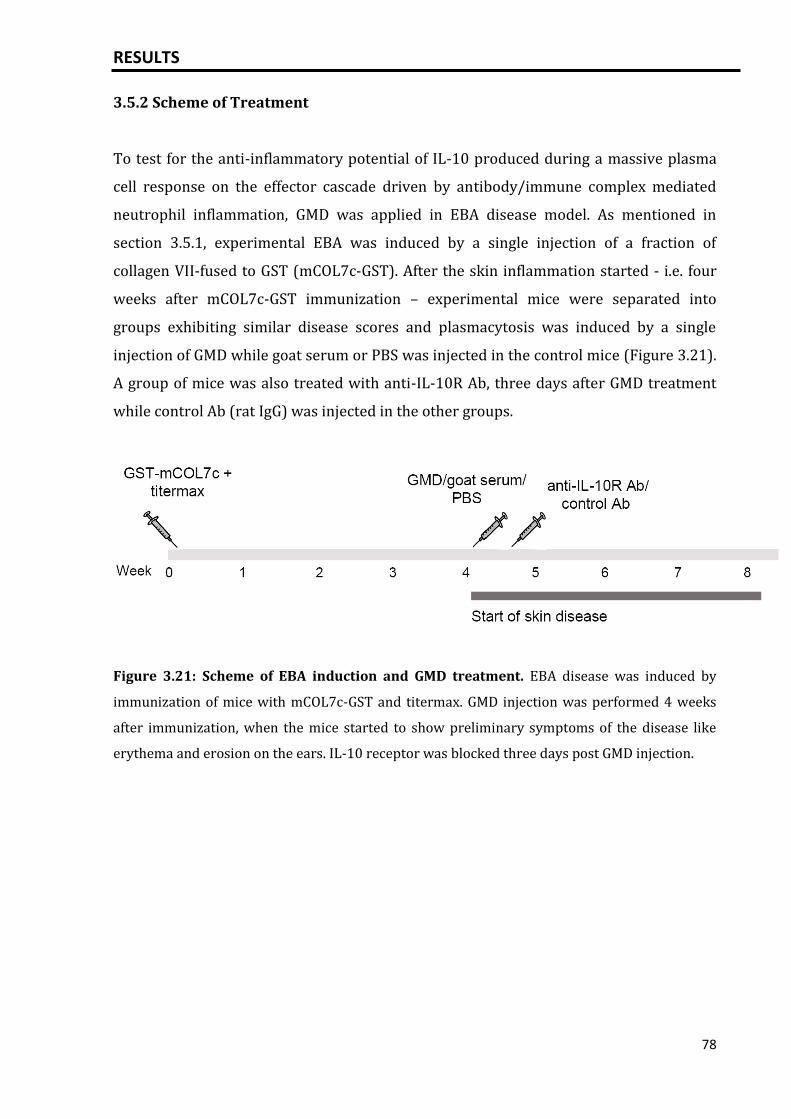
RESULTS
78
3.5.2 Scheme of Treatment
To test for the anti-inflammatory potential of IL-10 produced during a massive plasma
cell response on the effector cascade driven by antibody/immune complex mediated
neutrophil inflammation, GMD was applied in EBA disease model. As mentioned in
section 3.5.1, experimental EBA was induced by a single injection of a fraction of
collagen VII-fused to GST (mCOL7c-GST). After the skin inflammation started - i.e. four
weeks after mCOL7c-GST immunization – experimental mice were separated into
groups exhibiting similar disease scores and plasmacytosis was induced by a single
injection of GMD while goat serum or PBS was injected in the control mice (Figure 3.21).
A group of mice was also treated with anti-IL-10R Ab, three days after GMD treatment
while control Ab (rat IgG) was injected in the other groups.
Figure 3.21: Scheme of EBA induction and GMD treatment. EBA disease was induced by
immunization of mice with mCOL7c-GST and titermax. GMD injection was performed 4 weeks
after immunization, when the mice started to show preliminary symptoms of the disease like
erythema and erosion on the ears. IL-10 receptor was blocked three days post GMD injection.
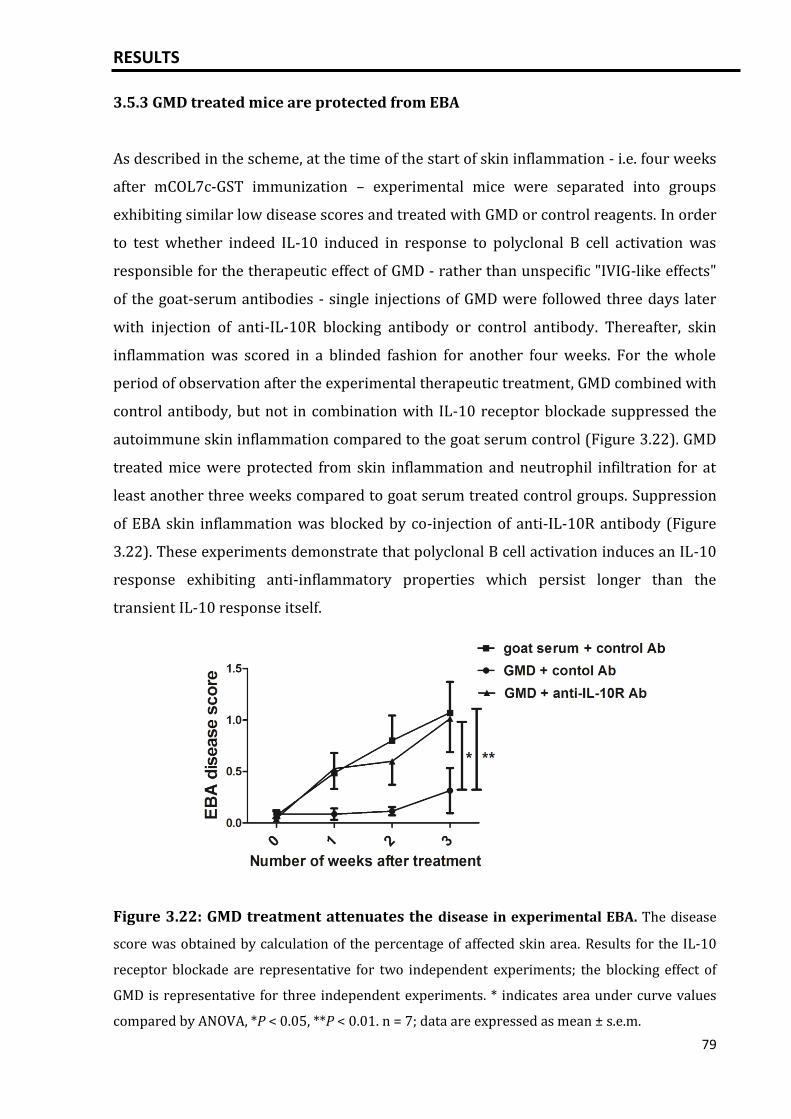
RESULTS
79
3.5.3 GMD treated mice are protected from EBA
As described in the scheme, at the time of the start of skin inflammation - i.e. four weeks
after mCOL7c-GST immunization – experimental mice were separated into groups
exhibiting similar low disease scores and treated with GMD or control reagents. In order
to test whether indeed IL-10 induced in response to polyclonal B cell activation was
responsible for the therapeutic effect of GMD - rather than unspecific "IVIG-like effects"
of the goat-serum antibodies - single injections of GMD were followed three days later
with injection of anti-IL-10R blocking antibody or control antibody. Thereafter, skin
inflammation was scored in a blinded fashion for another four weeks. For the whole
period of observation after the experimental therapeutic treatment, GMD combined with
control antibody, but not in combination with IL-10 receptor blockade suppressed the
autoimmune skin inflammation compared to the goat serum control (Figure 3.22). GMD
treated mice were protected from skin inflammation and neutrophil infiltration for at
least another three weeks compared to goat serum treated control groups. Suppression
of EBA skin inflammation was blocked by co-injection of anti-IL-10R antibody (Figure
3.22). These experiments demonstrate that polyclonal B cell activation induces an IL-10
response exhibiting anti-inflammatory properties which persist longer than the
transient IL-10 response itself.
Figure 3.22: GMD treatment attenuates the disease in experimental EBA. The disease
score was obtained by calculation of the percentage of affected skin area. Results for the IL-10
receptor blockade are representative for two independent experiments; the blocking effect of
GMD is representative for three independent experiments. * indicates area under curve values
compared by ANOVA, *P < 0.05, **P < 0.01. n = 7; data are expressed as mean ± s.e.m.
RESULTS
80
3.5.4 Activation of B cells via GMD did not increase the mCOL7c-GST specific
plasma cell response and autoantibody titers
Immunization with mCOL7c-GST leads to a rapid activation of autoreactive B cells and
formation of plasma cells in the lymph nodes where mCOL7c-GST specific plasma cell
population persists thereafter for several months. Once established, this autoreactive
plasma cell compartment exhibits relatively little turn over [88]. GMD was injected four
weeks after disease induction when the size of the autoreactive plasma cell
compartment already has reached its maximum. However, since GMD treatment induces
a huge plasma cell response it was important to investigate if the autoreactive i.e.
mCOl7c-GST specific plasma cells have increased in the lymph node, where they have
been shown to reside [88]. In this model the autoreactive plasma cells can be analyzed
by intracellular staining for the immunizing antigen [88]. When used in such a
therapeutic setting GMD treatment did not lead to an expansion of the mCOL7c-GST
specific plasma cell population (Figure 3.23 a, b). Accordingly, total IgG, IgG1, IgG2a and
IgG2b serum autoantibodies to type VII collagen (mCOL7c) relevant for triggering skin
inflammation were also analyzed. The autoantibody titers were not altered (Figure 3.23
c) indicating that the therapeutic effect of GMD is not due to a reduction in pathogenic
autoantibodies but rather due to the suppression of the subsequent inflammatory
effector mechanisms. Also, when used in a therapeutic setting polyclonal activation of B
cells via IgD is not promoting the production of potentially harmful autoantibodies.
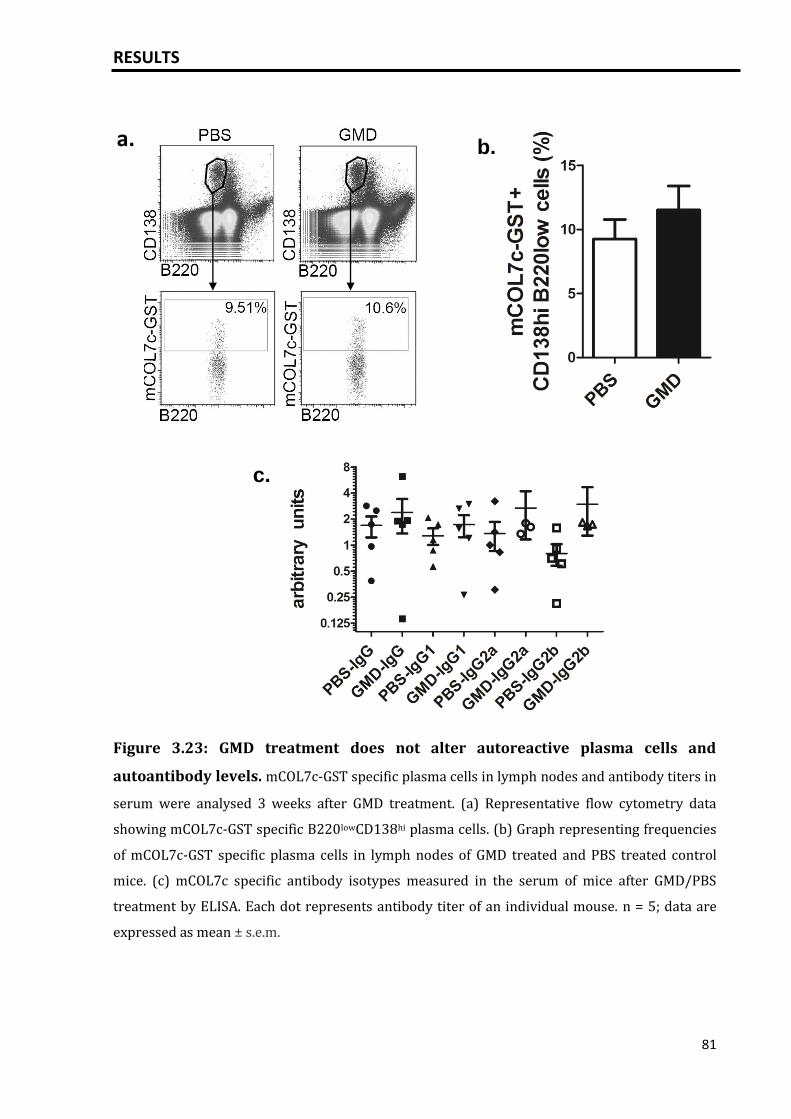
RESULTS
81
Figure 3.23: GMD treatment does not alter autoreactive plasma cells and
autoantibody levels. mCOL7c-GST specific plasma cells in lymph nodes and antibody titers in
serum were analysed 3 weeks after GMD treatment. (a) Representative flow cytometry data
showing mCOL7c-GST specific B220lowCD138hi plasma cells. (b) Graph representing frequencies
of mCOL7c-GST specific plasma cells in lymph nodes of GMD treated and PBS treated control
mice. (c) mCOL7c specific antibody isotypes measured in the serum of mice after GMD/PBS
treatment by ELISA. Each dot represents antibody titer of an individual mouse. n = 5; data are
expressed as mean ± s.e.m.
a. b.
c.
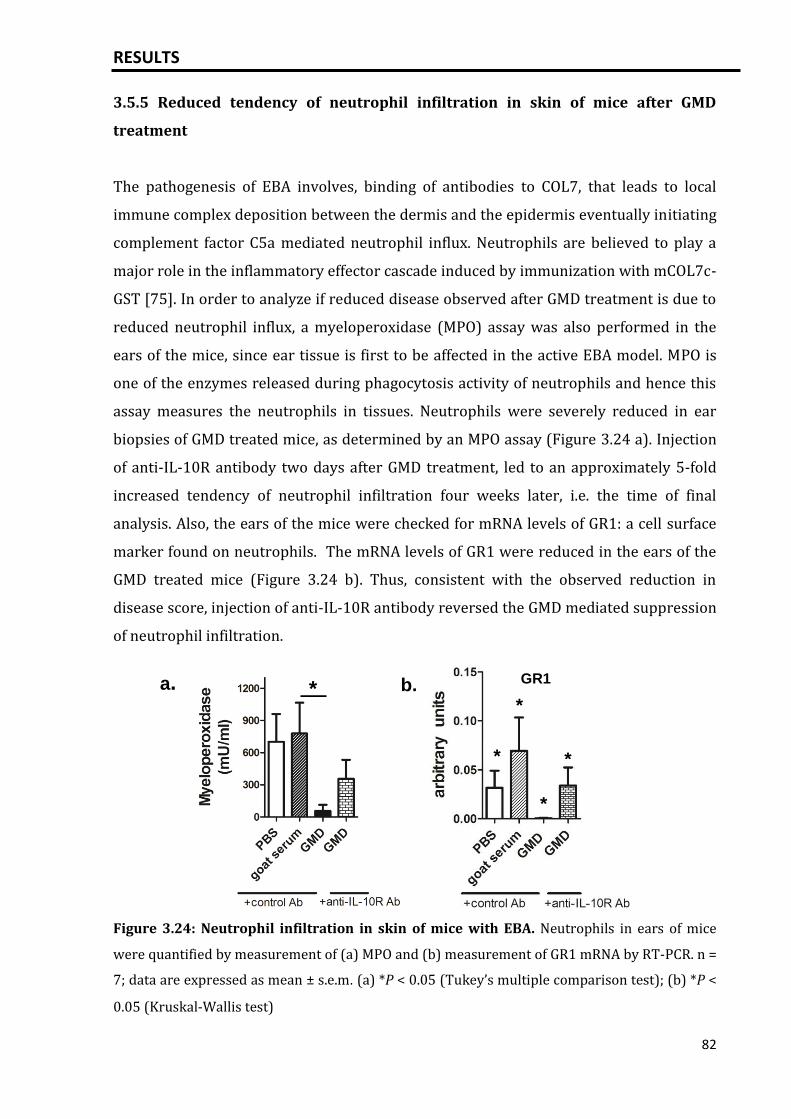
RESULTS
82
3.5.5 Reduced tendency of neutrophil infiltration in skin of mice after GMD
treatment
The pathogenesis of EBA involves, binding of antibodies to COL7, that leads to local
immune complex deposition between the dermis and the epidermis eventually initiating
complement factor C5a mediated neutrophil influx. Neutrophils are believed to play a
major role in the inflammatory effector cascade induced by immunization with mCOL7c-
GST [75]. In order to analyze if reduced disease observed after GMD treatment is due to
reduced neutrophil influx, a myeloperoxidase (MPO) assay was also performed in the
ears of the mice, since ear tissue is first to be affected in the active EBA model. MPO is
one of the enzymes released during phagocytosis activity of neutrophils and hence this
assay measures the neutrophils in tissues. Neutrophils were severely reduced in ear
biopsies of GMD treated mice, as determined by an MPO assay (Figure 3.24 a). Injection
of anti-IL-10R antibody two days after GMD treatment, led to an approximately 5-fold
increased tendency of neutrophil infiltration four weeks later, i.e. the time of final
analysis. Also, the ears of the mice were checked for mRNA levels of GR1: a cell surface
marker found on neutrophils. The mRNA levels of GR1 were reduced in the ears of the
GMD treated mice (Figure 3.24 b). Thus, consistent with the observed reduction in
disease score, injection of anti-IL-10R antibody reversed the GMD mediated suppression
of neutrophil infiltration.
Figure 3.24: Neutrophil infiltration in skin of mice with EBA. Neutrophils in ears of mice
were quantified by measurement of (a) MPO and (b) measurement of GR1 mRNA by RT-PCR. n =
7; data are expressed as mean ± s.e.m. (a) *P < 0.05 (Tukey’s multiple comparison test); (b) *P <
0.05 (Kruskal-Wallis test)
a. b.
*
*
*
*
*
GR1
*
*
*
*
b.
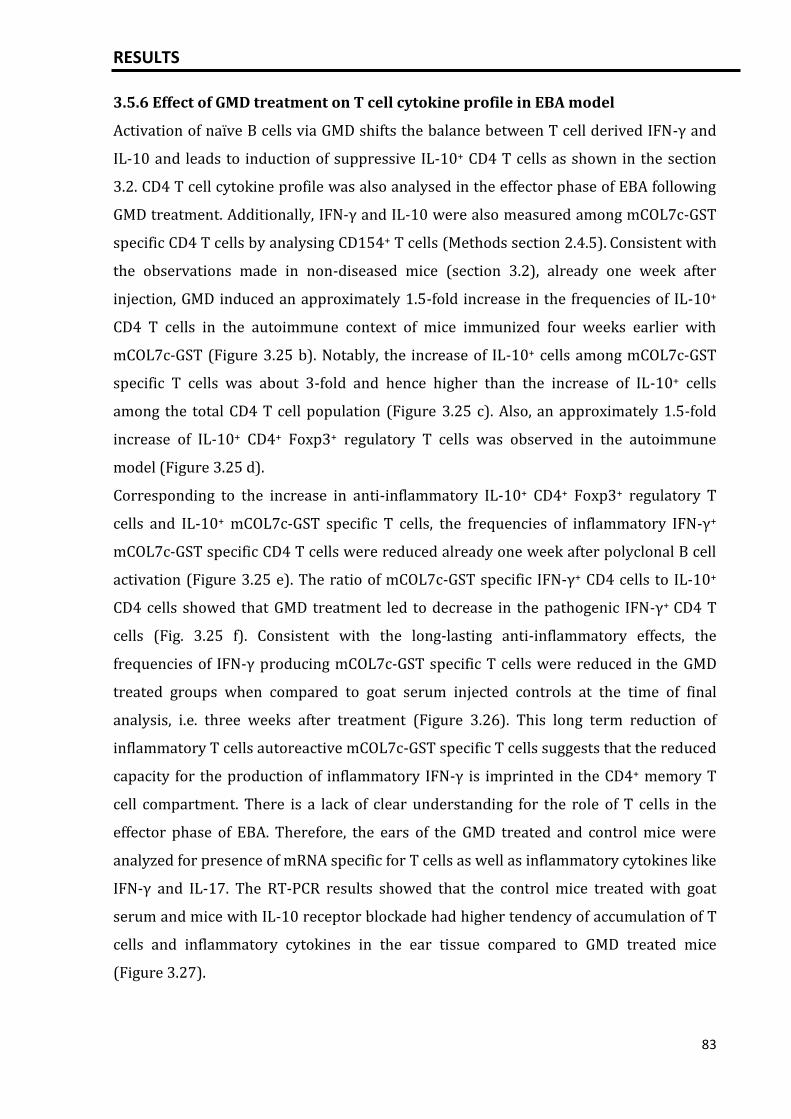
RESULTS
83
3.5.6 Effect of GMD treatment on T cell cytokine profile in EBA model
Activation of naïve B cells via GMD shifts the balance between T cell derived IFN-γ and
IL-10 and leads to induction of suppressive IL-10+ CD4 T cells as shown in the section
3.2. CD4 T cell cytokine profile was also analysed in the effector phase of EBA following
GMD treatment. Additionally, IFN-γ and IL-10 were also measured among mCOL7c-GST
specific CD4 T cells by analysing CD154+ T cells (Methods section 2.4.5). Consistent with
the observations made in non-diseased mice (section 3.2), already one week after
injection, GMD induced an approximately 1.5-fold increase in the frequencies of IL-10+
CD4 T cells in the autoimmune context of mice immunized four weeks earlier with
mCOL7c-GST (Figure 3.25 b). Notably, the increase of IL-10+ cells among mCOL7c-GST
specific T cells was about 3-fold and hence higher than the increase of IL-10+ cells
among the total CD4 T cell population (Figure 3.25 c). Also, an approximately 1.5-fold
increase of IL-10+ CD4+ Foxp3+ regulatory T cells was observed in the autoimmune
model (Figure 3.25 d).
Corresponding to the increase in anti-inflammatory IL-10+ CD4+ Foxp3+ regulatory T
cells and IL-10+ mCOL7c-GST specific T cells, the frequencies of inflammatory IFN-γ+
mCOL7c-GST specific CD4 T cells were reduced already one week after polyclonal B cell
activation (Figure 3.25 e). The ratio of mCOL7c-GST specific IFN-γ+ CD4 cells to IL-10+
CD4 cells showed that GMD treatment led to decrease in the pathogenic IFN-γ+ CD4 T
cells (Fig. 3.25 f). Consistent with the long-lasting anti-inflammatory effects, the
frequencies of IFN-γ producing mCOL7c-GST specific T cells were reduced in the GMD
treated groups when compared to goat serum injected controls at the time of final
analysis, i.e. three weeks after treatment (Figure 3.26). This long term reduction of
inflammatory T cells autoreactive mCOL7c-GST specific T cells suggests that the reduced
capacity for the production of inflammatory IFN-γ is imprinted in the CD4+ memory T
cell compartment. There is a lack of clear understanding for the role of T cells in the
effector phase of EBA. Therefore, the ears of the GMD treated and control mice were
analyzed for presence of mRNA specific for T cells as well as inflammatory cytokines like
IFN-γ and IL-17. The RT-PCR results showed that the control mice treated with goat
serum and mice with IL-10 receptor blockade had higher tendency of accumulation of T
cells and inflammatory cytokines in the ear tissue compared to GMD treated mice
(Figure 3.27).
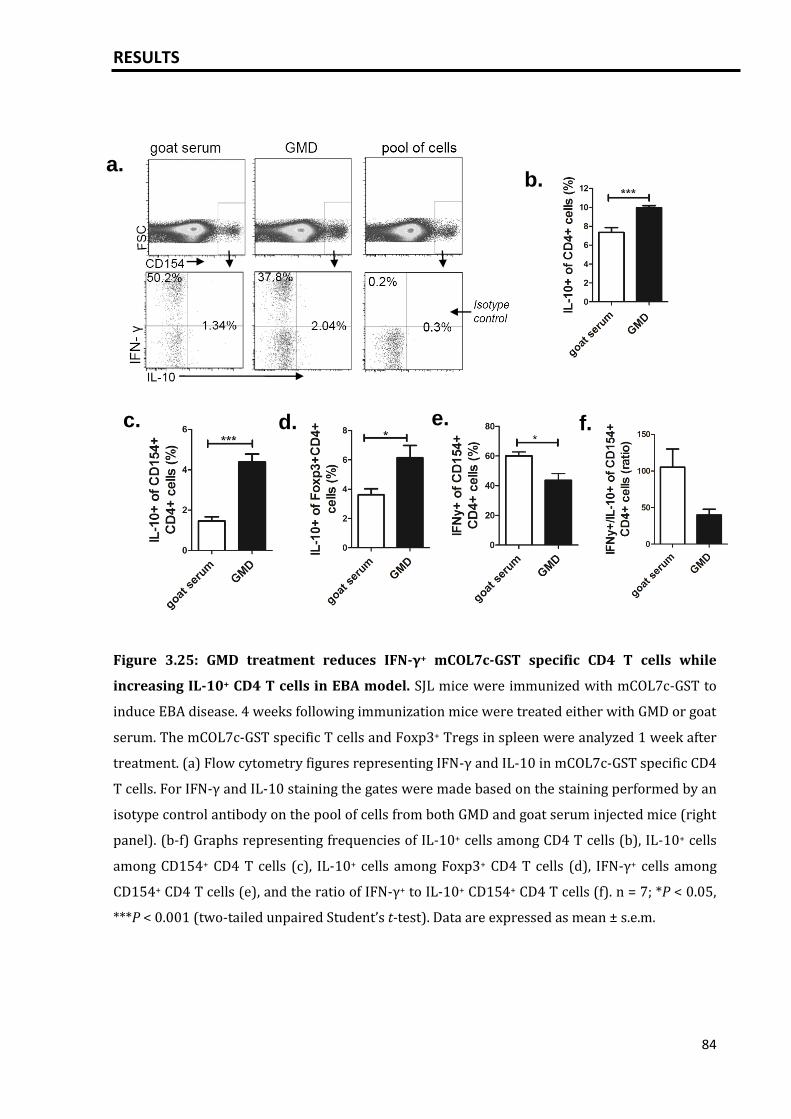
RESULTS
84
Figure 3.25: GMD treatment reduces IFN-γ+ mCOL7c-GST specific CD4 T cells while
increasing IL-10+ CD4 T cells in EBA model. SJL mice were immunized with mCOL7c-GST to
induce EBA disease. 4 weeks following immunization mice were treated either with GMD or goat
serum. The mCOL7c-GST specific T cells and Foxp3+ Tregs in spleen were analyzed 1 week after
treatment. (a) Flow cytometry figures representing IFN-γ and IL-10 in mCOL7c-GST specific CD4
T cells. For IFN-γ and IL-10 staining the gates were made based on the staining performed by an
isotype control antibody on the pool of cells from both GMD and goat serum injected mice (right
panel). (b-f) Graphs representing frequencies of IL-10+ cells among CD4 T cells (b), IL-10+ cells
among CD154+ CD4 T cells (c), IL-10+ cells among Foxp3+ CD4 T cells (d), IFN-γ+ cells among
CD154+ CD4 T cells (e), and the ratio of IFN-γ+ to IL-10+ CD154+ CD4 T cells (f). n = 7; *P < 0.05,
***P < 0.001 (two-tailed unpaired Student’s t-test). Data are expressed as mean ± s.e.m.
a. b.
c. d. e. f.
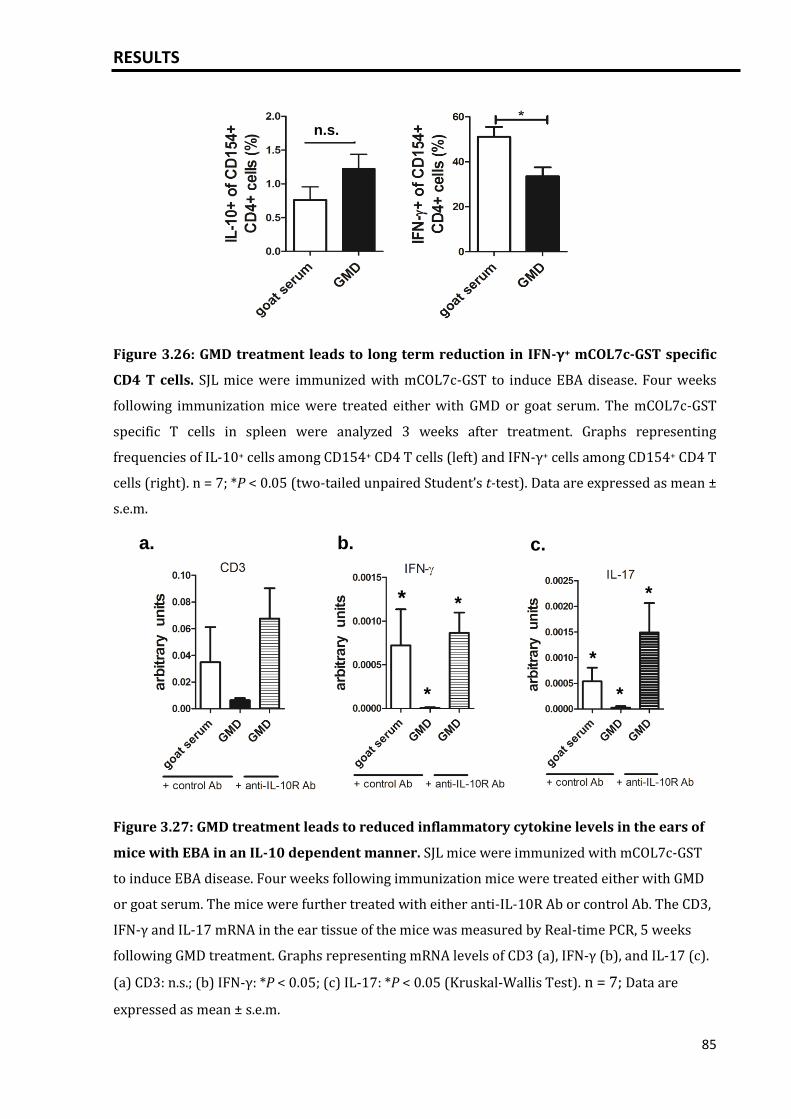
RESULTS
85
Figure 3.26: GMD treatment leads to long term reduction in IFN-γ+ mCOL7c-GST specific
CD4 T cells. SJL mice were immunized with mCOL7c-GST to induce EBA disease. Four weeks
following immunization mice were treated either with GMD or goat serum. The mCOL7c-GST
specific T cells in spleen were analyzed 3 weeks after treatment. Graphs representing
frequencies of IL-10+ cells among CD154+ CD4 T cells (left) and IFN-γ+ cells among CD154+ CD4 T
cells (right). n = 7; *P < 0.05 (two-tailed unpaired Student’s t-test). Data are expressed as mean ±
s.e.m.
Figure 3.27: GMD treatment leads to reduced inflammatory cytokine levels in the ears of
mice with EBA in an IL-10 dependent manner. SJL mice were immunized with mCOL7c-GST
to induce EBA disease. Four weeks following immunization mice were treated either with GMD
or goat serum. The mice were further treated with either anti-IL-10R Ab or control Ab. The CD3,
IFN-γ and IL-17 mRNA in the ear tissue of the mice was measured by Real-time PCR, 5 weeks
following GMD treatment. Graphs representing mRNA levels of CD3 (a), IFN-γ (b), and IL-17 (c).
(a) CD3: n.s.; (b) IFN-γ: *P < 0.05; (c) IL-17: *P < 0.05 (Kruskal-Wallis Test). n = 7; Data are
expressed as mean ± s.e.m.
n.s.
a. b. c.
*
*
*
*
*
*
DISCUSSION
86
4. Discussion
4.1 Overview
In addition to their unique capacity to produce antibodies, activated B cells can produce
multiple immunomodulating molecules and contribute in immunosuppressive
mechanisms that limit autoimmune, allergy and infection triggered inflammation. In this
thesis, the immunomodulating effects of T cell-dependent in vivo polyclonal activation of
B cells via their antigen-receptor IgD were investigated. The activation of the B cells via
GMD led not only to a massive plasma cell response but also IL-10 expression was
observed in most of these plasma cells. Moreover, B cell activation through GMD also
induced IL-10 expressing regulatory T cells. The experiment performed in B cell specific
IL-10 KO mice further suggests that IL-10 from B lineage cells induces IL-10 among T
cells while reducing IFN-γ+ pathogenic Th1 cells. Additionally, this study demonstrates
that polyclonal and neoplastic plasmacytosis-associated IL-10 mediates suppression of
neutrophil infiltration towards C5a. Through in vitro assays it was shown that high IL-10
concentrations present in the vicinity of plasma cells can directly block neutrophil
migration. Furthermore, when plasma cell IL-10 was induced in a neutrophil mediated
autoimmune skin disease (EBA), it reduced the tissue injury in the disease without
affecting the number of autoreactive plasma cells or autoantibodies. Through the results
obtained in the thesis, I hypothesize that the IL-10 produced by plasma cells could be a
negative feedback that potentially limits neutrophil mediated tissue injury and possibly
Th1 cell mediated autoimmune diseases. On the other hand, the results show that IL-10
from normal/neoplastic plasma cells causes immunosuppression which leads to the
further question of whether this phenomenon contributes to immunodeficiency
observed during plasmacytosis in patients with diseases like myeloma and SLE. Thus,
this study elaborates the role of IL-10 producing plasma cells in the regulation of
immune responses in health and disease. The detailed interpretation of the results is
discussed in the following sections.
DISCUSSION
87
4.2 IL-10 expression by normal and neoplastic plasma cells
A main finding of the thesis was that after injection of GMD, plasma cells resembled a
major population of IL-10 producing cells in spleen. Also, in vitro stimulation of B cells
by LPS resulted in a significant proportion of IL-10 producing plasma cells. These
observations suggest that IL-10 production is a common feature of plasma cells. These
findings are in accordance with the studies from the last decade, suggesting that B
lineage cells can be a source of IL-10.
4.2.1 Confirmation of the hypothesis: Plasma cells produce IL-10
For many years B lineage cells were thought to be antigen presenting and antibody
secreting cells. However, the studies done in the last decade suggest that B cells regulate
immune response through provision of cytokines, one of them being IL-10 [38]. The IL-
10 producing B cells also termed as regulatory B cells have been shown to attenuate
many inflammatory and autoimmune conditions in different mouse models and in
humans [24]. In the recent years different phenotypes of the IL-10+ B cells have been
recognized; but whether these cells resemble distinct immunoregulatory B cell subtypes
or rather certain developmental stages remains to be elucidated [8]. While a study
suggested that a subset of IL-10+ B cells termed B10 cells are plasma cell precursors [45]
a very recent study also gives evidence that CD138+ plasma cells produce IL-10 in
context of EAE and Salmonella infection [100]. The results obtained during this thesis
further confirm that plasma cells produce IL-10.
4.2.2 Some evidence of IL-10 expression by malignant plasma cells
On similar lines, some studies also indicate that human myeloma cell lines can express
IL-10 [104, 109]. Other studies also indicated as IL-10 being the growth factor for
myeloma cells suggesting an autocrine signaling [105]. Notably, supernatants of the
murine plasma cell line MOPC315.BM also contained around 500 pg/ml of IL-10.
Accordingly, studies from our clinical partners show that IL-10 was detectable in serum
of the majority of patients suffering from advanced myeloma (6 out of 8) at an average
of 15 pg/ml, but was undetectable (≤0.7 pg/ml) in serum of healthy human controls,
MGUS patients which may develop into multiple myeloma disease later and in first
diagnosed myeloma patients (personal communication with Prof. Markus Huber-Lang).
These data show that the IL-10 expression is not only restricted to normal plasma cells
DISCUSSION
88
but also the neoplastic plasma cells and that IL-10 levels increase with progression of
neoplastic plasmacytosis.
4.2.3 Reasoning behind the expression of IL-10 by myeloma cells
IL-10 production by myeloma cells could be to promote immune suppressive
environment for tumor escape from immune surveillance thereby inducing myeloma
development and growth. Such phenomenon of immune suppression is observed in
many forms of cancer, which elicit strong immune response during the early phase, but
the immune response is soon down-regulated for progressive tumor growth [110]. IL-10
is considered one of the immune suppressive factors exerting this effect. E.g. IL-10
containing supernatants from melanoma cell line were found to inhibit production of
inflammatory cytokines like TNF-α, IFN-γ and IL-2 by human peripheral blood
lymphocytes [111]. Similarly, IL-10 treatment can convert melanoma and lymphoma
cells into cytotoxic T cell resistant phenotype by reducing the HLA class I molecules on
their surface [56]. The autocrine/paracrine secretion of IL-10 by tumor cells to promote
their proliferation and inhibit apoptosis has also been demonstrated [112, 113]. A study
shows that IL-10 promotes proliferation of human myeloma cells [109] suggesting that
IL-10 could act as a growth factor for malignant plasma cells. Moreover, whether the IL-
10 from myeloma cells could be a cause of immune suppression in myeloma patients
which often leads to fatal bacterial infections is an interesting topic of further research
[60] (discussed in detail in section 4.4).
4.2.4 IL-10 expression observed in early plasma cells
The massive IL-10+CD138hi plasma cell response after GMD injection was present on day
7 following treatment but was decreased already on day 17 in spleen. This indicates that
the high IL-10+ plasma cell response following GMD treatment is short lived or the cells
moved to other tissues. The short lived cells could be early plasma cells that undergo
apoptosis after a few days of immunoglobulin secretion [114]. The early/short lived
plasma cells generally arise from either naïve marginal zone B cells that are IgDlow or
naïve follicular B cells that are IgDhi [3]. The early plasma cell response can be T cell
independent as in case of LPS stimulation or T dependent [3]. A plasma cell response via
germinal center reaction generally peaks between day 10 and day 14 after immunization
and then diminishes [3]. Since, the analysis of plasma cells following GMD injection was
performed only on day 7 and day 17, a possibility of IL-10+ plasma cell response
following a germinal center reaction cannot be completely eliminated.
DISCUSSION
89
4.2.5 Reasoning behind plasma cells as source of IL-10
The plasma cell frequencies in normal physiological conditions are around 0.1% – 0.5%
in spleen and other lymphoid organs [115]. Both T-dependent (GMD) and T-
independent (LPS) stimulations generated a massive plasma cell response that could
resemble conditions during plasmacytosis. Such high plasma cell response is observed
in various infections, autoimmune diseases like SLE and cancer like multiple myeloma.
Since IL-10 is a well-known immunosuppressive cytokine, the IL-10 production by
plasma cells could be a negative feedback from the cells, in response to B cell activation
and high plasma cell numbers. The B cell stimulatory conditions used in the thesis
induced high frequencies of IL-10+ plasma cells. Whether other stimulatory conditions
or antigens would also lead to such high IL-10+ plasma cell response remains to be
elucidated.
4.2.6 Plasma cells with an immunosuppressive phenotype
There has been evidence suggesting immunopotent and immunosuppressive
characteristics of antibodies are based on their glycosylation status [116]. While the
non-galactosylated IgGs have been associated with pro-inflammatory immune responses
like in rheumatoid arthritis; galactosylated and sialylated antibodies have been shown
to be responsible for immunosuppressive effects as observed after administration of
IVIG [116]. Whether the IL-10+ plasma cells represent a subset of plasma cells, that also
produce immunosuppressive glycolsylated antibodies along with IL-10, needs to be
further examined. Nevertheless, the data shows that plasma cells generated upon LPS or
GMD mediated activation of B cells, can express IL-10 and may act as negative regulators
of immune response. The results further emphasize that apart from being cellular
factories synthesizing and secreting thousands of antibodies, plasma cells have a
potential to regulate immunity by production of cytokines like IL-10.
DISCUSSION
90
4.3 GMD treatment promotes IL-10 in T cells
The results in the thesis indicate that following GMD injection, apart from a large
amount of IL-10+ plasma cells, a small fraction of CD4 T cells also express IL-10. Further
analysis of these T cells revealed that the IL-10+ regulatory T cells were Foxp3+ (Tregs)
as well as Foxp3- CD4 T cells (Tr1 cells or cytokine switched Th1 cells). Additionally,
GMD treatment in B cell specific IL-10 KO mice showed that IL-10+ CD4 T cells were
specifically induced via B lineage cell IL-10. The increase in IL-10+ CD4 T cells was
accompanied by reduction in IFN-γ+ Th1 cells. The induction of Foxp3+ CD4 T cells was
however not dependent on the B lineage IL-10. However, this observation does not rule
out the possibility that the induction of IL-10 among Foxp3+ CD4 T cells is dependent on
B lineage IL-10 while induction of Foxp3+ cells themselves is independent of B lineage
IL-10. Due to lack of sufficient mice during the course of the thesis, this could not be
further analyzed.
4.3.1 Maintenance/induction of regulatory T cell population by B cells
B cells are important in maintaining the Foxp3+ Treg population as has been described
by reduced Tregs observed in B cell deficient mice [117, 118]. Naïve B cells can also
generate regulatory T cells following antigen specific prolonged contact with the T cells
[119]. The importance of B cells and/or B cell derived IL-10 in the induction and
development of IL-10+ T cells (Tregs or Tr1 cells) has been shown in different disease
models. The absence of B cells has also been shown to reduce the number of Tregs and
induce tumor development [118]. In an Ova induced oral tolerance model, the
reconstitution of B cells from WT mice in B cell KO (uMT) mice, induced development of
Tregs and restored oral tolerance [117]. Furthermore, the adoptive transfer of
specifically IL-10+ Bregs in uMT mice restores Tregs in an antigen induced arthritis
model [42]. The exasperated arthritis observed in chimeric mice specifically lacking IL-
10 in B lineage cells is accompanied with reduced frequencies of Foxp3+ Tregs and
Foxp3- Tr1 cells [42] [34]. Contrary to this, in my thesis, I observed similar induction of
Foxp3+ Tregs following GMD injection in B cell specific IL-10 KO mice and wild type
mice. However, an increase in IL-10+ T cells was seen only in wild type mice. Thus, the
results obtained in the thesis are only partially in accordance with previous studies that
suggest that B cell IL-10 is required for the maintenance and induction of both Foxp3+
and Foxp3- regulatory T cells. The results from the thesis suggest that induction of
DISCUSSION
91
Foxp3+ Tregs following B cell activation is not always via B cell IL-10. But, the IL-10
expression in T cells is dependent on B lineage IL-10 and can be increased with the
induction of IL-10+ B lineage cells, as performed via GMD treatment.
4.3.2 Induction of Foxp3+ or Foxp3- regulatory cells: through cytokines or cell-cell
contact
Some studies report that direct contact between the B lineage cells and T cells is
important for induction of Tregs. E.g. CD80/86 deficient (B7-/-) mice are unable to
restore Treg proliferation and migration in EAE model, indicating that contact between
B cells and T cells is crucial [120]. Whether such contact occurs following GMD injection,
for T cell IL-10 and also Foxp3 induction, could be further studied through CD80 or
CD28 inhibition. Such contact between GMD activated B cells and CD4 T cells might be
the cause of induction of Foxp3+ CD4 T cells also in B cell specific IL-10 KO mice,
following GMD treatment. Apart from direct contact, IL-10+ B lineage cells could control
the T cell differentiation into IL-10+ T cells by altering the cytokine microenvironment.
Cytokines are known to dictate the balance between pro- and anti-inflammatory T cells.
Cytokines like IL-4 and IL-6 can induce IL-10 production among T cells [121, 122]. These
cytokines are also increased after GMD treatment [123, 124]. Regulatory T cells are also
induced via TGF-β produced by B lineage cells [125]. Thus, the increase in Foxp3+ and
Foxp3- regulatory T cells could also be without direct contact but due to change in the
cytokine microenvironment in spleen.
4.3.3 Th1 cell regulation by IL-10
The role of IL-10 in Th1 cell regulation was first described when mice lacking IL-10 gene
developed colitis via exasperated Th1 responses [22]. The immunoregulatory function
of IL-10 on Th1 cells is also seen in infections. Mice deficient of IL-10 clear Trepanosoma
cruzi and Toxoplasma gondii infection faster but they also have high mortality rate due
to severe tissue damage via unending Th1 activation and failure to downregulate IFN-γ
after pathogenic clearance [126, 127]. Thus, IL-10 mediated suppression of generation
and maintenance of Th1 cells is well known and explains the reduced frequencies of
IFN-γ+ T cells following GMD treatment in wild type but not in B cell specific IL-10 KO
mice. The inhibition of generation of Th1 cells via IL-10 can also occur by IL-10
produced intrinsically by cells expressing IFN-γ during Th1 lineage differentiation [101].
The increased IL-10+ Foxp3- cells observed after GMD treatment could be these Th1 cells
in which the cytokine profile has switched to IL-10 expression.
DISCUSSION
92
4.4 Inhibition of neutrophil migration towards C5a during
plasmacytosis
In this thesis work, it has been observed that high plasma cell load can block neutrophil
migration towards C5a in an IL-10 dependent manner. Already moderate GMD-induced
plasmacytosis was sufficient to block neutrophil migration towards C5a mediated
peritonitis. The inhibition of neutrophil migration was much more pronounced in the
MOPC315.BM myeloma model, in which plasma cells persist longer and in greater
numbers as compared with plasma cell response following GMD treatment.
4.4.1 Physiological relevance in antibody/immune complex mediated
inflammation
This mechanism could be relevant in case of antibody/immune complex mediated
inflammation, where the immune complexes are formed due to massive plasma cell
responses that result in high level production of antibodies. The antibodies and/or
immune complexes attach to the tissues which further leads to activation of complement
as well as secretion of chemokines or other chemoattractants leading to neutrophil
infiltration and tissue injury. This is observed in case of autoimmune and infectious
diseases that are associated with plasmacytosis, e.g. SLE [51], malaria [128] and
Schistosoma infection [129]. Immune complex-mediated inflammation frequently occurs
in severe chronic infections [130] as a result of increasing numbers of antibody-
secreting plasma cells. In this setting, the anti-inflammatory properties of
plasmacytosis-associated IL-10 will limit antibody-initiated and neutrophil-mediated
inflammation, without affecting the protective functions of antibodies, such as microbe-
immobilization, toxin neutralization and induction of complement-mediated pathogen
opsonization and lysis.
Autoantibodies are often present in serum of SLE patients, years before the clinical onset
of disease [131]. The novel anti-inflammatory pathway induced by plasmacytosis
associated IL-10 may contribute to the delayed onset of lupus immunopathology.
Support of this idea comes from Lyn deficient mice that exhibit B cell intrinsic
hyperreactivity leading to uncontrolled plasma cell formation, autoantibody production
and the development of a lupus-like disease. In this model, B lineage-derived IL-10 was
shown to reduce lupus nephritis development, and among B lineage cells, CD138+
plasma cells were described as a major source of this cytokine [48]. In contrast, B
DISCUSSION
93
lineage-derived IL-10 does not inhibit autoimmunity in MRL.Fas(lpr) mice [132].
However, in contrast to other models and SLE patients [133], lupus disease in the
MRL.Fas model is mainly driven by an uncontrolled T cell response rather than by B cell
hyperreactivity [134].
4.4.2 Physiological relevance in plasmacytosis associated immunodeficiency
While plasmacytosis-induced deficiency in neutrophil function could limit unwanted
inflammation, it may also increase the risk of infections. Indeed, deficiency of neutrophil
functions including migration, have been reported in patients suffering from diseases
associated with plasmacytosis such as multiple myeloma and SLE [135]. Of note,
neutrophils are required to elicit an efficient immune defense against Gram-positive
bacteria, which are the frequent cause of severe infections in patients suffering from
both diseases [54, 136]. The results presented in this study may encourage studies
aimed at probing blockade of the IL-10 receptor signaling pathway as a novel strategy to
improve immune dysfunction and reduce severe infections in patients suffering from
multiple myeloma and SLE. Thus, the results suggest further investigation into a possible
causative link between plasmacytosis and immunodeficiency observed in diseases like
lupus and multiple myeloma.
In conclusion, this study provides evidence that plasma cells during plasmacytosis
induced by GMD treatment or in multiple myeloma model exert an immunosuppressive
IL-10 response. This negative feedback response is positively correlated with the
strength of the plasma cell response. It can serve as a counterbalancing mechanism to
protect the body from harmful antibody/immune complex-mediated inflammation and
tissue injury in case of a strong plasma cell response. This protection comes at the price
of severe innate immunodeficiency that often goes along with diseases like SLE and
multiple myeloma.
DISCUSSION
94
4.5 Inhibition of neutrophil migration towards C5a via IL-10
IL-10: a well-known immunoregulatory cytokine exerts a wide spectrum of biological
activities resulting in suppression of the inflammatory response. IL-10 mediates its anti-
inflammatory activities by influencing various cells of the immune system including
neutrophils. Another finding of the thesis is that IL-10 at high concentrations can
directly inhibit neutrophil migration towards C5a. Moreover, the in vitro Boyden
chamber assay showed that IL-10 from co-cultured plasma cells or MOPC315.BM
myeloma cells was sufficient to block neutrophil migration. Additionally, in vivo
neutrophil infiltration towards C5a was reduced in WT mice but not in B cell specific IL-
10 KO mice, following GMD injection. Also, immunohistology showed that plasma cells
and MOPC315.BM myeloma cells co-localize with neutrophils in spleen and bone
marrow respectively.
4.5.1 First study showing a direct effect of IL-10 on C5a mediated neutrophil
migration
There have been various studies suggesting that IL-10 can have suppressive effect on
the development, activation, recruitment and other functional properties of neutrophils
like phagocytosis and respiratory burst [103]. A number of animal models have shown
that IL-10 can reduce the organ injury by inhibiting neutrophil migration. For instance,
IL-10 dose-dependently inhibited neutrophilia in airways in an antigen induced airway
inflammation [137]. The role of endogenously produced IL-10 was also shown in a
model of endotoxemia where inhibition of IL-10 led to increased lung neutrophil influx
as well as increase in TNF-α and macrophage inflammatory protein (MIP)-2 levels [138].
However, the effects of IL-10 on neutrophil migration observed so far were believed to
be due to indirect downregulation of other cytokines or chemokines like IL-1 and TNF-α.
The experiments performed in the thesis show for the first time that IL-10 can directly
inhibit neutrophil migration towards complement C5a. The mechanism by which IL-10
can inhibit neutrophil migration towards C5a remains to be elucidated. The IL-10 could
regulate the expression of the two receptors for C5a on neutrophils namely C5aR (CD88)
and C5L2. While C5aR is known for its pro-inflammatory properties, C5L2 has anti-
inflammatory effects [139].
DISCUSSION
95
4.5.2 First study demonstrating effect of high concentrations of IL-10 from plasma
cell on neutrophils
Although some studies suggest that plasma cells and/or B lineage cells have a potential
to express IL-10, and these IL-10 expressing cells can affect monocytes [24], dendritic
cells [140] T cell functions [34, 42]; the negative modulation of neutrophil migration via
IL-10 from plasma cells has been shown for the first time through this thesis. The data
from B cell specific IL-10 KO mice further confirm that the plasmacytosis associated
inhibition of neutrophil migration is specifically via IL-10 from plasma cells and not
from T cells that also express IL-10 following GMD treatment.
IL-10 can directly have an inhibitory effect on neutrophil migration only at
concentrations of >25 ng/ml. Experimental results show that GMD treated mice or the
mice with myeloma load do not have such high concentrations in the serum. However,
these levels of IL-10 could be reached within tissue or in the periphery of the individual
cells. The co-localization of plasma cells or myeloma cells with neutrophils found in
spleen and bone marrow sections respectively further emphasizes the hypothesis that
the high concentrations of IL-10 found in the periphery of plasma cells could negatively
regulate neutrophil migration towards the site of inflammation. Also, there is a much
higher possibility of the plasma cells and neutrophils to co-localize especially in spleen
since both these types of cells are found in red pulp of spleen, while T cells are mostly
present in the white pulp in the periarteriolar lymphoid sheath.
4.5.3 Physiological relevance
In addition to the direct inhibitory effect of IL-10 on neutrophil migration identified in
this thesis, IL-10 exhibits multiple other anti-inflammatory effects, e.g. blockade of
neutrophil activation and degranulation, inhibition of inflammatory chemokines and T
cells [103]; suggesting that plasmacytosis associated IL-10 can suppress inflammation
and protective immunity at multiple levels. Nevertheless, neutrophil infiltration is a
prerequisite for local tissue destruction by these major innate effector cells. Hence, the
direct inhibitory effect of IL-10 on neutrophil migration towards C5a could be an
important mechanism to limit inflammation. But on the other hand, it could also impair
innate immune defense since neutrophils are usually the first cells to be recruited to the
site of inflammation [70]. To the best of my knowledge, such a direct inhibitory effect of
IL-10 on complement-mediated neutrophil migration has not been described so far. This
DISCUSSION
96
finding adds an additional mechanism of how IL-10 can suppress innate and adaptive
immunity, and particularly neutrophil functions.
4.6 Suppression of neutrophil mediated skin autoimmune disease
through GMD induced plasmacytosis
In this thesis it has been demonstrated for the first time that IL-10 plays an
immunoregulatory role in the pathogenesis of active model of EBA. It was also shown
that IL-10+ B cells are increased during the course of the disease. Most importantly,
when GMD treatment was applied in this neutrophil mediated skin autoimmune disease,
it did not increase the autoantibody levels but attenuated the disease in an IL-10
dependent manner. The neutrophil populations in the skin had a tendency to decrease in
the GMD treated mice. Moreover, the mCOL7c-GST specific IFN-γ+ inflammatory Th1
CD4 T cells were reduced following GMD treatment. The mRNA measurement in the skin
of the mice with EBA showed decreased GR1, IFN-γ and IL-17 levels in GMD injected
mice.
4.6.1 Role of IL-10 in EBA explained
The role of various cytokines in autoantibody induced tissue injury in EBA has been
studied so far. In a passive experimental EBA model, induced by the transfer of anti-
collagen VII antibodies in mice, the elevated serum concentrations of TNF-𝛼, MIP-1𝛼,
GM-CSF, IL-1𝛼, IL-1𝛽, IL-4, IL-6, IL-10 and IL-17 were observed [75]. Although increased
IL-10 levels were observed in experimental EBA model, the functional relevance of this
cytokine in the disease has not been described so far. The increased disease score in
mice injected with anti-IL-10R blocking antibody shows an immunoregulatory role
played by IL-10 in EBA. Furthermore, the attenuation of the disease following GMD
treatment indicates towards a potential IL-10 targeted therapy in EBA.
IL-10+ B cells have been shown to be increased in many autoimmune disease models
including EAE, colitis, collagen induced arthritis and lupus [24]. In these models, the IL-
10+ B cells negatively regulate the disease and the absence of these cells leads to an
exasperated disease [24]. The results in the thesis indicate that frequency of IL-10+ B
cells is four times higher in the diseased mice, suggesting further that IL-10 from B cells
could be playing a regulatory role in EBA.
DISCUSSION
97
4.6.2 The effectiveness of GMD treatment is through IL-10 and inhibition of
complement mediated neutrophil migration but not via other IVIG like effects
Intravenous application of high doses of IgG (IVIG) has been used as therapy for
different autoimmune diseases like multiple sclerosis, pemphigus disease [141, 142].
EBA patients treated with IVIG also showed a satisfactory clinical response suggesting
IVIG as an effective treatment for EBA [85]. Since GMD is composed of anti-IgD
antibodies, the attenuated disease observed following GMD treatment could also have
been an effect similar to IVIG treatment. However, the experiments in the thesis show
that the EBA disease score was higher when the GMD injection was accompanied with
anti-IL-10R antibody. This result indicates that the GMD induced IL-10 plays regulatory
role in the disease. Moreover, no attenuation of EBA was observed in mice injected with
goat serum, indicating that goat antibodies do not have any effect in experimental EBA.
The above observations rule out the hypothesis that the attenuation of the disease
following GMD treatment might be due to high levels of immunoglobulin injected in the
treatment. Since one of the suggested mechanisms of action of IVIG is via inhibitory Fc
receptor (FcγRIIB) [143], injection of only Fab fragments of GMD will help to further
evaluate any immunosuppressive effects via Fc fragments of the injected antibodies.
Blistering in experimental EBA mice is associated with local deposition of complement,
indicating that complement activation is essential for blister formation in EBA [79]. Also,
C5 deficient mice are protected from experimental EBA [76]. Neutrophils have been
demonstrated to be main effector cells in EBA as their depletion is accompanied by
protection from the disease [84]. The major role played by complement and neutrophils
in EBA further explains the effectiveness of GMD treatment in attenuation of the disease,
since as observed in the course of the thesis, GMD treatment leads to inhibition of
neutrophil migration towards C5a. This is also seen in the reduced tendency of
migration of neutrophils towards skin in the GMD treated mice as observed by MPO
assay as well as RT-PCR.
4.6.3 Effect of GMD on CD4 T cells and its possible relevance in EBA
CD4 T cells clearly play role in autoantibody induction in EBA. Nude mice are completely
protected from EBA and the disease is restored by transfer of T cells from wild type mice
[81]. T cells are also target of heat shock protein 90 blockade that ameliorates the
disease [144]. Collagen VII specific T cells can also be detected in the serum of EBA
patients [145]. A study also suggests that complement-fixing anti-collagen VII antibodies
DISCUSSION
98
that are responsible for tissue injury in EBA are induced in Th1 polarized lymph nodes
in experimental EBA mice [82]. Increased IFN-γ/IL-4 ratio in the draining lymph nodes
of EBA susceptible mice compared to EBA resistant mice further indicated a role of Th1
cells in the pathogenesis of EBA. Thus, there is plenty of experimental evidence showing
the significance of T cells in autoantibody production and induction of EBA. However, a
clear role of T cells and the cytokines produced by autoreactive CD4 T cells in the
effector phase of EBA (i.e. in autoantibody induced tissue injury) has not been studied so
far. In the thesis, GMD treatment was performed after the mice started showing the first
signs of symptoms i.e. during the effector phase of EBA. Hence, the reduced mCOL7c-GST
specific IFN-γ+ CD4 T cells observed after GMD treatment shed some light on the role
Th1 cells could play in the effector phase of EBA. The Th1 cells have been shown to be
pathogenic in many autoimmune diseases like EAE and collagen induced arthritis [34,
146]. The long term decrease (three weeks post GMD injection) in the IFN-γ+ mCOL7c-
GST specific CD4 T cells could also contribute to the decreased disease score in GMD
treated mice. The decreased IFN-γ mRNA in the ears of the GMD treated mice compared
to control mice further indicates a role of Th1 cells in the effector phase of EBA.
Moreover, since IL-10 was shown to be immunoregulatory in the disease, the increase in
IL-10+ mCOL7c-GST specific CD4 T cells although short term could also lead to the
amelioration of the disease. The increase in the regulatory T cells which are well known
to be immunosuppressive in various autoimmune diseases [25] could further enhance
the effect of GMD treatment. Depletion of CD4 cells or IFN-γ during the effector phase of
experimental EBA would further determine the significance of Th1 cells in the induction
of disease symptoms in EBA.
In the GMD treatment, the accompanied decrease in IFN-γ secreting Th1 cells, although
not very drastic, suggests that GMD could be potentially used in autoimmune disease
models like EAE and collagen induced arthritis, where Th1 cells have been shown to be
associated with the pathogenesis of the disease [34, 146].
OUTLOOK/ FUTURE PLANS
99
5. Outlook/Future Plans
The results obtained in the course of the thesis clearly indicate that plasma cells express
IL-10 and this IL-10 can negatively regulate C5a mediated neutrophil migration as well
as Th1 cell populations. The thesis shows physiological relevance of plasma cell IL-10 in
attenuating a skin autoimmune disease where neutrophils play a major role in tissue
injury. Another major result of the thesis is the inhibition of neutrophil migration by IL-
10 in MOPC315.BM induced murine multiple myeloma model. It would be interesting to
find out whether IL-10 from myeloma cells could be one of the reasons for immune
suppression and increased bacterial infections observed in multiple myeloma patients.
This is currently being evaluated in the MOPC315.BM induced murine multiple myeloma
model, in cooperation with Dr. Kurt Bommert, University of Würzburg and Prof.
Hammerschmidt, University of Greifswald. In this experiment, the mice injected with
MOPC315.BM will be infected with Streptococcus pneumoniae and the degree of infection
in the lungs, nasopharynx and bronchial tissue will be analyzed.
Similarly, it would be interesting to address the question whether plasma cell IL-10 is
also one of the causes for increased infections observed in SLE patients who also have
increased plasma cell frequencies. Neutrophil migration towards C5a as well as degree
of infections could be analyzed in mouse SLE models.
The molecular basis of the IL-10 mediated direct suppression of neutrophils towards
C5a is currently being analyzed in cooperation with Dr. Christian Karsten, University of
Lübeck. The effect of IL-10 on the C5a receptor, calcium release and ROS release in
neutrophils would be studied under this study.
Additionally, considering the effect of GMD on induction of IL-10 expressing and Foxp3+
regulatory T cells as well as inhibition of IFN-γ+ Th1 cells, the treatment could be tried in
many other autoimmune diseases where alteration of these T cell populations has been
shown to attenuate the disease.
REFERENCES
100
6. References
1. Chung, J.B., M. Silverman, and J.G. Monroe, Transitional B cells: step by step towards immune competence. Trends Immunol, 2003. 24(6): p. 343-9.
2. Goldsby, R.A., et al., Kuby immunology. 4th ed. 2000, New York: W.H. Freeman. xxv, 670 p.
3. Shapiro-Shelef, M. and K. Calame, Regulation of plasma-cell development. Nat Rev Immunol, 2005. 5(3): p. 230-42.
4. Pillai, S., A. Cariappa, and S.T. Moran, Marginal zone B cells. Annu Rev Immunol, 2005. 23: p. 161-96.
5. MacLennan, I.C., Germinal centers. Annu Rev Immunol, 1994. 12: p. 117-39.
6. Manz, R.A., A. Thiel, and A. Radbruch, Lifetime of plasma cells in the bone marrow. Nature, 1997. 388(6638): p. 133-4.
7. Radbruch, A., et al., Competence and competition: the challenge of becoming a long-lived plasma cell. Nat Rev Immunol, 2006. 6(10): p. 741-50.
8. Tiburzy, B., et al., Plasma cells in immunopathology: concepts and therapeutic strategies. Semin Immunopathol, 2014. 36(3): p. 277-88.
9. Hiepe, F., et al., Long-lived autoreactive plasma cells drive persistent autoimmune inflammation. Nat Rev Rheumatol, 2011. 7(3): p. 170-8.
10. Weissmann, G., Rheumatoid arthritis and systemic lupus erythematosus as immune complex diseases. Bull NYU Hosp Jt Dis, 2009. 67(3): p. 251-3.
11. Constant, S.L. and K. Bottomly, Induction of Th1 and Th2 CD4+ T cell responses: the alternative approaches. Annu Rev Immunol, 1997. 15: p. 297-322.
12. Steinman, L., A brief history of T(H)17, the first major revision in the T(H)1/T(H)2 hypothesis of T cell-mediated tissue damage. Nat Med, 2007. 13(2): p. 139-45.
13. Cantor, S.B., et al., Pharmacoeconomic analysis of oprelvekin (recombinant human interleukin-11) for secondary prophylaxis of thrombocytopenia in solid tumor patients receiving chemotherapy. Cancer, 2003. 97(12): p. 3099-106.
14. Ramirez-Herraiz, E., et al., Efficiency of adalimumab, etanercept and infliximab in rheumatoid arthritis patients: dosing patterns and effectiveness in daily clinical practice. Clin Exp Rheumatol, 2013. 31(4): p. 559-65.
15. Targan, S.R., et al., A short-term study of chimeric monoclonal antibody cA2 to tumor necrosis factor alpha for Crohn's disease. Crohn's Disease cA2 Study Group. N Engl J Med, 1997. 337(15): p. 1029-35.
REFERENCES
101
16. Madan, R., et al., Nonredundant roles for B cell-derived IL-10 in immune counter-regulation. J Immunol, 2009. 183(4): p. 2312-20.
17. Fiorentino, D.F., et al., IL-10 acts on the antigen-presenting cell to inhibit cytokine production by Th1 cells. J Immunol, 1991. 146(10): p. 3444-51.
18. Pestka, S., et al., Interleukin-10 and related cytokines and receptors. Annu Rev Immunol, 2004. 22: p. 929-79.
19. Ding, L., et al., IL-10 inhibits macrophage costimulatory activity by selectively inhibiting the up-regulation of B7 expression. J Immunol, 1993. 151(3): p. 1224-34.
20. de Waal Malefyt, R., et al., Interleukin 10 (IL-10) and viral IL-10 strongly reduce antigen-specific human T cell proliferation by diminishing the antigen-presenting capacity of monocytes via downregulation of class II major histocompatibility complex expression. J Exp Med, 1991. 174(4): p. 915-24.
21. Moore, K.W., et al., Interleukin-10 and the interleukin-10 receptor. Annu Rev Immunol, 2001. 19: p. 683-765.
22. Kuhn, R., et al., Interleukin-10-deficient mice develop chronic enterocolitis. Cell, 1993. 75(2): p. 263-74.
23. Braat, H., et al., A phase I trial with transgenic bacteria expressing interleukin-10 in Crohn's disease. Clin Gastroenterol Hepatol, 2006. 4(6): p. 754-9.
24. Mauri, C. and A. Bosma, Immune regulatory function of B cells. Annu Rev Immunol, 2012. 30: p. 221-41.
25. Sakaguchi, S., Regulatory T cells: key controllers of immunologic self-tolerance. Cell, 2000. 101(5): p. 455-8.
26. Sakaguchi, S., T. Takahashi, and Y. Nishizuka, Study on cellular events in post-thymectomy autoimmune oophoritis in mice. II. Requirement of Lyt-1 cells in normal female mice for the prevention of oophoritis. J Exp Med, 1982. 156(6): p. 1577-86.
27. Sakaguchi, S., et al., Regulatory T cells and immune tolerance. Cell, 2008. 133(5): p. 775-87.
28. Sakaguchi, S., et al., Immunologic self-tolerance maintained by activated T cells expressing IL-2 receptor alpha-chains (CD25). Breakdown of a single mechanism of self-tolerance causes various autoimmune diseases. J Immunol, 1995. 155(3): p. 1151-64.
29. Hori, S., T. Nomura, and S. Sakaguchi, Control of regulatory T cell development by the transcription factor Foxp3. Science, 2003. 299(5609): p. 1057-61.
30. Kretschmer, K., et al., Inducing and expanding regulatory T cell populations by foreign antigen. Nat Immunol, 2005. 6(12): p. 1219-27.
REFERENCES
102
31. Laurence, A., et al., Interleukin-2 signaling via STAT5 constrains T helper 17 cell generation. Immunity, 2007. 26(3): p. 371-81.
32. Nolting, J., et al., Retinoic acid can enhance conversion of naive into regulatory T cells independently of secreted cytokines. J Exp Med, 2009. 206(10): p. 2131-9.
33. Bettelli, E., et al., Reciprocal developmental pathways for the generation of pathogenic effector TH17 and regulatory T cells. Nature, 2006. 441(7090): p. 235-8.
34. Carter, N.A., E.C. Rosser, and C. Mauri, Interleukin-10 produced by B cells is crucial for the suppression of Th17/Th1 responses, induction of T regulatory type 1 cells and reduction of collagen-induced arthritis. Arthritis Res Ther, 2012. 14(1): p. R32.
35. Barr, T.A., et al., B cell depletion therapy ameliorates autoimmune disease through ablation of IL-6-producing B cells. J Exp Med, 2012. 209(5): p. 1001-10.
36. Bermejo, D.A., et al., Trypanosoma cruzi trans-sialidase initiates a program independent of the transcription factors RORgammat and Ahr that leads to IL-17 production by activated B cells. Nat Immunol, 2013. 14(5): p. 514-22.
37. Matthes, T., C. Werner-Favre, and R.H. Zubler, Cytokine expression and regulation of human plasma cells: disappearance of interleukin-10 and persistence of transforming growth factor-beta 1. Eur J Immunol, 1995. 25(2): p. 508-12.
38. Mizoguchi, A. and A.K. Bhan, A case for regulatory B cells. J Immunol, 2006. 176(2): p. 705-10.
39. Goetz, M., et al., Exacerbation of ulcerative colitis after rituximab salvage therapy. Inflamm Bowel Dis, 2007. 13(11): p. 1365-8.
40. Dass, S., E.M. Vital, and P. Emery, Development of psoriasis after B cell depletion with rituximab. Arthritis Rheum, 2007. 56(8): p. 2715-8.
41. Matsushita, T., et al., Regulatory B cells inhibit EAE initiation in mice while other B cells promote disease progression. J Clin Invest, 2008. 118(10): p. 3420-30.
42. Carter, N.A., et al., Mice lacking endogenous IL-10-producing regulatory B cells develop exacerbated disease and present with an increased frequency of Th1/Th17 but a decrease in regulatory T cells. J Immunol, 2011. 186(10): p. 5569-79.
43. Yanaba, K., et al., A regulatory B cell subset with a unique CD1dhiCD5+ phenotype controls T cell-dependent inflammatory responses. Immunity, 2008. 28(5): p. 639-50.
44. Evans, J.G., et al., Novel suppressive function of transitional 2 B cells in experimental arthritis. J Immunol, 2007. 178(12): p. 7868-78.
45. Maseda, D., et al., Regulatory B10 cells differentiate into antibody-secreting cells after transient IL-10 production in vivo. J Immunol, 2012. 188(3): p. 1036-48.
REFERENCES
103
46. Rafei, M., et al., A granulocyte-macrophage colony-stimulating factor and interleukin-15 fusokine induces a regulatory B cell population with immune suppressive properties. Nat Med, 2009. 15(9): p. 1038-45.
47. Neves, P., et al., Signaling via the MyD88 adaptor protein in B cells suppresses protective immunity during Salmonella typhimurium infection. Immunity, 2010. 33(5): p. 777-90.
48. Scapini, P., et al., B cell-derived IL-10 suppresses inflammatory disease in Lyn-deficient mice. Proc Natl Acad Sci U S A, 2011. 108(41): p. E823-32.
49. Nagase, H., et al., Mechanism of hypergammaglobulinemia by HIV infection: circulating memory B-cell reduction with plasmacytosis. Clin Immunol, 2001. 100(2): p. 250-9.
50. Thai, K.T., et al., High incidence of peripheral blood plasmacytosis in patients with dengue virus infection. Clin Microbiol Infect, 2011. 17(12): p. 1823-8.
51. Wanitpongpun, C., et al., Bone marrow abnormalities in systemic lupus erythematosus with peripheral cytopenia. Clin Exp Rheumatol, 2012. 30(6): p. 825-9.
52. Suwannaroj, S., S.L. Elkins, and R.W. McMurray, Systemic lupus erythematosus and Castleman's disease. J Rheumatol, 1999. 26(6): p. 1400-3.
53. Anderson, K.C. and R.D. Carrasco, Pathogenesis of myeloma. Annu Rev Pathol, 2011. 6: p. 249-74.
54. Kalambokis, G.N., L. Christou, and E.V. Tsianos, Multiple myeloma presenting with an acute bacterial infection. Int J Lab Hematol, 2009. 31(4): p. 375-83.
55. Grammatikos, A.P. and G.C. Tsokos, Immunodeficiency and autoimmunity: lessons from systemic lupus erythematosus. Trends Mol Med, 2012. 18(2): p. 101-8.
56. Yue, F.Y., et al., Interleukin-10 is a growth factor for human melanoma cells and down-regulates HLA class-I, HLA class-II and ICAM-1 molecules. Int J Cancer, 1997. 71(4): p. 630-7.
57. Cook, G., et al., Transforming growth factor beta from multiple myeloma cells inhibits proliferation and IL-2 responsiveness in T lymphocytes. J Leukoc Biol, 1999. 66(6): p. 981-8.
58. Urashima, M., et al., Interleukin-6 promotes multiple myeloma cell growth via phosphorylation of retinoblastoma protein. Blood, 1996. 88(6): p. 2219-27.
59. Frassanito, M.A., A. Cusmai, and F. Dammacco, Deregulated cytokine network and defective Th1 immune response in multiple myeloma. Clin Exp Immunol, 2001. 125(2): p. 190-7.
60. Pratt, G., O. Goodyear, and P. Moss, Immunodeficiency and immunotherapy in multiple myeloma. Br J Haematol, 2007. 138(5): p. 563-79.
REFERENCES
104
61. Jego, G., et al., Pathogen-associated molecular patterns are growth and survival factors for human myeloma cells through Toll-like receptors. Leukemia, 2006. 20(6): p. 1130-7.
62. Sjoholm, A.G., et al., Complement deficiency and disease: an update. Mol Immunol, 2006. 43(1-2): p. 78-85.
63. Manthey, H.D., et al., Complement component 5a (C5a). Int J Biochem Cell Biol, 2009. 41(11): p. 2114-7.
64. Ramos, T.N., J.E. Wohler, and S.R. Barnum, Deletion of both the C3a and C5a receptors fails to protect against experimental autoimmune encephalomyelitis. Neurosci Lett, 2009. 467(3): p. 234-6.
65. Hashimoto, M., et al., Complement drives Th17 cell differentiation and triggers autoimmune arthritis. J Exp Med, 2010. 207(6): p. 1135-43.
66. Yancey, K.B., Biological properties of human C5a: selected in vitro and in vivo studies. Clin Exp Immunol, 1988. 71(2): p. 207-10.
67. Strainic, M.G., et al., Absence of signaling into CD4(+) cells via C3aR and C5aR enables autoinductive TGF-beta1 signaling and induction of Foxp3(+) regulatory T cells. Nat Immunol, 2013. 14(2): p. 162-71.
68. Liu, J., et al., IFN-gamma and IL-17 production in experimental autoimmune encephalomyelitis depends on local APC-T cell complement production. J Immunol, 2008. 180(9): p. 5882-9.
69. Lieschke, G.J., et al., Mice lacking granulocyte colony-stimulating factor have chronic neutropenia, granulocyte and macrophage progenitor cell deficiency, and impaired neutrophil mobilization. Blood, 1994. 84(6): p. 1737-46.
70. Kolaczkowska, E. and P. Kubes, Neutrophil recruitment and function in health and inflammation. Nat Rev Immunol, 2013. 13(3): p. 159-75.
71. Brinkmann, V., et al., Neutrophil extracellular traps kill bacteria. Science, 2004. 303(5663): p. 1532-5.
72. Mayadas, T.N., G.C. Tsokos, and N. Tsuboi, Mechanisms of immune complex-mediated neutrophil recruitment and tissue injury. Circulation, 2009. 120(20): p. 2012-24.
73. Baumann, U., et al., Distinct tissue site-specific requirements of mast cells and complement components C3/C5a receptor in IgG immune complex-induced injury of skin and lung. J Immunol, 2001. 167(2): p. 1022-7.
74. Schmidt, R.E. and J.E. Gessner, Fc receptors and their interaction with complement in autoimmunity. Immunol Lett, 2005. 100(1): p. 56-67.
75. Ludwig, R.J., Clinical presentation, pathogenesis, diagnosis, and treatment of epidermolysis bullosa acquisita. ISRN Dermatol, 2013. 2013: p. 812029.
REFERENCES
105
76. Sitaru, C., et al., Induction of dermal-epidermal separation in mice by passive transfer of antibodies specific to type VII collagen. J Clin Invest, 2005. 115(4): p. 870-8.
77. Woodley, D.T., et al., Evidence that anti-type VII collagen antibodies are pathogenic and responsible for the clinical, histological, and immunological features of epidermolysis bullosa acquisita. J Invest Dermatol, 2005. 124(5): p. 958-64.
78. Woodley, D.T., et al., Induction of epidermolysis bullosa acquisita in mice by passive transfer of autoantibodies from patients. J Invest Dermatol, 2006. 126(6): p. 1323-30.
79. Sitaru, C., et al., Induction of complement-fixing autoantibodies against type VII collagen results in subepidermal blistering in mice. J Immunol, 2006. 177(5): p. 3461-8.
80. Ludwig, R.J., et al., Generation of antibodies of distinct subclasses and specificity is linked to H2s in an active mouse model of epidermolysis bullosa acquisita. J Invest Dermatol, 2011. 131(1): p. 167-76.
81. Sitaru, A.G., et al., T cells are required for the production of blister-inducing autoantibodies in experimental epidermolysis bullosa acquisita. J Immunol, 2010. 184(3): p. 1596-603.
82. Hammers, C.M., et al., Complement-fixing anti-type VII collagen antibodies are induced in Th1-polarized lymph nodes of epidermolysis bullosa acquisita-susceptible mice. J Immunol, 2011. 187(10): p. 5043-50.
83. Sitaru, C., et al., Autoantibodies to type VII collagen mediate Fcgamma-dependent neutrophil activation and induce dermal-epidermal separation in cryosections of human skin. Am J Pathol, 2002. 161(1): p. 301-11.
84. Chiriac, M.T., et al., NADPH oxidase is required for neutrophil-dependent autoantibody-induced tissue damage. J Pathol, 2007. 212(1): p. 56-65.
85. Ahmed, A.R. and H.M. Gurcan, Treatment of epidermolysis bullosa acquisita with intravenous immunoglobulin in patients non-responsive to conventional therapy: clinical outcome and post-treatment long-term follow-up. J Eur Acad Dermatol Venereol, 2012. 26(9): p. 1074-83.
86. Hofgaard, P.O., et al., A novel mouse model for multiple myeloma (MOPC315.BM) that allows noninvasive spatiotemporal detection of osteolytic disease. PLoS One, 2012. 7(12): p. e51892.
87. Wong, D., et al., Eosinophils and Megakaryocytes Support the Early Growth of Murine MOPC315 Myeloma Cells in Their Bone Marrow Niches. PLoS One, 2014. 9(10): p. e109018.
88. Tiburzy, B., et al., Persistent autoantibody-production by intermediates between short-and long-lived plasma cells in inflamed lymph nodes of experimental epidermolysis bullosa acquisita. PLoS One, 2013. 8(12): p. e83631.
REFERENCES
106
89. Jung, T., et al., Detection of intracellular cytokines by flow cytometry. J Immunol Methods, 1993. 159(1-2): p. 197-207.
90. Matsushita, T. and T.F. Tedder, Identifying regulatory B cells (B10 cells) that produce IL-10 in mice. Methods Mol Biol, 2011. 677: p. 99-111.
91. Kirchhoff, D., et al., Identification and isolation of murine antigen-reactive T cells according to CD154 expression. Eur J Immunol, 2007. 37(9): p. 2370-7.
92. Frentsch, M., et al., Direct access to CD4+ T cells specific for defined antigens according to CD154 expression. Nat Med, 2005. 11(10): p. 1118-24.
93. Finkelman, F., et al., The in vivo cytokine capture assay for measurement of cytokine production in the mouse. Curr Protoc Immunol, 2003. Chapter 6: p. Unit 6 28.
94. Finkelman, F.D., et al., Anti-cytokine antibodies as carrier proteins. Prolongation of in vivo effects of exogenous cytokines by injection of cytokine-anti-cytokine antibody complexes. J Immunol, 1993. 151(3): p. 1235-44.
95. Bradley, P.P., et al., Measurement of cutaneous inflammation: estimation of neutrophil content with an enzyme marker. J Invest Dermatol, 1982. 78(3): p. 206-9.
96. Kalies, K., et al., T cell zones of lymphoid organs constitutively express Th1 cytokine mRNA: specific changes during the early phase of an immune response. J Immunol, 2006. 176(2): p. 741-9.
97. Wang, K., G. Wei, and D. Liu, CD19: a biomarker for B cell development, lymphoma diagnosis and therapy. Exp Hematol Oncol, 2012. 1(1): p. 36.
98. O'Connell, F.P., J.L. Pinkus, and G.S. Pinkus, CD138 (syndecan-1), a plasma cell marker immunohistochemical profile in hematopoietic and nonhematopoietic neoplasms. Am J Clin Pathol, 2004. 121(2): p. 254-63.
99. Coffman, R.L. and I.L. Weissman, B220: a B cell-specific member of th T200 glycoprotein family. Nature, 1981. 289(5799): p. 681-3.
100. Shen, P., et al., IL-35-producing B cells are critical regulators of immunity during autoimmune and infectious diseases. Nature, 2014. 507(7492): p. 366-70.
101. Cope, A., et al., The Th1 life cycle: molecular control of IFN-gamma to IL-10 switching. Trends Immunol, 2011. 32(6): p. 278-86.
102. Lagasse, E. and I.L. Weissman, Flow cytometric identification of murine neutrophils and monocytes. J Immunol Methods, 1996. 197(1-2): p. 139-50.
103. Cassatella, M.A., The neutrophil: one of the cellular targets of interleukin-10. Int J Clin Lab Res, 1998. 28(3): p. 148-61.
104. Otsuki, T., et al., IL-10 in myeloma cells. Leuk Lymphoma, 2002. 43(5): p. 969-74.
REFERENCES
107
105. Gu, Z.J., et al., Interleukin-10 is a growth factor for human myeloma cells by induction of an oncostatin M autocrine loop. Blood, 1996. 88(10): p. 3972-86.
106. Nolte, M.A., et al., Isolation of the intact white pulp. Quantitative and qualitative analysis of the cellular composition of the splenic compartments. Eur J Immunol, 2000. 30(2): p. 626-34.
107. Elmore, S.A., Enhanced histopathology of the spleen. Toxicol Pathol, 2006. 34(5): p. 648-55.
108. Winter, O., et al., Megakaryocytes constitute a functional component of a plasma cell niche in the bone marrow. Blood, 2010. 116(11): p. 1867-75.
109. Lu, Z.Y., et al., Interleukin-10 is a proliferation factor but not a differentiation factor for human myeloma cells. Blood, 1995. 85(9): p. 2521-7.
110. Yang, L. and D.P. Carbone, Tumor-host immune interactions and dendritic cell dysfunction. Adv Cancer Res, 2004. 92: p. 13-27.
111. Chen, Q., et al., Production of IL-10 by melanoma cells: examination of its role in immunosuppression mediated by melanoma. Int J Cancer, 1994. 56(5): p. 755-60.
112. Sredni, B., et al., Ammonium trichloro(dioxoethylene-o,o')tellurate (AS101) sensitizes tumors to chemotherapy by inhibiting the tumor interleukin 10 autocrine loop. Cancer Res, 2004. 64(5): p. 1843-52.
113. Alas, S., C. Emmanouilides, and B. Bonavida, Inhibition of interleukin 10 by rituximab results in down-regulation of bcl-2 and sensitization of B-cell non-Hodgkin's lymphoma to apoptosis. Clin Cancer Res, 2001. 7(3): p. 709-23.
114. Smith, K.G., et al., The phenotype and fate of the antibody-forming cells of the splenic foci. Eur J Immunol, 1996. 26(2): p. 444-8.
115. Gutierrez, T., et al., Separate checkpoints regulate splenic plasma cell accumulation and IgG autoantibody production in Lyn-deficient mice. Eur J Immunol, 2010. 40(7): p. 1897-905.
116. Collin, M. and M. Ehlers, The carbohydrate switch between pathogenic and immunosuppressive antigen-specific antibodies. Exp Dermatol, 2013. 22(8): p. 511-4.
117. Sun, J.B., et al., B lymphocytes promote expansion of regulatory T cells in oral tolerance: powerful induction by antigen coupled to cholera toxin B subunit. J Immunol, 2008. 181(12): p. 8278-87.
118. Tadmor, T., et al., The absence of B lymphocytes reduces the number and function of T-regulatory cells and enhances the anti-tumor response in a murine tumor model. Cancer Immunol Immunother, 2011. 60(5): p. 609-19.
119. Reichardt, P., et al., Naive B cells generate regulatory T cells in the presence of a mature immunologic synapse. Blood, 2007. 110(5): p. 1519-29.
REFERENCES
108
120. Mann, M.K., et al., B cell regulation of CD4+CD25+ T regulatory cells and IL-10 via B7 is essential for recovery from experimental autoimmune encephalomyelitis. J Immunol, 2007. 178(6): p. 3447-56.
121. Jin, J.O., X. Han, and Q. Yu, Interleukin-6 induces the generation of IL-10-producing Tr1 cells and suppresses autoimmune tissue inflammation. J Autoimmun, 2013. 40: p. 28-44.
122. Schmidt-Weber, C.B., et al., IL-4 enhances IL-10 gene expression in murine Th2 cells in the absence of TCR engagement. J Immunol, 1999. 162(1): p. 238-44.
123. Champion, B.R., et al., Secondary immunoglobulin responses of C57BL/c mice previously stimulated with goat anti-mouse IgD. Immunology, 1991. 72(3): p. 336-43.
124. Kricek, F., et al., Induction in mice of serum IgE levels after treatment with anti-mouse IgD antibodies is preceded by differential modulation of tissue cytokine gene transcription. Eur J Immunol, 1995. 25(4): p. 936-41.
125. Lee, K.M., et al., TGF-beta-producing regulatory B cells induce regulatory T cells and promote transplantation tolerance. Eur J Immunol, 2014. 44(6): p. 1728-36.
126. Gazzinelli, R.T., et al., In the absence of endogenous IL-10, mice acutely infected with Toxoplasma gondii succumb to a lethal immune response dependent on CD4+ T cells and accompanied by overproduction of IL-12, IFN-gamma and TNF-alpha. J Immunol, 1996. 157(2): p. 798-805.
127. Hunter, C.A., et al., IL-10 is required to prevent immune hyperactivity during infection with Trypanosoma cruzi. J Immunol, 1997. 158(7): p. 3311-6.
128. Grau, G.E., et al., Interleukin 6 production in experimental cerebral malaria: modulation by anticytokine antibodies and possible role in hypergammaglobulinemia. J Exp Med, 1990. 172(5): p. 1505-8.
129. Boros, D.L., Immunopathology of Schistosoma mansoni infection. Clin Microbiol Rev, 1989. 2(3): p. 250-69.
130. Naicker, S., et al., Infection and glomerulonephritis. Semin Immunopathol, 2007. 29(4): p. 397-414.
131. Arbuckle, M.R., et al., Development of autoantibodies before the clinical onset of systemic lupus erythematosus. N Engl J Med, 2003. 349(16): p. 1526-33.
132. Teichmann, L.L., et al., B cell-derived IL-10 does not regulate spontaneous systemic autoimmunity in MRL.Fas(lpr) mice. J Immunol, 2012. 188(2): p. 678-85.
133. Lipsky, P.E., Systemic lupus erythematosus: an autoimmune disease of B cell hyperactivity. Nat Immunol, 2001. 2(9): p. 764-6.
134. Huggins, M.L., et al., Modulation of autoimmune disease in the MRL-lpr/lpr mouse by IL-2 and TGF-beta1 gene therapy using attenuated Salmonella typhimurium as gene carrier. Lupus, 1999. 8(1): p. 29-38.
REFERENCES
109
135. Heise, E.R., Diseases associated with immunosuppression. Environ Health Perspect, 1982. 43: p. 9-19.
136. Zandman-Goddard, G. and Y. Shoenfeld, SLE and infections. Clin Rev Allergy Immunol, 2003. 25(1): p. 29-40.
137. Zuany-Amorim, C., et al., Interleukin-10 inhibits antigen-induced cellular recruitment into the airways of sensitized mice. J Clin Invest, 1995. 95(6): p. 2644-51.
138. Standiford, T.J., et al., Neutralization of IL-10 increases lethality in endotoxemia. Cooperative effects of macrophage inflammatory protein-2 and tumor necrosis factor. J Immunol, 1995. 155(4): p. 2222-9.
139. Gerard, N.P., et al., An anti-inflammatory function for the complement anaphylatoxin C5a-binding protein, C5L2. J Biol Chem, 2005. 280(48): p. 39677-80.
140. Lo-Man, R., Regulatory B cells control dendritic cell functions. Immunotherapy, 2011. 3(4 Suppl): p. 19-20.
141. Amagai, M., et al., A randomized double-blind trial of intravenous immunoglobulin for pemphigus. J Am Acad Dermatol, 2009. 60(4): p. 595-603.
142. Fergusson, D., et al., Use of intravenous immunoglobulin for treatment of neurologic conditions: a systematic review. Transfusion, 2005. 45(10): p. 1640-57.
143. Samuelsson, A., T.L. Towers, and J.V. Ravetch, Anti-inflammatory activity of IVIG mediated through the inhibitory Fc receptor. Science, 2001. 291(5503): p. 484-6.
144. Kasperkiewicz, M., et al., Heat-shock protein 90 inhibition in autoimmunity to type VII collagen: evidence that nonmalignant plasma cells are not therapeutic targets. Blood, 2011. 117(23): p. 6135-42.
145. Muller, R., et al., T and B cells target identical regions of the non-collagenous domain 1 of type VII collagen in epidermolysis bullosa acquisita. Clin Immunol, 2010. 135(1): p. 99-107.
146. Jager, A., et al., Th1, Th17, and Th9 effector cells induce experimental autoimmune encephalomyelitis with different pathological phenotypes. J Immunol, 2009. 183(11): p. 7169-77.
LIST OF FIGURES
110
List of Figures
1.1 T cell dependent and independent B cell activation................................................... 7
1.2 Plasma cell response................................................................................................................. 10
1.3 Development of Bregs and their mechanism of action via IL-10 in
autoimmune diseases...............................................................................................................
15
1.4 Pathogenesis of EBA.......................................................................................................... ........ 23
3.1 B cell and non-B cell IL-10 after GMD injection............................................................ 53
3.2 B cell activation via GMD induces a massive IL-10+ response in plasma
cells...................................................................................................................................................
54
3.3 GMD treatment leads to moderate increase in IL-10+ CD4+ T cells...................... 55
3.4 Plasma cells are main contributors of IL-10 following GMD treatment in
spleen............................................................................................................................................ ...
56
3.5 B cell activation via GMD leads to high IL-10 levels in serum................................ 57
3.6 B cell stimulation via LPS induces IL-10+ plasma cells.............................................. 58
3.7 B cell stimulation via LPS induces IL-10 production by plasma cells.................. 59
3.8 GMD treatment augments IL-10 production in Foxp3+ and Foxp3- CD4 T
cells........................................................................................................................ ...........................
61
3.9 B lineage cell IL-10 induces IL-10+ CD4 T cells and reduces IFN-γ+ CD4 T
cells following B cell activation via GMD..........................................................................
63
3.10 B lineage IL-10 does not induce Foxp3+ CD4 T cells following B cell
activation via GMD.....................................................................................................................
64
3.11 A plasma cell response is accompanied with a change in the neutrophil
frequencies in spleen and bone marrow..........................................................................
66
3.12 Mice with myeloma load have increased neutrophil frequencies in spleen... 67
3.13 Experimental scheme describing analysis of neutrophil infiltration towards
C5a in vivo......................................................................................................................................
68
3.14 Polyclonal B cell activation induced plasmacytosis leads to an IL-10
dependent suppression of neutrophil migration towards C5a..............................
69
3.15 Murine myeloma results in an IL-10 dependent suppression of neutrophil
migration towards C5a........................................................................................................ ....
71
3.16 IL-10 can directly suppress neutrophil migration towards C5a............................ 73
3.17 B lineage IL-10 blocks neutrophil migration towards C5a....................................... 74
LIST OF FIGURES
111
3.18 Neutrophils and plasma cells co-localize in vivo……………………………………….... 75
3.19 EBA disease is regulated by IL-10....................................................................................... 77
3.20 IL-10+ Bregs are increased in mice with EBA................................................................. 77
3.21 Scheme of EBA induction and GMD treatment.............................................................. 78
3.22 GMD treatment attenuates the disease in experimental EBA................................. 79
3.23 GMD treatment does not alter autoreactive plasma cells and autoantibody
levels.............................................................................................................................................. ..
81
3.24 Neutrophil infiltration in skin of mice with EBA.......................................................... 82
3.25 GMD treatment reduces IFN-γ+ mCOL7c-GST specific CD4 T cells while
increasing IL-10+ CD4 T cells in EBA model...................................................................
84
3.26 GMD treatment leads to long term reduction in IFN-γ+ mCOL7c-GST specific
CD4 T cells.................................................................................................................. ...................
85
3.27 GMD treatment leads to reduced inflammatory cytokine levels in the ears
of mice with EBA in an IL-10 dependent manner........................................................
85
LIST OF TABLES
112
List of Tables
2.1.1 Buffers, Solutions and Mediums............................................................................... 25
2.1.2 Kits.................................................................................................................................. ....... 26
2.1.3.1 Antibodies used in flow cytometry and immunohistology staining......... 27
2.1.3.2 Antibodies used for injection in mice..................................................................... 27
2.1.3.3 Antibodies used in ELISAs........................................................................................... 28
2.1.4 Instruments....................................................................................................................... 28
2.1.5 List of other reagents..................................................................................................... 29
2.1.6 Small Equipment............................................................................................................. 30
2.1.7 Software used for analysis.......................................................................................... 30
2.8.2 Primer sequences, amplicon sizes and gene accession numbers of the
analyzed genes............................................................................................................... ..
48
ABBREVIATIONS
113
ABBREVIATIONS
Ab Antibody
APC (Dye) Allophycocyanin
APCs Antigen presenting cells
BCR B cell receptor
Bregs Regulatory B cells
BSA Bovine serum albumin
C5a Complement 5a
CD Cluster of differentiation
cDNA Complementary deoxyribonucleic acid
CNS Central nervous system
COL7 Type VII collagen
CSR Class switch recombination
CXCL C-X-C motif ligand
DEJ Dermal-epidermal junction
DNP 2,4-Dinitrophenol
EAE Experimental autoimmune encephalomyelitis
EBA Epidermolysis bullosa acquisita
EDTA Ethylenediaminetetraacetic acid
eGFP Enhanced green fluorescent protein
ELISA Enzyme-linked immunosorbent assay
FACS Fluorescence activated cell sorting
FITC Fluorescein isothiocyanate
Foxp3 Forkhead box P3
GBSS Gey’s Balanced Salt Solution
G-CSF Granulocyte-colony stimulating factor
GFP Green fluorescent protein
GMCSF Granulocyte macrophage colony stimulating factor
GMD Goat anti mouse immunoglobulin D antiserum
GST Glutathion-S-transferase
ABBREVIATIONS
114
HIS Polyhistidine
HIV Human immunodeficiency virus
HLA Human leukocyte antigen
HRP Horseradish peroxidase
HTAB Hexadecyl-trimethylammonium bromide
IFN-γ Interferon-gamma
Ig Immunoglobulin
IL Interleukin
i.p. Intraperitoneal
i.v. Intravenous
IVCCA In vivo cytokine capture assay
IVIG Intravenous immunoglobulin
KO Knockout
LPS Lipopolysaccharide
MACS Magnetic activated cell sorting
MALT Mucosal associated lymphoid tissue
mCOL7c Recombinant murine type VII collagen
MHC Major histocompatibility complex
MIP Macrophage inflammatory protein
MOPC Mineral-oil induced plasmacytomas
MPO Myeloperoxidase
n Number of mice in each group
NC-1 Non-collagenous domain
NETs Neutrophil extracellular traps
NK cells Natural killer cells
O.D. Optical density
PBS Phosphate buffered saline
PCR Polymerase chain reaction
PE Phycoerythrin
PMA Phorbol 12-myristate 13-acetate
ABBREVIATIONS
115
pNPP para-Nitrophenylphosphate
R Receptor
RNA Ribonucleic acid
ROS Reactive oxygen species
RPMI Rosewell Park Memorial Institute Medium
RT Room temperature
RT-PCR Quantitative reverse transcriptase PCR
SLE Systemic lupus erythematosus
TCR T cell receptor
Tc Cytotoxic T cell
TGF-β Transforming growth factor beta
Th T helper cell
TLR Toll like receptor
TMB 3,3’,5,5’-Tetramethylbenzidine
TNF-α Tumor necrosis factor alpha
Tregs Regulatory T cells
Tr1 cells Type 1 regulatory T cells
WT Wild type

ACKNOWLEDGEMENT
116
Acknowledgement
I would like to thank all those who supported me and believed that this work will one
day be ready.
First and foremost, I would like to express my sincerest gratitude to my supervisor Prof.
Rudolf Manz, who has supported me throughout my thesis and provided excellent
guidance.
My sincere thanks also go to all the members of AG Manz and ISEF (especially Kathleen
Kurwahn, Lingzhang Meng, Christian Karsten and David Wong), who helped me with
experimental work as well as provided a very friendly and cheerful working
atmosphere.
Furthermore, I would like to thank members of GRK 1727 as well as my mentors, Prof.
Ludwig and Prof. Westermann, for their suggestions and hard questions.
Last but not the least; I would like to thank my family members for their encouragement
and immense faith in me. I especially thank my father Mr. Anand Kulkarni for reading
my thesis and for his valuable suggestions.

117