Embed Size (px)
Citation preview
Supporting documents
Rare Observation of ‘Aggregation Induced Emission’ in Cyclometalated Platinum(II) Complexes and their Biological Activities
Sheik Saleem Pashaa, Parvej Alama, Subhra Dashb, Gurpreet Kaurc, Debashree Banerjeed, Rajdeep Chowdhuryb, Nigam Rathe, Angshuman Roy Choudhuryc, Inamur Rahaman Laskara*
aDepartment of Chemistry, Birla Institute of Technology and Science, Pilani Campus, Pilani, Rajasthan, India; [email protected]; bDepartment of Biology, Birla Institute of Technology and Science, Pilani Campus, Pilani, Rajasthan, India; [email protected]; cDepartment of Biological Sciences, Birla Institute of Technology and Sciences, Jawahar Nagar, Shameerpet Mandal, Hyderabad, Andhrapradesh, 50078, India; [email protected]; dDepartment of Chemistry and Biochemistry and Center for Nanoscience, University of Missouri- St. Louis, St. Louis, MO 63121USA; [email protected],; e Department of Chemical Sciences, Indian Institute of Science Education and Research (IISER), Mohali, Sector 81, S. A. S. Nagar, Manauli PO, Mohali, Punjab 140306, India ; [email protected]
Experimental
Materials: Potassium tetra chloro palatinate(II), 1,2-bis(diphenylphosphino)ethane, cis-1,2
Bis(diphenylphosphino)ethylene, 2-phenylpyridine, 2-ethoxyethanol were purchased from Sigma Aldrich
Chemical Company Ltd. The other uded solvents were procured from Merck.
Characterization: 1H NMR, 13C NMR and 31P NMR spectra were recorded in a 400 MHz Brucker NMR
spectroscope. UV-Vis absorption spectra were recorded in a Simadzu Spectrophotometer (model UV-1800 and
2550). Steady state photoluminescence (PL) spectra was recorded on Horiba Jobin Yvon Spectrofluorometer
(FluoroMax-4). The solid state quantum yield of the thin film sample was measured using a calibrated
integrating sphere in a Gemini Spectrophotometer (model Gemini 180).
Syntheses and characterizations
Synthesis of complex 1
Electronic Supplementary Material (ESI) for RSC Advances.This journal is © The Royal Society of Chemistry 2014
Complex-1: K2PtCl4 (0.30 g, 7.2 mmol) and 2-phenyl pyridine (0.280 g, 18.1 mmol) were dissolved in 4 mL of
water and kept in a microwave vial for 10 min under microwave condition at 1000C. After 10 min green color
precipitate was obtained and it was separated from water, dry under vacuum oven for 15 min. The crude product
was recrystalized by ethanol giving green color solid product, Yield, (0.360 g, 92%).
General syntheses for complex 2 and 3
To a stirred solution of complex 1 (1 equivalent ) in DCM (6 mL), chelate phosphine ligands for complex 1,
1,2-bis(diphenylphosphino)ethane and for complex 2, cis-1,2-Bis(diphenylphosphino)ethylene (1 equivalent)
was added and the reaction mixture was stirred for 1 minut , the crude product was purified by column
chromatography using 60-120 silica mesh giving pure products.
Complex 2, green solid , 94 % yield and complex 3 green solid , 85% yield
Fabrication of thin-film of 2a and 2b on substrate for PL measurement: The 10-3 M solution of Complex-1,
Complex-2 and complex-3 (in DCM) were prepared. Two drops of the solution were placed on thin glass
substrate (2x2cm2) and the solvent was allowed to evaporate slowly.
Preparation of solution of THF/H2O and DCM / hexane of 1, 2 and 3 for PL measurement:
10-5 M stock solution of 1 was prepared in THF. Six 5 ml glass tube were taken and labeled them as 0 %, 30 %,
50 %, 70 % , 80 % and 90 %. 0.5 mL of stock solution was added to each of the flask. Then, volume was filled
to 5 ml through addition of 0 ml, 1.5 ml, 2.5 ml, 3.5 ml, 4 ml and 4.5 ml water to 0 %, 30 %, 50 %, 70 %, 80
% and 90%, labeled flasks, respectively. For 2 and 3 DCM/ Hexane was used in place of THF/ water.
Single crystal X-ray diffraction data were collected on Bruker AXS Kappa Apex II diffractometer equipped with
Oxford Cryosystem 700Plus liquid nitrogen based cooling device. The data set was recorded at 100K using φ
and ω scans such that the data is completed up to 70 degrees two theta. Data reduction and standard processing
were done using APEX II1 suite available from Bruker AXS. The crystal structure was solved using direct
methods (SHELXS97)2 available in the Olex23 suite and the structure was refined by full matrix least squares
refinement process using SHELXL97.2 Geometric calculations were carried out using PARST974 and
PLATON97.5
Quantum Chemical Calculation using Density Functional Theory (DFT):
The crystal structure of the Platinum complex is being geometry optimized at ground state level using Density
Functional Theory (DFT). B3LYP hybrid functional was used in DFT. Double-Zeta basis set (LANL2DZ) and
effective core potential was approximated for Platinum atom . The four atoms coordinated to Platinum and the
counter-ion chloride were treated separately from the remaining atoms in the complex. The basis set applied on
Chlorine atom, 6-311++G (3df,4pd), contains additional diffusion function to represent its anionic nature. Two
phosphorous atoms, one nitrogen atom and one carbon atom coordinated to Platinum were being assigned 6-
31G** basis set. Remaining carbon and hydrogen atoms were assigned with 6-31G* and 3-21G basis sets,
respectively. Time-dependent DFT (TD-DFT) calculations were performed on the lowest singlet ground state to
probe the absorption and emission properties, using the same functional and basis sets. As the experiments were
recorded in dichloromethane (CH2Cl2) (DCM) solvent, all the computations were performed in DCM solution
(e=8.93) using polarizable continuum model. Ten lowest singlet and triplet roots of the non-Hermitian
eigenvalue equations were obtained to determine the vertical excitation energies. Oscillator strengths were
deduced from the dipole transition matrix elements for singlet states only. All the calculations were performed
using GAMESS-US software. Canonical Molecular Orbital analysis (CMO) has been performed to analyze the
composition and bonding nature of molecular orbitals (MO), using NBO 5.0 software . CMO analysis gives
effective information on i) bonding characters of MO, like HOMO ‒ x, LUMO + y etc. and ii) the energies of
individual MOs. The partial charge transfer (CT) has been characterized for HOMO ‒ x to LUMO + y transition
(Equation 1).
CT(M)=[%(M)HOMO‒x]‒[%(M)LUMO+y] ....Equation 1
In Equation 1, “%(M)HOMO - x” and “%(M)LUMO + y” are percentage of metal character obtained from
CMO analysis. When the contributions to an excited state comes from the multiple single-electron excitations,
the metal CT character is described by the Equation 2
CTi (M) =∑ [Ci ( i - j )]2 ((M)i -(M)j ).......Equation 2,
where Ci (i-j) are co-efficients expressed as the excitation amplitudes corresponding to transitions between i to j
states.
Cytotoxicity and cell imaging study
Hep3B cells (procured from National Centre for Cell Science-NCCS, Pune) were cultured in minimum essential
media (MEM) (Hi media, #41500-067) containing 10% FBS (Invitrogen, #26140-079) and 1% penicillin and
streptomycin mixture (Invitrogen, #10378-016).
The in-vitro cytotoxicity was determined through several assays. Briefly, Hep3B cells growing in log phase
were seeded at a density of 4000 cells per well in 96 well plates and incubated overnight at 5% CO2 and 37C.
The cells were treated with the Pt complex at concentrations of 0.5M, 1M, 2M, 5M, and 10M dissolved
with DMSO (Sigma, # D2438) for 24 hours with respective control where no drug was added. Following drug
treatment, MTT/PBS (MTT: Sigma, #M5655) (Stock concentration 5mg/ml) (PBS: Invitrogen, #21300-025)
20ul was added and incubated for 4 hours post which formazan crystals were solubilized using DMSO and
readings were obtained at 495nm with a differential filter at 630nm using an enzyme-linked immune-sorbent
assay (ELISA) micro-plate reader (model no: Start-fax 2100). Percentage of viable cells was calculated using
formula:
Viability (%) = (mean absorbance value of drug treated cells) / (mean absorbance value of control) *100
The in-vitro cytotoxicity was also validated through WST-1 assay, a ready-to-use colorimetric assay for the non-
radioactive quantification of cytotoxicity. Briefly, Hep3B cells were seeded at a density of 4000 cells per well in
a 96 well plate and incubated for 24 and 48 hours at 5% CO2, and 37C. The cells were treated with the Pt
complex at concentrations of 0.5M, 2M, 5M, 10M, 15M. Following drug treatment, WST1 reagent
(Roche, #11644807001) was added (10l in 100l media) in all the wells and incubated for 4 hours. The
absorbance was measured at 450nm using the ELISA micro-plate reader. Percentage of viable cells was
calculated using the same formula as MTT assay. Furthermore, in-vitro cytotoxicity was also assayed through
Trypan Blue staining. Hep3B cells were seeded at a density of 1*106 cells in 25cm2 culture flask and incubated
for 30 hours. Cells were then trypsinized, 20l of cell suspension was mixed with 2l of trypan blue dye (Bio-
Rad, cat no-#145-0013) and added in a dual chamber cell counter slide (Bio-Rad, cat no- #145-0011). Post
which viability was assayed with an automated cell counter (Bio-Rad).
For bio-imaging experiment, cells were cultured at a density of 2*104 per cover slip and incubated at 5% CO2
and 37C for 24 hours. Following incubation, platinum compound at a concentration of 10M was added and
cells were kept in the incubator for another 1 hour. Cells were then mounted with glycerol on glass slides and
observed under a fluorescence microscope (OLYMPUS, U-25ND25). A representative figure for both bright
field and fluorescence image (100X) is provided in the text. Scale bar represents 5µm.

Fig.S1 1H NMr spectra of 1 , [1H NMR (400 MHz, Chloroform-d) a=δ 9.63 (d, J = 6.0 Hz, 1H), b= δ 9.26 (d, J
= 5.7 Hz, 1H), c= δ 8.10 (d, J = 5.2 Hz, 2H), d= δ 7.96 (t, J = 7.8 Hz, 1H), e= δ 7.74 (t, J = 7.6 Hz, 1H), f= δ
7.64 (s, 1H), g= δ 7.52 (d, J = 7.8 Hz, 2H), h= δ 7.36 (dt, J = 20.8, 6.9 Hz, 4H), i= δ 7.08 (t, J = 6.7 Hz, 1H),
7.03 – 6.97 (m, 1H), j= δ 6.89 (t, J = 7.4 Hz, 1H), k=6.22 (t, 1H), l= δ 6.20 (d, 1H).]
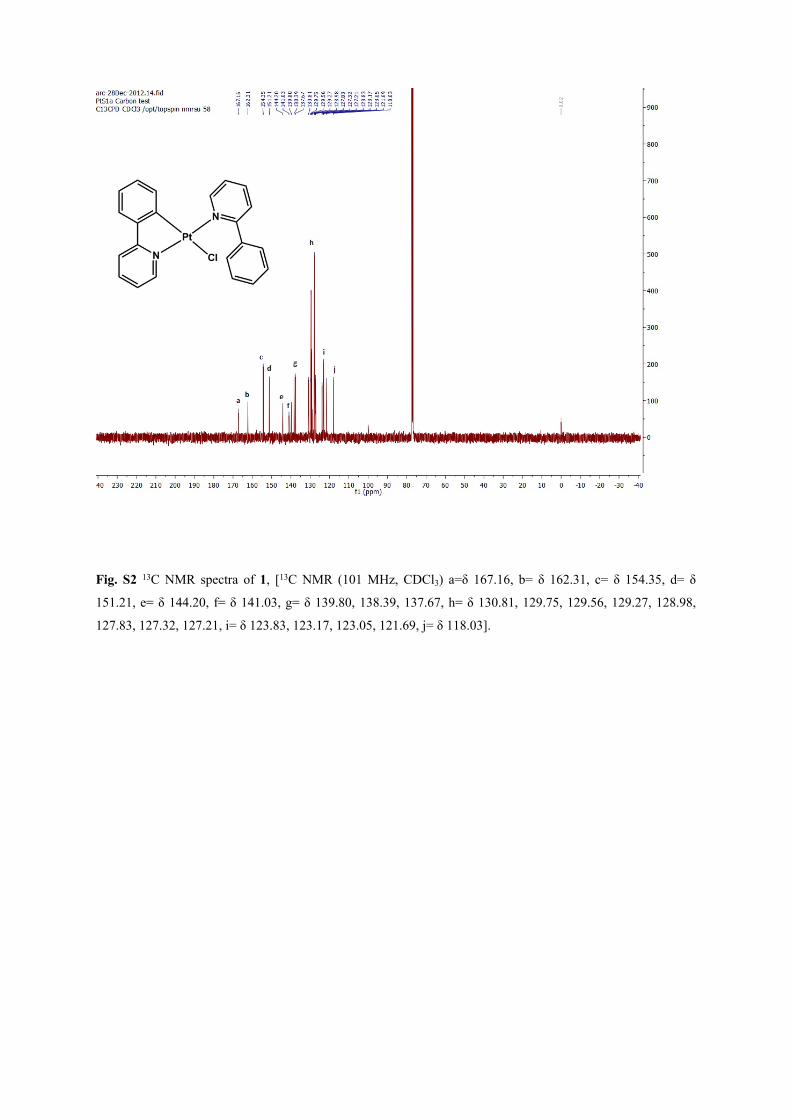
Fig. S2 13C NMR spectra of 1, [13C NMR (101 MHz, CDCl3) a=δ 167.16, b= δ 162.31, c= δ 154.35, d= δ
151.21, e= δ 144.20, f= δ 141.03, g= δ 139.80, 138.39, 137.67, h= δ 130.81, 129.75, 129.56, 129.27, 128.98,
127.83, 127.32, 127.21, i= δ 123.83, 123.17, 123.05, 121.69, j= δ 118.03].

Fig. S3 1H NMR spectra of 2 , [1H NMR (400 MHz, Chloroform-d) a=δ 8.22 (t, J = 4.9 Hz, 1H), b= δ 8.09 –
7.91 (m, 6H), c= δ 7.85 (ddt, J = 11.7, 6.6, 1.6 Hz, 4H), d= δ 7.75 (dt, J = 7.9, 1.7 Hz, 1H), e= δ 7.68 – 7.48 (m,
12H), f= δ 7.15 (t, J = 7.6 Hz, 1H), g= δ 7.08 – 7.00 (m, 1H), h= δ 6.94 (ddt, J = 7.3, 5.8, 1.3 Hz, 1H), i= δ 6.84
(tt, J = 7.5, 1.5 Hz, 1H), j= δ 2.75 – 2.44 (m, 4H)].
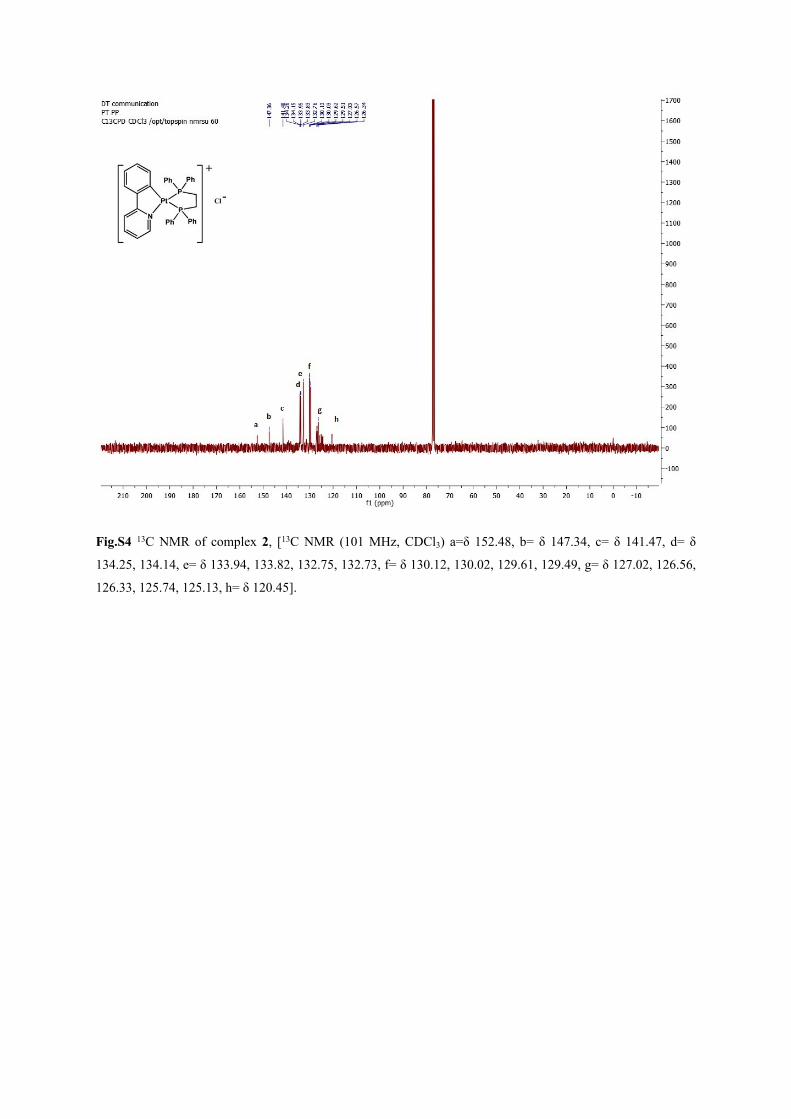
Fig.S4 13C NMR of complex 2, [13C NMR (101 MHz, CDCl3) a=δ 152.48, b= δ 147.34, c= δ 141.47, d= δ
134.25, 134.14, e= δ 133.94, 133.82, 132.75, 132.73, f= δ 130.12, 130.02, 129.61, 129.49, g= δ 127.02, 126.56,
126.33, 125.74, 125.13, h= δ 120.45].
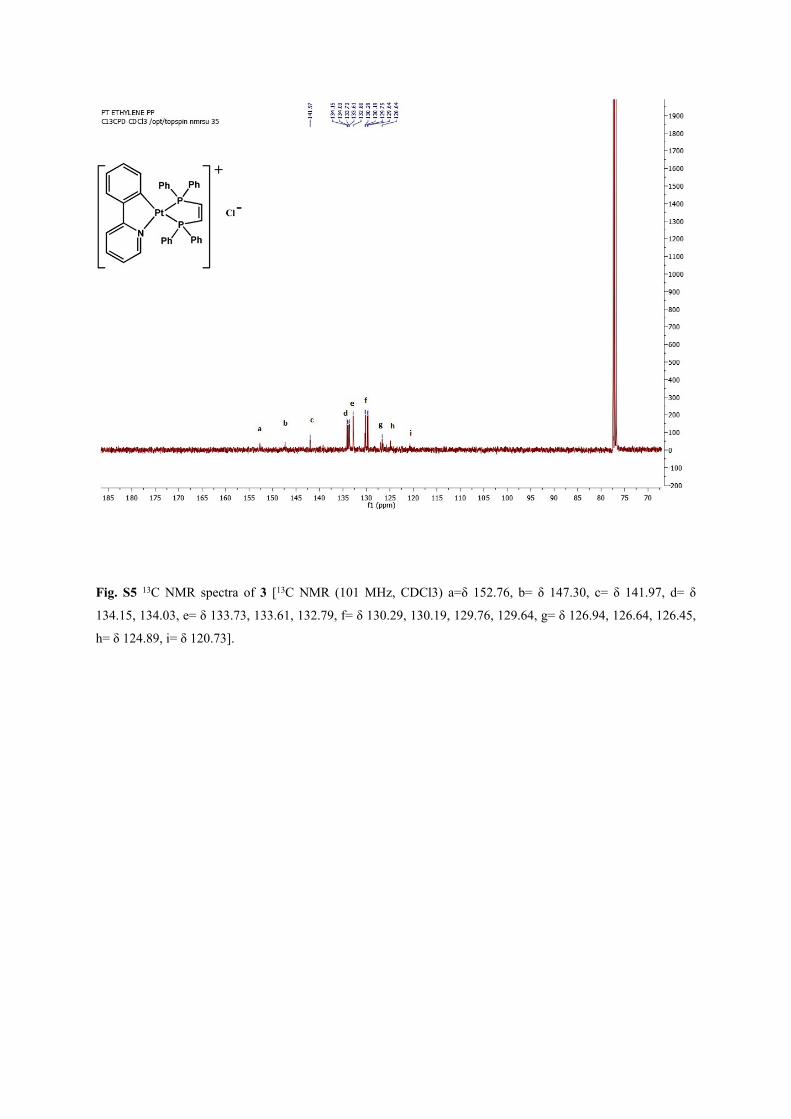
Fig. S5 13C NMR spectra of 3 [13C NMR (101 MHz, CDCl3) a=δ 152.76, b= δ 147.30, c= δ 141.97, d= δ
134.15, 134.03, e= δ 133.73, 133.61, 132.79, f= δ 130.29, 130.19, 129.76, 129.64, g= δ 126.94, 126.64, 126.45,
h= δ 124.89, i= δ 120.73].
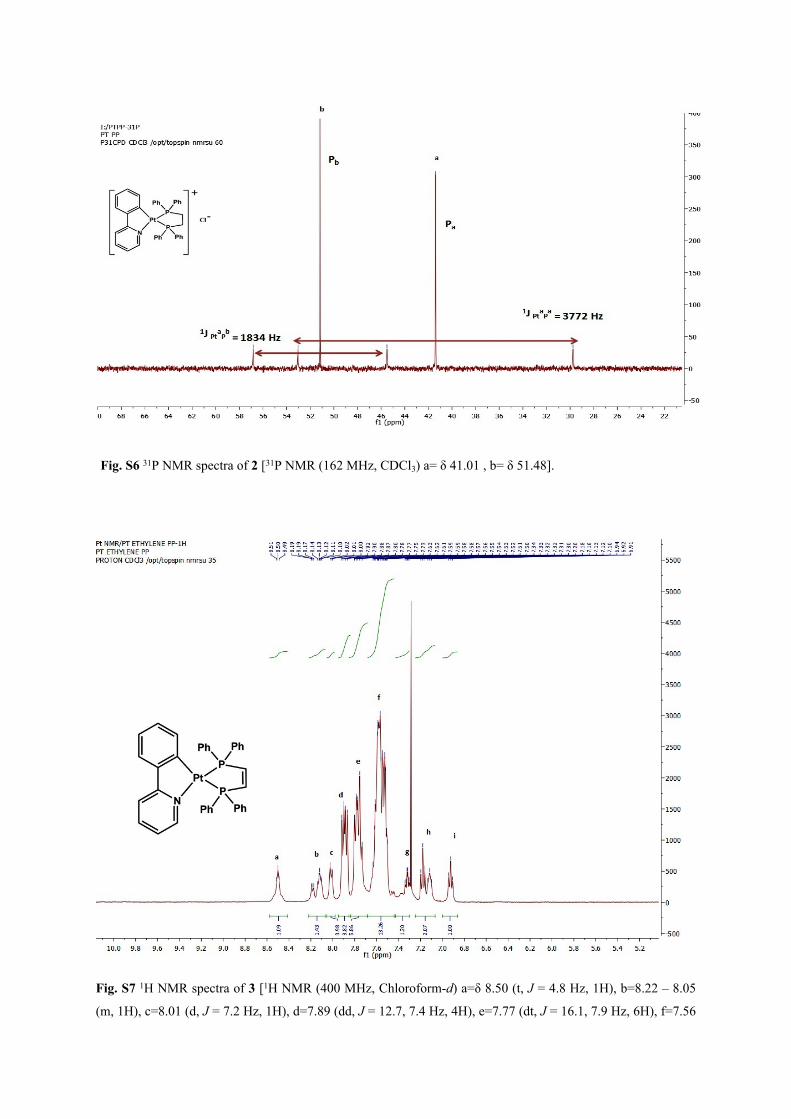
Fig. S6 31P NMR spectra of 2 [31P NMR (162 MHz, CDCl3) a= δ 41.01 , b= δ 51.48].
Fig. S7 1H NMR spectra of 3 [1H NMR (400 MHz, Chloroform-d) a=δ 8.50 (t, J = 4.8 Hz, 1H), b=8.22 – 8.05
(m, 1H), c=8.01 (d, J = 7.2 Hz, 1H), d=7.89 (dd, J = 12.7, 7.4 Hz, 4H), e=7.77 (dt, J = 16.1, 7.9 Hz, 6H), f=7.56
(ddt, J = 17.5, 9.7, 7.1 Hz, 13H), g=7.32 (td, J = 7.2, 3.0 Hz, 1H), h=7.15 (dt, J = 24.1, 7.0 Hz, 2H), i=6.92 (t, J
= 7.3 Hz, 1H)].
a

b
c
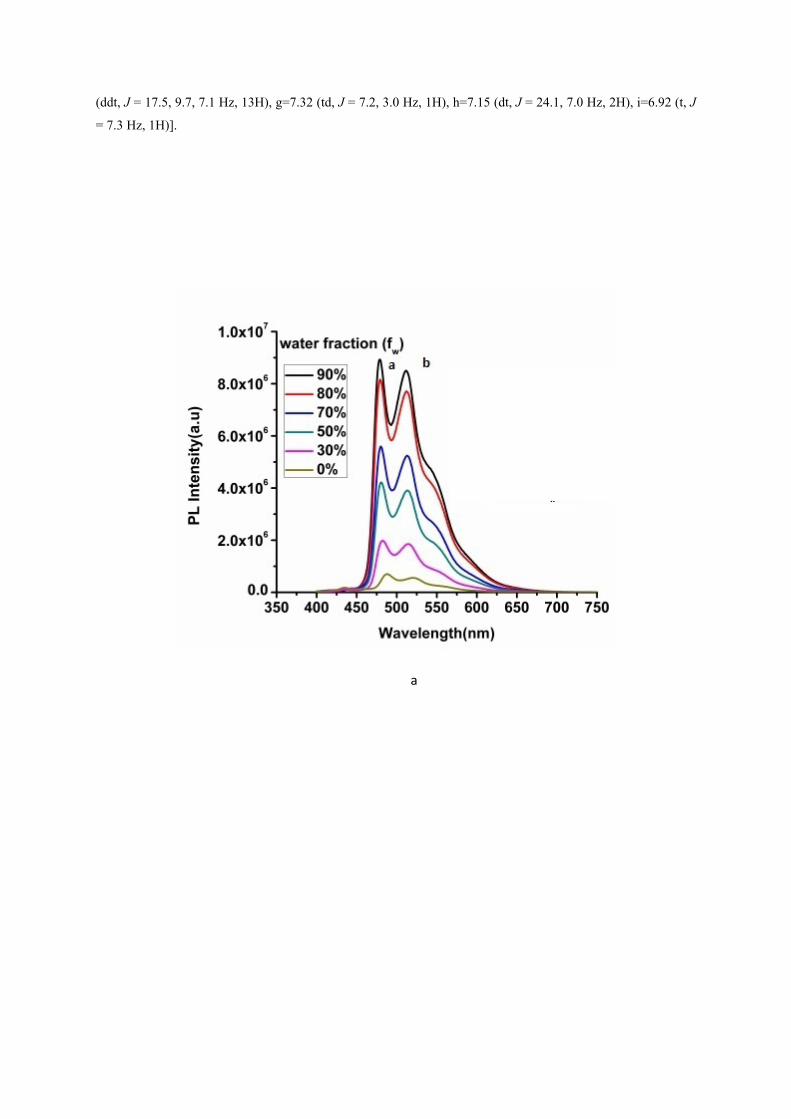
Fig S8. (a, b and c) PL spectra of 1 in THF/water mixed solvents with different fw with excitation at 385 nm, (Insets depict the changes of PL peak intensity with different fh )(max a=487 and b=521 nm); the error bar representation of PL intensity and Luminescent images of 1 (radiated with an ultraviolet light at 365 nm) in water−THF mixed solvents with the concentration kept at 2 × 10⁻⁵ M.
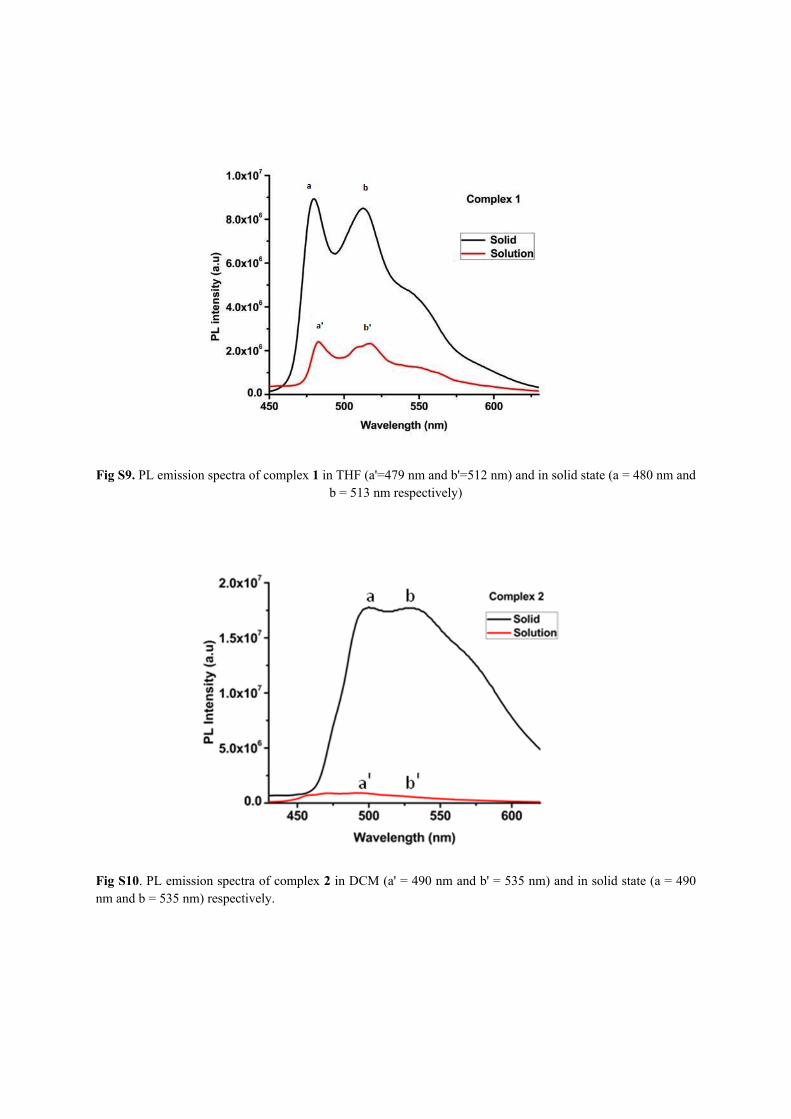
Fig S9. PL emission spectra of complex 1 in THF (a'=479 nm and b'=512 nm) and in solid state (a = 480 nm and b = 513 nm respectively)
Fig S10. PL emission spectra of complex 2 in DCM (a' = 490 nm and b' = 535 nm) and in solid state (a = 490 nm and b = 535 nm) respectively.

Fig S11. PL emission spectra of complex 3 in DCM (a' = 490 nm and b' = 517 nm) and in solid state (a = 490 nm and b = 517 nm) respectively.
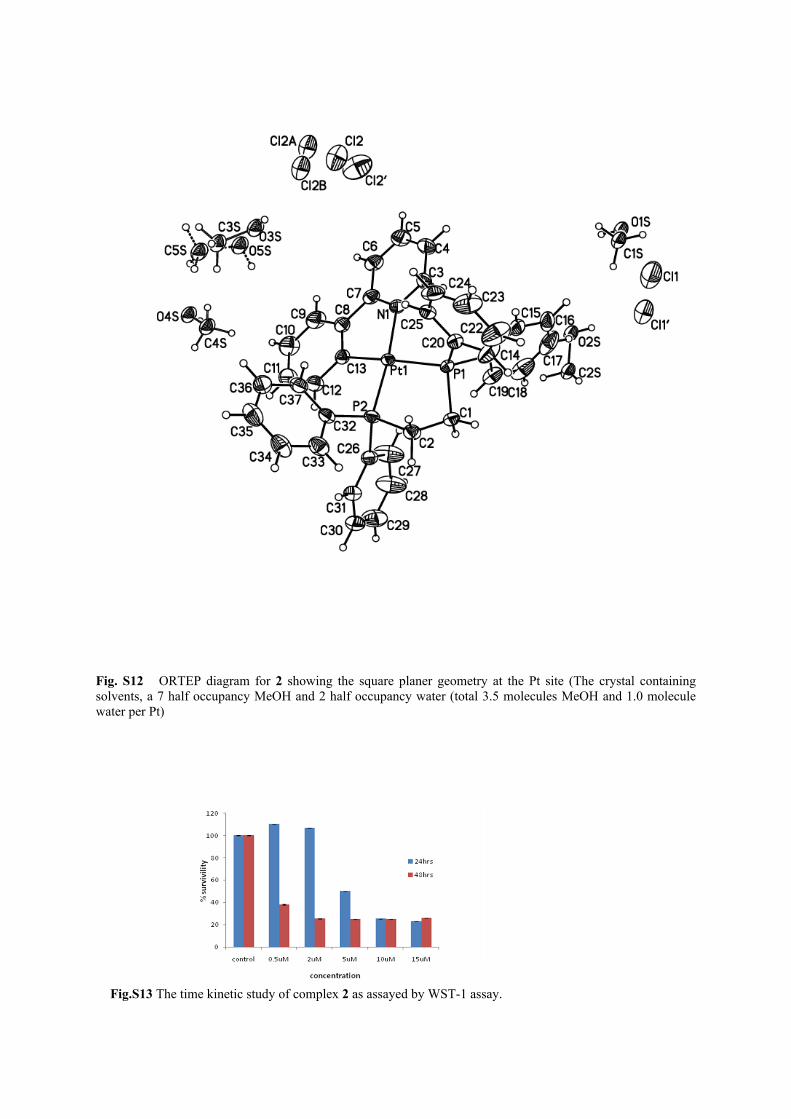
Fig. S12 ORTEP diagram for 2 showing the square planer geometry at the Pt site (The crystal containing solvents, a 7 half occupancy MeOH and 2 half occupancy water (total 3.5 molecules MeOH and 1.0 molecule water per Pt)
Fig.S13 The time kinetic study of complex 2 as assayed by WST-1 assay.
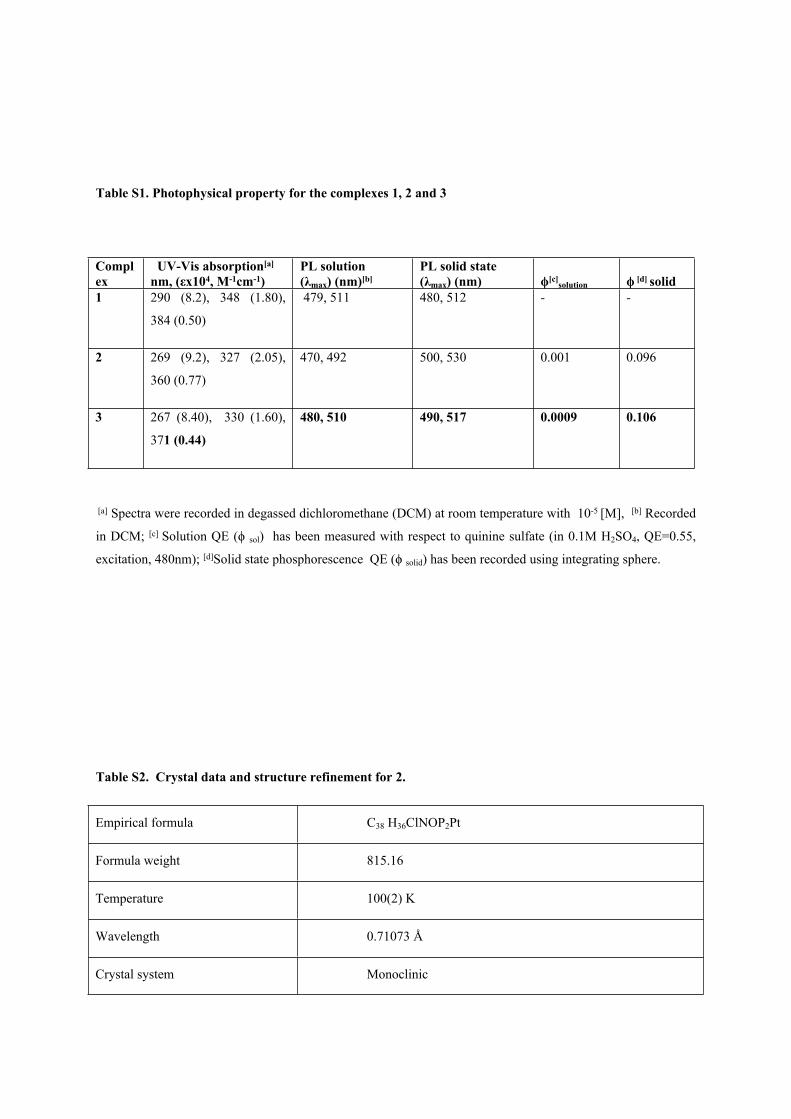
Table S1. Photophysical property for the complexes 1, 2 and 3
Complex
UV-Vis absorption[a]
nm, (εx104, M-1cm-1)PL solution(λmax) (nm)[b]
PL solid state(λmax) (nm) ϕ[c]
solution ϕ [d] solid1 290 (8.2), 348 (1.80),
384 (0.50)
479, 511 480, 512 - -
2 269 (9.2), 327 (2.05),
360 (0.77)
470, 492 500, 530 0.001 0.096
3 267 (8.40), 330 (1.60),
371 (0.44)
480, 510 490, 517 0.0009 0.106
[a] Spectra were recorded in degassed dichloromethane (DCM) at room temperature with 10-5 [M], [b] Recorded
in DCM; [c] Solution QE (ϕ sol) has been measured with respect to quinine sulfate (in 0.1M H2SO4, QE=0.55,
excitation, 480nm); [d]Solid state phosphorescence QE (ϕ solid) has been recorded using integrating sphere.
Table S2. Crystal data and structure refinement for 2.
Empirical formula C38 H36ClNOP2Pt
Formula weight 815.16
Temperature 100(2) K
Wavelength 0.71073 Å
Crystal system Monoclinic
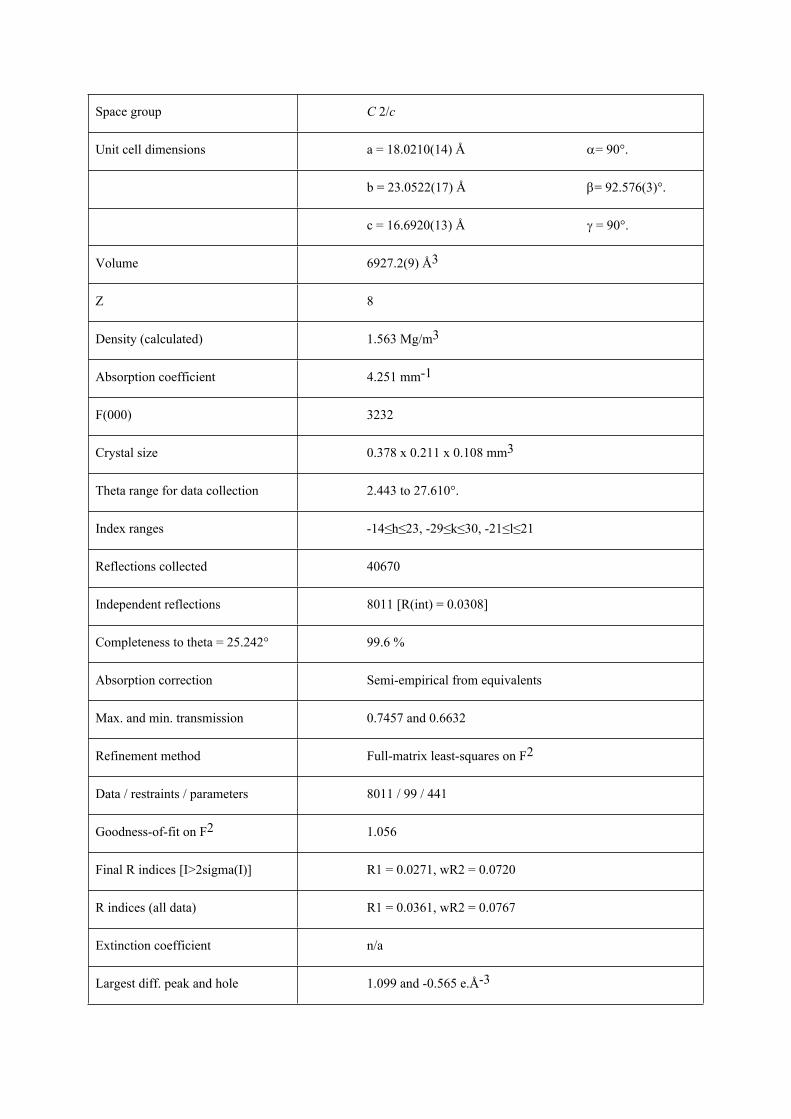
Space group C 2/c
Unit cell dimensions a = 18.0210(14) Å = 90°.
b = 23.0522(17) Å = 92.576(3)°.
c = 16.6920(13) Å = 90°.
Volume 6927.2(9) Å3
Z 8
Density (calculated) 1.563 Mg/m3
Absorption coefficient 4.251 mm-1
F(000) 3232
Crystal size 0.378 x 0.211 x 0.108 mm3
Theta range for data collection 2.443 to 27.610°.
Index ranges -14≤h≤23, -29≤k≤30, -21≤l≤21
Reflections collected 40670
Independent reflections 8011 [R(int) = 0.0308]
Completeness to theta = 25.242° 99.6 %
Absorption correction Semi-empirical from equivalents
Max. and min. transmission 0.7457 and 0.6632
Refinement method Full-matrix least-squares on F2
Data / restraints / parameters 8011 / 99 / 441
Goodness-of-fit on F2 1.056
Final R indices [I>2sigma(I)] R1 = 0.0271, wR2 = 0.0720
R indices (all data) R1 = 0.0361, wR2 = 0.0767
Extinction coefficient n/a
Largest diff. peak and hole 1.099 and -0.565 e.Å-3
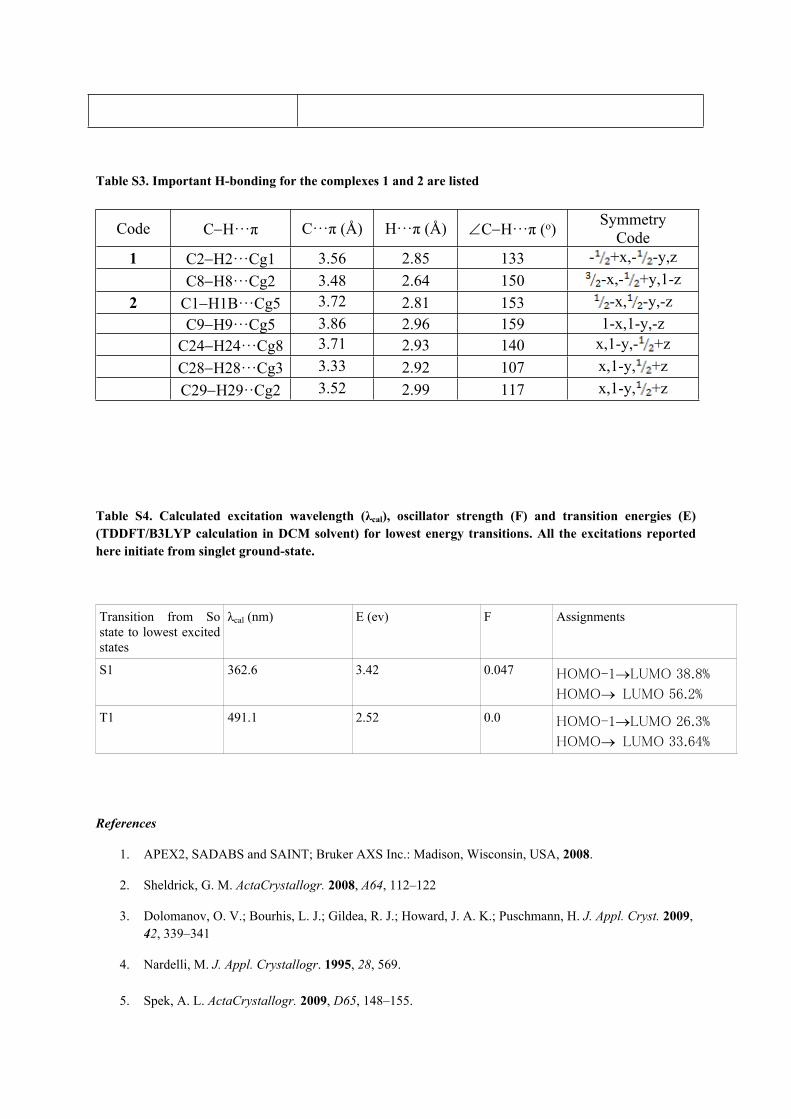
Table S3. Important H-bonding for the complexes 1 and 2 are listed
Code CH···π C···π (Å) H···π (Å) CH···π (o) SymmetryCode
1 C2H2···Cg1 3.56 2.85 133 - +x,- -y,zC8H8···Cg2 3.48 2.64 150 -x,- +y,1-z
2 C1H1B···Cg5 3.72 2.81 153 -x, -y,-zC9H9···Cg5 3.86 2.96 159 1-x,1-y,-z
C24H24···Cg8 3.71 2.93 140 x,1-y,- +zC28H28···Cg3 3.33 2.92 107 x,1-y, +zC29H29··Cg2 3.52 2.99 117 x,1-y, +z
Table S4. Calculated excitation wavelength (λcal), oscillator strength (F) and transition energies (E) (TDDFT/B3LYP calculation in DCM solvent) for lowest energy transitions. All the excitations reported here initiate from singlet ground-state.
Transition from So state to lowest excited states
λcal (nm) E (ev) F Assignments
S1 362.6 3.42 0.047 HOMO-1LUMO 38.8%
HOMOLUMO 56.2%
T1 491.1 2.52 0.0 HOMO-1LUMO 26.3%
HOMOLUMO 33.64%
References
1. APEX2, SADABS and SAINT; Bruker AXS Inc.: Madison, Wisconsin, USA, 2008.
2. Sheldrick, G. M. ActaCrystallogr. 2008, A64, 112–122
3. Dolomanov, O. V.; Bourhis, L. J.; Gildea, R. J.; Howard, J. A. K.; Puschmann, H. J. Appl. Cryst. 2009, 42, 339–341
4. Nardelli, M. J. Appl. Crystallogr. 1995, 28, 569.
5. Spek, A. L. ActaCrystallogr. 2009, D65, 148–155.


![Soybean Yield Components and Seed Potassium … · analysis was published by Parvej et al. (2015). Briefly, two glypho - sate [N-(phosphonomethyl) glycine]-resistant soybean cultivars,](https://img.dokumen.tips/doc/110x75/5b89e7467f8b9a78618cd123/soybean-yield-components-and-seed-potassium-analysis-was-published-by-parvej.jpg)