Embed Size (px)
Citation preview

Supporting Information:
Supramolecular Polymer Networks Based on
Cucurbit[8]uril Host-Guest Interactions as
Aqueous Photo-Rheological Fluids
Cindy S. Y. Tan,†,‡ Jesus del Barrio,∗,†,¶ Ji Liu,† and Oren A. Scherman∗,†
Melville Laboratory for Polymer Synthesis, Department of Chemistry, University of
Cambridge, Lensfield Road, Cambridge CB2 1EW, U.K., and Faculty of Applied Sciences,
Universiti Teknologi MARA, Kampus Kota Samarahan, Jalan Meranek, 94300 Kota
Samarahan, Sarawak, Malaysia.
E-mail: [email protected]; [email protected]
Phone: +44 (0)1223 334370. Fax: +44 (0)1223 334866
S.I. Instrumentation
Instrumentation
1H NMR (500 MHz) spectra was recorded using a Bruker Avance BB 500. Chemical shifts
were recorded in ppm (δ) in D2O with the internal reference set to δ 4.79 ppm. ATR FT-IR
∗To whom correspondence should be addressed†Melville Laboratory for Polymer Synthesis, Department of Chemistry, University of Cambridge, Lensfield
Road, Cambridge CB2 1EW, U.K.‡Faculty of Applied Sciences, Universiti Teknologi MARA, Kampus Kota Samarahan, Jalan Meranek,
94300 Kota Samarahan, Sarawak, Malaysia.¶Gould Research Center, Schlumberger, High Cross, Madingley Road, Cambridge CB3 0EL, U.K.
1
Electronic Supplementary Material (ESI) for Polymer Chemistry.This journal is © The Royal Society of Chemistry 2015

spectroscopy was conducted using a Perkin-Elmer Spectrum 100 series FT-IR spectrometer
equipped with a universal ATR sampling accessory.
Rheological characterisation was performed using a Discovery Hybrid Rheometer (DHR)-2
from TA Instruments fitted with a Peltier Plate as the temperature control system. All mea-
surements were performed using a 20- and 40-mm parallel plate geometry with a gap of 500
nm and results were analysed using TA Instruments’ TRIOS software. Dynamic oscillatory
strain amplitude sweep measurements were conducted at a frequency of 10 rad/s. Dynamic
oscillatory frequency sweep measurements were conducted at a 1% strain amplitude, between
0.01 to 100 rad/s, while flow sweep tests were done between 0.01 and 100 s−1. Real-time
photorheological measurements were done on DHR-2 Rheometer with a UV accessory that
uses a light guide and reflecting mirror assembly to transfer UV radiation from a high-
pressure mercury light source. The UV Light Guide accessory is configured using a lower
Smart Swap assembly with light source mount, collimator, and 5 mm light guide. A UV
light source (Exfo Omnicure S2000), with wavelengths in the range of 320 to 500 nm, and
triggering cable are attached.
ITC titration experiments were carried out on a VP-ITC from Microcal Inc. at 25 ◦C
in 10 mM sodium phosphate buffer (pH 7). In a typical experiment, the host was in the
sample cell at a concentration of 0.05 - 0.1 mM, and the guest was in the syringe at a
10 - 20 fold higher concentration. In the case of functional polymers, the concentration used
is determined from the concentration of functional monomer units in solution and not the
concentration of polymer. A titration consisted of 20 consecutive injections of 2-10 µL with
at least 60 s intervals between injections. The first data point was removed from the data set
prior to curve fitting. Heats of dilution were checked by titration well beyond saturation or
by titration of the guest into a buffer solution and subtracted from the normalised enthalpies,
but relatively small in all cases. The data were analysed with Origin 7.0 software, using the
one set of sites model.
Gel permeation chromatography (GPC) was carried out in water (H2O) on a Shodex
2

glucose column with a Shimadzu SPD-M20A prominence diode array detector, Optilab
refractive index detector and dynamic light scattering detector (both Wyatt). Before injection,
samples were filtered through 0.2 µm PVDF filters before injection using a 0.5 mL/min flow
rate.
UV-Vis spectra were recorded on a Varian Cary 4000 UV-Vis spectrophotometer in
aqueous solutions with 1 nm resolution at 25 ◦C. Photoirradiation was carried out using
a LZC-ORG photoreactor from Luzchem Research Inc. equipped with both UV and white
T5 type lamps centered at ∼ 360 nm and ∼ 420 nm, respectively. Visible light was obtained
with white T5 type lamps combined with a sharp-cut filter (< 420 nm).
Diffraction data for CB[8]·Z-3 was collected using a standard method1 on beamline I19.
Beamline I19 is situated on an undulator insertion device with a combination of double
crystal monochromator, vertical and horizontal focussing mirrors and a series of beam slits
(primary white beam and either side of the focussing mirrors). The experimental hutch
(EH1) was equipped with a Crystal Logic 4-circle kappa geometry goniometer with a Rigaku
Saturn 724 CCD detector and an Oxford Cryosystems Cryostream plus cryostat (80 - 500 K).
For conventional service crystallography, the beamline was operated at a typical energy of
18 keV (Zr K absorption edge) and a Rigaku ACTOR robotic sample changing system was
available. Software package CrystalClear-SM Expert 2.0 r5 (Rigaku, 2010) was used for
the initial cell determination and data collection, with CrysAlisPro, Agilent Technologies,
Version 1.171.37.35 (release 13-08-2014 CrysAlis171 .NET) (compiled Aug 13 2014,18:06:01)
used for the integration, scaling and absorption correction. The structure was solved us-
ing SUPERFLIP2 and was refined against F2 using full matrix least squares refinement in
SHELXL-2014.3 ORTEP3 for Windows was used for the production of the crystal graphics
in Figure S16.
3

S.II. Experimental
Synthesis of Cucurbit[8]uril, CB[8].
Cucurbit[8]uril, CB[8] was prepared according to previously reported procedures.4
Synthesis of PSTMV, P4.
PSTMV was prepared according to previously reported procedures.5
Synthesis of HEC-Np, P5.
HEC 1.3MDa (1.00 g) was dissolved in N-methylpyrrolidone (NMP, 120 mL) at 110 ◦C
overnight. The solution was cooled to room temperature and Np-NCO (29.7 mg, 0.18
mmol) and dibutyltin dilaurate (TDL, 3 drops) were added and the mixture stirred at room
temperature overnight. The crude product was then purified by precipitation from acetone,
filtered, and dried overnight under vaccum at 60 ◦C (1.01 g, 98%). 1H NMR Spectroscopy
(D2O, 500 MHz) δ (ppm) = 7.99 - 7.29 (7H, br, Np-H), 4.50 - 2.90 (307H, br, cellulose
backbone). Elemental analysis: Found C, 46.76; H, 6.95; N, 0.21. C215H367O151N1 required
C, 47.98; H, 6.83; N, 0.26. FT-IR (ATR) = 3410 (br), 2950 (br), 2910 (br), 1395, 1075 (s)
cm−1. GPC (H2O): Mn (PDI) = 664 KDa (1.14).
Synthesis of 2-Np-PEG-OMe-Np (PEG-Np, 2).
Poly(ethylene glycol) monomethyl ether (5000 g/mol) was dried by azeotropic distillation in
toluene. A solution of poly(ethylene glycol) monomethyl ether (1.0 g, 0.2 mmol) in anhydrous
DCM (30mL) was added with 2-naphthol isocyanate (101.5 mg, 0.6 mmol). Dibutyltin di-
laurate (TDL, 2 drops) was added and the mixture was stirred for 24 h at room temperature.
The mixture was diluted with DCM (100 mL) and the slurry was sonicated for 5 min. The
remaining solid was filtered off and the solvent was removed under pressure to yield a yel-
lowish solid. The yellowish solid was redissolved in DCM (20 mL), filtered and precipitated
in cold diethyl ether (2x). Suction filtration yielded 2-Np-PEG-OMe (1.00 g, 97 %) as a
white solid. 1H NMR (400 MHz, CDCl3): δ (ppm)= 8.03 (s, 1H), 7.79 - 7.77 (m, 3H), 7.45
4
- 7.38 (m, 4H), 4.39 (t, 2H), 3.85 - 3.45 (m, PEG backbone), 3.39 (s, 3H). GPC (THF): Mn
= 5 KDa (1.1).
Synthesis of p-(phenylazo)benzyl) alcohol.
p-(phenylazo)benzyl) alcohol was prepared according to previously reported procedures.6
Synthesis of p-(phenylazo)benzyl) bromide.
p-(phenylazo)benzyl bromide was synthesised following a published procedure.7 To a stirring
solution of p-(phenylazo)benzyl alcohol (1.50 g, 7.10 mmol) in anhydrous THF (50 mL) kept
stirring at 0 ◦C, triphenylphosphine (2.78 g, 10.6 mmol) and N-bromosuccinimide (1.89 g,
10.6 mmol) were added in small portions alternately. The reaction mixture was stirred at
room temperature overnight. Insoluble material was filtered through a pad of silica and
washed with copious amount of THF. The filtrate was evaporated under vacuum and the
residue was purified by column chromatography (eluent: hexane/ethyl acetate 8/2 vol.) to
afford a pure orange solid (1.31 g, 67 %). 1H NMR (CDCl3, 400 MHz) δ (ppm) = 4.56 (s,
2H); 7.48 - 7.56 (m, 5H); 7.88 - 7.94 (m, 4H).
Synthesis of 1-[p-[(phenylazo)benzyl)]imidazolium bromide, E-3.
p-[(phenylazo)benzyl)] imidazolium bromide was synthesised following a published proce-
dure.7 A mixture of p-(phenylazo)benzyl) bromide (0.50 g, 1.82 mmol) and 1-methylimidazole
(0.18 g, 2.18 mmol) in toluene (3 mL) was stirred at room temperature for 10 h. The reaction
mixture was centrifuged, washed with toluene (2 x 20 mL) and dried in vacuo to yield a pure
orange solid (0.47 g, 72 %). 1H NMR (CDCl3, 400 MHz) δ (ppm) = 10.94 (s, 1H); 7.95 (m,
4H, 7.65 (d, 2H); 7.52 (m, 3H); 7.20 (s, 2H), 5.72 (s, 2H); 4.10 (s, 3H).
5

S.III. General preparation of supramolecular polymer
networks.
Naphthyl-functionalised hydroxyethyl cellulose (P5, 5 mg) was dissolved in water (0.5 mL)
with mild heating and vortexing. A solution of PSTMV (P4) (1.5 mg) and CB[8] (1 mg)
was heated gently to dissolve in water (0.5 mL) separately. Both solutions were then mixed,
heated and shaken to obtain pinkish, transparent hydrogels. The hydrogels resulted from the
formation of ternary complex CB[8]·P4·P5 with molar ratio of 1:1:1 and they were pinkish
in color due to the charge transfer between the electron-deficient and electron-rich guests in
the CB[8].
6

S.IV. Supporting Results.
E-3
6.66.87.07.27.6 7.47.88.08.28.48.68.89.09.29.49.69.810.0
(a)
Z-3
+
E-3
(b)
CB[8]•1•E-3
(e)
CB[8]•E-3
(c)
(d)
CB[8]•Z-3
+
E-3
(f)
CB[8]•Z-3
+
1
+
E-3
ppm
Figure S1: Partial 1H NMR spectra (500 MHz, D2O, 298 K) of E-3 alone before (a); afterUV irradiation (b); CB[8]·E-3 before (c); after UV irradiation (d); CB[8]·1·E-3 before (e)and after UV irradiation (f). Labels of small molecules used in NMR titration: protons ofuncomplexed 1 (filled blue square), complexed 1 (open blue square), uncomplexed E-3 (filledpink circle), uncomplexed Z-3 (open pink circle), complexed E-3 (filled orange circle) andcomplexed Z-3 (open orange circle) are highlighted. Predominant species are highlighted inbold.
7

10.0 9.5 9.0 8.5 8.0 7.5 7.0 6.5 ppm
2
(a)
1
(b)
CB[8]•1
(c)
CB[8]•1•2
(d)
+ +
CB[8]•1•E-3 2E-3CB[8]•1•2
(e)
+ + +
CB[8]•1•2 Z-32 1
(f)
CB[8]•Z-3 E-3
+
E-3
+
Figure S2: Partial 1H NMR spectra (500 MHz, D2O, 298 K) of 2 only (a); 1 only (b);CB[8]·1 (c); CB[8]·1·2 (d); mixture of CB[8]·1·2 and CB[8]·1·E-3 complexes at equilibriumbefore (e) and after UV irradiation (f). Labels of small molecules used in NMR titration:protons of uncomplexed 1 (filled blue square), complexed 1 (open blue square), uncomplexed2 (filled red triangle), complexed 2 (open red triangle), uncomplexed E-3 (filled pink circle),uncomplexed Z-3 (open pink circle), complexed E-3 (filled orange circle) and complexed Z-3(open orange circle) are highlighted. Predominant species are highlighted in bold.
8
250 300 350 400 450
Wavelength (nm)
Ab
so
rba
nce
(A
bs)
0
0.5
1.5
1.0
2.5
2.0 CB[8]·1
CB[8]·1·2
2
250 300 350 400 450
Wavelength (nm)
250 300 350 400 450
Wavelength (nm)
CB[8]·1·2
CB[8]·1·E-3
CB[8]·Z-3 + 1
CB[8]·1·2 + CB[8]·1·E-3
CB[8]·Z-3 + 1 + 2
E-3
Z-3
CB[8]·1·E-3
CB[8]·Z-3 + 1
Ab
so
rba
nce
(A
bs)
0
0.4
1.0
0.8
1.4
1.2
0.6
0.2
Ab
so
rba
nce
(A
bs)
0
0.5
1.5
1.0
2.5
2.0
3.0
(a)
(b)
(c)
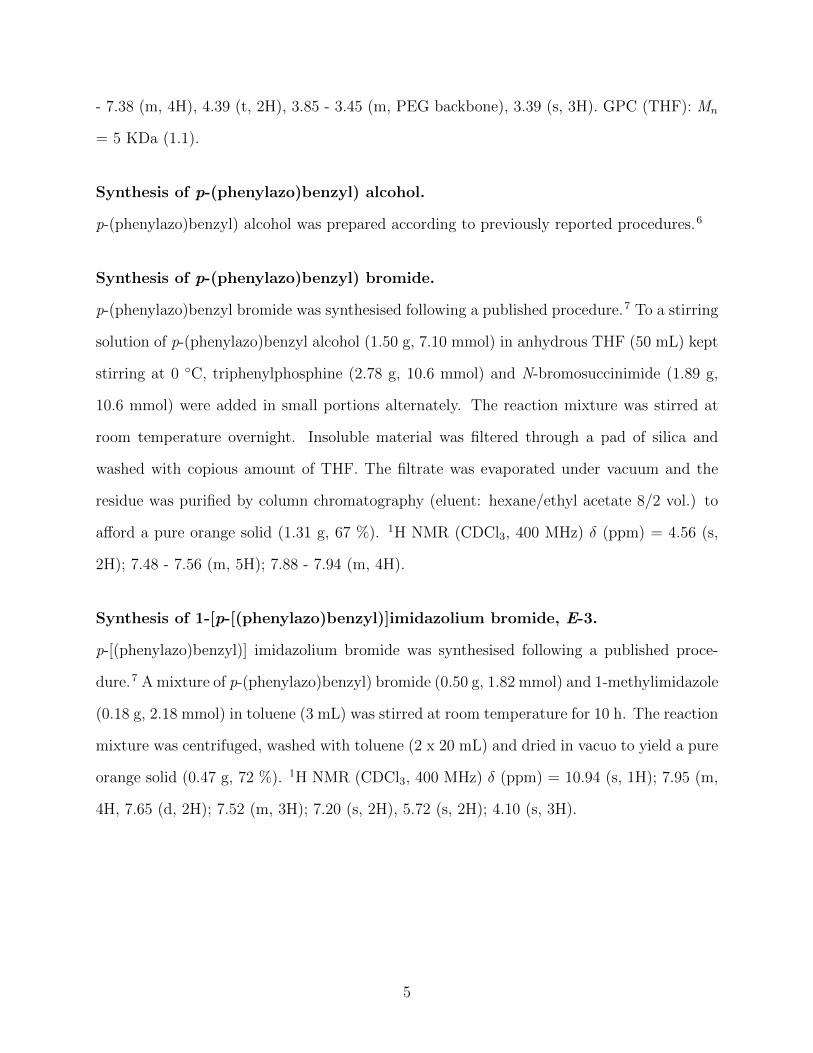
Figure S3: UV-Vis absorption spectra of CB[8]·1 binary complex, 2 and CB[8]·1·2 (a); E-3and CB[8]·1·E-3 ternary complex before and after UV irradiation (b) and CB[8]·1·2 ternarycomplex in the presence of E-3 before and after UV irradiation (c) in solution (0.05 mM,H2O, 298 K).
9

Δ
Δ
Figure S4: 1 mM PEG-Np was titrated into 0.1 mM CB[8]·1 solution in PBS buffer, pH 7,298K.
10

Δ
Δ
Figure S5: 1 mM E-3 was titrated into 0.1 mM CB[8]·1 solution in PBS buffer, pH 7, 298K.
11

Δ
Δ
Figure S6: 1 mM Z-3 was titrated into 0.05 mM CB[8] solution in PBS buffer, pH 7, 298K.
Since photoisomerisation of trans-azobenzene to its cis conformation is known to be incom-
plete, this binding constant of Z-3 into CB[8] was reported for Z-3 solution at an E :Z ratio
of 20:80.
12

G’, G
’’ (P
a)
102
101
(a)
Strain (%)
10010-1 101 102
G’ before UV
G’’ before UV
G’ after UV
G’’ after UV
10-1
(b)
Frequency, ω (rad/s)
10010-1 101 102
G’ before UV
G’’ before UV
G’ after UV
G’’ after UV
Before UV
After UV
Vis
co
sity (
Pa
.s)
103
102
101
100
(c)
Shear rate (1/s)
10010-1 101 102
100
G’, G
’’ (P
a)
102
101
100
Figure S7: Storage (G’ ) and loss (G”) moduli from strain-amplitude sweep at 10 rad/s (a),frequency sweep at 1% strain (b) and steady-shear rheology (c) of 0.75 wt.% HEC controlsamples before and after UV irradiation (360 nm, 4.8 mW/cm2, 5 min, 20 ◦C). Note: Smallchanges in the zero-shear viscosity in the fluids after the UV irradiation might be attributedto the rearrangement of polymer chain in the mixture.
13
G’, G
’’ (P
a)
102
101
100
Strain (%)
10010-1 101 102
G’ before UV
G’’ before UV
G’’ after UV
G’ after UV
Gel
Sol
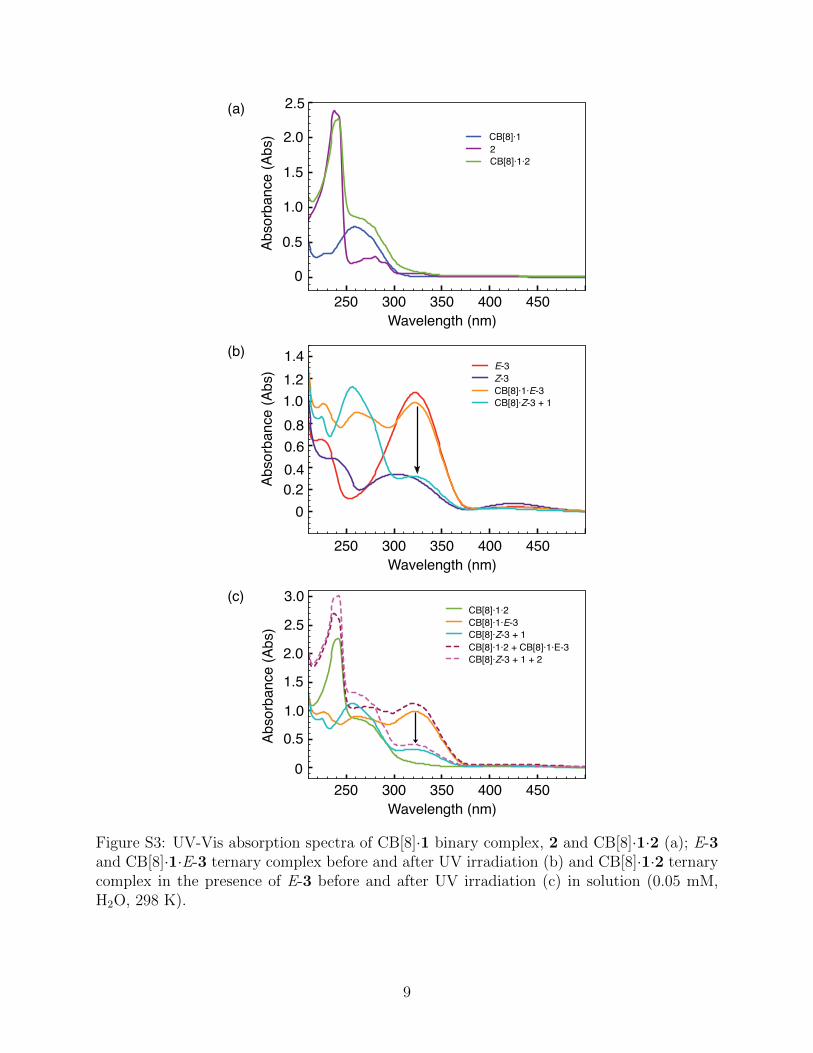
Figure S8: Strain-amplitude sweep performed at 10 rad/s for 0.75 wt.% HEC samplescontaining 0.5 mol eq E-3 before and after UV irradiation (360 nm, 4.8 mW/cm2, 5 min,20 ◦C).
14
Strain (%)
10010-1 101 102
G’, G
’’ (P
a)
102
101
100G
’, G
’’ (P
a)
102
101
100
10-1
Frequency, ω (rad/s)
10010-1 101 102
Shear rate (1/s)
10010-1 101 102
Vis
co
sity (
Pa
.s)
10-1
102
101
100
0.5 eq E-3
0.5 eq E-AzoTEG
G’ 0.5 eq E-3
G’’ 0.5 eq E-3
G’ 0.5 eq E-AzoTEG
G’’ 0.5 eq E-AzoTEG
G’ 0.5 eq E-3
G’’ 0.5 eq E-3
G’ 0.5 eq E-AzoTEG
G’’ 0.5 eq E-AzoTEG
(a)
(b)
(c)
NN
OO
OO
OH
E-AzoTEG
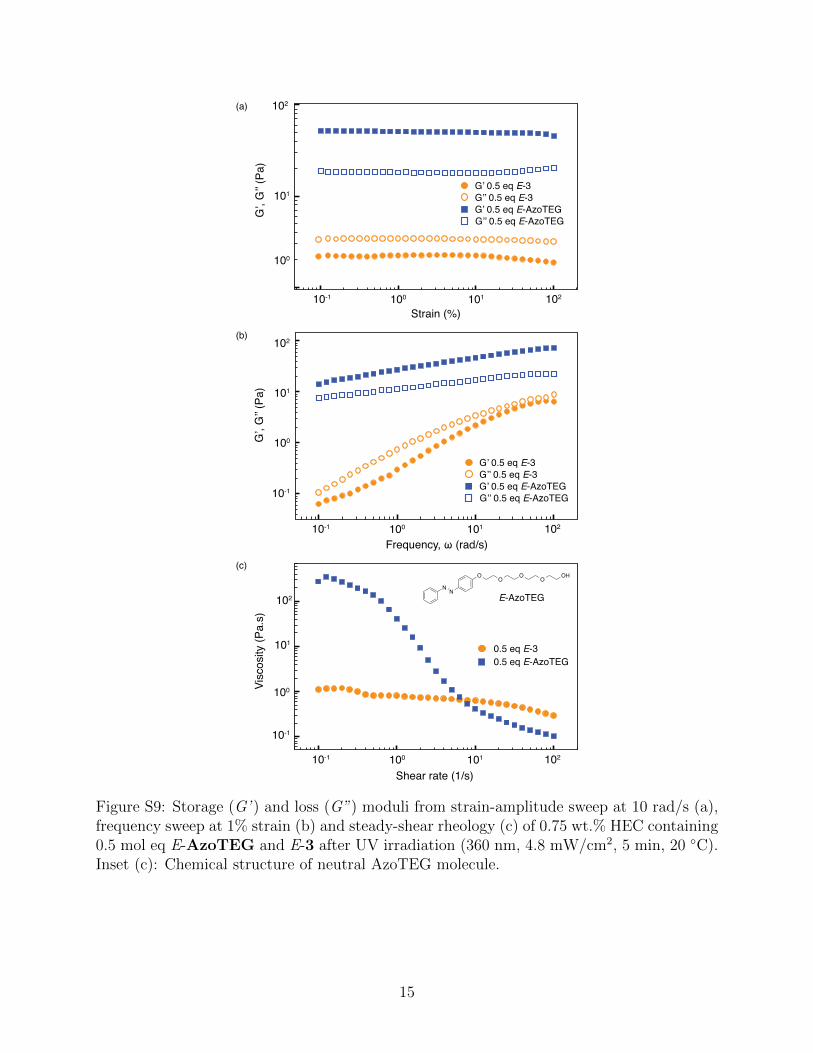
Figure S9: Storage (G’ ) and loss (G”) moduli from strain-amplitude sweep at 10 rad/s (a),frequency sweep at 1% strain (b) and steady-shear rheology (c) of 0.75 wt.% HEC containing0.5 mol eq E-AzoTEG and E-3 after UV irradiation (360 nm, 4.8 mW/cm2, 5 min, 20 ◦C).Inset (c): Chemical structure of neutral AzoTEG molecule.
15
0 min
2 min
5 min
60 min
Shear rate (1/s)
10010-1 101 102V
isco
sity (
Pa
.s)
102
101
100
10-1
Vis
co
sity (
Pa
.s)
103
102
101
100
10-1
Shear rate (1/s)
10010-1 101 102
0 eq
0.25 eq
0.5 eq
1 eq
(a)
(b)
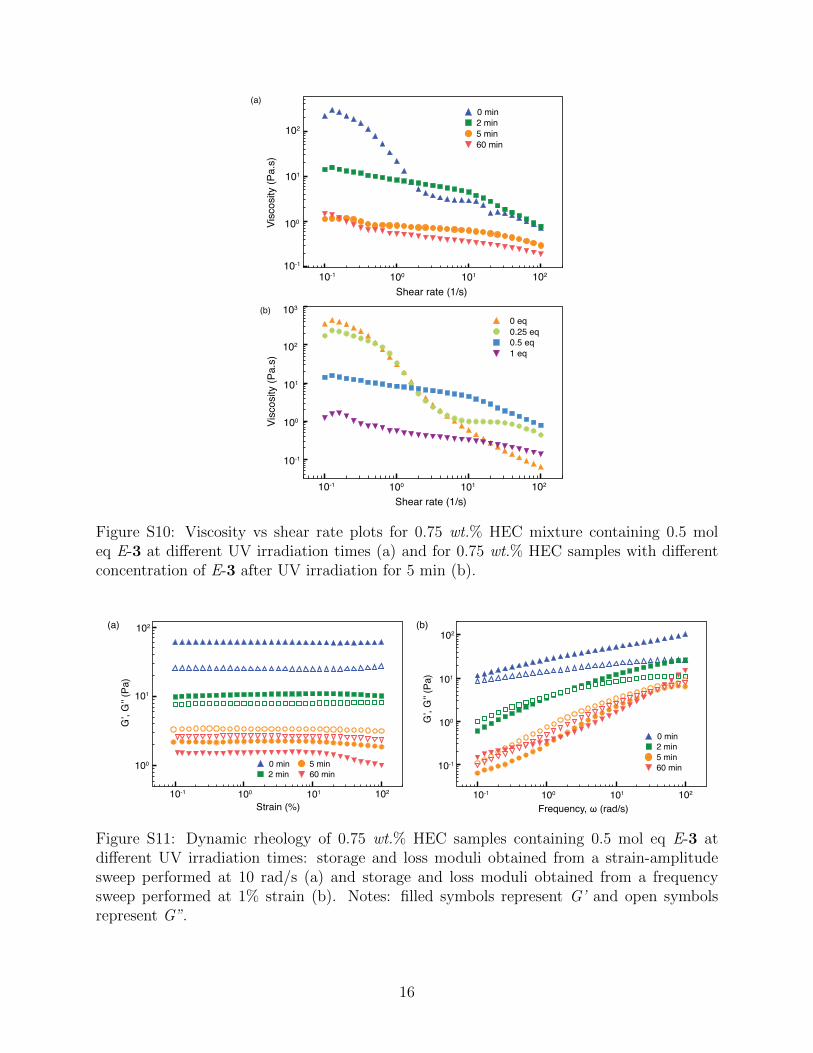
Figure S10: Viscosity vs shear rate plots for 0.75 wt.% HEC mixture containing 0.5 moleq E-3 at different UV irradiation times (a) and for 0.75 wt.% HEC samples with differentconcentration of E-3 after UV irradiation for 5 min (b).
G’, G
’’ (P
a)
102
101
100
Strain (%)
10010-1 101 102
Frequency, ω (rad/s)
10010-1 101 102
G’, G
’’ (P
a)
102
101
100
10-1
0 min
2 min
5 min
60 min0 min
2 min
5 min
60 min
(a) (b)
Figure S11: Dynamic rheology of 0.75 wt.% HEC samples containing 0.5 mol eq E-3 atdifferent UV irradiation times: storage and loss moduli obtained from a strain-amplitudesweep performed at 10 rad/s (a) and storage and loss moduli obtained from a frequencysweep performed at 1% strain (b). Notes: filled symbols represent G’ and open symbolsrepresent G”.
16

0 eq
0.25 eq
0.5 eq
1 eq
G’, G
’’ (P
a)
102
101
Frequency, ω (rad/s)
10010-1 101 102
0 eq
0.25 eq
0.5 eq
1 eq
G’, G
’’ (P
a)
102
101
100
10-1
Frequency, ω (rad/s)
10010-1 101 102
Strain (%)
10010-1 101 102
G’, G
’’ (P
a)
102
101
100
Strain (%)
10010-1 101 102
G’, G
’’ (P
a)
102
101
(a) Before UV irradiation (b) After UV irradiation
Figure S12: Storage and loss moduli from strain-amplitude sweep at 10 rad/s and frequencysweep at 1% strain of 0.75 wt.% HEC samples with different concentration of E-3 before (a)and after (b) UV irradiation for 5 min. Notes: filled symbols represent G’ and open symbolsrepresent G”.
Their flow properties were altered as a function of concentration and photoirradiation.
Figure S8a shows that the sample was very viscous and strongly thixotropic before UV
irradiation. After 5 min of irradiation at 360 nm, the zero-shear viscosity decreased one
order of magnitude and the degree of shear-thinning also gradually reduced. No further
changes in zero-shear viscosity occur with longer irradiation time (> 5 min) because all E-3
had been converted into Z-3 within 5 min and complexed with CB[8], by removing other
guests.
Steady-shear rheological data for four samples of HEC mixtures, each containing 0, 0.25,
0.5 and 1 mol eq E-3, respectively, were compared. All mixtures containing some E-3 shear-
thin under the shear rate tested. Significant reduction in their zero-shear viscosities (Figure
17
S8b) and G’ (Figure S9) was seen after UV irradiation. The viscosity of the sample with 0.25
eq E-3 was similar to that of the HEC mixture without E-3, however at higher shear rate, its
viscosity dropped drastically to 1 Pa·s. Further increase in the E-3 content decrease initial
viscosities of the samples by more than one order or magnitude with a slight dependence on
the shear rate (Figure S8b).
Increasing duration of photoirradiation also lowered G’ as a function of strain and fre-
quency, measured at ambient temperature . The crossover point of G’ and G” of the sample
shifted to higher frequencies after 5 min of UV irradiation. Prolonged exposure to UV
caused the breakdown of the entire network (G” > G’) throughout the frequency range mea-
sured (Figure S9).The length of UV irradiation is also dependent on the concentration of
E-3. Higher E-3 concentration added to the gel matrix requires longer irradiation time to
isomerise E-3 completely (Figure S10).
18

G’, G
’’ (P
a)
102
101
100
10-1
G’, G
’’ (P
a)
102
101
100
Time (s)
10 3020 40 50 60 100 120 240140 160 180 200 220
G’
G’’
*
* (Pa
.s)
102
101
100
OFF UV ON
(320 - 390 nm)
OFF VISIBLE LIGHT ON
(400 - 500 nm)
Ch
an
ge
filt
er
(a)
0.5 eq AzoTEG
(b)
Time (s)
10 3020 40 50 60 100 120 240140 160 180 200 220
* (Pa
.s)
102
101
100G’
G’’
* Control
OFF OFF
Ch
an
ge
filt
er
NN
OO
OO
OH
UV ON
(320 - 390 nm)
VISIBLE LIGHT ON
(400 - 500 nm)
Figure S13: Real-time cyclic photoswitching of 0.75 wt.% HEC samples with (a) and without(b) 0.5 mol eq of E-AzoTEG at 20 ◦C by alternate UV and visible light irradiations. TheG’, G” and complex viscosity, η∗ of both samples did not change during UV (320 - 390 nm,40 s) and visible light irradiations (400 - 500 nm, 1200 s). Note: No light irradiation takesplace during OFF state. UV-visible light irradiations are labelled as ON state at differentwavelengths. A change of filter between 320 - 390 nm and 400 - 500 nm filters took place inbetween the UV and visible light irradiations.
19

10 9 8 7 6 5 4 3 ppm11
E-3
Z-3
+
E-3
E-3
(a)
(b)
(c)
Figure S14: 1H NMR spectra (500 MHz, D2O) of E-3 before UV irradiation (a), after (b)UV irradiation and after heating at 343K, 24 h (c).
20
Strain (%)
10010-1 101 102
G’, G
’’ (P
a)
102
101
100
G’, G
’’ (P
a)
102
101
100
10-1
Frequency, ω (rad/s)
10010-1 101 102
Shear rate (1/s)
10010-1 101 102
Vis
co
sity (
Pa
.s)
102
101
100
+ UV
(i) (ii) (iii)
(a) (b)
(c) (d)
E-3
Z-3
E- / Z-3 (420 nm)
E- / Z-3 (heat)
E-3
Z-3
E- / Z-3 (420 nm)
E- / Z-3 (heat)
E-3
Z-3
E- / Z-3 (420 nm)
E- / Z-3 (heat)
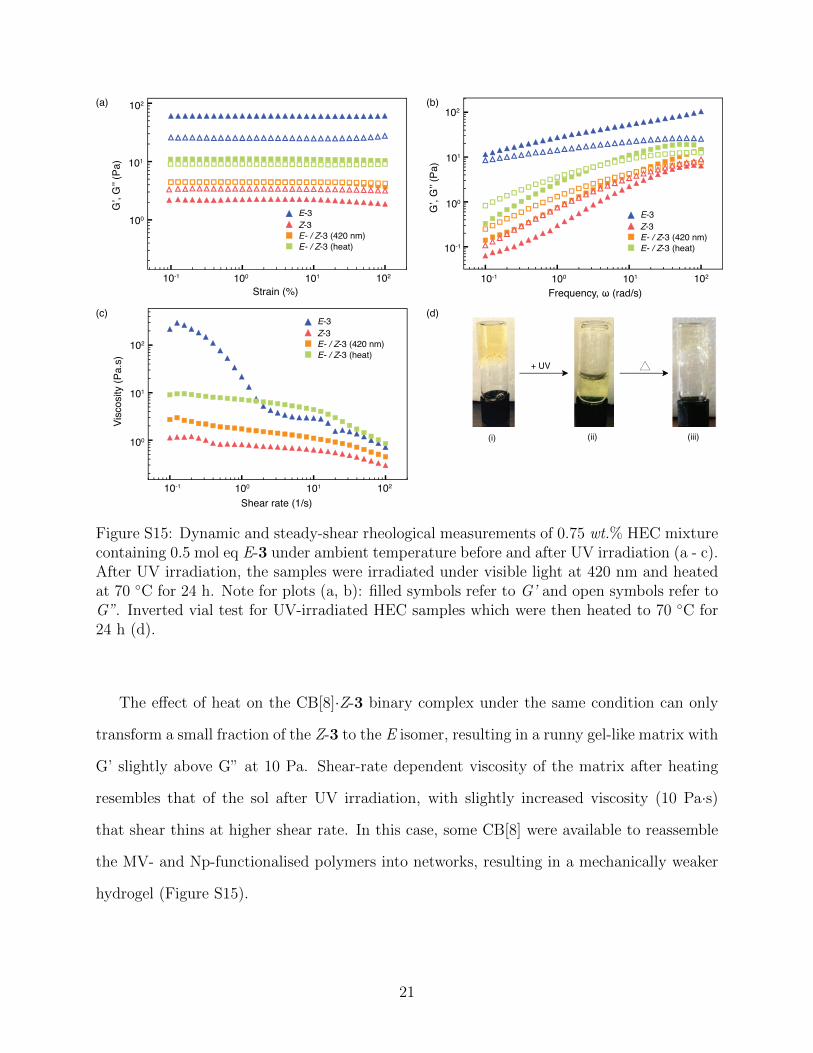
Figure S15: Dynamic and steady-shear rheological measurements of 0.75 wt.% HEC mixturecontaining 0.5 mol eq E-3 under ambient temperature before and after UV irradiation (a - c).After UV irradiation, the samples were irradiated under visible light at 420 nm and heatedat 70 ◦C for 24 h. Note for plots (a, b): filled symbols refer to G’ and open symbols refer toG”. Inverted vial test for UV-irradiated HEC samples which were then heated to 70 ◦C for24 h (d).
The effect of heat on the CB[8]·Z-3 binary complex under the same condition can only
transform a small fraction of the Z-3 to the E isomer, resulting in a runny gel-like matrix with
G’ slightly above G” at 10 Pa. Shear-rate dependent viscosity of the matrix after heating
resembles that of the sol after UV irradiation, with slightly increased viscosity (10 Pa·s)
that shear thins at higher shear rate. In this case, some CB[8] were available to reassemble
the MV- and Np-functionalised polymers into networks, resulting in a mechanically weaker
hydrogel (Figure S15).
21
Frequency, ω (rad/s)
10010-1 101 102
G’, G
’’ (P
a)
102
101
100
Vis
co
sity (
Pa
.s)
102
101
100
10-1
Shear rate (1/s)
10010-1 101 102
(a)
(c)
10-1
G’, G
’’ (P
a)
102
101
100
Strain (%)
10010-1 101 102
Z-3
Z-3 + CB[8]
(b)
(d)
CB[8]
sol gel
E-3
Z-3
Z-3 + CB[8]
E-3
Z-3
Z-3 + CB[8]
E-3
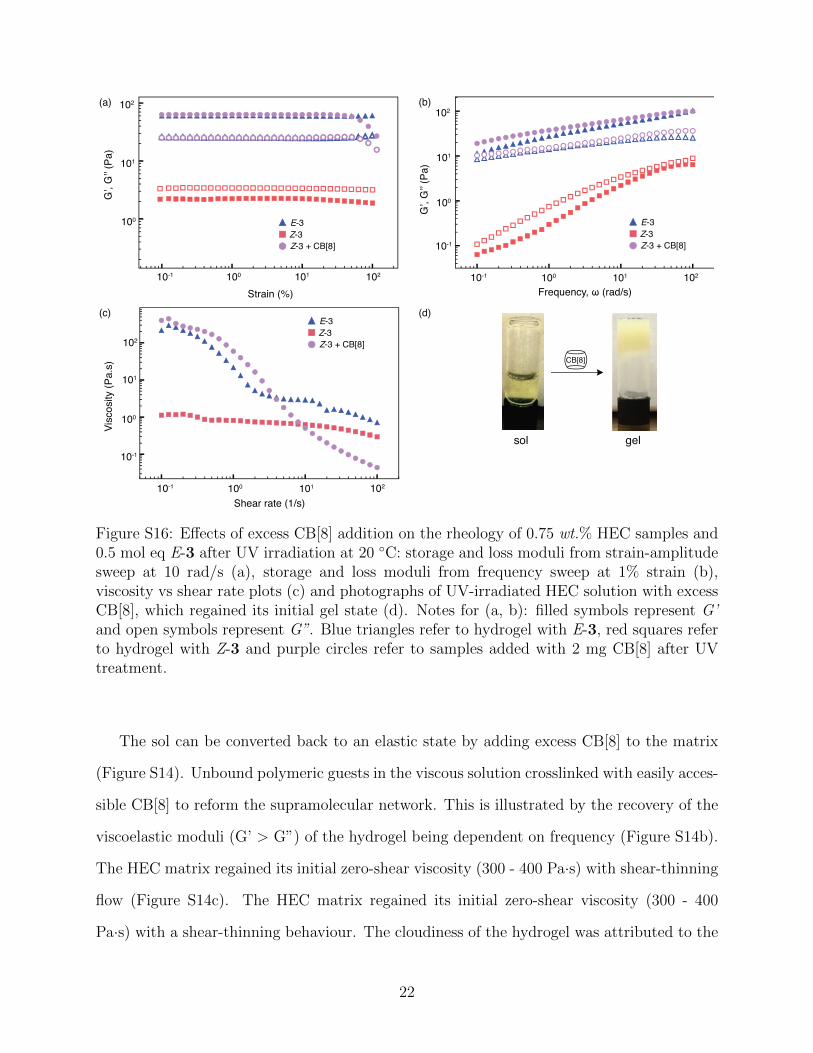
Figure S16: Effects of excess CB[8] addition on the rheology of 0.75 wt.% HEC samples and0.5 mol eq E-3 after UV irradiation at 20 ◦C: storage and loss moduli from strain-amplitudesweep at 10 rad/s (a), storage and loss moduli from frequency sweep at 1% strain (b),viscosity vs shear rate plots (c) and photographs of UV-irradiated HEC solution with excessCB[8], which regained its initial gel state (d). Notes for (a, b): filled symbols represent G’and open symbols represent G”. Blue triangles refer to hydrogel with E-3, red squares referto hydrogel with Z-3 and purple circles refer to samples added with 2 mg CB[8] after UVtreatment.
The sol can be converted back to an elastic state by adding excess CB[8] to the matrix
(Figure S14). Unbound polymeric guests in the viscous solution crosslinked with easily acces-
sible CB[8] to reform the supramolecular network. This is illustrated by the recovery of the
viscoelastic moduli (G’ > G”) of the hydrogel being dependent on frequency (Figure S14b).
The HEC matrix regained its initial zero-shear viscosity (300 - 400 Pa·s) with shear-thinning
flow (Figure S14c). The HEC matrix regained its initial zero-shear viscosity (300 - 400
Pa·s) with a shear-thinning behaviour. The cloudiness of the hydrogel was attributed to the
22
insoluble CB[8] present in excess (Figure S14d). With time, the presence of excess CB[8]
caused the soft material to undergo syneresis; a phenomenon caused by expulsion of water
from the gel, therefore altering the overall rheological properties of the thixotropic hydro-
gel. Phototriggered displacement of polymer bound guests led to the network disassembly
highlighted the significance of CB[8] in the ternary complex formation. The non-reversible
viscosity change by light irradiation at different wavelengths is also reported in the simple
micellar PR fluids and the reversibility of such systems can be achieved by altering their
mixture composition and pH.8,9
23

G’, G
’’ (P
a)
102
101
100
10-1
Time (s)
1000 200 300 400 500
G’, G
’’ (P
a)
102
101
100
10-1
Time (s)
1000 200 300 400 500
(a)
(b)
Figure S17: Step-strain time-sweep measurements displaying recovery of 0.75 wt.% HECsamples (a) with and (b) without 0.5 mol eq E-3 structure following successive high-magnitude deformation at 1000 % strain and low-magnitude recovery at 0.05 % strain.
24

G’, G
’’ (P
a)
102
101
10 20 30 40 50 60 70
Temperature
G’ heatingG’’ heatingG’ coolingG’’ cooling
Figure S18: Thermoreversibility of HEC supramolecular networks without E-3 when heatedand then cooled between 10 and 70 ◦C.
Oscillatory temperature sweep measurements were performed on the HEC samples with-
out E-3 chromophore between 10 and 70 ◦C at 1% strain and 10 rad/s (Figure S18). The
samples were heated to 70 ◦C and cooled down to 10 ◦C. The range of temperature was
selected to avoid evaporation of water from the samples on the parallel-plate geometry. In
the temperature sweep, viscoelastic components decreased with heat and gradually rose back
to their initial moduli without significant changes after the cooling process. This observation
indicates the thermoreversible stability of the rapid transient linkages in the supramolecular
hydrogels is reproducible at a given temperature.
X-ray Crystal Structure of CB[8]·Z-3.
The guest Z-3 is disordered over 2 positions inside the CB[8] cavity. As such various ge-
ometrical (SAME) and displacement (SIMU, RIGU, EADP) restraints have been employed.
25

There are large voids between the CB[8] guest molecules containing solvent water and the
chloride counter anions. However, they were too disordered to accurately determine their
location, thus the SMTBX solvent mask routine has been employed as implemented in Olex2.
Figure S19: ORTEP (ellipsoids at 50% occupancy) showing the CB[8]·Z-3 complex.
26

Acknowledgement
C.S.Y.T. thanks Ministry of Education of Malaysia and MARA University of Technology for
their financial supports. J. L. is financially supported by the Marie Curie FP7 SASSYPOL
ITN programme. J.d.B. is grateful for a Marie Curie Intra-European Fellowship (Project
273807). O.A.S thanks the ERC for their funding.
References
(1) Coles, S. J.; Gale, P. A. Chem. Sci. 2012, 3, 683–689.
(2) Palatinus, L.; Chapuis, G. J. Appl. Cryst. 2007, 40, 786–790.
27

(3) Sheldrick, G. Acta Cryst. 2008, A64, 112–122.
(4) Kim, J.; Jung, I. S.; Kim, S. Y.; Lee, E.; K., K. J.; Sakamoto, S.; Yamaguchi, K.;
Kim, K. New cucurbituril homologues: Synthesis, isolation, characterisation and X-ray
crystal structures of cucurbit[n]uril (n = 5, 7 and 8). J. Am. Chem. Soc. 2000, 122,
540–541.
(5) Appel, E. A.; Biedermann, F.; Rauwald, U.; Jones, S. T.; Zayed, J. M.; Scherman, O. A.
Supramolecular cross-linked networks via host-guest complexation with cucurbit[8]uril.
J. Am. Chem. Soc. 2010, 132, 14251–14260.
(6) Fatas, P.; Longo, E.; Rastrelli, F.; Crisma, M.; Toniolo, C.; Jimenez, A. I.; Cativiela, C.;
Moretto, A. Bis(azobenzene)-based photoswitchable, prochiral, C α- tetrasubstituted
α-amino acids for nanomaterials applications. Chem. Eur. J. 2011, 17, 12606–12611.
(7) Kaiser, M.; Leitner, S. P.; Hirtenlehner, C.; List, M.; Gerisch, A.; Monkowius, U.
Azobenzene-functionalized N-heterocyclic carbenes as photochromic ligands in silver(i)
and gold(i) complexes. Dalton Trans. 2013, 42, 14749–14756.
(8) Ketner, A. M.; Kumar, R.; Davies, T. S.; Elder, P. W.; Raghavan, S. R. A simple class
of photorheological fluids: Surfactant solutions with viscosity tunable by light. J. Am.
Chem. Soc. 2007, 129, 1553–1559.
(9) Sun, K.; Kumar, R.; Falvey, D. E.; Raghavan, S. R. Photogelling colloidal dispersions
based on light-activated assembly of nanoparticles. J. Am. Chem. Soc. 2009, 131, 7135–
7141.
28

![Supporting Information · Supporting Information Decamethylcucurbit[5]uril based Supramolecular Assemblies as Efficient Electrocatalysts for Oxygen Reduction Reaction Ruru Chen,ab](https://img.dokumen.tips/doc/110x75/5eaec9fbe603423ba5066208/supporting-supporting-information-decamethylcucurbit5uril-based-supramolecular.jpg)


![Supporting Information for - The Royal Society of … Supporting Information for Pillar[n]arene-based Supramolecular Organic Frameworks with High Hydrocarbon Storage and Selectivity](https://img.dokumen.tips/doc/110x75/5aafea8c7f8b9a6b308de72e/supporting-information-for-the-royal-society-of-supporting-information-for.jpg)


![Supramolecular Chirality in Azobenzene-Containing Polymer ......chemistry, physics, biomedical sciences and nanomaterials [23]. Chirality at a supramolecular level has attracted great](https://img.dokumen.tips/doc/110x75/60d3a6c070959419313d3eb8/supramolecular-chirality-in-azobenzene-containing-polymer-chemistry-physics.jpg)