Embed Size (px)
Citation preview

Supporting Information
Enhancing Specificity in the Janus Kinases: A Study on the Thienopyridine
JAK2 Selective Mechanism Combined Molecular Dynamics Simulation
Jiao Jiao Li, Peng Cheng, Jing Tu, Hong Lin Zhai*, Xiao Yun Zhang
College of Chemistry & Chemical Engineering, Lanzhou University, Lanzhou, 730000, PR China
1. Supplementary material for four complexes 19-JAK.
Four hydrogen bonds for the complex 19-JAK2 was superior to others (for 19-JAK1 with
three hydrogen bonds, for 19-JAK3 with two hydrogen bonds and for 19-TYK2 one hydrogen
bond). The differences in the number of hydrogen bonds was one of the JAK2 selectivity factors.
Fig. S1 Numbers of hydrogen bonds vs. simulation time for (a) 19-JAK2 (b) 19-JAK1, 19-JAK3 and 19-TYK2.
2. Results and discussion for four 22-JAK members
2.1. Molecular docking
As shown in the molecular docking results, the performance of molecular docking was well
validated and the initial structures with the best recognition poses were obtained to further execute
* Correspondence to: Tel.: +86 931 8912596; fax: +86 931 8912582; E-mail address: [email protected] (H.L. Zhai).
Electronic Supplementary Material (ESI) for Molecular BioSystems.This journal is © The Royal Society of Chemistry 2015

MD simulations. From the satisfying superimposition between the crystal structure of 3TJD and
the re-docking conformation of JAK2 with inhibitor 22 by the RRD protocol (Fig.1), the root
mean square deviation (RMSD) value between them was 0.580Å. In addition, the docking scores
of four 19-JAK members were highly consistent with each of them experimental activity (Table
S1), which also justified that the JAK2 inhibitor 22 demonstrated the high JAK family selectivity.
It fully turned out that the molecular docking method was feasible.
2.2. MD simulations
2.2.1. Stability of the system simulations
After docking process, the MD simulations of eight systems during 12 ns were run to monitor
the dynamic, structural and energetic properties. The temporal root mean square deviation (RMSD)
values of the Cα atoms of residues within 5 Å around the ligand in the binding pocket relative to
the respective initial structures were shown in the Fig. S2. It was shown that the RMSD
fluctuation of each system was always very small during the MD simulations. Furthermore, the
time evolution of the RMSD values for all protein backbone atoms for each system relative to
their initial structures also tended to converge specially during the last 6 ns (Fig. S2). The
convergent results suggested that all system simulations reached equilibrium and stabilization
during the last 6 ns, which confirmed that the selection of the initial conformations was reasonable.
Therefore, we could employ the last stable 3 ns trajectories for the following energy calculations.
2.2.2. Selectivity analysis for four 22-JAK members
To validate and convince the findings further, the inhibitor 22 that had the same
thienopyridine scaffold and the similar JAK2 inhibition selectivity was bound dynamically into
four JAK kinases to analyze the JAK2 selectivity over JAK1, JAK3 and TYK2. Judging from the

energy calculation results by the MM/GBSA approach (Table S2), the predicted energies gone
along with their experimental activities and varied from -56.92 to -39.23 kcal/mol, and the binding
energy differences (∆∆G) of 22-JAK2 over 22-JAK1, 22-JAK3 and 22-TKK2 were 13.29
kcal/mol, 17.69 kcal/mol and 16.12 kcal/mol, respectively. From four energy items (∆Evdw, ∆Eele,
∆GGB and ∆GSA), the main reason why the thienopyridine compound 22 demonstrated high JAK2
selectivity in binding affinities should be the van der Waals interaction term (-57.85 kcal/mol for
22-JAK2, -48.39 kcal/mol for 22-JAK1, -49.32 kcal/mol for 22-JAK3, -48.29 kcal/mol for 22-
TYK2). In all systems, the remarkable nonpolar contributions as the major driving force suggested
that the hydrophobic amino acid residues in the active pocket played a crucial role in the ligand
binding process, and the polar interactions of positive value were adverse to the integration
between JAK family kinases and inhibitors. Interestingly, the electrostatic (∆Eele) between JAK1
and 22 was counteracted by the unfavorable polar part of desolvation although ∆Eele for 22-JAK1
was the greater superiority than 22-JAK2. The nonpolar forces ultimately may be the positive
factors of the potent and highly selective thienopyridine JAK2 inhibitors with the long and
conjugate scaffold. The modes of 22-JAK family members were consistent with the corresponding
19-JAK family members, which further proved that the computational method was reliable to
analyze the JAK2 selectivity.
Due to the different size of the ligand-binding cavity for four JAK family members, the
selective difference mainly reflected that the long plane scaffold of the inhibitor 22 with the big
hydrophobic t-butyl group in JAK1, JAK3 and TYK2 site cavities had the different degree of
torsion relative to in JAK2 site cavity. Allowing for the degree of JAK2 selectivity over the other
JAK family kinases, the comparison of the structural features between 22-JAK2 and the other

three 22-JAK members fell into two cases to elaborate the binding differences methodically as
follows.
2.2.2.1. The comparison of the structural features between 22-JAK2 and 22-JAK1
To deeply dissect the impact of binding mode on JAK2 selectivity, the structural and
energetic basis of 22-JAK interaction was provided to make a comparative analysis in the JAK
active site. For the important comparative study between 22-JAK2 and 22-JAK1, the structural
framework of 22 can be well embedded in the ATP-binding cleft of JAK2 PTK and oriented so
that the thienopyridine ring pointed towards the hinge region, the amide group was exposed to the
bulk solvent and the t-butyl group was located in the glycine loop (Fig. S3a and Fig. S4b). For the
complex 22-JAK1, because of the non-conservative residue His885 at the tip of the glycine loop
of JAK1 (Fig. S4a), the cleft of the glycine loop in the collapsed position was narrow so that the t-
butyl group with a large steric effect deviated from the tip of the glycine loop and was exposed to
the bulk solvent (Fig. S3b and Fig. S4c), which leaded to the differences in the individual residue
free energy contribution and hydrogen bonding network.
The per-residue energy contributions of four key domains (Fig. S5) suggested that the hinge
region served as the important player to JAK2 inhibitory selectivity. Owing to the stronger H-
bond network in JAK2 hinge region, the energy difference (∆∆G) of each residue (Fig. S6) shown
that their hinge regions were more discrepant than other domains, and that the significantly
different equivalence residues were Glu930/Glu957, Tyr931/Phe958, Leu932/Leu959,
Gly935/Gly962 and Asn981/Asn1008 for 22-JAK2/22-JAK1. As can be seen from Fig. S3e, the
residues Leu855, Val863 from the glycine-rich loop, Met929, Glu930, Tyr931, Leu932, Gly935
from the hinge region and Asn981, Leu983 from the catalytic loop with the major favorable
energy contributions to the complex 22-JAK2 indicated that they served as major residues for
ligand binding. It was interesting that the important residues of the complex 22-JAK2 and the
homologous residues of three other complex members were almost hydrophobic, which can form
similarly strong nonpolar interactions with compound 22 (Fig. S7c). Noticeably, the distinct
differences of the key residue contributions on 4, 6 and 8 positions (equivalence residues) can be
mainly attributed to the variant contributions of the polar interactions (Fig. S7a and S7b), which
may be in keeping with hydrogen bonding interactions. A strong hydrogen bonds network for the
complex 22-JAK2 was created that involved residues Glu930 (one H-bond, 22(N16-
H38)…Glu930(O), with 76.80% occupancy), Leu932 (two H-bonds, Leu932(N-H)…22(N1) and
22(N18-H40)…Leu932(O), with 54.93% and 27.80% occupancy, respectively) and Asp994 (one
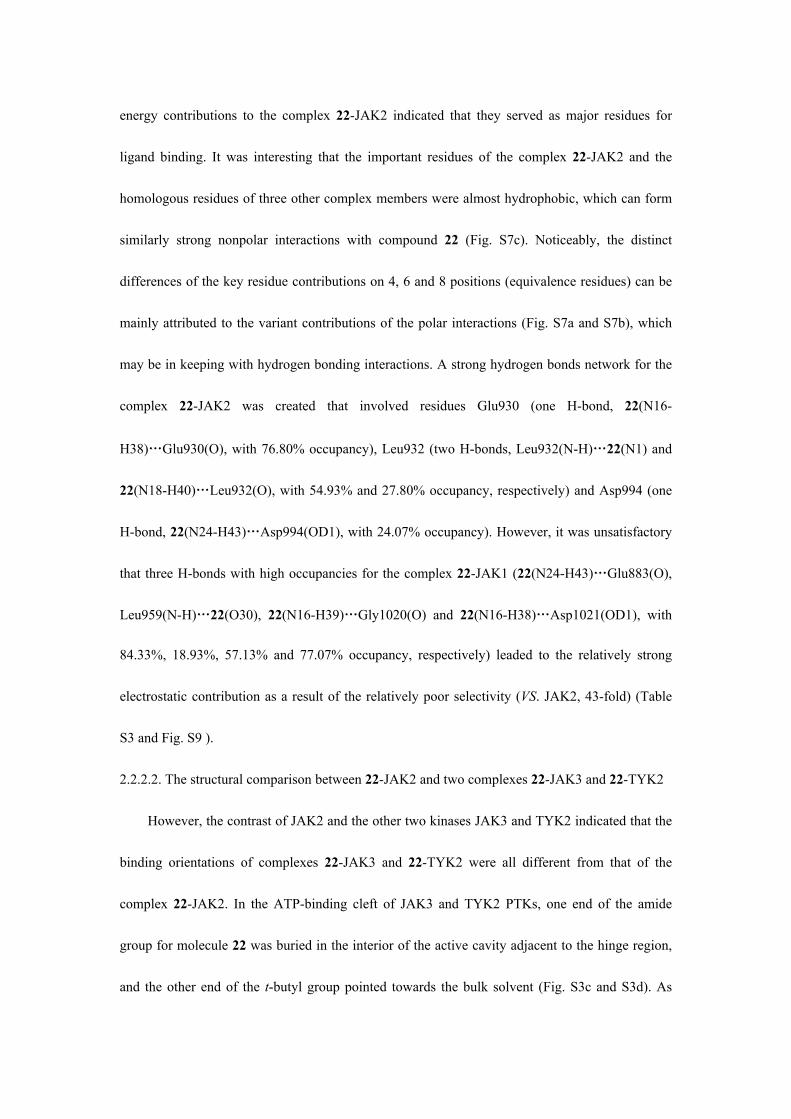
H-bond, 22(N24-H43)…Asp994(OD1), with 24.07% occupancy). However, it was unsatisfactory
that three H-bonds with high occupancies for the complex 22-JAK1 (22(N24-H43)…Glu883(O),
Leu959(N-H)…22(O30), 22(N16-H39)…Gly1020(O) and 22(N16-H38)…Asp1021(OD1), with
84.33%, 18.93%, 57.13% and 77.07% occupancy, respectively) leaded to the relatively strong
electrostatic contribution as a result of the relatively poor selectivity (VS. JAK2, 43-fold) (Table
S3 and Fig. S9 ).
2.2.2.2. The structural comparison between 22-JAK2 and two complexes 22-JAK3 and 22-TYK2
However, the contrast of JAK2 and the other two kinases JAK3 and TYK2 indicated that the
binding orientations of complexes 22-JAK3 and 22-TYK2 were all different from that of the
complex 22-JAK2. In the ATP-binding cleft of JAK3 and TYK2 PTKs, one end of the amide
group for molecule 22 was buried in the interior of the active cavity adjacent to the hinge region,
and the other end of the t-butyl group pointed towards the bulk solvent (Fig. S3c and S3d). As

shown in Figure S8, the glycine-rich loop approached the catalytic loop so that the width and
height of the active pocket may not be enough to place in the compound 22 with the long scaffold
and the hydrophobic t-butyl group. The visible discrepancy with the large steric effect won the
high levels of JAK2 electivity for 22-JAK3 (427-fold) and 22-TYK2 (493-fold). The H-bond
information listed in Table 3S suggested that the complex 22-JAK2 gone with the high H-bond
number and occupancy. The results leaded to the weak energy contributions (Fig. S3g and S3h)
and hydrogen bonding interactions (Fig. S3c and S3d) (for 22-JAK3, two H-bonds, 22(N16-
H39)…Glu903(O) and Leu905(N-H)…22(N16) with 50.67% and 17.33% occupancy, for 22-
TYK2, two H-bonds with 16.07% and 42.07% occupancy, 22(N24-H43)…Leu983(O) 22(N16-
H38)…Glu979(O)). Moreover, their differences in the hinge regions and key residues were almost
in line with that of complexes 22-JAK2 and 22-JAK1 (Fig. S6 and S7).The results suggest that the
compound 22 with the long plane scaffold and the big hydrophobic t-butyl group was unable to fit
perfectly into the narrow active pocket of JAK3 and TYK2, which may be the critical element in
the high-fold JAK2 selectivity over JAK3 and TYK2.
After all, two thienopyridine derivatives 19 and 22 shared the similarity of the JAK2
selective characteristics. In contrast, it was worth mentioning that the slightly JAK2 selective
differences between 19-JAK and 22-JAK were mainly ascribed to the interactions in hinge region.
The reason may be that the propoxy of 22 can have a greater effect on the hinge region relative to
the methyl of 19. The slight difference also proved the conclusion that the key hinge region served
as an important JAK2 selectivity factor.

Table S1. The structure, IC50 values and the corresponding scores of RRD docking method for the inhibitor 22. The italics in the brace mean the fold selectivity vs. JAK2.
Compound 22 Complex 22-JAK2 22-JAK1 22-JAK3 22-TYK2
RRD score -10.943 -5.206 -4.205 -4.073
pIC50 (exp.) 8.52 6.89 5.89 5.83N
S
NH2
S
NHO
O
HN
OO
IC50(μm) 0.003 0.129(43) 1.28(427) 1.48(493)
Table S2 The predicted binding free energies and the individual energy terms for the complexes 22-JAK based on MM/GBSA method (kcal mol-1).
Contribution 22-JAK2 22-JAK1 22-JAK3 22-TYK2
ΔEvdw -57.85±2.89 -48.38±2.79 -49.32±2.40 -48.29±3.75
ΔEele -32.12±4.84 -47.35±7.14 -12.76±3.12 -22.78±5.25
ΔGGB 40.38±3.93 59.17±4.61 29.20±3.08 37.30±3.83
ΔGSA -7.33±0.13 -7.07±0.21 -6.35±0.16 -7.04±0.20
ΔGMM -89.98±5.48 -95.73±7.27 -62.08±3.42 -71.07±5.56
ΔGsol 33.05±3.92 52.10±4.60 22.84±3.07 30.26±3.81
ΔEpolar 8.26 11.83 16.44 14.52
ΔEnonpolar -65.18 -55.46 -55.67 -55.33
ΔGpred -56.93±3.73 -43.63±4.54 -39.23±3.49 -40.81±4.90
pIC50 8.52 6.89(43) 5.89(427) 5.83(493)
Table S3 Hydrogen bonds analysis for the complexes 22-JAK from MD simulation.
Complex Donor Acceptor Distance (Å) Angle (°) Occupancy (%)
22-JAK2 22(N16-H38) Glu930(O) 2.866 18.31 76.80
Leu932(N-H) 22(N1) 2.915 15.58 54.93
22(N18-H40) Leu932(O) 2.895 39.91 27.80
22(N24-H43) Asp994(OD1) 2.896 22.31 24.07
22-JAK1 22(N24-H43) Glu883(O) 2.834 16.67 84.33
22(N16-H38) Asp1021(OD1) 2.836 24.96 77.07
22(N16-H39) Gly1020(O) 2.861 35.03 57.13
Leu959(N-H) 22(O30) 2.888 24.88 18.93
22-JAK3 22(N16-H38) Glu903(O) 2.828 28.07 50.67
Leu905(N-H) 22(N16) 2.926 40.75 17.33
22-TYK2 22(N16-H38) Glu979(O) 2.863 27.77 42.07
22(N24-H43) Leu983(O) 2.847 16.98 16.07

Fig. S2 Time evolution of the RMSD values for four complexes 22-JAK. (a) Cα atoms for the residues around 5 Å of the ligand; (b) all protein backbone atoms.

Fig. S3 The predicted modes of the inhibitor 22 binding to the JAK kinases in the active pocket and the corresponding ligand–residue interaction spectra for the complexes 22-JAK. H-bond interactions were revealed by a blue dotted line. (a) and (e) 22-JAK2 complex; (b) and (f) 22-JAK1 complex; (c) and (g) 22-JAK3 complex; (d) and (h) 22-TYK2 complex.

Fig. S4 Comparison of the MD simulation results between complexes 22-JAK2 (red) and 22-JAK1 (green) (a). Molecular surface representation of JAK2 PTK (b) and JAK1 PTK (c) in complex with 22.
Fig. S5 The per-residue energy contributions of the key domains (the hinge region, glycine-rich loop, catalytic loop and activation loop).

Fig. S6 The energy differences (∆∆G) of each residue for the complex 22-JAK2 relative to other complex members 22-JAK1 (a), 22-JAK3 (b) and 22-TYK2 (c).

Fig. S7 The key residue interactions for JAK2 kinase and the equivalent residue interactions for JAK1, JAK3 and TYK2. (a) the total binding contributions (∆Gtotal); (b) the polar contributions (∆Gpolar); (c) the nonpolar contributions (∆Gnonpolar).
Fig. S8 Molecular surface representation of JAK3 PTK (a) and TYK2 PTK (b) in complex with 22.
Fig. S9 Numbers of hydrogen bonds vs. simulation time for (a) 22-JAK2 (b) 22-JAK1, 22-JAK3 and 22-TYK2.
3. Supplementary material for the complexes between the new molecules and two kinases
JAK2 and JAK1
3.1. Stability of the system simulations
The temporal RMSD values of the Cα atoms of residues within 5 Å around the ligand in the
binding pocket and all protein backbone atoms for each system relative to the respective initial
structures were convergent, and suggested that all of the systems reached equilibrium after 10 ns

simulation (Fig. S10 and S11). The 300 snapshots were extracted from the last stable 3 ns
trajectories to using energy calculations.
3.2. Selectivity analysis for the new molecules
As can be seen in the Table 6, the predicted energy contributions of five ligands-JAK2
systems reached up to -66.69 kcal/mol (-59.37 to -66.69 kcal/mol), and the higher disparities over
the corresponding ligands-JAK1 (17.84, 6.02, 16.44, 14.84, 19.12 kcal/mol) indicated that the
novel molecules may be the promising activities and high selectivity levels of JAK2 inhibitors
(Table S4). The new molecules were stabilized into the active cavity of JAK2 by Van der Wals
and electrostatic forces increased markedly. From the surface representation of JAK2 and JAK1
with new molecules (Fig. S12), the compounds in the binding cleft of JAK1 generated certain
directed deviations relative to JAK2, which may be the major factor leading to the high JAK2
selectivity. The residues of JAK2 protein in four key domains could be available to act on the new
molecules effectively. Owing to the introduction of the RA and RB groups, it was not hard to detect
the powerful forces in the hinge region at work. The big RC group was buried suitably in the
glycine loop where the residues Lys857 to Gly861 made important contributions to stabilize the
complexes. Because of the space structure of the RA, RB and RC groups the scaffold moved down
and right slightly and was near to the catalytic loop and activation loop, which formed the
favorable interactions between JAK2 and the new molecules (Fig. 10). However, the novel
compounds within the complexes ligands-JAK1 could be not fitted into the binding cleft perfectly
so that the residue contributions were relatively weak (Fig. S13). The H-bond numbers and
interactions of ligands-JAK2 were superior to ligands-JAK1 as well (Table S5 and S6). The MD
simulation results provided the valid evidences to verify the reliability and rationality of the new

molecules.
Table S4 The predicted binding free energies and the individual energy terms between the new molecules and JAK1 based on MM/GBSA method (kcal mol-1).
Contribution A1C-JAK1 A3C-JAK1 A3B-JAK1 A3BC-JAK1 BC-JAK1
ΔEvdw -56.29±4.00 -62.49±2.98 -53.06±2.98 -62.06±3.38 -53.96±3.13
ΔEele -52.37±8.16 -56.97±7.21 -21.97±5.98 -45.77±7.05 -14.42±7.66
ΔGGB 74.98±6.07 71.84±5.79 38.87±5.07 64.27±5.61 30.54±6.33
ΔGSA -7.84±0.25 -7.84±0.19 -6.96±0.24 -8.28±0.36 -7.17±0.22
ΔGMM -108.67±8.10 -119.46±7.23 -75.03±6.85 -107.83±7.56 -68.39±7.20
ΔGsol 67.14±6.04 64.00±5.73 31.91±4.97 55.98±5.51 23.37±6.36
ΔEpolar 22.61 14.87 16.90 18.50 16.12
ΔEnonpolar -64.13 -70.33 -60.02 -70.34 -61.13
ΔGpred -41.53±4.20 -55.47±3.77 -43.13±3.75 -51.85±4.45 -45.02±3.87
Table S5 Hydrogen bonds analysis from MD simulation between the new molecules and JAK2.
Complex Donor Acceptor Distance (Å) Angle (°) Occupancy (%)
A1C-JAK2 A1C(N19-H50) Asp994(OD2) 2.821 19.51 66.60
Leu932(N-H) A1C(N1) 2.918 15.07 49.93
A1C(N21-H51) Glu930(O) 2.894 21.88 42.47
A1C(N11-H45) Leu932(O) 2.908 29.82 22.87
A3C-JAK2 A3C(N21-H52) Glu930(O) 2.870 23.25 67.93
A3C(N19-H51) Asp994(OD2) 2.823 20.31 58.60
Leu932(N-H) A3C(N1) 2.915 16.78 55.73
A3C(N11-H46) Leu932(O) 2.922 25.30 6.13
A3B-JAK2 A3B(N21-H56) Glu930(O) 2.877 33.09 66.47
Leu932(N-H) A3B(N1) 2.929 15.86 42.87
A3B(N11-H41) Leu932(O) 2.890 40.38 35.27
A3BC-JAK2 A3BC(N19-H52) Asp994(OD2) 2.816 33.99 75.73
A3BC(N21-H53) Glu930(O) 2.860 32.50 74.80
A3BC(N11-H47) Leu932(O) 2.881 39.26 44.20
Leu932(N-H) A3BC(N1) 2.931 17.70 33.73
Gln853(NE2-HE21) A3BC(N29) 2.916 28.31 16.07
BC-JAK2 BC(N21-H44) Glu930(O) 2.885 29.40 56.67
BC(N19-H43) Asp994(OD2) 2.835 33.24 50.07
BC(N11-H38) Leu932(O) 2.889 35.97 46.87
Leu932(N-H) BC(N1) 2.929 15.56 42.87
Table S6 Hydrogen bonds analysis from MD simulation between the new molecules and JAK1.

Complex Donor Acceptor Distance (Å) Angle (°) Occupancy (%)
A1C-JAK1 Leu959(N-H) A1C(O23) 2.843 25.13 67.13
Glu883(N-H) A1C(O25) 2.870 17.12 66.33
A1C(N21-H52) Asp1021(OD1) 2.833 23.97 64.47
A1C(N19-H50) Glu883(O) 2.862 28.05 44.73
A1C(N21-H51) Gly1020(O) 2.850 28.48 18.80
A3C-JAK1 A3C(N40-H64) Leu959(O) 2.840 28.51 79.47
A3C(N21-H51) Asp1021(OD2) 2.833 30.37 50.00
Leu959(N-H) A3C(O23) 2.879 19.62 44.80
A3C(N21-H53) Gly1020(O) 2.866 45.60 44.33
A3B-JAK1 A3B(N19-H46) Pro960(O) 2.844 16.49 82.87
Leu959(N-H) A3B(N32) 2.937 18.11 11.73
A3BC-JAK1 Lys909(NZ-HZ1) A3BC(O22) 2.771 27.27 37.82
Arg879(NH2-HH21) A3BC(O32) 2.857 37.78 4.71
BC-JAK1 BC(N21-H44) Leu959(O) 2.828 26.10 84.13
Leu959 (N-H) BC(N1) 2.939 18.87 19.60
Fig. S10 Time evolution of the RMSD values of Cα atoms for the residues around 5 Å of the ligand.
Fig. S11 Time evolution of the RMSD values of all protein backbone atoms

Fig. S12 Molecular surface representation between the new molecules and the kinases JAK2 and JAK1.

Fig. S13 The predicted modes of the new molecules binding to JAK1 in the active pocket and the corresponding ligand–residue interaction spectra for the complexes. H-bond interactions were revealed by a blue dotted line.


![¾³Yz¿ Y±YyZ°À]yu JAK2± %æç±¹|-Y½Z·±ºÀ Zcº ...bloodjournal.ir/article-1-1091-fa.pdf · JAK2 ¶¯v¤¯ MPNs JAK2 WHO JAK-STAT PV JAK2 LNK V617F JAK2 V617F JAK2 JH2](https://img.dokumen.tips/doc/110x75/5eddd3dbad6a402d6669089a/yz-yyyzyu-jak2-yz-zc-jak2-v-mpns.jpg)