Embed Size (px)
Citation preview

Support Study for DFID
Low Carbon Mini Grids
“Identifying the gaps and building the evidence base on low carbon mini-grids”
Final Report November 2nd 2013
Final Report – Support Study on Green Mini-Grid Development Contract title “Identifying the gaps and building the evidence base on low carbon mini-grids”
Contract reference Contract n° 40066520 (IED ref.: 2012/023/DFID minigrid)
Client Department for International Development (DfID)
22 Whitehall, London SW1A 2EG
UK
Consultant IED Innovation Energie Développement 2 chemin de la Chauderaie
69340 Francheville, France
Tel : +33 (0)4 72 59 13 20
Fax : +33 (0)4 72 59 13 39
www.ied-sa.fr
VERSION 1 VERSION 2
Date 17 may 2013 20 September 2013
Written by TDV/HP/IT/EM TDV/HP/IT/EM
Reviewed by TDV/HP/AS TDV/HP/AS
Approved by AS AS
The views expressed in this report are those of the authors, and do not necessarily reflect those of the Department for International Development.
1

Final Report – Support Study on Green Mini-Grid Development
TABLE OF CONTENTS
Abbreviations & Acronyms
Introductory Note
Report Structure
Chapter 1: International Review of Mini-Grids
Chapter 2: Potential of Mini-Grids
Chapter 3: Cost-Benefit Modelling
Chapter 4: Financial Schemes & Modelling
Chapter 5: Best Practices for Implementation & Operational Management
Chapter 6: National Policies and Regulatory Frameworks
Chapter 7: Smart Technologies and Innovative Energy
Storage
Chapter 8: Green Mini-Grid Development Programme
Annexes (TOR & Country Visit Reports)
2

Final Report – Support Study on Green Mini-Grid Development
Abbreviations & Acronyms
International organisations & key programmes ADB Asian Development Bank AFD French Development Agency ARE Alliance for Rural Electrification AfDB African Development Bank AusAID Australian Agency for International Development BTC Belgian Technical Cooperation DANIDA Danish International Development Agency DECC (UK) Department of Energy & Climate Change DoE – US Department of Energy (United States) DfID (UK) UK Department for International Development DGIS (NL) Directorate General for International Cooperation ECOWAS Economic Community Of West African States ECREEE Ecowas Centre for Renewable Energy & Energy Efficiency EPIA European PV Industry Association EPRI Electric Power Research Institute GEF Global Environment Facility GIZ (GTZ) German Technical Cooperation Agency ICF International Climate Fund IDB International Development Bank IEA International Energy Agency IEC International Electro-technical Commission IFC International Finance Corporation IRENA International Renewable Energy Agency JICA Japan International Cooperation Agency JRC – EC Join Research Centre – European Commission KfW German Development Bank MDB Multilateral Development Bank NGO Non-governmental organisation NORAD Norwegian Agency for Development Cooperation SIDA Swedish International Development SNV Netherlands Development Organisation UNDP United Nation Development Programme UNEP United Nation Environment Programme UNIDO United Nation Industrial Development Organisation UNFCC United Nation Framework Convention for Climate Change USAID United States Agency for International Development WB World Bank AECF Africa Enterprise Challenge Fund ENDEV Energizing Development Programme ESMAP (WB) Energy Sector Management Assistance Program EF Energy Facility (EU-ACP) EREF Renewable Energy Facility EUEI European Union Energy Initiative PVPS PV Power System programme (IEA) REACT Renewable Energy and Adaptation to Climate Technologies SEFA Sustainable Energy For All (UN) SREP Scaling-up Renewable Energy Programme SPWA Strategic Program for West Africa
3

Final Report – Support Study on Green Mini-Grid Development
Other acronyms ABC Aerial Bundled Cable LED Light Emitting Diode AC / DC Alternative / Direct Current LV–MV–HV Low – Medium – High Voltage ASS After Sales Services MFI Micro-Finance Institution B-2-B Business to business M4P Market for the Poor BCS Battery Charging Station MG Mini-Grid BOS Balance of System NPV Net Present Value BOT Build-Operate-Transfer ODA Official Development Assistance CAPEX Capital Expenditure OPEX Operation Expenditure CDM Clean Development Mechanism O&M Operating and Maintenance CER Certified Emission Reduction P2P Private to Private CHP Combined Heat & Power PE Private Equity CIF Climate Investment Fund PPP Public Private Partnership CSP Concentrated Solar Power PS Private Sector DC Developing Country PSP Private Sector Participation DISCO Distribution Company PV Photovoltaic DN (Power) Distribution Network QTP Qualified Third Party DP Development Pole RE Rural Electrification EA Enumeration Area REA Rural Electrification/Energy Agency EIRR Economic Internal Rate of Return REE Rural Electrification Enterprise EPC Engineering, Procurement, Construction REF Rural Electrification/Energy Fund ESIA Environmental & Social Impact Assessment RE-FiT Renewable Energy Feed-in-Tariff ESCO Electrification Service Company REN Renewable Energy ESCOOP Electrification Service Cooperative RET Renewable Energy Technology EST Energy Smart Technology ROE Return on Equity ESS Energy Storage Solution ROR Rate of Return FCAS Fragile and conflict- affected states SA Stand Alone system FiT Feed-in-Tariff SHP Small Hydro Power FIRR Financial IRR SHS Solar Home System FNPV Financial Net Present Value SME Small & Medium Enterprise GDP Gross Domestic Product SPP Small Power Producer GENCO Generation Company SSD Decentralised Service Company (Fr) GHG Green House Gas TA Technical Assistance GIS Geographical Information System PPA Power Purchase Agreement GMG Green Mini-Grid VAT Value-Added Tax HDI Human Development Index WTP Willingness To Pay HFO Heavy Fuel Oil
HH Household
IGA Income Generating Activity Ke Kenya IP Investment Plan (SREP) Ma Malawi IPD Indicator for Potential Development Mo Mozambique IPP Independent Power Producer Rw Rwanda IRR Interest Rate of Return Tz Tanzania LCOE Levelised Cost of Electricity Ug Uganda LDC Least Developed Country DRC Democratic Republic of Congo
4

Final Report – Support Study on Green Mini-Grid Development
Units & Currencies k – M – G – T Kilo – Mega – Giga – Tera USD or $ 1 EUR = 1.336 USD kW-MW-GW Kilo-méga-giga Watt EUR or € 1 USD = 0.748 EUR kWh - MWh Kilo - Méga Watt hour GBP or £ 1 USD = 0.645 GBP GWh - TWh Giga - Tera Watt hour
Wp – kWp Watt peak (solar)
V Volt XOF or FCFA 1 USD = 491 Francs CFA (West Africa) A Ampere RWF 1 USD = 638 Francs (Rwanda) L Litre TZS 1 USD = 1650 Shilling (2013-Tanzania) ha Hectare KES 1 USD = 87.6 Shilling (Kenya) hab Inhabitant UGX 1 USD = 2605 Shilling (Uganda) pop Population MZN or Mt 1 USD = 29.6 Metical (Mozambique)
5

Final Report – Support Study on Green Mini-Grid Development
Introductory Note
The support study “Identifying the gaps and building the evidence base on low carbon mini-grids”
was conducted by the consultant IED and this report has the objectives to present the information
and evidences collected from the field based on IED and international mini-grid experiences and to
draw preliminary conclusions of mini-grid development potential for Africa. Such report is neither
intended to develop an analytical R&D framework on Mini-Grids, nor to be a document ready to be
published.
This final report has been prepared in July-September 2013. It is the revised version of the draft that
was submitted in May 2013. The present report accounts for most of the comments made on the
draft by numerous reviewers.
The report does not account for comments which doubt the validity of parameter values (costs,
lifetime, etc.) used in the examples. The commentators may be aware of projects whose values are
different from the ones used in the examples, but that does not make the example values invalid.
The costs of green mini-grids are project specific and may vary enormously from one project to
another. An example, therefore, is only a piece out of a mosaic.
Some good comments have been made which are or are not fully addressed in this report. These
comments are viewpoints (which the authors do sometimes not share), pointing to further sources of
information (some have been reviewed for this report but not all), going into deeper analysis beyond
the scope of building on evidence or occasionally misunderstandings (in the present report, the
wordings sometimes have been changed). Responding to many of these comments in writing would
have consumed too much time. Should an opportunity be given to discuss this report, the authors
would be pleased to address those comments.
6

Final Report – Support Study on Green Mini-Grid Development
Report Structure
This report represents the final report on the support study on “Identifying the gaps and building
the evidence base on low carbon mini-grids”. The review forms part of a preliminary initiative of
DFID to promote Green Mini-Grids (GMG) in Africa under the International Climate Fund (ICF) with
the objective of providing guidance and recommendations for DFID intervention and programme
implementation.
The study has been conducted by Innovation Energie Development (IED) under contract to DFID according to the Terms of Reference and milestones reproduced in Annex. The support study started
on the 22nd
of November 2012 and ended in September 2013. The report is based on activities which have included kick-off meetings, development of the
methodological framework, literature and web review of documents relevant to the state-of-the-art
practices for mini-grids, collation of relevant international experience, and a field visit in 2 targeted
African countries (Kenya & Mozambique) to conduct interviews with key stakeholders and to collect
field data.
The report is structured in 8 chapters as per the requirements of the TOR, and each chapter starts
with a “Highlights” section. Rather than writing a “Summary of Summaries” we leave the reader to
refer to each one of the chapters for a summary review.
Chapter 1, International Review of Mini-Grids and Data Collection, provides an overview of
the technologies, and of implementation schemes. The reality of the target countries is that
while there are a number of diesel based mini-grids run either by private operators with low
service and high cost, outside any regulated framework, and some run through various forms
of Public Private Partnerships, there are extremely few Green Mini-Grids. Some Renewable
Energy Power Generation operations are found to be for self-consumption or feeding into
the grid, but very seldom for powering a Mini-Grid isolated from the interconnected
network. Therefore there is, in reality, very little actual evidence to build on.
Chapter 2, Relevance of Mini-Grid Solutions, proposes an approach to help the planner
identify whether in a given country / region, Mini-Grids – and further Green Mini-Grids are a
viable option for access to electricity services. These mini-grid areas are those which will
remain out reach of the interconnected grid for a few years to come, and yet where there is
sufficient load density to ensure the economic viability of a mini-grid (as opposed to those
areas where stand-alone individual / community systems are the most relevant). The
objective here is to establish whether there is a sufficient volume benefitting a sizable
population, which justifies the development of the whole, complex value chain – technology,
skills, business models, etc.
Chapter 3, Cost Benefit Modelling, confirms once again the benefits of electrification from
an economic perspective, which is that of the society as a whole and in a long term view.
From the point of view of society, benefits of access to electricity widely exceed that of “greenness” per se in the country context of this study. It also remains that these Green
Mini-Grids are capital intensive but viable in the long term, also looking into the fact that we are on a learning curve. Case studies will illustrate that we are sometimes borderline in terms
7

Final Report – Support Study on Green Mini-Grid Development
of comparison to fossil fuels, but considering the dynamics of rising fossil fuel prices, cost of
environmental degradation and the fact that renewables are becoming cheaper and more
reliable, GMG should definitely be considered.
Chapter 4, Financial Schemes and Modelling, highlights that GMG investment returns
generally do not match private sector expectations in terms of returns, pay back and risk.
Government-led programmes are being – albeit modestly- observed, because this requires a
significant outlay of capital upfront, and most countries would naturally prioritised grid
extension which maximises the number of connections per € spent. Hence, there clearly is a
need for financial engineering to bridge the gap between economic viability from the
society’s perspective and profitability from the investor’s perspective.
Chapter 5, Best Practices for Implementation and Operational Management, actually offers
some examples and good practices of implementation. “Best practices”, given the reality of
the number of schemes actually implemented, is a total overstatement. The two key entry
points of the analysis here is that Green Power Generation Activity for a mini-grid has to be
distinguished from the Distribution activity – involving customer management. In some
cases, one may have a single player. Field evidence shows that this is not the case as
companies interested in the generation side, are more often than not is a separate entity
from distributors with the local contacts. They want a (reliable) off taker, who can be a DISCO
(distribution company), a distribution cooperative, or large anchor customers. Aside from
that, the risks and returns of distribution in a mini-grid are very different from Small Green
Power generation. One structure undertaking the two activities is observed in the case of
much smaller micro grids, or low tech village level approach – which is a very relevant but
different market segment.
Chapter 6 National Policies, Regulatory and Financial Frameworks shows that formulating
without a vision, strategy, quantified plan and political commitment, GMG stand little chance
of broad expansion beyond pilot projects. Once this foundation is established, the legal basis,
authorisation, procedures, and transparency should be worked out, further offering the
incentives required for GMG to take off (i.e. fiscal, financial, tax). Field reality shows us that
this is starting in countries which are already well advanced in grid expansion for rural
electrification. In countries where grid expansion still offers a significant potential, policy
makers will look at mini-grids only as “pilots” to learn from in preparation for a future phase.
Chapter 7 on Smart Technologies and Innovative Energy Storage provides a quick
perspective on the very promising technology developments, which is a strong argument in
favour of making efforts to bridge the gap between economic and financial viability.
Chapter 8, GMG Development Programme is the final chapter of the report which suggests
countries for priority intervention given DFID goals, and the types of interventions which
would be most effective in scaling up the number of GMG from demonstrations to
programmes.
8

Final Report – Support Study on Green Mini-Grid Development
Chapter 1: International Review of Mini-Grids
TABLE OF CONTENTS
ABBREVIATIONS & ACRONYMS ....................................................................................... 3
INTRODUCTORY NOTE ................................................................................................... 6
REPORT STRUCTURE ..................................................................................................... 7
KEY HIGHLIGHTS ........................................................................................................ 11
1 MG SYSTEM DEFINITIONS & COMPARISONS .............................................................. 15
1.1 Introduction ................................................................................................................ 15
1.2 Definitions................................................................................................................... 15
1.3 Comparisons of RE Approaches .................................................................................... 17
2 REVIEW OF MG TECHNOLOGIES .............................................................................. 21
2.1 Preamble ..................................................................................................................... 21
2.2 MG Technology Concept .............................................................................................. 21
2.3 Range of Renewable Generation Technologies ............................................................. 26
2.4 Data on Costs of Green Mini-Grids ............................................................................... 34
3 POTENTIAL FOR MG ............................................................................................ 42
3.1 Literature Assessment ................................................................................................. 42
3.2 Country Case Assessment ............................................................................................ 47
4 REVIEW OF MAIN MG PROGRAMMES ...................................................................... 48
4.1 Preamble ..................................................................................................................... 48
4.2 Existing International MG Activities ............................................................................. 48
4.3 DFID/ICF Priority Countries .......................................................................................... 52
5 ANNEX 1: BRIEF ON SPECIFIC COUNTRIES .................................................................. 55
5.1 ICF Priority Countries ................................................................................................... 55
5.2 Other Countries ........................................................................................................... 79
6 ANNEX 2 ........................................................................................................... 89
6.1 Definition of Electrification Levels ................................................................................ 89
6.2 References & Bibliography ........................................................................................... 90
9

Final Report – Support Study on Green Mini-Grid Development
LIST OF TABLES AND FIGURES
Figure 1 : Illustrative View of Grid and Off-Grid Perimeters (DFID-IED, 2013) .................................. 16 Figure 2 : Rural Electrification Approaches (IED, 2012) .................................................................. 22 Figure 3: Schematic View of a PV / Diesel Hybrid System (PVPS, 2013) ........................................... 31 Figure 4 : LCOE Projection (2012-2020) for Renewable Energy Technologies (IRENA, 2013) ............. 38 Figure 5 : LCOE Projection (2010-2030) for Solar PV (Hearps, EPIA, 2011) ....................................... 39 Figure 6 : LCOE Projection (2010-2030) for Wind (Hearps, EPIA, 2011) ........................................... 39 Figure 7 : Projection of Electricity Generation Share by 2030 (UN-SEFA, 2012) ................................ 43 Figure 8 : Localities Supplied by 2030 by the Grid and Decentralise RE Solutions (ECREE, 2012) ....... 43 Figure 9: Most Economical Source of Energy in Africa (Szobo, JRC-EU, 2012) .................................. 44 Figure 10: Most Economical Sources of Energy (JRC-EU, 2011, presentation in ACRA) ..................... 45 Figure 11 : LCOE Comparison of Diesel vs. PV in Africa (JRC-EU, 2011) ............................................ 46 Figure 12: Payback Period of Hybrid PV/Diesel in Africa (RLI, Ch. Breyer, 2012) ............................... 46 Figure 13: Typical Load Curves for Rural Electrification .................................................................. 47 Figure 14 : Kenya’s Grid Network, Solar & Wind Potential ............................................................. 56 Figure 15 : Tanzania Existing Network (Tanesco 2012) ................................................................... 60 Figure 16 : Institutional Framework and Market Structure of the Electricity Sector (SREP-IP, 2013) .. 61
Table 1: Definitions of Rural Electrification systems ...................................................................... 17 Table 2: Comparison G-MG-SA (based on Yadoo, 2012) ................................................................. 20 Table 3: Reliability of GMG .......................................................................................................... 24 Table 4: IED Reference costs for Green Mini-Grids (GMG) ............................................................. 35 Table 5: Generating cost ranges by technology (IRENA) ................................................................. 36 Table 6: Costs of green power plants ............................................................................................ 40 Table 7: Technical potentials for renewable power generation (uncertainty +/- 50%) (IRENA, 2011) 44 Table 8: List of international donors involved in RE & GMG ........................................................... 49 Table 9: GMG developing programmes ........................................................................................ 49 Table 10: GMG supporting networks ............................................................................................ 50 Table 11: Criteria for country selection and preliminary scores ...................................................... 53 Table 12: Indicative ranking of ICF priority countries ..................................................................... 54 Table 13: MG status in ICF priority countries ................................................................................ 54 Table 14: Proposed 2012 FIT tariff for Main Grid (152 TZS = 0.09 USD) ........................................... 62 Table 15: Proposed 2012 FIT tariff for Mini-Grid (480 TZS = 0.30 USD): ........................................... 62 Table 16: List of SPP projects in Tanzania (March 2013, TANESCO) ................................................. 64 Table 17: Economic Levelised Cost of Electricity (LCOE) in Mini-Grids from various energy sources (SREP-IP, 2013) ........................................................................................................................... 65 Table 18: Definition of Electrification levels .................................................................................. 89 Table 19: Access levels to electricity (and non-solid fuels) in ICF priority countries .......................... 89
10

Final Report – Support Study on Green Mini-Grid Development
International Review of Mini-Grids
Key Highlights
The aim of this first chapter of our support study is to review the international experience with mini-grid implementation (diesel-based and ‘Green’ or renewable-based mini-grids).
The main statement from the upcoming review is the tremendously large number of projects,
programmes, initiatives, networks, and publications dealing with mini-grids for rural electrification.
The review cannot be exhaustive and cover all worldwide experiences and lessons learnt, especially
as each experience of MG implementation is highly site-specific. However, here below are the main
highlights on the MG state-of-the-art found during the international review covering mainly African
and Asian regions. 1) Mini-grid definitions and comparison
There are no standard, universal definition of mini-grid (MG) and green mini-grids (GMG).
Specific definitions and comparison with grid extension and stand-alone systems for rural electrification are given to delimit the content of our support study.
2) Installed mini-grids
Availability of reliable data is a real barrier to assess the number, the capacity or the
investments of mini-grids in a country. At best, basic data are available from government or
donors-led projects but rarely from private or NGO initiatives. Reliable data on implemented
and operating systems are even more difficult to find.
The grid extension remains the preferred option for rural electrification but nowadays,
planners are more and more concerned by the economic justification and are aware of
having mini-grids as part of their rural population. Current investments in mini-grids are still
very limited compared to grid extensions.
The Green Mini-Grids using local renewable resources are relatively new, except for
numerous micro-hydro sites, and are bound to grow considerably given rising fuel prices and
recent technology developments (performances & costs).
The era of stand-alone pilot/demonstration projects, which aimed to test the technology, is
definitely over. However most African countries are still at the pilot stage with GMG; only
Mali, Senegal and Kenya have been identified in Africa as having more than a dozen of green
mini-grids implemented by their governments and seemed to be ready for scale-up. 3) Technologies and performances
A wide variety of renewable energy technologies (RET) are available with different maturity
levels, costs and performances. Each resource (hydro, biomass, wind, solar) has several
technology options for generating electricity and competing with diesel-based gensets.
11

Final Report – Support Study on Green Mini-Grid Development
The technology choice should theoretically depend first on their cost-effectiveness, on the
available local resource(s) and on the load profile of the rural settlements. In practice,
choices have often been led by government and/or donors.
The intermittency (and unpredictability) of renewable sources is a specific barrier to meet
the rural off-grid demand. The additional costs for energy storage becomes the main
bottleneck for solar & wind MG systems. Multi-sources or hybrid systems are now perceived
as a promising alternative despite their higher complexity.
The cost-effectiveness is a key element in MG and GMG development:
i) Mini-Grids: The cost-effectiveness of MG vs. grid extension and individual isolated
systems (SHS, BCS, etc.) depends on geographical constraints (aridity, mountains, forests,
islands), settlement density, grid network coverage and rate of capacity utilisation of the
isolated plant.
ii) Green Mini-Grids: The cost-effectiveness of Green MG vs. conventional fuel-based MG
will basically depend on local energy resources, fuel prices, and financial incentives and
also on the rate of utilisation. Renewable energy technologies, and particularly solar and
wind, remain expensive although often the least cost option in remote areas.
Given the real uncertainties on load demand forecasting as well as on grid extension
schedules, the design of MG should be as much as possible evolutive, flexible and adaptable
since the early stage to later minimise financing needs and to avoid wastage of investments.
MG systems should be able to adapt with load (reserve capacity, additional investment) and
with future grid interconnection (technical and regulatory issues).
Other key lessons can be specifically drawn per RET technologies for power generation:
i) Hydro: seasonal fluctuation of the production for run-off river hydro plants; long
preparation and lead times; underestimated investment costs; matching least-cost
design and local demand; cost-effectiveness and commercial attractiveness related to
utilisation rate; advisable with grid connection; mature, proven & affordable technology;
etc.
ii) Biomass (gasifier): tricky collection & storage of biomass; O&M labour & technically
demanding; serious maintenance & environmental concerns (water and by-products
disposal); advisable for anchor customers (agribusiness) or daily limited power supply
(e.g. 12h/24); cheap feedstock and low production cost; etc.
iii) Wind/Solar: high upfront cost; high replacement costs; intermittent & unpredictable
resources; need costly battery storage for higher penetration rate or backup diesel-
gensets (hybrid) to meet rural demand; complex optimised design for hybrid MG; wind
hybrid systems apparently technically demanding; advisable to design hybrid systems
with reduced battery capacity and proper demand-side management.
12

Final Report – Support Study on Green Mini-Grid Development
4) Implementation models
There are many different possible schemes for MG and GMG implementation but there is no
reference implementation or business model that can be easily/promptly replicated for
scaling-up GMG programme; there are no best practices as such for GMG implementation.
Implementation of MG in rural areas can face many different barriers that are project, site
and country-specific: national policy and regulatory environment, financing models,
technology choice and management organisation.
Success and sustainability of a GMG electrification project is intimately linked to key issues
and specific barriers. The experiences showed that long term sustainability of MG and GMG
can strongly be improved with proper appreciation of grid extension, choice of high quality
components (standards), adequate local O&M skills (trainings), end-users commitment
(awareness) and associated productive uses / IGA activities (incentives).
All recent programmes and initiatives focus on how to overcome the key barriers on
business, financing, policy and technology environment that hinder the development and the
scaling up of GMG on a large scale. Hence, there is a need to move to sustainable, high
impact, efficient and effective programmes.
Creating a critical mass of green mini-grid experience is of crucial importance for
sustainability, in particular to ensure availability of spare parts, local skills and to reduce
procurement costs.
5) Implementing actors
There is a wide range of donors involved in rural electrification including MG component. The
review of existing programmes provides a stark reminder of the duplication of effort among
various donors and the lack of critical mass due to many small uncoordinated donor
programmes
i) Dominance of government-led projects for both design and implementation
ii) Difficult attempt to attract the private investors beyond equipment supply &
construction works
iii) Difficulties to imply the local communities in the long term
There is a need, and will, to build effective international linkage & coordination for GMG
development, and to develop collaborative and structured approaches with integrated
planning.
Although there are many study programmes and brainstorming networks regarding green
mini-grid development, there is no multi-country investment programme that aligns
interventions along the GMG project development continuum and targets infrastructure
investment. 6) National environments
13

Final Report – Support Study on Green Mini-Grid Development
In almost all African countries, national power reforms have been initiated over the last
decade with a special focus on defining adapted framework for off-grid and sometimes mini-
grid development. Given its own environment, each country has developed specific strategy
and policy for rural electrification & renewable energy sectors: tariff structure, technology
choice, support to private and financing sectors, among others. As an example, Kenya has
developed local skills in biogas, Uganda is well known for hydro competency while Burkina &
Mali have pushed solar hybrid system development.
It is then important to target countries having key ingredients ready for MG scale-up
programme as follows: rural electrification planning, renewable potential assessment,
preparatory studies, supporting policies for local private and financing sectors, adapted or
adaptable tariff structure, appropriate procurement procedures, interest and commitment of
national project partner(s) and local/central government, local skills and eagerness for O&M
and project management, etc.
Regional experiences: some GMG experiences in East Africa, Central Africa, and West Africa
have been identified and reviewed as far as information are available. The most experienced
countries for GMG are Senegal and Mali for solar hybrid systems and Kenya for mixed
renewables (microhydro, wind, solar).
14

Final Report – Support Study on Green Mini-Grid Development
1 MG System Definitions & Comparisons
1.1 Introduction
The Department for International Development (DFID), jointly with other UK Departments (DECC, Defra, FCO), are managing the International Climate Fund (ICF).
Within the ICF, there is a low carbon knowledge studies fund which aims to collate evidences to maximise results and ensure lesson learning across different geographical and economic contexts.
The present study on mini-grids aims to support ICF design teams in the preparation of an ICF
Concept Note and to ensure the preparation of evidence based Business Cases, in the instance that
evidence does support the rationale for UK intervention and identify a potentially transformational
role for the ICF.
As the International Climate Fund focuses on low carbon projects and the use of renewable energy carriers, the study will concentrate on Low Carbon mini-grids, equivalently called in this study “Green Mini-Grids” or GMG.
1.2 Definitions
In rural electrification, there are different approaches to electrify rural settlements depending on their distance from the grid, as illustrated by the next figure.
Grid perimeter: geographical areas where settlements are connected to the national
distribution grid or are located at a cost-effective distance where grid extension can be
justified by population density and load demand levels.
Off-grid perimeter: geographical areas where settlements are outside the grid perimeter and
can be supplied by either stand-alone individual systems (SA) if households are scattered or
by mini-grids (MG) if households are sufficiently dense. Those mini-grids can be supplied by
different generating sources (diesel, hydro, biomass, wind, solar).
15

Final Report – Support Study on Green Mini-Grid Development
Grid Off-Grid
33 kV Perimeter Perimeter
Distribution
Off-Grid
Perimeter 100 kV Biomass
Transmission
Stand-alone
MG
> X pop
Systems
Justified by high
population
Solar/wind
MG Hydro
MG
Figure 1 : Illustrative View of Grid and Off-Grid Perimeters (DFID-IED, 2013)
The present study focuses on Mini-Grids and Green Mini-Grids that can provide cost-effective
alternative solution for rural electrification in specific conditions, compared to the conventional grid
extension and to stand-alone solutions (solar home systems, solar community systems, and battery-
charging stations).
The following table provides our definitions of the terms used in the study. They may differ from other sources as terminology is not standardised.
16

Final Report – Support Study on Green Mini-Grid Development
Table 1: Definitions of Rural Electrification Systems
Type Rural Electrification system definitions On-grid system (or grid-tied) All network or sub-grid or generating systems that are connected to the grid and run
by national utility or by IPP. Off-grid system All distribution networks that are isolated from the main grid, supplied by (0 - few MW) independent source(s) of power, and managed by any kind of operator. Mini-grid system (MG) System where all or a portion of the produced electricity (by any source) is fed into a (10kW - few MW) small distribution grid (low & medium voltage (LV/MV); single-/tri-phases) which
provides several end-users with electricity. Note: A mini-grid system can be either isolated or grid-connected If the mini-grid is connected to the main grid, it should be operated by a third party, separate than the state utility (public or private). The aim of the grid connection is usually to sell extra energy or to compensate the deficit of energy.
Green mini-grid (or low carbon) Mini-grid system (as defined above) where the energy fed into the grid is produced by (10kW - few MW) renewable energy carriers or hybrid systems (renewables/fossil fuels). Green
generators are cleaner and potentially cheaper than conventional generation using fossil fuels.
Micro-grid system (µG) System where the produced electricity (usually below 10kW) is fed into a very small (1 - 10kW) distribution grid (usually low voltage and single phase) which provides several end-
users with electricity. Micro-grids can also operate in both grid-connected or island-mode.
Stand-alone system (SA) Isolated power system that usually supply one rural customer without distribution (0-5kW) grid (household, community infrastructure, battery charging station, multifunctional
platform, water pumping station) Smart Grids
1 Smart grids are networks that monitor and manage intelligently the transport of
electricity from all generation sources to meet the varying electricity demands of end users.
Hybrid system System having more than one generating source, either mix of renewable and fossil- fuel sources or mix of renewable sources only. Hybrid generator can supply mini-grids or stand-alone systems
1.3 Comparisons of RE Approaches
Based on figure 1 and the above definitions, it is useful to compare the different advantages and drawbacks of mini-grids compared to other more usual ways to electrify rural areas.
1) Conventional grid
Grid connection or extension remains the preferred mode of electrification worldwide. For
political/social reasons, the top-down approach remains the prevalent strategy to extend the grid
in non-profitable remote regions (example: Morocco, India, Thailand, Ghana, South Africa,
Kenya).
However, it has important economic barriers that limit its extension in remote rural areas where the power demand is low and the settlement dispersed, particularly in Africa.
The power quality and availability at end-of-network often doesn’t reach acceptable standards
(fluctuating voltages & frequencies) and customer expectations due to poor design, operation &
maintenance of rural generation, transport and distribution infrastructures.
Some key features of grid connection approach are given in table 2.
1
http://www.iea.org/topics/smartgrids/ 17

Final Report – Support Study on Green Mini-Grid Development
2) Stand-Alone systems (SA)
SA systems, in particular Solar Home Systems (SHS), have been widely promoted by various
international donors, development agencies or local governments to target the most remote and
scattered population (i.e. Bangladesh, Laos, India). Affordability, reliability and sustainability of
individual SHS have been widely criticised after so many programmes failed during the last 2
decades. Moreover, the service offered is limited and the SA systems are often considered as
pre-electrification. However, for scattered population in remote regions as in Mauritania or Mali,
SHS or small wind power systems may offer a cost-effective pre-electrification solution to access
modern energy.
There is a strong commercial interest to develop innovative SA solutions for the numerous
remote and scattered households worldwide. The affordability of those products is the key issue
nowadays and efforts have been put to improve performances and to reduce not only the costs,
but also the size of those SA systems. Beside the common SHS usually ranging from 10 to 100Wp,
there are many other cheaper products as pico-turbines and pico-solar.
Individual pico-hydro turbines (100-500W) have been massively commercialised in remote
areas of East Asia (Laos, Vietnam, China) starting at prices as low as $50 per unit (low
quality).
Portable pico-PV systems have now reached much higher quality by incorporating highly
efficient end use equipment. Most advanced pico-PV systems include not only LED lamps for
lighting but also phone charging, radio and possibility of incrementally adding on other
efficient appliances (some could be called a pico-grid system). Pico-systems start with
portable lanterns that can be commercialised at affordable prices (< $10, similar to kerosene
lamps). A comprehensive review of “Pico-Solar PV systems for remote homes” has been
conducted & published (Jan 2013) by Task 9 of Photovoltaic Power Systems Programme of
the International Energy Agency.
These systems also exist most of the time as rechargeable systems. Stand-alone systems should
be considered as complementary to mini-grids and should be systematically integrated in mini-
grid programmes for the remoter, scattered and out of reach households. A battery charging
service integrated in the mini-grid could also provide a minimal level of service for those remote
households.
Nevertheless, all those small and individual power systems provide limited amount of electricity
and are perceived as a pre-electrification step as they don’t offer enough power for specific
appliances and productive uses. They could not be considered as contributing to universal energy
access. Some key features of Stand-Alone approach are given in table 2. 3) Mini-grids (MG)
Finally Mini-Grids come naturally as an intermediate cost-effective solution for off-grid areas
where population density can justify the provision of electricity through a local distribution grid,
whatever the production source is.
18

Final Report – Support Study on Green Mini-Grid Development
The electricity service provided by a mini-grid can be limited to 2-6 hours a day usually when the
fuel source (mainly fossil fuels & biomass) has a cost to be supported by the customers; it can be
12-24 hours if the source is “free” and available 24h/day (hydro) or if a storage solution is
available (solar & wind). The MG system offers a pre-electrification service that limits the
generation of income activities and its economic impacts.
Over the last 20 years, many governments, power utilities and private industries in DC have
implemented mini-grids, mostly diesel-based MG and some hydro-based MG. Motivation was
often more political or social than economical. The greatest MG development was observed in
Asia.
In Cambodia, to overcome the very limited grid extension, more than 300 diesel-based mini-grids have been
developed in rural areas and are operated by local REE (private enterprises) under EAC licence. (cf. Country
Brief in Annex 1)
In India, the poor quality of the distribution networks and the insufficiency of power supply has lead to
develop alternative decentralised approaches to reach the remaining 10% unelectrified villages (> 110.000)
and the unserved demand (households, cottages, etc.). Among various programmes, the government-led
RGGVY programme2 launched in 2005 has supported several thousands of Mini-Grids (MG) or Decentralized
Distributed Generation (DDG) Systems based on conventional & renewable (mainly with hydro < 5MW) energy
sources where grid supply is not feasible or cost-effective. A state renewable energy agency (CREDA) in
Chhattisgarh State has provided electricity access to 35,000 households by operating and managing Solar
Based mini-grid systems. (cf. Country Brief in Annex 1) Many more examples of existing MG & GMG will be provided over this chapter and the following boxes
4) Comparison of the main RE approaches
The following table provides some key characteristics for each approach allowing preliminary comparison of mini-grids with grid extension and stand-alone systems.
2 http://rggvy.gov.in/rggvy/rggvyportal/index.html
19

Final Report – Support Study on Green Mini-Grid Development
Table 2: Comparison G-MG-SA (based on Yadoo, 2012)
Issues Grid extension (rural) Stand-Alone Systems
Technical Grid capacity limitation (expensive reinforcement Limited power & energy Wide
of grid lines and power capacities)
renew
Voltage drop (transport & distribution losses) Limited applications (pre-electrif.) Poten
Unstable power Discontinuous supply service Poten
Insufficient energy Limited access for productive uses Need
Load-shedding (unreliability and shortages) Often DC appliances
low efficiency Need
Low overall system reliance Low capacity factor Need
Appropriate for scattered users Need
Organisational Slow implementation process Fast implementation process Need
Management by professional as Utilities Management by end-users Need
Uniform tariff for all customers No energy tariff
fee-for service, etc. Poten
Economical High capex for isolated area and low loads Very costly energy Difficu
High opex for rural distribution network Difficult money collection Difficu
Social/environmental Environmental impacts for MV lines Limited Socio-economic and environmental impacts Poten
No community involvement Good potential for local involvement Poten
Policy/regulatory Need adapted regulatory framework for IPP, … No need for specific regulatory framework Need
Need
Need
Need
20

Final Report – Support Study on Green Mini-Grid Development
2 Review of MG Technologies
2.1 Preamble Generation versus Distribution
First, while discussing the issue of mini-grid technologies, the focus is often too much on the
generation side, and centred on the questions related to renewables vs. fossil fuel generation. In
reality, the distribution grid and customers’ connections represent as much as 50% of the global
investment cost (more or less, depending on the generation technology and on grid standard level).
Not enough attention is paid to the issue of reducing the distribution grid per kWh sold cost, and
such reductions arise from the following: (1) a better design (lay out of the grid), (2) norms which can
be simplified at level still acceptable to the utility, and (3) procurement practices. Then only
generating sources can be compared for GMG. Rural load profile
Second, the characteristic of rural loads is the high evening peak, leading to size the supply for the
evening load, and hence a substantial part of the initial investment cost (CAPEX) is used only for very
few hours a day. This is clearly a significant drawback for 100% renewable energy supply, and makes
the case for hybrid systems, wherein diesel generation with low CAPEX would be used for these
peaks. The other option would be to store energy produced during off peak, with the question of the
cost of storage (water, biomass, electrochemical batteries) (cf. Chapter 7). The specificity of the rural
loads combined with the intermittency and poorly predictable production of renewables make the
case for hybrid systems, which nonetheless require optimisation and deep technical knowledge. Renewable sources
Third, all renewables do not have the same costs, the same intermittency characteristics, nor the
same level of technical maturity and complexity in design and or operations. We will review these
aspects through examples in the following section.
2.2 MG Technology Concept 2.2.1 Decentralised mini-grids Given their low investment requirement, the decentralised mini-grids often use fuel-based gensets in
rural areas generating electricity and supplying isolated distribution grids. There are many examples
in Nigeria or Madagascar. Multi-genset systems are preferred to offer more reliable service up to
24h/day if consumers can afford the fuel bill.
Recently, the market has been changed by the emergence of new technologies. Renewable electricity
costs have been drastically reduced and reliability has considerably improved, giving an opportunity
to develop Green Mini-Grids and hybrid systems, in particular where grid is not well developed.
These two options are illustrated by figure 2.
21

Final Report – Support Study on Green Mini-Grid Development
Rural
Electrification
Centralised
Aggreg. Decentralised Stand-Alone
Mini-Grids
Grid-based Connection Individual
Systems (Micro - Smart) Systems
(SHS, BCS, MFP ...)
Fossil fuel- Hybri- Low-Carbon
or Green
based MG
disation MG
(One or more
technologies)
Hydro Biomass Wind Solar Hybrid
Figure 2 : Rural Electrification Approaches (IED, 2012)
A decentralised mini-grid consists of 2 parts:
Power generation: without grid connection, the mini-grid can be supplied either by fuel-
based gensets or by renewable energy sources or by a mix called hybrid systems. Technical
operation of renewable or hybrid systems can be rather complex.
Power distribution & sales: adapted norms for distribution network and sustainable technical
and commercial management are the key issues. Distribution network in mini-grid systems
will be discussed further in item 2.2.4.
IEC has published Technical Specifications IEC 62257, a set of standards covering technical and
organisational aspects of mini-grids (design, installation, maintenance, contracting) and a checklist of
good practices.
Some mini-grids can be rather small both in terms of power capacity and number of customers; they
are commonly called Micro-Grids, as defined in table 1. Micro-grids usually target small community
of users and have a strong local involvement. This approach is justified only if settlement is dense and
far from the grid to justify the higher price of limited service. The box below provides 3 examples of
micro-grid projects.
22

Final Report – Support Study on Green Mini-Grid Development
Mali – Uganda: A project called Shared Solar3 (headed by Professor Vijay Modi of Columbia University) has
brought cheap electricity to about 20 isolated and poor villages in Uganda and Mali (2012). Shared Solar uses
solar panels hooked to micro electric grids of 20 families or fewer. The grids are managed by smart meters
that users pay via their cell phones. Those smart devices include remote control and allow metering each
consumer in real-time every hour and allow for pre-payment or for time-of-day pricing. The storage needed
for demand and supply management can also be optimised.
Modi said there were two keys to the success of Shared Solar. Pay-as-you-go amounts as little as 50 cents and
gives poor people flexibility in purchases. And the metering technology has helped keep costs low. Modi said
he’s developing Shared Solar systems for parts of Haiti and other countries. Tanzania - Micro hybrid system
In 2008 a PV-diesel hybrid system was installed at Ihushi Development Centre (IDC), near Mwanza, Tanzania.
Earlier, several small PV-systems were used and a diesel generator was needed in a carpentry workshop. As
many of the already available components were used to form the central micro-grid, and additional required
equipment was purchased.
IDC is a community based organization running several projects in the village and a vocational training centre
for sewing, carpentry and masonry. At the centre, there are classrooms, a carpentry workshop, a preschool, a
business centre where computers can be used and courses are held, a meeting hall that can be rented for
large meetings and special occasions, a guest house, two offices and a kitchen. The hybrid system supplies power for lighting, computers, a
copy machine, a TV, a refrigerator, the charging of mobile phones for
the villagers, and occasionally hand tools for carpentry, an electric iron
or electric sewing machines.
The supply side of the hybrid system includes a 655 Wp PV array, using two different types of modules, and a 12 kW diesel generator. The three phase diesel generator is mainly powering machines in a carpentry work shop, and one phase is
connected to the PV system making it a hybrid system. A battery bank of five 12V 200Ah valve regulated lead
acid batteries form the energy storage. The system has a charge controller with MPP tracking, a bi-directional
inverter with maximum output of 1500 W, and a voltage stabilizer stabilizing the power entering the system
from the generator. The distribution system is divided into AC and DC sections supplying different loads. DC is
used at night for security lighting purposes, while AC power is used mainly at day time. The DC load is stable at
about 50W throughout the night, with a slightly higher power demand in the evening. The energy used in the
DC system amounts to less than 1 kWh/day. The AC load is of more unstable nature, varying over the day as
well as from day to day and from week to week. There is no AC power demand at night. During working hours,
the average AC power demand is around 150W with peaks of around 500W. The total energy consumption is
around 1.5 to 2 kWh per day not including weekends. Economic and financial analysis has been conducted on this project as case study in Chapters 3 and 4.
India: The private company MGP has invested (without subsidies), installed and operates 137 micro-grids in
one area of poor farmers and uses a fee-for-service model ($1.64/month – prepaid weekly). Each system
includes 2 solar panels (120Wp) and 2 batteries to supply 35 households having each 2 lamps (7h/day) and
one mobile charger to compete with traditional kerosene lamps. The payback period ($1200) is 2-3 years only
making the business model attractive. Replication in Asia and Africa is under investigation. However, with such
very small micro or pico-grids, the service provided (less than 5Wp per household in average) is very limited.
http://businesstoday.intoday.in/story/mgp-solar-microgrids/1/186818.html
3 Vijay Modi: Shared Solar power grids brings electricity to isolated African villages
23

Final Report – Support Study on Green Mini-Grid Development
2.2.2 Green Mini-Grids
As defined above in item 1.2, the Green Mini-Grids (GMG) can be distinguished from fossil fuel-based
mini-grids by the use of renewable energy carriers (hydro, biomass, wind, solar) to generate and
supply electricity to the distribution network.
The generator is often a hybrid system, mixing different sources of power from renewables, battery
and diesel to compensate the fluctuation. The most common hybrid system is the solar PV generator
mixed with a diesel genset and a battery. Optimised hybrid design attempts to reduce as far as
possible the use of batteries or fuel consumption.
An emerging application is the ‘hybridisation’ or the conversion of existing fossil fuel-based
generating units to more environmental-friendly solutions, i.e. substituting part of fuel consumption
by renewable energy production. Several Sahelian countries as Mali and Mauritania have shown a
keen interest to hybridise with solar PV their existing costly diesel power plants.
The distribution network in a mini-grid is described below (Cf. item 2.2.4).
2.2.3 Energy Storage
Energy storage in the green mini-grids using renewable energy is a critical issue to ensure reliability
and it should be analysed for each technology (see table below). The storage can be relatively simple
and cheap if it consists of storing feedstock or raw materials as fuel, water or biomass but it becomes
much more complex and expensive if the produced electricity has to be stored (chemical batteries or
other alternatives). Among various electricity storage systems, the cheapest remains the lead acid
batteries ($150-200/kWh capacity) adding usually more than 50% to the PV system cost. Other
alternatives (lithium-ion, Redox flow, sodium-sulphur) will be analysed in Chapter 7 of this support
study. The overall storage cost over the battery’s lifetime (or levelised cost of electricity LCOE) range
is usually between $0.20 and $0.50/kWh, which doubles the LCOE of solar electricity.
Table 3: Reliability of GMG
Type Reliability issue Possible solutions
Diesel Fuel supply in remote area can be Fuel tank storage or bio-fuel locally Genset problematic (variable road status) produced
Hydro Hydro resource availability is erratic and dry Water tank storage or other storage season can be problematic Back-up generator (fuel, renewable)
Gasifier Biomass storage and quality is a key issue to Large storage or multi-waste gasifier ensure power production all the year round Back-up generator (fuel, renewable)
Wind Erratic wind fluctuations during day & night Back-up generator (fuel, renewable) Energy storage
Solar PV No solar energy during the night and erratic Back-up generator (fuel, renewable) solar fluctuations during the day Energy storage
2.2.4 Distribution Network (DN)
The power distribution network in the mini-grid is also a critical part with various possible layouts
and different electrical characteristics, highly site specific (village size, population density, load
characteristics, etc):
24

Final Report – Support Study on Green Mini-Grid Development
- Secondary lines or low voltage (LV) lines usually around 230V in single phase or 400V in three
phase systems are used to supply customers typically not farer than 1km from the power
plant to limit the voltage drops and cable size. Indicative LV line cost (without users’
connections) ranges from $5,000 to $8,000/km but can be lower or higher depending on geo-
topographical constraints and technology used (poles, cables, accessories, etc.)
- Primary line or medium voltage (MV) lines can be required when the mini-grid provides
power to remote customers or to several settlement clusters or villages located at several
tens of km from the power house. The voltage is usually ranging between 11kV and 33kV.
One step-up at power plant and several step-down transformers are required to deliver LV
power to customers at different locations. These MV lines including transformers and specific
protections are significantly adding to the distribution costs and can be justified only if the
load is high enough. Indicative MV line cost ranges from $13,000 to $15,000/km but can also
considerably vary as the LV line cost above. “Single Wire Earth Return” (SWER) used for
instance in Cameroon, is a cheaper alternative to transport MV electricity through one single
aerial cable but doesn’t allow tri-phase applications for income generating activities (as
motors).
Various technologies of various quality and lifetime can be considered for the distribution network,
from bamboo poles with bare iron conductors to concrete or metallic poles with ABC cables, varying
the levelised cost of electricity from $0.05 to $0.15/kWh (IRENA cost study 2012). In India, the typical
cost of low-voltage distribution line is about $3000 per km for the plains and it increases by 10–25%
for remote, hilly regions (Bhattacharyya, 2013).
Investment for simplified LV distribution network can be in average of about 10-20% of the total solar PV mini-grid investment but can rise above 50% with other configurations and standards.
There are several African countries (as Cameroon) having adopted simplified standards for rural electrification reducing equipment costs but keeping safety and performances at an acceptable level.
Upgradability of the mini-grids is primordial and they should be able to meet the rising demand, to
aggregate together or to be later connected to the main grid. The isolated distribution network
should be initially designed for easy connection following national standards and at low extra cost.
However the MG plant connection requires synchronisation devices having significant costs -
depending on sophistication level - that can hardly be justified for small capacity MGs (< 50kW).
Lower cost synchronisation systems can lead to reliability issues (faults and damages of equipments).
Therefore, redeploying the valuable assets of the small MG plants to new non-electrified sites should
be considered. If the MG plant connection is technically & economically feasible, the tariff should still
be established with the distributor.
As an illustrative example, the 80kW rice-husk gasifier project in Charchuk (IED-Cambodia), initially
conceived for single village electrification, has been unexpectedly caught up by the grid. Expensive
synchronisation unit has been added to inject and to sell at negotiated tariff the biomass electricity
production into the grid 24h/day at fixed load. The payback time has been strongly affected (see also
example in item 2.3.2.4).
A valuable low-cost mini-grid electrification “Mini-Grid Design Manual” was edited by the ESMAP-WB in 2000.
25

Final Report – Support Study on Green Mini-Grid Development
2.3 Range of Renewable Generation Technologies 2.3.1 Hydropower Hydropower is the most popular and the oldest renewable energy source used to produce electricity
for rural grids. Abundant and old experiences exist in several developing countries. Typical capacity
range from few kW (micro-hydro) to few MW (small-hydro), depending on various factors as
hydrology, load demand, geographical constraints.
The infrastructure and civil works can be rather complex and costly depending on the water
collection system (pond, weir, channel, forebay, penstock). The powerhouse is pretty standard
hosting one or more turbines, alternators and control system.
The technology is quite simple and well mature, allowing local repairing, etc. There are several
examples of local manufacturing or assembling companies in Africa dealing with cross-flow or pelton
turbines for rural applications.
Investment costs for micro or mini hydro plant are generally claimed to be low but they are often higher than expected, as they are extremely variable and site-specific. Moreover the long
preparation time (studies, ESIA4, permits) and the long lead times are other hurdles.
Hydro plants can be commercially attractive if the output of the least-cost design can be sold.
However this output often exceeds the local demand that could be supplied by a mini-grid. In such
cases, the connection to main grid is therefore required. (Cf. further examples of Cameroon (RUMPI)
and Tanzania (Mwenga-Rift Valley Energy)).
Given the seasonal water flow variations, the actual operating hours of a run-off-the-river
hydropower plant will depend on the site and can vary from 3000 to 8000 hours a year. This can
considerably influence the flexibility and the supply-demand matching in off-grid systems.
Furthermore a low utilisation ratio will affect the cost effectiveness of the generating system. A
minimum water storage capacity will attenuate hourly or daily fluctuations. Costly backup gensets or
chemical batteries could be required to ensure continuous service but rising up the running costs.
Uganda’s rural electrification sector has just received a US$17.6 million boost from the Dutch ORIO
Infrastructure Fund5 for feasibility studies bolstering efforts to increase access to electricity in the rural areas
from 1% to over 10% through the use of renewable energy solutions such as small hydros, solar and biogas.
Some of those studies should lead to the construction of 10 mini-hydro stations around the country for rural
electrification.
Energy minister is set to launch the project, commencing with an 18 month feasibility study of sites around the
country costing US$1.2 million followed by a US$32 million construction phase. The ten mini hydro sites will
be handed over to private concessionaires after construction.
The studies will commence in February 2013 and are scheduled to last 18 months. They will be
undertaken by Royal Haskoning, an international engineering and consulting company.
The Uganda Energy Credit Capitalisation Company (UECCC) will manage the transaction and funding
4 Environmental & social impact assessment study
5 New Vision newspaper report http://www.newvision.co.ug/news/639125-rural-electrification-gets-sh46b.html
26

Final Report – Support Study on Green Mini-Grid Development
of mini hydro power stations of up to 1.5 MW each.
After the development phase, ORIO will have to reconfirm its matching support of 50% to the
implementation/ construction phase of the 10 mini hydro power stations. Upon completion, up to 347,000
households and about 800 small and medium-size enterprises shall be connected to the grid.
The addition of over 10MW from this project will supplement on-going efforts to produce some 71.8 MW from
Kakira (12 MW), Kikagati (10 MW), Bugoye (13 MW), Mpanga (18 MW), Ishasha (6.0 MW), Buseruka (9.0 MW),
Nyagak (3.5MW) and Kisiizi (0.3MW).
Tanzania: Mwenga Hydro Limited (MHL), an affiliate of Rift Valley Energy, has installed the 3.5-MW Mwenga
hydro plant. Construction started mid 2010, power production in September 2012. The average annual
production is estimated at about 24 GWh. Production is expected to be almost year round. The bulk of the
production (about 80%) will be sold to TANESCO under the feed-in tariff scheme. The plant is connected by an
83.7 km long 33-kV line to TANESCO’s main grid. The line was constructed by MHL. About 2.8 GWh will be sold
to Mufindi Tea Company Ltd., an affiliate of Rift Valley Corporation. Before, the tea producer had been
supplied by TANESCO but frequent supply interruptions required the company to use its own generators for
power supply. About 2.4 GWh is planned to be sold for rural power supply. The construction of a distribution
network, consisting of 28.5 km of 400V lines, was still ongoing at the time of this writing (August 2013). The
network will serve customers in surrounding villages. In July 2013, MHL had received over 1,000 applications
for connection and about 600 customers were already connected. MHL expects to serve almost 3,000
customers in the villages, which will be connected to the plant. 2.3.2 Biomass The use of biomass products or wastes to produce electricity for rural settlements is an attractive
alternative as the resource can be much cheaper than using fossil fuels. There are mainly 4 distinct
technologies currently existing to produce electricity: biofuel & bio-digester, co-generation, and
gasifier. 2.3.2.1 Biofuels
The biofuels arouse interest not only for transport sector but also for rural electrification to replace diesel gensets used for mini-grids.
Biofuels6 are made by a conversion of non-fossil biomass (living organisms mainly from plants or
plant-derived materials but also from animal manure) to convenient energy in solid, liquid, or gas form. They include bio-ethanol, biodiesel, vegetable oils, biogas, etc.
In Mali7, the potential for jatropha is of particular interest as the country is not an oil producing country and is
land-locked. Several initiatives, using jatropha oil as fuel are being implemented by various actors in Mali for
rural electrification and by the transport sector. But this is at its infancy and the contribution to the national
energy supply is very low.
The national objective of the national biofuel strategy (2007) is to replace 20% of diesel oil consumption with
biofuel by 2022. Jatropha oil and ethanol have been identified as the most promising sources for biofuel
production in Mali. To reach this target, 448,000 tons of seeds should be produced in 2022 requiring a
6 http://en.wikipedia.org/wiki/Biofuel#Vegetable_oil
7 http://www.globalbiopact.eu/images/stories/case-studies/mali_case-study.pdf
27

Final Report – Support Study on Green Mini-Grid Development
plantation surface of 47,787 hectares.
Biodiesel could create a sizable market for itself due to the fact that it can be used in most diesel engines with
just some very minor engine changes. This means the potential market is very large. But there may also be an
increased risk that the biodiesel is exported instead of being used for the local needs and the local
development in Mali.
In order to facilitate the implementation of this strategy and the elaboration of legislative rules, the National Agency for Biofuel Development (ANADEB) was established in 2009.
One key rural electrification project is running successfully in Mali: Mali-Folkecenter Nyetaa (MFC) has a more
low-tech grassroots approach based on the use of pure jatropha oil in converted diesel gensets to produce
power for rural electrification. MFC is currently working in eleven villages to set up these systems. Garalo
Bagani Yelen was the pilot project in which the organisational model was developed. This model has been
expanded into the 10-villages project called “Bagani Courant 10”. The key to the approach is that in typical
rural diesel electrification projects, 50-75% of operating costs are for fuel. This cash leaves the village and the
country to pay for diesel imports. In MFC’s work the fuel costs are re-injected into the local community to pay
for jatropha oil and jatropha seeds and thus the electrification increases people’s revenues. Combined with
the support for new income generating activities it becomes an engine to kick-start local economic
development.
2.3.2.2 Bio-digesters In many African countries, crop waste of maize and sorghum can be used as feedstock to generate
biogas (the grain itself being used as food) with a commercially proven anaerobic-digestion
technology. The produced gas is then used either for domestic lighting and cooking or electricity use.
At an industrial scale, it can be used for both anaerobic digestion for gas or electricity, and the
residues from that process make excellent charcoal briquettes. It’s also noteworthy that biogas can
provide dispatchable electricity; gas storage over a daily cycle is both simple and cheap, and gas
engines can follow loads effectively. This makes biogas an excellent complement to either wind or
solar power, although it is rarely used as such.
However, biogas also has potential drawbacks. Crop residues have low biodegradability, low biogas
yield and a long digestion time due to the high content of lignocellulose in crop straw. Feedstock is
difficult to handle due to its features of intertwining, difficulty in loading in and discharge, low
bulking density, inflation in water, and non-uniformity. Potential solutions include pre-treatment to
improve biodegradability, optimizing the digester to adapt to the special material properties,
meeting the biological requirements, and optimizing operational parameters to achieve the best
performance. Year-round production may not be possible if feedstock availability is seasonal with
only one crop harvested annually since storing low-density crop waste over many months is unviable.
(Source: SREP IP Tanzania, 2013)
For biogas technology, GIZ has put similar effort of local capacity building in Kenya as there are many potential agro-industries able to produce power.
28

Final Report – Support Study on Green Mini-Grid Development
2.3.2.3 Cogeneration The cogeneration becomes (again) more and more popular for isolated agro-industries to self-generate their electricity in context where national grids suffer to extend.
The CHP co-generation (heat and power) is a long proven technology with a lower CAPEX ($1000 to
$2000/kVA) than hydro (but larger OPEX), which has been developed by a certain number of agro-
industries (sugar, timber) using conventional steam turbine systems with boilers and a variety of fuels
or wastes. Electricity is used first for the self-consumption and then, if excess power is available, for
employees’ supply (often free of charge). Payback time is usually under 5 years and technology risk is
low. As they own the power system, there is no off-take risk.
However, getting them to sell their extra power to the grid or to surround rural settlements is
another issue. Injection of excess power to the grid could be attractive if there is little extra
investment and good PPA as experienced in India, Thailand, and Brazil. But getting an agro-industry
to invest in rural distribution and to have a commercial activity to sell electricity is nearly unheard of.
They would perhaps sell to a rural distributor (off-taker) or act as an off-taker if there is no off-take
risk and no hassle.
Thus there is a potential to have rural electrification with co-generation-based mini-grids around
some specific agro-industries, and there are several African countries such as Tanzania, Kenya,
Uganda, and Cameroon that have significant technology awareness and knowledge. But there is not
much experience with specific steam-generation MG projects, probably because small-scale boilers
and steam turbines (200kW to 1MW) are not easy to find, at least in Africa. There is however some
cottage enterprises as Tinytech in India, which manufactures very small steam power plants in the
range 1-10kVA. Typically an 18HP/10kVA plant will cost $9000 (www.tinytechindia.com). 2.3.2.4 Gasification The gasification of solid waste offers several advantages to produce cheap electricity compared to
bio-digesters. In this study, more focus is given on the gasification technology. India and China are
the most advanced in this technology development.
Biomass gasification is a nearly proven technology used in agro-industry to valorise their waste. In
India and Cambodia, there are many examples of large use of gasifier by rural industry for their self-
consumption (rice millers, berries for silk worms). The technology has been fine-tuned over the years
and has reasonable CAPEX ($1300 to $3000/kW). Some of those self-generating agro-industries
supply their excess power for free to their employees.
The use of a biomass gasifier specifically dedicated to pure rural electrification (without anchor
customer) and thus to mini-grids is a new challenge and the technology for such application is less
proven. Without gas storage, managing variable load 24h/d is a big challenge if diesel gensets are to
be avoided.
Despite cheap feedstock and low production cost, many other problems have been reported with
existing plants. Collection & storage of biomass is also a challenging task (often underestimated).
There are serious maintenance & environmental concerns linked to water and by-products disposal
(bio-char, sludge, tar).
29

Final Report – Support Study on Green Mini-Grid Development
Small-scale biomass gasifiers are labour and technically demanding. Local technical, financial and
managerial skills are a prerequisite for such gasifier-based technology which relies on thousands of
mechanical parts (fans, pumps, compressors, pistons, valves). Effective managing leadership and
capacity building require long and significant investment; those conditions are met in India and
Cambodia.
Two key examples of recent development are given in the box below. But such investments can take
place once there is local capacity and potential for local replication to reach critical mass (with
respect to biomass availability).
India: Husk Power System (HPS) company (Bihar) has installed more than 80 ‘mini power plants’ (25 to 100
kW) based on low-cost gasification of agricultural residue (rice husk, mustard stems, corn cobs, certain grasses
etc) ; it generates electricity 6-10h/day using 100% producer gas based system (“single fuel mode”). Waste
products as char are recycled locally. The company then distributes electricity directly to households and small
businesses in villages and hamlets within a radius of 1.5 kilometres, depending on size and population. Costs
are kept low by running insulated wires along bamboo poles and using low cost transformers. Electricity is
delivered on a pay-for-use basis (customised pre-paid meter) for up to 4,000 inhabitants.
Total Landed Cost of Installation is claimed (by HPC) to be below $1,300 per kW (including equipment cost,
basic construction and cost of wiring a small village). This investment cost may vary based on country but is
rather low given special design and local manufacturing. No detail is given on quality (lifetime), safety and
environmental issues. The plant is operated by trained villagers. Operational Cost (including amortization,
overhead of husk procurement team and cluster manager, wages, maintenance) is usually below $0.15/kWh.
Consumers pre-pay a fixed monthly fee ranging from US$2 - $3 to light up two fluorescent lamps and one
mobile charging station.
Cambodia: A local subsidiary of IED-France, CCDE, has invested with UNIDO support and installed in 2012 a
150kW rice husk gasifier (supplied by Ankur – an Indian manufacturer) for Charchuk village, to replace an
existing mini diesel power plant and to upgrade service quality (higher standards, higher power availability and
quality, lower tariffs, increased customers). The gasifier is operated by CCDE. The production is sold to a
private rural electrification enterprise, REE. The company manages the distribution network, which supplies
about 1,000 customers. The initial feasibility study estimated the investment cost at about 3,400 $/kW,
including some preparatory costs (engineering studies) and network extension costs for REE. The actual costs
were slightly higher, reaching 3,625 $/kW. A rough breakdown of the costs is as follows:
Gasifier cost, including gas cleaning equipment, two sets of filters, grid connection, civil works,
feedstock storage warehouse, monitoring equipment, etc.: about $2,900 per kW of installed gasifier
capacity. Diesel back-up capacity: $300 per kW of installed gasifier capacity. Network cost about $200 per kW of installed gasifier capacity. Preparatory cost about $200 per kW of installed gasifier capacity.
After one year of operation, costs are under control and allow REE charging a significantly lower tariff
compared to previous diesel-supply ($0.44/kWh instead of $0.93). Moreover, power quality and services have
improved. However, the tariff remains very high compared to the national tariff and subsidies are needed to
make power supply affordable for the rural population. Unexpectedly, the main grid will reach the village soon
and the gasifier production will soon be fed into the main grid, necessitating expensive investments in
synchronization equipment. Replication of this project is under investigation in two Cambodian villages. (IED)
30

Final Report – Support Study on Green Mini-Grid Development
2.3.3 Solar or Wind Hybrids Solar or Wind energy rarely appears as a single-source of energy for mini-grids given their
intermittences and unpredictable fluctuations. Battery storage can solve availability problems of
renewable sources but their economical & environmental impacts become the main barrier for
solar/wind mini-grids. (Cf. Chapters 5 & 7). The next figures illustrate a PV-Diesel hybrid system with
battery for rural electrification and how the load demand can be managed with genset and battery
[PVPS T9, 2013].
Figure 3: Schematic View of a PV / Diesel Hybrid System (PVPS, 2013) There are mainly 4 configurations of solar PV generators used to supply MG:
PV-only with battery: traditionally, solar power plants for mini-grids were designed at high cost
with oversized PV modules and oversized batteries (examples given below in India and the
Philippines). However this has recently changed, these solutions were often more expensive than
traditional diesel-generator supply and mainly attractive for infrastructure facilities (hospitals,
schools) as stand-alone systems, and not as power source for mini-grids. The high upfront cost
was perceived as a barrier against diesel-based gensets. Today a backup diesel genset is common
to avoid the over-sizing of the battery and provide a more flexible service to customers without
excessive additional cost.
PV – Diesel hybrid with battery: hybrid systems are quite complex to design, to install and to
operate than above PV-only systems. The optimised design should minimise the size of the
battery (to compensate day-time fluctuations of PV output) and the fuel consumption (evening
operation). The challenge is to maximize the share of renewable generation to the total energy
mix (also called ‘penetration rate’) to reduce the burden of the fuel price. These hybrid solutions
with batteries are still an expensive solution when considering the replacements over the
lifecycle.
PV – Diesel hybrid without battery: direct PV injection in a diesel-based mini-grid without
battery is emerging now but has to be limited to about 30% of the load peak power during
daytime to avoid affecting genset operation. Consequently, fuel savings & benefits are very
limited. Research is on-going to design systems allowing higher PV penetration without batteries
and without affecting diesel genset performances. They could soon become commercially viable.
31

Final Report – Support Study on Green Mini-Grid Development
PV-only without battery: would allow much lower costs but can only be used if another storage system is available as water tank for water pumping. Not applicable for rural electrification.
Similar configurations can be analysed with wind turbines, instead of solar PV, with/without battery
and with/without genset. The unpredictability of the wind reinforces the need for storage and
increases the system cost. The wind-diesel hybrid systems are apparently more technically
demanding. Such a system has been installed in Mali (Nara) but has never worked.
Another configuration for MG is the Solar – Wind – Diesel hybrid system, which can be designed in
some specific case when solar radiation is well complementary with wind speeds. Larger fuel savings
should balance the higher investment cost. The design and the operation become more complex by
increasing the number of sources. An example of hybrid (hydro + wind + solar + battery) in Scotland is
given in the box below.
The recent emergence of hybrid systems in GMGs is also linked to the emergence of innovative
technologies, which allow better energy production, storage & load management (as described in
Chapter 7).
India: 9 solar PV mini-grids have been implemented by WBREDA in Sunderbans since 1996 (total 345kWp for
1750 customers) for 2 million US$ with subsidies from MNES. The largest was 110kWp for 750 consumers.
Tariff for one connection (=100W) is around 2.5$ for 18-20kWh per month. It is estimated that each 100 kWp
mini-grid has the potential of saving about 180 tons of CO2 emissions annually.
A mix of public and community financing and public-private local community partnerships, with rural bank and
cooperative, has enabled 15 years of mini-grid operation and has provided inspiration for similar projects
elsewhere. Project management and demand forecast (increasing connections and consumption) were critical
issues. No indication if the Sunderbans PV systems are still operating.
Philippines: a solar mini-grid of 45 kWp was implemented in 1998 under a Belgian government financing to
supply power (85kWh/day) to the rural population of Pangan-An island (287 households). 15 years later, the
large lead-acid battery has come to its end after providing satisfactory service to the inhabitants for more than
10 years.
Using backup diesel genset for occasional use could have reduced the high initial investment cost. The
“hybridisation” with a backup genset and a smaller new battery would be the cheapest solution for
rehabilitation (see also Chapter 5 - item 1.4.5 for inappropriate tariff and lack of finance to replace the
battery).
In Mali, the 72 kWp hybrid power plant of Kimprana was jointly developed with the Dutch Cooperation. The
energy service company SSD Yeelen Kura currently operates it. It serves 217 households (approximately 3,000
people). The investment cost of the solar component (excluding gensets and local grid) was 328 M FCFA,
brought by SSD / FRES / Dutch Cooperation.
The PV field totals 72 kWp. The specificity of this plant is that it is subdivided into two sub-arrays with distinct
roles and different regulators: a first sub-array (34.5 kWp) is connected to 6 inverters SMA Sunny Mini Central
(400V DC) assembled in three phases; a second sub-array of 37.5 kWp is connected to battery bank (48V DC)
via a DC/DC charge controller unit, and a set of 9 bidirectional inverters SMA SI 5048 assembled to create a
three-phase 230V AC supply.
32
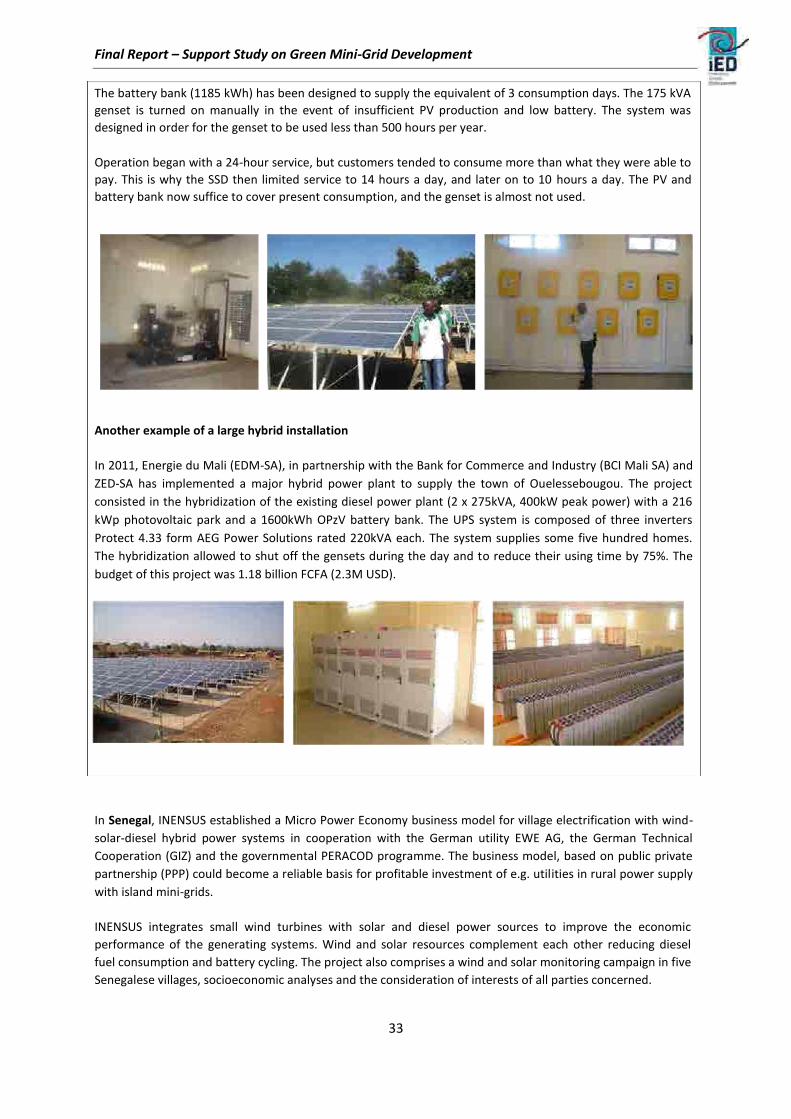
Final Report – Support Study on Green Mini-Grid Development
The battery bank (1185 kWh) has been designed to supply the equivalent of 3 consumption days. The 175 kVA
genset is turned on manually in the event of insufficient PV production and low battery. The system was
designed in order for the genset to be used less than 500 hours per year.
Operation began with a 24-hour service, but customers tended to consume more than what they were able to
pay. This is why the SSD then limited service to 14 hours a day, and later on to 10 hours a day. The PV and
battery bank now suffice to cover present consumption, and the genset is almost not used. Another example of a large hybrid installation
In 2011, Energie du Mali (EDM-SA), in partnership with the Bank for Commerce and Industry (BCI Mali SA) and
ZED-SA has implemented a major hybrid power plant to supply the town of Ouelessebougou. The project
consisted in the hybridization of the existing diesel power plant (2 x 275kVA, 400kW peak power) with a 216
kWp photovoltaic park and a 1600kWh OPzV battery bank. The UPS system is composed of three inverters
Protect 4.33 form AEG Power Solutions rated 220kVA each. The system supplies some five hundred homes.
The hybridization allowed to shut off the gensets during the day and to reduce their using time by 75%. The
budget of this project was 1.18 billion FCFA (2.3M USD). In Senegal, INENSUS established a Micro Power Economy business model for village electrification with wind-
solar-diesel hybrid power systems in cooperation with the German utility EWE AG, the German Technical
Cooperation (GIZ) and the governmental PERACOD programme. The business model, based on public private
partnership (PPP) could become a reliable basis for profitable investment of e.g. utilities in rural power supply
with island mini-grids.
INENSUS integrates small wind turbines with solar and diesel power sources to improve the economic
performance of the generating systems. Wind and solar resources complement each other reducing diesel
fuel consumption and battery cycling. The project also comprises a wind and solar monitoring campaign in five
Senegalese villages, socioeconomic analyses and the consideration of interests of all parties concerned.
33

Final Report – Support Study on Green Mini-Grid Development
A local private power supplier for rural areas (Inensus West Africa) has been created in 2008 to operate the
hybrid systems and to sell electricity in a mini-concession (min. of 15 Years) to customers (mobile
communication companies, lodges, hotels, guesthouses and farms) and to stimulate productive uses of
electricity.
The first pilot project consists of a hybrid power in Sine Moussa Abdou village (the most windy area near
Thies) to supply electricity to the 900 inhabitants. The system includes 5.2kWp solar / 5kW wind / 11kVA
diesel and 120kWh battery. The diesel genset, used only as a back-up for the days when solar and wind energy
would not have charged the battery enough for evening load. The total investment cost for the hybrid
generator and distribution mini-grid have not been obtained, neither the operating costs.
Main advantages are lower probability of services interruption; lower diesel consumption; lower battery
capacity and cost. Over the next years, INENSUS aims at electrifying one hundred villages in Senegal with this
concept. (More on http://www.inensus.com/)
In Tanzania, in the framework of IREP project, 9 projects in Pwani region have been identified for immediate
PV hybridisation of existing isolated diesel power plants (23 to 265kW). With a diesel price of 1.25$/l, the
levelised costs of electricity produced by the fuel-based power plants were between 0.87 and 0.97 $/kWh. The
study conducted by IED has estimated the levelised costs of solar electricity (produce by PV) at: 46cts/kWh
without energy storage, at 52cts/kWh with energy storage for half production day, at 58cts/kWh with energy
storage for full production day. With 20% penetration rate only, the global LCOE will be slightly lowered.
(More on http://www.irep.rea.go.tz/)
Namibia: The Tsumkwe Energy Project (ACP-EU) has introduced large-scale off-grid solar-diesel hybrid system
(202kWp) to supply stable electricity (24h) to remote rural settlements in Otjozondjupa Region, in
combination with energy efficiency measures and thermal energy, to support and diversify local socio-
economic activity.
A local Tsumkwe Energy Supply Company (TESCo) has been created as IPP to initiate pre-implementation
studies and awareness campaigns, community involvement, site preparation and construction, stabilisation
and repair of existing electricity network and installation of a PV generator. (More details on http://www.tsumkweenergy.org/)
The Scottish Isle of Eigg is still not connected to the power distribution grid located on the mainland 16
kilometers away. The approximately 100 inhabitants have been operating their own stand-alone grid since
2008. They successfully converted their power supply, stepping away from diesel and now generate power
using virtually 100% renewable energy sources. The SMA hybrid off-grid system equipped with an installed
renewable power generation capacity of 166 kilowatts integrates solar PV (32kWp), wind power (24kW),
hydropower (110kW) and a storage battery (212kWh). If this is not sufficient, two diesel generators (64kW
each) are used as a backup. This provides sustainable and economical electrical power around the clock.
Energy costs have dropped more than 60 percent since the conversion - See more at: http://www.sma.de/en/products/references/eigg-island.html#sthash.OoKgOqLp.dpuf
2.4 Data on Costs of Green Mini-Grids
The information presented in this section is indicative and of little help for planning purposes unless
more details are provided. In particular the equipment should be specified, broken down into
components when hybrid systems are considered, and it should be indicated which costs are covered
34

Final Report – Support Study on Green Mini-Grid Development
by the numbers and which costs are not (are transportation and installation costs included? are some
costs subsidized? etc.). The sources from which the numbers have been taken provide some of that
information although they also fall short of providing all information. The fact that GMG costs are
highly site specific prevents the preparation of a catalogue where reference costs for a planned
project can be found. The costs presented here give an idea of the order of magnitude. 2.4.1 Current costs of GMG components
The investment costs of GMGs depend on numerous factors (demand, resource availability, site
conditions, taxes, technical standards, etc.). As a consequence, they vary dramatically. The table at
the end of this paragraph gives an impression of the high degree of variation.
The ‘IED reference costs’ shown in the table below reflect the cost range, which IED considers as the
range into which the costs normally fall at present. The costs do not always apply which is
demonstrated by one of the examples presented in this report: the 500-kW ENNy hydro plant in
Rwanda had a power plant cost of about $5,600/kW.
Table 4: IED Reference Costs for Green Mini-Grids (GMG)
Technology -based Size range Power plant LCOE Operating time MG (kW) CAPEX ($/kW) ($/kWh) (h/yr)
Diesel genset 5 – 300 500 – 1500 0.3 – 0.6 Any
Hydro 10 – 1000 2000 – 5000 0.1 – 0.3 3000 – 8000
Biomass-gasifier 50 – 150 2000 – 3000 0.1 – 0.3 3000 – 6000
Wind hybrid 1 – 100 2000 – 6000 0.2 – 0.4 2000 – 2500
Solar hybrid 1 – 150 5000 – 10000 0.4 – 0.6 1000 – 2000
GMG 0.25 – 1
LV distribution 400V $5,000 – 8,000 A rough estimate of the required
/km length is 30 customers per km.
Connection costs $350 per customer.
MV distribution 33kV 13,000 - 15,000 $/km
IRENA conducted a quite comprehensive study on the costs of renewable energy technologies. The main results are presented in the box below. IRENA Renewable Cost Database
IRENA has developed a worldwide Renewable Cost Database based on the data of about 8,000 projects (proposed and implemented projects), covering grid and off-grid projects in various countries.
IRENA analysed and compared three parameters: (i) investment/capital cost, (ii) levelised cost of electricity generation (LCOE) and (iii) capacity factor. Important findings of the study are:
The levelised cost of generated electricity (LCOE) has been declining for wind, solar PV and some
biomass technologies. The rapid deployment of renewable technologies has produced a virtuous circle leading to significant
35

Final Report – Support Study on Green Mini-Grid Development
cost reductions.
Hydropower and geothermal electricity produced at good sites are still the cheapest technologies to
generate electricity.
The cost hierarchy (hydro>geothermal>biomass>wind>solar) tends to follow an inverse relationship to resource availability.
Where oil-fired generation is the predominant power generation source (e.g. on islands, off-grid and
in some countries), a renewable solution almost always exists which would produce at lower cost.
As the cost of renewable power drops, the scope of economically viable applications will increase even further.
Very often, renewable technologies are now the most economic solution for off-grid electrification
and for centralised grid supply in locations with good resources.
Different renewable power generation technologies can be combined in mini-grids. The
complementary nature of different renewable options could stabilize power supply and nevertheless
be less costly than diesel-fired generation. China has some of the most competitive renewable costs in the world, followed by India. Costs are site-specific. There is no single “best” renewable power generation technology.
The table below summarizes the instructive ‘generating cost ranges by technology’ found by IRENA. As costs are highly site-specific, the cost ranges are wide.
Table 5: Generating Cost Ranges by Technology (IRENA)
Technology Invest. Cost ($/kW) LCOE ($/kWh) LCOE ($/kWh) LCOE ($/kWh) Capacity World Africa Islands Factor
Diesel genset 0.35 – 0.50 0.35 – 0.53
Hydro small <1000 - 4500 0.03 – 0.13 0.03 – 0.09 0.05 – 0.3 0.3 – 0.8 Biomass gasifier 2100 - 5700 0.03 – 0.24 0.02 – 1.8 0.16 – 0.22 0.1 – 0.9 Biomass digester 2600 - 6100
Wind small 900 – 2200 0.16 – 0.40 0.05 – 1.6 0.14 – 0.5 0.29 – 0.35 Solar off-grid? 1700 – 4200 0.20 – 0.45 ? 1.0 – 1.7 0.13 – 0.25 Distribution 0.05 – 0.15
The data for off-grid solar PV systems are predominantly based on aid projects. The potential for cost
reductions from large-scale deployment, for instance by pooling projects across countries, is significant and
could reduce the LCOE of off-grid solar systems with battery storage to USD 0.50 and USD 0.85/kWh.
Source: IRENA, Renewable Power Generation Costs in 2012: An Overview, 2013. http://www.irena.org/menu/index.aspx?mnu=Subcat&PriMenuID=36&CatID=141&SubcatID=277 2.4.2 Cost Projections of RET
Cost projections for small-scale renewable power systems such as green mini-grids are rare.
Projections mainly cover large-scale RET. That also applies to the projections shown in this
paragraph, which presents the projection made in IRENA’s report (IRENA, 2013) and in a report of the Melbourne Energy Institute (Hearps, 2011).
The LCOE projections made in the IRENA report on “Renewable Power Generation Costs in 2012” are
shown in the figure below. The technologies with the largest cost reduction potential are CSP, solar
PV and wind. Hydropower and most biomass combustion technologies are expected to have only a
small cost reduction potential.
36

Final Report – Support Study on Green Mini-Grid Development
Hydropower
No decline in hydropower capital costs or LCOE is expected until 2020. Cost variations would be due to commodity price variations and general civil engineering costs. Biomass
Most biomass combustion technologies are mature, although the projected growth in the market will allow modest capital cost reductions of between 10% and 15% by 2020.
The cost reduction potential for gasification technologies, excluding anaerobic digestion, is higher and, if deployment accelerates, capital cost reductions of 10% to 20% might be possible by 2020.
Biomass technologies will not see the lower range for their LCOE shift significantly by 2020, given that today’s cheapest options rely on very cheap or even zero-cost feedstock supply.
For less mature technologies such as gasification, capital cost reductions are expected to drive down the upper end of the LCOE range. Solar
Solar PV module costs have declined so rapidly in recent years that international market prices are
now significantly below the learning curve. Price reductions have therefore, to some extent, been
brought forward and we are likely to see slower price reductions in the period to 2020 than in the
past five years. By 2020, Chinese c-Si modules could be sold for between $0.4 and $0.5/W. Balance of
system costs (BoS includes all other components such as inverter, charge control, etc.) is becoming
the crucial determinant of the LCOE of solar PV. BoS costs will determine as much as 80% of the cost
reduction potential for solar PV. The typical LCOE range for solar PV will decline from between $0.12-
$0.36/kWh in 2012 to between $0.09-$0.30/kWh in 2020. Wind
By 2020 installation costs for wind farms in the United States and in Europe could fall from currently
about $1,750/kW to between $1,300 and $1,600/kW. The projection assumes that wind turbine
prices stabilise at around $800/kW. This price is still significantly higher than the average prices in
China & India (< $500/kW).
Average capacity factors for new wind farms will continue to rise. But O&M costs for wind turbines will increase and prevent a significant decline of the LCOE.
37

Final Report – Support Study on Green Mini-Grid Development
Figure 4 : LCOE Projection (2012-2020) for Renewable Energy Technologies (IRENA, 2013)
Regarding the costs of distribution networks, specific investment costs are expected not to change
much. The World Bank expects the prices for copper and aluminium to be quite stable over the next
decade despite growing demand in China8. CAPEX reductions could be seen for rural mini-grids if
least-cost options are always installed (SWER in areas with low demand), standards are adapted to
the environment in rural areas and bulk procurement is applied. Smart meters and remote control
could reduce operating costs.
Another technical report published by Melbourne Energy Institute (Hearps, 2011) has compared solar
PV and wind cost projections from different sources (IEA, EPIA/GWEC, EPRI) until 2030. All sources
indicate on-going cost reductions over the next decade and even beyond.
EPIA forecasts a PV LCOE reduction to about $0.12-$0.16/kWh by 2020 and a further decline to
$0.10-$0.12/kWh by 2030. The forecast applies mainly to large-scale grid-connected PV power
plants.
8
2013 - http://siteresources.worldbank.org/INTPROSPECTS/Resources/334934-1304428586133/Price_Forecast.pdf 38

Final Report – Support Study on Green Mini-Grid Development
Figure 5 : LCOE Projection (2010-2030) for Solar PV (Hearps, EPIA, 2011)
GWEC forecasts a slight decline of the LCOE of wind turbines; to about $0.11/kWh by 2020 and below $0.10/kWh by 2030.
Figure 6 : LCOE Projection (2010-2030) for Wind (Hearps, EPIA, 2011)
39

Final Report – Support Study on Green Mini-Grid Development
Table 6: Costs of Green Power Plants
Source / Project Country Technology -based Size range (kW; Power Plant Invest. L MG* batteries in kWh) Cost (€/kW or $/kW)
PUBLIC DISTRIBUTION NETWORK (PDN) IRENA World/Africa/Islands PDN
DIESEL GENSET (DG) ARE (hybrid MG) Diesel 400
IRENA World/Africa/Islands Diesel
Sandwip island Bangladesh Diesel 200
IED – Chambak Cambodia Diesel 58/100/140 653
HYDRO-POWER (Hy) DRC Micro-Hydro
ARE (hybrid MG) Micro-Hydro/Diesel 27/8 1800+400
IRENA World/Africa/Islands Hydro Small <1000 – 4500
Bhattacharyya World Micro-Hydro 5-100 1136 – 5630
BIOMASS Ankur India Gasifier 100 2700 (FOB)
HPS (Bihar) India Gasifier/100%gas 25-100 1300
IED – Charchuk Cambodia Gasifier/2gensets 150 2500
IRENA World/Africa/Islands Gasifier ? 2100 – 5700
Bhattacharyya World Gasifier/100%gas 50-100 1500 – 2880
Bhattacharyya World Biodigester 1900 – 2500
WINDPOWER
REN21 – 2010 Wind/Ba (WHS) 0.1 – 5,0 -
ARE (hybrid MG) Wind/Diesel/Ba 60/18 2100+400+225
ARE (hybrid MG) PV/Wi/DG/Ba 35/20/8 2100+2800+400
IRENA World/Africa/Islands Wind Small 900 – 2200
Sandwip island Bangladesh Wind only 335 1500
Bhattacharyya World Wind/Batteries 1-100 2500 – 6000
40

Final Report – Support Study on Green Mini-Grid Development
Table (continued): Costs of gGreen Power Plants
Source / Project Country Technology -based Size range (kW; Power Plant Invest. L MG* batteries in kWh) Cost (€/kW or $/kW)
SOLAR-POWER (PV) IRENA World/Africa/Islands PV Off-grid? 1700 – 4200
ARE (hybrid MG) PV/Ba 2800+225
REN21 – 2010 PV/Ba (SHS) 0.020 – 0.250 -
Bhattacharyya World PV/Ba 1 – 150 -
ARE (hybrid MG) PV/DG/Ba 60/18 2800+400+225
IED (offre ‘12 Cambodia PV/DG/Ba 70/300+140/600 6835 €/kWc
Sara+Tenesol+CK)
IED (projet GIZ) Senegal PV/DG/Ba 30/40/288 5820 €/kWc
IED (projet GIZ) Senegal PV/DG/Ba 5/5/48 7690 €/kWc
IED (ZED SA) Mali 2010 PV/DG/Ba 216/2x220/1600 8330 €/kWc
IED (SSD Yeelen Kura) Mali Kimparana2008 PV/DG/Ba 72/140/595 7420 €/kWc
IED (SSD Yeelen Kura) Mali Kolondie 2011 PV/DG/Ba 152/200/1670 6860 €/kWc
IED (SSD Yeelen Kura) Mali Ourikela2011 PV/DG/Ba 51/80/700 10238 €/kWc
IED (etude ’12) Madag Ambon PV/DG/Ba 40/40+60/288 7900 $/kWc**
IED (etude ’12) Madag Ambon PV/DG/Ba 55/40+60/288 7200 $/kWc**
IED (etude ’12) Madag Mampi PV/DG/Ba 250/160+200/6050 4960 $/kWc**
IED (TEP vertes) Pacific PV/DG/Ba 17/ ? / ? 19.900 €/kWc
IED (TEP vertes) Pacific PV/DG/Ba 90/ ? / ? 12.400 €/kWc
IED (IPES - AHT) Mauritania PV/DG/Ba 16/44/144 7150 €/kWc
IED (IPES - Male) Mauritania PV/DG/Ba 30/36/216 6416 €/kWc
Sources IRENA, Renewable Power Generation Costs in 2012: An Overview, 2013. http://www.irena.org/menu/index.aspx?mnu=Subcat&PriMe ARE-USAID, Hybrid Mini-Grids for Rural Electrification: Lessons learned, 2012 Subhes Bhattacharyya, Rural Electrification Through Decentralised Off-grid Systems in Developing Countries, Springer 2013 IED: Internal documents. Most data based on site visits.
41

Final Report – Support study on Green Mini-Grid development
3 Potential for MG
3.1 Literature Assessment
Based on literature review, there is a wide consensus to believe that mini-grids will play a significant
role to increase the access to electricity in the less developed countries where conventional grid
extensions are not cost-effective. Fuel-based mini-grids are suffering from fuel price increase and
scarcity, as well as from delivery issue in remote area, giving an opportunity to develop renewable
energies and Green Mini-Grid systems, in particular where grid is not well developed. Especially as
renewable energy technologies have considerably improved and their electricity costs have been
significantly reduced, in particular for solar PV.
The concept of potential for an energy technology is rather theoretical, variable and difficult to
assess. There are basically 3 levels of potential that can be assessed. The Chapter 2 will focus on the
first level “physical potential”.
- The ‘physical potential’ takes into account the basic information as geographic relief,
population density and distribution network
- The ‘technical potential’ takes into account the technology, the energy resource and human
resources
- The ‘feasible potential’ takes into account the politico-socio-economic environment.
According to the IEA’s World Energy Outlook (WEO) 2011, nearly 60% of the population, some 587
million people, lacked access to electricity in Africa in 2009 – almost all of these were in sub-Saharan
Africa. Access to electricity in rural areas in sub-Saharan Africa was 12%. Despite new policies
focusing on improved access, numbers without access are projected to rise to almost 650 million as
population growth outpaces the rate of new connections. The power supply situation in Sub-Saharan
Africa is by far the worst and requires huge investments, as detailed by IEA in the energy access
projection to 20309. Grid extension is the most suitable option for urban zones and for probably
around 30% of rural areas. The remaining remote rural areas could be connected either with mini-
grids or stand-alone off-grid solutions with an assumed potential share of 65% of MG and 35% of SA
(WEO 2012).
On his side, UN-SEFA has pointed out that only 40% of the electricity needs would be met by grid extension (urban and rural) and 42% by mini-grids (mainly in Sub-Saharan Africa and in India).
9
http://www.worldenergyoutlook.org/resources/energydevelopment/energyaccessprojectionsto2030/ 42

Final Report – Support study on Green Mini-Grid development
Figure 7 : Projection of Electricity Generation Share by 2030 (UN-SEFA, 2012)
As another example, ECREEE has published the ECOWAS Renewable Energy Policy (EREP – 2012)
where they estimate that 75% of the population (600 millions in 2030 in ECOWAS region) will be
supplied by the grid in 2030, leaving 104 million of inhabitants to be supplied with mini-grids and 47
millions with stand-alone systems. The next figure gives the estimates per settlements or localities.
96,000 localities (45%) could benefit from mini-grids in ECOWAS countries. Investment of €31 billion
has been estimated for 128,000 mini-grids by 2030.
Figure 8 : Localities Supplied by 2030 by the Grid and Decentralise RE Solutions (ECREE, 2012)
IRENA has published “Prospects for African Power Sector” in 2011 with detailed projections and
technical potential assessment by renewable technology and per country/region. Although the study
doesn’t consider mini-grids in particular, the table below highlights that the highest potential
estimate is for solar (PV & CSP), followed by wind, then biomass and last hydro.
43

Final Report – Support study on Green Mini-Grid development
Table 7: Technical Potentials for Renewable Power Generation (uncertainty +/- 50%) (IRENA, 2011)
According to a series of studies conducted by JRC-EU10
and Rainer Lemoine Institute, the following
charts (Fig. 9) indicate the most economical sources of electricity supply in Africa. The preferred
option is usually the connection to the main grid through extension but the network in Africa is
poorly developed (39% in 2012) and most rural areas are left aside (61%). Therefore mini-grids and
stand-alone systems using diesel (15%), solar (34%) or hydro (12%) have huge potential for the
remaining African population.
Figure 9: Most Economical Source of Energy in Africa (Szobo, JRC-EU, 2012)
The 2 African maps illustrate the increasing share of solar PV from 2010 to 2012 (yellowish area) mainly due to cost reduction of PV technology and fuel price increase.
10
http://publications.jrc.ec.europa.eu/repository/bitstream/111111111/23076/1/reqno_jrc67752_final%20report%20.pdf 44
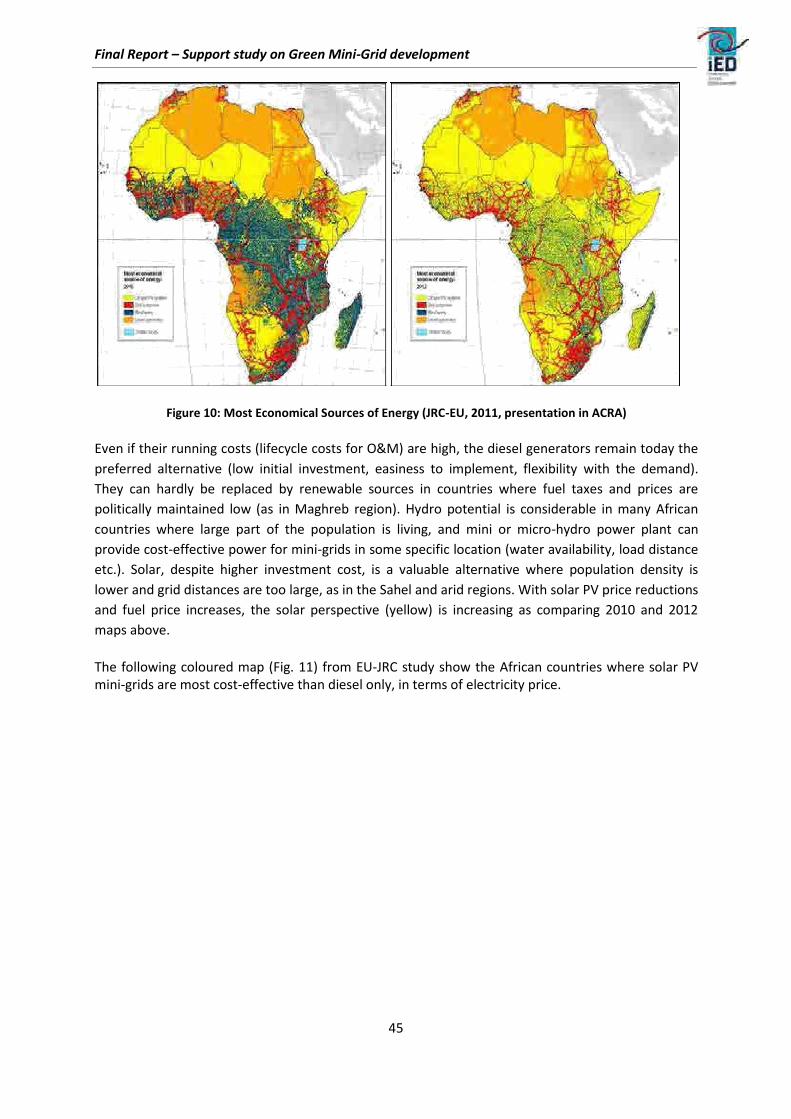
Final Report – Support study on Green Mini-Grid development
Figure 10: Most Economical Sources of Energy (JRC-EU, 2011, presentation in ACRA)
Even if their running costs (lifecycle costs for O&M) are high, the diesel generators remain today the
preferred alternative (low initial investment, easiness to implement, flexibility with the demand).
They can hardly be replaced by renewable sources in countries where fuel taxes and prices are
politically maintained low (as in Maghreb region). Hydro potential is considerable in many African
countries where large part of the population is living, and mini or micro-hydro power plant can
provide cost-effective power for mini-grids in some specific location (water availability, load distance
etc.). Solar, despite higher investment cost, is a valuable alternative where population density is
lower and grid distances are too large, as in the Sahel and arid regions. With solar PV price reductions
and fuel price increases, the solar perspective (yellow) is increasing as comparing 2010 and 2012
maps above.
The following coloured map (Fig. 11) from EU-JRC study show the African countries where solar PV mini-grids are most cost-effective than diesel only, in terms of electricity price.
45

Final Report – Support study on Green Mini-Grid development
Figure 11 : LCOE Comparison of Diesel vs. PV in Africa (JRC-EU, 2011)
The next coloured map from Reiner Lemoine Institute (RLI-Berlin) shows the countries where hybrid mini-grids (solar/diesel) are most cost-effective than diesel only, in terms of payback period (Fig. 12).
Figure 12: Payback Period of Hybrid PV/Diesel in Africa (RLI, Ch. Breyer, 2012)
46

Final Report – Support study on Green Mini-Grid development
As shown by the above maps and tables, the potential of renewable energies varies considerably
from one source to another and from one region/country to another. Even when the estimated
potential is high, renewable resources have different levels of availability in specific area (dispersion)
and different levels of “intermittence”. Those concerns are important for rural electrification sector.
Hydro potential is actually very site-specific and concentrated in specific locations. Biomass power
plants should be close to biomass production areas. Wind and solar are more diffuse resources
although sufficient wind speeds are recorded only on specific spots. Solar energy, although the most
diffuse (low energy per m², low capacity factor), has the widest coverage and can fit more easily with
scattered remote households.
Moreover, for off-grid rural electrification, the intermittent renewable energy supply rarely matches
the village demand characterised by a specific load curve. The next figure illustrates how a
hydropower supply without storage could provide excess energy during daytime and could be
shortfall during evening peak load (see Fig.13). With energy storage or diesel backup, the utilisation
factor of GMG power plant could be significantly improved. The concept of hybrid system (see
further item 3.2.2) has emerged to overcome this critical demand/supply matching issue, but with an
impact on kWh cost.
Figure 13: Typical Load Curves for Rural Electrification
3.2 Country Case Assessment
In the frame of the support study for DFID, IED was requested to present a replicable analytical approach to establishing optimal conditions for mini-grids.
The following Chapter 2 of the support study will present a detailed GIS-based analysis and a
preliminary physical assessment of the Green Mini-Grid potential in seven ICF priority countries:
Kenya, Tanzania, Mozambique, Malawi, Rwanda, Uganda, and Democratic Republic of Congo.
47

Final Report – Support study on Green Mini-Grid development
4 Review of Main MG programmes
4.1 Preamble
This section will highlight that there are many achieved or on-going GMG projects and programmes
worldwide and particularly in Africa. But those donors-led initiatives haven’t been coordinated and
didn’t reach critical mass yet.
The challenge that DFID want to address is to scale-up GMG development and to launch a multi-
donor coordinated implementation programme in some selected priority African countries. Such
programme to support M4P11
for RE would include an important part of investment for
infrastructures to be implemented in a limited period of time (typically 3-5 years). This means that a
certain number of prerequisite steps should have been addressed previously by DFID or other donors
to ensure a favourable environment.
Typically RE project implementation follows 4 major intervention stages where donors can provide support and where effective coordination is needed:
1) Upstream activities: include capacity building, policy framework, master planning, etc.
2) Studies: include all studies from pre-feasibility to detailed studies (technical, social,
economic, financial, environmental)
3) Pilot: include pilot or demonstration projects at limited scale to verify relevance and
sustainability
4) Up-scaling: include large-scale investments to reach critical mass and sustainable
deployment.
The actual situation of donors’ interventions is very country-dependent as donors have specific
activities. Moreover, the support situation in each country and for each donor is changing
continuously with variable focus on those 4 intervention areas. A country-by-country analysis is
needed to identify the critical points where new support (DFID) could intervene to contribute to
GMG scaling up and would gain the biggest impact.
4.2 Existing International MG activities 4.2.1 National & bilateral projects
Today many developing countries are actively promoting green mini-grids (GMG) as the most cost-
effective electrification alternative for given local contexts. Some have launched national
programmes or initiatives either on public or donor funds. Those national or bilateral programmes
are too many to be listed here. A review of mini-grid status is given for DFID/ICF priority countries in
item 5.3 and for some other leading countries in item 5.4.
International donors involved in rural electrification and to some extend in green mini-grids are also numerous. We can mention the following: 11
Making Markets Work for the Poor (M4P) is an approach to poverty reduction that donors such as DFID, Sida and SDC have been supporting over the past few years (cf. DCED website)
48

Final Report – Support study on Green Mini-Grid development
Table 8: List of International Donors involved in RE & GMG12
International organisations UN (UNEP, UNIDO), WB (IDB, IFC, GEF, ESMAP) European bodies EU (EUEI, JRC), KfW/GIZ, Danida, AFD, SIDA, NORAD, DFID, FINIDA, ADA American bodies DOE, USAid Asian & Australian bodies ADB, AusAID African bodies AfDB Donors supporting renewable energies only are not included such as Chinese for hydro power plants, etc.
4.2.2 Multi-country programmes
Beside bilateral aid, there are also wider multi-country programmes launched by international
organisations or donors having a component promoting development of GMG projects in specific
countries, either upgrading existing diesel-based MG or creating new GMG. Such programmes
include pilot or demo infrastructure investments. There is actually no scaling-up programme for
massive GMG development in Africa. The following table provides short descriptions on some main
programmes identified having a focus on GMG infrastructure development. The list is not exhaustive.
Table 9: GMG Developing Programmes
Programme A: Donor Country/Region GMG activities B: Leader
ENDEV A: GER, NED, NOR, 18 countries including 11 Energizing Development Programme (>2004) focussing (1&2) GBR, SUI, AUS … African: Benin, Burkina, on RET, Grid, MG, & SA to provide sustainable access to (On-going) B: GIZ, NLA Burundi, Ethiopia, Ghana, energy to rural people (target: 13.7 million in 18
Kenya, Mali, countries). Activities differ from one country/project to Mozambique, Rwanda, another and cover awareness, capacity building, Senegal, Uganda technical assistance & financing for project design & studies, implementation & monitoring. Cooperation with international programmes (EU, Africa). MG activities are supported in Ethiopia, Mozambique, Rwanda, Senegal, Uganda. http://endev.info
SREP A: DEN, SUI, JPN, 8 pilot countries: Kenya, SREP (Scale-up RE programme) operating under SCF - CIF (On-going) KOR, NED, SWE, Mali, Ethiopia, funds and supporting pilot investments in LICs, initially 6
NOR, ESP, GBR, Nepal, Honduras, pilot countries. Activities include financing, capacity USA, AUS Maldives, Liberia, building and support to government and private sector to B: MDBs (AfDB, Tanzania (new) deploy viable renewable energy solutions. In Kenya, Mali, WBG, IFC, …) Nepal & Tanzania
activities include GMG mini-grids
with renewables (solar, mini/micro hydro, …) https://www.climateinvestmentfunds.org/cif/node/67
GEF-SPWA A: GEF (UNs, WB, West Africa (15 ECOWAS Strategic programme for WA, under GEF, on promoting (On-going) …) + Burundi & Chad) coordination, coherence, & integration of projects aiming
B: UNIDO, ECREEE poverty reduction and biodiversity conservation. 4
national energy priorities: EE efficiency, agro fuel, hydropower,
authorities green mini-grids. 13 GMG projects have been implemented. http://www.thegef.org/gef/strategic-program-west- africa-spwa - http://www.ecreee.org/fr/node/3945
REACT 1&2 A: GBR (DfID), DEN, East Africa (special focus The REACT Window (Renewable Energy and Adaptation (On-going) SWE, FIN, AUT, on Tz & Moz) to Climate Technologies) is a special fund of the AECF
NED (private sector fund) open to business ideas based on renewable energy. The fund aims to catalyse private B: KPMG, DBSA sector investment and innovation in low cost, clean energy and climate change technologies. 21 projects have been approved under REACT 1 (15M$ allocated
12 http://en.wikipedia.org/wiki/List_of_development_aid_agencies
49

Final Report – Support study on Green Mini-Grid development with about half for Tz). http://react.aecfafrica.org/
GTIEA UNEP/AfDB East Africa Greening the tea industries with small hydro plants and (Completed) with rural electrification component. Implementation in
Kenya, Tanzania, Rwanda. Energy EU-ACP Africa The 1
st Energy Facilities has selected 75 energy
Facility infrastructure projects in Africa among which several (On-going) having mini-grids with renewable sources. The second EF
is implementing several other GMG systems. EREF ECREEE, UNIDO ECOWAS Renewable Energy Facility financing investment and (On-going) supporting businesses in periurban / rural areas of
ECOWAS (grants & innovative loans). 1st
call for proposal in June 2011: 41 projects in 15 countries with 1M€ grant.
RE-based UNIDO/ UNEP/ GEF Zambia UNIDO is implementing a GEF/UNEP funded renewable MG energy project in Zambia, which will establish on pilot (On-going) basis three mini-grids powered by 3 renewable energy
sources (solar PV, 1MW biomass and 1MW small hydro) in rural communities
GMG DFID Africa Concept note under preparation for GMG development (Start-up) programme
4.2.3 International networks
With the realization of the potential and development needs for MG in Africa, a number of initiatives
and partnerships have emerged since 2011 to conduct thoughts, studies and to develop strategies,
tools, action plans and support at regional scale.The following table lists some key initiatives or
networks supporting GMG development (without direct infrastructure investment).
Table 10: GMG Supporting Networks Initiatives Actors Country/Region GMG activities
ESMAP WB Worldwide Energy Sector Management Assistance Programme is a (On-going since 1983) multidonor technical assistance trust fund administered
by the World Bank and cosponsored by 13 official bilateral donors. It has already covered a wide range of activities (e.g. MG Design Manual in 2000, China Village Electrification Guide in 2005, REToolkit in 2008). On- going activities include support to SE4All, Off-Grid Electricity Access, Renewable Energy Access (AFREA), as well as Hydro, Solar and Wind mapping (REMAP), etc. https://www.esmap.org/node/274713
REN21 REN 21 / RECP Mini-Grid Policy Toolkit (under preparation) is designed (On-going) / ARE to specifically address the needs for right policy
framework and specific energy regulations, by providing policy-makers with background, tools and recommendations for mini-grid development.
RECP EUEI-PDF Africa Support to national and regional studies & events on (On-going) renewable energies and power sector in Africa (2011-
2013)
SEFA UN-F Worldwide SEFA has created in 2011 an Energy Access Practitioner (On-going) Network to improve business, financing and delivery
models for mini-grids and hybrid MG in a perspective of scaling-up.
E4A ADB A dedicated working group on mini-grids has been (On-going) created by Asian ADB to work on business & financing
schemes, pilot & scale up, capacity building.
CEM4 NREL Developing countries The Clean Energy Ministerial will hold a strategic (On-going) roundtable in Delhi (March 2013) to discuss mini-grids
13
http://web.worldbank.org/external/default/main?menuPK=717354&pagePK=34004168&piPK=34004428&theSitePK=717306 50

Final Report – Support study on Green Mini-Grid development and what can be done to accelerate green mini-grids in developing countries.
PASS UNEP Rural African and Asian Raising the mini-grid issue to provide electricity access (On-going) islands at the Power Africa Strategy Summit (Cape Town 2011).
Commitment to action and priority 3-point plan, signed by 100 participants. Options for commercially viable model of GMG in remote areas.
LCEDN DECC Recent network of experienced stakeholders (~150) (On-going) concerned with energy for development. Promote
multi-tasking and collaborative projects between NGOs, academics and private sector.
PVPS – IEA Worldwide Since 1993, IEA PV Power System (PVPS) programme Task 9 (O) conducts joint research projects in the application of PV Task 11 (C) through 12 tasks: T11 on hybrid & mini-grid systems
and T9 for service deployment in developing countries. Club ER ACP-EU, AFD Africa CLUB-ER activities include building capacity of African (On-going) agencies and structures managerial staff in charge of
electrification and increasing opportunities for horizontal exchanges through thematic workshops, institutional twinning and strengthening … A workshop on Hybrid has been provided and one on Mini-grids is planned in 2013.
ARE ARE, EU Developing countries Alliance for Rural Electrification is an international (On-going) members business association focusing on the promotion and the
development of off-grid renewable energy solutions for rural electrification. Materials have been developed by expert WG for hybrid and mini-grids systems.
NEPAD AU Africa NEPAD has an energy programme covering all energy issues with a focus on bioenergy and some activities on renewable energy.
APS WB (+IED) Developing countries Starting study project on “potential for Alternative (Start-up) Power Supply (APS) in developing countries with a
particular focus on private players’ involvement for distributed generation and supply
Credit Line for RE AFD Kenya & Uganda The objective of the AFD credit line is through a (On-going) (+IED) (starting in Tanzania) partnership with selected national banks, to provide a
financing facility for term loans and appropriate risk mitigation through a risk sharing instrument (ARIZ), assorted with a technical assistance to support project developers and banks and infrastructure investment. AFD has been long present in Kenya in the rural electrification sector, and has provided loans to KPLC for grid expansion and is considering schemes for hybrid mini grids.
IEC IEC Worldwide Standards IEC 62257 for off-grid & MG Homer NREL Worldwide Software to evaluate design options for both off-grid
and grid-connected power systems, including hybrids. Retscreen Canada Worldwide Clean energy project analysis software tool that helps
decision makers to determine the technical and financial viability of potential renewable energy, energy efficiency and cogeneration projects.
REToolKit WB Worldwide REToolKit14
is a rich platform on the web dealing with all key MG issues as economics & financial analysis, best practices & lessons learnt, financing mechanisms, policy & regulatory studies, etc. but all related documents are actually out-of-date, most recent are from 2005
Publications Many Worldwide More than 100 publications and studies on MG and GMG
14
http://web.worldbank.org/WBSITE/EXTERNAL/TOPICS/EXTENERGY2/EXTRENENERGYTK/0,,contentMDK:21818434~menuPK :5141956~pagePK:210058~piPK:210062~theSitePK:5138247~isCURL:Y,00.html
51

Final Report – Support study on Green Mini-Grid development
4.2.4 Major GMG supporting events
Annual European conference on “PV Hybrid and Mini-Grid” (OTTI)
strongly focused on solar technology.
First conference on “Off-Grid Renewable Energy”, IOREC, Accra, 2012
focused on REN and DC. First conference on “Sharing Business Models and Scaling up Mini Grids in Asia and Pacific”, SEFA,
ADB, Kathmandu, Feb. 2013 Regional training workshop on GMG for CLUB-ER’s members, in Mauritania (July 2013) and in
Mozambique (August 2013). 4.3 DFID/ICF Priority Countries 4.3.1 Priority country selection At the early stage of the study, DFID has expressed its strategy that the first phase of their up-scaling
investment programme for GMG shall focus on 2 or 3 African countries only. DFID and IED have
agreed on the below criteria and ranking methodology needed to select a set of 7 priority countries
in Africa out of 10 initially pre-selected: Tanzania, Kenya, Malawi, Mozambique, Rwanda, Nigeria,
Ethiopia + DRC, Somalia, Uganda.
It was agreed at the kick-off meeting to use the following criteria with the objective to identify
countries where both sustainability and high impact can be achieved with a large GMG programme.
The selected criteria are:
1 Stability of the Most countries can be classified using FSI index, but we simply use the criterion, country which considers if a country is, or not a FCAS (Fragile and Conflict affected country), combined with LIC/MIC status.
2 Rural Electrification Key criterion showing significant differences between some countries but
Rate comparison is approximate as available rates are not always for the same year.
3 Fuel price for power The fuel taxes can varies significantly between countries affecting directly the plants cost-effectiveness of renewable energies
4 DFID/ICF interest & DFID has local offices that have expressed their first interest for GMG commitment development based on their knowledge of the country’s context.
5 Mini-grid potential Through the electrification master plans, the criterion allows assessing where off- grid mini-grids could be sustainably developed and % of people in need could be
targeted.
6 Political environment This quite subjective criterion should help to assess the level of regulatory & & wills institutional environment for promoting Mini-Grids, or at least rural electrification, renewable energies and private sector.
7 MG & RET The national experience with renewable technologies and with mini-grids will
experience increase the chance of success in the operation and management phase.
8 International GMG- This criterion assess the number of international programmes having GMG related programmes component, being similar or complementary
52

Final Report – Support study on Green Mini-Grid development
Indicative information has been collected for each criterion and each country and is presented in the detailed working table given in annex. Note that the results are highly indicative:
For several criteria, H-M-L appreciations are relatively subjective and are based on
literature findings.
There are other worthy criteria that could be considered but they can hardly be quantified at this stage:
o Potentially interested national private sponsors
o National finance sector: is there experience in project financing in the country, are
there banks and financial institutions engaged in term financing, supporting SMEs,
innovation?
o Availability of required technical skills at national and local levels: this does not
necessarily mean that there already is experience in the specific technology but
that there are engineers and technicians of the required skill level The next table gives the indicative results for the 10 countries.
Table 11: Criteria for Country Selection and Preliminary Scores
Criteria
1 Stability of the country
2 (Rural Electrification Rate)-1
*
3 Fuel price for power plants
4 DFID/ICF interest & commitment
5 Mini-grid potential
6 Political environment & wills
7 MG & RET experience
8 International GMG-related programmes
Global Enabling Environment for GMG
* the criterion is reverse to other criteria
Ken
ya
Tan
zan
ia
Rw
and
a
Uga
nd
a
Mal
awi
Moz
ambi
que
Gh
ana
Som
alia
DR
C
Eth
iop
ia
Nig
eria
We
igh
t
L (l
ow
)
M(m
ediu
m)
H (
hig
h)
Un
it
M M M M M M H L L M L 1 FCAS LIC LMIC - -
MIC
L M H M H H L H H H L 1 >20% 5-20% <5% %
H H H H H M M H H M M 1 < 0.5 0.5 - 1 >1 $/l
H H M M M H L H M L M 1 from from from -
Steven Steven Steven
H H H M M L M L L M H 1 <30% 30-40% >40% %
H H M M M M H L M L M 1 TDV/SH TDV/SH TDV/SH
H H M M M M M L L L L 1 <5 5-10 >10 GMG
H M M H L L L L L L L 1 <2 2-5 >5 pgm
84% 81% 69% 63% 59% 55% 51% 50% 48% 41% 41% 8 2 5 10 Weight
However, a preliminary subjective score (on the lower line) is proposed in the above table based on
indicative weight for each score [H=10; M=5; L=2] to all criteria. Each criterion could be given
different weight for fine-tuning but at this level the weight is equivalent for all criteria (=1).
53

Final Report – Support study on Green Mini-Grid development At this stage, the countries can finally be ranked as follow:
Table 12: Indicative Ranking of ICF Priority Countries 1 Kenya 84%
2 Tanzania 81%
3 Rwanda 69%
4 Uganda 63%
5 Malawi 59%
6 Mozambique 55%
7 Ghana 51%
8 Somalia 50%
9 DRC** 48%
10 Ethiopia 41%
10 Nigeria** 41% ** FCAS country
The Top 6 countries from the above assessment have been selected by DFID as priority countries for
more detailed investigation in this study. The 7th
country selected by DFID is DRC despite an
apparent low population density and serious stability and governance problems, due to its extremely low electricity rates. 4.3.2 MG status in ICF priority countries
Given the above selection of the 7 ICF priority countries for the DFID programme, this section
provides basic information on the status of existing MG in key countries, as far as information has
been found. A more detailed country’s overview, including national energy sector and policies, is
given in the Annex 1 for ICF priority countries and few other countries. Table 13: MG Status in ICF Priority Countries
Priority country Key information in MG status
State-run MG:
o Existing: 18 diesel-based MG operated by KPLC (19MWp)
o Existing: many micro- & mini-hydro but now most are grid-connected
o Existing: 7 hybrid MG (1 PV/Diesel, 1 Wind/Diesel, 1 PV/Wind/Diesel)
o Planned: hybridation of 12 existing diesel-based MG (3 MWRE)
1 Kenya o Planned: 27 new PV and wind GMG (13 MWRE)
o Planned: 200 new villages with hydro and solar (~100MWe)
o Major programmes: SREP …
Private- or community-run MG: many micro-hydro and PV systems installed
Tariff: uniform for grid and off-grid = ~0.29$/kWh (2010)
IPPs: 10 hydro sites through PPP are in the pipeline
FIT in place for Wind, Biomass, Hydro since 2008
State-run MG:
o Existing: 21 diesel-based MG (TANESCO)
o Existing: 13 hydro, 2 biomass, 2 gasifier MGs
o Planned: hybridation of existing diesel-based MG
o Planned: > 13 new micro- or mini-hydro
2 Tanzania o Planned: hybrid solar/wind/diesel for telecom base stations
o Major programmes: TEDAP, SREP …
Private- or community-run MG: many micro- and mini-hydro projects
Tariff: uniform for grid and off-grid = ~0.12$/kWh (2013)
SPPs: 11 grid connected SPPs mainly hydro & biomass and one SPP for
isolated MGFIT in place for Grid injection and for mini-grids
54

Final Report – Support study on Green Mini-Grid development
Annex 1: Brief on Specific Countries
This section presents briefly the national energy sector and the achievements in rural electrification
and mini-grids for 2 groups of countries: firstly the ICF priority African countries (selected by DFID
and to be covered by this support study) and secondly some key other countries.
Information provided is indicative as the sources are mainly from official internet websites,
completed to some extent with more updated data from some African institution partners of the
CLUB-ER.
4.4 ICF Priority Countries 4.4.1 Kenya
The New Constitution promulgated in 2010 has substantially changed the governance structure in
Kenya by the creation of 2 levels of Government and 47 Counties. New institutions have been
established as part of the changes in line with the objectives and targets of ‘Vision 2030’ (Middle Income Country by 2030).
Vision 2030 recognizes energy as one of the vision and requires an alignment of the energy sector
policy and legislation. This requires preparation or revision of the following documents: Draft
National Energy Policy (appropriate policy, legal, regulatory and institutional framework to review),
Draft Energy Bill (new), and RE Strategic Plan (to review).
The Rural Electrification Authority (REA) was established in 2007 to extend electricity to rural areas as
fixed by the government target and to accelerate the pace of rural electrification in the country. In
2012, the national electricity connection rate was about 30% and the rural connection rate was
estimated at 26% (having increased from 12% in 2009) while the rural access rate15
is presently
estimated at 77% as the grid has been extended in most populated areas.
The new mandate of REA to power the Vision 2030 is to reach ‘universal connectivity by 2030’; it
includes the increase of access to electricity (equally in 47 new counties) and the promotion of the
renewable energy development. REA will expand the national grid in the rural areas and install off-
grid stations and develop mini-grid.
There are on-going views to change the existing Rural Electrification Authority (REA) into the National
Electrification and Renewable Energy Authority (NERA) and to become the lead agency for
development of all other renewable energy resources excluding geothermal and large hydro. NERA
shall be the one-stop-shop for information and guidance to investors on renewable energy projects.
The REA (or NERA) will remain a national organization in charge of planning network extension,
managing the Rural Electrification Program Fund and innovation on renewable energy.
For June 2014, the new REA target for Rural Electrification is the “full access” of rural population by
electrifying the remaining 4387 public facilities out of 25,000 (trading centres, GSS schools, health
centres). This target of full access doesn’t mean that all households will be connected. 15
Access rate is here corresponding to “SEFA” and “CLUB-ER” definition (cf. Annex 6.1) i.e. % of households potentially having access to electricity.
55

Final Report – Support study on Green Mini-Grid development
The installed capacity for electricity generation is 1521MW consisting of 50% hydro, 35% thermal, 13% geothermal, 1.7% co-generation, and 0.3% wind.
Major economic activities in Kenya take place along the “Railway Belt” from Mombasa in the Coast to
Kisumu in the West. And the national grid network has developed around those areas. A new
transport corridor will probably open up in the North and East of Kenya (from Lamu) due to the
discovery of oil and will lead to fast development of infrastructures.
Figure 14 : Kenya’s Grid Network, Solar & Wind Potential16
The major towns in Northern/Eastern Kenya depend on mini grids, as grid power line extensions are considered not economically viable due to high distance, low demand and low economical activities.
There are currently 18 operational mini-grids to serve the rest of the country. Distribution and sales
are done by KPLC utility and the generating equipment is owned either by KenGen or REA (all 3 are
government organisations). The total installed capacity is 19MW with only diesel generators (from
0.1 to 1.5 MW). 7 of them have operated for more than 30 years, 11 have been developed in the last
six years and 11 more are currently being developed by the Rural Electrification Authority.
The mini-grids are firstly developed by REA under GoK funds (with substantial support by
development partners) and then handed over to Kenya Power (KP) for operation, distribution and
retails of electricity and collection (5% levy for REA).
The tariff system in Kenya is uniform (cross-subsidy) irrespective of grid or off-grid and is based on
energy consumption and fuel used for generation (the average generation cost in 2010 was $0.29
/kWh).
In the areas where the off-grid systems are being put up there is abundance of renewable energy,
mainly solar and wind, as most hydro sites and biomass resources are actually close to the grid. In
order to offset fuel consumption, renewable energy is being introduced into the off-grid systems.
There is a huge potential of replacing diesel generation with solar generation in the micro-grids.
16
Solar and Wind Energy Resource Assessment in Kenya (SWERA) - http://www.hedon.info/BP56:PracticalActionNews 56

Final Report – Support study on Green Mini-Grid development
The Ministry of Energy (MoE) has encouraged potential Independent Power Producers (IPPs) to carry
out feasibility studies on renewable energy generation on the basis of which Power Purchase
Agreements (PPAs) with the off-taker can be negotiated. At least 10 sites could be developed
through Public Private Partnership. The Ministry of Energy is also undertaking a National Small Hydro
Atlas.
The first Feed-in-Tariffs Policy for wind, biomass and small hydro was published in 2008 and was revised in 2010 and 2012.
At present, there are 7 existing hybrid mini-grids using renewable energy: 5 Solar/Diesel, 1
Wind/Diesel and 1 Solar/Wind/Diesel. Solar ranges from 10 to 300kWp and wind ranges from 50 to
500kW while diesel ranges from 128 to 2400kW. The first two were implemented and managed in
2011 by KPLC. In addition, REA has developed 2 Mini Hydro sites and also has biogas projects in 3
rural schools.
All new off-grid stations coming up will have renewable energy components. REA intends to develop
off-grid systems that will be primarily renewable with diesel backup. REA intends to put up into the
grid at least 250MW from renewable energy resources in 2013-2018 and to retrofit all the existing
off-grid diesel-based stations to have renewable energy components. A first phase of 200 villages
(about 100MW or in average ~500kW/village) is planned to be developed with mini-hydro or solar,
and with community participation through SPV formed by KenGen.
The GoK plans to raise the share of renewables in 12 isolated mini-grids with a total capacity of
11MW by installing 3MW of solar and wind to complement the existing diesel generators in these
grids. The GoK also plans to construct 27 new isolated green mini-grids with a total installed capacity
of 13MW. The total cost for the 16MW of additional generating capacity and the grid costs of the 27
new mini-grids is USD 68 million. The average cost is USD 3,000/kW for power generation and USD
1,300/kW for the mini-grid development (IRENA – PAPS). The SREP programme in Kenya is used to
support GMG activities of the GoK and to implement some of those planned hybrid solar-diesel mini-
grids.
On larger scale, Kenya Power has wind and geothermal power plants connected to the Grid and KenGen and the Ministry of Energy plan to implement 60MWp of Solar in Garissa.
Beside government-led MG projects in Kenya, there are a significant numbers of private or
community GMG projects using hydro (and probably solar). There are basically 2 categories of
private investors:
Micro renewable energy projects (~$65,000) implemented by local communities as for
example Tima 2.2kW and Kathamba 1.1kW Hydro Power Plant projects (European Union co-
financing for a total investment cost of $36,700);
Small hydropower projects implemented by agro-industries (as tea factories) with sometimes a rural electrification component to sell (or give) excess of power.
In both cases, the key lesson is the lack of planning and financial capacity to consider the load demand growth. There is no plan to reinvest for new customers.
57

Final Report – Support study on Green Mini-Grid development
Other existing mini-grids include for example are as follows:
- Tana and Athi Rivers Development Authority is implementing, under ACP-EU EF 2012, the
construction of 7 mini-hydropower plants to provide electricity to 7 rural communities. A
Community Project Management Committee will be trained to operate and maintain the mini-
hydro projects in conjunction with the Kenya Electricity Regulatory Board, in charge of power
generation and distribution.
- Thiba mini-hydro project initiated by the local community in 2002 was implemented in 2005.
Currently it supplies power for 12-14h/day to 180 customers (most are shareholders) within 1.6
km radius with regular voltage drops. Flat tariff of $3/month is applied (no meter). Customers
are facing frequent blackouts due to recurrent technical problems with turbines (low quality, bad
design, lack of skills and funds) but the community is proud of their system and look for
assistance to improve it.
- Tungu-Kabri micro-hydro power project funded by the UNDP and developed by Practical Action
and the Kenyan Ministry of Energy, the project benefits 200 households (around 1,000 people) in
the Mbuiru village river community. The project uses cheap, sustainable and small-scale hydro
technology (18kW) to make electricity and even in the face of drought. There has been a strong
involvement of the community for weir and canal construction after sensitization and on-the-job
training by PA. Construction will take two years. (source: http://practicalaction.org/microhydro)
- Mpeketoni Electricity project (MEP) is an old diesel-powered micro-grid project (1994) in Lamu
District that has evolved over the years to meet a fast growing demand (60 to 300 kVA capacity).
Land was given by GoK and powerhouse and equipment was given by GIZ. However with the fuel
price increase, the tariff has raised significantly ($0.35/kWh in 2006). The system was handed
over to the community in 2005. The GoK increased again the generator capacity (2x300 kVA) and
upgraded the distribution network. Wind generation was seriously considered (since 2006).
Today the installed capacity is 1169kW with a peak of 480kW and the network will be grid
connected in 2013 and the construction of a wind farm of 90MW will be contracted soon.
(source: www.globalelectricity.org/Projects/RuralElectrification/Nairobi/Day-2_fichiers/Case%20Study%20Mpeketoni%20Electricity%20Project.pdf)
State-of-the-art sentiment
GoK has shown a rather proactive policy to promote wind and solar pilot projects for MG and is now
mature to duplicate those approaches for other new or existing sites. However, the place and role of
private sector is not yet clear and the viability/sustainability of the existing projects have not been
fully proven mainly due to tariff issues. Other key sources:
- REA’s interviews and presentations at CLUB-ER workshops (www.club-er.org) - Project document for MG development, REA - SREP, 2013 - Various official Websites (REA, KPLC)
58

Final Report – Support study on Green Mini-Grid development
4.4.2 Tanzania Policy & institutional environment
The power sector in Tanzania was characterized by large hydro capacity installed (561MW) but its
part of the consumption has actually been reduced (35%) in favour of gas generation (32%). The
country suffers from severe droughts over the last decade, low coverage of the electric grid and an
increasing shortage of electric power production capacity in relation to demand, which roughly grows
with the economic growth. The reliability of electric grid power is low, with frequent brownouts and
blackouts. There was an estimated private individual installed capacity (small generators) in 2011 of
300-400MW not connected at TANESCO producing at about $0.35/kWh using diesel17
. The update
Power System Master Plan (PSMP, update 2012) estimates now at 565 MW of private gensets.
The rural electrification sector is defined by law and well regulated under the Ministry of Energy and
Minerals (MEM). The Electricity Act (2008) describes the power generation, distribution, tariffs, and a
specific section on RE plans & strategies, organisation and actors such as REA (Rural Energy Agency)
and EWURA (regulation). There is a REF fund managed by REB board (MEM & MoF) and fed by the
government, SIDA and NORAD and by a 3% levy. Detailed guide exists to prepare and submit
projects. In addition there is a Power Sector Master Plan (PSMP) which has been revised in 2012
(PSMP updated 2012) and a Rural Electrification Investment Prospectus (see below).
A Rural Energy Master Plan was produced in 2005 and is under revision wherein the update started
with 4 regions under IREP project (2013). The objective for electricity access is 30% by 2015 and 50%
by 2020, from 18.6% in 2012 (PSMP, 2012). As of 2013, there is only 7% electricity access in rural
areas. The first objective is to electrify all district centres and to reach 16% by 2015 in rural areas
(REA, Club-ER, 2013).
17
“Final Report on Joint Energy Sector Review for 2010/11”, MEM, September 2011 59

Final Report – Support study on Green Mini-Grid development
Figure 15 : Tanzania Existing Network (Tanesco 2012)
EWURA is also regulating the private sector participation through the tariffs and PPA for other private
actors as IPPs, SPPs (small power producers <10MW), SMPPs (very small power producers < 100kW),
DNO (Distribution Network Operators), SPD (small power distributor).
A state-owned utility called TANESCO is in charge of urban electrification while REA is in charge of
peri-urban and rural electrification. REA has implemented more than 140 grid extensions (REA-Club-
ER, 2013). TANESCO still has the monopole for distribution. For the past several years, TANESCO has
been poorly managed and has been in a bad financial situation (high demand, too low tariffs).
Network quality is very poor despite high-level standards. The benefits from reform engaged by the
government to restructure TANESCO and to invest in the production and transport infrastructures
will take years from now. (SREP-IP, 2013 + IED, 2013)
REA, EWURA and TANESCO are thus the 3 key actors under MEM in Tanzania dealing with rural electrification, renewable energy and market development as illustrated by the figure below.
60

Final Report – Support study on Green Mini-Grid development
Figure 16 : Institutional Framework and Market Structure of the Electricity Sector (SREP-IP, 2013)
The end-user retail tariff is uniform on TANESCO network (60 to 273 TZS/kWh for domestic
categories, $0.04 and $0.17 respectively). The average retail tariff is estimated at $0.12/kWh18
. A 3%
tax is levied on the tariff for REA and EWURA. As for the off-grid, tariff is determined by the kind of technology used and investment cost (REA/Club-ER, 2013).
The new institutional framework is favourable to IPP and to renewable energies with FIT tariffs
adjusted by EWURA for on-grid and off-grid injection. IPP regime is set with standard procedures,
PPA and annual licences (>1MW). IPPs can get investment support but not for operation.
The MEM has adopted in 2007 the Standardized Power Purchase Agreements (SPPA) and
Standardized Power Purchase Tariffs (SPPT) for interconnecting and selling power (< 10MW) to the
main grid and to mini-grids (cf. below Tables 14 and 15).
The tariffs are negotiated through SPPA under SPP guidelines and Standardized Tariff Methodology
and adjusted annually by the Working Group WGSPD hosted by EWURA to accommodate
uncontrollable operational costs. The following proposal has been completed and submitted for
approval:
18
The official tariff structure (fixed and variable parts per categories) doesn’t really help for tariff comparison and analysis. The actual average tariff should be calculated as the ratio between the total yearly income from electricity sales and the total energy consumed by customers. The average tariff of TANESCO is estimated to be around $0.12/kWh.
61

Final Report – Support study on Green Mini-Grid development
Table 14: Proposed 2012 FIT Tariff for Main Grid (152 TZS = 0.09 USD19
)
Table 15: Proposed 2012 FIT Tariff for Mini-Grid (480 TZS = 0.30 USD): If the IPP sells (hydro) power to TANESCO’s main grid, there are two feed-in tariffs depending on the
season (rainy/dry). The feed-in tariff is calculated by EWURA as the average of the avoided costs of
supply and the incremental cost of mini-grids. For 2012, the feed-in tariff for mini-grids was set at
TZS480.50/kWh ($0.30/kWh). If the IPP sells to other customers than TANESCO, it can propose tariffs,
which must be approved by EWURA. Standardized documents for power purchase agreements
(SPPA) are available for SPPs with small power systems (<1MW). There are currently 12 registered
and operating SPPs: 1 operating an isolated MG, 11 selling to the grid/TANESCO.
Current government incentives include tax exemption (VAT & import duties) for main solar
component (panels, batteries, inverters and regulators) and $2/Wp rebate to SHS installer. No tax
exemptions are provided for other renewable technologies (wind, hydro, biomass). Achievements On-grid projects: Existing: There are 4-5 small IPPs (2 – 5MW) connected to the main grid.
Planned: Four companies have expressed interest to develop wind farms between 500 and 1,000
MW (SREP-IP, 2013). There are demand-driven proposal by registered operators to develop grid-
connected mini-grids.
For off-grid areas where over 80% population does not have access to electricity, there is a huge
potential for small-scale renewable technologies. Renewable energies have a key role in the
government’s strategy to electrify rural areas20
. The green mini-grid experience in Tanzania is still
very limited. TANESCO is running 21 diesel-based off-grid stations supplying isolated mini-grids for
small towns (installed capacities ranging from 400kW to 12MW and 8 stations have peak loads below
1MW). TANESCO’s priority is to connect those isolated grids to the main grid. There is no indication
of hybridisation plans by TANESCO. 19
Exchange rate (2013): 1 USD = 1650 TZS or 100 TZS = 0.06 USD
20 Renewable sector in Tanzania, UKTI, 2012, www.uktradeinvest.gov.uk
62

Final Report – Support study on Green Mini-Grid development
REA supports at present 38 feasibility studies for off-grid projects, almost all of which are hydro
projects. Support is provided in the form of matching grants, which finance up to 80% of the costs of
the feasibility study. Matching grants are an instrument of the TEDAP Project. The Rural Energy Fund,
which is managed by REA, supports 17 on-going GMG projects: 13 SHP, 2 biomass cogenerations and
2 gasification projects. Hydro & Biomass
Hydro: Most of the developed small hydro are owned by missions or private entities and are
not connected to the grid. Based on the REA database, there is a government list of 169
potential sites (480MW) for micro, mini and small hydro at different stages of development:
reconnaissance, pre-feasibility, feasibility (15), business plan (6), and existing (23). Those sites
are geo-referenced in the GIS database. Only 13 sites are proposed for mini-grids and 6 of
them have capacity below 100kW.
Biomass: There is a large potential for biomass in the country. Most of the existing projects
are run and supported by agri-businesses (sugar cane, tea, coffee) that are producing
electricity from their biomass wastes. Eventually the excess of electricity is sold to
neighbourhood (employees, utility, industrial and sometimes villages). This approach offers
an innovative and attractive way to provide electricity to rural settlements, provided that
agribusinesses exists in the proximity and that owners are welcoming the idea to sell
electricity to village customers or to an off-taker, if any.
Some key biomass & hydro projects (identified from literature & web21
):
o Mafia Island: Ngombeni Power Ltd., a private developer envisage implementing a
wood/coconut-based gasifier (1.4MW) to replace an existing diesel genset run by
TANESCO, which supplies about 2,000 customers. The project has already been planned
for almost 10 years. Tariff rate and PPA setting was the main stumbling block.
o Tanwat is a wood-factory co-generating electricity from wattle tree chips, pine chips, eucalyptus chips and sawmill waste (2.5MW at Njombe since 1995). Tanwat sells about
30% of power production to a tea factory and 40% to TANESCO’s isolated mini-grid in Njombe.
o Tanganyika Planting Company Limited, TPC, a sugar producer in Moshi in the Kilimanjaro
area, is co-generating 17.5 MW from bagasse. Excess power is sold to TANESCO and 2500
rural customers. It served as a good example for the other sugar companies in Tanzania,
all of which are undergoing expansion and collectively, could provide electricity to at
least 15,000, and perhaps as many as 25,000 new rural consumers over the coming years
(IED survey, 2013).
o Mwenga Hydro Project (3.5 MW) was initiated by Mufindi Tea Factory to overcome poor quality supply from TANESCO. 3,000 rural connections are also planned.
o Mngeta MHP expansion (1.1 MVA in Kilomber) + 300 customers 21
http://www.globalelectricity.org/Projects/RuralElectrification/Nairobi/Day-2_fichiers/TZ%20MIRREIA%20e7.pdf 63

Final Report – Support study on Green Mini-Grid development
o Kilocha MHP (4,6 MW in Njombe) + 1,500 customers
o Malagrasi MHP (8MW (
24) in Kigoma) + 5,500 customers
o Kasulu MHP (300kW to replace DG, run by KAECCO cooperative) + customers
In 2010, there was a pipeline of grid-connected renewable energy projects totalling 76 MW
(hydro+biomass+cogen) with SPPA contracts or LOI signed with TANESCO, as illustrated by the next
table available in SREP-IP, 2013:
Table 16: List of SPP Projects in Tanzania (March 2013, TANESCO) Solar
Beside widely spread domestic PV systems implemented by private sector but mainly
concentrated in areas where grid is within reach, the government is targeting the use of solar
PV to supply the isolated/off-grid stations to partly displace the thermal generation.
Example of private project: a new solar micro-grid project (2012) with 2kWp - 24VDC (100
customers with pre-payment), financed, installed and operated by an Italian private company
DEVERGY
Solar power is widely used (5MWp in 2012) in the country through SHS and pico systems sold by an active private sector & NGOs in 3 main projects (SIDA/MEM, UNEP/MEM, WB-LA).
REA perceives hybrid technology as one of the solutions to provide reliable and affordable
electricity supply in isolated areas. Private developers presently manage the development of
hybrid systems while REA provides support to developers through capacity building,
64

Final Report – Support study on Green Mini-Grid development
technical assistance, promotion of the technology and awareness raising. REA is planning to use various financing schemes to further develop hybrid technology (REA interview, 2013):
(1) Provision of matching grant to buy down capital cost for private project developers;
(2) Provision of technical assistance to project developers to establish viability of the
project;
(3) Establishment of credit line to ensure that project developers access long term loans
from banks and capacity building to project developers interested to invest in modern
energy technology
There are currently several hybrid systems installed, mainly in the range of 1 to 10 kWp PV.
There are plans to implement systems, which include wind energy. Telecom off-grid base
stations (several thousands in Tanzania) relying on diesel are considered as a huge market for
hybrid systems (SEI, 2012; GSMA project). However, according to REA (interview, 2013),
telecom companies still tend to generate from fuel rather than wind and solar.
There are no centralised utility solar PV systems (> 1MW) installed yet. The key constraint is
tariff levels that should cover the costs. Potential investors want to sell electricity generated
from solar PV at $0.20/kWh but TANESCO buys electricity in average at $0.15-$0.16/kWh.
Also private investors prefer to be paid in USD and not TZS. Another challenge is that of
competition with grid extension. Standardised Power Purchase Agreements (SPPA) and
Renewable Energy Feed-In Tariff (REFIT) are under review by EWURA to address these issues. Wind
Wind: Small-scale wind power units of few tens of kW are commercialised on the market and
sold to privates or NGOs for hybrid or battery-based power systems. Telecom with hybrid
wind/solar systems is also emerging to reduce fuel consumptions. A wind resource
assessment has been made in Tanzania to about seven different sites mainly for large wind
projects led by private investors (few tens of MW).
The next table provides a comparison of economic LCOE for mini-grids using different sources,
ranging from $0.2 to $0.7/kWh for renewables compared to $0.59 for diesel-based MG. Note that
with grid-based systems, the estimated kWh production costs are $0.02 (old hydro), $0.13 (new
hydro), $0.06 (Gas) and $0.40 (fuel) (REA, CLUB-ER, 2013)
Table 17: Economic Levelised Cost of Electricity (LCOE) in Mini-Grids from various energy sources (SREP-IP,
2013)
65

Final Report – Support study on Green Mini-Grid development
Some on-going projects TEDAP
The TEDAP (Tanzania Energy Development and Access Project) is a project focusing on energy access
expansion and renewable energy development with on-grid and off-grid components. The off-grid
component is implemented by REA and financed by WB/GEF and provides a good support to third
parties to develop off-grid SPP (Small Power Project) including MG. Financing mechanisms as credit
line and performance grants are proposed under TEDAP project to promote the private sector.22
E.g.
REA offers $500 subsidy per connected customer (performance grant)23
.
Key lessons for Renewable-Energy Mini Grids that have emerged from the off-grid electrification component of TEDAP are as follows (SREP-IP, 2013):
Strong private-sector interest is tempered by the need for essential pre-requisites: streamlined
procedures and regulations to minimise transaction costs and time, transparent processes.
Limited experience and capacity in undertaking feasibility studies and preparing projects for financing
has resulted in the need to extend preparation time for over-committed staff members and consultants
to reach the financial application stage. Thus, both capacity building and specialised expertise are
critical.
Soliciting private companies to submit proposals, proposal evaluation, and awarding matching grants are time-consuming processes. Bundling projects and awarding their preparation to larger, more capable entities for Transaction Advisory Services can reduce time and cost and improve outcomes. One example of the bundling concept is GVEP International’s responsibility for 6 projects.
Commercial bankers have little experience in lending to this sector. Training bank staff in performing
due diligence is important. Whilst classroom training is useful, the real value added is providing
experienced consultants to work with banks on evaluating actual projects. Although the banks started
to lend to renewable energy projects under the credit line, they remain very risk averse.
High equity requirements (about 40%) and limited access to long-term financing reduce project
bankability. The TEDAP credit line, while important, does not eliminate the constraint of high equity
requirements. Although international private-equity funds have started to enter the Tanzanian off-grid
electrification market, the high equity returns demanded and concerns over currency and off-taker
risks have limited their investments.
TANESCO’s recent delayed payment of SPP and IPP invoices is of great concern to current and future investors. Early resolution of this problem through liquidity injections to TANESCO and/or using appropriate risk-mitigation instruments is essential to maintaining the viability of the SPP programme.
REACT
The AECF REACT window in Tanzania has a specific allocation from DFID ($8M) and SIDA ($3M). The
REACT projects in TZ include businesses supplying decentralized rural energy solutions (cook stoves &
electricity with solar, hydro and biomass). One example is the battery charging station project (by
solar or by grid) promoted by the company EGG-energy24
based on franchisee model (typically be
village entrepreneurs who already successfully operate a medium-sized business). Portable, 22
http://www.esmap.org/sites/esmap.org/files/TEDAP%20SPPs%2011-18.pdf
23 The total incentive for the investor is however limited to 80% of the total network cost. (source above TEDAP/ESMAP)
24 http://www.aecfafrica.org/Aecf_Newsletter/Tanzania_Newsletter.pdf
66

Final Report – Support study on Green Mini-Grid development
rechargeable, and affordable batteries are rented to customers in exchange for a subscription fee,
which can last 3-10 days, depending on consumption. Customers can exchange their depleted
battery for a fully charged one at any time at a nearby EGG-energy charging station or distribution
point. Electricity is thus distributed over existing distribution networks such as feet, bicycles,
motorbikes and other vehicles. Prepaid metering for solar home systems is another interesting
activity developed in Tanzania (“Mobisol and off-grid electric” project). http://offgrid-electric.com SREP
Despite Tanzania not being a partner country for Clean Technology Fund (CTF), it has just joined SREP
regional programme. Based on a national review of key barriers, bottlenecks and opportunities,
MEM, with support of MDBs, has prepared an investment plan covering 2 categories of projects: (i)
Geothermal Power Development Project and (ii) Renewable Energy for Rural Electrification (RERE)
Project. The RERE component, with an indicative budget of $182.45M (13.7% by SREP), will be
implemented by REA and will include 3 off-grid electrification schemes: mini-grids, micro-grids and
solar packages (SSMP) with total target capacity of 47 MW. SREP main objective is to demonstrate
the scalability and the sustainability of renewable energy for off-grid rural electrification. One of the
challenges will be to mobilise the co-financing from private sector (16.7%) and from commercial
banks (15.3%). Partial risk guarantee instruments are foreseen to cover off-taker, currency, and other
commercial risks that foreign equity partners may require for small power projects (SPPs). (SREP-IP,
2013) Rural Electrification Investment Prospectus
The RE prospectus is a project funded by NORAD and implemented by REA and IED with the objective
to assist the Government of Tanzania and Donors to come together to develop a workable starting
framework for a sector wide approach and to prepare with REA, EWURA, TANESCO a national
Electrification Program Prospectus, with the objectives of systematically engaging potential financiers
(principally donors and the private sector) and raising financing for the scale up program. An
investment plan in the 26 regions has been developed using a GIS rural electrification database. IREP
As part of the IREP project, funded by European Commission (Energy Facility 2), IED has assessed the
potential for distributed generation in four regions based on the analysis of typical rural loads and
accounting for available local renewable resources. The calculations were made with GEOSIM, a GIS-
based software. The results show areas where grid expansion makes sense and potential for various
mini grids: biomass based, hydro based, and solar PV. In particular, there is a significant potential for
micro-hydro systems in the centre and southwest of the country. There are also many areas where
rice-husk gasification could be used for distributed generation. SEI Study
Stockholm Environment Institute (SEI) has conducted in 2012 a study “Sustainable Energy Markets in
Tanzania”, financed by SIDA and DFID, mapping out the current status of each renewable energy
market system in Tanzania, and looking at on-going initiatives and potential future demand and
supply in order to recommend possible entry points for SIDA and DFID over a five year horizon. The
67

Final Report – Support study on Green Mini-Grid development
study gives a very comprehensive overview of the institutional framework and the private power sectors. State-of-the-art sentiment
The vastness of the country, coupled with low population densities, makes grid extension too
expensive for many difficult-to-reach areas, creating a significant market potential for off-grid
electrification schemes (IP, 2013). There are also a handful of donors eager to support GMG
development.
However despite this huge potential, there are not much MG experiences yet. According to REA
(interview July 2013), main reasons could be that the private sector participation for carrying out
GMG projects is still limited, and initial capital to start up GMG projects remains a main challenge. On
the receiving end, (the economic capability of the rural people who are main customer for the
product is also limited, this is due to the fact that final product from GMG especially on solar happens
to be very expensive thus unaffordable to rural people. Other barriers (from IP, 2013) have also restrained the GMG development in Tanzania as:
Frequent droughts affect hydropower generation
Lack of experience and limited expertise in undertaking feasibility studies, detailed design,
procurement and construction for renewable energy power plants other than small
hydropower (SHP) for which experience & skill actually exist now.
Lack of incentive to develop mini-grid projects due to uncertainty of grid expansion
The banking sector and investors have limited experience with financing renewable energy projects
Equity financing is quite scarce
Renewable energy projects also face significant risks, including off-taker (especially payments by the utility), resource, and currency risks
Other key sources:
- REA’s interviews and presentations at CLUB-ER workshops (www.club-er.org)
- SREP Investment Plan, Tanzania, 2013
- "Sustainable Energy Markets in Tanzania", SEI, 2012
- Various official Websites (REA, Tanesco, EWURA)
68

Final Report – Support study on Green Mini-Grid development
4.4.3 Malawi An integrated Energy Policy has been developed in 2003, including participation of PPP & IPP in
energy development, a Rural Electrification Policy & Plan (2003), energy act, etc. The main key actors
are: the Rural Electrification Management Committee (REMC) that manages REF funds & RE
activities; the Department of Energy Affairs (DoEA) that is the technical arm for electrification and is
responsible for all planning, purchase of materials and contracting and supervision of Rural
Electrification (Implementer), the MERA (Regulator) and ESCOM (Contractor & National Utility).
The National strategy is to follow the Master Plan for Electrification of Trading Centres (TCs) up to
2021 developed with JICA. Additional trading centres and public institutions can be added by district
assemblies.
The government is supporting private sector participation (SMEs and IPPs) with import tax
exemption. The end-user’ tariff25
is uniform for ESCOM and not cost reflective with $0.08/kWh ($4
fixed + $0.06/kWh for billing or prepayment). However Malawi’s energy act allows private sector
participation in the supply of electricity (with permits) but limits these suppliers to rates no higher
than ESCOM’s. There is now a FIT ready for implementation for all renewables (geothermal, hydro,
biomass, solar and wind).
The ESCOM Corporation has a total capacity of about 300 megawatts, 90% of which comes from
hydroelectric power, with the remainder coming from thermal plants. Power outages are a perennial
problem in Malawi, sometimes lasting as long as 17 hours, and are often attributed to ESCOM’s aged
machinery. The fuel is highly taxed (diesel = $1.89/l) but part is feeding the Rural Electrification Fund.
Against an annual customer growth averaging 8.5%, ESCOM is struggling to meet the increasing
demand for electricity. Less than 2% of the 13 million people in this small country have electricity.
In the framework of the Malawi Renewable Energy Acceleration Programme (MREAP), an evaluation
study has been conducted on Off-grid Community Managed Renewable Energy Projects in Malawi
(12 cases studies using solar, hydro, wind and biomass). The current policy framework from 2004
doesn’t recognise modern RET approaches for community / households. A Policy Development
Process Map was under preparation in 2012. The study has pointed out the following weaknesses:
There is a lack of clarity around the roles and responsibilities of government, installers,
community for the long term operations and maintenance, including both capital and
revenue financing;
Lack of capacity development or planning for all levels in society working with RET, in particular to support maintenance, including health and schools
Lack of clear and testable standards and quality infrastructures standards
Lack of evaluation & monitoring of RET installations 25
http://www.escom.mw/tariffs.php 69
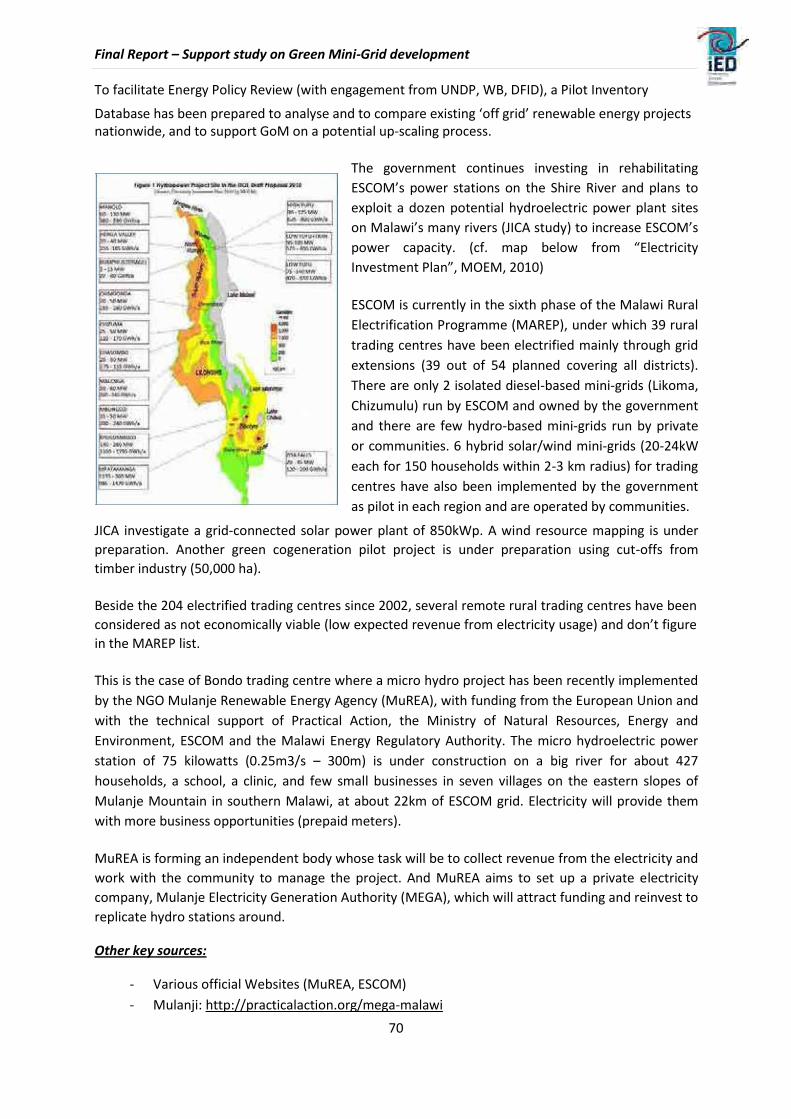
Final Report – Support study on Green Mini-Grid development To facilitate Energy Policy Review (with engagement from UNDP, WB, DFID), a Pilot Inventory Database has been prepared to analyse and to compare existing ‘off grid’ renewable energy projects nationwide, and to support GoM on a potential up-scaling process.
The government continues investing in rehabilitating
ESCOM’s power stations on the Shire River and plans to
exploit a dozen potential hydroelectric power plant sites
on Malawi’s many rivers (JICA study) to increase ESCOM’s
power capacity. (cf. map below from “Electricity
Investment Plan”, MOEM, 2010)
ESCOM is currently in the sixth phase of the Malawi Rural
Electrification Programme (MAREP), under which 39 rural
trading centres have been electrified mainly through grid
extensions (39 out of 54 planned covering all districts).
There are only 2 isolated diesel-based mini-grids (Likoma,
Chizumulu) run by ESCOM and owned by the government
and there are few hydro-based mini-grids run by private
or communities. 6 hybrid solar/wind mini-grids (20-24kW
each for 150 households within 2-3 km radius) for trading
centres have also been implemented by the government
as pilot in each region and are operated by communities. JICA investigate a grid-connected solar power plant of 850kWp. A wind resource mapping is under
preparation. Another green cogeneration pilot project is under preparation using cut-offs from
timber industry (50,000 ha).
Beside the 204 electrified trading centres since 2002, several remote rural trading centres have been
considered as not economically viable (low expected revenue from electricity usage) and don’t figure
in the MAREP list.
This is the case of Bondo trading centre where a micro hydro project has been recently implemented
by the NGO Mulanje Renewable Energy Agency (MuREA), with funding from the European Union and
with the technical support of Practical Action, the Ministry of Natural Resources, Energy and
Environment, ESCOM and the Malawi Energy Regulatory Authority. The micro hydroelectric power
station of 75 kilowatts (0.25m3/s – 300m) is under construction on a big river for about 427
households, a school, a clinic, and few small businesses in seven villages on the eastern slopes of
Mulanje Mountain in southern Malawi, at about 22km of ESCOM grid. Electricity will provide them
with more business opportunities (prepaid meters).
MuREA is forming an independent body whose task will be to collect revenue from the electricity and
work with the community to manage the project. And MuREA aims to set up a private electricity
company, Mulanje Electricity Generation Authority (MEGA), which will attract funding and reinvest to
replicate hydro stations around. Other key sources:
- Various official Websites (MuREA, ESCOM) - Mulanji: http://practicalaction.org/mega-malawi
70
Final Report – Support study on Green Mini-Grid development
4.4.4 Rwanda
Per capita energy consumption in Rwanda is one of the lowest in the world. Only 16 per cent of the
population have access to electric power; less than 2 per cent in rural areas. During the 1994
genocide, most of the infrastructure for power generation and distribution was destroyed. The
economic sectors with the greatest potential for growth (agricultural industry, tourism, IT) are
suffering from a poor energy supply. At the same time, many social infrastructure services cannot be
provided due to the shortage of energy. The retail tariffs have been drastically increased over the last
decade and reach today RWF 134 /kWh ($0.21/kWh) for ordinary consumption (ex. VAT 18%), one of
the highest in Africa.
The government is seeking to rebuild the energy infrastructure, and at the same time harness the
potentials of hydropower, methane gas, wind, solar and geothermal energy sources. Plans exist to
raise capacity from currently 100 MW to 1,000 MW by 2017. The aim is to achieve the goal with
particular emphasis on the inclusion of the private sector.
The Rwandan Ministry of Infrastructure (MININFRA) has integrated the private sector development
into its policy to develop the supply of electricity, and is planning to privatise all publicly funded
micro-hydropower plants. The energy sector is characterised by multi-ministries involved and is
regulated by RURA through a Rwanda Grid Code (Jan 2012). The country has significant remaining
micro-hydropower resources with a large number of small 20 kW to 250 kW potential sites. In order
to promote the development of these sites by the private sector, feed-in-tariffs for micro-
hydropower26
came into force in February 2012. The project also supported the introduction of
other regulations, such as environmental standards and licensing procedures.
As such, private SMEs are gradually taking on a leading role in negotiations with the national energy
provider and government authorities. Rwandan banks, with no previous experience of projects in the
energy sector, have now started offering loans to developers of micro-hydropower plants.
International investors have begun investing in companies supported by the project.
The first two privately run micro-hydropower plants (96 and 500kW) have been connected to the
electricity grid in Rwanda and supply over 10.000 people with electricity. A third micro-hydropower
plant will be completed by mid-2012 and more are planned. Since 2007, PV / diesel hybrid systems
have been installed in 50 remote health centres (typically with gensets rated 16 to 20 kVA and 3 to 6
kWp PV arrays). Diesel generators are used as back up to PV supply. Hybrid systems are owned by
beneficiaries and are financed through grants from different international development partners
working with the Ministry of Health. These systems enabled to reduce fuel consumption and to use
of new medical equipments, but maintenance remains a challenge for the beneficiaries.
The PSP Hydro Project (Private Sector Participation in Micro-hydro Power Supply for Rural
Development) implemented by Energy, Water and Sanitation Authority (EWSA) (2006-2013) targets
connection of micro-hydro plants to the grid to supply rural customers.
The IREA RPPP on-going project (under ACP-EU EF) aims to increase rural energy access in Rwanda
through public private partnership and includes the development of a 3MW micro-hydro plant
providing electricity to over 10.000 households, through the mobilisation of private finance. The 26
http://www.rura.gov.rw/docs/REGULATIONS_ON_FEED_TARIFFS_HYDRO_POWER_PLANTS.pdf 71

Final Report – Support study on Green Mini-Grid development
project conducted feasibility studies, established a ‘call to tender’ for business cases/plans from
private sector companies and local financial institutions, and set up a local help desk to provide
support and advise to private businesses. Are included also monitoring throughout the constructional
and operational phase, evaluations and audits, capacity building and training.
UNIDO and MININFRA implemented a project with 4 mini-hydropower stations to promote
renewable-based energy development for 2,000 households, small businesses, cottage industries,
schools and health centres.
GoR, UNIDO, BTC and GIZ are the main actors supporting off-grid programmes with 20 implemented
micro and mini-hydro schemes for off-grid electrification.27
More on https://energypedia.info/index.php/Rwanda_Country_Situation 4.4.5 Mozambique
Although Mozambique is producing natural gas and is a net exporter of electricity thanks to a huge
hydropower plant (2GW), electricity access is limited to around 32% (3% rural access rate). The grid
network is reasonably covering the country but the population is highly dispersed.
Mozambique is a large country with a widely dispersed, mostly rural population. Despite ambitious
grid extension plans, large areas of the country will not be reached by the electricity grid in the short
to medium-term. The country has a great deal of potential for supplying electricity for off-grid
applications, especially through solar PV, small hydro and biomass (including forest/agricultural
waste).
Politically and institutionally, Mozambique is making rapid progress on renewable energy. The
Ministry of Energy became a separate entity in 2005, and includes a National Directorate for New and
Renewable Energy. Legal and strategic preparations are also in place to support up scaling of
renewable energy, including biofuels. A key challenge is to generate the resources necessary for up-
front investment, whatever the renewable technology and project scale. An increased role for private
sector investment is likely to be necessary for Mozambique to increase its rates of renewable energy
use and electricity access.
The Energy Fund (Fundo de Energia, or FUNAE) has the main responsibility for delivering the rural
electrification strategy. It has successfully implemented a wide range of off-grid projects, using
resources generated from fees on electricity sales, from the state budget and with donor support.
FUNAE has a strong ambition to create opportunities for the private sector, which will be needed to
increase the pace of electrification. In practice, customer tariffs are set at grid levels, reflecting
FUNAE’s focus on providing social goods. While the Energy Fund (FUNAE) was originally set up to
finance projects, it has moved increasingly into project management. FUNAE is involved in identifying
and tendering for projects and, in some cases, operation and maintenance. FUNAE has a successful
record in implementing off-grid projects (cf. Box 1 below), and in the short term needs continued
financial resources to continue this work. In the longer-term, its ability to deliver rural electrification
on a much wider scale will ultimately be limited by human and financial resources, and a more 27 http://www.paceaa.org/workshops/Rwanda%20Training%20Workshop/02.%20Overview%20Of%20The%20Rural%20Electri fication%20Strategy%20In%20The%20Country%20%20.pdf
72

Final Report – Support study on Green Mini-Grid development
strategic approach will be required. While FUNAE is currently the main player, there is a strong
political ambition to create private sector opportunities for provision of these rural energy services
based on business models, which could be scaled-up at lower cost to the State.
The state electricity utility (EDM), owns and operates all plants on the system other than Cahora Bassa, but its main focus is on maintaining and developing the transmission and distribution grid.
Project developers are free to approach the Ministry of Energy with proposals. Standard tariffs and
conditions for renewables investments are not yet in place. Certain projects may be able to produce
electricity at costs below the marginal cost of purchase from Cahora Bassa.
A number of tax incentives currently exist to support socially beneficial investments. To support this,
a system of feed-in tariffs or equivalent is required to promote small hydro and biomass co-
generation for grid-connected electricity generation.
There is an opportunity to encourage the private sector to supply equipment and finance. To
promote private sector involvement in the rural electrification and decentralised energy sector the
following points are being considered by involved parties (government, donors, private entities):
- Introduce a role in which FUNAE engages with the private sector through creation of a private
sector liaison officer
- Establishment of a private sector forum to discuss possible revisions to policies and regulations;
- Expansion of tender process to include management, design and maintenance activities
previously undertaken by FUNAE;
- Provide a clear policy and implementation guidelines by which private sector and community-led
projects can apply for funds through FUNAE;
- Proactively encourage allow a business-led approach to emerge by encouraging private
equipment suppliers and distributors to enter the market in partnership with microfinance
institutions where appropriate; and
- Consider the use of a concession-based system. Box 1: FUNAE achievements
FUNAE has delivered projects using a wide range of scales of solar power, from just a few watts to tens of
kilowatts. The successful deployment and demonstration of solar energy technologies have led to an upsurge
in awareness and interest in the potential of solar energy for rural electrification. In particular, the
deployment of pico-scale solar energy systems has led to requests for the kits to be sold on a commercial
basis, leading to opportunities for income generation in the private sector.
FUNAE aims to deliver the electrification of schools, clinics and villages using photovoltaic, wind and mini-
hydro systems. To date, the electrification of 115 villages, 298 schools and 300 clinics has been successfully
completed.
To support the growing solar market in the country, FUNAE has been instrumental in the development of
plans to construct a solar module manufacturing plant with a value of approximately USD 13 million to
assemble solar modules for sale in Mozambique and in neighbouring countries. This will bring additional
73

Final Report – Support study on Green Mini-Grid development
employment to Mozambique and could be the first step towards a domestic solar manufacturing sector.
FUNAE continues to deliver sample projects and provide a range of examples of solar installations. Plans for
2012 include the further electrification of 350 schools, 350 health clinics and 30 villages. In addition, three
large solar projects, in the range of 400 to 500 kilowatts—a size never before installed in Mozambique—are
planned in Niassa province.
Alongside the deployment of technology, FUNAE has developed the capacity for operation and maintenance,
both through commercial arrangements and through training provided to community representatives. In
2008, FUNAE initiated a programme to train solar energy technicians in all provinces of the country.
The green mini-grid experience in Mozambique is still limited as detailed below:
Diesel-based mini-grids: 69 systems implemented by FUNAE and managed by local
“management committee”. Money collection by the committee (flat rate tariff – 8 hours/day
service) but low collection rate. Many are stopped due to lack of finance for fuel, spares, and
maintenance.
Hydro: Mozambique has good experience with large hydropower, although has very little
experience with small, mini & micro hydropower supplying mini-grids (MG); only 3 hydro
schemes are under implementation with FUNAE and about ten more by privates and NGOs.
Hydro is the most promising renewable source in Mozambique with 53 identified SHP
potential sites (< 1MW). About fifteen other SHP projects (<100kW) are under construction
or planned by government. In parallel, GIZ has implemented 7 micro hydro plants of 20kVA
each (operational) with LV distribution network and plans 20 more (cf. Box 2 below).
Solar: Three solar hybrid MGs of 0.4-0.5 MWp each are under implementation by FUNAE
(Korean loan). Few other smaller solar-MGs have been implemented by specific donors,
private companies and charity NGOs, without FUNAE involvement.
Wind: only large wind farms are considered for grid connection of several tens of MW on the
coast. One 300kW wind turbine has been installed but not connected to the grid because no
tariff.
Biomass: some sugar & mill factories use their waste for cogeneration but they need fair tariffs for grid connection or rural household distribution.
Box 2: Micro and mini hydro & mini-grids in Manica District (GIZ – ENDEV SHP project) Project is implemented with MoE (A. Saide is chairman of Steering Committee), without FUNEA Feasibility studies are conducted with FUNEA Local supervision by GIZ office in Manica (Charles Chidamba & Mario Merchan) Implementation of 7 micro hydro plants of 20kVA each (operational) with LV distribution network Pelton turbines manufactured locally, including a grind mill that could be run by the same turbine (similar
techno & project as in Zimbabwe under GIZ and Practical Action, although quality is higher in Zimbabwe) Construction with local NGOs and SMEs. The operator is a local businessman identified and recruited with local NGO’s assistance. Key success
factor. The operator contributes with in-kind or small cash (<10%) and become owner after start-up.
74

Final Report – Support study on Green Mini-Grid development
He sells electricity to customers and maintained the all system. Management scheme and tariffs are
under fine-tuning … high remoteness of villages complicates the management organization. Critical tariff issue: A flat rate tariff has been negotiated with customers (at about 200Mt/month?) and
agreed by committee but need the final approval of MoE as it is above EDM tariff (request is on-going). Several technical problems but will be solved More projects are planned till the end of 2015. There is a list of at least 20 sites with prefeasibility studies
in Manica. Concern with load forecast adequacy as village population could grow more rapidly as people from other
villages are moving easily to get electricity.
4.4.6 Uganda
Currently, power demand is estimated at 445 MW and growing rapidly each year. The country requires an additional 50 MW each year to avoid load shedding.
The electricity sector in Uganda was unbundled in 2001 and the responsibilities, previously solely
carried out by Uganda Electricity Board (UEB), transferred to various companies
(UEGCL/UETCL/UEDCL).
After unbundling, the government proceeded with the process of privatisation. The generation
concession license was competed for and won by Eskom Ltd, which took over in April 2003. Umeme
Ltd won the distribution concession, and took over in March 2005. UETCL is the system operator, the
bulk supplier and single buyer of power for the national grid in Uganda. It is the purchaser of all
independently generated power (presently 6 IPPs) in the country that is fed into the national grid. Institutional Environment & Policy Framework
The power sector is organised through 3 main institutions: MEMD, REA, ERA. The Electricity
Regulatory Authority issues licenses, reviews and approves tariffs and establishes/enforces
standards. The key instruments are:
The Electricity Act, 1999 Rural Electrification Strategy and Plan (RESP), 2001 The National Energy Policy (NEP), 2002 Renewable Energy Policy (REP), 2007
The Renewable Energy Policy (REP) establishes a Standardised Power Purchase Agreement (SPPA)
and Feed-in Tariffs (FIT) for renewable energy generation projects. It introduces favourable financial
and fiscal regimes for RETs, including:
Preferential tax treatment or tax exemption, Accelerated depreciation, Provision of risk mitigation mechanisms and credit enhancement instruments, Credit mechanisms for renewable energy consumers.
The Rural Electrification Strategy and Plan (RESP) contains, amongst other things, information relating to renewable energy power generation for sale to the main grid and for mini-grids. The RESP
75

Final Report – Support study on Green Mini-Grid development
plans to connect over 500,000 new electricity customers to the main grid, independent grids, and to solar PV systems, with the support of local institutions (ERA, REA, REF, REB).
Furthermore, the creation of the Energy Fund seeks to provide a public financing source to support
or leverage private sector financing, in addition to providing for the construction of hydropower
projects and the associated infrastructure. Tariffs & Feed-in-Tariffs (FiT)
In the FY 2011/2012 alone, government budgeted for UGX 417 billion ($160M) on account of
subsidies to compensate electricity tariffs. By mid January 2012, the government addressed the huge
imbalance between average UMEME cost-reflective tariff of power (UGX 964/kWh or $0.37/kWh)
and the end-user tariff (UGX 382/kWh or $0.15/kWh) by allowing a tariff increase by an average of
55%. Currently, the end user retail tariff is based on consumer category (UGX 524/kWh or $0.20/kWh
for domestic) and is not anymore cross-subsidized over categories of customers.
Beside UMEME distribution, there are 5 other distribution companies with adapted tariffs for off-grid
and there is one off-grid generation and distribution company (Wenreco - West Nile Rural
Electrification Company Ltd) whose adjusted domestic tariff is UGX 367 or $0.14/kWh. Special tariffs
granted for mini-grids range from USD 0.18-0.23.
To promote the development and use of renewable energy sources and the private sector
generation, the government has developed a feed-in-tariff structure, called REFIT28
, which applies to
small-scale renewable energy systems, up to a maximum installed capacity of 20MW, as defined by
the Electricity Act 1999. For instance, the solar FIT (2011-2012) amounts to $0.362/kWh (< 2 MWp)
and the hydro FIT, depending on the size of the hydropower scheme (0.5-20MW), ranges between
$0.073 and $0.109/kWh, paid by the Uganda Electricity Transmission Limited (UETCL). Uganda
follows South Africa and Algeria with early feed-in tariff programs. However, Uganda appears to have
learned lessons from other programs worldwide. The Uganda program offers tariffs for a full suite of
technologies, including geothermal and bagasse, detailed hydro tariffs, as well as technology specific
program caps. Beside FIT and import duty reduction, there is no other subsidy for MGs.
Despite those incentive mechanisms, private sector is still reluctant to invest in rural electrification
sub-sector (low domestic connection and consumption rates). Very few private investments
occurred. Renewable & Off-grid solutions
There is strong political motivation to improve access to electricity for rural populations, particularly those not connected to the grid, and to promote renewable energies, esp. biomass and solar.
There are actually 3 diesel-based MG (2,84MW), 2 micro-hydro MG (360 kW) and 1 hybrid
Hydro+Genset mini-grid, run by Government. Prepaid meters, though not common in Uganda are
catching on under an Umeme project to install them.
Beside the large private and public investments in the power sector, the off-grid sub-sector didn’t succeed to take off yet and to involve private investors. 28
http://era.or.ug/tariffs/feedintariff147f/ 76

Final Report – Support study on Green Mini-Grid development
In the solar business, there are about 25 solar dealers in Uganda. Solar companies in general have
difficulties and/or low incentives to develop markets in rural areas and focus their interest on urban
areas. MEMD and GIZ have established a network of solar dealers and micro-finance institutions, in
cooperation with REA and PSFU.
The government is willing to put forward the hybrid technology. REA has budgeted for feasibility
studies in 2011-2012 for hybrid solutions in Koome and Buvuma islands (hybrid systems with wind,
solar and diesel sources). Presently, hybrid systems in the 5 kWp range have been implemented at
rural district headquarters and at a few industries. The deployment of this technology is still at infant
stage.
MHP feasibility studies are starting in 2013 under Dutch financing (ORIO) which should lead to the
construction of 10 mini hydro power stations around the country. Access to finance for private
investors and availability of management skills to operate micro hydro power plants are key barriers
to be addressed.
At present, the following institutions are supporting the Ugandan energy sector: KfW, GIZ, USAID, DFID, EIB, EU-Commission, WB, NORAD, IAEA, USTDA, IDB, UNDP, UNIDO, AdDB, JICA, NDF and SIDA. https://energypedia.info/wiki/Uganda_Energy_Situation#Energy_Situation http://www.reegle.info/countries/uganda-energy-profile/UG
4.4.7 Democratic Republic of Congo (DRC) In 2011, DRC was classified as a LIC and FCAS with a very high Fail State Index (FSI – Rank n°2) measuring stability and security, as shown on the world map below (www.fundforpeace.org). The country is characterised by the highest hydro potential in Africa but a medium density of
population (~30 people/km² as shown in above DRC map29
) non-uniformly distributed30
and a low
level of infrastructure development. The national grid operated by SNEL utility is about 4000km HV
lines and reaches in 2009 an electricity access of 11% (<2% rural) for a population of 71.7 million
people (66% rural). There are 2 interconnected networks (West around Kinshasa; South around
Lubumbashi), one isolated Eastern network around Bukavu and some autonomous ones. 29
“Hydrological modelling of the congo river basin: a soil-water balance approach”, Josué Bahati Chishugi, 2008 30 http://wwf.panda.org/what_we_do/where_we_work/congo_basin_forests/congo_basin_forest_information/maps_congo _basin/
77

Final Report – Support study on Green Mini-Grid development
Installed capacity in DRC was 2475 MW (98.7% hydro) in 2008 but available power was much lower. The country is a net exporter to Congo (Brazzaville) and Zambia.
The Ministry of Mines and Energy is responsible for the setting of electricity tariffs and procedures for the extension of the grid, as well as monitoring the country's IPP projects.
The SNEL utility is a subsidiary of the Ministry, reports directly to the Ministry and acts to ensure its
own operational standards. There is no dedicated energy industry regulator, and SNEL is largely self-
regulating. Their infrastructures are very poor and degraded (war).
The National Energy Commission (CNE) is responsible for monitoring the energy sector in the country
and is directly responsible for the renewable energy sector of the country (for RE). There is no
specific RE agency in DRC. But there is a National Agency for Rural Energy Services (ANSER) with a
dedicated unit for rural electrification.
Due to the unreliability of the national grid, approximately half of the DRC’s generation capacity is
owned and operated by private companies for self-generation, one of the highest proportions in
Africa.
The power sector is under reform and a revised Energy Policy is under preparation/validation, which
will promote RE programme, independent regulation, private-public partnership (PPP) and
independent power producers (IPP).
At this stage, there is no subsidy or incentive mechanism for investments in the power sector but a
new Electricity Act is under promulgation (since January 2011) to clarify the reform and proposing
liberalisation of the electricity sector, and creating free and fair codes of competition, protecting
both users and operators. 2 models are prioritised in the Electricity Act: the Creative Concessions for
large areas and the Electricity Community Cooperatives (Practical Action, 2009). It also includes
consideration for the creation of the rural electrification agency, which should be in charge of
managing the funds and allocating the subsidies to ensure that rural electrification is also targeting
low-income populations. Permits are required to construct (simplified standards) and operate MG,
including environmental impact assessment study. However, no law exists to promote renewable
energy technologies, nor regulations for their use.
End-users tariffs are not uniform and special tariffs apply for rural MG. The diesel price ($1.45/litre) is
not tax exempted. There are fixed FIT tariffs for selling electricity to the main grid: $0.05-$0.10/kWh
for diesel-based generators. Not yet fixed for biomass/solar/wind.
The National Department for New & Renewable Energy (SNER) is the recent institution dealing with
renewables. REN potential (hydro, biomass, wind, solar) has been assessed by CNE (list and maps; no
GIS). Only few particular hotspots in the country have been identified, at Ugoma, where wind speeds
are in the 6-6.6 m/s range, and potentially in Munkamba, Lukalaba and Inongo.31
According to the scoping study32
conducted by Practical Action in 2009 (supported by DFID), micro
hydropower was scored the highest and priority interventions should be focused on selected schemes in this field. However, many villages do not have mini or micro hydro potential. A mix of 31
http://postconflict.unep.ch/publications/UNEP_DRC_renewable_energy_FR.pdf
32 Review & appraisal of potential transformative rural energy interventions in Congo Bassin, Practical Action, DFID, 2009
78

Final Report – Support study on Green Mini-Grid development
technological options (for instance micro hydro power, small biogas units and river turbines) should
be considered to ensure that some rural areas are not excluded from the future rural electrification
programme.
There are currently 42 diesel-based power plants from which 27 are isolated supplying MG (39MW)
run by privates IPPs and public entities and 4 hydro-based MG (50MW installed – 20MW available)
run by IPPs. Micro- or mini-hydro projects for rural electrification are of new interest for
Government. Very little work has been done with small scale hydropower.
In addition, there are 836 individual solar systems, with a total power of 83 kW, located in Equateur,
Katanga, Nord-Kivu, Kasaï, and Bas-Congo. Wind energy is not used in DRC, except some small pilot
schemes.
But there is no real experience with hybrid systems or solar/wind MG, except 2 hybrid plants (5,5kW hydro + 150Wp PV + battery) in Kikimi & Manenga (2004). Planned electrification projects include:
In the short term, there are priority electrification projects for urban and rural areas, using micro-hydro plants
Electrification of 347 centres via micro-hydro plants, over 20 years
3 years action plan (CNE) to electrify several decentralised rural centres with REN ($17M): 11
micro-hydro schemes (4,5MW), 11 villages/centres with stand-alone solar systems (100kWp),
and wind study & speed measurement. (MME, CNE, SNV, KfW)
Other projects under various programmes (UN-REDD, CARPE) Barriers:
The country lacks of policy framework, institutional capacity, independent regulatory body,
proven financing mechanisms and business models to develop MG and promote private
sector investment and involvement.
High-risk environment for private investors in the country http://www.reegle.info/countries/congo-dem-rep-energy-profile/CD http://postconflict.unep.ch/publications/UNEP_DRC_renewable_energy_FR.pdf
4.5 Other Countries 4.5.1 Somalia
Somalia was classified in 2011 as a LIC and FCAS with the highest Fail State Index (FSI – Rank n°1) in
the world. All social and economical activities are hindered by the internal security situation and the
multiple sovereignty issues. Somalia is currently divided into three regions: Somaliland, Puntland and
South and Central Somalia (cf. map below).
79

Final Report – Support study on Green Mini-Grid development
For economic reconstruction and nation building, sustainable sources of energy will be needed, combined with more efficient use of existing energy sources.
Somalia is rich in energy resources (oil and natural gas, hydropower, wind, solar). The major
obstacles to the development of these available energy resources are political, financial and
institutional. The total installed electricity capacity was 80MW in 2006 (100% thermal). Today’s capacity is 65MW (77MW in 2010) but less than 50% is available. Moreover Somalia has the lowest consumption of
modern forms of energy (33kWh/capita) in the Sub-Saharan Africa. 95% of the poorest households in
the country do not have access to electricity (9.8 million people - 2011). Moreover electricity prices
are very high ($0.8-$1/kWh).
Diesel generators are the main source of energy and the country relies heavily on imported
petroleum for production of electricity. Hydropower was not generated in the past. IRENA and REN
database mentions an installed hydro capacity of 4.8MW. The 3 regions have their own separate electricity networks.
In Somaliland, the grid is operated by SECO (electric utility) and there is an energy agency.
In Puntland, electricity provided by NEC is mainly accessible to major towns like Bosaso.
In South and Central Somalia, 60% of households in Mogadishu and 23% of households in Merka have access to electricity for lighting.
Nugal Electrical Company (NEC – formerly NEPA) is a public/private company based in Puntland State
and is the main electricity supplier in Somalia. NEC generates, transmits and distributes electricity to
the immediate area. There are several other electrical companies.
The Transnational Industrial Electricity and Gas Company (TIEGC) is a recently formed conglomerate of five companies from the Mogadishu area, created in to provide energy security in the region.
Throughout the country, there were about 80 state owned oil-fired thermal and diesel power plants,
which relied on petroleum. Now power generation and distribution is decentralized and private
sector based (only 7% of production is attributed to public agencies). Electricity is also produced and
supplied in parts of some cities with privately owned generators, most are second-hand from Dubai.
Providers frequently combine this business with either telecoms provision or importation of fuel. The
available choices for electricity provision are tailored to customer needs (evenings only, daytime
only, or 24 hours). The providers also do not use meter but charge based on the number of light
bulbs in the house.
A socio-economic survey was undertaken in 2006 targeting 200 households in urban and peri-urban settlements, commercial enterprises and service institutions.
The country does not have mechanisms to regulate electricity generation, transmission and
distribution. The petroleum sub-sector is also largely unregulated. There is no central authority to
deal with licensing, setting standards and monitoring operations of numerous private electricity
producers. As there is no dedicated regulator, energy companies in the country have the
80

Final Report – Support study on Green Mini-Grid development
responsibility to self-regulate, in so far as possible. The government has taken a limited role in energy regulation in recent times, primarily due to the extended conflict.
The Somaliland government is in the process of creating institutions to coordinate various energy
sub-sectors. Currently, there are seven government ministries involved in the energy sector; which
largely operate independently and have limited capacity to develop, enforce and monitor the sector.
Until recently the current energy planning procedure was not clearly defined due to the war.
Development partners (ADRA Somalia) have assisted the government in Somaliland in developing a
framework for energy policy making and planning and are facilitating an energy policy initiative
Somaliland's Energy Policy Dialogue (SEPD) launched in 2006. A Rural Electricity Distribution Master
Plan was under preparation in 2009. An Energy Policy has been issued for Somaliland (March 2010 –
ADRA/EU/MWEMR) which propose energy planning, new regulation for sustainable energy &
renewable energy development, private sector promotion, adequate institutions (Energy Commission …) and capacity building.
The Somali Association for Sustainable Energy and Development (SOMASED) is dedicated to
providing the government, NGOs, donors and private companies in Somalia with awareness and
expertise in the field of sustainable energy and distributed renewable electricity generation systems.
Detailed data on renewable energy potential and activities exist and can be summarized as follow:
Hydro potential is estimated at 100-120 MW. Before the war (<1985), only 4.8 MW was
exploited on the lower Juba valley. No updated data available.
Solar energy (5-7 kWh/m2/day average irradiation) is more and more used for off-grid generation in the country and becomes increasingly popular. Total installed =25kWp.
With wind speeds varying from 3-11.4 m/s, there are several promising wind sites on the
coast. Four 50 kW turbines were installed in Mogadishu in 1988, and several wind-driven
water pumping. INENSUS recently carried out a design study about a wind-solar hybrid
system to cover the electricity demand of GIZ Office.
Wooded areas in Somalia have been drastically reduced over the last 30 years due to overexploitation (less than 10% left) and cannot be considered for power generation.
The Somalia Energy and Livelihoods Project (SELP), launched in 2007, aims to increase access
to renewable energy sources and reduce poverty within the states of Puntland and
Somaliland in northern Somalia.
The energy sector has operated in a policy vacuum, with no legal and regulatory framework primarily
due to the extended conflict. Inadequacy and lack of clear policies and lack of regulatory framework
are still the key restraining factors for REN development.
DFID/ICF has investigated how to develop a hybrid MG project to support the health sector in
Somaliland suffering from lack of energy. Detailed information about needs, consumption and
expenditure has been collected. Accordingly, the private solar business is rather active in the 3
regions with growing skills and expertise for installation and maintenance. Beside O&M capacity, the
technology design should remain simple and reliable in such precarious environment. Key issues for
81

Final Report – Support study on Green Mini-Grid development
such public infrastructures will be to secure the equipment (thefts) and to ensure sustainability with appropriate financing mechanism for O&M and for long-term replacements (battery).
(Map from Reegle33
, 10 Mar 2012) 4.5.2 Nigeria
With the highest population in Africa and a poor & unreliable national grid, Nigeria has a tremendous
potential for rural MG and for REN development. The supply-demand gap existing in Nigeria is
estimated at about 12,000 MW due to huge lack of infrastructure investment. In the last decade,
many studies have been conducted to improve energy access (ESMAP, HELIO, GEF, CIF) but very little
progress were made. Only few small local or private initiatives have been successfully implemented.
E.g. an independent mini-utility (Bonny Utility Company) started as a corporate social responsibility
CSR initiative, distributing high quality power with smart customer management, becoming a
sustainable business.
Rural electrification has been poorly addressed until now (26% rural electrification rate in 2010) but
new REA aims to develop MG and hybrid systems. A RE master plan should be prepared soon and an
adapted policy framework (IPP, FIT) has been prepared for REN. Nigeria has abundant REN resources
but fuel prices are very low, as well as kWh grid prices, and restrain the potential development of
REN. CNG or LPG power plants for off-grid and on-grid are the most cost-effective alternative in the
South part.
There is no evidence of any GMG or hybridization projects at this stage. Only MG for isolated sites or IPP for grid injection operated by oil companies in the South have shown sustainability.
One of the longest, most successful generation projects in Nigeria is the small hydro mini-grid
operated by NESCO in Jos region. Another GMG project has been identified with UNIDO/GEF (SPWA-
CC – 2009-2015) using biomass gasifier and mini-hydro sources to augment rural electrification and
productive uses (2-5MW gasifier under implementation). The SunGas project has a demo gas plant
and a pilot REN projects in 2 southern states co-financed by EU (2009-2014, 2.5 M€ grant).
Nigeria is a very dysfunctional and unsafe place to develop businesses and infrastructure projects. Main barriers are safety in the North, social and institutional complexity and financial risks. Many
33
http://www.reegle.info/countries/somalia-energy-profile/SO 82

Final Report – Support study on Green Mini-Grid development
international investors and donors are watching the political situation while waiting for favourable conditions. 4.5.3 Ethiopia
In Ethiopia, the responsibility for rural electrification is clearly split. The state-owned power
corporation undertakes all national grid extension projects, and the REF supports private off-grid
electrification. The REF has five unique aspects:
There are no investment grants;
Village electricity cooperatives own and manage the isolated grid projects,
The REF has no permanent staff, only consultants working on 1-year contracts while staff from existing institutions provide ad hoc assistance;
Off-grid is for communities located 100 km or more from the national grid,
Government staff (not private consultants) assists communities in project preparation and implementation.
4.5.4 Mali
Energy policy in Mali aims at the implementation of RE projects by the private sector with private
operators or concessionaires. Substantial subsidies (between 70% and 80% of the investment costs of
RE projects (generation and distribution), including vehicles and office equipment) are provided to
that end. Donors provided the bulk of the subsidies. This scheme, which is managed by AMADER, has
been quite successful when considering that almost 100 projects have been implemented or is
currently being implemented, supplying in total about 70,000 customers.
Grid extension forecast 2020 – 2030 does not exist but the electrification rate was 17% (5% in rural
areas) in 2007. Today, rural electrification in Mali is actively supported by AMADER, which manages a
REF fund to centralize various financial supports and implements RE projects following 2 approaches:
Bottom up: “spontaneous” private initiative (“PCASER”)
selection of projects based on the promoters’ ability to develop and operate a viable project with a fixed investment subsidy (80%, $500.000 max).
Top Down: Priority Electrification Zones (“ZEM”)
AMADER solicits bids for the electrification of designated areas. Selection through direct competition among bidders. Promoters submit proposals in response to calls and projects are selected on the basis of lowest tariff. In poorer rural areas, where sponsors are hard to come, REF finances feasibility studies and put projects up for bidding. Lowest tariff wins.
Tariffs of EDM national grid are uniform but tariffs of mini-grids set up by private operators can be
adapted to recover operation costs. Most private-run MGs are fuel-based and have increasing
operating costs. Fuel tax exemption (450FCFA) is hard to get for operators and most of them pay the
pump price with VAT (640 FCFA).
83

Final Report – Support study on Green Mini-Grid development
AMADER tries to narrow the differences of tariffs by introducing a fixed fee (2500 to 4000 FCFA) in
addition to the kWh tariff (200-220 FCFA). There is no official FIT for grid sales but similar tariff (215
FCFA) is used for private solar plants and 60 FCFA/Wp/month for individual SHS.
There were 93 PCASER projects (diesel or solar) run by privates in 2012 (70.000 customers). Part of
them is too close to EDM grid and is handed back to EDM to standardise the tariff (social constraint).
Compensations and subsidy reimbursements are being considered. Some PCASER projects are
stopped due to lack of skills or profitability of operators.
REN potential has been assessed but solar energy has by far the best potential compared to hydro, wind and biomass; solar is actively promoted by AMADER. One wind-diesel hybrid system at Nara has never really worked (failure case).
216 kWp system implemented in 2011 (largest installed PV/diesel hybrid mini-grid of Africa) thanks to cooperation between EDM and a private operator with funding from a Malian Bank.
In 2012, the World Bank and the ADB are funding a project (SREP) to implement PV arrays in existing diesel power plants in 40 localities for a total of 5 MWp PV.
Another program managed by AMADER is currently hybridizing 17 localities for a planned total of 1 MWp PV power.
Several private operators plan to add PV capacity (20 - 300 kWp) to their diesel power plants to lower the costs (Kama SA, SSD Yeelen Kura, Tilgaz).
All those implemented solar-based projects (SHS, solar mini-grids, hybrid power plants) are
impressive in numbers and in number of targeted people but the private operators are struggling to
get tax exemption and to recover their operating costs. 4.5.5 Senegal
Within the scope of the local rural electrification initiative (ERIL) projects, PERACOD and the
Senegalese Rural Electrification Agency (ASER) have implemented the ERSEN project (Électrification
Rurale Sénégal). Financed by the Directorate-General for International Cooperation (The
Netherlands) and implemented by the German-Dutch partnership “Energising Development”, ERSEN
is a project promoting the use of renewable energies in isolated zones where classical means of
electrification, such as the extension of the main grid, are difficult to realise. ERSEN aims to electrify
265 villages. In most of these villages solar-diesel hybrid solutions are used to produce electricity.
Senegal has been one of the most active African countries in the implementation of hybrid
technology. With Isofoton from Spain, a 13 billion FCFA program has implemented 9 hybrid power
plants in remote areas and islands in the Saloum delta to provide electricity service to 5000
households and several productive activities. In association with GIZ and DGIS Netherlands, a 685
million FCFA program has implemented 16 hybrid power plants (5kWp PV, 11 kVA diesel each) and an
extension of this program plans to add 50 more hybrid systems. Two larger hybrid power plants are
planned on islands in Casamance (30 kWp PV and 50 kVA diesel each).
84

Final Report – Support study on Green Mini-Grid development
More recently, Inensus is currently operating a purely private rural electrification project in Senegal.
They have developed their own technological solution, and their own business model. There was
initial support through GIZ under a PPP. According to the company and observers, the project is
functional, i.e. costs are covered, and users are paying. The problem seems to be replication, which
seems to have more to do with the regulatory side than with the approach as such, again, according
to these sources. 4.5.6 Mauritania
Characterised by its very low population density and scattered settlements, Mauritania has
experienced many off-grid diesel mini-grids in the past; many of them (power plants for
administrative centres) are run at high costs by the national utility SOMELEC with a uniform tariff.
The ADER agency in Mauritania is in charge of the rural electrification outside SOMELEC perimeter
and provides either individual systems (20-300Wp for domestic, community or productive uses) or
recently hybrid systems as one wind/diesel MG on the coast and 6 solar/diesel MG (20-25kWp)
across the country (under implementation).
Another agency (ACCES) has also implemented RE projects: 26 diesel-based MG, 26 localities with individual solar kits and 14 multi-functional solar platforms. 4.5.7 Burkina Faso
Even if in Burkina Faso, the regulatory framework allows private companies to develop APS projects,
as well as local communities, the very low profitability and the risks attached to this activity
prevented the development of private project holders. APS projects are funded by the national
Electrification Fund (FDE) through local cooperatives. Under these rural electrification projects,
private companies are involved as contractors through tender procedures for construction attached
to a mandatory O&M contract for 5 years, and they generally withdraw at the end of the 5-year
contract. There are around five of such private operators today, typically operating in a single
locality. The captive power and B-2-B segments have not developed so far. The regulation body ARSE
was created in 2010 but its activities are today very limited because of limited budget.
Burkina Faso’s Fund FDE has initiated a project in 2012 to add solar PV component to existing diesel
power plants in the Sahel region. A previously installed PV array in the diesel plant of a remote
locality in Sahel will soon be connected to the main grid. 4.5.8 Philippines
In the Philippines, the Small Power Utilities Group (SPUG) of the National Power Corporation is in
charge of generating power for areas that are not connected to the main grid. Except for one hydro
plant, all of SPUG’s plants are diesel generators, including rented equipment. The generated power is
transported on SPUG’s transmission system to the grid of distribution utilities, most of which are
electric cooperatives. SPUG’s generation has in recent years been increasingly replaced by so-called
New Power Providers (NPPs). The NPPs are private companies, which took over and overhauled SPUG’s plants or constructed new power plants, including hydro plants. That policy has reduced generation costs substantially and improved the quality of power supply (less supply interruptions).
The policy to make private investors engage in generation and distribution in rural areas, referred to
as Qualified Third Parties (QTPs), has been less successful. By the end of 2011, there was only a single 85

Final Report – Support study on Green Mini-Grid development
private company operating as QTP, supplying about 1400 customers in the Rio Tuba area on the
island of Palawan. The generation equipment consisted at that time of a 420 kW diesel plant to
which a 70 kW gasifier fuelled by coconut and wood chips was planned to be added. The
cumbersome process of becoming a QTP and the reluctance of ECs to waive parts of their franchise
area for QTP involvement are important reasons for the poor results of the QTP policy. 4.5.9 Cambodia
In Cambodia, electricity is generated by EDC (Electricité du Cambodge, the national utility), by
Independent Power Producers (IPPs) and by consolidated licensees. The latter have been provided a
combined generation and distribution license by the EAC – Electricity Authority of Cambodia.
National production accounts only for 38.5% of the total power needs; the rest is met by imports.
Most electricity is imported from Thailand (74.7% of total imports).
There are today about 200 Rural Electrification Enterprises (REEs) that are either power generation
and distribution companies or pure distribution companies, owning their generation / distribution
infrastructures. The private operators with a power generation activity benefit from an attractive
tariff system which is fixed by the EAC. This environment helped the development of the REE model.
At this early stage of power and energy sector development in Cambodia, integration of financing
mechanisms for the private sector is a key to success. In the current Cambodian context, the key
element consists in enabling the REE to mobilize the needed financing, predominantly for the
distribution network (connection to the national grid and distribution within villages). 4.5.10 India
In India, even though more than 90% of villages are electrified, household connection rates remain
below 50% in a number of rural areas, and hamlets around villages, often remain unserved. Further,
due to insufficient power available on the interconnected grid, a number of villages and industry
undergo frequent brownouts, thus having to resort to their own backup power – e.g. diesel
generation for irrigation or cottage / small scale / large industry.
Insufficient power supply has been a constant issue in India, and legislation has been formulated and
implemented since the 1980s to allow and encourage industry to develop their own captive power,
self generation with sale of excess power at favourable rates to the grid with an obligation to
purchase from the grid, particularly for renewable energy (wind, hydro, cogeneration – bagasse and
otherwise); wheeling and banking of power along with other incentives has been one of the
cornerstones of wind power development in India. Some argue that the regulatory framework and
fiscal incentives led to a number of free riders in the early days, nonetheless it remains that hundreds
of MW are installed under the 2 first APS schemes, and India offers a very interesting context to learn
lessons from:
Captive power and self-generation with surplus power sold off-site
Private to private (P2P) sales through wheeling arrangements
The focus in India from the start has been on grid expansion, industrial development, and rural
electrification for irrigation, and mini grids for RE are of a relatively more recent development. After a
period of more than 5 decades focusing on grid expansion, the Government of India launched in
86

Final Report – Support study on Green Mini-Grid development
2005, the RGGVY – a programme aiming at 100% village electrification providing 90% capital subsidy
(as these are all remote villages) for Rural Electricity Distribution backbone, Village Electrification
Infrastructure and Decentralised Distribution Generation (DDG), earmarking $13 billion for the
programme. DDG is developed in close collaboration with the MNRE, with the challenge in 2005 of
providing 420000 villages, earmarking a budget of $135M at the launching stage – and focusing on
renewables (biogas, mini hydro, gasification, biomass)
Understanding the utilities would not extend services to the remote villages, the RGGVY fostered
legislation authorizing franchisee systems – the franchisee can be and NGO, user association,
cooperative, Panchayati Institution (commune), an entrepreneur.
Hence, a few hundred projects (a few thousands including hydro < 5MW) have been installed in India under the following schemes:
Mini-grids, where electricity is generated and sold via a privately-owned or operated
distribution network to residential and/or commercial end users or co-operatives; and
Coordinated supply of individual power generation or storage units (such as rooftop PV or battery/power box rentals).
4.5.11 Vietnam
With rapid growth and expansion of the Vietnamese economy for the last decade, power demand
has been increasing dramatically. With an average annual growth of power demand of 14.5 % from
2001 to 2010, electricity demand reached 86.5 TWh in 2010, 3.5 times greater than demand in 2001.
Under current mechanism, power development was facilitated not only by EVN’s (Vietnam Electricity,
vertically integrated power utility in charge of development, management and operation of the
state’s electric power industry assets) own investment but also under BOT (Build-Operate-Transfer)
and IPP (Independent Power Producer).
According to report by Nguyen Anh Tuan (ADB, 2010), the existing models of rural electricity management in Vietnam fall into six categories:
Provincial utilities: EVN (Electricity of Vietnam), which is represented by the provincial
electricity company, would invest in and expand the electricity grid and sell electricity to
customers at the official price dictated by the government.
Private electricity agent (bidder) in the commune: the electricity network investment is
funded by the local budget including households’ contribution. Thereafter a private agent is
selected to manage the electricity network and sell electricity to customers. This model has
been made illegal by the IMC 01/1999, because the local authority could not control the
electricity price, resulting in very high prices.
Private local enterprise: Provincial People Committee grants a decision to form a provincial
company to supply services of electricity and water. This company has responsibility to build
the electricity grid in the province; to buy electricity at the substation meter and to sell
electricity to customers at the price which is determined by the provincial People’s
Committee. The electricity price is specified by the local authorities while costs of operation, repair and management are not specified.
87

Final Report – Support study on Green Mini-Grid development
State enterprise (local level): a state owned enterprise builds the electricity network, buys
bulk electricity at the substation and sells it to customers at the price which is approved by
the local authorities. The notable point here is that electricity is only one of a number of
fields of business of the company.
Electricity service cooperatives (ESCOOP): With these cooperatives the share of assets invested by the local budget should be rented by the cooperative.
Commune electricity groups (CEG): The Commune People’s Committee forms a commune
electricity group or authorizes an existing agriculture cooperative to buy bulk electricity at
the meter installed in the MV substation and then to sell electricity to customers. Electricity
prices vary sharply across communes.
The pressure to meet soaring power loads, urgently mobilize investments for new capacity
construction, and ensure that the new corporate configurations and institutions being created for the
reformed and restructured power industry will best serve long-term needs, combine together with
ambitious electricity access for all households will be probably the most critical juncture of the
country’s power development.
The question arises: Can the remarkable success in rural electrification in Vietnam be shared with
other countries? Enabling political and socioeconomic conditions that contributed to Vietnam
success may not be replicable in other countries. Nonetheless, Vietnam case can provide useful
lessons from its experience in adaptive and dynamic combination of all factors: strong leadership,
commitment of all stakeholders, national-wide mobilization of participative involvement and
finances, innovative management models and technical solutions.
88

Final Report – Support study on Green Mini-Grid development
5 Annex 2
5.1 Definition of Electrification Levels
There is no standard definition for describing the level of electrification in a country; this generates much confusion in communications.
In the Global Tracking Framework of the SE4All, the Electricity access has been recently defined as
the availability of an electricity connection at home or the use of electricity as the primary source for
lighting. (Box O.1, p.14, Vol 2, SE4All Global tracking Framework) The next table provides other definitions of common terms used in literature.
Table 18: Definition of Electrification Levels
Electrification level ECOWAS CLUB-ER
Coverage rate % of the population living in areas number of electricity-supplied where the service is available localities /total number of localities (traditional rate of electrification)
Access rate % of the considered population number of households in which is effectively connected to electricity-supplied localities / the considered service total number of households (% of households potentially having access to electricity)
Dispersion rate number of electrified localities /
total localities
Penetration rate number of households effectively connected / total number of households (% of households effectively having access to electricity)
Another interesting definition of an electrified village (in India) (at least 10% of the total number of households in the village and infrastructures should be connected) is given in:
http://rggvy.gov.in/rggvy/rggvyportal/index.html
Table 19: Access Levels to Electricity (and non-solid fuels) in ICF Priority Countries
Access to Electricity (% of population ) Access to Non-Solid Fuel (% of population) Total Rural Urban Latest Available Total Rural Urban Latest Available
Region Country 1990 2000 2010 2010 2010 Source/year 1990 2000 2010 2010 2010 Source/year SSA Tanzania 7 9 15 4 46 DHS2010 <5 <5 6 5 16 DHS2010
SSA Rwanda 2 6 11 4 40 EICV32011 <5 <5 <5 <5 5 NatSur2007
SSA Uganda 7 9 15 5 67 DHS2011 <5 <5 <5 <5 11 DHS2009
SSA Malawi 3 5 9 4 37 DHS2010 <5 <5 <5 <5 11 DHS2010
SSA Mozambique 6 7 15 2 45 DHS2009 <5 <5 5 5 10 MICS2008
SSA DRC 6 7 15 3 39 DHS2007 <5 <5 7 5 14 DHS2007
SSA Sub-Saharan Africa 23 26 32 14 63 Aggregated 14 17 19 6 42 Aggregated WOR World 76 79 83 70 95 Aggregated 47 54 59 35 84 Aggregated
Source: Box O.1, p.14, Vol 2, SE4All Global tracking Framework
89

Final Report – Support study on Green Mini-Grid development
5.2 References & Bibliography General information
“Prospects for African Power Sector”, IRENA, 2011
“Renewable Power Generation Costs in 2012: An Overview”, IRENA, 2013
http://www.irena.org/menu/index.aspx?mnu=Subcat&PriMenuID=36&CatID=141&SubcatID
=277
“IEA’s World Energy Outlook”, WEO, 2011 -
http://www.worldenergyoutlook.org/resources/energydevelopment/energyaccessprojection
sto2030/
“ECOWAS Renewable Energy Policy” (EREP – 2012), ECREEE, 2012 “Pico Solar PV systems for remote homes” (Jan 2013) by Task 9 of PVPS-IEA “Towards Achieving Universal Energy Access by 2030”, Energy Access Practitioner Network,
United Nations Foundation, UN-SEFA, June 2012 "Renewable energies in Africa - Current knowledge”, Scientific and Technical report, JRC-EU,
F. Monforti, 2011 -
http://publications.jrc.ec.europa.eu/repository/bitstream/111111111/23076/1/reqno_jrc67
752_final%20report%20.pdf “Technical Specifications IEC 62257, a set of standards for mini-grids”, IEC, “Mini-Grid Design Manual”, ESMAP-WB, 2000 “Rural Electrification Through Decentralised Off-grid Systems in Developing Countries”,
Subhes Bhattacharyya, Springer, 2013 “Delivery Models for Decentralised Rural Electrification”, iied, A. Yadoo, 2012 “Technical Brief: Building the Evidence Base for Green Mini-Grids”, CEG, A. Yadoo, 2013 “Hybrid Mini-Grids for Rural Electrification: Lessons learned”, ARE-USAID, 2012
“Demonstrating a Viable Business Model in Africa & Asia” (Clean Energy Hybrid Mini-
Grids), Dean Cooper, Feb. 2013 (+ .ppt)
“Rural Electrification with PV Hybrid Systems - Overview and recommendations for further deployment”, IEA PVPS Task 9, IED (GL), Feb 2013
“Recent practices from Africa’s Rural Electrification”, EUEI PDF, Oct 2011, R. Karhammar
“Renewable Energy Technology Cost Review”, Melbourne Energy Institute, Technical Paper
Series, Patrick Hearps & Dylan McConnell, March 2011 -
http://www.energy.unimelb.edu.au/documents/renewable-energy-technology-cost-
review-0 Some key programmes
Endev: https://energypedia.info/wiki/Energising_Development_(EnDev)
SREP: https://energypedia.info/wiki/PREP_Highlight:_Scaling-up_Renewable_Energy_Program_(SREP)
GEF-SPWA: http://www.ecreee.org/fr/node/3945 PVPS –T11: http://www.iea-pvps-task11.org/
90

Final Report – Support Study on Green Mini-Grid Development
Chapter 2: Potential of Mini-Grids
TABLE OF CONTENTS
KEY HIGHLIGHTS .......................................................................................................... 4
1 INTRODUCTION ..................................................................................................... 9
2 INTEGRATED PLANNING METHODOLOGY .................................................................... 11
3 ADAPTED METHODOLOGY WITH DETAILED GIS DATA ................................................... 12
3.1 Key Preamble .............................................................................................................. 12
3.2 Density Analysis .......................................................................................................... 14
3.3 MV Grid Analysis ......................................................................................................... 15
3.4 Identification of Mini-Grids .......................................................................................... 17
3.5 Energy Demand Assessment ........................................................................................ 19
3.6 Avoided Carbon Emission Assessment .......................................................................... 20
3.7 Greening Mini-Grids .................................................................................................... 21
4 SIMPLIFIED METHODOLOGY WITHOUT DETAILED GIS DATA ............................................ 27
4.1 Extrapolation Method .................................................................................................. 27
4.2 Green Resource Assessment ........................................................................................ 29
5 POTENTIAL MG ASSESSMENT RESULTS ..................................................................... 30
5.1 Tanzania ...................................................................................................................... 30
5.2 Kenya .......................................................................................................................... 37
5.3 Rwanda ....................................................................................................................... 42
5.4 Malawi ........................................................................................................................ 45
5.5 Uganda ........................................................................................................................ 48
5.6 Mozambique ............................................................................................................... 52
5.7 DRC ............................................................................................................................. 54
6 COUNTRY COMPARISON AND CONCLUSION ................................................................ 57
6.1 Country Comparison .................................................................................................... 57
6.2 Conclusion ................................................................................................................... 61
7 ANNEX: GEOSIM® METHODOLOGY.......................................................................... 63
7.1 Spatial Analyst ............................................................................................................. 63
1

Final Report – Support Study on Green Mini-Grid Development
7.2 Demand Analyst .......................................................................................................... 65
7.3 Network Option........................................................................................................... 66
7.4 Distributed Energy ....................................................................................................... 66
7.5 Conclusion ................................................................................................................... 67
LIST OF TABLES AND FIGURES Figure 1 – MG potential in ICF countries for scenarios min & max (IED, 2013) ...................................... 7
Figure 2 – National population density & access to electricity in Africa (UNDP, 2008) .......................... 9
Figure 3 – Settlements & electrical grid networks in Cambodia and Madagascar (IED, 2013) ............... 9
Figure 4 – Conventional (yellow) and new (green) RE planning approaches (IED, 2013) ..................... 11
Figure 5 – Sensitivity Analysis in Tanzania ............................................................................................ 13
Figure 6 – Density Scoring Model ....................................................................................................... ... 15
Figure 6 – Grid Extension Cost (indicative)............................................................................................ 16
Figure 7 – Scoring Model .......................................................................................................... ............. 17
Figure 8 - Density Level ............................................................................................................... .......... 18
Figure 9 - Distance to MV grid ........................................................ ....................................................... 18
Figure 10 - Final Score ................................................................................................................. .......... 18
Figure 11 – Number of MG vs. distance between EAs .......................................................................... 19
Figure 12 – Total energy consumption vs. village population ............................................................... 20
Figure 13 – Average specific flow rate in Africa .................................................................................... 22
Figure 14 – Energy Production and Consumption ................................................................................. 25
Figure 15 – Solar Radiation in Africa ..................................................................................................... 26
Figure 16 - Tanzania Situation Map ............................................................................................... ........ 31
Figure 17 - Tanzania Map of Mini-Grid Potential .................................................................................. 35
Figure 18 - Kenya Situation Map ........................................................................................................... 38
Figure 19- Kenya Hydro Resource Map ................................................................................................. 39
Figure 20 - Kenya Biomass Resource Map ............................................................................................ 39
Figure 21 - Kenya Wind Map ................................................................................................... .............. 40
Figure 22 - Kenya Solar Resource Map .................................................................................................. 41
Figure 23- Rwanda Situation Map ................................................................. ........................................ 42
Figure 24 - Rwanda Hydro Resource Map ............................................................................................. 43
Figure 25 - Malawi Situation Map ......................................................................................................... 45
Figure 26 - Malawi Hydro Potential ...................................................................................................... . 46
Figure 27 - Uganda Situation Map ........................................................................................................ . 48
Figure 28 - Uganda MV Network Map................................................................................ ................... 49
Figure 29 - Uganda Hydro Potential ...................................................................................................... 50
Figure 30 -Uganda Biomass Potential ................................................................................................... 50
Figure 31 - Uganda Solar Resource ....................................................................................................... 51
Figure 32 - Mozambique Situation Map ............................................................................................... 52
Figure 33 - Mozambique Electrified District Capital Map ..................................................................... 53
Figure 34 - DRC Situation Map ........................................................................................................... ... 54
Figure 35 - DRC Solar Potential .............................................................................. ............................... 55
Figure 36 – Electrification Options for ICF Countries ............................................................................ 60
2

Final Report – Support Study on Green Mini-Grid Development
Table 1: Data quality and availability .............................................................................................. 4 Table 2: Assumption for RET CAPEX & sizing ................................................................................... 5 Table 3: Max potential of GMG in ICF countries .............................................................................. 6 Table 4 : Electrification options in ICF priority countries .................................................................. 6 Table 5 : Key criteria for MG potential assessment (IED, 2013)....................................................... 13 Table 6: Emission factor per country ............................................................................................ 21 Table 7 - IREP region population and development poles .............................................................. 31 Table 8- IREP regions MV extension ............................................................................................. 32 Table 9 - IREP region mini-grids .................................................................................................... 32 Table 10 - IREP region green mini-grids source.............................................................................. 32 Table 11 - IREP regions stand-alone solution ................................................................................. 33 Table 12 - Tanzania Mini-Grid Potential ........................................................................................ 34 Table 13 - Tanzania Renewable Resource for Green Mini-Grids ...................................................... 36 Table 14- Kenya electricity customer statistics .............................................................................. 38 Table 15- Kenya Green Mini-Grid Potential ................................................................................... 41 Table 16 - Rwanda population density and distance from the MV network ..................................... 43 Table 17 - Rwanda Green Mini-Grid Potential Scenario 1 (100% Hydro).......................................... 44 Table 18 - Rwanda Green Mini-Grid Potential Scenario 2 (50% Hydro) ........................................... 44 Table 19 - Malawi Population density and distance to the MV Network ......................................... 46 Table 20 - Malawi green mini grid potential scenario 1 (50% Hydro) .............................................. 46 Table 21 - Malawi green mini grid potential scenario 2 (95% Hydro) .............................................. 47 Table 22 - Uganda Population density and distance to the MV Network ......................................... 49 Table 23 - Uganda Green Mini-Grid Potential ................................................................................ 51 Table 24 - DRC Green Mini-Grid Potential Scenario 1 (100% Hydro) ............................................... 55 Table 25 - DRC Green Mini-Grid Potential Scenario 2 (50% Hydro) ................................................. 56 Table 26 - Maximum Potential of Green Mini-Grid in ICF Priority Countries .................................... 57 Table 27 - Minimum Potential of Green Mini-Grid in ICF Priority Countries ..................................... 58 Table 28 - Grid Extension Potential in ICF Priority Countries .......................................................... 59 Table 29 – Electrification Options for ICF Priority Countries (Scenario Max.) ................................... 59
3

Final Report – Support Study on Green Mini-Grid Development
Key Highlights
a) Analytical Planning Methodology In the frame of the support study for DFID, IED was requested to present a replicable analytical approach to establishing optimal conditions for green mini-grids.
IED is currently using an integrated planning tool, GEOSIM1, for potential assessment and RE planning
purposes. For the scope of the present study, IED is proposing an ‘adapted methodology’, based on
GEOSIM software and on available national GIS data, to assess the potential for Mini-Grids (MG), and
in particular for Green Mini-Grids (GMG), in seven ICF priority countries (Tanzania, Rwanda, Uganda,
Malawi, Kenya, Mozambique, DRC).
IED's experience clearly shows that nowadays electrification planners have a clear preference for grid
expansion. Nonetheless, they are more and more concerned by the economic justification and are
aware of having mini-grids as part of their rural population.
b) Data availability & reliability However, RE planning and simulations with integrated planning software as GEOSIM require a wide
range of primary data for each country (spatial data, demand forecast, RET resources), which is out of
this study’s scope. Starting from our standard GEOSIM methodology (Cf. Annex), we have adapted
the methodology to 2 categories of countries to assess the potential for GMG based on different
renewable energy sources:
1. Adapted methodology (item 3) for countries having “Basic GIS data” (pop density, dist to
grid, RET resources) 2. Simplified methodology (item 4) for countries having “Non-GIS data” or where some critical
GIS data are lacking (pop density, MV km/region, RET resources)
Unfortunately, even if some key GIS data exists, such as in Kenya and Mozambique, we could not get
them from the national institutions during our field studies. The second ‘simplified method’ was
used.
The following table shows the data availability per type of data and indicates which methodology has been used per country.
Table 1: Data quality and availability
Type of methodology
GEOSIM
Adapted methodology
Simplified
Type of Data methodology
Population Village scale Enumeration Area National statistics
Data availability (Country2) (Tz) (Tz, Rw, Ug, Mw, Ke) (DRC, Mz)
MV Network GIS layer GIS layer MV network total
Data availability (Country) (Tz) (Tz, Rw, Ug, Mw) length (DRC, Mz, Ke)
Type of methodology Tanzania (4 Rwanda, Uganda, Malawi, Kenya, DRC,
applied regions) Tanzania (whole country) Mozambique
1 GEOSIM is a tool developed by IED to help decision makers with planning, distinguishing the grid expansion segment from
mini-grids and stand-alone systems 2
Ke = Kenya, Mw = Malawi, Mz = Mozambique, Rw = Rwanda, Tz =Tanzania, Ug = Uganda
4

Final Report – Support Study on Green Mini-Grid Development
The results obtained from this preliminary macro assessment in item 5 provide for each ICF country
as a first order of magnitude: (i) the population targeted by MG, by grid extension and by stand-alone
systems, (ii) the power & energy demand from MG, (iii) the share of renewable energy, and (iv) the
avoided carbon emissions. Those results are indicative and rely strongly on the choice of
variables/assumptions and on the quality of data available for the simulation.
Mini-grids can be of various types; covering only a village or connecting several villages with a MV
backbone. Our level of analysis (regional and country scale) does not allow us to go down in such
details, thus the parameter used to quantify the potential of mini-grid is the population that would
benefit from it, pre-feasibility studies would determine this point.
c) Choice of variables & key assumptions:
The choices of variables and assumptions are critical parts of the analytical approach. For preliminary
and replicable assessment, only technical variables have been considered namely (i) population
density, (ii) distance to the grid, and (iii) renewable resources. For pragmatic reasons, no politic,
social, economic parameters could have been integrated in our simplified approach. Software as
GEOSIM proposes such detailed analysis.
Based on detailed surveys and findings in Tanzania (IREP project), the following key thresholds have been considered for our assessment:
Population density:
o Scenario Max: > 250 inhab/km²
o Scenario Min: > 300 inhab/km² Grid distance:
o Scenario Max: > 5km
o Scenario Min: > 20km
Energy demand @ Year 5: 147 kWh/yr/pers
60% HH connection rate
5% HH consumption growth
Demographic data: population growth, adapted for each country Avoided carbon emission: technology penetration rate; national emission factor
Table 2: Assumption for RET CAPEX & sizing
RET Sizing assumptions
Hydro Rivers with more than 4 l/s/km² and more than 25m head across 5km buffer
Biomass Ton of biomass/electrical MWh;
Capacity > 50% Demand
Wind Locations at less than 20km from the shore (see, large lake, plateau) (arbitrary
choice)
Solar hybrid Rest of areas unserved by other renewables RET
5

Final Report – Support Study on Green Mini-Grid Development
d) Assessment Results The following tables summarize the results of our analysis & assessment for the potential for GMG
development (scenario max) as well as for alternative options (grid extension and stand-alone
systems). Given the lack of data, 2 hydro options have been considered for some countries (Malawi,
Rwanda, DRC).
Table 3: Max potential of GMG in ICF countries
Total
Mini-Grid
Win
d
Hyd
ro
Bio
mass
Solar
kTCO
2e
/Yr
Emissio
n A
void
ed
Population
Populati
on
(2013) (Scenario Max)
Kenya 43 629 394 10 181 127 (23%) 22% 10% 10% 63% 1 303
Tanzania 44 607 249 9 107 605 (20%) 10% 10% 18% 64% 1099
Malawi 95%Hydro 16 777 547
4 545 807 (27%)
5% 95% 0% 0% 674
Malawi 50%Hydro
5% 50%
0% 45% 510
Rwanda 100%Hyd 11 609 429
3 269 828 (28%)
0% 100% 0% 0% 512
Rwanda 50% Hyd
0% 50%
0% 50% 374
DRC 100%Hydro 75 210 198
4 389 275 (6%)
0% 98% 2% 0% 1308
DRC 50% Hydro
0% 50%
2% 48% 985
Uganda 34 758 001 2 256 931 (6%) 22% 58% 2% 18% 275
Mozambique * 24 096 669 133 880* (1%)* - - - - -
Total 100% Hydro 250 688 487
33 884 452 (14%)
16% 55% 12% 62% 4 573
Total 50% Hydro
16% 48% 12% 69% 8 908
(*) underestimated result due to lack of reliable GIS data on population density and MV network location.
Table 4 : Electrification options in ICF priority countries
Electrification Total Population
Population
Mini Grid
Share of MG
under grid SA Population
options (2013)
Population
population
densification
Kenya 43 629 394 14 542 221 10 181 127 18 906 046 (23%)
Tanzania 44 607 249 6 049 000 9 107 605 29 450 644 (20%)
Malawi 16 777 547 5 056 481 4 545 807 7 175 259 (27%)
DRC 75 210 198 4 100 571 4 389 275 66 720 352 (6%)
Rwanda 11 609 429 6 821 440 3 269 828 1 518 161 (28%)
Uganda 34 758 001 16 326 307 2 256 931 16 174 763 (6%)
Mozambique 24 096 669 4 337 676 133 880* 19 625 113 (1%)*
Total 250 688 487 57 233 697 33 884 452 159 570 338 (14%)
When comparing the 2 scenarios Min (>300p/km²; >20km) and Max (>250p/km²; >5km), the population targeted by Mini-Grids is strongly affected in all priority countries, except in DRC where the change of thresholds has very little effect on the assessment.
6

Final Report – Support Study on Green Mini-Grid Development
Po
pu
lati
on
(m
illio
n)
12,0 10,0
8,0 6,0 4,0 2,0 0,0
MG potential: scenarios Min & Max
MAX
MIN
Figure 1 – MG potential in ICF countries for scenarios min & max (IED, 2013)
e) Main conclusions The above results (with scenario max) have highlighted three (3) categories of countries for MG development:
a) High MG potential: Kenya & Tanzania where a significant remote MG market (20-
23% but high absolute value) exists; with high solar share
b) Moderate MG potential: Malawi & Rwanda where MG market (27-28%) is large but not
so remote; high potential share for hydro
c) Low MG potential: DRC & Mozambique where population is highly dispersed and
Uganda where the grid has large coverage.
As illustrated by the graph below, the grid densification potential is high for Kenya, Uganda and
Rwanda, in regions where the population is dense and the MV network is well developed. In Tanzania
and Malawi, the grid densification potential is moderate. Mozambique and DRC have a lower grid
extension potential due to the large country size and low population density.
As the remaining alternative for scattered and remote population, stand-alone solutions have high
potential in DRC, Tanzania and Mozambique. These countries are large and have moderate or low
population density. The potential is moderate in Kenya and Uganda. There is a low potential in
Malawi and Rwanda where the territory is small and the MV network is quite developed.
7

Final Report – Support Study on Green Mini-Grid Development
Electrification Options
Mill
ion
s
Po
pu
lati
on
80 70 60 50 40 30 20 10
0
Grid Population
SA Population
Mini Grid Population
All the presented results from the adapted modelling are highly indicative and can be significantly different if critical assumptions/thresholds are changed as shown by the two (2) scenarios Min and Max.
8

Final Report – Support Study on Green Mini-Grid Development
1 Introduction As a general fact, the preferred option for rural electrification is the grid extension if it is the least-cost option. In practice, there is a continuum of non-exclusive technical supply options (grid extension, decentralised mini-grids, stand-alone off-grid solutions) that have to be adapted to the contrasted geo-economic situations. The next 2 figures illustrate the intrinsic link between the population density and the electricity access rate. Low rural population density like in Niger or Chad is generally synonym of low electricity access. Fast urbanisation and grid extension in some countries such as Nigeria can reduce the choice of MG areas or affect the viability of MG.
Figure 2 – National population density & access to electricity in Africa (UNDP, 2008) Where renewable energy is supported by international donors (grant or subsidy), the national governments are also welcoming power generation from renewable energy sources to reduce their lack of generation capacities and their dependence on fossil fuels. Accurate renewable energy resource assessment and their cost estimates are also required to promote GMG.
The 2 figures below compare the situation of rural electrification in two very different environments.
Figure 3 – Settlements & electrical grid networks in Cambodia and Madagascar (IED, 2013)
9

Final Report – Support Study on Green Mini-Grid Development
In Madagascar, the “physical potential” for MG (in terms of population density and distance to the grid) is very large. Political, economical and geophysical constraints impede the extension of the grid and the country is covered with isolated fuel-based generators. However, Madagascar has a low “feasible potential” because the political and financial environments are not suitable for MGs. In Cambodia, the national grid is rapidly expanding in an accessible topography and today the potential for MG is significantly reduced. However, Cambodia offers good opportunities for MG investors given the more reliable and viable environment. This chapter will focus on the assessment of physical & technical potentials for GMG, including basically population density, distance to the grid and renewable energy potential. As a first assessment level for the “physical potential”, the MGs are relevant in locations where population density is appropriate and where grid is not accessible (linked to physical relief). Therefore we can define the eligible area or suitable perimeter for a MG by using two (2) key criteria:
Minimum distance to the grid (km): this parameter can vary considerably from one country to another as it depends on technical capacity of the grid, geophysical constraints, proximity load demand, grid extension costs, national strategy and policy for grid extension, etc.
Minimum population density (/km²): the value of this criteria can also vary considerably and
will depend on the load characteristics (customer profiles (domestic, small business, anchor customers), customer density (or number of connection per km, or energy sold per km²)) and on distribution system costs which can be significant in mini-grid total costs.
In Tanzania, for instance, where IED is conducting the IREP project the hypothesis of 5km from the grid and 250 people/km² were considered as the minimum thresholds for MG development in rural villages without specific demand (as anchor customers). With an anchor customer in the MG perimeter, the viability of the MG is improved and a lower density of rural households could be acceptable. The purpose of this chapter is to determine the optimal conditions for cost-effective mini-grid (MG) solutions, as compared to household systems and grid-based systems, in each ICF priority country (Tanzania, Kenya, Rwanda, Uganda, Malawi, DRC, Mozambique) and per technology. To assess the “physical potential” for MG in those countries, it is proposed to consider 2 scenarios based on the following assumptions (Cf. item 3.1):
Minimum potential for MG: will be calculated with min. 5km from the grid and min. 250 people/km², based on the case of IREP study in Tanzania.
Maximum potential for MG: will be calculated with min. 20km from the grid and min. 300
people/km². A replicable analytical approach is proposed where basic information are analysed (spatial socio-economic data, power demand and forecast, grid network and extension, and renewable energy resources), results are interpreted and strategic interventions (investment) are identified. The main challenge for such analytical approach is to collect reliable, update and accurate data for each specific country. Given the time and budget constraints for this study, the potential Green Mini-Grid (GMG) contribution has been assessed according to a simplified spatial optimisation methodology specifically developed for this study and provides a fair idea of where grid can be economically extended and where viable mini-grids could be implemented. Unfortunately, the less data we have, the less accurate results are. The following sections present first an integrated planning methodology, followed by the proposed adapted methodology for preliminary assessment of GMG potential, and finally the results of the potential assessment for the selected priority countries.
10

Final Report – Support Study on Green Mini-Grid Development
2 Integrated Planning Methodology As a consequence of particular conditions in rural environments (low demand for energy, scattered population, etc), rural electrification projects are usually not profitable and investment subsidies are structurally mandatory. Since available public funds are usually limited in DC, optimising these subsidies with adequate planning is of utmost importance. Conventional rural electrification planning exercise usually focuses on spatial analysis of localities, domestic demand, socio-economic activities, load forecast and comparison between various electrification options (grid extension, mini-grids, isolated systems), as illustrated in yellow boxes in the next figures. The new approach for RE planning focuses on maximizing the potential direct and indirect impacts of rural electrification by prioritizing the localities with highest development potential (using specific development index for each settlement based on multi-sectoral data available).
Figure 4 – Conventional (yellow) and new (green) RE planning approaches (IED, 2013)
GEOSIM software is an example of an integrated RE planning tool, developed by IED based on its long experience of rural electrification planning. It is a decision-support tool for planners which provides the best modern energy access solutions between centralized grid, mini-grid approach and distributed energy based on a cost-benefit analysis for the studied area (comparison of the delivered kWh costs from different options). A special attention is given to socio-economic development in strategic villages or areas (“development poles”) and to green energies to feed mini-grids. The software and the methodology are described more in details in annex 7. GEOSIM is thus a powerful tool for rural electrification planning including mini-grid potential assessment. However, it consumes a lot of time to collect many primary data, to analyse and compare the different scenarios. It is a long term process requiring several months to cover an entire country; it gives optimal rural electrification solution for a given country context and characteristics. Performances will depend on local expertise and commitment of partners and national institutions. Typically, the range of geo-referenced data (GIS database) needed to follow this methodology is very wide and difficult to obtain, even when existing, such as follows:
- Precise location of settlement along with their population - Multi-sectoral geo-referenced data on infrastructures and businesses
11

Final Report – Support Study on Green Mini-Grid Development
o Health (health centres, hospitals, dispensaries, water resources)
o Education (schools)
o Economy (markets, banks, population, micro finance institutes)
- Socio-economic data from field surveys - National network localization
o HV grid o MV grid (existing + planed) o MV/LV ratios
o MV and LV development costs
- Precise renewable energy potential assessment
o Identified hydro potential
o Identified biomass potential o Wind and solar maps
In the framework of our study, those data are not readily available from ICF priority countries, and there is no time to gather them and follow the conventional planning approach.
Therefore two alternative methodologies have been developed below (items 3 and 4), which will be
applied first in countries where minimum GIS data are available (Tanzania, Rwanda, Uganda, Malawi)
and then in countries where no detailed/update GIS data could be collected (Kenya, DRC,
Mozambique).
3 Adapted Methodology with Detailed GIS Data
3.1 Key Preamble
The proposed adapted assessment methodology is a simplification of the GEOSiM methodology that
can be applied to countries having minimum detailed geo-referenced data on their electricity
network, their population density and their renewable energy resources. The adapted methodology
has been built on the following steps:
- Use of accurate data and GEOSIM results consolidated from IREP Project in 4 regions, out of
26 in Tanzania, - Apply the adapted method to the 22 remaining regions to cover all Tanzania, - Collect the available detailed GIS data for other ICF countries - Apply the adapted method to those countries with satisfactory GIS data
The adapted method for MG potential assessment will depend on the availability of precise GIS data.
The levels of assumptions and simplifications required for that exercise have key implications on the
final results. Therefore, calculations have been done for 2 scenarios so-called minimum and
maximum potentials for MG considering different thresholds for the multi-criteria.
Criteria Scenario Max Scenario Min Score Population density Min. 250 persons/km² Min. 300 persons/km² 0 to 1 Load distance to the national grid Min. 5 km Min. 20 km 0 to 1 Renewable potential (see below) (see below) no
12

Final Report – Support Study on Green Mini-Grid Development
For each of these criteria a score from 0 to 1 will be given to weigh the interest level for mini-grids. If the score is close to 1 for a given administrative unit, it is very interesting to consider mini-grids.
Table 5 : Key criteria for MG potential assessment (IED, 2013)
Criteria Max. MG Potential Min. MG Potential
Population density 250 hab/km² is by experience a good 300 hab/km² is a more restrictive threshold below which constructing a threshold that will reduce the number of grid between customers become non potential mini-grids, keeping villages with cost-effective higher density only.
Distance to the grid 5km is taken as a reasonable limit below 20km can be taken as a realistic which the grid can easily be extended threshold in countries where strong and supply settlements. This threshold support is given to grid extension in the can be higher depending of the national short or medium term. policy and willingness to extend quickly
the grid. If 5km is considered, MG design
should obviously include easy
interconnectability to the grid
The next figures illustrate the sensitivity analysis applied to the 3 electrification options in Tanzania, varying the 2 key factors: population density and distance to the grid.
Figure 5 – Sensitivity Analysis in Tanzania
The potential MG assessment results presented in the next sections for the ICF countries are given for the maximum potential scenario. The complementary results for minimum potential scenario are given in the country comparison section (item 6).
It is highlighted that these ‘adapted method’ developed for preliminary “physical potential”
assessment does not provide the potential for viable or feasible MGs. The proposed method has the
following significant limitations compared to GEOSIM integrated planning approach:
13

Final Report – Support Study on Green Mini-Grid Development
- Only “MG physical potential” is assessed
- Socio-economic analysis of the possible MG options is not considered (income levels and
socio-economic activities (institutions, anchor loads) - No “most viable MG option” and no “cost-effective solution” are provided - Tanzania-based assumptions might not be applicable as such in other countries
Several other key factors are also not considered in the adapted method:
- Governance issue (government command-and-control) of off-grid RE business models - Customer density - Load factor for each technology - Local ability to O&M a GMG - MG size and economies of scale - Financing mechanisms and subsidy levels
Thus the adapted method does not allow assessment of viable options, provides only a preliminary
assessment of the physical and technical potential of MG as required in the TOR. Further economic
issues are treated in Chapter 3 “Cost-Benefit Analysis”.
3.2 Density Analysis 3.2.1 Tanzania For Tanzania and Kenya census, results are available. They consist in enumeration of population on
relatively low size territory (1-5 km²); those small territories are called “Enumeration Areas” (EA). It is
then easy to compute the population density. The question is to know from which point in terms of
density it is worthy to install community-based solution.
Based on IREP project experience, a threshold of 250 persons/km² has been set as a techno-
economic minimum under which no grid or mini-grid solution will be considered. This is a core
assumption in our analysis.
This threshold comes from the following assumptions and calculation: The IREP project highlighted an average power need of 250W per household customer and 60% of connection after 5 years of installation of modern source of energy. The minimum installed capacity will be about 30kVA (25kW), representing 100 customers. The amount of 100 customers can be found in villages of 800 inhabitants (based on 4.6 person per household). The area served per installation of 25kW is likely to be a circle of 1km radius, representing more or less 3.14 km². Thus the average minimum density above which the installation of modern energy source for community can be interesting is 800/3.14 =254 person/ km². As a simplification the figure of 250 persons/km² has been selected.
Enumeration areas have been scored based on this threshold on 0 to 1 scale:
14

Final Report – Support Study on Green Mini-Grid Development
Density Score
1,2
1
0,8
0,6
0,4
0,2
0 0 250 500 750 1000
Population density (hab/km²)
Figure 6 – Density Scoring Model 3.2.2 Other Countries For the 5 other countries the last census results were not available in detail or as GIS layer, hence the
data from the African Renewable Energy Technology Platform of the European Union Energy
Initiative (EUEI AFRETEP) has been used. They provide a 1km² layer of population density in 20053,
this information has been updated to 2013 based on population annual growth rate of each country.
Since data are less detailed, simpler calculus were done. Only areas beyond 250hab/km² were
considered as sufficiently dense for DRC, Malawi, Mozambique, Uganda and Rwanda. 3.2.3 Sensitivity Analysis The threshold of 250hab/km² is dependent on the electricity demand level. 250W per household has
been taken as reference, from one country to another this value can change depending on the
economic level of the country. Kenya GDP per habitant is 50% more important than Tanzanian one,
thus the demand level could be re-evaluated. In the 250W demand level, 35% comes from lighting,
35% from TV and 7% from refrigerator. If the share of these devices is increased to 50% the demand
level will be around 300W4. This change has an impact on the density threshold which becomes
200hab/km².
For Kenya this change induces a variation on the total population concerned by mini-grids of 10%, this range of imprecision is satisfactory for our level of analysis.
3.3 MV Grid Analysis For each Enumeration Area (or geographic grid cell where population is known) the distance to the
grid (existing or planned) of the centre of the enumeration area has been computed. Based on this
distance a score can be given to each enumeration areas. The determination of this score depends
on the economic viability of grid extension versus mini-grid development. To feed a LV network,
either a decentralized power plant or the centralized MV network can be chosen. From the chapter 3
cost-benefit analyses we can take the following figures to characterize these options: 3 http://re.jrc.ec.europa.eu/download/afretep/afretep_etrs_1km_popdens.zip
4 These values are averaged values between three population segments: poor, medium and rich consumers, each one have different consumption patterns.
15

Final Report – Support Study on Green Mini-Grid Development
MV extension costs : 14,300 $/km Gasifier power plant : 2800 $/kW Hydro power plant : 2200 – 5600 $/kW PV-Hybrid power plant : 3400 $/kW
Power supply solution costs can thus be compared. The following chart shows these costs for the smallest possible system: 25kW
Power supply cost for a 25kW system
Inve
stm
en
t ($
)
250 000 200 000 150 000 100 000
50 000
- 3.8
4.9 5.9 9.8
0 5 10 15
Distance to the grid (km)
MV connection Hydro 2 PV - Hybrid Gasifier Hydro 1
Figure 7 – Grid Extension Cost (indicative) Below 3.8km, connection to the MV grid is the best economical solution; if above 9.8km, any green mini-grid option is preferable to a grid connection.
In the IREP project studies, mini-grids are considered for every village farther than 5 km from the existing or planed MV grid. So a distance threshold of min. 5km from the existing or planned MV grid is a good candidate to decide whether a village should benefit from a grid extension or a mini grid. The following distance scoring is used to avoid steps effects (otherwise village at 4.9km would never have mini-grids and village at 5.1km would never have grid extension).
16

Final Report – Support Study on Green Mini-Grid Development
Figure 8 – Scoring Model
This threshold of 5km corresponds to the threshold of densification of existing MV network. Further
villages connection supposes a general framework of MV extension viewed as a regional
development scheme which is out of the scope of this study.
3.4 Identification of Mini-Grids In order to identify the potential location of mini-grids, these two scores are multiplied to get a final
score showing the distance to the grid and the density of population. EAs with a final score above 0.4
(i.e. more than 250 hab/km² and farther than 5km) could be candidate for mini-grids. Enumeration
areas up to a 2km distance of already electrified villages (transformer) are discarded5.
5
The information about electrified villages was available only for Tanzania.
17

Final Report – Support Study on Green Mini-Grid Development
The following illustrate this method:
Figure 9 - Density Level Figure 10 - Distance to MV grid
Figure 11 - Final Score
Enumeration areas population that is not known and all areas where the population density is not above 250 hab/km² have been discarded for mini-grids. Note that the number of EAs far from the national grid and having high density population is not
directly linked to the number of mini-grids in a given country. Indeed a mini-grid can power one or
several village in the vicinity. This notion is directly related to the distance between centroids of EAs.
The proposed rule is to consider that 2 EA areas which have a centroid at less than 3km, belong to
the same mini-grid.
The next curve shows that for Tanzania, there are about 3500 EAs but the number of mini-grids is only 700 if 3km is taken as limit.
18

Final Report – Support Study on Green Mini-Grid Development
4000
3500
grid
s 3000
2500
of
Min
i
2000
1500
Nb 1000
500
0
0 0,5 1 1,5 2 2,5 3 3,5 4 4,5 5
distance (km) between centroid to consider whether 2 EA belong to the same mini grid
Figure 12 – Number of MG vs. distance between EAs
3.5 Energy Demand Assessment The GEOSIM methodology provides a load forecast model at the village scale, in order to assess the required capacity for the electric mini-grid. Through IREP project, an analysis of electric demand of a representative range of villages in Tanzania has been performed. The average electric consumption of a village is estimated at 147 kWh/yr/person at Year 5,
considering the following assumptions used by REA agency6:
Household connection rate: 60%
Infrastructure connection rate: 90%
Population growth rate: 3%
Households specific consumption growth rate: 5%
Infrastructures specific consumption growth rate: 7%
The ratio of 147 kWh/yr/person takes into account the household consumption aggregated to the
infrastructures consumption. Depending on the village size, the infrastructures consume more or less
energy. To simplify the model, it has been decided to allocate these consumptions to the households.
The following graph shows the final household consumption including the infrastructure
consumptions. 6
Agreed by the Rural Energy Agency of Tanzania
19

Final Report – Support Study on Green Mini-Grid Development
Total Energy consumption per capita depending on the village size
(kWh/Yr/Pers @Yr 5)
kWh
/Yr/
per
s
200
180
160
140
120
100
0 1000 2000 3000 4000 5000 6000 7000 8000
Village population Yr 1
Figure 13 – Total energy consumption vs. village population
3.6 Avoided Carbon Emission Assessment To assess the avoided emissions, the first step is to evaluate the displaced energy from fossil fuel
resource. This is done based on the penetration factor of each technology7. The present study
compares the possibility of connecting villages to mini-grids and to the centralised grid. Thus for each technology, 2 calculations are done to estimate carbon emission.
The first calculation is the comparison with pure diesel genset8 based mini-grid:
[Avoided Emission] = [Penetration Rate] x [Energy Demand] x [1.3 kgCO2eq/kWh] In this hypothesis the avoided carbon results in the non-use of 100% genset-based mini-grid.
The second calculation gives the avoided emission compared to a connection to the national grid, the avoided emission are thus totally dependent on the emission factor of a given country energy mix:
[Avoided Emission] = [Penetration Rate] x [Energy Demand] x [Country Grid emission factor]
The following table summarizes the grid emission factor applied for several countries9:
7 Details are given for each technology in the next section
8 IPCC takes 1.3 kgCO2eq/kWh as emission factor for diesel genset in the range 10-100kW
9 Source : The CDM Project Potential in Sub-Saharan Africa – 2011 - Wuppertal Institute for climate, Environment and Energy – GFA Envest
20

Final Report – Support Study on Green Mini-Grid Development
Table 6: Emission factor per country
For Kenya, the emission factor is: 700 TCO2eq/GWh (http://cdm.unfccc.int/Projects/DB/SGS-UKL1298369167.94/view)
For Malawi, our estimation is 681 TCO2eq/GWh based on the data found on: http://www.reegle.info/countries/malawi-energy-profile/MW
3.7 Greening Mini-Grids There are many studies on renewable energy resource assessment for African countries (e.g. NREL,
IRENA, SWERA, REMAP). However, the GIS databases, if any, are difficult to get from the local
institutions and even harder from the consultants. To overcome this critical barrier for our rough
assessment of green mini-grid potential, we have been constrained to consider rough data available
on the web and some severe assumptions, in particular for hydro and wind resources which can be
somehow far from reality. 3.7.1 Hydro Resource a) Resource Assessment
EUEI AFRETEP initiative directs to http://gis-lab.info which provides global maps of rivers and streams
around the world. The only metadata available is to know whether a stream is perennial or not since
many perennial streams that are located inside arid zones have questionable data reliability.
Average precipitation above the zone is also used. Based on this data and on the annual
temperature, the ‘Turc equation’ gives the mean run-off per km² in l/s. Below 4 l/s/km² it has been
considered that the zone is too dry to present potential condition for hydro development (black
colour in the below chart).
21

Final Report – Support Study on Green Mini-Grid Development
Figure 14 – Average specific flow rate in Africa The last data needed to estimate whether hydro potential can be exploited is the head of a potential
installation. To assess this, special topographical data have been used10
. This data consists in tiles of
5x5 degree with high horizontal resolution: 0.0008 degree (400m); data source is from satellite observation.
In a buffer of 5km around every potential mini-grid, rivers with more than 25m head shall be selected
as potential sources of hydro power. The process of allocation of head to rivers is very time
consuming because of the very high quantity of data to process. This approach has only been done
for Tanzania. b) Carbon emission avoided
Given the draught and seasonal variations, a hydro-mini-grid will be more profitable for a private
operator (in the long term) if it can be connected to the national grid as backup. The alternative to
run diesel gensets when water flow is too low will generate very high operating costs. In practice,
many mini and small hydro schemes end up being connected to the grid.
For carbon emission calculation, we will consider that all hydro mini-grids are grid connected, thus
only a part of the energy produced from hydro replaces diesel production or national utility
production.
10
http://gisdata.usgs.gov/website/HydroSHEDS/viewer.php or http://gisdata.usgs.gov/
22

Final Report – Support Study on Green Mini-Grid Development
The model is calibrated from the IREP data: 17 hydro mini-grids have been identified within the 4
pilot regions. 87% of the energy comes from the SHP (small hydro power) and 13% from the national
grid.
For the CO2 emission calculation, we will then assume 87% of penetration rate with hydropower, i.e.
87% of the energy demand will be covered by the hydro resource. And the 13% remaining should be
covered by grid or diesel backup. 3.7.2 Biomass Resource a) Resource Assessment
The Map Spam Project11
provides worthwhile African data on 10x10km grid concerning biomass yield, production and harvested areas for:
banana and plantain, barley, beans, cassava, coffee, cotton, groundnut, maize, millet, potato, rice, sorghum, soybean, sugar beet, sugarcane, sweet potato and yam, wheat
other fibres (flax fibre and tow, hemp fibre and tow, kapok fibre, jute, jute-like fibres, ramie,
sisal, agave fibres nes, abaca manila hemp, fibre crops nes), other oil crops (coconut, oil palm
fruit, olives, karite nuts (sheanuts), castor beans, sunflower, rapeseed, tung nuts, safflower
seed, sesame, mustard seed, poppy seed, oilseeds nes),
other pulses (dry broad beans, dry peas, chickpea, cowpeas, pigeon peas, lentils, bambara beans, vetches, lupins, and pulses nes)
This data comes from the crossing of several statistics, data from FAO and national administration
about production of different crops, land cover from satellite view, precipitation and elevation.
These datasets are of low precision for this study and quite old but nevertheless they give clues on
the presence of biomass production at a medium resolution. Only rice husk and bagasse (sugar cane)
have been considered in the following methodology since they are largely produced and can be used
with gasifiers, one of the most experienced and promising technologies.
For every mini-grid identified, electricity needed at the 5th
year of the project has been compared to
the energy production potential from biomass based on the following estimation12
:
Rice Husk
0.65 Ton Rice per Ton of Paddy 0.2 Ton of Husk per ton of Paddy 2.5 kg of rice husk per electric kWh 33% of energy production for the mill needs and 66% for the electrification need
11
You, L., Z. Guo, J. Koo, W. Ojo, K. Sebastian, M.T. Tenorio, S. Wood, U. Wood-Sichra. Spatial Produciton Allocation Model (SPAM) 2000 Version 3 Release 1. http://MapSPAM.info
12 These estimations are based on on-field studies performed in Tanzania for the IREP project, results are presented in
“Identification of Biomass potential in the Morogoro, Pwani and Lindi regions of Tanzania”
23

Final Report – Support Study on Green Mini-Grid Development
Sugar Cane
0.4 Ton of bagasse cane per ton of sugar cane 2.9 kg of bagasse per kWh 15% of energy production for internal use, 85% for electrification need
The bagasse can hardly be stored and the production is very seasonal, thus mini-grids based
on sugar cane can only be viable if connected to the national grid. Only mini-grids closer than
10km to the main grid are considered eligible for being fed by sugar cane based solution.
For each 10x10km area (cell) where biomass production is known, the potential electricity
production is computed. If it represents at least 50% of the total electricity demand of mini-grids
under this area, those mini-grids are considered potentially eligible for biomass projects. b) Carbon Emission Avoided
For rice husk gasifier, carbon emission will be reduced thanks to the (partial) replacement of diesel consumption and to the avoidance of natural decomposition and methane production of rice husk
disposal. The key hypotheses are as follow13
:
Carbon content of avoided diesel production
1.30 kgCO2/kWh
1.29 kgCO2e/kg rice husk
Carbon content of avoided rice husk disposal
Projected emission from diesel 2.80 kgCO2/L
Projected emission from gasification 0.11 kgCO2/kg rice husk
A dual fuel gasifier using rice husk and diesel for backup will have a penetration rate of 80%. The final
avoided emission for such hybrid system is estimated at 3.03 T CO2eq / MWh.
For sugar cane / bagasse co-generation (connected to the grid), it has been considered that the only avoided emission occurs in the non-burnt diesel in genset.
Contrary to rice husk, bagasse cannot be stored on long time period, so during several months no
energy can be produced from this resource. Thus this kind of installation has to be connected to the
grid to provide continuous service. Rice husk gasifier can run year-round disconnected from the
national grid. 3.7.3 Hybrid Mini-Grids In our assumptions, wind and solar-based mini-grids are hybrid mini-grids requiring a diesel genset
backup to operate efficiently. Indeed these solutions suffer from daily intermittences and
unpredictability (in particular for wind). Only hybrid PV systems are equipped with batteries, we
assume that wind-based systems are in the range 100kW-1MW which is too large to consider battery
storage. 13
References: UNFCC Methodology I.D.; UNFCC Methodology III.E.; 2006 IPCC values
24

Final Report – Support Study on Green Mini-Grid Development
3.7.3.1 Wind Resource a) Resource Assessment
Despite many studies that exist at national level, no precise wind map exists at the African scale on
the web. By way of exception, Kenya has benefitted from a detailed mapping of wind resources from
Risoe Institute, the detailed wind map can be downloaded from Swera website
(http://maps.nrel.gov/SWERA). Wind map resource also exists in Tanzania and is under preparation
in Rwanda and Malawi.
In Tanzania, several specific wind assessment studies14
have been performed which conclude that
there exists a decent potential especially close to the Indian Ocean shores. Thus, as a very simplified
approach for our study, all mini-grids at less than 20km from the shore have been considered as
potential candidate for wind power; this is an arbitrary threshold. Onshore spots where wind
potential also exists (as in Rift Valley, etc) have been considered in the potential assessment, as far as
maps or geo-referenced data are available. b) Carbon Emission Avoided
The GEOSIM methodology includes wind hybridization of mini-grids. The optimisation considers year
5 of the project duration to size the wind turbines in order to cover the base load of the mini-grids in
year 5. The penetration ratio will be high during the first years but will decline over the 20 years. In
average of 20 years, the penetration ratio for wind turbines is around 20%.
The typical evolution of the energy demand is as follows15
:
MW
h/y
r
Figure 15 – Energy Production and Consumption
The avoided CO2 emissions are thus typically corresponding to 20% of the total energy needed for the project in average over 20 years. It has been considered that the typical size of such project range in 100kW – 1MW and at that size energy storage is not viable, that is why only the base load is covered by wind energy.
14 Distribution of Wind and Solar Energy Resources in Tanzania and Mozambique, Chalmers, 2011 (SIDA); Wind energy study in Tanzania, TATEDO, 1998
15
Reference: Geosim – IED, based on 4.5m/s average wind speed and 225kW ACSA wind turbines. More detail p28
25
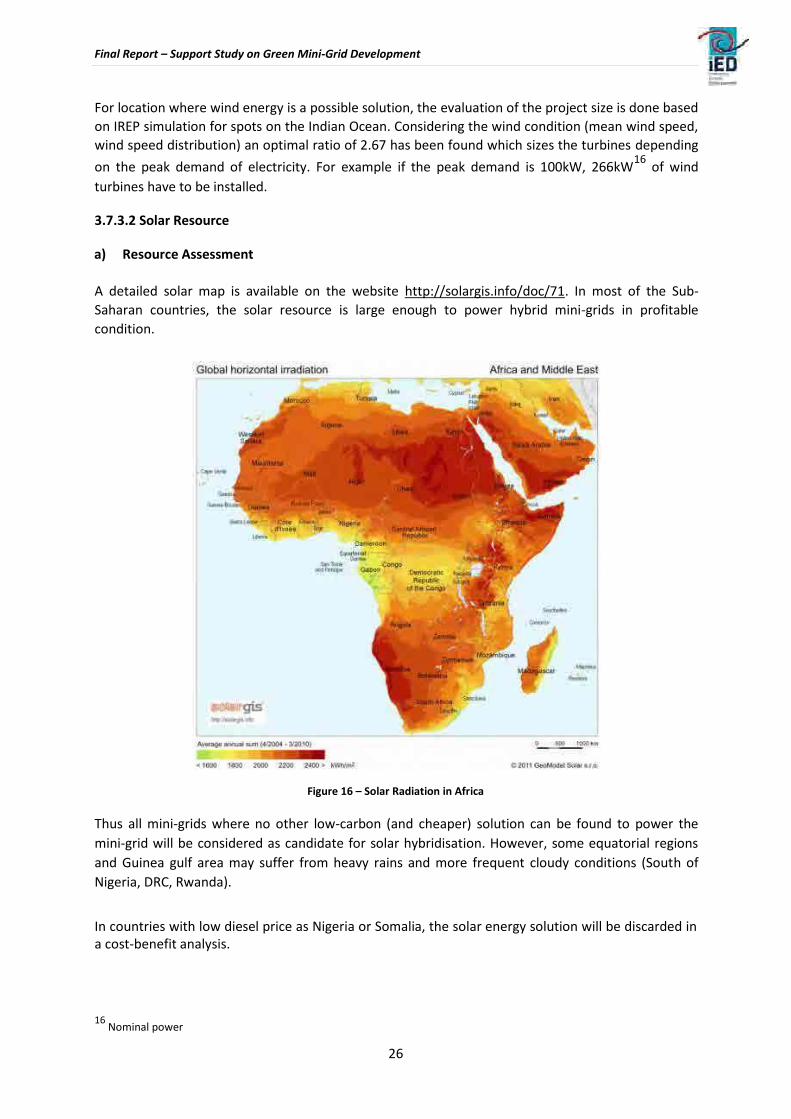
Final Report – Support Study on Green Mini-Grid Development
For location where wind energy is a possible solution, the evaluation of the project size is done based
on IREP simulation for spots on the Indian Ocean. Considering the wind condition (mean wind speed,
wind speed distribution) an optimal ratio of 2.67 has been found which sizes the turbines depending
on the peak demand of electricity. For example if the peak demand is 100kW, 266kW16
of wind
turbines have to be installed. 3.7.3.2 Solar Resource a) Resource Assessment
A detailed solar map is available on the website http://solargis.info/doc/71. In most of the Sub-
Saharan countries, the solar resource is large enough to power hybrid mini-grids in profitable
condition.
Figure 16 – Solar Radiation in Africa Thus all mini-grids where no other low-carbon (and cheaper) solution can be found to power the
mini-grid will be considered as candidate for solar hybridisation. However, some equatorial regions
and Guinea gulf area may suffer from heavy rains and more frequent cloudy conditions (South of
Nigeria, DRC, Rwanda).
In countries with low diesel price as Nigeria or Somalia, the solar energy solution will be discarded in a cost-benefit analysis.
16
Nominal power
26

Final Report – Support Study on Green Mini-Grid Development
b) Carbon Emission Avoided
The avoided CO2 emissions correspond to the penetration rate of solar energy. Based on standard
load curve for rural electrification (see next figure), it has been considered that 40% of the energy
can come from PV, with 5% of energy to be stored because of the mismatching of hours of demand
and solar production (also called buffer storage).
Typical Tanzanian village load curve Year 5
80
60
40
k W
20
0 Demand curve PV production
1 3 5 7 9 11 13 15 17 19 21 23
Solar based mini-grids are of smaller size (30-500kW) than wind turbine projects, contrary to wind based project which has no significant scaling up effect when gathering several PV generators.
There is no advantage in building a big PV system: to build 10x 10 kWp system in 10 villages or one
big 100kW system to connect 10 villages through a MV mini-grid does not save any money. It is
preferable to build 10 x 10kWp to avoid the MV network costs.
4 Simplified Methodology without Detailed GIS Data
Given the restriction to access precise GIS data for some countries, an extrapolation method has been used based on the most up-to-date and geographically precise data.
4.1 Extrapolation Method
When no GIS data about MV network is available, the key variables to assess the mini grid potential are as follows:
Total population Population in area above 250hab/km² Surface of the country MV Network total length Electrification rate
The total length of the MV grid in each country has been found either from annual report of national
utilities or from our contacts in Club ER17
.
The consultant’s work is to put together these variables to get a figure which represent the mini-grid potential in a given country. The result of this problem is known for a batch of reference country.
17
Club of Rural Electrification : http://www.club-er.org/
27

Final Report – Support Study on Green Mini-Grid Development
Thus the best formula has to be found which gives the most realistic results (the formula applied to
the known countries should give results equal -or close- to the real mini grid potential).This kind of
problem is known in mathematics as an optimisation problem.
The first step to solve this problem is to choose the kind of formula that can apply in this case: linear,
polynomial, exponential. There are few countries that can be used as reference, if other methods
than the linear one was chosen, risks of divergence of the results would be high.
So the problem is to find the coefficient where Y = mini grid potential (measured as the mini-grid population potential)
n variables that are relevant for the study of the problem
For a set of m values of the variables and the corresponding m results Y, mathematics give
methods to find the best . The quality of the given is measured by a coefficient named
correlation coefficient R², the closer this coefficient is to 1, the better is the given batch of .
Excel implements these methods and for each set gives the corresponding R².
Here, we are extrapolating results for 3 countries: Kenya, Mozambique and DRC (our targets) from
reference countries that are Tanzania, Malawi, Uganda and Rwanda. Two artificial reference
situations have been added: Tanzania with no MV network and Tanzania covered entirely by a MV
network. In mathematics it is well known that if the targets are close to the reference, the results of
an extrapolation will be good, else one have to minimize the number of used variable in order to
minimize the risk of divergence of the method.
Kenya and Tanzania are geographically close; furthermore these countries are alike in terms of size
and population. Mozambique and DRC cannot be directly compared to any other reference country
in our analysis. So in order to avoid the risk of divergence, it is wise to limit the number of used
variables.
The consultant has made several tries varying the calculation method, and the used variable, the best results uses only:
(i) number of people living in place where MG can be a solution (density is above 250 hab
/ km²) (ii) length of MV network (km) (iii) Surface of the country (km²) (iv) Electrification rate (%)
(The information on total population is represented in the electrification rate) Extrapolation model: The final model has the form: ( ) and where:
- total population of the country living under the area of influence of Mini-grids
28

Final Report – Support Study on Green Mini-Grid Development
- total population of the country living in place where the density is above 250 hab/km²
- total length of the MV network in the country
- constants determined in order to minimize the error for each reference point
18.
A coefficient of correlation (R²) is computed in the linear regression, the closer to 1, the best is the extrapolation, for equation (1) R² = 0.92; for equation (2) R² = 0.90. 0.92 is better than 0.9, they are both quite good, not excellent.
4.2 Green Resource Assessment
The renewable energy resource assessment will be done in the same way as in the above GIS
methodology. But contrary to the GIS methodology, the extrapolation methodology cannot localize
the estimated mini-grids, thus the consultant has only assessed whether a technology and a
renewable resource can be potentially used depending on different contexts of a given country.
The percentage of the country energisable by a given green technology is applied to the percentage
of the candidate country for mini-grids e.g. if the national hydro potential is 10%, the potential for
hydro-based mini-grids will also be 10%.
18
Since MG_pop is directly proportional to Pop and inversely proportional to MV, a and c are positives and b and d are negative.
29

Final Report – Support Study on Green Mini-Grid Development
5 Potential MG Assessment Results
5.1 Tanzania
For the specific case of Tanzania, the MG potential assessment will first review the results available
from the IREP project in 4 regions and then will apply the adapted method to the other provinces
(under ESMAP/WB funding). 5.1.1 Integrated Rural Electrification Planning (IREP) project
The IREP project undertaken by IED with an EU financing is aiming at a rural electrification plan for 6
regions out of 26 in Tanzania. This project is running since mid-2011 and is still on-going19
. It has first
focused on 3 Tanzanian regions: Pwani, Morogoro and Lindi and continued on a fourth one: Tanga, the analysis of Iringa and Dodoma is currently being processed.
The assignment for IED was to carry out the work on the first 3 regions to demonstrate its
methodology, then to assist the Tanzanian Rural Energy Agency (REA) for the next 3 regions in order
for this agency to get the capacity to work through the entire country at the end of the project.
Synergies with ESMAP are ongoing to benefit from their data and information (resource mapping,
etc). 5.1.2 Situation map The following map shows the population density and HV grid in Tanzania: 19
Mid 2013
30

Final Report – Support Study on Green Mini-Grid Development
Figure 17 - Tanzania Situation Map
5.1.3 GEOSIM assessment in 4 IREP regions In the 4 IREP’s regions (Tanga, Morogoro, Pwani and Lindi), detailed GEOSIM methodology has been applied for the IREP Project, the following are the results of this work:
87 Development Poles (DP) are not yet electrified or planned to be electrified in the near future. The rural electrification study will focus on them with priority.
Zone No of No of Area Total No of DP not DP km² inhabitants villages (km²) No of electrified (population) per DP
20
(census 2002) DP
Lindi 791,306 427 67,000 44 35 152000 1520 Morogoro 1,759,809 594 70,799 60 8 584000 1180
Pwani 889,154 455 32,407 46 10 205000 700 Tanga 1,651,179 839 26,808 84 34 313900 319
Table 7 - IREP region population and development poles
5.1.3.1 Grid Extension Potential There is a large potential for increasing electricity access through densification of the existing network i.e. connection of village within a buffer of 5km. The following table is the result of GEOSIM
analysis, showing the selection of profitable21
grid extension under study in IREP project within the
area:
20 Total Area of influence of the Development poles
21 For each connected village a cost-benefit analysis has been performed, the profitable (on commercial benefit basis) villages are the one where more benefits than costs have been found.
31

Final Report – Support Study on Green Mini-Grid Development
Table 8- IREP regions MV extension
Region
km of MV line
# of villages
population
Lindi 644 145 223 000
Morogoro 208 126 236 000
Pwani 316 151 220 000
Tanga 627 375 526 000
Total 1 795 797 1 205 000
In the 4 IREP regions, there is an identified potential for grid extension covering 797 villages and 1.2M people. 5.1.3.2 Green Mini-Grid Potential
The GEOSIM simulation has also identified the optimum villages with green mini-grids based on local available renewable energy resources:
Table 9 - IREP region mini-grids
Region # of MG % # of villages in MG population
Lindi 24 36.4% 40 75 200
Morogoro 17 25.8% 76 143 000 Pwani 14 21.2% 22 43 200
Tanga 11 16.7% 19 47 100 Total GMG 66 100% 157 308 500
In the 4 IREP regions, there is an identified potential for 66 GMG covering 157 villages and 0.3M people.
Table 10 - IREP region green mini-grids source
Renewable sources # of MG % # of villages in MG population
Total hydro 15 22.7% 81 134 600
Total biomass (rice husk) 8 12.1% 11 22 700 Total hybrid wind 2 3.0% 3 6 200
Total hybrid solar 41 62.1% 62 135 000 Total GMG 66 100% 157 308 500
5.1.3.3 Stand-alone Solution
The villages outside the mini-grids and grid extension forecasts are assessed as more efficiently
reached by stand-alone or individual solution such as Solar Home Systems (SHS) for households and
community equipment (PV for schools and hospitals, multifunctional platforms). The following
estimations are based on one equipment for the 25% richest households and one equipment for
school and health centre per village.
32

Final Report – Support Study on Green Mini-Grid Development
Table 11 - IREP regions stand-alone solution
Region # stand-alone # Community Population
equipment equipment
Lindi 15 000 3 800 330 000
Morogoro 24 000 6 000 424 000
Pwani 14 000 3 500 254 000 Tanga 20 000 5 000 373 000
Total 73 000 18 300 1 381 000
5.1.4 Assessment in Other Regions 5.1.4.1 GIS Analysis
As presented in the above Chapter 3, the adapted methodology (with GIS data) has been applied to assess the potential for the entire Tanzania (26 regions).
Inside the 5km grid perimeter, there are 3 categories of enumeration areas (EA), those with high
density (> 250 persons/km²), those with low & medium density (< 250) and those at less than 2km of
an electrified village.
Beyond the 5km threshold, there are also 4 categories of enumeration areas (EA), depending on the population densities (low, medium, high, very high). The following table summarizes the results of this methodology:
33

Final Report – Support Study on Green Mini-Grid Development
Table 12 - Tanzania Mini-Grid Potential
TANZANIA Solution EA* Population Household Dist. to Average
MV (km) Density Close to the grid Extension 2 144 4 330 274 941 364 2 67
low & medium density of MV (9.6%)
Close to the grid, Extension 2 887 6 049 822 1 315 179 1 2 446
high density of MV (13.5%)
Electrified villages and Extension 3 655 10 217 127 2 221 115 4 7 676
<= 2km of electrified village of LV (22.8%) Total EA to be powered by grid Extension 8686 20 597 223 4 477 658
extension (47%)
Far from the grid MG 1 681 4 737 240 1 029 835 17 217
Medium density (10.6%)
Far from the grid MG 1 483 3 847 951 836 511 26 499
high density (8.5%)
Very far from the grid MG 344 522 414 113 568 48 4 315
very high density (1.1%) Total EA to be powered by Mini- MG 3 508 9 107 605 1 979 914
Grids (20%)
Far from the grid SA 6 227 14 902 421 3 239 657 21 53
low density (33%) Total EA to be powered by stand- SA 6 227 14 902 421 3 239 657 21 53
alone systems (33%) Total 18 44 607 249 9 697 228 13 2 072
421
EA: Enumeration area (cf. Chapter 3) Close to the grid : <5km Low density: <125hab/km² MV / LV: medium / low voltage Far from the grid: 5-10km Medium density: 125-250 hab/km²
SA : Stand alone systems Very far from the grid > 10km High density: 250-1000 hab/km²
MG: Mini Grid Very high density : >1000hab/km²
Note that the number of mini-grids is not the number of EAs; indeed several EAs are connected
within the same mini-grids. If one considers that EAs at less than 3km belong to the same mini-grids,
there are 776 mini-grids.
The following maps also show the above results of the adapted methodology applied on the entire country and the potential renewable sources.
34

Final Report – Support Study on Green Mini-Grid Development
Figure 18 - Tanzania Map of Mini-Grid Potential

Final Report – Support Study on Green Mini-Grid Development
5.1.4.2 Green Mini-Grid Potential
Base on the GIS methodology, the following table analyses which source of energy can power the identified mini-grids in Tanzania. Solar PV is applied when no other solution has been found.
Based on assumptions in above item 3, the next table provides information on energy and power
requirements in year 5, on renewable device capacities and on carbon emission avoided compared to
diesel-based or grid extension options. This preliminary assessment cannot provide a ‘number of
mini-grids’ that could be targeted due to limited information available at this early stage. The
indicative number of ‘population targeted by mini-grids’ is the main result of the assessment.
Table 13 - Tanzania Renewable Resource for Green Mini-Grids
Tanzania Wind Hydro Biomass Solar Total**
Population targeted by mini-grids22
910 761 910 761 1 639 369 5 828 000 9 107 605
Share of population for a given technology 10% 10% 18% 64%
Average energy consumption over 20 Yr
(GWh/Yr) 231 231 416 1478 2355
Penetration rate (%) 33% 87%
80% 50% 40%
(RH) (SC)
Total Energy* demand @ Yr5 (GWh) 134 134 241 857 1365
Total Power demand @ Yr5 (MW) 25 25 45 161 257
Renewable Device capacity*** (MW) 62 25 45 235 297
Carbon emission Diesel-MG (kTCO2eq/Yr) 99 261 1217 768 2346
Carbon emission National grid (kTCO2eq/Yr) 46 122 570 360 1099
Note that the:
* Total Energy needed in year 5 to fully feed the considered systems, whatever the sources are
** Total on the last column can be greater than 100% because some mini-grid can be powered by several sources.
*** RE Device capacity: for Wind and Solar the installed capacity is larger than the demand capacity.
5.1.4.3 Grid Extension and Stand-alone Potential
The IREP project has analysed the grid extension necessary to connect the most important villages (in
socio-economic terms) in 4 Tanzanian regions, based on the ratios [existing MV lines / grid
population / connection rates] in these regions and the proposed extension in IREP, the following
estimation can be done for the extension in the whole country.
Grid Population Existing MV New km MV
lines (km) lines (km)
Tanzania 6 049 000 32 771 4 047
The remaining population that should be covered by SA systems: 29,450,644 persons
22
Population living in area >250hab/km² further than 5km of existing MV
36

Final Report – Support Study on Green Mini-Grid Development
5.2 Kenya
5.2.1 Data Available
5.2.1.1 GIS Data
A fair quantity and quality of data are freely available for Kenya on the internet. The following GIS layers have been used:
GIS Layers Data type Data quality Sources
1989 Census Population of 1989 Good http://www.ilri.org/
per district, division
and sub location
Household Number and Good, at district level www.opendata.go.ke
energy source percentage of
household per source
of lighting (data from
2009 national census)
2009 population Location of population Fair, population are www.opendata.go.ke
census per sub location located on a point not
on an area,
reallocation has been
done by the
consultant based on
name
Livestock and Statistic per Fair, no information of http://www.ilri.org/
crop production administrative unit the source and date of
data
HV lines Location of HV lines Poor, data of 2004, http://www.infrastructureafrica.org
length of network has (HV/MV updated network couldn’t be
dramatically increase obtained on GIS format, neither from
since this date KPLC, nor from REA despite promises)
Power plants Location and type of Poor GIS layers, no http://www.infrastructureafrica.org
power plants indication on the
rated power, no
information of the
date (2004 is
suspected since data
come from the same
source as HV lines)
5.2.1.2 Reports
Two main reports have also been used for this assessment:
Rural Electrification Master Plan 2009 – 2013 (Ministry of Energy – Rural Energy Agency; Decon)
Kenya Power, Annual Report and Financial statements 2012 (KPLC)
5.2.2 Situation Map
The following map shows the population density and HV/MV grid in Kenya:
37

Final Report – Support Study on Green Mini-Grid Development
Figure 19 - Kenya Situation Map 5.2.3 Country Overview
In 2009 there were 38.6 million inhabitants in Kenya, now the population is about 44.1 million
people. Among them a few areas have access to electricity; KPLC, the national utility, claims the
following statistics about domestic customers:
Table 14- Kenya electricity customer statistics
Region # Customer Domestic
customer
Nairobi 921 548
Coast 201 425 1 428 363
West 322 885
Mt Kenya 210 136
Rural
Electrification 382 631 304 298
program
Total 2 038 625 1 732 661
The total MV network length is 47,035 km; the average household size is 4.4 persons per household;
there is 17.3% of the total population which is electrified. If Nairobi region is removed from this
statistics, the 2013 population comes to about 40 Million inhabitants and the electrification rate
turns to 10.3%.
The analysis of population shows that among the 44 million people in Kenya, 28M live in areas where the density is above 250hab/km².
38

Final Report – Support Study on Green Mini-Grid Development
5.2.4 Renewable Resource for Mini-Grid
Except for wind, the source of data is the one presented in item 3.6. Wind data are mean annual wind speed 50m above sea level, on a 5x5km grid (source : http://en.openei.org/wiki) 5.2.4.1 Hydro
There is a good match between hydro resources (Cf. item 3.6.1) and population repartition in the west of the country, but the rest is rather dry and no hydro power can be expected for these regions.
Figure 20- Kenya Hydro Resource Map
5.2.4.2 Biomass
The following map shows the place where the offer in terms of rice husk gasification and sugarcane energy production is potentially above 50% of the total demand in year 5 of sub-locations in Kenya.
Figure 21 - Kenya Biomass Resource Map
39

Final Report – Support Study on Green Mini-Grid Development
Other biomass potential exists such as pineapples, coffee production, and biogas production from livestock or from dairy but this requires extension of time to analyse them. 5.2.4.3 Wind
The Risø Institute has modelled the wind map of Kenya with a 5km resolution grid; the full data can
be downloaded at http://en.openei.org/datasets/node/613. The area where the mean wind speed of
50m above ground level that is above 5m/s have been considered as potentially interesting for wind
power development. It can be observed that good potential exists in populated places in the regions
of Central, Nyanza and Coast.
Figure 22 - Kenya Wind Map 5.2.4.4 Solar
As solar resource in Kenya is very good, every mini-grid can be hybridised with solar panels if other more cost-effective renewables are not available.
40

Final Report – Support Study on Green Mini-Grid Development
Figure 23 - Kenya Solar Resource Map
5.2.5 Extrapolation Results
Our extrapolation model for countries without proper GIS data indicates that the mini-grid population (outside the 5km perimeter) is 10 million persons.
The results from the extrapolation presented in Erreur ! Source du renvoi introuvable. and based on Tanzanian and other GIS countries give the following results:
Table 15- Kenya Green Mini-Grid Potential
Kenya Wind Hydro Biomass Solar Total
Population targeted by mini-grids
(>250hab/km² & >5km of MV) 2 239 848 1 018 113 1 018 113 5 905 054 10 181 127
Share of population for a given technology 22% 10% 10% 63%
Average energy consumption over 20 Yr
(GWh/Yr) 568 258 258 1 497 2 582
80% 50%
Penetration rate (%) 33% 87% (RH) (SC) 40%
Total Energy need @ Yr5 (GWh) 329 150 150 868 1 497
Total Power need @ Yr5 (MW) 62 28 28 163 281
Renewable Device capacity (MW) 153 238 391
Carbon emission Diesel-MG (kTCO2eq/Yr) 244 292 756 779 2 070
Carbon emission National grid (kTCO2eq/Yr) 153 184 476 490 1 303
5.2.6 Grid extension and Stand-alone Potential
Using the same ratio obtained with the grid extension projects identified in Tanzania, the following results can be found:
41

Final Report – Support Study on Green Mini-Grid Development
Grid Population
Existing MV New km MV
lines (km) lines (km)
Kenya 14 542 221 47 035 9 713
The remaining population that should be covered by SA: 18,906,046 persons
5.3 Rwanda 5.3.1 Situation Map The following map shows the population density and HV/MV grid:
Figure 24- Rwanda Situation Map 5.3.2 Country Overview
No precise GIS layer has been obtained for the MV network in Rwanda, but this country is very small
and a recent map of the network was found on http://www.paceaa.org/workshops/:“Overview of
the rural electrification strategy in the country”. We have used the map found on this document as a
GIS layer. The population data from EUEI AFRETEP has been used for the population analysis. It
shows that Rwanda has a very high density population (91% above our threshold) compared to
Tanzania and Kenya above. 34% of the population is living in areas away from the grid perimeter, as
shown in the previous map and the next table.
However, grid extension plans have not been considered and this might strongly affect the MG
potential figure (28% of population) as the government is actively supporting grid extension for rural
areas and densification.
42

Final Report – Support Study on Green Mini-Grid Development
Table 16 - Rwanda population density and distance from the MV network
Population 2013
Population living at Population living at
Total
less than 5km of MV more than 5 km of MV
population living where density Individual solution
< 250hab/km² 323 821 680 899 1 004 719
(3%) (6%) 9%
population living where density Network densification Mini grid
>= 250hab/km² 7 334 882 3 269 828 10 604 709
63% 28% 91%
Total 7 658 702 3 950 726 11 609 429
66% 34%
5.3.3 Renewable Potential Assessment
The country is highly dense with a significant potential for MG outside the existing distribution
network. The major resource is hydro which is available over the whole country as show on the next
map.
Figure 25 - Rwanda Hydro Resource Map
Other resources as biomass and wind have limited potential while solar has an acceptable potential
but will be much less cost-effective than in Tanzania. Given the high population density, the biomass
resource is rather scarce in Rwanda. If all rice produced in Rwanda were used for energy production
it will represent about 700 MWh/yr, the energy needed for mini-grid is about 480,000 MWh/yr, and
so rice husk resource was considered as negligible.
5.3.4 GMG Potential Assessment Results in Rwanda
The main scenario is a high share of hydro for mini-grids. However, it could also be realistic to consider another scenario with mix of solar and hydro (50/50).
43

Final Report – Support Study on Green Mini-Grid Development
Table 17 - Rwanda Green Mini-Grid Potential Scenario 1 (100% Hydro)
Scenario 1: Rwanda - 100% Hydro Hydro
Total population living in area >250hab/km² 10 609 429
Share of population for Hydro technology 100%
Population targeted by mini-grids (>250hab/km² & >5km
of MV) 3 269 828
Average energy consumption over 20 Yr (GWh/Yr) 834,54
Penetration rate 87%
Energy need @ Yr5 (GWh)
483,79
Power Need @ Yr5 (MW) 90,94
Avoided Carbon emission DMG (kTCO2eq)
943
Avoided Carbon emission National grid (kTCO2eq) 515
Table 18 - Rwanda Green Mini-Grid Potential Scenario 2 (50% Hydro)
Scenario 2: Rwanda - 50% Hydro Hydro Biomass Solar Total
Population targeted by mini-grids (>250hab/km² &
>5km of MV) 1 634 914 0 1 634 914 3 269 828
Share of population for a given technology among the
total choice 50% 0,00% 50%
Average energy consumption over 20 Yr (GWh/Yr) 415 0 415 829
Penetration rate 87% 40%
Energy need @ Yr5 (GWh) 240,3 0 240,3 480,7
Total Power @ Yr5 (MW) 45 0 45 90
Renewable Device capacity (MW) 45 66 66
Carbon emission Diesel-MG* (kTCO2eq/Yr) 469 0 216 684
Carbon emission National grid** (kTCO2eq/Yr) 256 0 118 374
Assumptions (cf. item 3.6):
Total Population 11 609 429 (2013)
* Diesel emission 1.3 TCO2e/MWh
** National electricity production carbon content 0.71 TCO2e/MWh
The first scenario is optimistic in its view of considering 100% hydro given all the actual site-specific
constraints. The second scenario is more conservative considering a lower access rate to hydro for
mini-grids, but results in higher investment and reduction of -30% in carbon savings. Further analysis
will be required to assess the realistic hydro potential for MG. 5.3.5 Grid Extension and Stand-alone Potential
The following results can be found after extrapolation for the grid extension potential:
Grid Existing MV New MV
Population lines (km) lines (km)
Rwanda 6 821 440 1 931 4 562
44

Final Report – Support Study on Green Mini-Grid Development
The remaining population that should be covered by SA systems: 1,518,161 persons
5.4 Malawi 5.4.1 Situation Map The following map shows the population density and HV/MV grid:
Figure 26 - Malawi Situation Map
5.4.2 Country Overview
No GIS layer has been obtained from Malawi institutions/agencies, but a detailed map of the MV
network has been used from ESCOM to draw the MV network of the country as shown on the
previous map. Population density is mainly concentrated in 2 areas where the grid is already well
extended.
Same as above for Rwanda, here is the table showing the population repartition depending on the density threshold and the distance to the grid:
45

Final Report – Support Study on Green Mini-Grid Development
Table 19 - Malawi Population density and distance to the MV Network
Population living at less Population living at more
Total
than 5km of MV
than 5 km of MV
population living where density < 2 285 822 4 508 842 6 794 664
250hab/km² 14% 27% 40%
population living where density >= Extension of MV Mini grids
9 982 883
5 437 076 4 545 807
250hab/km²
32% 27%
60%
Total 7 722 898 9 054 649 16 777 547
46% 54%
5.4.3 Renewable Potential Assessment
The following map shows a good potential for hydro mini-grids in almost the entire country as a mean run off > 4l/s:
Figure 27 - Malawi Hydro Potential
Biomass resource is rather limited for power generation: based on the “Off-grid concept paper for
the energy sector 2011-2016” on electricity generation for rural areas (www.mca-
m.gov.mw/documents), there are about 35,000 people in rural areas that could be powered from
biomass generation (less than 1% of MG population potential).
No wind map could be found for Malawi, but we can consider that there is some potential close to the Lake Malawi, thus 5% of the population in mini-grids could be powered by wind based mini-grids.
5.4.4 GMG Potential Assessment Results in Malawi
Given the uncertainty on the dominant hydro resource, as for Rwanda, 2 scenarios can be considered, first with 50% hydro and second with 95% hydro.
Table 20 - Malawi green mini grid potential scenario 1 (50% Hydro)
Scenario 1: Malawi - 50% Hydro Wind pop Hydro Biomass Solar Total
Total population living in area >250hab/km² 499 144 4 991 441 36 854 4 455 443 9 982 883
Share of population for a given technology 5% 50% 0,37% 45%
46

Final Report – Support Study on Green Mini-Grid Development
Population targeted by mini-grids (>250hab/km² & >5km of MV) 227290 2272903 36854 2028831 4 545 807
Average energy consumption over 20 Yr (GWh/Yr) 58 576 9 514 1158
Penetration rate 33% 87% 40%
Energy need @ Yr5 (GWh) 33 334 5 298 671
Total Power @ Yr5 (MW) 6 63 1 56 126
Renewable Device capacity (MW) 16 82 97
Carbon emission Diesel-MG (kTCO2eq/Yr) 25 652 27 268 971
Carbon emission National grid (kTCO2eq/Yr) 13 342 14 140 510
Table 21 - Malawi green mini grid potential scenario 2 (95% Hydro)
Scenario 2: Malawi - 95% Hydro
Wind pop
Hydro Biomass Solar Total
Population targeted by mini-grids (>250hab/km²
& >5km of MV) 227290 4301735 36854 0 4 545 807
Share of population for a given technology 5% 95% 0,37% 0%
Average energy consumption over 20 Yr (GWh/Yr) 58 1091 9 0 1158
Penetration rate 33% 87% 40%
Energy need @ Yr5 (GWh) 33 632 5 0 671
Total Power @ Yr5 (MW) 6 119 1 0 126
Renewable Device capacity (MW) 16 0 16
Carbon emission Diesel-MG (kTCO2eq/Yr) 25 1234 27 0 1286
Carbon emission National grid (kTCO2eq/Yr) 13 647 14 0 674
Assumptions (cf. § 3.6):
Total Population 16 777 547 (2013))
National potential of Rice husk gasification 6202 MWh/yr
National potential of Sugar Cane based energy 223 MWh/yr
Diesel emission 1.3 TCO2e/MWh
National electricity production carbon content 0.68 TCO2e/MWh
As for Rwanda, more analysis is required to know the actual hydro potential for MG in the country.
The 50% hydro scenario will result in more investment compared to 95% hydro and 20% less carbon
emission avoided.
5.4.5 Grid Extension and Stand-alone Potential
Here is the table summarising the extrapolation for the network length for grid extension in Malawi:
Grid Population
Existing MV New km MV
lines (km)
lines (km)
Malawi 5 056 481 3 861 3 385
The remaining population that should be covered by SA systems: 7,175,259 persons
47

Final Report – Support Study on Green Mini-Grid Development
5.5 Uganda 5.5.1 Situation Map The following map shows the population density and HV/MV grid:
Figure 28 - Uganda Situation Map 5.5.2 Country Overview
The detailed 2013 MV network map has been provided by Ugandan Ministry of Energy and Mineral
Development, thus the detailed GIS methodology has been performed to assess the potential for
green mini-grids in Uganda. Unfortunately, no precise population maps were found. 2005 data from
EUEI regarding population has been used. The following maps illustrate the data used for this study.
48

Final Report – Support Study on Green Mini-Grid Development
Figure 29 - Uganda MV Network Map
The total population is about 34 million inhabitants in 2013; the breakdown of people living far from the grid in dense location is as follows:
Table 22 - Uganda Population density and distance to the MV Network
distance <5km
distance >5km
Total
population living where density > 250
18 14 0 341 2 256 931 20 397 272
(52%) (6%) (59%)
population living where density < 250
7 929 956 6 430 771 14 360 728
(23%) (19%) (41%)
Total 26 070 297 8 687 703
34 758 000
(75%) (25%)
5.5.3 Renewable Potential Assessment
Hydro
The hydro potential is good as shown on this map, almost all the country has a good mean rate flow and many rivers are present.
49

Final Report – Support Study on Green Mini-Grid Development
Figure 30 - Uganda Hydro Potential Biomass The following map provides the potential for rice and sugar cane biomass resources in Uganda.
Figure 31 -Uganda Biomass Potential But when one compare the electricity potential generation with the demand in the areas, only empty areas appear as interesting.
If this quantity of biomass is converted into electric MWh/Yr, the total supply for the country would
be about 9 GWh/Yr, while the total need for electricity in remote area is close to 330 GWh/Yr. We
can consider biomass potential for green mini-grids in Uganda negligible.
50

Final Report – Support Study on Green Mini-Grid Development
Wind & Solar
The wind potential is not known, ESMAP claims in its renewable energy resource mapping status
report23
that no wind atlas of Uganda has been done. However, as for Tanzania we can consider that
decent wind potential can be found close to large water lakes. Thus all locations with high population
density and closer than 5km of lake shores have been considered as candidate for electrification
from wind power. Alternatively, solar resource is very good on more than half of the country.
Figure 32 - Uganda Solar Resource
5.5.4 GMG Potential Assessment Results in Uganda
There is thus a fair potential for mini-grid with more than 2 million people concerned in Uganda (about 6% of the population).
The following table shows the repartition of renewable resources feeding needed to feed green mini-grids in Uganda:
Table 23 - Uganda Green Mini-Grid Potential
Uganda Wind pop
Hydro Biomass Solar Total
Population targeted by mini-grids
(>250hab/km² & >5km of MV) 496 525 1 309 020 45 139 406 248 2 256 931
Share of population for a given technology 22% 58% 2% 18%
Average energy consumption over 20 Yr
(GWh/Yr) 126 332 11 103 572
Penetration rate (%) 33% 87% 40%
Total Energy need @ Yr5 (GWh) 73 192 7 60 332
Total Power need @ Yr5 (MW) 14 36 1 11 62
Renewable Device capacity (MW) 34 16 50
Carbon emission Diesel-MG (kTCO2eq/Yr) 54 375 34 54 517
Carbon emission National grid (kTCO2eq/Yr) 29 200 18 29 275
23 https://www.esmap.org/sites/esmap.org/files/RESEARCH%20-
%20Renewable%20Energy%20Resource_Mapping_Status_Report_P131926.pdf
51

Final Report – Support Study on Green Mini-Grid Development
5.5.5 Grid Extension and Stand-alone Potential Here is the table showing the results for grid extension option for Uganda
Grid Existing MV New MV
Population lines (km) lines (km)
Uganda 16 326 307 18 000 10 903 The remaining population that should be covered by SA systems: 16,174,762 persons
5.6 Mozambique 5.6.1 Situation Map The following map shows the population density and HV/MV grid:
Figure 33 - Mozambique Situation Map 5.6.2 Country Overview
Very unfortunately, no GIS map has been collected from local institutions (EDM & FUNAE) despite the existing updated GIS layers and have been officially requested during country’s visit.
The electrical network has been recently intensively extended in many rural areas and is represented in that map. Almost all district towns are electrified (all by end of 2015), as shown in below map
(coloured districts)24
. 24
http://www.edm.co.mz/index.php?option=comdoc_man&task=doc_download&gid=135&Itemid=68&lang=en
52

Final Report – Support Study on Green Mini-Grid Development
The only available information on population density is from the same source as the above countries. The previous map (from EUEI’s grid) indicates a very low density of population all over this large
country, well below our threshold of 250 people/km². Most un-electrified settlements with a higher
density (>250) are close to national grid or existing electrified centres.
Figure 34 - Mozambique Electrified District Capital Map 5.6.3 Renewable Potential Assessment
The renewable energy potential has not been assessed, given the above MG potential results and the lack of geo-referenced data obtained from Mozambique. 5.6.4 GMG Potential Assessment Results in Mozambique
Based on our given criteria and on the geo-referenced data collected, the potential of MG in
Mozambique cannot be assessed properly. This shows the limit of our simplified methodology when
no or poor information is available. Indeed, in most all rural areas outside the grid perimeter, the
population density (from EUEI’s grid) seems to be below our threshold of 250 people/km², which
would mean that the population is much too scattered in rural areas and that the potential for mini-
grid is negligible.
However, based on FUNAE database and interviews during the country visit by the consultant, the
actual population density does not seem to be that scattered. Without the adequate population GIS
layer, the assessment cannot be updated and fine tuned.
53

Final Report – Support Study on Green Mini-Grid Development
5.6.5 Grid Extension and Stand-alone Potential
The potential for grid extension and stand alone has not been assessed, given the results above and the lack of geo-referenced data obtained from Mozambique.
5.7 DRC 5.7.1 Situation Map The following map shows the population density and HV/MV grid:
Figure 35 - DRC Situation Map 5.7.2 Country Overview
No precise GIS database for MV network has been found for DRC. The local Ministry of Energy in
Kinshasa has given us information about the length of the MV network, about 4,000 km only. Most of
the country is un-electrified as shown by the previous map.
Without more precise information on population, the grid from EUEI has been used, and the 2013
population is estimated to be 75 Million people with an average density of 32 persons/km². The non-
electrified population, living in areas where the density is higher than 250hab/km², is about 8 million
persons only (12% of total population).
The potential for grid extension and stand alone has not been assessed, given the results above and the lack of geo-referenced data obtained from Mozambique. 5.7.3 Renewable Potential Assessment
DRC is well-known for having the best hydro potential in the Africa, largely unexploited. The mean
run-off is greater than 4 l/s on the entire territory, and therefore, based on our simplified criteria, the
entire territory is eligible for mini or micro hydro.
54

Final Report – Support Study on Green Mini-Grid Development
The biomass analysis gives a total potential of electricity generation of 30 MWh/yr, which can cover 2% of the mini grid population.
No wind map has been found; DRC is a flat forest country, there is no reason that an exceptional wind potential exists there, except on the small coast. No wind turbines will be proposed in DRC.
Solar potential is relatively acceptable, except near the coast (cf. PVGIS maps - http://re.jrc.ec.europa.eu/pvgis).
Figure 36 - DRC Solar Potential
5.7.4 GMG Potential Assessment Results The extrapolation method evaluates the mini-grid population to be around 5 million persons. Thus, as for Rwanda and Malawi, 2 hypotheses are done, 100% hydro and 50% hydro.
Table 24 - DRC Green Mini-Grid Potential Scenario 1 (100% Hydro)
Scenario 1: DRC 100% Hydro Hydro Biomass Solar Total
Population targeted by mini-grids (>250hab/km² &
>5km of MV) 4281017 108 258 0 4 389 275
Share of population for a given technology 98% 2,47% 0%
Average energy consumption over 20 Yr GWh/Yr 1086 27 0 1113
Penetration rate 87% 40%
Total Energy need @ Yr5 (GWh) 629 16 0 645
Total Power need @ Yr5 (MW) 118 3 0 121
Carbon emission Diesel-MG (kTCO2eq/Yr) 1228 80 0 1308
Carbon emission National grid (kTCO2eq/Yr) 671 44 0 714
55

Final Report – Support Study on Green Mini-Grid Development
Table 25 - DRC Green Mini-Grid Potential Scenario 2 (50% Hydro)
Scenario 2: DRC 50% Hydro Hydro
Biomass Solar
Total
Population targeted by mini-grids (>250hab/km² &
>5km of MV) 2 194 638 108 258 2 086 379 4 389 275
Share of population for a given technology 50% 2,47% 48%
Average energy consumption over 20 Yr GWh/Yr 557 27 529 1113
Penetration rate 87% 40%
Total Energy need @ Yr5 (GWh) 323 16 307 645
Total Power need @ Yr5 (MW) 61 3 58 121
Renewable Device capacity (MW) 84 84
Carbon emission Diesel-MG (kTCO2eq/Yr) 629 80 275 985
Carbon emission National grid (kTCO2eq/Yr) 344 44 150 538
The extrapolation method indicates a potential of 4.3M persons living in areas where mini-grids
exists is the best option to provide modern energy access. Depending on the scenario chosen to feed
these mini-grids, 1300kTCO2eq/Yr (100% hydro) or 985kTCO2eq/Yr can be spared. 5.7.5 Grid Extension and Stand-alone Potential Here is the table showing the results for grid extension option for DRC
Grid Existing MV New MV
Population lines (km) lines (km)
DRC 4 100 571 4 000 2747 The remaining population that should be covered by SA: 66,720,352 persons
56
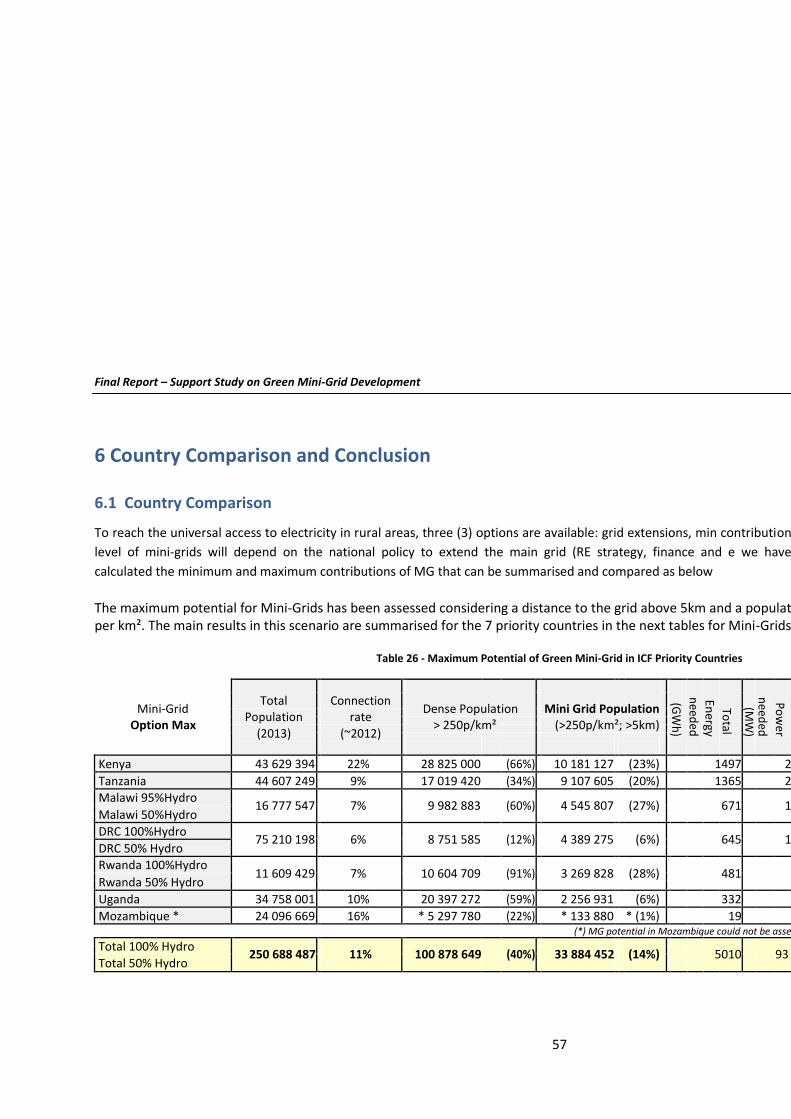
Final Report – Support Study on Green Mini-Grid Development
6 Country Comparison and Conclusion
6.1 Country Comparison To reach the universal access to electricity in rural areas, three (3) options are available: grid extensions, min contribution
level of mini-grids will depend on the national policy to extend the main grid (RE strategy, finance and e we have
calculated the minimum and maximum contributions of MG that can be summarised and compared as below
The maximum potential for Mini-Grids has been assessed considering a distance to the grid above 5km and a populat per km². The main results in this scenario are summarised for the 7 priority countries in the next tables for Mini-Grids Table 26 - Maximum Potential of Green Mini-Grid in ICF Priority Countries
Mini-Grid Total
Connection
Dense Population
Mini Grid Population
(GW
h)
need
ed En
ergy To
tal
(MW
) n
eeded
Po
wer
Population rate
Option Max > 250p/km² (>250p/km²; >5km)
(2013)
(~2012)
Kenya 43 629 394 22% 28 825 000 (66%) 10 181 127 (23%) 1497 2
Tanzania 44 607 249 9% 17 019 420 (34%) 9 107 605 (20%) 1365 2
Malawi 95%Hydro 16 777 547 7% 9 982 883
(60%) 4 545 807
(27%)
671
1
Malawi 50%Hydro
DRC 100%Hydro 75 210 198 6% 8 751 585
(12%) 4 389 275
(6%)
645
1
DRC 50% Hydro
Rwanda 100%Hydro 11 609 429 7% 10 604 709
(91%) 3 269 828
(28%)
481
Rwanda 50% Hydro
Uganda 34 758 001 10% 20 397 272 (59%) 2 256 931 (6%) 332
Mozambique * 24 096 669 16% * 5 297 780 (22%) * 133 880 * (1%) 19
(*) MG potential in Mozambique could not be asse
Total 100% Hydro 250 688 487
11%
100 878 649
(40%)
33 884 452
(14%)
5010
93
Total 50% Hydro
57
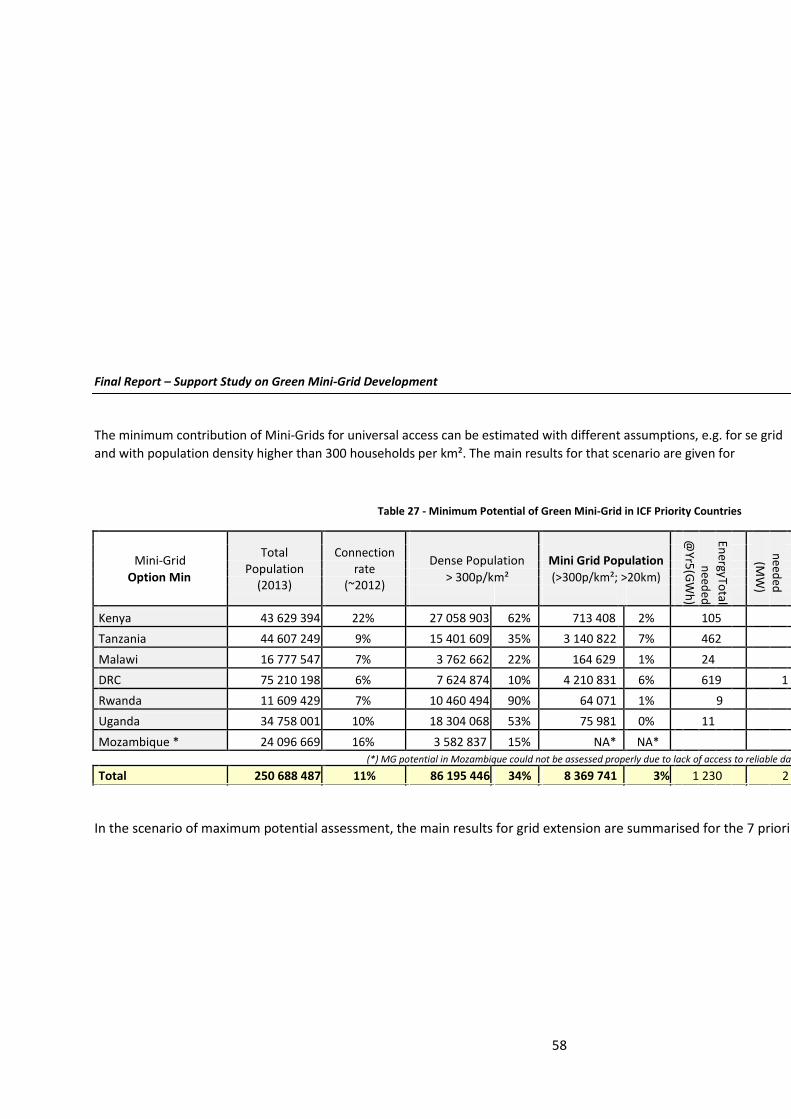
Final Report – Support Study on Green Mini-Grid Development
The minimum contribution of Mini-Grids for universal access can be estimated with different assumptions, e.g. for se grid
and with population density higher than 300 households per km². The main results for that scenario are given for
Table 27 - Minimum Potential of Green Mini-Grid in ICF Priority Countries
Mini-Grid Total
Connection
Dense Population
Mini Grid Population
@Yr5
(GW
h)
need
ed En
ergyTotal
(MW
) n
eeded
Population rate
Option Min
> 300p/km² (>300p/km²; >20km)
(2013) (~2012)
Kenya 43 629 394 22% 27 058 903 62% 713 408 2% 105
Tanzania 44 607 249 9% 15 401 609 35% 3 140 822 7% 462
Malawi 16 777 547 7% 3 762 662 22% 164 629 1% 24
DRC 75 210 198 6% 7 624 874 10% 4 210 831 6% 619 1
Rwanda 11 609 429 7% 10 460 494 90% 64 071 1% 9
Uganda 34 758 001 10% 18 304 068 53% 75 981 0% 11
Mozambique * 24 096 669 16% 3 582 837 15% NA* NA*
(*) MG potential in Mozambique could not be assessed properly due to lack of access to reliable da
Total 250 688 487 11% 86 195 446 34% 8 369 741 3% 1 230 2
In the scenario of maximum potential assessment, the main results for grid extension are summarised for the 7 priori
58

Final Report – Support Study on Green Mini-Grid Development
Table 28 - Grid Extension Potential in ICF Priority Countries
Grid Extension & densification
Total
Population Grid Population Existing MV lines (km) New MV
option (within 5km)
(2013)
Kenya 43 629 394 14 542 221 47 035
Tanzania 44 607 249 6 049 000 32 771
Malawi 16 777 547 5 056 481 3 861
DRC 75 210 198 4 100 571 4 000
Rwanda 11 609 429 6 821 440 1 931
Uganda 34 758 001 16 326 307 18 000
Mozambique 24 096 669 4 337 676 12 353
Total 250 688 487 57 233 697 119 951
Finally, the next table and figures compare the 3 electrification options for each country, including grid extension Stand-Alone systems (for scattered off-grid population (<250p/km² and >5 km from the grid)).
Table 29 – Electrification Options for ICF Priority Countries (Scenario Max.)
Total
Electrification options Population Grid Population Mini Grid Population SA Popu (2013)
Kenya 43 629 394 14 542 221 10 181 127
Tanzania 44 607 249 6 049 000 9 107 605
Malawi 16 777 547 5 056 481 4 545 807
DRC 75 210 198 4 100 571 4 389 275
Rwanda 11 609 429 6 821 440 3 269 828
Uganda 34 758 001 16 326 307 2 256 931
Mozambique (*) 24 096 669 4 337 676 * 133 880 (*) MG potential in Mozambique could not be assessed properly du Total 250 688 487 57 233 697 33 884 452 1
Based on our given criteria and on the geo-referenced data collected, the potential of MG in Mozambique cannot be of our simplified methodology when no or poor information is available. Indeed, in most all rural areas outside the
59

Final Report – Support Study on Green Mini-Grid Development
(from EUEI’s grid) seems to be below our threshold of 250 people/km², which would mean that the population is mu the potential for mini-grid is negligible.
Electrification Options
Mill
ion
s
80
Mill
ion
s
70 Grid Population
Po
pu
lati
on 60
SA Population
Po
pu
lati
on
50
40
30
20
10
0
Electrificati 80 70 60 50 40 30 20 10
0 Figure 37 – Electrification Options for ICF Countries
60
6.2 Conclusion The simplified or adapted methodology used to assess the MG potential in the 7 priority countries
gives an indicative overview of the share of population that can be targeted by grid extension, mini-
grids or stand-alone solutions.
Despite its highest electrification rate, our analysis shows that Kenya with 43 million people in total
has the highest technical potential for mini-grid development with 10 million people living in off-grid
and high density regions. This represents one third of the total potential population among the
selected countries. But this figure is not precise; despite our contacts in Kenya and the on-field
mission, it was not possible to get the updated national MV network GIS layer. Thus this 10 million is
only an estimation based on extrapolation with other countries. The places where mini-grids would
be could not be located at this stage; such further development would be worthwhile.
The Risoe Institute has shown that Kenya has a good potential for wind development as well as hydro
and biomass. Solar which is the last option in our simulation still has the greatest share above 60% as
it provides an alternative where other renewables are insufficient. Avoided carbon emission in Kenya
also represent a third of the potential of the sum of the other countries.
Almost the same targeted population, avoided carbon emission proportion can be found in Tanzania
for mini-grid development. Tanzania is bigger than Kenya and for this country it was possible to
locate enumeration areas where mini-grid is the best option for rural electrification and to select the
best option to power the mini-grids. For 4 regions, precise and identified mini-grids have been
studied within the IREP project conducted by the Rural Energy Agency (REA).
Malawi and Rwanda have the same profile, where the existing MV network has been studied based
on maps. Rwanda’s area is a fifth of Malawi’s area, but Rwanda’s population is only two third of
Malawi’s population. Both have a potential population for mini-grids development close to 3 – 4
million people. But in both countries, most locations are not very far from the grid. Malawi is a
rectangle of 800 x 170 km and the national network goes from south to north, so every part of the
country is at maximum 100km far from the national grid. Rwanda is very small (180 x 150 km) and
has a national grid covering all the country, not developed enough yet for the electrification of every
village, but simple grid development policy can reach this objective. Contrary to Tanzania, the mini-
grid option will be in close competition with grid extension depending on national policy and
priorities. The mini-grids development should be designed with the perspective of rapid grid
interconnection.
For these three last countries (Tanzania, Malawi, Rwanda) the analysis has shown the location of potential mini-grids, thanks to the available GIS data.
DRC is a huge country with some large independent grids. The population is much dispersed but
since the total MV network is very short (4,000km) the extrapolation model still find about 4 million
people which would be impacted by mini-grid development. Further analysis will be required to
study the exact location of these mini-grids.
Uganda has the best developed MV network compared to the size of its area. Thus the potential for mini-grid development is minor with ‘only’ 2 million people for whom mini-grid seems to be a
61

solution for modern energy access. 16 million persons live in Uganda in dense area at less than 5km of the MV network, there is there a huge potential for grid densification.
Mozambique potential for MG was the hardest to assess given the poor quality information
available. The country has a rather well-extended interconnected network all over the country and
the density of rural off-grid settlements has to be verified to justify mini-grid approach.
Rural population candidate for MG reaches the highest value in Kenya and Tanzania, followed by
Malawi and DRC. However, those absolute numbers are relatively small compared to the scattered
non-electrified population, candidate for stand-alone systems.
Note that the results from the adapted modelling are highly indicative and can be significantly
different if critical assumptions/thresholds as minimum population density (250 pers/km²) or
minimum distance to the grid (5 km) are changed.
62

7 Annex: GEOSIM® Methodology GEOSIM is a software developed by IED based on its long experience of rural electrification planning. It is a decision help tool for planners working in four steps:
1 GEOSIM Spatial Analyst ®
Spatial analysis and planning - Identification and selection of development poles. - Analysis of hinterlands and ranking of poles
2
GEOSIM Demand Analyst ® Load forecasting
- Identification of isolated settlements
- Assessment of energy consumption - Assessment of peak load - Assessment of the number of LV and MV clients
Rural electrification plan of
the targeted territory 3
-
-
GEOSIM Network Options ® Optimisation of supply options
Analysis of supply options of development poles ( grid , diesel, hydro, biomass) Selection of the least -cost option ( sizing and costing )
4 GEOSIM Distributed Energy ®
Standalone systems
- Sizing of equipments (PV, Multifunctional platforms )
- Calculation of investments
To follow this methodology requires a long process of data gathering and consolidation, it is only
successful if local partners such as Rural Electrification Agencies, Ministries and Utilities are closely
involved in the work.
In this context, it is aimed at developing an entire plan of rural electrification at a regional or national
scale taking into account the development of social and economic infrastructures, the demand level
of households, infrastructures and industries and the development of national grid. Its outputs are
the analysis of social infrastructure inside the territory, analysis of electricity demand, maps and
steps of centralized grid extensions, mini-grids identification (based on diesel or on renewables) and
development of distributed energy for remote areas.
This Methodology has been recently applied in Tanzania (on 4 regions) in the IREP Project, in Burkina
and in Cambodia for their rural electrification master plan. Similarly it is used or has been used in
Mali, Niger, Benin, Cameroon, Ethiopia, Senegal, Central African Republic, and Madagascar. The 4 key steps of GEOSIM methodology are described hereafter.
7.1 Spatial Analyst The main objective of our spatial analysis approach is to anticipate the impact of rural electrification
projects on social and economic development, in order to maximise it at the planning stage. Impacts
are different with results; results are the number of households and business being connected. It
would be of little help if the only use of electricity is to connect TV and bars (which
63

sometimes happens), that is why we prefer to analyse the impact of electrification in term of access to education, health and economic development. 7.1.1 Maximising the impact of rural electrification and social development
Spatial analysis will allow us to identify the most relevant places (settlements) to electrify and then
rank (prioritize) them, according to their rated potential for development. More classical tools such
as load forecasting and least-cost sizing of power plants will then be used to optimize the projects
technically, economically and financially, which will provide power to these high ranked settlements.
The rationale behind this is the following: rural electrification is usually not profitable, therefore it
requires public subsidies which are available in very limited quantities, and these limited resources
should be allocated to places with the highest potential for development, even if they are not
necessarily the most profitable, nor administratively the most important.
Those settlements, with relatively more potential impact on the development of their surroundings (or hinterland) than other settlements of the area, are called Development Poles (DP). 4.1 Identification of ‘development poles’
The method used to identify DPs draws its inspiration from the Human Development Index (HDI)
developed by the UNDP. The overall idea is to calculate a composite index, similar to the HDI, but for
each settlement of the area (and not only at the macro scale). This index, called the Indicator for
Potential Development (IPD), is calculated from multi-sectoral data and ranges from 0 (no potential
for development) to 1 (highest potential)25
. Settlements with the highest IPD will be simply selected
as DPs. Like the HDI, the IPD is based on 3 components, health, education and economy, each
subdivided in different criteria.
IPD is calculated for all settlements of a given country, then settlement are ranked based on the IDP,
the 10% settlements with best IPD are taken as development poles. Development poles must also be
selected with respect to a balance between several criteria. They must cover more or less uniformly
the entire study area, no remote area should be forgotten. They must not be too many development
poles in order not to result in not too expensive electrification plans.
Electrification of a development pole will impact its surroundings. If a development pole is electrified
it will impact its infrastructures, this will benefit the inhabitants in the vicinity even if they are located
outside the boundary of a given development pole. 7.1.3 Ranking of ‘development poles’
A quick and easy way of ranking DPs would be to use their IPD. However, IPD is only an estimate of
the inner potential of the settlement on the development of its hinterland. Even if a DP has an IPD of
1 (the highest value), but is located in a very remote area for some reason, the electrification of this
particular DP will benefit only to the people living inside it, and nobody will benefit indirectly from
25
A location with a high school, a hospital, piped water and 15 000 habitant will have a score close to 1 A location with a primary school, a dispensary, a borehole and 500à habitants will have a score close to 0.5 A location with no school, no health center and 900 inhabitants will have a score close to 0. These indicators varies from one country to another and are set with the local rural agencies
64

the electrification (for example electrified hospitals and schools), simply because it is too far from any other settlement.
That is why ranking of DPs is done using a sophisticated gravitational model combining the IPD score
and the distance of each DP to other settlements. The main outcome of this calculation is the
estimated total population covered by a DP, i.e. the population potentially benefiting directly or
indirectly from the electrification of the DP. DPs are then ranked by their population covered (higher
population covered means higher priority). With this model, it happens very often that a DP with a
slightly lower IPD has a very high priority of electrification simply because it is located in a very
populated area.
7.2 Demand Analyst 7.2.1 Rural Survey
Within the IREP Project in Tanzania, surveys have been undertaken to estimate the households,
infrastructures and industries demand inside the study area. More than 3600 questionnaires have
been analysed in order to assess the following:
Household segmentation of demand
Household capacity to pay
Household equipment rate
Number of infrastructure per village
Infrastructure equipment rate
7.2.2 Demand Model
These surveys have been done in order to fill the GEOSIM Demand Model with correct assumptions.
The GEOSIM Demand is a bottom up model; it draws for each village a load curve based on the
aggregation of load curves of every kind of customers present in a standard village:
Households
o Low demand level (±75% of customers, 40kWh/month, mainly lighting services)
o Intermediate demand level (±20%, 80kWh/month, mainly lighting services + TV or
Refrigerator)
o High demand level (±5%, 160kWh/month, mainly lighting + TV + Refrigerator + fan)
Infrastructures
o Schools
o Little business
o Health centres
65

o Mills
o Pumping services
o Public lighting
A range of hypotheses are made on population growth rate, infrastructure number evolution,
connection rates evolution and specific consumption evolutions of each kind of customer in order to
catch with the villages’ demand.
7.3 Network Option
Based on cost and benefits hypothesis, MV grid extensions are computed following a cost-benefit
analysis balancing revenues of village connection and cost of grid extension. The extensions are
calculated through a GIS based algorithm which takes into account optimal path for grid to connect
villages and consider max extension length per year, and total max extension.
For the IREP project, long structuring MV extension were already decided, the algorithm was thus used only to find worthy villages in a 5 km buffer along to the existing or planned MV grid. The remaining not electrified poles are analysed from a mini-grid point of view:
If a hydro or biomass renewable potential exists in the vicinity, a green mini-grid is modelled,
eventually connecting several villages in a cluster. The cluster size is computed to maximize
the cost-benefit analysis in order to make it profitable for a private investor.
If no renewable potential exist in the vicinity a diesel mini-grid is modelled, again the mini-
grid size is computed to maximise the cost-benefit analysis. Based on resource assessment
and costs hypothesis, hybridisation with wind or solar energy is then studied.
At the end of this process, all un-electrified development poles are included in an electrification
project, either from the centralized grid, or from a mini-grid option. The choice between the two
solutions is based on a cost-benefit analysis.
If other interesting renewable potentials have been identified (hydro or biomass) in addition to those
for Development Poles, a list of green mini-grids connecting clusters of villages are also provided to
the planner following the same methodology as for development poles.
For all private run mini-grids, connection to the centralised grid can thus be studied under the economic point of view.
7.4 Distributed Energy
Further, the villages that are not included in the above network or mini-grid option results are
studied as candidate for distributed energy solution. This module compute the cost of providing solar
home system and solar kits to identified infrastructures (health, education) as well as productive
solution such as multifunctional platforms.
The costs of providing individual solar home systems for the 25% richest households are also assessed.
66

7.5 Conclusion
At the end of the GEOSIM Methodology, all the studied areas are covered by modern energy access,
based on a cost-benefit analysis of the best solutions between centralised grid, mini-grid approach
and distributed energy. A special attention is given to strategic villages in term of socio-economic
development through the development poles approach. Green energies are included in the
methodology to feed mini-grids.
67

Final Report – Support Study on Green Mini-Grid Development
Foreword to Chapters 3 and 4 This report has been prepared in August 2013. It is the revised version of the draft that was
submitted in May 2013. The present report accounts for the comments on the draft. Not all
comments have, however, been considered. That mainly concerns two types of comments:
1. Some comments on the parameter values (costs, lifetime, etc.) used in the examples doubt the
validity of the values. The commentators may be aware of projects whose values are different
from the ones used in the examples, but that does not make the example values invalid. The
costs of green mini-grids are project specific and may vary enormously from one project to
another. An example, therefore, is only a piece out of a mosaic.
2. Quite some comments confuse economic analysis with financial analysis. Economic analysis are
made from the viewpoint of the society; financial analysis from the viewpoint of the investor.
Comments such as “... the analysis does not take tariff related aspects into consideration and
does not tell whether the projects would be able to generate adequate funds to run their
businesses in the long run.” address aspects which are dealt with in the financial analyses but
not in the economic analyses.
The consultant’s impression is that some reviewers attach a different meaning to costs and benefits than the consultant does. The following brief text aims at clarifying some issues in that respect.
The term “cost-benefit analysis” is generally reserved for analyses which are made from the overall
viewpoint of the society. If the analyses are made to determine whether a village, town or area shall
be electrified by a green mini-grid, the result is almost always “yes”. But that is also true if the
electrification is not done by a green mini-grid but by another technology: mini-grids fuelled by diesel
generators, connection to the main grid, stand-alone systems, etc. Green mini-grids may provide
particular benefits in the form of less or zero GHG emissions but these benefits are small compared
to the electrification benefit. The reason that almost each and every electrification project can be
justified from the overall economic point of view is that the benefits of electrification are high. It is
true that many, if not most, electrification benefits are (very) difficult to quantify. Where efforts have
been made to quantify them to the extent possible, the result was that the benefits are very high. A
study conducted in 1998 on the benefits of rural households in the Philippines found that “… the
total benefit of providing electricity to a typical, non-electrified Philippine household would be $81 –
150 per month1. Even if they were much lower in other projects, they would still be high enough to
justify the realization of almost all projects. Traditional measures of the benefits such as the
willingness to pay do not produce such results. The examples presented in this report are no
exception to that rule. But the traditional measures are incomplete measures of the benefits for the
society and that is why by adding other benefits – verbally, not numerically - one can justify the
electrification project. This is extensively reported in the study “Access to Electricity in Sub-Saharan
Africa: Lessons Learned and Innovative Approaches”, undertaken for the French Development Bank, EFD in 2012 by IED. 1
Source: ESMAP, Rural Electrification and Development in the Philippines: Measuring the Social and Economic Benefits, Report 255/02, May 2002, p. 3.
1

Final Report – Support Study on Green Mini-Grid Development
In the consultant’s view, the more interesting and important question is which electrification
technology should be applied from the overall viewpoint of the society. Least-cost electrification
plans are the appropriate instruments to answer that question. The examples presented in this
report compare the costs and benefits of some technologies.
Once it has been decided how to electrify an area, the real challenge is the implementation of the
project and the sustainability of the operation, points which are addressed in Chapter 5 of this
report. It is in this context that business models and tariffs are relevant. The monetary aspects of the
challenge are addressed in the financial analyses. Unfortunately, the terms costs and benefits are
also used in the context of financial analyses and that explains the sometimes confusing discussion2.
It would be much better to only speak of receipts, revenues, expenditures, expenses, profit and loss
if financial issues are addressed. But that is, of course, wishful thinking.
Compared to financial analysis, economic analysis is a soft science where the analyst has many
degrees of freedom to determine the result. In view of that one may wonder why economic analyses
are still requested. The main reason seems to be that donors need the economic justification of
planned projects to support them.
Other comments made on the draft report mainly concern the style of presentation and “the English”.
Comments on the style of presentation have to some extent been taken into account in this
report. The description of the examples has, however, not been shortened radically as
proposed by one commentator. Identifying the economic costs and benefits is not a simple
task and the description serves to understand the complexities.
The report has not been written by authors with English as mother tongue. The authors
acknowledge that native English speakers would often describe the content differently. But
the authors are also convinced that what they want to express can be understood even if it
is not written in perfect English.
Furthermore, the present document is a consultancy report, focusing on bringing concrete
experience to the table and providing some analysis; it is not a scientific publication. Clearly,
bringing it to that level would require additional scientific analysis and editing.
It should finally be noted that the model used for the analysis of diesel – PV hybrid systems has been
changed. The present model accounts for the hourly production of the PV system and the hourly
load demand.
2
The ToR for this project provides several examples for the use of costs and the benefits for both economic and financial analyses.
2

Final Report – Support Study on Green Mini-Grid Development
Chapter 3: Cost-Benefit Analyses
TABLE OF CONTENTS
FOREWORD TO CHAPTERS 3 AND 4 ...............................................................................................1
KEY HIGHLIGHTS ...........................................................................................................................5
1 INTRODUCTION .................................................................................................................10 1.1 Definition of Green Mini-Grid ....................................................................................... 10 1.2 Economic costs and benefits of green mini-grids – some methodological comments ...... 10 1.3 Scope of this Report ..................................................................................................... 14
2 EXAMPLES OF COST-BENEFIT ANALYSES .......................................................................15 2.1 Mwenga Hydro Plant ................................................................................................... 15 2.2 ENNy Hydro Plant ........................................................................................................ 20 2.3 Biomass-fuelled Gasifier Program ................................................................................. 23 2.4 Diesel – PV Hybrid Systems .......................................................................................... 29
ANNEX 1: EXAMPLES OF COST-BENEFIT TABLES ..............................................................34 MWENGA 3.5-MW HYDRO PLANT (TANZANIA)............................................................................ 34 ENNy 500-kW HYDRO PLANT (RWANDA) .................................................................................... 35 MINI-GRIDS SUPPLIED BY RICE-HUSK-FUELED GASIFIERS (TANZANIA) .......................................... 36 MINI-GRIDS SUPPLIED BY DIESEL-PV SYSTEMS (TANZANIA) ......................................................... 37
ANNEX 2: ANECDOTAL INFORMATION ON THE BENEFITS OF ELECTRIFICATION AND
THE WILLINGNESS TO PAY ...................................................................................................38
3

Final Report – Support Study on Green Mini-Grid Development
LIST OF TABLES AND FIGURES
Figure 1 – Development of the number of customers and the energy production of the gasifier ....... 25
Figure 2 – Assumed hourly production of PV system in % of installed capacity ................................... 31
Table 1: Carbon Price Scenarios ............................................................................................................ 13
Table 2: Comparison of gasifier and diesel supply ........................................................................... ..... 28 Table A1.1: MWENGA Hydro Plant ............................................................................................... 34
Table A1.2: ENNy Hydro Plant................................................................................................. ..... 35
Table A1.3: Biomass Gasifier Plant........................................................................................... .... 36
Table A1.4: Diesel-PV Hybrid Power Plant.............................................................................. ...... 37
4

Final Report – Support Study on Green Mini-Grid Development
Key Highlights The following questions are asked in the Terms of Reference of the present study.
What are the key performance and impact benchmarks in low carbon mini-grids worldwide in terms
of ICF key performance indicators (especially energy access, emissions reductions and job creation)?
How do these compare with on-grid and household scale intervention benchmarks? Present a cost-
benefit model (including sensitivity analysis) based on real scheme data for micro-hydro, solar PV,
wind, bioenergy, diesel and hybrid mini-grid types – drawing from examples in ICF priority countries in
Africa wherever possible.
Performance indicators depend on the objectives. The principal objectives of the ICF’s GMG program
are understood to be (i) the reduction of poverty by providing access to electricity for people who
would not be reached by the main grid in the foreseeable future and (ii) the reduction of GHG
emissions by using “clean” technologies to generate the needed electricity. Performance indicators
would consequently focus on electricity access and the reduction of GHG emissions. The few existing
GMG projects do not allow meaningful performance or impact benchmarking. The consultant doubts
that benchmarking makes sense given that GMG projects are highly location specific.
Energy access: The long-term objective of the electrification policy is to connect most potential
customers in the country to the main grid. The policy is justified because it costs less to supply
customers by the main grid unless they are in remote areas with a low load density. Mini-grids are
seen as permanent solutions for such areas and as temporary solutions for areas that are planned
being connected to the main grid but not within the “next years”. Transmission expansion plans
enable estimating which areas will not be reached by the main grid within the “next years”. Chapter 2 of the present study presents rough estimates of the energy access potential of green mini-grids
based on that approach. Further, this dimension has to be very clearly factored into the policies and
regulatory frameworks, in that when a private investor invests in a mini-grid, he possibly cannot be
assured that the area will not be connected to the interconnected network over the coming 10 years.
Hence, he has to have assurance as to the conditions under which the interconnected grid will be
obliged to off take his (renewable energy) production – see Chapter 6. While the potential is huge,
the challenge lies in the implementation of GMG projects and in their sustainable operation. The
issues are not linked to the cost-benefit analyses which are the subject of this report.
Emission reductions: Compared to mini-grids supplied by diesel generators or electrification by
means of grid connection, green mini-grids reduce emissions. The benefit of emission reductions is
however much lower than the benefit derived from electrification.
Job creation: Do green mini-grids create jobs for the local population and, in particular, more jobs
than traditional diesel-based mini-grids or stand-alone systems? The question cannot be answered in
the affirmative. Anecdotal data indicate that the construction (civil works) of green mini-grids is
usually done by local companies. Few components are so far produced locally and components which
are sourced locally are sometimes imported. During operation, the number of jobs created by
individual mini-grids is rather limited. The Mwenga project employs about 20 people (including staff
in charge of the mini-grid), the ENNy project has 11 people (no mini-grid) and the 150-kW gasifier in
Cambodia employs 11 people (the mini-grid is operated by another company).
5

Final Report – Support Study on Green Mini-Grid Development
Present a cost-benefit model (including sensitivity analysis) based on real scheme data for micro-
hydro, solar PV, wind, bioenergy, diesel and hybrid mini-grid types – drawing from examples in ICF
priority countries in Africa wherever possible.
The models used for the examples have been forwarded to DFID. The models are project specific.
Other projects would thus require new models. That said, most elements of the provided models can
be used for other projects. The cost-benefit analyses of mini-grids presented in this report focus on two main issues:
1. The costs and benefits of electrification by a green mini-grid.
2. The comparison of the costs and benefits of green mini-grids with alternative supply options,
predominantly diesel-fuelled mini-grids.
The first issue addresses the question whether an area should be electrified by a green mini-grid; and the second issue whether a green mini-grid would be the preferred option.
The question whether an area should be electrified is basically not asked any longer. It is generally
accepted that electrification brings so many benefits in the long term that almost each electrification
program is justified3. It is normally difficult to demonstrate that in terms of numbers because most
benefits are very difficult, if not impossible, to quantify. The willingness to pay (WTP) or the avoided
costs are still standard measures of the benefits. They are highly incomplete measures of the costs
and, in particular, the benefits for the society as a whole – the WTP and the avoided costs virtually
measure only short-term individual benefits - but given the problem to quantify most benefits, they
are also used in the calculations presented here. As detailed in the report already referenced above,
indirect benefits would pertain to issues such as better health, better services offered by small shops,
global attractiveness of the town to services and commercial activities, and investments in general.
But these aspects are impossible to quantify in monetary terms in a cost benefit analysis and pertain
more to impact analysis. The WTP has been determined such that the economic internal rate of
return (EIRR) is 10% which is typically the threshold value.
More interesting than the question whether an area should be electrified by a green mini-grid are
two other questions: (1) by which green mini-grid technology (hydro plant, biomass plant, hybrid
systems, etc.) should the area be electrified or would a traditional solution (diesel-based mini-grid or
grid connection) not be the best option?, and (2) given that financial resources are limited, should
the area under consideration be electrified now or should other areas not be given priority?
The second question is not addressed in this report. It is the subject of electrification master plans.
The first question is addressed by comparing the EIRRs of green mini-grid technologies and of
traditional supply solutions which is basically a mini-grid supplied by diesel generators. 3
A study conducted in 1998 on the benefits of rural households in the Philippines found that “… the total benefit of providing electricity to a typical, non-electrified Philippine household would be $81 – 150 per month”. Source: ESMAP, Rural Electrification and Development in the Philippines: Measuring the Social and Economic Benefits, Report 255/02, May 2002, p. 3.
6

Final Report – Support Study on Green Mini-Grid Development
The economics of green mini-grids are site specific and every project has its particularities. The
examples presented in this report therefore do not claim being representative or typical of the
technology or the country.
Efforts were made that the examples present projects which have been realized. Cost data of two
small hydro plants and a gasifier were obtained from the investors. The data do not cover all costs,
not all obtained data reflect exactly the realized costs and only the approximate date of cost accrual
was sometimes communicated. Obtaining a complete and precise set of data on existing (green)
mini-grids is virtually impossible. Analysing planned projects is much easier than analysing projects
which have been realized. One hydro plant which has been analyzed is the 3.5-MW Mwenga plant in Tanzania. The bulk (about 80%) of the plant’s production of 24 GWh/year is fed into TANESCO’s main grid. The remainder is
used to supply customers in surrounding rural areas, including one anchor customer. A mini-grid has
been constructed for that purpose. The low specific investment costs of the plant, about 2,200
US$/kW, explain why the plant has levelised economic costs of only 5.3 US cents/kWh when
calculating with 20 years of production. That the WTP would have to be relatively high, about 0.19
US$$/kWh, is due to the connection costs (350 US$/customer) and the network which must be
constructed to electrify customers, including the network that TANESCO has to establish to connect
new customers.
The economics of the plant depend on what TANESCO is doing with the energy obtained from the
Mwenga plant. The result presented above assumes that TANESCO uses the energy to connect
customers who previously had no access to electricity. While that is the most likely policy in view of
the government’s objective to advance electrification, TANESCO could theoretically also use the
energy for other purposes such as allowing existing customers to consume more, improving power
supply quality, or reducing GHG emissions. The benefits of such end-use are likely to be in general
(significantly) lower compared to the benefits of electrification. The country benefits in particular
much more from electrification which green power plants make possible than from their reduction of
greenhouse gases. From the overall economic viewpoint, it is thus better to install a green mini-grid
which serves previously non-electrified customers than to install a green power plant which feeds
into the grid but does not necessarily lead to additional connections. That result also applies to the
other technologies examined in this report. Furthermore, this configuration should probably not be
qualified as a “mini grid” but more as a small IPP. Mini grids are those local generation situations
which more than half of the power generated serves local previously un electrified population.
The second analysed hydro plant is the 500-kW ENNy plant in Rwanda. The owner had planned to
supply individual customers but the Government of Rwanda has recently informed the company that
it could only sell to EWSA4. Compared to the Mwenga plant, the ENNy plant is expensive (about
5,600 US$/kW). Levelised costs are about 17 US cents per kWh when calculating with 20 years of
production. The plant would require a WTP of about 0.31 US$/kWh in order that the EIRR would be
at least 10%. While the plant is a relatively expensive hydro plant, it is far more attractive on
economic grounds than a diesel generator. 4
The information was obtained from CARERA, a German company which is a shareholder in ENNy. The information was obtained after the draft report had been submitted. The reason for not allowing ENNy to supply retail customers seems to be that the Government of Rwanda wants to avoid having different tariff schemes in the country.
7

Final Report – Support Study on Green Mini-Grid Development
A common feature of both hydro plants is that lead times were long. It took at least 5 years from
the start of serious planning until the start of power production. Both plants expect to produce
almost year round which certainly does not apply to all potential hydro sites that could be developed.
Both plants are at present faced with the problem that the main grid cannot fully absorb the
production which the companies could inject into the grid. Power production is therefore lower
(more than 10%) than possible. A significant difference between the plants concerns the preparatory
costs. These were relatively low for the Mwenga plant (about 5% of the hydro plant investment cost)
but high for the ENNy plant, reaching almost 25% of the investment cost.
Another cost-benefit analysis was made for a program where off-grid electrification would be done
by mini-grids supplied by gasifiers using rice husks as feedstock. An electrification study for Tanzania
has identified that technology as potentially attractive supply solution for areas where rice husks
would be available. In total, 16 small towns (development centres) could benefit from off-grid
electrification by that technology. The experience with an existing rice-husks-fuelled gasifier in
Cambodia was used to determine the costs of the gasifiers. It turned out that the investment costs
are (much) higher than the “typical” values reported in some studies. The Cambodian data suggest
that 2,800 US/kW is a sound estimate of the investment cost of a gasifier equipped with gas cleaning
equipment, two sets of filters for continuous operation, water treatment and ash removal.
Calculating with these costs, a lifetime of 10 years, feedstock costs of 5 US$/ton and a specific
consumption of 2 tons/MWh, the levelised economic costs of the gasifiers are in the order of 25 US
cents per kWh. The costs could exceed 30 US cents in a pessimistic scenario where, in particular, the
lifetime is short (8 years) and feedstock costs are high (20 US$/ton). Adding the mini-grid in the
reference case, the levelised economic costs increase from 0.25 US$/kWh to 0.44 US$/kWh. The WTP
would have to be about 0.47 US$/kWh in order that the EIRR, accounting for GHG emissions, is 10%5.
The comparison with diesel supply shows that the gasifier tends to be the preferred supply option
(higher EIRR at given WTP). But it is also true that gasifier supply is normally not much better in terms
of the economic evaluation criteria. In some scenarios - for example, if the gasifier lifetime is below
10 years - diesel supply would rather be recommended. If the economic costs of the GHG emissions
of the diesel generators are not taken into account, the diesel generators would usually be the
preferred supply option.
The analyses further indicate that the connection of the villages to the main grid is not recommended
compared to gasifier supply. All of the 16 villages are at present more than 40 km away from the
main grid and the distance would have to be about half in order to make grid connection the
preferred option. TANESCO’s expansion plans indicate that the main grid will not be within that
distance in the next ten years.
Cost-benefit analyses of mini-grids supplied by diesel-PV hybrid systems were made for the same 16
towns. The analyses were made for hybrid systems with and without storage capacity. The installed
PV capacity was determined such that it equalled about the maximum load which is expected to
occur in ten years at the time when the PV production peaks which is typically between 12h and 14h.
5
Biomass-fuelled gasifiers are not clean technologies in terms of GHG emissions. In fact, their emissions are high and tar is produced in addition. Their emissions do, however, not enter in economic analyses because the produced greenhouse gases are sequestered again when the biomass crop grows. What enters in the calculation of the benefits are the avoided emissions of households which used black carbon emitting kerosene lamps before switching to electric light when the gasifiers have been installed.
8

Final Report – Support Study on Green Mini-Grid Development
Calculating with costs of 800 US$/kW for the diesel generators, 0.15 US$/kWh for diesel fuel cost6,
1,600 US$/kWp for the PV panels, 1,000 US$/kWp for the inverter and a PV production of 4
kWh/day/kWp, yields levelised economic costs of 0.26 US$/kWh for the hybrid system without
storage capacity. The costs are calculated over the assumed diesel lifetime of 10 years and account
for the residual values of the PV components. Adding the costs of the mini-grids for the 16 towns
increases the levelised costs to about 0.45 US$/kWh. The WTP would have to be about 0.51
US$/kWh in order that the EIRR, including the costs of GHG emissions, is 10%.
Storage would allow lower diesel fuel cost but the levelised costs would increase because storage
capacity is expensive. Calculating with battery cost of 250 US$/kWh and a discharge factor of 2, yields
levelised costs of 0.27 US$/kWh without accounting for the mini-grid costs and 0.47 US$/kWh when
including the mini-grid costs.
In the model used for the analyses, diesel–only supply would economically be a bit more attractive
than supply by a diesel-PV hybrid system. That may change if the total PV capacity is not installed at
the beginning – in the model, the installed capacity is, without storage, only fully used in 10 years -
but a more phased approach is used where PV capacity is added in line with the growing demand.
The comparison with gasifier supply indicates that, if feedstock is available at a reasonable price and
the lifetime of the gasifiers is 10 years or more, mini-grids supplied by gasifiers can be expected to
have a higher EIRR. That is mainly due to the zero CO2 emissions of gasifiers. The key findings of this study can be summarized as follows:
With the possible exception of diesel-PV hybrid systems, green mini-grids seem to be economically more attractive than diesel-based mini-grids.
Among the examined green mini-grid projects, the mini-grids supplied by hydro plants are most
attractive (in terms of the lowest WTP which yields an EIRR of 10%), followed by rice-husk fuelled
gasifiers and diesel-PV hybrid systems. The two hydro plants produce almost year round which is
certainly not true for all potential hydro sites.
The electrification benefit is significantly higher than the emission reduction benefit. That is also
true when applying the UNFCCC method “electrification of rural communities using renewable
energy” which yields much higher baseline emissions than the traditional methods.
Supporting green mini-grids can be expected to be more rewarding than supporting green power
plants which feed into the main grid. The impact of this finding on DFID’s policy is that
preference should be given to subsidizing green mini-grids rather than green power plants
which feed into the main grid.
6
The costs are the economic costs. Taxes are thus not included. Without taxes, diesel fuel costs are in Tanzania about 0.60 US$/litre. An assumed specific consumption of 0.25 litre/kWh then yields 0.15 US$/kWh.
9

Final Report – Support Study on Green Mini-Grid Development
1 INTRODUCTION
1.1 Definition of Green Mini-Grid
While a precise definition cannot be given, a green mini-grid is, in this report, a small grid which is
supplied by a green power plant. The term “green power plant” is associated with small power
plants. A rule of thumb is that the installed capacity of a small plant does not exceed 10MW. The
green power plant uses renewable energy carriers for power production. Plants which use renewable
and non-renewable energy carriers such as, for example, diesel-PV hybrid systems, belong in this
report to the green power plants. The mini-grid will usually be an isolated grid. But there are cases
where the mini-grid is connected to the main grid.
1.2 Economic costs and benefits of green mini-grids – some methodological comments
1.2.1 What are economic costs and benefits?
Economic costs and benefits are determined from the viewpoint of the society as a whole. Contrary
to financial analyses, taxes, subsidies and financing costs are not taken into account in economic
analyses because they constitute transfer payments. This means that, for example, the benefits
which the economy derives from tax payments are offset by the loss of benefits which the tax payers
have to shoulder. Another important difference is that costs accrue when resources are used and not
when they are paid. 1.2.2 What is analysed? – The importance of distinguishing between two different cases One has to clearly distinguish between two cases:
(1) Cost-benefit analyses which analyse the costs and benefits of electrification by a certain
technology.
(2) Cost-benefit analyses which compare the costs and benefits of different technologies. The differences between these two types of analysis are outlined below. The costs and benefits of electrification by a green mini-grid
The costs to be included in the calculations are the costs for the design, construction, operation and
maintenance of the green mini-grid. If the green power plant emits greenhouse gases, the costs of
the GHG emissions have to be taken into account, too. The benefits are the various benefits
associated with electrification or improved power supply quality. There are also benefits in terms of
reduced GHG emissions. Households normally use kerosene for lighting before being electrified and
kerosene lamps emit black carbon, which is a hazard for human health and the environment. These
emissions are avoided when the households use electric light. If some customers used diesel
generators before being supplied by a green mini-grid, the avoided emissions of the generators
would be benefits in economic cost-benefit analyses.
10
Final Report – Support Study on Green Mini-Grid Development
The comparison of electrification by a green mini-grid with electrification by another technology
The connection to the main grid or electrification by a green mini-grid or a not-green mini-grid brings
the same benefits if the systems provide the same hours of electricity service and the same quality.
That is, of course, not always the case. Run-of-river hydro plants will not produce year round if there
are periods where the water level is insufficient to operate the plant. A biomass-fuelled plant may
have to be shut down longer than a diesel generator because of shortage of feedstock or longer
maintenance periods.
While electrification benefits of different technologies could be identical, that is seldom true for the
costs/benefits associated with GHG emissions. Hydro plants do, for example, have zero GHG
emissions whereas diesel generators have high emissions. When comparing green mini-grids fed by
hydro plants with mini-grids fed by diesel generators, the costs of the diesel emissions must be taken
into account.
The comparison of technologies must, of course, also account for differences in preparatory,
investment and O&M costs. The preparatory costs (costs for feasibility and engineering studies, costs
of environmental assessments, costs to obtain the necessary permits etc.) of green-mini grids are
often higher in terms of costs per kW installed than those of traditional supply technologies.
Investment costs per kW installed are almost always higher. The operation costs of green mini-grids
are normally lower because the fuel is free of charge (hydro, wind, solar) or at least less expensive
(biomass) than that of power plants fuelled by coal, gas or petroleum liquids. As for the maintenance
costs of mini-grids, there is no clear tendency. The maintenance costs of biomass-fuelled plants are
often high in terms of the costs per kWh whereas the costs of PV plants are low.
Cost calculations also have to account for differences in losses. Supply by the main grid incurs transport losses which are absent in mini-grids.
Finally, the comparison between technologies would have to account for differences in the year of
electrification. A mini-grid may be set up quickly whereas connection to the main grid may only occur
after many years. In that case, the mini-grid would have additional benefits in the form of the
benefits of electrification until the main grid arrives. 1.2.3 Benefits of Electrification
The term “benefits of electrification” is reserved here for all benefits excluding those related to GHG emissions.
Electrification usually incurs numerous benefits: an increase in economic activities in the wake of
electrification, higher incomes due to the economic upswing, an increase in productivity caused by
the use of electric equipment, savings in energy expenditures, better health care, less tedious
household chores due to the use of electric appliances, better education as improved lighting allows
children to spend more time on studying at home, increased security due to street lighting, reduced
migration to urban areas, etc. The problem is that the benefits are difficult to quantify. Where it has
11

Final Report – Support Study on Green Mini-Grid Development
been tried to quantify economic benefits to the extent possible, the results show that they are very
high7.
The willingness to pay for electricity or the avoided costs is still the most commonly used indicator of
the benefits of electrification when it comes to measuring the benefits. The indicators are incomplete
as they only reflect the (short-term) benefits which customers derive from electrification. The
benefits for the society as a whole are not taken into account and neither are the long-term benefits
of the end-users. In fact, there is also some empirical evidence that the WTP tends to underestimate
the benefits which individuals derive from electrification. Surveys have shown that they often spend
more on electricity after some time than their avoided costs or their declared WTP8.
The general tendency is that the benefits to society of electrification almost always justify
electrification9. As will be seen, calculations which use the willingness to pay to reflect the benefits
must often be done with WTP values which certainly exceed what customers are willing to and can
afford to pay. The criterion used in that context is that the economic internal rate of return (EIRR) is
at least 10%. The WTP is an incomplete measure of the economic benefits which the society derives
from electrification. Reduction of GHG emissions – a particular benefit of green mini-grids compared
to other technologies.
A particular benefit of green mini-grids is that, compared to diesel-based mini-grids or supply by the
power plant mix of the main grid, greenhouse gas emissions are much lower or even absent. While
there is no consensus regarding the height of the costs of greenhouse gas emissions, it is generally
acknowledged that the costs are high.
In financial analyses, the expected carbon credit reflects the benefits of reducing greenhouse gas
emissions. Small projects do not apply for carbon credit because of cumbersome procedures and the
fact that the costs of certification often exceed the expected credits. In economic cost-benefit
analysis, a green mini-grid provides a benefit compared to a diesel-based mini-grid or grid
connection, independent of whether the project applies for a credit. Quantifying the benefit is,
however, difficult. This report uses the carbon prices provided by DFID. The prices in the three
scenarios obtained from DFID are shown in Table 1. The prices have been converted into US$ by
applying the exchange rate of 1.55 US$/£. It should be noted that all of DFID’s scenarios foresee a
significant increase in carbon prices in real terms. As a consequence, avoided emissions can make a
significant contribution to the economic benefits. That is different from financial analyses if these are
made at today’s prices where carbon prices are below 5 Euros per ton of CO2. 7 A study conducted in 1998 on the benefits of rural households in the Philippines found that “… the total benefit of providing electricity to a typical, non-electrified Philippine household would be $81 – 150 per month …”. Source: ESMAP, Rural Electrification and Development in the Philippines: Measuring the Social and Economic Benefits, Report 255/02, May 2002, p. 3.
8 See, for example, the article “Bangladesh; Lessons from the first pilot DRE Project using the public service approach” in
Decentralised Rural Electrification – An Opportunity for Mankind, Techniques for the Planet, (Christoph de Gouvello, Yves Maigne et al), Systèmes Solaires, Paris, 2002.
9 Almost always does not mean always. One comment made on the draft rightly mentioned that bringing a submarine cable to an island with ten people can normally not be justified on economic grounds.
12

Final Report – Support Study on Green Mini-Grid Development
Table 1: Carbon Price Scenarios
Source: DFID Two comments are worth mentioning:
a) The development of the carbon prices at 2011 shows a (very) high increase in real terms.
b) The prices cannot be compared with market prices which, at present (August 2013) are much
lower. The costs – costs rather than prices would be the correct expression – (should)10
include the costs which GHG emissions incur for the society (costs due to the devastating
effects of floods and storms caused by climate change, costs of health damages caused by
GHG emissions, etc.). These costs are not reflected in market prices. 1.2.4 Other specific benefits of (green) mini-grids
While there is an ongoing trend that planning, construction and O&M activities in the power sector
are increasingly done by local companies, the trend is particularly visible in mini-grids. The design of
mini-grids is usually done by local companies. Green mini-grids exist which source many components
locally. The construction of the mini-grid and the civil works of the power plant are done by local
companies. Some green power plants also employ more people per kWh generated than large
plants. Biomass-fuelled power plants usually require a large number of people for the collection and
transport of the biomass.
Another important benefit of mini-grids is that they can be established quickly. The time needed
from planning until commissioning is two to three years for mini-grids with power supply by diesel
generators, biomass plants, PV plants or wind turbines. Hydro plants need more time but small hydro
plants which feed into mini-grids need much less than large hydro plants where more than ten years
seems to have become the time needed between the start of serious planning (feasibility study) and
10
It could not be clarified whether the carbon prices obtained from DFID reflect market price scenarios or economic cost scenarios.
13

Final Report – Support Study on Green Mini-Grid Development
commissioning. The benefit that mini-grids can be set up relatively quickly while it may take years to
connect the area to the main grid which may provide cheaper power supply, enters in cost-benefit
calculations in the form that the benefits of electrification are attributed to the mini-grid until the
year when the main grid arrives.
1.3 Scope of this Report This report presents the results of the cost-benefit calculations made for:
An existing 3.5-MW hydro plant which feeds power into the main grid and supplies
customers in rural areas by a mini-grid.
An existing 500-kW hydro plant which presently feeds all the production into the main grid
but plans to supply individual customers11
.
A program for off-grid electrification by mini-grids which are supplied by biomass-fuelled gasifiers.
The program, which would supply 16 villages of Tanzania, has been identified in a recent
electrification study for the country. Gasifiers are already in use in Asia but very few are
operating in Africa. The analysis uses data of a gasifier which is operating in Cambodia.
A program for off-grid electrification by mini-grids which are supplied by diesel-PV hybrid systems.
Pilot projects exist in some African countries and are under construction in others. Among
the issues which are still subject of research work are the compensation of the fluctuations of
the PV system, the dimensioning of the PV capacity and how much, if any, storage capacity
should be added. The issues are interrelated.
Annex 1 presents tables which show the costs and benefits of the analysed projects (reference scenario).
In Annex 2, the report presents some information on reported benefits of electrification and the willingness to pay for electricity supply. 11
A comment made on the draft asked whether it has not been possible finding a hydro plant which supplies retail customers only. Information on such plants which were financed by UNIDO can be found in “UNIDO Evaluation Group, UNIDO Projects for the Promotion of Small Hydro Power for Productive Use, Vienna 2010”. The data shown in that document are not sufficient for cost-benefit analyses.
14

Final Report – Support Study on Green Mini-Grid Development
2 EXAMPLES OF COST-BENEFIT ANALYSES Tables with results of the cost-benefit analyses are presented in Annex 1. The models which have been used to make the calculations have been forwarded to DFID.
All mini-grid projects are location-specific and the examples, therefore, do not claim to be
representative or typical. Their value is rather seen in that they show possible results and the
explanations provided indicate what has to be taken into account. The economic costs, and even
more so the economic benefits of projects, are not always self-evident.
The analyses of the Mwenga and the ENNy hydro plant are based on information provided by the investors. The analyses of the gasifier and the diesel – PV hybrid systems are based on planned
projects12
. The consultant’s experience is that it is much easier making cost-benefit analyses for planned
projects than for existing projects. The analysis of planned projects is based on assumptions
regarding the costs and their date of accrual. The analysis of existing projects should, of course, be
based on the actually realized costs and their date of accrual. Unfortunately, it is almost impossible
obtaining all that information with the desired accuracy and the Mwenga and ENNy project are no
exception to this rule. Missing data had to be replaced by assumptions and not all provided data
probably reflect the exact values. While the results would be different if a complete and exact set of
data had been obtained, the presented results certainly reflect the order of magnitude and the main
conclusions that can be drawn from the results would not be different if a perfect database had been
available. The analyses presented below have been made at 2013 prices in US$.
2.1 Mwenga Hydro Plant
The Mwenga hydro plant is a 3.5MW plant located in Tanzania. The owner is Mwenga Hydro Limited
(MHL), an affiliate of Rift Valley Energy. Power production started in September 2012. Except for
about two weeks during which the flow will be insufficient for power generation, production is
expected to be year round. The bulk of the produced energy – about 80% - will be sold to TANESCO
under the feed-in tariff scheme. Other customers supplied by MHL will be the Mufindi Tea Company
Ltd., an affiliate of Rift Valley Corporation, and customers in rural areas. In total, 3,000 rural
customers are planned to be supplied. The mini-grid for their supply is still under construction. In July
2013, MHL had received over 1,000 applications for connection and about 600 customers were
already connected. 2.1.1 Economic Cost The costs are divided as follows: preparatory cost, investment cost and annual O&M cost. Preparatory Cost 12
The analyses assume that the country uses its resources to construct and operate the projects. A different model would be to assume that foreign investors build and operate them. In that model, the costs for the society would be the price the investors are paid for the energy sold to the off-takers in the country. The main results of that model, in particular the comparison with other supply technologies, would not be different from those of the present model.
15

Final Report – Support Study on Green Mini-Grid Development
Preparatory costs were for studies, permits, etc. According to the investor, preparatory costs were in
the order of 0.4 million US$ (about 4% of the investment cost). The consultant’s estimate of the
annual distribution of the costs is: 2008 – 33%, 2009 – 50%, 2010 – 17%. Investment Cost of the Project Developer The investor informed the consultant that his total investment costs are in the order of 10 million US$. The consultant’s estimate of the components is as follows (in 1000 US$): Component Invest. Cost Year of investment (1,000 US$)
Hydro plant (3.5 MW) 7,700 2010: 33%, 2011: 50%, 2012: 17%
33-kV lines (83.7 km) 1,200 2011: 50%, 2012: 50%
400 V lines (28.5 km) 170 2012: 50%, 2013: 50%
Customer connections (3000 customers) 1,050 2012: 33%, 2013: 67%
Total 10,120
TANESCO’s investment cost for the supply of new customers
The largest portion (about 80%) of the output of the Mwenga plant will be sold to TANESCO. If
TANESCO uses the power completely or partly to supply new customers, the following investments
will be necessary:
Distribution grid: 10,500 US$/km, 30 customers per km13
Connection cost: 350 US$/customer
In addition, 33-kV lines will probably have to be constructed and transformers installed. Estimating
these costs with a fair degree of accuracy would be a time consuming task which exceeds the
resources of the present study. TANESCO’s supply costs are thus somewhat underestimated but that
does not affect the main findings of the analyses14
. O&M Cost
Annual O&M cost of the Mwenga plant have been estimated by the consultant at 3% of the investment cost. TANESCO’s annual O&M cost have been fixed at 2% of TANESCO’s investment cost. 2.1.2 Levelised Economic Cost
The levelised economic costs of the hydro plant have been obtained by dividing the discounted annual costs of the hydro plant (including all preparatory costs) by the discounted annual energy
production of 24 GWh15
. Discount rate: 10%. 13
The value of 30 customers per km of distribution grid is based on TANESCO’s statistics.
1433-KV lines will above all be needed to connect non-electrified villages and towns to the main grid. A significant portion
of the new customers will be in already electrified areas where the extension of the existing distribution network is sufficient to connect them. The underestimation of TANESCO’s costs is thus not high.
15MHL’s application for carbon credits is based on a higher average annual production of 28.5 GWh, The consultant has
been informed by MHL that, at least for the time being, 24 GWh is a more realistic value because TANESCO’s grid could not absorb a higher output. Generation in 2012 is estimated at 6 GWh. Generation started in September 2012.
16

Final Report – Support Study on Green Mini-Grid Development
The Mwenga plant is an attractive hydro plant. The levelised cost of the plant over 20 years would be
5.3 US cents per kWh. The calculation is conservative because the normal lifetime of a hydro plant is
much longer (at least 30 years) and no residual value has been taken into account. 2.1.3 Economic Benefits The benefits of the Mwenga hydro can be classified into three categories:
The plant will provide non-electrified entities (households, businesses, institutions, etc.) with
access to electricity. That applies to the customers who will be served by MHL and to the
customers whom TANESCO can connect thanks to the power supply received from the
Mwenga plant.
The plant will improve the power supply quality of the Mufindi Tea Company. The plant
would also improve the supply quality to TANESCO’s customers if TANESCO used a portion of
the energy received from Mwenga for that purposes. Benefits from improved supply quality
are not taken into account because quantifying them would have required time-consuming
analyses.
The plant will reduce greenhouse gas emissions. Newly connected households will replace
kerosene lamps by electric light thereby reducing emissions of black carbon. The emissions
are estimated at 0.162 tons of CO2 equivalent per household per year16
. The supply of the Mufindi Tea Company by a zero-emission plant will reduce GHG emissions as the power
plants feeding into TANESCO’s grid are not any longer used to supply the company. The grid
emission factor shown in Mwenga’s CER application is 0.529 tCO2/MWh.
2.1.4 Results
Assuming that the power injected into TANESCO’s grid is entirely used for new connections, the WTP
must be 0.192 US$/kWh in order that the net electrification benefit measured in terms of the
economic internal rate of return (EIRR) over 20 years (2012 – 2032) is 10%. The value accounts for
the residual value of the Mwenga plant, calculated from an estimated lifetime of 30 years. The other
assets (network, connections) have no residual value because their lifetime has been fixed at 20
years. 16
The value is based on the following assumptions: consumption of 0.053 liters per hour of kerosene lighting, 3.5 hours
per household per day, 2.4 kg of CO2 emissions per liter. The values are shown in the UNFCCC document “Lift-off! The
Illumination Project to Replace Kerosene lamps with Solar LED Lamps”; see
http://cdm.unfccc.int/filestorage/G/B/O/GBOUJW0NHR4VC8A9P63TSXZ5LQE7DM/CPA-DD-
TZ%20Master.pdf?t=M0J8bW1oZXcwfDAIwSKT34RmHe_4PT0Tzeri . A commentator proposed that the avoided black carbon emissions should be 0.092 tCO2/year rather than 0.162
tCO2/year. The value of 0.092 is shown in the CDM document “Small-scale Methodology. Substituting fuel-based lighting
with LED/CFL lighting systems. Version 04.0”. See
http://cdm.unfccc.int/filestorage/f/m/B6TAXE4RNLD9WI0QJ8HPGSC2YMV5ZK.pdf/EB70_repan32_AMS-
III.AR_ver04.0.pdf?t=c3R8bXJ4aHF6fDBd30UmcMwzKgRmlACCu7RE . The value of 0.092 assumes a kerosene consumption
of 0.03 liters/hours whereas the Tanzanian Lift-off-Project calculates with 0.053 liter/hour.
17

Final Report – Support Study on Green Mini-Grid Development
The WTP of 0.192 US$/kWh may be considered high in view of the low levelised costs of the hydro
plant of 0.053 US$/kWh. The levelised costs do not account for the network and connection costs.
Without these costs, the WTP would have to be only 0.066 US$/kWh (electrification EIRR 10%).
The WTP of 0.192 US$/kWh exceeds the average price paid by TANESCO’s customers. That price is
presently (August 2013) in the order of 0.125 US$/kWh (0.15 when including VAT and levies). Survey
results presented in Annex 2 do not provide a clear picture whether the WTP of 0.192 US$/kWh is
the amount that new customers are, on average, willing and able to pay. But knowing that the WTP
is an incomplete measure of the economic benefits, there can be no doubt that the Mwenga plant is
justified on economic grounds.
The electrification EIRR does not account for avoided emissions. When including the benefit of
avoided GHG emissions the EIRR reaches 11.2% (Central Carbon Price Scenario). In that calculation,
the avoided emissions consist of the avoided black carbon emissions of newly supplied households
(0.162 tCO2/household/year) and the avoided emissions of supplying the Mufindi Tea Company by
the Mwenga hydro plant instead of the power plant mix feeding into the main grid (0.529
tCO2/MWh).
If only a portion of the power injected into TANESCO’s grid is used for new connections, the result
depends on what is done with the power that is not used for new connections. If it is used to increase
the consumption of the existing customers, their benefit would probably be lower than the benefit of
customers who had previously no access to electricity (law of diminishing marginal returns). The
power could also be used to improve the power supply quality17
. The existing customers would
certainly benefit from the improved supply quality. That benefit may be high in some cases (reducing
the costs of industries or increasing their productivity) but the consultant would expect that these
benefits are for the majority of customers lower than the benefit which new customers derive from
electrification18
. If the power is used to reduce emissions by replacing existing power plants, the
benefit is given by multiplying the replaced emissions by one of the carbon price scenarios19
. If, for
example, TANESCO uses 50% of the power obtained from the Mwenga plant to reduce emissions, the
EIRR would be 8.2% (WTP = 0.192 US$/kWh) when calculating with the grid emission factor of 0.529
tCO2 per MWh and the Central Carbon Price Scenario. The value includes the electrification benefits
of the retail customers who are supplied by Mwenga and TANESCO (50% of the power obtained from
Mwenga is used for new connections). 17 If the power is used for several purposes, it must be distributed among these purposes. Otherwise there is a high risk of double counting. In reality, it will usually be almost impossible to separate between different impacts of additional power supply. That does not make the considerations presented here invalid but the shows the limits for the application in practice.
18 A study conducted in 2009 in Kenya on the willingness to pay for better power supply found that most households were willing to pay more. Not surprisingly, affluent households were willing to pay more than poor households. The provided information does not allow estimating how much more customers would be willing to pay. See: Sabah Abdullah and Petr Mariel, Choice Experiment Study on the Willingness to Pay to Improve Electricity Services, Bath Economics Research Papers, No. 15/09.
19 A comment made on the draft report asked whether the avoided cost of conventional generation enter the calculation of the benefits if no new customers are electrified. The answer is no. TANESCO has not sufficient generation capacity to satisfy the demand. Mwenga is, therefore, not replacing existing generation. Theoretically, TANESCO may decide using Mwenga not for electrification purposes. But the benefit would then not be the replacement of conventional capacity but linked to the purpose Mwenga is used for (improving power supply quality, allowing existing customers to consume more, etc.).
18

Final Report – Support Study on Green Mini-Grid Development
The results indicate that, most likely, Tanzania benefits more from electrification than from other
benefits which a green power plant may incur. A green power plant which comes with a mini-grid is,
therefore, likely to produce higher benefits than a green power plant which feeds into the main grid
because main grid supply may partly be used for other purposes than electrification. In reality, there
may be cases where the other benefits are higher than the electrification benefits. But these cases
are probably the exception to the rule. Comparison with supply by diesel generator
In view of the low levelised costs of the Mwenga plant, it is not surprising that the plant is much more attractive on economic grounds than diesel generators. Based on the following assumptions:
Diesel generator capacity 3,620 kW
Operated on average at 80% of the capacity during 8,300 hours per year, the diesel capacity
would generate 24GWh per year which is the production of the Mwenga plant.
Specific investment cost 800 US$/kW
The investment costs of 2.9 million US$ are assumed to accrue in 2012 and 2022.
Lifetime 10 years
Preparatory cost 10% of initial investment cost
Preparatory costs are assumed to accrue in 2011 and 2012 (50% each)
O&M cost 4% of investment cost
Economic fuel cost 0.15 US$/kWh
Calculating with the costs for distribution grids and customer connections as described in paragraph
2.1.1, the WTP has to be 0.344 US$/kWh in order that the EIRR without accounting for GHG
emissions is 10%. When including the costs and benefits of GHG, the EIRR drops in the Central
Carbon Price Scenario to 2.0%. This is because the costs of the emissions of the diesel generator (0.87
tCO2/MWh) by far outweigh the benefits of the avoided black carbon emissions.
19

Final Report – Support Study on Green Mini-Grid Development
2.2 ENNy Hydro Plant
ENNy’s 500-kW plant is located in Rwanda. Power production started at the end of April 2012. At
present, the total production is sold to EWSA under the feed-in tariff scheme. ENNy had originally
planned to supply the Nishili Tea Factory and rural customers. The plan was based on the assumption
that the interconnected grid would arrive in 2025. When the grid arrived in 2012, ENNy still intended
supplying the mentioned customers and had negotiated a wheeling tariff with EWSA (≈ 2 US cents
per kWh). ENNy has recently been informed by the Government of Rwanda that the output can only
be sold to EWSA at the feed-in tariff. The reason seems to be that the government does not want
different retail tariff schemes in the country. 2.2.1 Economic Cost Costs of the hydro plant The economic costs of the 500-kW hydro plant are:
Preparatory cost 0.65 million US$
Investment cost 2.81 million US$ (≈5600 US$/kW)20
Annual O&M cost estimated at 2% of the investment cost
The preparatory and investment cost were provided by ENNy. The annual O&M cost reflect the
consultant’s estimate. That also applies to the annual distribution of the preparatory and investment
costs: Preparatory cost 2008 – 33%, 2009- 50%, 2010 – 17%
Investment cost 2010 – 33%, 2011 - 50%, 2012 - 17% The construction period was much longer than ENNy had assumed because of two main reasons: (a) the construction company doing the civil works had to be replaced because of unsatisfactory performance, and (b) penstock material was not released by customs during 9 months.
ENNy employs 12 staff (11 men, 1 woman): 2 managers, 3 electro-mechanics for the operation of the plant, 7 support staff (watchmen, water intake handling, etc). EWSA’s cost for the supply of new customers The costs for EWSA to supply new customers with the energy received from ENNy are estimated as:
Distribution grid: 10,500 US$/km, 30 customers per km Connection cost: 350 US$/customer
In addition, 33-kV lines may have to be constructed and transformers installed to connect new customers. In the absence of data which would have allowed estimating these investment costs, they
20
The specific investment cost of about 5,600 US$/kW are very high; Mwenga’s cost are in the order of 2,200 US$/kWh. It could not be determined why the costs of the ENNy plant are that high. ENNy mentioned that transportation costs were high because the site is not easily accessible but other reasons certainly also contributed.
20

Final Report – Support Study on Green Mini-Grid Development
are not considered. The costs thus underestimate the true costs somewhat but certainly not by a
large margin because many, if not most, new customers will probably be in areas where the
extension of distribution lines is sufficient to connect them.
EWSA’s O&M costs are estimated at 2% of the investment cost. 2.2.2 Levelised Economic Cost
The plant is expensive compared to the Mwenga plant. When calculating with a discount rate of 10%,
the levelised costs of the hydro plant are 17.3 US cents per kWh. The value has been calculated over
20 years without accounting for the residual value of the plant. The levelised costs include the
preparatory costs. Without these costs, the levelised costs are 14 US cents per kWh. The calculation
is based on an average annual production of 2.84 GWh/year21
. The average production potential is
higher, estimated by ENNy at 3.18 GWh/year, but weaknesses of the network prevent so far that the
production potential can be injected. 2.2.3 Economic Benefits
The economic benefits depend on what EWSA is doing with the additional power supply. As the
government is striving to provide access to electricity, one scenario is to assume that all of ENNy’s
production will be used to connect new customers. The benefits would then be the electrification
benefit measured by the WTP, the avoided black carbon emissions of new household customers and
avoided GHG emissions of new customers who so far used self-generation to satisfy (a portion of)
their electricity demand. Another realistic scenario would be that only a portion of ENNy’s
production is used to connect new customers and the remainder used to improve the supply quality
of existing customers. Estimating the benefit which existing customers derive of the improved quality
would require on the supply side analyses of power supply interruptions (frequency and duration)
and voltage drops and on the demand side the estimation of the WTP to pay for better supply
quality. Such analyses go beyond the scope of this study. Only the first scenario is, therefore,
considered. 2.2.4 Results
The WTP must be 0.31 US$/kWh in order that the EIRR calculated over 20 years is 10%22
. Adding the
benefits of avoided black carbon emissions increases the EIRR to 10.4% (Central Carbon Price
Scenario) 23
. The results assume that customers consume on average 60 kWh/month – the number of customers
is 2,326 in 2012 and 3,489 from 2013 onward – and that 80% of the new customers are households
with avoided black carbon emissions of 0.162 tCO2 per household per year. If the average
consumption is only 30 kWh/month, the WTP must be 0.40 US$/kWh for the electrification EIRR to
be 10%. When accounting for avoided GHG emissions, the EIRR then is 10.7%. The increase in the
WTP is due to that the costs for the construction of the distribution network (30 customers per km)
are then twice as high and that the same applies to the connection costs. The electrification benefit
21
In the first 12 months of operation, 2.84 GWh were produced.
22 The result takes into account the residual value of the hydro plant, assuming that the lifetime is 30 years.
23 The EIRR does not change much if a lower or higher average consumption is assumed.
21

Final Report – Support Study on Green Mini-Grid Development
does not change – because it is linked in the WTP method to the MWh consumption of the customers
and not to their number – and the higher avoided GHG emissions only have a small impact.
Even the WTP of 0.31 US$/kWh may be considered high, given that the levelised cost is only 0.173
US$/kWh. The much higher WTP is due to the network and connection costs of EWSA. Without these
costs, a WTP of 0.192 US$/kWh would be sufficient for the electrification EIRR to be 10%.
Rwanda’s tariffs are among the highest in Africa. Excluding VAT, customers currently pay (August
2013) about 0.21 US$/kWh. WTP values of 0.31 and 0.40 US$/kWh are significantly higher. It must be
doubted that the 3,489 customers would on average be willing and able to pay such prices. But,
again, the WTP only accounts for a portion of the overall economic benefits.
The arguments brought forward in the Mwenga chapter on the likely impact on the economic
feasibility, if not 100% of the supplied electricity is used to connect new customers, also apply here. It
is in particular true that the electrification benefits make the hydro plant more attractive compared
to a situation where it would only reduce GHG emissions. Rwanda’s grid emission factor is 0.7044
tCO2/MWh24
. If the production of the ENNy plant were not used to advance electrification but “only”
to reduce GHG emissions, the EIRR would be negative. Comparison with supply by diesel generators
Despite the relatively high costs of the ENNy plant, the plant is more attractive than a diesel generator. Based on the following assumptions:
Diesel generator capacity 430 kW
Operated on average at 80% of the capacity during 8,257 hours per year, the diesel capacity
would generate 2,840 MWh per year which is the production of the ENNy plant.
Specific investment cost 800 US$/kW
The investment costs of 344,000 US$ are assumed to accrue in 2012 and 2022.
Lifetime 10 years
Preparatory cost 10% of initial investment cost
Preparatory costs are assumed to accrue in 2011 and 2012 (50% each)
O&M cost 4% of investment cost
Economic fuel cost 0.15 US$/kWh
Calculating with the costs for distribution grids and customer connections as in the analysis of the
ENNy plant, the WTP has to be 0.339 US$/kWh in order that the EIRR without accounting for GHG
emissions is 10%. When including the costs and benefits of GHG, the EIRR drops in the Central
24
Source: CDM, Project Design Document, Mushishito Small Hydro Power Project, June 2011, p.20.
22

Final Report – Support Study on Green Mini-Grid Development
Carbon Price Scenario to 2.0%. This is because the costs of the emissions of the diesel generator (0.87 tCO2/MWh) by far outweigh the benefits of the avoided black carbon emissions.
2.3 Biomass-fuelled Gasifier Program A currently still ongoing study which prepares an electrification prospectus for Tanzania has
identified several potential off-grid projects where electrification should be done by green mini-grids.
The mini-grids would later (after 2020) be connected to the main grid. The off-grid program for 2015
includes the electrification of 16 development centres which are located in areas where biomass
residues are plentiful, in particular rice husks. The off-grid program, therefore, foresees the
installation of mini-grids which would get the electricity from biomass-fuelled gasifiers.
Gasifiers are already in use in Asia (India25
, Thailand, Cambodia) but very few are operating in Africa.
Gasification of biomass (residues) is a relatively sophisticated technology. Intensive training of the
personnel in charge of operation and maintenance is needed. Fouling and slagging are potential
problems in operation. Fouling occurs if tar is clogging engine valves or accumulating on turbine
blades. Tar is inevitably produced in the process but can be largely removed by gas clean-up
equipment. Slagging can arise if high-ash biomass is used. Rice husk is a high-ash biomass. A lifetime
of 20 years which is often mentioned seems to be very optimistic26
. 2.3.1 Economic cost Preparatory cost 10% of investment costs
The preparatory costs are assumed to accrue in 2013 (67%) and 2014 (33%) Investment cost Gasifier 2,800 US$/kW
Total installed capacity: depends on demand at end of lifetime. If the lifetime is 8 or 10 years, the demand in the 16 villages would require installing a total 2,520 kW. If the lifetime is 12 or 15 years, 2,625 kW would be needed. The calculation of the installed capacity is described below. The average installed capacity in the 16 small towns would thus be 158 kW or 164 kW respectively.
The costs include gas clean-up equipment. The producer gas contains a range of contaminants and
gas clean-up is required to reduce contaminant concentration to harmless levels. Gas clean-up
equipment is expensive. Ceramic filters, sintered metal filters or electrostatic precipitators are
mentioned in the IRENA report (see footnote below) as devices for removing smaller particles. The
Charchuk gasifier, manufactured by Ankur, an Indian company, uses filters filled with sawdust.
Mini-grids 323 km of LV lines, 10,500 US$ per km. Total cost: 3.39 million US$ Some networks include MV lines. Total MV cost: 468,000 US$
25
According to page31 of the document “IRENA, Renewable Energy Technologies: Cost Analysis Series, Volume 1, Issue 1/5, Biomass for Power Generation, June 2012”, more than 100 MW of small-scale gasifier capacity for off-grid, mini-grid and grid-connected applications was installed in India in mid 2008. Rice-husk gasification is a widely deployed technology in the country. See http://www.irena.org/DocumentDownloads/Publications/RE_Technologies_Cost_Analysis-BIOMASS.pdf
26 A comprehensive document on biomass-fuelled power plants is the above mentioned IRENA report. Levelized cost calculations shown in the report assume that the economic life is 20 to 25 years (page 38).
23

Final Report – Support Study on Green Mini-Grid Development
Transformer cost: 480,000 US$ Customer connection cost: 350 US$ per customer
The investment costs are assumed to accrue in 2014.
The initially installed mini-grids allow connecting of all customers who join up to and including the 5th
year of electrification (49% of households and many other customers). Thereafter, the grid is
assumed to be extended in five-year intervals. The added km of LV lines is obtained by dividing the
number of new connections within five years by 3027
. MV line costs are added proportionally as in
the initial grid. The initially installed transformer capacity is sufficient to meet the demand with a
time horizon of 20 years. Annual cost O&M cost gasifier 4% of gasifier investment cost O&M mini-grid 2% of mini-grid investment cost
Feedstock cost 5 US$ per ton, including transport cost. Feedstock need: 2 tons per MWh28
Lifetimes used to calculate residual values
Gasifier 10 years in base case
LV, MV lines 20 years
Transformer 20 years Customer connect 20 years
The number of customers develops in 10 years as shown in Figure 1. The initial customers comprise
of 35% of the households in the development centres and a number of other customers. Household
customers increase such that almost 50% of the households are connected at the end of the fifth
year of electrification (2019). The number of other customers increases approximately
proportionally. From year six onward, the number of customers increases by 1.5% per year.
Power production starts in 2015 and develops in 10 years as shown in Figure 1. The average monthly
consumption is initially 60 kWh per customer. The consumption declines slightly every year as newly
connected customers tend to be less affluent. After ten years, it is about 54 kWh per month. Gross
generation assumes that losses (network losses and own consumption of the gasifier) account for 7%
of gross generation.
The installed capacity is calculated as follows: The annual demand for energy is translated into the
annual peak demand assuming that the load factor is 0.40 and that the gasifiers are operated 7,680
hours per year. The peak demand at the end of the lifetime of the gasifier plus a safety margin yields
the installed capacity. 27
TANESCO’s statistics indicate that, on average, 30 customers are connected to 1 km of LV line.
28 Feedstock need and costs reflect those of the Charchuk gasifier in Cambodia. The specific consumption mainly depends on the calorific value of the rice husks. Feedstock costs are relatively low compared to cost data cited in the literature. In India, rice husks prices were in 2011 around 22 US$ per ton according to the aforementioned IRENA Report (page 31 of the report).
24

Final Report – Support Study on Green Mini-Grid Development
Figure 1 – Development of the number of customers and the energy production of the gasifier
2.3.2 Levelised Economic Cost A. Levelised Cost of Gasifier
When calculating with a gasifier lifetime of 10 years, a discount rate of 10%, and the cost and production data presented above, the levelised cost of the gasifier is 0.249 US$/kWh. The impact of some key assumptions on the levelised cost of the gasifier is as follows:
Investment cost 3,000 US$/kW: 0.266 US$/kWh 2,500 US$/kW: 0.223 US$/kWh
Feedstock cost 10 US$/ton: 0.259 US$/kWh 20 US$/ton: 0.279 US$/kWh
O&M cost 3%: 0.238 US$/kWh 5%: 0.260 US$/kWh
Lifetime: 8 years: 0.283 US$/kWh 12 years: 0.236 US$/kWh
Best of all worlds: 0.201 US$/kWh (lifetime 12 years, feedstock cost 5 US$/ton, investment cost 2,500 US$/kW, annual O&M cost 3% of gasifier investment cost)
Worst: 0.345 US$/kWh (lifetime 8 years, feedstock cost 20 US$/ton, investment cost 3,000 US$/kW, annual O&M cost 5% of gasifier investment cost)
It should be noted that many assumptions in the “best-of-all-worlds-scenario” are even more conservative than those found in documents. The experience with the 150-kW Charchuk gasifier in
25

Final Report – Support Study on Green Mini-Grid Development
Cambodia suggests that the standard lifetime of 20 years would be extremely difficult to achieve (the
operator of the Charchuk gasifier calculates with 8 years). Investment costs of less than 2,500
US$/kW are also rather unlikely given the strong recommendation to include gas cleaning
equipment, two sets of filters to allow continuous operation while one set is cleaned, and a water
treatment plant. O&M is labour intensive. The Charchuk plant employs 11 persons (3 technicians, 3
assistant technicians, 5 unskilled workers). B. Levelised System Cost: Gasifier plus Mini-Grids and Connections
Adding the costs of mini-grids, connections and the preparatory costs of these items (10% of the
investment cost) to the gasifier cost yields levelised economic costs of 0.444 US$/kWh if the gasifier
lifetime is 10 years. The value compares with 0.249 US$/kWh for the gasifier alone. The calculation of
the system costs accounts for the residual values of the mini-grids and the connections. The
corresponding values for lifetimes of 8 and 12 years are 0.487 US$/kWh (8 years) and 0.425 (12
years). 2.3.3 Economic benefits
The gasifiers create benefits in the form of providing access to electricity and by avoiding emissions of black carbon in electrified households due to the replacement of kerosene lamps by electric light. 2.3.4 Results High WTP values are necessary in order to obtain EIRR values of at least 10%.
In the base case (10 years lifetime, etc.), a WTP of 0.477 US$/kWh yields an EIRR of 10% when not
accounted for avoided GHG emissions and 10.4% if including avoided GHG emissions (80% of
customers in that calculation are assumed to be households with avoided black carbon emissions of
0.162 tCO2 per household per year; Central Carbon Price Scenario).
If the lifetime is 12 years, the WTP must be 0.457 US$/kWh to obtain the same EIRRs. If the lifetime is only 8 years, the WTP must be 0.523 US$/kWh.
Network and connection costs account for the largest portion in the WTP. Without these costs, a WTP of 0.267 US$/kWh would be sufficient (electrification EIRR 10%).
WTP values in the order of 0.46 – 0.52 US$/kWh are certainly beyond what most customers are
willing and able to pay. That said, the WTP is an incomplete measure of the benefits of electrification
and the consultant does not doubt that the electrification of the 16 development centres by gasifiers
or other technologies is warranted.
More interesting than the question whether the development centres should be electrified is the
question which mode of electrification would be the best from the viewpoint of the society. Supply
by diesel generators and connection to the main grid are analyzed below.
26

Final Report – Support Study on Green Mini-Grid Development
Box 1: Application of another method for the calculation of avoided emissions
The method described in UNFCCC document “Electrification of rural communities using renewable energy” would yield much higher baseline emissions. The method has been developed for the electrification of communities by renewable energy sources. At least 75% of the end-user must be households. The baseline emission factors are: - 6.8 tCO2/MWh for the first 55 kWh/year of renewable electricity consumed by households, public buildings or small medium or micro enterprises,
- 1.3 tCO2/MWh for the consumption between 55 kWh/year and 250 kWh/year, - 1.0 tCO2/MWh for the consumption exceeding 250 kWh/year The figures yield baseline emissions of 7,558 tCO2 in 2015, increasing to 10,731 tCO2 in 2024 which compares
with 893 tCO2 in 2015 and 1,352 in 2024 in the method described above (avoided black carbon emissions of households). In the Base Case, the EIRR is 13.0% when calculating with the higher baseline emissions (Central Carbon Price Scenario; WTP 0.477 US$/kWh). That compares with 10.4% for the method described above. See: https://cdm.unfccc.int/methodologies/DB/5V3GUB9R90CWY26N7RXSSEVZ6C5W8G
Comparison with supply by diesel generators
Table 2 compares the gasifier supply with the supply by diesel generators. The specific costs of diesel
generators (investment cost, preparatory cost, O&M cost, fuel cost) are those shown in paragraphs
2.1 and 2.2. The total installed capacity of the diesel generators is identical to that of the gasifiers and
the same applies to the annual power generation. The diesel investment costs accrue in 2014; the
preparatory costs in 2013 (two-thirds) and 2014 (one third).
Table 2 shows that, overall, there is not a significant difference between the two supply solutions. If
only the net electrification benefit is considered, the diesel solution would be preferred. That is also
true if GHG emissions are accounted for and the lifetime of the gasifiers and the diesel generators is
only 8 years. At higher lifetimes, the EIRR of the gasifier supply is in general higher.
The assumptions are rather favourable for diesel supply. That mainly concerns the investment cost of
800 US$/kW (the cost includes transportation to the site, installation, and the cost of the power
house) and the fuel cost of 0.15 US$/kWh which implicitly assume that the specific fuel consumption
is 0.25 l/kWh. If, for example, the specific diesel investment cost are 1,000 US$/kW and the specific
fuel consumption is 0.30 l/kWh – the diesel fuel price is then 0.18 US$/kWh -, gasifier supply has a
higher EIRR in all cases when accounting for GHG emissions and, except if the lifetime is only 8 years,
also a higher electrification EIRR.
27

Final Report – Support Study on Green Mini-Grid Development
Table 2: Comparison of gasifier and diesel supply
Lifetime 8 years 10 years 12 years
WTP (US$ per kWh) such that the electrification EIRR of 0.520 0.477 0.455
gasifier supply calculated over the lifetime is 10%
EIRR of diesel solution if WTP as above 13.9% 12.2% 11.5%
EIRR including GHG emissions
Central Carbon Price Scenario Gasifier 10.3% 10.4% 10.4%
Diesel 12.0% 10.0% 9.0%
High Carbon Price Scenario Gasifier 10.4% 10.5% 10.6%
Diesel 11.4% 9.3% 8.2%
Low Carbon Price Scenario Gasifier 10.2% 10.2% 10.2%
Diesel 12.6% 10.8% 10.0%
Shaded cells: Highest EIRR of the two values
Comparison with grid supply
Another supply option would be to connect the villages to the grid. Of course, that solution has not
been proposed because of the distance to the grid. Our calculations confirm that. Assuming that one
km of 33-kV line costs 14,500 US$, annual O&M costs are 2% of the investment cost, transportation
losses are 4% of generation of the power plants feeding into the main grid and calculating with main
grid generation and transmission costs of 0.085 US$/kWh29
and a grid emission factor of 0.529
tCO2/MWh, the average distance to the grid would have to be 23 km in order for the electrification
EIRR to be 10% (the WTP values are those shown in Table 2). Taking further into account the
emissions, the distance must be about 21 km in order for the EIRR to be the same as the gasifier EIRR
(for example, 10.4% if the gasifier lifetime is 12 years and the Central Carbon Price Scenario applied).
At the moment, all villages are more than 40km away from the main grid.
29 See Mercados, Development of Electricity Tariff-Setting Methodology and Carrying Out Cost of Service Study, October
2012, p.8.
28

Final Report – Support Study on Green Mini-Grid Development
2.4 Diesel – PV Hybrid Systems
Diesel-PV hybrid systems already exist in some countries. In Kenya, for example, five mini-grids are
supplied by diesel – PV systems. In all five mini-grids, little PV capacity is installed relative to the
diesel capacity. The values are: Madera – 19%, Elwak – 14%, Hola – 8%, Merti – 8%, Lodwar – 4%. The
mini-grids were initially only supplied by diesel generators. The PV capacity was added and is
operated in base load mode (which explains the low installed PV capacity). Kenya’s SREP documents
states on page 22: “The results so far have been very encouraging and it is proposed that the rest of
the existing mini grids and the ones under construction be retrofitted to include renewable energy
and also up-scale the percentage of RE in the pilot stations.”30
The five stations mentioned above are
pilot stations.
The ongoing research work on diesel-PV hybrid systems focuses on the size of the PV system relative
to the size of the diesel generator. The compensation of the short-term fluctuations of the PV output
- by using batteries or the diesel generator – is an important subject in that respect. According to
SMA Solar, intelligent control systems may allow a much higher penetration of PV capacity (up to
60% of the diesel capacity) without having to install batteries to compensate the short-term
fluctuations. Refer to http://www.sma.de/en/products/sma-fuel-save-controller.html. The hybrid-
system without storage which is presented in this study assumes that no battery capacity is used to
compensate the short-term fluctuations. The capacity of the PV system is 30% of the diesel capacity.
A currently still ongoing study which prepares an electrification prospectus for Tanzania has
identified a total of 73 sites as candidates for off-grid electrification by diesel – PV mini-grids. The
following cost-benefit analysis is not made for that program but for the 16 sites for which supply by
gasifiers could also be envisaged. That enables comparing the two supply solutions. 2.4.1 Economic cost Preparatory costs 10% of investment costs
The preparatory costs are assumed to accrue in 2013 (67%) and 2014 (33%) Investment cost, annual O&M cost and lifetimes
Diesel generator Installed capacity: such that it meets the highest peak demand during the
lifetime plus a safety margin;
Investment cost: 800 US$/kW (power house included)
Lifetime: 10 years
Annual O&M costs: 4% of investment cost
Economic fuel cost: 0.15 US$/kWh in 2013 (0.25 litre/kWh; 0.60 US$/litre)
Emissions: 0.87 tCO2/MWh
PV system Installed capacity of PV panels: calculation described below
30
Republic of Kenya, Scaling-Up Renewable Energy Program, Project Document for Mini-Grids Development in Kenya. April
2013. The report presents in Appendix 9 the results of economic analyses of the existing hybrid mini-grids. In the analyses, the benefits are the fuel savings which are assumed to increase by 10% per year! Not surprisingly, the EIRRs, calculated over 25 years, are high (most > 20%). It seems, however, that the analyses are not economic but rather financial analyses made from the viewpoint of the society (as opposed to financial analyses made from the viewpoint of the investor which are also presented in the report). The text on page 25 of the report suggests so.
29

Final Report – Support Study on Green Mini-Grid Development
Inverter capacity: 10% higher than the installed capacity of the PV panels Investment cost: PV panels 1,600 US$/kWp, inverter 1,000 US$/kWp Battery 250 US$/kWh, charge control 500 US$/kWp
31
Lifetimes: PV panels 25 years, inverter 12 years, batteries 8 years, Charge control: 8 years Civil works: 15% of PV investment cost PV production: 4 kWh per day per kWp installed Annual O&M cost: 1% of investment cost
Mini-grids As described in the cost-benefit analysis of the gasifier program The investment costs are assumed to accrue in 2014
Installed capacity of PV system: The annual demand for energy and peak load is the same as
described in the paragraph on biomass-fuelled gasifiers. Given the annual peak load at the end of the
lifetime of the diesel generator (10 years in base case), the peak load in that year at the time when
the PV production peaks (normally between 12h and 14h) is estimated by multiplying the peak load
by a certain percentage (34% in the base case). The resulting value is the installed capacity of the PV
system. Example: The (synchronous) peak load in the 16 small towns in 2024 is 2,211 kW. The total
installed PV capacity is then 2,211*0.34 ≈ 752 kWp, corresponding to 30% of the installed diesel
capacity.
PV production without storage: The hourly production of the PV system is estimated by multiplying
the installed capacity by an hourly production factor. The factors vary between about 1% (6h and
18h) and almost 80% (around 13h); see Figure 2. The factors have been adjusted such that the
possible daily production equals the installed capacity times the assumed specific production of 4
kWh per day per kWp installed. The possible hourly production is then compared with the hourly
load demand. The latter is estimated by multiplying the annual peak load by hourly load factors. The
factors vary between about 20% (minimum load at 5 h) and 100% (peak load at 19 h). If the hourly PV
production does not exceed the hourly load, the PV production is injected into the grid. If it exceeds
the hourly load, the PV production injected into the grid is limited by the hourly load32
.
31 A comment on the draft mentioned that charge controls may not be necessary because the inverter assures the charge control. That is true in case of an AC bus where the bidirectional inverter controls the battery’s charging and discharging process. If a DC bus is used, a separate charge controller is normally installed. The system costs are thus overestimated if the system comes with an AC bus.
32 The present model is different from the one of the draft report. The previous model did not consider the hourly PV production and, as a consequence, did not match the hourly production with the load demand.
30

Final Report – Support Study on Green Mini-Grid Development
Figure 2 – Assumed hourly production of PV system in % of installed capacity
PV production with storage: The calculation is basically the same except that the PV production
which is not injected into the grid is stored in batteries and discharged later. The battery capacity
assumes that the discharge factor is 2.0, which means that the battery capacity is twice the maximum
daily production injected into the batteries during their lifetime (8 years).
Diesel capacity and production: When calculating with a lifetime of 10 years, the total installed
diesel capacity is 2,520kW which equals the total installed gasifier capacity. The diesel generators
inject the load which is not satisfied by the PV system. In the case of a PV system with storage, the PV
production which is directly injected into the grid plus the production which is stored constitutes the
demand for energy satisfied by the PV system. 2.4.2 Levelised economic cost A1. Diesel – PV hybrid system without storage
Calculated over the period 2013 – 2024 and accounting for the residual values of the PV system
(panels, inverter, civil works), the levelised costs are 0.255 US$/kWh. Discount rate: 10%.
Preparatory costs are taken into account. A2. System cost: Diesel – PV hybrid system without storage plus mini-grids and connections
When including the costs of the mini-grids and the customer connections, the levelised costs amount to 0.452 US$/kWh. B1. Diesel – PV hybrid system with storage
The levelised costs are 0.287 US$/kWh with battery charge control (DC bus) and 0.270 US$/kWh without separate charge controllers (AC bus); see footnote 31. B2. System cost: Diesel – PV hybrid system with storage plus mini-grids and connections
The levelised costs are 0.484 US$/kWh with battery charge control (DC bus) and 0.467 US$/kWh without separate charge controllers (AC bus).
31

Final Report – Support Study on Green Mini-Grid Development
The levelised costs of a diesel-only system would be 0.218 US$/kWh which compares with 0.255 US$/kWh for the hybrid system. Adding a PV system to diesel generators thus increases the levelised
costs33
. 2.4.3 Economic benefits
The diesel-PV system would create benefits in the form of providing access to electricity. Regarding
GHG emissions, the system reduces emissions of black carbon in electrified households due to the
replacement of kerosene lamps by electric light. It increases emissions because of the operation of
the diesel generators. 2.4.4 Results A.1 Hybrid system without storage
Unless otherwise noted, the following results have been obtained from the costs and benefits
accruing in the period 2013 – 2024. The lifetime of the diesel generators is assumed to be 10 years.
Starting production in 2015, the lifetime of the generators ends in 2024 and their residual value at
the end of 2024 is thus zero. The residual values of the other components (PV components, mini-
grids, connections) are taken into account.
The WTP has to be 0.485 US$/kWh to yield an EIRR of 10% when not accounting for GHG emissions. Without network and connection costs, the WTP would have to be 0.273 US$/kWh.
As has been mentioned before, a WTP in the order of 0.50 US$/kWh almost certainly exceeds the
WTP of the majority of the potential customers. But, as also mentioned, the WTP does not account
for all electrification benefits.
If emissions are taken into account, the EIRR declines to 8.7% (Central Carbon Price Scenario). The
decline is due to the emissions of the diesel generators (0.87 tonnes CO2 per MWh) which by far
outweigh the emission reductions (0.162 tCO2 per year per household) due to the replacement of black carbon emitting kerosene lamps by electric light. A.2 Comparison with diesel-only supply
The WTP of 0.485 US$/kWh yields for diesel-only supply an EIRR of 12.7% when not accounting for
emissions and of 10.5% when accounting for the costs of emissions in the Central Carbon Price
Scenario. In the High Carbon Price Scenario, the EIRRs of diesel-only supply are 12.7% (without
accounting for emissions) and 9.8% (accounting for emissions) respectively. That compares with
10.1% and 8.2% for the hybrid system.
According to these results, diesel-only supply would be more attractive on overall economic grounds
than supply from the diesel-PV hybrid system. Cost configurations can be produced where the EIRR
of the hybrid systems exceeds that of diesel-only supply but one has to make quite “heroic”
assumptions to obtain such a result with the present model. Do these findings indicate that, on
33
The result may be counterintuitive to what one expects. It is true that adding PV capacity reduces fuel costs. But the PV investment cost also increase and that occurs at the beginning of the considered period whereas the fuel savings are realized over the whole period. In discounting, the years lose in importance the more they are in the future and it is this effect which explains the increase in the levelised cost.
32

Final Report – Support Study on Green Mini-Grid Development
overall economic grounds, diesel-only supply would be the preferred solution? That conclusion
cannot be drawn. In the present model, the installed PV capacity system is determined such that its
maximum production which is assumed to occur between 12h and 13h meets the demand which
may at that time occur 10 years ahead in the future. Initially installing less capacity and adding PV
capacity when the demand grows would reduce the discounted costs of the hybrid system
significantly and could perhaps make the hybrid system more attractive on overall economic grounds
than diesel-only supply.
Financial analyses are more favourable for hybrid systems because the price of diesel fuel is much
higher in financial analyses. In economic analyses taxes are not taken into account and that makes
diesel fuel much less expensive than in financial analyses. The price to be paid for diesel fuel in
Tanzania is at present (August 2013) more than double the economic costs of 0.60 US$/litre34
. A.3 Comparison with gasifier supply
The gasifier supply presented in paragraph 2.3 had in the reference case about the same levelised
cost as the diesel-PV hybrid system: 0.249 US$/kWh vs 0.255 US$/kWh for the diesel-PV hybrid
system. The cost-benefit analyses of the two supply solutions clearly favour the gasifier, however. At
a WTP of 0.475 US$/kWh, the EIRR of the gasifier solution is 10.2% (10 years lifetime, emissions
taken into account, Central Carbon Price Scenario). When calculating with the same WTP value, the
corresponding EIRR of the hybrid system is 8.1%. The gasifier has higher investment cost per kW of
installed capacity but much lower fuel cost and its GHG emissions are not taken into account because
the produced greenhouse gases are sequestered again when the biomass crop grows.
Of course, this result has to be taken with a grain of salt. The economics of green mini-grids depend
on the site and while the present findings indicate that gasifier supply, if possible, may often be the
preferred supply option compared to diesel-PV hybrid systems, there may well be sites where that is
not the case – even if sufficient biomass is available. B. Hybrid system with storage
Calculating with a WTP of 0.485 US$/kWh, the EIRR of the hybrid system with storage capacity is
9.4% when not accounting for GHG emissions and 8% when including GHG emissions (Central Carbon
Price Scenario). The EIRR values assume that separate charge control is not necessary. If it is, the EIRR
values are 8.7% and 7.3% respectively.
In order that the EIRR without GHG emissions is 10%, the WTP must be 0.496 US$/kWh (no separate charge control) and 0.51 US$/kWh respectively (separate charge control).
34
According to the source http://www.globalpetrolprices.com/Tanzania/diesel_prices/, the average price of diesel fuel stood in August 2013 at 1.34 US$/litre. In the (remote) areas where the hybrid systems are considered candidates for off-grid electrification, the price was certainly higher.
33

Final Report – Support Study on Green Mini-Grid Development
ANNEX 1: EXAMPLES OF COST-BENEFIT TABLES
MWENGA 3.5-MW HYDRO PLANT (TANZANIA) The table below shows the data up to and including 2015. From 2016 onward, costs and electrification benefits are the same as in 2015. GHG benefits increase slightly in line with the carbon price scenario. See Table 1 in the main report. The EIRRs have been calculated up to and including 2032. The residual value in 2032 is 2.5 million US$. All costs and benefits are at constant prices. Exchange rate: 1 £ = 1.55 US$.
Table A1.1: MWENGA Hydro Plant
34
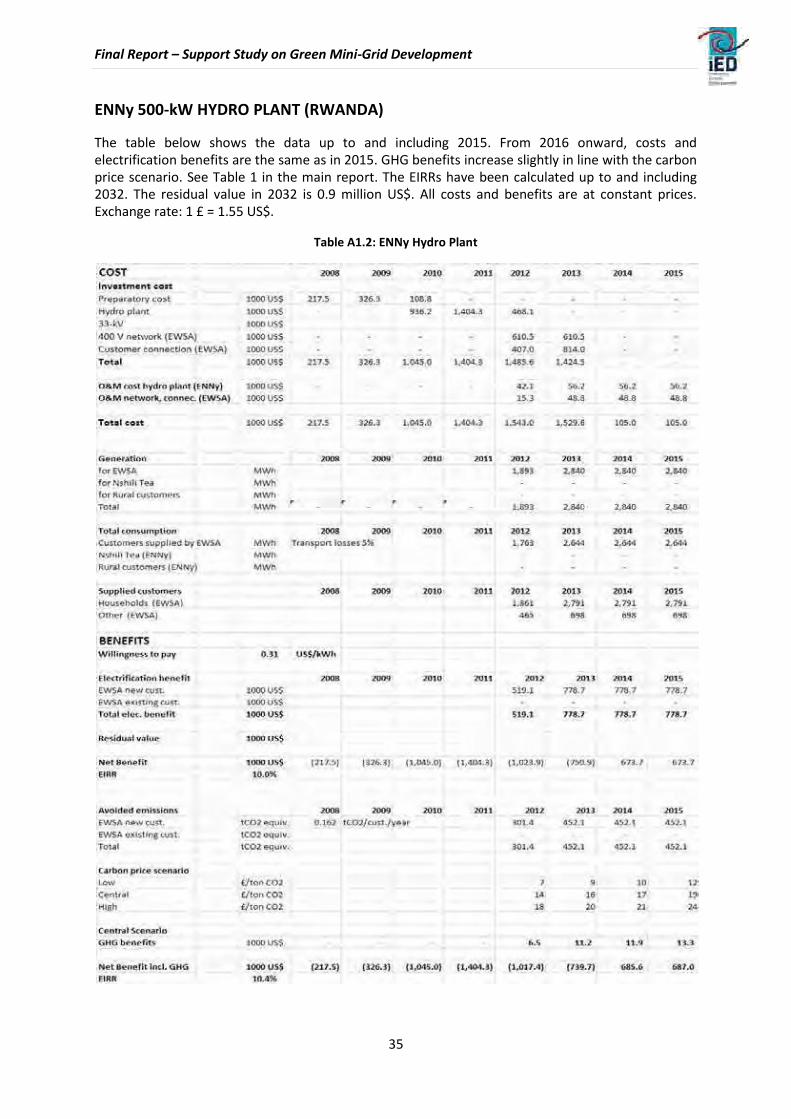
Final Report – Support Study on Green Mini-Grid Development
ENNy 500-kW HYDRO PLANT (RWANDA) The table below shows the data up to and including 2015. From 2016 onward, costs and electrification benefits are the same as in 2015. GHG benefits increase slightly in line with the carbon price scenario. See Table 1 in the main report. The EIRRs have been calculated up to and including 2032. The residual value in 2032 is 0.9 million US$. All costs and benefits are at constant prices. Exchange rate: 1 £ = 1.55 US$.
Table A1.2: ENNy Hydro Plant
35

Final Report – Support Study on Green Mini-Grid Development
MINI-GRIDS SUPPLIED BY RICE-HUSK-FUELED GASIFIERS (TANZANIA) The installation of mini-grids which are supplied by biomass-fuelled (rice husks) gasifiers is among the options considered in Tanzania’s off-grid electrification program. The data shown below assume that a total gasifier capacity of 2,520 kW would be installed in 16 villages. Cost: 2,800 US$/kW. Lifetime: 10 years. Feedstock need 2 tonnes/MWh. Feedstock cost: 5 US$/tonne. All costs and benefits are at 2013 prices. Exchange rate: 1 £ = 1.55 US$.
Table A1.3: Biomass Gasifier Plant
36

Final Report – Support Study on Green Mini-Grid Development
MINI-GRIDS SUPPLIED BY DIESEL-PV SYSTEMS (TANZANIA) The installation of mini-grids which are supplied by diesel-PV systems is among the options considered in Tanzania’s off-grid electrification program. The data shown below assume that 2,520 kW of diesel capacity and 752 kWp of PV capacity are installed. Economic fuel cost 2013: 0.15 US$ per kWh diesel generation. PV production: 4 kWh/day/kWp. All costs and benefits at 2013 prices. EIRR is calculated over the period 2013 – 2024 (10 years of operation). Exchange rate: 1 £ = 1.55 US$.
Table A1.4: Diesel-PV Hybrid Power Plant
37

Final Report – Support Study on Green Mini-Grid Development
ANNEX 2: ANECDOTAL INFORMATION ON THE BENEFITS OF ELECTRIFICATION AND THE WILLINGNESS TO PAY
This annex displays the information which the consultant has collected on the benefits of
electrification and the willingness-to-pay in four countries: Tanzania, Kenya, Rwanda and
Mozambique. The annex also describes some of the problems which mini-grid projects faced.
1. TANZANIA
1.1 Socio-Economic Benefits of Electrification Except for the Urambo Project, where the description explicitly mentions that electricity services had
raised business and economic opportunities in the village and that many clients had started income-
generating activities after they had been connected to the mini-grid, there is no explicit mentioning
of the socio-economic benefits of other mini-grids. There can be no doubt, however, that the
benefits are substantial.
The Rural Master Plan of 200535
provides ample evidence of the benefits of electrification. The
electrified villages which were surveyed for the preparation of the Master Plan were not electrified
by off-grid schemes. It may be that the benefits of such schemes are lower if the off-grid scheme
does not supply 24 hours, 7 days a week or if the capacity of the scheme limits the number of
supplied customers. But that the benefits are significant follows, for example, from the text on page 47: “After electrification, the establishment of new food processing units is observed in 75% of the
villages. In 60% of villages of the contrast sample, new metal construction shops have opened and in
55% new furniture maker shops. The establishment of new saw mills or oil seed presses is observed
in 10% of the electrified villages. The opening of any kind of new commercial, repair and service
shops is observed more frequently than the opening of industrial workshops and has occurred in 85%
of villages after electrification. The number of village leaders observing improvements of social life
and welfare since electrification of their village is much higher than the number of leaders observing
improvements of economic infrastructure by opening of new businesses. A very high number finds
that women’s work has become easier since electrification of their village (75%) and that
electrification has led to more social events and better communication (75%), has improved the
living conditions of poor families (70%) and public security during night (70%).”
The survey data also indicated higher monthly incomes in electrified areas compared to similar un-electrified areas.
A study on the impact of electricity services on microenterprise in rural Tanzania showed that the growth rate of micro-enterprises was noticeably higher in areas with electricity services than in areas
without36
.
35
DECON, SWECO, Inter-Consult: Rural Master Plan 2005 36
Maleko, G. (2005), Impact of electricity services on microenterprise in rural areas in Tanzania, Master’s thesis, University of Twente, Enschede.
38

Final Report – Support Study on Green Mini-Grid Development
1.2 Willingness to Pay 1.2.1 Summary of collected information
No recent survey was found that informs about the willingness-to-pay of potential new customers.
The Base Line Survey conducted in 2011 unfortunately only informs about which percentage would
be very much willing (23.5%), willing (68.5%), doesn’t know (6.8%) and is not willing (1.2%) to pay for
electricity services.
Older surveys provide a vast range of estimates. A detailed description the projects marked (*) is given below.
(*) In the Urambo project, customers paid in 2002 0.47 US cents per kWh. Almost all
customers belonged to the affluent citizens of Urambo.
A survey conducted in 2005 for the preparation of the Rural Master Plan yields an estimate of 0.39 US cents per kWh when assuming that the average monthly consumption would be 30 kWh which was the average consumption of TANESCO’s D1 and T1 customers in 2012.
(*) In 2005, TANWAT, a producer of tannin from wattle and of sawn timber from pine trees, charged third parties between 8.5 and 11.0 US cents per kWh.
A high value of 0.40 US cents per kWh is mentioned in the 2007 appraisal document for the
TEDAP Project for T1 customers in urban areas. The estimate assumes, however, that these
customers use their own diesel generator which is certainly not true for all not-yet-
connected T1 customers in urban areas. (T1 is the general usage tariff for residential, small
commercial and light industrial use, public lighting and billboards. The average consumption
of T1 customers exceeds 283.4 kWh per meter reading period.)
A much lower value of 10.4 US cents per kWh is mentioned in the 2007 TEDAP appraisal document for D1 customers.
(*) Most customers supplied by the hydro plants of the Njombe Diocese paid flat tariffs.
Domestic customers paid between 1.1 and 2.6 US$ per month in 2008. Those who paid kWh
tariffs, paid between 3.3 US cents/kWh and 9.8 US cents/kWh.
1.2.2 URAMBO MINI-GRID
In 1993, supported with funds from SIDA, the Tanzanian government and TANESCO created Urambo
Electric Consumers Co-operative Society (UECCO) to serve as a model for future rural electrification
efforts. Diesel generators were installed and TANESCO had provided technical support and training
to the co-operative. A survey which was conducted in 2002 provided the following findings:
Power production was done by two diesel generators with a total installed capacity of 193 kW. Specific fuel consumption was 0.34 liter/kWh in January 2002.
39

Final Report – Support Study on Green Mini-Grid Development
Electricity was supplied daily during 4 – 5 hours in the evening. In 2002, about 70% of the
electricity consumed was used in households, 15% in businesses, 12% in institutions and public buildings and approximately 3% for street lighting.
Consumption was partly metered and partly charged on a flat-rate basis. Average monthly consumption was 35 kWh per customer.
The number of clients had increased from 67 in 1994 to 241 in 2002. Customers comprised
households, institutions (police, bank etc.), public (churches and mosques), businesses (bars,
guest houses, hotels) and street lighting (15 bulbs). Approximately 10% of the households in
Urambo Township were electrified by the cooperative.
The electricity clients were assumed to be among the most affluent citizens of Urambo. Of
the clients interviewed, 1/3 was categorized as high-income, and almost 2/3 as middle-
income. Only one client was a low-income client in accordance with the definition of
Tanzania Bureau of Statistics in 2000/2001.
22% of the interviewed clients claimed that the electricity services had raised business and
economic opportunities in the village. Guesthouses, bars and shops had extended their hours
of business and other businesses such as hair salon; video-rooms and groceries (selling of
cold drinks) had started afresh. Close to 15% of the interviewed clients also said that they
started income-generating activities after they had been connected to electricity.
In 2002, the price per unit amounted to 450 TSh, which was more than 15 times higher than the TANESCO’s tariff for households. Converted into USD, the energy charge in Urambo in 2002 was 0.47 USD/kWh and the tariff charged by TANESCO was 0.030 USD/kWh.
In 2002, the unpaid electricity was aid to be 37%. The term “unpaid” covered technical losses and the consumption not paid by flat-rate clients who consumed more than they were billed.
The funds set aside for maintenance were not sufficient. The distribution system showed
signs of maintenance shortcomings. Some transformers had oversized fuses, and the
conductors used in the system were undersized in a few areas. The distribution system was
gradually becoming overloaded, thereby contributing to the increase in technical losses.
Source: Elisabeth Ilskog, And Then They Lived Sustainably Ever After? Experiences from Rural
Electrification in Tanzania, Zambia and Kenya, Doctoral Thesis 2008, KTH Royal Institute of
Technology, School of Technology and Health Stockholm, Sweden 1.2.3 TANWAT POWER PLANT
The TANWAT Project is a 2.5 MW power plant fuelled predominantly by wattle tree chips but also by
pine chips, eucalyptus chips and saw-mill waste. The power plant is owned by TANWAT, a producer
of tannin from wattle and of sawn timber from pine trees. Operation of the power plant started in
40

Final Report – Support Study on Green Mini-Grid Development
1995. According to a document from 2004, about 40% of the produced energy is sold to TANESCO,
30% to Kibena Tea Factory which is 15 km away from the plant and connected by an 11-kV line, 20%
is consumed in the wattle factory and the saw-mill and 10% is said to be the power station’s own
consumption. A presentation made by the power station manager in 2008 or 2009 mentioned that
TANWAT planned to install a 5MW plant and later a 15MW plant. A lack of skilled labour was
mentioned in the presentation. TANWAT tackles the problem by intensive in-house training and
attractive remuneration packages. One boiler was lost in 1996 due to improper handling.
In 2005, all sales of power to third parties were made at prices between 8.5 and 11 US cents per kWh. Sources: a) TaTEDO, Biomass Based Electricity Production: TANWAT Case Study, Tanzania, 2004 b) Rabiel Ulomi, Power Station Manager, TANWAT Power Plant (Case Study), 2008 or 2009 c) DECON, SWECO, Inter-Consult: Rural Master Plan 2005, Chapter on Biomass Utilization and Co-
Generation 1.2.4 Plants developed by the Njombe Diocese Catholic Church Mission
The information provided in this paragraph is based on the document: Wim Jonker Klunne and
Emmanuel G. Michael, Increasing sustainability of rural community electricity schemes – Case study
of small hydropower in Tanzania, October 2009. Tariffs were communicated by Mr. Emmanuel
Michael on May 6, 2013 (extract from Thesis).
Supported by donors, the Njombe Roman Catholic Church Mission installed small hydro plants in three villages. Common features of the installations are:
Developed in close collaboration with villagers. Main use of power is for productive uses.
Strict payment arrangements. Supply cut off in case of non-payment. Payment of
reconnection fees. Dispute handling scheme in place.
Ownership models in which responsibility is shared between the mission, the local community and donors.
Operation and maintenance need technical expertise. Arrangements for technical support
through contracts with the companies which installed the plants. Technicians in charge of the
plants get intensive training. Matembwe Village Hydro
Supported by CEFA, an Italian NGO
Commissioned in 1986. Supplying two villages: Matembwe and Image
Installed capacity 150 kW
Plant is shut down if there is insufficient water
Users in 2008: 20 commercial users in Matembwe Village Company (vocational centre; the centre was powered before by two diesel generators. The consumption of the vocational centre accounted for about 42% of total consumption), domestic (280 households), social centres (9)
41

Final Report – Support Study on Green Mini-Grid Development
In 2008, Matembwe and Image had already been connected to TANESCO’s grid. Hydro plant continued being operated. Most villagers supplied by the hydro plant remained customers of the plant because the tariffs were lower than TANESCO’s tariff of 128 Tsh/kWh, excluding VAT. Some villagers opted to use a TANESCO connection as back up when the hydro plant is not operated due to insufficient water supply. Other people connected to TANESCO because the hydro plant could not satisfy the demand in the village.
Tariff Schedule in Matembwe in 2008
Domestic customers with meters: 70 Tsh/kWh
Domestic customers, flat rate: 4,000 Tsh for 3 months
Commercial: 120 Tsh/kWh
Institutions: free Mavanga Village Hydro
Commissioned in 2002. Supplies two villages: Mavanga and Mbugani
Installed capacity 2*75 kW
Users in 2008: domestic (570 households), commercial users (46 micro-enterprises), service institutions (14)
Tariff Schedule in Mavanga in 2008
Domestic users, 1-5 light bulbs 1,800 Tsh per month Domestic users, 6-10 light bulbs 2,600 Tsh per month Domestic users, 11-15 light bulbs 3,200 Tsh per month Grain milling 45% of income from milling Metal workshop 15,000 Tsh per month Health Centre 10,000 Tsh per month Dispensary 2,000 Tsh per month Shops, kiosks 4,000 Tsh per month Pharmacy 3,000 Tsh per month Salon 5,000 Tsh per month Bar 5,000 Tsh per month Primary school 2,000 Tsh per month Secondary school 10,000 Tsh per month Churches 2,000 Tsh per month
Lugarawa Village Hydro
1979: single-phase power supply; since 1995 three-phase supply
Plant supplies communities in Lugarawa and Mdilidili
Installed capacity 140 kW
Users in 2008: Mission Hospital and light load uses in villages (309 households, 18 commercial loads, 9 institutions)
42

Final Report – Support Study on Green Mini-Grid Development
Tariff Schedule in Lugarawa in 2008
Non-commercial users: 40 Tsh/kWh Commercial: 60 Tsh/kWh Mission Hospital: 50,000 Tsh per year
The thesis of Emmanuel Michael mentioned that end-users were not complaining about the tariffs
which were lower than TANESCO’s tariff of 128 Tsh/kWh, excluding VAT. It is not clear whether VAT
was added on the hydro plant tariffs; probably not. The income derived from the power sales was
subject to the income tax.
Whether the tariffs enabled the sustainable operation of the projects cannot be said in the
affirmative but it is likely. Two graphics which show the expenditures and receipts in the first eight or
nine months in 2008 reveal that the cumulated cash balance was always positive.
2. KENYA
2.1 Socio-Economic Benefits of Electrification Little information was found in recent documents on the socio-economic benefits of electrification.
The description of the community-owned Tungu – Kabiri micro-hydro mini-grid in Annex 2 mentioned
realized and planned benefits of the project.
The planned installation of mini-grids under the SREP is expected to provide the following positive social impacts:
a) Increased supply of clean energy for productive use b) Direct and indirect skilled and non-skilled employment opportunities c) Gains in the local and national economy and increase of revenue generation d) Optimal use of land e) Optimal use of existing natural resources such as wind and solar
f) Improvement in security as a result of increased lighting around the area where the projects
will be installed g) Improvement in social infrastructures h) Improved communication
Source: Republic of Kenya, Scaling-Up Renewable Program (SREP), Project Document for Mini-Grids Development in Kenya, p.32.
2.2 Manufacturing, design and construction capacity Apart from construction works, local contributions are currently limited to low-technology areas such
as steel. The major exception is Ubbink, a Dutch company which opened in 2011 a solar panel factory
in Naivasha. Ubbink East Africa is a joint venture between Ubbink B.V. and the Kenyan company
Chloride Exide Ltd.
43

Final Report – Support Study on Green Mini-Grid Development
2.3 Willingness to Pay 2.3.1 Survey conducted in Kisumu district in 2007
In 2007, a survey was conducted in Kisumu district on the WTP for connection. In total, 200
households were interviewed. The median WTP of households for grid connection was 10.5 US$ per
month. The median WTP for PV power supply was about 8.2 US$ per month. While the study focused
on paying for connection costs, the monthly payments are indicative of the amount households
would be willing to pay for electricity services. At present tariffs, the amount of 10.5 US$ would allow
a monthly consumption of almost 120 kWh37
. In FY 2011/12 (July 2011 – June 2012), the average
consumption of domestic customers was in the order of 80 kWh/month38
. That indicates that the
WTP for electricity services is higher than what is actually paid.
Source: Sabah Abdullaha and P. Wilner Jeanty, Willingness to pay for renewable energy: Evidence from a contingent valuation, in Renewable and Sustainable Energy Reviews (15) 2011 o Tungu-Kabiri Project
In Tungu-Kabiri, a 14-kW micro-hydro project has been on-going since 1998, with the first electricity
being produced in June 2001. The project has been initiated by ITDG, and is based on a concept with
a business centre. In the centre, premises for business enterprises or public services have been
established. The power to the centre is supplied during the day from 8.00 am to 4.00 pm. In 2003,
power was used in eight separate stalls for a hair salon, a barbershop, charging of mobile phones,
selling of cold beverages, a video show room, and for welding. Outside the centre, the hydropower
replaced a diesel engine used for grain milling. The tariff was based on flat rate, meaning that all
clients paid the same monthly amount. No electricity was in 2003 supplied to the surrounding
households. However, this was a planned development. Other planned but not realized projects
comprised of water pumping, which was specifically advocated by the women in the community, and
a health clinic which was meant to be set up within the micro-enterprise centre.
The Small Grants Program of the UNDP/GEF was financed for 63,500 US$. The community
contributed labour to the project estimated at 30% of total costs. The project is owned and operated
by a community group formed as a corporation. In 2003, the community group had a leadership
composed of 15 persons, of which 6 were women and 9 were men. The total number of members
was initially approximately 200, but had in 2003 decreased to 150. Major problems which were noted in 2003 were:
Low flat rate tariffs of 300 KSh per month (about 4.5 US$) which do not provide sufficient revenues to cover the O&M costs of the plant
Limited operational skills among staff 37
The tariff for domestic customers is: Fixed rate 120 Ksh. First 50 kWh: 2 Ksh/kWh. More than 50 kWh up to 1500 kWh: 8.10 Ksh/kWh. Consumption exceeding 1500 kWh: 18.57 Ksh/kWh. Source: Kenya Power website. See http://www.kplc.co.ke/index.php?id=45. A sales tax of 12% is added on the tariffs. Source: http://www.knowyourcountry.com/kenya3.html. Exchange rate: 84 Ksh per US$. 38
Calculated from KPLC’s Annual Report 2011/12.
44

Final Report – Support Study on Green Mini-Grid Development
Sources
a) Elisabeth Ilskog, And Then They Lived Sustainably Ever After? -Experiences from Rural
Electrification in Tanzania, Zambia and Kenya, Doctoral Thesis 2008, KTH Royal Institute of
Technology School of Technology and Health Stockholm, Sweden b) https://energypedia.info/wiki/Kenya:_best_practice_case_studies#Impacts_and_Benefits_4 c) http://www.inforse.org/Case/Case-Kenya-Decentralizing.php3
3. RWANDA
3.1 Socio-Economic Benefits of Electrification The results of a study in Rwanda on the impacts of rural electrification on households were published
in 2011 in the Journal of Development Effectiveness. The households were living in villages which had
been connected to the grid for at least four years and in villages without access to grid electricity.
Impact indicators were hours of lighting usage, the time primary school children dedicated to
studying at home, energy expenditures, and income per working-age adult. The study found that
lighting hours were significantly higher in electrified households. The time children spent on studying
at home was also higher in electrified households but the difference was not as important compared
to lighting hours. An interesting result was that energy expenditures were higher in electrified
households. Households saved on costs for lighting but the added electrical appliances (television,
etc.) had the effect that the total energy expenditures were higher than they were before the
households were electrified. Regarding income, the study found that electrified households had a
higher income but that may be due to regional factors as electrified households hardly used
electricity for income-generating activities.
Source: Gunther Bensch, Jochen Kluve & Jörg Peters (2011): Impacts of rural electrification in Rwanda, Journal of Development Effectiveness, 3:4, 567-588
3.2 Manufacturing, design and construction capacity A study of Rwanda’s Micro-Hydro Energy Market mentioned that local companies recently started
offering locally manufactured equipment for pico-hydro plants (<10 kW). The study also concluded
that there is sufficient local and international expertise in Rwanda for the preparatory works
(hydrological studies, feasibility studies, design etc.) and the construction of micro-hydro plants. An
excerpt from the study states that, “… as a result of the PSP Hydro project the local capacity to
design, build and operate such systems is rapidly increasing. Although donor-financed projects have
all relied on international consultants for the design and construction of their micro-hydro plants, the PSP hydro project entirely relied on local consultants with success.” (p. 2 of source (a)).
That information has been confirmed by the ENNy plant. The plant was constructed by a local
company. People from surrounding villages were employed at the construction site. The hydro-
mechanical equipment was locally produced (Butare Metal Workshop). Sources (a) GTZ, Rwanda’s Micro-Hydro Energy Market, Target Market Analysis, December 2009, p.3 (b) CARERA, a shareholder in ENNy, by email on May 6, 2013
45

Final Report – Support Study on Green Mini-Grid Development
3.3 Willingness to Pay A presentation made in Dakar in November 2011 on Rwanda’s program for expanding electricity
access mentions that “despite low income levels in Rwanda, analysis showed that 370,000
households would be willing and able to pay cost of grid connection and recurrent charges”39
. It
should be noted in this context that Rwanda’s tariffs are among the highest in Africa. The present
tariff for domestic customers is 134 RWF excluding VAT (≈ 21 US cents per kWh) and 158 including
VAT (≈ 25 US cents per kWh). See: http://www.rura.gov.rw/docs/Press_Statement_Electricity.pdf
4. MOZAMBIQUE
4.2 Socio-Economic Benefits of Electrification A study published in 2008 estimated the benefits of rural electrification of Ribáuè district. The district
was electrified in 2000 by grid connection. The benefits were estimated over the period 2000 – 2005.
The study concluded that, despite high electrification costs of US$ 2,100 per customer, the
electrification had led to positive cumulative net benefits within 4 years. The benefits were mainly
due to the improved performance of the local cotton fabric and other increased (informal) economic
activities. In contrast, the monetized benefits for households had been small. A scenario exercise
showed that the electrification project was likely to further raise substantial net benefits until 2020. Sources
Peter Mulder and Jonas Tembe, Rural electrification in an imperfect world: A case study from Mozambique. Energy Policy, Volume 36, August 2008
RWI Materialien, Energy Usage and Socio-economic conditions in Mozambique – Evidence
from GTZ Electrification Project Regions, Heft 56, 2010
4.2 Manufacturing, design and construction capacity The German GIZ has worked with local entrepreneurs to extend their businesses from milling to local
electricity distribution and has upgraded three systems [24-26], supported local production of
turbines and is currently assisting local education institutes in Chimoio, Manica province, to set up a
local hydropower training and knowledge centre [16]. 4.3 Willingness to Pay A study conducted in 2008 in Manica Province estimated the monthly energy expenditures of non-
electrified rural households at 170 Mt/month (≈ 7 US$). When adding the fees for charging cell
phones, the amount would have been 210 Mt/month (≈9 US$). Source: https://energypedia.info/images/8/82/CH_3-4_DESIGN_OF_A_BCS_IN_MOZAMBIUE.pdf
Customers in the rural areas supplied by the small hydro plants which are installed under the GIZ
program “Access to Modern Energy Services – Mozambique” pay in 2013 between 11 and 25 US$ per
month (communicated by email on May 3, 2013, by Marian Merchán Andreas).
39
Arun P. Sanghvi, Sector Wide Approach for Planning and Expanding Electricity Access – Rwanda Case Study, November 2011.
46

Final Report – Support Study on Green Mini-Grid Development
Chapter 4: Financial Schemes & Modelling
TABLE OF CONTENTS
KEY HIGHLIGHTS ........................................................................................................................... 3
INTRODUCTION ...........................................................................................................................10
1 MAIN BARRIERS TO GMG FINANCING ....................................................................................11 1.1 Barrier #1: Local access to capital ................................................................................. 11 1.2 Barrier #2: Counterparty and other risks ....................................................................... 12
2 FIRST ASSESSMENT OF GMG PROJECTS BANKABILITY .............................................................13
3 BUSINESS CASES .....................................................................................................................14 3.1 Comments on the calculation method. ....................................................................14 3.2 Financial analysis of MWENGA Hydro Project (Tanzania) ............................................... 15 3.3 Financial analysis of the ENNY Hydro Project (Rwanda) ................................................. 21 3.4 GMG supplied by biomass-fuelled gasifiers ................................................................... 25 3.5 GMG supplied by diesel – PV hybrid systems ................................................................ 33
ANNEX 1: RE-FIT STRUCTURES IN SOME KEY AFRICAN COUNTRIES ............................................39
ANNEX 2: CASH-FLOW TABLES OF ANALYZED PROJECTS / PROGRAMS ......................................41 2.1 MWENGA HYDRO PROJECT (TANZANIA) ....................................................................... 42 2.2 ENNy HYDRO PROJECT (RWANDA)................................................................................ 43 2.3 GASIFIER PROGRAM ..................................................................................................... 44 2.4 DIESEL – PV HYBRID SYSTEMS ....................................................................................... 45
1

Final Report – Support Study on Green Mini-Grid Development
LIST OF TABLES AND FIGURES
Figure 1: Development of the number of customers and the energy production in the Base Case ....26 Figure 2: Carbon credits paid in voluntary markets in 2012 ........................................................... 32
Table 1: Loan Conditions in some Sub-Saharan Countries .............................................................. 11 Table 2: Financial data on Kenya’s Retrofitting Program ............................................................13 Table 3: Mwenga Hydro Project - ROE in several scenarios (consultant’s estimates) ...................18 Table 4: ENNy Hydro Project - ROE in several scenarios (consultant’s estimates) ............................ 24 Table 5: Mini-grids supplied by gasifiers using rice husks - ROE in several scenarios ........................ 30 Table 6: Mini-grids supplied by diesel-PV systems – Results of scenarios ........................................ 37
2

Final Report – Support Study on Green Mini-Grid Development
Key Highlights 1. Issues Addressed in Terms of Reference The following questions are asked in the Terms of Reference of the present study.
What is the financing gap (if any) in terms of delivering and replicating mini-grid schemes of different
technology types? What is the experience in terms of cost recovery and tariff collection with respect
to repaying capital and/or ongoing costs? What is the importance, if any, of including an anchor
(larger enterprise) customer on a mini-grid? Present a financial model for each of the technology
types based on real scheme data in different countries, and assess project financing viability gaps
overall, timing issues (in terms of expenditure and revenue profiles).
What is the financing gap (if any) in terms of delivering and replicating mini-grid schemes of
different technology types? The financing gap is understood to mean the funds which investors in
GMG technologies cannot, or are not willing, to mobilize for financing the investment costs of the
GMG technology. The financing gap cannot be quantified in absolute or relative terms – it is highly
project specific. Empirical evidence suggests that private investors tend to often have problems to
mobilize their contribution to the investment costs in the form of equity or loans. That has been
Mali’s experience where more than 100 diesel-based mini-grids have been established (not a GMG
technology) and where about 80% of the investment costs were typically financed by grants. In
Tanzania, it is also a major problem according to information obtained from REA.
Lack of equity or problems to obtain loan funding certainly contribute to the observed reluctance of
investors to realize GMG projects, but other reasons seem to be of (at least) equal importance. The
reasons can be summarized under doubts regarding the profitability of the investment. The
profitability depends on numerous factors (demand, tariffs, payment behavior of customers,
competence in proper operation of the technology, lifetime of the technology, etc.). Of course, the
less funds potential investors have to mobilize, the less these risks are important for them.
What is the experience in terms of cost recovery and tariff collection with respect to repaying
capital and/or ongoing costs? There is very little experience so far. TANESCO, which is Mwenga’s
main customer, absorbing about 80% of the hydro plant production, pays with significant delays
which may require MHL to mobilize interim financing to pay its operating and financing costs on
time. In more general terms, it can be observed that when the mini grid is private sector-led (and
often in an unregulated environment), collection rates are close to 100% as otherwise the operator
cannot make ends meet. When the “perception” is that of a public service that will in any case
continue, collection rates vary between 30 and 80%. What is the importance, if any, of including an anchor (larger enterprise) customer on a mini-grid?
Having one or several anchor customers will help the investor to realize the project, provided that
the anchor customers are considered reliable customers. Anchor customers promise a reliable
revenue stream which will make banks more willing to provide loans. The Mwenga project has an
anchor customer and the ENNy project had intended to have one. Anchor customers may also help
to bring down tariffs for small customers. If anchor customers are businesses which nowadays
operate diesel generators to satisfy their demand for electricity, they may be willing to pay a tariff
3

Final Report – Support Study on Green Mini-Grid Development
which is higher than the average tariff which the investor demands and still benefit from the above-average tariff if it is lower than the costs of diesel power supply.
Selling a portion of the produced power under the feed-in tariff scheme also amounts to selling to an
anchor customer. In Rwanda, the feed-in tariff scheme is less attractive than selling to individual
customers. In Tanzania, the feed-in tariff is much higher than the tariff for small customers who
consume less than 50 kWh per month but significantly lower compared to the other tariffs. The
Mwenga hydro plant sells nevertheless the bulk of its production to TANESCO under the feed-in tariff
scheme because the least-cost design of the plant required installing more capacity than there is
demand for electricity in surrounding areas which can be supplied by mini-grids. That is a typical “problem” of hydro plants.
A contradiction to be noted here is that if the goal is access for the more remote rural population, there will never be any anchor customers in such locations. Financial model. The models used for the examples have been forwarded to DFID.
2. Access to Loans
The investment costs of GMG projects are high relative to what potential can or is willing to finance by equity. Access to loans is required and that is often a problem because of several factors:
GMG projects need long-term loans (loan tenor ≥ 10 years) in view of the lifetime of the assets. Providing long-term loans is difficult for local banks because they mainly depend on customer deposits to fund their lending. Customer deposits are short-term liabilities. The banks need access to long-term financing to provide loans for electrification projects. A temporary solution to that problem is the credit line facility which the TEDAP Project makes available. Local banks are given loans by a donor or the government for on-lending to GMG projects.
Banks in Africa have hardly any experience in financing GMG projects. One reason that they are reluctant doing so is that they know that many customers are poor. That makes them doubt that the project will provide a reliable stream of revenues. Another reason is that they
are not used to financing projects which are only profitable in the medium to long-term. For
large banks, the comparatively small transaction volume seems to be a barrier1.
Guarantees constitute another problem. Potential investors can often not provide guarantees which local banks demand. Non-recourse financing, where the GMG project constitutes the guarantee, is not accepted. Providing a guarantee fund would certainly help. Rwanda has already started doing that and the investor in a small hydro plant in Rwanda also benefitted from a guarantee provided by an African-wide fund, the Interstate Fonds de Solidarité Africaine in Niger.
1
A comment on the draft mentioned that efforts are under way in Uganda and Tanzania (UNCDF Local Finance Initiative) to increase the capacity and willingness of local banks to finance projects on a non-recourse basis.
4

Final Report – Support Study on Green Mini-Grid Development
3. The Importance and Limits of Grants
Grants which are provided to finance a portion of the investment costs help to finance the project as
it reduces the funds which the investor has to mobilize in the form of equity or loans. But grant
financing will also be required to make tariffs more affordable. There may be a few hydro plant sites
which could offer affordable tariffs without grant funding but that is very likely not the case for
GMGs supplied by gasifiers or diesel-PV systems. Further, if the tariff is affordable, the length of the
payback period will probably not be acceptable to the private investor on purely commercial terms,
given political and hydrology risks.
Grant financing of the investment costs of GMG technology will, however, not always result in
affordable tariffs. If the costs of operation are high as is, for example, the case of diesel-PV hybrid
systems, even 100% grant financing of the investment costs may still require tariffs which for many, if
not most, of the targeted customers, are not affordable. Cross-subsidization or other instruments
must then be applied.
Charging low connection fees, fees which are significantly lower than the connection cost, will be
important to enable customers to connect to the mini-grid. The output-based performance grant
provided under the TEDAP Project is considered an adequate instrument in that respect as it obliges
investors to charge low connection fees. Other instruments such as charging low fees and recovering
the remaining costs plus interests through a small monthly charge which is added to the electricity
bill or included in prepayment tariffs could, of course, also be applied.
Available grants probably need to be considered in a much more creative way than just a straight
investment subsidy or tariff subsidy. They could be engineered creatively as (partial) risk guarantees
to cover political risk or guarantees commercial banks would want and the company cannot provide
in order to access loans, etc.
On a different angle, grants would be very useful in supporting emerging SME mini-grid operators
through targeted training, support in setting up management procedures, etc. which are costs for
which investors often do not have available funds - unless they are very large companies, in which
case they would not be interested in mini-grids. These considerations of risk sharing will be further developed in Chapters 5 and 6.
4. Willingness to Pay and the height of nation-wide tariffs
The height of the nation-wide tariffs charged by the national utilities is important as it has an impact
on the tariff level which the customers are willing to accept. Mali provides evidence for that
statement. Potential customers were asked before the diesel-based electrification of their town or
village how much they would be willing to pay for electricity supply. The avoided costs were also
estimated. The tariffs were in line with the average willingness to pay and were often in line with the
avoided costs. But the tariffs were significantly higher than the tariffs of EDM, the public utility. After
having been electrified for a while, some customers started complaining that they pay much higher
tariffs than customers supplied by EDM.
5

Final Report – Support Study on Green Mini-Grid Development
This example can definitely be generalised: at the beginning of the operation of a mini-grid,
customers are very happy to pay a high price for a reasonably good quality service. With time, the
benchmark of willingness to pay will evolve from avoided cost to utility based tariff. It is a policy
decision which has to be properly anticipated as to whether declining tariffs should be modelled or
whether the policy maker will take a clear stand on keeping the higher tariffs over the lifetime of the
project.
When using the height of nation-wide tariffs as criterion for the selection of the countries to focus
on, Rwanda would top the ranking. It has the highest tariffs among the seven potential priority
countries (about 0.22 US$/kWh excluding VAT). The DRC has the lowest (about 0.06 US$/kWh). 5. Rate of Return
The expected rate of return is an important criterion for investors and ranks second in importance to
the condition that, with the possible exception of the first two years of operation, no funds have to
be injected during project operation and that the payback period should not exceed 7 years but in
reality, if the investor is a local SME, this would be down to 2 years, unless specific risk coverage
instruments are in place.
The contacted investors were reluctant to inform the consultant which rate of return they require.
The consultant made that experience in other projects, too. If numbers are provided, it is often not
clear which rate of return the numbers presents (financial internal rate of return, return on assets,
return on equity, etc.) and whether the numbers refers to calculations made at expected current
prices or constant prices.
The consultant considers 6% – 8% return on equity in real terms (calculation at constant prices) as
the minimum for private investors. Even rates of 15% to 20% are not uncommon (examples are
presented in the chapter on the Mwenga plant). High rates are justified as the investors have to face
various risks.
There are certainly investors (or funding agencies) who are satisfied with low rates of profitability2.
Communities are often mentioned in that context. A note of caution seems, however, appropriate.
The risk is that communities put too little emphasis on the profitability, charging tariffs which just
cover the operating and financing costs but don’t provide funds for major maintenance or repair
works. Examples presented in the report on economic analyses demonstrate that (Urambo Project in
Tanzania, Tungu-Kabiri Project in Kenya).
2 A comment on the draft mentioned so-called impact investors which accept low rates of return if the project
has significant social and environmental benefits. The GDF SUEZ Rassembleurs d’Energies Fund, the Acumen Fund, and the Grass Roots Business Fund were mentioned as examples.
6

Final Report – Support Study on Green Mini-Grid Development
6. Some results of analyzed GMG technologies The financial feasibility of GMG projects depend on numerous factors and the examples presented in this report do not claim being representative for the technology or the country.
The two analysed hydro-based GMG constitute two extreme cases. The 3.5-MW Mwenga plant in
Tanzania seems to be an attractive site in the sense of low investment cost per kW (estimated at
about 2,200 US$/kW) whereas the 500-kW ENNy plant in Rwanda is just the opposite with costs in
the order of 5,600 US$/kW. The business model of the Mwenga plant allows selling to small
customers at the lowest nation-wide tariff of about 0.04 US$/kWh (excluding VAT and levies). The
low cost of the plant, an anchor customer and sales of about 80% of the plant’s production under
Tanzania’s feed-in tariff scheme (0.095 US$/kWh) enable that.
The business model of the ENNy plant had foreseen that about 85% of the production is sold to an anchor customer (a tea producer) and 15% to rural customers. Rwanda’s high average tariff of about 0.22 US$/kWh (excluding VAT (18%) would have allowed the company to make a decent profit while
selling at that tariff or an even slightly lower tariff. The business model has become obsolete as the
Government of Rwanda recently informed ENNy that it can only sell under the feed-in tariff scheme
to EWSA (0.129 US$/kWh). The analyses show that this policy could create problems for the company
in the sense that funds have to be injected during operation until the loans have been repaid.
Both hydro plants have some points in common:
They expect to produce power almost year round. That will certainly not be true for the
many hydro sites which have been identified as potential candidates for supplying mini-grids.
Lead times were long. It took at least 5 years from the start of serious planning until the start of power production.
Both plants are, at present, faced with the problem that the main grid cannot fully absorb
the production which the companies could inject into the grid. Power production is therefore
lower than possible (more than 10% lower).
The costs of gasifier supply mainly depend on the equipment of the gasifier, the lifetime and the
feedstock cost. The consultant’s impression is that investment costs found in the literature tend to
significantly underestimate the costs of a well-equipped plant (gas cleaning equipment, water
treatment, ash removal) while the lifetime is overestimated. In the analysed example, with rice-husk-
fuelled gasifier investment cost of 2,800 US$/kW, 10 years lifetime, feedstock need of 2 tons/MWh
and feedstock cost of 5 US$/ton, the average tariff will have to be higher than 0.25 US$/kWh
(excluding VAT) in order for the ROE to be at least 8%. That result has been obtained, assuming that
substantial grant financing will be provided (two-thirds of the investment cost in the presented
example).
Under the same financing conditions, a scenario where the mini-grid customers pay about the same
tariff as TANESCO’s customers would require significantly lower investment costs and the
consumption of a large portion of the production by anchor customers who used diesel-based self-
generation before the mini-grid is available. In Tanzania, a tariff of about 0.35 US$/kWh for gasifier
mini-grid supply would for such anchor customers still be lower than the costs of self-generation. If
7

Final Report – Support Study on Green Mini-Grid Development
the anchor customers consume about 40% of the production and investment costs are about 10%
lower, other customers could be offered a tariff which is not much higher than the average price paid
currently by TANESCO’s customers (0.125 US$/kWh excluding taxes). The result indicates that anchor
customers could help a lot to reduce tariffs for small customers provided, of course, that they pay a
tariff which is significantly higher than the average tariff which is required to make the project
financially feasible. The residual value of the mini-grid will be substantial at the end of the gasifier’s lifetime (maximum 12 years in the example) – and this becomes a particularly serious problem if the private investor is
to invest in the distribution grid as well as in the generation system. The ROE calculations assume
that the investor will be paid his share in the residual value. That could theoretically lead to a
situation where, during project operation, tariffs are charged which are high enough to cover the
expenditures but would only allow minor dividend payments. The payment of the residual value
would then produce the desired ROE. Such a scenario would not be in the interest of private
investors but the regulating authority may favor it. Private investors would very much prefer being
paid higher tariffs during project operation and lower residual values. The regulating authority may
favor lower tariffs during project operation as it has to also consider the interests of the customers.
That points to a potential conflict for mini-grids with an agreed supply period which is significantly
shorter than the lifetime of the network and connection assets.
Among the analysed GMG technologies, diesel-PV hybrid systems are the most expensive ones. Even
with substantial subsidies (62% of the investment cost in the presented example), they will probably
require tariffs which exceed 0.50 US$/kWh to avoid that additional funds that have to be injected
during project operation until the loans are repaid.
Despite being expensive, power supply by diesel-PV systems without storage capacity is very likely
being less expensive than diesel-only supply, meaning that at a given ROE, a lower tariff can be
charged if power supply is done with the hybrid system (or a higher ROE is obtained at a given tariff).
The result supports the currently ongoing retrofitting of diesel stations in Kenya and Mali where PV
capacity is added to existing diesel capacity.
Adding storage capacity reduces diesel generation but increases investment costs. When calculating
with battery cost of 250 US$ per kWh, a discharge rate of 50%, and a battery lifetime of 8 years, the
tariff must be higher compared to a system without storage; in the example, the tariff must be about
0.54 US$/kWh.
7. Comment on mini-grids and uniform tariffs
Governments would certainly like that customers supplied by mini-grids do not pay more than the
customers supplied by the public utility. For mini-grids supplied by diesel-PV systems, that will not be
possible if a private investor establishes and operates the grids even if the investment costs are
heavily subsidised. For mini-grids supplied by gasifiers, it could be possible but requires optimistic
assumptions regarding the investment costs and a significant consumption by anchor customers who
are willing to pay significantly more than the average tariff; see the example described above. In
general, a uniform tariff policy will not be possible if gasifier or diesel-PV mini-grids are established
and operated by private investors. If uniform tariffs shall be charged throughout the country, the
public utility should establish and operate ”high-cost” mini-grids. The public utility can recover the
8

Final Report – Support Study on Green Mini-Grid Development
difference between the nationwide tariff and the higher mini-grid costs through the tariffs it charges
for main-grid supply. Of course, that will only be possible if the main-grid tariffs are at least cost
covering which is not everywhere the case; not in Tanzania and the DRC, for example.
8. Carbon credits
The investor of the 3.5-MW Mwenga hydro plant has applied for carbon credits under the CDM
scheme and the application has been approved. The carbon credits are unlikely to have a significant
impact on the profitability of the plant. The owners of the 500-kW ENNy plant did not apply as they
assume that the application and monitoring costs would exceed the carbon credits.
While that is probably true for the ENNy project and as well for individual mini-grids supplied by
gasifiers or diesel-PV systems, it may not be true if small individual projects are bundled under the
Program of Activities scheme, baseline emissions are calculated using the method described in the UNFCCC document “electrification of rural communities using renewable energy”
3 and the carbon
credits are sold in the voluntary market. Calculations made for the gasifier program show that this
scheme promises sound rates of return. The set-up of the scheme will, in the consultant’s opinion,
require that a public authority is charged with the whole process. If so, the beneficiary would not be
the private investor but the public authority.
3
https://cdm.unfccc.int/methodologies/DB/5V3GUB9R90CWY26N7RXSSEVZ6C5W8G
9

Final Report – Support Study on Green Mini-Grid Development
Introduction
During the last few years, most countries in East Africa implemented policies to support the
development of mini-grids. The approach to facilitate access to financing for these projects relies on
the following:
Capital grants for initial investment, which may cover the production asset and the distribution network.
Subsidised connection costs for end users
The policy in some countries allows special tariffs for decentralized mini-grids. The tariffs are
negotiated with the regulating authority and provide adjustment mechanisms to follow the
evolution of costs.
After discussing the two main barriers to the financing of GMG which are access to capital and counterparty risks, we will assess the bankability issues of this type of projects in four countries. Bankability of an energy project is the direct consequence of the promoter’s creditworthiness, the
quality of the project’s counterparts and the structure of the project. Creditworthiness is linked to
the capacity to provide collaterals for loans. As will be seen, that is a critical issue taking into account
that non-recourse financing is usually not possible for GMG projects.
In the third part, four GMG projects/programs are analysed. In the two existing projects, power is
supplied by hydro plants. The programs are mini-grids supplied by gasifiers and mini-grids supplied by
diesel-PV hybrids. The analyses focus not only on financing issues but also on the tariffs which would
provide the investor with a reasonable rate of return.
10

Final Report – Support Study on Green Mini-Grid Development
1 Main Barriers to GMG Financing
1.1 Barrier #1: Local access to capital Green mini-grids are characterised by high initial capital investments which usually exceed the
investor’s capability for equity financing. Tax regimes which are not favourable for equity financing
(withholding tax) also constitute an aspect to be considered in this context. Getting equity
contributions from third parties is difficult and often virtually impossible. GMGs are illiquid assets and
no market transaction has been recorded to date in the Sub-Saharan region. Their small size and local
anchorage makes them of little interest for equity providers such as Private Equity funds.
Furthermore, Private Equity funds generally invest with a five years exit strategy which is not in line
with the often long construction period and payback periods of at least 10 years.
Grants reduce the amount that the investor must mobilise to finance a green mini-grid project and to
allow him charging affordable tariffs. But grants usually do not cover 100% of the investment cost
and the remaining amount which the investor has to finance is normally still high and exceeds what
he can or is willing to finance by equity. Access to loans with a long maturity, preferably with a grace
period which covers at least the first year of operation and a not-too-high interest rate is necessary
to make the project financially attractive for the investor and allow affordable tariffs for the end-
user.
Sub-Saharan Private Lending market is characterized by a low level of long term liquidity. As a
consequence, local banks and financial regulation institutions limit the maximum maturity terms to a
few years and interest rates are high due to high local inflation (above 8% in 2012 in most of the
priority countries) and the lack of adequate guarantees. The following table shows data provided by
the African Bank of Development and local Central Banks. Given the small volume of activity, interest
rates are given as indicators of the local cost of capital, but shall not be taken as absolute values,
since a large low-high spread can be observed locally. In practice, the maturity of the loans directly
depends on the level and quality of the guarantees provided to the bank by the borrower.
Table 1: Loan Conditions in some Sub-Saharan Countries
Longest maturity terms available Average lending rate (%)
for loans (Years)
Kenya 10 14
Malawi 5 29
Mozambique 10 19
Rwanda 10 16
Tanzania 5 15
Uganda 20 19
DRC 3 67
Obtaining favourable financing conditions is a complex issue, closely linked with the promoter’s capacity to provide sound business plans and guarantees.
11
Final Report – Support Study on Green Mini-Grid Development
1.2 Barrier #2: Counterparty and other risks The two main counterparts for the purchase of electricity supplied by a mini-grid are:
Distribution utility End-users
Counterparty risk taken in its broadest definition covers mainly the following risks:
Default risk: Default of payment by off-takers generates cash stress during
operation
Volume risk: The off-takers purchase a lower volume than expected when decision to invest was taken
First case: IPP selling energy to a local (mini-)grid
Feed-in tariff (FiT) paid by a distribution utility (Main Grid or isolated grid) has been the main policy
instrument implemented for the promotion of low carbon energy development in the countries we
are looking at. They can support the development of GMG since one possible business model is
selling a portion of the power producing under the feed-in tariff scheme and the remainder to retail
customers. The findings of a recent study of the FiT-regimes in African countries are presented in
Annex 1. The presentation is limited to the existing FiT-regimes in four priority countries (Kenya,
Tanzania, Uganda, Rwanda). The DRC, Mozambique and Malawi do not yet have feed-in tariffs. Second Case: Integrated mini-grid operator selling the produced energy to end-users.
Households and other small customers have a low demand for electricity and a low capacity to pay.
Their default risk is increasingly minimised by the use of prepaid meters but the risk remains that the
demand will turn out lower than expected. One strategy to minimise that risk is having an anchor
customer with a high demand for electricity. Of course, the risk then depends on the business of the
anchor customer.
Another risk is seen in that the regulator may not approve the demanded tariffs; in particular if these
are above those of the country’s electric utility. Even with subsidized investment costs, cost-covering
GMG tariffs will often be higher than the nation-wide tariffs. The risk is in that case not mainly seen
in that the regulator does not approve the initially requested tariffs – the project would then simply
not be realized – but that the regulator is reluctant to approve later necessary tariff increases or only
does so with substantial delay. Tariff adjustment formulas, which allow the investor raising the tariffs
if costs increase which are beyond his control, try to minimise that risk.
Currency risk is another risk if the project is financed with loans in foreign currency and sales
revenues are in local currency. Tariff adjustment formulas which account for changes of exchange
rates until loans have been repaid would protect the investor from that risk.
12

Final Report – Support Study on Green Mini-Grid Development
2 First Assessment of GMG Projects Bankability There are few private promoters for GMG projects in the countries of interest. Though mechanisms
dedicated to the promotion of private GMG has been put in place, especially in Kenya and Tanzania,
most of the existing mini-grids are owned by the National Public Utilities. This means that they
present the following characteristics:
Low cost of capital and experience in project development and operations
Relatively small impact of the project in the utility’s overall financial performance
Investment choices do not follow private sector investment criteria
In Tanzania, TANESCO owns and operates some mini-grids. Funding comes from public money and
donors, leading to a relatively low cost of capital. The interest rate of treasury bills is high (about 14%
for bills with a short maturity of one or two years) but the contribution of donors dilutes the cost of
financing from the Tanzanian State.
In Kenya, most of the existing mini-grids are owned by the public utility and have negative NPV at the
standard discount rate for publicly financed projects of 10%. The table below shows the financial
analysis of new investments, dedicated to decrease the carbon intensity by adding wind or solar
capacity to existing mini-grids supplied by diesel generators. The calculations are based on the feed
in tariff of USD 0.20 and USD 0.12 for solar and wind in off-grid areas respectively.
Table 2: Financial data on Kenya’s Retro fitting Program
Estimated Required
Annual
Capital Cost Estimated FNPV at 10%
subsidies to
Plant income FIRR
(USD) CDM (USD) Interest Rate reach a 10%
based on FIT
(USD) FIRR
Wajir Solar 8 397 761 415 224 23 532 -3 219 665 4.51% 38%
Lodwar Solar 2 039 895 129 758 7 354 -42 174 7.16% 2%
Hola Solar 815 958 51 903 2 941 -168 696 7.16% 21%
Merti Solar with battery storage 2 344 429 51 903 2 941 -1 697 167 0.00% 72%
Merti Solar without battery storage 815 958 51 903 2 941 -168 696 7.16% 21%
Habswein Solar 815 958 51 903 2 941 -168 696 7.16% 21%
Baragoi Solar with battery storage 2 344 429 51 903 2 941 -1 697 167 0.00% 72%
Baragoi Solar without battery storage 815 958 51 903 2 941 -168 696 7.16% 21%
Mfangano Solar with battery storage 2 293 867 77 855 4 412 -1 322 974 1.18% 58%
Mfangano Solar without battery storage 1 223 937 77 855 4 412 -253 044 7.16% 21%
Wajir Wind 2 117 082 71 136 6 719 -1 134 847 2.14% 54%
Merti Wind 705 694 18 148 187 -453 556 0.07% 64%
Habswein Wind 705 694 23 823 2 455 -374 711 2.22% 53%
Baragoi Wind 705 694 14 212 1 464 -508 238 0.00% 72%
Source: SREP PROJECT DOCUMENT FOR MINI -GRIDS DEVELOPMENT IN KENYA, and IED calculation.
13

Final Report – Support Study on Green Mini-Grid Development
The last column of the table shows the external subsidy or grant which would have to be injected in the project so as to reach a 10% Financial IRR. Rationale: The Financial NPV of a project represents the market value of the project or the “enterprise value”. A subsidy or a grant compensating a negative NPV calculated on the basis of a 10% discount rate (which, in fact, is far below the actual Weighted Average Cost of Capital of Private Investors) allows the investor to reach its targeted return. The “required subsidies to reach a 10%
FIRR” is the results of the ratio “FNPV/Capital Cost” and assumes that the support to the project is
provided by a capital grant.
It is important to notice that the FIRRs in this table are calculated without any leverage and projects are assumed to be fully financed on the utility’s balance sheet. If a project has an unlevered FIRR of 7%, a non-recourse financing with debt could help to reach an acceptable return.
As explained in the previous paragraph, local banks can hardly provide loans with suitable maturity
for this kind of project and high interest rates would increase the Weighted Average Cost of Capital
instead of decreasing it. Furthermore, project financing is characterized by high transaction costs
making investments below MUS$ 20 of little interest for international commercial banks.
To date, the bankability of a GMG mainly depends on the credit worthiness of the promoter since projects are to be developed on a corporate balance sheet financing basis.
3 Business Cases
3.1 Comments on the calculation method The financial analyses have been made from the viewpoint of the investor in the green mini-grid. Two key parameters are used to judge whether the financial situation is sound are:
The rate of return on equity (ROE) The funds that may have to be injected during project operation
In calculations at constant prices, as is the case in this report, the ROE for a private investor should
normally be at least 6%. More important for the investors than the ROE is that, except for the first
year of operation, funds need not be injected during project operation. The injection of funds
becomes necessary when the cumulated net cash flow is negative. The project could then not pay its
bills and would be declared bankrupt unless funds can be mobilised. In the models, that is done in
the form of equity injections. In reality, the funds can also be short-term bank loans (overdraft) 4.
The cash-flow table and the income statement have been prepared to analyse the financial situation
of the projects. The cash-flow table shows the expenditures and receipts. The income statement
determines the annual profit or loss following standard rules of accounting. If a profit is made after
taxes, the profit is assumed to be paid as dividend in the next year. In addition, there may be special
dividends. A special dividend is paid if the cash-flow table shows that the projects has excess liquidity
with excess being defined as exceeding a certain amount. Excess liquidity may be present if the
project receives substantial grant financing. The depreciation entering the income statement is based
4
In reality, the funds need not be provided in the form of equity but can be bank loans, too.
14

Final Report – Support Study on Green Mini-Grid Development
on the total asset value, independent on how the investments were financed. GMG projects often
have high asset values and consequently high depreciation which may result in low profits. If a
significant portion of the investment costs has been paid by grants, the project may show high cash
amounts; in particular once all loans have been repaid. If the cash amount exceeds a threshold value
defined by the user of the model, the excess is paid as a special dividend, subject to the prevailing
withholding tax.
Residual values are taken into account at the end of the considered period. The residual values only
account for the portion of the assets which has been financed by the investor. The grant-financed
portion is not taken into account.
All calculations have been made at constant prices in US$. In reality, calculations are also made at current prices over short periods. In our cases, the considered periods are long (≥ 10 years). Calculations at current prices would require forecasting inflation and exchange rates over long periods. Doing that for more than five years ahead would be pure speculation. Cash-flow tables of the projects analysed below are presented in Annex 2.
3.2 Financial Analysis of MWENGA Hydro Project (Tanzania) 3.2.1 Brief description of the project
Mwenga Hydro Limited (MHL), an affiliate of Rift Valley Energy, has installed the 3.5-MW Mwenga hydro plant. Construction started mid 2010 and power production in September 2012. The average
annual production is estimated at about 24 GWh5. Production is expected to be almost year round.
The bulk of the production will be sold to TANESCO under the feed-in tariff scheme. The plant is connected by an 83.7 km long 33-kV line to TANESCO’s main grid. The line was constructed by MHL. About 2.8 GWh will be sold to Mufindi Tea Company Ltd., an affiliate of Rift Valley Corporation.
Before, the tea producer had been supplied by TANESCO but frequent supply interruptions required
that the company often used its own generators for power supply. About 2.4 GWh is planned to be
sold for rural power supply. The construction of a distribution network, consisting of 28.5 km of 400
V lines, was still ongoing at the time of this writing (August 2013). The network will serve customers
in surrounding villages. In July 2013, MHL had received over 1,000 applications for connection and
about 600 customers were already connected. MHL expects to serve almost 3,000 customers in the
villages which will be connected to the plant.
The financial analysis of the project is based on information which the consultant had received from
Rift Valley Energy. The information was provided in the form of order-of-magnitude values. The
financial analysis presented here is, therefore, the consultant’s analysis and not that of the company.
5
MHL’s application for carbon credits is based on a higher average annual production of 28.5 GWh, The consultant has been informed by MHL that, at least for the time being, 24 GWh is a more realistic value because TANESCO’s grid could not absorb a higher output.
15

Final Report – Support Study on Green Mini-Grid Development
3.2.2 Assumptions Investment Cost
Total investment costs have been in the order of 10 million US$. The consultant’s estimate of the
breakdown by the main components is: hydro plant 7.7 million US$, 33-kV line 1.2 million US$, 400-V
network 0.2 million US$ and customer connections 1.0 million US$. Annex 1 shows the annual
payments. Preparatory costs were about 0.4 million US$. Financing of Investment Cost The contribution of the four sources used to finance the investment costs is estimated as follows:
A grant from the EU financed 48% of the cost of the hydro plant. The grant was obtained
under the EU-ACP Energy Facility. A call for proposals was issued and MHL’s proposal was
among the selected ones.
The performance grant provided under the TEDAP Project pays 500 US$ per connected
customer subject to the condition that it does not finance more than 80% of the
transmission, distribution and connection cost. The performance grant is paid in three
installments: 40% on signature, 40% on equipment receipt and 20% on connection.
A loan is assumed to have financed 30% of the cost of hydro plant and the 33-kV line. The
loan conditions are: maturity of 10 years, two years grace period6, and interest rate 13%.
Interest during the grace period is capitalised. The loan is assumed to be repaid in constant
annual amounts. The loan conditions are favourable by Tanzanian standards. They were
made possible by the Credit Line Facility of the TEDAP Project. The Credit Line Facility
provides loans to financial institutions for on-lending. The loans have to be used for energy
projects.
The remainder is financed by equity.
According to these assumptions, the investment costs are financed as follows: Grants (EU + TEDAP) 48%, loan 27%, equity 25%. Preparatory costs have been assumed to be entirely financed by equity. Other cost
Annual O&M cost: 3% of investment cost
Annual insurance cost: 2% of investment cost
Working capital: 3 months of O&M costs
Corporate tax: 30% of the profit shown in the income statement (losses carried forward).Payment in the following year.
Withholding tax on dividends: 5%
6
In the financial analysis, loan disbursement starts in 2010 and ends in 2012. A grace period of two years could mean that repayments start in 2012. In the financial analysis, repayments start in 2013, the first full year of power production.
16

Final Report – Support Study on Green Mini-Grid Development
Salaries are an important component of annual O&M costs. The salaries paid by MHL are not known
but the company informed about the number of employees. The total number is about 20 with the
following breakdown: 3 for the management, 5 for the operation of the hydro plant, 11 for tasks
related to the network (maintenance, administration, etc.), and a few others for cooking, cleaning,
etc. Revenues and receipts
The tariffs are:
TANESCO 2012 feed-in tariff of 152.54 TSh/kWh (0.0953 US$/kWh)
Mufindi Tea 147 TSh/kWh. The tariff equals two-thirds of TANESCO’s
energy tariff for T1 customers. (0.0921 US$/kWh)
Rural customers 60 TSh/kWh (TANESCO’s D1 tariff)
7 (0.0375 US$/kWh)
TANESCO is assumed to pay its monthly bill after 6 months8, and Mufindi Tea after 2 months. Rural
customers will be equipped with prepayment meters. While that theoretically avoids non-payments, a default rate of 2% is applied. Carbon Credit
MHL has applied for carbon credits under the CDM facility. The application was recently approved.
Application costs are estimated at 80,000 US$ and annual monitoring costs at 10% of the carbon
credit with a minimum of 20,000 US$.
The tons of avoided CO2 emissions is calculated by multiplying the energy generated for TANESCO by
the grid emission factor of 0.529 tCO2/MWh stated in the CDM document.
The carbon price is assumed to be 6 US$/tCO2 in 2013, increasing thereafter in real terms at 2% per
year. A higher price – 12 US$/ton in 2013, increasing by 2% per year – is used in a sensitivity analysis.
The higher price could perhaps be obtained in the voluntary market. 3.2.3 Results
In the base case described above – average annual production is 24 GWh/year -, the rate of return on
equity is 18.7% when calculating until 2032 (20 years production). The calculation accounts for the
share of MHL in the residual value of the hydro plant, calculated from an assumed lifetime of 30
years.
7 TANESCO’s D1 tariff of 60 TSh/kWh is subject to the condition that the customers do not consume more than 50 kWh per measuring period. The tariff for the consumption exceeding 50 kWh is 273 TSh/kWh. MHL assumes that rural households, constituting about 87% of its retail customers, will typically consume 30 kWh/month. The assumed monthly consumption of other customers varies, averaging about 280 kWh/month. The overall average is in the order of 63 kWh/month. While that would yield an average tariff of 88 TSh/kWh when applying TANESCO tariff schedule, the 60-TSh-per-kWh-tariff is used in the financial analyses because MHL informed the consultant that it may charge all retail customers the D1 tariff of 60 TSh/kWh.
8 That assumption reflects the situation as of April 2013. Billing has meanwhile been changed from monthly to quarterly. TANESCO is paying the quarterly bills about two months after receipt. The average time between power production and payment receipt is thus at the moment less than 6 months – rather 4 to 5 months - but calculating with a delay of 6 months seems prudent as TANESCO must be expected to occasionally pay with a greater delay.
17

Final Report – Support Study on Green Mini-Grid Development
No injection of funds is necessary during project operation. The payment of dividends starts in 2013
and the injected equity is recovered at the end of 2017. The payback is five years calculated from the
last year of equity injections (2012). Table 3 shows the results of sensitivity analyses.
Table 3: Mwenga Hydro Project - ROE in several scenarios (consultant’s estimates)
SCENARIO ROE
Base Case 18.7%
Residual value of hydro plant not taken into account 18.6%
Preparatory costs 800,000 US$ (Base Case: 400,000 US$) 16.4%
Average annual energy production declining by 2% per year (Base Case: no decline) 16.2%
O&M 5% (3%) 15.9%
Major repair of hydro plant components in 2022 at cost of 1 million US$ 17.9%
(Base Case: no major repair)
No anchor customer (Mufindi Tea in Base Case). Total production not sold under feed- 17.1%
in scheme sold to rural customers at D1 tariff
No grants (Base Case: EU grant and performance grant) 8.2%
In this scenario, funds would have to be injected in 2013 to avoid cash shortfalls.
The necessary tariff increase to yield the Base Case ROE of 18.7% would be 82%:
Feed-in tariff 0.174 US$/kWh excl. taxes and levies (Base Case 0.095)
Mufindi Tea 0.168 US$/kWh excl. taxes and levies (Base Case 0.092)
Rural customers 0.068 US$/kWh excl. taxes and levies (Base Case 0.038)
No sales under feed-in tariff (78% in Base Case). Feed-in sales instead to rural 4.4%
customers.
In this scenario, funds would have to be injected in the years 2015 – 2020 to avoid
cash shortfalls.
The necessary tariff increase to yield the Base Case ROE of 18.7% would be 88%:
Mufindi Tea 0.173 US$/kWh excl. taxes and levies (Base Case 0.092)
Rural customers 0.071 US$/kWh excl. taxes and levies (Base Case 0.038)
TANESCO paying with 2 months delay (6 months in Base Case) 20.9%
Carbon credit not taken into account 18.3%
Carbon credit in 2013 12 US$/ton (Base Case: 6.0 US$/ton) increasing thereafter by 19.4%
2% per year (same in Base Case)
Loan conditions 8 years maturity, 20% interest rate (10 years, 13%) 16.7%
2% annual devaluation of exchange rate in real terms (Base Case 0%) 16.5%
The analyses indicate that Mwenga is likely being an attractive investment. It may well be that some
costs are higher or that payments had to be made earlier than assumed, but the generally high ROE
values makes on expect that the plant would even under those conditions provide the investor with
a solid return.
18

Final Report – Support Study on Green Mini-Grid Development
Box 1: Return on equity – some examples
ROEs between 15 and 20% at constant prices are not unusual for power sector projects. The following projects demonstrate that. (1) In negotiations which are currently ongoing for the construction of the Ruzizi III power plant (147 MW) on the border between the DRC, Rwanda and Burundi, the investor is said to demand an ROE of about 23% in US$ at current prices which translates into about 20% at constant prices. Source: Workshop which the consultant attended in Bukavu in April 2013. (2) A consortium which intends to construct and operate a 7-MW PV plant in West Africa calculates with a ROE in Euros of about 18% at current prices which translates into about 15% at constant prices. Source: Information obtained from the investor. (3) A company which plans to construct and operate a 125-MW wind power plant in West Africa calculates with a ROE in Euros of 20% at current prices which translates into about 17% at constant prices. Source: Information obtained from the investor. Important results of the sensitivity analyses are:
The importance of the grants in allowing low tariffs. In the Base Case, the rural customers pay the D1 tariff which is TANESCO’s lowest tariff. (≈ 0.038 US$/kWh excluding 18% VAT and the 3% electricity levy). Without grants, their tariff would have to be 82% higher (≈ 0.068 US$/kWh) to yield the same ROE. A tariff of about 7 US cents per kWh is considered affordable but it would politically be more difficult to explain why (most) customers in rural areas should pay more than the poor elsewhere in the country.
The importance of the sales under the feed-in scheme. If the energy sold to TANESCO were instead sold to rural customers, their tariff would have to be 88% higher compared to the Base Case in order to yield the Base Case ROE. In reality, the increase would even have to be significantly higher because a much larger number of customers would then be required which, in turn, requires a much larger distribution network and increases connection costs.
The hydropower production is important but only drastically lower production values would make the plant a poor investment.
The ROE would be significantly lower, though still solid with 16.2%, if, starting in 2014, the
hydro production declines annually by 2%. Even a 5% decline would still yield 12.1%. If the
plant does not produce 24 GWh per year but only 20 GWh, the ROE would be 14.1%. If in
addition the output declines by 5% per year, the ROE would be 6.7%.
The carbon credit is of minor importance. Without the carbon credits, the ROE would be 18.3% instead of 18.7%. A carbon price which is much higher – twice as high in 2013 and even more in subsequent years – would only increase the ROE to 19.4%.
The anchor customer is of moderate importance. The ROE would decline from 18.7% in the Base case to 17.1% if the energy sold to Mufindi Tea were sold to rural customers at the D1 tariff. That the anchor customer is not more important is due to that the customer receives only about 10% of the production of the hydro plant.
19

Final Report – Support Study on Green Mini-Grid Development
The loan conditions are important but not of paramount importance. That is because “only”
about 25% of the investment costs are financed by a loan.
That the exchange rate development is of moderate importance is due to the discounting effect. Sales receipts in US$ decline significantly in the course of time if the Tanzanian Shilling devalues each year by 2% in real terms. But the decline is rather insignificant in the initial years which are the most important years in discounting methods.
The analyses also show that, even if no grant money had been received, the ROE would still be 8.2%.
As has been mentioned, some assumptions which the consultant had to make regarding the costs
and the time of their accrual may be too optimistic. The ROE without grant financing may, therefore,
be lower than calculated and even too low for MHL to realize the project. That message has indirectly
been received from MHL which mentioned that the project would probably not have been realized
without grant financing; certainly not the supply of rural customers by a mini-grid.
20

Final Report – Support Study on Green Mini-Grid Development
3.3 Financial Analysis of the ENNY Hydro Project (Rwanda)
3.3.1 Brief description of the project ENNy’s 500-kW plant is located in Rwanda. ENNy is a private joint venture of the German company
CARERA and the Rwandan NGO ADENYA as well as six other private individuals. Private investors
were supported within the framework of the project “Private Sector Participation in Micro
Hydropower Development” (PSP Hydro) which is part of the Dutch-German Energy Partnership
‘Energizing Development’ implemented by GIZ.
Power production started at the end of April 2012. At present, the total production is sold to EWSA
under the feed-in tariff scheme. ENNy had originally planned to supply the Nishili Tea Factory and
rural customers. The plan was based on the assumption that the interconnected grid would arrive in
2025. The grid arrived in 2012. ENNy is still planning to supply the Nishili Tea Factory and rural
customers and has negotiated a wheeling tariff with EWSA (≈ 2 US cents per kWh). The tea factory
would consume about 85% of the produced power. These plans have become obsolete. ENNy was
recently informed by the Government that it can only sell its production to EWSA.
A problem is, at present, that EWSA’s grid cannot absorb the production potential of the power
plant. Production is, therefore, limited at 2.84 GWH per year which compares with the potential of
3.18 GWh.
The financial analysis of the project is based on information which the consultant had received from
the developer. The information was provided in the form of order-of-magnitude values. The financial
analysis presented here is, therefore, the consultant’s analysis and not that of the company.
3.3.2 Assumptions Investment Cost
Total investment costs of the hydro plant are about 2.8 million US$. Preparatory costs were in the order of 0.65 million US$. Financing of Cost The contribution of the four sources used to finance the investment costs is estimated as follows:
A grant from the PSP-Hydro Program finances 23.4% of the cost of the hydro plant.
A loan finances 45.20% of the cost of the hydro plant. The loan conditions are: maturity of 8
years, three years grace period9, and interest rate 16.75%. Interest during the grace period is
capitalised. The loan is assumed to be repaid in constant annual amounts. The loan has been
provided by a local bank with a guarantee for 140% of the loan amount provided by the
shareholders, a special guarantee fund of the National Bank of Rwanda and a guarantee from
the FSA in Niger (Interstate Fonds de Solidarité Africaine).
The remainder is financed by equity, mezzanine capital and credits from the shareholders. 9
In the financial analysis, loan disbursement starts in 2010 and ends in 2012. The grace period of three years means that repayments start in 2013, the first full year of power production.
21

Final Report – Support Study on Green Mini-Grid Development
Preparatory costs have been assumed to be entirely financed by equity10
. Other cost
Annual O&M cost: 2% of investment cost
Annual insurance cost: 2% of investment cost
Working capital: 3 months of O&M costs
Corporate tax: 30% of the profit shown in the income statement (losses carried forward)
Withholding tax on dividends: 15%
Revenues and receipts
The plant sells the produced energy to EWSA at the RE-FiT tariff of 0.129 US$/kWh (net of VAT). EWSA is assumed to pay with a delay of two months. Carbon Credit The ENNy Project did not apply for carbon credits because of high transaction and registration costs.
3.3.3 Results
In the base case described above, the rate of return on equity is 3.0% when calculating until 2032 (20
years production). The rate is considered too low to incite private investors to realize the project.
Worse than the low ROE is the result that substantial amounts (about 150,000 US$ per year) will
have to be injected between 2014 and 2018 to cover cash deficits. At the end of 2018, the loans are
repaid.
The problems are mainly due to the fact that the government does not allow ENNy to sell to retail
customers. As has been mentioned, ENNy had planned selling about 85% of the plant’s output to the
Nishili Tea Factory and 15% to rural customers. A wheeling tariff of 12.62 FRw/kWh (≈ 0.02 US$/KWh) had already been negotiated with EWSA. The planned end-user tariffs were said to be about 10% below the tariffs of EWSA:
Nishili Tea Factory 189 FRw/kWh net of VAT (0.189 US$/kWh)
Rural Customers 189 FRw/kWh net of VAT (0.189 US$/kWh)
That scheme would yield a ROE of 6.4% if it were realized from 2014 onward. The result assumes that
the Nishili Tea Factory pays its bills after two months, and that rural customers are equipped with
prepayment meters. While that theoretically avoids non-payments, a default rate of 2% has been
applied. Funds would also in this scheme have to be injected until the loans are repaid (2018). But
the amounts would only be about a third of the amounts where ENNy sells the output to EWSA and is
paid the feed-in-tariff.
10
The consultant has been informed after this report had been finished that about 35% of the preparatory costs were
financed by equity. The remainder includes components financed by a bank loan but also costs of one shareholder for the management of the project. These costs shall be reimbursed during project operation. The information demonstrates that the reality is complex – much more complex than assumed in planning studies. Calculating with the exact conditions would change the major findings of the analyses. The identified problems would not disappear and examined solutions remain valid.
22

Final Report – Support Study on Green Mini-Grid Development
No additional equity injections would be necessary if ENNy sold to Nishili and rural customers at EWSA’s tariffs of 0.21 US$/kWh (net of VAT). The ROE would then be 7.8%. The sensitivity analyses mainly focus on what could be done to improve the financial situation.
The results presented in Table 2 show that the situation would improve if, from 2014 onward, ENNy
could inject the total possible power production of 3.18 GWh/year into the main grid. The ROE would
then be 4.6%. Further equity injections of about 100,000 US$ per year would, however, still be
necessary up to and including 2018. To really improve the situation, other parameter values would
also have to be more favourable. The following results assume that ENNy sells 3.18 GWh per year to
EWSA.
Feed-in-tariff. If, from 2014 onward, the feed-in-tariff is 30% higher (0.168 US$/kWh) cash deficits would be avoided without having to inject additional funds. The ROE would then be 8.3%.
Loan conditions. Extending the reimbursement period by four years would lower the ROE (3.6%) but
significantly reduce the injection of funds to avoid cash deficits (about 20,000 US$ per year until
2022). If, in addition, the interest rate of 16.75% is reduced to 15.5%, no injections would be
necessary11
. The ROE would be 4%.
Insurance. In the Base Case, annual insurance costs are 2% of investment costs. If they are only 1%,
the ROE would increase to 5.6%. Equity injections to avoid cash deficits would decline but still be
substantial.
Annual O&M cost. In the Base Case, annual O&M costs are 2% of investment costs. If they are only
1% until the loan has been repaid at the end of 2018, less equity injections would be necessary but
the amounts would still be substantial (about 80,000 US$ per year ). The ROE would be 5.1%
A combination of a higher feed-in-tariff, better loan conditions and lower annual insurance and O&M
costs could, of course, improve the financial feasibility significantly. If, for example, the feed-in-tariff
were 5% higher from 2014 onward, the loan reimbursement period were extended by two years,
annual insurance costs were only 1.5% of the investment costs and annual O&M costs were only
1.5% up to and including 2020 (2,0% thereafter), there would be no need to inject funds during
project operation. The ROE would be 5.7%.
Table 4 summarizes these scenarios and presents some additional ones. The results show that the
devaluation of the Rwanda Franc constitutes another important risk. That is not surprising because
the ENNy project is only marginally viable in the Base Case. Even small changes in important
parameter values can jeopardize the sustainability of such projects. 11
The consultant has been informed by a shareholder in ENNy that the company will try to renegotiate the loan conditions.
23

Final Report – Support Study on Green Mini-Grid Development
Table 4: ENNy Hydro Project - ROE in several scenarios (consultant’s estimates)
SCENARIO ROE
Base Case. Sales under feed-in tariff scheme (0.129 US$/kWh). Annual energy
production limited to 2.84 GWh because of main grid problems. 3.0%
Scenario requires injection of funds during project operation until loans have been
repaid in 2018.
Sales as planned to Nshili Tea Factory and rural customers at nation-wide tariffs of 7.8%
0.21 US$/kWh. No injection of funds necessary during project operation.
Annual energy production 3.18 GWh/year (Base Case 2.84 GWh).
Injection of funds necessary during project operation until loans have been repaid in 5.4%
2018.
Annual energy production 3.18 GWh/year and feed-in tariff 0.168 US$/kWh from 8.4%
2014 onward. No injection of funds necessary during project operation.
Annual energy production 3.18 GWh/year and better loan conditions: loan tenor 12
years (8 years in Base Case) and interest rate 15.5% (16.75% in Base Case). 4.0%
No injection of funds necessary during project operation.
Annual energy production 3.18 GWh/year and annual insurance cost 1.0% of
investment cost (2% in Base Case). Injection of funds necessary during project 5.6%
operation until loans have been repaid in 2018.
Annual energy production 3.18 GWh/year and annual O&M cost 1% of investment
cost until 2018 (2% in Base Case). Injection of funds necessary during project 5.1%
operation until loans have been repaid in 2018.
Annual energy production 3.18 GWh/year, feed-in tariff 0.135 US$/kWh from 2014
onward, loan tenor 10 years, annual insurance cost 1.5% of investment cost, annual 5.7%
O&M cost 1.5% of investment cost until 2020.
No injection of funds necessary during project operation.
No dividend tax (Base Case: 15%).
Injection of funds necessary during project operation until loans have been repaid in 3.8%
2018.
No grants (Base Case: 23.4% of hydro plant investment cost). Equity used instead.
Injection of funds necessary during project operation until loans have been repaid in 1.7%
2018.
2% annual devaluation of exchange rate in real terms (Base Case 0%) Negative
Comment: The described injection of funds is a result and not an assumption.
24

Final Report – Support Study on Green Mini-Grid Development
3.4 GMG supplied by biomass-fuelled gasifiers
3.4.1 Brief description of the program
A currently ongoing electrification study for Tanzania has identified biomass-fuelled gasifiers as
candidates for off-grid electrification. Sixteen development centres have been identified which would
not be connected to the grid before 2020 – and probably much later – and where rice husks should
be available in the vicinity of the centres to be used as feedstock for gasifiers. The total installed
capacity would be in the order of 2,600 kW (on average about 160 kW per centre). 3.4.2 Assumptions Gasifier: Investment cost, lifetime and production
Based on the experience with a rice-husk-fuelled gasifier in Cambodia, investment costs have been
fixed in the Base Case at 2,800 US$/kW. That is significantly higher than most figures found in the
documents on biomass-fuelled gasifiers where investment costs as low as 1,200 US$/kW can be
found. The reason for calculating with relatively high investment costs is that the experience with the
gasifier in Cambodia strongly suggests equipping the gasifier with two filter systems for gas cleaning,
a water treatment plant and ash removal equipment. The filters have to be cleaned frequently and if
a second set of filters is not available during that time, the gasifier cannot produce electricity.
The model also calculates with a lower lifetime of the gasifiers than mentioned in documents where 20 years seems to be the standard. In the Base Case, the lifetime of the gasifier is 10 years.
The gasifiers are assumed to produce 7,680 hours/year but not permanently. It may be that in reality
a diesel generator would be installed to produce electricity during (part of) the time when the
gasifier is not operated for maintenance purposes. The possible installation of a diesel generator will
depend on the demand characteristics in the supplied area: the higher the demand for productive
purposes, the higher the probability that a diesel generator will be installed. Mini-grid Investment Cost
The mini-grid investment costs are those calculated by GEOSIM, a model based on a geographic
information system. The model determined the length of the LV and MV lines and the needed
transformer capacity in the towns which are considered candidates for electrification by rice-husk-
fuelled gasifiers because of existing rice fields in the surrounding area. The costs are:
- LV Lines: 3.390 million US$ (323 km – about 20 km per settlement - at cost of 10,500 US$
per km of LV line) - Transformer: 0.480 million US$ - MV Lines: 0.468 million US$ (MV lines are installed in some settlements with a high demand) - Customer Connections: 350 US$ per customer
25

Final Report – Support Study on Green Mini-Grid Development
The investment costs of LV and MV lines exclude the costs of grid extensions which are due five years
after the electrification of the development centres. The extension investments are made with a time
horizon of five years which means that the extended grid will then allow satisfying the demand in the
following five years. The initially installed transformer capacity is sufficient for the demand at the
time horizon of 20 years.
Customer development: The number of customers increases from 6,887 in 2015 (first year of
operation) to 9,686 in 2019 (fifth year of operation) and slowly thereafter, reaching 10,435
customers at the end of the lifetime of the gasifier (2024). The customers are assumed to be
connected in the year before their supply starts.
The development of the number of customers and the energy production of the gasifiers in the Base Case is shown in Figure 1.
Figure 1: Development of the number of customers and the energy production in the Base Case
(total of 16 settlements for which rice-husks-fuelled gasifiers are considered supply options; lifetime of gasifiers 10 years)
Preparatory cost
Preparatory costs (feasibility studies, engineering studies, permits, etc.) are estimated at 10% of the investment cost. Financing of initial investment cost and preparatory cost Three sources are used in the model to finance the initial investment costs:
Grants. In the Base Case, grants finance 75% of the costs of the gasifiers and the investor
obtains in the first five years a performance grant of 500 US$ per connected customer12
. In addition, grants finance 50% of the preparatory cost.
12
In the model, the performance grant is paid as follows: 80% of connections cost in year of connection, 20% in the following year. Years of connection considered: 2014 – 2018. Last payment of performance grant thus in 2019. Total amount paid is subject to the constraint that it does not exceed 80% of grid and connection costs.
26

Final Report – Support Study on Green Mini-Grid Development
Loans. In the Base Case, loans finance 75% of the investment costs of the LV lines, the
transformers and the MV lines. Loan conditions: maturity 10 years, 2 years grace period, and
13% interest rate. Interest during the grace period is capitalised. The loan is assumed to be
repaid in constant annual amounts. Repayment starts in 2016, i.e. in the second year of
operation.
Equity. The remainder is financed by equity.
According to these assumptions, the investment costs of 16.59 million US$ (preparatory cost 1.38,
gasifier 7.06, grid 4.34, connections 3.39, IDC 0.42) are financed as follows in the Base Case: grants
65%, loans 22%, equity 13%. Lifetime of assets The lifetimes are used in the model to calculate the residual values.
Gasifier 10 years in Base Case (8 and 12 years in sensitivity analyses)
LV network 20 years
MV network 20 years
Transformer 20 hears
Connections 20 years Other cost
Feedstock cost: 5 US$ per ton of rice husk. Need: 2 tons per MWh.
Annual O&M cost of gasifier: 4% of investment cost
Annual O&M cost of mini-grid: 2% of investment cost
Annual insurance cost: 2% of investment cost
Working capital: 3 months of O&M costs
Corporate tax: 30% of the profit shown in the income statement (losses carried forward)
Tax on dividend: 5%
Revenues and receipts
The regulatory framework for mini-grids in Tanzania allows the investor to negotiate the tariffs with
the regulation agency (EWURA). Higher tariffs than those charged by TANESCO are thus allowed. The
model makes use of that provision. Customers are assumed being equipped with prepaid meters (no
payment delays, no defaults).
3.4.3 Results Key results of the Base Case are:
The ROE is 8.1% if the supplied customers pay on average 0.264 US$/kWh (excluding VAT
and the electricity levy).
Except for one year, funds do not have to be injected during project operation which starts in
2015. The exception is the year 2019, where in total about 140,000 US$13
have to be injected to finance the extension of the 16 distribution networks.
13
The investment costs are significantly higher, amounting to almost 300,000 US$. But when using the net receipts in 2019
27

Final Report – Support Study on Green Mini-Grid Development
While a ROE of 8.1% could be accepted by a private investor, the payback period is long. It is
only in the year after the end of the gasifier lifetime (10 years in the Base Case) that the
investor recovers the injected equity plus a (sound) margin. Before, he only recovers about
80% of the injected equity. In the year after the end of the gasifier lifetime, it is the investor’s
share in the residual value of the network and connection assets which assures that the
project has an acceptable ROE. Tariff: The average kWh-price which is presently paid by TANESCO’s customers is 0.125 US$/kWh (excluding VAT and the electricity levy). The gasifier supply price of 0.264 US$/kWh would thus be
more than twice as high as TANESCO’s price. While the gasifier supply price could still be affordable,
it would be difficult for the customers to accept having to pay much more than the customers
supplied by TANESCO. Bringing the average price for the mini-grid customers down to the average
price paid by TANESCO’s customers requires optimistic assumptions and anchor customers who
operated diesel generators before mini-grid supply becomes available. If (a) the gasifier investment
cost is 2,500 US$/kW, (b) network and connection costs are 10% lower than assumed in the Base
Case, (c) the investor is satisfied with a ROE of 5%, and (d) 40% of the production is sold to anchor
customers who are willing to pay 0.35 US$/kWh for mini-grid supply, the non-anchor customers
could be charged approximately what TANESCO’s pay, i.e. 0.125 US$/kWh.
If it is the government’s objective that mini-grid customers do not pay more than TANESCO’s
customers, the gasifier mini-grids should rather be established and operated by TANESCO than by
private investors. TANESCO could then charge the customers who are supplied by the gasifier mini-
grid the national tariff and recover the cost difference through the tariffs it charges for the main-grid
supply. At present, that would not be a real solution because TANESCO’s average tariff is not cost
covering14
.
Profitability: That the profitability of the project is only realized if the investor is paid his share in the
residual asset values15
at the end of the gasifier lifetime is certainly not in line with the planning of
private investors. They can be expected to very much prefer a scenario where the ROE is the same
but where they are paid a higher price during project operation and a lower price for the residual
values. A ROE of 8.1% would, for example, also result if the investor is paid 0.275 US$/kWh and only
75% of his share in the residual asset values.
Comparison with diesel supply. The high tariffs of gasifier supply raise the question whether diesel
supply wouldn’t be cheaper. The answer is no. A diesel generator which consumes 0.25 liter/kWh can
be considered very efficient. At the present diesel fuel price of about 1.30 US$ per liter, fuel cost
alone would be 0.325 US$/kWh. It is obvious that when adding all the other costs (diesel generator,
O&M cost of diesel generator, grid investment and O&M cost, connection costs) the average tariff
which would yield the Base Case ROE of 8.1% (lifetime 10 years), would have to be much higher than
the gasifier tariff. The diesel tariff would have to be in the order of 0.51 US$/kWh. The calculation
assumes that 75% of the diesel generator cost of 800 US$/kW would be subsidised. The tariff of 0.51 (receipts minus expenditures excluding the investment expenditures) and the accumulated cash, the investor only has to inject about 140,000 US$. 14
See
15 Example: If grants financed 75% of the investment cost of an asset, the investor’s share in the residual value is the residual book value multiplied by 0.25. The residual asset values comprise the residual values of the mini-grid components and the connections.
28

Final Report – Support Study on Green Mini-Grid Development
US$/kWh would require that funds are injected in the years of loan repayment (2016 – 2023) which
is not acceptable to private investors. To avoid having to inject funds except for the network
extension, the tariff has to be in the order of 0.545 US$/kWh. The ROE would then be high (about
18%) if the investor is paid 100% of his share in the residual asset values of the mini-grid. A ROE of
8.1% would result if the investor is only paid 11%. Table 5 shows the results of other scenarios. The most important findings are:
Without substantial grant funding, tariffs will most likely not be affordable. Without grant financing, the average tariff has to be about 0.57 US$/kWh (excluding 18% VAT and the 3% electricity levy) to yield the Base Case ROE of 8.1%. If grant financing is halved compared to the Base Case, the average tariff has to be about 0.41 US$/kWh. While in the Base Case an affordable tariff for the majority of the rural customers could perhaps be achieved if an anchor customer is present who had satisfied his electricity demand by diesel generators before supply by the mini-grid is available (and would thus be willing to pay an above-average tariff), high average tariffs of 0.57 or 0.41 US$/kWh would not enable that.
Selling the gasifier production under the feed-in-tariff scheme is of no interest unless the feed-in-tariff is 41% higher (13.4 US cents per kWh compared to 9.5 cents at present).
The importance of the demand level. The decision to invest in such a project is based on demand forecasts, which are a key determinant for the negotiated tariff. If the actual demand is 10% lower than forecasted and no tariff revision mechanism is in place, the ROE would decline to 5.4% in the Base Case.
Feedstock costs are important. In the Base Scenario, feedstock costs rather probably on the low side (5 US$/ton). A fourfold price is not unrealistic, in particular if the rice husks have to be transported over long distances. It would reduce the ROE to 2.4% which is considered not acceptable for private investors. In order that the ROE is the same as in the Base Case (8.1%), tariffs would have to be 10% higher.
Loan conditions have a moderate impact because only 22% of the investment costs are financed by loans.
The impact of taxes is insignificant. The corporate tax has no impact at all because the income statement never shows a profit. The impact of the withholding tax (tax on dividend payments) is insignificant because the tax is small (5%).
Lifetime of the gasifiers: A longer lifetime has only a moderate impact but a shorter lifetime than the Base Case lifetime of 10 years reduces the ROE significantly to 6.2% which compares with 8.1% in the Base Case.
29

Final Report – Support Study on Green Mini-Grid Development
The exchange rate development has a significant impact. An annual devaluation of 2% in
real terms would not recover the paid-in equity. An annual devaluation of 1% would reduce the ROE to 4.3%, a level which is of no interest to private investors.
The relatively high residual value which the investor is assumed being paid at the end has an
important impact on the result because the devaluation reduces the US$ amount
significantly.
The exchange rate development is important for a foreign investor. For a local investor, it is
important if some of his loans are in foreign currency or if he intends to convert the dividend
payments into foreign currency.
Table 5: Mini-grids supplied by gasifiers using rice husks - ROE in several scenarios
SCENARIO ROE
Base Case 8.1%
Tariff 0.275 US$/kWh (excluding taxes and levies; Base Case: 0.264) but only 75% of 8.1%
residual values paid (Base Case: 100%)
Gasifier cost 2,500 US$/kW (Base Case: 2,800 US$/kW) 10.6%
Network and connection costs 10% lower
The Base Case ROE of 8.1% could then be achieved with a tariff of 0.242 US$/kWh 12.9%
(Base Case tariff: 0.264 US$/kWh)
O&M 5% (Base Case: 4%) 6.0%
Demand 10% lower than in Base Case 5.4%
Entire production sold under feed-in tariff scheme. (Base Case: no sales under FiT
scheme). Negative
FiT must be 0.134 US$/kWh in that case in order that the ROE is 8.1%. The FiT is
currently (August 2013) in Tanzania 0.095 US$/kWh.
No grid extension in 2019. 8.7%
Feedstock cost 10 US$/ton (Base Case: 5 US$/ton) 6.2%
Feedstock cost 20 US$/ton (Base Case: 5 US$/ton)
The tariff would then have to be 0.297 US$/kWh (excluding VAT and levy) in order 2.4%
that the ROE is 8.1% (Base Case tariff: 0.264 US$/kWh).
No grants. Equity finances 44%, loans 56% (BC: grants 65%, loans 22%, equity 13%).
The tariff would then have to be 0.574 US$/kWh (excluding VAT and levy) in order Negative
that the ROE is 8.1% (Base Case tariff: 0.264 US$/kWh)
Grants finance half compared to Base Case (25% of preparatory cost, 37.5% of
gasifier cost, performance grant 250 US$/customer). Grants then finance 32%, loans
39% and equity 29% (Base Case: 65%, 22%, 13%). Negative
The tariff would then have to be 0.408 US$/kWh (excluding VAT and levy) in order
that the ROE is 8.1% (Base Case tariff: 0.264 US$/kWh)
Loan conditions 8 years maturity (Base Case: 10 years) 8.6%
Loan conditions 3 years grace period (Base Case: 2 years) 9.6%
No corporate tax (Base Case: 30%) 8.1%
No tax on dividends (Base Case: 5%) 8.5%
Lifetime of gasifier 12 years (Base Case: 10 years) 8.3%
Lifetime of gasifier 8 years (Base Case: 10 years) 6.2%
2% annual devaluation of exchange rate in real terms (Base Case 0%) Negative
30

Final Report – Support Study on Green Mini-Grid Development
Carbon Credit
Each individual system is too small to warrant the application for carbon credits under the regular
CDM scheme. The question is whether applying for carbon credits in the voluntary market under the
Program of Activities (PoA) facility makes sense. PoAs are bundling large numbers of emission
reducing activities that can earn carbon credits. Individually, these activities would be too small to
apply the often costly carbon credit certification processes. PoAs do not require that all individual
activities are known or identified at the moment the PoA is registered. Once the PoA is registered,
activities can be included periodically as the program grows provided, of course, that the technology
type of the project is included in the registered PoA. The time needed for a project to be included is
then shortened to a period of weeks which compares with years under the regular CDM project-
approval cycle16
.
The consultant views the PoA facility as a facility for a public authority and not for private investors.
A public authority would be in charge of the registration process, pay the application and annual
monitoring costs and receive the carbon credits. The following analyses assume that a public sector
authority will be in charge of the process and the benefits. Two methods are analysed:
In the first method, the avoided emissions of the gasifier program are those of households
which nowadays use kerosene for lighting. Kerosene lamps are emitting black carbon which
is a hazard for human health and the environment, affecting air quality both indoors and
outdoors. When gasifier-fuelled grid power supply is available, electric light is used and the
emissions are avoided.
The second method is the method described in UNFCCC document “electrification of rural
communities using renewable energy”17
. The method has been developed for the
electrification of communities by renewable energy sources. At least 75% of the end-user must be households. Compared to the first method, the baseline emissions are much higher.
In the first method, the avoided emissions are estimated at 0.162 tons of CO2 equivalent per
household per year18
. There will most likely be other avoided CO2 emissions as the gasifiers can be
expected to also supply customers who operate their own diesel generators at present. But the
number of such customers is not known and neither is their self-generation. Assuming that 80% of
the customers are households, the avoided emissions would be 893 tons of CO2 equivalent in 2015,
increasing to 1,352 tons in 2024. If application costs are 50,000 US$, annual monitoring costs is
16,000 US$ (for monitoring the projects in 16 small towns), and the public discount rate is 4% (at
constant prices), the carbon price has to be about 19.5 US$/ton in order that the discounted carbon
credits equal the discounted costs over the gasifier lifetime of 10 years. In 2012, the average carbon
credit for biomass projects was in the voluntary markets about 5 US$/ton (see Figure 2 below); in 16 PoA registration also takes a long time; on average more than a year (Workshop on PoA under the CDM; May 2011). But once the PoA is registered, including projects goes fast.
17 https://cdm.unfccc.int/methodologies/DB/5V3GUB9R90CWY26N7RXSSEVZ6C5W8G
18The value is based on the following assumptions: consumption of 0.053 liters per hour of kerosene lighting, 3.5 hours per
household per day, 2.4 kg of CO2 emissions per liter. The values are shown in the UNFCCC document “Lift-off! The Illumination Project to Replace Kerosene lamps with Solar LED Lamps”. A comment on the draft mentioned that much higher emission factors could be used if the methodology is applied which is described in the UNFCCC document
“Electrification of rural communities using renewable energy”.
31

Final Report – Support Study on Green Mini-Grid Development
2011 about 4 US$/ton. For some biomass projects much higher credits were obtained - up to 42
US$/ton in 2012 and up to 90 US$/ton in 2011 – but the average value is certainly a better estimate
of what would have been paid in the voluntary markets. A price of 19.5 US$/ton is far above the 2012
average and it must be doubted whether it can be obtained during the lifetime of the gasifiers (2015 – 2024).
Figure 2: Carbon credits paid in voluntary markets in 2012 Source: Ecosystem Marketplace, Maneuvering the Mosaic – State of the Voluntary Carbon Markets 2013, p. 26. When applying the second method, the baseline emission factors are:
6.3 tCO2/MWh for the first 55 kWh/year of renewable electricity consumed by households, public buildings or small medium or micro enterprises,
1.3 tCO2/MWh for the consumption between 55 kWh/year and 250 kWh/year, 1.0 tCO2/MWh for the consumption exceeding 250 kWh/year
The figures yield baseline emissions of 7,558 tCO2 in 2015, increasing to 10,731 tCO2 in 2024. When
calculating with the same costs and discount rate as above, a carbon credit of more than 1.2 US$/ton
would be sufficient in order that the discounted revenues exceed the discounted costs. Applying that
method thus promises sound rates of return.
Injection into the main grid under the feed-in-tariff scheme would produce higher baseline emissions
compared to in the first method – the grid emission factor used for the Mwenga plant is 0.529
tCO2/MWh – but much less compared to the second method. Grid injection of gasifiers is at moment
only a theoretical concept. As shown in Table 4, it is of no interest at the current feed-in-tariffs.
32

Final Report – Support Study on Green Mini-Grid Development
3.5 GMG supplied by diesel – PV hybrid systems
3.5.1 Brief description of the program A currently ongoing electrification study for Tanzania has identified diesel-PV hybrid systems as
candidates for off-grid electrification in 73 development centres which would not be connected to
the grid before 2020 – and probably much later. The following analysis is not made for these centres
but for the development centres for which mini-grids supplied by gasifiers are proposed. That
enables comparing gasifier supply with the supply of diesel-PV hybrid systems. 3.5.2 Assumptions Diesel-PV hybrid system: Investment cost, lifetime and production Diesel generator
Investment cost: 800 US$/kW (power house included) Lifetime: 10 years Installed capacity: 2,520 kW
This is total demand in the gasifier analysis. Diesel generators satisfy the demand that is not satisfied by the PV system, including in some scenarios storage capacity. PV system
Investment cost: PV panels 1,600 US$/kWp, inverter 1,000 US$/kWp, battery 250 US$/kWh,
charge control 500 US$/kWp Lifetimes: PV panels 25 years, inverter 12 years, batteries 8 years, charge control 8 years Civil works: 15% of PV investment cost
PV production: 4 kWh per day per kWp installed
In the model, the installed capacity of the PV system is the peak load at the end of the lifetime of the
diesel generator (10 years in Base Case) at the time of maximum PV production which is normally
between 12h and 14h. In the Base Case, the capacity is 752 kWp19
corresponding to 34% of the
annual peak load in 2024, which is the last year of the gasifier’s lifetime. The inverter capacity is 10%
higher which yields 857 kWp. The battery capacity is 1,679 kWh if the depth-of-discharge rate is 50%.
The capacity is the maximum daily energy injected into the batteries multiplied by the factor 2. Mini-grid investment cost The costs are the same as described in chapter 3.4 (gasifier). Preparatory cost Preparatory costs are estimated at 10% of the investment cost. 19
The peak load at the time of maximum PV production is estimated at 34% of the annual peak load.
33

Final Report – Support Study on Green Mini-Grid Development
Financing of initial investment cost and preparatory cost
In order to compare the hybrid supply with the gasifier supply, the same assumptions are made regarding the financing of the initial investment costs:
Grants. In the Base Case, the grants finance 50% of the preparatory cost, 75% of the
investment costs of the hybrid system (diesel and PV components), and pay a performance
grant for customers connected in the first five years of 500 US$ per customer. The
performance grant is subject to the condition that the total amount does not exceed 80% of
the network and connection cost.
Loans. In the Base Case, loans finance 10% of the investment costs of the PV components
and 75% the costs of the distribution network. Loan conditions: maturity 10 years, 2 years
grace period, and 13% interest rate. Interest during the grace period is capitalised. The loan is
assumed to be repaid in constant annual amounts.
Equity. The remainder is financed by equity.
According to these assumptions, the total investment costs in the first five years amount to 13.61
million US$ for the hybrid system without storage capacity (preparatory cost 1.11, diesel 2.02, PV
system 2.33, mini-grid 4.34, connections 3.39, IDC 0.42). In the Base Case, the costs are financed as
follows: grants 62%, loans 27%, equity 11%. The corresponding data of the system with storage are:
investment cost 14.14 million US$, grants 62%, loans 26%, equity 12%. Other cost
Fuel cost: 1.30 US$ per liter. Specific consumption: 0.25 liter per kWh
Annual O&M cost of diesel generators: 4% of investment cost
Annual O&M cost of PV system: 1% of investment cost
Annual O&M cost of mini-grid: 2% of investment cost
Annual insurance cost: 2% of investment cost.
Working capital: 3 months of O&M costs.
Corporate tax: 30% of the profit shown in the income statement (losses carried forward).
Tax on dividend: 5%
Number of customers and demand See Figure 1 above. Carbon Credit
The diesel-PV system would only avoid CO2 emissions if the diesel generators are already operating
and the PV system is added later. In our case, where there is no power supply before the hybrid
system is installed, avoided emissions would in the traditional approach be the black carbon
emissions of the kerosene lamps of rural households. The power production of the use of diesel
generators would add CO2 emissions. In total, the emissions of the diesel generators exceed the
avoided emissions.
It is not clear whether the method described in the UNFCCC document “electrification of rural communities using renewable energy” can be applied because the hybrid system is not a renewable-
34

Final Report – Support Study on Green Mini-Grid Development
only supply system. If it can nevertheless be applied, only the PV supply would qualify for the
calculation of the avoided baseline emissions and the emissions of the diesel would have to be
subtracted.
35

Final Report – Support Study on Green Mini-Grid Development
3.5.3 Results Diesel-PV Hybrid System without Storage Capacity
In the Base Case of gasifier supply, the ROE is 8.1% and the average tariff 0.264 US$/kWh (excluding
18% VAT and the 3% electricity levy). In the case of supply by diesel-PV hybrid systems without
storage capacity, the same ROE would require an average tariff of 0.503 US$/kWh. Both results
assume that the investor is paid 100% of his share in the residual asset values.
The tariff of 0.503 US$/kWh would probably not be accepted by investors as it requires that, except
for one year, funds have to be injected in each year when the loans are repaid (2016 – 2023). To
avoid that situation, the tariff has to be increased or other measures taken (for example, a lower
interest rate). A tariff of 0.513 US$/kWh would avoid the injection of additional funds except for
funds that are necessary to finance the grid extension. The ROE would be 10.3%.
The ROE is based on the assumption that investor is paid his share in the residual values at the end of
the lifetime of the diesel generators (10 years in the Base Case). A private investor will certainly
prefer receiving a higher tariff during project operation in exchange for receiving a lower residual
value at the end of the lifetime of the diesel generators. The analyses show that a tariff of 0.533
US$/kWh would yield a ROE of 10.3% if the investor receives only 45% of his share in the residual
asset values.
The high tariffs discussed above are certainly not affordable for all potential customers – the demand
projection is based on the assumption that about 50% of the households in the towns/villages and a
number of other customers (small and medium enterprises, local administration, health facilities,
schools, public lighting, etc.) are supplied at the end of the fifth year after the start of electrification.
There is no realistic scenario where the average tariff could be reduced to about 0.20 – 0.25
US$/kWh (excluding 18% VAT and the 3% electricity levy) which could be affordable.
Comparison with diesel-only supply. The diesel-only result is identical to the corresponding result in
the case of gasifier supply. Diesel-only supply would require an average tariff of about 0.545
US$/kWh to avoid having to inject funds during operation except for the extension of the distribution
network.
The tariff of 0.545 US$/kWh must be compared with the hybrid tariff of 0.513 US$/kWh. The
difference of about 5% may be considered too low to be significant. The assumptions are, however,
rather optimistic for the diesel-only solution.
A higher specific consumption of 0.30 liter/kWh and/or a 1% annual increase in the diesel fuel price
(increase in real terms) may be considered more realistic. The tariff of both the hybrid system and
the diesel-only supply would then have to be higher but the difference would widen in favor of the
hybrid system. In case the specific consumption is 0.30 liter/kWh and the diesel fuel increases by 1%
or year in real terms, the diesel-only tariff would have to be 6 US cents or 10% higher.
Another assumption favoring diesel-only supply concerns the installed capacity of the PV system. The capacity is installed such that its production can only be fully used without storage ten years ahead in
36

Final Report – Support Study on Green Mini-Grid Development
the future. An installation which is more in line with the demand development would reduce the costs of the hybrid system.
Table 6: Mini-grids supplied by diesel-PV systems – Results of scenarios
Base Case. Average tariff of 0.513 US$/kWh. The tariff avoids that, except for the extension of 10.3%
the distribution network, the injection of funds becomes necessary during project operation.
No extension of the distribution network in 2019. 11.1%
Price of PV panels 1,000 US$/kWp (Base Case: 1,600 US$/kWp). 12.0%
Diesel consumption 0.30 l/kWh (Base Case: 0.25 l/kWh) Negative at
The tariff would then have to be about 0.57 US$/kWh (excluding VAT and levy) in order to 0.513
avoid injection of funds except for network extensions. ROE: 9.6%. US$/kWh
Demand 10% lower (PV production unchanged). 6.5% at
The tariff would then have to be about 0.535 US$/kWh (excluding VAT and levy) in order to 0.513
avoid injection of funds except for network extensions. ROE: 11.0%. US$/kWh
No grants. Equity finances 61%, loans 39% (BC: grants 62%, loans 27, equity 11%). Negative at
An average tariff of about 0.62 US$/kWh would avoid injection of funds during operation
0.513
(except for network extensions). But ROE would be negative at that tariff. ROE of 6.0% would
US$/kWh
require tariff of 0.70 US$/kWh.
100% grant financing of preparatory cost, PV components and diesel generators. (Base Case:
prep. costs 50%, other 75%) and performance grant of 500 US$ per customer (same in Base
Case). Financing of network: 50% loans, 50% equity (Base Case: 75%, 25%). Grants then 22.5% at
finance 75%, loans 18% and equity 8% (Base Case: 62%, 27%, 11%). 0.513
The average tariff would of 0.467 US$/kWh (excluding VAT and levy) would then produce the US$/kWh
Base Case ROE of 10.2%. But that tariff would require the injection of funds during operation.
To avoid that except for network extensions the tariff has to be 0.47 US$/kWh. ROE: 11.2%.
Lifetime of diesel 12 years (Base Case: 10 years) 10.3%
Lifetime of diesel 8 years (Base Case: 10 years) 9.6%
2% annual devaluation of exchange rate in real terms (Base Case 0%) Negative
Diesel-PV Hybrid System with Storage Capacity
If in the Base Case with an average tariff of 0.513 US$/kWh storage capacity is added (1,679 kWh),
the ROE declines to 8.1%20
. While the ROE could perhaps be accepted by the investor, the scenario
has the shortcoming that substantial funds would have to be injected in 2019 for the network
extension (in total about 200,000 US$ in the 16 villages) and in 2022 for the battery replacement (in
total about 350,000 US$ in the 16 villages). Relatively small amounts (about 30,000 – 40,000 US$)
would also have to be injected in 2020 and 2023. To avoid having to inject funds during operation,
the tariff must be about 0.58 US$/kWh. The ROE would then be high (20%) and even still attractive
(13.7%) if no residual value were paid.
The same ROE as in the scenario without storage (10.3%) results if, for example, the tariff is 0.524
US$/kWh and no residual value is paid in 2025 or if the tariff is 0.544 US$/kWh and only 50% of the
residual value is paid. The second solution would almost certainly be preferred by the investor
because much less funds would have to be injected in 2019 and 2022. 20
The result assumes that no separate charge controller is necessary. The inverter controls the charging and discharging process.
37

Final Report – Support Study on Green Mini-Grid Development
The presented results are based on the assumption that no grants would be made available for the
network extension in 2019 or the battery replacement in 2022. The investor is assumed to inject
equity into the project to cover the otherwise resulting cash deficits. In reality, loans could be used to
avoid the cash deficits. Depending on the loan conditions that could improve the financial
performance of the project but unless the loan conditions are very favourable, the improvement
would not be dramatic.
Table 6: Mini-grids supplied by diesel-PV systems – Results of scenarios
SCENARIO ROE
WITH STORAGE CAPACITY
Base Case. Average tariff of 0.544 US$/kWh. The tariff requires injections of about 20,000 US$
in 2019 for the extension of the distribution network and of about 155,000 US$ in 2022 for the 10.3%
replacement of the batteries. ROE assumes that only 50% of residual value is paid.
No extension of the distribution network in 2019. 11.3%
Battery cost 200 US$/kWh (Base Case: 250 US$/kWh) 11.2%
Diesel consumption 0.30 l/kWh (Base Case: 0.25 l/kWh) Negative at
The tariff would then have to be about 0.60 US$/kWh (excluding VAT and levy) in order to 0.544
avoid higher injections of funds in 2019 and 2022 than in the Base Case. ROE: 10.4%. US$/kWh
Demand 10% lower (PV production unchanged). 4.9% at
The tariff would then have to be about 0.58 US$/kWh (excluding VAT and levy) in order that
0.544
the funds which have to be injected for network extensions and battery replacement are in
US$/kWh
total about the same as in the Base Case. ROE: 11.6%.
No grants. Equity finances 62%, loans 38% (BC: grants 62%, loans 26, equity 12%).
An average tariff of about 0.62 US$/kWh would assure that the funds which have to be Negative at
injected for network extensions and battery replacement are in total about the same as in the 0.544
Base Case. But ROE would be negative at that tariff. ROE of 6.0% and payment of 100% of the US$/kWh
residual value would require tariff of about 0.71 US$/kWh.
38

Final Report – Support Study on Green Mini-Grid Development
ANNEX 1: RE-FiT Structures in some key African Countries
39

Final Report – Support Study on Green Mini-Grid Development
REFiT structures
RWANDA KENYA TANZANIA
Payment basis Cost plus return before any CDM Benefit Generation cost plus return on equity (12% post tax) Avoided cost (based on the long run marginal cost
Payment duration Negotiable 20 years 15 years
Payment Structure Fixed Fixed Floor= price at the contract's signature. Cap= 150 o
Grid connection cost Grid or minigrid operator pays the interconnection and recovers Paid by the generator or made by TSO and recovered through the
Generator pays for the connection cost
costs from pass-through tariff
Amount purchased Negotiable Guaranteed purchase if technical requirements are met. Priority
100%
dispatch
Purchasing entity TSO or third party National TSO KPLC TANESCO and IPPs, wholesale or retail
Comodity purchased Electricity and CDM unless otherwise negotitated Electricity Electricity
Tariffs are adjusted to US$ PPI and differential inflation on a annual
Triggers and adjustments basis. Revision of the policy after three years while tarif can only be Review of the policy every three years Recalculated every year on the basis of the budget
adjusted upwards
Contracts issues Negotiated on a case by case basis Negotiated on a case by case basis Standardised PPA
Rwandan Franc equivalent to US$ Rate: tariffs are defined in US$
Payment currency and related risks unless the project is financed in local currency. Actual payments are
FiT denominated in US$. Payment offered in USD, EUR, or KES Tanzanian shilling: full exposure to currency risk f
made in local currency converted on the basis of current FX rates. investors and external funding
High Currency Risk for foreign investors
Interaction with other incentives None None None
Source: Report “Powering Africa Through Feed-in Tariff”, World Future Council, Feb. 2013
40

Final Report – Support Study on Green Mini-Grid Development
ANNEX 2: Cash-Flow Tables of Analyzed Projects / Programs
The tables presented in this annex for the Mwenga and ENNy Projects do not cover the whole period which has been analysed which is the period 2008 - 2032.
The tables for the gasifier program and the diesel-PV hybrid systems cover 10 years of operation which is the assumed lifetime of the gasifiers and the diesel generators respectively. In sensitivity analyses, other lifetimes have been analysed.
41

Final Report – Support Study on Green Mini-Grid Development
2.1 MWENGA HYDRO PROJECT (TANZANIA)
42

Final Report – Support Study on Green Mini-Grid Development
2.2 ENNy HYDRO PROJECT (RWANDA)
Comment: Net equity flow is positive from 2019 onward when the loans have been repaid.
43

Final Report – Support Study on Green Mini-Grid Development
2.3 GASIFIER PROGRAM The gasifier projects would supply 16 development centres in Tanzania as part of the off-grid electrification program.
44

Final Report – Support Study on Green Mini-Grid Development
2.4 DIESEL – PV HYBRID SYSTEMS The cash-flow table is for the diesel-PV systems without storage capacity. The hybrid systems would
supply 16 development centres in Tanzania as part of the off-grid electrification program. The centres
are the same as the ones which would alternatively be supplied by the gasifier projects.
45

Final Report – Support Study on Green Mini-Grid Development
Chapter 5: Best Practices for Implementation & Operational Management
TABLE OF CONTENTS Key Highlights ____________________________________________________________________ 3 1 Implementation Models and Some Good Practices __________________________________ 7
1.1 Introduction _____________________________________________________________ 7
1.2 Key Elements for Successful MG Implementation _______________________________ 8 1.2.1 Finance raising (project preparation, initial investment and re-investment) ________ 9 1.2.2 Design & engineering ___________________________________________________ 11 1.2.3 Construction __________________________________________________________ 12 1.2.4 Power generation & rural distribution models _______________________________ 13 1.2.5 Assets’ ownership ______________________________________________________ 14 1.2.6 Sustainable Operation and Maintenance (O&M) _____________________________ 15 1.2.7 Load demand characteristics _____________________________________________ 15 1.2.8 Electricity sales & payment collection ______________________________________ 16 1.2.9 Governance ___________________________________________________________ 16
1.3 Examples of Good Practices per Actor & Business Model ________________________ 17
1.3.1 Public institutions ______________________________________________________ 18 1.3.2 Private sector (profit-oriented) ___________________________________________ 19 1.3.3 Local community & institutions (non-profit oriented) _________________________ 24 1.3.4 End-users _____________________________________________________________ 27
1.4 Examples of Good Practices per Technology ___________________________________ 28
1.4.1 Diesel-based Mini-Grids _________________________________________________ 28 1.4.2 Hydro-based Mini-Grids _________________________________________________ 29 1.4.3 Biomass-based Mini-Grids _______________________________________________ 31 1.4.4 Hybrid Mini-Grids ______________________________________________________ 31
2 Good Practices in ICF Priority Countries __________________________________________ 32
2.1 Kenya __________________________________________________________________ 32
2.2 Tanzania _______________________________________________________________ 33
2.3 Mozambique ____________________________________________________________ 34
2.4 Malawi _________________________________________________________________ 35
2.5 Rwanda ________________________________________________________________ 35
2.6 Uganda ________________________________________________________________ 36
2.7 DRC ___________________________________________________________________ 36 3 Annexes ____________________________________________________________________ 37
3.1 References and Bibliography _______________________________________________ 37
1

Final Report – Support Study on Green Mini-Grid Development
LIST OF TABLES AND FIGURES
Figure 1: Risk profile of a MG project (AFD-IED, 2012) ..................................................................... 9 Figure 2 : Micropower Plants for Telecom (www.omcpower.com) ................................................. 30
Table 1: Various forms of public-private partnership for MG ........................................................... 4 Table 2: Mini-grid experiences and business models in ICF countries ............................................... 6 Table 3: Some key barriers for power generation and rural distribution ......................................... 14
2

Final Report – Support Study on Green Mini-Grid Development
Key Highlights The international review of existing GMG in Chapter 1 has highlighted that there are some sporadic
experiences of mini-grids in several countries, and to some extent with renewable energy sources,
but there is actually not enough practices to extract the so-called “best practice approaches” for MG
construction, operation and maintenance, as required in the TOR.
The same concern can be expressed with “successful MG scheme”. Even if a MG case study is found
to be “successful” (appraisal linked to information availability and to the angle of analysis (technical,
social, economic, financial)), the same case might become unsuccessful or unviable if new
information are collected or if bad progress arises after a while.
What is realistic at this stage is to provide some lessons learnt and success factors from the current
practices and some do’s & don’ts for GMG implementation and operation management. The key
elements to be addressed in MG implementation include financing, design, construction, operation,
maintenance, sales and billing but also ownership, support, monitoring and other governance issues
(tariff, contracts, permits, impact assessment, etc.). Evidence on key institutional, management and governance elements As well as continuing to provide long term sustainable service
One of the major findings is that MG projects which operate today in Africa are often those which
have a strong public and utility involvement. The attempts to promote the private sector to deal with
rural electrification, and in particular with mini-grids, have not been “successful” enough to be
replicable. There are still many barriers that impede the participation of private entrepreneurs and
investors and the scaling-up of MG market – related to the fact that, as the economic and financial
analysis has shown in Chapters 3 and 4, payback periods are long and all the risks along those 8 to 10
years: technology risks, commercial risks, are perceived as being very/too high by private sector
players. Today, private sector participation is being sought for mini-grid development, with different
levels of private sector collaboration. In Africa, the most common model emerging nowadays for off-
grid electrification is the mixed public-private model (PPP) where the investments are mainly
supported by public funds and the daily operation is handled by private enterprises. However, a wide
range of other MG implementation schemes and business & financing models have been
experimented in various countries (different institutional contexts) and this chapter aims to analyse
the different MG implementation approaches and their acceptability for African conditions.
Forms of PPP collaborations can be distinguished by the proportion of private sector involved in investment and operation & maintenance of a mini-grid:
3

Final Report – Support Study on Green Mini-Grid Development
Table 1: Various Forms of Public-Private Partnership for MG
INVESTMENT O&M COMMENT Public Public Utility managing a mini-grid in a Provincial capital – e.g. Burkina and
Sonabel
Public Private Management contract, which can / should be performance based.
Public / Private Private If the proportion of private sector investment is high enough, this leads to performance. If there is a 90% investment subsidy, incentive for private sector performance is more dubious.
Private Private Such cases of mini-grids for rural electrification probably do not exist in Africa, unless considering NGOs mobilising mostly grants, and the community ensuring collections and covering maintenance costs. In such cases, one is more at a micro grid, low tech level. On real commercial terms, such mini-grids do exist but essentially for self consumption.
However, a wide range of other MG implementation schemes and business & financing models have
been experimented in various countries (different institutional contexts) and this chapter aims to
analyse the different MG implementation approaches and their acceptability for African conditions.
A Mini-Grid by nature includes the power generation and the distribution which:
- Require different skill sets and organisation: distribution is basically quite low tech, requires
reliable manpower and good customer relations (with the aspect of new technologies
handled in Chapter 7). A company engaging as an EPC and possibly operator of a generation
unit, will need qualified and skilled manpower at least during construction, and even if
operation does not require highly skilled staff at the plant site (e.g. hydro or PV hybrid), in
case of problems, one needs qualified staff and access to spare parts.
- Have different lifetimes and payback periods – a network is 20 to 30 years, while the investor
in generation wants a payback – in Africa between 3 and 8 years (a problem for hydro and
PV). A distribution network (which has to be built as per standards allowing for grid
connection) has a life time of 20 years if not more, with payback periods not acceptable to a
private investor. This is by nature a public sector investment.
A significant distinction is done in this chapter between generation and distribution for which specific
actors and business models can be considered. The power generation is characterised by a higher
technology level than distribution and may require high level skills to operate and to maintain, in
particular if renewable energy sources are used. While the rural distribution, including network
maintenance and customer management, is another job and can be more easily managed by local
skills. Hence, an investor may be interested in the generation side of the mini-grid project, but
without the typical distribution side typically.
The appropriate organisation scheme (level of profitability, skills, training, spare parts, etc.) for power
generation will depend on the selected technology and its degree of complexity. The prospect of
grid-connection in the future can strongly affect the business model and the profitability of the
operators/investors. In some specific cases, as for micro-grids or very remote small mini-grids, the
4

Final Report – Support Study on Green Mini-Grid Development
community approach for operation (with sporadic technical and financial support) can be considered as a more viable option. On the end-consumer’s side, they can also play a key role in the success and viability of the MG:
- their connection and their willingness to pay can be encouraged despite their low income, - their involvement in tariff setting (if allowed) or in social acceptance of tariff scheme, - their commitment through initial contribution (in-kind or cash), - their solidarity & responsible behaviour for proper and safe use of equipment
Evidence for successfully raising finance and completing construction
Raising finance is the most obvious difficulty. The reality of GMG in Africa is that those which exist
are basically for the captive use of (agro) industries, and the rural electrification dimension is limited
to supplying a service to employees working for the agro-industry. Even in these situations, most
“projects” have benefited from support at the project feasibility stage and support during
construction.
The issues of raising finance can be addressed from two approaches when considering a private mini-grid:
The figure below illustrates the first approach where the risk profile of a project requires grant support as well as soft loans matching the project returns’ profile.
Figure 1: Risk Profile of a MG Project (AFD-IED, 2012) The development phase often requires 80 to 100% grants as though the funds required are low, the
success rate is not very high. During construction, the investor is very exposed, but if the upstream
work is done, risks will be declining. Insurance during construction is welcome.
The risks will decline as the investment is reimbursed and risks related to the revenue streams can be
divided into technology – and here for GREEN mini-grids for RE, (except for hydro probably) the risk
does remain high; resource risk (hydrology, price of biomass) and “PPA” or revenues, e.g. the off-take
of the distributor. A private investor may not be willing to take on these combined risks beyond a few
years, and creative thinking is required for sharing some of those risks.
5

Final Report – Support Study on Green Mini-Grid Development
The second approach is that of the credit worthiness of the investor. Those interested in mini-grids
often do not have the assets to go for balance sheet financing and project financing is seldom
available for such small projects. Innovation is required here. Approach to ICF countries
The analysis of major business models for MG experimented in the ICF priority countries confirms the variety of existing implementation models, but the dominant ones are the hybrid model mixing
public (agency or utility) and private, as summarised in the following table1.
Table 2: Mini-Grid Experiences and Business Models in ICF Countries
MG
Kenya
Tanzania
Mozamb.
Malawi
Rw
Ug
DRC
Dominant REA+Utility
REA+Utility FUNAE + Utility & Utility REA Utility &
business model & Privates Committee Community & Privates & Privates IPPs
All 7 ICF priority countries have reasonable experience with diesel-based mini-grids through a
dominant top-down approach led by the government, RE agencies or utilities. Experience with
renewable energy-based mini-grids is essentially limited to micro and mini-hydropower schemes.
Only Kenya has put serious effort to implement demo GMG projects in solar and wind. To some
extent, those institutional developers have been leant on private entrepreneurs or local communities
for daily operation and maintenance. Some other models have been experienced beside
government-led approach, initiated by private initiatives, NGOs, charismatic associations, or
international organisations. The general findings from our analysis in African countries can be summarised as follows:
- No scalable business model for mini-grids has been rolled out yet
- Most of the mini-grid deployment efforts are led by the Government, Donor and NGO with a strongly regulated approach
- Strong reluctance of private operators to invest in off-grid village electrification and in GMG
- Policy frameworks are yet to be developed or adapted for off-grid and for mini-grids, except for Tanzania
- Regulatory environment is slow to develop and to adapt (complex or inadequate
administrative procedures) - Lack of awareness and capacity of institutions to implement large scale mini-grid programme
1
Additional information on policy & regulatory frameworks, tariffs & financing instruments, and private sector participation will be presented in a similar comparative table in Chapter 6.
6

Final Report – Support Study on Green Mini-Grid Development
1 Implementation Models and Some Good Practices
1.1 Introduction
Based on IED experience in Africa and Asia, on CLUB-ER members (25 African countries) and on
literature review, there are clear indications that to reach sustainability, an ideal implementation
scheme for mini-grids (MG) should have a subtle mix of the following ingredients:
- On one hand, the private sector could play a decisive role in implementing and operating
mini-grids, as well as in co-financing initial investment and further re-investments. A strong
management is mandatory for MG project success.
- On the other hand, local communities and ‘local NGOs’2 should be informed, made aware,
mobilised and committed to ensure proper use of equipment and to allow efficient private sector business (high money collection rates, conflict settling, etc.).
- In between, the public institution should also play a key role in the promotion, assistance,
finance raising, regulation and supervision but not in implementation and operation of MGs.
- In addition, key institutions such as technical colleges, universities, NGOs, associations,
cooperatives, etc. are worth to be involved for local support and capacity building
programmes.
In practice, as rural electrification activity is usually a national development goal in the hands of
government institutions, the public sector together with the national utility (often State-owned or
parastatal) are commonly leading on all the implementation process, while the private sector and
local communities are poorly involved. In many countries, this public/utility model is found to be the
easiest to implement and can somehow work. Unfortunately, the public sector and its Utility are
rarely cost-effective and concerned for value-for-money as the money comes from international
donors and the government. Current Utilities are strongly centralised and can hardly mobilise skilled
staffs and other resources for remote customers; their technical and commercial management is
poorly efficient in rural areas (low service quality, low collection rate). Moreover, institutional
corruption is an omnipresent blight. Sustainability in the long term is therefore questionable when
institutions are too heavily involved in the implementation process. This general statement is
confirmed by an ongoing study on mini-grids conducted by ASD/MARGE in East Africa on behalf of
EUEI PDF-REN21-ARE.
Somalia is an interesting counter-example as the government is not involved in rural electrification,
neither in rural development, and consequently the national private sector is very well developed
and strongly active in many fields but without any regulation. Diesel gensets are for instance widely
scattered all over the country. A similar situation is found in Cambodia.
The key for success would be therefore a tricky mix of those 3 categories of actors in the MG
implementation process: the national institutions shall remain key players in any large scale rural
electrification programme; their regulatory role and their technical, managerial & financial support
2
Local NGOs (non-governmental organisations) are referred here as any non-profit local organisations such as local associations or cooperatives active in the target area.
7

Final Report – Support Study on Green Mini-Grid Development
for private sectors and end-consumers are essential. However all costs and subsidies must be
minimised to reach wide electricity access in rural areas (still more than 80% of the population lack
access to electricity in most Sub-Saharan African countries and could not be supported by 20% grid
connected ones). Private sector and local communities can play a key role in scaling up (at lower
costs) the use of mini-grids for rural beneficiaries.
A recent international workshop was hold in Kathmandu, Nepal, on 6-7 Feb. 2013 on “Sharing
Business Models and Scaling up Mini-grids in Asia and Pacific” (Energy For All – ADB). The workshop
aimed to review the success factors of mini-grid projects within and outside Asia and the Pacific, and
to showcase how mini-grid barriers can be addressed and offer a way forward for deploying
successful models at scale.
1.2 Key Elements for Successful MG Implementation
There are many different possible business schemes to implement and to operate mini-grids in off-
grid regions. But there is no indication that one existing model is more successful (i.e. cost-effective
and sustainable) than another in general, independently of the context and the demand
characteristics. There are no standard best-practices as such, ready for replication.
Moreover, the generation part and the distribution part of a mini-grid have different characteristics and can lead to different implementation and management schemes.
The stakeholders involved (see item 1.3 below), the technology choice (see item 1.4 below), and the
policy and regulatory framework in place (Cf. Chapter 7) also play a decisive role in the model choice.
Financing will be a major barrier even after policy environments are greatly improved.
The key questions/elements that need to be addressed in any MG implementation model can be listed as below.
1. Who finances project preparation, initial investment and further re-investment? 2. Who designs? 3. Who builds? 4. Who generates and who distributes? 5. Who owns the assets? 6. Who operates and maintains (O&M)? 7. Who stimulates the latest demand? 8. Who sells electricity and collects money? 9. Who deals with the governance elements? In particular:
o Who set & regulates the tariffs?
o Who regulates & validates contractual issues? o Who supervises and monitors? o Who undertakes assessment of social, economic and environmental impacts?
This long (and non exhaustive) list of questions above highlights the difficulty to develop business
models or “archetypes” of mini-grid operator. Each project follows somehow a specific model. Those
questions are discussed hereafter and will be illustrated in items 1.3 and 1.4.
8

Final Report – Support Study on Green Mini-Grid Development
1.2.1 Finance raising (project preparation, initial investment and re-investment)
Innovating a combination of loans and donations for better risk sharing of projects and maximizing leverage from the rare resources available as subsidy.
In view of the economic characteristics of electricity-access projects, the subsidising of financing is a necessity, whereby the subsidy component should aim in particular at:
Reinforcing capacity: that of institutional and regulation frameworks; capacity of new technology;
capacity of managing local operations; training of bank staff;
Preliminary studies and strategic planning: resource inventories; feasibility studies whose cost can be reintegrated into the project financing when it is implemented;
Supporting implementation: financial package, engineering and implementation studies, project oversight, reinforcing operator capacities;
Supporting investment: risk sharing, adapting the terms financial aid to the economic and financial profiles of the project (duration, rates, grace period), and investment subsidies).
Figure 2: Risk Profile of a MG Project (AFD-IED, 2012)
The uncertainties and risks related to projects for general electricity access, rural electrification, or developing renewable energy sources are manifold:
- Project risks: These are mostly technical. The first technical risk concerns resource availability and
its uncertainties (hydrology, weather, wind, insulation, availability of biomass). Studies—often
long and expensive—are thus needed for evaluating these aspects and for allowing the
implementation of renewable-energy projects. The second technical risk is related to
construction, in particular to civil engineering in the case of hydroelectricity; this risk carries with
it a real risk of cost overruns.
9

Final Report – Support Study on Green Mini-Grid Development
- Project context risks: For these, it is necessary to carefully analyse the anticipated demand and
the speed of its development. In fact, the regulatory framework for buy-back tariffs or access by
third parties to the grid commonly provides a visibility over only a few years, whereas the return
of a project is over at least five years and eight to ten years for an interesting profitability. Finally,
a last contextual project risk is related to the low level of experience, both technical and for
project management, of local operators that launch into this type of new operations.
- Counterpart risk: In view of the above-listed elements, many standard commercial or
development banks are hesitant when faced with such new projects. They often do not have the
required competence, the instruments for long-term loans, or the capability of evaluating and
financing such projects. They then focus on counterpart quality, demanding high guarantee levels
based on a standard analysis of companies asking for loans.
Under such circumstances, the structures that finance access—or the REF—should mobilise loans and
assign donations, in order to improve the profitability level of the project, thus increasing its interest
for potential donors.
To do so, one should draw up a list of priority projects in coordination with the planner, based on
economic and social considerations and on territorial development imperatives. These projects then
must be analysed on their profitability as well as their "versatility", in order to make a realistic
decision in view of the available resources, which portfolio can be developed and supported. Initially,
it may be necessary to subsidise or pre-finance some studies whose cost can later be reintegrated
into the overall project financing. In addition, it might be useful to carry out strategic opportunity
analysis of new technologies, such as hybrid PV-diesel, or biodiesel as a fuel for rural electrification.
This will show priorities to potential investors, for subsidising innovative projects with a
demonstration or teaching character at a suitable level, thus reckoning upon a lowering of long-term
costs. Subsidies will be needed for social projects, in the understanding that such operations have
little or no hope of a return.
The training and education of bankers, operators, national contractors, etc., must also accompany
the setting up of suitable instruments for a partial guarantee, encouraging them to become involved
over the long term and to assume the project or counterpart risks, which they would otherwise
refuse. In a context of private investment, where equity input is lacking, it might be conceivable to
invest in the capital of certain operations.
In view of the stakes of electricity-access development and of its financing perspectives, it is thus
necessary to rethink the structuring of rural and peri-urban electrification projects. Only then will it
be possible to arrive at a most efficient use of subsidies, as these are necessary for such projects that,
even when very well structured, have little chance of becoming profitable in an urban and industrial
setting. However, such—quite scarce—subsidies must be used in as reasoned and targeted a manner
as possible for financing the unprofitable aspects of a project, thus allowing a conciliation between
equalization and financial balance. Other key issues on financing are:
The project preparation process is a critical part of the finance raising and risk mitigation. It
should (i) assess the sponsor/investor capabilities and the local power resources, (ii) conduct
10

Final Report – Support Study on Green Mini-Grid Development
techno-economic feasibility and market studies; and (iii) provide support for latent demand
development. Financing mechanism for project preparation is usually grants from either
government or donors, and doesn’t have major risks.
Different financing mechanisms exist for initial investment in GMG such as fiscal incentives,
soft loans and grants. They are well-known and necessary instruments to attract private
operators to allow more profitable operation with a green mini-grid than running diesel-
based MG and eventually to reduce retail tariffs if allowed by the national policy framework.
Increased confidence and awareness of local commercial banks/micro-finances and effective
risk mitigation are also needed in addition to financing mechanisms (Ex. in Kenya and
Tanzania, despite credit lines in place, local banks are reluctant to support some renewable
energy projects (Hankins, 2013)). The key actions should include (i) increased awareness of
what works and technology familiarity, (ii) preparation of projects in a form that banks can
lend to, and (iii) credit enhancements that allow the banks to engage.
Off-grid projects are of a size where donors could make a big difference by adding financial
stability and reducing the risks of promoters – in consortium with domestic investors and any
grant or loan scheme from microfinance. Some finance institutions can also play a role in
engaging in local community development and revolving funds. (SEI, 2012)
Local contribution from beneficiaries is usually around 10-20% of the investment in recent
African rural electrification projects. Generally, domestic customers will contribute with the
payment of the in-house installation (standard wiring, plugs and light points). In some cases,
in-kind contributions are also included (labour, land, local material).
For consumers, micro-finances and access to soft loans can facilitate investments in productive equipments (mills, pumps, compressors).
Re-investment capacity is crucial for long term sustainability, when the growing demand
exceeds the production or when equipments come to their end-of-life. This should be
considered at the early stage of the project implementation. Long term fund with specific
disbursement mechanism could be included.
1.2.2 Design & Engineering
Some technology specific aspects for MG as design, construction, O&M need to be handled differently for the particular technology (hydro, biomass, wind, solar, hybrid).
Proper design of GMG using renewable energy sources, in particular hybrid systems, is not an easy
task. Project developers are often externalising this task or being assisted. Depending on the market,
local consulting expertise may not be available and more expensive international technical services
are required. The GMG configurations should take into account the local energy resources, the
power demand profile, the load factor, the capacity to pay, the local O&M skills, the harsh
environment and the perspective of final grid-connection (based on grid extension plans).
For hybrid or multi-source systems, the demand assessment and load forecast is crucial to determine the best scenario for power supply (24/24h for all clients or adapted patterns per category) and to
11

Final Report – Support Study on Green Mini-Grid Development
optimise the least-cost design. Energy efficiency and saving measures are of utmost importance to reduce the demand.
For instance with hybrid solar/wind systems, adding a small diesel genset as back-up can avoid expensive over-sizing of renewable sources to maintain reliable power supply.
Integrating the use of advanced and cost-effective smart technologies in the design could ease the management of energy supply/demand, of payments and monitoring.
If the MG design experience & skills at national level are found not appropriate, technical assistance & capacity building support will be required.
Some key references could be useful for design assistance. A specific document on “Design of PV-
Hybrid Systems in Mini-Grids” is under preparation with IEA - T9 group. An old but valuable low-cost
mini-grid electrification “Mini-Grid Design Manual” has been edited by the ESMAP-WB in 2000 with
interesting review of low-cost distribution grids. Recently the IEC (International Electro-technical
Commission) has published “Recommendations for small renewable energy and hybrid systems for
rural electrification” (IEC 62257) dealing with mini-grids and is preparing a White Paper on “Micro-
grids for disaster preparedness and recovery”, dealing with grid-connected as well as isolated mini-
grids. Key conclusions and recommendations will be relevant for all mini-grids and will show how
standards can support mini-grids, and where standards are essential.3
Designing as well as implementing and operating one solar hybrid or one gasifier MG or one micro-
hydro plant is proving extremely costly, in particular if all skills have to come from abroad. GIZ has
supported intensive training programme on biogas in Kenya. Sri Lanka has developed autonomous
local skills to design and implement their micro hydro programme (nowadays all hydro sites have
been equipped). 1.2.3 Construction
A green mini-grid includes a renewable energy generating plant with a distribution network. Its
construction and installation is in most cases the responsibility of private companies. While civil
engineering is contracted to local enterprises, the installation of equipments is better done by the
supplier.
The lack of capacities is often the main barrier during the construction phase of green mini-grids, in
particular for the renewable energy based generators. Few countries as Kenya and Tanzania, active
for a long time in hydropower, have developed skills in design and construction of SHP plants. But for
more recent technologies as gasifiers, wind and solar, there is a need for technical support from
either international consortium, or from collaboration with a technical colleges/universities.
Engineering-Procurement-Construction (EPC) contract arrangement for the whole MG would be
advisable as the contractor would be responsible for the engineering design to ensure that the
installed MG scheme will perform efficiently. However such local turnkey contractors, with design
and construction skills, are rarely available in Sub-Saharan Africa as the work covers various
3
https://cleanenergysolutions.org/initiatives/minigrids
12
Final Report – Support Study on Green Mini-Grid Development
competencies (civil work, power generation, distribution). Local entrepreneurs could also be reluctant to subcontract other local companies for complementary works.
Therefore, most off-grid or MG projects are implemented either by the utilities (who have these
overall skills and their network of proven sub-contractors) or by international companies who will
hire to some extent some national private services.
Depending on how the project is initially designed, the local community can also contribute during
the construction with labour and local materials (in-kinds), as in micro-hydro projects in Sri Lanka
where community involvement has been strongly promoted. 1.2.4 Power Generation & Rural Distribution Models
A Mini-Grid scheme includes the power generation and the distribution parts, both having
intrinsically different characteristics (technologies, spare parts, cost, lifetimes, profitability, and
skills). It is important to highlight their differences before looking at possible business models. The MG power generation has the following characteristics:
- Higher technology level than distribution network requires specific skills to operate and to
maintain, in particular if renewable energy sources are used.
- The CAPEX & OPEX costs and the degree of complexity of the technology will influence the organisation scheme for the MG operation.
- Appropriate regulatory framework supporting off-grid generation often exists through
IPP/PPA arrangements and reduces management risks. - Private developers can more easily invest and safely recover their stakes
- There is a wide range of implementation models that can fit with local conditions: IPP, BOO,
BOT, concession, utility, etc.4
- The prospect of grid-connection in the future should be considered as it can strongly affect
the business model and the profitability of the operators/investors. The rural distribution has the following characteristics:
- Rural distribution management basically includes network maintenance and customer
management. This is clearly a different job that can be more easily managed by local skills.
- The distribution is less-demanding technically but is much more risky as the revenue is strongly dependent on the electricity sales to consumers, mainly domestic households.
- Private developers investing in distribution and becoming a rural distributor would prefer
having reliable ‘anchor customers’ with a more reliable load than domestic one (Cf. item
1.3.2).
- There is also a wide range of models dealing with power distribution: off-takers, DISCO, ESCO, NGO, concession, utility in off-grid areas.
4
cf. UNEP/EUEI study in Kenya, Tanzania, Rwanda and Malawi, PACEAA, 2010
13

Final Report – Support Study on Green Mini-Grid Development
Table 3: Some Key Barriers for Power Generation and Rural Distribution
Power Generation Power Distribution
Fuel-MG High OPEX (O&M costs) Tariff scheme vs. running costs
Fuel supply & reliability issues Money collection
Limited service duration Customer management
Grid network O&M
GMG High CAPEX
Variability of renewable resources Productive uses
Technology complexity vs. local skills Community involvement & skills
Capacity upgrading Private sector involvement & support
Spare part availability
Sustainability & reliability issues
As shown in the above table, the barriers of both activities are very different and thus also their risks and profitability.
Either those 2 activities are merged or separated will depend on how the MG project is initially
designed (following which model) and what is the enforced regulatory framework for such off-grid
schemes.
Therefore, in a simplified view, 2 types of operation schemes can be considered:
- 1 operator dealing with power generation & distribution, as well as commercial sales
activities
- 1 operator for generation, usually called IPP, and one operator for distribution or called as the ‘off-taker’
Private sector interested in off-grid electrification would be more attracted by the 2nd model where they become an IPP with fixed tariffs and obligation for off-takers to buy all or part of the production.
The IPP and Off-taker5 model (either private or community entities) will be described in item 1.3.2.
1.2.5 Assets’ Ownership
The ownership of MG equipment, both distribution network and generating plant, is not always
clearly stated in projects and for sustainable operation, it is important to determine who will repair
or replace components and re-invest. (ARE 2012; Yadoo 2012; Stiftung 2013; Cooper 2013)
State-owned mini-grids are rather common in African countries as long as the government
has initiated most of the MG programmes and invested in infrastructures to electrify its
remote centres. The MG management (O&M) is afterwards taken over by a utility (uniform
tariff) or a local entrepreneur/operator/association (breakeven tariff).
5
Power off-taker: private or community entity in charge of power distribution to another private retailer/consumer or to community consumers
14

Final Report – Support Study on Green Mini-Grid Development
If a private operator is the owner, meaning he has contributed to the investment cost, the
tariff structure should be ‘financially viable’, i.e. designed to cover the running costs, the
depreciation of all system components and a reasonable margin to allow for sufficient return
on investment. Ownership could also be temporary over a fixed period in concession model.
Community ownership has also been experienced in few projects but the lack of financing
creates problems for special maintenance operations, continuing capacity building/training
or for re-investment to meet growing demand.
1.2.6 Sustainable Operation and Maintenance (O&M)
Long term sustainable operation of MG is one of the key challenges in rural African areas mainly
because of insufficient tariffs and low level of technical and managerial skills (rarely available outside
main towns, in particular in Africa). Integrating renewable energy sources in mini-grids increases
those 2 barriers. Private professionals coming from nearby towns have higher wages and are more
volatile.
Indeed, the fees or tariffs for off-grid settlements should be ideally set to cover at least the MG
running costs and as far as possible the replacement costs. But it is clear from various experiences
that either low capacities to pay or low tariffs (regulated/cross-subsidised) in rural areas don’t allow
such cost recovery if MG are powered with diesel gensets.
The level of local technical and managerial skills is another barrier for efficient and durable operation
of a MG scheme. As for “Construction” described above in item 1.2.3, bundling O&M contract with
an EPC contract would allow stronger commitment over the contractual period with a better service
quality and more effective guarantees; the contractor would work together with the supplier, the
builder, the operator and the maintainer, even if commercial management of customers can be
outsourced to a locally implanted entrepreneur. However, as mentioned earlier, this kind of national
turnkey contractors are hardly available in our African regions. In case of international procurement
of good & services, a maintenance & management contract over several years allows progressive
transferring of O&M skills to a local operator.
Another way to get skilled support for O&M is to have partnership with national key institutions such
as universities or technical colleges who can provide long term and reliable assistance during the
period. Indeed there are numerous international programmes having reinforced capacities of those
national institutions in the fields of renewable energies and rural electrification, including
management, O&M training, monitoring and socio-economic impact assessment. 1.2.7 Load Demand Characteristics
The power supply schemes for a MG can have different profiles depending on the load
characteristics (domestic and non-domestic needs, load profile, expectations, capacity to pay,
commercial activities and productive uses, load forecast, etc.):
- Only few hours of service during the evening (often the case with diesel-based gensets);
exclusively for domestic needs;
- double service with few hours during day-time and evening-time (diesel gensets, biomass or
hybrids); basically for small day-time commercial activities and domestic needs;
15

Final Report – Support Study on Green Mini-Grid Development
- “half-day” service with 10 to 14 hours continuously (hydro, biomass, solar, wind, hybrid)
- “full-day” service (hydro, biomass, solar, wind, hybrid) if more intensive commercial activities
exist.
Thus the choice of model for MG implementation (management organisation, tariff structure,
compensation mechanisms, etc.) will also depend on the load demand characteristics and its
evolution.
The cost-effectiveness of a MG is closely linked with the utilisation factor of the power plant and with
the total amount of energy sold to the customers when power is available. Productive uses can also
have a crucial impact on the long term sustainability of mini-grids.
In rural areas, the demand growth rate and the connection growth rate are also crucial for the
viability of the systems and its expandability. Stimulate the connection and the latent demand, in
particular income generating activities (IGA), are not an easy task; specialised local associations,
NGOs, committees could be involved to encourage connections and consumption to ensure optimal
matching of power supply and demand, and maximum socio-economical impacts.
Demand-side management (DSM as energy savings, ‘peak shaving’, ‘peak shifting’) by a local
committee or similar can also help in improving the plant utilisation factor and the profitability of the
operator. 1.2.8 Electricity Sales & Payment Collection
Electricity billing and money collection have been time consuming and costly in remote rural areas, as
well as customer management (connection/disconnection, anti-fraud controls, meter reading,
troubleshooting & ASS, etc.).
A wide range of management schemes have been experienced in all mini-grid projects. For example,
the flat rate tariff (as fee-for-services) was often adopted in MG projects either because it simplifies
the billing system (no meter) or because it bypasses constraining regulation where kWh tariffs are
uniform and too low.
Over the last decade, innovative and affordable technologies have emerged in the African market
and greatly facilitate the management of rural customers. Prepayment meters are becoming the new
standards for both urban and rural customers in Africa; only large customers get traditional meters.
Today the use of GSM network allows remote (pre)payments (mobile banking), solving the logistic
problem of access to “top-up or reload centres”. With new energy management systems and smart
meters, many cumbersome activities can be alleviated as door-to-door meter reading and money
collection (more details in Chapter 7). 1.2.9 Governance
The involvement of the private sector and local communities also requires organisation and
regulation of the off-grid market with appropriate standards, procedures, tariffs, authorisations and
contracts. The definition, implementation, and enforcement of those governance rules are definitely
the assignment of institutional bodies (ministries, agencies, authorities).
16

Final Report – Support Study on Green Mini-Grid Development
Set and approve adapted technical standards & required power quality for off-grid customers
Establish tariff structures for off-grid power producers & distributors with their respective income calculations
Grant and validate authorisations (permits, licenses) for generation & distribution Validate power purchase agreements Validate sales & retail contract Support SMEs and consumer protection and assistance in case of disputes
Those governance and regulatory issues are discussed in more details in Chapter 6.
1.3 Examples of Good Practices per Actor & Business Model The success of implementing and operating a mini-grid in the long term is strongly dependent on the
interest, confidence and satisfaction levels of the following parties: end-users/beneficiaries,
investors, mini-grid operator and the National Government, each of them having their specific
capacities, concerns and expectations.
To address the key issues described above on mini-grid implementation, there are basically 3
categories of stakeholders that could intervene and influence business models. Most countries have
experienced various and mixed/hybrid models for implementing their off-grid programme.
In one specific country, different models can co-exist to take into account the real environment, as
illustrated by the case of the Pacific Islands (See also Box below). In practice, different models are
mixed to combine the advantages of each other; a common case is the hybrid model where the
Utility is in charge of design and construction of MG and delegate its operation & maintenance to a
rural electricity service company (RESCO), either totally (generation and distribution) to a MG
operator or partially (distribution only) to an off-taker - Cf. item 1.2.4 above. Box: Main Mini-Grid models (learning from Pacific case)
In the Pacific Islands were many mini-grids (mostly diesel-based) have been installed, all major business models are existing or co-existing:
The Utility model approach is based on the concept that a single company owns and operates the
mini‐grid system, levying a fee for the service provided. The equipment is purchased directly by the utility
with all the installation, maintenance, repairs, commercial operation, and fee collection being the utility’s
responsibility [these however in some cases are sub‐contracted to local companies]. Initial project
financing is based on: a commercial investment by the utility; connection and monthly fee charges to the
end user; and a subsidy, by either Government or donor, to cover a major portion of the capital costs. Renewable Energy Service Companies (RESCOs) are generally smaller than utilities but operate in similar
ways to them. The major difference in a RESCO approach is that the equipment is usually purchased and
owned by the Government. The RESCO operates the system on behalf of the Government and is
responsible for the maintenance and fee collection. The fees in the RESCOs concept are calculated to
cover the non‐subsidised fraction of the capital cost including a reasonable commercial margin. At
present the RESCO concept has been used largely with stand‐alone systems. However, there are
frameworks developed for RESCOs to operate mini‐grids for rural electrification. The Cooperative scheme is much different from that of a utility and RESCO concept, as the operator is an
association of end‐users. This approach places the end user as the owner & customer and mitigates the
17

Final Report – Support Study on Green Mini-Grid Development
problems with the management and setting of fees. The Cooperative is set‐up as a non‐profit entity
under a Cooperative Act. The Cooperative may receive some assistance from Government and donors
but usually for equipment only. Other aspects of maintenance, repairs, operation and fee collection are
the responsibility of the Cooperative. The village or community committee setup is an informal structure usually chaired by the village or
community Headman or Chief. This could be an appropriate practice in remote areas where the
community as a whole has embarked on development initiatives. Those initiatives can be encouraged
and supported by Government. Village or Community Committee shall take over soon or later the
responsibility for operation, maintenance, repairs, and fee collection.
Pacific Island Experiences with Mini‐Grid Systems, A Toolkit for Legislators, October 2009, Rupeni Mario, SOPAC Technical Report 427
1.3.1 Public Institutions
In most Sub-Saharan African countries, the governments have created Rural Electrification Agencies
(REA) or similar bodies which have the mandate to promote, to raise financing and to supervise the
implementation and operation of rural electrification schemes. Therefore the dominant off-grid
implementation model in Africa is the top-down public-led approach, where the government sets the
programmes and the Utility (which can be either private or public or parastatal) implements them.
There is no national mini-grid up scaling that can occur without strong government will and support
and without a clear recognition of grid-extension limits and needs for alternative schemes. However,
many government-led off-grid project implementations suffer from low efficiency, poor governance
and corruption.
The utility-based model has been widely used around the world and many Utilities play a major role
in the whole process of project design and implementation. Utilities generally have more experience,
stronger financial resources and technical capabilities to carry out rural electrification projects. With
a nationwide market, they can build economies of scale, and use their central position to take
advantage of financing options (ARE 2011). However cost-effectiveness and value-for-money are
often poorly addressed in usually bureaucratic, corrupted and donor-aid supported environment.
The current decentralisation processes are another reality in African countries that needs to be
considered, giving increased importance to local government and local management of
infrastructures. However, their actual roles in rural electrification are not clearly established yet
(financing, supervision, O&M). 1.3.1.1 Examples of public-led mini-grid projects
Argentina: PERMER is a large government-led programme (1999) promoting PPP model, i.e. with
private/cooperative concessionaires (15 years) and government financing (CAPEX + Tariffs).
Tariffs (flat + variable rates) are set by provincial regulator through negotiation with
concessionaires. The model has been rather successful but is also criticised as not economically
viable with such heavy subsidies on tariffs (Batthacharyya, 2013, § 8.6.1)
18

Final Report – Support Study on Green Mini-Grid Development
Indonesia: Islands’ electrification programme using mini--grids was initially led (in the 90s) by
the government and the national utility PLN with a uniform tariff all over the territory
compensated by significant subsidies on fuel. The crisis and the evolution toward renewable
energies over the last decade prompted to do policy & regulatory reforms toward
decentralisation where local utilities will become more independent and will be able to adapt
tariffs and to recover their production costs. Poor governance, weak government commitment
and awaited reform (tariff & subsidies) have been serious barriers till now.
Mozambique: the national top-down model where FUNAE finances, builds and owns the MGs,
then transfers the operation, maintenance and money collection to a local “management
committee” in each village has been rather successful until now but might not be sustainable in
the long term (Cf. more details in item 2.3 hereafter). The strong involvement of FUNAE, initially
created as a Fund, in procurement and implementation stages doesn’t facilitate the private
sector to emerge and to compete. 1.3.2 Private Sector (profit-oriented)
Today the engagement of the private sector and its financial models is considered as the most
promising one for scaling up off-grid energy systems as it should provide electricity services more
efficiently. Efforts have been made in many countries to involve the private sector into rural
electrification and to remove key barriers through (i) incentives & access to finance, (ii) regulated
tariffs, (iii) internal skills, etc. Key issues are first discussed below, and then some examples are given. 1.3.2.1 Private Sector profiles for MG
The private sector being involved in MG implementation gathers different profiles, all driven by a
certain level of financial returns but usually also by a certain degree of social benefit or “returns” for
rural population.
The following private sector profiles for MG implementation can be distinguished: (1) mini-grid
operators, (2) mini-grid concessionaires, (3) independent power producers, and (4) anchor &
business customers. 1. Mini-grid Operators (no investment)
Mini-grid operator: private or community entity (including Electrical Service Companies (ESCO or
RESCO), operating franchisees, off-takers) involved in power generation and/or distribution; but only
for O&M, without contribution to investment cost.
Off-taker: private or community entity in charge of power distribution to another private
retailer/consumer or to community consumers. The off-taker is thus not dealing with power
generation.
In the case of “mini-grid operators” scheme, the MG investments are typically fully financed by the
public sector and donors, not by the private operator. Construction works are done by contractors
which are selected based on a bidding process by the public authority in charge of RE. A private
company then operates the power generation and distribution system once it has been set up.
Private companies usually bid for such contracts. Their offer includes a formula of how they will be
19

Final Report – Support Study on Green Mini-Grid Development
paid for their services. If things go well, the private company recovers its costs and makes a (small)
profit. The tasks of the private company comprise power production and/or distribution,
maintenance of the system and administrative tasks (meter reading, billing, collection, etc.). This
scheme involves limited risks for the private company and does not require it to contribute to the
financing of the investment costs. Finding private operating companies for power generation is
normally not difficult. As discussed previously (item 1.2.4), the distribution activity alone is much less
profitable and attractive for privates. (Cf. examples of Mauritania & Burkina Faso below) 2. MG Concessionnaires (with investment)
Mini-grid concessionaire: the company is granted the electricity supply monopoly (generation and
distribution) in the concession region during a certain period, typically 15 – 25 years (concession
contract).
In the “mini-grid concessionaire” scheme, the company has the responsibility to realize the
investments it has offered and to later operate the system. A large portion of the investments costs –
typically between 60% and 80% - is generally financed by the public sector and donors in the form of
subsidies. Only a small portion has to be financed by the private company. Depending on the size of
the concession, the amount can be substantial, however. The private enterprises who invest or
contribute to investment will try to reduce the payback time and to minimise the risks of running MG
in rural areas (dispersed population, weak capacity to pay). (cf. examples of Senegal, Mali & the
Philippines below) 3. IPPs (with investment)
Independent power producers (IPP): private companies, also called GENCOs, Small Power Producers, etc., involved as investors and operators in power generation only.
Suitable and guaranteed feed-in-tariffs and supportive policy regimes increase the attractiveness of
the mini-grid to the private sector. Those IPPs are the one benefiting from the Feed-in-Tariff (FIT)
incentives in case they use renewable energy sources for their generation and they sell their power
to the main grid (Utility).
In case of mini-grids, it can happen that an IPP will sell its power to an isolated off-taker or MG
operator. Some countries as Tanzania have considered in their regulatory framework this particular
IPP and Off-taker model with specific FIT tariff for mini-grids (Cf. Annex on country brief).
In reality, the private sector interested in off-grid electrification would be more attracted by an IPP
model with fixed tariffs and obligation for utility / MG operator / off-takers to buy all or part of the
production. (Cf. examples of Tanzania below) 4. Anchor & business customers
Anchor & business customers: some special customers as the agro-industry (tea/coffee, flowers,
cement), mining, tourism, telecom, etc. could play an active role in the electrification scheme of a
rural area:
20

Final Report – Support Study on Green Mini-Grid Development
- Either the agri business is self-generating its power (usually in the MW range), and could be
interested to sell its excess of power (as IPP) to other rural customers in the neighbourhood
(usually through a mini-grid of few hundreds of kW capacity),
- Or, the agri business becomes a ‘host’ or ‘anchor’ customer for an IPP or a MG operator, with
a predetermined consumption profile and tariff.
The private power developers could become interested by financing and distributing power through
a rural MG to customers if they can have one or more stable and reliable anchor and business loads
(industrial or institutional) among their customers and reduce the investment risks.
Although those anchor customers exist in limited number in rural African locations, it is worth to
consider their identification & implication as an effective partner to improve the overall bankability
and viability of the MG. Additional financing opportunities can be considered with those anchor
customers.
There are several cases where private companies would not have invested and constructed mini-
grids to supply people in rural areas without a connection to the interconnected grid to sell a portion
of the power produced (from renewable energy carriers) to the national utility which can also be
seen as an “anchor customer”. (Cf. examples of Tanzania, Cameroun and Nigeria below)
Where the demand in the nearby region is too low to justify a renewable energy plant (in particular
hydro), its construction might be only economically feasible if a high portion of the produced energy
could be sold to an anchor customer or the public utility.
This is the purpose of the so-called A-B-C model for IPPs or ESCOs (Mukherjee, 2013) where (A)
Anchor customers as tea factories, telecom or pumping ensure continuous and predictable load
improving the bankability, (B) Businesses as rice mills, shops, crafts improve the profitability and (C)
Community which requires affordable electricity at lowest prices. 1.3.2.2 Examples of Private-led mini-grid projects
In Mauritania, the experience with private MG operators has not been very successful yet,
mainly due to difficulty to set up appropriate contractual architecture, clarifying full
responsibilities of parties. In particular, the recurrent problem is the maintenance. Regular
maintenance is clearly part of the tasks of the private company and the costs for that are
covered by the agreed payment scheme. Major overhauls do not have to be financed by the
private company but by the public sector. In practice, if a system component breaks down, the
private company often claims that it falls under (lack of) major overhaul and the repair must be
financed by the public sector. The public sector, in turn, claims that lack of regular maintenance
is the cause and the repair should be financed by the private company. This is a very common
issue in many projects worldwide where ownership and responsibilities are not well set up.
In Burkina Faso: The COOPEL Model is based on a cooperative but strongly supported by private
entrepreneurs for construction, O&M and supervision tasks. Experience with those private MG
operators is similar with Mauritania. Cf also examples in § 1.3.3 below.
21

Final Report – Support Study on Green Mini-Grid Development
In Senegal, the dominant rural electrification model is based on very large concessions. The
program started in 2002 but the first customers were only supplied in 2012; progress has been
very slow. However ERSEN is a project promoting the use of renewable energies in isolated
zones, implemented by ASER and PERACOD and financed under ENDEV programme. It aims to
electrify 265 villages, mostly with solar-diesel hybrid solutions to supply mini-grids and solar
stand alone systems under the ERIL model (Electrification Rurale d’Initiative Locale) with private
operators selected on the basis of competitive bidding under the responsibility of local
authorities. E.g. GIZ/DGIS are supporting private concessions with hybrid PV mini-grids (20
installed and 50 more planned). E.g. the company INENSUS, developing hybrid electric micro-
production, has established a public-private partnership (PPP) with the local community and a
Senegalese partner Energy:MATFORCE to install & operate hybrid micro-grids in small
concessions and to deliver power for a minimum of 15 years ("MicroPowerEconomy model” - Cf.
also ‘Country brief’ in Annex).
In Mali, the government model is based on much smaller concessions, typically limited to a
village or a town. The PCASER programme (bottom-up approach) started at about the same time
as Senegal (2002) and the first customers were supplied in 2006. At the end of 2012, almost 100
concessions supplied customers in rural areas, mainly through spontaneous initiatives by local
authorities, private entrepreneurs, decentralised service companies (SSD in French) with
authorisation (small concessions). The power sources are predominantly diesel generators
(about 90%) or solar home systems. The first diesel-PV hybrid systems have been constructed.
While the progress made in Mali has been impressive, serious problems cannot be ignored: the
tariffs are often too low to allow cost recovery. Lack of skills or low profitability has affected
many of those entrepreneurs who invest 20-25% of the initial cost. AMADER, the authority in
charge of the program, had to provide additional funds to concessions to keep them operating.
India: In the framework of the 5 years RGGVY programme (2005) to electrify all remaining
villages/hamlets, the government has authorised the PPP model with franchisees (NGO, user
association, cooperative, commune, entrepreneur) on fixed territories buying energy from state-
owned DISCOs. About few hundred projects (MGs & individual systems) have been implemented
with positive performances including better metering & billing, higher collection rates and lower
technical and non-technical losses. However sustainability has been criticised given the high
financial and operational risks of that model. (Cf. ‘Country brief’ Chapter 1 and Batthacharyya,
2013, § 8.3)
India: At a much smaller scale, HPS company in Bihar has launched innovative private model of
local Rural Energy Entrepreneurs operating rice husk gasifier for power generation (30-200kW)
at village scale to supply min. 250 households with basic electrical services, free milling and
other local benefits. With a fixed rate tariff (Fee-for-Service), the revenues exceed the expenses
and generate enough profit to pay back upfront costs. However the service provided is limited in
hours and appliances. (Batthacharyya, 2013, § 8.6.2)
Philippines: A recent policy reform has replaced the former cooperative model by a larger
investors’ model engaged in generation and distribution in remote and unviable areas. Referred
as Qualified Third Parties (QTPs), those investors (privates, NGOs, Cooperatives, local
government …) should have demonstrated the capability and willingness to comply with
22
Final Report – Support Study on Green Mini-Grid Development
relevant technical, financial and other requirements through a competitive process.6 But till
now, it has not been successful mainly because of cumbersome procedures and conflicts with
Utilities on franchise areas. By the end of 2011, only one green mini-grid (Diesel/gasifier) was
owned by a private QTP investor (IED, 2013).
Cambodia: There are today about 600-1000 Rural Electrification Enterprises (REEs) running mini-
grids (either power generation and distribution or pure distribution) and owning their
generation/distribution infrastructures but only about 250 are licensed by EAC. The private
operators with a power generation activity benefit from an attractive tariff system fixed by the
EAC (30-90$c/kWh compared to 10-20$c for EDC). This environment helped the development of
the licensed REE model. However REEs provide rather poor quality service (limited power,
frequent failures, poor/old equipments, high losses). (Cf. below item 1.4.1 + ‘Country brief’ in
Annex + Batthacharyya, 2013, § 8.6.2)
Tanzania: Tanwat7 is a wood-factory co-generating electricity (2.5MW) and selling extra power
as an IPP to an anchor tea factory (30%) and to isolated mini-grid in Njombe Island (40%) run by
TANESCO through a PPA (0,085-0,11$/kWh in 2007). The biomass electricity from Tanwat comes
in addition to existing TANESCO mini-hydropower plant (830kW) and 2 diesel gensets (~2MW) to
meet the load and hydrology fluctuation. Further extensions are planned for another tea factory
and a mission.
In Tanzania, the company - Rift Valley Energy - would not have set up a 4 MW Mwenga hydro
plant with mini-grid to provide rural areas (10 MUSD including a 120 km power line) if it had not
been able to sell the bulk of the produced power to TANESCO via connection to the main grid.
Even having signed a PPA agreement with TANESCO, funding entities are scared to invest in the
project, to a large degree depending on the risk of not being paid by TANESCO for energy sold to
the grid (unreliable partner). The project thus includes establishing a utility company for the
local customers (Mufindi tea and coffee factories + 14 villages + few industries + TANESCO). This
is the first scheme which includes production and distribution to individual customers under
private ownership that is under construction in Tanzania. The company assumes that the second
planned plant, with 100 MW installed capacity, will be easier both regarding planning,
construction and funding.
In Cameroun, the RUMPI – hydro project (EU-ACP – EF) has been designed to use the optimal
power output of the hydro site, about 3MW which was far above local demand of surrounding
villages. Tiresome negotiations with the utility have finally led agreement to sell extra power to
the grid even if sales occur during the dry season when the utility has already enough capacity.
The Nigeria Electricity Supply Company (NESCO) operates a small hydro station in Jos as a mini-
grid but with a connection to the transmission grid in the cases there is an oversupply of power.
One of the keys to its success (one of the longest most successful generation projects) is the
presence of a strong anchor load (Makeri Smelting Company). NESCO also supplies electricity to
the large number of employees and several SMEs in the area. 6 DOE Dec 2005 Circular & guideline for QTPs - http://www.spug.ph/PSP_articles/DC%202005-12-011.pdf
7 “Biomass Based Electricity Production: TANWAT Case Study”, Tanzania, TaTEDO, 2004
23

Final Report – Support Study on Green Mini-Grid Development
1.3.3 Local Community & Institutions (non-profit oriented)
Whatever the choice of implementation model (public/private), local community should be involved
either formally or informally. Local commitment and ownership taking are one of the success keys for
off-grid sustainability. The form of community organisation (cooperative, association, and
committee) and the level of implication in a MG implementation project vary widely: 2 categories can
be distinguished:
1) Community organisation which is involved in O&M and in MG management. Experience has
shown that such model is rarely sustainable and hardly replicable. It often suffers from lack
of technical & managerial skills and financial capacities to properly operate and manage MG
infrastructures in the long term and need intensive and long-run assistance. This scheme
could only be recommended where local “champions” or strong local organisations can be
found at early stage of project definition.
2) Community organisation which is not involved in O&M and management of MG but is only
aware, informed, committed and mobilised to approve and support the MG project under a
private leadership with a strong management. Community roles can also include the
identification/development of latent energy demand in community, jointly with local NGOs
and the mediating support for social problem-solving (conflicts with private operator, fee
collection issues, guaranteeing user compliance, etc.).
Key issues for successful MG implementation are first addressed below, and then some examples are given. 1.3.3.1 Community involvement in MG implementation
MG service limitations: Users should be aware of MG limitations since the early stage. Off-grid mini-grids can’t provide the same service as from standard grid; costs are higher and quality could be lower than well-operated grid (service duration, power availability, voltage/frequency stability, outages). However in many African rural areas, the main grid services are very poor (blackouts, load shedding, voltage drops & spikes) and MGs may offer somehow better quality services.
Load peak management: With small isolated power systems, every customer can have a weight or significant impact on the load profile. Actual load curves are often very different than theoretical curves from feasibility studies. Load management (peak-shifting or shaving) based on consensual community agreement can help reducing CAPEX (avoid over-sizing) and OPEX costs (matching supply/demand), and also improving service quality. Some innovative technologies can contribute in efficient individual load management (prepayment meter, energy dispenser - cf. Chapter 7) but will not replace awareness requirements.
Social solidarity mechanism: can increase effective bill payment and collection rate. Indeed, the fee collection rate is one of the main challenges in the operator’s profitability and the project sustainability. A poor rate is obviously linked to the low incomes and low capacity to pay (cf. item 1.3.4 below) but also to the lack of awareness and commitment of customers. Many government-supported electrification projects are perceived as a “gift” and
24

Final Report – Support Study on Green Mini-Grid Development
beneficiaries have low willingness to pay for the service. Therefore regular awareness of
customers on their rights and obligations is mandatory, as well as on social and economic
benefits for the village and on the need for social cohesion. A local authority or ‘moral
guarantor’ can reason with off-the-rail customers, provide guidance or identify alternative
solutions (as external financing support for public services or for lowest income population).
Productive use: If no new income is generated from the use of electricity, the household
expenditures become higher and they might become indebted. Promoting the effective use of electricity for productive uses will subsequently increase the load-factor, the domestic
incomes and also the willingness to pay. Encouraging income-generating activities (IGA) is a difficult and long process which strongly depends on socio-cultural environment; introducing
new IGAs is even more complex (cf. Lao-Mauritania example below). Local NGOs and
specialised institutions are best to support such activities, which are out of the skills of the MG operator or implementer. In any case, the support of IGA should be considered and
planned since project inception in partnership with other development sectors (agriculture,
industry, infrastructures).
1.3.3.2 Examples of community-led mini-grid projects
Sri Lanka: In a first phase in the 90s, welfare-oriented community projects (under ITSL support)
have promoted micro-hydro schemes for MG operated by local ECS (Electricity Consumer
Society, an autonomous village organization dealing with finance raising, construction, O&M,
tariff setting). In a second phase initiated by the WB, the ECS-model has now evolved to a
market-oriented approach, driven by private Electricity Consumer Companies (ECC) submitting
proposal to a local bank and applying for loans. New schemes with ECC offer more energy for
productive end uses. The model also involves the decentralized provincial institutions. In both
phases, the village micro-hydro model from Sri Lanka has been very successful with many
replications and proven sustainability. (Cf. below item 1.4.2 + Batthacharyya, 2013, § 8.5.1)
Nepal: Since 2003, there are more than 200 Community-Based Organisations (CBO) in charge of
rural electrification by grid extension or as IPP or off-taker, with support of a national association
(NACEUN). Local staffs of such organisation or cooperative are intensively trained to operate,
maintain and sell electricity at tariff rate fixed by NEA for rural areas. Initial contribution is
usually 20% in cash and in-kind. The CBOs also provide microfinance (micro loans) to members
for productive equipments to increase incomes and employ ‘Social Mobilisers’ as interface with
consumers. Despite some minor hurdles (late repayments for loans, migration of trained
technicians), the CBO-led model has been rather successful with significant replications over the
last decade. The model is still under improvement (tariff reduction, system losses, collection
rate, and productive uses). (Batthacharyya, 2013, § 8.2.2)
India: Cooperative model developed in India since 1960s had limited success for grid extension
with poor performances, except in Sunderbans Islands where a MG pilot programme (1990s)
with gasifiers (500kW) and solar PV plants (26-120kWp) have been socio-economically very
successful. The model provides enough power with improved quality allowing productive uses
during 6-8 hours per day at a judicious and attractive tariff (0.037-0.056 $/kWh), just below the
diesel-based generation tariff (0.06 $/kWh). Local Rural Electricity Cooperatives (RESCOs)
25

Final Report – Support Study on Green Mini-Grid Development
implement and operate the MG and sell electricity. Bills are collected by local banks based on
actual consumption. However some improvements are still needed as securing biomass
resource, more power for specific appliances, system losses. And there is no indication how
major maintenances and replacements are or will be financed in the long term. (Batthacharyya,
2013, § 8.2.3)
Burkina Faso: Alternative Private Supply (APS) projects including mini-grids are funded by the
national Electrification Fund (FDE) through local cooperatives COOPEL established by the village
community. Each cooperative receives a ‘public service concession’ for construction and
operation of its electrical system. The financing includes 60% grant + 40% loan granted to
COOPEL, repayable over 10 years with a grace period of 3 years and a subsidized interest rate.
Those COOPEL are responsible for the ownership of the RE infrastructures and will be assisted
for the first years by contracted NGO/consultants to develop internal skills to supervise and
monitor projects’ implementation. Under these rural electrification projects, private companies
are involved as contractors through tender procedures for supply and construction attached to a
mandatory O&M contract for 5 years, and they generally withdraw at the end of the 5-year
contract. There are around five of such private operators today, typically operating mini-grid
with diesel power plant in a single locality. This low success is due to small number of loan
awards and partial refunding, too low turnover, low interest of contractors to manage such
remote systems from their base, and lack of an effective umbrella organization that supports a
number of functions (administration, billing, organizing the collection of payments, technical
support). The regulation body ARSE was created in 2010 but its activities are today very limited
because of limited budget. Even if the regulatory framework allows private companies to
develop APS projects, as well as local communities, the very low profitability and the risks
attached to this activity prevented the development of private project holders.
Tanzania: In 1993, supported with funds from SIDA, the Tanzanian government and TANESCO created Urambo Electric Consumers Co-operative Society (UECCO) to serve as a model for future
rural electrification efforts, with technical support and training by TANESCO. The diesel-based
mini-grid was surveyed in 20028. 2 diesel generators were initially installed (193kW) by UECCO
and operated 4-5 hours per day to supply in 2002 about 240 customers (partly metered, partly
flat rate). The tariff in effect in 2002 was 0.47$/kWh (450 TSh), which was more than 15 times
higher than the TANESCO’s tariff for households (0.03$), resulting in only 10% of connection rate
and 63% of money collection rate. Furthermore, the funds set aside for maintenance were not
sufficient, in particular for distribution network (undersized cable, transformer breakdown).
Tanzania: a more successful MG case in Tanzania is the Njombe Catholic Church Mission9 having
installed and operating small hydro plants (about 150kW each) in three villages, with donors’
support. Ownership and responsibilities are shared between the mission, the local community
and donors, but the Mission plays a leading role with strict management. Technical support and
training of local technician is provided on request through contracts with the installation
companies. Metered and flat rate tariffs are used (40-70 TSh/kWh or 1400-1800 TSh/month in
8 “And Then They Lived Sustainably Ever After? -Experiences from Rural Electrification in Tanzania, Zambia and Kenya”,
Elisabeth Ilskog, Doctoral Thesis 2008, KTH Royal Institute of Technology School of Technology and Health Stockholm
9 “Increasing sustainability of rural community electricity schemes – Case study of small hydropower in Tanzania”, Wim Jonker Klunne, October 2009
26

Final Report – Support Study on Green Mini-Grid Development
2008 for lowest domestic class). In 2013, the current tariffs are lower than TANESCO tariff (128TSh/kWh, exc. VAT).
Pacific Islands: The informal village committee setup has been practiced widely in the Pacific as
community development is well established. In the Fiji Islands for example, the Rural
Electrification policy provides the opportunity for such communities to seek government
assistance in electrifying the community. Normally the community’s contribution is 10% of the
total project costs with government financing the 90%. The installation, maintenance, repairs,
operations and fee collection of the project over the first three to five years is the responsibility
of the government, through its Rural Electrification Unit, afterwards transferred to the
Committee.
Lao vs. Mauritania: encouraging IGA in rural households in countries as Lao where strong
traditions of local handicraft exists for decades was found much easier than introducing new IGA
in Mauritania where nomadic culture hasn’t been used to product transformation or handicraft. 1.3.4 End-users
Last but not least, individual end-consumers shall also have a role in the success of MG implementation. There are 4 domains where they can intervene:
Willingness and capacity to pay: Rural end-users are characterised by low income and
irregular capacity to pay but usually with strong willingness to be electrified! Most non-
electrified households use to pay much more than proposed tariffs for much lower energy
service (candles, kerosene, dry cells, batteries, gensets). The willingness is directly affected
by the way the project is presented and accepted. Tricky equation between [willingness to
pay – Real expenditures – Incomes] remains a key issue for any rural electrification project.
Connection costs & tariffs: Nowadays, utility tariff structure is the main reference, even in
remote areas. If the applied tariff for MG beneficiaries is lower than the main grid, the social
acceptance will be much easier, even if some social tariff and connection incentives could be
needed for lowest income households. Subsidies or credit could intervene for the poorest to
facilitate connections. On the opposite if applied tariffs for the MG are higher than the
reference ones, the rural population, often sensitive to social equity and discrimination,
should be strongly aware and involved in the initial tariff setting. Even if allowed by the
regulatory framework, such “willing buyer arrangement” is uncertain in the medium term;
after a couple of years, complaints may increase and collection rate may decrease.
In-house installation (qualified): As a sign of adhesion and commitment, a local contribution
could be required from the beneficiaries, often limited to in-house installation and eventually
the connecting costs. This provides a first indication of the capacity and willingness to pay of
the customers.
Attitude & Behaviour: beneficiaries can contribute to village cohesion & solidarity, ensure
proper & safe use of equipment, follow load schedules, respect contract terms and due
payments, declare failures, watchdog & quality control of assets, etc.
27

Final Report – Support Study on Green Mini-Grid Development
A good cohesion and organisation level in the village community offers an advantage for stronger
commitment and more responsible behaviour. Supports and contributions from end-users will be
more effective if they are organised, e.g. through users’ association.
1.4 Examples of Good Practices per Technology
As illustrated above and in the Chapter 1, there is no accurate data on number of implemented mini-
grid schemes in developing countries and the technology choices; it varies significantly between
nations (policies and resources).
In many developing countries (Sahara and other fuel-supporting countries), more than 80% of their
mini-grids supplying rural towns or settlements are actually powered by diesel-based generators.
Only several lucky well-watered countries such as Nepal, Sri Lanka and Bolivia have intensively
exploited hydropower resources for mini-grids.
Beside hydropower, the emergence of other renewable energy based MG is still very limited and the
current status is strongly dependent on the technology. In Africa it must be noted that most of the
green mini-grids (GMG) were implemented as pilot or showcase projects to test those new
technologies.
Note that investment costs or CAPEX in the following section are approximate figures for generating
units only and are given as indication for preliminary technology comparison. More comments on
CAPEX and OPEX/levelised costs are given in Chapter 3. 1.4.1 Diesel-based Mini-Grids
Over the last decade, many governments have realised that the grid extension was not a feasible
option in the short and medium term. Given social obligation to provide electricity access to rural
population, they have supported or facilitated the emergence of stand-alone generators and mini-
grids either with financing from public (as in Burkina, Mali, Mauritania) or private (Cambodia) or
mixed. Those governments usually started with infrastructure support (subsidies or grants) as diesel-
based gensets and have low CAPEX (500-1500$/kW). However with increases of fuel prices,
governments advocating social tariffs were forced to add fuel subsidies or tax alleviation to reduce
the high OPEX in rural areas.
In Cambodia, the regulatory body (EAC) had another approach: EAC calculates a regulated tariff
based on the real investment and running costs plus a reasonable margin. Those tariffs for mini-grids
differ from one operator to another and are adjusted monthly and communicated officially to the
licensees. With such approach, the government has allowed more than 250 private rural electricity
enterprises (REE) to develop RE business without any subsidy and without tariff cross-subsidisation.
For rural electrification, the licensees can be generation (so diesel based) + distribution or just
distribution when the grid arrives, and so buying power in bulk. Rural customers might not be
satisfied with tariffs as high as 90 $cents but they usually don’t have any better alternatives, when
the supply source is diesel. On end of 2011, there were 111 licensees generating power from diesel
and distributing in mini-grids; 109 which were switching from diesel generation to buying bulk power
with the arrival of the grid; and 38 which had always only been distributors.
28

Final Report – Support Study on Green Mini-Grid Development
In Burkina Faso, there are half a dozen of private operators of diesel-based mini-grids (generation &
distributions) in partnership with village cooperatives (COOPEL) and supported by the rural
electrification fund (FDE). Under government license and fixed tariff, the operator gets a subsidy to
cover their fuel costs. Those who were buying expensive electricity from the Sonabel grid (75 FCFA =
0.15$/kWh) are stopping their business.
In Madagascar, about 70 mini-grids are installed with diesel gensets financed partly by JIRAMA
(state) or by privates but approximately a third of them are not working regularly or properly
because of lack of finances for fuel or for repairing. 1.4.2 Hydro-based Mini-Grids
Beside government or private-led diesel-based mini-grids, there are also a significant number of
hydropower schemes for mini-grids implemented for a long time by public (government for RE) or
NGOs or private investors (agro-industries for self-consumption) in specific countries with adequate
rivers (Nepal, Sri Lanka, Peru, Bolivia, Kenya, Uganda).
However, the scaling up of hydro schemes is today limited by a hardly predictable upfront cost
(CAPEX: 2000 to 5000$/kW) and by the limited number of studied projects, ready for
implementation. The main reasons are the limited number of adequate hydro sites (critical equation
between head, flow, seasonality, load proximity) and the high cost of project development (studies
for identification, feasibility, environmental and social impacts, permit procedure). Wherever
hydrology is available, as in Uganda & Rwanda, the government’s priority generally focuses on large
hydro projects and on feeding into the grid (through PPA agreements).
Small and mini hydropower suitable for mini-grids has large potential in many countries but
development is relatively complex, costly and long. Thus detailed studies for potential investors are
not available for small hydro schemes. Pipelines of small hydro projects (SHP) exist in Kenya, Uganda,
EATTA (UNEP), West Africa (UNDP, JICA). But as long as return on investment is larger than 5 years, it
is unlikely that the private sector will invest in hydro-schemes for mini-grids, except if part of the
production can be sold to the grid or to a suitable anchor tenant, at an attractive tariff (cf. “Energy
Placement” in Chapter 1).
As discussed before in item 1.3.2, agro-industries specialised in one business are usually not
interested by producing and selling electricity for rural settlements, but they might be interested to
become a host or anchor customer for another power development company (IPP or MG operator),
offering new financing opportunities. Hydropower and biomass technologies are appropriate sources
for such MW range applications.
As an example, the GTIE project (Greening the tea industry in East Africa with small hydropower) is
an interesting study case that demonstrates the difficulties to convince the private sector to finance,
or even to co-finance, the power conversion of proper-operating industries having equity. Despite
large efforts from national institutions (to setup appropriate regulatory framework and incentives)
and supports from international donors (grants for development studies, soft loans from UNEP, GEF,
AfDB, EATTA), it took more than 5 years development before having the first private company co-
investing in a hydropower scheme (0.85MW in Gura – Kenya). Other SHP constructions are expected
to commence soon in Kenya (10MW), in Rwanda (4MW), in Tanzania (1.5MW) and in Uganda (2MW)
29

Final Report – Support Study on Green Mini-Grid Development
but some are still looking for co-funding and suitable developers. The initial objective to include rural
electrification of settlements surrounding the tea factories has even more discouraged the private
investors/developers to start distribution business and to sell directly their extra power to
customers.
However, there are some interesting experiences and lessons to learn from the rural telecom
businesses in emerging countries where power supply is also a challenging issue. Some dedicated
private companies as OMC (India)10
are proposing power solution based on renewable energy
(micro-power plant 1-4kW) to supply off-grid (or poor-grid) telecom operators (anchor customer), as
well as the rural population (mini-grid). In a similar way, independent MG operators or off-takers
could be interested to develop rural power solution for off-grid industries as tea factories and for
surrounding households. Those operators could either purchase power from the nearest grid or
generate power from renewable sources and then sell to a local mini-grid including anchor
customer(s). Electricity supply would be their core business.
Figure 3 : Micropower Plants for Telecom (www.omcpower.com) An interesting case study is the tremendous development of hydropower in Sri Lanka. Today all small
and mini hydropower sites in the country have been equipped thanks to the development of a low
cost appropriate design approach, then low cost construction with simplified standards. It took more
than 10 years of capacity building to have national engineers for all studies and implementation
works. Such dynamic of hydro power development hasn’t been noticed yet in most Sub-Saharan
countries; expertise level still comes from outside the continent. Thus, there is a great potential for
South-South knowledge transfer and implementation support (mainly hydropower & biomass) from
experimented countries in Asia (as Sri Lanka, India, Nepal, Indonesia) but also from Maghreb or South
Africa or South America. Donors can play a key role in supporting such effective capacity building.
It must be noted that many existing hydro-based mini-grids in Kenya, Tanzania, Uganda, Rwanda and
Ethiopia have been connected to the national grids over the last 10 years. Thus, such mini/micro
hydro systems increasingly require adequate FITs to survive. There are only a handful of sites in East
Africa where isolation, population density and hydro resource make isolated hydro mini-grids viable
without subsidies. (M. Hankins 2013) 10
http://www.omcpower.com/telecom/power-solutions - http://www.omcpower.com/downloads/omc_market_0512.pdf
30

Final Report – Support Study on Green Mini-Grid Development
1.4.3 Biomass-based Mini-Grids
The CHP co-generation and gasification technologies and their utilisation in agro-industries (sugar,
rice, timber) for self-generation have been introduced in more details in Chapter 1 (§ 2.3.2). CAPEX
are typically ranging from 2000 to 3000$/kW.
Here the interesting aspect for MW range biomass power plants, as for hydro schemes, is the
possibility to be operated either by agro-industries re-selling as an IPP their extra power to an off-
taker or to the grid, or by a power developer targeting anchor load(s) and rural village consumers, as
explained above (§ 1.3.2)
Several countries as Tanzania, Kenya, Uganda, and Cameroun have significant technology knowledge and agro-industry experiences in that field. (Cf. example of TANWAT in Tanzania).
Biomass could also be collected at a smaller scale near the agro-production areas and feed gasifiers
or bio-digesters for small capacity power generation (<200kW). Investors/developers/operators can
be community organisation, NGOs, or private entrepreneurs. However, there are limited examples of
such project specifically targeting rural electrification. Some examples have been given before (husk
power). 1.4.4 Hybrid Mini-Grids
With a much higher CAPEX (3,000 to 10,000$/kW), the few existing hybrid mini-grids (wind or solar-based) have been highly subsidised by international donors highlighting their low OPEX.
Several score of AC-coupled solar hybrid mini-grids have been installed in the East African region in
the past 5 years. This model of solar mini or micro-grids appears to be the technology with the most
potential sites, particularly in small villages and off-grid businesses (M. Hankins 2013). The situation
is even truer in sunny West African countries.
However, actual OPEX are often higher than expected or claimed because they should include
provision for replacement of worn components at their end of life. Impact of battery or electronic
replacement is significant and could alter a project if not properly planned in the initial financing
scheme, in particular if managed by community with scarce resources.
With drastic decreasing prices for solar PV modules, the main part in the lifecycle cost of the solar
generator is now the battery. Other equipments of the so called balance-of-system (BOS) as inverters
and chargers have also an increasing cost share.
A “Maintenance or Replacement Fund” – fed by a levy on the tariff and properly managed over the
years – could solve the problem. But in practice, the money saved over-the-years has been used for
other purposes, including extra maintenance and repairing, before the death of the battery (~5-10
years). The personnel who manages and secures this fund is important.
As an illustrative example, in The Philippines, a solar mini-grid of 45 kWp was implemented in 1998
under a Belgian government financing to supply power (85kWh/day) to the rural population of
Pangan-An island (287 households). 15 years later, the large lead-acid battery has come to its end
after providing satisfactory service to the inhabitants. Unfortunately there is obviously no specific
savings or not enough savings from the tariff to replace the battery (and some degraded PV
31

Final Report – Support Study on Green Mini-Grid Development
modules), neither support from the local government support nor Belgian (failure of tariff setting for
a replacement fund). This results in a backward to diesel genset while the solar project was for long
shown as a success story to be replicated.
The storage, essential to meet the rural load demand profile, remains the main technology limitation
(economical and environmental) for solar/wind affordability and sustainability in MG (Cf. Chapter 1 -
§ 3 and Chapter 7). Alternative ways to reduce battery storage needs are essential to make solar and
wind hybrid mini-grids more competitive and to give room for private investors and operators for the
coming years.
Solar/wind hybrid solar systems using backup diesel gensets become more and more attractive as
they reduce the CAPEX (lower initial battery & PV module sizes/capacities) and the OPEX (reduced
replacement of batteries). A careful sizing optimisation of genset/battery/solar/wind equipments is
required to ensure an effective reduction of the levelised cost of electricity (LCOE) while using
occasionally diesel genset(s).
2 Good Practices in ICF Priority Countries
This section presents some practices of mini-grid implementation in ICF priority countries. The close
link between the MG implementation schemes and the existing regulatory frameworks suggests
providing the consolidated information in the same section here after for each priority country. In
addition, several details on energy and rural electrification sectors, key actors and mini-grid
achievements have already been given in “Brief on priority countries”, in Annex of Chapter 1.
2.1 Kenya
The main current business model in Kenya is top-down government-led approach to electrify all
administrative and markets centres as a priority either with grid extension or mini-grids. There are
about 14 mini-grid stations implemented under REA (finance, design, construction and ownership)
and operated by KPLC/KenGen state-owned companies. 7 of them have been recently hybridised
with solar/wind and other are diesel-based and some will be connected to the grid soon. About 68
off-grid sites (44 Greenfields and 24 existing to hybridise) have been selected and proposed to
donors for funding.
Government is conscious of the high cost to operate and maintain those fuel-based mini-grid stations
and their privatisation is under consideration (ongoing study) but there is no clear evidence about
the government’s willingness to transfer management and ownership of MGs to the private sector.
The regulatory framework has been revised to allow non-KPLC off-takers to distribute and sell
electricity in off-grid areas but there is no actual case of implementation. Grid retail tariff are very
low and could be a barrier for private involvement if imposed to off-grid operators. The basic
domestic tariff in 2012 was about $0.10/kWh (8 KSh)11
.
RE-FIT tariffs are in place since 2008 for IPPs larger than 500kW and are currently technology differentiated with exception for solar PV systems eligible for isolated mini-grids. (Stiftung, 2013)
11
http://www.erc.go.ke/erc/tarrifs/KENYA%20POWER%20RETAIL%20TARIFF%20APPLICATION.pdf
32

Final Report – Support Study on Green Mini-Grid Development
Beside those government-led MG projects, there are probably few tens of private- or community-led
projects using hydropower generation and hybrid systems for their mini-grids but there are no data
available to have accurate figures. Among them, there are a handful of private tea/coffee factories
having invested in hydro-based mini-grids but they actually prefer to sell excess electricity to the
national grid instead of to nearby rural population (except eventually to their workers as social
benefit).
According to the recent survey for MG policy toolkit preparation (EUEI PDF-REN21), there used to be
some community-led micro-hydro MG funded by missionary and by NGOs as Practical Action/ITDG
but all are now reached by the grid extension (Mt Kenya region) or never really came off. None
micro-hydro schemes for MG could be found for detailed investigation and case study (M. Hankins,
2013). NGOs also implemented recently a handful of hybrid solar/diesel mini-grids of few kW, as Kitui
project by Southampton University or Base Camp in Masai Mara Park.
2.2 Tanzania
The current implementation models for mini-grids in Tanzania are on one hand the Utility-based
model for few large diesel power plants and on the other hand a private initiative model for the
numerous small gensets (there is an estimated individual gensets installed capacity of 300-400MW).
Since 2007, the government (MEM) promotes rural electrification and energy sector development
through a new public-private partnership model with SPPs (Small Power Producers) and SPDs (Small
Power Distributors); this model could become the main new source of rural power outside TANESCO
corridors where there are thousands of unconnected villages in the 30 regions of Tanzania.
The FiT tariffs are not technology differentiated yet and are negotiated through SPPA under SPP
guidelines and Standardized Tariff Methodology (annual adjustment). Through Standardized Power
Purchase Agreements (SPPA) and Standardized Power Purchase Tariffs (SPPT), private IPPs can
interconnect and sell power to the Main grid (at about 0.094$/kWh based on mini-hydro) and to
Mini-grids (at about 0.30$/kWh or 480TSh). The average TANESCO retail tariff for domestic consumers is about 0.18$/kWh, without VAT.
Some private investors have started to develop about 10 small hydro projects totalling to 4MW; all of
them are unbundled IPP projects feeding power to the grid. There are also several ongoing projects
that combine power production and provision of power to individual customers (in villages), so called
bundled projects, and some of them are also connected to the TANESCO grid. Local participation is
encouraged to create village demand for electricity and ensure enough revenue.
There are also several interesting private anchor initiatives with renewable energies (unbundled
projects), involving agro-industries such as biomass from Tanwat, TPC-Moshi, Sao Hill, Mtibwa,
Kilombero and Kagera sugar factories, bio-fuel generation from Mafia coconut factory, and hydro
from Mufindi tea factory.12
12
Potential Projects in Kenya, Tanzania, Uganda, MIRREIA, ESD, Dec 2007 + SREP IP Tanzania, 2013
33

Final Report – Support Study on Green Mini-Grid Development
Among the key requirements to reach successful involvement of privates (SEI, 201213
), technical
assistance and capacity building are essential. There is a need for guidelines and manuals for
SPPs/SPDs, user-friendly business plan tools, guideline for Standards’ enforcement for all renewable,
etc. More capacity building is still required for government institutions (MEM, TANESCO, REA,
EWURA) on financial modelling, procurement & contracting and monitoring. There is also a need to
up-skill the labour force and to reinforce vocational and technical trainings (from a detailed study14
conducted to assess the availability and quality of labour in Tanzania). And of course a better access
to soft loans is needed.
2.3 Mozambique
In Mozambique, the main implementation model is the top-down approach with FUNAE and village
committees, where FUNAE finances, builds and owns the MGs, then transfer the operation,
maintenance and money collection to a local “management committee” in each village.
MoE is conscious about the limitation of the current model as many diesel-based mini-grids are dying
or are out of work (lack of funds and/or local skills). The ministry foresees the development of IPPs
and the transition of “village committee approach” toward “community-based enterprises” as a PPP
structure with internal management & accounting system.
Tariff issue is actually a serious barrier for private participation in off-grid electrification. RE-FiT tariffs
are planned but not implemented yet, although regulatory framework exists for IPPs. Furthermore
the retail tariff is uniform over the all country and off-grid kWh tariff must be the same as EDM
baseline tariff, 0.08 $/kWh (3Mt15
) only. Government-led off-grid projects are highly subsidised.
Alternatively, flat rate tariffs are also applied by some project developers to by-pass low kWh tariffs
(as for solar individual systems with 200-300Mt/month).
Private sector participation is encouraged by the government through specific regulation for SME and
micro enterprises with various incentive instruments. A specific study16
has been conducted to
review and analyse those investment incentives for small scale renewable energy projects and the
emergence of some (large) IPPs. However, to attract private sector and expect leverage effect in off-
grid business, access to incentives, grants and subsidy should be improved significantly, as well as
having appropriate tariffs (with PPA over 20 years). Today some private entrepreneurs could be
attracted to generate power (IPP) but they are not willing to distribute without fair tariffs.
Nevertheless there are some pure private initiatives electrifying rural settlements, usually owners of grind mills selling extra power to some nearby households.
The future role of FUNAE is also on the table to investigate how FUNAE could progressively withdraw
from numerous project implementations to the benefit of private enterprises and how FUNAE could
instead facilitate and regulate the private sector involvement.
13
SEI, 2012, Sustainable Energy Markets in Tanzania (Report 1 - § 3.2), David Bauner, September 2012
14 The potential for Job Creation and Productivity Gains Through Expanded Electrification, A. Mwakapugi, Special Paper, REPOA, 2010, www.repoa.or.tz
151 USD = 30 Metical (Mt)
16
Investment Incentives for Renewable Energy in Southern Africa: The Case of Mozambique, Boaventura Chongo Cuamba,
January 2013
34

Final Report – Support Study on Green Mini-Grid Development
2.4 Malawi In Malawi, the national utility ESCOM plays a dominant role in rural electrification implementation.
There is no RE agency as such but only a Rural Electrification Management Committee (REMC). A
separate and independent Rural Electrification Company (RECO), also called a “utility without wires”
in off-grid rural electrification, is under consideration to install, operate and owns equipment (as a
conventional utility “with wire”) and sells electrical services to customers. Composed of capable staff,
initially seconded from each of ESCOM’s functional departments and, if necessary, contract
personnel, the RECO would have responsibility for all operational functions in rural areas, as well as
financial accountability. This top-down model was successfully applied in Central America, the
Dominican Republic, Indonesia, and Morocco.
Presently, the rural electrification is well organised through the MAREP programme (204 trading
centres already electrified 2002-2012) and with regulatory framework for PPP and IPP participation
(REF fund from fuel levy and energy sales). However there is no FIT tariff yet and the retail tariff is
uniform nation-wide which limits IPPs to rate not higher than very low ESCOM’s tariff (0.05 $/kWh).
In 2010, several green mini-grids have been financed by MCC/GoM under a phase 1 pilot programme
(RE-PPP). Today, about a dozen of the isolated mini-grids are owned by Government and run by
ESCOM utility (diesel-based MGs on islands) or by local communities (pilot solar/wind hybrid MGs).
There are also half a dozen hydro-based mini-grids run by private or communities.
MuREA is a NGO, emanating from a micro-hydro project with international donors (EU/PA), which
promotes the community-based management of the mini-grid (O&M and money collection) and with
a local independent body. It aims to set up a private electricity company which will attract extra
funding for replicating similar hydro MG projects.
Some agro industries (tea, timber) are also interested to cheaper energy from hydro or biomass and to sell extra power.
2.5 Rwanda
In Rwanda, there is a tremendous effort to rebuild energy infrastructures through a PPP model and
to involve private SMEs as IPPs, in particular in micro-hydro projects. The new regulation (Grid Code
2012) distinguishes the GENCO and the DISCO businesses (but not tariffs found for DISCOs). The main
incentive is a FIT introduced in 2012 for micro-hydropower generation with a capacity differentiation
(0.16$/50kW-0.067$/10MW). RE-FIT for other sources will take longer time but tax breaks for solar
and wind are in place.
Consequently all public micro-hydro schemes are planned to be privatised and several tens of new private schemes are coming out.
Private promoters can theoretically be
guarantees from project developers and
standardised PPAs also creates delays,
(collateral).
supported by local banks offering loans but credible
creditworthiness of the utility are lacking. The lack of
extra costs and reticence from financing institutions
35

Final Report – Support Study on Green Mini-Grid Development
The retail tariffs have been drastically increased over the last decade and reach today 0.21$/kWh (134 RWF/kWh) for ordinary domestic consumption (ex. VAT 18%), one of the highest in Africa.
Other renewable energy technologies for MG are limited to some small hybrid PV/diesel systems
(<10kWp) for school and health infrastructures, financed through grants, owned and operated by
beneficiaries but maintenance & replacement remains a challenge.
2.6 Uganda
Despite a poor history of public-private partnerships in the country, Uganda is actively supporting
private sector involvement for off-grid electrification. The off-grid sub-sector is organised and
controlled by Ministry and Agency institutions (MEMD-REA-ERA); the top-down PPP model for MG
implementation has been the main approach where REA is developing & financing MGs and the
private sector contributes to investment and operates those MGs.
The regulatory framework in place encourages both private IPPs to generate and private distributors
to sell power under PPA at established FIT to the main grid (UETCL or Umeme Distribution Company)
or to mini-grids. The RE-FIT is technology differentiated (0.36$/kWh for solar power and 0.07-0.11
$/kWh for hydro depending of the hydro-scheme capacity). Investors still prefer to negotiate outside
RE-FIT which are not enough attractive. A third revision of the policy and FIT is ongoing.
Recently the government has strongly reduced subsidies on retail tariffs. The Utility domestic tariff is today around 0.20$/kWh (524 USh) for on-grid while off-grid tariffs can be adapted to each IPP/Distributor’s project and can be as low as 0.14$/kWh.
An Energy Fund (REF), financed by a 5% levy on bulk electricity sales, is also in place to support or leverage private sector financing.
The remaining barriers for GMG development are associated to the reluctance of private sector, the
limited subsidies available from the government and the limited local expertise to implement and
finance MG projects.
2.7 DRC
The energy policy framework in DRC is particularly underdeveloped and the institutional capacities
are insufficient to face the huge needs for rural electrification. As a consequence, the grid and off-
grid electrical infrastructures managed by SNEL are very inefficient (very low tariffs17
, 40%
distribution losses and 40% collection rate). Half of the DRC’s generation capacity is owned and
operated by private companies for self-generation, with high genset running cost (up to
0.63$/kWh).18
There is neither REA, nor independent regulatory body, nor financing or incentive mechanisms for
rural electrification or renewable energy promotion. However a national power sector reform and
revised policies reinforce the role of PPP and IPPs for power generation and off-grid distribution. 17
Residential tariff below 75kWh: 0.04$/kWh
18 http://www.infrastructureafrica.org/system/files/DRC%20country%20report.pdf
36

Final Report – Support Study on Green Mini-Grid Development
A FIT for diesel-based (<0.10$/kWh) and hydro-based (current FIT tariff for hydro could not be found)
power is applicable and gives some opportunities for IPPs. About 30 isolated diesel-based or large
hydro-based MGs are operated by IPPs or public entities. The government has neither experience yet
with micro and mini-hydro, nor with solar/wind hybrid systems but has new interest in small scale
renewable for the electrification of 347 rural centres. The retail tariff is non-uniform and can be
adapted for rural mini-grids. (CNE interview, 2013) Despite FIT and adjustable retail tariff, the environment remains highly risky for private investors.
3 Annexes
3.1 References and Bibliography
“Delivery Models for Decentralised Rural Electrification”, iied, A. Yadoo, 2012 “Hybrid Mini-Grids for Rural Electrification: Lessons learned”, ARE-USAID, 2012
“Demonstrating a Viable Business Model in Africa & Asia” (Clean Energy Hybrid Mini-Grids),
Dean Cooper, Feb. 2013 (+ .ppt)
“Business Models for Rural Electrification from Agro-Industries - The Case of Kenya, Tanzania,
Rwanda, and Malawi”, PACEAA, 2010, http://paceaa.org/documents/PACEAA_D2_Revised_SMA_07-10-10.pdf
“Powering Africa through Feed-In Tariffs”, Heinrich Böll Stiftung, Feb 2013
“Rural Electrification with PV Hybrid Systems - Overview and recommendations for further deployment”, IEA PVPS Task 9, IED (GL), Feb 2013
« Accès à l’électricité en Afrique subsaharienne : retours d’expérience et approches
innovantes », AFD, IED, Apr 2012 “Designing Sustainable Off-Grid Rural Electrification Projects”, WB, nov 2008 “Private sector led off-grid energy access – A-B-C business model”, Feb.2013, M. Mukherjee “Recent practices from Africa’s Rural Electrification”, EUEI PDF, Oct 2011, R. Karhammar “Off-Grid Business Models”, June 2009, Helios SE, Training session 2
Investment Incentives for Renewable Energy in Southern Africa: The Case of Mozambique,
Boaventura Chongo Cuamba, January 2013 “Rural Electrification Through Decentralised Off-grid Systems in Developing Countries”,
Subhes Bhattacharyya, Springer, 2013 Interview of M. Hankins (by IED), ASD, Nairobi, April 2013
37

Final Report – Support Study on Green Mini-Grid Development
Chapter 6: National Policies, Regulatory and
Financial Frameworks
TABLE OF CONTENTS
KEY HIGHLIGHTS.......................................................................................................... 3
1 CURRENT POLICIES AND ENERGY SECTOR STRUCTURES .................................................... 4
1.1 Current policies and key elements for conduciveness for green mini-grid development ... 4
1.2 Energy sector structures and Green mini-grid development ............................................ 7
2 REGULATORY FRAMEWORKS & TARIFFS .................................................................... 11
2.1 Operational Planning & Tariff Setting Issue ................................................................... 11
2.2 Private Sector Involvement ........................................................................................... 15
2.3 Capacity Development .................................................................................................. 16
3 FINANCING FRAMEWORKS AND INSTRUMENTS ........................................................... 16
4 ICF PRIORITY COUNTRIES ...................................................................................... 17
4.1 Framework & instrument comparison ........................................................................... 17
4.2 Remaining instrument gaps .......................................................................................... 18
5 ANNEXES........................................................................................................... 21
5.1 RET Support Policy and Regulatory Indicators in Western Africa .................................... 21
5.2 Tariff Comparison in some African Countries ................................................................. 22
5.3 References & Bibliography ............................................................................................ 24
1

Final Report – Support Study on Green Mini-Grid Development
LIST OF TABLES AND FIGURES
Figure 1 : Traditional & Restructured Power Sectors in Malawi ........................................................ 6 Figure 2 : Cost Share for preparing National RE Plan in Burkina Faso ................................................ 7 Figure 3 : IPP selling power to rural settlements (IED/AFD, 2013) ................................................... 14 Figure 4 : Calculated Average Electricity Price (USD) in SADC (USAID, 2011) .................................... 23
Table 1 : Segmentation of contexts of access to the electricity service (authors, IED, 2013) ............... 5 Table 2: Comparison of Support Policy & Regulatory Instruments (author, IED, 2013) ..................... 17 Table 3: Key remaining policy instrument gaps in ICF priority countries .......................................... 19 Table 4: RET Policy Indicators in ECOWAS ..................................................................................... 21 Table 5: Indicative Electricity Cost in Africa (USD, 2006) ................................................................ 24
2

Final Report – Support Study on Green Mini-Grid Development
Key Highlights For mini-grids – and green mini-grids to develop in a given country, there has to be at the outset a
political vision regarding rural electrification as a whole and within the global framework, a vision as
to the role of mini-grids; this then has to translate into well formulated objectives for mini-grids,
which can only emerge from a global national plan; which in turn had to translate in a quantified
strategy – through a systematic strategic planning approach as described in Chapter 2.
Second, even if the national policy is formulated – giving a strong role to mini-grids, the question
which then arises, before looking into the legal and regulatory issues, is whether the structures in
place can ensure the development of the mini-grids at a large scale, or is it wishful thinking? The
stark reality is that technical expertise is with the utility and the priority of the utility is grid extension – “mini-grids” being often restricted to isolated provincial capitals which have to be supplied – generally through fossil fuels, which are well known, fast to implement and easy to operate.
In general, it is observed that it is only once the grid expansion is well advanced that utilities will engage in – Green Mini-Grids, e.g. in Kenya.
The reality then is that for – Green Mini-Grids to develop, this has to involve private players: whether
they do exist with the required skill sets is an issue analysed in Chapter 5. Second, Chapters 3 and 4
have clearly illustrated that while there is undoubtedly a long term, infrastructure, public investment
economic logic in GMG, the actual feasibility in terms of bankability of projects and investors, and the
willingness of private players to take on the high risk level is very dubious. There is a real challenge in
developing transparent and encouraging regulatory frameworks – meaning simple and transparent;
and offering the private sector risk-sharing instruments giving them acceptable payback periods and
returns with a controlled level of risk.
Policy, regulatory and financial frameworks are found essential for launching a large-scale and sustainable GMG programme.
The general finding from this study is that, in almost all reviewed ICF priority African countries, the
policies are in place to promote the 3 key sectors concerned by green mini-grids: rural electrification,
renewable energies and private sector. The laws and related texts describe the willingness to
promote these investments. Quantified targets for rural electrification and renewable energy
penetration are often formulated. However, the situation with regulatory instruments is not as
advanced as with the policies and varies significantly from one country to another. Tanzania and
Uganda have the most advanced framework and instruments for GMG development while Kenya,
Rwanda, Malawi and Mozambique are on the way to filling the gap. DRC has still poor policy and
regulatory environment.
3

Final Report – Support Study on Green Mini-Grid Development
1 Current Policies and Energy Sector Structures Are the current policies conducive to accelerating mini-grid expansion or are they holding it back?
1.1 Current policies and key elements for conduciveness for green mini-grid development
1.1.1 Political vision and strategic objectives The electrification of isolated localities requires major investment, for a small number of customers
who generally have a limited financial capacity. As such localities seldom show prospects of creating
wealth, the question is raised over profitability and sustainability (which requires extensive recourse
to – limited and random – public assistance. This seriously jeopardizes the sustainability of projects).
Moreover, population densities are low in Sub-Saharan Africa (Cf. Chapter 2), compared to the
density in France (100 inhab/km²) and Europe in general (115 inhab/km2). The densities are
particularly low in Central Africa. The problem is that the lower the population density, the higher the
connection costs, as shown by the evolving costs of the Global Rural Electrification Programme
(PERG) in Morocco.
These vast low-density areas, where low-income communities live, are costly to serve and are thus
unprofitable. However, the communities living in such highly dispersed locations will inexorably need
densification to some extent. The responsibility thus lies with politicians and planners to decide, with
full knowledge of the facts, which areas to allocate resources to and what targets to focus on (social
objective as in Morocco or economic priority with "development centres") and to select the most
appropriate technology.
In order for the available – but scarce – resources to have the highest possible impact, it is essential
to have a clear political vision of the social and economic objectives and to make a political
commitment, while ensuring that operators are available who can function in a clear contractual
framework.
The government objectives for a service access programme can be more easily formulated after distinguishing the following segments:
1. Extension of the power grid as part of the national concession of the (public or private)
electricity company;
2. Electrification of villages and secondary centres and, more generally, of the development centres outside the national concession of the electricity company: technically speaking, these localities can be supplied by the national grid, or by isolated mini-grids (local generation capacity with an associated medium-voltage (MV) and low-voltage (LV) distribution grid that can serve one or more localities);
3. Electrification of very isolated and small localities, where extending the grid will be very costly
given the distance and the very low load levels. It is generally implemented with systems that are stand-alone or limited to common community services, typically PV stand-alone systems, or via micro-grids at village level;
4

Final Report – Support Study on Green Mini-Grid Development
4. Peri-urban electrification, i.e. neighbourhoods located around the major conurbations and,
more generally, the issue of densifying connections, and therefore that of widespread access
for communities once the service is available in the area.
Combining the technical-economic option and the institution responsible thus leads to the following segmentation table:
Table 1 : Segmentation of contexts of access to the electricity service (authors, IED, 2013)
Segments Electricity company
REA or REF*
Specialized operators
(public or private)
(NGOs, ministries…)
1. Electrification of development centres Viable
inside the main concession areas A
2. Electrification of centres outside the Viable
Viable
main concession areas
B
3. Isolated localities
Not profitable Not profitable Not profitable
C E
4. Outlying urban areas Not profitable Not profitable
D
F
* Rural Electricity Agency or Rural Electricity Fund.
The table highlights that options A and B (grid extension and off-grid villages) are integral parts of a
country's development and spatial planning policy; while options C and E (small and remote villages)
must be seen as a spatial complement to option B (and in terms of the available resources); options D
and F (peri-urban) have high investment and management costs that need to be controlled (their
organizational and technical specificities will be discussed later).
It is important to be lucid about the potential profitability of a service access program and make a
distinction between:1
1. An access program to equip a given area with the essential infrastructure for its economic
development, where there are therefore secondary centres with "economic potential". This
type of "territorial development" program is characterized by higher unit energy consumption
levels and a greater ability to pay which, combined with a higher population density (and
therefore better controlled investment costs), offers some prospects of profitability. At this
stage, the aim is not necessarily to connect the entire population;
2. The provision of a universal service to all the residents of an area, and in particular to the
poorest, i.e. peri-urban communities, 40 to 60% of households in villages and even quite large
towns in a country, and communities living in small villages or isolated dwellings. The
consumption levels of such customers will not exceed 50 kWh/month, representing maximum
expenses of EUR 5/month. In addition, the more dispersed the population, the higher the
1 The proposed segmentation must not lead to opposing "off-grid" and "grid extending" electrification schemes, as certain
analyses today tend to do. It must illustrate their complementary character.
5

Final Report – Support Study on Green Mini-Grid Development
investment cost per connection will be. In these areas, the basic paradigm is a complete subsidy of the investments and a tariff that covers operating costs.
These two approaches are based on two distinct objectives: economic and territorial development for the first, and social equity and geographical balance for the second (which has a high cost). 1.1.2 Current Policies
The international review conducted in this study has highlighted the diversity of national policies to
promote mini-grids and to increase national access to electricity. Despite deep restructuration of
power sectors, current policies and framework for green mini-grids (GMG) are still at the early stages
in many countries and strongly controlled by the governments.
The next figure represents the restructuration process of the power sector in Malawi but the
approach to reduce the role of the government to the benefit of the private sector is shared by many
other countries.
Figure 1 : Traditional & Restructured Power Sectors in Malawi2
1.1.3 Conducive Elements The key elements for conduciveness for green mini-grid development plan are:
Off-Grid RE & MG planning, with indicative investment plans. Kenya, Tanzania, Uganda and
Rwanda have recently include off-grid and MG development in their RE planning or Master
Plan. Other countries are not addressing specifically off-grid in their strategic plans yet.
Policy and regulatory framework: the national policy and regulatory environment should
promote the development of green mini-grids (GMG) through specific planning and support
to various stakeholders (project developers, investors, banking institutions, local
governments and beneficiaries).
Promotion and awareness, with capacity and confidence building of investors and private players.
Developing a policy, vision and strategy for rural electrification requires time and money and has to be politically adopted if one really wants GMG to develop beyond pilot or demonstration projects. 2
Source: “Malawi: Rural Energy and Institutional Development”, ESMAP, Dean Girdis, Mangesh Hoskote, 2005
6

Final Report – Support Study on Green Mini-Grid Development
The next figure illustrates the steps and costs involved in the 12-month preparation of the national plan in Burkina Faso (2008-2009). The total budget was 400,000 EUR.
Figure 2 : Cost Share for preparing National RE Plan in Burkina Faso
1.2 Energy Sector Structures and Green Mini-Grid Development 1.2.1 Energy Sector Reforms and Institutional Environment
In the mid-1990s, many reforms were launched due to the general inefficiency of public sector
electricity companies. With regard to the focus of our topic, out of more than 40 Sub-Saharan African
countries, almost half have set up a rural electrification agency (REA) and/or rural electrification fund
(REF). Out of the twenty or so countries that opted for an organization of the electricity sector shared
between a national or privatised electricity company and an REF/REA, almost all benefited from
World Bank assistance for its establishment. This created an institutional model for the various
initiatives, whose focal point is this REA and/or REF, in charge of – as the case may be – designing,
developing and operating power systems in rural and semi-urban areas.
Their action falls within a “perimeter” of rural and semi or peri-urban electrification with poorly
defined contours, generally simply juxtaposed to that of urban power systems. The necessary
coordination of the planning function of both sectors and efforts to seek synergies and general
efficiency, which should be the responsibility of a strong ministry, are thus made difficult.
Nevertheless, these two perimeters, which are governed by different or common regulations, are
experiencing respective developments that influence each other (grid extensions, area exclusively
reserved for the “off-concession”, etc.). These developments and their interface (feed-in and resale
tariff to the grid, compensation for operators/investors in case of an extension of the "national
concession") are key elements for coherent national policies to extend access to electricity services. If
they are poorly defined, they can block the service extension.
Today, we should question whether this institutional model has the capacity to accelerate or
promote access to electricity services. It has not changed significantly in the recent past, either in
terms of access for communities in electrified areas, or in terms of the percentage of localities
covered by the grid.
7

Final Report – Support Study on Green Mini-Grid Development
The key role of a central operator as a "public champion"
One sees that the African countries that kept their traditional national electricity company today
have the highest access rates to electricity: South Africa: 70%, Côte d’Ivoire: 39%, Ghana: 60% (82%
in urban areas and 29% in rural areas). The equilibrium between profitable areas (i.e. towns and
densely populated coastal areas) and areas of low profitability (i.e. rural areas) seems facilitated by a
single overall management system.
The institutional organizations in Morocco and Tunisia, both of which today have nationwide electrification, shared the following characteristics:
A single operator that has for a long time been the main instrument for developing access to
electricity; A clear centralisation/deconcentration of the administration; A strictly public approach until quite recently;
A very strong political will to develop electrification by extending the grid of the single or
dominant operator, but also by using other electrification methods as mini-grids;
No distinction between urban and rural areas, all being included within the area of activity of the dominant operator;
The lack, for a long time, of an instrument to formalise a sectoral and regulatory strategy.
In both these countries, the political will and mobilisation of national resources have played a key role. This is relayed and implemented by a relatively efficient single public operator.
For many years, some countries with an intermediate economic development, such as Cameroon or
Ivory Coast, adopted the same strategy as Morocco and Tunisia. They made no distinction between
urban and rural, even if the distribution operator had a well-defined field of action and had opened
to the alternative intervention by local and regional authorities for infrastructure financing. Since
then, the sector has moved towards a progressive liberalisation and its resulting institutional changes
(regulator, privatisations, asset holding companies, REAs). While such situations may have their own
dynamics, the absence of a rigorous oversight and clear regulatory framework – in other words of a
legitimate manager – often leads to situations of deadlock. Too many institutional stakeholders are just as inefficient as too few
In some cases, the institutional environment has too many stakeholders, which is shown by the fact that there is no clarification and/or simplification following a sector reform.
Mauritania, for instance, has been a “good pupil” in the eyes of its donors from an institutional
perspective. The electricity sector has a sectoral policy letter, an electricity code advocating the complete
opening of the sector, a ministry with a rather exemplary organization chart, a public operator, which has
been subject to privatization attempts (in vain), a regulatory authority, an REA, and an agency for
universal access to basic services (APAUS). We see, however, quite a gap between the texts, the facts, and
the existence and functioning of the institutions. The APAUS concept that has been defined should have
led to optimal coordination, the creation and management of basic services, and to efforts to achieve
systematic cost reduction (for the use of domestic and renewable energies, the choice of future
investments, and system management). In reality, however, the system
8

Final Report – Support Study on Green Mini-Grid Development
has led to competition with the sectoral agencies – for water and rural electrification – for project implementation and budget allocation.
A necessary match between the rural electricity market and the number, size and efficiency of operators
Senegal’s conceptual approach is exemplary and it has an institutional arsenal that has fully taken
account of a forward-looking vision – the sectoral policy letters; lessons learned from fruitless reform
attempts – privatization of the national electricity company (SENELEC); the functions of the Electricity
Sector Regulatory Commission, which is increasingly credible; the existence of a dominant operator
(SENELEC); the role of an REA, which is seeking to develop a public-private partnership (PPP) under a
mechanism integrating the economic, financial, legal and fiscal tools required to enhance the
attractiveness for operators of the sub-sector, SENELEC and PPPs.
Studies covering a period of 10 years have led to a reduction in the number of concessions from 20
to 11 to allow them to have a certain level of profitability. Few candidates were interested in the first
bid invitation for concessions, which was won by ONE, Morocco’s national electricity company.
This raises the question as to whether a "market" of operators exists with the critical size and means
to submit bids. Is it due to an insufficient promotion of the sub-sector and/or the absence of a
"champion"? Are expectations too great concerning the interest and capacity of the private sector to
take risks, especially for investments, in a financially depressed sector?
Conversely, the frameworks in Burkina Faso and Mali favour small and local national village
operators. However, this requires heavy investment subsidies (about 80%), as the operators work in
conjunction with an overall approach. Indeed, while over 60 projects for spontaneous applications
for rural electrification (PCASER), financed by the Malian agency for the Development of Household Energy and Rural Electrification (AMADER), supply Mali’s rural areas, their unit size is generally below 250 kW and, by themselves, they would never be able to resolve the issue of nationwide access to electricity for all.
While the institutional approach is forward-looking and maybe ambitious, it must, however, result
from a search of an optimum between the reality of the sector, its means and its resources, its
capacity to develop, and the objectives assigned to it. Moreover, the approach must be exhaustive in
terms of assigning roles and responsibilities, and must ensure the optimal exercise of the functions
required for the development and smooth running of the sub-sector.
A sophisticated structure does not necessarily fulfill the three regulatory, financing and industrial functions
In most African countries, the main characteristics of the organization of post-reform rural electrification and access are:
A repositioning of the State for its sovereign functions: regulation, promotion, protection of
the general interest, creation of the regulatory function; REAs, and a tentative recognition of the need for cross-subsidies;
A segmentation of the power system to allow the introduction of competition, particularly
for generation;
9

Final Report – Support Study on Green Mini-Grid Development
Access by private enterprises to these activities provided they obtain authorizations, licenses or concessions, and that they actually exist.
Unfortunately, the creation of entities for electrification has often not been supported, either by
national policies, or by an allocation of financial and human resources that would really allow them
to achieve the objectives assigned to them.
The rules of the game are too often poorly defined and the resources too low to create significant
development. These agencies may play several roles: running a pilot project for decentralised
electrification, organising a bid invitation for concession management, giving incentives to private
operators that wish to invest in a decentralised electrification project, and planning grid extensions
(Renewable Energy Association & ADER in Madagascar), possibly by financing this component.
Achieving effective results requires a coherent national policy for access to electricity, with the
corresponding institutional and regulatory environment (regulation function). It is thus necessary to
have all the appropriate structures, endowed with adequate resources and powers and ensuring the
required 3 functions:
i) Planning and regulation: a real political will to support electrification projects and ensure
they are sustainable, ii) Financing: clear economic orientations and sufficient financial resources,
iii) Industrial: private or public structures that can provide, install and operate the infrastructure.
Mixed results
It must be recognized that privatisation and withdrawal of the State did not lead to expected private sector mobilisation, neither operational nor financial.
We see that the multiplication of « independent » entities (institutions and agencies), prior to the
creation of large-scale infrastructure, leads to a fragmentation of competences, competition
between institutions to hold “borderline” responsibilities, and in-fine to conflicts and tensions. This
competition makes it impossible to gather the human, technical and political means required to
achieve the common objective: implement ambitious projects, while ensuring that the functions
required to achieve the objectives of access programs are available (financing, industrial and
regulatory functions). 1.2.2 Private Sector supporting Green Mini-Grid Development
Beyond the above institutions involved in rural electrification programmes, there are other key private actors playing or having to play roles in MG development and sustainable implementation.
- Are those actors existing and available on the national market? - Are they supported by the government to involve in MG development?
- Are their roles and responsibilities clearly defined at various stages of the implementation?
Feasibility studies, infrastructure design, procurement, construction, O&M, power
generation, rural distribution, etc. (Cf. Chapter 5)
10

Final Report – Support Study on Green Mini-Grid Development
2 Regulatory Frameworks and Tariffs
In the off-grid power sector, the overall purpose of the regulatory function can be summarised as follows:
1) Ensures that operational planning is undertaken with appropriate standards and that the
tariff setting issue is clearly addressed 2) Has to be conducive, clear and reliable enough to engage private sector with confidence
3) Assesses capacity levels, formulates and undertakes the required capacity development
activities 4) Ensures clarity of roles of different players
The above section item 1 has highlighted that regulatory framework in Africa is often poorly adapted
for MG and for GMG development. The adapted frameworks for GMG should integrate regulations
from 2 sub-sectors: off-grid electrification and renewable energy sub-sectors.
Note that a Mini-Grid Policy Toolkit3 which is under preparation (EUEI PDF/REN21/ARE) is directed at
African policymakers to provide them with essential information as well as hands-on
recommendations and tools to improve the policy and regulatory framework for mini-grids. The
Toolkit will share experiences, benefits, challenges and critical success factors involved.
2.1 Operational Planning and Tariff Setting Issue 2.1.1 Legal Framework and Standards
Developing mini-grid activities should be done within a national legal framework. At this legal level,
there are a certain number of key decisions which have to be taken, pertaining to the strategic –
close to policy level:
- Is private power sector generation allowed (i) for own consumption or (ii) for third party
sales?
- Is power wheeling allowed – allowing a generator to transit energy through a third party grid
to supply his customers? This can be the case with, for instance, a hydro scheme promoter
looking for different clusters of off-grid customers.
- Is there a distribution monopoly? If so, it implies that whenever there is a private initiative
for a small local production, the distribution company has to invest in the grid and agree to
operate it. If not so, are private producers or off-takers allowed to distribute and sell
electricity to rural customers?
Once this legal basis is clarified for mini-grids, the issue of standards and codes of practices to be
simplified for off-grid conditions follows. Here again, generation must be considered separately from
distribution:
- What generation standards are needed in a rural setting? Possibly not that of the high tech
research centres or the international requirements in terms of voltage drops and frequency.
3 http://www.euei-pdf.org/sites/default/files/files/field_pblctn_file/EUEI%20PDF_Mini-
grid%20policy%20toolkit_PIN_Apr2013.pdf
11

Final Report – Support Study on Green Mini-Grid Development
- Experiences have shown that standards of the distribution grid can be simplified; keeping
safety and performances at acceptable level, whilst ensuring that when the interconnected
grid arrives, this mini-grid will be taken over without much adaptation.
- Whilst specifically considering green mini-grids, at the policy and strategic planning levels,
the fact that the renewables are capital intensive will appear blatantly: a clear decision has to
be taken as to whether the government is ready to provide specific consideration to this
environmental and long term sustainability issue or not: indeed, it more often than not will
imply specific incentive schemes which would either cost money (can the country afford it
right now?) or imply foregone income. 2.1.2 Tariff Schemes As regards to tariffs, one should clearly distinguish the following in order to avoid confusion:
1) The end-user tariff
2) The generating sales price (at which the producer will sell to the distributor who may be a third party or himself)
3) The Feed-in-Tariff (FiT)
To which extent tariffs can cover the lifecycle costs of MG (investments for generation & distribution,
O&M, other recurrent costs) is a key political issue. The basic equation to consider is the following,
where subsidies should be minimised.
Final cost = [Generator cost + Generator’s margin] + [Distribution cost + Distributor’s margin]
= End-user Tariff + Subsidy
Appropriate tariff setting, and their combination with subsidies (investments, connections) are a key
enabler for the sustainability of MG or off-grid projects. They are also vital to ensure the participation
of the private sector. Tariffs and subsidies define the project profitability and therefore the suitable
business model to implement. (ARE, hybrids, 2012) 1) End-user retail tariffs
A strategic and policy level decision has to be made as to whether the tariffs of the mini-grids,
whether green or not, should be the same as that of the interconnected grid. If a decision is made
that tariffs should to some extent reflect costs, is the position a 100% pass through or tariffs by
zones? On the opposite, if tariffs are uniform over the country (or zone), there is little chance to have
private investors’ involvement in MG implementation.
Whilst the capacity to pay off end-users may be close to avoided cost – so relatively high, often
reaching a bill of 5 to 10 $/month at the start of the MG project, as time goes by, end-users would
want to see their tariffs aligned with that of the interconnected utility. These socio-political factors
have to be factored in.
Moreover, for GMG, it is totally unrealistic today to expect African end-users to pay a premium for
renewable energy as in developed country. The tariff setting has also to reflect the technology
choice; for instance, the recommended tariff for hybrid systems should reflects the specific cost
12

Final Report – Support Study on Green Mini-Grid Development
structure: a fixed monthly amount fairly reflecting operation and maintenance costs, a fixed monthly
amount partially reflecting investment costs, and a variable amount to reflect fuel costs. Such a tariff
structure provides the operators with clear financial forecast.
In most cases, African grid or utility retail tariffs are uniform within the concession(s) and highly
subsidised (< 0.10 $/kWh). Only few countries (as Uganda and Rwanda) have chosen high tariffs
(0.20$/kWh) to reflect actual production & distribution costs.
In off-grid areas, it is often not clear in African regulations to which extent the MG operators are
allowed to sell to rural customers and can adjust the retail end-user tariffs below or higher the utility
tariff. Tanzania, Rwanda, Uganda and DRC seem to have adjustable tariff policies outside the main
concession to allow profitable business for private MG operators but how it is actually implemented
is another issue. 2) Power selling price from the producer
Most African countries have established a framework to encourage independent power producers
(IPP/GENCO) to generate and to sell power (from renewable energy or not) to the main grid (Utility),
and in some cases (as in Tanzania) to other off-takers or to mini-grids.
In general, an IPP or GENCO can have different outlets to distribute its generated electricity; the selling price(s) will be the determinant for business profitability.
- for own consumption (for economic and reliability reasons)
- to off-takers or anchor customers
- to a major off-taker who can be the utility
- to an independent distributor (DISCOs)
- to end-users in the village (in many cases, the distribution to village customers is done
through a separate distribution activity depending how it is regulated. Whilst in “micro grid”,
the generation and distribution are usually integrated)
In the schematic figure below, an IPP is generating power for an anchor agro-industry and for a cluster of rural settlements. Profitability is strongly different for the 2 scenarios.
13

Final Report – Support Study on Green Mini-Grid Development
Figure 3 : IPP selling power to rural settlements (IED/AFD, 2013)
3) Feed-in-Tariff Scheme and Renewable Energies
The grid connection is a particular case in our MG study. If the grid is at a reasonable distance, it may
make sense to connect the MG to the grid and to negotiate adequate tariff with the utility for the
power balance (excess or deficit) or power wheeling to other customers.
In that scenario, having an off-take obligation of the utility for capacities below a certain level and at
clearly set tariffs, is very important for the viability of such mini-grids as it gives the private investor a
visibility as to a “worst case scenario”, which is the price at which generated power would be bought
by the utility.
The Feed-in-Tariff has been introduced simultaneously with IPP to set the selling price for the
producer. It is generally understood that FiT are exclusively associated with injection of power into
the main grid. However, FiT can also be established for Mini-Grids in case of an IPP selling to a MG
off-taker.
Here again come policy and strategic decisions: if the energy produced is renewable energy based, reasonably high tariffs to allow for decent payback periods are very important.
Renewable Energy Technologies (RET) are mainly promoted through the FiT tariff and in some cases also by fiscal incentives (import duty exemption).
Majority of African countries have or are in the process to set FiT tariffs for RET. However, some of
them, such as Mozambique and Malawi, take a long time doing the reform. Malawi doesn’t have any
regulation yet nor dedicated financing mechanisms and incentives for the purchase of RETs. Even if
existing, RE-FiT might not be adapted to MG yet; as for instance in Kenya and Uganda where FiT
tariffs are not much attractive and don’t apply to schemes below 500kW. RE-FiT for renewable energies exists or are under development in many African countries, mostly for
14

Final Report – Support Study on Green Mini-Grid Development
grid injection; improvement or adaptation to GMG are needed to provide long-term guaranteed
return on investment through payments for electricity generated4; Standardization of PPA to avoid
difficulty or endless negotiations.
A detailed study has been conducted in West African countries to review the policy environment for renewable energy and is presented in annex. (Baseline study report, Ecowas, 2012)
2.2 Private Sector Involvement
Here again comes policy and strategic decision of which place is given to private sector in the off-grid
power sector. The regulatory framework shall be conducive, clear and reliable enough to engage the
private sector with confidence. The 3 key issues to promote private entrepreneurs in MG business
are:
1) Tariff setting and subsidies
(This issue has been presented in above item 2.1)
2) Administrative simplifications
While PPAs, permits, licences, and incentives framework usually exist for rural electrification,
detailed and reliable information on their appropriateness and relevance for mini-grids are
scarce in the literature. One can note that existing administrative procedures are rather complex
for off-grid businesses. They should be simplified and standardised for mini-grid operators and
small scale projects: if the legal and regulatory requirements are the same for a small IPP and
mini-grid operator as for the larger generation and distribution businesses, then the activity will
never emerge.
It has been observed that overregulation and multiple decision makers can also have a disastrous effect. It is common to have the following cumbersome administrative steps:
- Need authorisation from the Ministry of Industry + Energy - Need authorisation on land tenure - Need EIA from water resources, environment and/or forests - Need social impact by minorities ministry - Need the local mayor’s + provincial governor’s approval - Need approval by the regulator on PPA - Need regulator to valid the network, - Etc.
While each and every step may sound legitimate, if each step is very long and detailed, the
transaction costs will kill the MG projects; and kill the Green MG a second time if further
authorisations are required for renewables
3) Specific incentives
4
Amortization + running costs + margin = sales incomes + FiT revenues
15

Final Report – Support Study on Green Mini-Grid Development
There are several specific incentives that are helpful for renewable energy or green power development, including tax and duties:
- Reduced import duties - Profit tax exemption during the first years - Allow accelerated depreciation - Etc.
2.3 Capacity Development Ideally, a proper regulatory framework should also deal with the support and the development of
capacities in management and technology required for local MG operators. The framework should
allow assessment of capacity levels, formulation and undertake the required capacity development
activities.
For instance, the know-how and skills for operating a gasifier or a PV-diesel hybrid will not appear out
of thin air. If one wants a GREEN technology to emerge, it will have to be through a long term
programme approach in order to build the skills (through technical institutions, universities, etc) and
the supply chains of equipment and spare parts. Such support programme could take 5 to 10 years.
3 Financing Frameworks and Instruments
In addition to specific policy and regulatory environment discussed above, an appropriate financing
framework and specific instruments need to be in place to promote GMG and the private sector. The
key financing issues are:
- What is the financial system to fund RE? Is it through the given level of investment support
needed and the characteristics of low demand and capacity to pay? Is the rural demand
marginal vs. the main grid? - Are scarce national and international grants leveraged? Through the RE Funds?
- Is access to credit for private operators a reality? Are the adequate risk management tools in
place? Are there guarantees for off-taker/utility risk/financial worries?
Historically, the Utilities ensured both financing and technical functions; the utility was the borrower, the operator, as well as the regulator. Today, the trend is to separate the 2 or the 3 functions:
- the Borrowers can be government, utility, operators, or RE funds. In India, there is a separate
RE Corporation.
- the Operators can be international utilities or small/medium/large national companies.
However, who will lend them money on a non recourse basis – as they often do not have the
needed Balance Sheets? - the Regulator for the power sector tends to be nowadays a separate, independent body.
The financing models emerging today for fund mobilisation and leveraging grants are through:
- a national utility: remains the most effective - large scale concessions: who are the credible contractors?
16

Final Report – Support Study on Green Mini-Grid Development
- rural electrification funds (REFs): to gather levies and supports from the government and
international donors; generally just bank accounts for transiting investment support and
sometimes operating costs
The main accesses to financing mini-grids are the national REF fund, the credit lines, the access to
soft loans (long term and low interest rate), and the local banks and MFIs (still reluctant for
supporting local private investors in mini-grids, given the high perceived risks and the limited
guarantees).
A major lesson on financing framework is that there is an urgent need to rethink and drastically
strengthen financing for off-grid rural electrification, with RE funds / agencies fully empowered as
professional financial intermediaries, capable of developing business plans, mobilising private sector
and leveraging scarce grants.
New financing mechanisms should provide access to loans (suitable interest rates and loan duration),
subsidies and fiscal incentives (tax credits, import duties, grants, guarantees), and supports for
preparatory works (site surveys, market studies, capacity-building).
4 ICF Priority Countries
4.1 Framework and Instrument Comparison
Based on literature review and, whenever possible, interviews of key actors, the table below
summarises the current situation found in each ICF priority country regarding their policy and
regulatory instruments for off-grid market and renewable energies, and by extension for green mini-
grids.
Table 2: Comparison of Support Policy and Regulatory Instruments (author, IED, 2013)
MG regulations Kenya Tanzania Mozambique Malawi Rw Ug DRC
Institutions: REA + ERC REA + EWURA FUNAE REMC + MERA Mininfra + RURA
REA + ERA No REA,
+ EWSA no Regulator
MG Planning: MG planning Starting MG
no MG planning no MG planning MG planning? MG planning no MG planning
planning
Procedures for MG: Std PPA Std PPA, PPT,
? PPP Licences, Licences, PPA no incentives
permits no std PPA
FIT tariffs: FIT (RET), FIT (RET+MG) FIT (Hydro), FIT (RET), FIT (Hydro)
differentiated, not differentiat. No FIT yet No FIT yet differentiated, differentiated, "differentiated"
negociable fixed (hydro) negociable < cap negociable < cap ?
Retail tariffs for MG: Uniform, not uniform, Uniform? Uniform? not uniform? ? ?
fixed, negociable, fixed? fixed? negociable, negociable? negociable?
(Utility tariff) (low) (medium) (low) (low) (high) (high) (low)
not subsidized (subsidised?) subsidised not subsidised subsidised?
Access to finance: REF, REF, FUNAE REF Local banks REF (levy) No
credit line credit line (TIB)
Private sector & MG: IPP, SPP & SPD SME, IPP, IPP, SME, IPP, IPP, GENCO, Self-consumer,
no DISCO no DISCO no DISCO GENCO, DISCO DISCO IPP, no DISCO
All acronyms are defined in the Abbreviation & Acronym section before Chapter 1 “?” means that information was not found or could be verified.
The above table attempts to highlight the various national environments based on their institutions,
policies, regulation, tariffs, financing, and private sector participation. The institutional and private
sector environments for those ICF priority countries are as follows:
17

Final Report – Support Study on Green Mini-Grid Development
Institutions: Three countries (Kenya, Tanzania, Uganda) have specific bodies for rural
electrification, for regulation (REA & ERA) and for renewable energy promotion. Other countries
manage with existing institutions (ministries, committees, funds) which might need to be
restructured as FUNAE (Mozambique) or Mininfra (Rwanda). Dedicated institutions don’t exist in
DRC yet.
MG Planning: while MG planning is already in place in Kenya, 3 other countries (Tanzania,
Uganda and Rwanda) have recently included off-grid & MG development in their RE planning or
Master Plan. Other countries are not addressing specifically off-grid in their strategic plans yet.
Procedure for MG: While PPAs, permits, incentives framework usually exist for rural
electrification, detailed and reliable information on their appropriateness and relevance for mini-
grids were scarce in the literature. Some information were found on permits and licences for MG
in Tanzania, Uganda and Rwanda.
FiT tariff: Almost all countries have or are in the process to set FiT tariffs for RET. Only
Mozambique and Malawi take a long time doing the reform. Malawi doesn’t have any regulation
yet nor dedicated financing mechanisms and incentives for the purchase of RETs. Even if existing,
RE-FiT might not be adapted to MG yet; as for instance in Kenya & Uganda where FiT tariffs are
not much attractive and doesn’t apply to schemes below 500kW.
Retail tariffs: In most cases, grid tariffs are uniform within the concession(s) and highly subsidised
(‘Low’ < 0.10 $/kWh). Only Uganda and Rwanda have high tariffs to reflect actual production &
distribution costs (‘High’ > 0.20$/kWh). Tanzania, Rwanda, Uganda and DRC seem to have
adjustable tariff policy outside the main concession to allow profitable business for private MG
operators.
Access to finance: A specific fund for rural electrification (‘REF’) to gather levies and supports
from government and international donors is rather common in those countries except for
Rwanda and DRC. Credit lines have been implemented in Kenya and Tanzania but no positive
results have been obtained so far for small-scale off-grid projects. Some local banks are involved
in Rwanda for MG development.
Private sector: To some extent, all ICF countries are supporting private sector participation with
different mechanisms and tools as fiscal incentives, FiT, simplified administrative procedures,
other supports to SME and PPP, etc. All ICF countries have established a framework to encourage
power producers (IPP/GENCO). For power distributor (Off-taker/DISCO), there is a real vagueness
(e.g. Kenya) on regulation for private operators to distribute and sell electricity in off-grid areas
and mini-grids (status, permits, tariffs), except for Tanzania, Uganda, Rwanda which have more
clearly addressed the issue of off-grid operators/distributors.
4.2 Remaining Instrument Gaps
From the below table, one can identify some key remaining policy instrument gaps that could affect -
in varying degrees - GMG programme implementation. Furthermore the situation changes more or
less rapidly in each country.
18

Final Report – Support Study on Green Mini-Grid Development
Table 3: Key remaining policy instrument gaps in ICF priority countries
MG regulations Kenya Tanzania Mozambique Malawi Rw Ug DRC
Remaining Gaps: No FIT < 500kW, low access to No MG planning No MG planning No REA No FIT < 500kW, No MG planning
FIT too low soft loans FIT too low
too low tariff & differentiated RE- No REA, no No REA No FIT for solar Umeme's low No REA, no
Not adjustable FIT Regulator as & wind creditworthiness Regulator
No off-grid Tanesco's low No FIT yet No FIT yet, no No REF fund bureaucratic No FIT for solar
distributor creditworthiness (under prepar.) RET incentives process & wind
too low tariff & too low tariff & No REF fund
Not adjustable? Not adjustable?
No off-grid No off-grid No off-grid
distributor distributor distributor
Two of those barriers could be more critical in the design of the MG development programme and should draw particular attention to the following:
Maladjusted retail tariffs, usually too low (cross subsidised), which impede sustainable
business model for MGs and off-grids.
Maladjusted regulation preventing off-grid operators to distribute and to sell power in off-grid areas.
From this policy and regulatory analysis, we can sort those ICF priority countries in 3 categories:
1) Well-advanced policy & regulatory frameworks: Uganda, Tanzania
2) Ongoing development of policy & regulatory frameworks: Kenya, Rwanda, Moz, Malawi
3) Poor policy & regulatory environment: DRC
The next box provides a more detailed description of the development achieved in Kenya regarding policy and regulatory frameworks. Policy and regulatory framework in Kenya (based on data collected by local DFID representative, May 2013) In Kenya, the existing policy, regulatory and licensing framework for setting up and operating mini-grids is not
effective and there needs to be a serious push to involve the private sector. Some of the identified factors that
impede the private sector development are: unclear roles of private sector vs. government in off-grid sector,
rigid model for generation & distribution (arbitrary feed-in-tariffs with preferential support to
generation only, apparent KPLC/REA exclusivity in electricity distribution, IPP not allowed to sell to
non-KPLC counterparts, non-KPLC off-takers are not allowed to distribute and sell electricity in off-
grid areas), uniform tariff policy excluding cost-recovery and new investments for private entrepreneurs, lack of available bank financing and other financing instruments (credit lines), limited local supply chains and expertise unfamiliarity and lack of awareness with suitable renewable technologies by energy suppliers & users VAT at the port of entry (significant cash flow and Forex issue)
An open and honest discussion with key actors (KEREA, KEPSA, IFC, MoE, REA, ERC and KPLC) and other
stakeholders around this question should be the starting point for any drive to change the policy and
regulatory framework for mini-grids. Strategic intermediate actors as Kenya Renewable Energy Association
(KEREA) and Kenya Private Sector Alliance (KEPSA) could help to raise the issue of reform in energy regulatory
framework both on policy dimensions and financing dimensions if private sector is to play an important role in
mini-grids in Kenya. ERC is playing a critical role in this process of opening up the power sector in Kenya for the
private sector.
19

Final Report – Support Study on Green Mini-Grid Development
In areas well away from the current grid, there is a potential for the private sector to engage and to operate
independent mini-grids, providing generation and distribution to rural customers. This would supplement the
existing mini-grid efforts of REA and Kenya Power, and accelerate access to energy in the country. Despite the
provision in law for this model, the process has not been clear enough, nor incentives powerful enough, to
attract private providers to take this step. Large potential for green mini-grids using agricultural waste and renewable resources also exists to supply
isolated mini-grids for rural communities, and at the same time powering commercial agricultural estates or
feeding the national grid. Proposed guidance to improve private sector investment:
Clarify policy and simplify administrative procedures5 around private distribution of electricity (PPA,
licenses, permits, and land tenure).
Establish financial incentives for private participation & operation of mini-grids, including waiving uniform tariff.
Support efforts to further enhance KPLC distribution network (capacity, efficiency) and to increase
private participation in distribution (concessions, lease contracts and management contracts). Plan ahead to avoid perverse situation if the grid would arrive during the fixed incentive period.
As example, the REACT grantee, Teita Estate, is establishing a small power production project using biomass
waste from its commercial agricultural estate in Kenya: 8MW from sisal waste. Teita is a large, established
company engaging in power production as a strategic complement to its business. They are therefore
expecting to secure financing from their commercial bank, with which they have an established relationship.
Furthermore this grantee has been in a position to negotiating favourable feed-in-tariffs with the government.
5
With about 10 government agencies, the regulatory and licensing processes in Kenyan energy sector are particularly cumbersome with high licensing transaction costs and time
20

Final Report – Support Study on Green Mini-Grid Development
5 Annexes
5.1 RET Support Policy and Regulatory Indicators in Western Africa
The following table shows the disparate policy support and environment for the promotion of RET in
West African countries (baseline study report, Ecowas, 2012). Unfortunately, a similar database for
Central & East Africa doesn’t exist yet and the information mainly concerns the grid connected green
power plants.
Table 4: RET Policy Indicators in ECOWAS
RET policy indicators Ghana BKF Mali Seneg Togo Benin Nigeria Guin-B
(definition given in Annex) 2011 2010 2010 2010 2011 2010 2010 2010
Feed-in tariff/premium payment Y N n.a. Y N N Y N
Electric utility quota obligation Y N n.a. N N N N Y
Net metering N N n.a. Y N N N N
Biofuels obligation/mandate Y N n.a. N N N N N
Tradable REC N N n.a. N N N N N
Capital subsidy, grant, or rebate Y N n.a. Y N N Y N
Investment or production tax N Y n.a. Y N N N N credits
Reductions in sales, energy, CO2, N Y n.a. n.a. Y Y N N VAT, or other taxes
Energy production payment N Y n.a. n.a. N N N N
Public investment, loans, or grants Y N n.a. Y N N Y Y
Public competitive bidding N Y n.a. n.a. N N N N
Source: http://www.ecowrex.org/indicators?title=&items_per_page=All
21

Final Report – Support Study on Green Mini-Grid Development
# RET Support Policy indicators Description R01 Feed-in tariff/premium A policy that sets a price that is guaranteed over a certain
payment period of time at which power producers can sell renewable energy generated electricity into the grid. Some policies provide a fixed tariff while others provide fixed premiums added to market- or cost-related tariffs. Feed-in tariffs are expressed in national currency per kWh or national currency per MWh.
R02 Electric utility quota obligation Generally called Renewable Portfolio Standard (RPS), renewables obligations or quota policies. A standard requiring that a minimum percentage of generation sold or capacity installed is provided by renewable energy. Obligated utilities are required to ensure that the target is met.
R03 Net metering Allows a two-way flow of electricity between the electricity distribution grid and customers with their own generation. Customers pay only for the net electricity used.
R04 Biofuels obligation/mandate Mandates for blending biofuels (Ethanol and Biodiesel) of total transportation fuel in per cent or million litres.
R06 Tradable REC Certificates provide a tool for trading and meeting renewable energy obligations among consumers and/or producers, and also a means for voluntary green power purchases. They operate by offering 'green certificates' for every kWh or MWh generated by a renewable producer. The value of these certificates, which can be traded in the market, is added to the basic payment for the renewably generated electricity.
F01 Capital subsidy, grant, or rebate This group of fiscal policy types is characterized by one-time payments by the government to cover a percentage of the capital cost of an investment.
F02 Investment or production tax Provide the investor or owner of qualifying property with an credits annual income tax credit based on the amount of money invested in that facility or the amount of electricity that it generates during the relevant year. It allows investments in RE to be fully or partially deducted from tax obligations or income.
F03 Reductions in sales, energy, A reduction in taxes which is applicable to the purchase (or CO2, VAT, or other taxes production) of renewable energy technologies.
F04 Energy production payment Direct payment of the government per unit of renewable energy produced.
P01 Public investment, loans, or Providing financial support can enable the development of grants infrastructure projects through the use of public benefits, funds, loans, as well as other financing options. These various financing options provide a means for allocating the capital necessary for the implementation of renewable energy projects.
P02 Public competitive bidding A tendering system by which contracts to construct and operate specific projects or fixed quantities of renewable capacity are awarded. Bidding for renewable power capacity can be done at the national or sub-national levels. By encouraging competition between utilities the goal of the tendering system is to reduce the price of supplying renewable energy.
5.2 Tariff Comparison in some African Countries The method used to calculate the average tariff in the graph below was to divide total utility
revenue into total units sold to consumers. One should take into consideration the impact of the
exchange rate on the tariff data.
22

Final Report – Support Study on Green Mini-Grid Development
Figure 4 : Calculated Average Electricity Price (USD) in SADC (USAID, 2011) Source: “Technical Report: RERA Publication on Electricity Tariffs & Selected Performance Indicators for the SADC Region”, SATH, USAID/Southern Africa, August 2011.
Other older figures (2006 & 2009) are given in the next 2 tables (Source: “Long Run Marginal Cost of Service Tariff Study”, Robert Vernstrom for TANESCO, May 2010).
23

Final Report – Support Study on Green Mini-Grid Development
Table 5: Indicative Electricity Cost in Africa (USD, 2006)
5.3 References & Bibliography
- “Innovative approaches for electricity supply in Sub-Saharan Africa”, AFD-IED, 2009 - “Hybrid Mini-Grids for Rural Electrification: Lessons learned”, ARE-USAID, 2012 - “Renewable Energy Incentives – Regional Policy Guideline for ECOWAS”, IED, 2012 - “Baseline Report for the ECOWAS Renewable Energy Policy (EREP)”, ECREEE, 2012 - “Powering Africa through Feed-In Tariffs”, Heinrich Böll Stiftung, Feb 2013 - “A New Scheme for the Promotion of Renewable Energies in Developing Countries - The
Renewable Energy Regulated Purchase Tariff”, JRC-EU, M. Moner-Girona, May 2008 - “Electrification and Regulation: Principles and a Model Law”, Kilian Reiche, Bernard
Tenenbaum, WB, 2006 - “Off-Grid Business Models”, June 2009, Helios SE, Training session 2
- “Energypedia.info” provides preliminary information on ‘Energy Policy framework’ per
country, p.e.
o https://energypedia.info/index.php/Rwanda_Country_Situation#Policy_framework.2 C_laws_and_regulations or
o https://energypedia.info/wiki/Uganda_Energy_Situation#Policy_Framework
24

Final Report – Support Study on Green Mini-Grid Development
Chapter 7: Smart Technologies and Innovative Energy
Storage
TABLE OF CONTENTS
KEY HIGHLIGHTS .................................................................................................... 2
1 INTRODUCTION ............................................................................................... 4
2 NEEDS & CHALLENGES FOR MINI-GRIDS .......................................................... 4
2.1 Management of Energy Generation ................................................................................... 4 2.2 Management of Energy Distribution .................................................................................. 5 2.3 Management of Energy Consumption ................................................................................ 5 2.4 Upgrading Mini-Grids ........................................................................................................ 5
3 SMART OR INNOVATIVE SOLUTIONS ............................................................... 6
3.1 Energy Smart Technologies (EST) ....................................................................................... 6
3.1.1 Definition ...................................................................................................................... 6
3.1.2 Functions & Products .................................................................................................... 7
3.1.3 Some Experiences & Lessons Learnt .............................................................................. 15
3.2 Energy Storage Solutions (ESS) ......................................................................................... 18
3.2.1 Context ........................................................................................................................ 18
3.2.2 Roles & Functions ........................................................................................................ 19
3.2.3 Storage Products ......................................................................................................... 19
3.2.4 Best Practices & Environmental Concerns .................................................................... 22
4 REFERENCES .................................................................................................. 23
4.1 EST .................................................................................................................................. 23
4.2 ESS .................................................................................................................................. 23
LIST OF TABLES AND FIGURES
Figure 1 – Rural Electrification & upgrading scenarios
.............. .......... ......... ..........
.............. .......... ........ 6 Figure 2 – Smart Metering Systems ...................................................................................................... 10
Table 1 – Prepayment system costs (Eskom) ........................................................................................ 16
1

Final Report – Support Study on Green Mini-Grid Development
Key Highlights a) Definitions and range of smart technologies The present review of smart technologies available for rural electrification will show the huge
potential of applications for developing countries, and in particular Africa where innovative and self-
developed solutions are emerging. Those technologies are developed to improve performances and
sustainability of electrification schemes and to support their energy management. b) Management of generation, distribution, and consumption in MG The breakthrough of low-cost electronic devices and communication systems in rural areas allowed
the emergence of attractive and affordable tools to remotely control, manage and supervise the MG
schemes and the billing systems. Prepayment systems are the most common and alleviate barriers
such as irregular incomes, logistical constraints & default payments, tampering,
disconnection/reconnection costs, etc.
However, before installing an advanced metering system, or any type of smart system, one should
consider the balance between costs and benefits of such an investment. As described above, there is
a wide variety of equipments installed on generators or consumers’ side and offer various services.
Some components can be very expensive and can require complex integration in the grid’s control
system. Additional communication infrastructure can be very costly if used for a single purpose (e.g.
meter reading).
Remote banking through mobile phone also offers a promising service for rural population, with
valuable impacts for electricity access, but more investigations are needed regarding how to organise
and secure money transfer from rural (consumers) to urban areas (vendors) in less-advanced African
countries.
Low-cost solutions to improve MG management and performances exist and have been developed
specifically for remote conditions within developing countries. But in no case these smart
technologies could replace strong capacity building, training, and awareness of operators and
consumers. c) Management of MG upgrading Matching the power demand and the supply in the medium and long term is a real challenge for isolated mini-grids given the uncertainties on actual load growth and on national RE priorities.
Given the actual evolution of the load profile and the presence of nearby load demand centres
(clusters of households), other mini-grids, or expanding main grid, there are different upgrading
options for an isolated MG such as: connection to the main grid, interlinking between mini-grids, or
mini-grid capacity expansion. Such adaptations, if not initially planned, can lead to significant costs
that will alter investors’ payback.
Initial network design should properly consider potential growth of the load and/or interconnection
with the main grid (considering MV primary lines, cable cross sections) to avoid replacement of
installed equipment or its costly reinforcement.
Power generation plants should be designed in a way that they can be easily dismantled and resettled in another location if extending grid reaches the area, or in a way that allows
2

Final Report – Support Study on Green Mini-Grid Development
synchronisation with the main grid, especially for renewable power injection under a suitable feed-in-tariff providing acceptable return on investment. d) Management of energy storage in MG Despite some interesting and promising developments on energy storage over the last decade,
mainly driven by electrical vehicle industry and more recently by grid-connected renewable energy
farms, there are limited progress to date, limited options for rural electrification and the high cost of
energy storage (i.e. the electrochemical batteries) remains the major barrier for its utilisation, in
particular for green mini-grids.
More pilot projects are needed to learn from hybrid systems with high renewable share and limited buffer storage or no storage at all.
3

Final Report – Support Study on Green Mini-Grid Development
1 Introduction In industrialised countries, with the increasing penetration rate of renewable energies in
conventional networks, there is a need to manage the impact of those intermittent and less-
predictable generation sources on the power quality and availability. Smart grids can be defined1 as
networks that monitor and intelligently manage the transport of electricity from all generation
sources to meet the varying electricity demands of end users.
The recent developments in Energy Smart Technologies (EST2) for better energy management and in
new Energy Storage Solutions (ESS) for grid-integration of renewable energy sources are presently
changing the way electricity is distributed, stored, traded and saved. ESTs aim to address some
specific concerns such as dynamic demand management, grid supply reliability (voltage, frequency),
topology flexibility, efficiency, peak curtailment/levelling, load adjustment, sustainability, etc.
Mini-grids require specific technology solutions that differ from that of a main grid. Two key challenges will be considered:
- the management – at low cost – of remote power generation, distribution and consumption; - the upgradability of the generation and distribution infrastructures
The intermittency of renewable energies and the evolutive nature of mini-grids (growing demand &
matching with grid extension plans) lead to technical and managerial issues that will also be
considered and analysed.
EST & ESS can mitigate some challenges regarding mini-grid management and further multi MG
interconnection or grid-connection. The objective of this chapter is to identify – non-exhaustively –
some cost-effective options within innovative technologies for better power supply and load
management, suitable in less-developed countries.
2 Needs & Challenges for Mini-Grids
The main challenges that MGs are facing in rural areas are their operation and maintenance and the
management of the customers. Both activities are delicate and require skills and time. In other
words, any affordable and easy-to-use technology which can facilitate the control of power
generation, distribution and sales would make the scheme more sustainable.
Furthermore, the adaptability of mini-grids for later integration into the main grid or for linking nearby mini-grids is another critical issue.
2.1 Management of Energy Generation The specific needs for better management of power generation are as follows:
Control, monitoring and troubleshooting of MG operation (in real-time) Data acquisition system for deeper analysis and diagnosis
1 http://www.iea.org/topics/smartgrids/
2 Terminology was proposed by Bloomberg New Energy Finance and will be used in this study because there is no other standard one.
4

Final Report – Support Study on Green Mini-Grid Development
Optimisation of multi-generating sources (in case of hybrid systems) Optimisation of backup and storage Smoothening of the renewable energy intermittence Voltage, frequency and power factor management Load balancing (matching supply and demand; between phases; frequency)
2.2 Management of Energy Distribution The specific needs for better management of power distribution are:
Reduce technical and non-technical losses in the network
2.3 Management of Energy Consumption The specific needs for better management of energy consumption are the following:
Improved demand/supply matching: special devices as current limiters, power/energy
management administrators, smart meters
Simplified and secured billing system and money collection: special devices for prepayment, mobile banking systems, flat rate system
Avoid non-technical losses (“anti-fraud”): special devices for connectors, connecting cables,
meter boards, protections Reduced consumptions: energy efficient appliances
2.4 Upgrading Mini-Grids In developing countries, there is a tremendous uncertainty on how the village loads will evolve in
rural areas. Load forecast (with assumptions on connection and consumption growth rates) is usually
part of the preparatory studies to allow proper system sizing before procurement. Main grid
extension plans are also carefully investigated. But the actual evolution is often different from
expectations and this can seriously affect the return on investment and the viability of an
implemented mini-grid. As illustrated in the next diagram, 2 major scenarios can occur:
- the main grid is unexpectedly extended to capture one or more mini-grids, - 2 or more mini-grids are interconnected to better match the growing demand
5

Final Report – Support Study on Green Mini-Grid Development
Grid Off-Grid
MV Perimeter Perimeter
Distribution
Off-Grid Biomass
Perimeter HV
Transmission
MV Grid MG
Solar/wind Extension > X pop MG linking
MG
Hydro
Hydro
MG
MG
Figure 1 – Rural Electrification & upgrading scenarios
The challenge will be to minimise the cost of adaptation and the impacts on the management scheme.
3 Smart or Innovative Solutions
3.1 Energy Smart Technologies (EST) 3.1.1 Definition
At this early stage of development, there is no consensus definition of what is EST yet but from US
DOE3 approach, EST shall use new and innovative technologies, in particular advanced digital
technologies (i.e. microprocessor-based measurement and control, communications, computing, and information systems), inspiring hope of a more efficient, resilient and flexible energy system, capable
of coping with intermittent generation, distributed energy resources, and changing demand.4
There are a wide range of innovative devices which can be used and combined to potentially address a lot of needs as those mentioned above for MGs. They actually include 3 categories of devices:
- Sensing and measurement devices: advanced microprocessor meters (smart meter) and
meter reading equipment, wide-area monitoring systems, dynamic line rating,
electromagnetic signature measurement/analysis, time-of-use and real-time pricing tools,
etc.
- Control devices: advanced switches, breakers and cables, backscatter radio technology, digital protective relays, etc.
- Integrated communication devices: data can be collected via modem (most common) or via
direct network connection.
3 “Control for Renewable Energy and Smart Grids”, Eduardo F. Camacho, Tariq Samad, 2011, www.ieeecss.org
4 http://about.bnef.com/events-awards/leadership-forums/energy-smart-technologies-2012/
6

Final Report – Support Study on Green Mini-Grid Development
Using those innovative devices, plenty of smart technologies or products can be designed and developed to meet the above needs (generation, distribution, consumption, upgrading). 3.1.2 Functions & Products 3.1.2.1 Smart Management of the Generation In the field of energy production, EST technologies can fulfill the following duties: 1. Control and monitoring of operation, troubleshooting, control of failure, etc.
o Small-sized standard diesel generators are usually sold without sophisticated controller and
data acquisition system. These devices are sometimes available as option and are required
when coupling (synchronisation) with other gensets or with solar/wind generators.
Communication between multi-generators is essential to optimise operation and to save fuel
and wear.
o On solar and wind side, over the last decade there have been many products developed by
inverter & Balance-of-System (BOS) manufacturers (SMA, Studer, Fronius, AEI, Kaco,
Outback, Xantrex). Most BOS equipments integrate smart devices to better manage energy
production and supply. Energy management in hybrid systems especially deals with multi-
sources, back-up gensets and batteries. Common features include: Automatic protections, limitations, switching, disconnections
Built-in Data Logger (energy flows, solar/wind resources, battery charge status and ageing)
AC/DC bus management
Communication devices between inverters, load controllers, charge controllers, meters
Remote communication for operating data and troubleshooting
User’s interface (display & data logging)
p Circutor has developed a special concept
5 for managing, controlling and monitoring
distributed generation/accumulation and demand in hybrid micro-grids (Electricity
Dispenser, Battery Supervisory Controller, 3-phase Power Analyser, PowerStudio SCADA). For
micro hydropower generation, the low-cost Electric Load Controller (ELC) allows to match the
production with the demand without unreliable and expensive hydraulic governors and without turbine speed variations.
o For large hybrid, SMA has developed a new product “fuel-saving controller” allowing high
penetration rate of solar PV (up to 60%) in an isolated diesel-based industrial system (1-
5MWp) without battery storage, by managing carefully the load demand and the productions from gensets and solar.
o Biomass & hydro power plants don’t benefit from such abundance of smart technologies. 2. Forecasting tools for RET sources (wind, solar) are actively developed in industrialised countries
and will be used soon in African or Asian contexts. They can greatly help in managing multi-
sources for off-grid systems. One example has been found in Burkina Faso, where the 2IE project
announce the use of a “meter forecast system” (PVSEC conference 2012, 5.BV1.50), but
forecasting tools are not yet easily applicable for developing countries.
5
http://www.circutor.com/docs/Cat_Renovables_GB.pdf
7

Final Report – Support Study on Green Mini-Grid Development
3. Voltage, frequency and power factor controllers are not new devices but progress in electronics
allows substantial reduction of power losses in mini-grids. They enable management and
matching of production and consumption in due time, reducing significantly power losses (e.g.
automatic capacitor bank allows automatic compensation of reactive energy in networks with
fluctuating loads and power variations during seconds). 3.1.2.2 Smart Management of the Distribution
Transformer station monitoring and control (as the Landis+Gyr S650 Smart Grid Terminal) is a
component for advanced low voltage distribution network infrastructures. The terminal provides
cover for multiple application areas by one device, including energy balance settlement, non-
technical loss6 detection and network optimization, as well as power quality analysis.
The “energy fraud preventing kit” (Michaud) is an outdoor fuse cut-out7 on top of the pole which
keeps consumption under control and avoids exceeding the subscribed demand. It can be
equipped with a fuse or a thermal or an electronic load limiter, and provides the network
management system with a simple cut-off point against energy fraud risk. 3.1.2.3 Smart Management of Power Consumption
In the field of energy use, EST devices can fulfill the duties as load control and limitation, automatic protection, payments, remote switching, disconnections (global or individual). 1. Devices limiting and/or controlling the demand
o Smart meters8: intelligent electricity meters allow two-way communication through a
communication system (GSM with SIM cards, satellite, radio, power line PLC), sending
accurate meter readings and energy usage details to the operator (energy supplier) and
giving key information to the customers through an energy display. This new technology
open up all kinds of opportunities to save energy and money, to increase flexibility in energy
use (between neighbours), to tailor services and tariffs to exact customer’s needs, etc. There
are a wide range of products available on the international market with a variable degree of
sophistication. Only simple smart meters (e.g. with prepayment or remote payment - see
further) can have potential for rural mini-grid projects in Africa.
o Improved energy meters: new generation of low cost, low consumption meters integrated in customer board are now commercialised for low income customers.
Example: RE Meter Kit (Michaud) is a turnkey cost-effective customer board with
accurate energy metering (1 to 15A, class 1). This board is provided with a protection cut-out, possibly a 220V electrical socket as well as a trapdoor for meter reading and access
to the earth leakage circuit breaker (ELCB).
o Energy or current limiter: includes various devices as electronic or thermal (PTC) switch,
circuit breakers, fuses that can limit the current of each customer at a fixed value. The
resulting load factor of the power plant is usually low and the unused capacity is not
valorised.
6 Non-technical losses: theft of electricity and measurement errors that could exceed 30% in some African countries
7 Protection device for protecting power system from over-load and short-circuit failure
8 http://en.wikipedia.org/wiki/Smart_meter
8

Final Report – Support Study on Green Mini-Grid Development
Example: the Aladin Service Connection Kit (Michaud) is a connection box for small customers with an electronic load limiter instead of the conventional meter. It is provided with a fuse switch connector to simplify any power cuttings without the intervention of the customer / operator in the event of energy fraud or failure to pay. It is a “fixed price energy management system” located on the façade or top of the pole which helps movements outside the core system to prevent fraudulent acts inside end-
users’ homes.
o Energy management systems: several developers have designed smart devices allowing
better management of rural customers having specific needs and behaviour.
The energy dispenser/meter, built by Circutor (Spain)9, is an advanced electronic meter,
which is installed in the house of each mini-grid’s user and which communicates with the
power plant’s supervisory control. It contains an operation algorithm based on EDA
concept (Energy Daily Allowance - developed with TTA10
), and allowing adaptation to the
state of charge of the battery system in the power plant. The meter provides energy
measurement, advices to user and limitations in power and in available energy based on
the tariff contracted (both with disconnection above preset limit). The bonus mode and
restriction mode encourages adequate user load management. User pays for availability
of energy, not for the consumed energy.
The Easynergy Kit (Michaud – France) is used to control power and energy of a single customer connected to the electrical network (main grid or off-grid). The energy flow is controlled thanks to an electronic energy regulator, instead of a meter. Power supply is turned off for a few seconds if it is exceeds the calibrated power level. Energy access is also turned off if the calibrated energy quantity has been consumed within the defined service time. The energy which is not consumed is
reusable on the next service time. The regulator is particularly adapted to fee-for-
service billing and for rural mini-grids.
The MicroPower Smart Meter (Inensus - Germany) is a Load Management and Accounting Unit (LAU) including metering, power & energy limitation and DSM management (load shedding, deferrable loads, and disconnection). The individual meters
communicate with the power plant through grid frequency measurement. This meter is
part of a Micro Power Economy model11
developed by Inensus, designed as a risk
management tool for rural electrification.
In France, the “Linky” programme aims to reduce peak load demand on the main grid by asking voluntary customers to have special load shifting device (e.g. BluePod from Voltalis). The smart meter device communicates in both directions, analyses the detailed consumer’s profile in real-time and can switch off deferrable loads daily or periodically for 10 to 15 minutes (as heaters, water heaters), without affecting customer’s comfort.
9 http://fr.circutor.com/energie/energies-renouvelables_a_1127.aspx
10 “15 years of field experience with the “energy daily allowance” concept as the basis for load control and guide for social behaviour in rural micro grids”, A. Graillot, M. Briganti, M. Solano-Peralta and X.Vallvé, TTA, April 2012
11This Micro Power Economy model leans on three core components to mitigate the risks: (i) involvement of stakeholders
9

Final Report – Support Study on Green Mini-Grid Development
2. Devices allowing prepayment
The prepayment meter industry started about 20 years ago, and is widely developed with high
competition between manufacturers (e.g. Landis & Gyr, Siemens, Conlog12
). In India alone, there are
already more than 20 manufacturers of prepaid meters. Benefiting from cost reduction, prepayment
meters have become very popular among African utilities solving many problems linked with fraud
and money collection in urban and rural areas. Main African countries having widely implemented
prepayment meters are South Africa, Sudan, Morocco but many other could be mentioned too.
In principle, the prepayment management system should include 3 components: (i) the prepayment
meters (tokens, cards, code; combo or split), (ii) the vending unit (point-of-sales, internet, scratch
cards) and (iii) the vending and management servers (operator/utility). Different approaches of
prepayment have been developed offering a wide range of management schemes: o Tokens: buying tokens with cash at a point-of-sales or paypoint (see figure below) o Reloadable key or card: buying credit with cash at a paypoint with terminal (data from customer
can be sent to operator’s server) o Scratch card: buying credit with cash at a paypoint and reload meter with code (see box below) o Internet: buy credit and get code through mobile banking (internet) o GSM: buy credit and get code through mobile banking (SMS) o Smart meters (with SIM card): buy credit and send data from the meter (SMS)
Figure 2 – Smart Metering Systems
(from http://www.wasion.com/en/2010060708172062.html)
Box: The Scratch Card Payment System uses cell phone communication to sell electricity to customers,
similarly as scratch cards for mobile phone available at many retail points. It is a prepayment vending solution
for areas with GSM coverage, where no on-line vending points are available. The consumer uses his cell
phone to communicate with the Scratch Power server via the GSM network, which in turn communicates with
the e-Vend server13
to generate the credit transfer number which is then communicated to the consumer’s
cell phone via SMS. Alternatively, point-of-sale vending terminal can be used with either a fixed line PSTN or
through mobile GPRS. 13
Part of Schneider/Merlin Gerin group - http://www.conlog.co.za/pages/ProductsServices/Meters.html
14 web server which provides a real-time vending service interface for authorized vending clients over the LAN/WAN, Intranet or Internet
10

Final Report – Support Study on Green Mini-Grid Development
And finally the prepayment meters can be either Split or Combo type. The split meter has separated
prepayment meter and customer interface unit. It is preferred when a customer shouldn’t have
access to meter or in culturally sensitive environments.
o Prepayment meter: contains all critical function such as metering, token decryption and load
control functionality. It has a two-wire communications interface to the remotely located
customer interface unit, operates independently and is immune to any form of tampering on the
interface unit. o Customer interface unit: comprises a keypad for the entry of prepayment voucher numbers and a
display for accessing parameters such as remaining credit and various meter status functions.
Examples of Products:
o Conlog BEC series: South African manufacturer provides different models of
prepayment with various features (disconnection, reconnection, reverse energy,
taper detection, ELCB) with some adapted models as BEC 23 ECU (max 20A) for low-
cost rural electrification project. o Cashpower prepaid meters from Landis & Gyr (Swiss)
14 range from small single phase
meters (Gemini, ECU, Sabre) to 3-phases meters, combo or split. Price starts from
350€ (ECU) and 390€ (Gemini).
The ECU is a keypad-based meter with built-in earth leakage and over current protection. The ECU meter is based on the ESKOM specification (SA) which calls for a prepayment meter that can be fitted into a standard plug-in base. This concept ensures simple installation and replacement procedures.
Gemini has 3 programmable modes (prepayment, credit, energy limiting) and standard protections (surge, tampering).
3. Devices allowing remote payment
Today the expansion of GSM network in rural areas has changed ways to operate and manage
electrification infrastructures. The access to mobile network allows in particular remote payments or
prepayments through what is called today the “mobile banking” or mobile payments. This low-cost
solution is progressively solving the problematic management of “reload centres” (logistic and
access).
In addition, as described above, remote communication through GSM also allows remote control and
monitoring of equipments either from generating plants or from customers. Many cumbersome
activities as door-to-door meter reading, money collection or troubleshooting can be alleviated.
The technology is simply used to communicate with a bank through SMS, far easier and cheaper than
other mobile banking systems (Direct Mobile Billing, Mobile Web Payment, NFC payment) using
internet or smart phones (mobile wallets, credit cards). Even the basic SMS-based mobile banking
system allows credit top-up, bill payments, salary payments, and other banking services such as
deposit, national or international money transfers. 14
http://www.landisgyr.com/products/electric-meters/prepayment/prepayment-meters/
11

Final Report – Support Study on Green Mini-Grid Development
In Africa, prepayment meters are becoming the new standards for both urban and rural customers;
only large customers still get conventional energy meters. There are many companies/organizations
working on innovative energy service solutions through SMS-based communication to facilitate rural
management of electrification schemes as payment and money collection, energy management and
remote monitoring.
All African telecom operators (Safaricom, MTN, Tigo, Etisalat, Kalahari, Vodacom) and some proactive
banks (Stanbic, Equity Bank) are developing through commercial partnerships ‘mobile payment products’
for their customers (ex. MobileMoney from MTN, M-PESA & M-KOPA from Safaricom).
In Kenya for instance, the key competing companies supporting rural electrification programmes and remote payments are:
o M-KOPA, a Nairobi-based company making clean energy affordable to customers across Kenya by
combining machine-to-machine technology and mobile payments to offer customers the chance
to purchase solar energy equipment on a pay-as-you-go basis. (Commercial partnership with
Safaricom since 2012, with funding from Shell Foundation, DFID, ACEF) - http://www.m-
kopa.com/
o M-PESA, a mobile-phone based electronic payments system and mobile money transfer,
launched in 2007, has been commercialized by Safaricom and adopted by 8.5 million Kenyans in
less than 3 years. Surveys of users show it is a highly valued service. Services include airtime top-
up, bill payments, salary payments, M-KESHO banking services (which allow customers to earn
interest) and also international money transfer in partnership with Western Union).15
o M-KESHO Account is an accessible and affordable bank account (at Equity Bank) that is managed
with M-PESA (deposit, withdraw, balance).16
Beyond remote payment, SMS-based innovative devices can also be used to control power
generation and end-users’ consumptions and to collect real-time data from the field. DFID and GIZ
have been supporting such innovative development in Kenya.
o bitHarvester, a SMS-enabled monitoring device developed with Access:Energy17
(Kenya) that
delivers real-time information on the status of an energy systems (wind turbines, hybrid) to an
office in-town (internet portal) and which regularly updates the supervisor on local conditions
and system performance. The devise can send e.g. hourly SMS updates on the power generated
by energy systems, the amount of electricity used by clients, local wind speeds and direction, and
anything else needed. The applications of the device are almost limitless, providing essential
information at a low cost for all projects involving remote data acquisition.
o Mobisol is a German company18
developing high-tech solar home systems to developing countries combining SHS with innovative mobile pay-as-you-go technology (prepaid energy
15
http://blogs.wsj.com/tech-europe/2012/10/29/more-to-african-mobile-payments-than-m-pesa/
16 www.gsma.com/mobilefordevelopment/programmes/mobile-money-for-the-unbanked/mmu-examples/m-kesho
17
http://accessenergy.org/in-the-lab/
18www.plugintheworld.com/mobisol/home.html - http://www.pv-magazine.com/services/press-
releases/details/beitrag/mobisol-launches-optimised-version-of-its-sms-based-pay-as-you-go-solar-home-system_100010322/#ixzz2OYxWiogz
12

Final Report – Support Study on Green Mini-Grid Development
meter). Using the mobile banking and micro-financing service M-Pesa, the SHS costs
can be paid off conveniently by mobile phone in a 36-month installment plan. The
systems come complete with a three-year warranty and a full service package
including free maintenance for three years. Through the GSM modem included in the
solar controller, technical data from the panel and battery is tracked and monitored
by local technicians in a web-based interface. The remote monitoring technology
allows potential maintenance problems to be addressed swiftly and enables systems to be locked automatically in case of overdue repayment.
4. Devices saving energy
The last category of innovative devices helping load and mini-grid management is the consuming
equipment itself. Nowadays, a wide range of affordable energy-saving equipments is available for off-
grid applications such as LED-based lamps/TV/monitors and efficient
refrigerators/pumps/motors/coolers. Awareness campaigns and delivery chain supports are
necessary to promote those essential energy-saving appliances. There are numerous national or
regional programmes promoting energy savings and efficient devices e.g. the “Super-Efficient Equipment and Appliance Deployment” (SEAD) initiative in ECOWAS region, launched by CEM (Clean
Energy Ministerial) with the Regional Centre for Renewable Energy and Energy Efficiency (ECREEE), to
support efforts to create a regional system of appliance efficiency standards and labels (S&L). 3.1.2.4 Management of the MG upgrading 1. Main grid interconnection:
When an isolated mini-grid is confronted with a nearby grid extension, the distribution grid will be connected to the main grid (substation) while the generation power plant has 2 options: - either the existing generation plant is dismantled/removed (e.g. diesel power plant),
- or the existing renewable energy power plant (hydro, biomass, hybrid) can be valued through
local injection into the grid (stability of grid reactive power, frequency, voltage boosting, etc.)
with smart devices as grid managers (SMA).
The connection of the distribution network of the MG to the main grid shall follow national
regulations and technical and safety standards for grid connection. Usually a MV line is extended
from the main grid to the existing MV line of the MG (if any) or to a step-down transformer replacing
the previous power generating house and supplying the LV network. Key technical issues for
distribution networks’ interconnection are the compatibility of design and equipment standards (for
MV & LV lines and for end-users’ connection), and the metering and protection systems (either in LV
or in MV) if the 2 systems are managed by different operators (e.g. three-phase distribution grids
that allow greater opportunity for commercial enterprises and for future interconnection to the
national grid).
The grid coupling of the existing power generating system based on renewable energy source is
technically feasible but more complex than network connection (measurements and synchronisation,
safe connection/disconnection, fault detection) and not cost-effective.
13
Final Report – Support Study on Green Mini-Grid Development
In general, utilities require a grid interactive inverter (safety-tested and certified) and the ability to
disconnect the generating system from the utility’s grid in the event of a power outage or
maintenance. Basically the generating unit should be able to adjust its electrical parameters (voltage,
frequency, etc.) and to be synchronised automatically and safely with the main grid.
Standard synchronisation devices can be used for interconnecting biomass and hydro-power plants
(similar with systems for gensets synchronisation). For hybrid solar or wind or DC hydro systems,
standard grid coupling devices are included in “grid-tie inverters”.
The main technical problem that can occur with later interconnection to the grid is if the renewable
energy based system was initially designed for stand-alone operation only, and not compatible with
grid connection, i.e. generator cannot be synchronised, inverters cannot be grid-connected, etc.
Based on power and energy availability (daily, weekly, yearly) from the renewable energy sources and the demand profile, the sales of electricity shall be negotiated with the distributor.
Example of Grid Coupling of a Biomass Mini-Grid (Cambodia) (Source: IED, internal report, 2013)
The Charchuk biomass-based mini-grid already described in Chapter 1 has been recently connected to the
main grid. The distribution network has been easily interconnected through its existing MV line without any
major extra costs. However, the rice husk gasifier unit of 70kW capacity was not designed to be grid
connected, as Charchuk was not part of the list of the villages to be connected to the national grid by 2018
according to the national electrification plan.
Additional synchronisation system (grid coupling device and adaptation of gas engine & alternator) and MV
extension (MV line, transformer, MV protections and metering) were necessary to inject the biomass power
into the main MV grid (only 55kW are injected because 15kW are consumed by auxiliaries). The total
upgrading cost (more important than if this option was considered at design/construction stage) and the
lower feed-in tariff were not in favour of this grid injection. However operation costs were slightly reduced
(no diesel consumed for power generation at load peak) and the total production increased as the system is
running at full gasifier capacity 24h/24. After grid synchronisation, the Charchuk project maintained
acceptable profitability, and as a first of its kind it provides key lessons before scaling up other gasifier
projects for rural electrification in Cambodia. 2. Mini-Grid upgrading and linkage
If the load demand on a mini-grid has risen above the generation capacity, strengthening of the
power plant will be needed. For diesel and biomass power generation, new unit(s) can be added to
increase the capacity. In a simple management scheme, gensets will be switched on and off
depending on the load profile with manual change-over switches, inducing short power cuts on the
network. For continuous and automatic power supply, a synchronisation panel should be added and
the gensets should be suitable for this. Wind and solar generators for stand-alone system can also be
upgraded with larger capacities and easily synchronised through their conversion electronic system
but storage capacity is a bit trickier to scale-up. Over-sizing some components, such as wiring and the
converters, could be recommended to anticipate a future demand growth and facilitate the mini-
grid’s expansion.
14

Final Report – Support Study on Green Mini-Grid Development
The particular case of two or more expanding mini-grids which could be later interconnected
together to better match the growing demand is not much different technically than the above-
mentioned case. The 2 distribution networks, after extension, can be easily interconnected, either in
LV, or better in MV voltage. On the generation side, it is recommended to centralise the generation
system in one place for easier O&M but in case of renewable energy, the location is strongly
dependent on the resource and may need to stay at different location. In any case, the 2 or more
generating sources should be synchronised, in the same way as coupling a renewable power plant
with the main grid as above.
Example of diesel-based micro-grid in PRES project (Philippines): (Source: IED, internal report, 2013)
About 154 diesel-based micro-grids have been installed on Masbate Island and have been running for about 5 years supplying power for 5 hours per day to rural customers with flat rate tariff. Generating systems have been standardised in 2 sizes: 6 and 12kW. The LV distribution network radius is not larger than 1.2 km. Some villages have up to 5 independent micro-grids with distinct management teams. The project is today facing 2 issues for upgrading the schemes:
- The micro-grid distribution network (LV) has been designed according to French standards and
without metering (current limiters). The main grid is extended rapidly and uses different design and standards (poles’ height, ground clearance, cross sections, protections & metering, etc.). Difficult negotiations are ongoing to adapt at lowest cost the micro-grid networks for interconnection and harmonisation.
- Several nearby micro-grids could be interlinked with one network and one centralised power plant. This would improve power supply flexibility and reduce management cost but additional MV line construction might be needed in some locations. And this upgrading should happen at the end of life of the small existing gensets.
3.1.3 Some Experiences & Lessons Learnt Over the last decade, innovative and affordable smart technologies appeared on the African market
and now greatly facilitate the management of energy demand, customers’ payments and system
monitoring.
With new energy management systems and smart meters, many cumbersome activities can be alleviated as door-to-door meter reading and money collection.
Among the mass of manufacturers, some of them have developed specific low-cost EST products
suitable for AC mini-grids as Michaud, Inensus, and Circutor in Europe. But many other local
entrepreneurs in Africa and Asia have developed innovative solutions adapted to the local needs and
customers’ expectations. Some local universities (as IT department) have also joined those
developments.
The prepayment technology is mature today and has been adopted by most African utilities.
Prepayment is definitely appropriate and cost-effective for national grids when growing demand
exceeds supply. Reducing the consumption is found more cost effective than increasing power
generation. Furthermore the cost of implementing & managing prepayment system is more easily
amortised with large customer network (e.g. meter installation/replacement, extensive retail
network or server system or GSM facilities).
15

Final Report – Support Study on Green Mini-Grid Development
For mini-grids, the prepayment meter and its related management/communication facilities could be
too costly for small communities. Their implementation requires specific skills and training. The fact
that end-users tend to save on credits to reduce their consumption can affect the cash-flow forecast
and the return on investment for the operator.
The technology choice will depend on the business model and the tariff structure adopted. A flat-rate
tariff or a fee-for-services will simplify the billing management, having a binary (paid/non paid)
instead of charging different amounts every month (traditional meter), and avoiding heavy
equipment like server or computer to manage prepaid card generation. A flat-rate tariff or a fee-for-
services will require different payment systems, protections and connection boards than for energy-
based tariff.
In India, the prepaid meters are currently available within a price band of 40 to 90 USD (2011) based
on the specifications and size (volume) of the order. For implementation of pre-paid metering, in
addition to the meters, a substantial infrastructure in terms of software and server etc. is also
required to be maintained by the utility or distributor. As a result, in case the number of prepaid
meters is less, this cost gets loaded on to a small number of meters/ consumers. However, in case
prepaid meters are implemented on a larger scale, the cost would get distributed over a large
consumer base and would register significant reduction. (Deloitte, 2011)19
The next table provides some indicative costs or prepaid meters in South Africa (Eskom, Durban, 2009).
Table 1 – Prepayment System Costs (Eskom)
19 http://www.forumofregulators.gov.in/Data/Reports/Evolving%20measures%20for%20the%20effective%20implementation %20of%20prepaid%20metering%20in%20the%20country.pdf
16

Final Report – Support Study on Green Mini-Grid Development
Case study in South Africa20
There are over 4 million prepaid meters installed in South Africa since early 90s. Eskom has more than 3.2 million presently. The majority of these meters were going with “ready-boards” including ELCB protection and plugs for now domestic customers. The newly electrified customers are predominantly poor. Consumption is averaging less than 100kWh per household per month in poor areas. These customers do experience cash-flow problems. Prepayment stops a customer from going into debt as it provides automatic credit control - as opposed to the billed system where the utility has to do this itself - manually. The prepayment meter is known as an ECU (electricity control unit) incorporating all the protection
features inside the meter for further cost reduction. The ECU can be connected directly to plug sockets. This device is intended for users that require less than 20Amp of supply current and constitutes a large portion of the Eskom electrification market.
Prepayment was seen as a means of direct budgeting. Finding some money for electricity at the required
time of consumption could then be related by the customer to other expenditure such as food and household goods.
The tariff used is a single rate energy based tariff - allowing customers to easily relate usage and money. The customer can compare the cost of the electricity token directly with another energy carrying item such as a bottle of paraffin. Prepayment removed some operational problems during meter reading as political protest, social pressure, township unrest and crime. For the newly electrified customers the access to electricity is the most important. The availability and accessibility of the Point-of-Sale, where prepaid tokens are sold, are important issues addressed by Eskom. Prepayment meters are installed only after consultation with and agreement by the community to be electrified. Eskom is careful not to promote prepayment as a solution for theft or to punish customers. As part of the development various systems were piloted and analysed, including billed, flat rate and a remote controlled flat rate. Prepayment still turned out to be the most cost effective system while still providing the customer with a value for money product. Eskom claims having conducted life-cycle costing studies showing that prepayment is the most cost effective option of system operation.
Case study in Argentina21
A cost-benefit analysis has been used to assess the adoption of prepaid meters in a local district in Argentina. The analysis highlights how the role of tariffs, the cost of start-up investment and the socioeconomic characteristics of the population affect system performance. Several simulation exercises examine the sensitivity of results to changes in some distinctive elements of policy implementation. The results of a survey conducted among local electricity users indicate that prepaid meters lead to an increase in welfare. They also indicate that the advantages of the system are linked to the reduction of arrears in accounts receivables and of operational and financial costs on the part of the service provider and to a better allocation of resources for the user. Consumer evidence, however, suggest that the main arguments against prepayments relate to the possibility of self disconnection by low income consumers.
MG case study in Senegal (Michaud – Inensus) In Senegal, there are more than 10,000 non-electrified villages offering a large market potential for micro-grids. Since 2009, Michaud installed with GIZ Peracod 700 power management systems on the field for MGs. This
20
http://www.prepayment.eskom.co.za/faq.asp
21 “Prepaid Meters in Electricity. A Cost-Benefit Analysis (Argentina)”, Ariel A. Casarin, Luciana Nicollier, March 2008 - https://www.sandiego.edu/business/documents/Casarin.pdf
17

Final Report – Support Study on Green Mini-Grid Development
will lead to the development of a second generation of product thanks to this first experiment, enabling to be more cost effective. The Micro Power Economy model is currently being established in the village Sine Moussa Abdou as a pilot project realized within a Private-Public-Partnership (2008) between INENSUS GmbH, MATFORCE (local private partner) and GIZ GmbH (public partner). A hybrid generator [solar (5kWp)/wind (5kW)/diesel (8kVA)/battery (120kWh)] and Inensus Micro Power Smart Meters with prepaid cards have been installed. Tariffs are those set by the CRSE and the electricity production and sale license was given to INENSUS WA in a mini-concession for a minimum of 15 years (ERIL programme). At the start of the project, 65 consumers (households, workshops and social infrastructure) received electricity.
3.2 Energy Storage Solutions (ESS) 3.2.1 Context
There is a wide range of Energy Storage Solutions (ESS) supporting the grid integration of variable
renewable, the production of which depends on meteorological conditions and varies daily and
seasonally. Some are commercialised, but most of them are still at pre-commercial stage or under
development. Main storage categories are:
Electro-chemical batteries (lead-acid, Li-ion, NaS, Vanadium Redox Flow) Flywheels (seconds to minutes) Fuel cells Compressed air (CAES) Potential storage (pumped hydro) Thermal storage Magnetic storage Supercapacitors, Superconductors
Each of these storage systems has its own characteristics as power and energy density (kW/kg -
kWh/kg), discharge time, lifetime, and cost. The technology of choice often depends on the size of
the system, the specific service, the electricity sources and the marginal cost of peak electricity, if
any. An interesting technical document has been prepared on “Electricity storage – Technology Brief” by IRENA and IEA-ETSAP in April 2012 and provides overview of technologies, costing, potentials and barriers for electricity storage for renewables.
An International Renewable Energy Storage Conference (IRES 2012) is held annually in Berlin to get
insights into the current status of energy storage solutions, the need for storage capacity and
examples of success.
In conventional diesel-based mini-grids, the genset is operated on-demand, as fuel stock is a form of energy storage.
18

Final Report – Support Study on Green Mini-Grid Development
In green mini-grids, the electricity production using variable renewable energy sources may not
match with the fluctuating demand profile. Storage of electricity might be required to ensure
continuity and quality services to customers.
In biomass generating plants, the matching with the demand is ensured with the storage of solid
wastes. And to some extent in hydropower with storage dam, the water flow can also be adjusted to
meet the demand.
The storage issue is of utmost importance for solar and wind generation due to their variable and unpredictable character.
In this section, we will focus only on storage technologies which concern hybrid systems with solar
and/or wind resources, more particularly on flywheel systems and on some electrochemical batteries
(lead-acid, Li-ion, Vanadium Redox).
3.2.2 Roles & Functions
In decentralised systems as green mini-grids, the storage can have different functions:
- Attenuate the production fluctuations over short period of time (< minutes): this “buffer
storage” helps to stabilise the power supply and can usually be achieved with flying wheels
for wind turbines or with limited capacity chemical batteries.
- Shift the daily production periods to load peaks by a couple of hours, also called “peak
shaving”. Lead-acid and Li-ion batteries are well adapted for such daily storage. Such storage
also allows reducing or limiting the use of genset(s) during peak load with better load factors.
- Security reserve over few days in case of consecutive days with low renewable sources. This
reserve is usually costly as the stored energy will be used only occasionally. A backup thermal
genset (diesel or other liquid fuel) is recommended to avoid over-sizing the storage system
and to provide flexibility at lower cost in case of unplanned or exceptional demands.
3.2.3 Storage Products
In relation to the deployment of smart grids, renewable energy integration and electrical vehicles, a
strong battery market growth is observed for grid-tied storage systems. Electrochemical batteries
have a large potential with a number of new materials and technologies under development to
improve performance and reduce costs. Their development will also be beneficial to the green mini-
grid market in terms of increased performances, reliability and costs.
Common storage batteries used or considered for green mini-grids are:
Battery type Availability Cost-benefit Flywheels Commercial Low cost, high power but for limited time Lead-Acid batteries Commercial low cost but low energy density and short-lifetime Li-ion batteries Commercial high efficiency and lifetime, widely used for
portable devices but still expensive for larger power application & off-grid
Vanadium redox flow cells Pre-commercial already been used in small- to mid-size renewable power systems but not mature yet for DC and remote applications
Novel batteries (e.g. NaS batteries) Demo phase constraining barriers for use in rural areas and DC
19

Final Report – Support Study on Green Mini-Grid Development
applications (high T° for NaS)
Flywheels
Flywheels can make available kW to MW-size power output with very short response time and
with high efficiency but for a limited time (seconds to minutes). Systems can be more or less
complex and efficient (use of vacuum chamber, superconducting magnetic levitation) but
requires little maintenance. At present, commercial flywheels are mostly used to provide back-up
power to UPS but can support frequency regulation and wind power in small grids. Their capital
cost22
is also sensitive to the size, ranging from $1000/kW for small, simple flywheels to
$4000/kW for MW-size multi-wheel systems. (Irena, 2012)
Lead-Acid battery
The lead acid battery remains today the most used storage system in decentralised power
applications and hybrid systems given its low cost and reasonable performances. Over the last
decade, some noticeable progresses have been made to increase performances and lifetime of
those batteries used in off-grid solar/wind systems. Advanced deep-cycle lead-acid batteries
have been developed for solar applications to better fit with daily cycles. Market prices of deep-
cycle batteries are in the range of 150-250$/kWh. The overall storage cost is usually between
$250 and 500 per MWh, depending on operating conditions and real lifetimes. For comparison,
the overall cost of pumped hydro energy storage is estimated at between $50 and $150 per
MWh. (Irena, 2012)
Li-ion battery (LIB)
Lithium-ion batteries are perhaps the most promising technology for both small and large-scale
electricity storages in power generation. They dominate the market of energy storage for
portable devices and are also the primary candidate for energy storage in electric vehicles and
distributed renewable power. They can cope with high variability of discharge.
They currently offer superior performances (power & energy density, cycle efficiency, durability,
self discharge, temperature range) than lead-acid, NiCd, and NiMH but need further
development for application to power generation and for cost reduction. Safety of larger Li-ion
batteries is also an issue as overcharging, short circuiting and abnormal heating can occur during
operation. Furthermore performance, costs and safety features vary significantly within the
Lithium battery family (various materials for cathode, anode, and electrolyte).
Li-ion batteries for power applications are still expensive (up to $2500/kW) because of the need
for new materials and technology, and safety devices. Large research efforts on batteries for
electric vehicles and wind energy storage promise a rapid cost reduction to less than $1000/kW
(Irena, 2012). High quality Li-ion products (half MW size) are available in EU at about $1000- 22
Capital costs of a storage technology can be given per unit of power capacity ($/kW) or per unit of energy storage capacity ($/kWh) (what is conversion to Ah?). Operating costs are given per unit of power capacity per year ($/kW-yr). The overall cost and the levelised cost of energy storage are given per unit of energy ($/kWh) as the ratio of all costs incurred for storing the energy (capital, operation and energy costs, if any) to the total amount of energy stored in all storage cycles over the plant’s lifetime. The costs provided in the text are indicative estimates often with a wide range of variations.
20

Final Report – Support Study on Green Mini-Grid Development
1300/kWh while low-cost products (mainly from Asia) can be as low as 500$/kWh. Different
forecast scenarios claim LIB price decline between 150 and 400$/kWh by 202023
but there are
plenty of press announcements touting improved performance and lower cost.24
The better performances and longer lifetime of Li-ion give a prospective overall storage cost
which could be close to the overall cost of deep-cycle lead-acid batteries. As a first estimate, the
overall cost of stored electricity is about 0.24$/kWh for lead-acid technology (case study in the
Philippines – Pangan-An) and could be 0.29$/kWh for a Li-ion technology at current average
market price and ideal lifetime and performances (see table below). Some experiences indicate
that overall cost for Li-ion is in practice higher than 0.50$/kWh (PVSEC conference 2012, Zhaw,
EKZ, 5.DP3.2).
Lead-acid Li-ion Capital cost ($/kWh) 170 1000 Expected lifetime at DOD (years) 10 20 Depth of discharge (DOD) 20% 90% Round cycle efficiency (%) 75% 90% First estimate of LCOES ($/kWh) 0,24 0,29
Vanadium Redox-flow Battery (VRB)
This electro-chemical storage system offers power capacity from few kW to MW-size with short
time response to power demand and a high lifetime (> 12,000 charge/discharge cycles). VRB
needs little maintenance but is rather complex for remote areas with pumping and cooling
systems. It can be used to support large wind/solar power generation at a cost of $3000-
5000/kW with prospects for a rapid reduction to $2000/kW and $250–300/MWh overall storage
cost, depending of actual lifetime (Irena, 2012). Alternative flow battery concepts include Zn/Br
(commercial) and other Zn-Air, Al-Air, Fe-Cr, Zn-Cl (still under development).
Sodium Nickel Chloride battery (NaCl-Ni)
NaCl-Ni battery is another alternative technology presently under development (General
Electric’s) but with attractive perspectives as it has simple and robust technology, and high
energy density. Capital cost is still about 1000$/kWh but is expected to reach half in a couple of
years (Probert, 2012).
Sodium Sulphur battery (NaS)
NaS batteries are based on the sodium-sulfur reaction and require high operating temperatures
(300°C). At this early stage of development, they are suitable only for large-size applications, such
as MW-size grid stabilization, load-levelling, utility-scale storage of wind and PV electricity. Their
feasibility in off-grid or mini-grid projects has not been demonstrated yet.
Storage management & monitoring
23
http://www.greentechmedia.com/articles/read/lithium-battery-prices-on-slow-decline
24 “Driving down costs in LIB for EV market”, Kevin See, Lux Research, Energy Storage Journal, Sept 2012
21

Final Report – Support Study on Green Mini-Grid Development
As described in the above section on Energy Smart Technologies (EST), there are interesting
innovative devices developed to better utilise electrochemical batteries. Their lifetime is closely
linked to the way of use. Smart management systems can optimise the availability and the use of
power and energy from the storage system.
Regular measurement and monitoring of the state-of-charge (SOC) and other performance
indicators are used to improve the management of the whole power system (multi-generating
sources, battery storage, load) and to improve the battery lifetime (charge & discharge
regulation). Remote communication are also become common is such energy management
systems. 3.2.4 Best Practices & Environmental Concerns
The two (2) main barriers of electricity storage by means of electrochemical devices are the high
overall cost (LCOE) and the environmental impact (recycling & embedded CO2 during production). Reducing the use of battery storage is a new trend in recent green mini-grid development.
There are numerous case studies on hybrid solar systems with battery storage installed in developing
countries. Most of them have been using conventional lead-acid batteries to level daily peak demand
and to ensure security reserve. Such large battery capacity allows high penetration rate of renewable
sources (solar or wind). Examples of such solar-battery systems in Mali and the Philippines have been
described in previous chapter 1 (item 3) and chapter 5 (item 1.4.5).
Given the high overall storage cost ($/kWh) from electrochemical batteries, there is a new trend to
better design hybrid systems with reduced battery capacities and with more sophisticated EMS
systems to increase cost-effectiveness of the mini-grid scheme.
There are some new GMG projects with smaller battery capacity having started in Sub-Saharan
countries such as Mauritania, Mali, Burkina Faso where ‘buffer batteries’ are considered to stabilise
renewable energy production and to allow direct usage of solar or wind energy. But there are no
lessons learnt from those projects yet.
Alternatively, first pilot experiments with solar-based mini-grids without batteries are also
implemented as e.g. in Mauritania when the day-time solar production can be directly absorbed by
the load profile. However, for technical reasons, the penetration rate of solar power is considered to
be limited to 30% of the current peak load and solar energy / total consumption ratio can be very low
and just reduces marginally the fossil fuel expenditures.
Recourse to electrochemical storage not only increase CO2 emission of the GMG (1-3 kg CO2
emission/kg of battery for production + 0.6 kg for recycling25
) but also raises the issue of recycling
battery elements at their end of life. Efficient recycling facilities are rarely available in Sub-Saharan countries and resending back to the manufacturers are additional costs that must be considered.
Therefore, performance and costs of storage systems are to be assessed with respect to the improved service and benefits provided like higher reliability has always an incremental cost.
25
“A Review of Battery Life-Cycle Analysis: State of Knowledge and Critical Needs”, Argonne National Laboratory, US-DOE, 2010, http://www.osti.gov/bridge
22

Final Report – Support Study on Green Mini-Grid Development
4 References
4.1 EST
- http://about.bnef.com/markets/energy-smart-technologies/ - http://en.wikipedia.org/wiki/Smart_grid#Integrated_communications - http://en.wikipedia.org/wiki/Grid_energy_storage - EU: http://www.smartgrids.eu/ - DOE: http://energy.gov/oe/technology-development/smart-grid
- Deloitte, 2011,
http://www.forumofregulators.gov.in/Data/Reports/Evolving%20measures%20for%20the%2
0effective%20implementation%20of%20prepaid%20metering%20in%20the%20country.pdf
- Eskom, Durban, 2009,
http://www.apua-
asea.org/updea/archiv/AtelierCSDurban%202009/Communications/Prepayment%20Meterin g%20System%20in%20Eskom%20-%202008%20ver%2003.pdf
- MA-Casablanca: EBRD - Rural Electrification and Smart Metering Project
4.2 ESS
- “ELECTRICITY STORAGE - Technology Brief”, IEA-ETSAP and IRENA, Technology Policy Brief E18, April 2012, www.etsap.org, www.irena.org
- IRES 2012 (Berlin) –
http://www.eurosolar.de/en/index.php?option=com_content&task=view&id=577&Itemid=8
- New Global Off-grid Energy Storage Market Growth Research Report 2012-2016
http://www.researchmoz.us/global-off-grid-energy-storage-market-2012-2016-report.html
- “Large-scale PV, Battery energy storage and the grid”, Tim Prober, Large Scale Solar, Oct. 2012
23

Final Report – Support Study on Green Mini-Grid Development
Chapter 8: Green Mini-Grid Development
Programme
TABLE OF CONTENTS
HIGHLIGHTS .................................................................................................................................2
1 KEY GAPS & BARRIERS ..............................................................................................................8 1.1 Physical potential, political vision and will ...................................................................... 8 1.2 Regulatory and Financial Framework .............................................................................. 9 1.3 Models and players for GMG programme development and sustainable implementation 9
2 GMG INTERVENTIONS IN ICF PRIORITY COUNTRIES .................................................................11 2.1 Context ........................................................................................................................ 11 2.2 ICF Priority Country Review .......................................................................................... 13 2.3 Recommendations for DFID intervention ...................................................................... 15 Figure 1 : Risk Profile of a MG project (AFD-IED, 2012) .................................................................... 4 Figure 2 : IPP selling power to Off-Takers, Utility and Rural Mini-Grids (IED/AFD, 2013)..................... 6
Table 1: General environment comparison of ICF countries ............................................................. 7 Table 2: PROs and CONs of RET Technologies for MG ...................................................................... 8 Table 3: Comparison of support policy & regulatory instruments ..................................................... 9 Table 4: Type of interventions per category of country .................................................................. 11
1

Final Report – Support Study on Green Mini-Grid Development
Highlights The main conclusion from the above investigations (chapters 1 to 7) is that the definition of a GMG
development programme in Africa strongly depends on the targeted countries where very different
resources, political, economic, and social environments can be found. The viability of mini-grid
implementation is very sensitive to various factors as choice of technology, national policy and
regulatory frameworks, access to finance, private sector participation, and skills & resources (and
renewable energy resources for green mini-grids). Adequate GMG intervention strategy should be
tailored according to local conditions and to address critical barriers and gaps in each specific
country.
The comments provided by the reviewers underscore the fact that grant funding still is very much
required for a number of enabling activities, such as planning and strategic planning, awareness
creation and support and learning.
The difficulty of reconciling the fact that GMGs are not financially profitable, but that there is a great
potential for expansion is not a contradiction per se, but brings us back once again to the difference
between economic viability and financial profitability. Any way one looks at the issue, some sort of
public support has always been needed to develop infrastructure, either by way of very long term
financing provided by public funds - thanks to public guarantees - or by way of straight public
subsidy. The appetite of DFID to cover this required grant component through one instrument or the
other (soft repayment terms, grants, guarantees), whether in the name of access to a service for the
poor, or in the name of lower carbon emissions is not for the Consultant to discuss here in this
report. Neither is it for the Consultant to express views whether GMGs are the best value for DFID’s
money to reduce carbon emissions.
The only point we highlight here, is that while fully acknowledging that some countries are far more
advanced than others in terms of frameworks or capacity, it still is not realistic to assume that GMG
will emerge anywhere based on purely commercial finance, be it only because financing terms
matching the profile of GMG projects is not available in the countries and when it is, it is on the basis
of balance sheet financing only, in a situation where project proponents do not offer sufficiently
strong balance sheets.
Key Gaps and Barriers to be addressed to develop a programme targeting GMG, intervention strategies to be considered, and resources to bring in.
One approach in categorising the gaps and barriers is to classify them at different stages of green mini-grid programme development, and we have identified 3 stages:
1. Do we have a national rural electrification / mini-grid / green MG policy / vision / strategy – and
plan? The resource needed is basically human resources, generally funded through grants
and it is essential to take the time required to build national capacity and ownership, otherwise the following steps will not happen
2

Final Report – Support Study on Green Mini-Grid Development
2. Do we have the proper legal foundations, regulatory framework (transparent and not too
complex), financial and fiscal incentives? The resources needed are again human and funded through grants or sometimes
could be a component of long term ODA type loan1 – a government to government
financing. The required decisions which are structuring for the country, can take a
very long time because they have financial implications – especially as regards to the
green aspect of electrification, and are of a legal nature. Without political
commitment, this does not happen, and recommendations remain at the study
stage.
3. Do we have the ingredients for actual project development: identified pipeline of the projects,
availability of proven technology and qualified staff to run it, companies willing to invest in these
projects and operate them – generation and / or distribution, banks and financiers willing to fund
such activities given the characteristics of projects (long term) and of borrowers (week balance
sheets).
The resources needed are a blend of grants, long term concessional finance, mezzanine loans, quasi equity, possibly guarantee instruments.
Categories 1 and 2 imply grant support and long term strategic partnerships – 5 to 10 years. Activities
in the second category can be usefully finished whilst starting the third, but category 3 needs 3 to 5
years when starting from project identification, and a combination of grants / concessional loans and
commercial finance.
Hence, seeing mini-grids operating sustainably, when starting from a blank situation, requires
roughly a 10 year commitment. Some of the 7 preselected ICF countries are already well advanced
along this road.
Financing – grants, loans, guarantees, FiT
Our understanding is that DFID does not really have an interest in the more upstream activities in categories 1 and 2, but would like to focus on category ‘GMG investments’. As repeatedly underscored throughout this report, mini-grids can sometimes be financially profitable – provided tariffs are high and CAPEX is low; but this is very seldom the case, and we are generally in
a situation of economic viability for the nation and financial non bankability given the risks perceived
by investors and their expected returns, and the difficulty for banks to undertake non-recourse
project financing for such relatively small scale projects. A blend of grant, loans and guarantees are
needed to make the projects happen as illustrated in the following figure. 1
ODA: Official Development Aid or Assistance
3

Final Report – Support Study on Green Mini-Grid Development
Figure 1 : Risk Profile of a MG project (AFD-IED, 2012) Project development risk is high (meaning probability of failure is high) and though the
needed amounts for detailed feasibility studies, financial engineering, etc. are small, these
funds are still hard to mobilise. A private sector investor will seldom take 100% of this risk,
and (a relatively high proportion) grant support is needed. The investor will value this
investment often as “sweat equity”. Innovative thinking can be built in here, by providing
grants which will be refundable in case the project pushes through; setting up equity funds to
cover these financing requirements, with low return requirements, explicit exit clauses and
not over interfering the project management – forms of “patient capital”. The time of construction is when the investor’s exposure is highest, as he is disbursing the
bulk of the funds needed, whilst not yet having any income stream.
o Time and cost overruns can cause very serious problems, as the investors are
generally not very capitalised and do not meet with working capital constraints. It
may be of interest to have guarantees against cost and time overruns, as these
delays imply setbacks in income streams and capacity to pay back loans.
o As mentioned in the previous chapters, availability of working capital during the first
years is a serious issue – this is the time when loans start to be repaid, income
streams are low because demand has yet to build up, and the plant needs full
operational staff on board. Being properly capitalised or having access to quasi
capital / working capital funds is fundamental in ensuring project start up. Further,
staff generally has to be recruited and trained during this construction period, whilst
there is no income stream, so has to be funded. Once the project is running, and income starts coming in, risk level is lower and exposure
level in monetary terms declines progressively with reimbursements. However:
4

Final Report – Support Study on Green Mini-Grid Development
o The term of the loan has to match investment’s cash flow profile: long term
especially for Green MGs which are capital intensive. Local banks in Africa generally
do not offer such loans, preferably with a grace period to allow for the period
without income during construction. DFID could work with the financial community
to discuss the development of such instruments and possibly provide such facilities.
o Financing of the generation and distribution components could possibly be
distinguished, the distribution network requiring much longer loan terms and public
financing.
o Local financial institutions often do not have the skill sets to upraise such projects
and generally only engage in balance sheet financing for such small investments.
Non-recourse project financing is generally observed in Africa only for very large
generation projects which are internationally syndicated and not for the amounts we
are talking about for GMG: 0.5 to 3M$. A long term non-recourse facility, which
would be disbursed on a project by project basis, and not asking for large pipelines ex-ante could go a long way to help GMG take off.
o Risk sharing instruments are hence very much needed to cover the following:
Provide guarantees to local banks compensating for the fact that GMG investors do not have the required Balance Sheets
Share into the off take risk: which can be commercial – e.g. the distributor defaulting, or political – change in the tariff level, incentive schemes
Technology risk should at the outset be taken by the investor / operator of the generation unit
Resource risk is something being discussed for large units (lower sunshine, hydrology risk) which large insurance companies are actually modelling. But it may not be realistic to cover these risks, though perhaps the hydro angle should be given some thought.
In our view, Feed-in-Tariffs are a secondary issue here. As explained when discussing the business models in the previous chapters, the main issues are:
The end user tariff levels, and whether they can cover [distribution (cost + margin)] and
[generation (cost+margin)]. The answer is no at commercial financing conditions. Distribution
needs long term public financing conditions and generation for GMG has been discussed as
well.
The PPA – power purchase agreement, between the generator and the various off-takers:
own captive, anchor customers, distribution utility in terms of energy and price is the key point.
Feed-in-Tariff is not a realistic proposition for Green Mini-Grids, as there is no way that the
off-takers mentioned above would take on the risk of production cost variation. FiT is defined
as an economic policy created to promote active investment in and production of renewable
energy sources. Feed-in-tariffs typically make use of long-term agreements and pricing tied
to costs of production for renewable energy producers. By offering long-term contracts and
guaranteed pricing, producers are sheltered from some of the inherent risks in renewable
energy production, thus allowing for more diversity in energy technologies. This applies to
production which is grid tied, and the main utility can take on such risks and variations for a
5

Final Report – Support Study on Green Mini-Grid Development
small portion of its generation. Here, we are talking of Green Mini-Grids, in off-grid areas, for
isolated populations, so the case of becoming grid tied would be very exceptional – it would
mean that it would be worthwhile to construct many km of a line to reach the main grid.
Figure 2 : IPP selling power to Off-Takers, Utility and Rural Mini-Grids (IED/AFD, 2013)
Skills to bring in, policy, capacity / enabling interventions
As seen below, there are some countries where the policies are in place, and the regulatory
frameworks are being developed. These should be the DFID priority countries given DFID’s focus on
project implementation.
It remains, as explained above, that it would be a poor approach to wait for the ideal regulatory
framework, thus this will be set up in a learning-by-doing approach, if GMG start emerging. During
these early stages, - this means high risk for investors in GMG – and hence, risk sharing and specific
instruments as explained above.
At this point, the key missing skill sets would again be country specific but in terms of the project / programme stages, the needed skill sets are:
Financial engineering that is adapted to small scale projects
Value chain of O&M: are the spares and maintenance capacities and infrastructure available
for the selected green technology – at low cost and short time lags to ensure sustainability?
E.g. repair capacity for an intelligent inverter for a PV diesel hybrid will not be available if
there is only one pilot in the country.
Adequately trained technical and managerial staff who are willing to stay at site (so qualified
people in remote areas) or travel regularly to the sites – and the possibility to pay them
salaries affordable by the project / programme?
6

Final Report – Support Study on Green Mini-Grid Development
Approach to ICF countries
In Chapter 1, ten pre-selected ICF countries with very different environments have been compared
using 8 criteria as summarised in the table below. With this approximate and indicative assessment,
Kenya and Tanzania are found to be the 2 best-ranked countries with rather favourable
environments to launch a GMG programme, followed by Rwanda and Uganda.
Table 1: General environment comparison of ICF countries
Criteria 1 Stability of the country
2 (Rural Electrification Rate)-1
*
3 Fuel price for power plants
4 DFID/ICF interest & commitment
5 Mini-grid potential
6 Political environment & wills
7 MG & RET experience
8 International GMG-related programmes
Global Enabling Environment for GMG
* the criterion is reverse to other criteria
Ken
ya
Tan
zan
ia
Rw
and
a
Uga
nd
a
Mal
awi
Moz
ambi
que
Gh
ana
Som
alia
DR
C
Eth
iop
ia
Nig
eria
We
igh
t
L (l
ow
)
M(m
ediu
m)
H (
hig
h)
Un
it
M M M M M M H L L M L 1 FCAS LIC LMIC - -
MIC
L M H M H H L H H H L 1 >20% 5-20% <5% %
H H H H H M M H H M M 1 < 0.5 0.5 - 1 >1 $/l
H H M M M H L H M L M 1 from from from -
Steven Steven Steven
H H H M M L M L L M H 1 <30% 30-40% >40% %
H H M M M M H L M L M 1 TDV/SH TDV/SH TDV/SH
H H M M M M M L L L L 1 <5 5-10 >10 GMG
H M M H L L L L L L L 1 <2 2-5 >5 pgm
84% 81% 69% 63% 59% 55% 51% 50% 48% 41% 41% 8 2 5 10 Weight
In Chapter 2, a preliminary assessment of GMG potential (linked to criteria 5 above) was conducted
in 7 ICF priority countries, based on ‘macro data’ as population density, distance to grid network and
renewable resources. The assessment study provides, among other results, the share of the
population targeted by mini-grids2 and the share of those mini-grids that can be supplied by hydro,
biomass, wind or solar. Three (3) categories of countries were found:
a) High MG potential: Kenya & Tanzania where a real remote MG market (20-23% of
population) exists; with high solar share
b) Moderate MG potential: Malawi & Rwanda where MG market (27-28%) is large but not
so remote; high potential share for hydro
c) Low MG potential: Uganda where the national grid has large coverage,
Mozambique and DRC where population is highly dispersed. From these 2 analyses, Tanzania and Kenya offer the most favourable conditions to successfully
conduct a GMG programme (rural electrification policy, RE & MG planning, renewable energy
support, sufficient technical & managerial skills, adequate tariff, REA & regulator, support to private
sector, local financing capabilities).
2
Number of mini-grids can only be calculated when population data are available at village level (population density). This was the case for Tanzania.
7

Final Report – Support Study on Green Mini-Grid Development
1 Key Gaps & Barriers
The way to design an intervention strategy to promote and upscale GMG in a specific country will depend on the market readiness assessed through key gaps and barriers.
1.1 Physical potential, political vision and will
Is there a technical and economic potential to develop and scale-up GMG? Is there a suitable policy and institutional environment for GMG?
Do we have a national rural electrification / mini-grid / green MG policy / vision / strategy – and
plan? Is there a real political will to support renewable energy, in mini-grids, with the financial
implications?
Resource needed is basically human resources, generally funded through grants and it is
essential to take the time required to build national capacity and ownership, otherwise the
following steps will not happen.
Critical barriers for GMG deployment have been identified in previous chapters (1 to 5) but the
primary ones are country, site & technology-specific. The following points have to be analysed
regarding their market readiness for MG projects:
1) Data on geographical constraints, settlement density & grid network 2) Data on load demand & forecast 3) Data on local RET resources 4) Data on technology choice (least cost option compared to fuel prices)
The choice of renewable energy technology (RET) shall depend first on the local availability of the resource(s) but also on pros & cons summarised in the table below.
Table 2: PROs and CONs of RET Technologies for MG
RET Pros Cons
Hydro Low operating costs Site specific potential (distance to load!)
Commercialised techno (mature) Site specific design
Studies often available High/variable CAPEX (*)
Direct synchronisation for grid connection Seasonal resource variation
Long preparation and lead times + costly
Biomass Relatively Low CAPEX: 2000-3000$/kW Lack of skills in DC
(gasifier) Labour intensive Complex O&M
Direct synchronisation for grid connection Max 20h/24 service
Variety of usable biomass feedstock Sensitive to feedstock cost
Pre-commercialised techno, limited experience
beyond 300kW
Hybrids Resource widely available High intermittence
Storage and/or High fuel
(PV/wind) Lower OPEX but LCOE is high CAPEX: 3000-10,000$/kW
subsidy
Least cost option in many remote areas gensets (economic & environment impact)
OPEX reduction with smart technologies High cost for battery storage
Complex design
Electronic synchronisation for grid connection
Pre-commercialised techno , limited experience
PV hybrid without battery: demo stage
(*) highly site-specific
8

Final Report – Support Study on Green Mini-Grid Development
1.2 Regulatory and Financial Framework As presented before, the enabling environment in favour of GMG development varies considerably
between countries. The following points highlight the critical policy & regulatory issues in terms of
GMG project sustainability.
1) Is there a clear institutional framework with clear functions and responsibilities? 2) Is there a PPA simple enough for mini-grids and reasonable transaction costs?
3) Is there a flexible tariff structure adaptable to various business models? (flat rate, metered
(smart devices for remote prepayment)) 4) Are there fiscal incentives such as custom duty exemption? 5) Is there enough awareness & confidence?
In Chapter 6, we attempt to compare the various policy environments and regulatory instruments
dedicated to MG in ICF countries. The following table illustrates schematically the main findings and
highlights more advanced policy and regulatory framework in Tanzania & Uganda, followed by Kenya
and Rwanda, while Mozambique and Malawi’s policy instruments are still at an early stage of
development.
Table 3: Comparison of support policy & regulatory instruments
MG regulations
Kenya
Tanzan.
Mozam.
Malawi
Rw
Ug
DRC
Institutions:
MG Planning:
Procedures for MG:
FIT tariffs:
Flexible tariffs for
MG:
Access to finance:
Private sector &
MG:
1.3 Models and players for GMG programme development and sustainable implementation
Do we have the ingredients for actual project development? identified pipeline of projects,
availability of proven technology and qualified staff to run it, companies willing to invest in these
projects and operate them – generation and / or distribution, banks and financiers willing to fund
such activities given the characteristics of projects (long term) and of borrowers (week balance
sheets).
9

Final Report – Support Study on Green Mini-Grid Development
Resources needed are a blend of grants, long term concessional finance, mezzanine loans, quasi equity, possibly guarantee instruments. 1) Business or implementation models
As analysed in Chapter 5, the choice of delivery/business model (financing, ownership, O&M, management arrangements) depends on local conditions.
a. There is definitely no standard, no scalable model yet: the implementation scheme is
a mix of public institution participation, local community mobilisation and private
sector involvement. Clear roles & responsibilities (in particular ownership) during
preparation and implementation process are key success factors. b. The fundamental drive has to be defined: universal access or profitable business? c. Reluctance of private investors because of various risks (wrong forecast)
d. A key success factor is to identify strong & sustainable management of MG (O&M,
payment, rules)
e. A critical mass of GMG should be created to ensure reasonable profit, efficient O&M
and spare management, acceptable technical and managerial skills, and lower
procurement costs 2) Financing schemes
As it has been demonstrated in Chapter 4, GMG projects are not bankable on a non-recourse
basis, mainly due to their risk profile and size. Nevertheless, local banks, with or without the
support of international credit line, are willing to invest in well-structured projects showing
sound cash flows, provided adequate risk sharing & coverage instruments (guarantees) are put in
place. Each country presents different characteristics in terms of financial sector development
and incentive mechanisms dedicated to increase the return and reduce the risks of the projects.
The following points have to be analysed regarding the market readiness in terms of financial
sustainability of the projects:
a. Real experience: Are the existing tariff and subsidies sufficient for allowing
acceptable ROE for the project developer/owner? Some GMG technologies require
even with substantial grant financing tariffs which are much higher than the
prevailing tariffs of the national utility. These are often not cost-covering. The gap
makes the acceptance of the high GMG tariffs socially and politically difficult.
b. Are there a significant number of potential equity investors with the capacity to
provide adequate guarantees for the full investment cost of the project? If not, this
implies the implementation of dedicated guarantee programs.
c. Capability of local banks to structure loans following the requirements of GMG investments (long grace period or refinancing facilities, sufficient loan maturities).
d. Support for project preparation requires that the riskiest part of project
development, i.e. the initial expenses required for feasibility, engineering,
environmental and permitting, is supported by dedicated grants.
e. Industrialists and large private players will invest in energy production if the
investment is attractive and they can find a way to limit their exposure to project risk
(third party guarantees for example).
10

Final Report – Support Study on Green Mini-Grid Development
f. Support to customers (in-house connection and productive equipments): Programs
dedicated to promote electric power usage and ease the access to energy provides a
significant demand risk mitigation instrument for projects.
2 GMG Interventions in ICF Priority Countries
2.1 Context
Drawing on the above gaps and barriers analysis, the following matrix illustrates the type of support
intervention that could be implemented in a country depending on its progress level to promote
green mini-grids.
Table 4: Type of interventions per category of country Interventions Favourable country Moderately favourable Non-favourable country
country
ICF countries Kenya, Tanzania, Malawi, Mozambique DRC
Rwanda, Uganda
GMG vision, Minor interventions: Minor interventions: Major interventions:
policy and plan - support CB, S-S - support demo with solar, - support RET & MG
partnership, wind, biomass potential assessment
- pipeline of F/S - support CB, S-S - support prelim. studies
partnership, - support demo with RET
- pipeline of F/S - support CB
GMG legal Minor interventions: Major interventions: Later interventions:
foundations, - adjust regulatory - support reform for - support awareness on
regulatory instruments for GMG promotion of RET, MG, PS, GMG
framework and - flexible retail tariff institutions, … - support to institutional &
incentives - master planning for MG regulatory reform
- flexible retail tariff - Support RE planning
- adapt FIT to MG
Financial, Major interventions: Later interventions Later interventions
organisational, - access to finance
technology and - support institution CB
HR readiness - Support to PS and MFI - support community mobilisation & awaren. - support impacts of MG
The first stage of intervention shall deal with primary barriers related to the vision, policy and
plan for GMG & impacts (item 3.2 above). It concerns mainly less-organised countries with
limited or no policy and frameworks to support MG. Many various upstream supports will be
needed before reaching viable GMG projects (5-10 years).
The second stage is directed to countries having already addressed the first stage, basically
where techno-economic potential for GMG has been demonstrated and identified but the
regulatory framework is not appropriate yet for large deployment of GMG.
The third stage is concerned on advanced countries where both potential and framework
exist (even if they need improvement) but where remaining barriers are mainly financial,
organisational and human resources. Well addressed support could bring viable GMG
projects in less than 3 years.
11

Final Report – Support Study on Green Mini-Grid Development
It must be noted that the favourable conditions for viable scaling-up of MG programme are rather rare in African contexts.
Therefore it is recommended to design a support intervention programme prioritising “favourable
countries” as Kenya and Tanzania where viable GMGs can be implemented massively, safely and
sustainably in a short period of time. Major interventions should focus on critical barriers as financial
support, adequate tariffs, and involvement of private developer, investors and local communities.
Other minor interventions should also be addressed to improve national regulatory and institutional
frameworks and to enhance local skills for O&M and management of GMG.
Identifying reliable local partners (knowledgeable, skilled, reliable) and building a strong project
management team (including or not private operator, local community) are key success factors for a
sustainable intervention.
Such programme initiated by DFID could demonstrate sustainable business models and technologies,
provide confidence among national stakeholders to scale up GMG deployment and will encourage
less-advanced countries to create enabling environment for progressive replication and GMG market
development.
The Chapter 1 has highlighted the collegial interest for green mini-grids using renewable and hybrid
generating sources for rural electrification. A certain number of ongoing programmes and initiatives
supporting mini-grids in Africa have been identified: national governments, SREP, EUEI-PDF,
PASS/UNEP, ENDEV/GIZ-KfW, CEM4/NREL, REACT/AECF, DFID, AFD, etc. They mainly focus on how to
overcome some of the barriers on business, financing, policy and technology environment that
hinder the development and the scaling up of viable GMG on a large scale.
Some of those programmes as SREP & ENDEV are directly supporting infrastructure investment. But
there is no market development programme yet dedicated to create a critical mass of green mini-
grids and to move to sustainable, high impact, efficient and effective GMG upscaling programmes.
The DFID initiative is a good opportunity to launch a multi-country market development programme
focusing on “favourable countries” having large potential for replication, but keeping open
technology choice based on previous (pilot) experiences.
The sustainability of a large scale GMG programme will also be reinforced if synergies are set up with
other key actors in social and economical rural development such as financing institutions, ministries,
NGOs from various sectors: infrastructure, health, education, agriculture, gender, etc. A multi-sector
approach should increase the benefits of electrification and the chance of success in the long term.
Monitoring the impact indicators will be crucial.
Moreover, there is a need, and a will from donors and programme developers, to build effective international linkage & coordination between various GMG initiatives, maybe through a kind of “international learning platform on GMG”. The DFID programme will be designed through such a collaborative and structured approach.
12
Final Report – Support Study on Green Mini-Grid Development
2.2 ICF Priority Country Review Beyond the specific country information collected through the whole study report (Chapters 1 to 7), a
one-week study tour in Kenya & Mozambique was also conducted by the consultant in April 2013 to
meet the key stakeholders and to examine in more depth the relevance and the feasibility to launch
a GMG development programme. Country visit provides much more evidence-based information and
clearer view of barriers and perspectives than literature review and remote interviews. The 2 visited
countries were selected by DFID among the 7 priority countries, while Tanzania was covered through
the local contacts and ongoing project of IED. (Cf. detailed IED mission reports in Kenya &
Mozambique - Annexes). 2.2.1 Kenya The favourable environment in Kenya for launching a GMG intervention programme was confirmed by the mission. The key findings and recommendations are described below: 1) Lessons learnt from existing programmes & projects with MG:
Most MGs in Kenya are implemented under government-led projects, many of them
supported by donors with a unique REA-KPLC business model. As in many countries, those
MGs are highly subsidized (upfront cost). Few private MG exist and there is very little
information on them.
Experience with renewable energy as complementary sources to existing fossil fuel-based MGs is still very new (since 2012) and limited (7 GMG are in operation under REA);
information on performances is hardly available.
The capacity and willingness of private sector to participate to MG projects is not clear, regardless of the tasks (engineering, construction, operation, management).
Policy and institutional framework is not completed for small scale mini-grids (<500kW)
Institutional staffs dealing with off-Grid at MoE and REA is limited for a wider MG roll-out programme.
The donors involved in off-grid energy subsector in Kenya seem to have good transversal
communication, a rather common viewpoint, giving potential for further synergies.
2) Barriers identified that impede the GMG roll-out in Kenya:
Electricity cost & ability to pay: everlasting barrier given the high production cost and the low income in rural areas
Business model: sustainability concern, lack of clarity about ownership, special maintenance,
EoL replacement, PPA, tariff, collection scheme
Policy & regulatory framework: blur in authorisations for generation (IPPs) and distribution (ESCOs) for off-grid and associated agreements, retail tariffs, FiT, net-metering.
Lack of technical experience: All green mini-grids in Kenya have been recently installed since
2012 based on only one business model. And detailed operating data and monitoring with
technical and economical performances, if existing, are not openly available. Private sector &
community involvement is generally weak and local capacities and skills have to be
demonstrated. Private sector involvement in GMG: basically not existing.
3) Perspectives for a new GMG development programme
13

Final Report – Support Study on Green Mini-Grid Development
There is a current proactive support from donors (WB, DFID, GIZ/KfW, AFD, NDF) for GMG
development in Kenya and considerable international funding for MG will be deployed in the coming years (about 80M€ in the pipeline, without DFID contribution)
From the official list of 68 GMG sites proposed by REA, it is already agreed that: o AFD will focus on hybridisation of existing MG (30M€), while
o GIZ/KfW will implement few pilot greenfield MG projects (5-10 Solar Diesel Mini-
Grids with 15 M€ investment loan) together with other key accompanying activities
(7.5 M€ grant for TA): RE policy enhancement; support to REA/ERC (for off-grid); PS capacity strengthening.
Synergy between new MG programmes is wished by related donors. There is a consensus to
say that new business models (community-based and/or private sector) should be
investigated in parallel with the existing REA/KPLC model (public-led), and could be
supported by donors, with REA keeping a role of supervision & monitoring.
Government institutions should clarify the regulatory framework for off-grid electrification
(small scale renewable energy projects) e.g. incentives to encourage household connections, as the $500 performance grant per connected customer in Tanzania, should be promoted.
Additional studies, consultations, sensitisations, workshops should be organised jointly by
donors and MoE to develop the private sector for off-grid business.
4) Recommendations for DFID intervention in Kenya are provided in item 2.3 2.2.2 Mozambique In Mozambique, the environment for launching a GMG intervention programme is less attractive
than in the 4 “favourable countries”. The country visit permitted to confirm the “moderately
favourable” status for GMG development and to highlight the following key findings: 1) Lessons learnt from existing programmes & projects with MG:
There is little experience with mini-grids in Mozambique. They are mainly implemented by FUNAE
(69 diesel, 4 solar, 3 small & micro hydro), by GIZ (7 micro hydro), and by privates & NGOs (some
hydro or diesel-based mini-grids). There are 2 business models that have been implemented for mini-grids as follows:
- ‘FUNAE model’ based on local management committee with a leasing on equipment - ‘GIZ model’ based on local private champion becoming owner (ENDEV-AMES)
Meanwhile, the following 2 tariff schemes are experimented:
- Flat rate tariff when no meter - Specific tariff with conventional or prepaid meters
2) Barriers to develop GMG Among the main identified barriers that impede the GMG development:
14

Final Report – Support Study on Green Mini-Grid Development
Demand characteristics (scattered HH, low load, low incomes, poor village organization) Investment financing (lack of incentives, access to credits, soft loans) Private sector involvement: some interests have been mentioned but no involvement so far
Institutional environment; capacity limitations of FUNAE in project implementation,
management and monitoring. While ME & FUNAE have experienced remarkable
development in the last few years, they remain seriously understaffed with respect to their
level of responsibilities and volume of work, requiring significant institutional strengthening
and capacity development and probably deeper structural reform.
Policy & regulatory frameworks: no political will to adapt tariffs and allow profitable EDM and IPP businesses.
3) Perspectives for GMG development programme The Government’s approach is to develop solar hybrids and small hydro-based mini-grids run by
community-based enterprises with support of FUNAE (PPP). The consultant expressed some doubt
whether community-based enterprises would assure project sustainability (e.g. unsuccessful projects
in Burkina Faso, etc.).
4) Recommendations for DFID intervention in Mozambique are provided in item 2.3. 2.2.3 Other ICF priority countries Despite there was no study tour organised in the other ICF priority countries, the present
background study has collected enough information in previous chapters on lessons learnt, barriers
and perspectives for GMG development through interviews, literature and local contact networks.
We can conclude that:
Tanzania, Uganda and Rwanda have similar environment regarding GMG development than
Kenya case Malawi is closer to Mozambique case with its emerging policy framework DRC is clearly a separate case.
2.3 Recommendations for DFID intervention Various donors are supporting or planning to support GMG by various means (training, local
production of components of GMG, capacity building, feasibility studies, funding of GMG projects,
technical assistance in implementation, etc.). It is obvious that DFID’s GMG activities in the seven
priority countries should be coordinated with ongoing or planned activities of the other donors. 2.3.1 Kenya, Tanzania, Uganda, Rwanda In these countries, the policy and regulatory framework is largely in place for the promotion of GMG.
In Kenya and Tanzania there is so far little private sector involvement in setting up and operating
GMGs. In Uganda and Rwanda, the private sector is already more involved though the number of
GMGs put up by the private sector is still small. Promoting private sector involvement is
recommended as the funding which the private sector will contribute will help in advancing the
governments’ electrification program. The capacity of the public sector to design, construct and
operate GMGs is also limited. Letting the private sector take over projects will thus also support the
15

Final Report – Support Study on Green Mini-Grid Development
governments’ electrification objectives. The following recommendations aim at promoting private sector involvement in GMGs. Country-
specific recommendations cannot be made. There may be some specific issues which prevent larger
private sector involvement but that would require in-depth studies which go beyond the scope of the
present study. By and large, the necessary policy and regulatory environment is in place in the four
countries to achieve significant private sector involvement in GMGs. The main stumbling blocks are
access to finance and lack of awareness of the GMG policy. The following recommendations aim at
alleviating these obstacles.
Ask the agencies in charge of rural electrification to prepare for future RE master plans which
show areas for off-grid electrification, the technology to be used plus the earliest year for
grid connection.
Support agencies in charge of off-grid electrification with funds to identify GMG projects and
prepare pre-feasibility studies. These should then be offered to the private sector
(competitive bidding).
Support awareness campaigns with funds which inform interested parties about the GMG
policy, the GMG potential, already identified possible projects, and the support made
available by the government and donors to realize GMG projects (financial support, technical
support, support in obtaining all necessary permits and other administrative support). The
campaigns should also inform about what is expected from potential investors in GMG
(financial contribution, technical competence, use of smart technologies if cost effective,
presentation of business plans, etc.).
The consultant expects that the awareness campaign will make already existing interested
investors present project proposals. These may not always be sound proposals but based on
the experience made in other countries (Mali, Senegal) the consultant wouldn’t be surprised
if some good proposals are among them.
Provide local banks with partial risk guarantees to make them lend to investors in GMG without demanding guarantees from the investors.
Provide loan financing similar to the credit line facility of the TEDAP Project (money lent to
local banks for on-lending for GMG projects).
Provide grant financing for the investment costs of GMG projects. The amount should
depend on the submitted business plan, showing in particular the requested customer
connection costs and the tariffs as a function of the grant money. Technologies which are not
yet mature technologies (e.g. biomass-fuelled gasifiers, hybrid-systems with storage capacity)
may receive more grant funding per kW installed than mature technologies (hydro plants).
2.3.2 Mozambique & Malawi In Mozambique and Malawi, not all elements of the policy and regulatory frameworks to promote
private sector participation in GMG are yet in place. As long as that situation has not changed, DFID
should support demonstration projects which private sector entities would like to realize. The
support would include making the government accept the projects as pilot projects for private sector
involvement, the business model, the GMG technology, etc. The pilot projects are expected to also
help setting up an adequate regulatory and institutional framework and the fiscal regime. The
institutional framework includes the clear definition of the roles of institutions. The support of the
16
Final Report – Support Study on Green Mini-Grid Development
private entities should integrate all necessary elements: feasibility and design studies, financing, capacity building, etc. 2.3.3 DRC The case of Democratic Republic of Congo is very different as the country is still at an early stage of
its energy reform; existing institutional structures are frequently changed and knowing “who is doing
what” in the energy sector is a serious challenge. Recently a rural energy service agency (ANSER) has
been established. Furthermore, current instability limits activities and foreign investments.
The needs for implementing a GMG programme are upstream with priority focus on technical and economic potential assessment in the country.
“With respect to implementation although public –private partnership seems to be the model to be
promoted, in the case of DRC there are thousands of villages and communities which may not attract
private investors. However, in some communities it is possible to raise some funds to fund part of the
initial investment and to involve local communities through in kind and financial contributions as well
as management. Furthermore particularly for micro hydro, income generating activities could be
implemented to payback part of the whole of the capital invested. Working also in close relationships
with churches may confer more sustainability to rural electrification given their involvement and long
experience in rural development.” (Practical Action, 2009)
17

Final Report – Support Study on Green Mini-Grid Development (Annexes)
Annexes to Study Report
Annex 1: Terms of References ....................................................................................................... 2 Annex 2: Country Visit Reports (Kenya & Mozambique) .................................................................. 7
1

Final Report – Support Study on Green Mini-Grid Development (Annexes)
Annex 1: Terms of References
IED Chapters DFID TOR
1. International review of MG What is the current state of the art internationally with regards to mini-grid (diesel, and data collection renewable and hybrid) implementation - presenting installed capacity, investment
and performance data across technologies, implementers, donors, business models, countries and regions? Present also this analysis specifically for mini-grid sectors in the ICF priority countries in Africa, and compare with the international status.
2. Relevance of MG solutions In what contexts are mini-grids the optimal solution to electrification as opposed to household systems or grid-based approaches? Present a replicable analytical approach to establishing where and when mini-grids are optimal for given technologies/resources (at least micro-hydro, solar PV, wind, bioenergy, diesel and hybrid), consumer densities/characteristics and proximities to the grid. Apply this analytical approach to ICF priority countries in Africa and present a preliminary assessment of the minimum necessary (for universal access), estimated economic optimal and potential maximum contribution of mini-grids of different technology types in these countries.
3. Cost-Benefit Modelling What are the key performance and impact benchmarks in low carbon mini-grids worldwide in terms of ICF key performance indicators (especially energy access, emissions reductions and job creation)? How do these compare with on-grid and household scale intervention benchmarks? Present a cost-benefit model (including sensitivity analysis) based on real scheme data for micro-hydro, solar PV, wind, bioenergy, diesel and hybrid mini-grid types – drawing from examples in ICF priority countries in Africa wherever possible.
4. Financial schemes and What is the financing gap (if any) in terms of delivering and replicating mini-grid modelling schemes of different technology types? What is the experience in terms of cost
recovery and tariff collection with respect to repaying capital and/or ongoing costs? What is the importance, if any, of including an anchor (larger enterprise) customer on a mini-grid? Present a financial model for each of the technology types based on real scheme data in different countries, and assess project financing viability gaps overall, timing issues (in terms of expenditure and revenue profiles).
5. Best practices for What is the available evidence on the key institutional, management and governance implementation & operational elements necessary for a successful mini-grid scheme in terms of raising finance and management successfully completing construction, as well as continuing to provide long term
sustainable service? What is the most effective and viable role that end consumers can play in the process of mini-grid development and delivery in different contexts? Present analysis on best practice approaches to mini-grid construction, operation and maintenance, tariff collection/payment and governance – both separately (unbundled) and as a whole. Present analysis specifically on the existence and acceptability of such different approaches in the ICF priority countries in Africa.
6. National policies & regulatory To what extent has the expansion of mini-grids been accelerated or held back in frameworks different countries by policy and regulatory environments and energy sector
structuring? What are the key elements of national policy which need to be in place in order for mini-grids to be a viable delivery option? Present the current status of policy and regulatory environment with relation to mini- grids in the African ICF priority countries.
7. Smart technologies & What potential is there for linking mini-grids and using “smart” technology to balance innovative energy storage supply and demand across different mini-grids? How can the issue of later possible
integration with a centralised grid be managed? What is the role and best practice in energy storage technologies on mini-grids using intermittent renewables.
8. GMG development programme Drawing on the above, if the ICF was to develop a programme targeting green mini- grid sector development – focusing on ICF priority countries in Africa, what would the key gaps and barriers to be addressed, skills and resources to bring in, geographical areas to focus on and intervention strategies to be considered. Consider policy and capacity/enabling interventions alongside financing (such as grants, loans, guarantees and feed-in tariffs/results-based payments).
2

Final Report – Support Study on Green Mini-Grid Development (Annexes)
Section 3: TERMS OF REFERENCE
Identifying the gaps and building the evidence base on low carbon mini-grids
Introduction The International Climate Fund (ICF) is a £2.9bn fund over 2011/12 to 2014/15 which is jointly
managed by the Department for International Development (DFID), the Department of Energy and
Climate Change (DECC), the Department for Environment, Food and Rural Affairs (Defra) and the
Foreign and Commonwealth Office (FCO). The UK is currently programming its low carbon portfolio.
Within the ICF, there is a low carbon knowledge studies fund which aims to collate evidence to
maximise results and ensure lesson learning across different geographical and economic contexts.
The studies are demand-based from ICF design teams and will ensure the preparation of evidence-
based Business Cases.
The purpose of this ToR is to bring together a study on mini-grids. The study should enable
benchmarked and evidence-based review and improvement of current ICF projects expected over
the next 4-18 months. In the instance that evidence does support the rationale for UK intervention
and identify a potentially transformational role for the ICF, the study should also underpin a future
ICF concept note to be submitted to the February 2012 board.
The Objective The main objective is to identify the key gaps to scale up the low carbon mini-grids sector, with a focus on Africa but drawing lessons from international experience. It is expected that this will provide
an evidence base and benchmarks against which to assess specific low carbon mini-grid proposals.
For example, under the Scaling-Up Renewable Energy Programme (SREP) and the Results-Based
Financing for Low Carbon Energy Access (RBF) – as well as point to possible additional targeted
intervention strategies to accelerate renewable and/or hybrid mini-grid sectors.
The Recipient The recipients of the study are the DECC and DFID ICF design teams. The study will be conducted in
parallel with country office policy leads working on programmes with mini-grid components and ICF
design teams on any future mini-grid concept.
The Scope The study should focus on ICF priority countries in Africa (Nigeria, Ethiopia, Tanzania, Malawi,
Mozambique, Rwanda and Kenya) in terms of recommendations going forward, but drawing on a
wider evidence base.
The Requirements The report will look at the following questions:
What is the current state of the art internationally with regards to mini-grid (diesel, renewable and hybrid) implementation - presenting installed capacity, investment and
3

Final Report – Support Study on Green Mini-Grid Development (Annexes)
performance data across technologies, implementers, donors, business models, countries
and regions? Present also this analysis specifically for mini-grid sectors in the ICF priority
countries in Africa, and compare with the international status. In what contexts are mini-grids the optimal solution to electrification as opposed to
household systems or grid-based approaches? Present a replicable analytical approach to
establishing where and when mini-grids are optimal for given technologies/resources (at
least micro-hydro, solar PV, wind, bioenergy, diesel and hybrid), consumer
densities/characteristics and proximities to the grid. Apply this analytical approach to ICF
priority countries in Africa and present a preliminary assessment of the minimum necessary
(for universal access), estimated economic optimal and potential maximum contribution of
mini-grids of different technology types in these countries. What are the key performance and impact benchmarks in low carbon mini-grids worldwide in
terms of ICF key performance indicators (especially energy access, emissions reductions and
job creation)? How do these compare with on-grid and household scale intervention
benchmarks? Present a cost-benefit model (including sensitivity analysis) based on real
scheme data for micro-hydro, solar PV, wind, bioenergy, diesel and hybrid mini-grid types –
drawing from examples in ICF priority countries in Africa wherever possible. What is the financing gap (if any) in terms of delivering and replicating mini-grid schemes of
different technology types? What is the experience in terms of cost recovery and tariff
collection with respect to repaying capital and/or ongoing costs? What is the importance, if
any, of including an anchor (larger enterprise) customer on a mini-grid? Present a financial
model for each of the technology types based on real scheme data in different countries, and
assess project financing viability gaps overall, timing issues (in terms of expenditure and
revenue profiles). What is the available evidence on the key institutional, management and governance
elements necessary for a successful mini-grid scheme in terms of raising finance and
successfully completing construction, as well as continuing to provide long term sustainable
service? What is the most effective and viable role that end consumers can play in the
process of mini-grid development and delivery in different contexts? Present analysis on best
practice approaches to mini-grid construction, operation and maintenance, tariff
collection/payment and governance – both separately (unbundled) and as a whole. Present
analysis specifically on the existence and acceptability of such different approaches in the ICF
priority countries in Africa. To what extent has the expansion of mini-grids been accelerated or held back in different
countries by policy and regulatory environments and energy sector structuring? What are the
key elements of national policy which need to be in place in order for mini-grids to be a
viable delivery option? Present the current status of policy and regulatory environment with
relation to mini-grids in the African ICF priority countries. What potential is there for linking mini-grids and using “smart” technology to balance supply
and demand across different mini-grids? How can the issue of later possible integration with
a centralised grid be managed? What is the role and best practice in energy storage
technologies on mini-grids where using intermittent renewables. Drawing on the above, if the ICF was to develop a programme targeting green mini-grid
sector development – focusing on ICF priority countries in Africa, what would the key gaps
and barriers to be addressed, skills and resources to bring in, geographical areas to focus on
4

Final Report – Support Study on Green Mini-Grid Development (Annexes)
and intervention strategies to be considered. Consider policy and capacity/enabling
interventions alongside financing (such as grants, loans, guarantees and feed-in
tariffs/results-based payments). Constraints and Dependencies The study needs to be completed by 22
nd May 2013 and there is a budget ceiling of £80,000.
Reporting
An annotated outline of the final report including details of the case examples to be modelled should be presented within 2 weeks of the start of the contract.
The key datasets, modelling and initial conclusions should be presented by the end of
January 2013 for discussion and integration into any possible ICF concept note. A draft final report should be presented by the end of April.
The final report, updated after comments from DFID and external peer reviewers, should be
presented by 22nd May.
The researchers will provide intermediate outputs as far as possible for use and review in ICF concept
preparation. The final report should be submitted to the Low Carbon Team in DFID who will then
pass them on to ICF colleagues.
It is likely that this report will also be of interest to wider stakeholders in this sector, and it may be
presented via relevant networks such as the SE4ALL Electricity Practitioner Network, the Alliance for
Rural Electrification, Energypedia, HEDON and others.
Timeframe All deliverables should be received by May 2013. The total anticipated duration of the project is 6 months.
DFID Coordination The key contacts in DFID are Victoria Cunningham and Simon Foster. Steven Hunt in DFID will provide quality assurance of the product.
Background The IEA has estimated that, in order to achieve universal electricity access, mini-grids will have to
provide around 40% of new capacity needed by 2030, with the largest amount of the global total
(187TWh) needed in sub-Saharan Africa (WEO 2010). Meanwhile mini-grid development remains
slow, with diesel systems serving largely the better off in extreme situations, and international
support mainly focused on centralised grid systems, and to a lesser extent, household level systems.
However, low carbon mini-grid options do exist - systems based on micro-hydropower have been in
place for many years, and there is increasing public and private interest in bioenergy-fired, solar and
wind-diesel hybrid systems.
This research will draw on a range of ongoing research into different aspects of low carbon mini-grids and Smart Grids, including DFID Research and Evidence Division’s research support via Southampton University and LCEDN, the SE4ALL practitioner network sub-group on mini-grids, UNIDO research on
5

Final Report – Support Study on Green Mini-Grid Development (Annexes)
Smart Grids, GSMA work around mobile masts, relevant experience to date under REACT, RBF and EEP.
Low carbon mini-grids have not received close attention in DFID’s climate change research portfolio
to date with on-grid technologies and household scale interventions receiving more attention. This
research will close that gap.
Competition Criteria
- Technical skills on low carbon mini-grids (including smart grids) and renewable energy technologies
- Private sector, project finance and economic analysis expertise - Value for money
6

Final Report – Support Study on Green Mini-Grid Development (Annexes)
Annex 2: Country Visit Reports (Kenya & Mozambique)
(Cf. separate files)
7

Final Report – Support Study on Green Mini-Grid Development (Annexes)
Assessment of the GMG Potential Development in Mozambique
Mission report
(Taric de Villers – 9-12 April 2013)
TABLE OF CONTENTS 1 Introduction ................................................................................................................ .................... 2
1.1 Objectives ............................................................................................................................. ... 2
1.2 Methodology ............................................................................................................ ............... 2
1.3 Agenda and interviewed contacts ........................................................................................... 2
2 MOE - DNRE ............................................................................................................................. ........ 4
3 FUNAE ............................................................................................................... .............................. 5
4 EDM ......................................................................................................................... ........................ 7
5 NORAD ............................................................................................................................. ................ 7
6 BTC
.............. .......... ......... .......... ......... .......... .......... ......... ......
.............. .......... ......... .......... ......... ....... 8
7 GIZ
.............. .......... ......... .......... ......... .......... .......... ......... ......
.............. .......... ......... .......... ......... ........ 9
8 AFD .............. .......... ......... .......... ......... .......... .......... ......... ......
.............. .......... ......... .......... ......... ....... 9
9 DFID ............................................................................................................................................... 10
10 WB
.............. .......... ......... .......... ......... .......... .......... ......... ......
.............. .......... ......... .......... ......... ...... 10
11 AECF ................................................................................................. ............................................. 10
12 Conclusions ................................................................................................................. .................. 11
13 Annexes ......................................................................................................................................... 12
13.1 Institutional environment ..................................................................................................... 12
13.2 Tariff Structure ............................................................................................................ .......... 13
13.3 National Grid Network ....................................................................................................... ... 15
1

Final Report – Support Study on Green Mini-Grid Development (Annexes)
1 INTRODUCTION
1.1 Objectives:
- Review of mini-grid experience - Assess the potential for GMG development - Clarify policy and regulatory framework environment - Identify key national partners for GMG development programme
1.2 Methodology:
- Interviews of key institutions: FUNAE, MoE, EDM, WB, DFID, AFD, CTB, GIZ, AECF - Interviews of key consultants: M. Boaventura - General data collection (Maputo):
1. Review of national policies and regulatory framework for Mini-Grids (isolated and later grid connected)
2. Geo-referenced database (GIS) as population, villages, existing/planned MV network and isolated power plants
3. List and details of existing/planned mini-grids in Kenya (isolated diesel-based power plants, renewable energy-based mini-grids) + implementation & operational schemes
4. Experience with smart technologies (metering, payment collection, storage) for rural electrification
5. Key partners to finance, promote, build, operate GMG projects - Project data collection (Maputo): real operation data of implemented GMG projects, if any.
1.3 Agenda and interviewed contacts:
Date Organisation Interviewed
9-10 April FUNAE Edson Uamusse (Planning)
Abel Boane (Hydro) Amilcar Maducia (IT & GIS)
Simaosaranga (Planning)
9 April MoE – DNRE Antonio Saide (National Director)
9-10 April Consultant Boaventura Chongo Cuamba (Prof)
11 April EDM Jeronimo Narrime (Environmental manager)
Antonio Gimo Junior (Planning) Olga Utchavo (System planning) Yara Assia Cabra (Planning)
Belarmina Mirasse Jassias (Environmental planner)
11 April NORAD Mari Sofie Furu (counselor – Energy sector)
11 April CTB Jan Cloes (NRE Technical Assistant to FUNAE)
Tom Smis (resident representative)
12 April GIZ Florian Geyer (assessor/project adviser)
Charles Chidamba (Field expert – Manica) 12 April AFD Emmanuel Haye (chargé de mission)
DFID Gareth Weir: not available, in a workshop + vacation
Rita Zacarias: not available, on vacation
2

Final Report – Support Study on Green Mini-Grid Development (Annexes)
WB Rob Mills: not available, living in UK
AECF Anjali Saini: not available, to contact in Nairobi
Separate XL file with detailed contact information
3

Final Report – Support Study on Green Mini-Grid Development (Annexes)
2 MOE - DNRE
General institutional framework o Main policy documents
Electricity Act 1997
National Energy Policy 1998
National Energy Sector Strategy Decree 2000 and revised in 2009
New & Ren. Energy Dev. 2009 + Strategy in 2011 Policy
Rural Electrification Strategy and Prepared by … under revision/approval? (TBC)
Investment Program (RESIP)
Master plan for rural electrification
No document yet. Need integrated document for rural electrification (with agriculture, industry); new MP under discussion with WB (RESIP / EDAP)
Master plan for power generation Prepared by NorConsult / MoE in 2009
Master plan for grid extension Old document, obsolete, initial targets are not reachable. New MP by NorConsult (financed by AFD) under process
and validation (delay).
Code of electricity Document revised by … (funded by NORAD) (TBC)
Renewable Energy Atlas Ongoing by Portuguese & local consultants (GESTO – www.gestoenergy.com & SELF Energy –
http://www.selfenergy.co.mz), including detailed
information on potential, options, beneficiaries, budget
o No real implementation agency for rural electrification, FUNAE plays the role o No real regulatory body for electricity; MoE actually plays the role with CNELEC as
advisor. Plan to transform CNELEC in regulatory body. (*NORAD) o “Energy Sector Working Groups” (Paris Declaration on aid effectiveness):
one on Energy (coal, gas, petrol) with MoE
one on Renewable Energy (SNV, GIZ, BTC, Norad, WB and FUNAE)
38% electricity access in 2012 (25% with grid and 13% with PV) Local manufacturing/assembly capacities:
o 5MWp Solar module assembly (near Maputo): ongoing with Indian cooperation o Solar pico systems with FOSERA o Hydro turbines: existing in Manica with GIZ (similar to Zimbabwe) o Prepaid meters: existence of local assembly
Green mini-grid experiences: o Hydro: Mozambique has good experience with large hydropower, although has very
little experience with small, mini & micro hydropower supplying mini-grids (MG); only 3 hydro schemes are under implementation with FUNAE and some other planned. Hydro is the most promising renewable source in Mozambique.
o Solar: Three solar MGs are under implementation by FUNAE. Few other solar-MGs by specific donors, private companies and charity NGOs, without FUNAE involvement.
o Wind: 30 MW on the coast + 300kW turbine but not connected to the grid (no tariff) o Biomass: some sugar & mill factories using waste for cogeneration; need fair prices
for grid connection or rural household distribution. Private sector is supported by the government through specific regulation (Ministry of
4

Final Report – Support Study on Green Mini-Grid Development (Annexes)
Planning & Development & MoF) with the Investment Law (1993/2009), Decree 2008 for SME and micro enterprises, and PPP law (2011). Investment Promotion Agencies (CPI) and SME Support Institute (IPEME) help specific enterprises with various incentive instruments. A
specific study1 has been conducted to review and analyse those investment incentives for
small scale renewable energy projects. Taxation system (corporate tax, simplified tax, VAT, imported duties) is regulated by 2 laws
(2002, 2006). 0% duty on electricity product import.
IPPs: few IPPs with gas and one hydro IPP (HCB) are operating and selling electricity to EDM; other new are coming in hydro and wind.
Tariffs barrier: o IPP regulatory framework is in place but not the tariffs o Big gap between baseline tariff (3Mt/kWh or ~8 $c/kWh) and “fair tariff” for IPPs o Need for fair price for PPA over 20 years
o RE-FiT: under discussion; first draft planned for August 2013 (but unlikely to come
out soon as Presidential election are scheduled in 2014) (Cf. AFD)
o Private sector could be attracted to generate power (IPP) but are not willing to distribute
Non-tariff barriers: o Low population density o Many micro-villages (50-100kW only) o Rural people organisation: very difficult to … o Very low income in some rural areas; even EDM tariff can be too high (Cf. BTC) o No specific financing scheme for MG or RE
o No specific fiscal incentives for renewable energies, nor for energy but there are
incentives (import & VAT) for all kind of enterprises
o Fuel price (Petromoc): Diesel = 38Mt/l & Gasoline = 47Mt/l. VAT and fuel tax are not levied on kerosene. The diesel fuel tax is halved for agriculture, fisheries, and power generation
Off-grid business model: o FUNAE/Government off-grid project evolution: village collection
1 village representative
1 village
committee
new model still to be defined.
o New model could be SME with accounting system mixed with village community = “Community-based enterprises”
o Ownership of equipment is FUNAE; management is local committee o There are also pure private initiatives to electrify rural households, usually owners of
grind mills selling extra power to some nearby households.
3 FUNAE
Institutional positioning o Initially designed as a fund to promote sustainable power resources as renewable e
(solar, hydro, wind), and by extension of rural electrification. (Cf. Annex) o FUNAE is also involved in improved cook stoves, rural fuel stations and diesel-based
mini-grids programmes. o There is neither a specific Rural Electrification Agency nor a regulatory body similar
to Mozambique’s. FUNAE and MoE play both roles (with advisory of CNELEC). o FUNAE actually acts as an implementation agency for off-grid RE projects and EDM is
1 Investment Incentives for Renewable Energy in Southern Africa: The Case of Mozambique, Boaventura Chongo Cuamba,
January 2013
5

Final Report – Support Study on Green Mini-Grid Development (Annexes)
in charge of grid extension. o Most provinces have FUNAE delegations
Partnerships (not exclusive) o Portugal: solar projects, Atlas on RE o Norway’s NORAD: institutional support to MoE and FUNAE o Belgium’s BTC: hydro & solar projects, water supply, support to FUNAE o WB: solar projects o Korean: solar MG projects
o India: local manufacturer of solar panel (Indian technology and raw materials for 2
years) with 5 MWp capacity; state owned company (PPP) Financing sources
o From donors as above o From government (Ministry of Finance)
Implementation o Diesel genset mini-grids: 69 systems implemented by FUNAE and managed by local
“management committee” (only 14 are recorded as ‘GG’ in GIS system). Money collection by the committee (flat rate tariff – 8 hours/day service) but low collection rate. Many are stopped due to lack of finance for fuel, spares, maintenance.
o Hydro power plants (15kW – 1MW): Based on GIS data, total 69 SHP sites including 53 potential sites + 3 projected + 13 constructed. Most are located in 4 regions (Niassa, Zambezia, etc.). Load demand (villages or grid) at proximity of hydro site remains a key barrier.
o Hydro mini-grids: 3 under construction (two with ~500kW and one with 23kW); local operators
9 are starting (or ongoing)
6 are under EPC contracts (< 100kW each
simplified procedures)
Management by local communities will be prioritized
o Solar mini-grids:
Korean project: 3 solar MG (400+400+500kWp) under construction in 3 villages in Niassa where LV grids supplied by small fuel genset (~45kVA) were existing; supplied and financed under Korean loan; oversizing and very high
price (33 M$
27.5$/Wp). Backup with new diesel gensets (~300kVA). End-user connection with prepayment meters. Initially designed as stand-alone MG with batteries but the main grid is coming very close soon. Investigation for grid connection (inverter issue) and sale of extra power (negotiation with EDM on FiT is ongoing). Customer tariffs, operation and management are not fixed yet (either local private operator or local community).
Portuguese project: one solar MG of 2 kWp with high quality components (SMA) but also very expensive
o Stand-alone solar systems: several thousands of systems installed with flat rate tariff
(200-300Mt/month)
Solar equipments are from many brands, low quality, maintenance and spare part problems (*BTC)
Management & tariff issues o FUNAE owns the equipment; local “management committees” operate, maintain
and collect money in each village. No meter & flat rate for solar individual systems (200-300Mt/month)
kWh meters & adapted tariff for MG (TBC)
o kWh tariff cannot be higher than EDM tariff 3Mt/kWh (7-8 $c). All projects are
subsidized. o Part of money collection goes back to FUNAE (75% for stand-alone solar)
6

Final Report – Support Study on Green Mini-Grid Development (Annexes)
Planning & Monitoring o GIS database
Existing 11/22/33kV MV network (2010) from EDM
Villages and population from CENSUS 2007
No specific layer with off grid power systems (generation & distribution) o No operational data is available from rural committee
o No public information is available on operating status of existing installations (solar, hydro, gensets)
o Despite existing GIS data at FUNAE and the repetitive attempts (at all hierarchic levels) to get the key layers for accurate MG potential assessment, FUNAE did not provide data, neither reply to IED regarding that request. Consequently the potential assessment provided in Chapter 2 of the DFID Support Study is based on unreliable data and might wrongly state that MG potential in Mozambique is negligible.
4 EDM
EDM is a parastatal utility leading in power generation, transmission & distribution (Cf. Annex)
EDM has no more isolated power plants; all are connected to the grid. Electrification plan:
o All 128 Districts HQ will be connected by 2014; there are about 20 left (Cf. annex map)
o There are 396 Administrative Posts with only 198 grid-connected today and about 20 planned by 2014. Left 179 to be electrified by other means (Cf. annex map)
EDM is apparently interested with renewable solutions for off-grid electrification of
remaining administrative posts, in particular with wind power.
In 2006, NVE has identified 170 potential sites for mini & small hydro (< 10MW) in 2 main catchment areas (Niassa and Zambezia). Average capacity is 150kW but no feasibility studies available and doubts about viability.
In 2008, pre-feasibility studies made by NorConsult for 9 projects (0.5 – 8 MW) to be
connected to EDM (<20km from MV) in the same 2 provinces. Expected RE-FiT tariff: 10 USc/kWh per 2009.
Rural domestic consumption growth rate is actually 3-4%/yr (= low scenario)
EDM is using simplified “red box” with meter for rural connections
EDM is using prepaid & split CREDELEC meters (offline) since 1995 (80-90% of customers)
EDM is starting with online CREDELEC meters (National On-line Pre-Paid Electric Energy Sale in petrol stations, supermarkets, ATMs, mobile phones, internet)
EDM tariff is uniform all over the country and baseline tariff is 3 Mt/kWh (cf. Annex). No
increase since 2010. Customers’ tariffs and connection fees per categories are given in annex.
5 NORAD
Ongoing activity: Capacity strengthening of MoE (DE) with NVE Institute (integrated planning of all energy sectors)
Planned activities: o In-depth impact study of rural electrification (income generation, impact on EDM
business); OTC to be launched second half of 2013 o Twinning programme between EDM and Norway utilities o Support to develop a “Strategy for PS involvement” with FUNAE (see below)
7

Final Report – Support Study on Green Mini-Grid Development (Annexes)
Limitation observed (related to MG projects) o RE-FiT: planned but not implemented; although framework exists for IPPs o Private sector involvement: lack of capacity (especially for local SMEs) and lack of
finance & incentives. To attract private sector and expect leverage effect, one needs to increase significantly grants & subsidy levels and to have appropriate tariffs.
o FUNEA performances:
Involved in various activities: renewable, fuel stations, cooking stove, rural electrification
Involved at all levels: funding, implementation, O&M, monitoring
Too many programmes, projects, systems, committees, donors
Lack of capacity and staff resources with respect to their volume of work
FUNEA is too stretched and overloaded
Real concern on sustainability: low performances with maintenance, spare parts, money collection, monitoring
Need deep structural change to facilitate and to regulate the PS involvement
All donors agree with those statements but most continue to support FUNAE thereby increasing the drift/slippage and the rate of failures.
Therefore NORAD is reluctant to support any large electrification programme with FUNAE, despite many demands. Instead NORAD agreed to support FUNAE to develop a “Strategy for PS involvement” through an open tender. The results will impact how support funds could be managed and used. The conventional REA + REF combination is one option among others to be investigated by the study. But the resulting structural adjustment might be rejected later on by MoE or even by FUNAE (get money back from committee’s collection).
6 BTC
Activities o 23.5 M€ programme (Solar PV, water supply, wind pumping) over 4 years but very
limited disbursement after 2 years o Technical assistance to FUNAE on hydro, solar, wind projects o Support to DNRE (MoE) and technical assistance to FUNAE on hydro, solar, wind
projects o Member of RES working group but not yet a pressure group
Limitation observed (related to MG projects) o Scattered household & low population density (4-10 people/km²) o Difficulty to identify appropriate villages for MG (Cf. INE statistics (www.ine.gov.mz)) o Very low income of rural households in some areas; even 3Mt/kWh is too high o Low collection rates by committee
no money for fuel, spares, maintenance Many of
the 69 diesel-based gensets are stopped.
o Inadequacy between hydro production and load demand (level & distance) o Lack or rural electrification framework (no policy development, no regulation, no real
implementation agency, no FiT, no PS incentives) o Private sector involvement: the PS has no capacity to invest, to operate, and to
maintain. Lack of maturity, low entrepreneurship, very few can invest (far from
critical mass), very few have social concern, lack of competition (
high prices up to 3X market prices and low quality services)
o Tariffs: Without attractive tariffs well above 3Mt/kWh, there is no profitability, no sustainability for renewable electricity projects and private operators.
o FUNAE limitations: Lack of capacity, resources, overloaded with implementation (as NORAD)
Over solicitation by donors on renewable energy
8

Final Report – Support Study on Green Mini-Grid Development (Annexes)
Lack of staff capacity despite continuous increase of staff (120 today) and dynamic
management.
Limited O&M & supervision capacity
Little concern on value-for-money
Big tendering machine with lot of staff busy with procurement issues. Recent restriction with Portuguese language for tendering.
Strong believe that “solar is free”
7 GIZ
ENDEV2 – AMES-M (Access to More Energy Services)
programme o Productive use of energy o Biomass & improved cook stoves o Pico Solar (lanterns) o Micro and mini-hydro & mini-grids in Manica District
Project is implemented with MoE (A. Saide is chairman of Steering Committee), without FUNEA
Feasibility studies are conducted with FUNEA
Local supervision by GIZ office in Manica (Charles Chidamba & Mario Merchan)
Implementation of 7 micro hydro plants of 20kVA each (operational) with LV distribution network
Pelton turbines manufactured locally, including a grind mill that could be run by the same turbine (similar technology & project with Zimbabwe under GIZ and Practical Action, although quality is higher in Zimbabwe)
Construction with local NGOs and SMEs
The operator is a local business man identified and recruited with local NGO’s assistance. This is a key success factor. The operator contributes with in-kind or small cash (<10%) and become owner after start-up.
He sells electricity to customers and maintained all the system. Management scheme and tariffs are under fine-tuning. High remoteness of villages complicates the management organisation.
Critical tariff issue: A flat rate tariff has been negotiated with customers (at about 200Mt/month) and agreed by committee but needed the final approval of MoE as it is above EDM tariff (request is ongoing).
Several technical problems but will be solved (see with Mario)
More projects are planned till the end of 2015. There is a list of at least 20 sites with prefeasibility studies in Manica.
Concern with load forecast adequacy as village population could grow more rapidly as people from other villages are moving easily to get electricity.
8 AFD
Activity in energy is limited to loan support to EDM for grid extension. It includes: o Review of Grid Extension Master Plan (contracted to NorConsult); far behind
schedule; at validation stage o Part of the Donors’ working group; weak participation of MoE
General political context (Presidential elections in 2014) will not facilitate progress in energy
sector.
2
AMES-M programme is implemented in the context of the Dutch-German partnership called “Energising Development”, aims to increase sustainable access to modern forms of energy in Mozambique.
9

Final Report – Support Study on Green Mini-Grid Development (Annexes)
EDM is facing serious accounting and debt problems. A tariff study conducted in 2012 by
Elexpert (SA consultant) highlights the need to increase the EDM tariff substantially (at least 10% per year) as the buying price of electricity will double by end of 2018.
From HCB Cahora Bassa Hydro Scheme (2075MW), only 500MW is available for Mozambique
and the peak demand reached 730MW in 2012 (620MW in 2011). Alternative power productions are indispensable and EDM will need to buy power from IPPs.
Most forthcoming IPPs won’t be able to sell electricity at Cahora Bassa price (2$c/kWh) or
even at baseline tariff (8$c/kWh). Aggreco for instance runs 120MW gensets and sells peak power to EDM at 15$c/kWh. Some gas-based IPPs claims to produce electricity at 3$/GJ only (=1.1$c/kWh).
9 DFID No meeting - Data from internet
Not part of Energy Sector Working Group yet
3 years programme on biofuels with guidance to initiate the market (*MoE)
10 WB No meeting - Data from internet
The World Bank is one of the main donors in the energy sector in Mozambique, enjoys close working relations with GoM, and has consistently played a key policy and institutional development and technical advisory role in the energy sector for more than a decade.
The World Bank is an active member of the "Energy Sector Working Group" that was
established within the framework of the Paris Declaration on aid effectiveness. The World Bank already supports the Energy Sector through various projects.
o ERAP (APL-1) project was approved by the Board in 2003. o EDAP (APL-2): Energy Development and Access Project (cf. annex)
The Bank is also supporting national and regional transmission project initiatives (as
Mozambique-Malawi Interconnection and Regional Transmission Interconnection) that will facilitate large scale investment in least cost power generation and regional trade.
11 AECF No meeting - Data from internet
The AECF REACT Mozambique Window is a special fund of the AECF (multi donors) that is open to business ideas based on renewable energy and adaptation to climate technologies
10

Final Report – Support Study on Green Mini-Grid Development (Annexes)
12 CONCLUSIONS 1) Lessons learnt from existing programmes & projects with MG : There is little experience with mini-grids in Mozambique. They are mainly implemented by FUNAE (69 diesel, 4 solar, 3 small & micro hydro), by GIZ (7 micro hydro), and by the private sector & NGOs (some hydro or diesel-based mini-grids). There are 2 business models that have been implemented for mini-grids as follows:
- FUNAE model based on local management committee with a leasing on equipment - GIZ model based on local private business man becoming owner
Meanwhile, the following 2 tariff schemes are experimented:
- Flat rate tariff when no meter - Specific tariff with conventional or prepaid meters
2) Barriers to develop GMG Among the main identified barriers that impede the GMG development:
Demand characteristics (scattered HH, low load, low incomes, poor village organization)
Investment financing (lack of incentives, access to credits, soft loans)
Private sector involvement (lack of confidence, of technical & managerial skills, of financial capability, and of entrepreneurship, in particular in rural areas, outside Maputo)
Institutional environment: capacity limitations of FUNAE in project implementation,
management and monitoring. While ME & FUNAE have experienced remarkable development in the last few years, they remain seriously understaffed with respect to their level of responsibilities and volume of work, requiring significant institutional strengthening and capacity development and probably deeper structural reform.
Policy & regulatory frameworks: no political will to adapt tariffs and allow profitable EDM
and IPP businesses.
3) Perspectives for GMG development programme The most appropriate approach could be to start with small hydro-based mini-grids run by community-based enterprises with support of FUNAE (PPP) and with flat rate tariff (similar than GIZ approach), unless tariff structure changes soon.
11

Final Report – Support Study on Green Mini-Grid Development (Annexes)
13 ANNEXES
13.1 Institutional Environment Extract from Project Appraisal Document (2010) on EDAP (APL-2) Project (Energy Development and
Access Project3
The Ministry of Energy (ME) is responsible for national energy planning and policy formulation
and for overseeing the operation and development of the energy sector. ME is composed of
three main thematic areas (Power Sector, Renewables and Liquid Fuels) and a central services
management group. ME is represented in the provinces through Provincial Directorates of
Mineral Resources and Energy. ME presently has a total of 156 staff, of which only 30% are
university level professionals. While ME has experienced a remarkable development in the last
few years, it remains seriously understaffed with respect to its level of responsibilities and
volume of work, requiring significant institutional strengthening and capacity development. Electricidade de Mozambique (EdM), is a vertically-integrated, government-owned electric
utility with an installed capacity of 140MW hydropower (86MW operational) and installed
109MW (82MW operational) in thermal power stations. EdM buys most of its power supply
(400MW) from Hidroelectrica de Cahora Bassa (HCB), owner and operator of the Cahora Bassa
plant on the Zambezi (2,075 MW). The GoM owns 82 percent of HCB which operates as an
Independent Power Producer (IPP). The bulk of the electricity generated at HCB is exported to
South Africa, with a small amount to Zimbabwe. EdM sells any excess electricity on the
Southern Africa Short Term Energy Market. The Mozambique transmission grid is currently
interconnected with South Africa, Zimbabwe and Swaziland. The Fundo Nacional de Energia (FUNAE) was established in 1997 as a public institution to
promote rural electrification and rural access to modern energy services, in a sustainable
manner, and as a contributor to economic and social development in the country. Since its
establishment FUNAE has been able to implement numerous successful projects using solar,
wind and biomass energy resources and technologies to electrify and/or bring access to
modern energy services (water pumping, crop grinding, communications, etc.) to schools,
clinics and communities. FUNAE has two decentralized offices in Tete and Nampula. The Conselho Nacional de Electricidade (CNELEC) was established as an independent advisory
regulatory body for the electricity sector in early 2008 with support from IDA's "Energy Reform
and Access Project" (ERAP APL-1; P069183). In a July 2006 directive issued by the Minister of
Energy, CNELEC was instructed to give its highest priority to an evaluation of EdM's
performance under its Performance Contract with the Government of Mozambique (GoM).
This Performance Contract covers the years 2007 to 2009 and sets out the goals and indicators
to be met annually by EdM and by the government. The 2006 directive also instructed CNELEC
to conduct a review of the current methodology used by EdM in setting tariffs. In performing
the review of EdM's performance, the directive instructed CNELEC to conduct its review in an
open and transparent manner with public hearings in several locations throughout the
country. The directive also required that CNELEC make use of surveys of public opinion on
3
http://www-
wds.worldbank.org/external/default/WDSContentServer/WDSP/IB/2010/01/18/000333038_20100118012856/Rendered/
PDF/522040PAD0P108101Official0Use0Only1.pdf
12

Final Report – Support Study on Green Mini-Grid Development (Annexes)
EdM's performance. In early 2009, the Government of Mozambique (GoM) approved the
allocation of 2.5% of the concession fees from Hidroelectrica de Cahora-Bassa, in addition to a
25% share of any other electricity sector’s concession fees, to fund CNELEC's future operating
budget. This decision is seen as a very positive signal of GoM commitment to CNELEC. At
present, the Bank funds the major portion of CNELEC's operating budget through ERAP (APL-1).
13.2 Tariff Structure
13

Final Report – Support Study on Green Mini-Grid Development (Annexes)
14

Final Report – Support Study on Green Mini-Grid Development (Annexes) 13.3 National Grid Network
15

Final Report – Support Study on Green Mini-Grid Development (Annexes) Sources: EDM “Annual Statistics”, 2011;
16

Final Report – Support Study on Green Mini-Grid Development (Annexes)
Assessment of the GMG Potential Development in Kenya
Mission report
(Taric de Villers – 15-17 April 2013)
TABLE OF CONTENTS 1 Introduction ................................................................................................................ .................... 2
1.1 Objectives: ............................................................................................................................. .. 2
1.2 Methodology: .......................................................................................................................... 2
1.3 Agenda and interviewed contacts: .......................................................................................... 2
2 MoE ............................................................................................................................. .................... 4
3 REA
.............. .......... ......... .......... ......... .......... .......... ......... ......
.............. .......... ......... .......... ......... ....... 5
4 KPLC ............................................................................................................................. .................... 5
5 WB .............. .......... ......... .......... ......... .......... .......... ......... ......
.............. .......... ......... .......... ......... ........ 6
6 AFD
.............. .......... ......... .......... ......... .......... .......... ......... ......
.............. .......... ......... .......... ......... ....... 7
7 GIZ-Kenya ............................................................................................................................. ........... 8
8 DFID-KfW/GIZ-IED meeting ......................................................................................... .................... 9
9 ASD .............. .......... ......... .......... ......... .......... .......... ......... ......
.............. .......... ......... .......... ......... ..... 10
10 Smart Technologies ....................................................................................................................... 11
11 Conclusions ................................................................................................................................... 13
12 Annexes ......................................................................................................................................... 14
12.1 Institutional Environment ..................................................................................................... 14
12.2 Tariff Structure & Fuel Prices .............................................................................................. .. 15
12.3 IED comments on “Project Document on MG development in Kenya (SREP)” .................... 16
12.4 Country’s Brief (from IED interim report) ............................................................................. 18
1

Final Report – Support Study on Green Mini-Grid Development (Annexes)
1 INTRODUCTION
1.1 Objectives:
- Review of mini-grid experience - Assess the potential for GMG development - Clarify policy, institutional and regulatory framework environment for MG - Identify key national partners for GMG development programme
1.2 Methodology:
- Interviews of key institutions & donors: REA, MoE, KPLC, WB, DFID, AFD, GIZ, AECF - Interviews of key consultants: M. Hankins, Kiremu - General data collection (Nairobi):
1. Review of national policies and regulatory framework for Mini-Grids (isolated and later grid connected)
2. Geo-referenced database (GIS) as population, villages, existing / planned MV network and isolated power plants
3. List and details of existing/planned mini-grids in Kenya (isolated diesel-based power plants, renewable energy-based mini-grids) + implementation and operational schemes
4. Experience with smart technologies (metering, payment collection, storage) for rural electrification
5. Key partners to finance, promote, build, operate GMG projects - Project data collection (Nairobi): real operation data of implemented GMG projects.
1.3 Agenda and interviewed contacts:
Date Organisation Interviewed
15-16 April REA Raphael Kazhenzi (Renewable Energy manager)
resigned James Muriithi (Renewable Energy senior engineer)
Simon Wangi (Chief Manager Operations)
on leave
16 April KPLC Henry Gichungi (Off-Grid Manager)
travelling abroad Henri Kapsowe (Off-Grid Power Station officer)
17 April MoE Issak Kiva (Ag. Director of Renewable Energy)
15 April Rencon Kiremu Magambo (Director, Consultant) Associated Ltd
15 April GIZ Aregash Asfaw (Senior coordinator)
Geoffrey Ronoh (Technical project advisor)
16 April DFID/KfW/GIZ/IED Join meeting:
- DFID: Virinder Sharma
- GIZ: Bozhil Kondev, Jörg Baur, Gerrit Plum, Jacinta
Murunga
- KfW: Arndt Wierheim
16 April DFID Virinder Sharma (programme officer)
17 April ASD Mark Hankins (Director)
17 April WB Mits Motoashi (Energy & Finance specialist)
2

Final Report – Support Study on Green Mini-Grid Development (Annexes)
17 April AFD Maïtane Concellon (Energy Programme officer)
Nyokabi Gitahi (Programme officer)
17 April AECF “Grantee Induction Cocktail” in Nairobi
cancelled
? M-KOPA Jesse More
no time to meet – to contact by email
? GSMA Mary & Charlotte
no time to meet – contact by phone + email
? Access:Energy Harrison Leaf (Director)
no time to meet – to contact by email
Separate XL file with detailed contact information
3

Final Report – Support Study on Green Mini-Grid Development (Annexes)
2 MOE
Ongoing energy reform is supporting Renewable Energy and Rural Electrification through its Renewable Energy Department (RED) and Rural Electrification Agency (REA). Strong commitment to rural electrification.
The key institutional actors for off-grid and mini-grids are MoE, REA, KPLC, KenGen and ERC
(Cf. annex) The key institutional documents include (http://www.energy.go.ke/downloads/):
o Revised National Energy Policy (May 2012) and Energy Acts (2006) o Rural Electrification Programme Levy Fund (REPLF) 2003-2008 o REMP 2009 – Rural Electrification Master Plan 2008-2018 o FiT tariffs policy (MoE, Jan 2010 + revision Dec 2012) o SREP Investment Plan (May 2011) o Privatization Act;
Public enterprises reforms and privatization (policy paper 1992)
KPLC privatization in 2006 (70% public)
Concessioning of government-owned Isolated Power Stations approved by Parliament through Sessional Paper on Energy in October 2004
o Decentralization: ongoing process with the creation of 47 counties and governments
but their role in the planning/management of electricity remains to be defined Private sector support:
o The generation market is open to IPP; licenses are issued by ERC; FiT is in place (see
below). There are several operational IPPs but only one off-taker (KPLC). o The distribution/sales market does not seem to be regulated yet. Is the market open
to other distributors than KPLC? Are licenses & PPAs ready? o Fiscal incentives for renewables include zero-rating duty and VAT on “solar systems”
(modules, electronics, batteries if packaged), and to some extend on wind equipment.
Fuel price is distance-dependent (formulae) and adjusted every month (103-119 KES/l in April
2013). Taxes are identical for all; there is no tax alleviation for power generation. Mini-grid delivery and implementation scheme consists of:
o Existing mini-grids that have been fully financed by GoK; donors are expected for new programmes
o REA procure, install equipments, then handover to KPLC, but REA still own assets o KPLC operate & maintain (& replace), generate and distribute to end-users
o Financial MG operation losses (mainly from fuel gensets) are compensated by
government (or by monthly adaptations of cross-subsidized tariffs? TBC)
New MG site selection is based on REMP and REA/KPLC investigations (mainly administrative and market centres). A total of 68 sites (44 greenfields + 15 under construction + 9 existing) have been selected and proposed to donors for funding.
Tariff structure o End-users fee connection and tariff are uniform for all KPLC customers. Pre-financing
facility exists for connection charges (“Stima loan”) o Not clear for other non-KPLC customers if any (identical to KPLC or can be set on
case-by-case for isolated MG) o FiT tariff has been implemented since March 2008 and was reviewed in Jan 2010 &
Dec 2012. New FiT (e.g. 12KES/kWh for grid-tie PV and 20KES for off-grid PV above 500kWp) is guaranteed for 20 years with standardized PPA for small scale renewable energy projects (0.5-10 MW)
o Net-metering for small scale RES projects, with PPA is under consideration. Probably with the concept of electricity banking or unit banking which allows to defer non-
4

Final Report – Support Study on Green Mini-Grid Development (Annexes)
used units to the next period? o Not clear tariff for off-grid and mini-grids, in particular below 500kW
MoE is implementing SREP project (see WB below) and has coordinated the preparation of a joint “Project document on MG development in Kenya (SREP)” under the request of concerned donors (AFD, KfW, WB, DFID). Comments are awaited for the 18
th April. (Cf.
Annex)
The industrial sector in Kenya includes manufacturers of batteries (Chloride Exide), of PV
modules (50MWp in Naivasha town1), homemade wind turbines (microenterprise), micro-
hydro turbines (crossflow, kaplan below 100kW) by few SMEs (technology transfer from Nepal). Prepaid meters seem to be imported.
Identified studies: o The Privatization Commission (www.pc.go.ke) has recruited a local consultant (PKF –
M. Matheu 0738.243.355 - www.pkfea.com) to study the privatization potential of off-grid power stations and to facilitate comprehensive review of the most appropriate and effective way of operating the stations in the future. Study report is awaited for a long time and expected in 3 months
o There is one ongoing study on tariff scheme to advice the GoK about the best tariff scheme to be adopted.
o In the framework of REMP revision, DECON has conducted a study on connectivity and accessibility in rural areas
o There was a study in Net-Metering in Kenya conducted by GIZ (see below) Staff at MoE working on off-grid power systems: n.a.
3 REA
Mini-grids are planned accordingly to REMP in priority to supply District HQ, then administrative centres and market centres.
REA has been in charge of planning, design, procurement, financing and installation of 12
diesel-based mini-grids (7 have been recently hybridised, see below). REA is in the process of developing 15 new MG sites still diesel-based (under construction).
Alternative technology choice2: Hydro and biomass resources are not available in off-grid
area (arid zones). All harvestable rivers are near the grid and biomass is preferred for larger power generation units (cities).
Existing GIS system & information at REA have been promised but not provided to IED
despite many reminders. Staff at REA working on off-grid power systems: n.a.
4 KPLC
KPLC is presently running 12 MG since 2007-2010, all initially diesel-based power stations. 2 will be soon grid connected and 7 have been hybridised with solar and wind since 2011-2012.
Station Operator Year Diesel (kW) Solar (kW) Wind (kW)
Lodwar KPLC 2012 1440 60 -
Merti KPLC 2011 128 10 -
Habaswein KPLC 2012 360 30 50 + Batt
Mandera KPLC 2012 1600 300 -
1 Joint venture between Chloride Exide and Ubbink B.V - a wholly owned subsidiary of Centrotec Sustainable AG (Dutch),
started in Aug 2011, 100 modules/day, 13-125Wp.
2 Kenya Energy Atlas (ESD, 2006)
5

Final Report – Support Study on Green Mini-Grid Development (Annexes)
Hola KPLC 2012 800 60 -
Marsabit KPLC 2011 2406 - 500 (2) El Wak KPLC 2012 360 50 -
Key lessons from MG and their hybridisation: o High CAPEX for MG
Standard connection costs (standard board with meter; no “ready board”) are
very high (35.000 KES) and KPLC plans to double connection fees to recover the real costs
High standard for distribution network (MV+LV). No adapted standards (low cost) for rural electrification
o High OPEX for MG: fuel based generating unit costs about 50 KES/kWh (fuel part
only) and average tariff to consumers is 17-20 KES/kWh only. High cost for conventional money collection; no prepayment on first installation because of non-availability of meters.
o Lack of local availability of spare parts causes major maintenance delays and accelerates wear & tear of gensets.
o Only Habaswein MG has a “small” battery (490 kWh) to improve the stability; others are direct injection into the “grid”.
o In Habaswein, the load peak has increased from 50kW (2007) to 181kW (2013), i.e. 44% per year. But in Merti & Baragoi, it increased from 20 to 54kW over 6 years, i.e. 5.7%/year. Lodwar has an increased of 27%/year and was used as reference in load forecast for SREP document.
o KPLC faced stability problems with wind generation without storage if penetration is above 30%. KPLC investigates solutions with ABB/flywheel to improve stability and penetration rates up to 100% for wind. Solar PV capacity are usually far below 30%.
o No specific information on economical and technical performances of existing GMG is available (fuel savings, solar performance ratio)
o Low private sector involvement due to lack of confidence/awareness on MG and of funds for feasibility studies
o Demand analysis and load forecast assumptions seem to be overestimated in the recent MG project document. Statistics from existing electrified sites should be published or shared.
Retail KPLC tariff (Cf. Annex): 120KES fixed + 2 KES/kWh (0-50 units/month) or 8.1 KES (51-
1500 units/month) or 18.6 above 1500 units/m. For comparison, most rural households spend between US$ 10 and 14 per month (850 – 1200 KES) on lighting alone with kerosene for tin lamps and lanterns.
Staff at KPLC working on off-grid power systems: 8
5 WB
WB provides institutional support to MoE and REA following the REMP and focusing on commercial centres to have more impacts and sustainability.
Some people at MoE and REA are highly involved and committed (Gichungi, Kiva, and former
Kazhenzi who just resigned) but the respective staffs are limited
Long process from initial SREP’s start to the first SREP Invest Plan (July 2011) and finally to the “Project Document for MG Development” (April 2013). Requested by donors led by WB, this baseline document is issued by MoE to clarify the government mini-grid strategy and financing needs.
Off-grid & MG have drawn attention and support from many donors in Kenya over the last 2
years. The following funds are indentified:
6

Final Report – Support Study on Green Mini-Grid Development (Annexes)
o WB KEEP: 8 M$ for off-grid
o WB SREP: 10 M$ for mini-grids
o NDF
10M€ for mini-grids (Nordic Development Fund)
o AFD
SREP: 30 M€ for mini-grids
o KfW
SREP: 15 M€ for investment (loan) + … M€ for TA (grant)
o DFID
SREP: 10 M through Climate Funds & WB
o DFID
potentially 33 M£ (38M€) for investment & TA (loan+grant)
There are basically 3 scenario or business models that could be considered for MG in Kenya: o Present REA (financing/implementation) and KPLC (operation and sales) o IPP (co-financing/construction/generation) and KPLC as Off-Taker (distribution/sales) o ESCO or private operator (co-financing/construction/generation/distribution/sales)
In scenario 2, private IPP can be attracted with FiT to produce and sell electricity to KPLC but
the fuel costs (even if reduced with renewable introduction) have to pass through the KPLC customer tariff or to be compensated by GoK. The regulatory framework is not yet clear enough for IPP and rural off-takers.
In scenario 3, FiT is not applicable and it is not clear if other ESCOs selling electricity to rural
customers can really exist alongside KPLC.
Furthermore, the private sector involvement is a risky challenge. Local capacity for O&M is questionable, even in Nairobi. Experience with O&M of solar home systems in Kenya is not successful (Cf. KEREA – M. Charles).
WB was supporting the privatisation process since 2005 and requested for a study but finally
withdrew and MoE has launched its own privatisation study which has not come out yet after many years.
In the former government there was a keen Permanent Secretary who is open to support off-
grid programme and private sector involvement but he is likely to be changed. The political context is still difficult during this transition phase. Not any decision can be taken.
ERC (M. Pavel) is working on the regulatory framework to open net-metering for small scale
renewable energies. No indication if it will be applicable for mini-grids.
6 AFD
AFD has a portfolio of 600 M€ for energy projects, including some activities in grid extension, densification and off-grid electrification, including micro-finance for end-users’ connections. AFD has also a credit line to support local banks and in-fine private sector participation.
AFD is leading the Energy Sector Working Group in Kenya
AFD support REA/KPLC through the SREP programme with indirect funding (30 M€ for mini-grids)
Dilemma: the regulatory framework is not ready to start new delivery and business models
and it can take long before the right political decisions come. Political wills are weak for rural electrification. Main interest is for geothermal and coal, much less for renewable and rural electrification.
AFD has decided to be pragmatic and to approve the ongoing model of off-grid power
stations implemented by the GoK with REA and KPLC, even if it is not the most sustainable scheme. AFD will support the “retrofitting mini-grids” programme, i.e. the hybridisation of diesel-based mini-grids which are existing or already under construction.
The investigations for alternative business models are interesting but the involvement of the
private sector or the community participation remains difficult and uncertain. A study on privatisation of mini-grids is awaited for a very long time. Results are not expected to be very relevant as the consultation base was limited.
There are several private companies (national and international) showing interest to invest in
7

Final Report – Support Study on Green Mini-Grid Development (Annexes)
renewable energy and rural electrification projects but are not clear on what to do? Delivery only? IPP? ESCO?
Some reforms of the policy framework are planned but no progression and no action plan at the government level. And which role the counties will play in the electrification? (planning, financing, implementation, sales?)
There is a lack of convincing experiences. There should be more experience sharing with
other African countries such as Senegal, Burkina, etc.
Institutional skills at MoE, REA, KPLC are insufficient to implement all those mini-grid projects (retrofit & greenfield). As proposed in the GoK project document for MG development (SREP), there is a need for an overall technical assistance (design, supervision, monitoring, capacity building) and it should be led by the team of donors with a common approach.
7 GIZ-KENYA
GIZ-Kenya is involved in Kenya’s energy sector through different projects: o “Development partnerships with the private sector in Africa” project in 8 countries
including Kenya (2006-2018) http://www.giz.de/themen/en/36630.htm Assistance to SME to develop business plan
“Renewable energy promotion with private sector in East Africa”: to facilitate partnership between European companies and African companies to promote renewable energies (see below).
support to alternative off-grid business models
IPP to invest and produce electricity for off-takers or ESCOs Several private rural SMEs are looking for more sustainable and
cheaper sources of electricity (hydro, solar, biomass) or for selling excess power (to KPLC or off-takers) or for outsourcing power supply (ESCO). But some are also looking for better social image. A major candidate is Telecom (Safaricom, Airtel) e.g. GSMA has conducted an
interesting feasibility study for Safaricom with IFC support3. Other
similar example in Uganda with Kirchner Solar Group, Airtel & GIZ
project4.
Need for guarantees on tariffs, customers, sales, fuel compensation o Solar training & awareness programme to address the serious lack of skills and
capacity for large solar projects in Kenya “German Solar Academy” starts courses since 2011 with 3 partners
(Energiebau Solarstromsysteme GmbH, SCHOTT Solar AG and SMA Solar Technology AG). There are about 4 trainings of 1 week per year for East African engineers and artisans in photovoltaic technology. 130 technicians have been trained until present, mainly members of staff of power companies (KPLC), research institutions and privately owned businesses.
Solar training at Strathmore University in Nairobi for East African participants, including training of trainers, which give certification as requested by the new regulation (solar technicians must be qualified & certified - KEREA)
3 Study to evaluate the opportunity to improve access to energy services for Safaricom customers while improving the
business case to serve off-grid areas. 47 off-grid sites are found to offer feasible commercial opportunities for provision of community power in partnership with an ESCO.
4 The operator model is advantageous for all concerned. Airtel benefits from lower-priced solar electricity and is no longer dependent on fluctuating oil prices on the global market. The investment risk for Kirchner Solar Group stays within calculable limits because Airtel guarantees the purchase of a large quantity of electricity and other consumers will use prepaid meter system to get kWh via mobile phone, as much as they can afford.
8

Final Report – Support Study on Green Mini-Grid Development (Annexes)
Grid connected solar PV demo projects & awareness
515kWp installed on UNEP-HQ’s roof in Nairobi in 2011 with a partnership between SCHOTT, SMA & Energiebau
new project of 1MWp on roof of Strathmore University in Nairobi
(ongoing tendering)
negotiation with KPLC for net-metering. FiT of 12 $c/kWh is not enough for IPP as solar kWh cost is about 16-18 $c without margin nor taxes (and average grid kWh tariff about 23$c). GIZ has
conducted a Study on “Net Metering in Kenya” (Dec 2011)5.
o Support to innovative technologies
D-lite portable lanterns (Total Energy): identify new distribution networks in remote areas with existing SMEs or micro entrepreneurs. Target is 200 distributors of lanterns
M-KOPA: SMS-based remote monitoring of solar lanterns or SHS with a server in GIZ office to communicate with the local technician and to follow the number of systems installed and in operation. SIM development with IT Department of University and Mobisol. SHS can be remotely switched off in case of non-payment.
Solar street lights with LabTrust Ltd company. Support to identify new business models (PPP) to develop street lights in rural counties.
GIZ-Kenya expressed interest to collaborate with other donors, in particular with DFID: o Identification of sustainable business models o Private sector involvement o Solar PV promotion o Support and capacity building for project implementation o Experience in the field and with innovative technologies in Kenya
8 DFID-KFW/GIZ-IED MEETING
The meeting led by DFID had the objective to investigate how DFID can structure its MG support in synergy with the other donors’ support programmes in Kenya. DFID has submitted a Concept Note to ICF board and, if approved, will prepare a Business Case at the end of September 2013.
DFID is open on technology, business models, financing schemes, donors’ cooperation,
national partners and countries. DFID is keen on new delivery & business models and private sector involvement for MG, even if challenging (implementation capacity). DFID already funds 10M in SREP through Climate Fund and could finance 33M£ (grant+loan) for new MG programme.
KfW will focus on one technology (solar hybrid MG systems) and one country (Kenya) and has
to work with REA but is open to areas (greenfields), size and other partners. Potential for solar MG is large in Kenya. KfW delegation will spend 10 days in Kenya to decide what to propose to GoK. KfW finance 15m€ loan for SREP investments + 7.5M€ grant for TA (GIZ). Support activities will focus on RE policy enhancement; support to REA/ERC (for off-grid); PS capacity strengthening and Solar Diesel MG pilot projects (5-10 sites).
GIZ has several experiences with solar hybrid MGs, e.g. in Senegal (20 villages for 3 years and
~60 more to come) where ASER provides subsidies for upfront costs, issues licenses (15 years) to fully private operators and supervises O&M.
5
http://www.africansolardesigns.com/component/simpledownload/?task=download&fileid=TmV0LU1ldGVyaW5nUmVwb3 J0IEtlbnlhLnBkZg%3D%3D
9

Final Report – Support Study on Green Mini-Grid Development (Annexes)
Main Donors such as WB, AFD, KfW and DFID have a rather common viewpoint on the off-
grid sector Main challenges are:
o Influence MoE on renewable energy and rural electrification
o Adequate regulatory framework and tariff structure for MG role of ERC
o Identification of realistic business mode(s) for MG that could limit subsidies and ensure sustainability, in alternative to REA-KPLC model.
Proposal between DFID & KfW
o to identify new champion to influence MoE from above (in the former government, there was a champion M. Hino at PM level who was willing to support new models for rural electrification)
o to have common voice and message to address to MoE and to join donor’s efforts, together with REA to implement parallel business modes.
o to define a common agenda between donors to push government decisions o to share feasibility studies, terms of references, financing structures
9 ASD
ASD (http://www.africansolardesigns.com/), Nairobi-based, is involved in consultancy and in developing various projects dealing with renewable energies in East Africa. ASD puts effort in promoting solar through any means: educate the public, push policy makers, and help the industry and private sector. ASD is working with the private sector, communities and NGOs but most projects remain donors-led.
The EUEI project on “Mini-grid Policy Toolkit” (with RECP, REN21 and ARE) aims to develop
renewable energy policy tools for mini-grids and to educate, train, aware and advice key persons at the government level. The project leans on 4 elements: business models, technology, regulatory framework and community base. 5 workshops have already been organised in all Sub-Saharan Africa.
In the framework of this EUEI project, ASD & MARGE have been contracted by REN21 to
prepare case study database to sensitize on and to promote green MG (ongoing consultancy). 8 case studies on mini-grids were initially targeted by REN21 study in 16 African countries with mixed technologies and with sustainable models over several years’ operation. It must be stated that very little useful examples with renewable mini-grids could actually be found in Africa.
o Hydro mini-grids: most, if not all, hydro MGs have been connected to the grids in
investigated countries (Ethiopia, Uganda, Rwanda, Kenya). Hydrology seems to be in the same areas than grid networks. Major experiences in Africa were with mission settlements and more recently with tea factories. Very few small towns have been electrified with off-grid hydro, unlike in Asia.
o Biomass mini-grids: there are also very few experience with small scale biomass
technology dedicated to rural electrification. Regulatory framework is usually not ready for biomass technology. One MG case study has been selected with Tanganyika
Wattle Company – TANWATT6, a timber industry in Tanzania using their wood waste
for providing process heat and electricity for their own use as well as sales of excess power to TANESCO.
o Hybrid mini- and micro-grids: Hybrid micro-grids below 100kWp generally use solar,
wind, batteries and backup genset. They are installed in many places but there are 6
http://webcache.googleusercontent.com/search?q=cache:fFtffCFj0NsJ:www.hedon.info/TANWATBiomassElectricityTanza nia+&cd=1&hl=fr&ct=clnk&gl=be
10

Final Report – Support Study on Green Mini-Grid Development (Annexes)
no real successful business models. Systems and technologies are very expensive (well above 1000$/person) and require large subsidies for upfront cost (donor-led projects as University of Southampton). Above 100kWp, hybrid mini-grids can be running without batteries but this is still at development stage.
Key lessons from ASD: o Most existing case studies are public/donor-led projects o Government institutions (MoE, REA, ERC, KPLC) move slowly and are highly
corrupted at all stages but they can hardly be by-passed. o REA is based on a donor/grant model for “access projects”. Tendering and
procurement are the most corrupt and blind steps in power sector (connivances between MoE, REA, KPLC and some private enterprises). SREP programme is somehow supporting this.
o Off-grid is a very particular market that donors often do not understand properly. o The key question is should we push first mini-grids in remote areas for rural
population with low income to promote “Electricity Access” or should we push first MG toward rural businesses directly making profit to support “technology & industry development”? These are 2 opposite approaches to promote and scale up MG. Only the second one could be sustainable in Africa.
o Donors should target the private sector and support local businesses to promote mini-grids and renewable energy, even if it is more difficult than the public sector (e.g. failure with AFD credit line & Stanbic bank for eco-tourist camp project despite strong local partnership). There are plenty of candidate rural businesses to substitute their diesel gensets as telecom, agro-industries, tourist camps, flower farms, extractive camps but there are no successful cases yet in Africa.
o The need is financial: High interest loan or long pay-back time (7-8 years) for green mini-grids is not attractive for local businesses (as tourist camps) that may prefer the high annual cost of running a generator. With initial grants and smart loans, the market could start. AECF (Hugh Scott – 0738170562) funding windows on behalf of donors could play a key role.
Different approaches could be implemented in parallel by the donors, under the supervision
of REA who, as board member, could ensure regulation, pricing, quality control, supervision, monitoring:
o “Public approach with REA” could be considered for large mini-grids and large consumers (e.g. above 50kWp)
o “Community approach with NGOs” for smaller systems (< 50kWp), e.g. with Practical Action, ASD, Southampton, social entrepreneurs
o “Private sector approach with KAM” for local businesses as described above.
Geographical focus should take into consideration the decentralisation process (support by the new government) and the 42 counties. Priority could be given to counties with little access to electricity (and with sufficient willingness-to-pay). Donors could sit together to identify and select their respective “franchises” where GMG could be implemented.
10 SMART TECHNOLOGIES
There are several companies/organizations working on innovative energy service solutions to facilitate rural management of electrification schemes as payments and money collection, energy management and remote monitoring. Among them,
o M-KOPA, a Nairobi-based company making clean energy affordable to customers across Kenya by combining machine-to-machine technology and mobile payments to offer customers the chance to purchase solar energy equipment on a pay-as-you-go basis. (Commercial partnership with Safaricom since 2012)
11

Final Report – Support Study on Green Mini-Grid Development (Annexes)
o M-PESA, a mobile phone-based electronic payments system and mobile money
transfer, launched in 2007, has been commercialised by Safaricom and adopted by 8.5 million Kenyans in less than 3 years. Surveys of users show it is a highly valued service. Services include airtime top-up, bill payments, salary payments, M-KESHO banking services (which allow customers to earn interest) and also international money transfer in partnership with Western Union.
o M-KESHO Account is an accessible & affordable bank account (at Equity Bank) that is managed with M-PESA (deposit, withdraw, balance).
o bitHarvester, a SMS-enabled monitoring device developed with Access:Energy (Kenya) that delivers real-time information on the status of an energy systems (wind turbines, hybrid) to an office in-town (internet portal) and which regularly updates supervisor on local conditions and system performance. The devise can send e.g. hourly SMS updates on the power generated by energy systems, the amount of electricity used by clients, local wind speeds and direction, and anything else needed. The applications of the device are almost limitless, providing essential information at a low cost for all projects involving remote data acquisition.
o Mobisol is a German company developing high-tech solar home systems to developing countries combining SHS with innovative mobile pay-as-you-go technology (prepaid energy meter). Using the mobile banking and micro-financing service M-Pesa the SHS costs can be paid off conveniently by mobile phone in a 36-month installment plan. The systems come complete with a three-year warranty and a full service package including free maintenance for three years. Through the GSM modem included in the solar controller, technical data from the panel and battery is tracked and monitored by local technicians in a web-based interface. The remote monitoring technology allows potential maintenance problems to be addressed swiftly and enables systems to be locked automatically in case of overdue repayment.
DFID and GIZ have been supporting such innovative development in Kenya allowing more
cost-effective rural electrification.
12

Final Report – Support Study on Green Mini-Grid Development (Annexes)
11 CONCLUSIONS 1) Lessons learnt from existing programmes & projects with MG:
Most MGs in Kenya are implemented under government-led projects or donor-led projects with a unique REA-KPLC business model. As in many countries, those MGs are highly subsidised (upfront cost or energy). Few private MG exists and are driven by economical considerations.
Experience with renewable energy as complementary sources to existing fossil fuel-based
MGs is still very new (since 2012) and limited (7 GMG are in operation under REA); information on performances is hardly available.
The capacity and willingness of private sector to participate to MG projects is not clear
regardless of the level (engineering, construction, operation, management). Policy and institutional framework is not completed for small scale mini-grids (<500kW)
Institutional staffs dealing with Off-Grid at MoE and REA is limited for a MG roll-out
programme.
The Donors involved in off-grid energy sub-sector in Kenya seem to have good transversal communication, a rather common viewpoint, giving potential for further synergies.
2) Barriers to develop GMG Among the main identified barriers that impede the GMG roll-out in Kenya are as follows:
Electricity cost & ability to pay: everlasting barrier given the high production cost and the low income in rural areas
Business model: lack of clarity about ownership, irregular maintenance, replacement after
worn-out, PPA, tariff, collection scheme
Policy & regulatory framework: blur in authorisations for generation (IPPs) and distribution (ESCOs) for off-grid and associated agreements, retail tariffs, FiT, net-metering
Lack of experience: All green mini-grids in Kenya have been recently installed since 2012
based on only one business model. And detailed operating data with technical and economical performances, if existing, are not openly available. Private sector & community involvement is generally weak and local capacities & skills have to be demonstrated.
Financing: private sector (industry, tourism) is scared to invest in risky MG projects and to
take on responsibility of developing IPP models over 15 years, unlike in Asia or South America.
3) Perspectives for GMG development programme There is a consensus among Donors to say that other business models (community-based
and private sector) should be investigated and could be supported in parallel to the existing REA/KPLC (public-led) model.
Government institutions should clarify the regulatory framework for off-grid electrification
(small scale renewable energy projects).
Additional studies, consultations, sensitizations, workshops should be organised by Donors and MoE to develop the private sector for off-grid business.
Donors should pay attention to appropriate and well-designed GMG configurations to match
the local resources, the power demand, the capacity to pay, the local O&M skills, the harsh environment and the potential final grid-connection.
13

Final Report – Support Study on Green Mini-Grid Development (Annexes)
12 ANNEXES
12.1 Institutional Environment The Ministry of Energy (MoE - http://www.energy.go.ke) is responsible for formulation and
articulation of energy policies to create an enabling environment for efficient operation and growth
of the sector. It sets the strategic direction for the growth and provides a long term vision for all
sector players. The vision of Ministry of Energy (MoE) is to provide “affordable quality energy for all
Kenyans” while the mission is “to facilitate provision of clean, sustainable, affordable, reliable and
secure energy for national development while protecting the environment.” Its tasks include national
energy planning, training of manpower and mobilization of financial resources.
The Rural Electrification Agency (REA) was created, under section 66 of the Energy Act of 2006 as a
body corporate with the principal mandate of extending electricity supply to rural areas, managing
the rural electrification fund, mobilizing resources for rural electrification and promoting the
development and use of renewable energy. This has seen an increase in electricity connections.
The Kenya Power & Lighting Company (Kenya Power - http://www.kplc.co.ke/) is a State Corporation
with a government shareholding of 50.1% and private shareholding of 49.9% as of June 2012. It is
currently the only off-taker in the power market purchasing bulk power from all power generators on
the basis of negotiated Power Purchase Agreements (PPA) for onward transmission, distribution and
retail to customers. It owns most of the existing transmission network while new transmission
systems are being developed by KETRACO, a wholly government owned corporation.
KenGen (http://www.kengen.co.ke/) is operating 14 hydropower plants, 3 thermal power plants, 2
geothermal power plants, 2 off-grid power stations (Lamu island 1.5MW & Garissa town 2.4 MW)
and 1 wind farm in Ngong 6x850kW Vestas since 2008 (plan to move from current 5.1MW to
25,5MW). KenGen has also invested in feasibility studies on solar power but did not share the results.
The Energy Act of 2006 has restructured the Electricity Regulatory Board (ERB) to Energy Regulatory
Commission (ERC - www.erc.go.ke) whose mandate was expanded to encompass the entire energy
sector. The Energy Regulation Commission issues permits and licenses under the Energy (Electricity
Licensing) Regulations of 2010 including the renewable energy sector. A permit is required for power
plants below 3,000 kW and a license required for power plants exceeding 3,000kW.
14

Final Report – Support Study on Green Mini-Grid Development (Annexes) 12.2 Tariff Structure & Fuel Prices The below figure shows the tariff since June 2008:
15

Final Report – Support Study on Green Mini-Grid Development (Annexes)
12.3 IED comments on “Project Document on MG development in Kenya (SREP)” Main text
- Villages and centres selection is questionable. Several selected centres for new MG projects are very small with as little as 60 people (12 households).
- Major design error is to consider only 2 “standardised capacities” for solar (100 & 150 kWp)
16

Final Report – Support Study on Green Mini-Grid Development (Annexes)
although administrative centres varies from 12,000 people to only 60 people with the same 100kWp capacity. Optimisation in hybrid system is a key factor for success and profitability.
- This affects the cost per customer ratio, ranging from 2200$/people to 58,000$/people (p. 68)
- Assumptions for load forecast (consumption and capacity growth rates) should be checked and better argued, based on statistics from existing plants (probably overestimated)
- FiT tariff structure for off-grid is unclear, in particular below 500kW. - FiT does not apply to small scale mini-grids and should not be used for economical & financial
analysis. - Technical & economical performances of existing hybrid MGs are not clearly presented. No
evidence about solar/wind hybridisation of existing diesel-based MGs. - No effort to reduce CAPEX are presented (distribution lines, connection board, metering, etc) - Prepayment systems and innovative technologies should be also proposed and described. - Storage issue should be better addressed with sizing and costing for new sites - OPEX costs of existing stations are not detailed to appreciate the benefits of solar
hybridisation (fuel and maintenance savings). - MV/LV substation costs for greenfield projects are missing - Regular maintenance cost for solar without storage can be considered as negligible but not
the replacement costs of electronics (and batteries if any) Appendix
- Data on generated units from solar is missing - Household population should also be given for existing MGs - Probably some errors in solar costing Table 2 page 66 (23.4$/Wp ???) - Why fuel savings are estimated and not calculated from existing MGs? (p.74 & 79)
17

Final Report – Support Study on Green Mini-Grid Development (Annexes) 12.4 Country’s Brief (from IED interim report) The New Constitution promulgated in 2010 has substantially changed the governance structure in
Kenya by the creation of 2 levels of Government and 47 Counties. New institutions have been
established as part of the changes in line with the objectives and targets of ‘Vision 2030’ (Middle
Income Country by 2030).
Vision 2030 recognizes energy as one of the Vision and requires an alignment of the energy sector’s
policy and legislation. This requires preparation or revision of following documents: Draft National
Energy Policy (appropriate policy, legal, regulatory and institutional framework to review), Draft
Energy Bill (new), RE Strategic Plan (to review).
The Rural Electrification Authority (REA) was established in 2007 to extend electricity to rural areas
as fixed by the government target and to accelerate the pace of rural electrification in the country. In
2012, the national electricity connection rate was about 30% and the rural connection rate was
estimated at 26% (having increased from 12% in 2009).
The new mandate of REA to power the Vision 2030 is to reach ‘universal connectivity by 2030’; it
includes the increase of access to electricity (equally in 47 new counties) and the promotion of
renewable energy development. REA will expand the national grid in the rural areas and install off-
grid stations and developing mini-grid.
There are ongoing views to change the existing Rural Electrification Authority (REA) into the National
Electrification and Renewable Energy Authority (NERA) and to become the lead agency for
development of all other renewable energy resources excluding geothermal and large hydro. NERA
shall be the one-stop-shop for information and guidance to investors on renewable energy projects. The REA remains the national organization in charge of planning network extension, managing the Rural Electrification Program Fund and innovation on renewable energy.
For June 2014, the new REA target for Rural Electrification is the full access of rural population by
electrifying the remaining 4,387 public facilities out of 25,000 (trading centres, GSS schools, health
centres). The installed capacity for electricity generation is 1521MW consisting 50% hydro, 35%
thermal, 13% geothermal, 1.7% co-generation, 0.3% wind.
Major economic activities in Kenya take place along the “Railway belt” from Mombasa in the Coast to Kisumu in the West. And the national grid network has developed around those areas. A new
transport corridor will probably open up in the North and East of Kenya (from Lamu) due to the
discovery of oil and will lead to fast development of infrastructures.
The major towns in Northern/Eastern Kenya depend on mini-grids, as grid power line extensions are
considered not economically viable due to high distance, low demand and low economical activities.
There were 18 operational mini-grids all diesel-based to serve the rest of the country (4 of them have
been recently connected to the grid). Distribution & sales is done by KPLC utility and the generating
equipment are own either by KenGen or REA (all 3 are state organisations). The total installed
capacity is 19MW with only diesel generators (from 0.1 to 1.5 MW). 7 of them have operated for
more than 30 years, 11 have been developed in the last six years. 15 more mini-grids are currently
18

Final Report – Support Study on Green Mini-Grid Development (Annexes) being developed by the Rural Electrification Authority. The mini-grids are firstly developed by REA under GoK funds (with substantial support by
development partners) and then handed over to Kenya Power (KPLC) for operation, distribution and
retails of electricity and collection (5% levy for REA).
The tariff system in Kenya is uniform (cross-subsidy) irrespective if grid or off-grid and is based on
energy consumption and fuel used for generation (the average generation cost in 2010 was 0.22
€/kWh). The first Feed-in-Tariffs Policy for wind, biomass and small hydro was published in 2008 and
was revised in 2010 and 2012.
In the areas where the off-grid systems are being put up, there is abundance of renewable energy
(mainly solar and wind). In order to off-set fuel consumption, renewable energy is being introduced
into the off-grid systems. There is a huge potential of replacing diesel generation with solar
generation in the micro-grids. All new off-grid stations coming up will have renewable energy
components. REA intends to develop off-grid systems that will be primarily renewable with diesel
backup. REA intends to put up into the grid at least 250MW from renewable energy resources in
2013-2018 and to retrofit all the existing off-grid diesel-based stations to have renewable energy
components. A first phase of 200 villages (about 100MW or in average ~500kW/village) could be
developed with mini-hydro or solar, and with community participation through SPV formed by
KenGen.
The Ministry of Energy (MoE) has encouraged potential Independent Power Producers (IPPs) to carry
out feasibility studies on renewable energy generation on the basis of which Power Purchase
Agreements (PPAs) with the Off-taker can be negotiated. At least 10 sites could be developed
through Public Private Partnership. The Ministry is also undertaking a National Small Hydro Atlas and
there is a Kenya Energy Atlas published by ESD in 2006.
Seven of the existing mini-grids have been hybridised using renewable energy: 5 Solar/Diesel, 1
Wind/Diesel and 1 Solar/Wind/Diesel. Solar ranges from 10 to 300kWp and wind ranges from 50 to
500 kW while diesel ranges from 128 to 2400 kW. The first 2 were implemented and managed in
2011 by KPLC. In addition, REA has developed 2 mini-hydro sites and also has biogas projects in 3
rural schools.
Under the SREP programme, the GoK plans to raise the share of renewables in 12 isolated mini-grids
with a total capacity of 11MW by installing 3MW of solar and wind to complement the existing diesel
generators in these grids. The GoK also plans to construct 27 new isolated green mini-grids with a
total installed capacity of 13MW. The total cost for the 16 MW of additional generating capacity and
the grid costs of the 27 new mini-grids is USD 68 million. The average cost is USD 3,000/kW for power
generation and USD 1,300/kW for the mini-grid development (IRENA – PAPS).
On larger scale, Kenya Power has wind and geothermal power plants connected to the Grid and KenGen and the Ministry of Energy plan to implement 60MWp of Solar in Garissa.
Beside government-led MG projects in Kenya, there are a significant numbers of private enterprises
19

Final Report – Support Study on Green Mini-Grid Development (Annexes)
or communities GMG projects using hydro (or solar). There are basically 2 categories of private investors: Micro renewable energy projects (~50.000€) implemented by local communities as for example Tima 2.2kW and Kathamba 1.1kW Hydro Power Plant projects (European Union co-financing for a total investment cost of 28 246€); Small hydro power projects implemented by industrial cottages (as tea factories) with sometimes a rural electrification component to sell (or give) excess of power.
In both cases, the key lesson is the lack of planning and financial capacity to consider the load demand growth. There is no plan to reinvest for new customers.
Other existing mini-grids include, for example:
- Thiba mini-hydro project initiated by the local community in 2002 and was implemented in 2005.
Currently it supplies power 12-14h/day to 180 customers (most are shareholders) within 1.6 km
radius with regular voltage drops. Flat tariff of ~3$/month is applied (no meter). Customers are facing
frequent blackouts due to recurrent technical problems with turbines (low quality, bad design, lack of
skills and funds) but the community is proud of their system and look for assistance to improve it.
- Tana and Athi Rivers Development Authority is implementing under ACP-EU EF 2012 the
construction of 7 mini-hydropower plants to provide electricity to 7 rural communities. A Community
Project Management committee will be trained to operate and maintain the mini-hydro projects in
conjunction with the Kenya Electricity Regulatory Board, in charge of power generation and
distribution.
- The Mpeketoni Electricity project (MEP7) was a community-based diesel-powered micro-grid
system since 1994 to 2006 but has been recently handover to KPLC for upgrade.
7
http://www.globalelectricity.org/Projects/RuralElectrification/Nairobi/Day- 2_fichiers/Case%20Study%20Mpeketoni%20Electricity%20Project.pdf
20