Embed Size (px)
Citation preview
Maize Scoping Study East and Southern Africa
Supply Chain Analysis Report
Compiled by Dr. Wilson Enzama Consultant
September 2016
i
TABLE OF CONTENTS EXECUTIVE SUMMARY ................................................................................................... ii 1. INTRODUCTION ......................................................................................................... 1
1.1 Background Information .......................................................................................... 1 1.2 Objectives and Scope of Study .............................................................................. 1 1.3 Approach and methodology ................................................................................... 1 1.4 Methodological Limitations and Mitigations ........................................................ 2 1.5 Assumptions ............................................................................................................... 3 1.6 Report layout ............................................................................................................ 3
2. GLOBAL AND REGIONAL CONTEXT ......................................................................... 4 3. KEY FINDINGS ........................................................................................................... 6
3.1 Consumption Patterns ............................................................................................. 6 3.2 Maize Grain Production ........................................................................................... 6 3.3 Marketing and Distribution of Maize and Maize Flour ........................................ 8 3.4 Milling Industry Structure ...................................................................................... 10 3.5 Fortifiable Maize ..................................................................................................... 11
4. COUNTRY SPECIFIC REPORTS ................................................................................ 14 4.1 South-Africa ............................................................................................................. 14 4.2 Malawi ...................................................................................................................... 19 4.3 Zambia ...................................................................................................................... 25 4.4 Zimbabwe ................................................................................................................ 31 4.5 Rwanda ..................................................................................................................... 36 4.6 Burundi ..................................................................................................................... 42 4.7 Tanzania ................................................................................................................... 47 4.8 Kenya ........................................................................................................................ 54 4.9 Uganda ...................................................................................................................... 60 4.10 Mozambique .......................................................................................................... 66 4.11 Namibia .................................................................................................................. 72 4.12 Botswana ................................................................................................................ 77 4.13 Angola ..................................................................................................................... 82
5. CONCLUSION ........................................................................................................... 87 6. ANNEX: LIST OF PERSONS VISITED PHYSICALLY OR ONLINE ................... 88 7. REFERENCES ........................................................................................................... 90
ii
EXECUTIVE SUMMARY
Introduction
This is a report of a maize scoping study commissioned by Smarter Futures to trace and map the flows of maize grains and maize products (flours of different extractions rates) through the supply chain from farms and imports to the final consumers in 13 countries of East and Southern Africa. These countries include South-Africa, Malawi, Zambia, Zimbabwe, Rwanda, Burundi, Tanzania, Kenya, Uganda, Mozambique, Namibia, Botswana and Angola. The study established the availability of maize as a staple food, in terms of the quantity produced, volume of local and cross boarder trade and the way maize is processed and consumed as flour or other forms. The study was undertaken in two phases. The first phase (Jan-Feb 2016) involved a desk study based on secondary data, obtained mainly from online information. The second phase (July-August 2016) involved visits to Tanzania, Uganda, Kenya, Malawi and Zimbabwe to validate some of the findings from the desk review and fill data gaps. Only five countries were visited as a result of budgetary and time constraints.
Summary of findings
Maize grain production Apart from South Africa which has substantial number of large farms, maize is
mainly produced by large number of smallholder farmers. Large commercial farms contributed average of less than 30% of total production.
Most rural households grow their own maize which they take to small or micro toll mills, which are usually conveniently located within the village.
Whereas maize is grown across the countries subnational regions, there are specific ecological and geographic areas in each country which are more suitable for maize production. These regions often have surplus supplies of maize grain which then have to be transported to urban areas of deficit.
Regional maize harvests for 2015/16 marketing year was 10-25% percent below average due to poor growing conditions during the 2014/15 and 2015/16 production years. Generally, in southern African countries, due to El Nino conditions, some places have been experiencing severe drought while others severe flooding, thus resulting in low maize yields.
All three of the region’s surplus-producing countries, South Africa, Zambia, and Tanzania, had below-average maize harvests. This amounted to a combined 3.4 million MT less than average production for these three countries, with important implications for total regional supply and trade prospects.
South Africa’s 2015/2016 maize production has registered drastic increase from the 6.5 million MT in 2014/2015 doubling to 13 million MT in 2015/16 (USDA 2016).
iii
Countries with significantly below-average production (25 percent or more) include structurally-deficit Zimbabwe, Namibia, Botswana, Burundi, Rwanda and Malawi (in the last two years, harvests dropped considerably in Malawi which used to be sel-sufficient).
Above-average carry-over stocks from the bumper harvest of 2013/14 partially offset the effects of below-average regional production. Stocks are especially high in Tanzania, Uganda and Zambia, while South Africa remains the regional leader in total carry-over stock tonnage. Stocks were not large enough, however, to fill 2015/2016 year’s deficits.
In addition to below the average harvests, most producing households experience seasonal deficits in months towards new harvest when stocks from previous harvests are depleted, thus increasing their food insecurity. More so, during harvest, smallholder farmers tend to sell much more of their harvest at very low farm-gate prices to meet other household expenses.
Marketing and distribution Distribution of maize from surplus to deficit areas within and between the countries
is hampered by poor transport networks, government trade policies and market information asymmetries. This results to continued surplus in growing regions and deficits in highly populated regions with high demand.
The regions local production cannot meet the local demand for human consumption and feed. The deficits have been sourced mainly from Mexico, US and Argentina, through South Africa for both white and yellow maize.
Milling structure Four categories of mills have been identified: large, medium, small commercial and
small toll mills. Small commercial mills process, package and label in their own brand name while small toll mill provide milling services for households for a fee. Medium and large mills are often roller mills while small commercial and toll mills are hammer mills.
In Zimbabwe and South Africa, the share of milling is about 50% for large/medium and small mills; while small commercial and informal toll mills dominate the other countries as they service over 70% of the consumers. The share of large mills increases during times of scarcity when countries depend on imports or reserves from FRAs.
Hammer milled maize meals tend to be an undefined class, but which is probably most closely associated with ‘special-sifted maize meal’. It represents the lowest cost option and is suitable to many rural applications.
Maize flour from large/medium mills often ends up in supermarket shelves in urban centres and for export while those from small mills are sold in rural markets
iv
where they are located. Proximity to the markets plays important role in distribution of grains and flour.
Recommendation for future maize supply chain research
The various data gaps that have been identified in the report as ‘unknown’ or ‘no data’ need to be filled by country delegates who will attend the maize fortification strategy meeting.
Due to the volume of information needed to plan and implement maize fortification, next studies should be country specific to capture all aspects of fortification from primary data from government sectors and partner organizations.
In order to get maximum support from the government during research, there will be need for direct collaboration with relevant government sector or agency which should spearhead the hosting and supporting of visiting researchers.
There is need to map strategies countries are using and the associated technological option being employed or piloted to fortify maize; practical challenges, future prospects and challenges for up-scaling or adoptions in other settings.
1
1. INTRODUCTION
1.1 Background Information Smarter Futures contracted an individual consultant to undertake a short-term maize supply chain scoping study in East and Southern Africa. The aim was to provide concrete information on the potentials and scope for maize flour fortification initiative. Maize grain and its processed products such as maize meal or flour is a major staple food for the populations of East and Southern African nations, accounting for 54-65 percent of energy intake. The maize meal has different industrial processing systems and a range of processing clusters across Africa. The processing clusters vary from farms and rural areas without developed processing mills to towns with commercial processing capabilities. A number of studies have already been carried out on maize value chains, milling industry assessment, and flour fortification. However, there is very little quantitative data on the supply of maize grain to the milling sector, milling capabilities and the subsequent supply of maize flour and other products to the consumer at the rural, urban and peri-urban areas. Understanding the milling industry structure and their capacities and market shares sets the environment and informs strategies for flour fortification. The study entailed developing a maize supply map for each country using Smarter Futures’ model; identify the number and size of aggregators and storage providers; identify large, medium and small sized millers and among others provide estimates of average production capacity of the mills and provide estimates of market share of millers.
1.2 Objectives and Scope of Study The thrust of the scoping study is to establish the potential reach of fortifiable maize flour products to the population of countries under study and at the east and southern African regional level. The flow of maize grain and maize products (flours of different extractions rates) was traced through the supply chain and mapped from the farms and imports to the consumers in the selected countries of East and Southern Africa. These countries include South-Africa, Malawi, Zambia, Zimbabwe, Rwanda, Burundi, Tanzania, Kenya, Uganda, Mozambique, Namibia, Botswana and Angola. Specifically, the study establishes the availability of maize as a staple food, the quantity and the way maize is processed, consumed as flour or other foods.
1.3 Approach and methodology The study was divided into two phases each with different approaches and methods. In the first phase, a comprehensive online desk review of secondary data was undertaken focusing on three important areas:
2
• Identification, collection and review of existing reports and supporting documents (electronic and paper) on maize production and supply that have been carried out at the country and regional level by partners.
• Identification, collection and review of existing reports and supporting documents (electronic and paper) on maize trade/distribution and milling industry that have been carried out at the regional levels by regional and/or international organizations.
• Information on maize consumption patterns to identify the types of flour (colour, extraction rate) preferred by consumers in the relevant countries.
The second phase involved country visits to Tanzania, Kenya, Malawi, Zimbabwe and Uganda to interact with Smarter Futures partners, millers, traders and government agencies to fill data gaps identified during the desk study and most importantly validated the data from desk review.
1.4 Methodological Limitations and Mitigations A number of methodological challenges were experienced during the two phases. Firstly, in a number of cases, websites of organizations are either not updated or are restricted or if not, the reports accessed on website tend to be undated; making it difficult to confidently access up-to-date information. Secondly, despite increasing interest in analysing maize supply or value chains in Eastern and Southern Africa, most of the studies use case study method with specific sub-national regions or are synthesis report of a number of countries. Therefore, past studies do not provide detailed national quantitative information on maize supply chain. Where country specific studies have been conducted, a lot of the information is largely qualitative and descriptive, lacking statistical data. Thirdly, apart from maize production, consumption, import and export data obtainable from United States Department of Agriculture (USDA) database, figures for maize flour milling and distribution are not readily available. It should be noted that, maize flour supply statistics indicated in this report are the author’s estimates calculated from maize grain figures based extraction rate of 80%. Where up-to-date figures are not obtainable, available old data, say for 2013 or 2014 has been used. Such dates are clearly indicated. Snow-balling sampling method was used to select stakeholders for key informant interviews for the second phase1. The snow-balling proved to be robust as there was not information on the right people who had the relevant statistics.
1 Researchers use this sampling method if the sample for the study is very rare or is limited to a very small subgroup of the population. This type of sampling technique works like chain referral. After observing the
3
1.5 Assumptions Based on the challenges mentioned above, a number of assumptions were made:
• In general, it is assumed here that most rural population are subsistence producers of maize and this is most milled from hammer mills, considered unfortifiable using conventional large and medium scale fortification technology.
• Population estimates for 2015 were used for all countries. Therefore, per capita consumption of unfortifiable flour is calculated based on the rural population while that of fortifiable flour is based on urban population.
1.6 Report layout The report has been structured in five sections. Section two presents an overview of the current regional and global context of maize supply chain. This situates the different country reports in global arena. Section three summarises the findings, giving regional perspectives for the two regions. In section four, detailed country by country maize supply chain analyses have been presented under the sub-sections: consumption patterns, maize production and supply, milling industry and distribution of maize flour. The report ends with some concluding remarks.
initial subject, the researcher asks for assistance from the subject to help identify people with a similar trait of interest.
4
2. GLOBAL AND REGIONAL CONTEXT Ranum et al (2014) observe that, maize is grown throughout the world, although there are large differences in yields. The Food and Agriculture Organization (FAO) of the United Nations indices of agricultural production include commodities that are considered edible and contain nutrients, and show the relative level of the aggregate volume of agricultural production for each year in comparison with the base period 1999–2001. It is estimated that in 2012, the total world production of maize was 875,226,630 tons, with the United States, China, and Brazil harvesting 31%, 24%, and 8% of the total production of maize, respectively. Africa accounts for only 6.5% of the total global production. Africa imports 28% of the required maize from countries outside the continent. Most maize production in Africa is rain fed and smallholder led. Irregular rainfall can trigger famines during occasional droughts. Worldwide consumption of maize is more than 116 million tons, with Africa consuming 30% and SSA 21%. Maize is the most important cereal crop in sub-Saharan Africa (SSA) and an important staple food for more than 1.2 billion people in SSA and Latin America. All parts of the maize grain can be used for food and non-food products. In industrialized countries, maize is largely used as livestock feed and as a raw material for industrial products. Maize accounts for 30−50% of low-income household expenditures in Eastern and Southern Africa. A heavy reliance on maize in the diet, however, can lead to malnutrition and vitamin deficiency diseases such as night blindness and kwashiorkor. Lesotho has the largest consumption per capita with 174 kg per year. Eastern and Southern Africa uses 85% of its production as food, while Africa as a whole uses 95%, compared to other world regions that use most of its maize as animal feed. Maize is processed and prepared in various forms. Maize flour is prepared into porridge in Eastern and Southern Africa. Fresh maize is ground, fried or baked in many countries. In all parts of Africa, green (fresh) maize is boiled or roasted on its cob and served as a snack. Popcorn is also a popular snack. South Africa is the largest producer of both white and yellow maize in the southern region. The region has been food secure as far as maize as staple was concerned. However, Southern Africa was estimated to have a regional maize deficit of 1.4 million MT for the 2015/16 marketing year. This deficit increases to 1.9 million MT when Tanzania is omitted from the regional estimates, which is the likely scenario based on trade flow patterns, current demand structure, and the price differentials between Tanzania, the Greater Horn of Africa, and southern Africa. Evidence of regional maize deficits is reflected in prices. Maize prices in 2015/2016 were above 2014 price and average levels across the region, even in countries that had above-
5
average harvest that year as well as those that are typically surplus producing. For instance, in Malawi and South Africa, maize prices increased by more than 10 percent during the harvest and postharvest period, providing an early indication of thin market supplies.
6
3. KEY FINDINGS
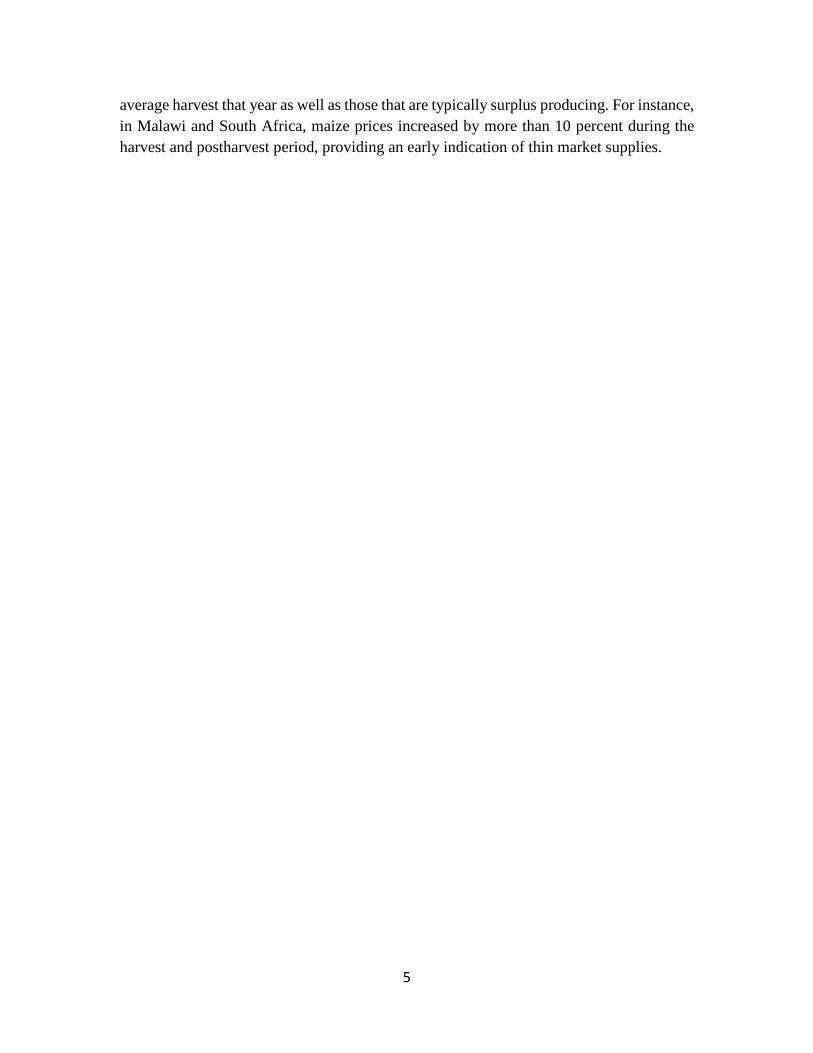
3.1 Consumption Patterns In east and southern African countries, maize consumptions constitute 52-65 percent energy in take for majority of the population in the region. Malawians say ‘chimanya ndi moyo’ meaning ‘maize is life’. Maize is consumed in different forms; the most common thick porridge made from maize flour. It is the commonest way of maize consumption in all the selected countries with varying degree of dependency on maize for energy intake. The flour is prepared in similar ways as thick porridge but with different local names such as ugali in Kenya and Tanzania, xima, nsima or nisima in Malawi and Zambia, sadza in Zimbabwe, putu in South Africa. Nsima with side dish of meat and vegetables in Malawian restaurant
Roasted green maize by a road side in Uganda
Another form of maize consumed across eastern and southern Africa is wholegrain; dried maize grains are soaked in water for say half day and cooked until soft. At times the maize is mixed with beans, tomatoes, onions. This is common in the rural households across the region. It is considered heavy food that takes long to digest. Wholegrain is consumed in nearly all the countries with more preferences in Uganda, Kenya, Zimbabwe, Malawi, Zambia and Tanzania. Other forms of maize for human consumption are pop-corns, grits (small broken grains of corn), cooking oil and cake.
3.2 Maize Grain Production Between 65% and 88% of households grow maize either for subsistence or commercial purpose. White maize is widely grown majorly for human consumption. Yellow maize is not popular except in South Africa and Zambia as animal feed. However, during times of scarcity, poor households sometimes resort to yellow maize for human consumption. Yellow maize is not popular for human consumption because of three factors; (i) the color is not attractive to most consumers, (ii) it is considered fit as animal feed and (iii) if at all
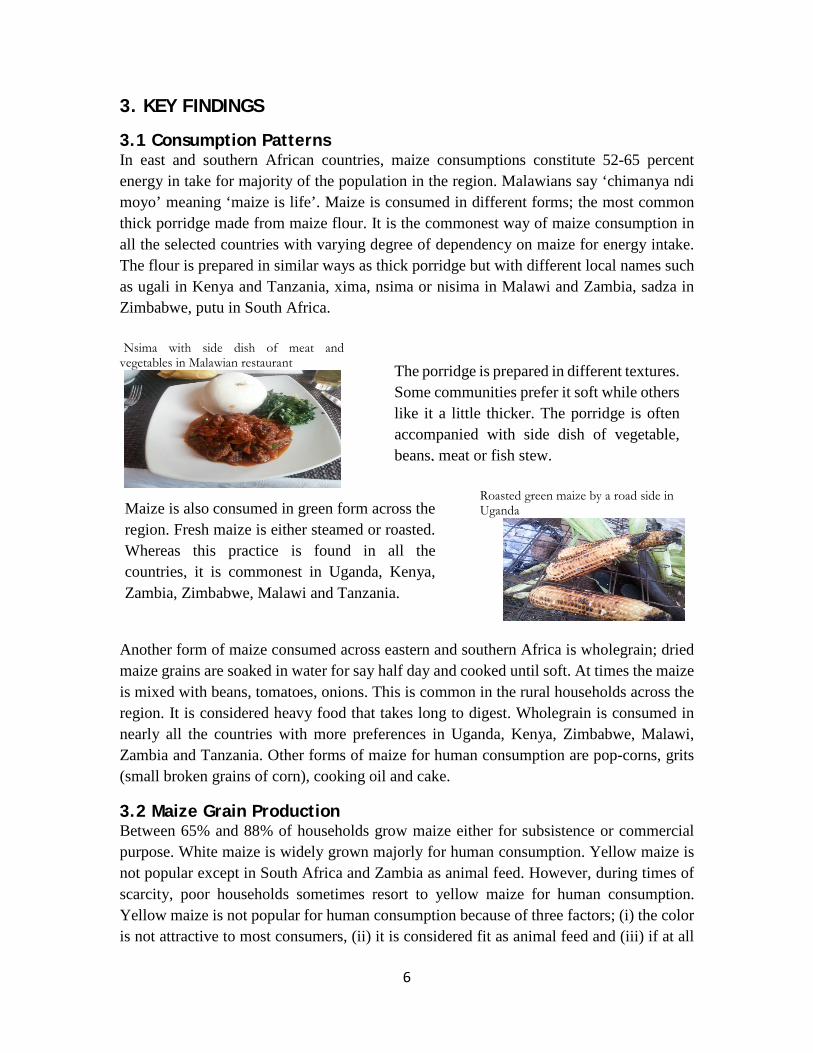
Maize is also consumed in green form across the region. Fresh maize is either steamed or roasted. Whereas this practice is found in all the countries, it is commonest in Uganda, Kenya, Zambia, Zimbabwe, Malawi and Tanzania.
The porridge is prepared in different textures. Some communities prefer it soft while others like it a little thicker. The porridge is often accompanied with side dish of vegetable, beans, meat or fish stew.
7
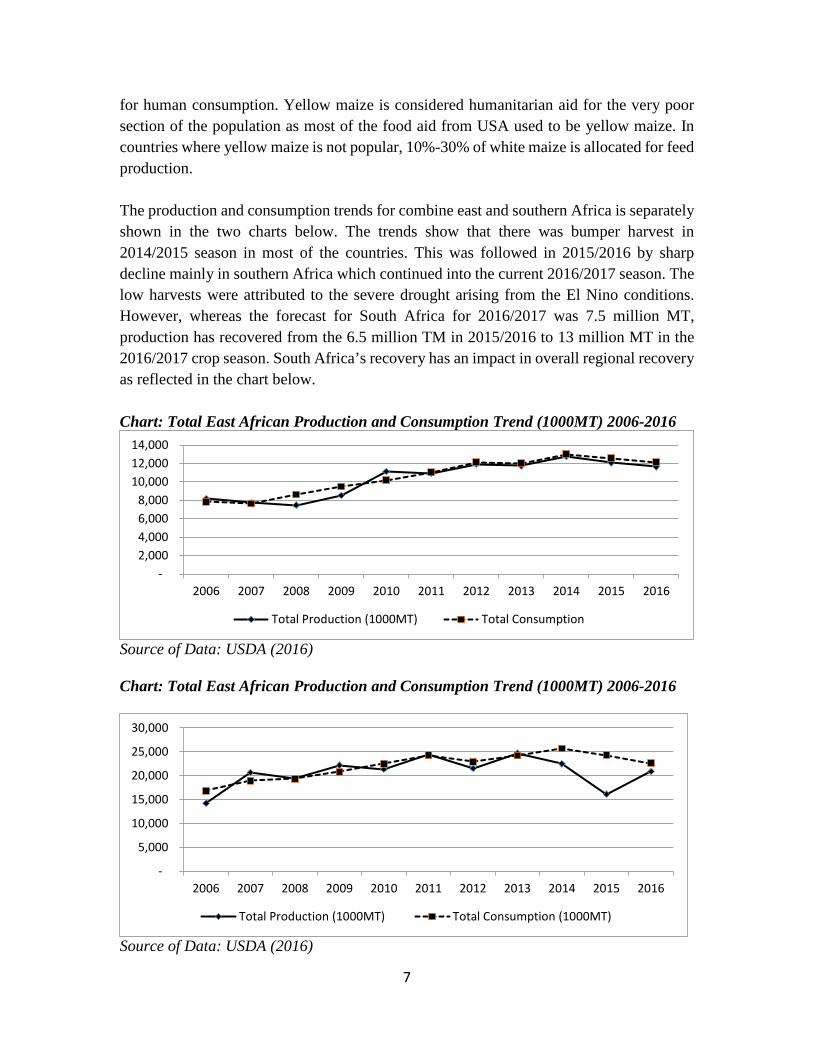
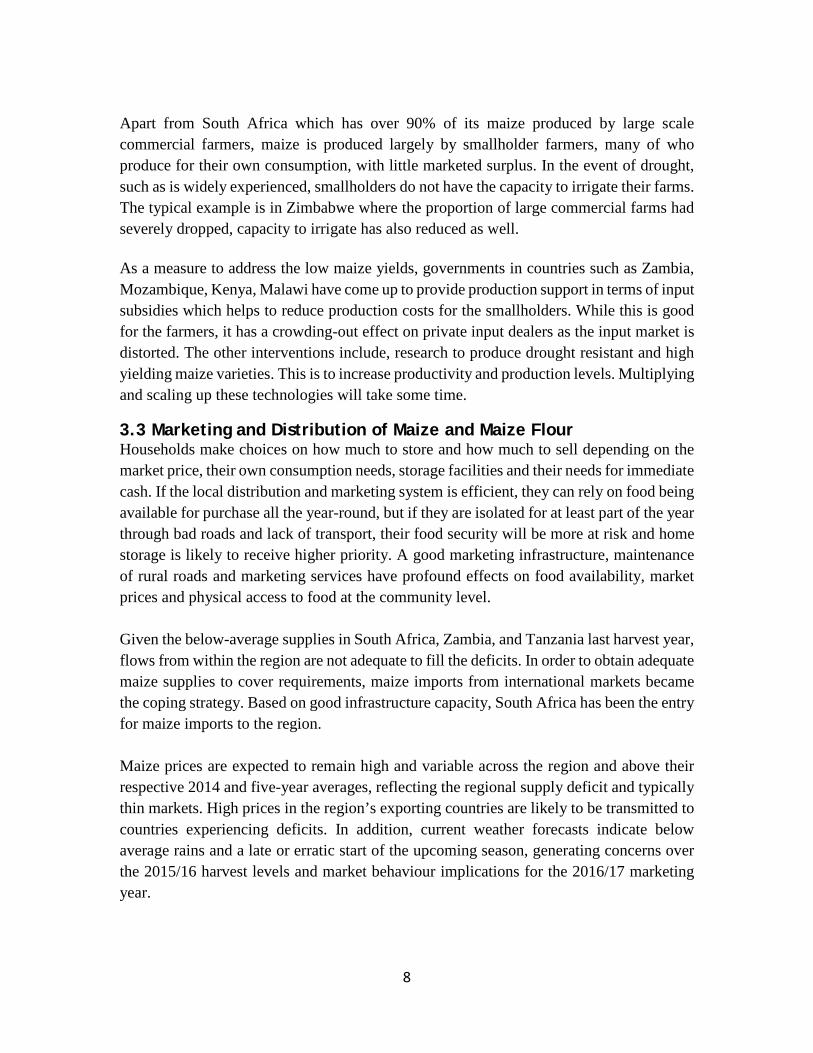
for human consumption. Yellow maize is considered humanitarian aid for the very poor section of the population as most of the food aid from USA used to be yellow maize. In countries where yellow maize is not popular, 10%-30% of white maize is allocated for feed production. The production and consumption trends for combine east and southern Africa is separately shown in the two charts below. The trends show that there was bumper harvest in 2014/2015 season in most of the countries. This was followed in 2015/2016 by sharp decline mainly in southern Africa which continued into the current 2016/2017 season. The low harvests were attributed to the severe drought arising from the El Nino conditions. However, whereas the forecast for South Africa for 2016/2017 was 7.5 million MT, production has recovered from the 6.5 million TM in 2015/2016 to 13 million MT in the 2016/2017 crop season. South Africa’s recovery has an impact in overall regional recovery as reflected in the chart below. Chart: Total East African Production and Consumption Trend (1000MT) 2006-2016
Source of Data: USDA (2016) Chart: Total East African Production and Consumption Trend (1000MT) 2006-2016
Source of Data: USDA (2016)
- 2,000 4,000 6,000 8,000
10,000 12,000 14,000
2006 2007 2008 2009 2010 2011 2012 2013 2014 2015 2016
Total Production (1000MT) Total Consumption
-
5,000
10,000
15,000
20,000
25,000
30,000
2006 2007 2008 2009 2010 2011 2012 2013 2014 2015 2016
Total Production (1000MT) Total Consumption (1000MT)
8
Apart from South Africa which has over 90% of its maize produced by large scale commercial farmers, maize is produced largely by smallholder farmers, many of who produce for their own consumption, with little marketed surplus. In the event of drought, such as is widely experienced, smallholders do not have the capacity to irrigate their farms. The typical example is in Zimbabwe where the proportion of large commercial farms had severely dropped, capacity to irrigate has also reduced as well. As a measure to address the low maize yields, governments in countries such as Zambia, Mozambique, Kenya, Malawi have come up to provide production support in terms of input subsidies which helps to reduce production costs for the smallholders. While this is good for the farmers, it has a crowding-out effect on private input dealers as the input market is distorted. The other interventions include, research to produce drought resistant and high yielding maize varieties. This is to increase productivity and production levels. Multiplying and scaling up these technologies will take some time.
3.3 Marketing and Distribution of Maize and Maize Flour Households make choices on how much to store and how much to sell depending on the market price, their own consumption needs, storage facilities and their needs for immediate cash. If the local distribution and marketing system is efficient, they can rely on food being available for purchase all the year-round, but if they are isolated for at least part of the year through bad roads and lack of transport, their food security will be more at risk and home storage is likely to receive higher priority. A good marketing infrastructure, maintenance of rural roads and marketing services have profound effects on food availability, market prices and physical access to food at the community level. Given the below-average supplies in South Africa, Zambia, and Tanzania last harvest year, flows from within the region are not adequate to fill the deficits. In order to obtain adequate maize supplies to cover requirements, maize imports from international markets became the coping strategy. Based on good infrastructure capacity, South Africa has been the entry for maize imports to the region. Maize prices are expected to remain high and variable across the region and above their respective 2014 and five-year averages, reflecting the regional supply deficit and typically thin markets. High prices in the region’s exporting countries are likely to be transmitted to countries experiencing deficits. In addition, current weather forecasts indicate below average rains and a late or erratic start of the upcoming season, generating concerns over the 2015/16 harvest levels and market behaviour implications for the 2016/17 marketing year.
9
Internal trade Apart from Namibia and Botswana, maize is grown in all the sub-national regions of all the countries. Only the eastern part in Botswana is arable. However, in each country there are regions which grow more maize than the others. The higher producing sub-national regions are often surplus regions, while less maize growing regions, especially highly populated urban areas become regions of demand. Smallholder households often sell surplus production after earmarking grains for household consumption. There are four marketing channels for internal maize trade:
(i) Farmers’ weekly spot markets in rural areas where maize is traded in small quantities within the village from surplus households to deficit households.
(ii) Middlemen buy maize grain during harvest season at very low farm-gate prices and sell to millers, wholesalers or aggregators at higher prices during season of scarcity.
(iii) Millers use agents who they support finances and logistics to set up buying centers with storage facilities in the areas of production to buy and store maize before transporting to the processing facilities.
(iv) In countries like Zimbabwe, Zambia, Malawi, Namibia, Botswana and Kenya, government agents buy a good amount of maize during harvest from smallholders at market prices and sell back to the population and millers through the marketing agencies such as ADAMARC in Malawi at lower prices for the poor to access food during times of scarcity.
(v) Other farmers have organized themselves into association for joint marketing of inputs, financial services and maize grains.
In net deficit countries such as Kenya, Zimbabwe, Botswana, Namibia, Burundi, Rwanda and Malawi, deficits are met from imports or reserves from previous harvests through the National Food Reserve Agencies (NFRAs). Maize markets are becoming more concentrated in the hands of few government agencies and private sector that control the market as opposed to liberalized markets that have been adopted by most of the countries in the 1990s. This shows a trend of government re-centralizing the maize markets. Private sector players are finding it increasingly more difficult to profitably engage in maize supply chains. In a number of the countries, it was reported that, private actors who are politically connected have opportunities to import or get quotas from government agencies and reserves. This means large/medium scale maize milling will also be concentrated in few politically powerful mills. The challenges of internal distribution of maize grain in the selected countries from areas of production to consumption such as cities, towns and urban centers are; (i) poor roads and transport facilities which make movement of goods and population difficulty and costly; and (ii) lack of market (price) information for farmers and local traders, leading to market failures for smallholders.
10
External Trade Cross border trade is one source of distributing maize grains from surplus to deficit countries within the region. For example, Uganda and Tanzania are the major source of maize imports for Kenya, while Malawi imports from Zambia and Mozambique, Zimbabwe from Zambia, South Africa and Mozambique. During time of scarcity imports from USA, Mexico, and Argentina meet the local production gaps. In order to fulfill its obligations, some of the imports are (re)exports to Asian countries. In addition to the formal trades, there are informal cross border trades in grain and flour through the porous border points which remained undocumented and, therefore, unreported. The challenges of external trade are the following:
(a) The subsidies also lower the prices of maize grains in these exporting countries, making imports from them cheaper than local production in importing countries. In Zimbabwe for example imported maize grain from Zambia and Mozambique is cheaper than locally produced maize, thus driving prices downwards. This discourages local production further.
(b) Most imports from South Africa have been reduced due to ban on GMO maize consumption in a number of the countries. This also limits the catchment area for imports by Zimbabwe, Kenya and Rwanda which have banned importation of GMOs.
3.4 Milling Industry Structure Interviews with stakeholders in the countries visited indicate that, the milling industry structures vary in each of the selected countries depending on the national and local production environment. Government regulations, political power relations and structure of transport and distribution systems play important roles in shaping the structure of the milling industry. In most countries mill categorization is largely unknown. They talk of large, medium and small mills without an objectively verifiable definition. From field observations there can be categories of mills defined or undefined by different countries. These are large, medium, small and micro mills. For the purpose of fortification, small mills can be classified into commercial and toll mills. Some small mills operate as mixed mills servicing local customers in daytime and operating as commercial mills at night when the electricity supply is most stable. In South Africa mills above 482MT/day are large scale, 98-482MT/day is medium and anything below 98MT/day is considered small scale; all of the small, medium and large mills mentioned here are roller mills. The increasing number of hammer mills have not ben established. In Zambia, large scale mill is that above 40MT/day, 10-39 is considered medium scale while anything less than 10MT/day is small. Others such as Malawi,
11
Zimbabwe, Uganda, etc. do not have any benchmarks for categorization. In over half of countries, there are thousands of small portable diesel engine powered hammer mills of 300-500kgs per day providing milling services for mainly own produced maize for home consumption in remote villages where electricity supply is problematic or not accessible. Dijk and Rabellotti (1997) observed that, in the past most of the country had large scale urban based commercial milling sector which originally enjoyed monopoly status. Zimbabwe and South Africa have highly centralized production system which until recently, made small scale milling impossible to operate. While in Tanzania, Uganda, Mozambique and Kenya, the small scale milling sector was allowed to develop alongside large mills and are now outcompeting large mills. Large mill enjoyed preferential treatment from government policies in terms of tax holidays, special allocation of rations during times of scarcity. Larger scale mills source grain from farmers and grain para-statals at fixed costs. Where there are parastatals, large private truck traders in Zambia, South Africa, Malawi and Zimbabwe are involved. However, due to the liberalization of the agricultural and agro-processing sector in the last 2 to 3 decades ago, the share of small scale milling sector has steady grown at various levels in all the countries under study. In Uganda, Malawi, Mozambique, Tanzania and Kenya small scale mills are playing increasing role than in Zimbabwe, Zambia and South Africa. The mills pack maize meal for the local retail markets or for sale in the cities and in large bags for export. In order to compete favourably with large scale mills, small-scale millers in all the countries have formed association aims at collective efficiency based on inter-dependences and cooperation between specialized clustering enterprises. Clusters take advantage of joint access to customers, traders’ and transporters. Support by a network of competing and collaborating small scale grain traders and transporters. It was also discovered that, there are no scale economies in milling industries. The large scale mills incur high cost in high consumption of electricity, sourcing of grains from distant places and wider distribution of flour in large towns. In Zimbabwe for example, due to high cost of milling due to underutilization of mills. Some large mills now operate at only 36% of full capacity. This is not cost effective. As a result, some large scale mills are subcontracting small scale mills to process maize flour at low cost, which they can then package and label in their brand name.
3.5 Fortifiable Maize Fortifiable maize can be determined based on the structure of production, marketing and milling structure.
(i) Own produced maize grains (which forms over 65-75% of total consumption) end up in the numerous small and micro toll mills across the countries. In some countries such as Malawi where there is only one large and five medium millers, even a good
12
proportion of maize obtained through the market are taken to toll mills including in the capital city Lilongwe where there are several of these mills.
(ii) Large scale commercial production is often a sure source of supplies to large scale mills which are fortifiable. The increasing preference for small hammer mills makes investments in large scale milling extremely unattractive.
(iii) Formally imported maize is clearly fortifiable as imports are handled by large scale traders, millers and government. Their redistribution within the country can be controlled to end up in medium and large scale mills where fortification is feasible.
(iv) Large scale trading or storage of maize is largely fortifiable. Large scale aggregated maize is source for exports or medium and large scale mills in most of the countries.
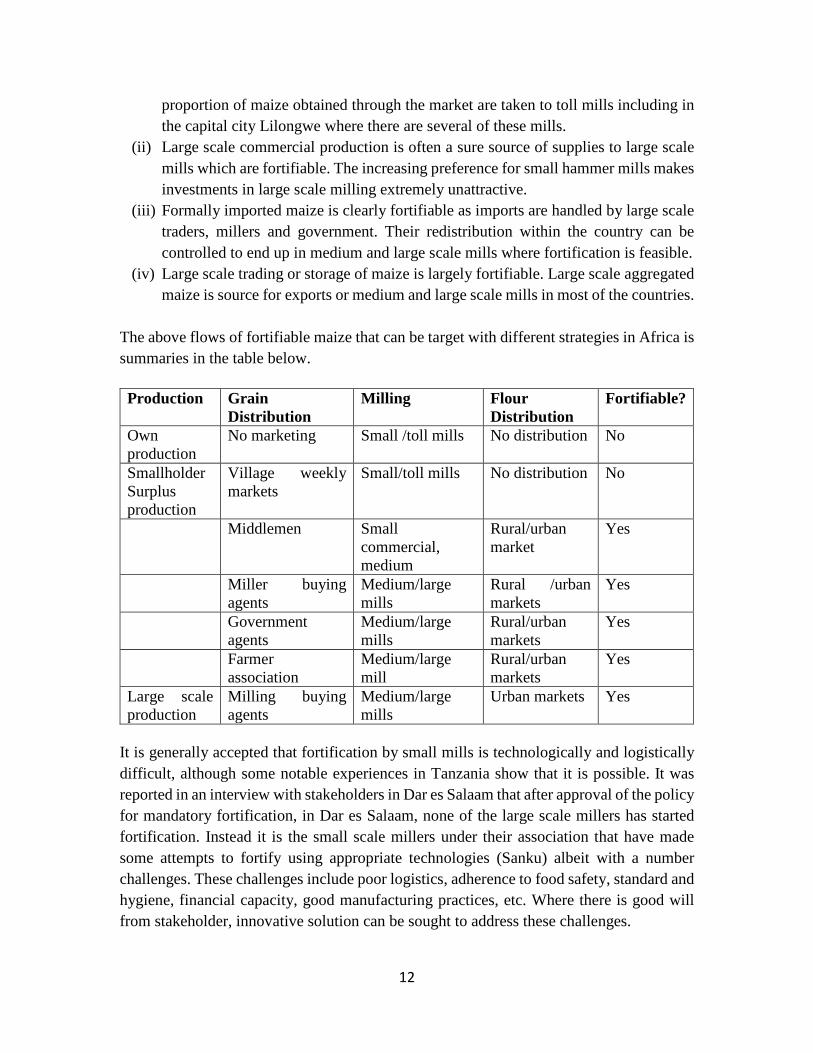
The above flows of fortifiable maize that can be target with different strategies in Africa is summaries in the table below. Production Grain
Distribution Milling Flour
Distribution Fortifiable?
Own production
No marketing Small /toll mills No distribution No
Smallholder Surplus production
Village weekly markets
Small/toll mills No distribution No
Middlemen Small
commercial, medium
Rural/urban market
Yes
Miller buying agents
Medium/large mills
Rural /urban markets
Yes
Government agents
Medium/large mills
Rural/urban markets
Yes
Farmer association
Medium/large mill
Rural/urban markets
Yes
Large scale production
Milling buying agents
Medium/large mills
Urban markets Yes
It is generally accepted that fortification by small mills is technologically and logistically difficult, although some notable experiences in Tanzania show that it is possible. It was reported in an interview with stakeholders in Dar es Salaam that after approval of the policy for mandatory fortification, in Dar es Salaam, none of the large scale millers has started fortification. Instead it is the small scale millers under their association that have made some attempts to fortify using appropriate technologies (Sanku) albeit with a number challenges. These challenges include poor logistics, adherence to food safety, standard and hygiene, financial capacity, good manufacturing practices, etc. Where there is good will from stakeholder, innovative solution can be sought to address these challenges.
13
In Africa it may seem safe to admit that these small scale commercial mills are indispensable for maize fortification. Firstly, they are close to the producers and provide direct market for small producers’ grains and many of them have developed long time market relations with the producers. Secondly, local consumers prefer white and soft maize four that is produced by the hummer mills as opposed to coarse flour from roller mills. Thirdly, the millers are the largest source of flour for the majority of consumers as they sell maize flour direct to the consumers where near them.
14
4. COUNTRY SPECIFIC REPORTS
4.1 South-Africa
Introduction South Africa has one of the continent's biggest and most developed economies and it is considered to be in the BRICS (Brazil, India China and South Africa). Its population stands at 53.7 million (Mckee 2016) occupying an area of 1.22 million sq. kms. It is the largest producer of maize in Africa. In South Africa, demand for maize can be divided into three main categories: human consumption (52%), animal feeds (47%) and maize gristing2 (1%). Consumption Patterns The most dish of majority of South Africans is made from maize flour known as Mieilie Pap or Putu. It is also known as krummelpap, which means “crumbly porridge”, which is made from grounded dried whole or refined corn flour. South African children as well as adults love it. It is usually serviced with a tomato and onion relish or served with a stew, to soak up the gravy. For breakfast, the porridge is made and left overnight and eaten with milk and sugar as a fluid porridge, particularly in Western Cape. Traditionally, putu is made out of white maize flour. However, with introduction of yellow maize, meant for feeds, in some parts of the country, yellow maize is sometimes consumed by human beings particularly during times of scarcity of white maize. Louw (2010) observes that, considering the five most widely consumed food types [maize meal, white sugar, tea, whole milk and bread] by very poor consumers, maize porridge contributes about 54 percent of energy intake. Maize is also consumed in other forms such as pop-corns, green maize mainly in producing provinces and also processed into edible oils. However, these are in small quantities compared to maize meal. Maize Supply: Grain Production, Exports/Imports South Africa, which is the regional basket, by contrast, harvested 6.5 million MT of both white and yellow maize in 2015, over 50 percent less than the 14.95million MT harvest in 2014 and the lowest since 2007 due to El Nino engineered drought. The five major maize producing areas were declared drought disaster areas. These included North West, Kwazulu-Natal, Mpumalanga, Limpopo and Free-State. The reduction has resulted in tighter maize supplies. In May-December 2015 as estimated 450,000MT of maize were exported compared to 1.7 MT over the same period in 2014. This reflected lower yellow maize exports to Asia and reduced white maize exports to neighbouring countries, attributed to higher prices. 90% of South Africa’s corn is genetically modified. 2 Grist is grain that has been separated from its chaff in preparation for grinding. It can also mean grain that has been ground at a gristmill. Grist can be ground into meal or flour, depending on how coarsely it is ground. Maize made into grist is called grits when it is coarse and corn meal when it is finely ground
15
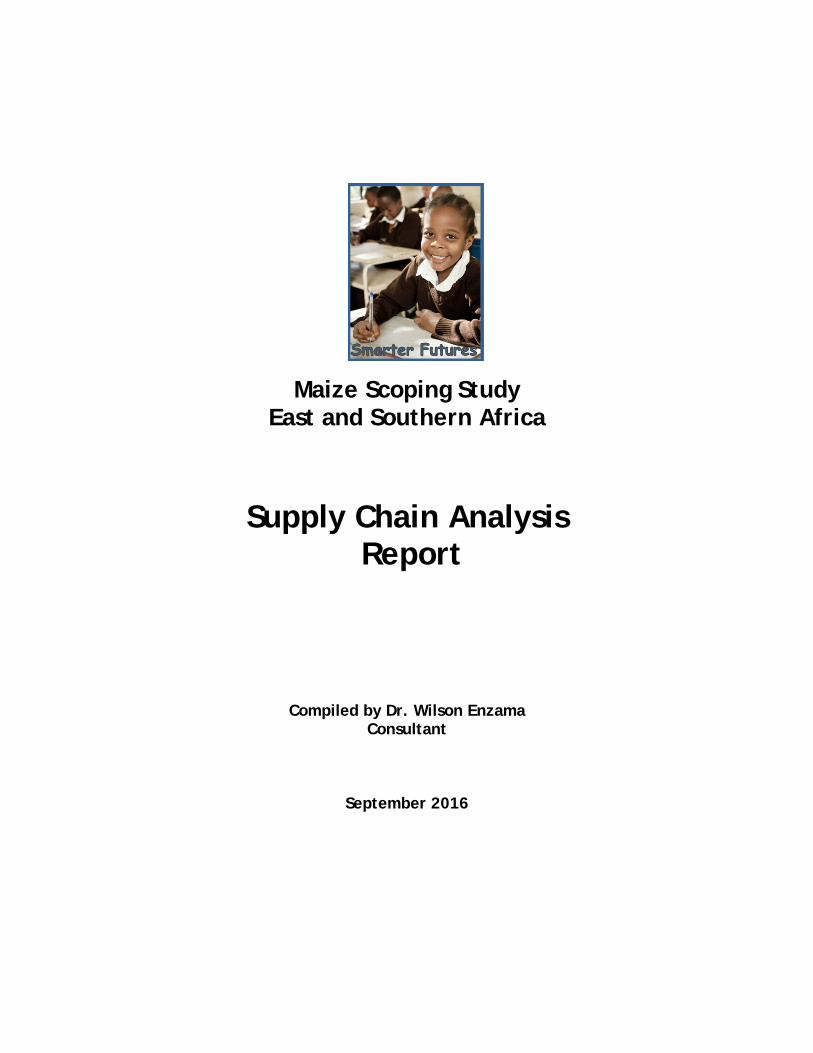
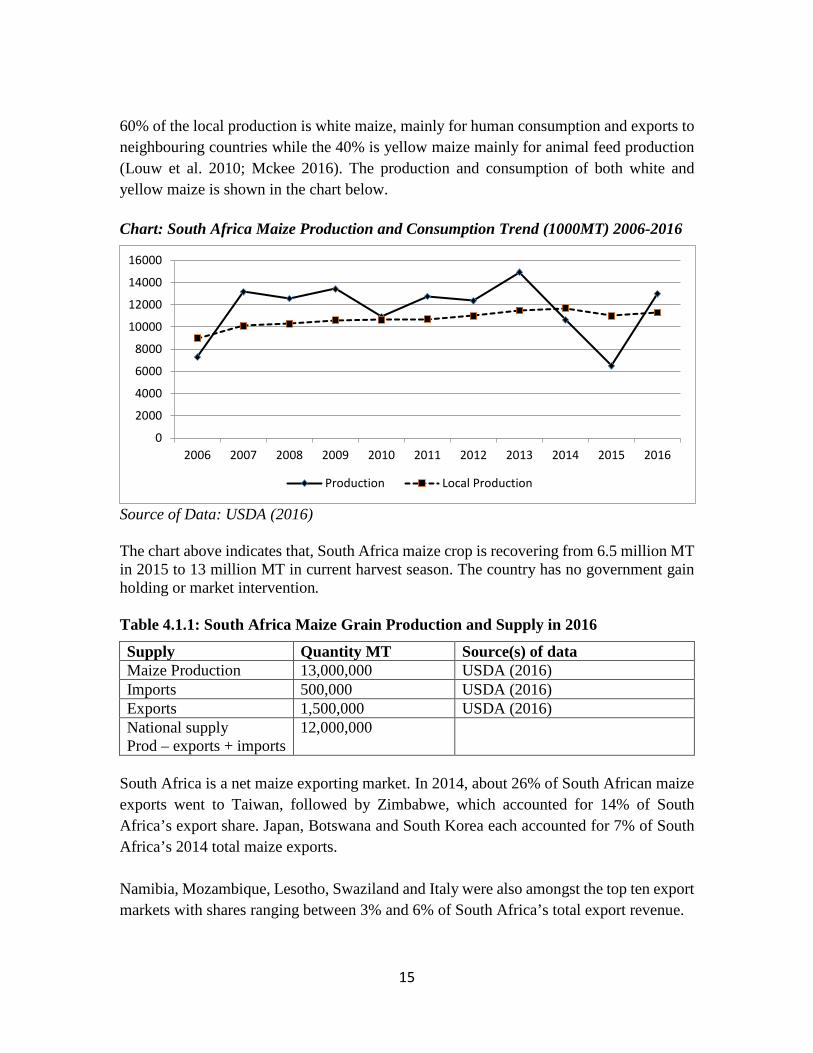
60% of the local production is white maize, mainly for human consumption and exports to neighbouring countries while the 40% is yellow maize mainly for animal feed production (Louw et al. 2010; Mckee 2016). The production and consumption of both white and yellow maize is shown in the chart below. Chart: South Africa Maize Production and Consumption Trend (1000MT) 2006-2016
Source of Data: USDA (2016) The chart above indicates that, South Africa maize crop is recovering from 6.5 million MT in 2015 to 13 million MT in current harvest season. The country has no government gain holding or market intervention. Table 4.1.1: South Africa Maize Grain Production and Supply in 2016
Supply Quantity MT Source(s) of data Maize Production 13,000,000 USDA (2016) Imports 500,000 USDA (2016) Exports 1,500,000 USDA (2016) National supply Prod – exports + imports
12,000,000
South Africa is a net maize exporting market. In 2014, about 26% of South African maize exports went to Taiwan, followed by Zimbabwe, which accounted for 14% of South Africa’s export share. Japan, Botswana and South Korea each accounted for 7% of South Africa’s 2014 total maize exports. Namibia, Mozambique, Lesotho, Swaziland and Italy were also amongst the top ten export markets with shares ranging between 3% and 6% of South Africa’s total export revenue.
0
2000
4000
6000
8000
10000
12000
14000
16000
2006 2007 2008 2009 2010 2011 2012 2013 2014 2015 2016
Production Local Production
16
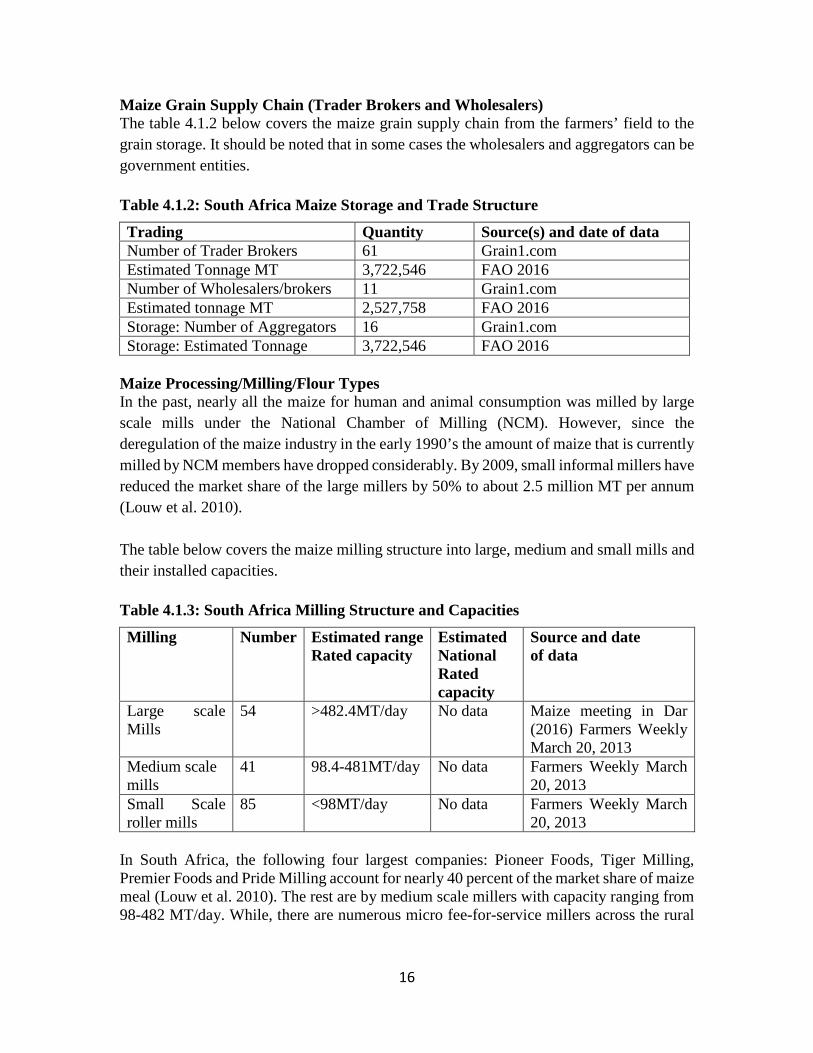
Maize Grain Supply Chain (Trader Brokers and Wholesalers) The table 4.1.2 below covers the maize grain supply chain from the farmers’ field to the grain storage. It should be noted that in some cases the wholesalers and aggregators can be government entities. Table 4.1.2: South Africa Maize Storage and Trade Structure
Trading Quantity Source(s) and date of data Number of Trader Brokers 61 Grain1.com Estimated Tonnage MT 3,722,546 FAO 2016 Number of Wholesalers/brokers 11 Grain1.com Estimated tonnage MT 2,527,758 FAO 2016 Storage: Number of Aggregators 16 Grain1.com Storage: Estimated Tonnage 3,722,546 FAO 2016
Maize Processing/Milling/Flour Types In the past, nearly all the maize for human and animal consumption was milled by large scale mills under the National Chamber of Milling (NCM). However, since the deregulation of the maize industry in the early 1990’s the amount of maize that is currently milled by NCM members have dropped considerably. By 2009, small informal millers have reduced the market share of the large millers by 50% to about 2.5 million MT per annum (Louw et al. 2010). The table below covers the maize milling structure into large, medium and small mills and their installed capacities. Table 4.1.3: South Africa Milling Structure and Capacities
Milling Number Estimated range Rated capacity
Estimated National Rated capacity
Source and date of data
Large scale Mills
54 >482.4MT/day No data Maize meeting in Dar (2016) Farmers Weekly March 20, 2013
Medium scale mills
41 98.4-481MT/day No data Farmers Weekly March 20, 2013
Small Scale roller mills
85 <98MT/day No data Farmers Weekly March 20, 2013
In South Africa, the following four largest companies: Pioneer Foods, Tiger Milling, Premier Foods and Pride Milling account for nearly 40 percent of the market share of maize meal (Louw et al. 2010). The rest are by medium scale millers with capacity ranging from 98-482 MT/day. While, there are numerous micro fee-for-service millers across the rural
17
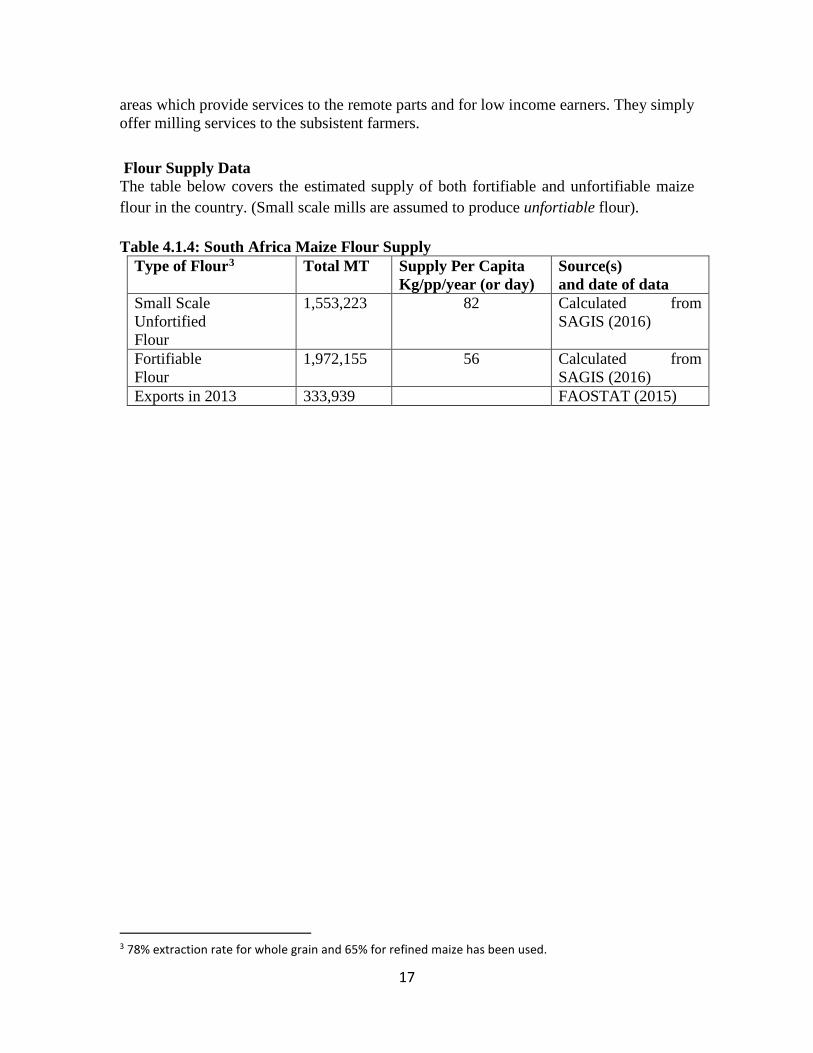
areas which provide services to the remote parts and for low income earners. They simply offer milling services to the subsistent farmers. Flour Supply Data The table below covers the estimated supply of both fortifiable and unfortifiable maize flour in the country. (Small scale mills are assumed to produce unfortiable flour). Table 4.1.4: South Africa Maize Flour Supply
Type of Flour3 Total MT Supply Per Capita Kg/pp/year (or day)
Source(s) and date of data
Small Scale Unfortified Flour
1,553,223 82 Calculated from SAGIS (2016)
Fortifiable Flour
1,972,155 56 Calculated from SAGIS (2016)
Exports in 2013 333,939 FAOSTAT (2015)
3 78% extraction rate for whole grain and 65% for refined maize has been used.
18
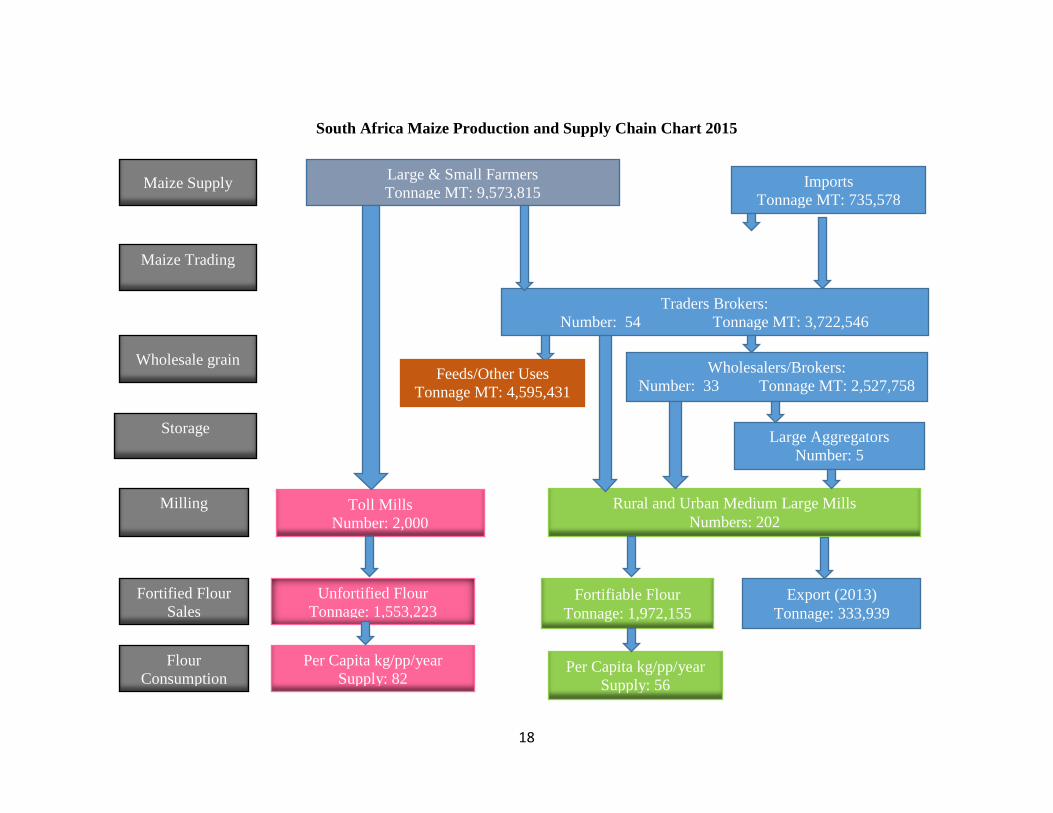
South Africa Maize Production and Supply Chain Chart 2015
Maize Supply Large & Small Farmers Tonnage MT: 9,573,815
Imports Tonnage MT: 735,578
Maize Trading
Traders Brokers: Number: 54 Tonnage MT: 3,722,546
Wholesalers/Brokers: Number: 33 Tonnage MT: 2,527,758
Wholesale grain
Large Aggregators Number: 5
Storage
Milling
Fortified Flour Sales
Flour Consumption
Toll Mills Number: 2,000
Rural and Urban Medium Large Mills Numbers: 202
Unfortified Flour Tonnage: 1,553,223
Per Capita kg/pp/year Supply: 82
Fortifiable Flour Tonnage: 1,972,155
Export (2013) Tonnage: 333,939
Per Capita kg/pp/year Supply: 56
Feeds/Other Uses Tonnage MT: 4,595,431
19
4.2 Malawi
Introduction Malawi is a small, densely populated country in southern Africa. According to World Bank, Malawi population is estimated to be 16,700,000 by 2014. Maize is by far the most important food staple in Malawi. Per capita consumption of maize is 133 kg, and it accounts for over half (54%) of the caloric intake of households in Malawi. This puts Malawi as one of the maize dependent countries in the world. While this may reflect “requirements”, actual maize consumption is much lower for most of the population. Consumption Patterns Reena Pastakia (2016) in her blog observes that, Malawians have a saying- ‘chimanga ndi moyo’ or 'maize is life'. She further asserts that, for around 80% of Malawians, life revolves around growing enough maize to feed the family. Nsima is the staple carbohydrate dish of Malawi. It is a thick starchy porridge made from corn, cassava or other starchy flour. There are two types of corn flours in Malawi: Ufa woyera –refined maize flour which has had the outer kernel shell and seed germ
pounded off, leaving just the starchy part of the seed) Ufa wa m’gaiwa – unrefined maize meal.
The stiff nsima porridge is formed into hamburger-size patties by scooping the porridge with a wet wooden spoon and flipping it onto a plate. The patty congeals in contact with the cool wet spoon and plate. While eating nsima, marble size pieces are broken off and rolled into a ball in the palm of the hand with the fingers. A final dimple is pressed into one side of it. It is then dipped in the sauce of vegetables or meat. Ndiwo is a basic vegetable dish of chopped greens that is delicious when served beside the nsima. Mgaiwa Phala (porridge) is maize meal dish eaten for breakfast and is usually served sweetened with the addition of sugar. Maize Supply: Grain Production, Exports/Imports The 2015 maize output was at 2.776 million tonnes, 28 percent lower than the record 2014 harvest. Total domestic consumption was 3.1 million tonnes. The demand was met by imports and reserves from previous year of 466,000TM. In 2015, government bought 30,000MT and 22,193MT of maize from Zambia and locally, respectively, to supplement the country's maize stock in National Food Research Agency (NFRA) depots. Another government parastatal ADMARC buys maize from smallholders at high prices during harvest period and sells at below the cost price to the poor households during scarcity. This government intervention distorts the market and crowds out private sector companies who trade in maize.
20
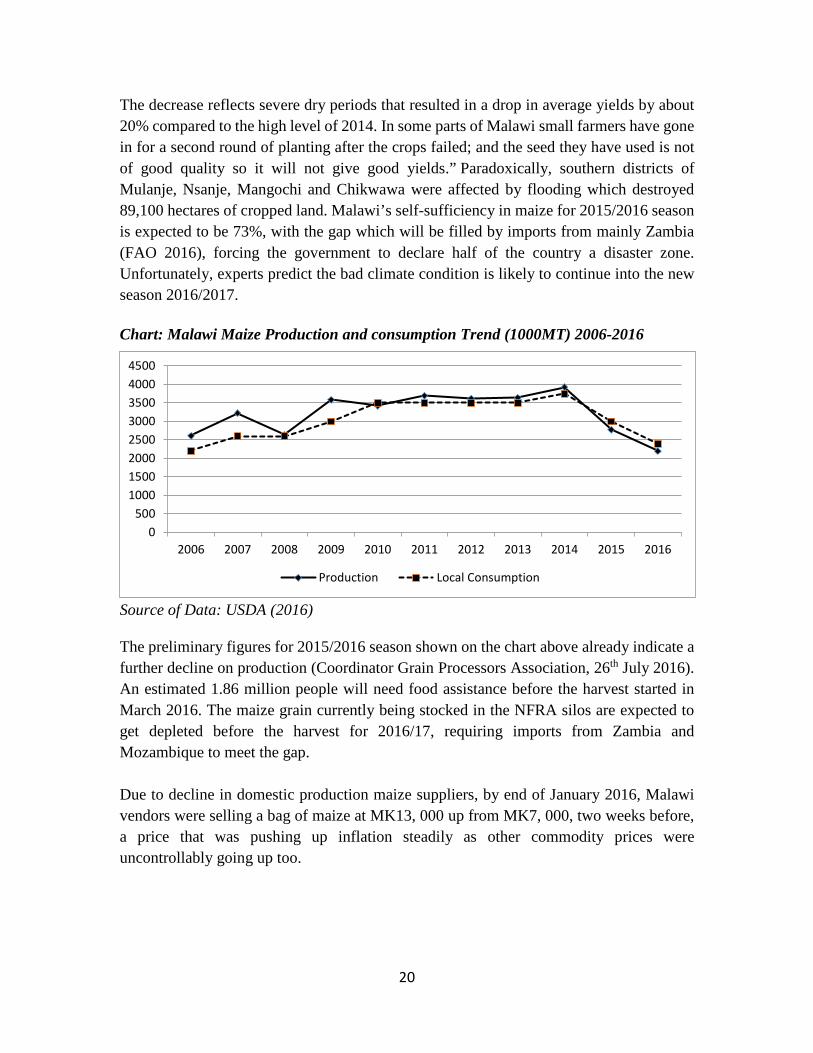
The decrease reflects severe dry periods that resulted in a drop in average yields by about 20% compared to the high level of 2014. In some parts of Malawi small farmers have gone in for a second round of planting after the crops failed; and the seed they have used is not of good quality so it will not give good yields.” Paradoxically, southern districts of Mulanje, Nsanje, Mangochi and Chikwawa were affected by flooding which destroyed 89,100 hectares of cropped land. Malawi’s self-sufficiency in maize for 2015/2016 season is expected to be 73%, with the gap which will be filled by imports from mainly Zambia (FAO 2016), forcing the government to declare half of the country a disaster zone. Unfortunately, experts predict the bad climate condition is likely to continue into the new season 2016/2017. Chart: Malawi Maize Production and consumption Trend (1000MT) 2006-2016
Source of Data: USDA (2016) The preliminary figures for 2015/2016 season shown on the chart above already indicate a further decline on production (Coordinator Grain Processors Association, 26th July 2016). An estimated 1.86 million people will need food assistance before the harvest started in March 2016. The maize grain currently being stocked in the NFRA silos are expected to get depleted before the harvest for 2016/17, requiring imports from Zambia and Mozambique to meet the gap. Due to decline in domestic production maize suppliers, by end of January 2016, Malawi vendors were selling a bag of maize at MK13, 000 up from MK7, 000, two weeks before, a price that was pushing up inflation steadily as other commodity prices were uncontrollably going up too.
0500
10001500200025003000350040004500
2006 2007 2008 2009 2010 2011 2012 2013 2014 2015 2016
Production Local Consumption
21
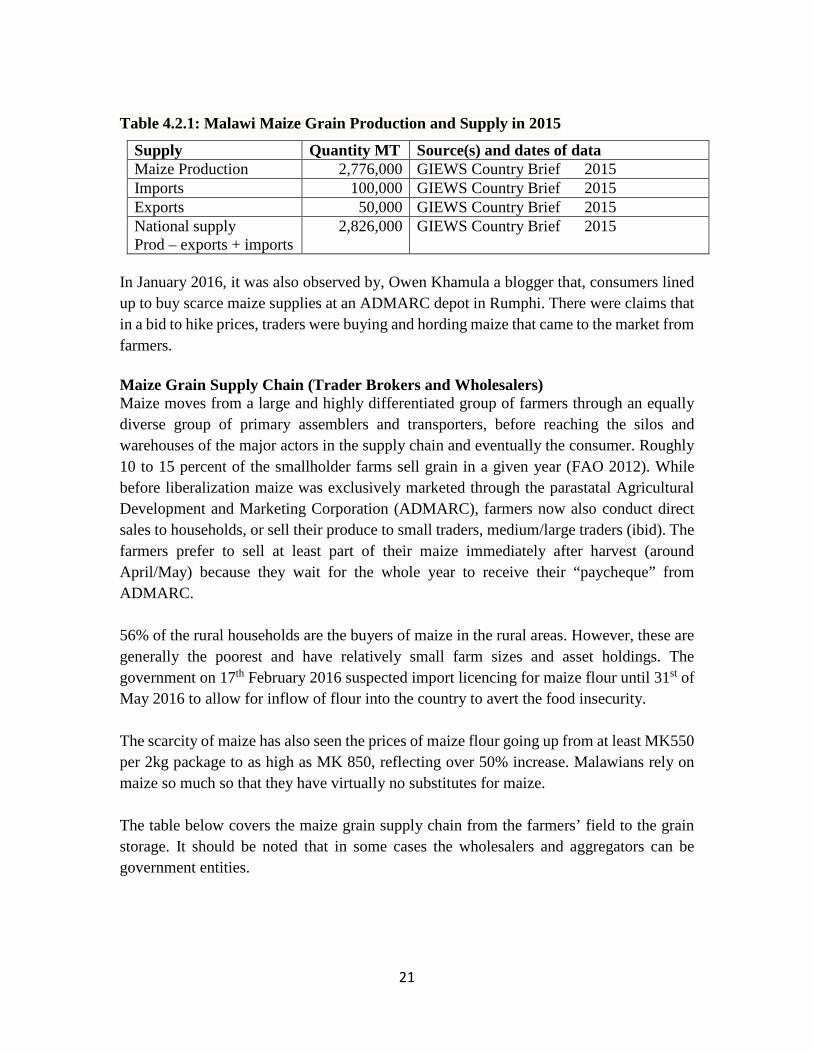
Table 4.2.1: Malawi Maize Grain Production and Supply in 2015
Supply Quantity MT Source(s) and dates of data Maize Production 2,776,000 GIEWS Country Brief 2015 Imports 100,000 GIEWS Country Brief 2015 Exports 50,000 GIEWS Country Brief 2015 National supply Prod – exports + imports
2,826,000 GIEWS Country Brief 2015
In January 2016, it was also observed by, Owen Khamula a blogger that, consumers lined up to buy scarce maize supplies at an ADMARC depot in Rumphi. There were claims that in a bid to hike prices, traders were buying and hording maize that came to the market from farmers. Maize Grain Supply Chain (Trader Brokers and Wholesalers) Maize moves from a large and highly differentiated group of farmers through an equally diverse group of primary assemblers and transporters, before reaching the silos and warehouses of the major actors in the supply chain and eventually the consumer. Roughly 10 to 15 percent of the smallholder farms sell grain in a given year (FAO 2012). While before liberalization maize was exclusively marketed through the parastatal Agricultural Development and Marketing Corporation (ADMARC), farmers now also conduct direct sales to households, or sell their produce to small traders, medium/large traders (ibid). The farmers prefer to sell at least part of their maize immediately after harvest (around April/May) because they wait for the whole year to receive their “paycheque” from ADMARC. 56% of the rural households are the buyers of maize in the rural areas. However, these are generally the poorest and have relatively small farm sizes and asset holdings. The government on 17th February 2016 suspected import licencing for maize flour until 31st of May 2016 to allow for inflow of flour into the country to avert the food insecurity. The scarcity of maize has also seen the prices of maize flour going up from at least MK550 per 2kg package to as high as MK 850, reflecting over 50% increase. Malawians rely on maize so much so that they have virtually no substitutes for maize. The table below covers the maize grain supply chain from the farmers’ field to the grain storage. It should be noted that in some cases the wholesalers and aggregators can be government entities.
22
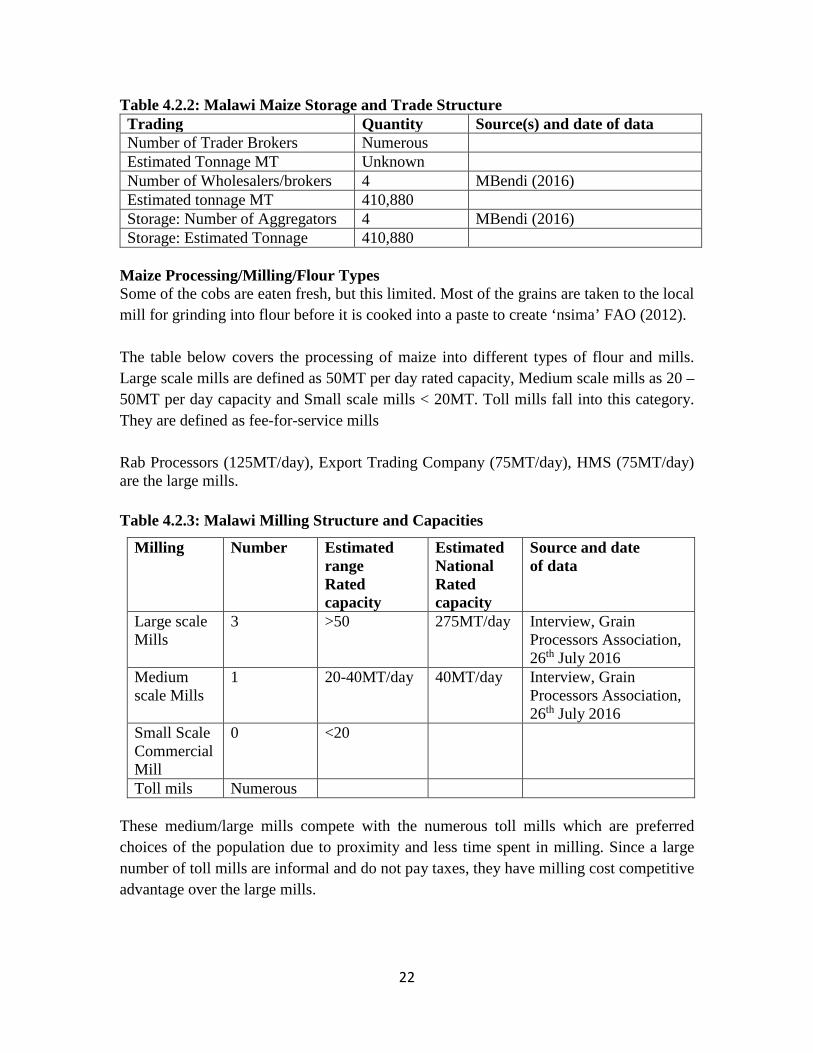
Table 4.2.2: Malawi Maize Storage and Trade Structure Trading Quantity Source(s) and date of data Number of Trader Brokers Numerous Estimated Tonnage MT Unknown Number of Wholesalers/brokers 4 MBendi (2016) Estimated tonnage MT 410,880 Storage: Number of Aggregators 4 MBendi (2016) Storage: Estimated Tonnage 410,880
Maize Processing/Milling/Flour Types Some of the cobs are eaten fresh, but this limited. Most of the grains are taken to the local mill for grinding into flour before it is cooked into a paste to create ‘nsima’ FAO (2012). The table below covers the processing of maize into different types of flour and mills. Large scale mills are defined as 50MT per day rated capacity, Medium scale mills as 20 – 50MT per day capacity and Small scale mills < 20MT. Toll mills fall into this category. They are defined as fee-for-service mills Rab Processors (125MT/day), Export Trading Company (75MT/day), HMS (75MT/day) are the large mills. Table 4.2.3: Malawi Milling Structure and Capacities
Milling Number Estimated range Rated capacity
Estimated National Rated capacity
Source and date of data
Large scale Mills
3 >50 275MT/day Interview, Grain Processors Association, 26th July 2016
Medium scale Mills
1 20-40MT/day 40MT/day Interview, Grain Processors Association, 26th July 2016
Small Scale Commercial Mill
0 <20
Toll mils Numerous These medium/large mills compete with the numerous toll mills which are preferred choices of the population due to proximity and less time spent in milling. Since a large number of toll mills are informal and do not pay taxes, they have milling cost competitive advantage over the large mills.
23
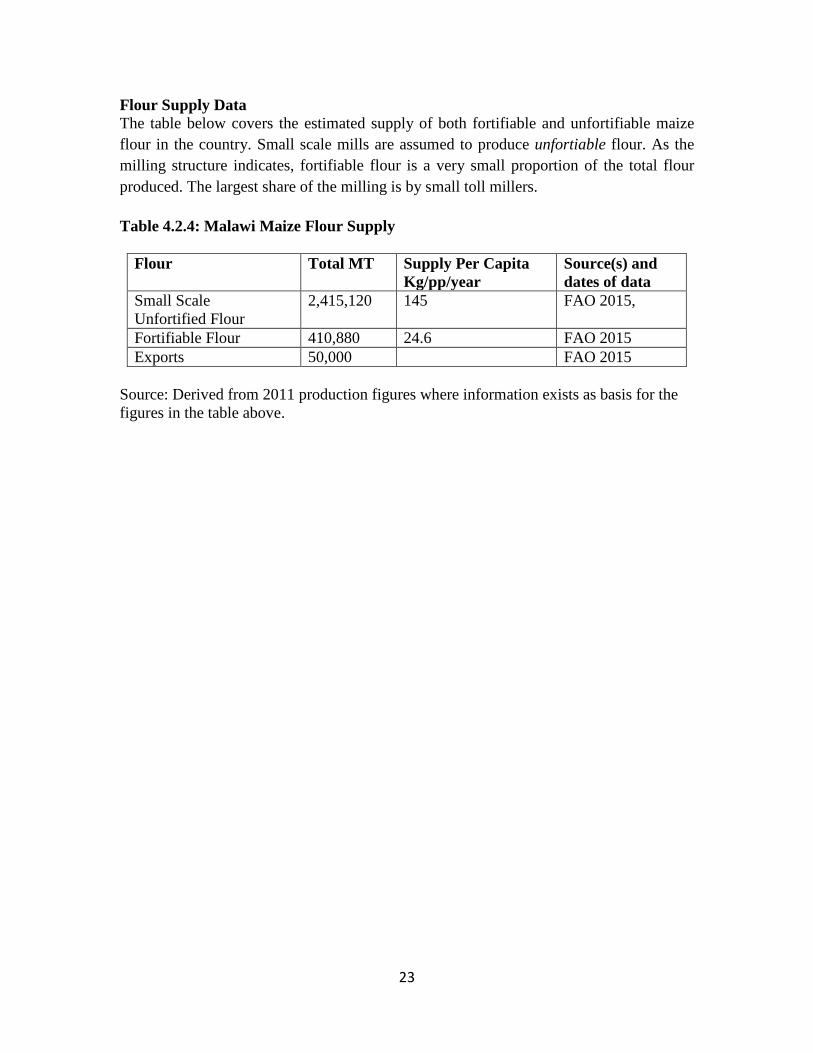
Flour Supply Data The table below covers the estimated supply of both fortifiable and unfortifiable maize flour in the country. Small scale mills are assumed to produce unfortiable flour. As the milling structure indicates, fortifiable flour is a very small proportion of the total flour produced. The largest share of the milling is by small toll millers. Table 4.2.4: Malawi Maize Flour Supply
Flour Total MT Supply Per Capita Kg/pp/year
Source(s) and dates of data
Small Scale Unfortified Flour
2,415,120 145 FAO 2015,
Fortifiable Flour 410,880 24.6 FAO 2015 Exports 50,000 FAO 2015
Source: Derived from 2011 production figures where information exists as basis for the figures in the table above.
24
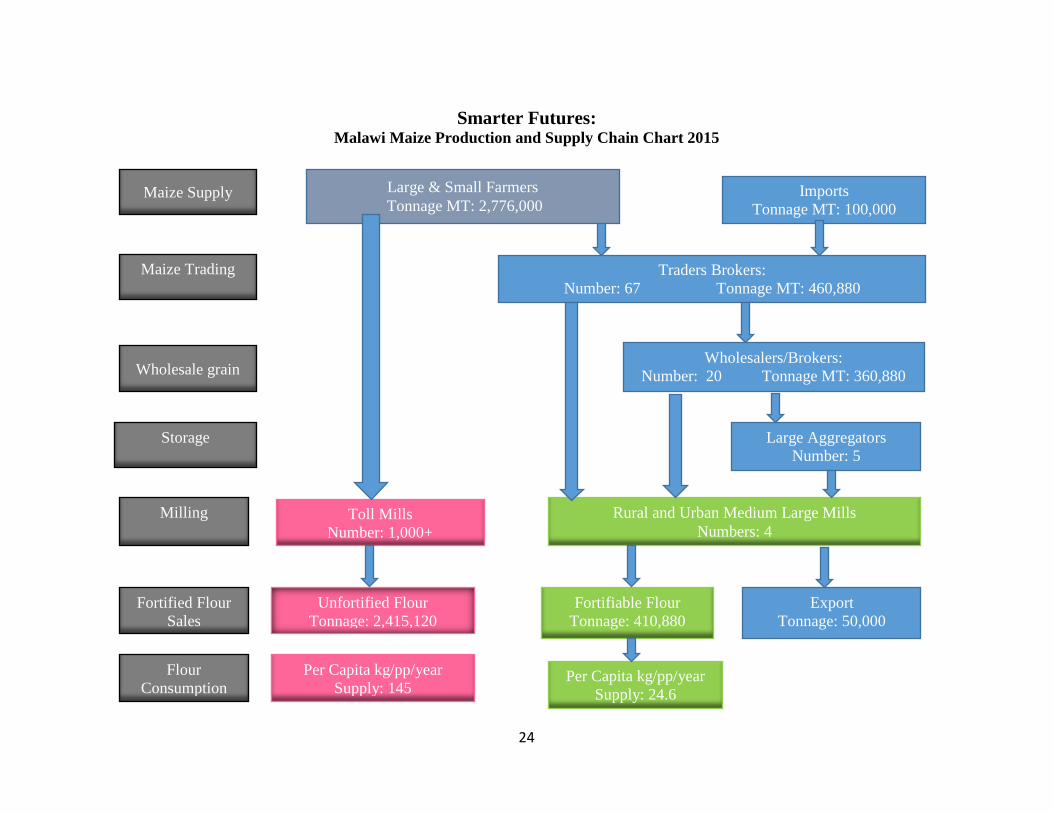
Smarter Futures: Malawi Maize Production and Supply Chain Chart 2015
Maize Supply Large & Small Farmers Tonnage MT: 2,776,000
Imports Tonnage MT: 100,000
Maize Trading
Traders Brokers: Number: 67 Tonnage MT: 460,880
Wholesalers/Brokers: Number: 20 Tonnage MT: 360,880
Wholesale grain
Large Aggregators Number: 5
Storage
Milling
Fortified Flour Sales
Flour Consumption
Toll Mills Number: 1,000+
Rural and Urban Medium Large Mills Numbers: 4
Unfortified Flour Tonnage: 2,415,120
Per Capita kg/pp/year Supply: 145
Fortifiable Flour Tonnage: 410,880
Export Tonnage: 50,000
Per Capita kg/pp/year Supply: 24.6
25
4.3 Zambia
Introduction Zambia is a landlocked country located in southern Africa, east of Angola. The total population of Zambia is 15.1 million. It has an area of 752,614 square kilometers (290,584 square miles) and a total land boundary of 5,664 kilometers (3,520 miles). Lusaka, the capital city, is located in the southern center of the country. Rural poverty rates have not declined. Four out of five people live on less than US $2 per day. Zambia has seemingly achieved food self-sufficiency, without food security (Chapoto et al. 2015) Chapoto et al (2015) observe that, maize dominates food consumption in Zambia, providing over half of all calories consumed. Cassava serves as the second most important food staple nationally, and in some regions it is the preferred staple. In recent decades, wheat has become increasingly important as a third basic staple food, particularly in urban areas where it now accounts for higher budget share than maize. Consumption Pattern On average, maize is consumed by 80% of the population. The per capita consumption is estimated to be 133kg/pp/year (Chapoto et al. 2010). It is consumed in three four major forms. The most common is nshima (stiff porridge). Almost all indigenous languages in Zambia probably call nshima by a different name according to the specific area language and dialect variation. The Chewa, Tumbuka, and Ngoni of Eastern Zambia and Malawi call it sima or nsima, the Bemba of Northern Zambia call it ubwali, the Tonga of Southern Zambia calls it Insima and Lozi of Western Zambia calls it buhobe. A consumption pattern survey by HarvestPlus (in 2011) reveals that nshima is eaten for lunch (99%), dinner (98%) and breakfast (78%). Another maize product most frequently for breakfast (80%) is samp _ a thin porridge. Boiled maize grain is the third popular maize product mostly eaten for breakfast (62%) and lunch (57%). Porridge is only eaten for breakfast (72%). Roasted maize and popcorns are only eaten as snacks (66%). The average consumption is 100kg per year (Hugo et al. 2015). Consumption is highly concentrated in urban areas where two thirds of commercial maize meal consumers reside and the upper two income quintiles which include 75% of commercial maize consumers. Only about a quarter of commercial maize meal consumers come from the lower 3 quintiles – still a substantial number, about 1.1 million, but less than the others.
26
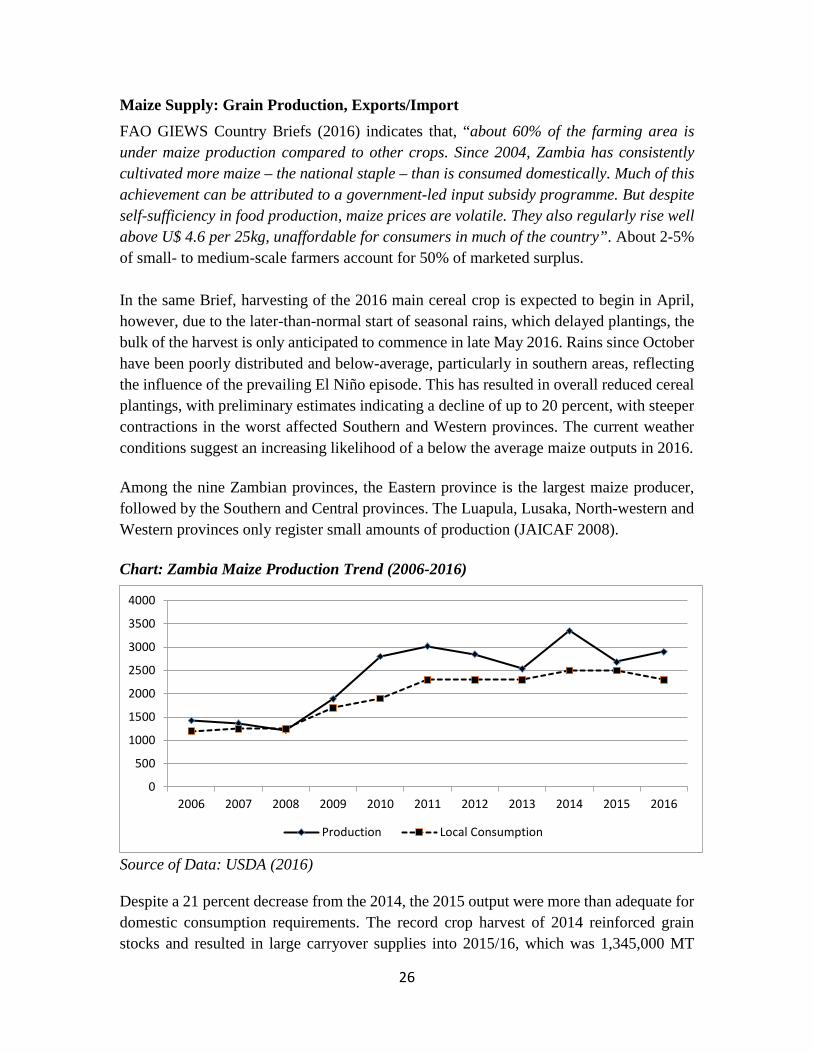
Maize Supply: Grain Production, Exports/Import FAO GIEWS Country Briefs (2016) indicates that, “about 60% of the farming area is under maize production compared to other crops. Since 2004, Zambia has consistently cultivated more maize – the national staple – than is consumed domestically. Much of this achievement can be attributed to a government-led input subsidy programme. But despite self-sufficiency in food production, maize prices are volatile. They also regularly rise well above U$ 4.6 per 25kg, unaffordable for consumers in much of the country”. About 2-5% of small- to medium-scale farmers account for 50% of marketed surplus. In the same Brief, harvesting of the 2016 main cereal crop is expected to begin in April, however, due to the later-than-normal start of seasonal rains, which delayed plantings, the bulk of the harvest is only anticipated to commence in late May 2016. Rains since October have been poorly distributed and below-average, particularly in southern areas, reflecting the influence of the prevailing El Niño episode. This has resulted in overall reduced cereal plantings, with preliminary estimates indicating a decline of up to 20 percent, with steeper contractions in the worst affected Southern and Western provinces. The current weather conditions suggest an increasing likelihood of a below the average maize outputs in 2016. Among the nine Zambian provinces, the Eastern province is the largest maize producer, followed by the Southern and Central provinces. The Luapula, Lusaka, North-western and Western provinces only register small amounts of production (JAICAF 2008). Chart: Zambia Maize Production Trend (2006-2016)
Source of Data: USDA (2016) Despite a 21 percent decrease from the 2014, the 2015 output were more than adequate for domestic consumption requirements. The record crop harvest of 2014 reinforced grain stocks and resulted in large carryover supplies into 2015/16, which was 1,345,000 MT
0
500
1000
1500
2000
2500
3000
3500
4000
2006 2007 2008 2009 2010 2011 2012 2013 2014 2015 2016
Production Local Consumption
27
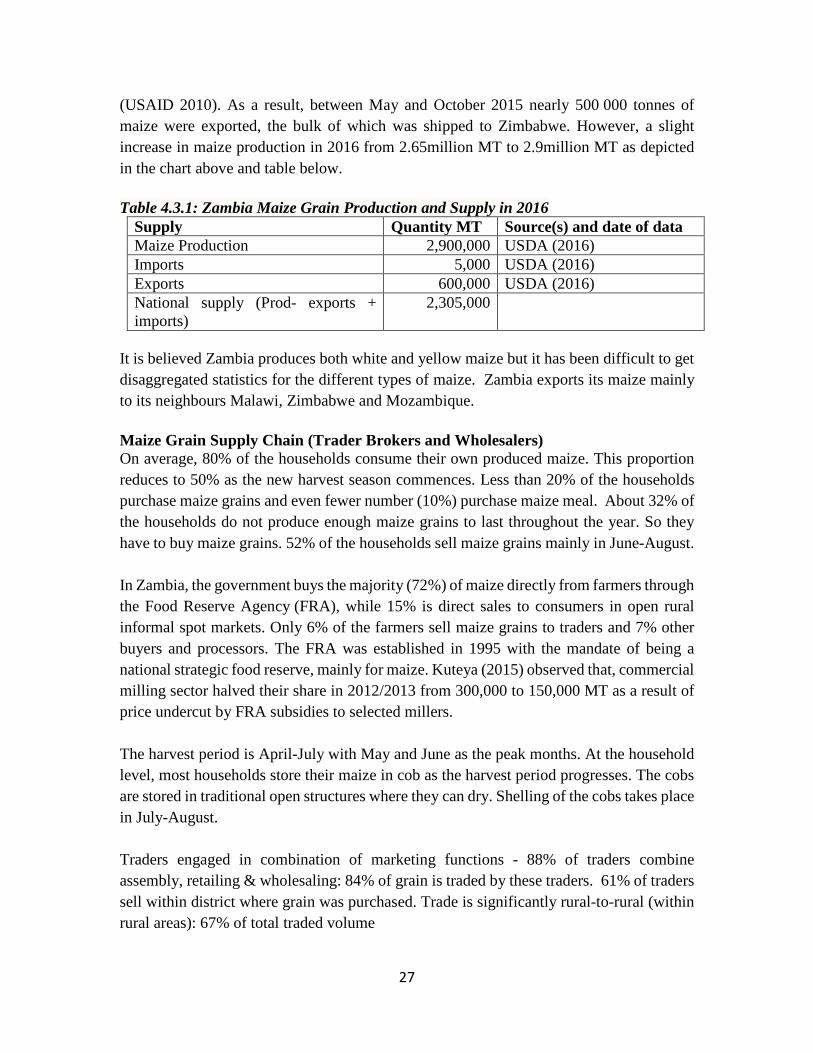
(USAID 2010). As a result, between May and October 2015 nearly 500 000 tonnes of maize were exported, the bulk of which was shipped to Zimbabwe. However, a slight increase in maize production in 2016 from 2.65million MT to 2.9million MT as depicted in the chart above and table below. Table 4.3.1: Zambia Maize Grain Production and Supply in 2016
Supply Quantity MT Source(s) and date of data Maize Production 2,900,000 USDA (2016) Imports 5,000 USDA (2016) Exports 600,000 USDA (2016) National supply (Prod- exports + imports)
2,305,000
It is believed Zambia produces both white and yellow maize but it has been difficult to get disaggregated statistics for the different types of maize. Zambia exports its maize mainly to its neighbours Malawi, Zimbabwe and Mozambique. Maize Grain Supply Chain (Trader Brokers and Wholesalers) On average, 80% of the households consume their own produced maize. This proportion reduces to 50% as the new harvest season commences. Less than 20% of the households purchase maize grains and even fewer number (10%) purchase maize meal. About 32% of the households do not produce enough maize grains to last throughout the year. So they have to buy maize grains. 52% of the households sell maize grains mainly in June-August. In Zambia, the government buys the majority (72%) of maize directly from farmers through the Food Reserve Agency (FRA), while 15% is direct sales to consumers in open rural informal spot markets. Only 6% of the farmers sell maize grains to traders and 7% other buyers and processors. The FRA was established in 1995 with the mandate of being a national strategic food reserve, mainly for maize. Kuteya (2015) observed that, commercial milling sector halved their share in 2012/2013 from 300,000 to 150,000 MT as a result of price undercut by FRA subsidies to selected millers. The harvest period is April-July with May and June as the peak months. At the household level, most households store their maize in cob as the harvest period progresses. The cobs are stored in traditional open structures where they can dry. Shelling of the cobs takes place in July-August. Traders engaged in combination of marketing functions - 88% of traders combine assembly, retailing & wholesaling: 84% of grain is traded by these traders. 61% of traders sell within district where grain was purchased. Trade is significantly rural-to-rural (within rural areas): 67% of total traded volume
28
The table below covers the maize grain supply chain from the farmers’ field to the grain storage. It should be noted that in some cases the wholesalers and aggregators can be government entities. Table 4.3.2: Zambia Maize Storage and Trade Structure
Trading Quantity Source(s) and date of data Number of Trader Brokers 21 Grain 1.com Estimated Tonnage MT 86,073 FAO (2016); Hugo et al. (2015) Number of Wholesalers/brokers 11 Grain 1.com Estimated tonnage MT 100,419 FAO (2016); Hugo et al. (2015) Storage: Number of Aggregators 3 FAO (2016); Hugo et al. (2015) Storage: Estimated Tonnage 1,662,782 FAO (2016); Hugo et al. (2015)
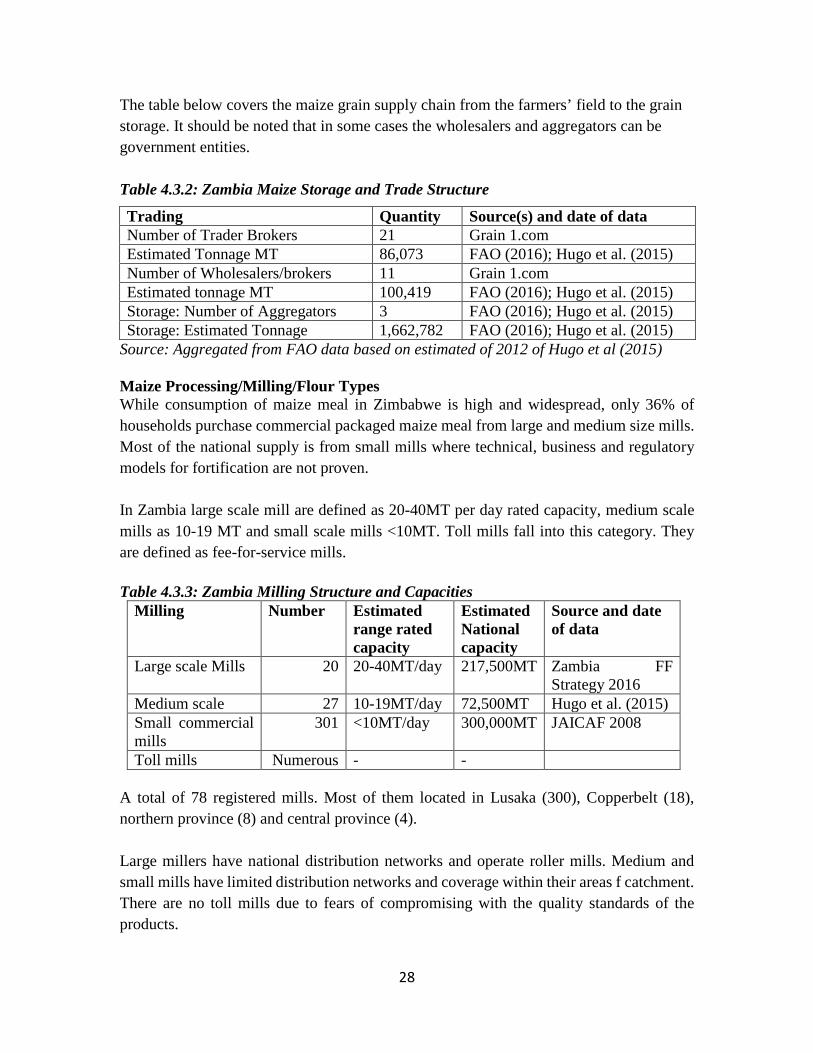
Source: Aggregated from FAO data based on estimated of 2012 of Hugo et al (2015) Maize Processing/Milling/Flour Types While consumption of maize meal in Zimbabwe is high and widespread, only 36% of households purchase commercial packaged maize meal from large and medium size mills. Most of the national supply is from small mills where technical, business and regulatory models for fortification are not proven. In Zambia large scale mill are defined as 20-40MT per day rated capacity, medium scale mills as 10-19 MT and small scale mills <10MT. Toll mills fall into this category. They are defined as fee-for-service mills. Table 4.3.3: Zambia Milling Structure and Capacities
Milling Number Estimated range rated capacity
Estimated National capacity
Source and date of data
Large scale Mills 20 20-40MT/day 217,500MT Zambia FF Strategy 2016
Medium scale 27 10-19MT/day 72,500MT Hugo et al. (2015) Small commercial mills
301 <10MT/day 300,000MT JAICAF 2008
Toll mills Numerous - - A total of 78 registered mills. Most of them located in Lusaka (300), Copperbelt (18), northern province (8) and central province (4). Large millers have national distribution networks and operate roller mills. Medium and small mills have limited distribution networks and coverage within their areas f catchment. There are no toll mills due to fears of compromising with the quality standards of the products.
29
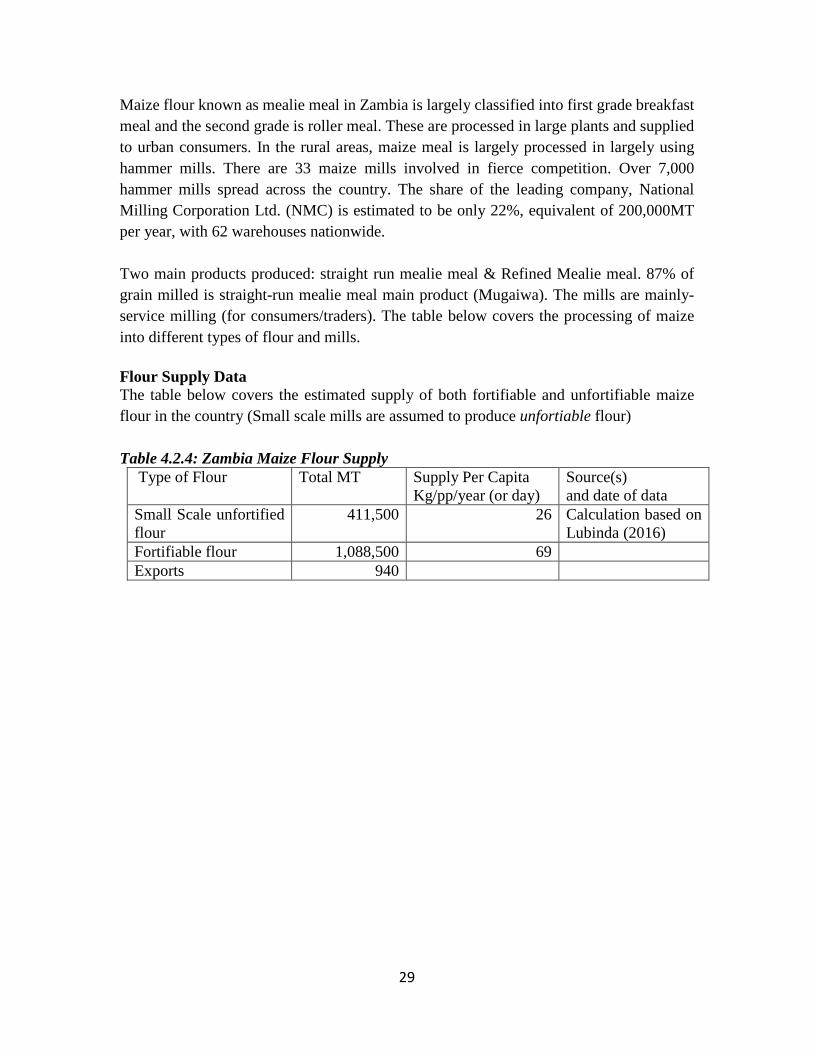
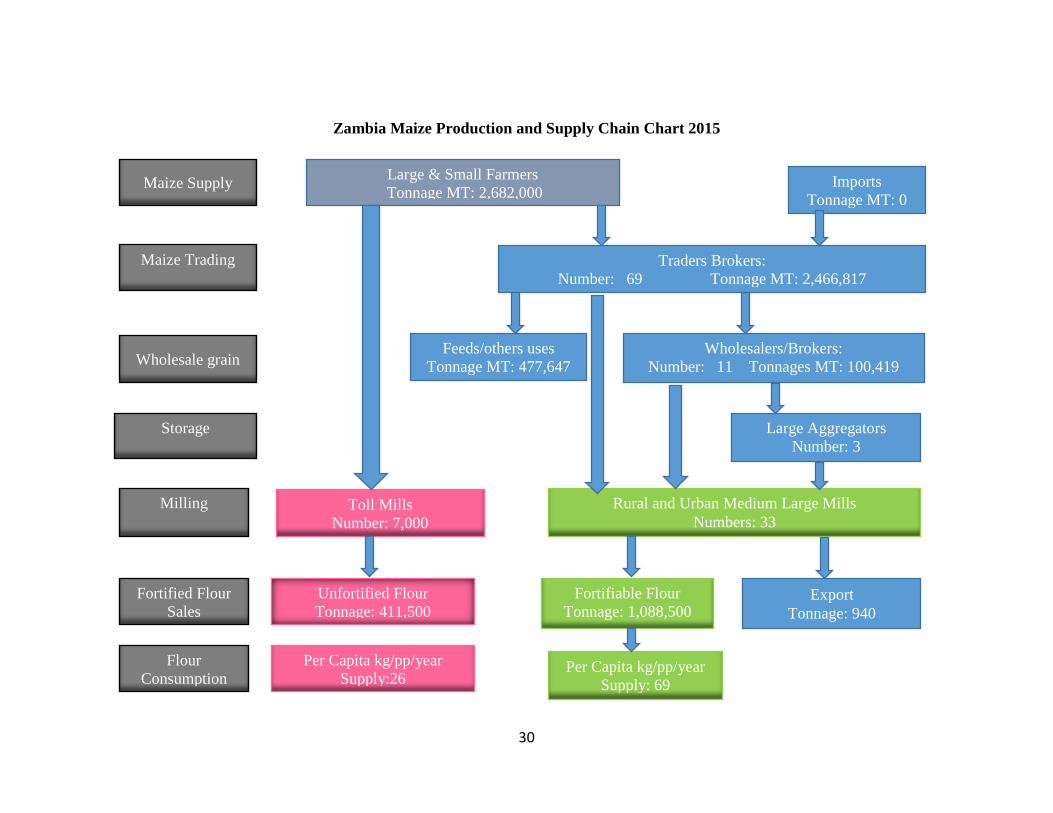
Maize flour known as mealie meal in Zambia is largely classified into first grade breakfast meal and the second grade is roller meal. These are processed in large plants and supplied to urban consumers. In the rural areas, maize meal is largely processed in largely using hammer mills. There are 33 maize mills involved in fierce competition. Over 7,000 hammer mills spread across the country. The share of the leading company, National Milling Corporation Ltd. (NMC) is estimated to be only 22%, equivalent of 200,000MT per year, with 62 warehouses nationwide. Two main products produced: straight run mealie meal & Refined Mealie meal. 87% of grain milled is straight-run mealie meal main product (Mugaiwa). The mills are mainly- service milling (for consumers/traders). The table below covers the processing of maize into different types of flour and mills. Flour Supply Data The table below covers the estimated supply of both fortifiable and unfortifiable maize flour in the country (Small scale mills are assumed to produce unfortiable flour) Table 4.2.4: Zambia Maize Flour Supply
Type of Flour Total MT Supply Per Capita Kg/pp/year (or day)
Source(s) and date of data
Small Scale unfortified flour
411,500 26 Calculation based on Lubinda (2016)
Fortifiable flour 1,088,500 69 Exports 940
30
Zambia Maize Production and Supply Chain Chart 2015
Maize Supply Large & Small Farmers Tonnage MT: 2,682,000
Imports Tonnage MT: 0
Maize Trading
Traders Brokers: Number: 69 Tonnage MT: 2,466,817
Wholesalers/Brokers: Number: 11 Tonnages MT: 100,419
Wholesale grain
Large Aggregators Number: 3
Storage
Milling
Fortified Flour Sales
Flour Consumption
Toll Mills Number: 7,000
Rural and Urban Medium Large Mills Numbers: 33
Unfortified Flour Tonnage: 411,500
Per Capita kg/pp/year Supply:26
Fortifiable Flour Tonnage: 1,088,500
Export Tonnage: 940
Per Capita kg/pp/year Supply: 69
Feeds/others uses Tonnage MT: 477,647
31
4.4 Zimbabwe
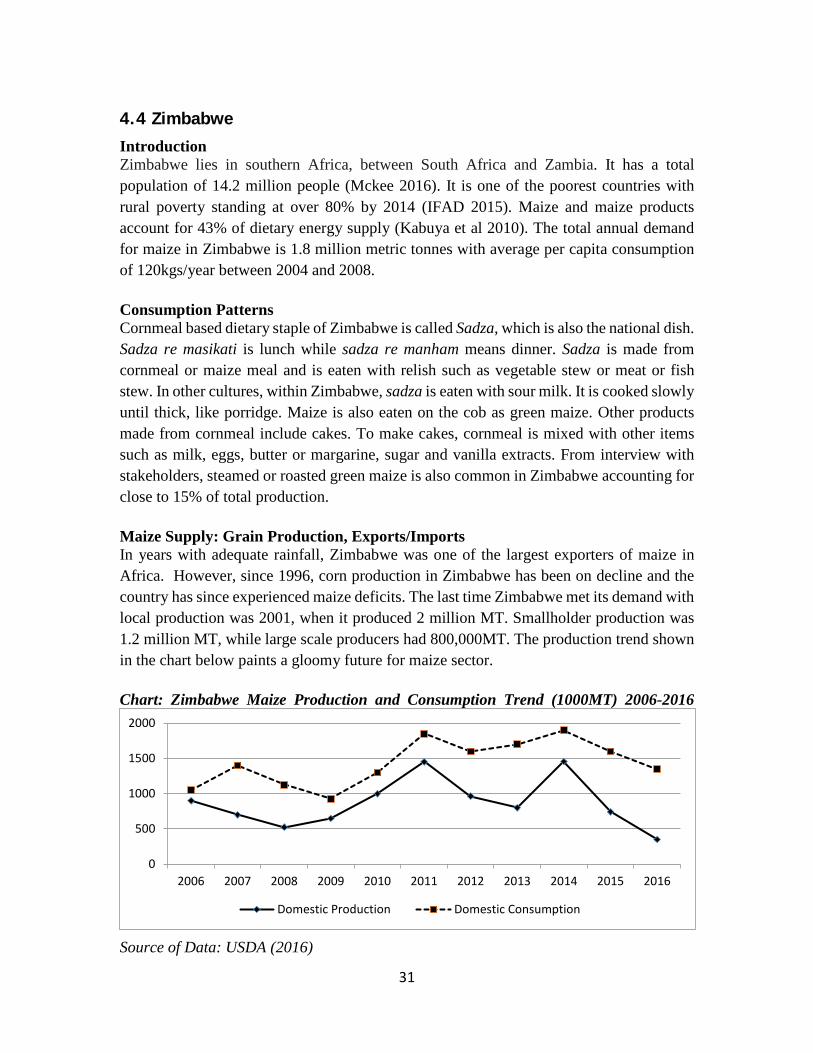
Introduction Zimbabwe lies in southern Africa, between South Africa and Zambia. It has a total population of 14.2 million people (Mckee 2016). It is one of the poorest countries with rural poverty standing at over 80% by 2014 (IFAD 2015). Maize and maize products account for 43% of dietary energy supply (Kabuya et al 2010). The total annual demand for maize in Zimbabwe is 1.8 million metric tonnes with average per capita consumption of 120kgs/year between 2004 and 2008. Consumption Patterns Cornmeal based dietary staple of Zimbabwe is called Sadza, which is also the national dish. Sadza re masikati is lunch while sadza re manham means dinner. Sadza is made from cornmeal or maize meal and is eaten with relish such as vegetable stew or meat or fish stew. In other cultures, within Zimbabwe, sadza is eaten with sour milk. It is cooked slowly until thick, like porridge. Maize is also eaten on the cob as green maize. Other products made from cornmeal include cakes. To make cakes, cornmeal is mixed with other items such as milk, eggs, butter or margarine, sugar and vanilla extracts. From interview with stakeholders, steamed or roasted green maize is also common in Zimbabwe accounting for close to 15% of total production. Maize Supply: Grain Production, Exports/Imports In years with adequate rainfall, Zimbabwe was one of the largest exporters of maize in Africa. However, since 1996, corn production in Zimbabwe has been on decline and the country has since experienced maize deficits. The last time Zimbabwe met its demand with local production was 2001, when it produced 2 million MT. Smallholder production was 1.2 million MT, while large scale producers had 800,000MT. The production trend shown in the chart below paints a gloomy future for maize sector. Chart: Zimbabwe Maize Production and Consumption Trend (1000MT) 2006-2016
Source of Data: USDA (2016)
0
500
1000
1500
2000
2006 2007 2008 2009 2010 2011 2012 2013 2014 2015 2016
Domestic Production Domestic Consumption
32
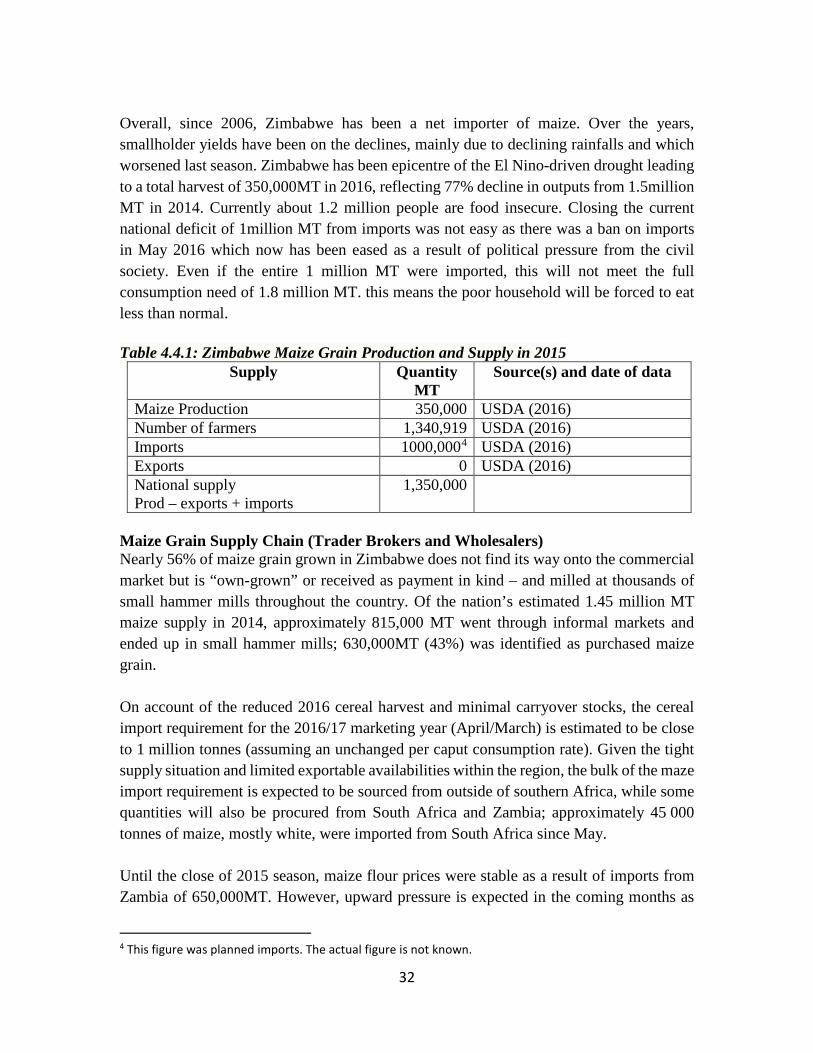
Overall, since 2006, Zimbabwe has been a net importer of maize. Over the years, smallholder yields have been on the declines, mainly due to declining rainfalls and which worsened last season. Zimbabwe has been epicentre of the El Nino-driven drought leading to a total harvest of 350,000MT in 2016, reflecting 77% decline in outputs from 1.5million MT in 2014. Currently about 1.2 million people are food insecure. Closing the current national deficit of 1million MT from imports was not easy as there was a ban on imports in May 2016 which now has been eased as a result of political pressure from the civil society. Even if the entire 1 million MT were imported, this will not meet the full consumption need of 1.8 million MT. this means the poor household will be forced to eat less than normal. Table 4.4.1: Zimbabwe Maize Grain Production and Supply in 2015
Supply Quantity MT
Source(s) and date of data
Maize Production 350,000 USDA (2016) Number of farmers 1,340,919 USDA (2016) Imports 1000,0004 USDA (2016) Exports 0 USDA (2016) National supply Prod – exports + imports
1,350,000
Maize Grain Supply Chain (Trader Brokers and Wholesalers) Nearly 56% of maize grain grown in Zimbabwe does not find its way onto the commercial market but is “own-grown” or received as payment in kind – and milled at thousands of small hammer mills throughout the country. Of the nation’s estimated 1.45 million MT maize supply in 2014, approximately 815,000 MT went through informal markets and ended up in small hammer mills; 630,000MT (43%) was identified as purchased maize grain. On account of the reduced 2016 cereal harvest and minimal carryover stocks, the cereal import requirement for the 2016/17 marketing year (April/March) is estimated to be close to 1 million tonnes (assuming an unchanged per caput consumption rate). Given the tight supply situation and limited exportable availabilities within the region, the bulk of the maze import requirement is expected to be sourced from outside of southern Africa, while some quantities will also be procured from South Africa and Zambia; approximately 45 000 tonnes of maize, mostly white, were imported from South Africa since May. Until the close of 2015 season, maize flour prices were stable as a result of imports from Zambia of 650,000MT. However, upward pressure is expected in the coming months as
4 This figure was planned imports. The actual figure is not known.
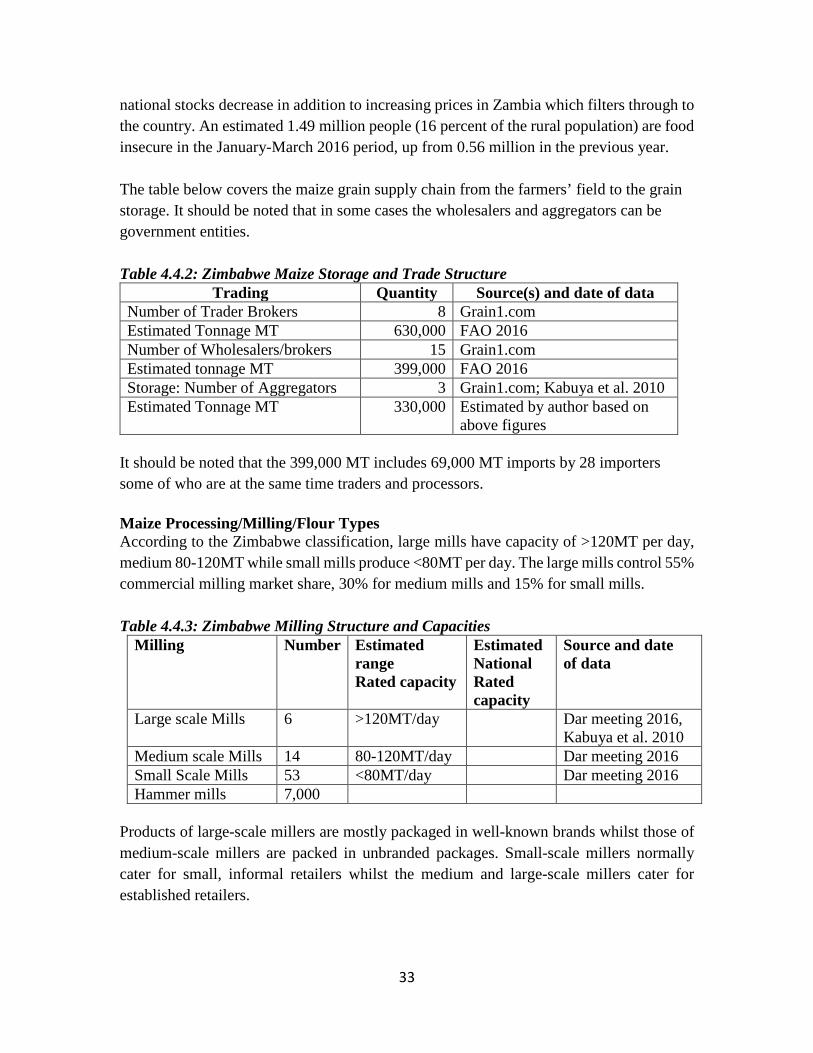
33
national stocks decrease in addition to increasing prices in Zambia which filters through to the country. An estimated 1.49 million people (16 percent of the rural population) are food insecure in the January-March 2016 period, up from 0.56 million in the previous year. The table below covers the maize grain supply chain from the farmers’ field to the grain storage. It should be noted that in some cases the wholesalers and aggregators can be government entities. Table 4.4.2: Zimbabwe Maize Storage and Trade Structure
Trading Quantity Source(s) and date of data Number of Trader Brokers 8 Grain1.com Estimated Tonnage MT 630,000 FAO 2016 Number of Wholesalers/brokers 15 Grain1.com Estimated tonnage MT 399,000 FAO 2016 Storage: Number of Aggregators 3 Grain1.com; Kabuya et al. 2010 Estimated Tonnage MT 330,000 Estimated by author based on
above figures It should be noted that the 399,000 MT includes 69,000 MT imports by 28 importers some of who are at the same time traders and processors. Maize Processing/Milling/Flour Types According to the Zimbabwe classification, large mills have capacity of >120MT per day, medium 80-120MT while small mills produce <80MT per day. The large mills control 55% commercial milling market share, 30% for medium mills and 15% for small mills. Table 4.4.3: Zimbabwe Milling Structure and Capacities
Milling Number Estimated range Rated capacity
Estimated National Rated capacity
Source and date of data
Large scale Mills 6 >120MT/day Dar meeting 2016, Kabuya et al. 2010
Medium scale Mills 14 80-120MT/day Dar meeting 2016 Small Scale Mills 53 <80MT/day Dar meeting 2016 Hammer mills 7,000
Products of large-scale millers are mostly packaged in well-known brands whilst those of medium-scale millers are packed in unbranded packages. Small-scale millers normally cater for small, informal retailers whilst the medium and large-scale millers cater for established retailers.
34
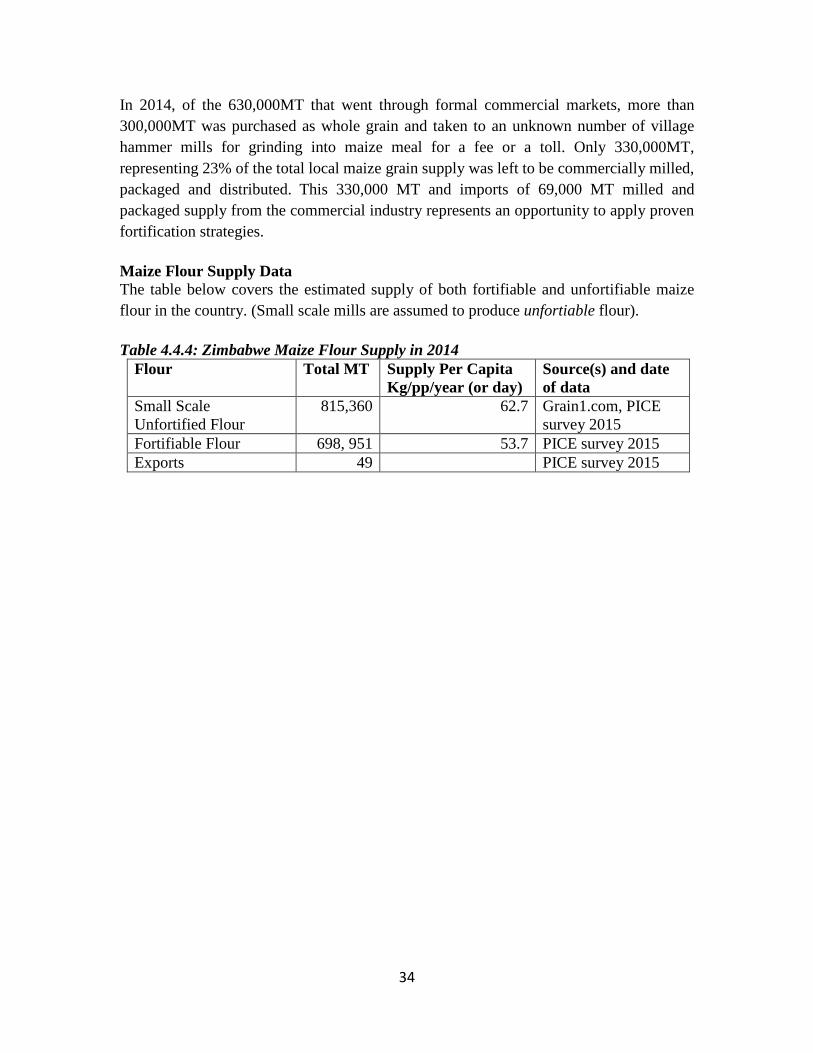
In 2014, of the 630,000MT that went through formal commercial markets, more than 300,000MT was purchased as whole grain and taken to an unknown number of village hammer mills for grinding into maize meal for a fee or a toll. Only 330,000MT, representing 23% of the total local maize grain supply was left to be commercially milled, packaged and distributed. This 330,000 MT and imports of 69,000 MT milled and packaged supply from the commercial industry represents an opportunity to apply proven fortification strategies. Maize Flour Supply Data The table below covers the estimated supply of both fortifiable and unfortifiable maize flour in the country. (Small scale mills are assumed to produce unfortiable flour). Table 4.4.4: Zimbabwe Maize Flour Supply in 2014
Flour Total MT Supply Per Capita Kg/pp/year (or day)
Source(s) and date of data
Small Scale Unfortified Flour
815,360 62.7 Grain1.com, PICE survey 2015
Fortifiable Flour 698, 951 53.7 PICE survey 2015 Exports 49 PICE survey 2015
35
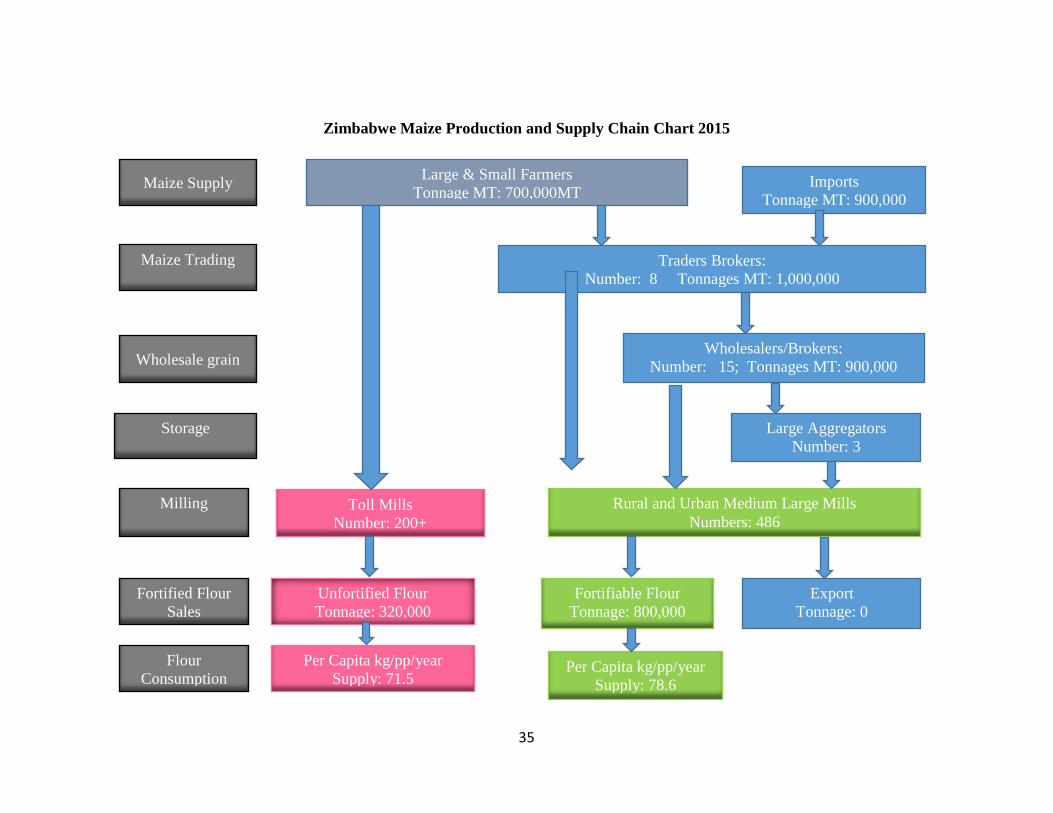
Zimbabwe Maize Production and Supply Chain Chart 2015
Maize Supply Large & Small Farmers Tonnage MT: 700,000MT
Imports Tonnage MT: 900,000
Maize Trading
Traders Brokers: Number: 8 Tonnages MT: 1,000,000
Wholesalers/Brokers: Number: 15; Tonnages MT: 900,000
Wholesale grain
Large Aggregators Number: 3
Storage
Milling
Fortified Flour Sales
Flour Consumption
Toll Mills Number: 200+
Rural and Urban Medium Large Mills Numbers: 486
Unfortified Flour Tonnage: 320,000
Per Capita kg/pp/year Supply: 71.5
Fortifiable Flour Tonnage: 800,000
Export Tonnage: 0
Per Capita kg/pp/year Supply: 78.6
36
4.5 Rwanda
Introduction Rwanda is a small landlocked country in East Africa. It is bordered by the Democratic Republic of Congo (DRC) to the west, Tanzania to the east, Uganda to the north, and Burundi to the south. The 2012 Population and Housing Census put the population of Rwanda to 10.5 million residents, of which 52% are women. Agriculture is the backbone of the Rwandan economy, contributing 32 percent to gross domestic product (GDP). Therefore, the Government of Rwanda (GoR) considers agriculture a major catalyst for growth and poverty reduction. To this end, the GoR has adopted a two-pronged approach to agricultural development, targeting substantial public sector investments along maize value chains and boosting productivity among smallholder farmers through the Crop Intensification Program (USAID 2013). Under this programm maize and wheat production have been observed to have increased six-folds. According to USAID (2013) the potential to increase Rwanda’s maize exports is limited, but increased import substitution is possible. This will likely be more cost-effectively achieved through improved post-harvest handling and storage than through increased production. Consumption Patterns Maize is consumed both green and as maize meal. Two recent estimates of maize meal consumption are available: a 2011 market survey estimated total demand for maize meal to be approximately 90,000 MT. The estimate of fresh (un-milled) maize consumption in 2010/11 was 106,000 MT. This is either steamed or roasted. The quality of flour preferred in Rwanda is like in other East African countries-white refined maize meal is preferred for making stiff porridge for lunch and dinner and light porridge for breakfast. Since maize meal is not a traditional dish of Rwandese, there is no local name for the stiff porridge but use posho which is adopted from Kiswahili. Maize Supply: Grain Production, Exports/Imports Rwanda Development Board (2012) observes that, ten years ago, maize was not a significant crop in Rwanda, but that production has increased substantially during the last five years. This is shown in the chart below. The growth has been driven by an increased emphasis placed by government on maize as a major crop that can underpin national food security. To boost production, new varieties have been introduced, a subsidized inputs program has been implemented, and cultivation patterns have been shifted from mixed cropping to consolidated monoculture. According to Rwanda Development Board (2012), maize is grown throughout the country (despite its limited suitability to conditions in the Northern Province). National production
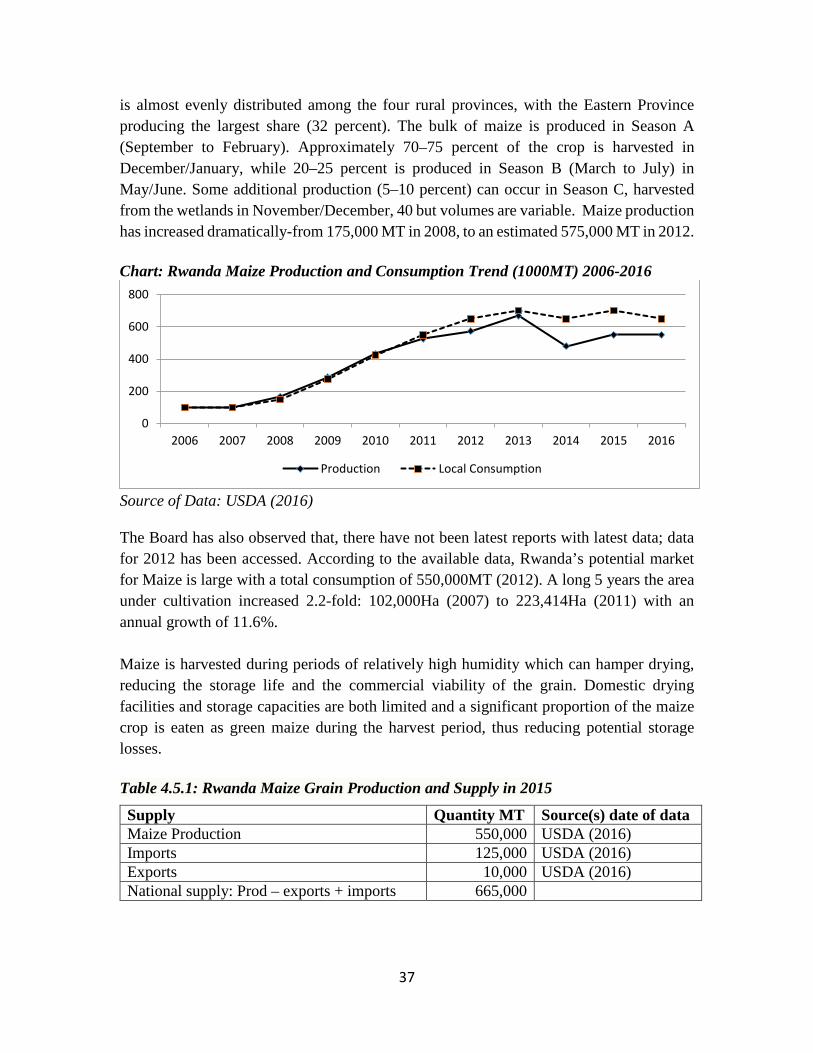
37
is almost evenly distributed among the four rural provinces, with the Eastern Province producing the largest share (32 percent). The bulk of maize is produced in Season A (September to February). Approximately 70–75 percent of the crop is harvested in December/January, while 20–25 percent is produced in Season B (March to July) in May/June. Some additional production (5–10 percent) can occur in Season C, harvested from the wetlands in November/December, 40 but volumes are variable. Maize production has increased dramatically-from 175,000 MT in 2008, to an estimated 575,000 MT in 2012. Chart: Rwanda Maize Production and Consumption Trend (1000MT) 2006-2016
Source of Data: USDA (2016) The Board has also observed that, there have not been latest reports with latest data; data for 2012 has been accessed. According to the available data, Rwanda’s potential market for Maize is large with a total consumption of 550,000MT (2012). A long 5 years the area under cultivation increased 2.2-fold: 102,000Ha (2007) to 223,414Ha (2011) with an annual growth of 11.6%. Maize is harvested during periods of relatively high humidity which can hamper drying, reducing the storage life and the commercial viability of the grain. Domestic drying facilities and storage capacities are both limited and a significant proportion of the maize crop is eaten as green maize during the harvest period, thus reducing potential storage losses. Table 4.5.1: Rwanda Maize Grain Production and Supply in 2015
Supply Quantity MT Source(s) date of data Maize Production 550,000 USDA (2016) Imports 125,000 USDA (2016) Exports 10,000 USDA (2016) National supply: Prod – exports + imports 665,000
0
200
400
600
800
2006 2007 2008 2009 2010 2011 2012 2013 2014 2015 2016
Production Local Consumption
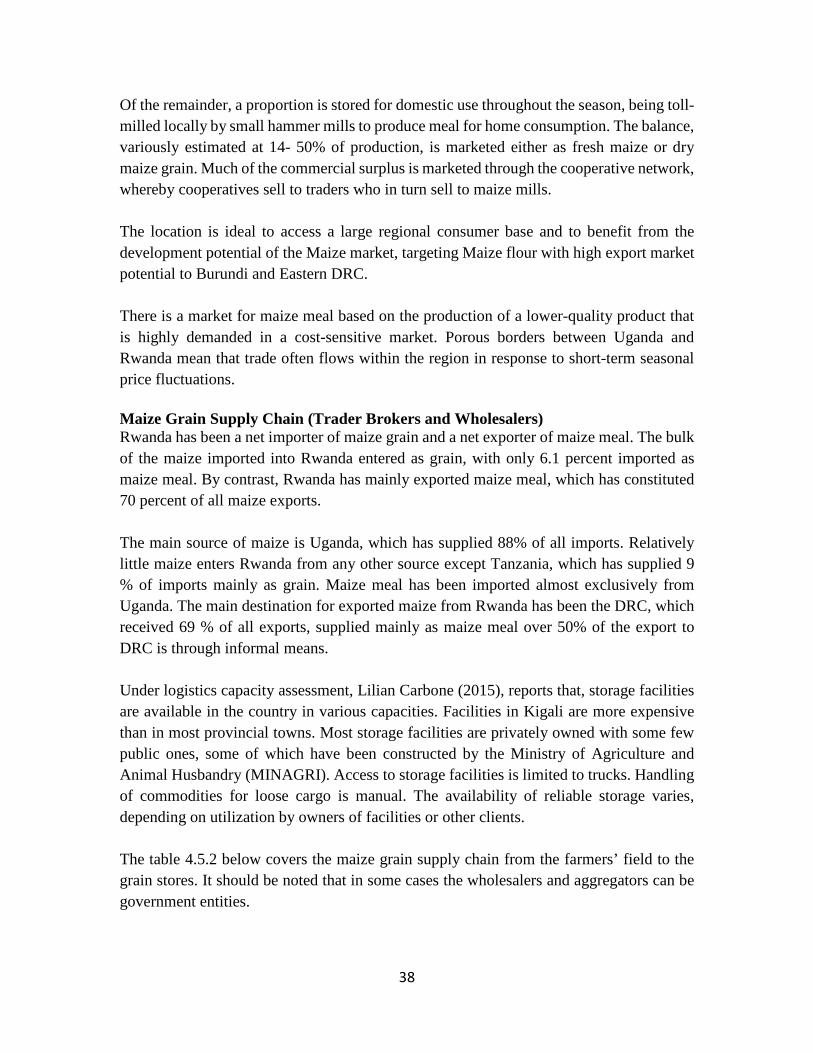
38
Of the remainder, a proportion is stored for domestic use throughout the season, being toll-milled locally by small hammer mills to produce meal for home consumption. The balance, variously estimated at 14- 50% of production, is marketed either as fresh maize or dry maize grain. Much of the commercial surplus is marketed through the cooperative network, whereby cooperatives sell to traders who in turn sell to maize mills. The location is ideal to access a large regional consumer base and to benefit from the development potential of the Maize market, targeting Maize flour with high export market potential to Burundi and Eastern DRC. There is a market for maize meal based on the production of a lower-quality product that is highly demanded in a cost-sensitive market. Porous borders between Uganda and Rwanda mean that trade often flows within the region in response to short-term seasonal price fluctuations. Maize Grain Supply Chain (Trader Brokers and Wholesalers) Rwanda has been a net importer of maize grain and a net exporter of maize meal. The bulk of the maize imported into Rwanda entered as grain, with only 6.1 percent imported as maize meal. By contrast, Rwanda has mainly exported maize meal, which has constituted 70 percent of all maize exports. The main source of maize is Uganda, which has supplied 88% of all imports. Relatively little maize enters Rwanda from any other source except Tanzania, which has supplied 9 % of imports mainly as grain. Maize meal has been imported almost exclusively from Uganda. The main destination for exported maize from Rwanda has been the DRC, which received 69 % of all exports, supplied mainly as maize meal over 50% of the export to DRC is through informal means. Under logistics capacity assessment, Lilian Carbone (2015), reports that, storage facilities are available in the country in various capacities. Facilities in Kigali are more expensive than in most provincial towns. Most storage facilities are privately owned with some few public ones, some of which have been constructed by the Ministry of Agriculture and Animal Husbandry (MINAGRI). Access to storage facilities is limited to trucks. Handling of commodities for loose cargo is manual. The availability of reliable storage varies, depending on utilization by owners of facilities or other clients. The table 4.5.2 below covers the maize grain supply chain from the farmers’ field to the grain stores. It should be noted that in some cases the wholesalers and aggregators can be government entities.
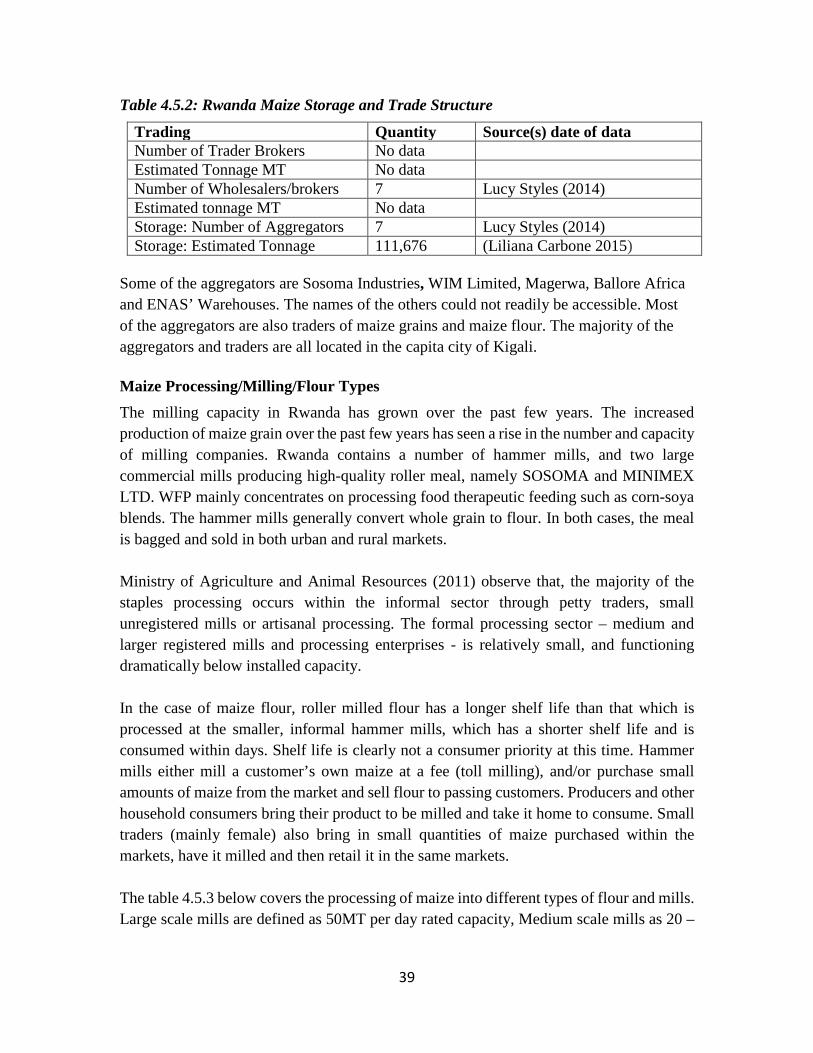
39
Table 4.5.2: Rwanda Maize Storage and Trade Structure
Trading Quantity Source(s) date of data Number of Trader Brokers No data Estimated Tonnage MT No data Number of Wholesalers/brokers 7 Lucy Styles (2014) Estimated tonnage MT No data Storage: Number of Aggregators 7 Lucy Styles (2014) Storage: Estimated Tonnage 111,676 (Liliana Carbone 2015)
Some of the aggregators are Sosoma Industries, WIM Limited, Magerwa, Ballore Africa and ENAS’ Warehouses. The names of the others could not readily be accessible. Most of the aggregators are also traders of maize grains and maize flour. The majority of the aggregators and traders are all located in the capita city of Kigali. Maize Processing/Milling/Flour Types The milling capacity in Rwanda has grown over the past few years. The increased production of maize grain over the past few years has seen a rise in the number and capacity of milling companies. Rwanda contains a number of hammer mills, and two large commercial mills producing high-quality roller meal, namely SOSOMA and MINIMEX LTD. WFP mainly concentrates on processing food therapeutic feeding such as corn-soya blends. The hammer mills generally convert whole grain to flour. In both cases, the meal is bagged and sold in both urban and rural markets. Ministry of Agriculture and Animal Resources (2011) observe that, the majority of the staples processing occurs within the informal sector through petty traders, small unregistered mills or artisanal processing. The formal processing sector – medium and larger registered mills and processing enterprises - is relatively small, and functioning dramatically below installed capacity. In the case of maize flour, roller milled flour has a longer shelf life than that which is processed at the smaller, informal hammer mills, which has a shorter shelf life and is consumed within days. Shelf life is clearly not a consumer priority at this time. Hammer mills either mill a customer’s own maize at a fee (toll milling), and/or purchase small amounts of maize from the market and sell flour to passing customers. Producers and other household consumers bring their product to be milled and take it home to consume. Small traders (mainly female) also bring in small quantities of maize purchased within the markets, have it milled and then retail it in the same markets. The table 4.5.3 below covers the processing of maize into different types of flour and mills. Large scale mills are defined as 50MT per day rated capacity, Medium scale mills as 20 –
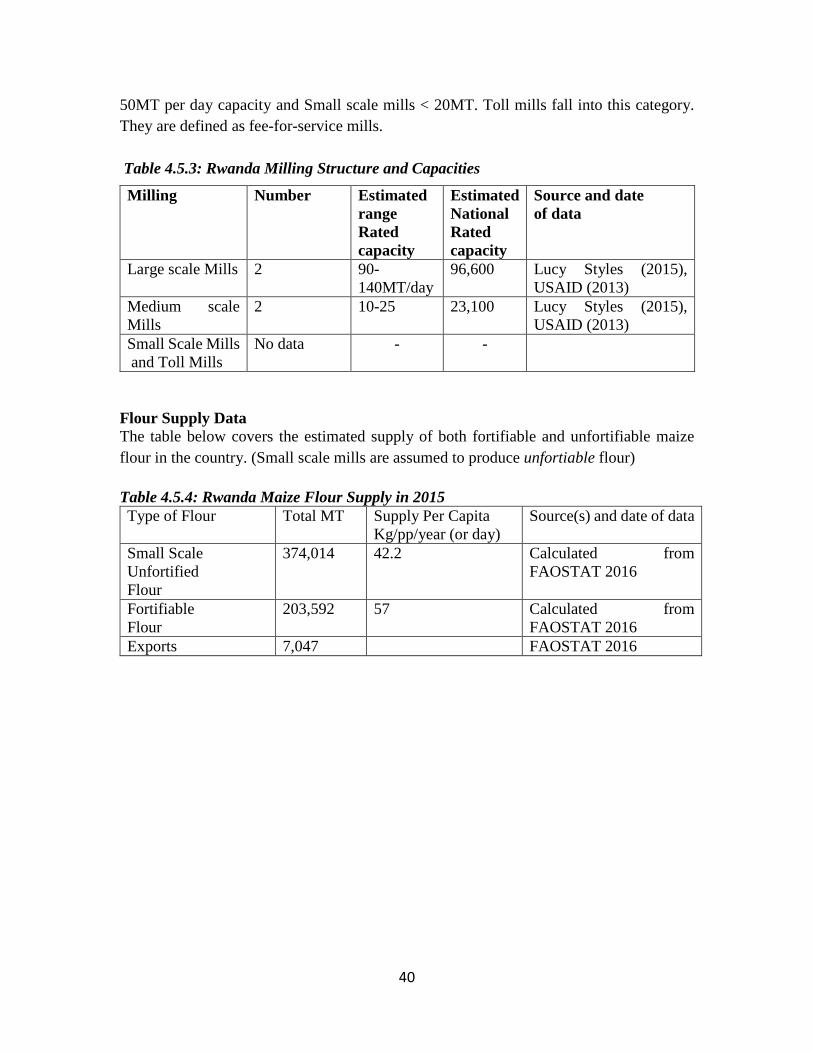
40
50MT per day capacity and Small scale mills < 20MT. Toll mills fall into this category. They are defined as fee-for-service mills. Table 4.5.3: Rwanda Milling Structure and Capacities
Milling Number Estimated range Rated capacity
Estimated National Rated capacity
Source and date of data
Large scale Mills 2 90-140MT/day
96,600 Lucy Styles (2015), USAID (2013)
Medium scale Mills
2 10-25 23,100 Lucy Styles (2015), USAID (2013)
Small Scale Mills and Toll Mills
No data - -
Flour Supply Data The table below covers the estimated supply of both fortifiable and unfortifiable maize flour in the country. (Small scale mills are assumed to produce unfortiable flour) Table 4.5.4: Rwanda Maize Flour Supply in 2015 Type of Flour Total MT Supply Per Capita
Kg/pp/year (or day) Source(s) and date of data
Small Scale Unfortified Flour
374,014 42.2 Calculated from FAOSTAT 2016
Fortifiable Flour
203,592 57 Calculated from FAOSTAT 2016
Exports 7,047 FAOSTAT 2016
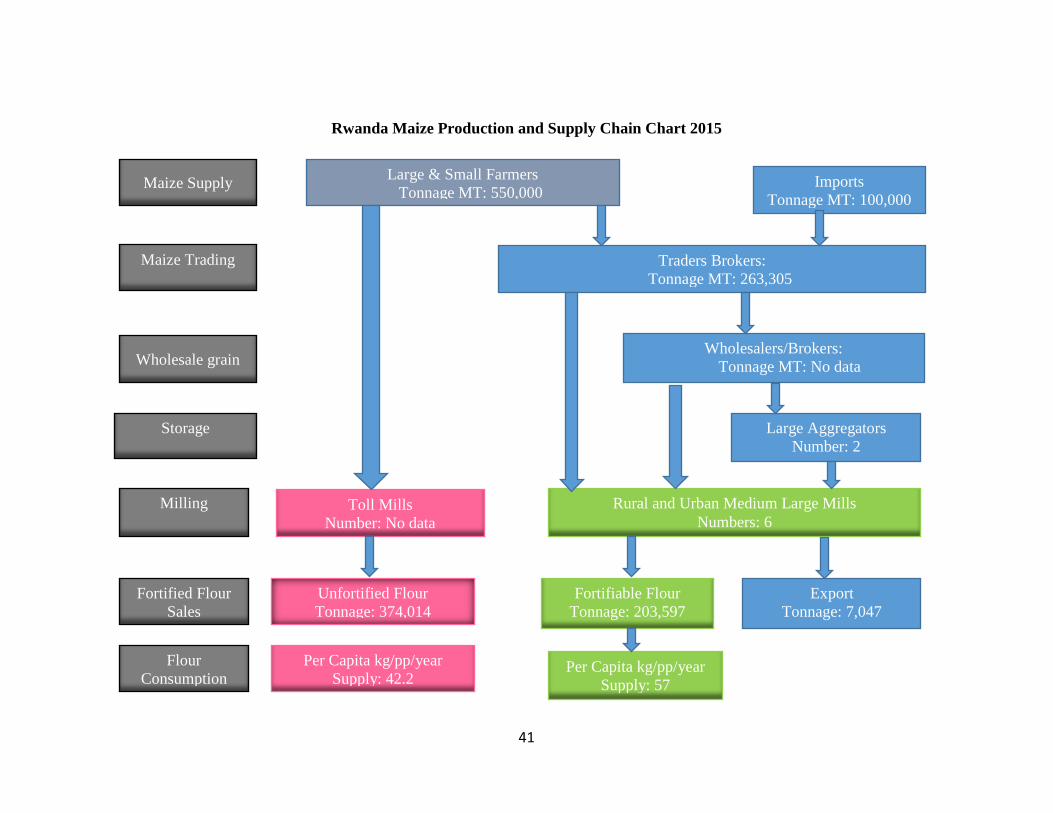
41
Rwanda Maize Production and Supply Chain Chart 2015
Maize Supply Large & Small Farmers Tonnage MT: 550,000
Imports Tonnage MT: 100,000
Maize Trading
Traders Brokers: Tonnage MT: 263,305
Wholesalers/Brokers: Tonnage MT: No data
Wholesale grain
Large Aggregators Number: 2
Storage
Milling
Fortified Flour Sales
Flour Consumption
Toll Mills Number: No data
Rural and Urban Medium Large Mills Numbers: 6
Unfortified Flour Tonnage: 374,014
Per Capita kg/pp/year Supply: 42.2
Fortifiable Flour Tonnage: 203,597
Export Tonnage: 7,047
Per Capita kg/pp/year Supply: 57

42
4.6 Burundi
Introduction Burundi is one of the land-locked countries of east Africa, sharing boarders with Tanzania in the east, DRC and Rwanda in the north. Burundi has a total Population of 9,790,000. Beans, cassava, sweet potatoes, maize and rice constitute the basic staple foods for the majority of the Burundian population. Beans are the main staple crop in Burundi; cassava, sweet potatoes, maize and rice are also very important, the former constituting the main source of protein for most low‐ and middle‐income households (Burundi Price Bulletin December 2015). The production and consumption of maize is on the increase particularly in the urban areas where it is preferred to cassava flour, the traditional Burundian food. USAID (2010) observes that, maize is grown throughout the country. It is primarily a staple food in highland areas with altitudes of over 1,800 meters. Along with beans, maize is also an important staple food in central plateaus area of between 1,300 and 1 800 meters of altitude. It is grown on hills between September and February and in swampy areas in dry seasons. Grown alone, or in association with other annual crops, such as beans, it quickly covers the soil and protects it against deterioration agents. Like other cereals, harvests are limited to cobs allowing the stems, leaves and roots enrich the soil with organic matter and mineral elements. Consumption Pattern Maize plays an important role in ensuring food security, especially in highland areas where it is stored and consumed throughout the year. In times of crises and low production, maize has been the main staple food in dietary habits of most Burundians. Maize flour, for example, is preferred to cassava traditionally consumed in these regions due to its richness in terms of nutrients. Almost all domestic production of maize is consumed by the farmers. Maize is consumed in various forms – grilled or whole, as a cake, or as porridge – especially in urban centres. Over 70% of the maize is consumed as food, and about 10% is used as animal feeds (maize bran). There is also increasing demand of value-added products (maize flour, poultry feeds, etc.) especially in urban centres where maize is gaining importance both as a major food item and for income generation. The consumption trends are shown in the chart below. Maize Supply: Grain Production, Exports/Imports Production is organized at the household level. Maize is harvested, dried and stored in form of cobs, and rarely in form of grain. Apart from drying, there is virtually no treatment of the maize to protect it from spoilage or pests because of lack of finances and availability of chemicals in the country. In these conditions, stocks are attacked and losses are difficult to avoid. Maize is well stored suspended in an aerated place or cribs. Storage in form of
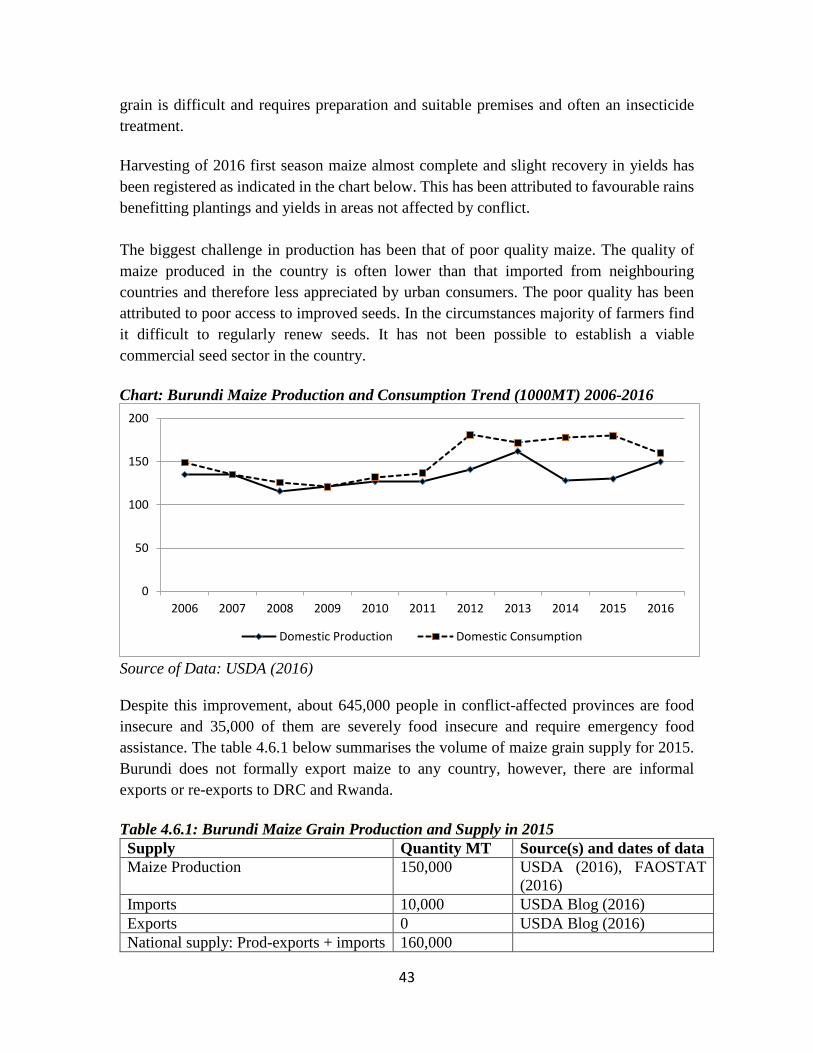
43
grain is difficult and requires preparation and suitable premises and often an insecticide treatment. Harvesting of 2016 first season maize almost complete and slight recovery in yields has been registered as indicated in the chart below. This has been attributed to favourable rains benefitting plantings and yields in areas not affected by conflict. The biggest challenge in production has been that of poor quality maize. The quality of maize produced in the country is often lower than that imported from neighbouring countries and therefore less appreciated by urban consumers. The poor quality has been attributed to poor access to improved seeds. In the circumstances majority of farmers find it difficult to regularly renew seeds. It has not been possible to establish a viable commercial seed sector in the country. Chart: Burundi Maize Production and Consumption Trend (1000MT) 2006-2016
Source of Data: USDA (2016) Despite this improvement, about 645,000 people in conflict-affected provinces are food insecure and 35,000 of them are severely food insecure and require emergency food assistance. The table 4.6.1 below summarises the volume of maize grain supply for 2015. Burundi does not formally export maize to any country, however, there are informal exports or re-exports to DRC and Rwanda. Table 4.6.1: Burundi Maize Grain Production and Supply in 2015 Supply Quantity MT Source(s) and dates of data Maize Production 150,000 USDA (2016), FAOSTAT
(2016) Imports 10,000 USDA Blog (2016) Exports 0 USDA Blog (2016) National supply: Prod-exports + imports 160,000
0
50
100
150
200
2006 2007 2008 2009 2010 2011 2012 2013 2014 2015 2016
Domestic Production Domestic Consumption
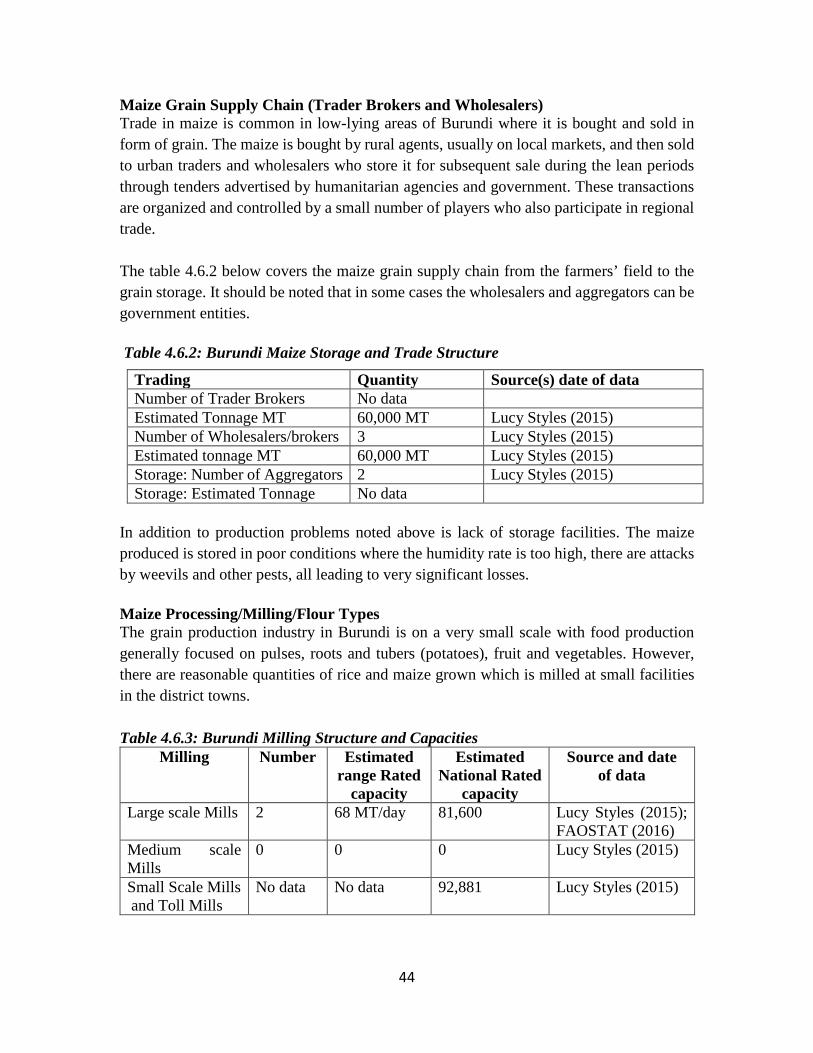
44
Maize Grain Supply Chain (Trader Brokers and Wholesalers) Trade in maize is common in low-lying areas of Burundi where it is bought and sold in form of grain. The maize is bought by rural agents, usually on local markets, and then sold to urban traders and wholesalers who store it for subsequent sale during the lean periods through tenders advertised by humanitarian agencies and government. These transactions are organized and controlled by a small number of players who also participate in regional trade. The table 4.6.2 below covers the maize grain supply chain from the farmers’ field to the grain storage. It should be noted that in some cases the wholesalers and aggregators can be government entities. Table 4.6.2: Burundi Maize Storage and Trade Structure
Trading Quantity Source(s) date of data Number of Trader Brokers No data Estimated Tonnage MT 60,000 MT Lucy Styles (2015) Number of Wholesalers/brokers 3 Lucy Styles (2015) Estimated tonnage MT 60,000 MT Lucy Styles (2015) Storage: Number of Aggregators 2 Lucy Styles (2015) Storage: Estimated Tonnage No data
In addition to production problems noted above is lack of storage facilities. The maize produced is stored in poor conditions where the humidity rate is too high, there are attacks by weevils and other pests, all leading to very significant losses. Maize Processing/Milling/Flour Types The grain production industry in Burundi is on a very small scale with food production generally focused on pulses, roots and tubers (potatoes), fruit and vegetables. However, there are reasonable quantities of rice and maize grown which is milled at small facilities in the district towns. Table 4.6.3: Burundi Milling Structure and Capacities
Milling Number Estimated range Rated
capacity
Estimated National Rated
capacity
Source and date of data
Large scale Mills 2 68 MT/day 81,600 Lucy Styles (2015); FAOSTAT (2016)
Medium scale Mills
0 0 0 Lucy Styles (2015)
Small Scale Mills and Toll Mills
No data No data 92,881 Lucy Styles (2015)
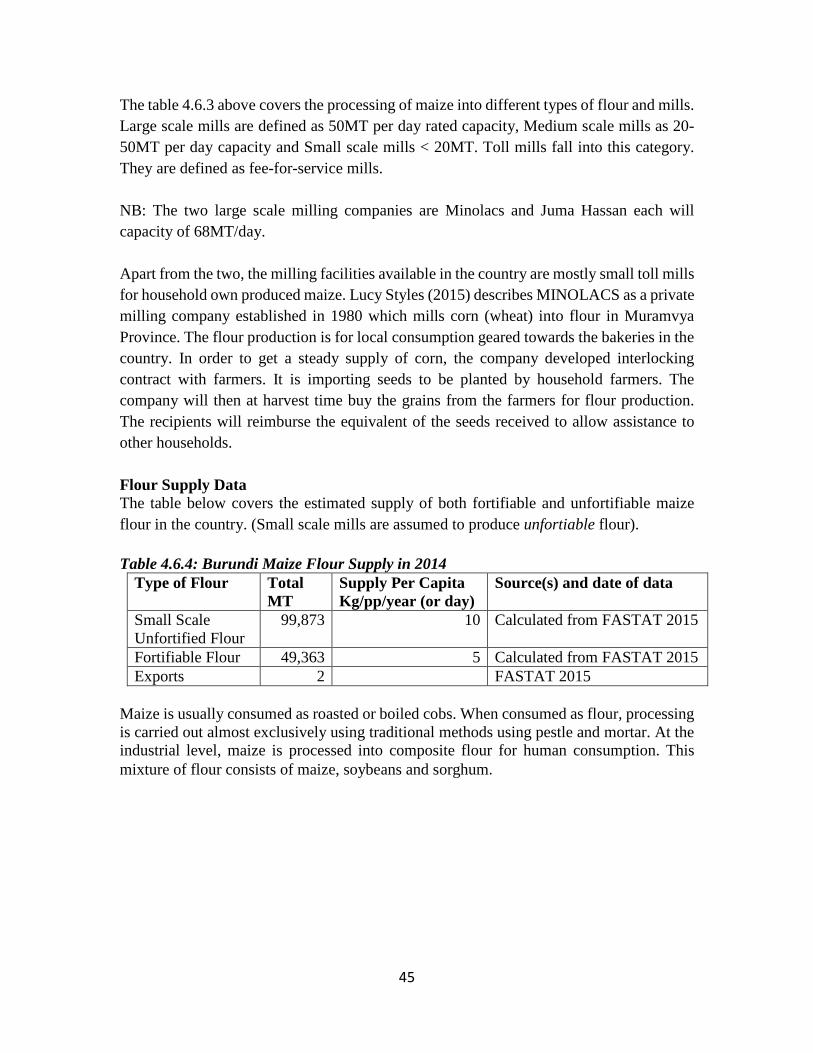
45
The table 4.6.3 above covers the processing of maize into different types of flour and mills. Large scale mills are defined as 50MT per day rated capacity, Medium scale mills as 20- 50MT per day capacity and Small scale mills < 20MT. Toll mills fall into this category. They are defined as fee-for-service mills. NB: The two large scale milling companies are Minolacs and Juma Hassan each will capacity of 68MT/day. Apart from the two, the milling facilities available in the country are mostly small toll mills for household own produced maize. Lucy Styles (2015) describes MINOLACS as a private milling company established in 1980 which mills corn (wheat) into flour in Muramvya Province. The flour production is for local consumption geared towards the bakeries in the country. In order to get a steady supply of corn, the company developed interlocking contract with farmers. It is importing seeds to be planted by household farmers. The company will then at harvest time buy the grains from the farmers for flour production. The recipients will reimburse the equivalent of the seeds received to allow assistance to other households. Flour Supply Data The table below covers the estimated supply of both fortifiable and unfortifiable maize flour in the country. (Small scale mills are assumed to produce unfortiable flour). Table 4.6.4: Burundi Maize Flour Supply in 2014
Type of Flour Total MT
Supply Per Capita Kg/pp/year (or day)
Source(s) and date of data
Small Scale Unfortified Flour
99,873 10 Calculated from FASTAT 2015
Fortifiable Flour 49,363 5 Calculated from FASTAT 2015 Exports 2 FASTAT 2015
Maize is usually consumed as roasted or boiled cobs. When consumed as flour, processing is carried out almost exclusively using traditional methods using pestle and mortar. At the industrial level, maize is processed into composite flour for human consumption. This mixture of flour consists of maize, soybeans and sorghum.
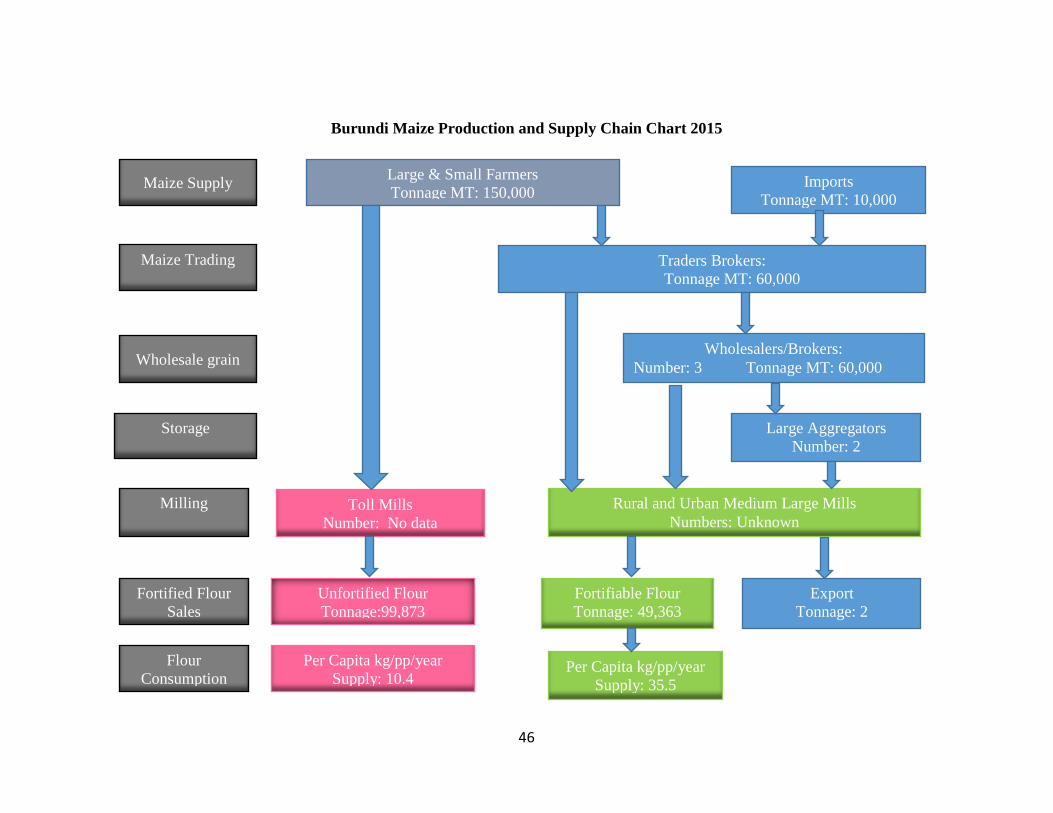
46
Burundi Maize Production and Supply Chain Chart 2015
Maize Supply Large & Small Farmers Tonnage MT: 150,000
Imports Tonnage MT: 10,000
Maize Trading
Traders Brokers: Tonnage MT: 60,000
Wholesalers/Brokers: Number: 3 Tonnage MT: 60,000 Wholesale grain
Large Aggregators Number: 2
Storage
Milling
Fortified Flour Sales
Flour Consumption
Toll Mills Number: No data
Rural and Urban Medium Large Mills Numbers: Unknown
Unfortified Flour Tonnage:99,873
Per Capita kg/pp/year Supply: 10.4
Fortifiable Flour Tonnage: 49,363
Export Tonnage: 2
Per Capita kg/pp/year Supply: 35.5
47
4.7 Tanzania
Introduction The United Republic of Tanzania is situated on the east coast of Africa. It is the largest of the East African countries with a total area of 945,078 km2 (364,900 sq. miles). It is bordered by Kenya and Uganda to the north, Rwanda, Burundi, and the Democratic Republic of the Congo to the west, and Zambia, Malawi, and Mozambique to the south. The country's eastern borders lie on the Indian. The population in 2014 was 50.76 million and increasing by an average of about 3 % per annum (FAOSTAT, 2015). While Tanzania remains a low-income country, it has experienced relatively stable growth in recent decades, accelerating from 3.5% in the 1990s to approximately 7 percent in the 2000s. Agriculture accounts for 45 percent of Tanzania’s GDP, as well as the livelihoods of some 80 percent of the country’s population (WFP 2012). While Tanzania’s food self-sufficiency has ranged from 88 to 112 percent over the past 8 years, localized food deficits are rampant. Among African countries, Tanzania has some of the highest levels of malnutrition. Approximately 42 percent of children under five suffer from malnutrition and stunting (WFP 2012). Consumption Patterns Tanzanian cuisine is incredibly varied (as you might expect from a place with over 120 different ethnic groups), but there’s one food you’ll see almost anywhere you travel in the country: Ugali. Between 85 to 90 percent of Tanzania’s population, about 40 million people, eat maize. Of the 6.5 million MT produced in 2011, between 3 and 4 million MT would have been marketed. Producers and their families ate the rest. The distribution of maize consumption within Tanzania is more evenly than the distribution of production. Transport is consequently crucial to the smooth operation of the value chain. Maize is consumed in all regions in Tanzania. The main staple food is “ugali” which is a stiff porridge traditionally made from course ground or hand pounded maize or sorghum or cassava flour, but is now made from refined flour. The most common side dish accompanying ugali is cooked green leafy vegetables. Frequency of vegetable consumption is high, especially among the poor rural communities compared to urban and wealthy households. Nearly 400 grams of maize are consumed per day per person in Tanzania; average national consumption is estimated to be over three million metric tons per year (FAOSTAT, 2014). Maize contributes about 34- 36 % of the average daily calorie intake. Maize is consumed in a variety of ways: thin porridge or stiff porridge locally known as ugali. Green (fresh) maize is either boiled or roasted on its cob and is served as a snack. Pop-corn is also a popular snack in Tanzania.
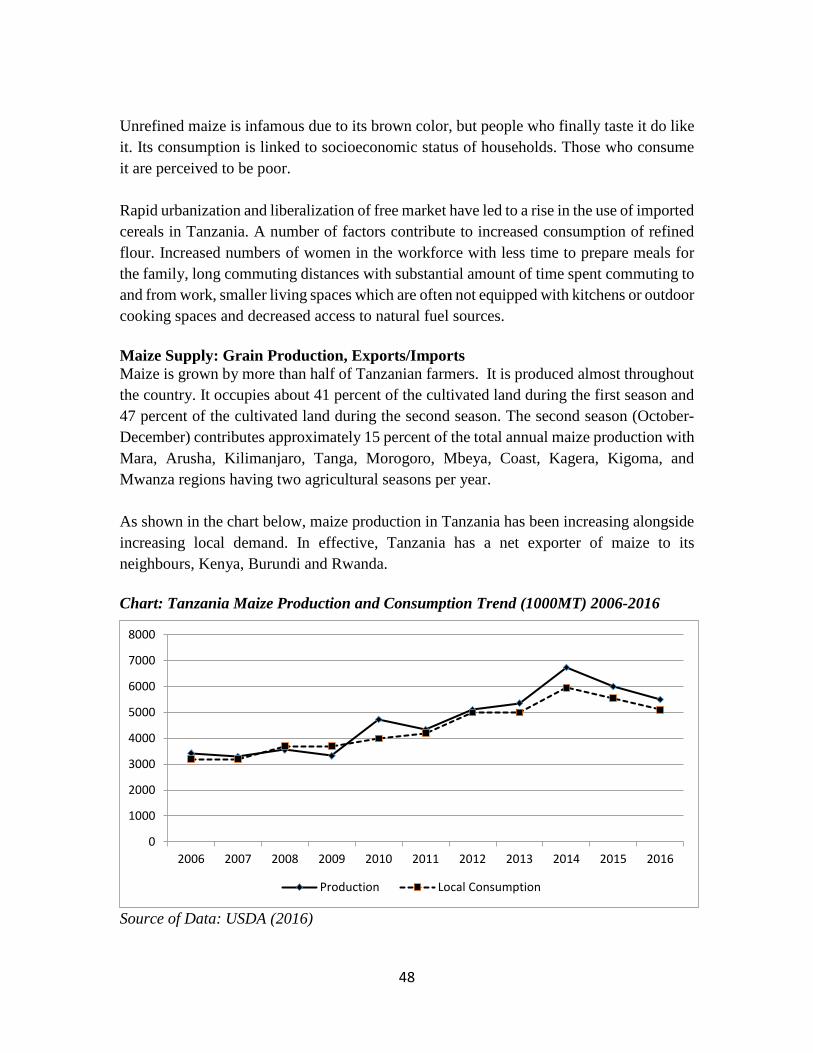
48
Unrefined maize is infamous due to its brown color, but people who finally taste it do like it. Its consumption is linked to socioeconomic status of households. Those who consume it are perceived to be poor. Rapid urbanization and liberalization of free market have led to a rise in the use of imported cereals in Tanzania. A number of factors contribute to increased consumption of refined flour. Increased numbers of women in the workforce with less time to prepare meals for the family, long commuting distances with substantial amount of time spent commuting to and from work, smaller living spaces which are often not equipped with kitchens or outdoor cooking spaces and decreased access to natural fuel sources. Maize Supply: Grain Production, Exports/Imports Maize is grown by more than half of Tanzanian farmers. It is produced almost throughout the country. It occupies about 41 percent of the cultivated land during the first season and 47 percent of the cultivated land during the second season. The second season (October-December) contributes approximately 15 percent of the total annual maize production with Mara, Arusha, Kilimanjaro, Tanga, Morogoro, Mbeya, Coast, Kagera, Kigoma, and Mwanza regions having two agricultural seasons per year. As shown in the chart below, maize production in Tanzania has been increasing alongside increasing local demand. In effective, Tanzania has a net exporter of maize to its neighbours, Kenya, Burundi and Rwanda. Chart: Tanzania Maize Production and Consumption Trend (1000MT) 2006-2016
Source of Data: USDA (2016)
0
1000
2000
3000
4000
5000
6000
7000
8000
2006 2007 2008 2009 2010 2011 2012 2013 2014 2015 2016
Production Local Consumption
49
In 2015, 4.3 million MT of the expected 6 million MT of maize was harvested in Tanzania. With per capita consumption of 128kg/year of maize, the 40 million people required 4,080 million MT. Smallholders produce over 95 percent of Tanzania’s maize. Of the 6,734,000 MT produced in 2014, 114,100 MT was exported (Wilson and Lewis 2015). Approximately 12,000 MT was imported and 73,800 MT was reserved for next season's seed. The price of maize in Tanzania has been increasing since April 2016. The factors driving the price upwards are not clear. Data prepared by the Regional Agricultural Trade Intelligence Network (Ratin) shows that a 90-kg bag of maize currently retails at Sh4,898 in Dar es Salaam, the highest unit price in East Africa. The same quantity of maize currently fetches between Sh2, 500 to Sh3, 510 in Nairobi, an average of Sh2, 661 in Kampala and Sh4, 597 in Burundi. The Ratin report shows that the majority of Kenyan farmers are opting to ferry their produce all the way to Dar es Salaam in search of higher returns. This comes just one day after Kenya millers warned that the price of maize flour would increase in coming weeks following a grain shortage, putting pressure on households that depend on the cereal as a major source of food. It has not been possible to access data for cross border trade in maize for Tanzania. The table 4.7.1 below presents the production, exports and imports of maize in 2014 which had a bumper harvest as opposed to 2015 season. Table 4.7.1: Tanzania Maize Grain Production and Supply in 2015
Supply Quantity MT Source(s) and date of data Maize Production 6,734,000 FAO 2015 Wilson and Lewis (2015) Imports 12,000 Wilson and Lewis (2015) Exports 114,100 Wilson and Lewis (2015) National supply Prod – exports + imports
6,631,900
Overall maize production has grown at an annual rate of 4.6 % over last 25 years. Maize production in Tanzania falls under four main categories. The smallholder farmers (<10ha) produce 85%, community farms (50-100ha) contribute 5%, large farms of over 100ha produce 5% and large private and public farms 5% of the total local supply. Due to low rains during the main planting season of 2015, only 5million of the expected 6 million was harvested.
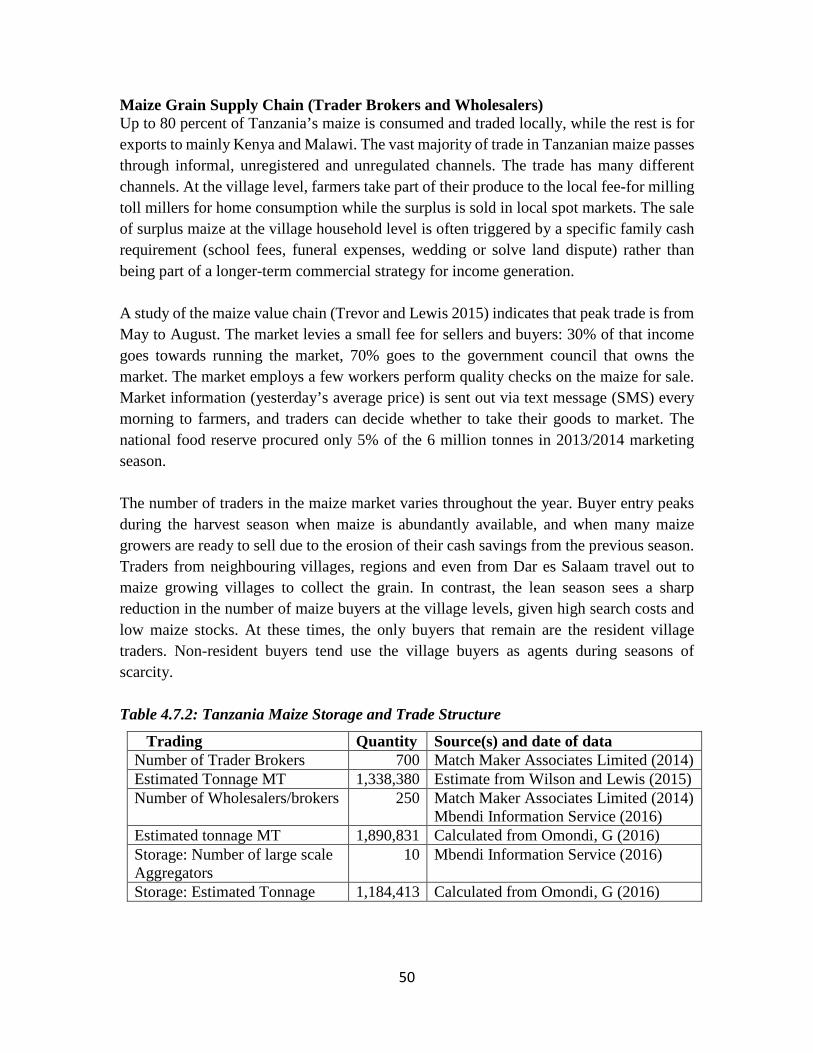
50
Maize Grain Supply Chain (Trader Brokers and Wholesalers) Up to 80 percent of Tanzania’s maize is consumed and traded locally, while the rest is for exports to mainly Kenya and Malawi. The vast majority of trade in Tanzanian maize passes through informal, unregistered and unregulated channels. The trade has many different channels. At the village level, farmers take part of their produce to the local fee-for milling toll millers for home consumption while the surplus is sold in local spot markets. The sale of surplus maize at the village household level is often triggered by a specific family cash requirement (school fees, funeral expenses, wedding or solve land dispute) rather than being part of a longer-term commercial strategy for income generation. A study of the maize value chain (Trevor and Lewis 2015) indicates that peak trade is from May to August. The market levies a small fee for sellers and buyers: 30% of that income goes towards running the market, 70% goes to the government council that owns the market. The market employs a few workers perform quality checks on the maize for sale. Market information (yesterday’s average price) is sent out via text message (SMS) every morning to farmers, and traders can decide whether to take their goods to market. The national food reserve procured only 5% of the 6 million tonnes in 2013/2014 marketing season. The number of traders in the maize market varies throughout the year. Buyer entry peaks during the harvest season when maize is abundantly available, and when many maize growers are ready to sell due to the erosion of their cash savings from the previous season. Traders from neighbouring villages, regions and even from Dar es Salaam travel out to maize growing villages to collect the grain. In contrast, the lean season sees a sharp reduction in the number of maize buyers at the village levels, given high search costs and low maize stocks. At these times, the only buyers that remain are the resident village traders. Non-resident buyers tend use the village buyers as agents during seasons of scarcity. Table 4.7.2: Tanzania Maize Storage and Trade Structure
Trading Quantity Source(s) and date of data Number of Trader Brokers 700 Match Maker Associates Limited (2014) Estimated Tonnage MT 1,338,380 Estimate from Wilson and Lewis (2015) Number of Wholesalers/brokers 250 Match Maker Associates Limited (2014)
Mbendi Information Service (2016) Estimated tonnage MT 1,890,831 Calculated from Omondi, G (2016) Storage: Number of large scale Aggregators
10 Mbendi Information Service (2016)
Storage: Estimated Tonnage 1,184,413 Calculated from Omondi, G (2016)
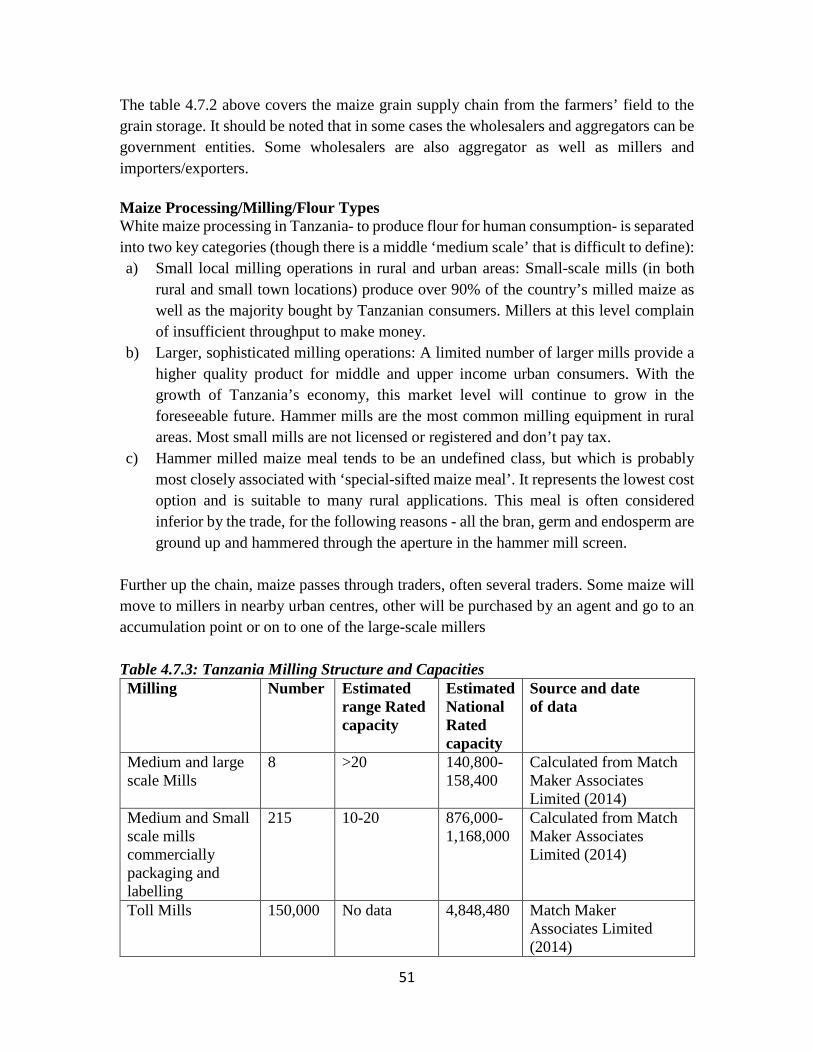
51
The table 4.7.2 above covers the maize grain supply chain from the farmers’ field to the grain storage. It should be noted that in some cases the wholesalers and aggregators can be government entities. Some wholesalers are also aggregator as well as millers and importers/exporters. Maize Processing/Milling/Flour Types White maize processing in Tanzania- to produce flour for human consumption- is separated into two key categories (though there is a middle ‘medium scale’ that is difficult to define): a) Small local milling operations in rural and urban areas: Small-scale mills (in both
rural and small town locations) produce over 90% of the country’s milled maize as well as the majority bought by Tanzanian consumers. Millers at this level complain of insufficient throughput to make money.
b) Larger, sophisticated milling operations: A limited number of larger mills provide a higher quality product for middle and upper income urban consumers. With the growth of Tanzania’s economy, this market level will continue to grow in the foreseeable future. Hammer mills are the most common milling equipment in rural areas. Most small mills are not licensed or registered and don’t pay tax.
c) Hammer milled maize meal tends to be an undefined class, but which is probably most closely associated with ‘special-sifted maize meal’. It represents the lowest cost option and is suitable to many rural applications. This meal is often considered inferior by the trade, for the following reasons - all the bran, germ and endosperm are ground up and hammered through the aperture in the hammer mill screen.
Further up the chain, maize passes through traders, often several traders. Some maize will move to millers in nearby urban centres, other will be purchased by an agent and go to an accumulation point or on to one of the large-scale millers Table 4.7.3: Tanzania Milling Structure and Capacities Milling Number Estimated
range Rated capacity
Estimated National Rated capacity
Source and date of data
Medium and large scale Mills
8 >20 140,800-158,400
Calculated from Match Maker Associates Limited (2014)
Medium and Small scale mills commercially packaging and labelling
215 10-20 876,000-1,168,000
Calculated from Match Maker Associates Limited (2014)
Toll Mills 150,000 No data 4,848,480 Match Maker Associates Limited (2014)
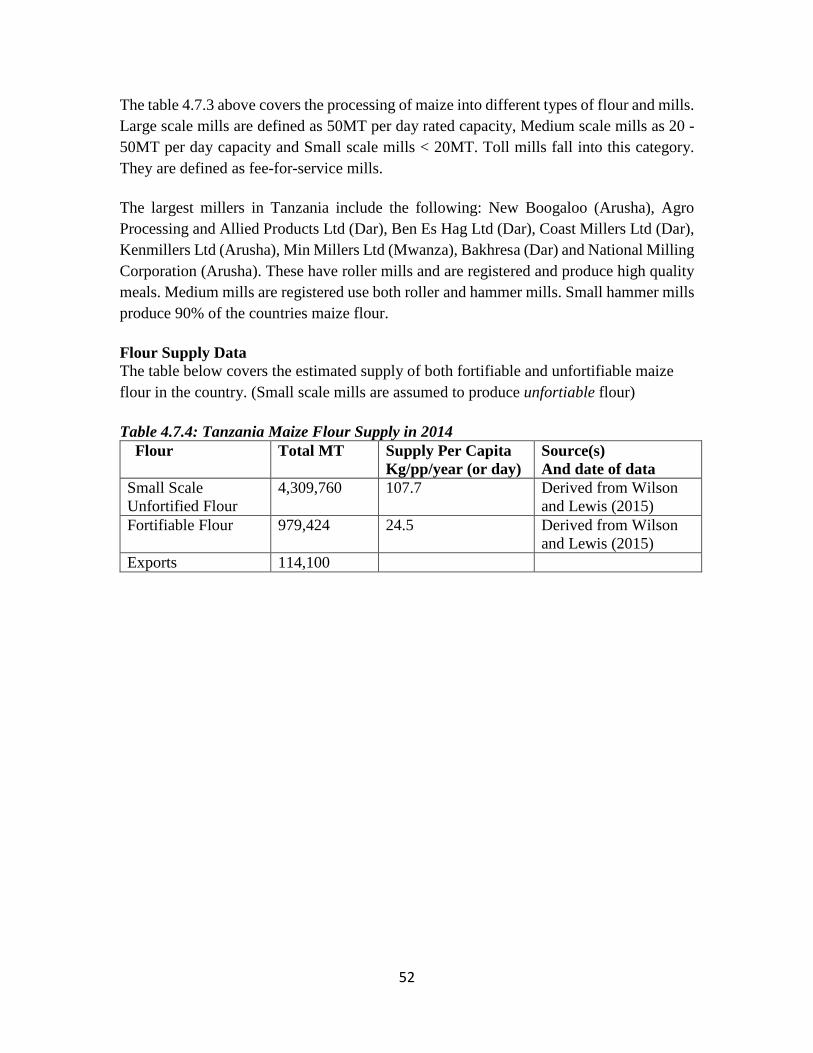
52
The table 4.7.3 above covers the processing of maize into different types of flour and mills. Large scale mills are defined as 50MT per day rated capacity, Medium scale mills as 20 - 50MT per day capacity and Small scale mills < 20MT. Toll mills fall into this category. They are defined as fee-for-service mills. The largest millers in Tanzania include the following: New Boogaloo (Arusha), Agro Processing and Allied Products Ltd (Dar), Ben Es Hag Ltd (Dar), Coast Millers Ltd (Dar), Kenmillers Ltd (Arusha), Min Millers Ltd (Mwanza), Bakhresa (Dar) and National Milling Corporation (Arusha). These have roller mills and are registered and produce high quality meals. Medium mills are registered use both roller and hammer mills. Small hammer mills produce 90% of the countries maize flour. Flour Supply Data The table below covers the estimated supply of both fortifiable and unfortifiable maize flour in the country. (Small scale mills are assumed to produce unfortiable flour) Table 4.7.4: Tanzania Maize Flour Supply in 2014 Flour Total MT Supply Per Capita
Kg/pp/year (or day) Source(s) And date of data
Small Scale Unfortified Flour
4,309,760 107.7 Derived from Wilson and Lewis (2015)
Fortifiable Flour 979,424 24.5 Derived from Wilson and Lewis (2015)
Exports 114,100

53
Tanzania Maize Production and Supply Chain Chart 2014
Maize Supply Large & Small Farmers Tonnage MT: 6,734,000
Imports Tonnage MT: 12,000
Maize Trading
Traders Brokers: Number: 700 Tonnage MT: 1,338,380
Wholesalers/Brokers: Number: 250 Tonnage MT: 1,890,831 Wholesale grain
Large Aggregators Number: 11
Storage
Milling
Fortified Flour Sales
Flour Consumption
Toll Mills Number: 154,000
Rural and Urban Medium Large Mills Numbers: 96
Unfortified Flour Tonnage: 4,309,760
Per Capita kg/pp/year Supply: 107.7
Fortifiable Flour Tonnage: 979,424
Export Tonnage: 114,100
Per Capita kg/pp/year Supply: 24.5
54
4.8 Kenya
Introduction A country in East Africa, the Republic of Kenya borders Tanzania to the south, Uganda to the west, and Ethiopia to the north. Kenya's climate is as varied as the land areas. Typically, there are two rainy seasons. The highest amount of rainfall occurs in April and the least rainfall occurs in January. The evenings in the Central Highlands can be quite chilly and the coastal areas are usually hot and humid. The current population is Kenya is estimated to be 44.2 million with annual growth rate of 2.7%. Maize is the key food crop in Kenya, constituting 3% of Kenya’s Gross Domestic Product (GDP), 12% of the agricultural GDP and 21% of the total value of primary agricultural commodities. Maize is both a subsistence and a commercial crop, grown on an estimated at 1.4 million hectares by large-scale farmers (25%) and smallholders (75%). Consumption Staple foods consist mainly of corn, maize, potatoes, and beans. Ugali (a porridge made of maize) providing roughly a third of the caloric intake for Kenya and meat are typically eaten inland, while the coastal peoples eat a more varied diet. Maize is also the central crop in Kenyan agriculture, being grown by 98% of Kenya smallholder farmers (Karimi 2011). Ugali is a semi-hard cake made of maize (corn) flour or millet flour. It's a favourite meal for all Kenyans and usually accompanies fish, meat, nyama choma, meat stews, sukuma wiki or other vegetable. The current per capita consumption per year has reduced to 75 kilograms of maize down from 98kilograms about 10 years ago. This reduction is attributed to increasing urban population which prefers other foods such as wheat and rice to maize. At the same time, maize prices in Kenya are among the highest in sub-Saharan Africa, and the poorest quarter of the population spends 28 percent of its income on the crop (ACDI/VOCA 2015). Maize meal consumption patterns in urban areas appear to largely reflect the influence of food policies that have affected the relative convenience and affordability of sifted flour in relation to posho flour. Throughout much of Eastern and Southern Africa urban consumers have an inherent and rigid preference for refined maize meal. Maize Supply: Grain Production, Exports/Imports Maize is the main diet for a majority of Kenyans and is therefore produced in almost all parts of the country and by an overwhelming majority of rural households. Maize is central to Kenya's agriculture & food security. It provides >1/3 of caloric intake and accounts for about 56% of cultivated land in Kenya. Small- and medium-scale sector produces about
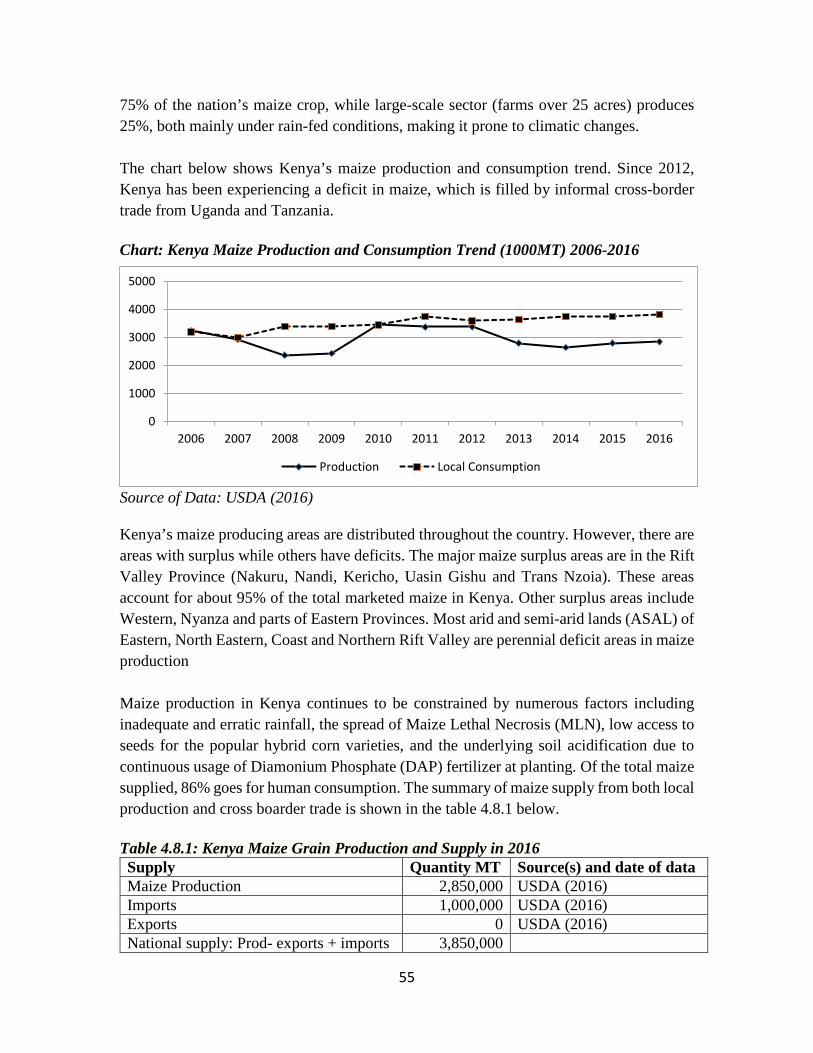
55
75% of the nation’s maize crop, while large-scale sector (farms over 25 acres) produces 25%, both mainly under rain-fed conditions, making it prone to climatic changes. The chart below shows Kenya’s maize production and consumption trend. Since 2012, Kenya has been experiencing a deficit in maize, which is filled by informal cross-border trade from Uganda and Tanzania. Chart: Kenya Maize Production and Consumption Trend (1000MT) 2006-2016
Source of Data: USDA (2016) Kenya’s maize producing areas are distributed throughout the country. However, there are areas with surplus while others have deficits. The major maize surplus areas are in the Rift Valley Province (Nakuru, Nandi, Kericho, Uasin Gishu and Trans Nzoia). These areas account for about 95% of the total marketed maize in Kenya. Other surplus areas include Western, Nyanza and parts of Eastern Provinces. Most arid and semi-arid lands (ASAL) of Eastern, North Eastern, Coast and Northern Rift Valley are perennial deficit areas in maize production Maize production in Kenya continues to be constrained by numerous factors including inadequate and erratic rainfall, the spread of Maize Lethal Necrosis (MLN), low access to seeds for the popular hybrid corn varieties, and the underlying soil acidification due to continuous usage of Diamonium Phosphate (DAP) fertilizer at planting. Of the total maize supplied, 86% goes for human consumption. The summary of maize supply from both local production and cross boarder trade is shown in the table 4.8.1 below. Table 4.8.1: Kenya Maize Grain Production and Supply in 2016 Supply Quantity MT Source(s) and date of data Maize Production 2,850,000 USDA (2016) Imports 1,000,000 USDA (2016) Exports 0 USDA (2016) National supply: Prod- exports + imports 3,850,000
0
1000
2000
3000
4000
5000
2006 2007 2008 2009 2010 2011 2012 2013 2014 2015 2016
Production Local Consumption
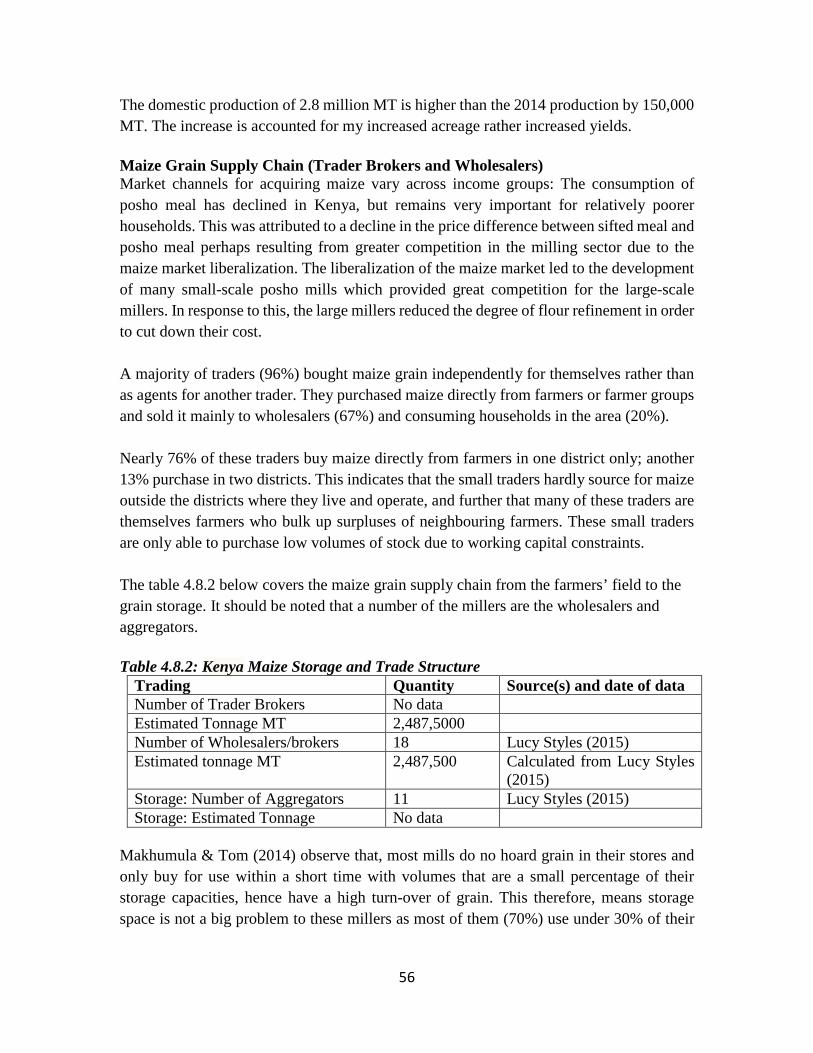
56
The domestic production of 2.8 million MT is higher than the 2014 production by 150,000 MT. The increase is accounted for my increased acreage rather increased yields. Maize Grain Supply Chain (Trader Brokers and Wholesalers) Market channels for acquiring maize vary across income groups: The consumption of posho meal has declined in Kenya, but remains very important for relatively poorer households. This was attributed to a decline in the price difference between sifted meal and posho meal perhaps resulting from greater competition in the milling sector due to the maize market liberalization. The liberalization of the maize market led to the development of many small-scale posho mills which provided great competition for the large-scale millers. In response to this, the large millers reduced the degree of flour refinement in order to cut down their cost. A majority of traders (96%) bought maize grain independently for themselves rather than as agents for another trader. They purchased maize directly from farmers or farmer groups and sold it mainly to wholesalers (67%) and consuming households in the area (20%). Nearly 76% of these traders buy maize directly from farmers in one district only; another 13% purchase in two districts. This indicates that the small traders hardly source for maize outside the districts where they live and operate, and further that many of these traders are themselves farmers who bulk up surpluses of neighbouring farmers. These small traders are only able to purchase low volumes of stock due to working capital constraints. The table 4.8.2 below covers the maize grain supply chain from the farmers’ field to the grain storage. It should be noted that a number of the millers are the wholesalers and aggregators. Table 4.8.2: Kenya Maize Storage and Trade Structure
Trading Quantity Source(s) and date of data Number of Trader Brokers No data Estimated Tonnage MT 2,487,5000 Number of Wholesalers/brokers 18 Lucy Styles (2015) Estimated tonnage MT 2,487,500 Calculated from Lucy Styles
(2015) Storage: Number of Aggregators 11 Lucy Styles (2015) Storage: Estimated Tonnage No data
Makhumula & Tom (2014) observe that, most mills do no hoard grain in their stores and only buy for use within a short time with volumes that are a small percentage of their storage capacities, hence have a high turn-over of grain. This therefore, means storage space is not a big problem to these millers as most of them (70%) use under 30% of their
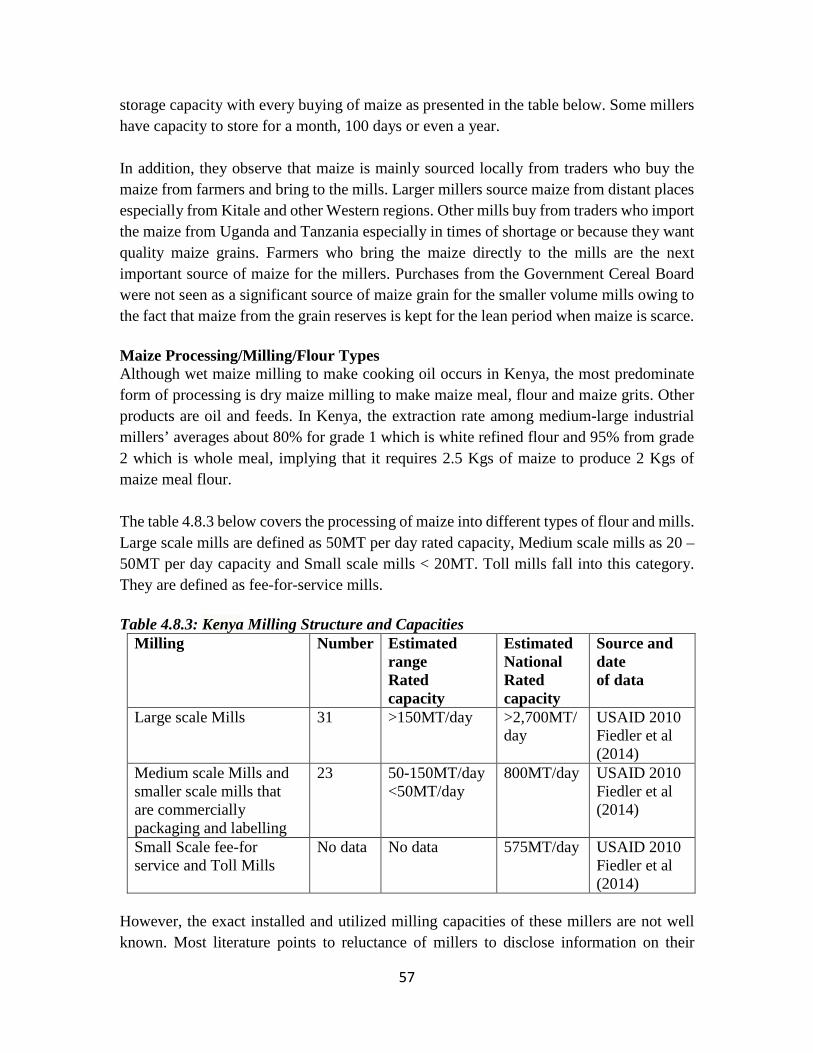
57
storage capacity with every buying of maize as presented in the table below. Some millers have capacity to store for a month, 100 days or even a year. In addition, they observe that maize is mainly sourced locally from traders who buy the maize from farmers and bring to the mills. Larger millers source maize from distant places especially from Kitale and other Western regions. Other mills buy from traders who import the maize from Uganda and Tanzania especially in times of shortage or because they want quality maize grains. Farmers who bring the maize directly to the mills are the next important source of maize for the millers. Purchases from the Government Cereal Board were not seen as a significant source of maize grain for the smaller volume mills owing to the fact that maize from the grain reserves is kept for the lean period when maize is scarce. Maize Processing/Milling/Flour Types Although wet maize milling to make cooking oil occurs in Kenya, the most predominate form of processing is dry maize milling to make maize meal, flour and maize grits. Other products are oil and feeds. In Kenya, the extraction rate among medium-large industrial millers’ averages about 80% for grade 1 which is white refined flour and 95% from grade 2 which is whole meal, implying that it requires 2.5 Kgs of maize to produce 2 Kgs of maize meal flour. The table 4.8.3 below covers the processing of maize into different types of flour and mills. Large scale mills are defined as 50MT per day rated capacity, Medium scale mills as 20 – 50MT per day capacity and Small scale mills < 20MT. Toll mills fall into this category. They are defined as fee-for-service mills. Table 4.8.3: Kenya Milling Structure and Capacities
Milling Number Estimated range Rated capacity
Estimated National Rated capacity
Source and date of data
Large scale Mills 31 >150MT/day >2,700MT/day
USAID 2010 Fiedler et al (2014)
Medium scale Mills and smaller scale mills that are commercially packaging and labelling
23 50-150MT/day <50MT/day
800MT/day USAID 2010 Fiedler et al (2014)
Small Scale fee-for service and Toll Mills
No data No data 575MT/day USAID 2010 Fiedler et al (2014)
However, the exact installed and utilized milling capacities of these millers are not well known. Most literature points to reluctance of millers to disclose information on their
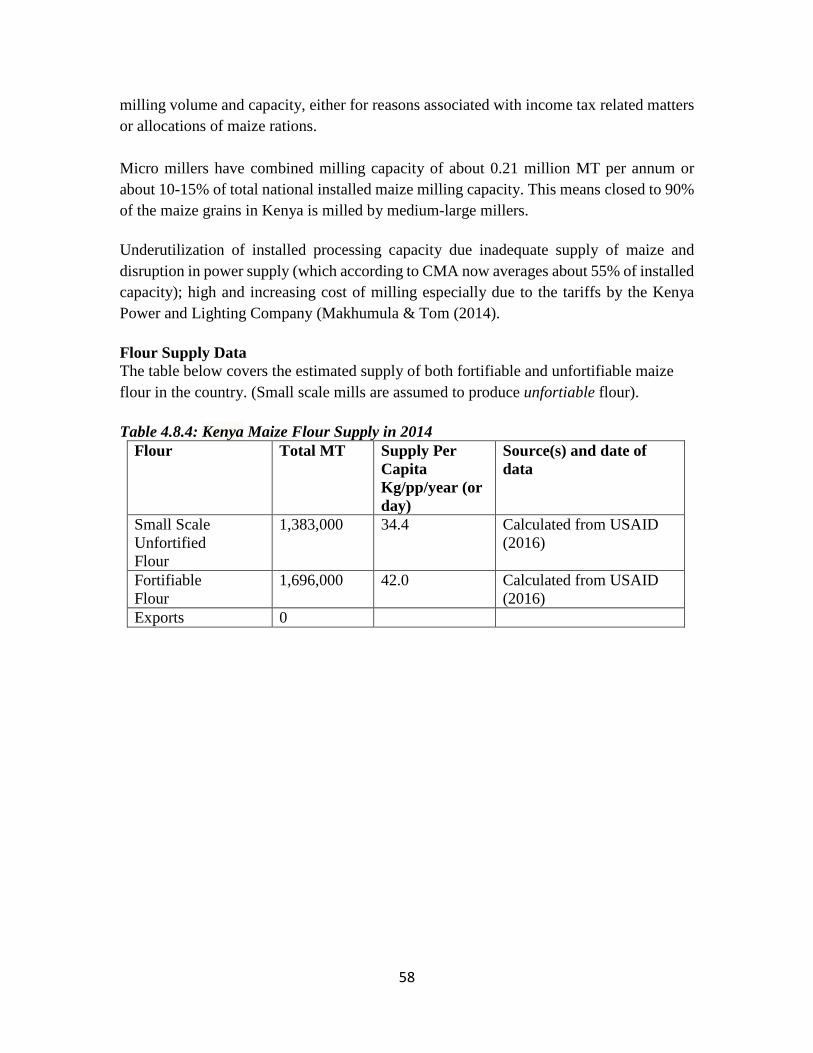
58
milling volume and capacity, either for reasons associated with income tax related matters or allocations of maize rations. Micro millers have combined milling capacity of about 0.21 million MT per annum or about 10-15% of total national installed maize milling capacity. This means closed to 90% of the maize grains in Kenya is milled by medium-large millers. Underutilization of installed processing capacity due inadequate supply of maize and disruption in power supply (which according to CMA now averages about 55% of installed capacity); high and increasing cost of milling especially due to the tariffs by the Kenya Power and Lighting Company (Makhumula & Tom (2014). Flour Supply Data The table below covers the estimated supply of both fortifiable and unfortifiable maize flour in the country. (Small scale mills are assumed to produce unfortiable flour). Table 4.8.4: Kenya Maize Flour Supply in 2014
Flour Total MT Supply Per Capita Kg/pp/year (or day)
Source(s) and date of data
Small Scale Unfortified Flour
1,383,000 34.4 Calculated from USAID (2016)
Fortifiable Flour
1,696,000 42.0 Calculated from USAID (2016)
Exports 0
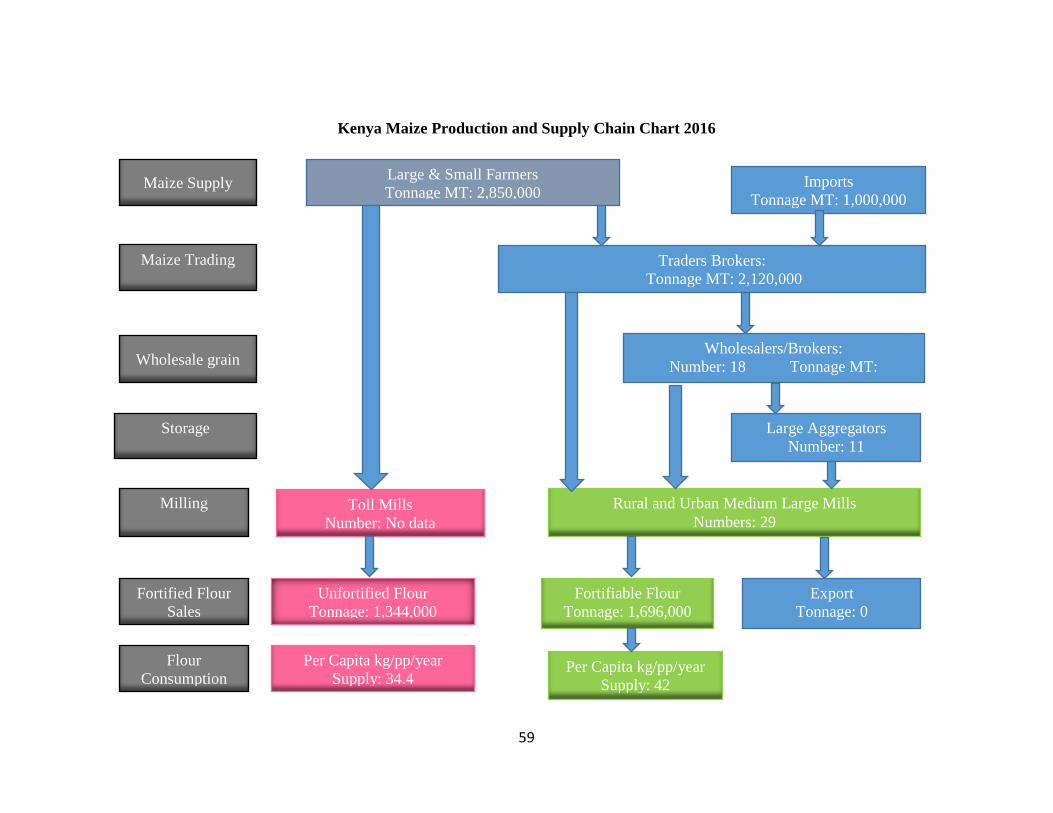
59
Kenya Maize Production and Supply Chain Chart 2016
Maize Supply Large & Small Farmers Tonnage MT: 2,850,000
Imports Tonnage MT: 1,000,000
Maize Trading
Traders Brokers: Tonnage MT: 2,120,000
Wholesalers/Brokers: Number: 18 Tonnage MT:
Wholesale grain
Large Aggregators Number: 11
Storage
Milling
Fortified Flour Sales
Flour Consumption
Toll Mills Number: No data
Rural and Urban Medium Large Mills Numbers: 29
Unfortified Flour Tonnage: 1,344,000
Per Capita kg/pp/year Supply: 34.4
Fortifiable Flour Tonnage: 1,696,000
Export Tonnage: 0
Per Capita kg/pp/year Supply: 42
60
4.9 Uganda
Introduction Uganda is the main source of staple food commodities in Eastern Africa, contributing 70% of the regions’ total exports. These exports consist primarily of significant grain sales to Kenya, Rwanda, the DRC, and South Sudan. In 2011, Uganda’s formal export earnings increased by 33.4% to US$2,159 million, while informal exports declined 32.6 percent to US$360 million. The biggest market for informal exports was the DRC, which accounted for 35.4 percent of total, followed by South Sudan (23.5 percent), Kenya (19.5 percent), Rwanda (9.9 percent), Tanzania (8.1 percent), and Burundi (3.5 percent). Due to the rising urbanization, a change in consumption patterns and the agility of smallholders to diversify into maize production as a commercial crop, maize production is growing in importance as well as consumption. Consumption Patterns While maize has been grown for a long time in Uganda, nonetheless, unlike in neighbouring countries (Kenya, Tanzania, etc), it does not form a major part of the population’s traditional diet, but is grown primarily for income generation, rather than for food security. However, the growing cost of traditional staple foods (such as bananas) has had the impact of increasing maize consumption, especially in urban areas. Kampala alone accounts for about 50% of formal trade in maize. The domestic market for maize in Uganda is estimated at 350,000 - 400,000 metric tonnes per annum (USAID 2010). In 2007, domestic consumption remained at 400,000 MT out of a national availability average of approximately 638,000 MT (USAID, 2010). Maize is consumed in various forms – green maize grilled or whole, as a cake or as porridge known as ugali- especially in urban centres. Over 70% of the maize is consumed as food, and about 10% is used as animal feeds (maize bran). There is also increasing demand of value-added products (pop corns, etc) especially in urban centres where maize is gaining importance both as a major food item and for income generation. Maize Supply: Grain Production, Exports/Imports The adoption of maize as a major commercial crop has been rapid in eastern Uganda in the districts of Kapchorwa, Mbale and Iganga as well as western districts of Masindi and Kasese where on average smallholders’ 75-95% household production is marketed. Maize is also a growing export commodity for Uganda within the sub-region (Kenya, Sudan, Rwanda, Burundi, Zambia and DR. Congo) with Kenya being the largest Uganda’s maize export destination. However, like all other EAC member states, maize yields in Uganda are generally low attributable to limited use of agricultural inputs. Farmers’ inputs have barely changed in the century; with the only inputs being family labour, the hand hoe and
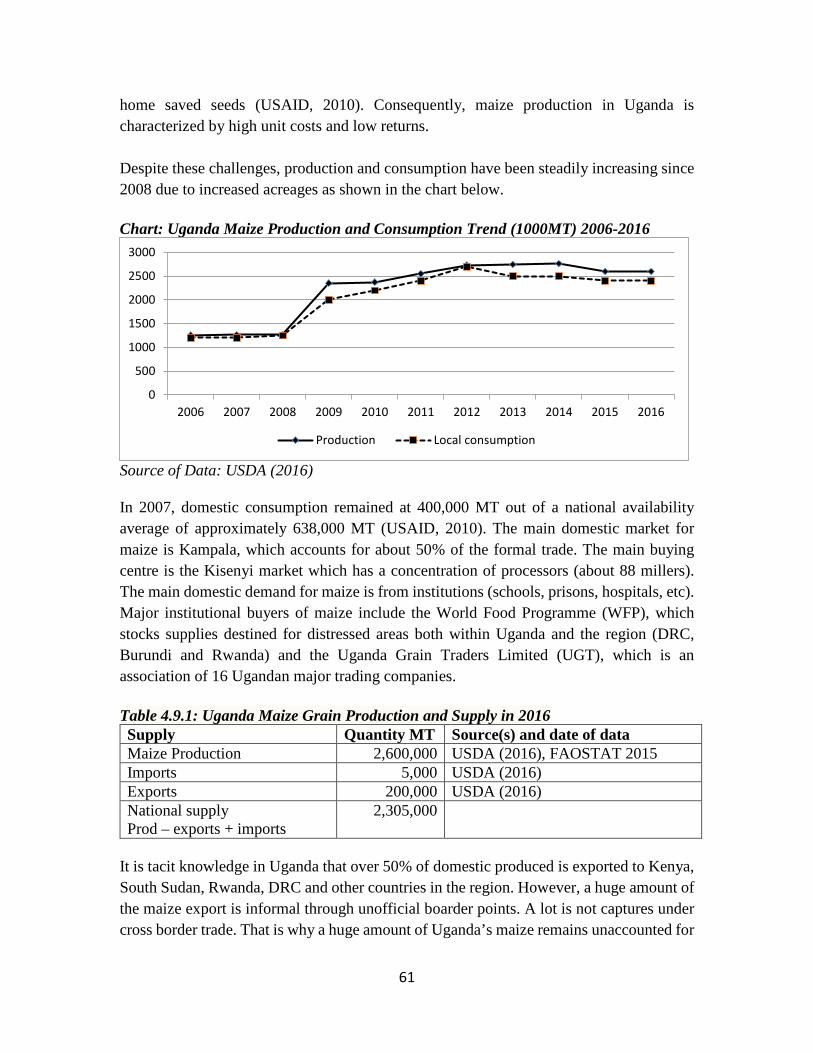
61
home saved seeds (USAID, 2010). Consequently, maize production in Uganda is characterized by high unit costs and low returns. Despite these challenges, production and consumption have been steadily increasing since 2008 due to increased acreages as shown in the chart below. Chart: Uganda Maize Production and Consumption Trend (1000MT) 2006-2016
Source of Data: USDA (2016) In 2007, domestic consumption remained at 400,000 MT out of a national availability average of approximately 638,000 MT (USAID, 2010). The main domestic market for maize is Kampala, which accounts for about 50% of the formal trade. The main buying centre is the Kisenyi market which has a concentration of processors (about 88 millers). The main domestic demand for maize is from institutions (schools, prisons, hospitals, etc). Major institutional buyers of maize include the World Food Programme (WFP), which stocks supplies destined for distressed areas both within Uganda and the region (DRC, Burundi and Rwanda) and the Uganda Grain Traders Limited (UGT), which is an association of 16 Ugandan major trading companies. Table 4.9.1: Uganda Maize Grain Production and Supply in 2016 Supply Quantity MT Source(s) and date of data Maize Production 2,600,000 USDA (2016), FAOSTAT 2015 Imports 5,000 USDA (2016) Exports 200,000 USDA (2016) National supply Prod – exports + imports
2,305,000
It is tacit knowledge in Uganda that over 50% of domestic produced is exported to Kenya, South Sudan, Rwanda, DRC and other countries in the region. However, a huge amount of the maize export is informal through unofficial boarder points. A lot is not captures under cross border trade. That is why a huge amount of Uganda’s maize remains unaccounted for
0
500
1000
1500
2000
2500
3000
2006 2007 2008 2009 2010 2011 2012 2013 2014 2015 2016
Production Local consumption
62
in the date. This doe not only apply to Uganda but similar experiences are all over the region where boarder points are porous and businesses are informal and bent to evade taxation. Maize Grain Supply Chain (Trader Brokers and Wholesalers) The transactions involved in the marketing of maize are complex but the main channels for the commodity flow include (i) from farmer (farm gate) to agents/traders/village markets in rural areas; (ii) from rural markets to secondary markets in regional towns such as Iganga, Bugiri and Sironko; (iii) from urban markets to major buying centers outside the district and (iv) the export market. Each one of these channels involves a number of key players. The table 4.9.2 below covers the maize grain supply chain from the farmers’ field to the grain storage. It should be noted that in some cases the wholesalers and aggregators can be government entities. As reflected in the table below, a number of large scale traders and exporters of maize have emerged over the years. The main ones include: the World Food Programme, (ii) the Uganda Grain Traders (UGT), (iii) the Masindi Seed and Grain Growers Association (MSGGA), and (iv) the Uganda National Farmers Federation (UNFFE). Table 4.9.2: Uganda Maize Storage and Trade Structure Trading Quantity Source(s) of data Number of Trader Brokers 7 Agribusiness directory (2016) Estimated Tonnage MT No data Number of Wholesalers/brokers 4 USAID 2010, Agribusiness directory
(2016) Estimated tonnage MT No data Storage: Number of Aggregators
7 Lucy Styles (2014), Agribusiness directory (2016)
Storage: Estimated Tonnage No data Maize Processing/Milling/Flour Types The maize grown and traded undergoes some level of value addition – conversion of maize grain into flour and a variety of other by-products, such as bran and germ. The principle players in this value chain are the processors/ millers, grouped into three categories, namely: small-scale millers, medium-scale millers and large-scale millers. Majority of the processors/millers fall under the small-scale category and they are scattered in various rural trading centres in the districts, carrying out primarily customised milling. They operate hammer mills of less than 10 tonnes per day, mainly on a contract basis. These mills are often of poorly designed and can, therefore, only produce “whole grain” nutritious maize flour, often referred to as “No.2. The medium-scale processors are based mainly in town centres-the district capitals and offer both contract and trade-based milling services to
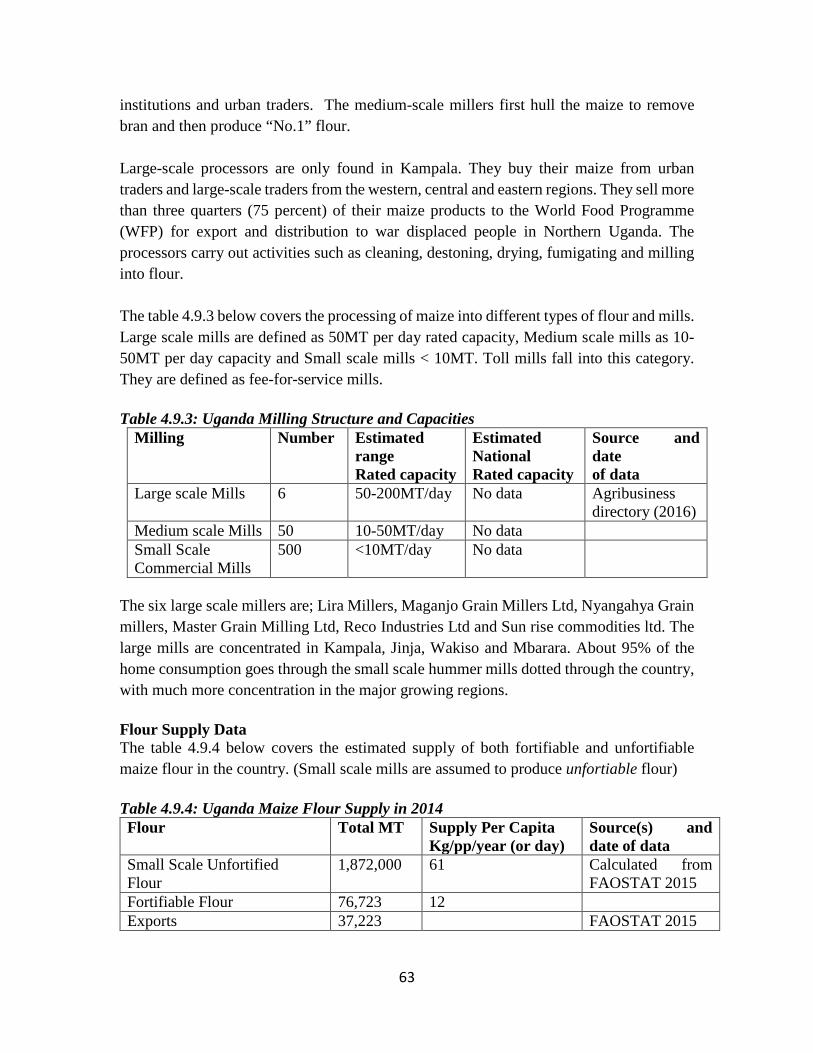
63
institutions and urban traders. The medium-scale millers first hull the maize to remove bran and then produce “No.1” flour. Large-scale processors are only found in Kampala. They buy their maize from urban traders and large-scale traders from the western, central and eastern regions. They sell more than three quarters (75 percent) of their maize products to the World Food Programme (WFP) for export and distribution to war displaced people in Northern Uganda. The processors carry out activities such as cleaning, destoning, drying, fumigating and milling into flour. The table 4.9.3 below covers the processing of maize into different types of flour and mills. Large scale mills are defined as 50MT per day rated capacity, Medium scale mills as 10- 50MT per day capacity and Small scale mills < 10MT. Toll mills fall into this category. They are defined as fee-for-service mills. Table 4.9.3: Uganda Milling Structure and Capacities
Milling Number Estimated range Rated capacity
Estimated National Rated capacity
Source and date of data
Large scale Mills 6 50-200MT/day No data Agribusiness directory (2016)
Medium scale Mills 50 10-50MT/day No data Small Scale Commercial Mills
500 <10MT/day No data
The six large scale millers are; Lira Millers, Maganjo Grain Millers Ltd, Nyangahya Grain millers, Master Grain Milling Ltd, Reco Industries Ltd and Sun rise commodities ltd. The large mills are concentrated in Kampala, Jinja, Wakiso and Mbarara. About 95% of the home consumption goes through the small scale hummer mills dotted through the country, with much more concentration in the major growing regions. Flour Supply Data The table 4.9.4 below covers the estimated supply of both fortifiable and unfortifiable maize flour in the country. (Small scale mills are assumed to produce unfortiable flour) Table 4.9.4: Uganda Maize Flour Supply in 2014 Flour Total MT Supply Per Capita
Kg/pp/year (or day) Source(s) and date of data
Small Scale Unfortified Flour
1,872,000 61 Calculated from FAOSTAT 2015
Fortifiable Flour 76,723 12 Exports 37,223 FAOSTAT 2015
64
Data on volumes of internal maize flour distribution and consumption is not readily available on line and not accessible from the stakeholders from primary sources.

65
Uganda Maize Production and Supply Chain Chart 2016
Maize Supply Large & Small Farmers Tonnage MT: 2,600,000
Imports Tonnage MT: 5,000
Maize Trading
Traders Brokers: Number: 7 Tonnage MT: 142,433
Wholesalers/Brokers: Number: 4 Tonnage MT: No data
Wholesale grain
Large Aggregators Number: 7
Storage
Milling
Fortified Flour Sales
Flour Consumption
Toll Mills Number: No data
Rural and Urban Medium Large Mills Numbers: 14
Unfortified Flour Tonnage: 1,872,6000
Per Capita kg/pp/year Supply: 61
Fortifiable Flour Tonnage: 76,723
Export Tonnage: 37,223
Per Capita kg/pp/year Supply:12
66
4.10 Mozambique
Introduction Mozambique, which gained independence from Portugal in 1975, is still suffering from the effects of a 16-year civil war that ended in 1992. But despite recent economic growth, more than half of Mozambique's 24.7 million people continue to live below the poverty line. Mozambique is located along the Indian Ocean coastline of southern Africa and covers over 799,380 Km2 hectares, including over 36 million hectares of arable land. The recent population census indicates that over 70% of Mozambique’s population lives in rural areas, and that population is growing. In Mozambique, over 90% of the population relies on agriculture for their livelihood. Maize is, along with cassava, one of the most important crops in the country and accounts for about 80% of the total grain production each year. About three quarters of Mozambique’s smallholder farmers grow maize, and 99% of all maize producers are smallholders with an average farm plot of 1.5 hectares. Consumption Patterns Nationally, cassava, maize, and rice serve as the major food staples in Mozambique, followed by wheat and millet. Maize consumption forms 22% of calorific intakes of Mozambicans, which is less compared to 36% for cassava. However, in terms of shares of expenditure of urban consumers, maize takes 13.4% and cassava 10.9% of the expenditure allocation of urban households. In Mozambique, maize flour is widely consumed in form of Xima across the social spectrum. The food consumption study conducted in 2010 indicated that 86.2% of the women of child-bearing age and 71.6% of the children in urban areas consume Xima. While xima can be made from a variety of bases including dried cassava and legumes, there is an undeniable national preference for maize meal. Mozambican consumers, both urban and rural, tend to shift their consumption based on the relative prices of the main staples. Xima (also called massa or nsima) is a type of porridge made with water and corn flour. The process of making xima actually begins from the field, where dried corn is picked, shucked, and left to soak. The hardened kernels are soaked for two days, and then laid out to dry. Once dried, they are brought to the mill, ground into powder, and laid out (again) to dry in the sun finally, after three days of labour, the corn flour is ready to be made into xima. Maize Supply: Grain Production, Exports/Imports Heavy rains in January caused flooding in central provinces, negatively impacting on crops and food security conditions. Floods followed a period of below-average rains in October and November 2014 that delayed planting of 2015 cereal crop, to be harvested from March/April 2015. Overall national maize supplies are favourable, on account of 2014
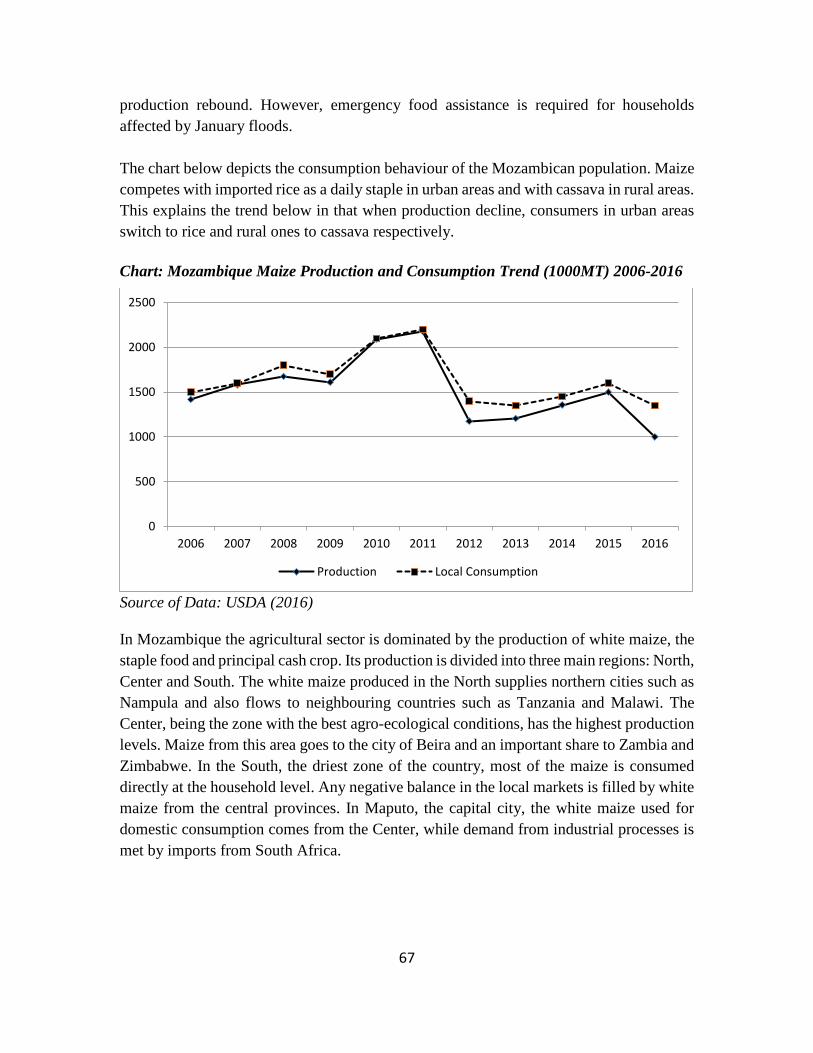
67
production rebound. However, emergency food assistance is required for households affected by January floods. The chart below depicts the consumption behaviour of the Mozambican population. Maize competes with imported rice as a daily staple in urban areas and with cassava in rural areas. This explains the trend below in that when production decline, consumers in urban areas switch to rice and rural ones to cassava respectively. Chart: Mozambique Maize Production and Consumption Trend (1000MT) 2006-2016
Source of Data: USDA (2016) In Mozambique the agricultural sector is dominated by the production of white maize, the staple food and principal cash crop. Its production is divided into three main regions: North, Center and South. The white maize produced in the North supplies northern cities such as Nampula and also flows to neighbouring countries such as Tanzania and Malawi. The Center, being the zone with the best agro-ecological conditions, has the highest production levels. Maize from this area goes to the city of Beira and an important share to Zambia and Zimbabwe. In the South, the driest zone of the country, most of the maize is consumed directly at the household level. Any negative balance in the local markets is filled by white maize from the central provinces. In Maputo, the capital city, the white maize used for domestic consumption comes from the Center, while demand from industrial processes is met by imports from South Africa.
0
500
1000
1500
2000
2500
2006 2007 2008 2009 2010 2011 2012 2013 2014 2015 2016
Production Local Consumption
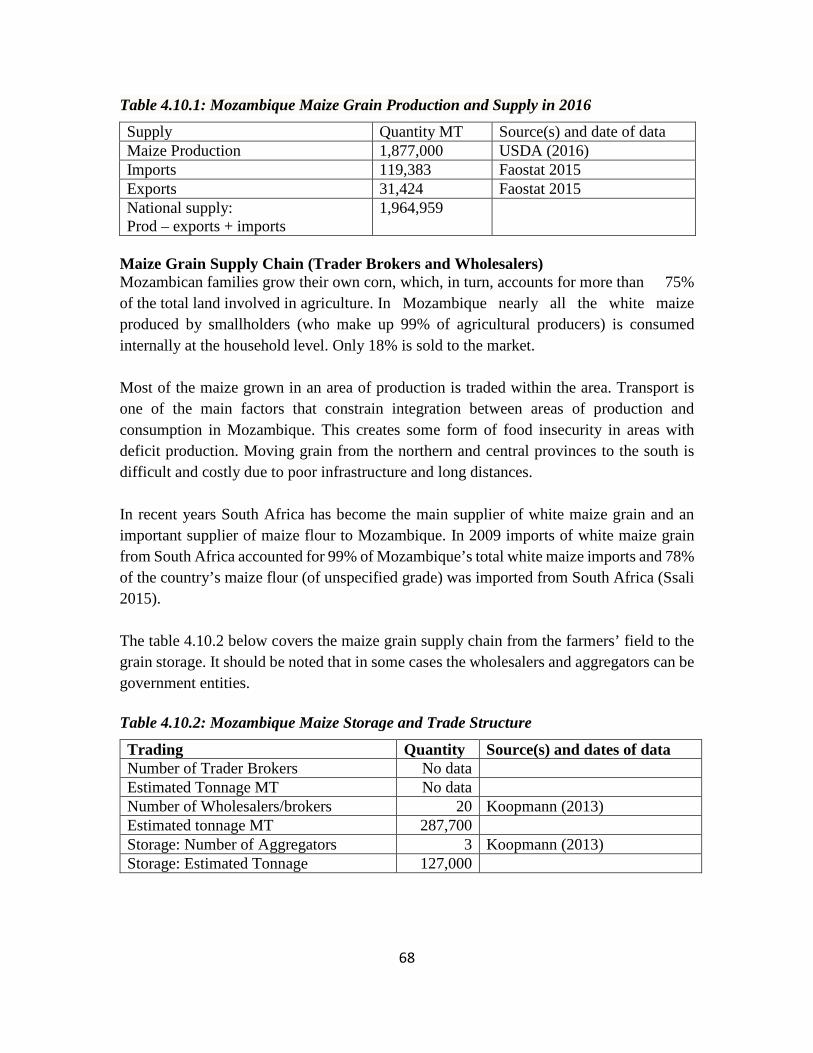
68
Table 4.10.1: Mozambique Maize Grain Production and Supply in 2016
Supply Quantity MT Source(s) and date of data Maize Production 1,877,000 USDA (2016) Imports 119,383 Faostat 2015 Exports 31,424 Faostat 2015 National supply: Prod – exports + imports
1,964,959
Maize Grain Supply Chain (Trader Brokers and Wholesalers) Mozambican families grow their own corn, which, in turn, accounts for more than 75% of the total land involved in agriculture. In Mozambique nearly all the white maize produced by smallholders (who make up 99% of agricultural producers) is consumed internally at the household level. Only 18% is sold to the market. Most of the maize grown in an area of production is traded within the area. Transport is one of the main factors that constrain integration between areas of production and consumption in Mozambique. This creates some form of food insecurity in areas with deficit production. Moving grain from the northern and central provinces to the south is difficult and costly due to poor infrastructure and long distances. In recent years South Africa has become the main supplier of white maize grain and an important supplier of maize flour to Mozambique. In 2009 imports of white maize grain from South Africa accounted for 99% of Mozambique’s total white maize imports and 78% of the country’s maize flour (of unspecified grade) was imported from South Africa (Ssali 2015). The table 4.10.2 below covers the maize grain supply chain from the farmers’ field to the grain storage. It should be noted that in some cases the wholesalers and aggregators can be government entities. Table 4.10.2: Mozambique Maize Storage and Trade Structure
Trading Quantity Source(s) and dates of data Number of Trader Brokers No data Estimated Tonnage MT No data Number of Wholesalers/brokers 20 Koopmann (2013) Estimated tonnage MT 287,700 Storage: Number of Aggregators 3 Koopmann (2013) Storage: Estimated Tonnage 127,000
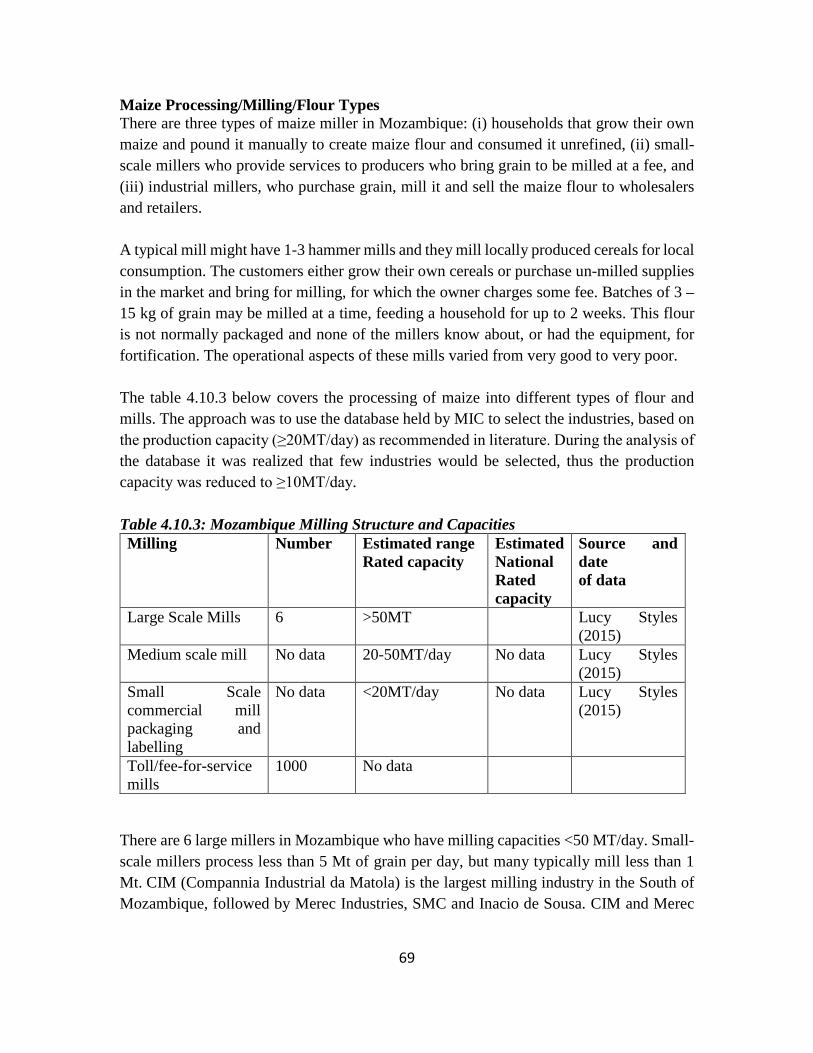
69
Maize Processing/Milling/Flour Types There are three types of maize miller in Mozambique: (i) households that grow their own maize and pound it manually to create maize flour and consumed it unrefined, (ii) small-scale millers who provide services to producers who bring grain to be milled at a fee, and (iii) industrial millers, who purchase grain, mill it and sell the maize flour to wholesalers and retailers. A typical mill might have 1-3 hammer mills and they mill locally produced cereals for local consumption. The customers either grow their own cereals or purchase un-milled supplies in the market and bring for milling, for which the owner charges some fee. Batches of 3 – 15 kg of grain may be milled at a time, feeding a household for up to 2 weeks. This flour is not normally packaged and none of the millers know about, or had the equipment, for fortification. The operational aspects of these mills varied from very good to very poor. The table 4.10.3 below covers the processing of maize into different types of flour and mills. The approach was to use the database held by MIC to select the industries, based on the production capacity (≥20MT/day) as recommended in literature. During the analysis of the database it was realized that few industries would be selected, thus the production capacity was reduced to ≥10MT/day. Table 4.10.3: Mozambique Milling Structure and Capacities Milling Number Estimated range
Rated capacity Estimated National Rated capacity
Source and date of data
Large Scale Mills 6 >50MT Lucy Styles (2015)
Medium scale mill No data 20-50MT/day No data Lucy Styles (2015)
Small Scale commercial mill packaging and labelling
No data <20MT/day No data Lucy Styles (2015)
Toll/fee-for-service mills
1000 No data
There are 6 large millers in Mozambique who have milling capacities <50 MT/day. Small-scale millers process less than 5 Mt of grain per day, but many typically mill less than 1 Mt. CIM (Compannia Industrial da Matola) is the largest milling industry in the South of Mozambique, followed by Merec Industries, SMC and Inacio de Sousa. CIM and Merec
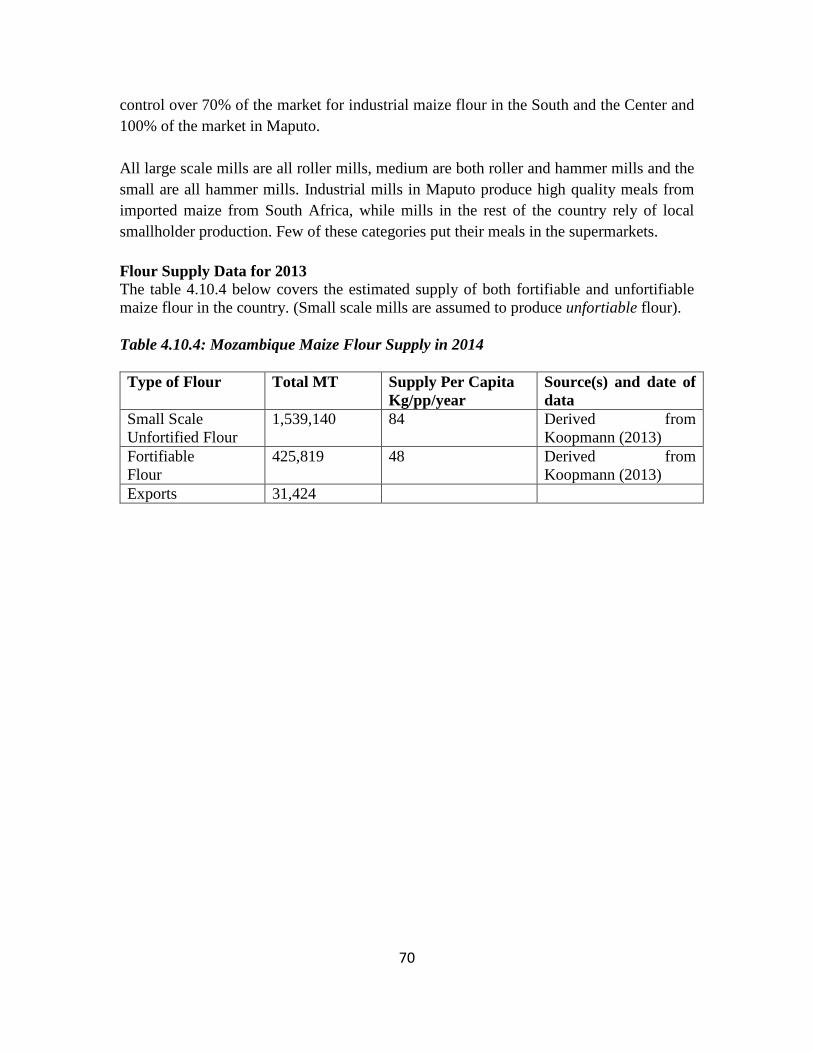
70
control over 70% of the market for industrial maize flour in the South and the Center and 100% of the market in Maputo. All large scale mills are all roller mills, medium are both roller and hammer mills and the small are all hammer mills. Industrial mills in Maputo produce high quality meals from imported maize from South Africa, while mills in the rest of the country rely of local smallholder production. Few of these categories put their meals in the supermarkets. Flour Supply Data for 2013 The table 4.10.4 below covers the estimated supply of both fortifiable and unfortifiable maize flour in the country. (Small scale mills are assumed to produce unfortiable flour). Table 4.10.4: Mozambique Maize Flour Supply in 2014 Type of Flour Total MT Supply Per Capita
Kg/pp/year Source(s) and date of data
Small Scale Unfortified Flour
1,539,140
84 Derived from Koopmann (2013)
Fortifiable Flour
425,819 48 Derived from Koopmann (2013)
Exports 31,424
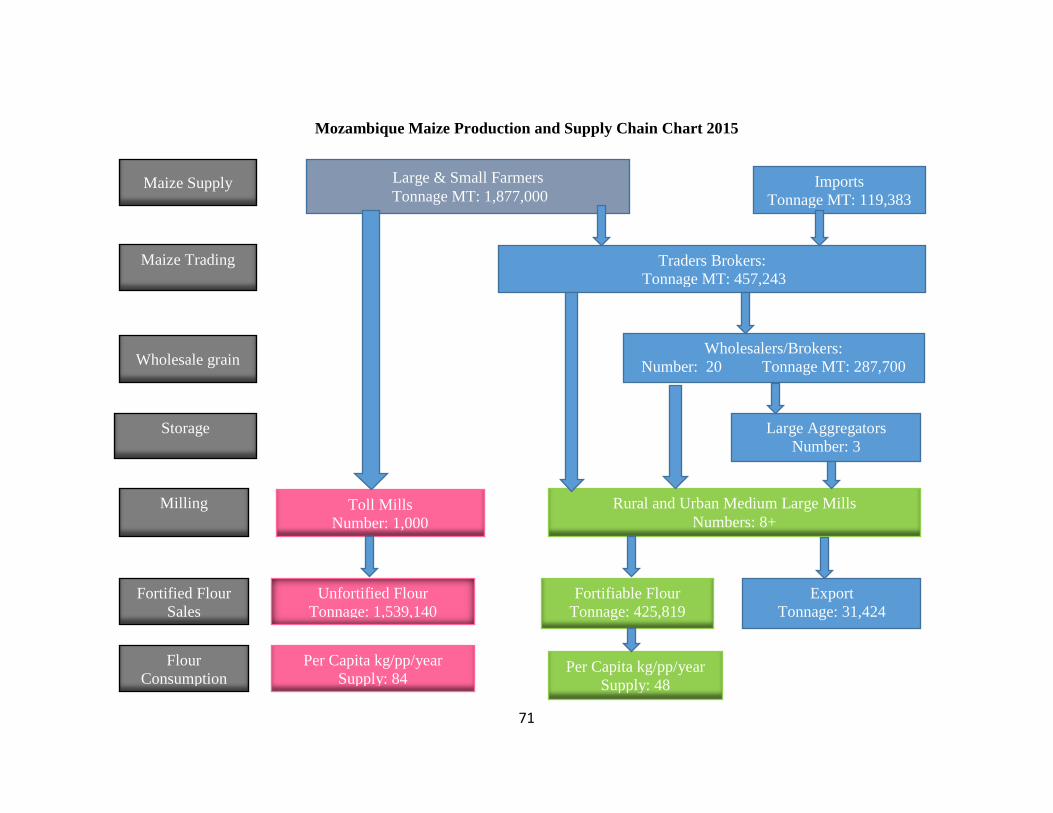
71
Mozambique Maize Production and Supply Chain Chart 2015
Maize Supply Large & Small Farmers Tonnage MT: 1,877,000
Imports Tonnage MT: 119,383
Maize Trading
Traders Brokers: Tonnage MT: 457,243
Wholesalers/Brokers: Number: 20 Tonnage MT: 287,700
Wholesale grain
Large Aggregators Number: 3
Storage
Milling
Fortified Flour Sales
Flour Consumption
Toll Mills Number: 1,000
Rural and Urban Medium Large Mills Numbers: 8+
Unfortified Flour Tonnage: 1,539,140
Per Capita kg/pp/year Supply: 84
Fortifiable Flour Tonnage: 425,819
Export Tonnage: 31,424
Per Capita kg/pp/year Supply: 48
72
4.11 Namibia
Introduction Namibia is a country located on the West coast of Africa and has a total area of 823,290 square kilometers1. It has an arid climate, with an average annual rainfall of 285 mm2. The population in 2010 was 2,283,289 and increasing by an average of 1.8 percent per annum. Of this, approximately 62 percent is classified as rural, down from 68 percent in 1993. Namibia has a total of 388,080 square kilometers of agricultural land, or 47 percent of the total land area. Of that, just one percent is classified as arable land. The country has over 17.7 billion cubic meters of renewable water resources available, of which 1.7 percent is withdrawn annually. Of the total water withdrawn, around 71 percent is used in the agricultural sector. White maize and mahangu remain the most important sources of staple food in Namibia. Consumption Patterns The traditional staples of Namibian cuisine are corn or millet porridge served with meat or fish stews. However, the German tradition is strong in Namibia (it’s having been a former German colony) and local dishes tend to be heavy on pasta, meat and vegetables such as potatoes, cabbage, celery and rice. As might be expected from the admixture of German traditions hams and sausages also feature quite heavily in the diet. Shellfish dishes are traditionally served with corn-based breads. Like most of Southern Africa braais (Southern African barbecues) and potjikos (a hot stew of meat, Chicken or fish cooked over an open fire in a cast-iron, three-legged pot) are also a feature of the cuisine. Maize Supply: Grain Production, Exports/Imports Maize is the largest commercially produced grain crop and remains one of the important sources of staple food in Namibia. Namibia Economic Board (2013) observes that, in Namibia, white maize is grown exclusively as a staple food and is planted under both irrigation and rain fed conditions. Although Namibia is still a net importer of staple grain, the local white maize production shows a gradual increase during normal rain-fed circumstances. This grain is produced under both rain-fed conditions and under irrigation. Under the irrigation systems, Green Scheme Projects contribute significantly to domestic white maize production in the Republic of Namibia. Green Scheme Projects are managed by Agribusdev, an agency appointed by the Board and who will also assist in implementing certain defined projects dealing with agronomic production as contained in the Agronomic Industry Act (Namibia Economic Board 2013). Given its importance in food security, white maize production and marketing is regulated by the Namibian Agronomic Board (NAB).
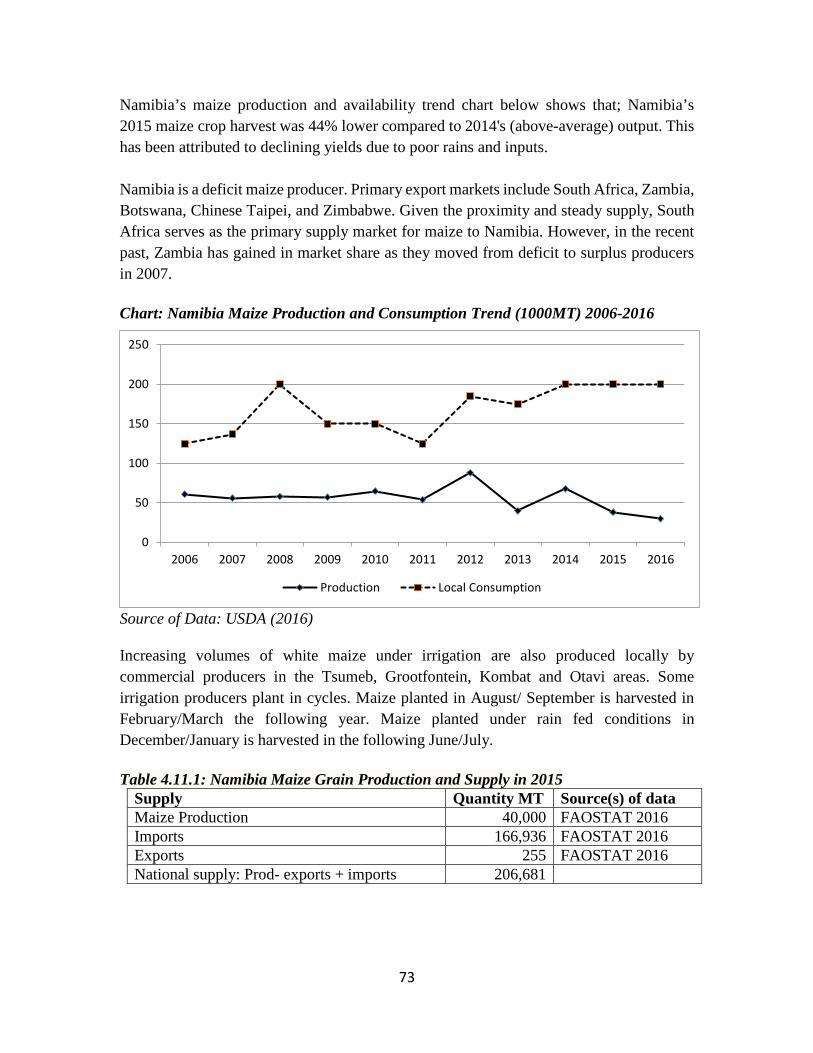
73
Namibia’s maize production and availability trend chart below shows that; Namibia’s 2015 maize crop harvest was 44% lower compared to 2014's (above-average) output. This has been attributed to declining yields due to poor rains and inputs. Namibia is a deficit maize producer. Primary export markets include South Africa, Zambia, Botswana, Chinese Taipei, and Zimbabwe. Given the proximity and steady supply, South Africa serves as the primary supply market for maize to Namibia. However, in the recent past, Zambia has gained in market share as they moved from deficit to surplus producers in 2007. Chart: Namibia Maize Production and Consumption Trend (1000MT) 2006-2016
Source of Data: USDA (2016) Increasing volumes of white maize under irrigation are also produced locally by commercial producers in the Tsumeb, Grootfontein, Kombat and Otavi areas. Some irrigation producers plant in cycles. Maize planted in August/ September is harvested in February/March the following year. Maize planted under rain fed conditions in December/January is harvested in the following June/July. Table 4.11.1: Namibia Maize Grain Production and Supply in 2015
Supply Quantity MT Source(s) of data Maize Production 40,000 FAOSTAT 2016 Imports 166,936 FAOSTAT 2016 Exports 255 FAOSTAT 2016 National supply: Prod- exports + imports 206,681
0
50
100
150
200
250
2006 2007 2008 2009 2010 2011 2012 2013 2014 2015 2016
Production Local Consumption
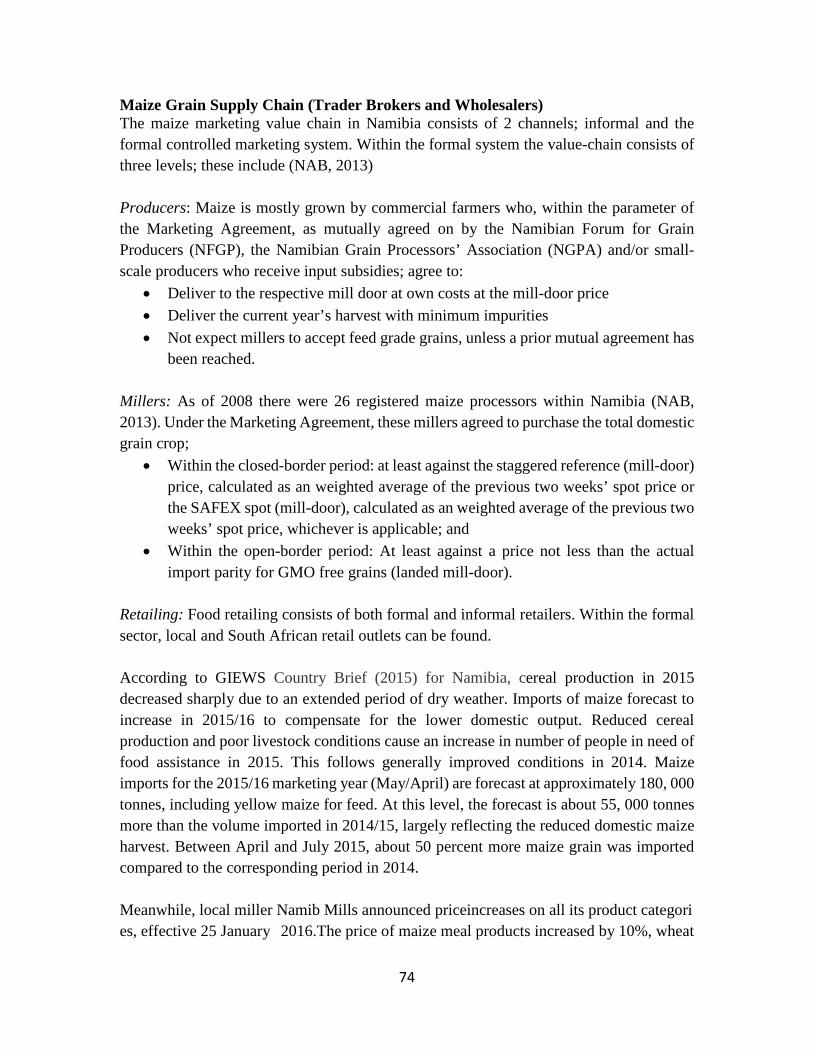
74
Maize Grain Supply Chain (Trader Brokers and Wholesalers) The maize marketing value chain in Namibia consists of 2 channels; informal and the formal controlled marketing system. Within the formal system the value-chain consists of three levels; these include (NAB, 2013) Producers: Maize is mostly grown by commercial farmers who, within the parameter of the Marketing Agreement, as mutually agreed on by the Namibian Forum for Grain Producers (NFGP), the Namibian Grain Processors’ Association (NGPA) and/or small-scale producers who receive input subsidies; agree to:
• Deliver to the respective mill door at own costs at the mill-door price • Deliver the current year’s harvest with minimum impurities • Not expect millers to accept feed grade grains, unless a prior mutual agreement has
been reached. Millers: As of 2008 there were 26 registered maize processors within Namibia (NAB, 2013). Under the Marketing Agreement, these millers agreed to purchase the total domestic grain crop;
• Within the closed-border period: at least against the staggered reference (mill-door) price, calculated as an weighted average of the previous two weeks’ spot price or the SAFEX spot (mill-door), calculated as an weighted average of the previous two weeks’ spot price, whichever is applicable; and
• Within the open-border period: At least against a price not less than the actual import parity for GMO free grains (landed mill-door).
Retailing: Food retailing consists of both formal and informal retailers. Within the formal sector, local and South African retail outlets can be found. According to GIEWS Country Brief (2015) for Namibia, cereal production in 2015 decreased sharply due to an extended period of dry weather. Imports of maize forecast to increase in 2015/16 to compensate for the lower domestic output. Reduced cereal production and poor livestock conditions cause an increase in number of people in need of food assistance in 2015. This follows generally improved conditions in 2014. Maize imports for the 2015/16 marketing year (May/April) are forecast at approximately 180, 000 tonnes, including yellow maize for feed. At this level, the forecast is about 55, 000 tonnes more than the volume imported in 2014/15, largely reflecting the reduced domestic maize harvest. Between April and July 2015, about 50 percent more maize grain was imported compared to the corresponding period in 2014. Meanwhile, local miller Namib Mills announced priceincreases on all its product categories, effective 25 January 2016.The price of maize meal products increased by 10%, wheat
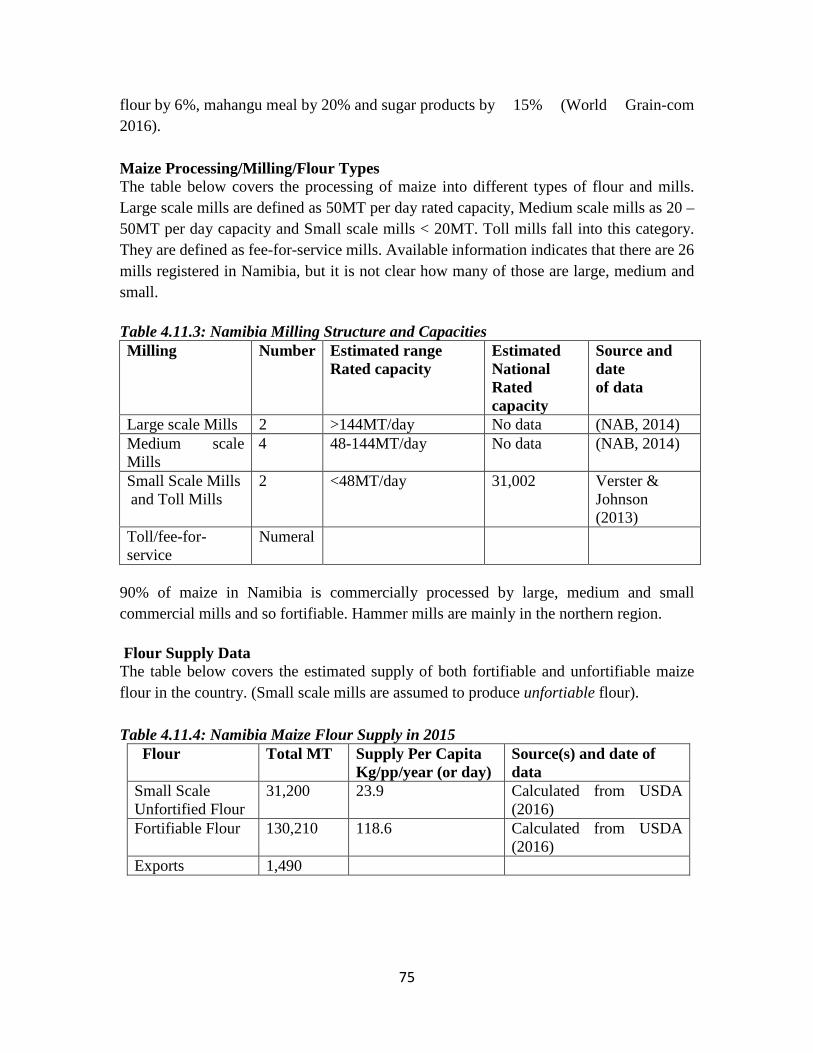
75
flour by 6%, mahangu meal by 20% and sugar products by 15% (World Grain-com 2016). Maize Processing/Milling/Flour Types The table below covers the processing of maize into different types of flour and mills. Large scale mills are defined as 50MT per day rated capacity, Medium scale mills as 20 – 50MT per day capacity and Small scale mills < 20MT. Toll mills fall into this category. They are defined as fee-for-service mills. Available information indicates that there are 26 mills registered in Namibia, but it is not clear how many of those are large, medium and small. Table 4.11.3: Namibia Milling Structure and Capacities Milling Number Estimated range
Rated capacity Estimated National Rated capacity
Source and date of data
Large scale Mills 2 >144MT/day No data (NAB, 2014) Medium scale Mills
4 48-144MT/day No data (NAB, 2014)
Small Scale Mills and Toll Mills
2 <48MT/day 31,002 Verster & Johnson (2013)
Toll/fee-for-service
Numeral
90% of maize in Namibia is commercially processed by large, medium and small commercial mills and so fortifiable. Hammer mills are mainly in the northern region. Flour Supply Data The table below covers the estimated supply of both fortifiable and unfortifiable maize flour in the country. (Small scale mills are assumed to produce unfortiable flour). Table 4.11.4: Namibia Maize Flour Supply in 2015
Flour Total MT Supply Per Capita Kg/pp/year (or day)
Source(s) and date of data
Small Scale Unfortified Flour
31,200 23.9 Calculated from USDA (2016)
Fortifiable Flour 130,210 118.6 Calculated from USDA (2016)
Exports 1,490
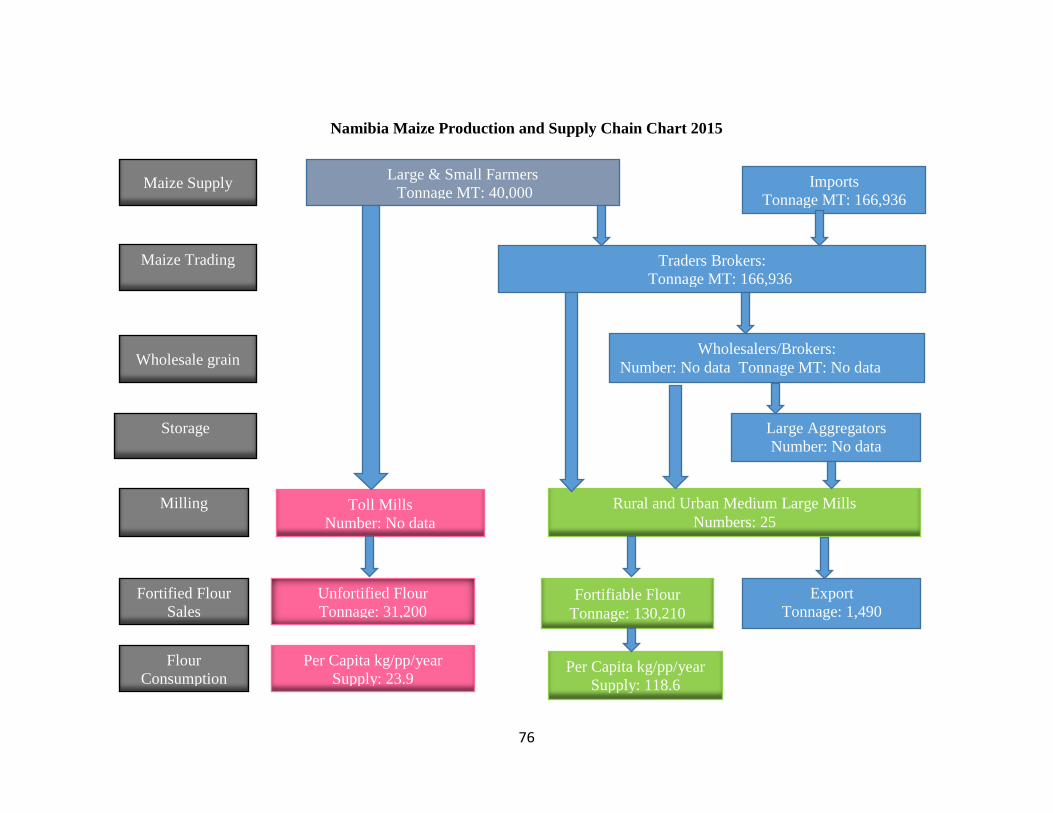
76
Namibia Maize Production and Supply Chain Chart 2015
Maize Supply Large & Small Farmers Tonnage MT: 40,000
Imports Tonnage MT: 166,936
Maize Trading
Traders Brokers: Tonnage MT: 166,936
Wholesalers/Brokers: Number: No data Tonnage MT: No data Wholesale grain
Large Aggregators Number: No data
Storage
Milling
Fortified Flour Sales
Flour Consumption
Toll Mills Number: No data
Rural and Urban Medium Large Mills Numbers: 25
Unfortified Flour Tonnage: 31,200
Per Capita kg/pp/year Supply: 23.9
Fortifiable Flour Tonnage: 130,210
Export Tonnage: 1,490
Per Capita kg/pp/year Supply: 118.6
77
4.12 Botswana
Introduction The country is sparsely populated because up to 70% of the country is covered by the Kalahari Desert, the vast arid to semi-arid landscape in Southern Africa covering much of Botswana and parts of Namibia and South Africa. Botswana's population of slightly less than 2 million people (in 2015) is concentrated in the eastern part of the country. Botswana is a flat country, dominated by the Kalahari sand sheet, which covers the underlying geology for over more than 80% of the surface area. The arable land area in Botswana is only 0.7%, due to the low rainfall and the sandy, infertile soils, which prevail over most of the country. Maintenance of the productive potential of this scarce resource is a key issue: soil erosion and bush encroachment (and its opposite, depletion of woody cover) are perceived as significant threats (Qamar 2013). The agriculture sector of Botswana is dominated by cattle rearing and subsistence farming, but it suffers from erratic rainfall and soil erosion. Botswana maize millers rely on South Africa for up to 95 per cent of their maize. It constituted about 30 per cent of what South Africa exported in white maize to African countries (BOPA 2015). The details are shown in the table below. Consumption Pattern Sorghum and maize are the most consumed staples by poor rural and urban households. Hence, the two commodities are the most important for rural household food security. Traditional pap is made with white cornmeal. Michael English observes that, traditional pap locally known as bogobe is made by putting sorghum, maize or millet flour into boiling water, stirring into a soft paste, and then cooking it slowly. Sometimes the sorghum or maize is fermented, and milk and sugar added. This dish is called ting. Without the milk and sugar, ting is sometimes eaten with meat or vegetables as lunch or dinner. Another way of making bogobe is to add sour milk and a cooking melon (lerotse). This dish is called tophi by the Kalanga tribe. In Botswana, Cornmeal Pap is eaten with the fingers, dipped into stews to pick up additional flavour. Like soft polenta, Cornmeal Pap goes well with any stewed meat or vegetable. The mixture stiffens up quickly, however, so serve immediately after cooking (Martin 2010). Maize Supply: Grain Production, Exports/Imports According to Botswana Agricultural Marketing Board (2016), both white and yellow maize are grown in Botswana. However, white maize is mainly sold to maize millers and
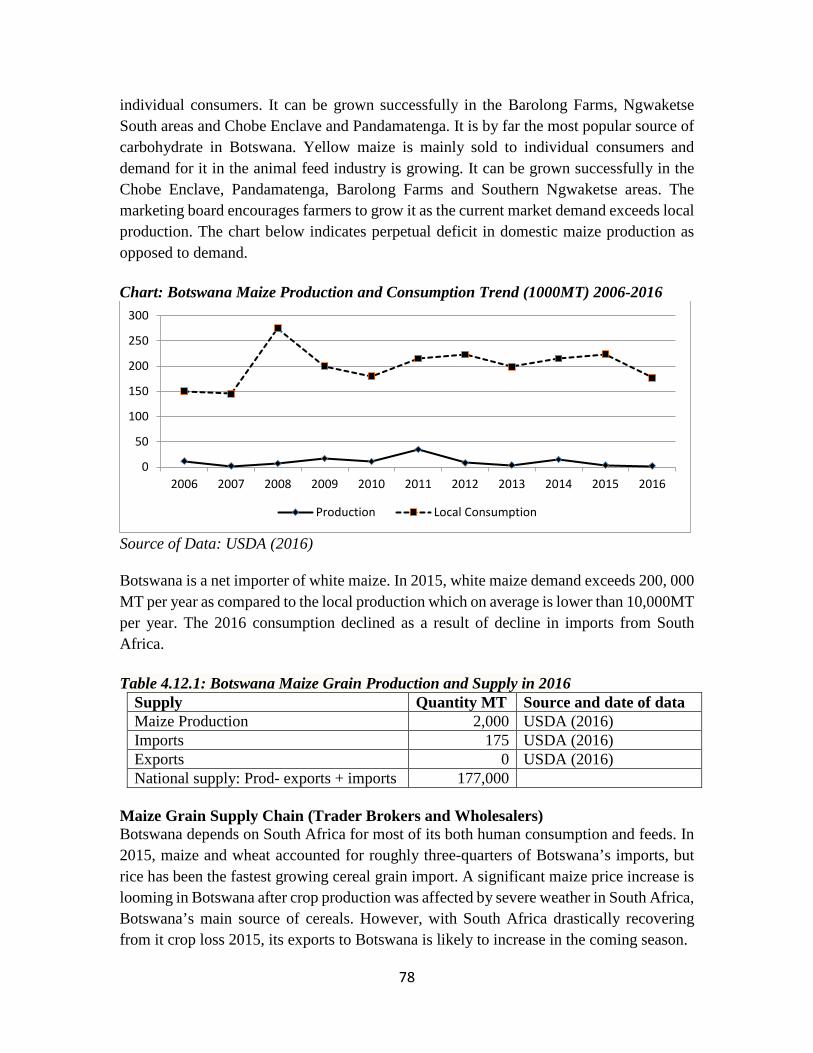
78
individual consumers. It can be grown successfully in the Barolong Farms, Ngwaketse South areas and Chobe Enclave and Pandamatenga. It is by far the most popular source of carbohydrate in Botswana. Yellow maize is mainly sold to individual consumers and demand for it in the animal feed industry is growing. It can be grown successfully in the Chobe Enclave, Pandamatenga, Barolong Farms and Southern Ngwaketse areas. The marketing board encourages farmers to grow it as the current market demand exceeds local production. The chart below indicates perpetual deficit in domestic maize production as opposed to demand. Chart: Botswana Maize Production and Consumption Trend (1000MT) 2006-2016
Source of Data: USDA (2016) Botswana is a net importer of white maize. In 2015, white maize demand exceeds 200, 000 MT per year as compared to the local production which on average is lower than 10,000MT per year. The 2016 consumption declined as a result of decline in imports from South Africa. Table 4.12.1: Botswana Maize Grain Production and Supply in 2016
Supply Quantity MT Source and date of data Maize Production 2,000 USDA (2016) Imports 175 USDA (2016) Exports 0 USDA (2016) National supply: Prod- exports + imports 177,000
Maize Grain Supply Chain (Trader Brokers and Wholesalers) Botswana depends on South Africa for most of its both human consumption and feeds. In 2015, maize and wheat accounted for roughly three-quarters of Botswana’s imports, but rice has been the fastest growing cereal grain import. A significant maize price increase is looming in Botswana after crop production was affected by severe weather in South Africa, Botswana’s main source of cereals. However, with South Africa drastically recovering from it crop loss 2015, its exports to Botswana is likely to increase in the coming season.
0
50
100
150
200
250
300
2006 2007 2008 2009 2010 2011 2012 2013 2014 2015 2016
Production Local Consumption
79
Botswana Agricultural Marketing Board observes that, the grain market is highly competitive and influenced by supply and demand conditions. When shortages occur in the market, prices rise and conversely they drop when there is excess in the market. As a result, market prices constantly fluctuate within a season and may vary widely from one year to another. Botswana being a net importer of grain is exposed to external market conditions since imports directly compete with locally produced grain because local agro-processors ;millers are free to import grain if it is cheaper to do so. As a result, the Botswana Agricultural Marketing Board; BAMB is forced to set producer; buying prices in parity with imports using the South African Futures Exchange ;SAFE as a benchmark. Maize Processing/Milling/Flour Types Botswana’s milling industry is largely dependent on South African maize crop and imports up to 95 per cent of its annual requirements. The 2016 maize imports from South Africa were 175,000MT down from 200,000MT in 3015. The table 4.12.3 below covers the processing of maize into different types of flour and mills. Large scale mills are defined as 50MT per day rated capacity, Medium scale mills as 20- 50MT per day capacity and Small scale mills < 20MT. Toll mills fall into this category. They are defined as fee-for-service mills. Table 4.12.2: Botswana Milling Structure and Capacities Milling Number Estimated
range Rated capacity
Estimated National Rated capacity
Source and date of data
Large scale Mills 2 - - BAMB5 (2016) Medium scale Mills and smaller scale mills that are commercially packaging and labelling
5 - - BAMB (2016)
Small Scale Mills and Toll Mills
- - -
The two large millers are Bolux Milling and Bokomo Botswana. However, their respective installed and operating capacities are not known. The number of toll mills is not known but believed to be very few owing to the fact that the largest proportion of domestic consumption is imported. Flour Supply Data The table below covers the estimated supply of both fortifiable and unfortifiable maize flour in the country. (Small scale mills are assumed to produce unfortiable flour).
5 BAMB stands for Botswana Agricultural Marketing Board
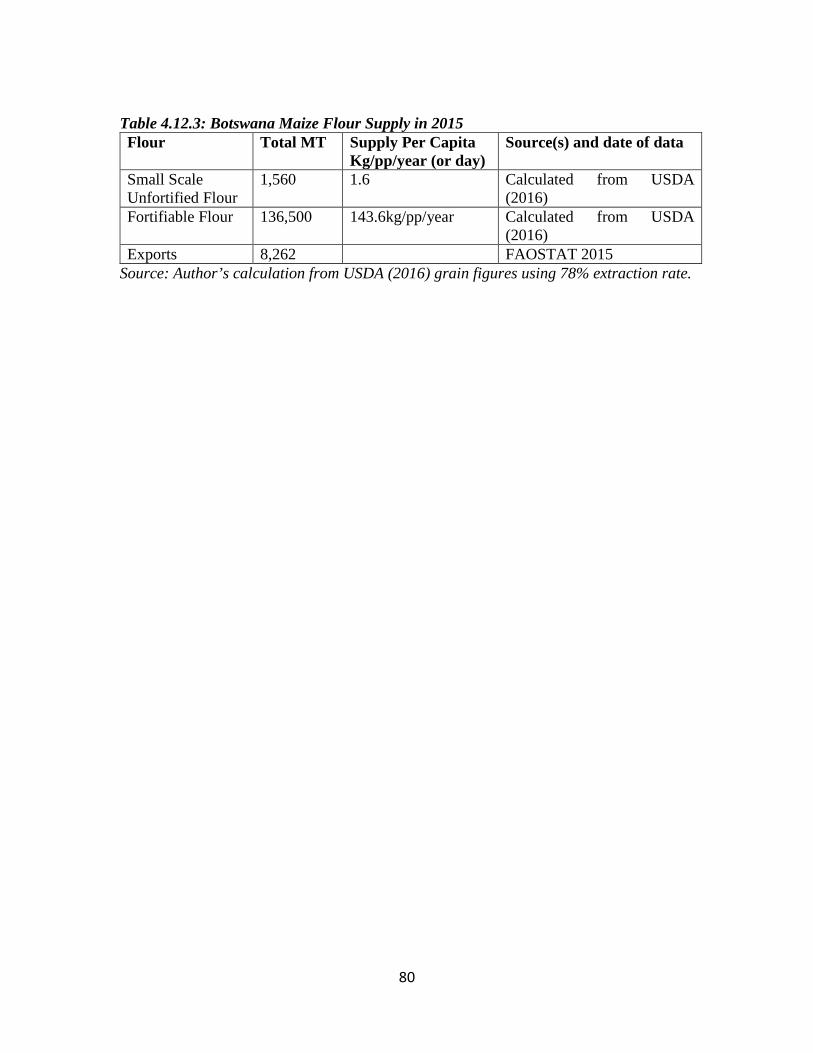
80
Table 4.12.3: Botswana Maize Flour Supply in 2015 Flour Total MT Supply Per Capita
Kg/pp/year (or day) Source(s) and date of data
Small Scale Unfortified Flour
1,560 1.6 Calculated from USDA (2016)
Fortifiable Flour 136,500 143.6kg/pp/year Calculated from USDA (2016)
Exports 8,262 FAOSTAT 2015 Source: Author’s calculation from USDA (2016) grain figures using 78% extraction rate.
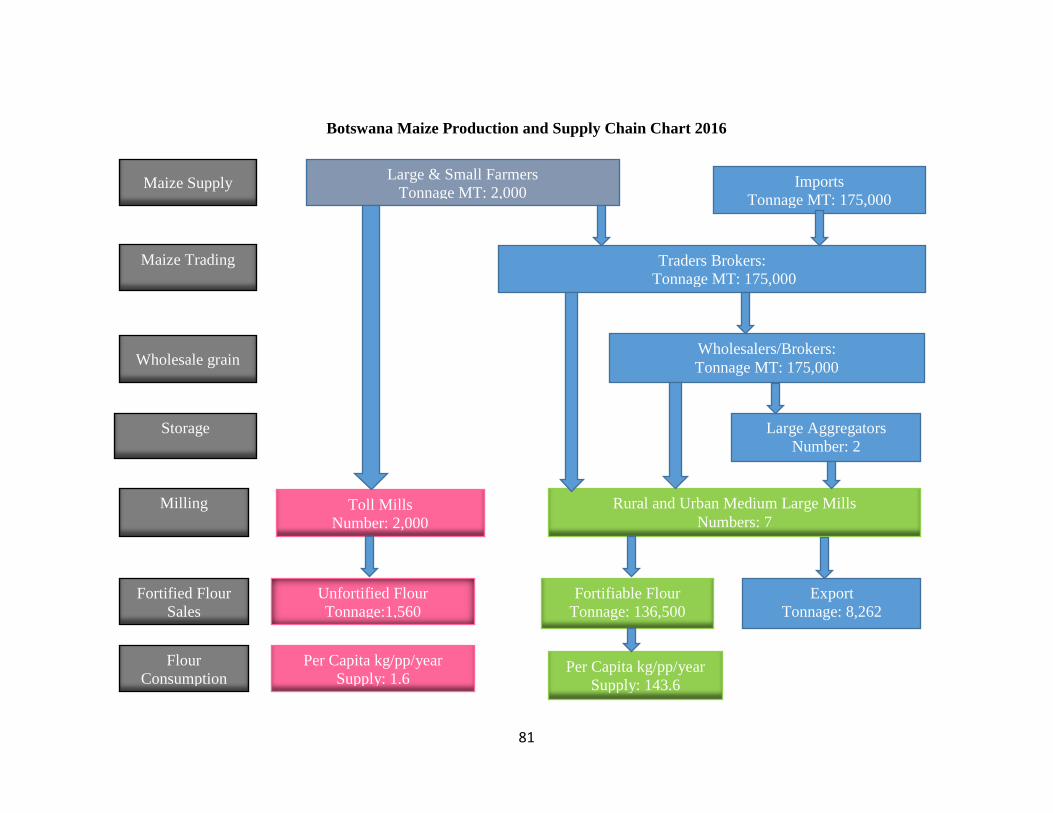
81
Botswana Maize Production and Supply Chain Chart 2016
Maize Supply Large & Small Farmers Tonnage MT: 2,000
Imports Tonnage MT: 175,000
Maize Trading
Traders Brokers: Tonnage MT: 175,000
Wholesalers/Brokers: Tonnage MT: 175,000 Wholesale grain
Large Aggregators Number: 2
Storage
Milling
Fortified Flour Sales
Flour Consumption
Toll Mills Number: 2,000
Rural and Urban Medium Large Mills Numbers: 7
Unfortified Flour Tonnage:1,560
Per Capita kg/pp/year Supply: 1.6
Fortifiable Flour Tonnage: 136,500
Export Tonnage: 8,262
Per Capita kg/pp/year Supply: 143.6
82
4.13 Angola Introduction Angola is located on the West coast of Africa. According to FAO (2013), the country has a total area of 1,246,700 square kilometers, with 7 major river systems, and a semi-arid climate with an average annual rainfall of around 1,010 mm. The population in 2015 was estimated to be 19.6 million and increasing by an average of 2.8 percent per annum. Of this, 44.1 percent was classified as urban, compared to 41.2 percent in 2010. A significant share of the labour force (around 69 percent of the total) is employed in agriculture. Angola is still recovering from the civil war which took place between 1975 and 2002. Most of Angola’s maize production mainly comes from large commercial farms with capacity to irrigate their farms. Cassava is the main crop produced by volume in Angola, followed by sweet potatoes and maize. Palm oil and coffee are the main export crops. Between 1999 and 2009, cassava production increased by 310 percent, sweet potato production by 439 percent, and maize by 127 percent (FAO 2013). The increase in the production of maize was due almost entirely to an increase in the area harvested. Consumption Pattern Like most of the countries, 80% of Angola’s production goes for human consumption while the rest goes for feeds. In Angola, maize meal is prepared in porridge form known as funji, which is much softer than Tanzanian Ugali. In Northern Angola, where cassava is a dominant crop, maize is mainly consumed green, while in the South, where maize is a primary staple, it is consumed in various forms, including as an ingredient in a traditional brew. Domestic demand for maize has trended upwards over the past decade and is comprised of both human and animal feed consumption. Maize Supply: Grain Production, Exports/Import Angola’s maize production is concentrated in Huambo, Benguela and Bie provinces. Within these three regions, maize constitutes up to 40% of total crop production. In general Maize is grown by small-scale producers who intercrop with beans, peanuts, sweet potatoes and/or cassava. These subsistence and/or small-scale producers receive input subsidies from government. According to Spears (Pty) and BFAP (2013), despite relatively low production volume, area planted to maize has increased while yields rose from 0.57 MT/HA to 0.75 MT/Ha between 2001/2002 and 2012/2013 marketing years. The primary drivers underpinning these trends include increased public sector investments as well as increased adoption of improved seed varieties (GAIN, 2009). Transport systems such as good roads, rails and storage facilities are favourable factors to ensure maize moves from surplus production regions to where there is deficit. The production and consumption trends in the chart below show a correlation between domestic supply and demand.
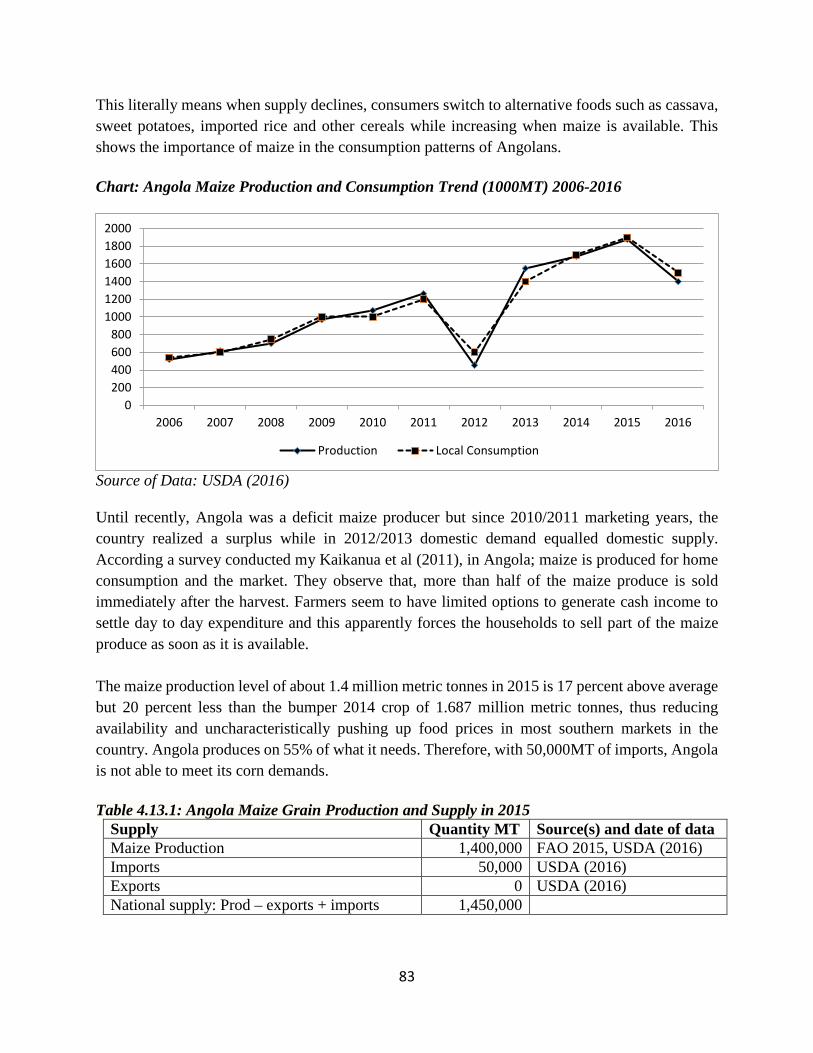
83
This literally means when supply declines, consumers switch to alternative foods such as cassava, sweet potatoes, imported rice and other cereals while increasing when maize is available. This shows the importance of maize in the consumption patterns of Angolans. Chart: Angola Maize Production and Consumption Trend (1000MT) 2006-2016
Source of Data: USDA (2016) Until recently, Angola was a deficit maize producer but since 2010/2011 marketing years, the country realized a surplus while in 2012/2013 domestic demand equalled domestic supply. According a survey conducted my Kaikanua et al (2011), in Angola; maize is produced for home consumption and the market. They observe that, more than half of the maize produce is sold immediately after the harvest. Farmers seem to have limited options to generate cash income to settle day to day expenditure and this apparently forces the households to sell part of the maize produce as soon as it is available. The maize production level of about 1.4 million metric tonnes in 2015 is 17 percent above average but 20 percent less than the bumper 2014 crop of 1.687 million metric tonnes, thus reducing availability and uncharacteristically pushing up food prices in most southern markets in the country. Angola produces on 55% of what it needs. Therefore, with 50,000MT of imports, Angola is not able to meet its corn demands. Table 4.13.1: Angola Maize Grain Production and Supply in 2015
Supply Quantity MT Source(s) and date of data Maize Production 1,400,000 FAO 2015, USDA (2016) Imports 50,000 USDA (2016) Exports 0 USDA (2016) National supply: Prod – exports + imports 1,450,000
0200400600800
100012001400160018002000
2006 2007 2008 2009 2010 2011 2012 2013 2014 2015 2016
Production Local Consumption
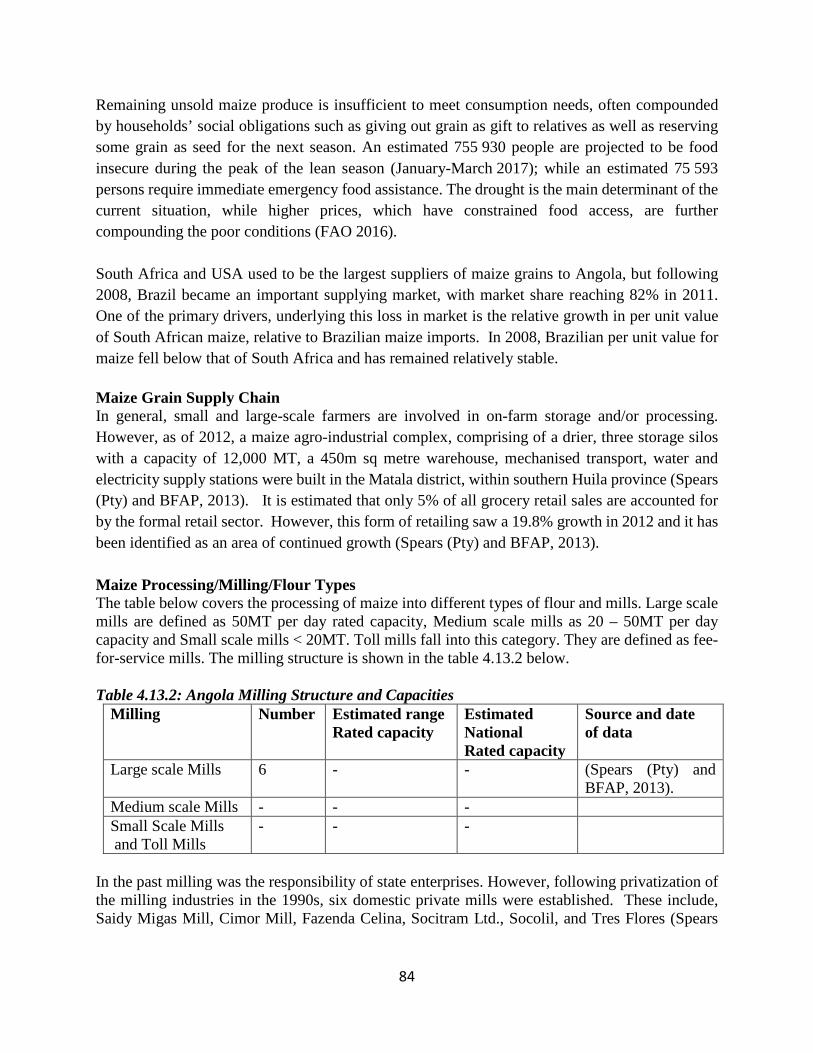
84
Remaining unsold maize produce is insufficient to meet consumption needs, often compounded by households’ social obligations such as giving out grain as gift to relatives as well as reserving some grain as seed for the next season. An estimated 755 930 people are projected to be food insecure during the peak of the lean season (January-March 2017); while an estimated 75 593 persons require immediate emergency food assistance. The drought is the main determinant of the current situation, while higher prices, which have constrained food access, are further compounding the poor conditions (FAO 2016). South Africa and USA used to be the largest suppliers of maize grains to Angola, but following 2008, Brazil became an important supplying market, with market share reaching 82% in 2011. One of the primary drivers, underlying this loss in market is the relative growth in per unit value of South African maize, relative to Brazilian maize imports. In 2008, Brazilian per unit value for maize fell below that of South Africa and has remained relatively stable. Maize Grain Supply Chain In general, small and large-scale farmers are involved in on-farm storage and/or processing. However, as of 2012, a maize agro-industrial complex, comprising of a drier, three storage silos with a capacity of 12,000 MT, a 450m sq metre warehouse, mechanised transport, water and electricity supply stations were built in the Matala district, within southern Huila province (Spears (Pty) and BFAP, 2013). It is estimated that only 5% of all grocery retail sales are accounted for by the formal retail sector. However, this form of retailing saw a 19.8% growth in 2012 and it has been identified as an area of continued growth (Spears (Pty) and BFAP, 2013). Maize Processing/Milling/Flour Types The table below covers the processing of maize into different types of flour and mills. Large scale mills are defined as 50MT per day rated capacity, Medium scale mills as 20 – 50MT per day capacity and Small scale mills < 20MT. Toll mills fall into this category. They are defined as fee-for-service mills. The milling structure is shown in the table 4.13.2 below. Table 4.13.2: Angola Milling Structure and Capacities
Milling Number Estimated range Rated capacity
Estimated National Rated capacity
Source and date of data
Large scale Mills 6 - - (Spears (Pty) and BFAP, 2013).
Medium scale Mills - - - Small Scale Mills and Toll Mills
- - -
In the past milling was the responsibility of state enterprises. However, following privatization of the milling industries in the 1990s, six domestic private mills were established. These include, Saidy Migas Mill, Cimor Mill, Fazenda Celina, Socitram Ltd., Socolil, and Tres Flores (Spears
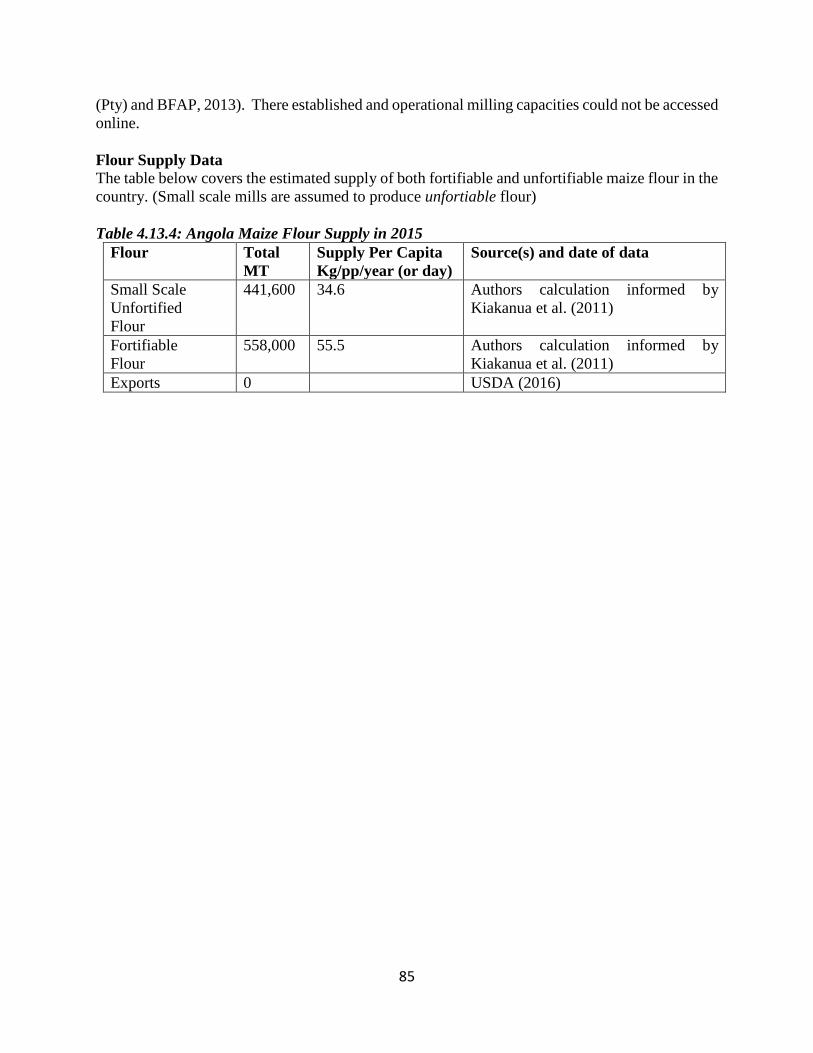
85
(Pty) and BFAP, 2013). There established and operational milling capacities could not be accessed online. Flour Supply Data The table below covers the estimated supply of both fortifiable and unfortifiable maize flour in the country. (Small scale mills are assumed to produce unfortiable flour) Table 4.13.4: Angola Maize Flour Supply in 2015
Flour Total MT
Supply Per Capita Kg/pp/year (or day)
Source(s) and date of data
Small Scale Unfortified Flour
441,600 34.6 Authors calculation informed by Kiakanua et al. (2011)
Fortifiable Flour
558,000 55.5 Authors calculation informed by Kiakanua et al. (2011)
Exports 0 USDA (2016)
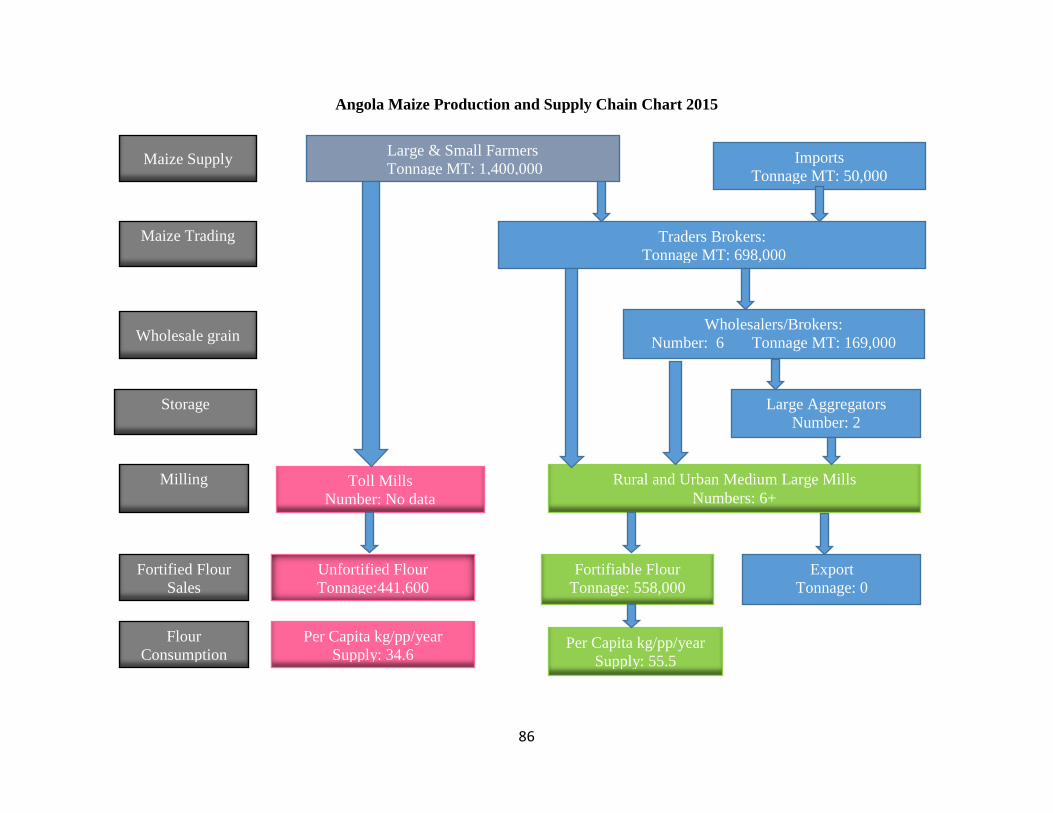
86
Angola Maize Production and Supply Chain Chart 2015
Maize Supply Large & Small Farmers Tonnage MT: 1,400,000
Imports Tonnage MT: 50,000
Maize Trading
Traders Brokers: Tonnage MT: 698,000
Wholesalers/Brokers: Number: 6 Tonnage MT: 169,000
Wholesale grain
Large Aggregators Number: 2
Storage
Milling
Fortified Flour Sales
Flour Consumption
Toll Mills Number: No data
Rural and Urban Medium Large Mills Numbers: 6+
Unfortified Flour Tonnage:441,600
Per Capita kg/pp/year Supply: 34.6
Fortifiable Flour Tonnage: 558,000
Export Tonnage: 0
Per Capita kg/pp/year Supply: 55.5
87
5. CONCLUSION Quantitative data was hard to access where they existed. However, in a number of cases, data on number of large and small famers, milling structure, number of mills and rated capacities was difficult to get. There is need for governments and partners to invest in quantitative data the number of farmers, traders, aggregators, wholesalers and brokers in the maize sub-sector. There are no statistics of basic variables and this makes planning for interventions difficult and cumbersome to undertake. Eastern and southern Africa has higher demand for maize than they can produce locally. There local production has been hampered by poor yields. The region has every opportunity to enhance the productivity and production of maize under smallholder conditions. Apart from Botswana and partly Namibia, the region has vast areas of arable land that have yet to be developed and huge water resources for irrigation. A good number of improved maize varieties are now available and more are in the pipeline; these need to be popularized and promoted vigorously. Government subsidies for improved seed varieties are creating interest in seed companies. Efforts need to be made to intensify fertilizer use more widely across the regions and increase the rate of application. Small-scale mechanization would help transform maize production in the regions where opportunities for animal traction are extremely low.
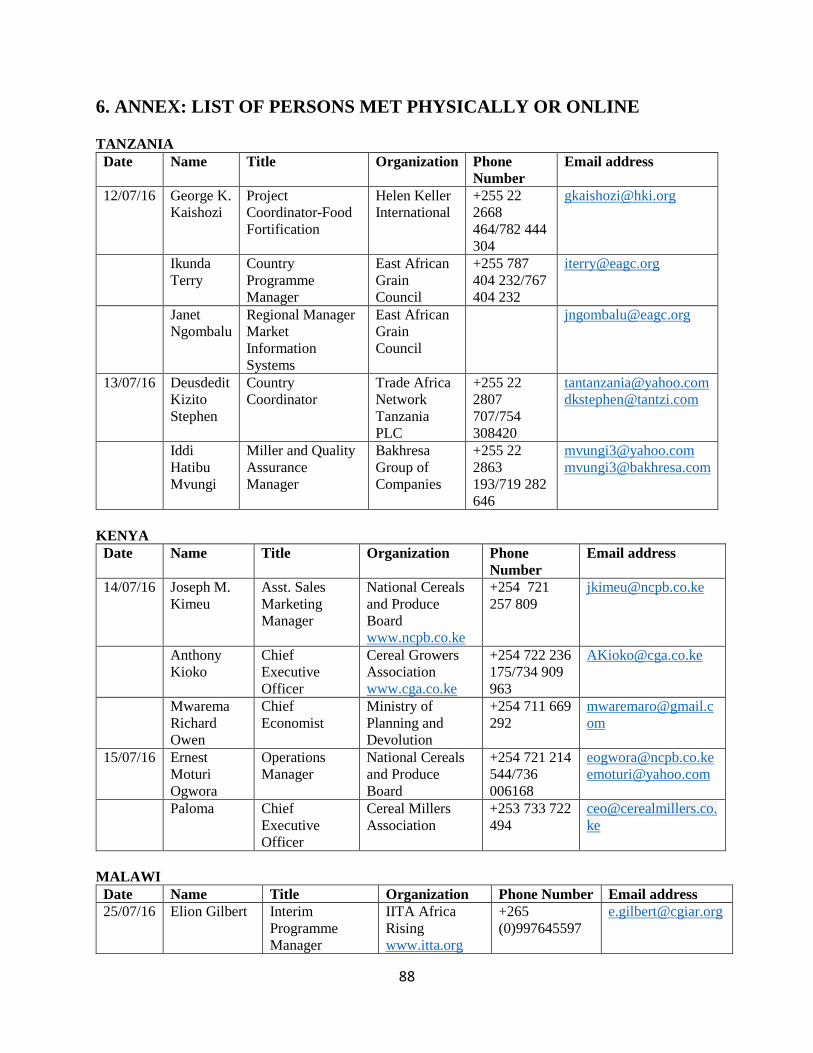
88
6. ANNEX: LIST OF PERSONS MET PHYSICALLY OR ONLINE TANZANIA
Date Name Title Organization Phone Number
Email address
12/07/16 George K. Kaishozi
Project Coordinator-Food Fortification
Helen Keller International
+255 22 2668 464/782 444 304
Ikunda Terry
Country Programme Manager
East African Grain Council
+255 787 404 232/767 404 232
Janet Ngombalu
Regional Manager Market Information Systems
East African Grain Council
13/07/16 Deusdedit Kizito Stephen
Country Coordinator
Trade Africa Network Tanzania PLC
+255 22 2807 707/754 308420
[email protected] [email protected]
Iddi Hatibu Mvungi
Miller and Quality Assurance Manager
Bakhresa Group of Companies
+255 22 2863 193/719 282 646
[email protected] [email protected]
KENYA
Date Name Title Organization Phone Number
Email address
14/07/16 Joseph M. Kimeu
Asst. Sales Marketing Manager
National Cereals and Produce Board www.ncpb.co.ke
+254 721 257 809
Anthony Kioko
Chief Executive Officer
Cereal Growers Association www.cga.co.ke
+254 722 236 175/734 909 963
Mwarema Richard Owen
Chief Economist
Ministry of Planning and Devolution
+254 711 669 292
15/07/16 Ernest Moturi Ogwora
Operations Manager
National Cereals and Produce Board
+254 721 214 544/736 006168
[email protected] [email protected]
Paloma Chief Executive Officer
Cereal Millers Association
+253 733 722 494
MALAWI
Date Name Title Organization Phone Number Email address 25/07/16 Elion Gilbert Interim
Programme Manager
IITA Africa Rising www.itta.org
+265 (0)997645597
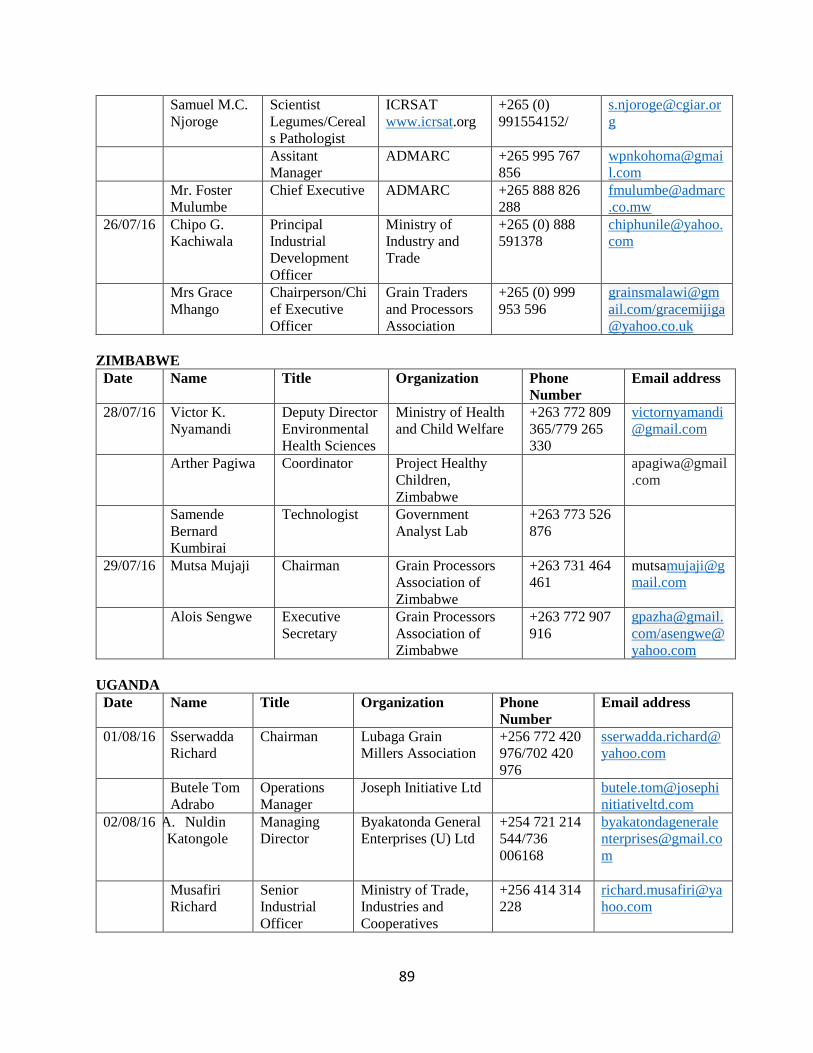
89
Samuel M.C. Njoroge
Scientist Legumes/Cereals Pathologist
ICRSAT www.icrsat.org
+265 (0) 991554152/
Assitant Manager
ADMARC +265 995 767 856
Mr. Foster Mulumbe
Chief Executive ADMARC +265 888 826 288
26/07/16 Chipo G. Kachiwala
Principal Industrial Development Officer
Ministry of Industry and Trade
+265 (0) 888 591378
Mrs Grace Mhango
Chairperson/Chief Executive Officer
Grain Traders and Processors Association
+265 (0) 999 953 596
[email protected]/[email protected]
ZIMBABWE
Date Name Title Organization Phone Number
Email address
28/07/16 Victor K. Nyamandi
Deputy Director Environmental Health Sciences
Ministry of Health and Child Welfare
+263 772 809 365/779 265 330
Arther Pagiwa Coordinator Project Healthy Children, Zimbabwe
Samende Bernard Kumbirai
Technologist Government Analyst Lab
+263 773 526 876
29/07/16 Mutsa Mujaji Chairman Grain Processors Association of Zimbabwe
+263 731 464 461
Alois Sengwe Executive Secretary
Grain Processors Association of Zimbabwe
+263 772 907 916
[email protected]/[email protected]
UGANDA
Date Name Title Organization Phone Number
Email address
01/08/16 Sserwadda Richard
Chairman Lubaga Grain Millers Association
+256 772 420 976/702 420 976
Butele Tom Adrabo
Operations Manager
Joseph Initiative Ltd [email protected]
02/08/16 A. Nuldin Katongole
Managing Director
Byakatonda General Enterprises (U) Ltd
+254 721 214 544/736 006168
Musafiri Richard
Senior Industrial Officer
Ministry of Trade, Industries and Cooperatives
+256 414 314 228
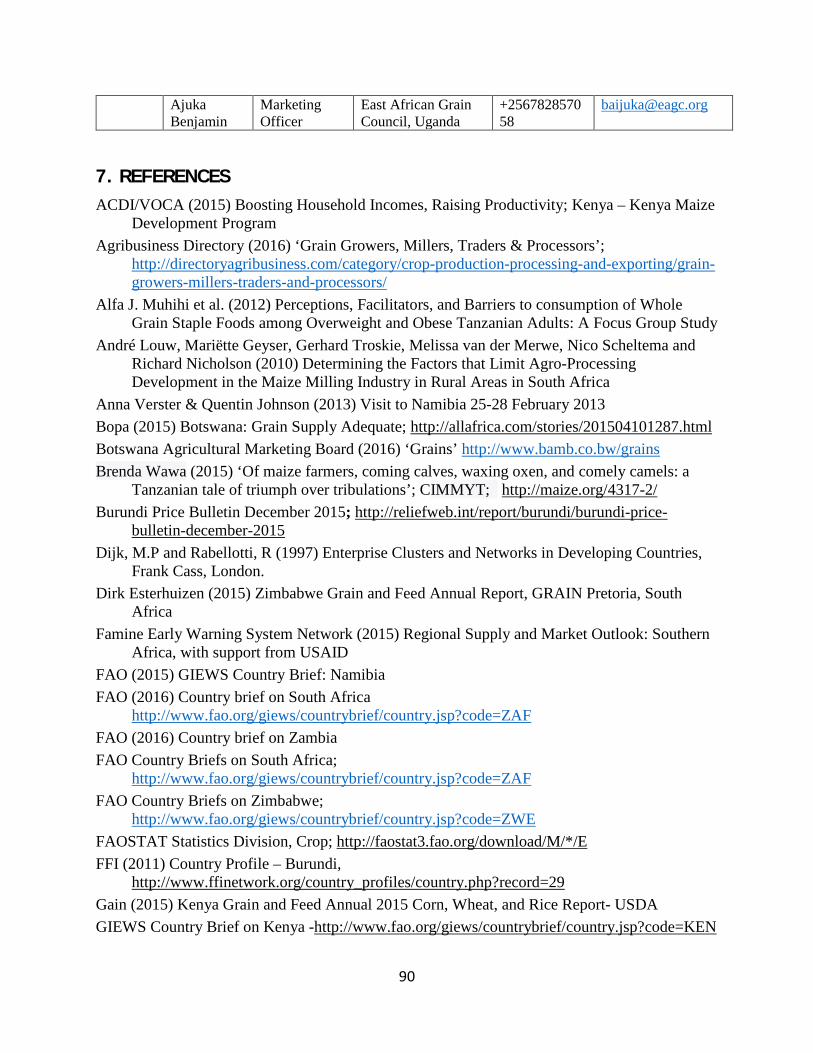
90
Ajuka Benjamin
Marketing Officer
East African Grain Council, Uganda
+256782857058
7. REFERENCES ACDI/VOCA (2015) Boosting Household Incomes, Raising Productivity; Kenya – Kenya Maize
Development Program Agribusiness Directory (2016) ‘Grain Growers, Millers, Traders & Processors’;
http://directoryagribusiness.com/category/crop-production-processing-and-exporting/grain-growers-millers-traders-and-processors/
Alfa J. Muhihi et al. (2012) Perceptions, Facilitators, and Barriers to consumption of Whole Grain Staple Foods among Overweight and Obese Tanzanian Adults: A Focus Group Study
André Louw, Mariëtte Geyser, Gerhard Troskie, Melissa van der Merwe, Nico Scheltema and Richard Nicholson (2010) Determining the Factors that Limit Agro-Processing Development in the Maize Milling Industry in Rural Areas in South Africa
Anna Verster & Quentin Johnson (2013) Visit to Namibia 25-28 February 2013 Bopa (2015) Botswana: Grain Supply Adequate; http://allafrica.com/stories/201504101287.html Botswana Agricultural Marketing Board (2016) ‘Grains’ http://www.bamb.co.bw/grains Brenda Wawa (2015) ‘Of maize farmers, coming calves, waxing oxen, and comely camels: a
Tanzanian tale of triumph over tribulations’; CIMMYT; http://maize.org/4317-2/ Burundi Price Bulletin December 2015; http://reliefweb.int/report/burundi/burundi-price-
bulletin-december-2015 Dijk, M.P and Rabellotti, R (1997) Enterprise Clusters and Networks in Developing Countries,
Frank Cass, London. Dirk Esterhuizen (2015) Zimbabwe Grain and Feed Annual Report, GRAIN Pretoria, South
Africa Famine Early Warning System Network (2015) Regional Supply and Market Outlook: Southern
Africa, with support from USAID FAO (2015) GIEWS Country Brief: Namibia FAO (2016) Country brief on South Africa
http://www.fao.org/giews/countrybrief/country.jsp?code=ZAF FAO (2016) Country brief on Zambia FAO Country Briefs on South Africa;
http://www.fao.org/giews/countrybrief/country.jsp?code=ZAF FAO Country Briefs on Zimbabwe;
http://www.fao.org/giews/countrybrief/country.jsp?code=ZWE FAOSTAT Statistics Division, Crop; http://faostat3.fao.org/download/M/*/E FFI (2011) Country Profile – Burundi,
http://www.ffinetwork.org/country_profiles/country.php?record=29 Gain (2015) Kenya Grain and Feed Annual 2015 Corn, Wheat, and Rice Report- USDA GIEWS Country Brief on Kenya -http://www.fao.org/giews/countrybrief/country.jsp?code=KEN
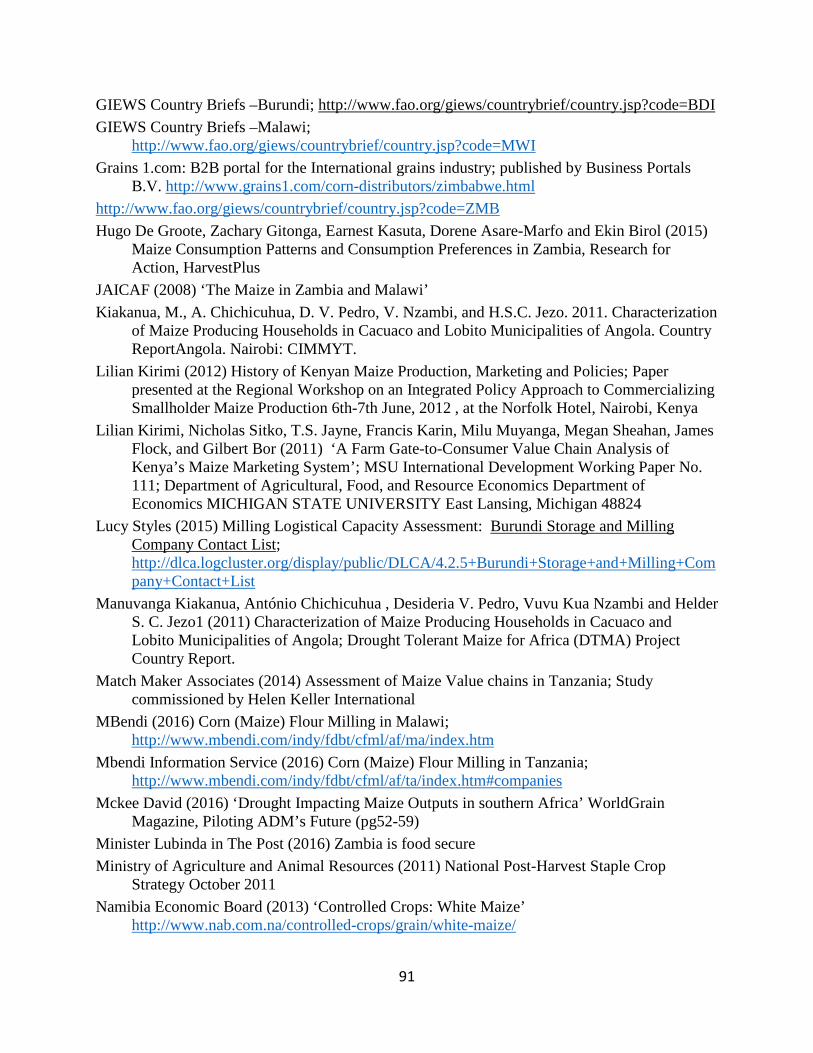
91
GIEWS Country Briefs –Burundi; http://www.fao.org/giews/countrybrief/country.jsp?code=BDI GIEWS Country Briefs –Malawi;
http://www.fao.org/giews/countrybrief/country.jsp?code=MWI Grains 1.com: B2B portal for the International grains industry; published by Business Portals
B.V. http://www.grains1.com/corn-distributors/zimbabwe.html http://www.fao.org/giews/countrybrief/country.jsp?code=ZMB Hugo De Groote, Zachary Gitonga, Earnest Kasuta, Dorene Asare-Marfo and Ekin Birol (2015)
Maize Consumption Patterns and Consumption Preferences in Zambia, Research for Action, HarvestPlus
JAICAF (2008) ‘The Maize in Zambia and Malawi’ Kiakanua, M., A. Chichicuhua, D. V. Pedro, V. Nzambi, and H.S.C. Jezo. 2011. Characterization
of Maize Producing Households in Cacuaco and Lobito Municipalities of Angola. Country ReportAngola. Nairobi: CIMMYT.
Lilian Kirimi (2012) History of Kenyan Maize Production, Marketing and Policies; Paper presented at the Regional Workshop on an Integrated Policy Approach to Commercializing Smallholder Maize Production 6th-7th June, 2012 , at the Norfolk Hotel, Nairobi, Kenya
Lilian Kirimi, Nicholas Sitko, T.S. Jayne, Francis Karin, Milu Muyanga, Megan Sheahan, James Flock, and Gilbert Bor (2011) ‘A Farm Gate-to-Consumer Value Chain Analysis of Kenya’s Maize Marketing System’; MSU International Development Working Paper No. 111; Department of Agricultural, Food, and Resource Economics Department of Economics MICHIGAN STATE UNIVERSITY East Lansing, Michigan 48824
Lucy Styles (2015) Milling Logistical Capacity Assessment: Burundi Storage and Milling Company Contact List; http://dlca.logcluster.org/display/public/DLCA/4.2.5+Burundi+Storage+and+Milling+Company+Contact+List
Manuvanga Kiakanua, António Chichicuhua , Desideria V. Pedro, Vuvu Kua Nzambi and Helder S. C. Jezo1 (2011) Characterization of Maize Producing Households in Cacuaco and Lobito Municipalities of Angola; Drought Tolerant Maize for Africa (DTMA) Project Country Report.
Match Maker Associates (2014) Assessment of Maize Value chains in Tanzania; Study commissioned by Helen Keller International
MBendi (2016) Corn (Maize) Flour Milling in Malawi; http://www.mbendi.com/indy/fdbt/cfml/af/ma/index.htm
Mbendi Information Service (2016) Corn (Maize) Flour Milling in Tanzania; http://www.mbendi.com/indy/fdbt/cfml/af/ta/index.htm#companies
Mckee David (2016) ‘Drought Impacting Maize Outputs in southern Africa’ WorldGrain Magazine, Piloting ADM’s Future (pg52-59)
Minister Lubinda in The Post (2016) Zambia is food secure Ministry of Agriculture and Animal Resources (2011) National Post-Harvest Staple Crop
Strategy October 2011 Namibia Economic Board (2013) ‘Controlled Crops: White Maize’
http://www.nab.com.na/controlled-crops/grain/white-maize/
92
Owen Khamula (2015) Malawi: Maize Price Steadily Rises - Malawi Vendors Take Advantage of Hunger Desperation, http://allafrica.com/stories/201601250704.html
Peter Ranum, Juan Pablo and Maria Nieves (2014) Global maize production, utilization, and consumption; Ann. N.Y. Acad. Sci. 1312:105–112
Qamar (2013) Bostwana: Global Forum for Rural Advisory Services; http://www.g-fras.org/en/world-wide-extension-study/africa/southern-afrca/botswana.html
Quentin Johnson & Anna Verster (undated) Intro to Q&A session on Maize Flour Fortification at the Large Mill ; Presentation at the 1 st African Flour Fortification Workshop, Arusha, Tanzania
Rashid A. Suleiman and Kurt A. Rosentrater (2015) Current Maize Production, Postharvest Losses and the Risk of Mycotoxins Contamination in Tanzania
Robyn Joubert (2013) Maize micro mills take their claim http://www.farmersweekly.co.za/article.aspx?id=37038&h=Maize-micro-mills--stake-their-claim
Rwanda Data Portal (2013) Trade Statistics-Crop, Livestock Products and Live Animal; http://rwanda.opendataforafrica.org/jscqslc/rwanda-fao-stat-water-resources-agriculture-production-and-trade
Rwanda Development Board (2012) RWANDA Ideal Conditions for High Value Products INVESTMENT OPPORTUNITY: Maize Production
Sergiy Zorya and Shireen Mahdi (2009) High Marketing Costs and Inefficient Policies in Tanzania’s Maize Market; A Poverty Perspective, World Bank
Shellemiah Keya and Patrick Rubaihayo (2013) Progress in On-Farm Production and Productivity in the East African Community: 50 Years after Independence; Kilimo Trust Technical Paper No.8 International Symposium on Agriculture: EAC partner states at 50years 5-7 November, 2013
Spears (Pty) Ltd and BFAP (2013) JADAFA Agricultural Outlook Brief: Namibia’s Grain Markets
Stephen Kabwe, Brian Chisanga and Chance Kabaghe (2016) ‘Need to Know Facts about Staples trade in Zambia’, Food Trade Advisory Forum
T. S. Jayne, Nicholas Sitko, Jacob Ricker-Gilbert, and Julius Mangisoni (2010) Malawi’s Maize Marketing System; School of Oriental and African Studies, London
Tebogo B. Seleka, Patricia M. Makepe, Pinkie Kebakile, Letsogile Batsetswe, David Mmopelwa, Keleswetse Mbaiwa and Jose Jackson (2008) ‘The Feasibility of Mandatory Fortification of Cereals in Botswana’ Published by LIGHTBOOKS a division of LENTSWE LA LESEDI (PTY) LTD PO Box 2365, Gaborone, Botswana
Technoserve (2009) The Millennium Mills Project: Promoting Maize Mills as Business and Community Hubs in Northern Mozambique’s Grain Belt, Business Plan / Feasibility Study
The Patriot (2016) Botswana: Food Shortage Looms, As Drought Bites; http://allafrica.com/stories/201601121225.html
Tinashe Kapuya, Davison Saruchera, Admire Jongwe, Tolbert Mucheri, Kingstone Mujeyi, Lulama Ndibongo Traub, and Ferdinand Meyer THE GRAIN INDUSTRY VALUE CHAIN IN ZIMBABWE , FAO publication
93
Trevor Wilson and J. Lewis (2015) The MAIZE Value Chain in Tanzania: A report from the Southern Highlands Food Systems Programme
USAID (2010) ‘Market Assessment and Baseline Study of Staple Foods’; Country Report – Uganda
USAID (2010) Staple Foods Value Chain Analysis Country Report – Kenya USAID (2013) Rwanda Cross-border Agricultural Trade Analysis; Enabling Agricultural Trade
USDA (2016) ‘Commodity’; http://www.indexmundi.com/agriculture/?country=rw&commodity=corn&graph=production
WFP (2016) Southern Africa Growing Season 2015-2016: Facing El Nino in Difficult Circumstance; http://vam.wfp.org/CountryPage_overview.aspx?iso3=MWI
William M. Ssali (2015) Sugar, Maize and Cassava Flour Industry Assessment in Mozambique: For Purposes of Fortification under The EU-MDGLC Program; Prepared for WFP Mozambique on behalf of the National Food Fortification Program Karla Koopmann (2013) Logistics Capacity Assessment-Wiki ; http://dlca.logcluster.org/display/public/DLCA/2.7+Mozambique+Milling+Assessment
World-Grain.com (2016a) Massive maize crop failure looms, LexisNexis article; News Day Zimbabwe
World-Grain.com (2016b) Government Orders 500 000t Drought Relief Grain, Zimbabwe.