Embed Size (px)
Citation preview

Cell Stem Cell, Volume 14
Supplemental Information
Multifaceted Regulation of Somatic Cell
Reprogramming by mRNA Translational Control
Soroush Tahmasebi, Tommy Alain, Vinagolu K. Rajasekhar, Jiang-Ping Zhang, Masha Prager-
Khoutorsky, Arkady Khoutorsky, Yildirim Dogan, Christos G. Gkogkas, Emmanuel Petroulakis,
Annie Sylvestre, Mohammad Ghorbani, Sarah Assadian, Yojiro Yamanaka, Julia R. Vinagolu
Baur, José G. Teodoro, Kitai Kim, Xiang-Jiao Yang, and Nahum Sonenberg
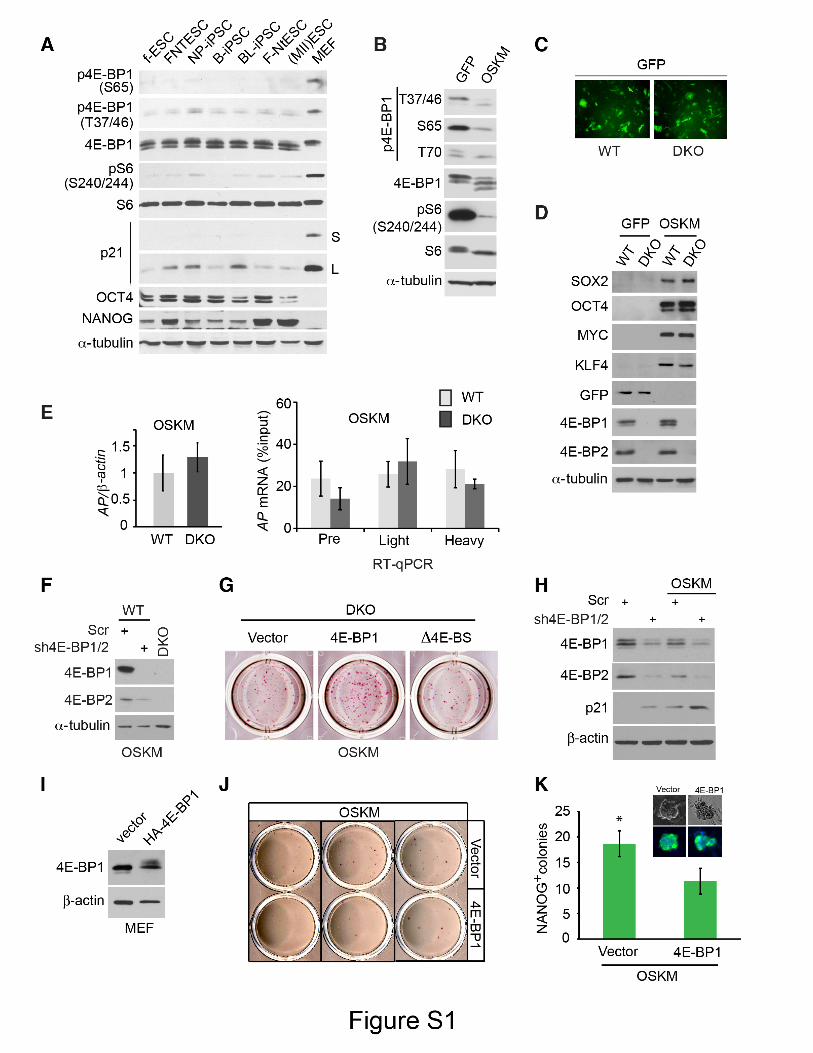
Supplemental Figure Legends Figure S1. 4E-BPs play a major role in the control of pluripotency, related to Figure 1.
(A) Expression and phosphorylation of the indicated proteins in pluripotent cells of various origins
(see manuscript text) were monitored by Western blotting. α-tubulin served as a loading control.
(B) WT MEFs were infected with GFP or OSKM expressing lentivectors and the amounts and
phosphorylation of the indicated proteins were determined by Western blotting on day 7 following
infection.
(C) Expression of GFP in GFP-transduced WT and DKO MEFs was monitored by fluorescence
imaging.
(D) Expression of OSKM and GFP was monitored in WT and DKO MEFs by Western blotting. α-
tubulin served as a loading control.
(E) Input mRNA and polysomal distributions of Alkaline phosphatase (AP) mRNA in WT and DKO
MEFs infected with OSKM for 12 days were monitored by RT-qPCR. Values are expressed as a
percentage of total AP mRNA (input). Data are presented as mean ± SD (n=3). Pre: RNP, 40S, 60S
and 80S fractions; Light: 2-3 ribosomes; Heavy: 4 and more ribosomes.
(F) WT MEFs were co-infected with OSKM and a scrambled shRNA (Scr) or shRNAs targeting 4E-
BP1 and 2 (sh4E-BP1/2). The levels of 4E-BP1 and 2 were monitored by Western blotting 48 h post-
infection. α-tubulin served as a loading control.
(G) DKO MEFs were co-infected with OSKM and a vector, WT 4E-BP1 (4E-BP1) or a 4E-BP1
mutant lacking the eIF4E-binding site (Δ4E-BS). Cells were stained with alkaline phosphatase staining
kit at 7 days post-infection.
(H) Levels of p21 protein in MEFs infected with lentivirus expressing a scrambled shRNA (Scr) or
shRNAs against 4E-BP1 and 2 (sh4E-BP1/2) in the presence or absence of reprogramming factors,
was monitored on day 7 of reprogramming.
(I) Western blot analysis of 4E-BP1 levels in MEFs expressing vector or HA-4E-BP1, 48 hours after
infection with OSKM expression lentivectors.
(J) MEFs infected with a vector or HA-4E-BP1 were co-infected with OSKM expression vector and
seeded on feeder layer. On day 7 after infection, cells were fixed, and reprogramming was monitored
by AP staining.
(K) NANOG immunostaining of cells described in (J) was performed on day 14 after infection.
Results are presented as a mean number of NANOG+ colonies. The NANOG immunofluorescence
staining of a colony for each experimental condition is presented in the insets. [ ± SD (n=3). *P <
0.05 (paired Student’s t-test)].
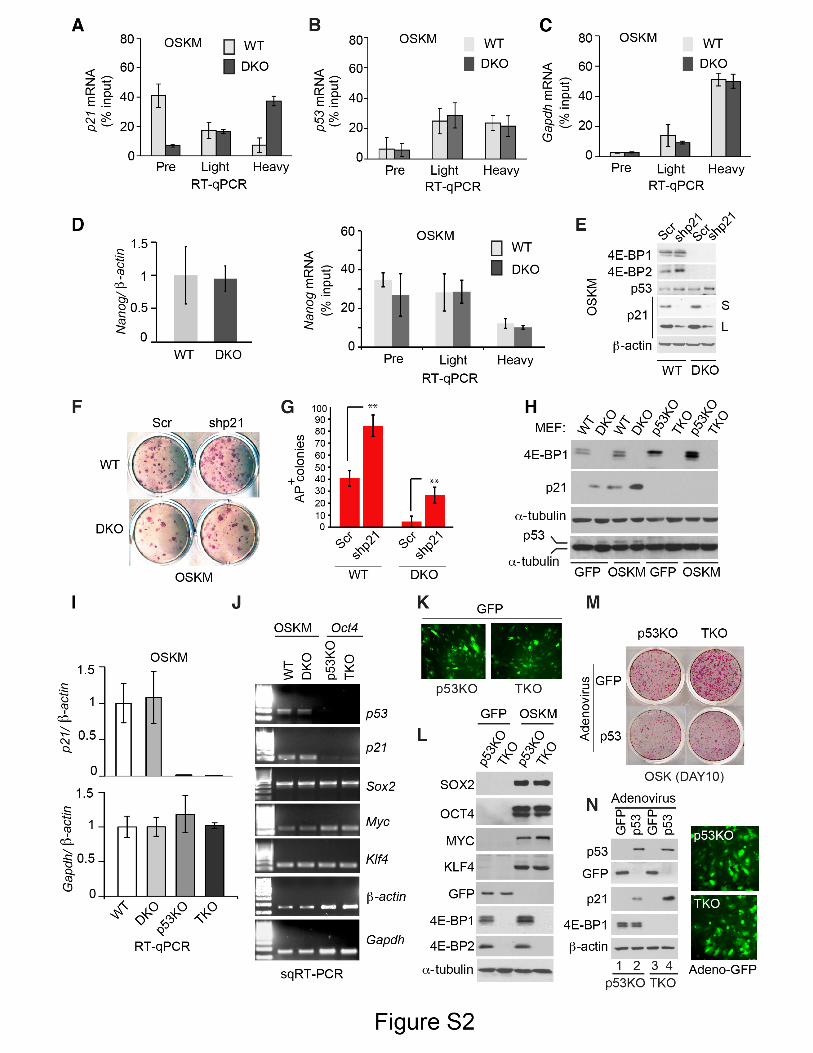
Figure S2. 4E-BPs stimulate reprogramming by repressing translation of p21 mRNA, related to
Figure 2.
(A-D) Input mRNA and/or Polysomal distributions of p21 (A), p53 (B), Gapdh (C) and Nanog (D)
mRNAs in WT and DKO MEFs infected with OSKM expression lentivectors for 12 days were
monitored by RT-qPCR. Values are expressed as a percentage of total levels of corresponding mRNAs
(input). Input value for p21, p53 and Gapdh presented in Figure 2A. Data are presented as mean
values ± SD (n=3). Pre: RNP, 40S, 60S and 80S fractions; Light: 2-3 ribosomes; Heavy: 4 and more
ribosomes.
(E) WT and DKO MEFs were infected with OSKM in the presence of either scrambled shRNA
(Scr) or shRNA against p21 (shp21). Expression of the indicated proteins was determined by
Western blotting 48 hours after infection. β-actin served as a loading control. S-short exposure; L-
long exposure.
(F) Cells described in (E) were stained for Alkaline phosphatase at 7 days after infection.
(G) Results shown in (F), are presented as a mean number of AP+ colonies [± SD (n=3). **P < 0.01
(paired Student’s t-test)].
(H and I) WT, DKO, p53KO and TKO MEFs were infected with OSKM expression lentivectors for
12 days and the levels of the indicated proteins (H) and mRNAs (I) were monitored. RT-qPCR data
were normalized to β-actin mRNA and the values for WT MEFs were set to 1. Data presented as the
mean values [± SD (n=3)].
(J) Levels of the indicated mRNAs in OSKM-infected WT and DKO MEFs or Oct4-infected p53KO
and TKO MEFs were monitored by sqRT-PCR. β-actin and Gapdh mRNAs were used as loading
controls.
(K) Expression of GFP in GFP-transduced p53KO and TKO MEFs was monitored by fluorescence
imaging.
(L) Expression of OSKM and GFP in p53KO and TKO MEFs was monitored by Western blot, α-
tubulin served as a loading control.
(M) p53KO and TKO MEFs were co-infected with OSK and adenoviruses expressing GFP or p53. At
day 10 post-infection cells were fixed and reprogramming was monitored by alkaline phosphatase
staining
(N) Expression of the indicated proteins in p53KO and TKO MEFs were co-infected with
reprogramming factors and adenoviruses expressing GFP or p53 was determined by Western blotting
at 2 days after infection. β-actin served as a loading control. Expression of GFP in GFP-transduced
cells was monitored by fluorescence imaging.
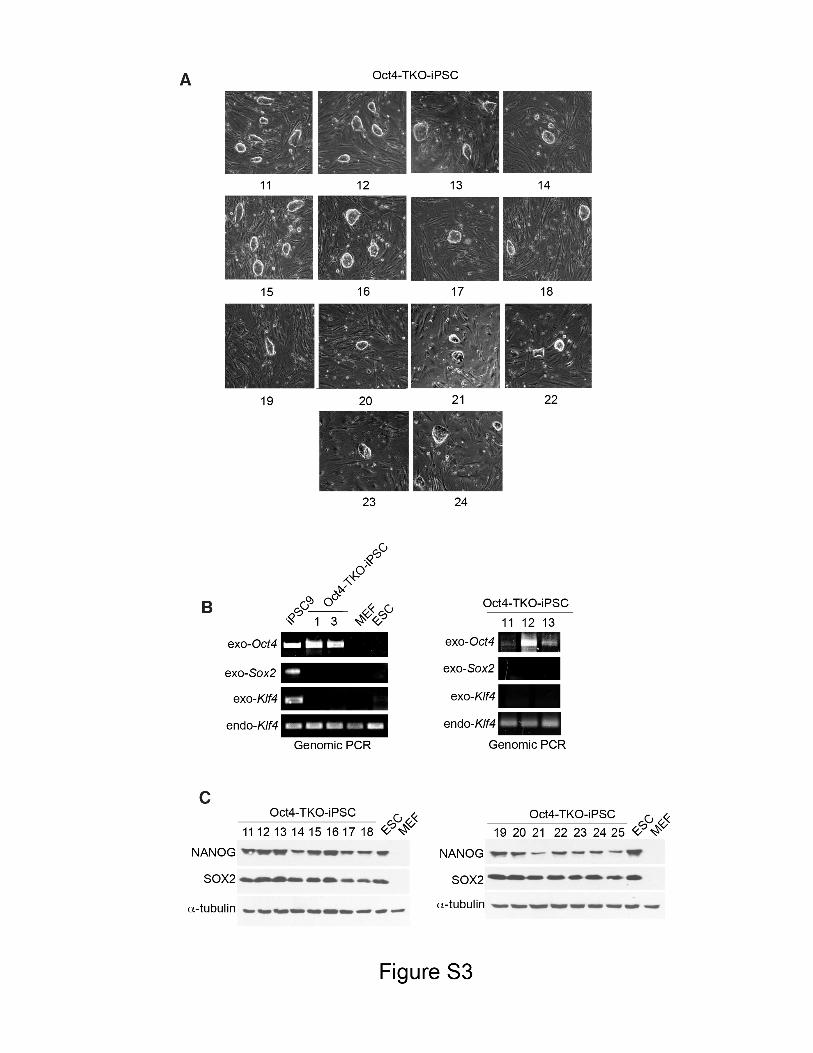
Figure S3. Characterization of Oct4-TKO-iPSC clones, related to Figure 3.
(A) Micrographs representing phase-contrast images of 14 different Oct4-TKO-iPSC clones.
(B) Genomic PCRs of selected Oct4-TKO-iPSC clones demonstrate the presence of exogenous Oct4
and the absence of exogenous Sox2 and Klf4. iPSC-9 clone which was generated by OSKM infection
served as a positive control. Mouse embryonic stem cells (mESC) and mouse embryonic fibroblasts
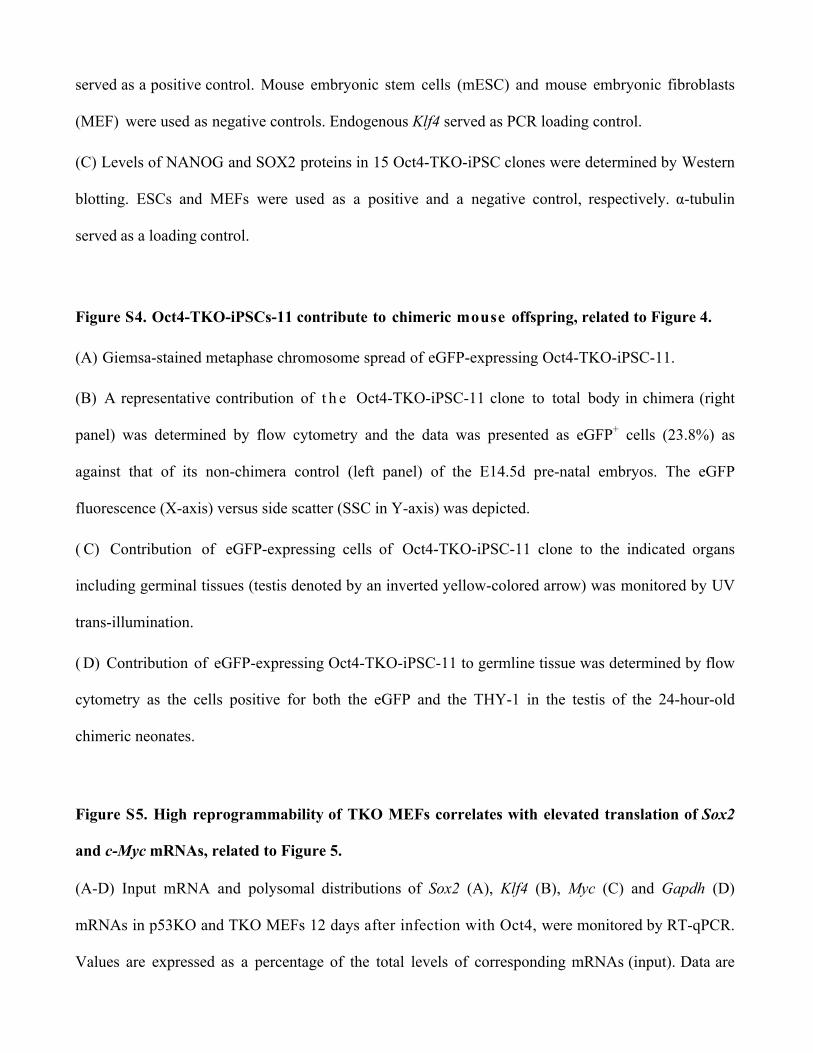
(MEF) were used as negative controls. Endogenous Klf4 served as PCR loading control.
(C) Levels of NANOG and SOX2 proteins in 15 Oct4-TKO-iPSC clones were determined by Western
blotting. ESCs and MEFs were used as a positive and a negative control, respectively. α-tubulin
served as a loading control.
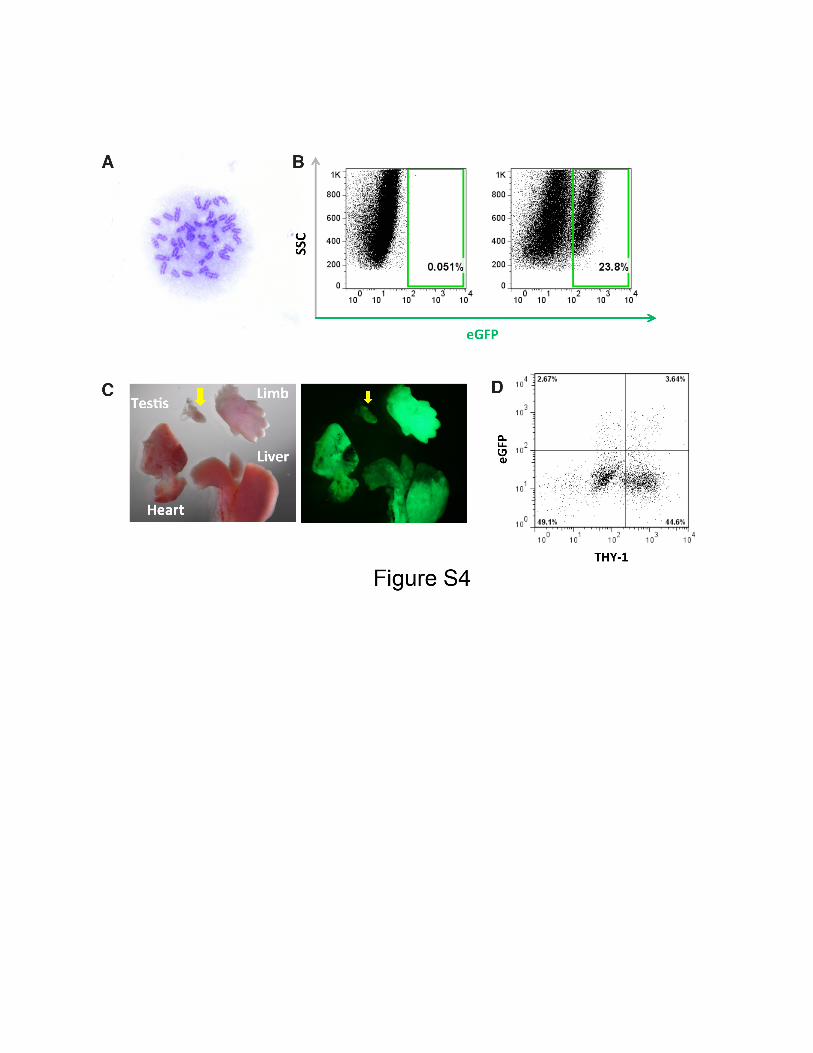
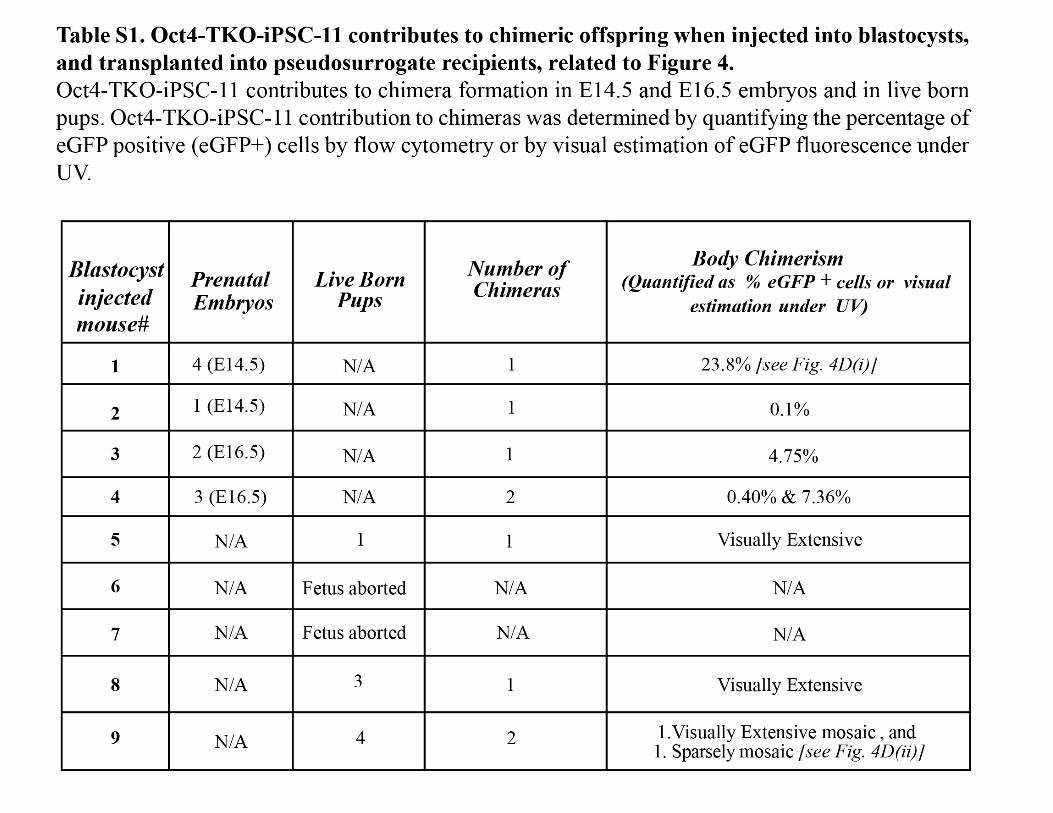
Figure S4. Oct4-TKO-iPSCs-11 contribute to chimeric mouse offspring, related to Figure 4.
(A) Giemsa-stained metaphase chromosome spread of eGFP-expressing Oct4-TKO-iPSC-11.
(B) A representative contribution of t h e Oct4-TKO-iPSC-11 clone to total body in chimera (right
panel) was determined by flow cytometry and the data was presented as eGFP+ cells (23.8%) as
against that of its non-chimera control (left panel) of the E14.5d pre-natal embryos. The eGFP
fluorescence (X-axis) versus side scatter (SSC in Y-axis) was depicted.
( C) Contribution of eGFP-expressing cells of Oct4-TKO-iPSC-11 clone to the indicated organs
including germinal tissues (testis denoted by an inverted yellow-colored arrow) was monitored by UV
trans-illumination.
( D) Contribution of eGFP-expressing Oct4-TKO-iPSC-11 to germline tissue was determined by flow
cytometry as the cells positive for both the eGFP and the THY-1 in the testis of the 24-hour-old
chimeric neonates.
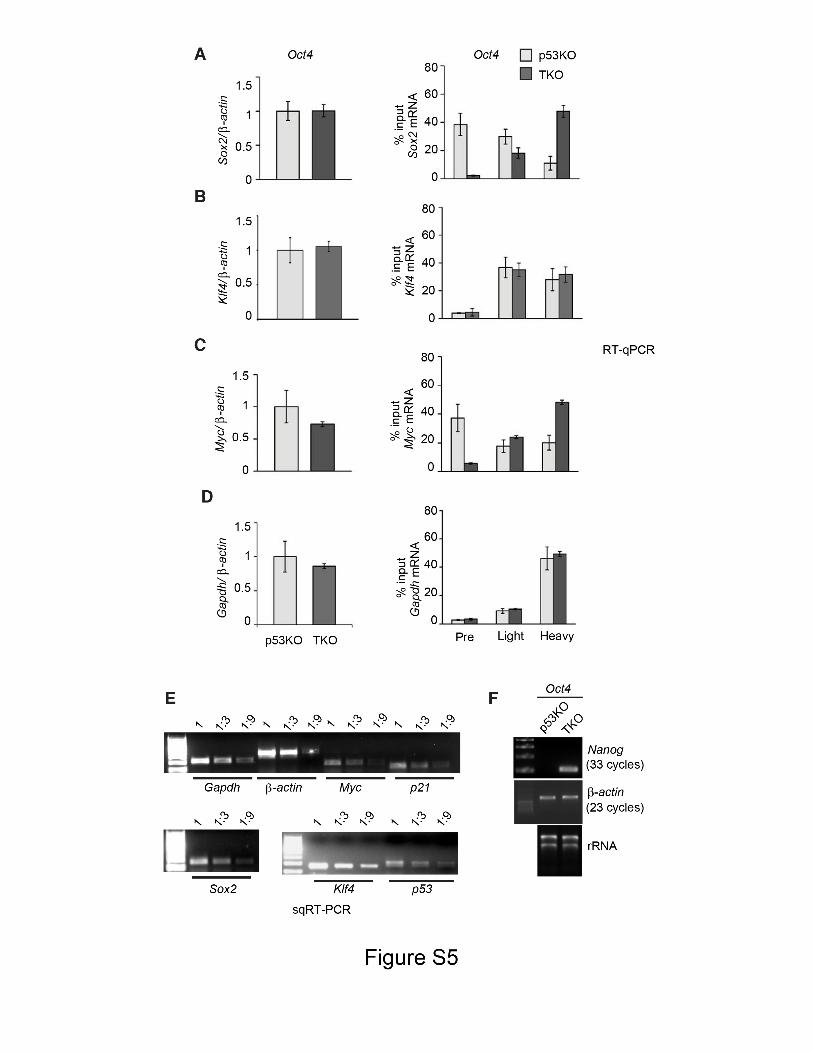
Figure S5. High reprogrammability of TKO MEFs correlates with elevated translation of Sox2
and c-Myc mRNAs, related to Figure 5.
(A-D) Input mRNA and polysomal distributions of Sox2 (A), Klf4 (B), Myc (C) and Gapdh (D)
mRNAs in p53KO and TKO MEFs 12 days after infection with Oct4, were monitored by RT-qPCR.
Values are expressed as a percentage of the total levels of corresponding mRNAs (input). Data are
presented as mean values ± SD (n=3). Pre: RNP, 40S, 60S and 80S fractions; Light: 2-3 ribosomes;
Heavy: 4 and more ribosomes.
(E) sqRT-PCRs were carried out using serial dilutions of RNA isolated from WT MEFs to ascertain
that the sqRT-PCR reactions presented in Figs. 2C, 5C and Fig. S2J were in a linear (quantifiable)
range.
(F) RNA extracted from Oct4-transduced p53KO and TKO MEFs, were examined 12 days after
infection by sqRT-PCR for expression of Nanog and β-actin.
Experimental Procedures
Animals and MEF isolation: The Animal Ethics Committee of the McGill University approved all
the animal procedures. DKO (4E-BP1/2-/-) mice and TKO (p53-/-; 4E-BP1/2-/-) mice were described
(Petroulakis et al., 2009). To generate TKO (p53-/-; 4E-BP1/2-/-) mice, p53-/- mice (Taconic, p53N12-
M homozygotes) were intercrossed with DKO (4E-BP1/2-/-) mice as described (Petroulakis et al.,
2009). All mice were in the C57BL/6 background. MEFs were derived from 13.5-day post coitus
mouse embryos as described (Takahashi et al., 2007). Briefly, 13.5-day post coitus pregnant mice
were sacrificed by cervical dislocation and under sterile condition the embryos were surgically
removed from uterus. The head, limbs, tail, and liver were removed and surgical blade was used to cut
the body to small pieces. Body pieces were trypsinized in 0.25% trypsin three times, 30 min each.
The resulting cells were collected by centrifugation and expanded on 10 cm culture dishes. MEFs with
three or less passages were used for iPSC generation. To prepare feeder layer, low passage MEFs
were inactivated by irradiation (6000 rads) or mitomycin C (10 µg/ml for 3 h).
iPSCs differentiation: After trypsinization 800-2000 iPSCs were cultured in a hanging drop
containing differentiation medium [DMEM, 20% fetal bovine serum, penicillin (50 µg/ml) and
streptomycin (50 µg/ml)]. After two days, the resulting embryoid bodies were cultured in the presence
or absence of retinoic acid (0.5 µM) for four days followed by four days of culturing in normal
differentiation media. Neurons and primitive blood vessels started to appear at day 6-8 of
differentiation. Adipocyte colonies formed between 10 to 15 days after plating.
Immunofluorescence microscopy: iPSCs were cultured on cover slips or in microscopy
chambers and fixed with 2% paraformaldehyde for 20 min. After washing with PBS, cells were
permeabilized with 0.2% Triton X-100 solution in PBS for 10 min, washed three times with 100 mM
glycine/PBS, and blocked with 2% BSA in IF buffer (0.2% Triton X-100 and 0.05% Tween-20 in
PBS) for 30 min. Subsequently, cells were incubated with t h e indicated primary antibodies (1:100
dilution) for 1 hour at room temperature or overnight at 4ºC, washed three times in PBS and
incubated with fluorescent conjugated secondary antibody (1:1000 dilution) for 45 min. DAPI (4', 6-
diamidino-2-phenylindole) was used to counterstain the nuclei. Micrographs were obtained using Zeiss
Axiovert 135 Fluorescence Microscope and processed using Adobe Photoshop software.
Teratoma formation assay: 1x10⁶ iPSCs were resuspended in 100 µl 50% Matrigel in PBS. The
mixture was injected subcutaneously into the flank of a nude mouse. 3 weeks after injection, mice
were sacrificed and the tumors were surgically removed for sectioning and histological analysis.
Generation and analysis of chimeric mice: After infection with the eGFP-lentivirus, eGFP-
positive iPSCs were purified by fluorescence activated cell sorting (FACS), chromosome number
counted (Kim et al., 2007), and expanded on a layer of inactivated MEFs. Chimeras were
generated by injecting female donor mice (B6-albino (C2J): B6(Cg)-Tyrc-2J/Jackson) blastocysts with
the eGFP-expressing iPSCs (~15 iPSCs/blastocyst) and then by transferring to pseudo-pregnant
surrogate recipient mice (~12 blastocysts per pseudosurrogate) (CBA male X B6 female= B6CBA-
F1/Jackson) as described (Kim et al., 2010) using the Mouse Genetics Core facility at the Memorial
Sloan-Kettering Cancer Center, New York. Organ tissue dissociation, antibody binding, and FACS
analysis for co-expression of eGFP and phycoerythrin conjugated markers were performed as reported
(Rajasekhar et al., 2011).
Antibodies: Antibodies against Sox2 (Y-17), KLF4 (H-180), Oct3/4 (H-134), p53 (FL-393), N-Myc
(C-19), ribosomal protein S6 (C-8), and GFP (sc-8334) were from Santa Cruz Biotechnology.
p21 Waf1/Cip1 (DCS60), SSEA-1 (MC-480), 4E-BP1 (53H11), 4E-BP2 (2845), phospho-4E-BP1
[pT37/46 (236B4), pS65 (174A9) and pT70 (9455)] and phospho-S6 ribosomal protein (pS240/244,
2215) were from Cell Signaling Technology. Additional antibodies were: CD-90/THY-1 (551401)
and p21 (556431) from BD Biosciences, c-Myc (1472-1, Epitomics), NANOG (BL1662, Bethyl
Laboratories), TUJ-1 (MMS-435P, COVANCE), MAP2 (M4403, Sigma), PECAM-1 (Millipore04-
1074), and α-tubulin (T-5168, Sigma). Rabbit polyclonal antibody against eIF4GI was described

(Wakiyama et al., 2000).
PCR primers: The sense and antisense primers are as follows: Nanog-F, CAGGTGTTTGAG GGTAGCTC; Nanog-R, CGGTTCATCATGGTACAGTC; Eras-F, ACTGCCCCTCATCAG
ACTGCTACT; Eras-R, CACTGCCTTGTACTCGGGTAGCTG; Rex1-F, ACGAGTGGCAGT
TTCTTCTTGGGA; Rex1-R; TATGACTCACTTCCAGGGGGCACT; Dax1-F, TGCTGCGGT
CCAGGCCATCAAGAG; Dax1-R, GGGCACTGTTCAGTTCAGCGGATC; KLF4RT1F,
TTCTCCACGTTCGCGTCCGG; KLF4RT1R, ACGCCAACGGTTAGTCGGGGC; MycRT1F,
GCCGCCGCTGGGAAACTTTG; MycRT1R, GGCTGTCTGCGGGGTTTCCAAC; Oct4RT2F,
CTTCCCCATGGCTGGACACCTG; Oct4RT2R, TCCTGGGACTCCTCGGGAGTTGG; Sox2RT2F,
AGGAGTTGTCAAGGCAGAGAAGAGA; Sox2RT2R,GCCGCCGCGATTGTT GTGATT;
mcp21F2, CCAGTTGGGGTTCTCAGTGACTTC; mcp21R2;TCAGCCATTGCTCA GTGTCCTG;
ACT01, GGACTCCTATGTGGGTGACGA; ACT02, GGGAGAGCATAGCC CTCGTAG. Alp1-F1,
CGGAACAGACCCTCCCCACGAG; Alp1-R1, GCAGGTGCCGATG GCCAGTACTA; MAP2-RT-
F1, CATCGCCAGCCTCGGAACAA; mMAP2-R2, TCCACCAC CTGGCCTGTGAC; Gata-6-F1,
ACCTTATGGCGTAGAAATGCTGAGGGTG,; Gata-6-R1,
CTGAATACTTGAGGTCACTGTTCTCGGG; Brachyury-F1, ATGCCAAAGAAAGAAAC GAC;
Brachyury-R1, AGAGGCTGTAGAACATGATT; p53F, ACATGACGGAGGTCGT GAGA and p53R
TTTCCTTCCACCCGGATAAG; Gapdh primers were obtained form Applied Biosystems. Primers
used for genotyping were: Oct4-05, TTTCCCGAATTCCCGGAGGAGTCCCA; Oct4-06,
CCCTTTGGATCCTCGTTG TGCATAGT; hSox2-F2, AGGACCAGCTGGGCTACCCG; hSox2-R2,
GCCAAGAGCCATGCCAGGGG; KLF4RT-1R, ACGCCAACGGTTAGTCGGGGC; CMV-F,
CGCAAATG GGCGGTAGGCGTG; β-actin MF,GGCTGTATTCCCCTCCATCG, β-actin MR,
CCAGTTGGTAACAATGCCATGT.
References
Kim, K., Doi, A., Wen, B., Ng, K., Zhao, R., Cahan, P., Kim, J., Aryee, M.J., Ji, H., Ehrlich, L.I., et al.
(2010). Epigenetic memory in induced pluripotent stem cells. Nature 467, 285-290.
Kim, K., Lerou, P., Yabuuchi, A., Lengerke, C., Ng, K., West, J., Kirby, A., Daly, M.J., and Daley,
G.Q. (2007). Histocompatible embryonic stem cells by parthenogenesis. Science 315, 482-486.
Petroulakis, E., Parsyan, A., Dowling, R.J., LeBacquer, O., Martineau, Y., Bidinosti, M., Larsson, O.,
Alain, T., Rong, L., Mamane, Y., et al. (2009). p53-dependent translational control of senescence and
transformation via 4E-BPs. Cancer Cell 16, 439-446.
Rajasekhar, V.K., Studer, L., Gerald, W., Socci, N.D., and Scher, H.I. (2011). Tumour-initiating stem-
like cells in human prostate cancer exhibit increased NF-kappaB signalling. Nat Commun 2, 162.
Takahashi, K., Okita, K., Nakagawa, M., and Yamanaka, S. (2007). Induction of pluripotent stem cells
from fibroblast cultures. Nat Protoc 2, 3081-3089.
Wakiyama, M., Imataka, H., and Sonenberg, N. (2000). Interaction of eIF4G with poly(A)-binding
protein stimulates translation and is critical for Xenopus oocyte maturation. Curr Biol 10, 1147-1150.