Embed Size (px)
Citation preview
Suntory Holdings Limited and Consolidated Subsidiaries Consolidated Financial Statements for the Year Ended December 31, 2018, and Independent Auditor's Report
- 2 -
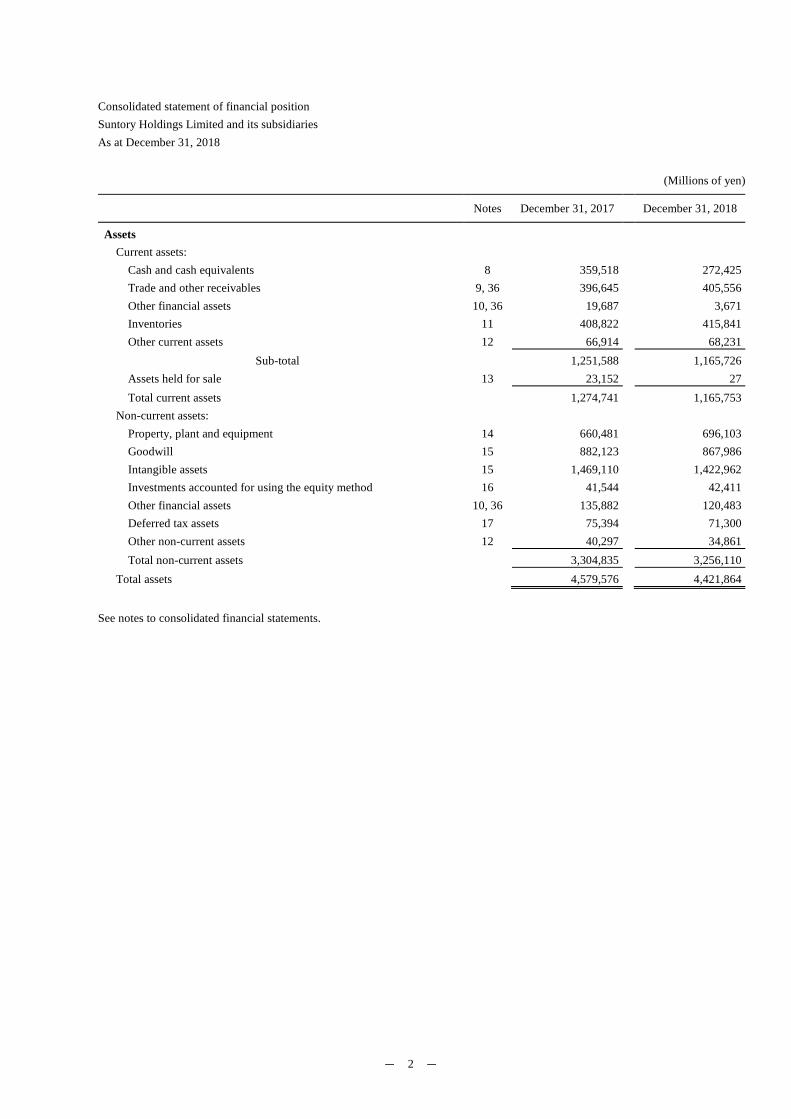
Consolidated statement of financial position Suntory Holdings Limited and its subsidiaries As at December 31, 2018
(Millions of yen)
Notes December 31, 2017 December 31, 2018
Assets
Current assets:
Cash and cash equivalents 8 359,518 272,425 Trade and other receivables 9, 36 396,645 405,556 Other financial assets 10, 36 19,687 3,671 Inventories 11 408,822 415,841 Other current assets 12 66,914 68,231
Sub-total 1,251,588 1,165,726 Assets held for sale 13 23,152 27 Total current assets 1,274,741 1,165,753
Non-current assets:
Property, plant and equipment 14 660,481 696,103 Goodwill 15 882,123 867,986 Intangible assets 15 1,469,110 1,422,962 Investments accounted for using the equity method 16 41,544 42,411 Other financial assets 10, 36 135,882 120,483 Deferred tax assets 17 75,394 71,300 Other non-current assets 12 40,297 34,861 Total non-current assets 3,304,835 3,256,110
Total assets 4,579,576 4,421,864
See notes to consolidated financial statements.
- 3 -
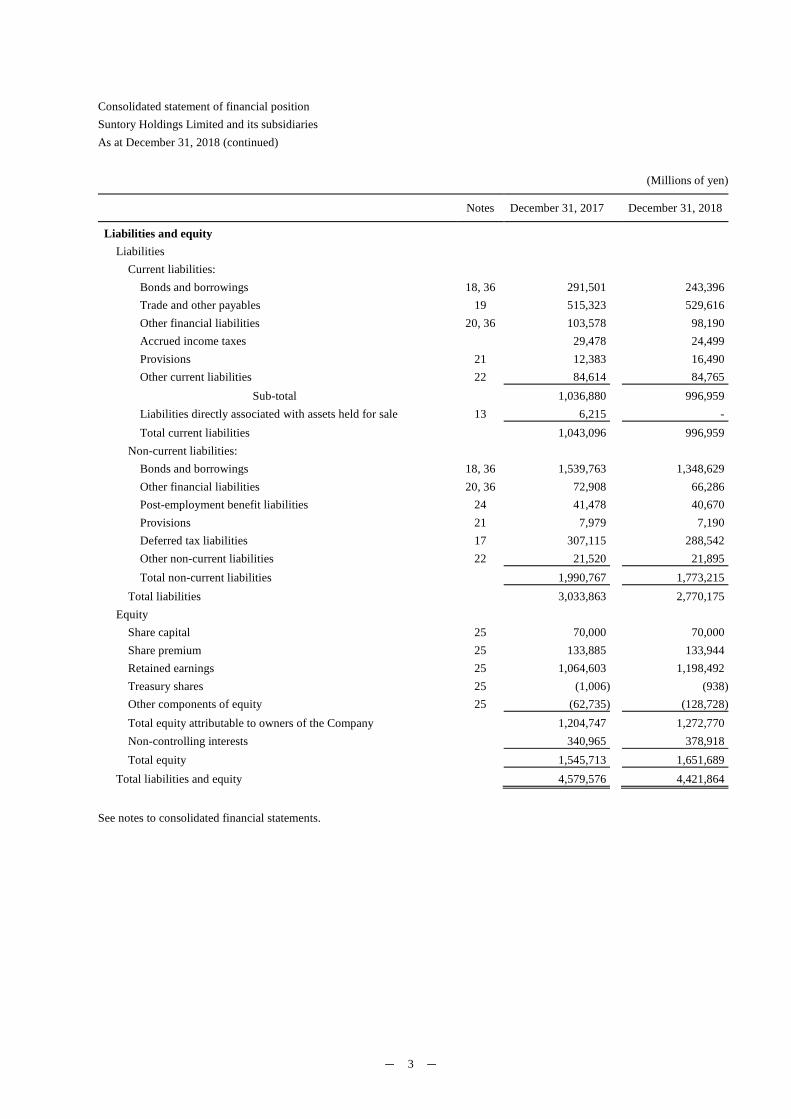
Consolidated statement of financial position Suntory Holdings Limited and its subsidiaries As at December 31, 2018 (continued)
(Millions of yen)
Notes December 31, 2017 December 31, 2018
Liabilities and equity
Liabilities
Current liabilities:
Bonds and borrowings 18, 36 291,501 243,396 Trade and other payables 19 515,323 529,616 Other financial liabilities 20, 36 103,578 98,190 Accrued income taxes 29,478 24,499 Provisions 21 12,383 16,490 Other current liabilities 22 84,614 84,765
Sub-total 1,036,880 996,959 Liabilities directly associated with assets held for sale 13 6,215 - Total current liabilities 1,043,096 996,959
Non-current liabilities:
Bonds and borrowings 18, 36 1,539,763 1,348,629 Other financial liabilities 20, 36 72,908 66,286 Post-employment benefit liabilities 24 41,478 40,670 Provisions 21 7,979 7,190 Deferred tax liabilities 17 307,115 288,542 Other non-current liabilities 22 21,520 21,895 Total non-current liabilities 1,990,767 1,773,215
Total liabilities 3,033,863 2,770,175 Equity
Share capital 25 70,000 70,000 Share premium 25 133,885 133,944 Retained earnings 25 1,064,603 1,198,492 Treasury shares 25 (1,006) (938)Other components of equity 25 (62,735) (128,728)Total equity attributable to owners of the Company 1,204,747 1,272,770 Non-controlling interests 340,965 378,918 Total equity 1,545,713 1,651,689
Total liabilities and equity 4,579,576 4,421,864
See notes to consolidated financial statements.
- 4 -
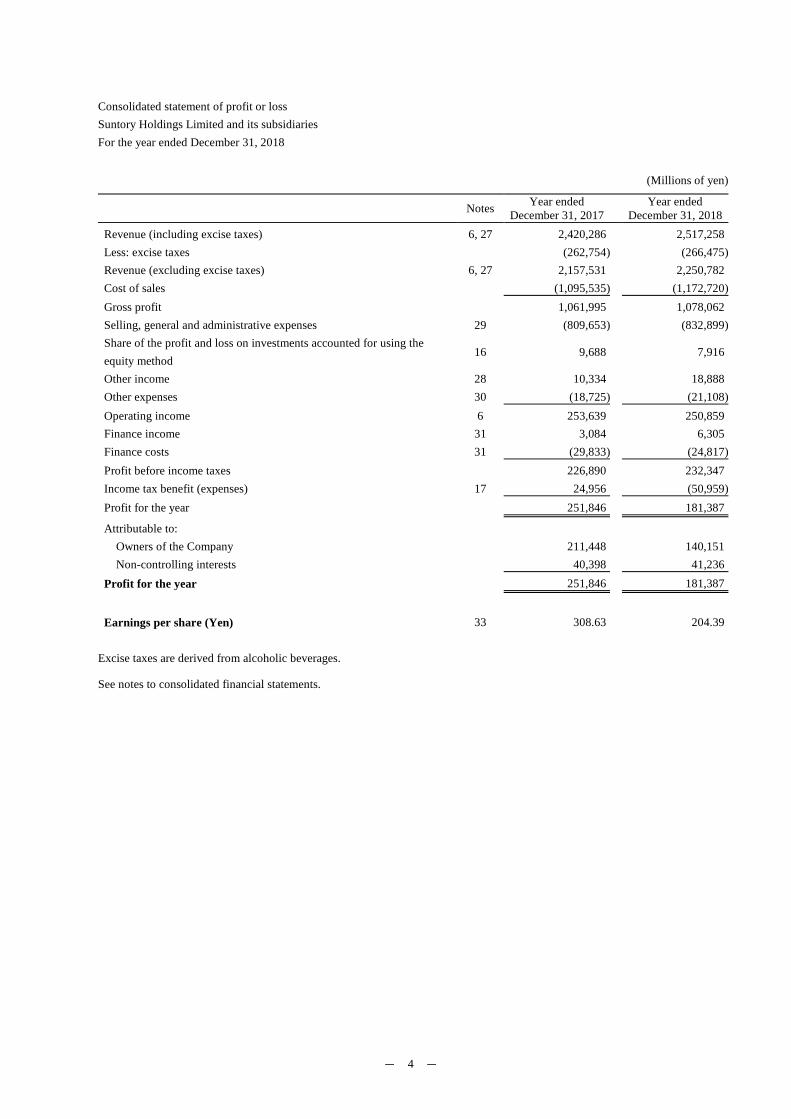
Consolidated statement of profit or loss Suntory Holdings Limited and its subsidiaries For the year ended December 31, 2018
(Millions of yen)
Notes Year ended December 31, 2017
Year ended December 31, 2018
Revenue (including excise taxes) 6, 27 2,420,286 2,517,258 Less: excise taxes (262,754) (266,475)Revenue (excluding excise taxes) 6, 27 2,157,531 2,250,782 Cost of sales (1,095,535) (1,172,720)Gross profit 1,061,995 1,078,062 Selling, general and administrative expenses 29 (809,653) (832,899)Share of the profit and loss on investments accounted for using the equity method
16 9,688 7,916
Other income 28 10,334 18,888 Other expenses 30 (18,725) (21,108)Operating income 6 253,639 250,859 Finance income 31 3,084 6,305 Finance costs 31 (29,833) (24,817)Profit before income taxes 226,890 232,347 Income tax benefit (expenses) 17 24,956 (50,959)Profit for the year 251,846 181,387
Attributable to:
Owners of the Company 211,448 140,151 Non-controlling interests 40,398 41,236
Profit for the year 251,846 181,387
Earnings per share (Yen) 33 308.63 204.39
Excise taxes are derived from alcoholic beverages.
See notes to consolidated financial statements.
- 5 -
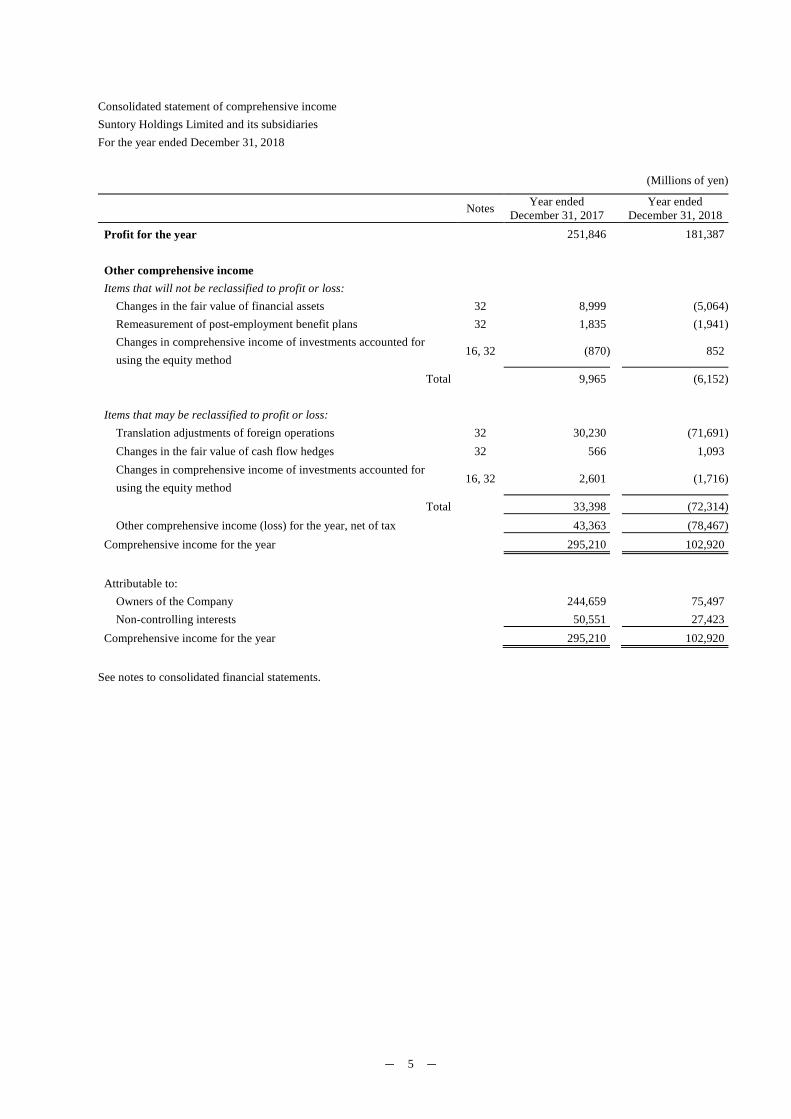
Consolidated statement of comprehensive income Suntory Holdings Limited and its subsidiaries For the year ended December 31, 2018
(Millions of yen)
Notes Year ended December 31, 2017
Year ended December 31, 2018
Profit for the year 251,846 181,387
Other comprehensive income
Items that will not be reclassified to profit or loss:
Changes in the fair value of financial assets 32 8,999 (5,064)Remeasurement of post-employment benefit plans 32 1,835 (1,941)Changes in comprehensive income of investments accounted for using the equity method
16, 32 (870) 852
Total 9,965 (6,152)
Items that may be reclassified to profit or loss:
Translation adjustments of foreign operations 32 30,230 (71,691)Changes in the fair value of cash flow hedges 32 566 1,093 Changes in comprehensive income of investments accounted for using the equity method
16, 32 2,601 (1,716)
Total 33,398 (72,314)Other comprehensive income (loss) for the year, net of tax 43,363 (78,467)
Comprehensive income for the year 295,210 102,920
Attributable to:
Owners of the Company 244,659 75,497 Non-controlling interests 50,551 27,423
Comprehensive income for the year 295,210 102,920
See notes to consolidated financial statements.

- 6 -
Consolidated statement of changes in equity Suntory Holdings Limited and its subsidiaries For the year ended December 31, 2018
(Millions of yen) Attributable to owners of the Company
Non-controlling
interests
Total equity Notes
Share capital
Share
premium
Retained earnings
Treasury shares
Other components
of equity Total
Balance at December 31, 2016 70,000 133,251 851,912 (1,598) (86,586) 966,979 305,155 1,272,134 Cumulative effect of adopting new accounting standards
783 783 (290) 492
Balance at January 1, 2017 70,000 133,251 851,912 (1,598) (85,802) 967,762 304,864 1,272,627 Profit for the year 211,448 211,448 40,398 251,846 Other comprehensive income 33,211 33,211 10,152 43,363
Total comprehensive income for the year
- - 211,448 - 33,211 244,659 50,551 295,210
Disposals of treasury shares 534 591 1,125 1,125 Dividends 26 (8,902) (8,902) (15,141) (24,043)Transfer from other components of equity to retained earnings
10,145 (10,145) - -
Changes in ownership interests in subsidiaries that do not involve loss of controls
99 1 101 691 793
Total transactions with owners of the Company
- 633 1,243 591 (10,143) (7,675) (14,449) (22,124)
Balance at December 31, 2017 70,000 133,885 1,064,603 (1,006) (62,735) 1,204,747 340,965 1,545,713 Cumulative effect of adopting new accounting standards
1,356 1,356 1,356
Balance at January 1, 2018 70,000 133,885 1,065,959 (1,006) (62,735) 1,206,103 340,965 1,547,069 Profit for the year 140,151 140,151 41,236 181,387 Other comprehensive income (loss)
(64,654) (64,654) (13,813) (78,467)
Total comprehensive income (loss) for the year
- - 140,151 - (64,654) 75,497 27,423 102,920
Disposals of treasury shares 90 68 159 159 Dividends 26 (8,913) (8,913) (16,401) (25,315)Increase due to business combinations
7 - 26,881 26,881
Transfer from other components of equity to retained earnings
1,295 (1,295) - -
Changes in ownership interests in subsidiaries that do not involve loss of control
(32) (43) (76) 50 (25)
Total transactions with owners of the Company
- 58 (7,618) 68 (1,338) (8,829) 10,529 1,699
Balance at December 31, 2018 70,000 133,944 1,198,492 (938) (128,728) 1,272,770 378,918 1,651,689
See notes to consolidated financial statements.
- 7 -
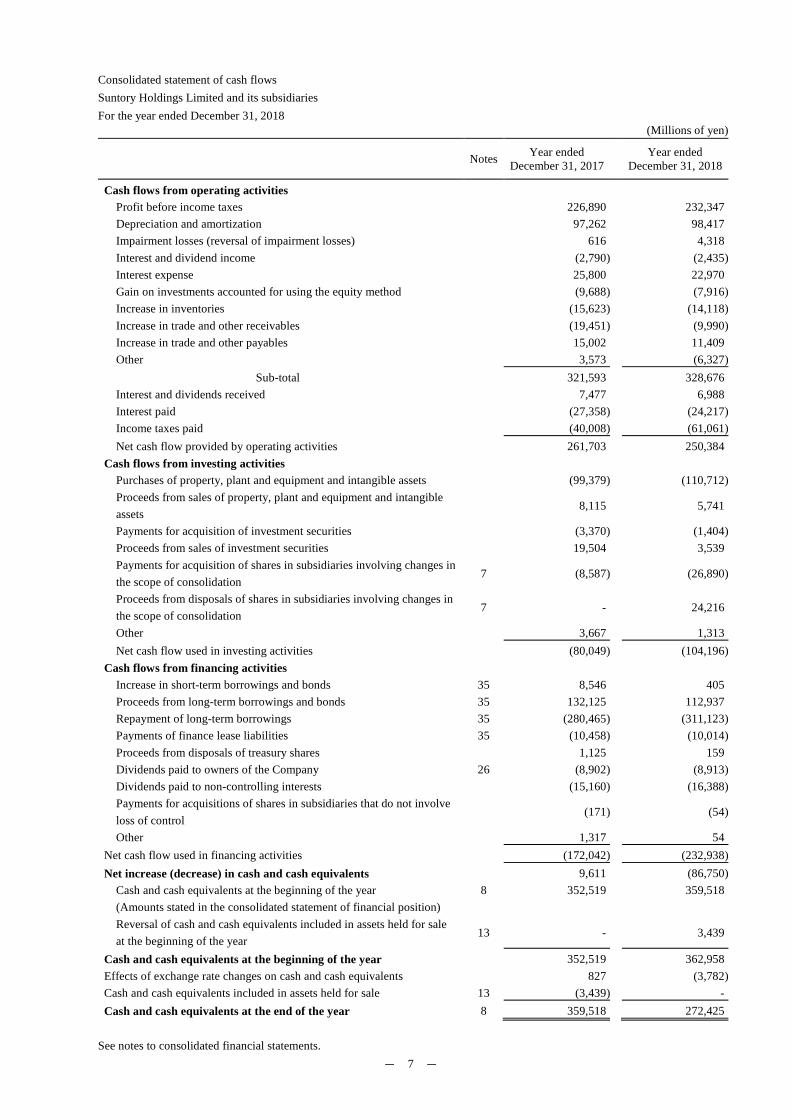
Consolidated statement of cash flows Suntory Holdings Limited and its subsidiaries For the year ended December 31, 2018
(Millions of yen)
Notes Year ended December 31, 2017
Year ended December 31, 2018
Cash flows from operating activities
Profit before income taxes 226,890 232,347 Depreciation and amortization 97,262 98,417 Impairment losses (reversal of impairment losses) 616 4,318 Interest and dividend income (2,790) (2,435)Interest expense 25,800 22,970 Gain on investments accounted for using the equity method (9,688) (7,916)Increase in inventories (15,623) (14,118)Increase in trade and other receivables (19,451) (9,990)Increase in trade and other payables 15,002 11,409 Other 3,573 (6,327)
Sub-total 321,593 328,676 Interest and dividends received 7,477 6,988 Interest paid (27,358) (24,217)Income taxes paid (40,008) (61,061)Net cash flow provided by operating activities 261,703 250,384
Cash flows from investing activities
Purchases of property, plant and equipment and intangible assets (99,379) (110,712)Proceeds from sales of property, plant and equipment and intangible assets
8,115 5,741
Payments for acquisition of investment securities (3,370) (1,404)Proceeds from sales of investment securities 19,504 3,539 Payments for acquisition of shares in subsidiaries involving changes in the scope of consolidation
7 (8,587) (26,890)
Proceeds from disposals of shares in subsidiaries involving changes in the scope of consolidation
7 - 24,216
Other 3,667 1,313 Net cash flow used in investing activities (80,049) (104,196)
Cash flows from financing activities
Increase in short-term borrowings and bonds 35 8,546 405 Proceeds from long-term borrowings and bonds 35 132,125 112,937 Repayment of long-term borrowings 35 (280,465) (311,123)Payments of finance lease liabilities 35 (10,458) (10,014)Proceeds from disposals of treasury shares 1,125 159 Dividends paid to owners of the Company 26 (8,902) (8,913)Dividends paid to non-controlling interests (15,160) (16,388)Payments for acquisitions of shares in subsidiaries that do not involve loss of control
(171) (54)
Other 1,317 54 Net cash flow used in financing activities (172,042) (232,938)Net increase (decrease) in cash and cash equivalents 9,611 (86,750)
Cash and cash equivalents at the beginning of the year 8 352,519 359,518 (Amounts stated in the consolidated statement of financial position)
Reversal of cash and cash equivalents included in assets held for sale at the beginning of the year
13 - 3,439
Cash and cash equivalents at the beginning of the year 352,519 362,958 Effects of exchange rate changes on cash and cash equivalents 827 (3,782)Cash and cash equivalents included in assets held for sale 13 (3,439) - Cash and cash equivalents at the end of the year 8 359,518 272,425
See notes to consolidated financial statements.
- 8 -
Notes to Consolidated Financial Statements
1. Reporting entity
Suntory Holdings Limited ("the Company") is a corporation which has been established based on Japanese Corporate law and is domiciled in Japan. The addresses of its registered office and principal place of business are disclosed on the Company's website (URL https://www.suntory.com). The Company's consolidated financial statements, whose closing date is December 31, are composed of the Company and its subsidiaries ("the Group") and its associates. The parent company of the Company is Kotobuki Realty Co., Ltd.
The Group is engaged in manufacturing and marketing alcoholic and non-alcoholic beverages, and other business. The Company is a pure holding company, which is responsible for establishing and promoting the group management strategy and providing administrative service to subsidiaries. The principal activities of the Group are described in "Note 6. Segment information."
2. Basis of preparation
(1) Compliance with Accounting Standards
The Group's consolidated financial statements have been prepared in accordance with International Financial Reporting Standards ("IFRSs"). The Group's consolidated financial statements were authorized for issuance by Takeshi Niinami, Representative Director, President & Chief Executive Officer, and Shinichiro Hizuka, Director, Senior Managing Executive Officer, on March 18, 2019.
(2) Basis of measurement
The Group's consolidated financial statements are prepared on the cost basis, except for the financial instruments and other items that are measured at fair value as described in "Note 3. Significant accounting policies."
(3) Functional currency and presentation currency
The consolidated financial statements are presented in Japanese yen, which is the Company's functional currency. Amounts presented in the consolidated financial statements are rounded down to the nearest million yen.
3. Significant accounting policies
(1) Basis of consolidation
[1] Subsidiary
A subsidiary is an entity controlled by the Company. The Company controls an entity when it is exposed, or has rights, to variable returns from its involvement with the entity and has the ability to affect those returns through its power over the entity. The Group's subsidiaries are included in the scope of consolidation, which begins when it obtains control over a subsidiary and ceases when it loses control of the subsidiary. All intragroup receivable and payable balances, intragroup transaction balances, and unrecognized gains and losses arising from intragroup transactions are eliminated in full in preparing the consolidated financial statements. Disposal of the Group's ownership interests in a subsidiary that does not result in the Group losing control over the subsidiary are accounted for as an equity transaction. Any difference between the amount of an adjustment to the non-controlling interests and the fair value of the consideration paid or received is recognized directly in equity and is attributed to owners of the Company. Non-controlling interests of the consolidated subsidiaries are identified separately from ownership interests attributable to the Group. Comprehensive income of subsidiaries is attributed to owners of the Company and non-controlling interests, even when comprehensive income attributed to non-controlling interests results in a negative balance.
[2] Associate
An associate is an entity over which the Company has significant influence, which is the power to participate in the financial and operating policy of the associate, but does not have control or joint control of those policies. Investments in an associate are initially recognized at cost upon the acquisition and are subsequently accounted for using the equity method. Investments in an associate include goodwill recognized upon the acquisition, net of accumulated impairment losses.
- 9 -
[3] Joint venture
A joint venture is an entity jointly controlled by two or more parties including the Group under the contractually agreed sharing of control of an arrangement over economic activities of the joint venture, which exists only when decisions for strategic financial and operating decisions related to relevant activities require unanimous consent of the parties sharing control. A joint venture of the Group is accounted for using the equity method.
(2) Business combinations
Business combinations are accounted for using the acquisition method. The acquisition cost is measured as the sum of the acquisition-date fair values of the assets transferred, liabilities assumed, and the equity financial instruments issued by the Company in exchange for control of the acquiree. Excess of the acquisition cost over the Group's share of the net fair value of the identifiable assets and liabilities of the investee is recognized as goodwill. Conversely, any excess of the Group's share of the net fair value of the identifiable assets and liabilities of the investee over the acquisition cost is immediately recognized as profit or loss. Transaction costs that are directly attributable to a business combination, such as agent, legal, and due diligence fees, are expensed as incurred. The Company accounts for the acquisition of additional non-controlling interests as an equity transaction, and accordingly, it does not recognize goodwill attributable to such transactions. Identifiable assets acquired and the liabilities assumed are recognized at their fair value as at the acquisition date, except for the following:
• Deferred tax assets or liabilities and assets or liabilities related to employee benefit arrangements; and
• Assets or disposal groups that are classified as held for sale in accordance with IFRS 5, "Non-current Assets Held for Sale and Discontinued Operations."
(3) Foreign currencies
[1] Transactions denominated in foreign currencies
Items included in the financial statements of each of the Group entities are measured using the currency of the primary economic environment in which the entity operates (the "functional currency"). In preparing the separate financial statements of each entity, transactions denominated in currencies other than the entity's functional currency are translated into its functional currency using the exchange rate that approximates the exchange rate prevailing at the date of the transaction.
At the end of each reporting period, monetary assets and liabilities denominated in foreign currencies are translated using the exchange rates prevailing at the reporting date. Any exchange differences arising from translation or settlement of monetary assets and liabilities denominated in foreign currencies are recognized in profit or loss. However, exchange differences arising from financial instruments designated as hedging instruments against a net investment in a foreign operation, translation or settlement of financial assets measured at fair value through other comprehensive income, and cash flow hedges are recognized in other comprehensive income.
[2] Financial statements of foreign operations
Assets and liabilities of the Group's foreign operations are translated into Japanese yen using exchange rates prevailing at the reporting date. Income and expense items are translated into Japanese yen at the weighted-average exchange rates for the reporting period, unless any significant change occurs. Any exchange differences arising from translation of the financial statements of the Group's foreign operations are recognized in other comprehensive income. Any exchange differences arising from translation of foreign operations disposed of by the Group are recognized in profit or loss for the reporting period in which that foreign operation is disposed of.
- 10 -
(4) Financial instruments
[1] Financial assets
(i) Initial recognition and measurement
Financial assets are classified into the following specific categories; financial assets measured at fair value through other comprehensive income ("FVTOCI") or fair value through profit or loss ("FVTPL") and financial assets measured at amortized
cost. The classification is determined at the initial recognition. All financial assets, excluding financial assets classified as measured at FVTPL, are measured at their fair value plus transaction costs. Financial assets are classified as measured at amortized cost if both of the following conditions are met:
• The financial assets are held within a business model whose objective is to hold the asset in order to collect contractual cash flows; and
• The contractual terms of the financial asset give rise on specified dates to cash flows that are solely payments of principal and interest on the principal amount outstanding.
Financial assets other than those measured at amortized cost are classified as financial assets measured at fair value. For financial assets measured at fair value other than equity instruments held for trading that should be measured at FVTPL, each equity instrument is designated as measured at FVTPL or FVTOCI. Such designation is continuously applied.
(ii) Subsequent measurement
After initial recognition, financial assets measured at amortized cost are measured at amortized cost, using the effective interest method. Financial assets measured at fair value are remeasured at fair value at the end of each reporting period. Any gain or loss on financial assets measured at fair value is recognized in profit or loss. However, changes in the fair value of equity instruments designated as measured at FVTOCI are recognized in other comprehensive income. The cumulative gain or loss recognized in other comprehensive income is reclassified to retained earnings when financial assets are disposed of, or a significant deterioration in fair value is recognized. Dividends from such financial assets are recognized as part of finance gains in profit or loss for the year.
(iii) Impairment
For financial assets measured at amortized cost, the Group recognizes a loss allowance against expected credit losses on such financial assets. At each reporting date, financial assets are assessed whether there has been a significant increase in credit risk of the financial asset since initial recognition. If the credit risk on financial assets has not increased significantly since initial recognition, a loss allowance is measured at an amount equal to 12-months of expected credit losses. On the other hand, if the credit risk on financial assets has increased significantly since initial recognition, a loss allowance is measured at an amount equal to the lifetime expected credit losses. However, a loss allowance for trade and other receivables is always measured at an amount equal to the lifetime expected credit losses. Expected credit losses on financial assets are assessed based on objective evidence which reflects changes in credit information, and past due information of receivables. Impairment loss is recognized in profit or loss for the amount of expected credit losses needed to adjust the loss allowance at the reporting date to the required amount. If any event resulting in a decrease of impairment losses occurs after the recognition of impairment losses, a reversal of impairment is recognized through profit or loss.
(iv) Derecognition
The Group derecognizes financial assets when the contractual rights to the cash flows from the assets expire, or when it transfers the financial assets and substantially all the risks and rewards of ownership of the assets to another party. If the Group neither transfers nor retains substantially all the risks and rewards of ownership and continues to control the transferred assets, the Group continues to recognize the asset and related liabilities to the extent of its continuing involvement.
[2] Financial liabilities
(i) Initial recognition and measurement
Financial liabilities are classified into either subsequently measured at amortized cost or at FVTPL. The classifications are determined at initial recognition. Financial liabilities measured at FVTPL are initially measured at fair value. Financial liabilities measured at amortized cost are initially measured at fair value less any directly attributable transaction costs.

- 11 -
(ii) Subsequent measurement
After initial recognition, financial liabilities measured at FVTPL include those held for trading purposes and those designated as measured at FVTPL upon initial recognition. Financial liabilities measured at FVTPL are measured at fair value after initial recognition, with subsequent changes recognized in profit or loss for the reporting period. After initial recognition, financial liabilities measured at amortized cost are measured at amortized cost using the effective interest method. A gain or loss on financial liabilities no longer amortized using the effective interest method and derecognized is recognized as part of finance costs in profit or loss for the reporting period.
(iii) Derecognition
Financial liabilities are derecognized when they are extinguished, i.e., when the obligations specified in the contract are discharged, cancelled, or expired.
[3] Presentation of financial assets and liabilities
Financial assets and liabilities are presented at their net amount in the consolidated statement of financial position only when the Group has a legally enforceable right to offset the financial asset and liability balances and it intends either to settle on a net basis or to realize financial assets and settle financial liabilities simultaneously.
[4] Derivatives and hedge accounting
The Group utilizes derivatives, such as foreign exchange contracts and interest rate swap contracts to hedge foreign exchange and interest rate risks, respectively. Derivatives are initially measured at fair value upon execution of a contract and are subsequently remeasured at fair value.
At the inception of a hedging relationship, an entity formally designates and documents the hedging relationship to which it applies hedge accounting and its risk management objective and strategy for undertaking the hedge. That documentation includes identification of a specific hedging instrument, the hedged item or transaction, the nature of the risk being hedged, and how the entity will test the effectiveness of changes in fair value of the hedging instrument in offsetting the exposure to fair value or cash flow changes of the hedged item attributable to the hedged risks. These hedges are presumed to be highly effective in offsetting fair value or cash flow changes. Further, continuing assessments are made as to whether the hedges are highly effective over all of the reporting periods of such designation.
If the hedging relationship does not meet the hedge effectiveness requirements in terms of hedge ratios due to a change in an economic relationship between the hedged item and the hedging instrument, despite the risk management objective remaining unchanged, the hedge ratio will be adjusted to meet the hedge effectiveness requirement. If the hedging relationship no longer meets the hedge effectiveness requirement in spite of the hedge ratio adjustment, hedge accounting is discontinued for the portion of the hedge relationship that no longer meets the requirement. The hedges that meet the hedge accounting criteria are classified and are accounted for under IFRS 9, "Financial Instruments" (as revised in July 2014; "IFRS 9") as follows.
(i) Fair value hedges
Changes in the fair value of the hedging instrument are recognized in profit or loss. However, changes in fair value of a hedged item that is an equity instrument designated as measured at FVTOCI are recognized in other comprehensive income. For changes in fair value of the hedged item attributable to the risk being hedged, such changes are adjusted with the carrying amount of the hedged item and are recognized in profit or loss. However, changes in fair value of a hedged item that is an equity instrument with an election to present such changes in other comprehensive income are recognized in other comprehensive income.
(ii) Cash flow hedges
The portion of the gain or loss on the hedging instrument that is determined to be an effective hedge is recognized in other comprehensive income. The portion of the gain or loss on the hedging instrument that is hedge ineffectiveness is immediately recognized in profit or loss.
The amount of the hedging instrument recognized in other comprehensive income is reclassified to profit or loss at the point a hedged future transaction affects profit or loss. If the hedged item gives rise to the recognition of a non-financial asset or liability, the amount recognized in other comprehensive income is removed to adjust the original carrying amount of the non-financial asset or liability.
- 12 -
If a forecasted hedge transaction or firm commitment is no longer expected to arise, the cumulative gains and losses previously recognized in equity through other comprehensive income are reclassified to profit or loss. If hedged future cash flows are still expected to arise, the cumulative gains and losses previously recognized in equity through other comprehensive income remain in equity until such future cash flows arise.
(iii) Hedges of a net investment in a foreign operation
Hedge of net investments in foreign operations are accounted for similarly to cash flow hedges. The portion of the gain or loss on the hedging instrument that is determined to be an effective hedge is recognized in other comprehensive income. The portion of the gain or loss on the hedging instrument that is hedge ineffectiveness is recognized in profit or loss. At the disposal of the foreign operation, cumulative gains and losses previously recognized in equity through other comprehensive income are transferred to profit or loss.
(5) Cash and cash equivalents
Cash and cash equivalents comprise cash on hand, cash in banks that can be withdrawn at any time, and short-term investments, which are readily convertible into cash and are not exposed to significant risk related to changes in value.
(6) Inventories
Inventories are stated at the lower of cost and net realizable value. The net realizable value is the estimated selling price in the ordinary course of business less the estimated costs of completion and the costs necessary to make the sale. The cost of inventories is principally determined using a weighted-average basis, comprising all costs of purchase and conversion and other costs incurred in bringing the inventories to their present location and condition.
(7) Property, plant and equipment
Property, plant and equipment is stated at cost less accumulated depreciation and any accumulated impairment losses.
The cost of property, plant and equipment comprises any costs directly attributable to the acquisition of the item, the initial estimate of the costs of dismantling and removing the item and restoring the site on which it is located, and borrowing costs that should be capitalized.
Depreciation charges on an item of property, plant and equipment, other than land and construction in progress, are recognized on a straight-line basis over its estimated useful life. The range of estimated useful lives by major asset item is as follows:
Buildings: 3 to 50 years Machinery and equipment: 2 to 20 years
The estimated useful lives, residual values, and depreciation methods are reviewed at each reporting date. A change in such accounting estimate is accounted for prospectively.
(8) Goodwill and intangible assets
[1] Goodwill
Goodwill is stated at cost less accumulated impairment losses. The method for measurement at initial recognition of goodwill is described in "Note 3. Significant accounting policies (2) Business combinations." Goodwill is not amortized, but is tested for impairment annually, and whenever there is an indication that the cash-generating unit may be impaired. The method for impairment of goodwill is described in "Note 3. Significant accounting policies (10) Impairment of non-financial assets."
[2] Intangible assets
Measurement of intangible assets is made by applying the cost model. Intangible assets are stated at cost less accumulated depreciation and any accumulated impairment losses. Intangible assets acquired separately are measured inclusive of directly attributable costs of acquiring the asset. The method for measurement at recognition of intangible assets acquired in a business combination is described in "Note 3. Significant accounting policies (2) Business combinations." Intangible assets with finite useful lives are amortized on a straight-line basis over their estimated useful lives. The estimated useful lives of the major intangible assets with finite useful lives are as follows:
• Trademarks: 15 to 30 years

- 13 -
The estimated useful lives, residual values, and amortization methods are reviewed at the end of each reporting period. A change in such accounting estimates is accounted for prospectively. Intangible assets with indefinite useful lives are not amortized, but are tested for impairment each reporting period and as necessary. The method for impairment of intangible assets with indefinite useful lives is described in "Note 3. Significant accounting policies (10) Impairment of non-financial assets."
(9) Leased assets
Where the Group has substantially all the risks and rewards of ownership of an asset subject to a lease, the lease is classified as a finance lease. Assets held under a finance lease are initially recognized at the lower of the fair value of leased assets and the present value of minimum lease payments, which are determined at the inception of the lease. Subsequent to the initial recognition, the leased assets are depreciated on a straight-line basis over the shorter of its estimated useful life and its lease term based on the applicable accounting policies for the asset. Lease payments under finance lease are allocated to finance costs and the repayment of the lease obligations based on the interest method. Finance costs are recognized as an expense.
Other leases are treated as operating leases. Lease payments for an operating lease transaction are recognized as an expense on a straight-line basis over the lease term.
(10) Impairment of non-financial assets
The carrying amount of a non-financial asset of the Company, exclusive of inventories and deferred tax assets, is assessed at each reporting date to test whether there is any indication that the asset may be impaired. If any such indication exists, the recoverable amount of the asset is estimated. Further, the recoverable amount is estimated annually at the same time every year for goodwill and intangible assets with indefinite useful lives and intangible assets that are not yet available for use.
The recoverable amount of an asset or a cash-generating unit is the higher of its fair value less costs of disposal and its value in use. In determining the value in use, estimated future cash flows are discounted to their present value using a pre-tax discount rate (or rates) that reflect(s) current market assessments of the time value of money and the risks specific to the asset. Non-financial assets not tested for impairment on an individual basis are grouped into the smallest cash-generating unit that generates cash inflows from the continuing use of the asset, which are largely independent of those from other assets or asset groups. In performing impairment testing on goodwill, an entity groups cash-generating units to which goodwill is allocated to enable performing impairment testing in a manner that reflects the smallest unit to which it relates. Goodwill acquired in a business combination, from the acquisition date, is allocated to each of the cash-generating units, or groups of cash-generating units, that are expected to benefit from the synergies of the combination.
Corporate assets of the Group do not generate independent cash inflows. If there is any indication that a corporate asset may be impaired, the recoverable amount of the cash-generating unit to which the corporate asset belongs is determined. Impairment loss is recognized in profit or loss when the carrying amount of an asset or cash-generating unit is greater than its recoverable amount. An impairment loss recognized for a cash-generating unit is first allocated to reduce the carrying amount of any goodwill allocated to the cash-generating unit, and then, to the other assets of the unit pro rata on the basis of the carrying amount of each asset in the unit.
Impairment losses recognized for goodwill are not reversed subsequently. Impairment losses recognized for other assets are assessed at each reporting date whether there is any indication that they may no longer exist or may have decreased. If there is a change in the estimates used to determine the recoverable amount of an asset, an entity reviews the recoverable amount of the asset and reverses an impairment loss for the asset. An impairment loss is reversed to the extent that it does not exceed the carrying amount that would have been determined, net of any amortization or depreciation, had no impairment loss been recognized for the asset in prior years.
(11) Post-employment benefit plans
The Company and certain consolidated subsidiaries have the following post-employment benefit plans for its employees: defined benefit and defined contribution plans. The present value of defined benefit obligations, related current service cost, and, where applicable, past service cost are determined using the projected unit credit method. The discount rate is determined by reference to market yields at each reporting date on high-quality corporate bonds corresponding to a discount period that is defined based on the period to the date of expected future benefit payment for each year. The net defined benefit liability (asset) is determined as the present value of the defined benefit obligation less the fair value of plan assets (adjusting for any effect of limiting a net defined benefit asset to the asset ceiling and of giving rise to a liability by a minimum funding requirement, if necessary). Remeasurements of the net defined benefit liability (asset) are recognized collectively in other comprehensive income for the period in which they are incurred.
- 14 -
Past service cost is recognized as an expense for the period it is incurred. Expenses related to defined contribution benefits are recognized when related services are rendered.
(12) Provisions
A provision is recognized only when an entity has a present obligation (legal or constructive) as a result of a past event, it is probable that an outflow of resources embodying economic benefits will be required to settle the obligation, and a reliable estimate can be made of the amount of the obligation. A provision is measured at the present value of estimated future cash outflows discounted using a pre-tax rate (or rates) that reflect(s) current market assessments of the time value of money and the risks specific to the liability. Where discounting is used, the increase in the provision due to the passage of time is recognized as finance costs.
(13) Revenue
[1] Sale of goods
The Group is engaged in the sale of alcohol and non-alcohol beverages and foods. As customers usually obtain control of the goods and the Group's performance obligation is satisfied at the time when the goods are delivered, the Group recognizes revenue at the amount of consideration promised under the contracts with customers after deduction of trade discounts, rebates, taxes collected on behalf of third parties, such as consumption taxes or value added tax, sales incentives, and returned goods. Please refer to "Note 3. Significant accounting policies (19) Changes in accounting policies."
[2] Interest income
Interest income is recognized using the effective interest method.
(14) Government grants
The Group measures and recognizes grant revenue at its fair value when there is reasonable assurance that an entity will comply with the conditions attached to them and will receive the grants. The grants received to compensate costs incurred are recognized as revenue in the period in which such costs are incurred. The grants related to the acquisition of an asset are deducted from the carrying amount of the asset.
(15) Income taxes
Income taxes are comprised of current and deferred taxes. Current and deferred taxes are recognized through profit or loss, except
for those that arise from a business combination or are recognized in other comprehensive income or directly in equity.
Current tax is measured at the amount expected to be paid to (recovered from) the taxation authorities. The amount of current tax is determined based on the tax rates and tax laws that have been enacted or substantively enacted by the end of the reporting period in each tax jurisdiction where the Group owns the business activities and earns taxable profit (or loss). Deferred tax is recognized for the temporary differences between the carrying amount of assets and liabilities for financial reporting purposes and their value for tax purposes as at the reporting date, as well as the carryforward of unused tax losses and unused tax credits.
Deferred tax assets and liabilities are not recognized for the following temporary differences:
• Temporary differences arising from the initial recognition of goodwill;
• Temporary differences arising on initial recognition of an asset or liability arising in a transaction other than business combinations and affecting neither accounting profit nor taxable income;
• Deductible temporary differences associated with investments in subsidiaries, associates, and interests in joint arrangements, to the extent it is probable that the temporary difference will not reverse in the foreseeable future;
• Taxable temporary differences associated with investments in subsidiaries, associates, and interests in joint arrangements, to the extent it is probable that the Group is able to control the timing of the reversal of the temporary difference, and the temporary difference will not reverse in the foreseeable future.
A deferred tax liability is principally recognized for all taxable temporary differences and a deferred tax asset is recognized for all deductible temporary differences to the extent it is probable that taxable profit will be available against which deductible temporary differences can be utilized.
- 15 -
The carrying amount of deferred tax assets is reviewed each period and is adjusted to the extent that it is probable that sufficient taxable profit will be available to allow all or part of the deferred tax assets to be utilized. Unrecognized deferred tax assets are also reviewed each period and recognized to the extent that it has become probable that future taxable profit will allow the deferred tax assets to be recovered.
Deferred tax assets and liabilities are measured at the tax rates and tax laws that are expected to be applied in the period when the asset is realized or the liability is settled, based on statutory tax rates and tax laws that have been enacted or substantively enacted by the end of the reporting period.
Deferred tax assets and liabilities are netted when the entity has a legally enforceable right to offset current tax assets and liabilities, and the deferred tax balances relate to the same taxation authority.
An asset or liability is recognized for uncertain tax positions at the estimated amount expected to arise from the uncertain tax position if it is probable that the position will result in a payment (or redemption) of taxes.
The Company and its wholly owned subsidiaries in Japan have adopted the consolidated taxation system and file income tax returns on a consolidated taxation group basis.
(16) Earnings per share
Basic earnings per share is calculated by the profit or loss attributable to ordinary shareholders of the parent for the period divided by the weighted-average number of ordinary shares issued, adjusted for treasury shares during the period.
(17) Non-current assets held for sale
The Group classifies a non-current asset or asset group that will be recovered principally through a sales transaction rather than through continuing use as held for sale if the asset or disposal group is available for immediate sale in its present condition, its sale is highly probable within one year, and the appropriate level of management of the Group is committed to a plan to sell the asset or disposal group.
The non-current asset held for sale is not depreciated or amortized, and is measured at the lower of its carrying amount and the fair value less costs to sell.
(18) Treasury shares
Treasury shares are measured at cost and are deducted from equity. Gains and losses arising from buy-back, sale, or retirement of treasury shares by the Company are not recognized. Any difference between the carrying amount of treasury shares and the consideration received for disposal of such treasury shares are recognized in other capital premium.
(19) Changes in accounting policies
The Group has adopted IFRS 15, "Revenue from Contracts with Customers" (amended in April 2016) (hereinafter, "IFRS 15"), from the year ended December 31, 2018. The Group recognizes revenue, except for interest and dividend revenue under IFRS 9, by considering the following five steps:
Step 1: Identify the contract(s) with a customer
Step 2: Identify the performance obligations in the contract
Step 3: Determine the transaction price
Step 4: Allocate the transaction price to the performance obligations in the contract
Step 5: Recognize revenue when (or as) the entity satisfies a performance obligation

- 16 -
The Group is engaged in the sale of alcohol and non-alcohol beverages and foods. As customers usually obtain control of the goods and the Group's performance obligation is satisfied at the time when the goods are delivered, the above criteria to recognize revenue are met at this point in time. Previously, it was required to recognize revenue when the Group transferred to the buyer the significant risks and rewards of ownership of the goods, retained neither continuing involvement nor effective control over the goods, it was probable the future economic benefits associated with the transaction would flow to the Group, and the economic benefits and the costs incurred or to be incurred in respect of the transaction could be measured reliably. The Group previously recognized revenue at the time of delivery of goods, and consequently, the timing of revenue recognition was not changed upon the application of IFRS 15.
In addition, revenue is measured at the amount after deduction of trade discounts, rebates, taxes collected on behalf of third parties such as, consumption taxes or value added tax, sales incentives, and returned goods from consideration promised under the contracts with customers. As a result of applying the five steps, the revenue measurement in certain contracts was changed from the previous method.
In the application of IFRS 15, the Group adopted the method where the cumulative effect of applying this standard is recognized at the date of initial application, which is allowed as the transition approach, and did not make retrospective adjustments for each reporting period in the past. As a result of applying IFRS 15, the balance of retained earnings as at January 1, 2018 increased by 1,356 million yen from the balance as at December 31, 2017.
4. Critical accounting estimates and judgements
During the process of preparation of the consolidated financial statements in accordance with IFRSs, management is required to make judgements, estimates, and assumptions. These judgements, estimates, and assumptions may affect application of the Group's accounting policies and amount of assets, liabilities, revenue, and expenses. However, actual results could differ from these estimates. The estimates and the underlying assumptions are reviewed on an ongoing basis. The effects of a change in accounting estimates are recognized prospectively from the period in which the estimate is revised.
The following are the judgements and estimates that management has made and that have significant effect on the amounts in the consolidated financial statements:
• Estimates used for impairment of properties, plant and equipment, intangibles, and goodwill ("Note 3. Significant accounting policies (10) Impairment of non-financial assets," "Note 14. Property, plant and equipment," "Note 15. Goodwill and intangible assets")
• Measurement of post-employment obligations ("Note 3. Significant accounting policies (11) Post-employment benefit plans," "Note 24. Post-employment benefit plans")
• Judgements and estimates made for the recognition and measurement of provisions ("Note 3. Significant accounting policies (12) Provisions," "Note 21. Provisions")
• Judgements made for assessing the recoverability of deferred tax assets ("Note 3. Significant accounting policies (15) Income taxes," "Note 17. Income taxes")
• Judgements made in determining whether the Group controls another entity ("Note 3. Significant accounting policies (1) Basis of consolidation," "Note 16. Investments accounted for using the equity method")
• Fair value measurement of financial instruments ("Note 3. Significant accounting policies (4) Financial instruments," "Note 36. Financial instruments (4) Fair value of financial instruments")
• Estimates used for residual value and useful life of property, plant and equipment and intangible assets ("Note 3. Significant accounting policies (7) Property, plant and equipment, (8) Goodwill and intangible assets," "Note 14. Property, plant and equipment," "Note 15. Goodwill and intangible assets")
• Measurement of the fair value of assets acquired and the liabilities assumed in a business combination ("Note 3. Significant accounting policies (2) Business combinations", "Note 7. Acquisition and sale of businesses and purchase of non-controlling interests").
- 17 -
5. New accounting standards and interpretations not yet adopted
IFRS 16, "Leases" (hereinafter, "IFRS 16"), has been published as at the approval date of the consolidated financial statements. The Group did not early adopt IFRS 16 but decided to adopt it from the mandatory adoption date of January 1, 2019. IFRS 16 eliminates the classification of leases as either operating leases or finance leases currently required under IAS 17, "Leases," and introduces a single lessee accounting model where the lessee is required to recognize assets and liabilities for all material leases. Requirements for measurement and disclosure are significantly refined by this new standard. All material leases will be recognized on the consolidated statement of financial position as right of use assets and depreciated on a straight-line basis. The lease liability will be measured at a discounted value and related interest will be charged to finance charges in the consolidated statement of profit or loss. Therefore, the charge to the consolidated statement of profit or loss for the operating lease payment will be replaced with depreciation on the right of use asset and the interest charge inherent in the lease. The Group has adopted IFRS 16 by applying the method, allowed as the transition approach, to recognize the cumulative effect of this new standard on the date of initial application and make no retrospective adjustment for each previous reporting period. The Group has decided to reduce the complexity of implementation to take advantage of a number of practical expedients on transition, at each region or business level as follows:
• not to reassess whether a contract is, or contains, a lease at the date of initial application
• to apply a single discount rate to a portfolio of leases with reasonably similar characteristics
• to exclude initial direct costs from the measurement of the right-of-use asset arising from leases previously classified as operating leases at the date of initial application
• to measure the right of use asset arising from leases previously classified as operating leases at the same value as the lease liability
• to apply the short-term and low value exemptions
The impact of IFRS 16 on the Group is still under assessment as at the timing of preparation of the consolidated financial statements; however, it is anticipated that total assets and total liabilities are to increase by approximately 2% and 3%, respectively, due to the application of the standard. The impact on consolidated statement of profit and loss is not anticipated to be material. This impact could be updated during the financial statement closing process for the year ending December 31, 2019.
There were no new and revised IFRSs which were publicly announced by the approval date of the consolidated financial statements and early adopted by the Group.
6. Segment information
(1) Overview of reportable segments
The reportable segments are components of the Group for which separate financial information is available and which are regularly reviewed by management to make decisions about the allocation of resources and to assess segment performance.
The Group applies a holding company structure, and operating companies have been established based on their products or services. The management of each operating company focuses on the type of products and services delivered or provided when establishing its own strategies for domestic and international operations. Therefore, the Group identified "Beverages and foods," and "Alcoholic beverages," and "others" as reportable segments based on the types of products and services delivered or provided. The classification of the Group's primary products and services have been defined as below.
Beverages and foods - non-alcoholic beverages, healthy drinks, processed foods, and others
Alcoholic beverages - sprits, beer, wine, and other alcoholic beverages
Others - healthy foods, ice cream, restaurants, flowers, operations in China, and other operations
(2) Description of reportable segments and allocations of revenues, expenses, and profit or loss
The accounting policies of the reportable segments are the same as the Group's accounting policies described in "Note 3. Significant accounting policies." The intersegment transactions are considered on an arm's length basis.
- 18 -
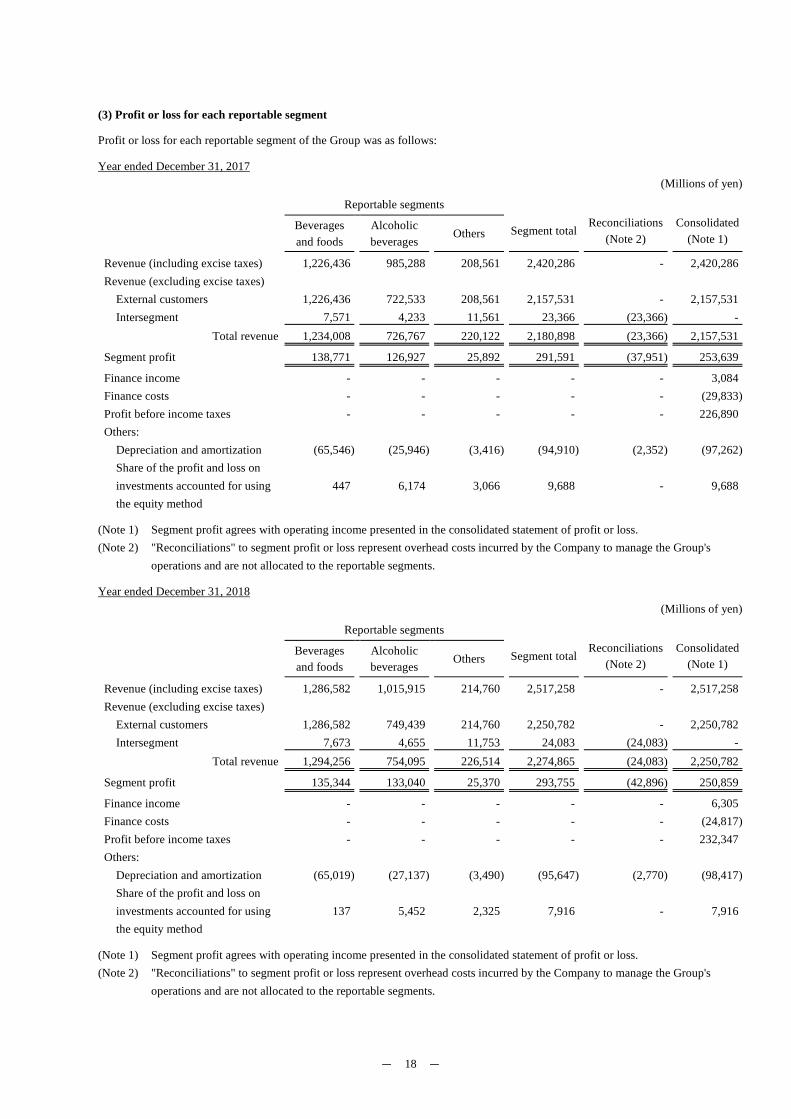
(3) Profit or loss for each reportable segment
Profit or loss for each reportable segment of the Group was as follows:
Year ended December 31, 2017 (Millions of yen)
Reportable segments
Segment total
Reconciliations
(Note 2)
Consolidated
(Note 1) Beverages and foods
Alcoholic beverages
Others
Revenue (including excise taxes) 1,226,436 985,288 208,561 2,420,286 - 2,420,286 Revenue (excluding excise taxes)
External customers 1,226,436 722,533 208,561 2,157,531 - 2,157,531 Intersegment 7,571 4,233 11,561 23,366 (23,366) -
Total revenue 1,234,008 726,767 220,122 2,180,898 (23,366) 2,157,531
Segment profit 138,771 126,927 25,892 291,591 (37,951) 253,639
Finance income - - - - - 3,084 Finance costs - - - - - (29,833)Profit before income taxes - - - - - 226,890 Others:
Depreciation and amortization (65,546) (25,946) (3,416) (94,910) (2,352) (97,262)Share of the profit and loss on investments accounted for using the equity method
447 6,174 3,066 9,688 - 9,688
(Note 1) Segment profit agrees with operating income presented in the consolidated statement of profit or loss. (Note 2) "Reconciliations" to segment profit or loss represent overhead costs incurred by the Company to manage the Group's
operations and are not allocated to the reportable segments.
Year ended December 31, 2018 (Millions of yen)
Reportable segments
Segment total
Reconciliations
(Note 2)
Consolidated
(Note 1) Beverages and foods
Alcoholic beverages Others
Revenue (including excise taxes) 1,286,582 1,015,915 214,760 2,517,258 - 2,517,258 Revenue (excluding excise taxes)
External customers 1,286,582 749,439 214,760 2,250,782 - 2,250,782 Intersegment 7,673 4,655 11,753 24,083 (24,083) -
Total revenue 1,294,256 754,095 226,514 2,274,865 (24,083) 2,250,782
Segment profit 135,344 133,040 25,370 293,755 (42,896) 250,859
Finance income - - - - - 6,305 Finance costs - - - - - (24,817)Profit before income taxes - - - - - 232,347 Others:
Depreciation and amortization (65,019) (27,137) (3,490) (95,647) (2,770) (98,417)Share of the profit and loss on investments accounted for using the equity method
137 5,452 2,325 7,916 - 7,916
(Note 1) Segment profit agrees with operating income presented in the consolidated statement of profit or loss. (Note 2) "Reconciliations" to segment profit or loss represent overhead costs incurred by the Company to manage the Group's
operations and are not allocated to the reportable segments.
- 19 -
(4) Information about products and services
Please refer to (1) overview of reportable segments.
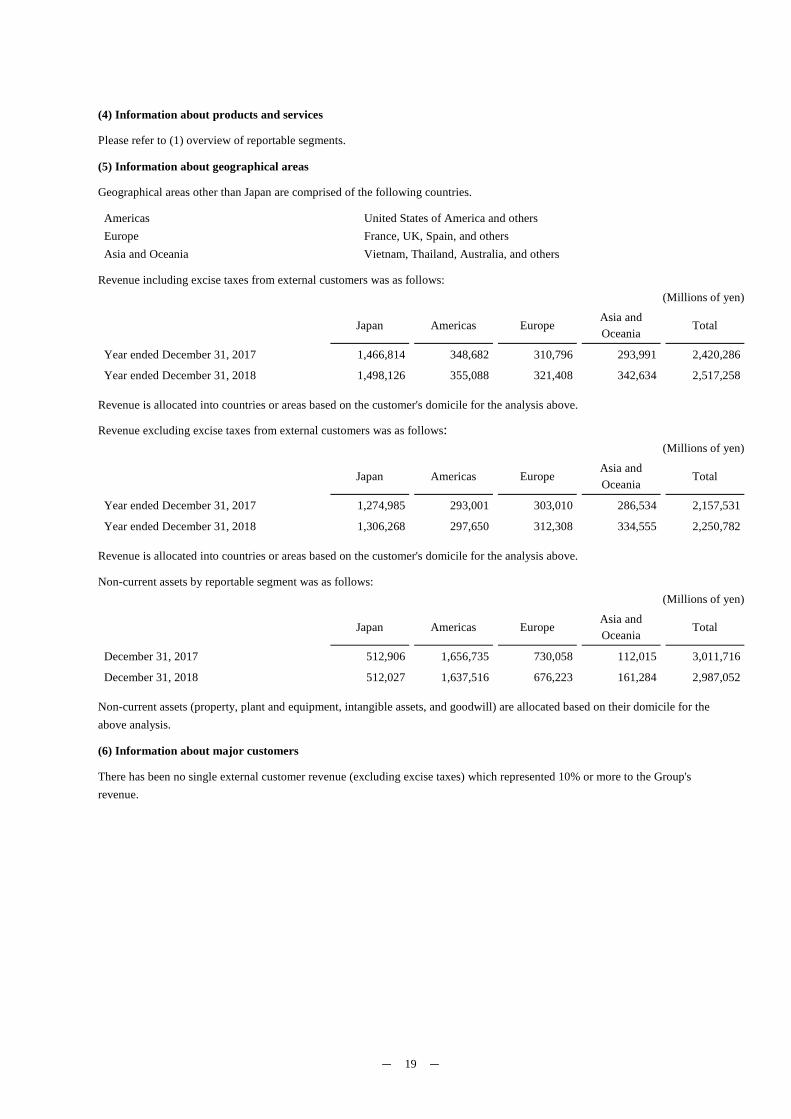
(5) Information about geographical areas
Geographical areas other than Japan are comprised of the following countries.
Americas United States of America and others Europe France, UK, Spain, and others Asia and Oceania Vietnam, Thailand, Australia, and others
Revenue including excise taxes from external customers was as follows: (Millions of yen)
Japan Americas Europe Asia and Oceania Total
Year ended December 31, 2017 1,466,814 348,682 310,796 293,991 2,420,286
Year ended December 31, 2018 1,498,126 355,088 321,408 342,634 2,517,258
Revenue is allocated into countries or areas based on the customer's domicile for the analysis above.
Revenue excluding excise taxes from external customers was as follows: (Millions of yen)
Japan Americas Europe Asia and Oceania
Total
Year ended December 31, 2017 1,274,985 293,001 303,010 286,534 2,157,531
Year ended December 31, 2018 1,306,268 297,650 312,308 334,555 2,250,782
Revenue is allocated into countries or areas based on the customer's domicile for the analysis above.
Non-current assets by reportable segment was as follows: (Millions of yen)
Japan Americas Europe Asia and Oceania Total
December 31, 2017 512,906 1,656,735 730,058 112,015 3,011,716
December 31, 2018 512,027 1,637,516 676,223 161,284 2,987,052
Non-current assets (property, plant and equipment, intangible assets, and goodwill) are allocated based on their domicile for the above analysis.
(6) Information about major customers
There has been no single external customer revenue (excluding excise taxes) which represented 10% or more to the Group's revenue.
- 20 -
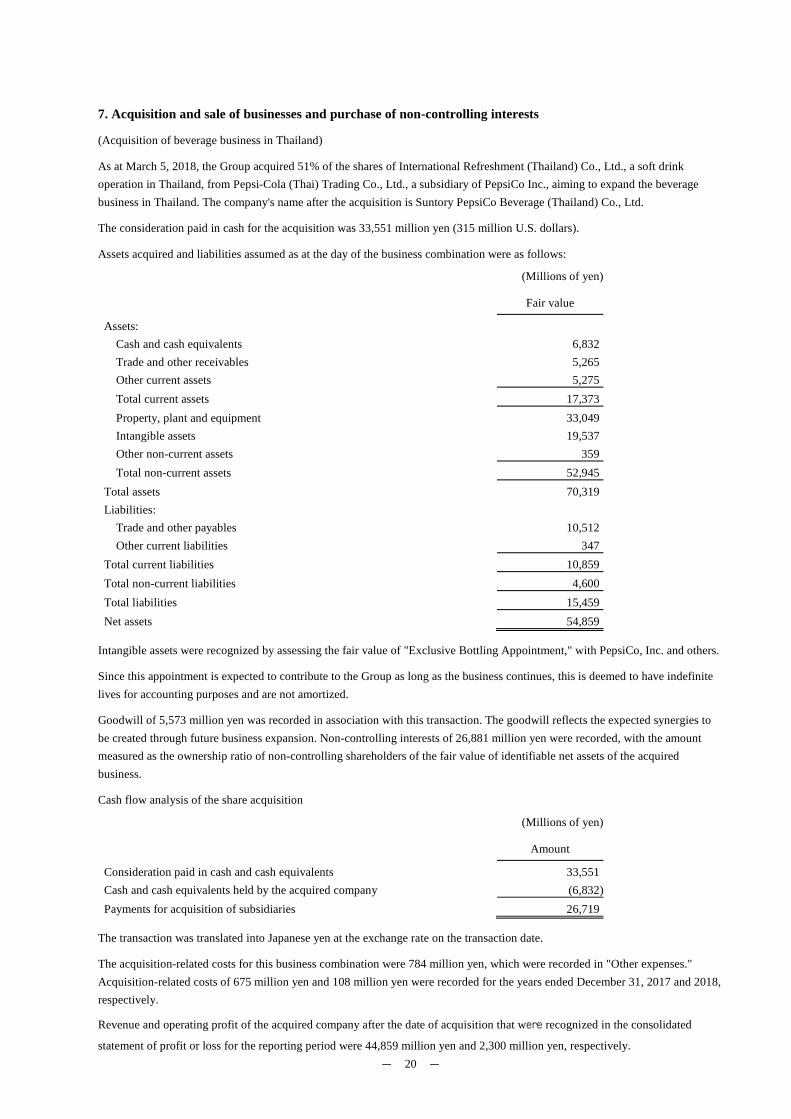
7. Acquisition and sale of businesses and purchase of non-controlling interests
(Acquisition of beverage business in Thailand)
As at March 5, 2018, the Group acquired 51% of the shares of International Refreshment (Thailand) Co., Ltd., a soft drink operation in Thailand, from Pepsi-Cola (Thai) Trading Co., Ltd., a subsidiary of PepsiCo Inc., aiming to expand the beverage business in Thailand. The company's name after the acquisition is Suntory PepsiCo Beverage (Thailand) Co., Ltd.
The consideration paid in cash for the acquisition was 33,551 million yen (315 million U.S. dollars).
Assets acquired and liabilities assumed as at the day of the business combination were as follows:
(Millions of yen)
Fair value
Assets: Cash and cash equivalents 6,832 Trade and other receivables 5,265 Other current assets 5,275 Total current assets 17,373 Property, plant and equipment 33,049 Intangible assets 19,537 Other non-current assets 359 Total non-current assets 52,945
Total assets 70,319 Liabilities:
Trade and other payables 10,512 Other current liabilities 347
Total current liabilities 10,859 Total non-current liabilities 4,600 Total liabilities 15,459 Net assets 54,859
Intangible assets were recognized by assessing the fair value of "Exclusive Bottling Appointment," with PepsiCo, Inc. and others.
Since this appointment is expected to contribute to the Group as long as the business continues, this is deemed to have indefinite lives for accounting purposes and are not amortized.
Goodwill of 5,573 million yen was recorded in association with this transaction. The goodwill reflects the expected synergies to be created through future business expansion. Non-controlling interests of 26,881 million yen were recorded, with the amount measured as the ownership ratio of non-controlling shareholders of the fair value of identifiable net assets of the acquired business.
Cash flow analysis of the share acquisition
(Millions of yen)
Amount
Consideration paid in cash and cash equivalents 33,551 Cash and cash equivalents held by the acquired company (6,832)Payments for acquisition of subsidiaries 26,719
The transaction was translated into Japanese yen at the exchange rate on the transaction date.
The acquisition-related costs for this business combination were 784 million yen, which were recorded in "Other expenses." Acquisition-related costs of 675 million yen and 108 million yen were recorded for the years ended December 31, 2017 and 2018, respectively.
Revenue and operating profit of the acquired company after the date of acquisition that were recognized in the consolidated
statement of profit or loss for the reporting period were 44,859 million yen and 2,300 million yen, respectively.
- 21 -
Had this business consolidation taken effect from the beginning of the year, the Group's revenues (excluding excise taxes), revenues (including excise taxes), and operating profit for the year ended December 31, 2018 would have been 2,262,760 million yen, 2,529,235 million yen, and 251,951 million yen, respectively. Since these amounts do not represent actual results of operation, the amounts are out of scope of the audit by the independent auditor.
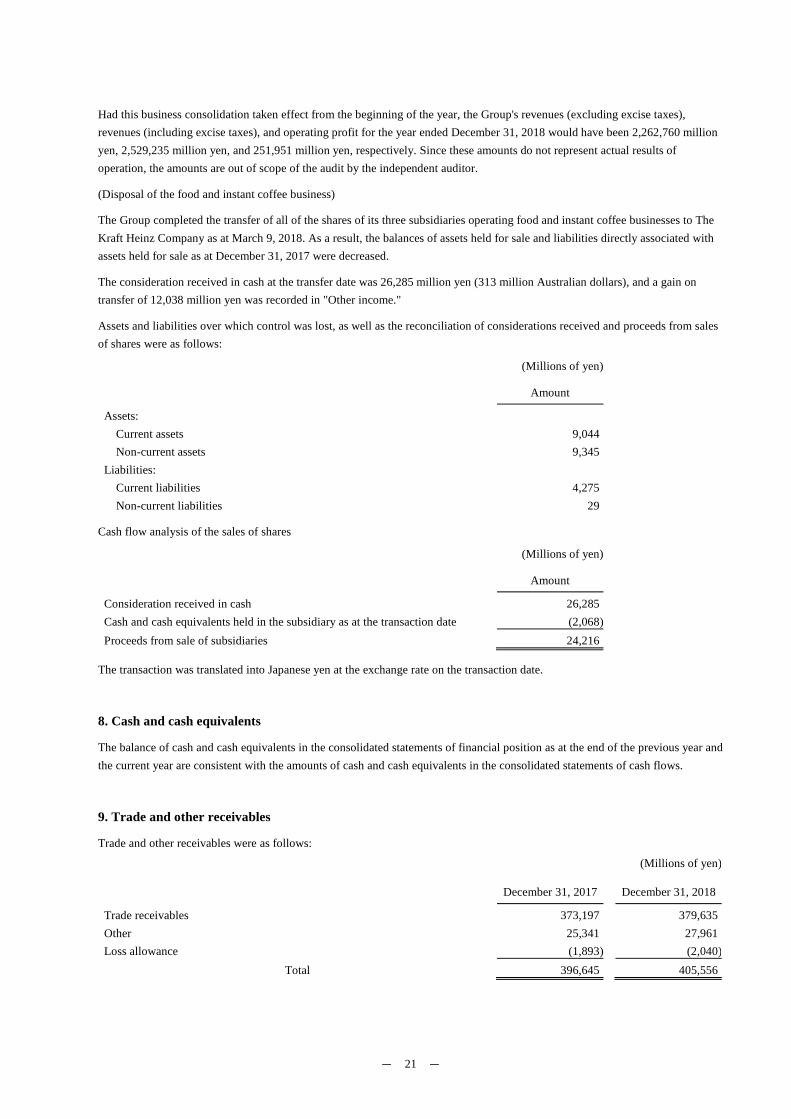
(Disposal of the food and instant coffee business)
The Group completed the transfer of all of the shares of its three subsidiaries operating food and instant coffee businesses to The Kraft Heinz Company as at March 9, 2018. As a result, the balances of assets held for sale and liabilities directly associated with assets held for sale as at December 31, 2017 were decreased.
The consideration received in cash at the transfer date was 26,285 million yen (313 million Australian dollars), and a gain on transfer of 12,038 million yen was recorded in "Other income."
Assets and liabilities over which control was lost, as well as the reconciliation of considerations received and proceeds from sales of shares were as follows:
(Millions of yen)
Amount
Assets: Current assets 9,044 Non-current assets 9,345
Liabilities:
Current liabilities 4,275 Non-current liabilities 29
Cash flow analysis of the sales of shares
(Millions of yen)
Amount
Consideration received in cash 26,285 Cash and cash equivalents held in the subsidiary as at the transaction date (2,068)Proceeds from sale of subsidiaries 24,216
The transaction was translated into Japanese yen at the exchange rate on the transaction date.
8. Cash and cash equivalents
The balance of cash and cash equivalents in the consolidated statements of financial position as at the end of the previous year and the current year are consistent with the amounts of cash and cash equivalents in the consolidated statements of cash flows.
9. Trade and other receivables
Trade and other receivables were as follows:
(Millions of yen)
December 31, 2017 December 31, 2018
Trade receivables 373,197 379,635 Other 25,341 27,961 Loss allowance (1,893) (2,040)
Total 396,645 405,556
- 22 -
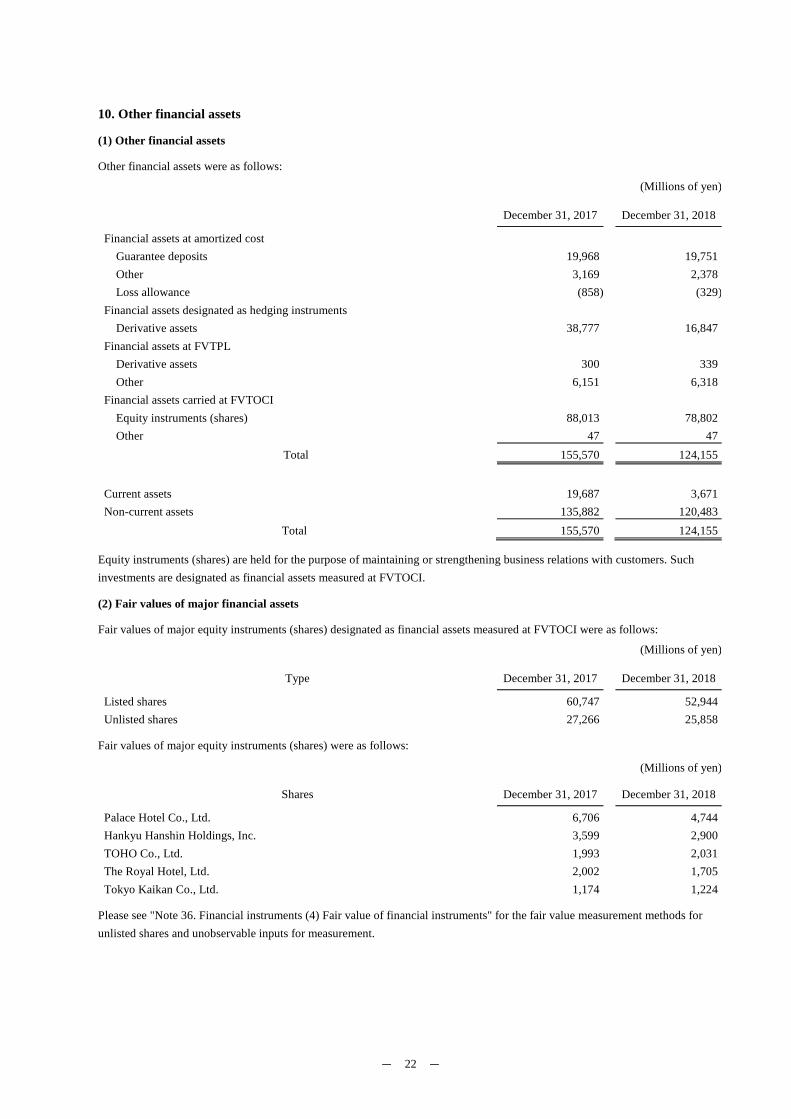
10. Other financial assets
(1) Other financial assets
Other financial assets were as follows:
(Millions of yen)
December 31, 2017 December 31, 2018
Financial assets at amortized cost
Guarantee deposits 19,968 19,751 Other 3,169 2,378 Loss allowance (858) (329)
Financial assets designated as hedging instruments
Derivative assets 38,777 16,847 Financial assets at FVTPL
Derivative assets 300 339 Other 6,151 6,318
Financial assets carried at FVTOCI
Equity instruments (shares) 88,013 78,802 Other 47 47
Total 155,570 124,155
Current assets 19,687 3,671 Non-current assets 135,882 120,483
Total 155,570 124,155
Equity instruments (shares) are held for the purpose of maintaining or strengthening business relations with customers. Such investments are designated as financial assets measured at FVTOCI.
(2) Fair values of major financial assets
Fair values of major equity instruments (shares) designated as financial assets measured at FVTOCI were as follows:
(Millions of yen)
Type December 31, 2017 December 31, 2018
Listed shares 60,747 52,944 Unlisted shares 27,266 25,858
Fair values of major equity instruments (shares) were as follows:
(Millions of yen)
Shares December 31, 2017 December 31, 2018
Palace Hotel Co., Ltd. 6,706 4,744 Hankyu Hanshin Holdings, Inc. 3,599 2,900 TOHO Co., Ltd. 1,993 2,031 The Royal Hotel, Ltd. 2,002 1,705 Tokyo Kaikan Co., Ltd. 1,174 1,224
Please see "Note 36. Financial instruments (4) Fair value of financial instruments" for the fair value measurement methods for unlisted shares and unobservable inputs for measurement.
- 23 -
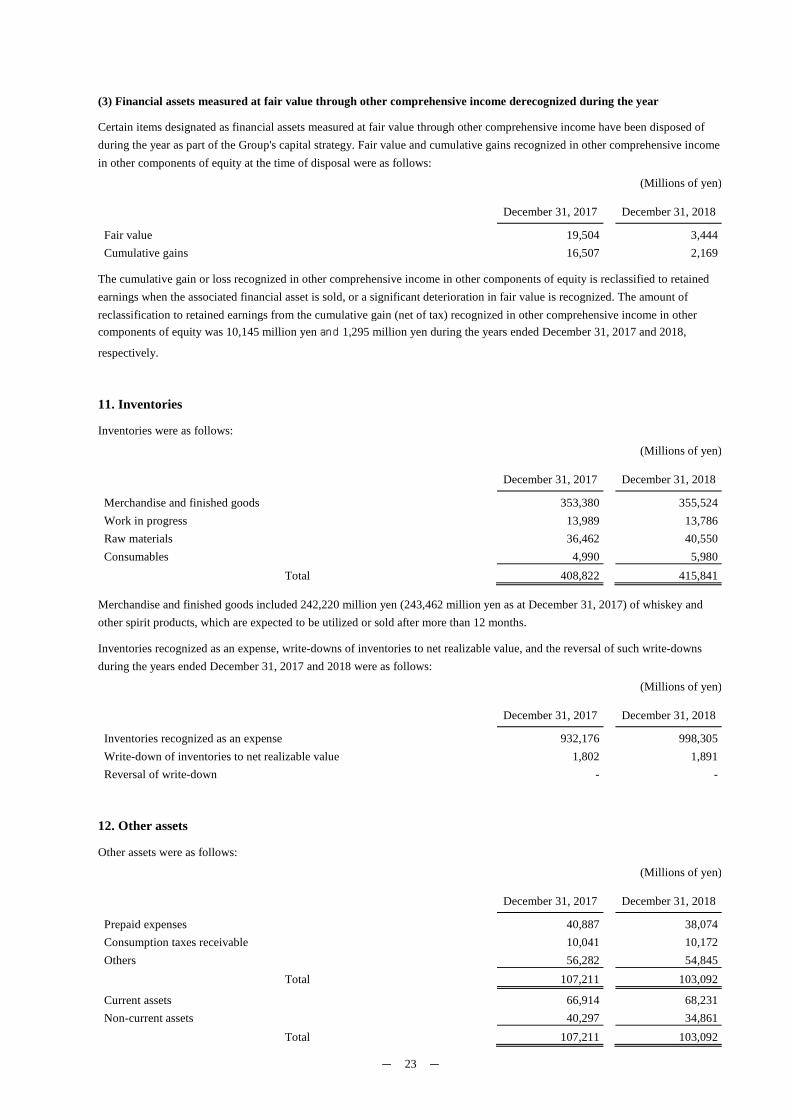
(3) Financial assets measured at fair value through other comprehensive income derecognized during the year
Certain items designated as financial assets measured at fair value through other comprehensive income have been disposed of during the year as part of the Group's capital strategy. Fair value and cumulative gains recognized in other comprehensive income in other components of equity at the time of disposal were as follows:
(Millions of yen)
December 31, 2017 December 31, 2018
Fair value 19,504 3,444 Cumulative gains 16,507 2,169
The cumulative gain or loss recognized in other comprehensive income in other components of equity is reclassified to retained earnings when the associated financial asset is sold, or a significant deterioration in fair value is recognized. The amount of reclassification to retained earnings from the cumulative gain (net of tax) recognized in other comprehensive income in other components of equity was 10,145 million yen and 1,295 million yen during the years ended December 31, 2017 and 2018,
respectively.
11. Inventories
Inventories were as follows:
(Millions of yen)
December 31, 2017 December 31, 2018
Merchandise and finished goods 353,380 355,524 Work in progress 13,989 13,786 Raw materials 36,462 40,550 Consumables 4,990 5,980
Total 408,822 415,841
Merchandise and finished goods included 242,220 million yen (243,462 million yen as at December 31, 2017) of whiskey and other spirit products, which are expected to be utilized or sold after more than 12 months.
Inventories recognized as an expense, write-downs of inventories to net realizable value, and the reversal of such write-downs during the years ended December 31, 2017 and 2018 were as follows:
(Millions of yen)
December 31, 2017 December 31, 2018
Inventories recognized as an expense 932,176 998,305 Write-down of inventories to net realizable value 1,802 1,891 Reversal of write-down - -
12. Other assets
Other assets were as follows:
(Millions of yen)
December 31, 2017 December 31, 2018
Prepaid expenses 40,887 38,074 Consumption taxes receivable 10,041 10,172 Others 56,282 54,845
Total 107,211 103,092
Current assets 66,914 68,231 Non-current assets 40,297 34,861
Total 107,211 103,092
- 24 -
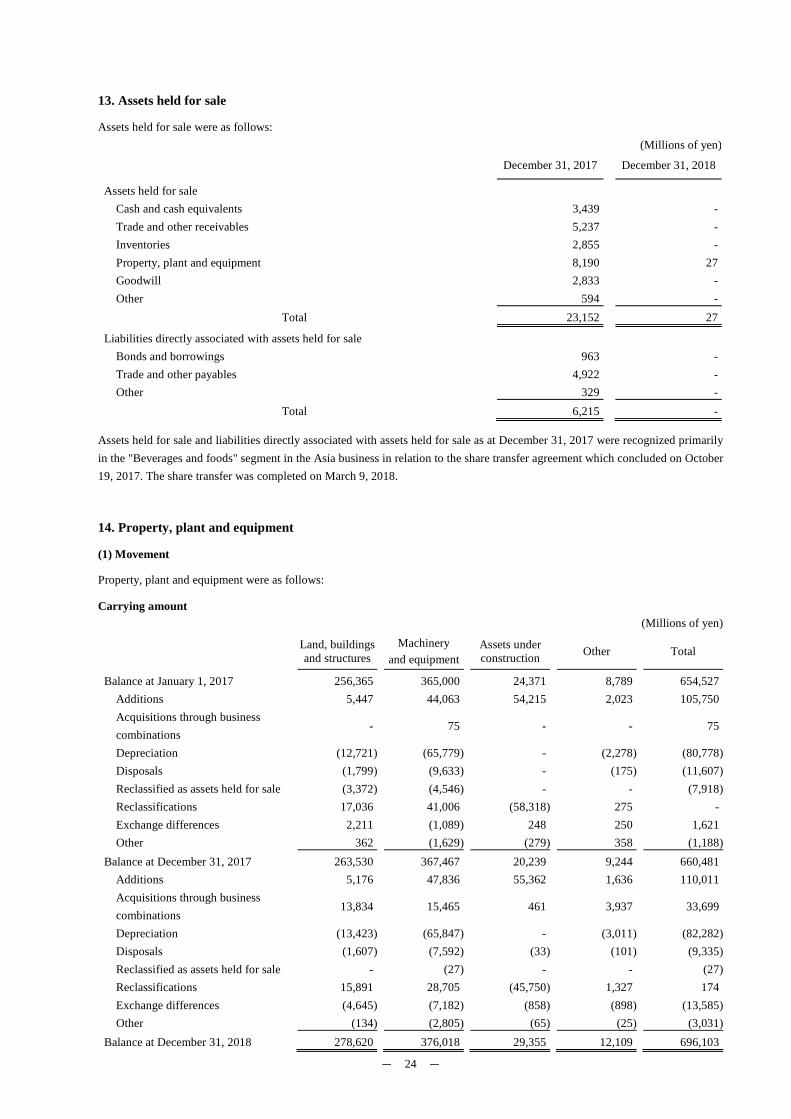
13. Assets held for sale
Assets held for sale were as follows: (Millions of yen)
December 31, 2017 December 31, 2018
Assets held for sale Cash and cash equivalents 3,439 - Trade and other receivables 5,237 - Inventories 2,855 - Property, plant and equipment 8,190 27 Goodwill 2,833 - Other 594 -
Total 23,152 27
Liabilities directly associated with assets held for sale
Bonds and borrowings 963 - Trade and other payables 4,922 - Other 329 -
Total 6,215 -
Assets held for sale and liabilities directly associated with assets held for sale as at December 31, 2017 were recognized primarily in the "Beverages and foods" segment in the Asia business in relation to the share transfer agreement which concluded on October 19, 2017. The share transfer was completed on March 9, 2018.
14. Property, plant and equipment
(1) Movement
Property, plant and equipment were as follows:
Carrying amount (Millions of yen)
Land, buildings and structures
Machinery and equipment
Assets under construction Other Total
Balance at January 1, 2017 256,365 365,000 24,371 8,789 654,527 Additions 5,447 44,063 54,215 2,023 105,750 Acquisitions through business combinations
- 75 - - 75
Depreciation (12,721) (65,779) - (2,278) (80,778)Disposals (1,799) (9,633) - (175) (11,607)Reclassified as assets held for sale (3,372) (4,546) - - (7,918)Reclassifications 17,036 41,006 (58,318) 275 - Exchange differences 2,211 (1,089) 248 250 1,621 Other 362 (1,629) (279) 358 (1,188)
Balance at December 31, 2017 263,530 367,467 20,239 9,244 660,481 Additions 5,176 47,836 55,362 1,636 110,011 Acquisitions through business combinations
13,834 15,465 461 3,937 33,699
Depreciation (13,423) (65,847) - (3,011) (82,282)Disposals (1,607) (7,592) (33) (101) (9,335)Reclassified as assets held for sale - (27) - - (27)Reclassifications 15,891 28,705 (45,750) 1,327 174 Exchange differences (4,645) (7,182) (858) (898) (13,585)Other (134) (2,805) (65) (25) (3,031)
Balance at December 31, 2018 278,620 376,018 29,355 12,109 696,103
- 25 -
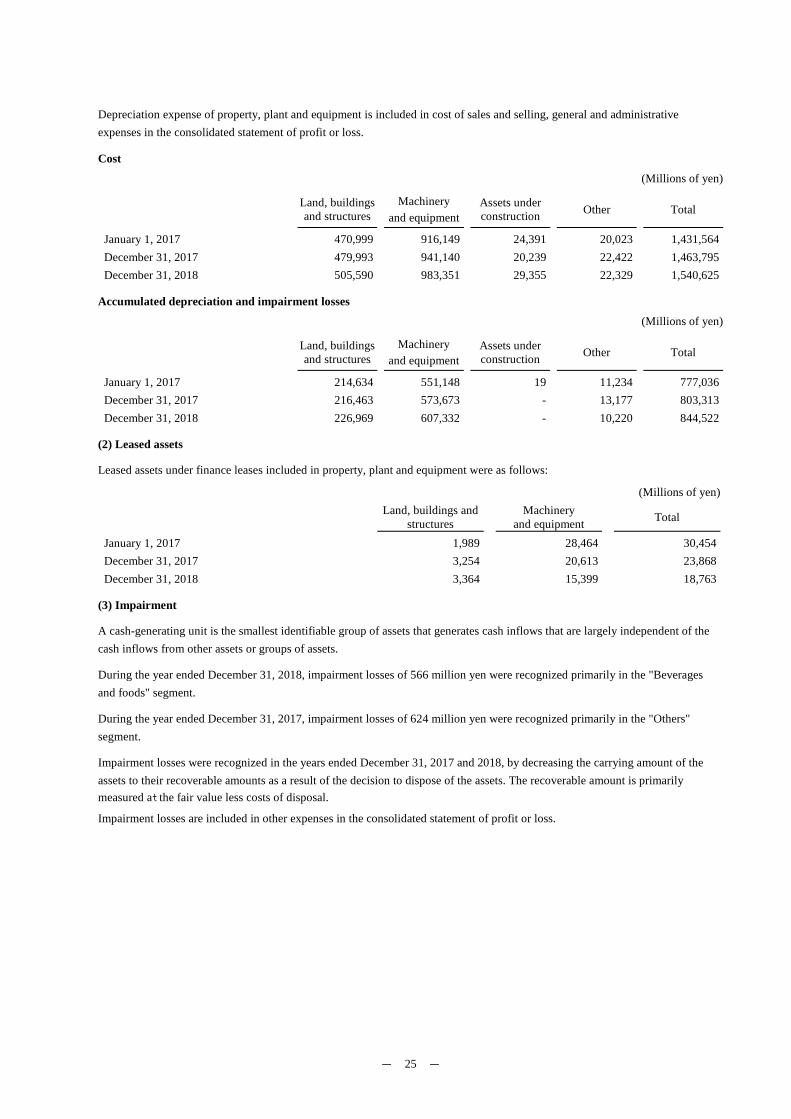
Depreciation expense of property, plant and equipment is included in cost of sales and selling, general and administrative expenses in the consolidated statement of profit or loss.
Cost (Millions of yen)
Land, buildings and structures
Machinery and equipment
Assets under construction Other Total
January 1, 2017 470,999 916,149 24,391 20,023 1,431,564 December 31, 2017 479,993 941,140 20,239 22,422 1,463,795 December 31, 2018 505,590 983,351 29,355 22,329 1,540,625
Accumulated depreciation and impairment losses (Millions of yen)
Land, buildings and structures
Machinery and equipment
Assets under construction Other Total
January 1, 2017 214,634 551,148 19 11,234 777,036 December 31, 2017 216,463 573,673 - 13,177 803,313 December 31, 2018 226,969 607,332 - 10,220 844,522
(2) Leased assets
Leased assets under finance leases included in property, plant and equipment were as follows:
(Millions of yen)
Land, buildings and
structures Machinery
and equipment Total
January 1, 2017 1,989 28,464 30,454 December 31, 2017 3,254 20,613 23,868 December 31, 2018 3,364 15,399 18,763
(3) Impairment
A cash-generating unit is the smallest identifiable group of assets that generates cash inflows that are largely independent of the cash inflows from other assets or groups of assets.
During the year ended December 31, 2018, impairment losses of 566 million yen were recognized primarily in the "Beverages and foods" segment.
During the year ended December 31, 2017, impairment losses of 624 million yen were recognized primarily in the "Others" segment.
Impairment losses were recognized in the years ended December 31, 2017 and 2018, by decreasing the carrying amount of the assets to their recoverable amounts as a result of the decision to dispose of the assets. The recoverable amount is primarily measured at the fair value less costs of disposal.
Impairment losses are included in other expenses in the consolidated statement of profit or loss.
- 26 -
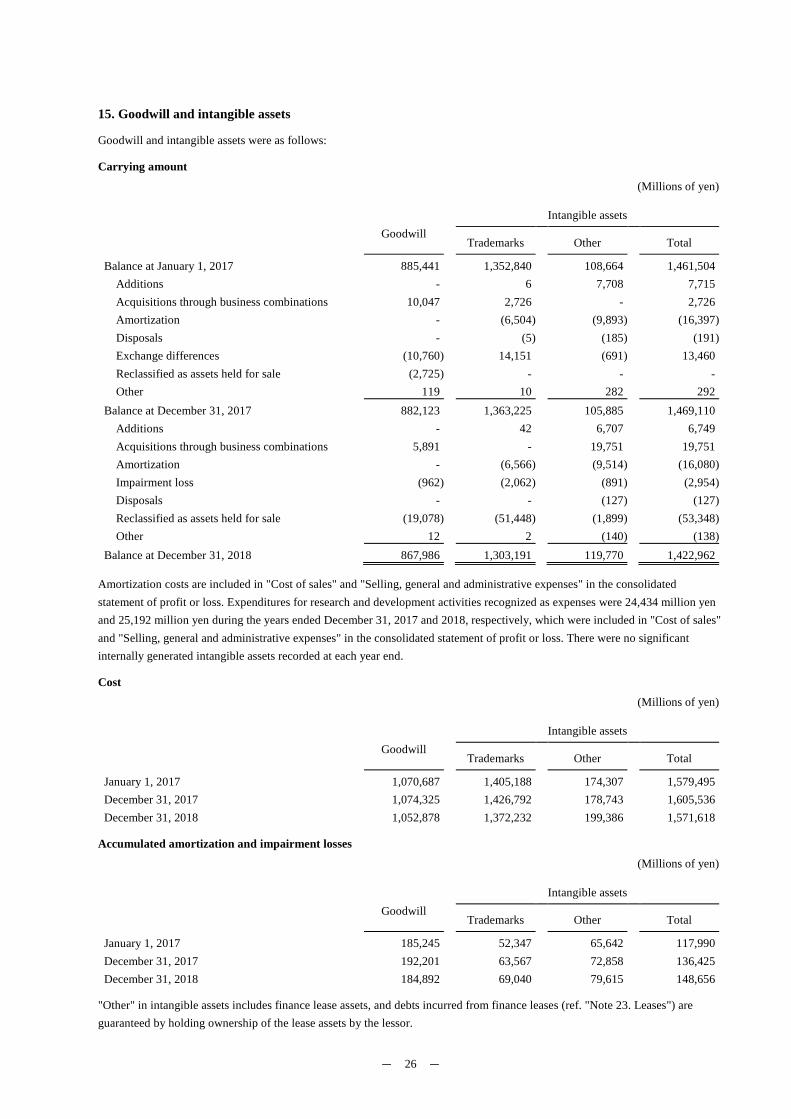
15. Goodwill and intangible assets
Goodwill and intangible assets were as follows:
Carrying amount
(Millions of yen)
Goodwill Intangible assets
Trademarks Other Total
Balance at January 1, 2017 885,441 1,352,840 108,664 1,461,504 Additions - 6 7,708 7,715 Acquisitions through business combinations 10,047 2,726 - 2,726 Amortization - (6,504) (9,893) (16,397)Disposals - (5) (185) (191)Exchange differences (10,760) 14,151 (691) 13,460 Reclassified as assets held for sale (2,725) - - - Other 119 10 282 292
Balance at December 31, 2017 882,123 1,363,225 105,885 1,469,110 Additions - 42 6,707 6,749 Acquisitions through business combinations 5,891 - 19,751 19,751 Amortization - (6,566) (9,514) (16,080)Impairment loss (962) (2,062) (891) (2,954)Disposals - - (127) (127)Reclassified as assets held for sale (19,078) (51,448) (1,899) (53,348)Other 12 2 (140) (138)
Balance at December 31, 2018 867,986 1,303,191 119,770 1,422,962
Amortization costs are included in "Cost of sales" and "Selling, general and administrative expenses" in the consolidated statement of profit or loss. Expenditures for research and development activities recognized as expenses were 24,434 million yen and 25,192 million yen during the years ended December 31, 2017 and 2018, respectively, which were included in "Cost of sales" and "Selling, general and administrative expenses" in the consolidated statement of profit or loss. There were no significant internally generated intangible assets recorded at each year end.
Cost
(Millions of yen)
Goodwill Intangible assets
Trademarks Other Total
January 1, 2017 1,070,687 1,405,188 174,307 1,579,495 December 31, 2017 1,074,325 1,426,792 178,743 1,605,536 December 31, 2018 1,052,878 1,372,232 199,386 1,571,618
Accumulated amortization and impairment losses
(Millions of yen)
Goodwill Intangible assets
Trademarks Other Total
January 1, 2017 185,245 52,347 65,642 117,990 December 31, 2017 192,201 63,567 72,858 136,425 December 31, 2018 184,892 69,040 79,615 148,656
"Other" in intangible assets includes finance lease assets, and debts incurred from finance leases (ref. "Note 23. Leases") are guaranteed by holding ownership of the lease assets by the lessor.

- 27 -
The breakdown of goodwill was as follow:
(Millions of yen)
Reportable segments December 31, 2017 December 31, 2018
Beverages and foods 254,025 250,685 (Details)
Japan business 130,680 130,680 Orangina Schweppes Group 91,099 84,792
Alcoholic beverages 628,098 617,300 (Details)
Spirits business 628,098 617,300 Other - -
Total 882,123 867,986
Goodwill for the "Beverages and foods" segment mainly consists of that recognized through the acquisition of Orangina Schweppes Holding B.V. and Japan Beverage Holdings Inc. Goodwill for the "Alcoholic beverages" segment mainly consists of that recognized through the acquisition of Beam Inc. (currently Beam Suntory Inc.).
The value in use is calculated as the discounted future cash flows estimated based on the business plans for one to three years which have been approved by management and discount rates determined with reference to the pre-tax weighted-average cost of capital ("WACC") of 4.8%‒23.4% (4.7%‒22.0% for the year ended December 31, 2017) of the cash-generating units or cash-
generating groups.
The value in use of remaining intangible assets recorded on the consolidated statement of financial position sufficiently exceeds the carrying amount of all of the cash-generating units or groups of cash-generating units except for the goodwill on which the impairment losses were recorded for the current year. The Group assessed that the value in use would continue to exceed the carrying amount even if the discount and growth rates fluctuate at a reasonably assumable level.
The breakdown of intangible assets with indefinite useful lives was as follows:
(Millions of yen)
Reportable segments December 31, 2017 December 31, 2018
Beverages and foods 356,960 352,617 (Details)
(Trademarks) Lucozade and Ribena 156,690 144,842 (Trademarks) Schweppes 81,017 76,250
Alcoholic beverages 948,179 922,137 (Details)
(Trademarks) Jim Beam 298,805 293,517 (Trademarks) Maker's Mark 295,551 290,320
Other - - Total 1,305,140 1,274,755
Intangible assets with indefinite useful lives for the "Beverages and foods" segment mainly consist of those recognized through the acquisition of Lucozade Ribena Suntory Limited and Orangina Schweppes Holding B.V. Intangible assets with indefinite useful lives for the "Alcoholic beverages" segment mainly consist of those recognized through the acquisition of Beam Inc. (currently Beam Suntory Inc.).
It has been deemed appropriate to treat those assets as having indefinite lives for as long as the business is a going concern. Thus, they are not amortized.
The value in use is calculated as the discounted future cash flows which are estimated based on the business plans for one to three years, which have been approved by management and discount rates determined with reference to the pre-tax WACC of 3.9%‒
10.3% (3.9%‒8.9% for the year ended December 31, 2017) of the cash-generating units or groups of cash-generating units.
- 28 -
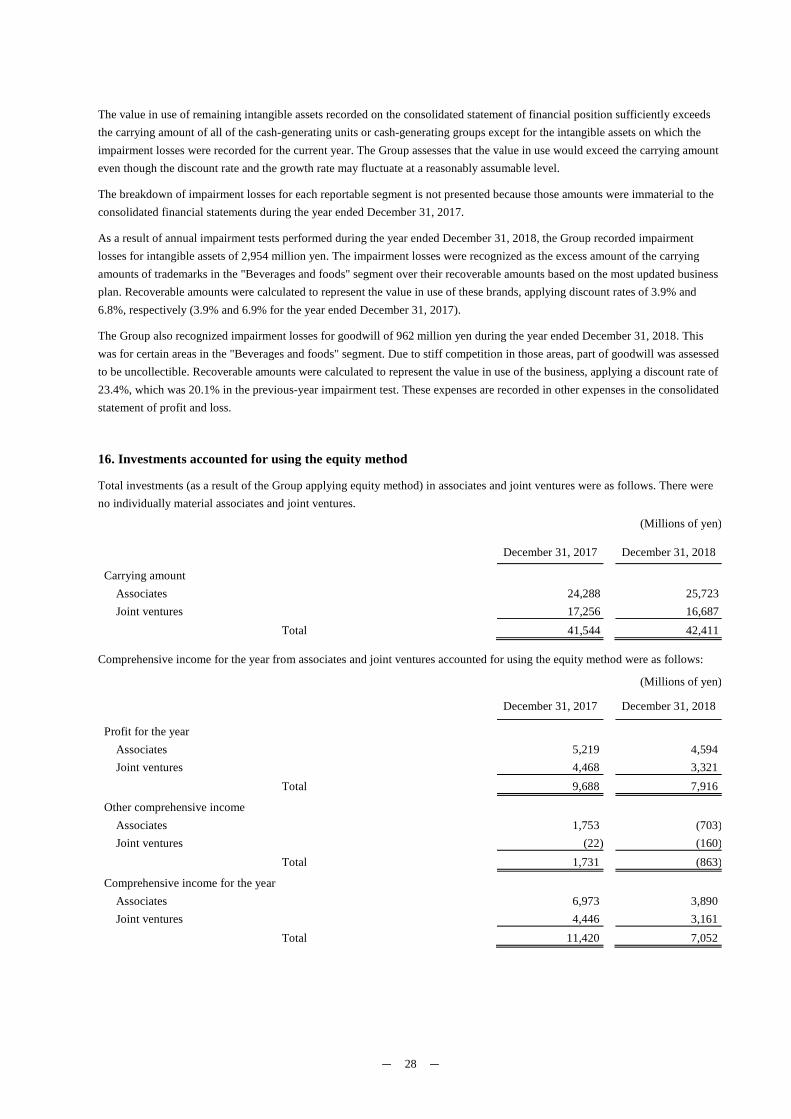
The value in use of remaining intangible assets recorded on the consolidated statement of financial position sufficiently exceeds the carrying amount of all of the cash-generating units or cash-generating groups except for the intangible assets on which the impairment losses were recorded for the current year. The Group assesses that the value in use would exceed the carrying amount even though the discount rate and the growth rate may fluctuate at a reasonably assumable level.
The breakdown of impairment losses for each reportable segment is not presented because those amounts were immaterial to the consolidated financial statements during the year ended December 31, 2017.
As a result of annual impairment tests performed during the year ended December 31, 2018, the Group recorded impairment losses for intangible assets of 2,954 million yen. The impairment losses were recognized as the excess amount of the carrying amounts of trademarks in the "Beverages and foods" segment over their recoverable amounts based on the most updated business plan. Recoverable amounts were calculated to represent the value in use of these brands, applying discount rates of 3.9% and 6.8%, respectively (3.9% and 6.9% for the year ended December 31, 2017).
The Group also recognized impairment losses for goodwill of 962 million yen during the year ended December 31, 2018. This was for certain areas in the "Beverages and foods" segment. Due to stiff competition in those areas, part of goodwill was assessed to be uncollectible. Recoverable amounts were calculated to represent the value in use of the business, applying a discount rate of 23.4%, which was 20.1% in the previous-year impairment test. These expenses are recorded in other expenses in the consolidated statement of profit and loss.
16. Investments accounted for using the equity method
Total investments (as a result of the Group applying equity method) in associates and joint ventures were as follows. There were no individually material associates and joint ventures.
(Millions of yen)
December 31, 2017 December 31, 2018
Carrying amount
Associates 24,288 25,723 Joint ventures 17,256 16,687
Total 41,544 42,411
Comprehensive income for the year from associates and joint ventures accounted for using the equity method were as follows:
(Millions of yen)
December 31, 2017 December 31, 2018
Profit for the year
Associates 5,219 4,594 Joint ventures 4,468 3,321
Total 9,688 7,916
Other comprehensive income
Associates 1,753 (703)Joint ventures (22) (160)
Total 1,731 (863)
Comprehensive income for the year
Associates 6,973 3,890 Joint ventures 4,446 3,161
Total 11,420 7,052
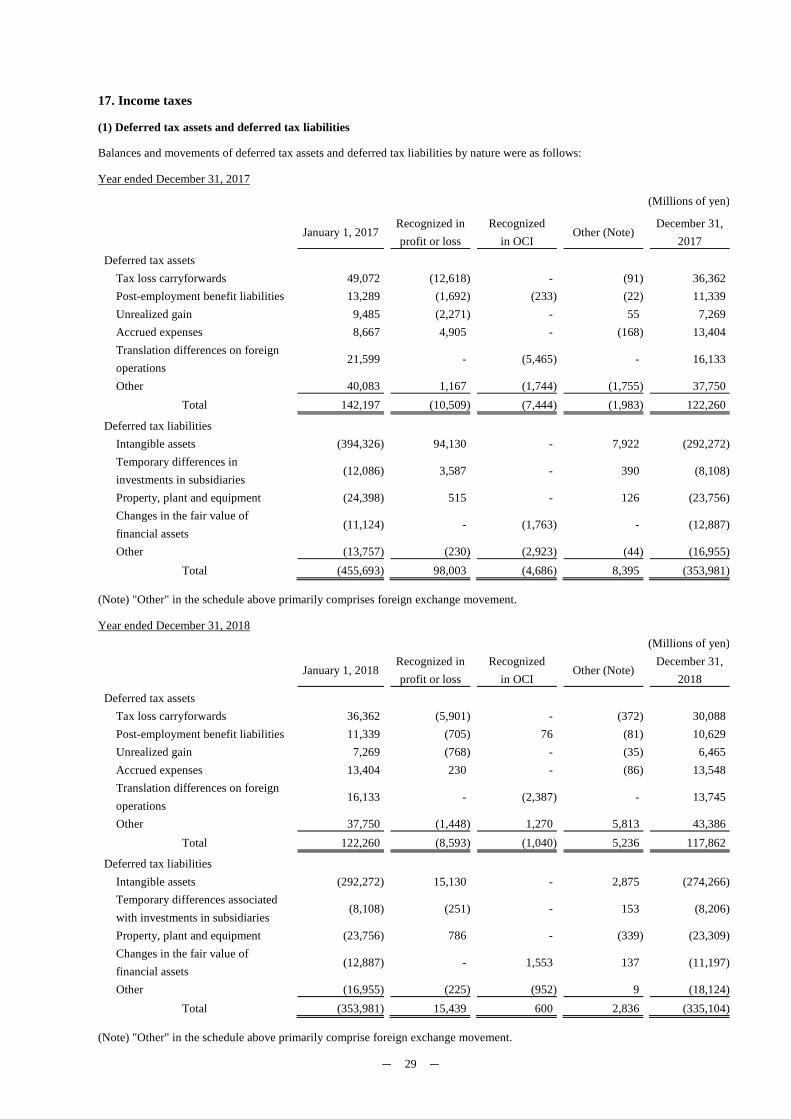
- 29 -
17. Income taxes
(1) Deferred tax assets and deferred tax liabilities
Balances and movements of deferred tax assets and deferred tax liabilities by nature were as follows:
Year ended December 31, 2017
(Millions of yen)
January 1, 2017 Recognized in profit or loss
Recognized
in OCI
Other (Note) December 31,
2017 Deferred tax assets
Tax loss carryforwards 49,072 (12,618) - (91) 36,362 Post-employment benefit liabilities 13,289 (1,692) (233) (22) 11,339 Unrealized gain 9,485 (2,271) - 55 7,269 Accrued expenses 8,667 4,905 - (168) 13,404 Translation differences on foreign operations
21,599 - (5,465) - 16,133
Other 40,083 1,167 (1,744) (1,755) 37,750 Total 142,197 (10,509) (7,444) (1,983) 122,260
Deferred tax liabilities Intangible assets (394,326) 94,130 - 7,922 (292,272)Temporary differences in investments in subsidiaries
(12,086) 3,587 - 390 (8,108)
Property, plant and equipment (24,398) 515 - 126 (23,756)Changes in the fair value of financial assets
(11,124) - (1,763) - (12,887)
Other (13,757) (230) (2,923) (44) (16,955)Total (455,693) 98,003 (4,686) 8,395 (353,981)
(Note) "Other" in the schedule above primarily comprises foreign exchange movement.
Year ended December 31, 2018 (Millions of yen)
January 1, 2018 Recognized in profit or loss
Recognized
in OCI
Other (Note) December 31,
2018 Deferred tax assets
Tax loss carryforwards 36,362 (5,901) - (372) 30,088 Post-employment benefit liabilities 11,339 (705) 76 (81) 10,629 Unrealized gain 7,269 (768) - (35) 6,465 Accrued expenses 13,404 230 - (86) 13,548 Translation differences on foreign operations
16,133 - (2,387) - 13,745
Other 37,750 (1,448) 1,270 5,813 43,386 Total 122,260 (8,593) (1,040) 5,236 117,862
Deferred tax liabilities Intangible assets (292,272) 15,130 - 2,875 (274,266)Temporary differences associated with investments in subsidiaries
(8,108) (251) - 153 (8,206)
Property, plant and equipment (23,756) 786 - (339) (23,309)Changes in the fair value of financial assets
(12,887) - 1,553 137 (11,197)
Other (16,955) (225) (952) 9 (18,124)Total (353,981) 15,439 600 2,836 (335,104)
(Note) "Other" in the schedule above primarily comprise foreign exchange movement.
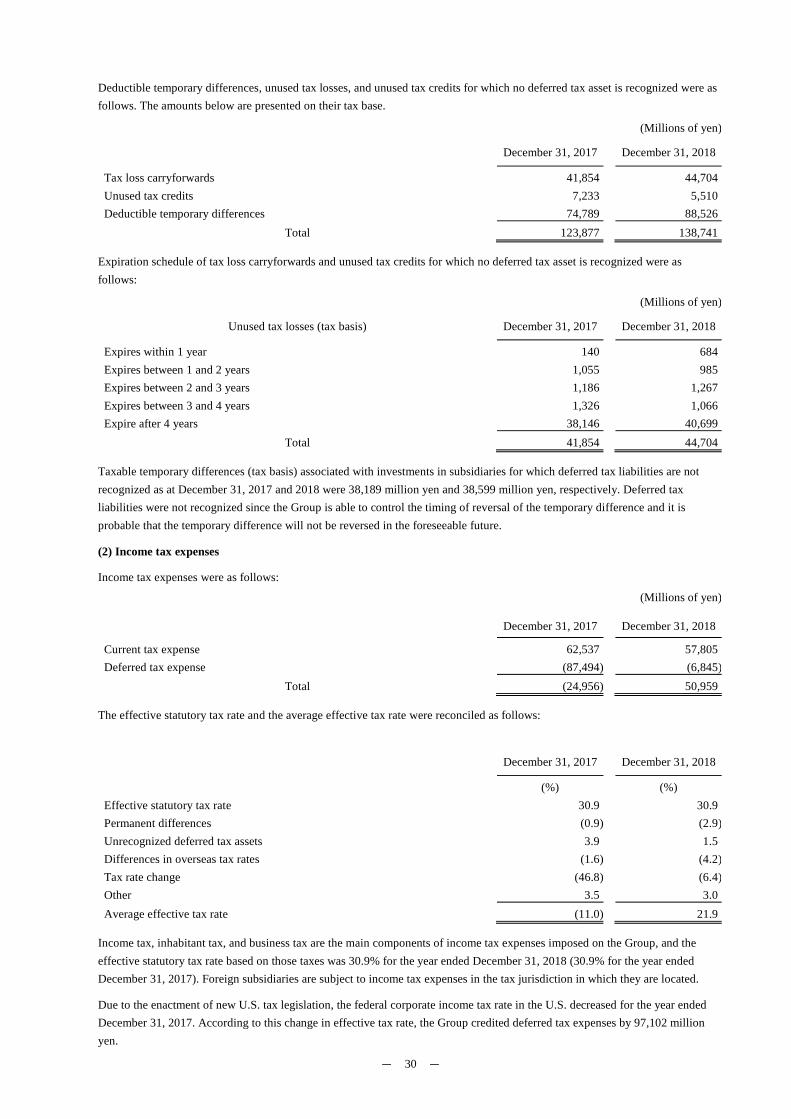
- 30 -
Deductible temporary differences, unused tax losses, and unused tax credits for which no deferred tax asset is recognized were as follows. The amounts below are presented on their tax base.
(Millions of yen)
December 31, 2017 December 31, 2018
Tax loss carryforwards 41,854 44,704 Unused tax credits 7,233 5,510 Deductible temporary differences 74,789 88,526
Total 123,877 138,741
Expiration schedule of tax loss carryforwards and unused tax credits for which no deferred tax asset is recognized were as follows:
(Millions of yen)
Unused tax losses (tax basis) December 31, 2017 December 31, 2018
Expires within 1 year 140 684 Expires between 1 and 2 years 1,055 985 Expires between 2 and 3 years 1,186 1,267 Expires between 3 and 4 years 1,326 1,066 Expire after 4 years 38,146 40,699
Total 41,854 44,704
Taxable temporary differences (tax basis) associated with investments in subsidiaries for which deferred tax liabilities are not recognized as at December 31, 2017 and 2018 were 38,189 million yen and 38,599 million yen, respectively. Deferred tax liabilities were not recognized since the Group is able to control the timing of reversal of the temporary difference and it is probable that the temporary difference will not be reversed in the foreseeable future.
(2) Income tax expenses
Income tax expenses were as follows:
(Millions of yen)
December 31, 2017 December 31, 2018
Current tax expense 62,537 57,805 Deferred tax expense (87,494) (6,845)
Total (24,956) 50,959
The effective statutory tax rate and the average effective tax rate were reconciled as follows:
December 31, 2017 December 31, 2018
(%) (%) Effective statutory tax rate 30.9 30.9 Permanent differences (0.9) (2.9)Unrecognized deferred tax assets 3.9 1.5 Differences in overseas tax rates (1.6) (4.2)Tax rate change (46.8) (6.4)Other 3.5 3.0 Average effective tax rate (11.0) 21.9
Income tax, inhabitant tax, and business tax are the main components of income tax expenses imposed on the Group, and the effective statutory tax rate based on those taxes was 30.9% for the year ended December 31, 2018 (30.9% for the year ended December 31, 2017). Foreign subsidiaries are subject to income tax expenses in the tax jurisdiction in which they are located.
Due to the enactment of new U.S. tax legislation, the federal corporate income tax rate in the U.S. decreased for the year ended December 31, 2017. According to this change in effective tax rate, the Group credited deferred tax expenses by 97,102 million yen.

- 31 -
Due to the enactment of tax amendments in the Netherland and some states in the U.S. for the year ended December 31, 2018, the Group reassessed deferred tax assets and liabilities, and credited deferred tax expenses by 14,847 million yen.
18. Bonds and borrowings
(1) Bonds and borrowings
Bonds and borrowings were as follows:
December 31, 2017 December 31, 2018 Average interest
rate (Note 1) Maturity date
(Millions of yen) (%) Short-term borrowings 39,658 36,350 1.77 -
Current portion of long-term borrowings 223,650 104,450 1.81 -
Current portion of bonds (Note 2) 28,192 102,596 2.10 -
Long-term borrowings 1,177,504 992,835 1.88 2020 - 2076 Bonds (Note 2) 362,259 355,794 2.33 2021 - 2078
Total 1,831,265 1,592,026
Current liabilities 291,501 243,396
Non-current liabilities 1,539,763 1,348,629
Total 1,831,265 1,592,026
(Note 1) The average interest rate is calculated as the weighted-average interest rate as at the end of the fiscal year. (Note 2) The summary of the terms of bonds was as follows:
Issuer Type Issue date December 31, 2017 December 31, 2018 Interest rate Collateral Maturity date
(Millions of yen) (Millions of yen) (%)
Suntory Holdings Limited
Publicly offered corporate bonds
June 2, 2016 49,832 49,858 0.15 -
0.22 None
June 2, 2023 -
June 2, 2026
Suntory Holdings Limited
Euro U.S. dollar bonds
May 9, 2014
22,597 22,199
3.04 None May 9, 2019
[200,000 thousand U.S. dollars]
[200,000 thousand U.S. dollars]
(22,199 [200,000 thousand U.S.
dollars])
Suntory Holdings Limited
U.S. dollar bonds October 1, 2014
56,282 55,406
2.55 None September 29,
2019
[499,642 thousand U.S. dollars]
[499,847 thousand U.S. dollars]
(55,406 [499,847 thousand U.S.
dollars])Suntory Holdings Limited
U.S. dollar bonds June 28, 2017 67,153 66,099
2.55 None June 27, 2022 [600,000 thousand U.S. dollars]
[600,000 thousand U.S. dollars]
Suntory Holdings Limited
Interest deferrable and early redeemable subordinated bonds
April 25, 2018 - 71,606 0.68 None April 25, 2078
Suntory Beverage & Food Limited
Publicly offered corporate bonds
June 26, 2014 -
July 26, 2018
39,921 69,845 0.00 -
0.07 None
June 26, 2019 -
June 26, 2024 (24,989)
Beam Suntory Inc.
Publicly offered corporate U.S. dollar bonds
November 15, 1991 -
June 10, 2013
154,665 123,373
3.25 - 8.63
None
November 15, 2021 -
January 15, 2036
[1,368,719 thousand U.S. dollars]
(28,192 [249,489 thousand U.S.
dollars])
[1,111,472 thousand U.S. dollars]
Total - - 390,451 458,390
- - - (28,192) (102,596)
Amounts enclosed in ( ) in the table above represent current portion of long-term bonds.
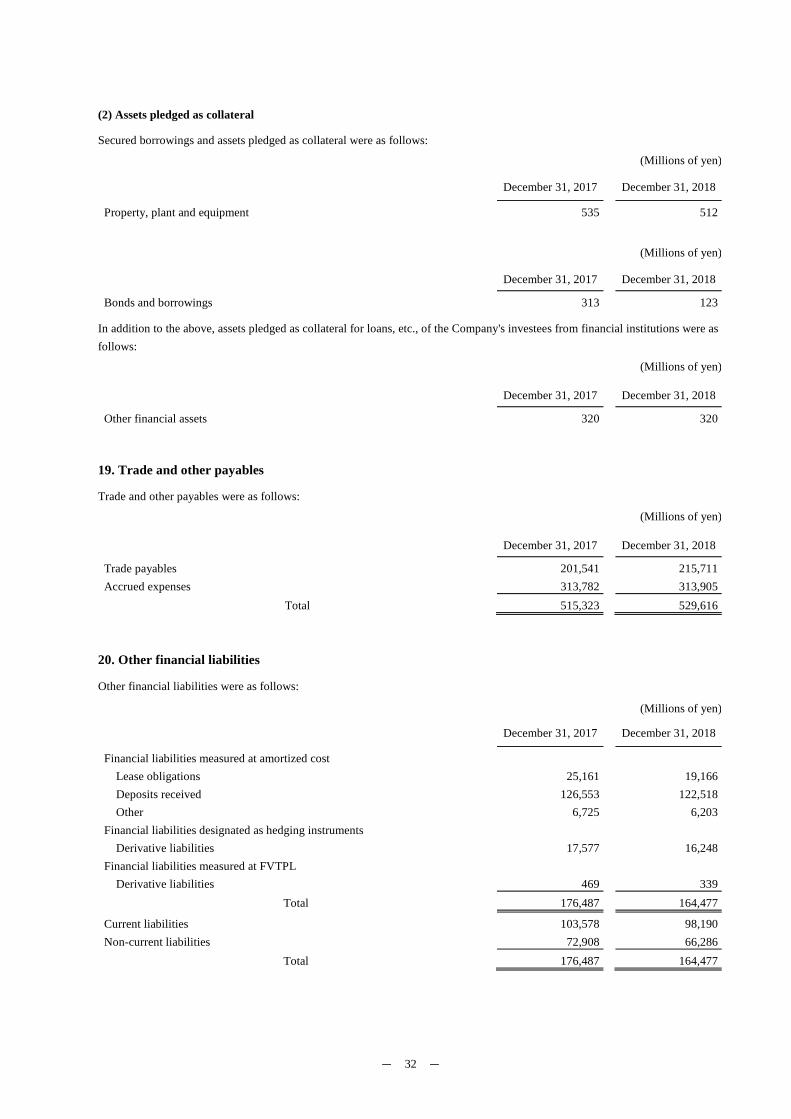
- 32 -
(2) Assets pledged as collateral
Secured borrowings and assets pledged as collateral were as follows:
(Millions of yen)
December 31, 2017 December 31, 2018
Property, plant and equipment 535 512
(Millions of yen)
December 31, 2017 December 31, 2018
Bonds and borrowings 313 123
In addition to the above, assets pledged as collateral for loans, etc., of the Company's investees from financial institutions were as follows:
(Millions of yen)
December 31, 2017 December 31, 2018
Other financial assets 320 320
19. Trade and other payables
Trade and other payables were as follows:
(Millions of yen)
December 31, 2017 December 31, 2018
Trade payables 201,541 215,711 Accrued expenses 313,782 313,905
Total 515,323 529,616
20. Other financial liabilities
Other financial liabilities were as follows:
(Millions of yen)
December 31, 2017 December 31, 2018
Financial liabilities measured at amortized cost
Lease obligations 25,161 19,166 Deposits received 126,553 122,518 Other 6,725 6,203
Financial liabilities designated as hedging instruments
Derivative liabilities 17,577 16,248 Financial liabilities measured at FVTPL
Derivative liabilities 469 339 Total 176,487 164,477
Current liabilities 103,578 98,190 Non-current liabilities 72,908 66,286
Total 176,487 164,477
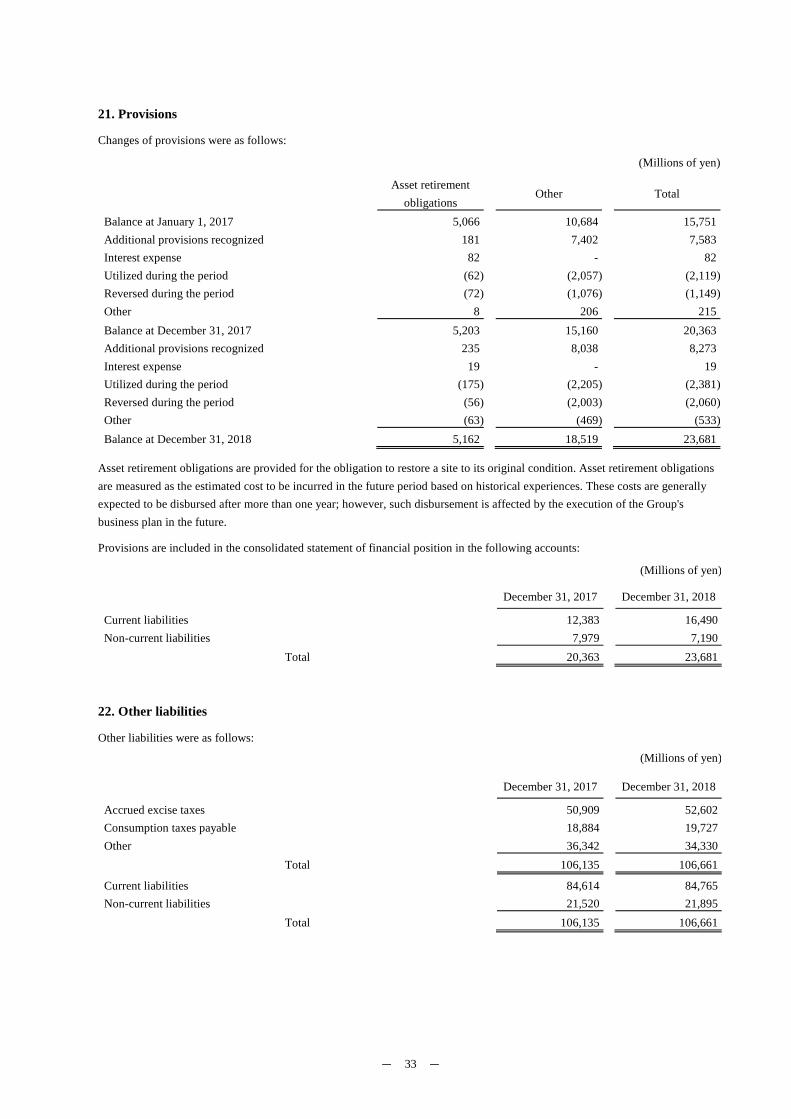
- 33 -
21. Provisions
Changes of provisions were as follows:
(Millions of yen)
Asset retirement
obligations Other Total
Balance at January 1, 2017 5,066 10,684 15,751 Additional provisions recognized 181 7,402 7,583 Interest expense 82 - 82 Utilized during the period (62) (2,057) (2,119)Reversed during the period (72) (1,076) (1,149)Other 8 206 215 Balance at December 31, 2017 5,203 15,160 20,363 Additional provisions recognized 235 8,038 8,273 Interest expense 19 - 19 Utilized during the period (175) (2,205) (2,381)Reversed during the period (56) (2,003) (2,060)Other (63) (469) (533)Balance at December 31, 2018 5,162 18,519 23,681
Asset retirement obligations are provided for the obligation to restore a site to its original condition. Asset retirement obligations are measured as the estimated cost to be incurred in the future period based on historical experiences. These costs are generally expected to be disbursed after more than one year; however, such disbursement is affected by the execution of the Group's business plan in the future.
Provisions are included in the consolidated statement of financial position in the following accounts:
(Millions of yen)
December 31, 2017 December 31, 2018
Current liabilities 12,383 16,490 Non-current liabilities 7,979 7,190
Total 20,363 23,681
22. Other liabilities
Other liabilities were as follows:
(Millions of yen)
December 31, 2017 December 31, 2018
Accrued excise taxes 50,909 52,602 Consumption taxes payable 18,884 19,727 Other 36,342 34,330
Total 106,135 106,661
Current liabilities 84,614 84,765 Non-current liabilities 21,520 21,895
Total 106,135 106,661
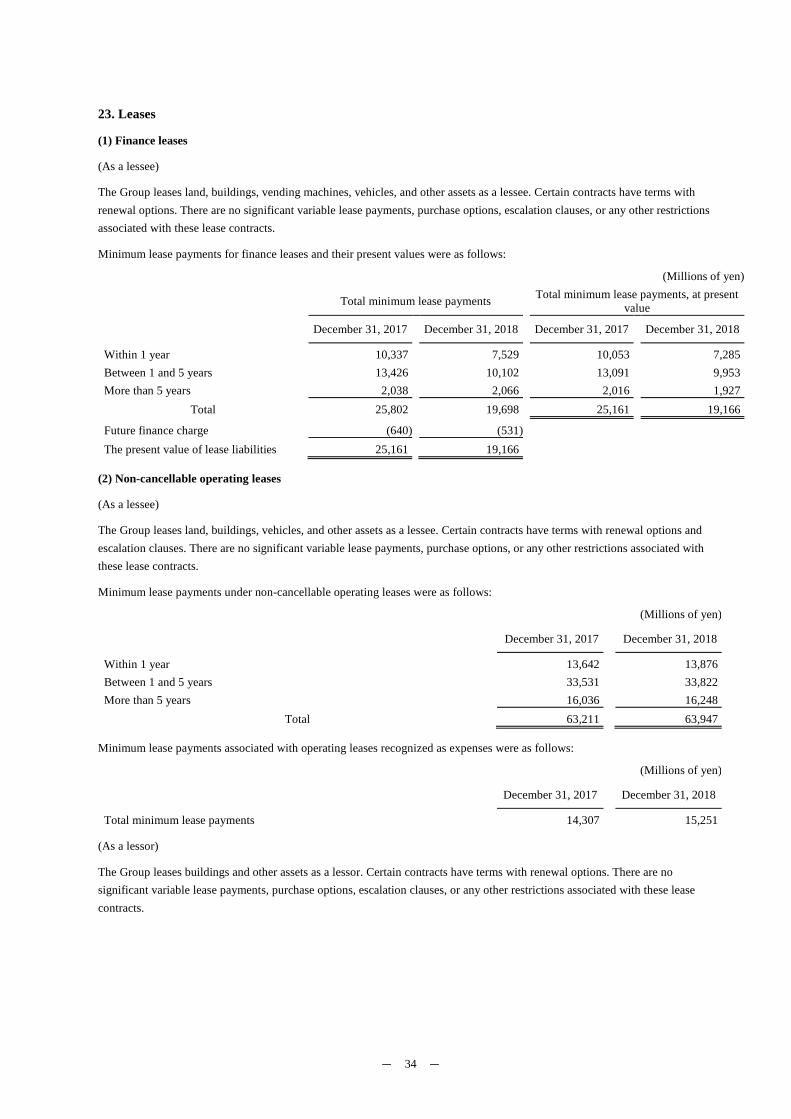
- 34 -
23. Leases
(1) Finance leases
(As a lessee)
The Group leases land, buildings, vending machines, vehicles, and other assets as a lessee. Certain contracts have terms with renewal options. There are no significant variable lease payments, purchase options, escalation clauses, or any other restrictions associated with these lease contracts.
Minimum lease payments for finance leases and their present values were as follows:
(Millions of yen)
Total minimum lease payments Total minimum lease payments, at present
value
December 31, 2017 December 31, 2018 December 31, 2017 December 31, 2018
Within 1 year 10,337 7,529 10,053 7,285 Between 1 and 5 years 13,426 10,102 13,091 9,953 More than 5 years 2,038 2,066 2,016 1,927
Total 25,802 19,698 25,161 19,166
Future finance charge (640) (531)The present value of lease liabilities 25,161 19,166
(2) Non-cancellable operating leases
(As a lessee)
The Group leases land, buildings, vehicles, and other assets as a lessee. Certain contracts have terms with renewal options and escalation clauses. There are no significant variable lease payments, purchase options, or any other restrictions associated with these lease contracts.
Minimum lease payments under non-cancellable operating leases were as follows:
(Millions of yen)
December 31, 2017 December 31, 2018
Within 1 year 13,642 13,876 Between 1 and 5 years 33,531 33,822 More than 5 years 16,036 16,248
Total 63,211 63,947
Minimum lease payments associated with operating leases recognized as expenses were as follows:
(Millions of yen)
December 31, 2017 December 31, 2018
Total minimum lease payments 14,307 15,251
(As a lessor)
The Group leases buildings and other assets as a lessor. Certain contracts have terms with renewal options. There are no significant variable lease payments, purchase options, escalation clauses, or any other restrictions associated with these lease contracts.

- 35 -
Minimum lease receivables under non-cancellable operating leases were as follows:
(Millions of yen)
December 31, 2017 December 31, 2018
Within 1 year 377 373 Between 1 and 5 years 663 803 More than 5 years 873 1,436 Total 1,914 2,612
24. Post-employment benefit plans
(1) Defined benefit plans
The Company and some of its subsidiaries established post-employment benefit plans, such as a defined benefit corporate pension plan and a lump-sum employment benefit plan. Certain subsidiaries also provide defined contribution pension plans. These plans are exposed to a variety of risks, such as general investment risk, interest rate risk, and inflation risk.
The defined benefit plans are administered by a separate fund that is legally isolated from the Group. The board of the pension fund and pension property management trust institutions are obliged by law to act in the interest of the members in the scheme and to manage the plan assets in accordance with designated management policies.
[1] Reconciliation of defined benefit obligations and plan assets
The liability recorded in the consolidated statement of financial position and with defined benefit obligations and plan assets were reconciled as follows:
(Millions of yen)
December 31, 2017 December 31, 2018
Present value of funded defined benefit obligations 188,691 182,303 Fair value of plan assets (181,308) (174,182) 7,382 8,120 Present value of unfunded defined benefit obligation 27,630 29,247 Net defined benefit liability 35,013 37,367
Balance in consolidated statement of financial position Post-employment benefit liabilities 41,478 40,670 Post-employment benefit assets (6,465) (3,303)
Net of liabilities and assets 35,013 37,367
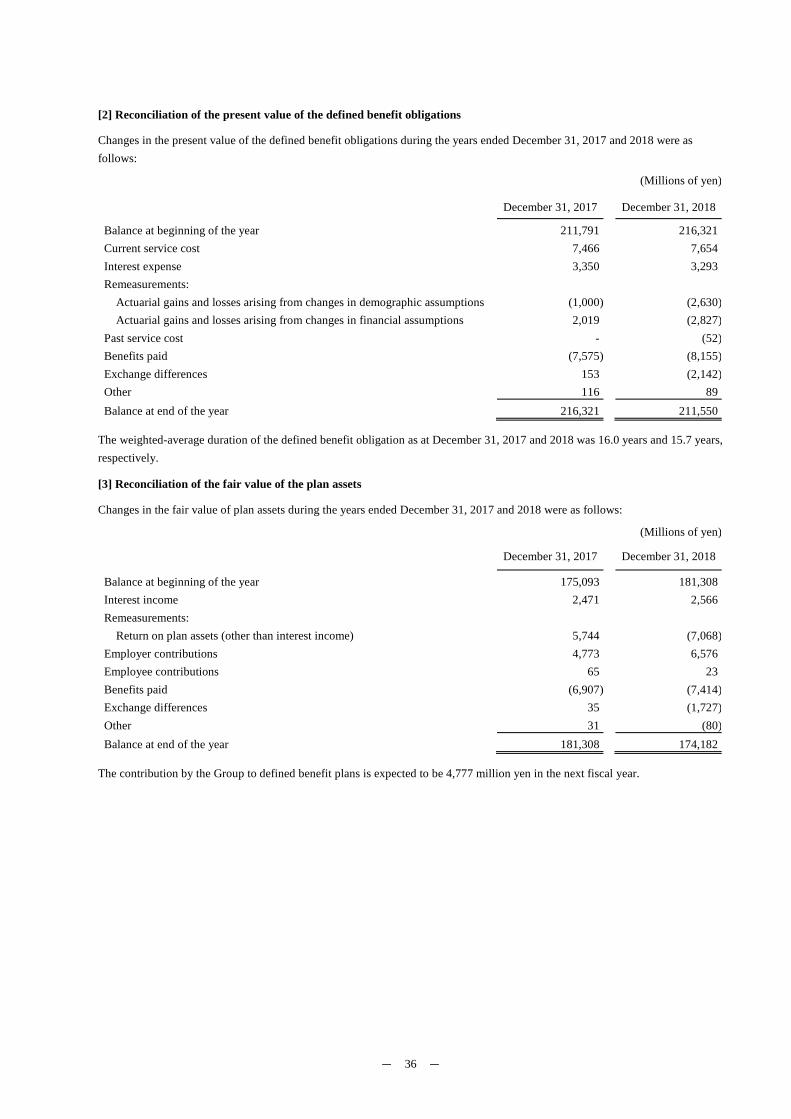
- 36 -
[2] Reconciliation of the present value of the defined benefit obligations
Changes in the present value of the defined benefit obligations during the years ended December 31, 2017 and 2018 were as follows:
(Millions of yen)
December 31, 2017 December 31, 2018
Balance at beginning of the year 211,791 216,321 Current service cost 7,466 7,654 Interest expense 3,350 3,293 Remeasurements:
Actuarial gains and losses arising from changes in demographic assumptions (1,000) (2,630)Actuarial gains and losses arising from changes in financial assumptions 2,019 (2,827)
Past service cost - (52)Benefits paid (7,575) (8,155)Exchange differences 153 (2,142)Other 116 89 Balance at end of the year 216,321 211,550
The weighted-average duration of the defined benefit obligation as at December 31, 2017 and 2018 was 16.0 years and 15.7 years, respectively.
[3] Reconciliation of the fair value of the plan assets
Changes in the fair value of plan assets during the years ended December 31, 2017 and 2018 were as follows:
(Millions of yen)
December 31, 2017 December 31, 2018
Balance at beginning of the year 175,093 181,308 Interest income 2,471 2,566 Remeasurements:
Return on plan assets (other than interest income) 5,744 (7,068)Employer contributions 4,773 6,576 Employee contributions 65 23 Benefits paid (6,907) (7,414)Exchange differences 35 (1,727)Other 31 (80)Balance at end of the year 181,308 174,182
The contribution by the Group to defined benefit plans is expected to be 4,777 million yen in the next fiscal year.
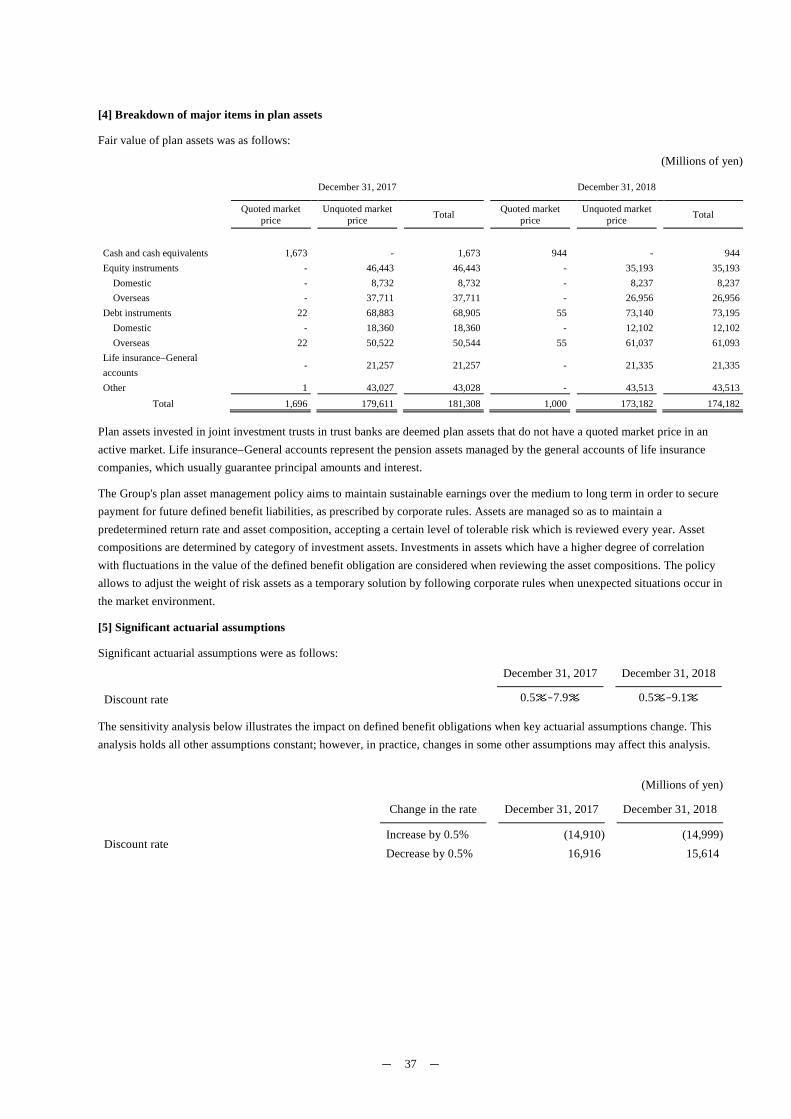
- 37 -
[4] Breakdown of major items in plan assets
Fair value of plan assets was as follows: (Millions of yen)
December 31, 2017 December 31, 2018
Quoted market
price Unquoted market
price Total Quoted market
price Unquoted market
price Total
Cash and cash equivalents 1,673 - 1,673 944 - 944 Equity instruments - 46,443 46,443 - 35,193 35,193
Domestic - 8,732 8,732 - 8,237 8,237 Overseas - 37,711 37,711 - 26,956 26,956
Debt instruments 22 68,883 68,905 55 73,140 73,195 Domestic - 18,360 18,360 - 12,102 12,102 Overseas 22 50,522 50,544 55 61,037 61,093
Life insurance–General accounts
- 21,257 21,257 - 21,335 21,335
Other 1 43,027 43,028 - 43,513 43,513 Total 1,696 179,611 181,308 1,000 173,182 174,182
Plan assets invested in joint investment trusts in trust banks are deemed plan assets that do not have a quoted market price in an active market. Life insurance–General accounts represent the pension assets managed by the general accounts of life insurance companies, which usually guarantee principal amounts and interest.
The Group's plan asset management policy aims to maintain sustainable earnings over the medium to long term in order to secure payment for future defined benefit liabilities, as prescribed by corporate rules. Assets are managed so as to maintain a predetermined return rate and asset composition, accepting a certain level of tolerable risk which is reviewed every year. Asset compositions are determined by category of investment assets. Investments in assets which have a higher degree of correlation with fluctuations in the value of the defined benefit obligation are considered when reviewing the asset compositions. The policy allows to adjust the weight of risk assets as a temporary solution by following corporate rules when unexpected situations occur in the market environment.
[5] Significant actuarial assumptions
Significant actuarial assumptions were as follows:
December 31, 2017 December 31, 2018
Discount rate 0.5%‒7.9% 0.5%‒9.1%
The sensitivity analysis below illustrates the impact on defined benefit obligations when key actuarial assumptions change. This analysis holds all other assumptions constant; however, in practice, changes in some other assumptions may affect this analysis.
(Millions of yen)
Change in the rate December 31, 2017 December 31, 2018
Discount rate Increase by 0.5% (14,910) (14,999)Decrease by 0.5% 16,916 15,614
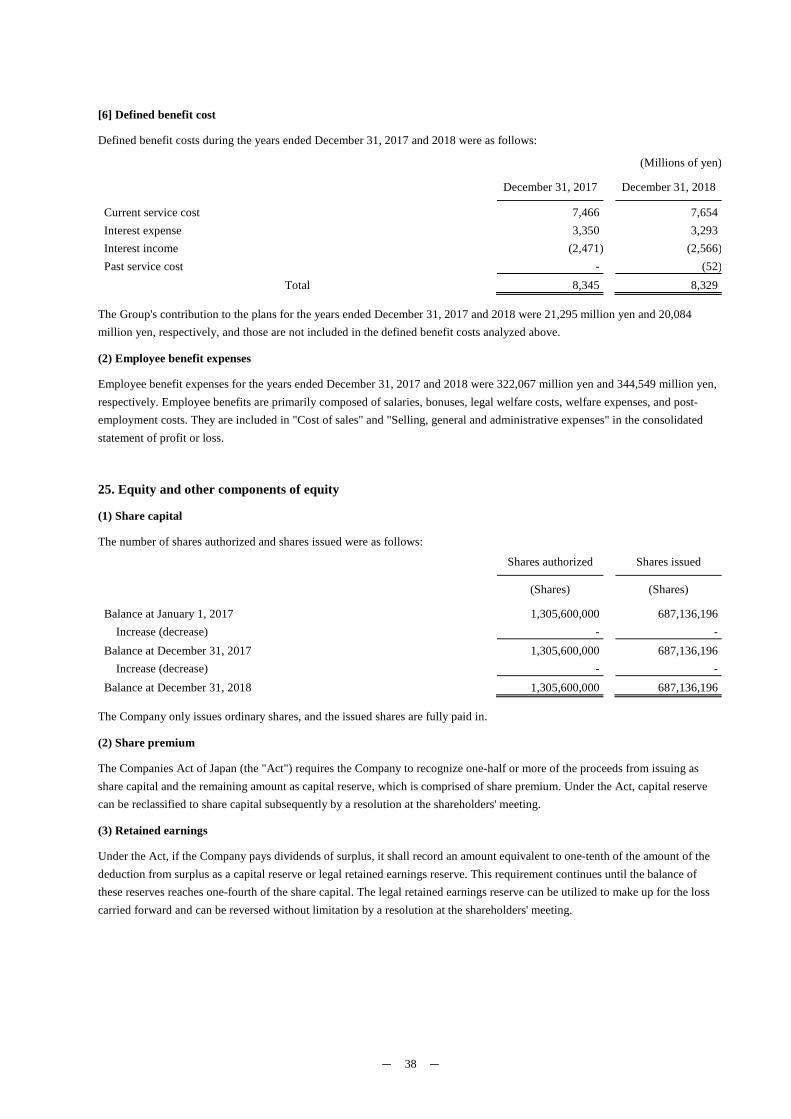
- 38 -
[6] Defined benefit cost
Defined benefit costs during the years ended December 31, 2017 and 2018 were as follows:
(Millions of yen)
December 31, 2017 December 31, 2018
Current service cost 7,466 7,654 Interest expense 3,350 3,293 Interest income (2,471) (2,566)Past service cost - (52)
Total 8,345 8,329
The Group's contribution to the plans for the years ended December 31, 2017 and 2018 were 21,295 million yen and 20,084 million yen, respectively, and those are not included in the defined benefit costs analyzed above.
(2) Employee benefit expenses
Employee benefit expenses for the years ended December 31, 2017 and 2018 were 322,067 million yen and 344,549 million yen, respectively. Employee benefits are primarily composed of salaries, bonuses, legal welfare costs, welfare expenses, and post-employment costs. They are included in "Cost of sales" and "Selling, general and administrative expenses" in the consolidated statement of profit or loss.
25. Equity and other components of equity
(1) Share capital
The number of shares authorized and shares issued were as follows:
Shares authorized Shares issued
(Shares) (Shares)
Balance at January 1, 2017 1,305,600,000 687,136,196 Increase (decrease) - -
Balance at December 31, 2017 1,305,600,000 687,136,196 Increase (decrease) - -
Balance at December 31, 2018 1,305,600,000 687,136,196
The Company only issues ordinary shares, and the issued shares are fully paid in.
(2) Share premium
The Companies Act of Japan (the "Act") requires the Company to recognize one-half or more of the proceeds from issuing as share capital and the remaining amount as capital reserve, which is comprised of share premium. Under the Act, capital reserve can be reclassified to share capital subsequently by a resolution at the shareholders' meeting.
(3) Retained earnings
Under the Act, if the Company pays dividends of surplus, it shall record an amount equivalent to one-tenth of the amount of the deduction from surplus as a capital reserve or legal retained earnings reserve. This requirement continues until the balance of these reserves reaches one-fourth of the share capital. The legal retained earnings reserve can be utilized to make up for the loss carried forward and can be reversed without limitation by a resolution at the shareholders' meeting.
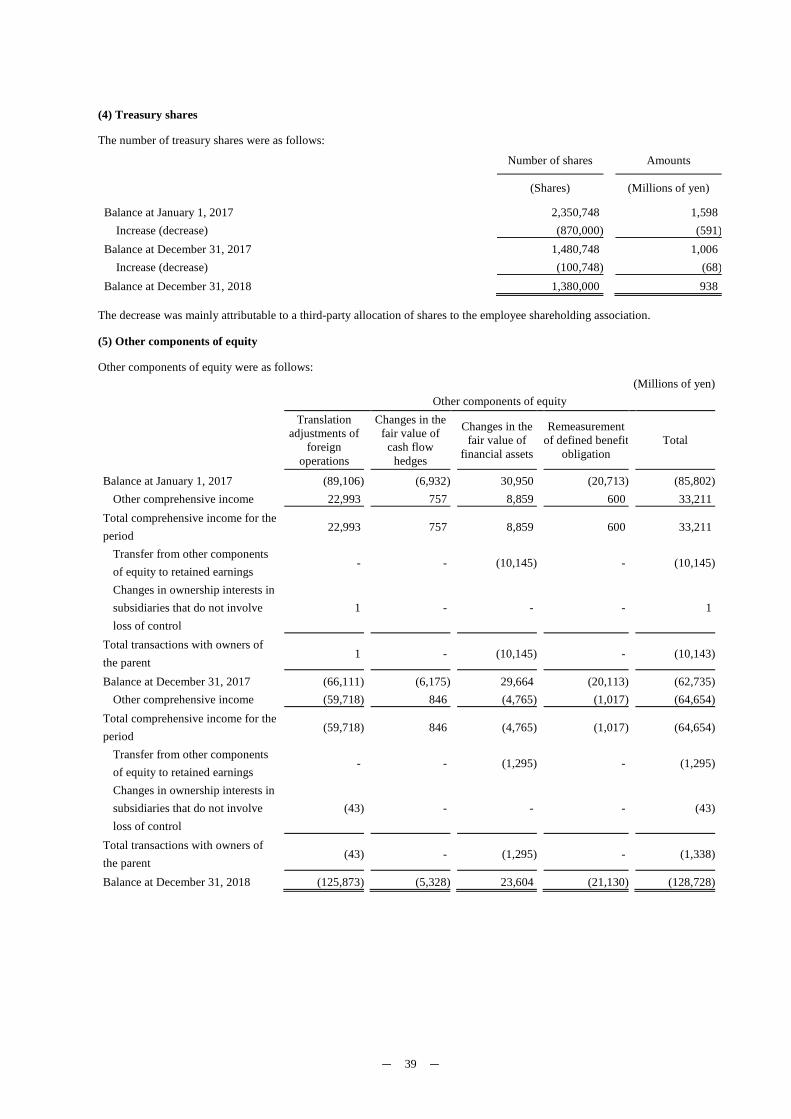
- 39 -
(4) Treasury shares
The number of treasury shares were as follows:
Number of shares Amounts
(Shares) (Millions of yen)
Balance at January 1, 2017 2,350,748 1,598 Increase (decrease) (870,000) (591)
Balance at December 31, 2017 1,480,748 1,006 Increase (decrease) (100,748) (68)
Balance at December 31, 2018 1,380,000 938
The decrease was mainly attributable to a third-party allocation of shares to the employee shareholding association.
(5) Other components of equity
Other components of equity were as follows: (Millions of yen) Other components of equity
Translation adjustments of
foreign operations
Changes in the fair value of
cash flow hedges
Changes in the
fair value of financial assets
Remeasurement
of defined benefit obligation
Total
Balance at January 1, 2017 (89,106) (6,932) 30,950 (20,713) (85,802)Other comprehensive income 22,993 757 8,859 600 33,211
Total comprehensive income for the period
22,993 757 8,859 600 33,211
Transfer from other components of equity to retained earnings
- - (10,145) - (10,145)
Changes in ownership interests in subsidiaries that do not involve loss of control
1 - - - 1
Total transactions with owners of the parent
1 - (10,145) - (10,143)
Balance at December 31, 2017 (66,111) (6,175) 29,664 (20,113) (62,735)Other comprehensive income (59,718) 846 (4,765) (1,017) (64,654)
Total comprehensive income for the period
(59,718) 846 (4,765) (1,017) (64,654)
Transfer from other components of equity to retained earnings
- - (1,295) - (1,295)
Changes in ownership interests in subsidiaries that do not involve loss of control
(43) - - - (43)
Total transactions with owners of the parent
(43) - (1,295) - (1,338)
Balance at December 31, 2018 (125,873) (5,328) 23,604 (21,130) (128,728)
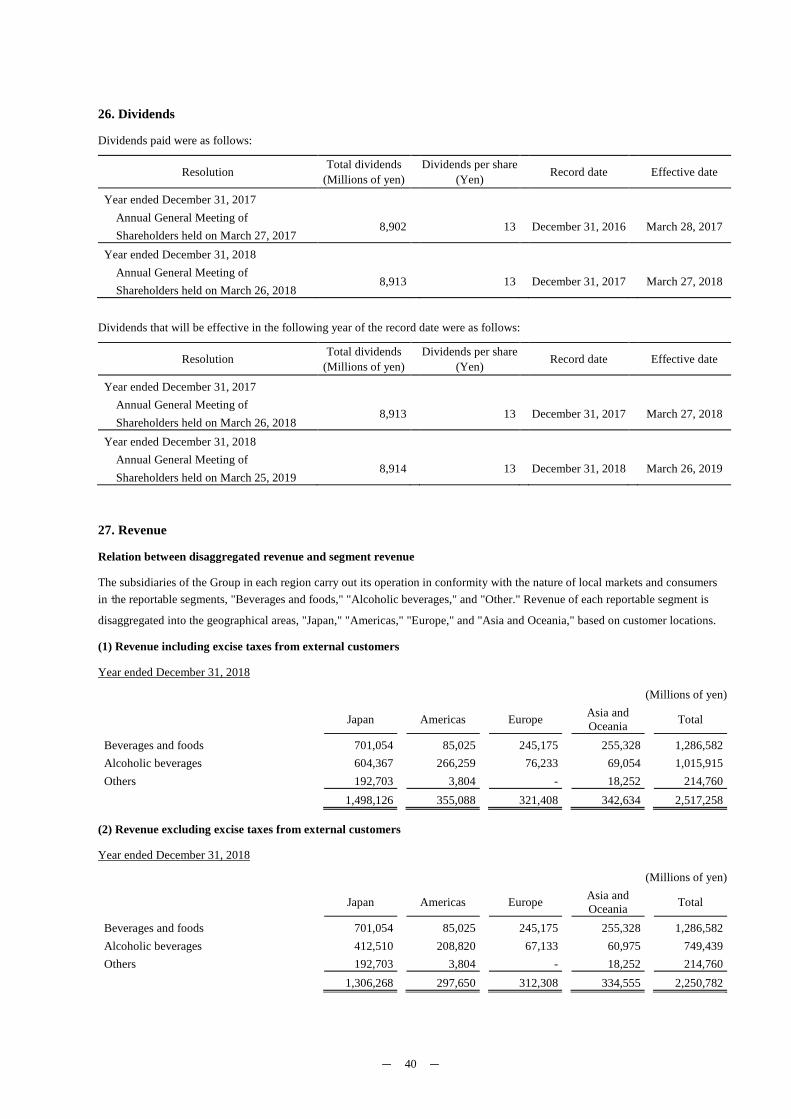
- 40 -
26. Dividends
Dividends paid were as follows:
Resolution Total dividends (Millions of yen)
Dividends per share (Yen) Record date Effective date
Year ended December 31, 2017
Annual General Meeting of Shareholders held on March 27, 2017
8,902 13 December 31, 2016 March 28, 2017
Year ended December 31, 2018
Annual General Meeting of Shareholders held on March 26, 2018
8,913 13 December 31, 2017 March 27, 2018
Dividends that will be effective in the following year of the record date were as follows:
Resolution Total dividends (Millions of yen)
Dividends per share (Yen) Record date Effective date
Year ended December 31, 2017
Annual General Meeting of Shareholders held on March 26, 2018
8,913 13 December 31, 2017 March 27, 2018
Year ended December 31, 2018
Annual General Meeting of Shareholders held on March 25, 2019
8,914 13 December 31, 2018 March 26, 2019
27. Revenue
Relation between disaggregated revenue and segment revenue
The subsidiaries of the Group in each region carry out its operation in conformity with the nature of local markets and consumers in the reportable segments, "Beverages and foods," "Alcoholic beverages," and "Other." Revenue of each reportable segment is
disaggregated into the geographical areas, "Japan," "Americas," "Europe," and "Asia and Oceania," based on customer locations.
(1) Revenue including excise taxes from external customers
Year ended December 31, 2018
(Millions of yen)
Japan Americas Europe Asia and Oceania Total
Beverages and foods 701,054 85,025 245,175 255,328 1,286,582 Alcoholic beverages 604,367 266,259 76,233 69,054 1,015,915 Others 192,703 3,804 - 18,252 214,760 1,498,126 355,088 321,408 342,634 2,517,258
(2) Revenue excluding excise taxes from external customers
Year ended December 31, 2018
(Millions of yen)
Japan Americas Europe Asia and Oceania Total
Beverages and foods 701,054 85,025 245,175 255,328 1,286,582 Alcoholic beverages 412,510 208,820 67,133 60,975 749,439 Others 192,703 3,804 - 18,252 214,760 1,306,268 297,650 312,308 334,555 2,250,782
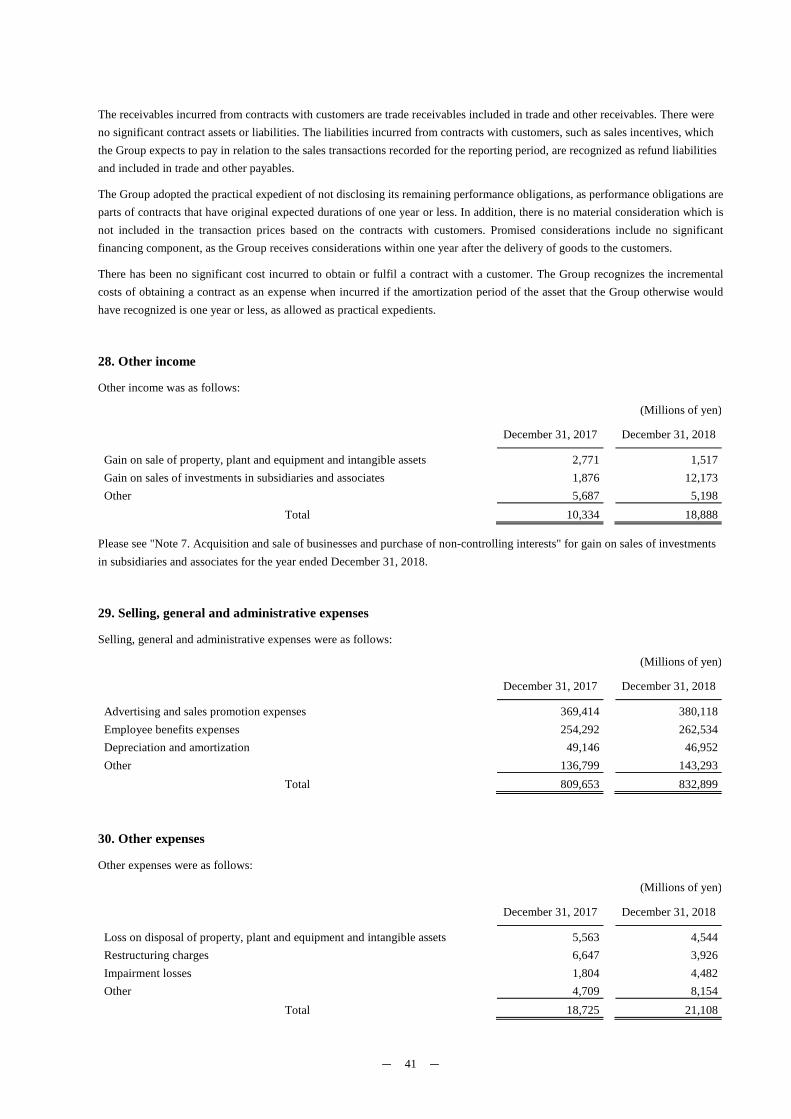
- 41 -
The receivables incurred from contracts with customers are trade receivables included in trade and other receivables. There were no significant contract assets or liabilities. The liabilities incurred from contracts with customers, such as sales incentives, which the Group expects to pay in relation to the sales transactions recorded for the reporting period, are recognized as refund liabilities and included in trade and other payables.
The Group adopted the practical expedient of not disclosing its remaining performance obligations, as performance obligations are parts of contracts that have original expected durations of one year or less. In addition, there is no material consideration which is not included in the transaction prices based on the contracts with customers. Promised considerations include no significant financing component, as the Group receives considerations within one year after the delivery of goods to the customers.
There has been no significant cost incurred to obtain or fulfil a contract with a customer. The Group recognizes the incremental costs of obtaining a contract as an expense when incurred if the amortization period of the asset that the Group otherwise would have recognized is one year or less, as allowed as practical expedients.
28. Other income
Other income was as follows:
(Millions of yen)
December 31, 2017 December 31, 2018
Gain on sale of property, plant and equipment and intangible assets 2,771 1,517 Gain on sales of investments in subsidiaries and associates 1,876 12,173 Other 5,687 5,198
Total 10,334 18,888
Please see "Note 7. Acquisition and sale of businesses and purchase of non-controlling interests" for gain on sales of investments in subsidiaries and associates for the year ended December 31, 2018.
29. Selling, general and administrative expenses
Selling, general and administrative expenses were as follows:
(Millions of yen)
December 31, 2017 December 31, 2018
Advertising and sales promotion expenses 369,414 380,118 Employee benefits expenses 254,292 262,534 Depreciation and amortization 49,146 46,952 Other 136,799 143,293
Total 809,653 832,899
30. Other expenses
Other expenses were as follows:
(Millions of yen)
December 31, 2017 December 31, 2018
Loss on disposal of property, plant and equipment and intangible assets 5,563 4,544 Restructuring charges 6,647 3,926 Impairment losses 1,804 4,482 Other 4,709 8,154
Total 18,725 21,108
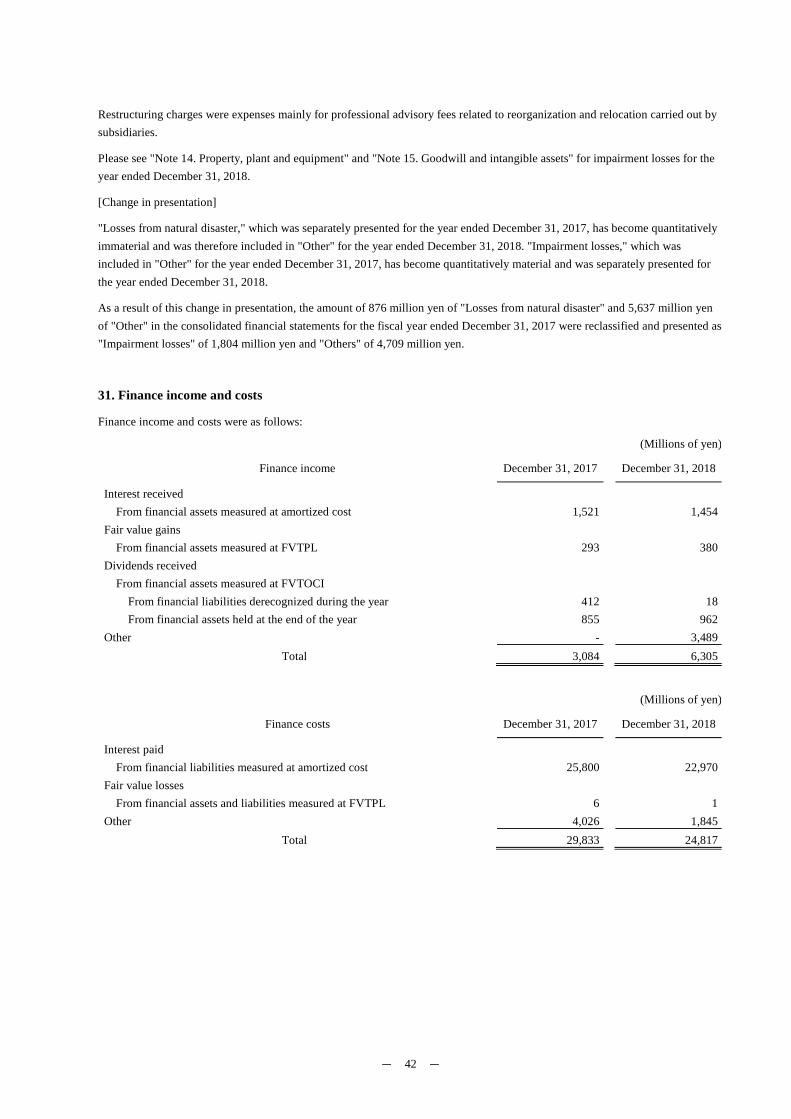
- 42 -
Restructuring charges were expenses mainly for professional advisory fees related to reorganization and relocation carried out by subsidiaries.
Please see "Note 14. Property, plant and equipment" and "Note 15. Goodwill and intangible assets" for impairment losses for the year ended December 31, 2018.
[Change in presentation]
"Losses from natural disaster," which was separately presented for the year ended December 31, 2017, has become quantitatively immaterial and was therefore included in "Other" for the year ended December 31, 2018. "Impairment losses," which was included in "Other" for the year ended December 31, 2017, has become quantitatively material and was separately presented for the year ended December 31, 2018.
As a result of this change in presentation, the amount of 876 million yen of "Losses from natural disaster" and 5,637 million yen of "Other" in the consolidated financial statements for the fiscal year ended December 31, 2017 were reclassified and presented as "Impairment losses" of 1,804 million yen and "Others" of 4,709 million yen.
31. Finance income and costs
Finance income and costs were as follows:
(Millions of yen)
Finance income December 31, 2017 December 31, 2018
Interest received From financial assets measured at amortized cost 1,521 1,454
Fair value gains From financial assets measured at FVTPL 293 380
Dividends received From financial assets measured at FVTOCI
From financial liabilities derecognized during the year 412 18 From financial assets held at the end of the year 855 962
Other - 3,489 Total 3,084 6,305
(Millions of yen)
Finance costs December 31, 2017 December 31, 2018
Interest paid
From financial liabilities measured at amortized cost 25,800 22,970 Fair value losses
From financial assets and liabilities measured at FVTPL 6 1 Other 4,026 1,845
Total 29,833 24,817
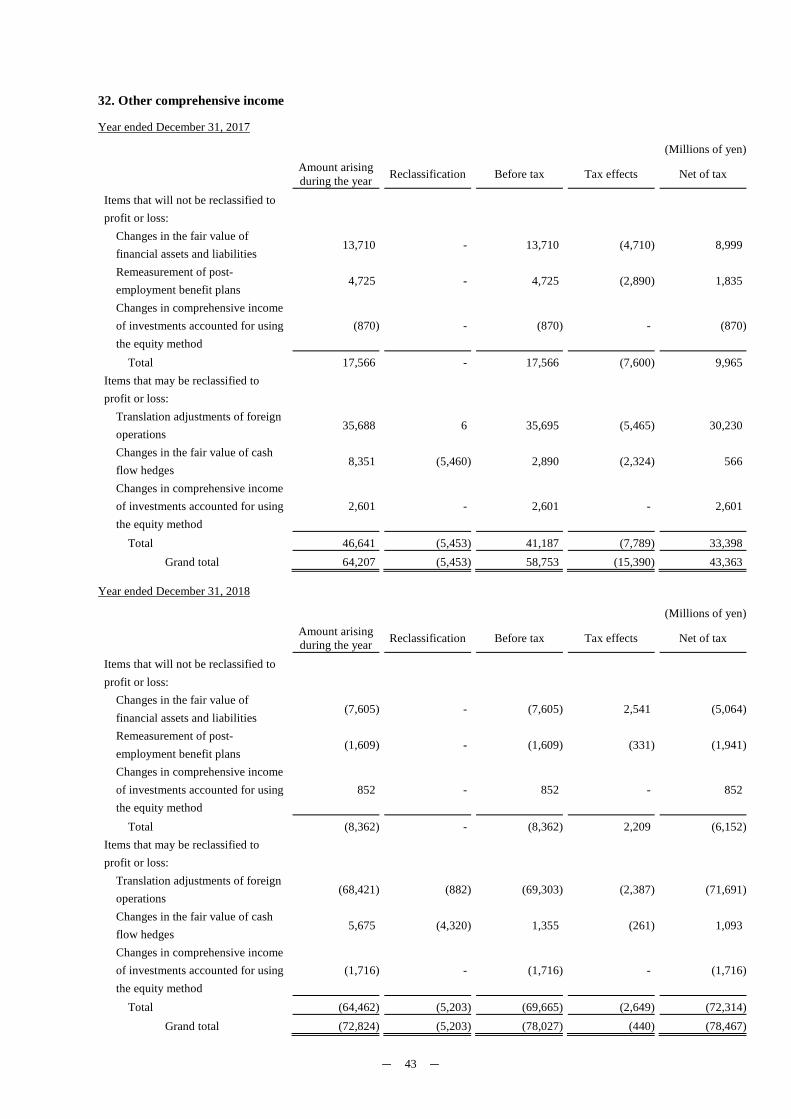
- 43 -
32. Other comprehensive income
Year ended December 31, 2017
(Millions of yen)
Amount arising during the year Reclassification Before tax Tax effects Net of tax
Items that will not be reclassified to profit or loss:
Changes in the fair value of financial assets and liabilities
13,710 - 13,710 (4,710) 8,999
Remeasurement of post-employment benefit plans
4,725 - 4,725 (2,890) 1,835
Changes in comprehensive income of investments accounted for using the equity method
(870) - (870) - (870)
Total 17,566 - 17,566 (7,600) 9,965 Items that may be reclassified to profit or loss:
Translation adjustments of foreign operations
35,688 6 35,695 (5,465) 30,230
Changes in the fair value of cash flow hedges
8,351 (5,460) 2,890 (2,324) 566
Changes in comprehensive income of investments accounted for using the equity method
2,601 - 2,601 - 2,601
Total 46,641 (5,453) 41,187 (7,789) 33,398 Grand total 64,207 (5,453) 58,753 (15,390) 43,363
Year ended December 31, 2018
(Millions of yen)
Amount arising during the year Reclassification Before tax Tax effects Net of tax
Items that will not be reclassified to profit or loss:
Changes in the fair value of financial assets and liabilities
(7,605) - (7,605) 2,541 (5,064)
Remeasurement of post-employment benefit plans
(1,609) - (1,609) (331) (1,941)
Changes in comprehensive income of investments accounted for using the equity method
852 - 852 - 852
Total (8,362) - (8,362) 2,209 (6,152)Items that may be reclassified to profit or loss:
Translation adjustments of foreign operations
(68,421) (882) (69,303) (2,387) (71,691)
Changes in the fair value of cash flow hedges
5,675 (4,320) 1,355 (261) 1,093
Changes in comprehensive income of investments accounted for using the equity method
(1,716) - (1,716) - (1,716)
Total (64,462) (5,203) (69,665) (2,649) (72,314)Grand total (72,824) (5,203) (78,027) (440) (78,467)
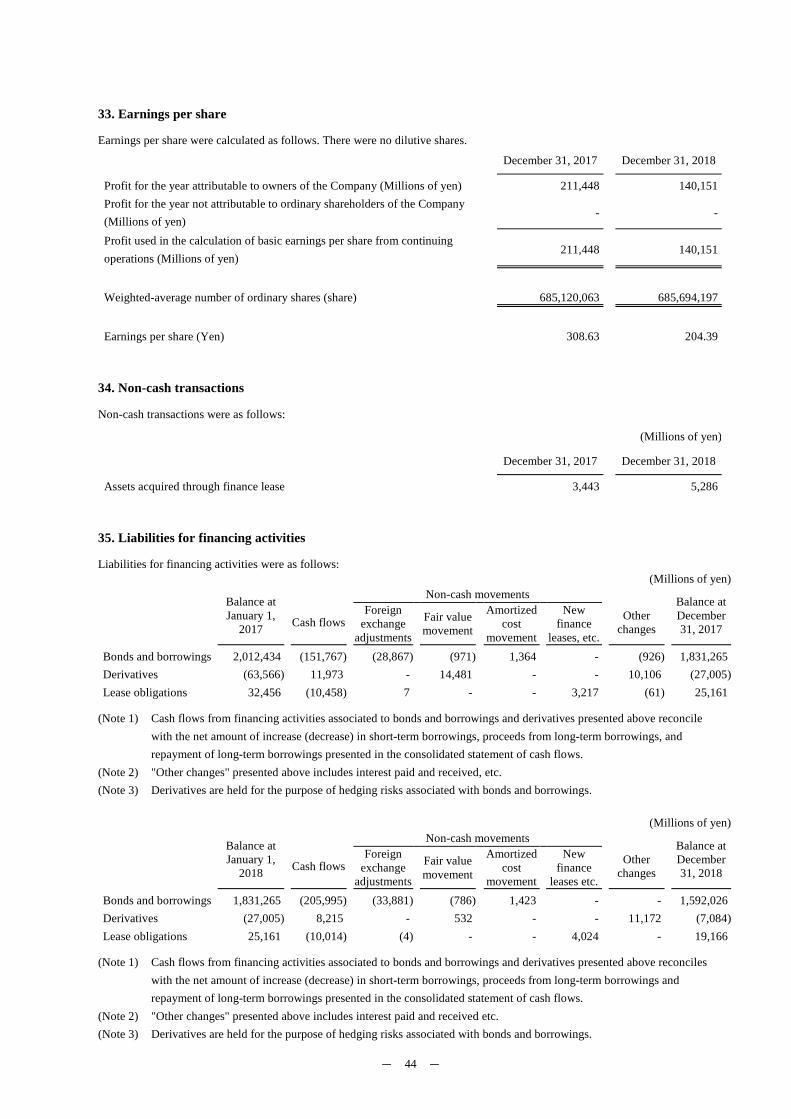
- 44 -
33. Earnings per share
Earnings per share were calculated as follows. There were no dilutive shares.
December 31, 2017 December 31, 2018
Profit for the year attributable to owners of the Company (Millions of yen) 211,448 140,151 Profit for the year not attributable to ordinary shareholders of the Company (Millions of yen)
- -
Profit used in the calculation of basic earnings per share from continuing operations (Millions of yen)
211,448 140,151
Weighted-average number of ordinary shares (share) 685,120,063 685,694,197
Earnings per share (Yen) 308.63 204.39
34. Non-cash transactions
Non-cash transactions were as follows:
(Millions of yen)
December 31, 2017 December 31, 2018
Assets acquired through finance lease 3,443 5,286
35. Liabilities for financing activities
Liabilities for financing activities were as follows: (Millions of yen) Balance at
January 1, 2017
Cash flows
Non-cash movements Other
changes
Balance at December 31, 2017
Foreign exchange
adjustments
Fair value movement
Amortized cost
movement
New finance
leases, etc.
Bonds and borrowings 2,012,434 (151,767) (28,867) (971) 1,364 - (926) 1,831,265 Derivatives (63,566) 11,973 - 14,481 - - 10,106 (27,005)Lease obligations 32,456 (10,458) 7 - - 3,217 (61) 25,161
(Note 1) Cash flows from financing activities associated to bonds and borrowings and derivatives presented above reconcile with the net amount of increase (decrease) in short-term borrowings, proceeds from long-term borrowings, and repayment of long-term borrowings presented in the consolidated statement of cash flows.
(Note 2) "Other changes" presented above includes interest paid and received, etc. (Note 3) Derivatives are held for the purpose of hedging risks associated with bonds and borrowings.
(Millions of yen) Balance at
January 1, 2018
Cash flows
Non-cash movements Other
changes
Balance at December 31, 2018
Foreign exchange
adjustments
Fair value movement
Amortized cost
movement
New finance
leases etc.
Bonds and borrowings 1,831,265 (205,995) (33,881) (786) 1,423 - - 1,592,026 Derivatives (27,005) 8,215 - 532 - - 11,172 (7,084)Lease obligations 25,161 (10,014) (4) - - 4,024 - 19,166
(Note 1) Cash flows from financing activities associated to bonds and borrowings and derivatives presented above reconciles with the net amount of increase (decrease) in short-term borrowings, proceeds from long-term borrowings and repayment of long-term borrowings presented in the consolidated statement of cash flows.
(Note 2) "Other changes" presented above includes interest paid and received etc. (Note 3) Derivatives are held for the purpose of hedging risks associated with bonds and borrowings.
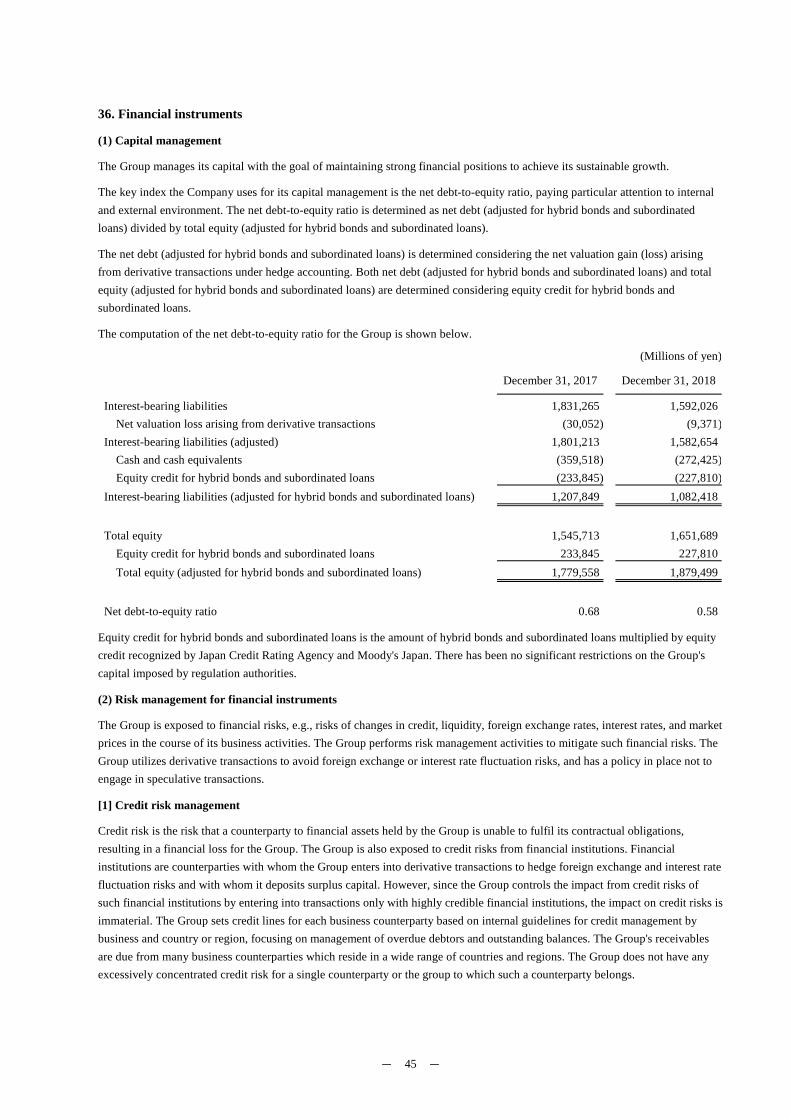
- 45 -
36. Financial instruments
(1) Capital management
The Group manages its capital with the goal of maintaining strong financial positions to achieve its sustainable growth.
The key index the Company uses for its capital management is the net debt-to-equity ratio, paying particular attention to internal and external environment. The net debt-to-equity ratio is determined as net debt (adjusted for hybrid bonds and subordinated loans) divided by total equity (adjusted for hybrid bonds and subordinated loans).
The net debt (adjusted for hybrid bonds and subordinated loans) is determined considering the net valuation gain (loss) arising from derivative transactions under hedge accounting. Both net debt (adjusted for hybrid bonds and subordinated loans) and total equity (adjusted for hybrid bonds and subordinated loans) are determined considering equity credit for hybrid bonds and subordinated loans.
The computation of the net debt-to-equity ratio for the Group is shown below.
(Millions of yen)
December 31, 2017 December 31, 2018
Interest-bearing liabilities 1,831,265 1,592,026 Net valuation loss arising from derivative transactions (30,052) (9,371)
Interest-bearing liabilities (adjusted) 1,801,213 1,582,654 Cash and cash equivalents (359,518) (272,425)Equity credit for hybrid bonds and subordinated loans (233,845) (227,810)
Interest-bearing liabilities (adjusted for hybrid bonds and subordinated loans) 1,207,849 1,082,418
Total equity 1,545,713 1,651,689 Equity credit for hybrid bonds and subordinated loans 233,845 227,810 Total equity (adjusted for hybrid bonds and subordinated loans) 1,779,558 1,879,499
Net debt-to-equity ratio 0.68 0.58
Equity credit for hybrid bonds and subordinated loans is the amount of hybrid bonds and subordinated loans multiplied by equity credit recognized by Japan Credit Rating Agency and Moody's Japan. There has been no significant restrictions on the Group's capital imposed by regulation authorities.
(2) Risk management for financial instruments
The Group is exposed to financial risks, e.g., risks of changes in credit, liquidity, foreign exchange rates, interest rates, and market prices in the course of its business activities. The Group performs risk management activities to mitigate such financial risks. The Group utilizes derivative transactions to avoid foreign exchange or interest rate fluctuation risks, and has a policy in place not to engage in speculative transactions.
[1] Credit risk management
Credit risk is the risk that a counterparty to financial assets held by the Group is unable to fulfil its contractual obligations, resulting in a financial loss for the Group. The Group is also exposed to credit risks from financial institutions. Financial institutions are counterparties with whom the Group enters into derivative transactions to hedge foreign exchange and interest rate fluctuation risks and with whom it deposits surplus capital. However, since the Group controls the impact from credit risks of such financial institutions by entering into transactions only with highly credible financial institutions, the impact on credit risks is immaterial. The Group sets credit lines for each business counterparty based on internal guidelines for credit management by business and country or region, focusing on management of overdue debtors and outstanding balances. The Group's receivables are due from many business counterparties which reside in a wide range of countries and regions. The Group does not have any excessively concentrated credit risk for a single counterparty or the group to which such a counterparty belongs.
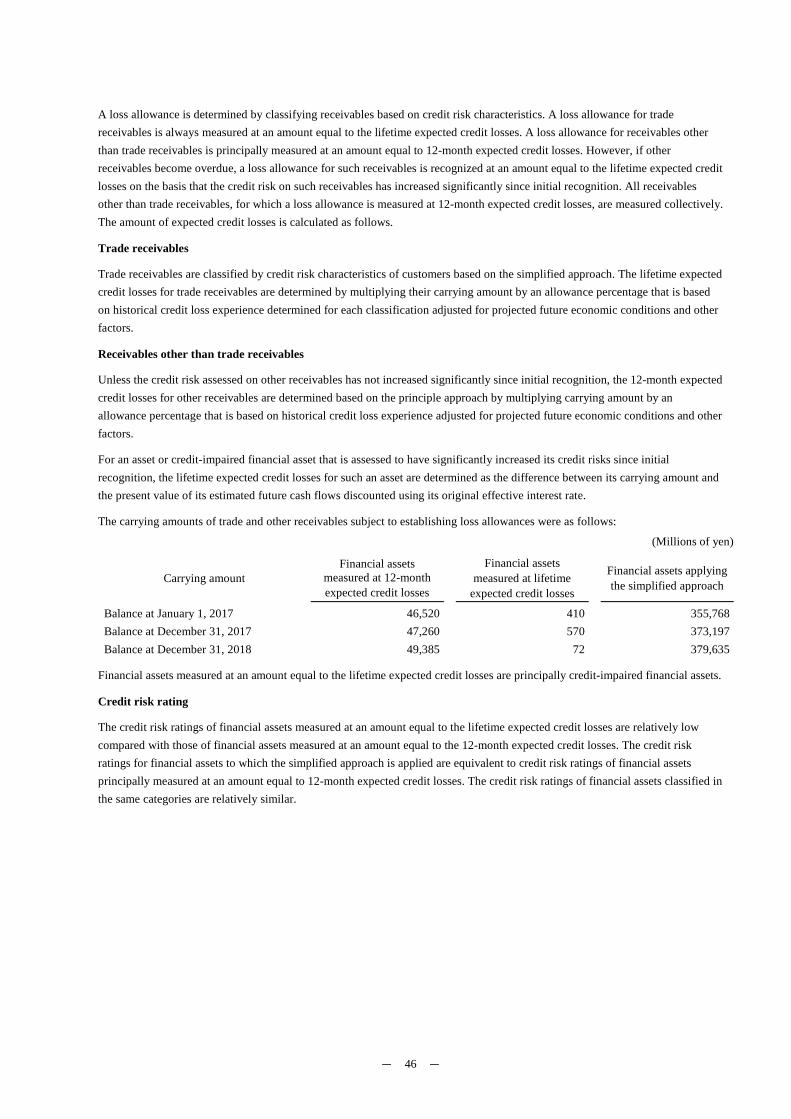
- 46 -
A loss allowance is determined by classifying receivables based on credit risk characteristics. A loss allowance for trade receivables is always measured at an amount equal to the lifetime expected credit losses. A loss allowance for receivables other than trade receivables is principally measured at an amount equal to 12-month expected credit losses. However, if other receivables become overdue, a loss allowance for such receivables is recognized at an amount equal to the lifetime expected credit losses on the basis that the credit risk on such receivables has increased significantly since initial recognition. All receivables other than trade receivables, for which a loss allowance is measured at 12-month expected credit losses, are measured collectively. The amount of expected credit losses is calculated as follows.
Trade receivables
Trade receivables are classified by credit risk characteristics of customers based on the simplified approach. The lifetime expected credit losses for trade receivables are determined by multiplying their carrying amount by an allowance percentage that is based on historical credit loss experience determined for each classification adjusted for projected future economic conditions and other factors.
Receivables other than trade receivables
Unless the credit risk assessed on other receivables has not increased significantly since initial recognition, the 12-month expected credit losses for other receivables are determined based on the principle approach by multiplying carrying amount by an allowance percentage that is based on historical credit loss experience adjusted for projected future economic conditions and other factors.
For an asset or credit-impaired financial asset that is assessed to have significantly increased its credit risks since initial recognition, the lifetime expected credit losses for such an asset are determined as the difference between its carrying amount and the present value of its estimated future cash flows discounted using its original effective interest rate.
The carrying amounts of trade and other receivables subject to establishing loss allowances were as follows:
(Millions of yen)
Carrying amount Financial assets
measured at 12-month expected credit losses
Financial assets measured at lifetime
expected credit losses
Financial assets applying the simplified approach
Balance at January 1, 2017 46,520 410 355,768 Balance at December 31, 2017 47,260 570 373,197 Balance at December 31, 2018 49,385 72 379,635
Financial assets measured at an amount equal to the lifetime expected credit losses are principally credit-impaired financial assets.
Credit risk rating
The credit risk ratings of financial assets measured at an amount equal to the lifetime expected credit losses are relatively low compared with those of financial assets measured at an amount equal to the 12-month expected credit losses. The credit risk ratings for financial assets to which the simplified approach is applied are equivalent to credit risk ratings of financial assets principally measured at an amount equal to 12-month expected credit losses. The credit risk ratings of financial assets classified in the same categories are relatively similar.
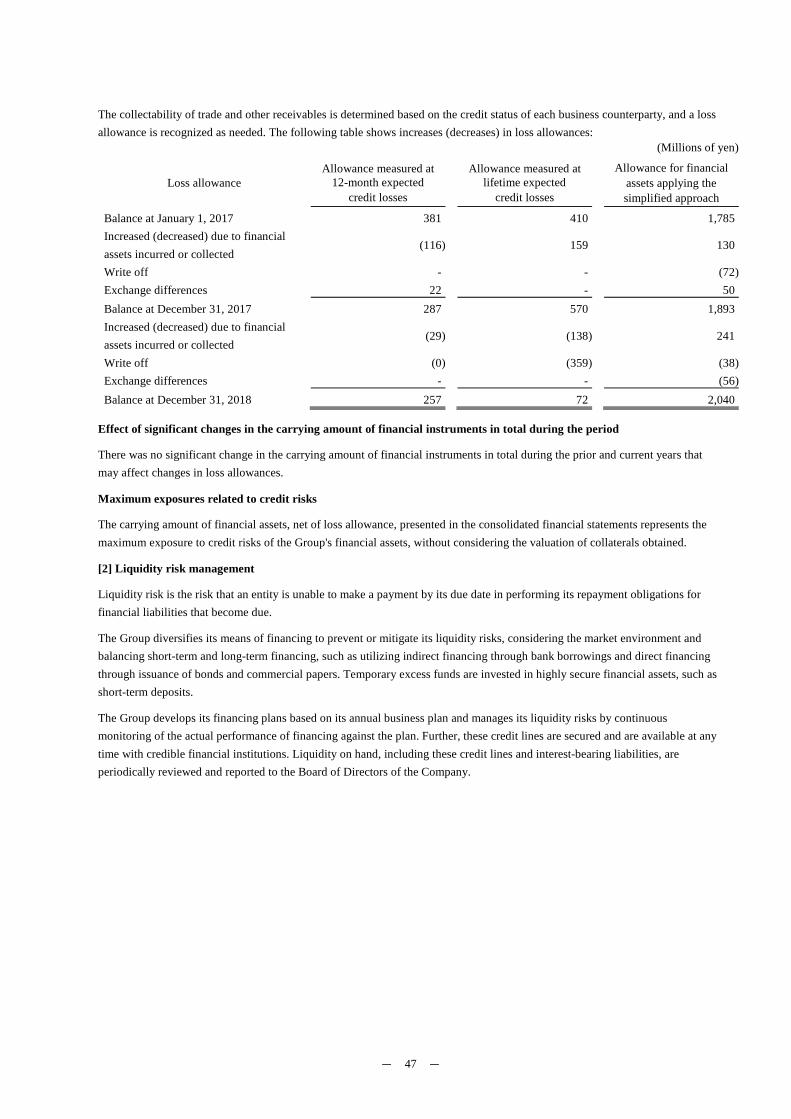
- 47 -
The collectability of trade and other receivables is determined based on the credit status of each business counterparty, and a loss allowance is recognized as needed. The following table shows increases (decreases) in loss allowances:
(Millions of yen)
Loss allowance Allowance measured at
12-month expected credit losses
Allowance measured at
lifetime expected credit losses
Allowance for financial assets applying the simplified approach
Balance at January 1, 2017 381 410 1,785 Increased (decreased) due to financial assets incurred or collected
(116) 159 130
Write off - - (72)Exchange differences 22 - 50 Balance at December 31, 2017 287 570 1,893 Increased (decreased) due to financial assets incurred or collected
(29) (138) 241
Write off (0) (359) (38)Exchange differences - - (56)Balance at December 31, 2018 257 72 2,040
Effect of significant changes in the carrying amount of financial instruments in total during the period
There was no significant change in the carrying amount of financial instruments in total during the prior and current years that may affect changes in loss allowances.
Maximum exposures related to credit risks
The carrying amount of financial assets, net of loss allowance, presented in the consolidated financial statements represents the maximum exposure to credit risks of the Group's financial assets, without considering the valuation of collaterals obtained.
[2] Liquidity risk management
Liquidity risk is the risk that an entity is unable to make a payment by its due date in performing its repayment obligations for financial liabilities that become due.
The Group diversifies its means of financing to prevent or mitigate its liquidity risks, considering the market environment and balancing short-term and long-term financing, such as utilizing indirect financing through bank borrowings and direct financing through issuance of bonds and commercial papers. Temporary excess funds are invested in highly secure financial assets, such as short-term deposits.
The Group develops its financing plans based on its annual business plan and manages its liquidity risks by continuous monitoring of the actual performance of financing against the plan. Further, these credit lines are secured and are available at any time with credible financial institutions. Liquidity on hand, including these credit lines and interest-bearing liabilities, are periodically reviewed and reported to the Board of Directors of the Company.
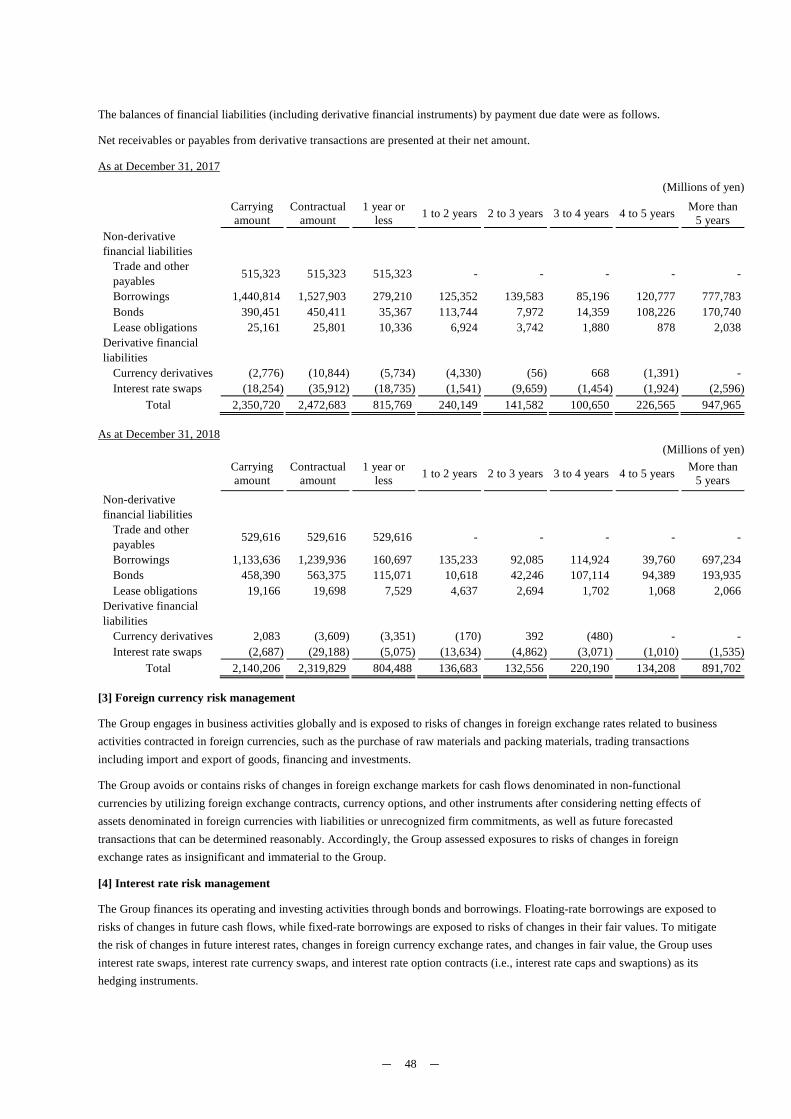
- 48 -
The balances of financial liabilities (including derivative financial instruments) by payment due date were as follows.
Net receivables or payables from derivative transactions are presented at their net amount.
As at December 31, 2017
(Millions of yen)
Carrying amount
Contractual amount
1 year or less 1 to 2 years 2 to 3 years 3 to 4 years 4 to 5 years More than
5 years Non-derivative financial liabilities
Trade and other payables 515,323 515,323 515,323 - - - - -
Borrowings 1,440,814 1,527,903 279,210 125,352 139,583 85,196 120,777 777,783 Bonds 390,451 450,411 35,367 113,744 7,972 14,359 108,226 170,740 Lease obligations 25,161 25,801 10,336 6,924 3,742 1,880 878 2,038
Derivative financial liabilities
Currency derivatives (2,776) (10,844) (5,734) (4,330) (56) 668 (1,391) - Interest rate swaps (18,254) (35,912) (18,735) (1,541) (9,659) (1,454) (1,924) (2,596)
Total 2,350,720 2,472,683 815,769 240,149 141,582 100,650 226,565 947,965
As at December 31, 2018 (Millions of yen)
Carrying amount
Contractual amount
1 year or less 1 to 2 years 2 to 3 years 3 to 4 years 4 to 5 years More than
5 years Non-derivative financial liabilities
Trade and other payables 529,616 529,616 529,616 - - - - -
Borrowings 1,133,636 1,239,936 160,697 135,233 92,085 114,924 39,760 697,234 Bonds 458,390 563,375 115,071 10,618 42,246 107,114 94,389 193,935 Lease obligations 19,166 19,698 7,529 4,637 2,694 1,702 1,068 2,066
Derivative financial liabilities
Currency derivatives 2,083 (3,609) (3,351) (170) 392 (480) - - Interest rate swaps (2,687) (29,188) (5,075) (13,634) (4,862) (3,071) (1,010) (1,535)
Total 2,140,206 2,319,829 804,488 136,683 132,556 220,190 134,208 891,702
[3] Foreign currency risk management
The Group engages in business activities globally and is exposed to risks of changes in foreign exchange rates related to business activities contracted in foreign currencies, such as the purchase of raw materials and packing materials, trading transactions including import and export of goods, financing and investments.
The Group avoids or contains risks of changes in foreign exchange markets for cash flows denominated in non-functional currencies by utilizing foreign exchange contracts, currency options, and other instruments after considering netting effects of assets denominated in foreign currencies with liabilities or unrecognized firm commitments, as well as future forecasted transactions that can be determined reasonably. Accordingly, the Group assessed exposures to risks of changes in foreign exchange rates as insignificant and immaterial to the Group.
[4] Interest rate risk management
The Group finances its operating and investing activities through bonds and borrowings. Floating-rate borrowings are exposed to risks of changes in future cash flows, while fixed-rate borrowings are exposed to risks of changes in their fair values. To mitigate the risk of changes in future interest rates, changes in foreign currency exchange rates, and changes in fair value, the Group uses interest rate swaps, interest rate currency swaps, and interest rate option contracts (i.e., interest rate caps and swaptions) as its hedging instruments.
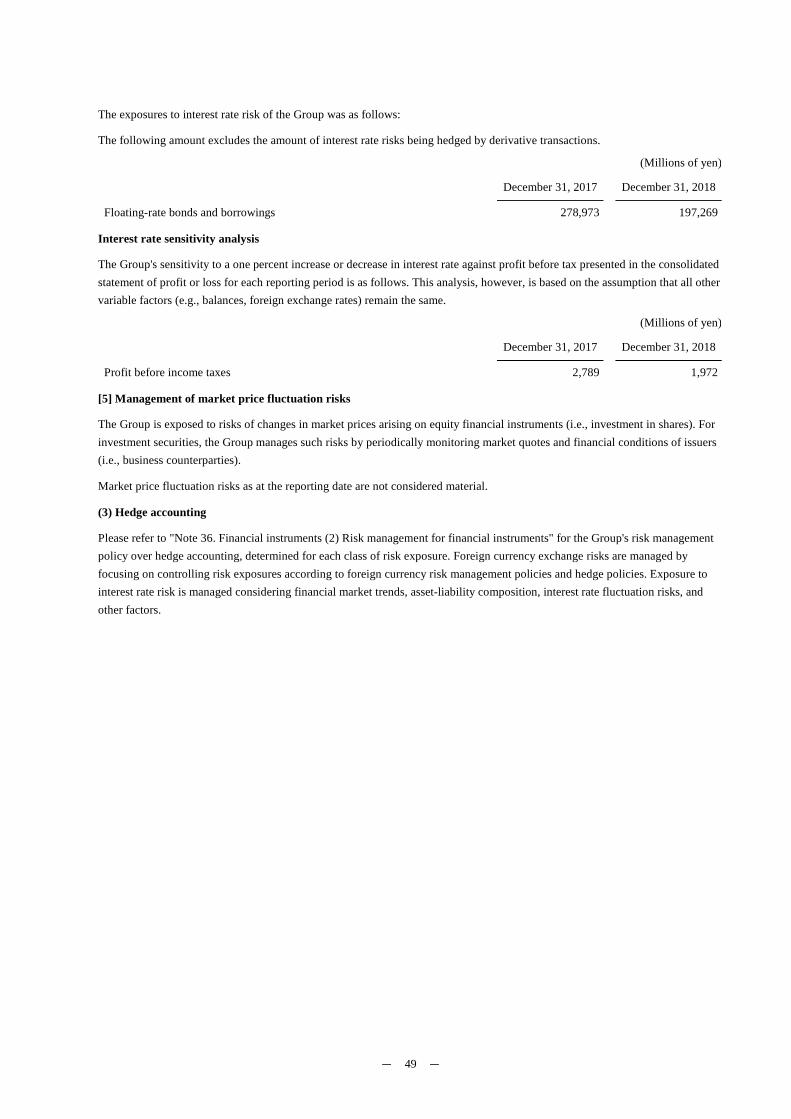
- 49 -
The exposures to interest rate risk of the Group was as follows:
The following amount excludes the amount of interest rate risks being hedged by derivative transactions.
(Millions of yen)
December 31, 2017 December 31, 2018
Floating-rate bonds and borrowings 278,973 197,269
Interest rate sensitivity analysis
The Group's sensitivity to a one percent increase or decrease in interest rate against profit before tax presented in the consolidated statement of profit or loss for each reporting period is as follows. This analysis, however, is based on the assumption that all other variable factors (e.g., balances, foreign exchange rates) remain the same.
(Millions of yen)
December 31, 2017 December 31, 2018
Profit before income taxes 2,789 1,972
[5] Management of market price fluctuation risks
The Group is exposed to risks of changes in market prices arising on equity financial instruments (i.e., investment in shares). For investment securities, the Group manages such risks by periodically monitoring market quotes and financial conditions of issuers (i.e., business counterparties).
Market price fluctuation risks as at the reporting date are not considered material.
(3) Hedge accounting
Please refer to "Note 36. Financial instruments (2) Risk management for financial instruments" for the Group's risk management policy over hedge accounting, determined for each class of risk exposure. Foreign currency exchange risks are managed by focusing on controlling risk exposures according to foreign currency risk management policies and hedge policies. Exposure to interest rate risk is managed considering financial market trends, asset-liability composition, interest rate fluctuation risks, and other factors.
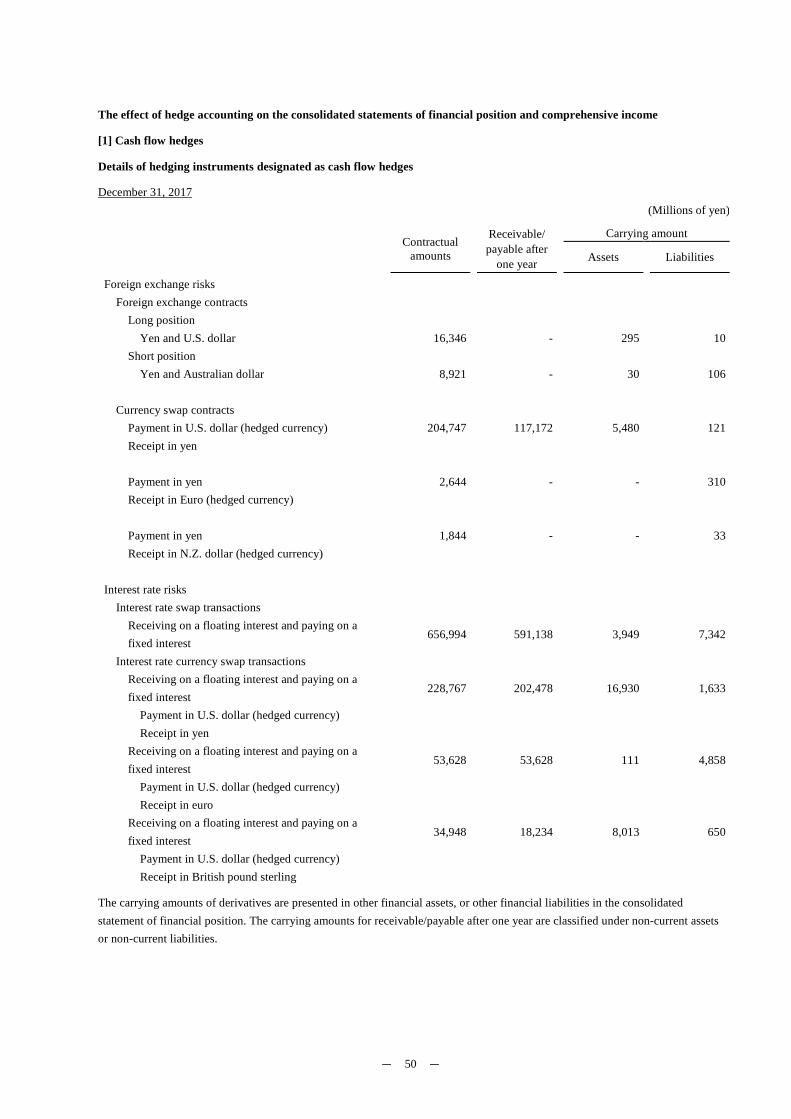
- 50 -
The effect of hedge accounting on the consolidated statements of financial position and comprehensive income
[1] Cash flow hedges
Details of hedging instruments designated as cash flow hedges
December 31, 2017 (Millions of yen)
Contractual
amounts
Receivable/ payable after
one year
Carrying amount Assets Liabilities
Foreign exchange risks Foreign exchange contracts
Long position Yen and U.S. dollar 16,346 - 295 10
Short position Yen and Australian dollar 8,921 - 30 106
Currency swap contracts
Payment in U.S. dollar (hedged currency) 204,747 117,172 5,480 121 Receipt in yen
Payment in yen 2,644 - - 310 Receipt in Euro (hedged currency)
Payment in yen 1,844 - - 33 Receipt in N.Z. dollar (hedged currency)
Interest rate risks Interest rate swap transactions
Receiving on a floating interest and paying on a fixed interest
656,994 591,138 3,949 7,342
Interest rate currency swap transactions Receiving on a floating interest and paying on a fixed interest
228,767 202,478 16,930 1,633
Payment in U.S. dollar (hedged currency) Receipt in yen
Receiving on a floating interest and paying on a fixed interest
53,628 53,628 111 4,858
Payment in U.S. dollar (hedged currency) Receipt in euro
Receiving on a floating interest and paying on a fixed interest
34,948 18,234 8,013 650
Payment in U.S. dollar (hedged currency) Receipt in British pound sterling
The carrying amounts of derivatives are presented in other financial assets, or other financial liabilities in the consolidated statement of financial position. The carrying amounts for receivable/payable after one year are classified under non-current assets or non-current liabilities.
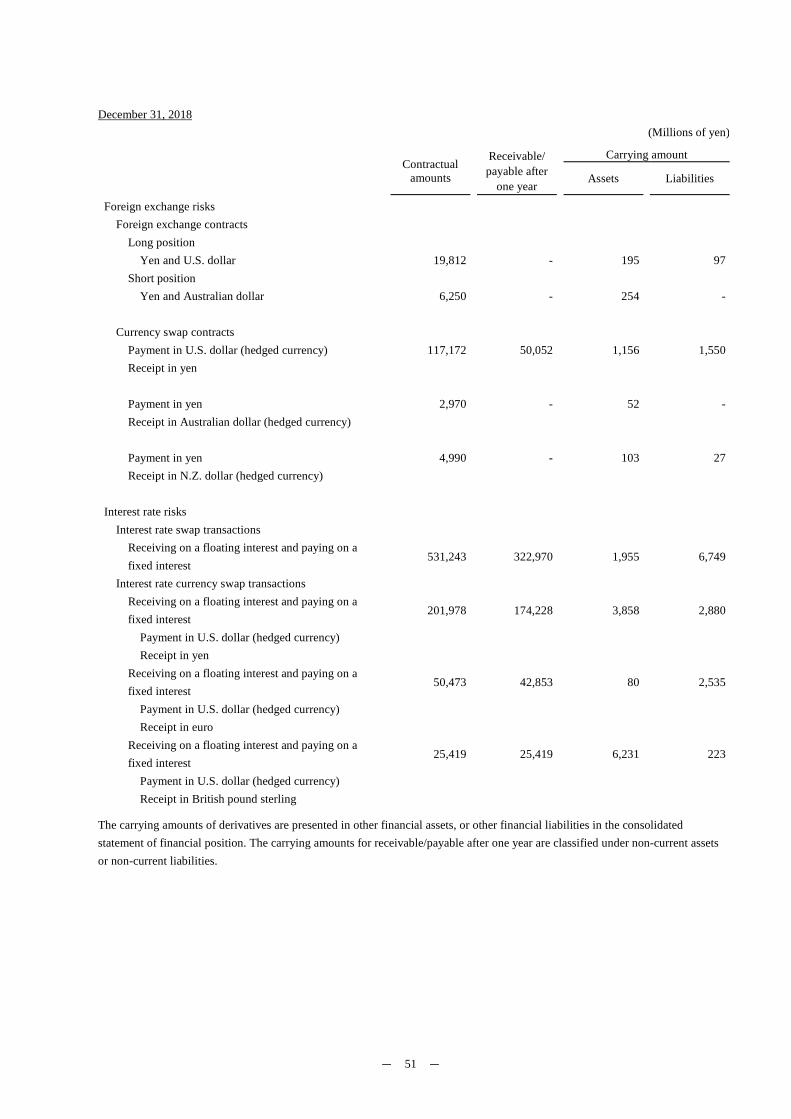
- 51 -
December 31, 2018 (Millions of yen)
Contractual amounts
Receivable/ payable after
one year
Carrying amount
Assets Liabilities
Foreign exchange risks Foreign exchange contracts
Long position Yen and U.S. dollar 19,812 - 195 97
Short position Yen and Australian dollar 6,250 - 254 -
Currency swap contracts
Payment in U.S. dollar (hedged currency) 117,172 50,052 1,156 1,550 Receipt in yen Payment in yen 2,970 - 52 - Receipt in Australian dollar (hedged currency) Payment in yen 4,990 - 103 27 Receipt in N.Z. dollar (hedged currency)
Interest rate risks Interest rate swap transactions
Receiving on a floating interest and paying on a fixed interest
531,243 322,970 1,955 6,749
Interest rate currency swap transactions Receiving on a floating interest and paying on a fixed interest
201,978 174,228 3,858 2,880
Payment in U.S. dollar (hedged currency) Receipt in yen
Receiving on a floating interest and paying on a fixed interest
50,473 42,853 80 2,535
Payment in U.S. dollar (hedged currency) Receipt in euro
Receiving on a floating interest and paying on a fixed interest
25,419 25,419 6,231 223
Payment in U.S. dollar (hedged currency) Receipt in British pound sterling
The carrying amounts of derivatives are presented in other financial assets, or other financial liabilities in the consolidated statement of financial position. The carrying amounts for receivable/payable after one year are classified under non-current assets or non-current liabilities.
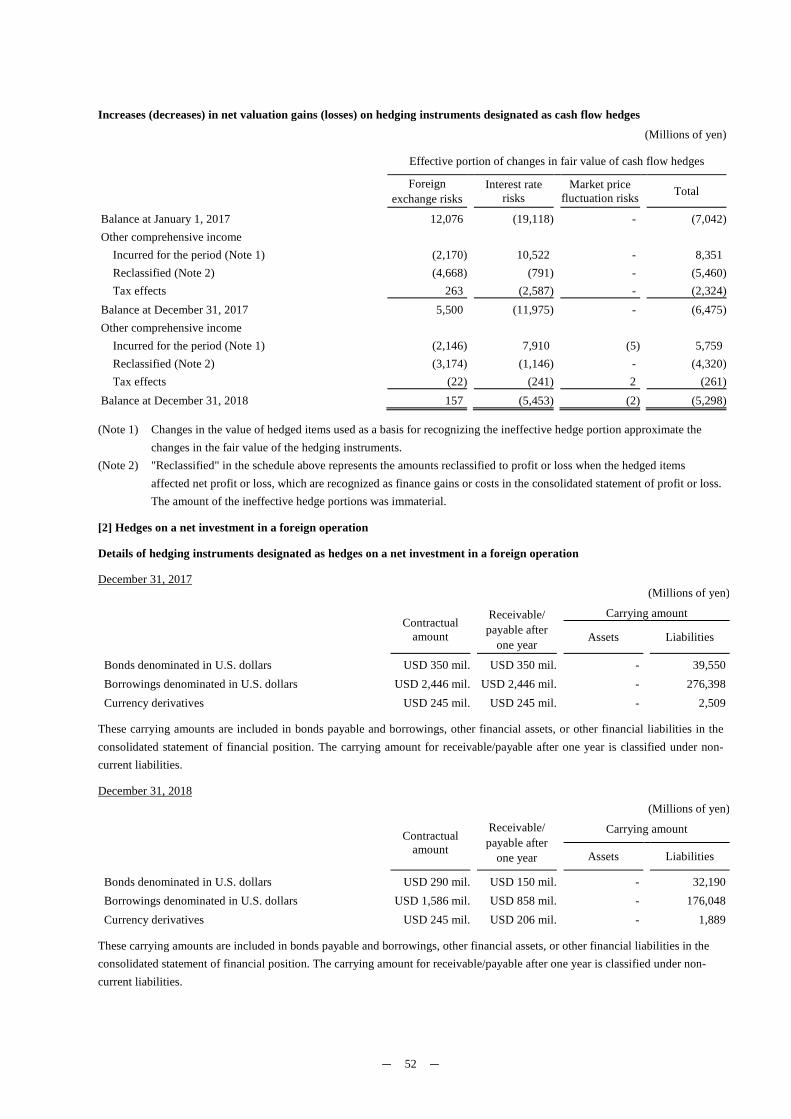
- 52 -
Increases (decreases) in net valuation gains (losses) on hedging instruments designated as cash flow hedges (Millions of yen)
Effective portion of changes in fair value of cash flow hedges
Foreign
exchange risks Interest rate
risks Market price
fluctuation risks Total
Balance at January 1, 2017 12,076 (19,118) - (7,042)Other comprehensive income
Incurred for the period (Note 1) (2,170) 10,522 - 8,351 Reclassified (Note 2) (4,668) (791) - (5,460)Tax effects 263 (2,587) - (2,324)
Balance at December 31, 2017 5,500 (11,975) - (6,475)Other comprehensive income
Incurred for the period (Note 1) (2,146) 7,910 (5) 5,759 Reclassified (Note 2) (3,174) (1,146) - (4,320)Tax effects (22) (241) 2 (261)
Balance at December 31, 2018 157 (5,453) (2) (5,298)
(Note 1) Changes in the value of hedged items used as a basis for recognizing the ineffective hedge portion approximate the changes in the fair value of the hedging instruments.
(Note 2) "Reclassified" in the schedule above represents the amounts reclassified to profit or loss when the hedged items affected net profit or loss, which are recognized as finance gains or costs in the consolidated statement of profit or loss. The amount of the ineffective hedge portions was immaterial.
[2] Hedges on a net investment in a foreign operation
Details of hedging instruments designated as hedges on a net investment in a foreign operation
December 31, 2017 (Millions of yen)
Contractual
amount
Receivable/ payable after
one year
Carrying amount
Assets Liabilities
Bonds denominated in U.S. dollars USD 350 mil.
USD 350 mil.
- 39,550 Borrowings denominated in U.S. dollars USD 2,446 mil. USD 2,446 mil. - 276,398 Currency derivatives USD 245 mil. USD 245 mil. - 2,509
These carrying amounts are included in bonds payable and borrowings, other financial assets, or other financial liabilities in the consolidated statement of financial position. The carrying amount for receivable/payable after one year is classified under non-current liabilities.
December 31, 2018 (Millions of yen)
Contractual
amount
Receivable/ payable after
one year
Carrying amount
Assets Liabilities
Bonds denominated in U.S. dollars USD 290 mil.
USD 150 mil.
- 32,190 Borrowings denominated in U.S. dollars USD 1,586 mil. USD 858 mil. - 176,048 Currency derivatives USD 245 mil. USD 206 mil. - 1,889
These carrying amounts are included in bonds payable and borrowings, other financial assets, or other financial liabilities in the consolidated statement of financial position. The carrying amount for receivable/payable after one year is classified under non-current liabilities.
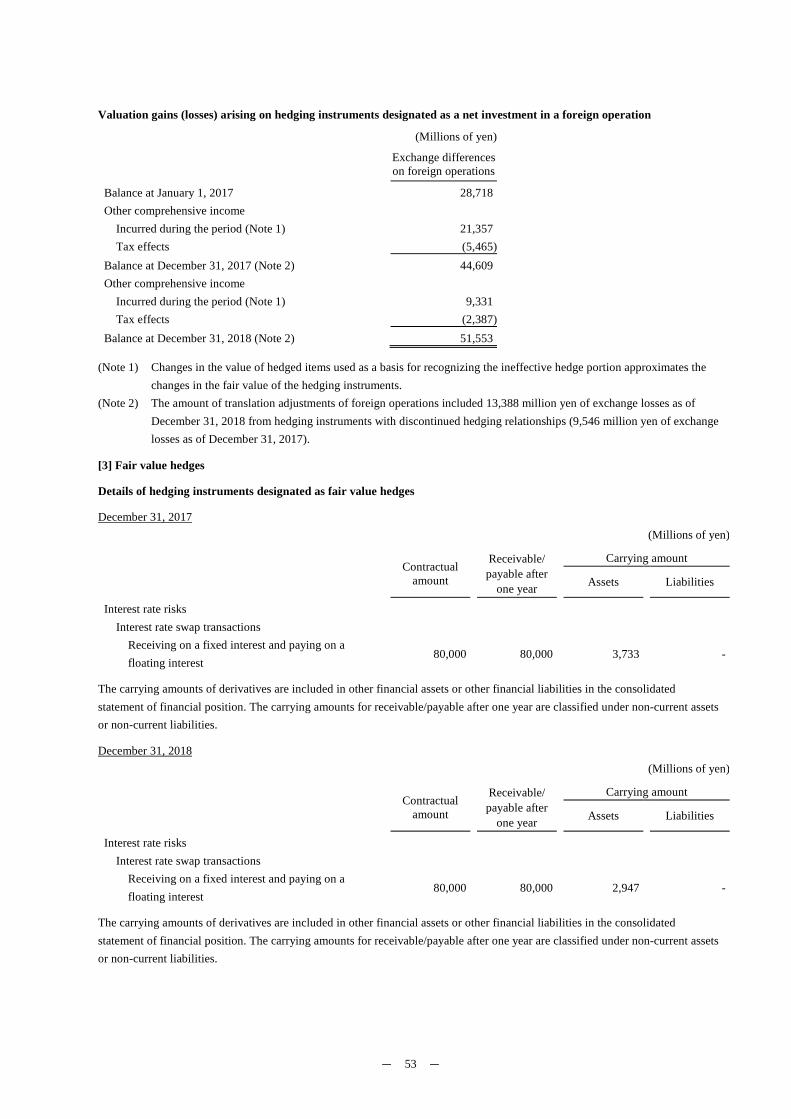
- 53 -
Valuation gains (losses) arising on hedging instruments designated as a net investment in a foreign operation
(Millions of yen)
Exchange differences on foreign operations
Balance at January 1, 2017 28,718 Other comprehensive income
Incurred during the period (Note 1) 21,357 Tax effects (5,465)
Balance at December 31, 2017 (Note 2) 44,609 Other comprehensive income
Incurred during the period (Note 1) 9,331 Tax effects (2,387)
Balance at December 31, 2018 (Note 2) 51,553
(Note 1) Changes in the value of hedged items used as a basis for recognizing the ineffective hedge portion approximates the changes in the fair value of the hedging instruments.
(Note 2) The amount of translation adjustments of foreign operations included 13,388 million yen of exchange losses as of December 31, 2018 from hedging instruments with discontinued hedging relationships (9,546 million yen of exchange losses as of December 31, 2017).
[3] Fair value hedges
Details of hedging instruments designated as fair value hedges
December 31, 2017 (Millions of yen)
Contractual
amount
Receivable/ payable after
one year
Carrying amount
Assets Liabilities
Interest rate risks
Interest rate swap transactions
Receiving on a fixed interest and paying on a floating interest
80,000 80,000 3,733 -
The carrying amounts of derivatives are included in other financial assets or other financial liabilities in the consolidated statement of financial position. The carrying amounts for receivable/payable after one year are classified under non-current assets or non-current liabilities.
December 31, 2018 (Millions of yen)
Contractual
amount
Receivable/ payable after
one year
Carrying amount
Assets Liabilities
Interest rate risks
Interest rate swap transactions
Receiving on a fixed interest and paying on a floating interest
80,000 80,000 2,947 -
The carrying amounts of derivatives are included in other financial assets or other financial liabilities in the consolidated statement of financial position. The carrying amounts for receivable/payable after one year are classified under non-current assets or non-current liabilities.
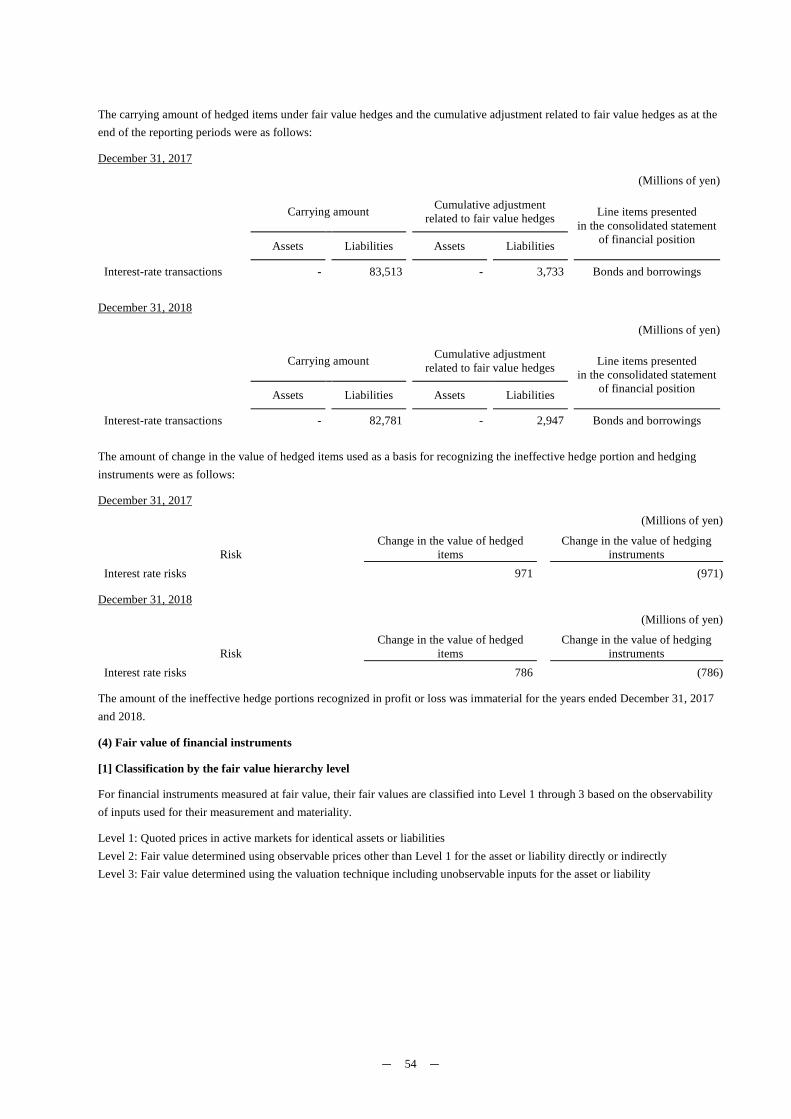
- 54 -
The carrying amount of hedged items under fair value hedges and the cumulative adjustment related to fair value hedges as at the end of the reporting periods were as follows:
December 31, 2017
(Millions of yen)
Carrying amount Cumulative adjustment
related to fair value hedges Line items presented in the consolidated statement
of financial position Assets Liabilities Assets Liabilities
Interest-rate transactions - 83,513 - 3,733 Bonds and borrowings
December 31, 2018
(Millions of yen)
Carrying amount Cumulative adjustment
related to fair value hedges Line items presented in the consolidated statement
of financial position Assets Liabilities Assets Liabilities
Interest-rate transactions - 82,781 - 2,947 Bonds and borrowings
The amount of change in the value of hedged items used as a basis for recognizing the ineffective hedge portion and hedging instruments were as follows:
December 31, 2017 (Millions of yen)
Risk Change in the value of hedged
items Change in the value of hedging
instruments Interest rate risks 971 (971)
December 31, 2018 (Millions of yen)
Risk Change in the value of hedged
items Change in the value of hedging
instruments Interest rate risks 786 (786)
The amount of the ineffective hedge portions recognized in profit or loss was immaterial for the years ended December 31, 2017 and 2018.
(4) Fair value of financial instruments
[1] Classification by the fair value hierarchy level
For financial instruments measured at fair value, their fair values are classified into Level 1 through 3 based on the observability of inputs used for their measurement and materiality.
Level 1: Quoted prices in active markets for identical assets or liabilities Level 2: Fair value determined using observable prices other than Level 1 for the asset or liability directly or indirectly Level 3: Fair value determined using the valuation technique including unobservable inputs for the asset or liability
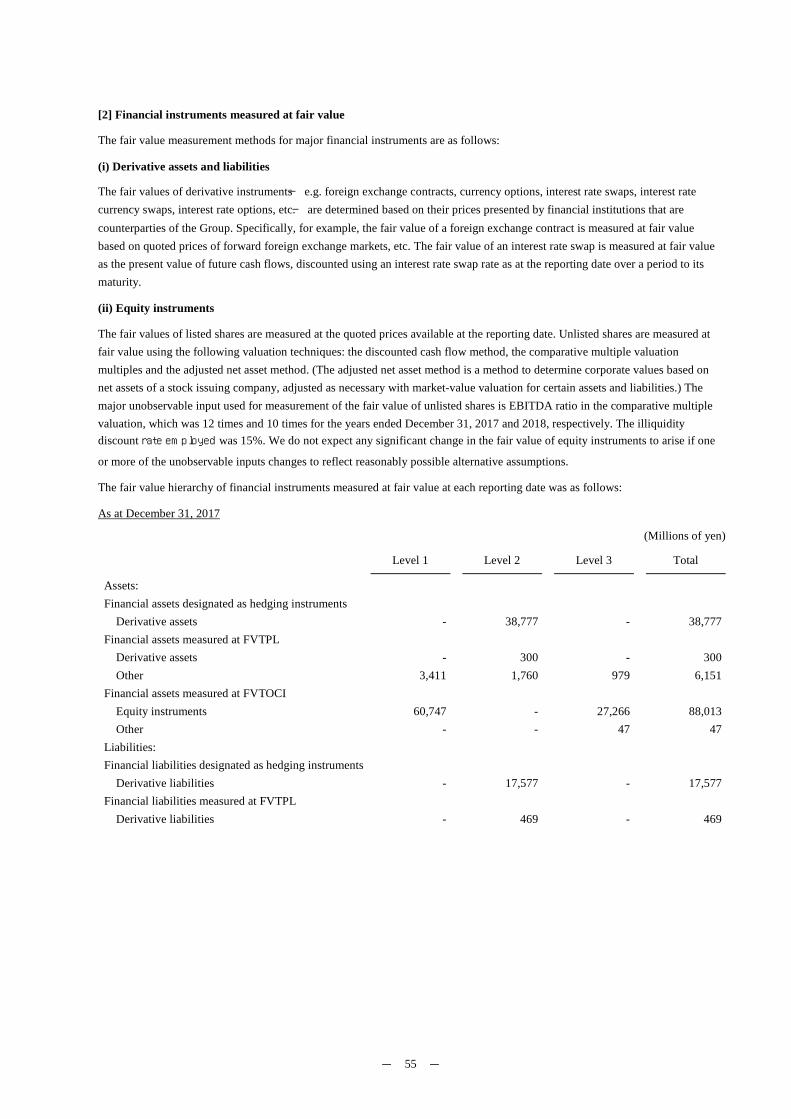
- 55 -
[2] Financial instruments measured at fair value
The fair value measurement methods for major financial instruments are as follows:
(i) Derivative assets and liabilities
The fair values of derivative instruments ̶ e.g. foreign exchange contracts, currency options, interest rate swaps, interest rate currency swaps, interest rate options, etc. ̶ are determined based on their prices presented by financial institutions that are counterparties of the Group. Specifically, for example, the fair value of a foreign exchange contract is measured at fair value based on quoted prices of forward foreign exchange markets, etc. The fair value of an interest rate swap is measured at fair value as the present value of future cash flows, discounted using an interest rate swap rate as at the reporting date over a period to its maturity.
(ii) Equity instruments
The fair values of listed shares are measured at the quoted prices available at the reporting date. Unlisted shares are measured at fair value using the following valuation techniques: the discounted cash flow method, the comparative multiple valuation multiples and the adjusted net asset method. (The adjusted net asset method is a method to determine corporate values based on net assets of a stock issuing company, adjusted as necessary with market-value valuation for certain assets and liabilities.) The major unobservable input used for measurement of the fair value of unlisted shares is EBITDA ratio in the comparative multiple valuation, which was 12 times and 10 times for the years ended December 31, 2017 and 2018, respectively. The illiquidity discount rate employed was 15%. We do not expect any significant change in the fair value of equity instruments to arise if one
or more of the unobservable inputs changes to reflect reasonably possible alternative assumptions.
The fair value hierarchy of financial instruments measured at fair value at each reporting date was as follows:
As at December 31, 2017
(Millions of yen)
Level 1 Level 2 Level 3 Total
Assets: Financial assets designated as hedging instruments
Derivative assets - 38,777 - 38,777 Financial assets measured at FVTPL
Derivative assets - 300 - 300 Other 3,411 1,760 979 6,151
Financial assets measured at FVTOCI Equity instruments 60,747 - 27,266 88,013 Other - - 47 47
Liabilities: Financial liabilities designated as hedging instruments
Derivative liabilities - 17,577 - 17,577 Financial liabilities measured at FVTPL
Derivative liabilities - 469 - 469
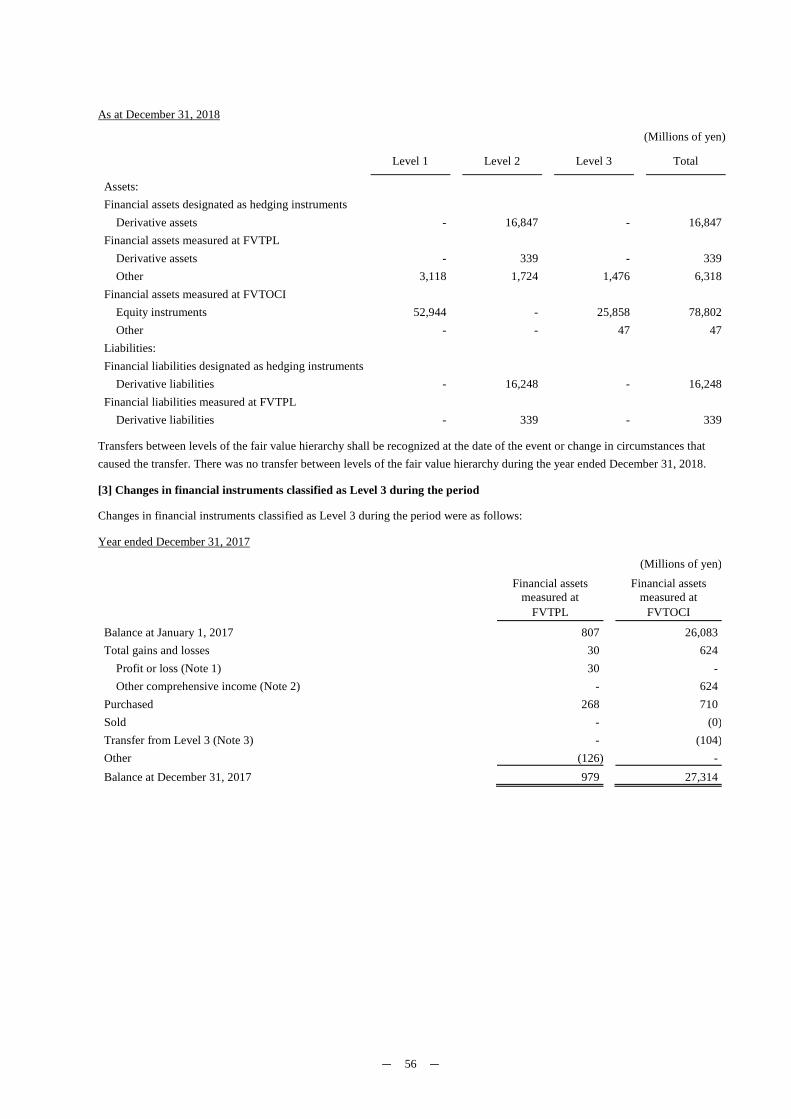
- 56 -
As at December 31, 2018
(Millions of yen)
Level 1 Level 2 Level 3 Total
Assets:
Financial assets designated as hedging instruments
Derivative assets - 16,847 - 16,847 Financial assets measured at FVTPL
Derivative assets - 339 - 339 Other 3,118 1,724 1,476 6,318
Financial assets measured at FVTOCI
Equity instruments 52,944 - 25,858 78,802 Other - - 47 47
Liabilities:
Financial liabilities designated as hedging instruments
Derivative liabilities - 16,248 - 16,248 Financial liabilities measured at FVTPL
Derivative liabilities - 339 - 339
Transfers between levels of the fair value hierarchy shall be recognized at the date of the event or change in circumstances that caused the transfer. There was no transfer between levels of the fair value hierarchy during the year ended December 31, 2018.
[3] Changes in financial instruments classified as Level 3 during the period
Changes in financial instruments classified as Level 3 during the period were as follows:
Year ended December 31, 2017
(Millions of yen)
Financial assets
measured at FVTPL
Financial assets
measured at FVTOCI
Balance at January 1, 2017 807 26,083 Total gains and losses 30 624
Profit or loss (Note 1) 30 - Other comprehensive income (Note 2) - 624
Purchased 268 710 Sold - (0)Transfer from Level 3 (Note 3) - (104)Other (126) - Balance at December 31, 2017 979 27,314
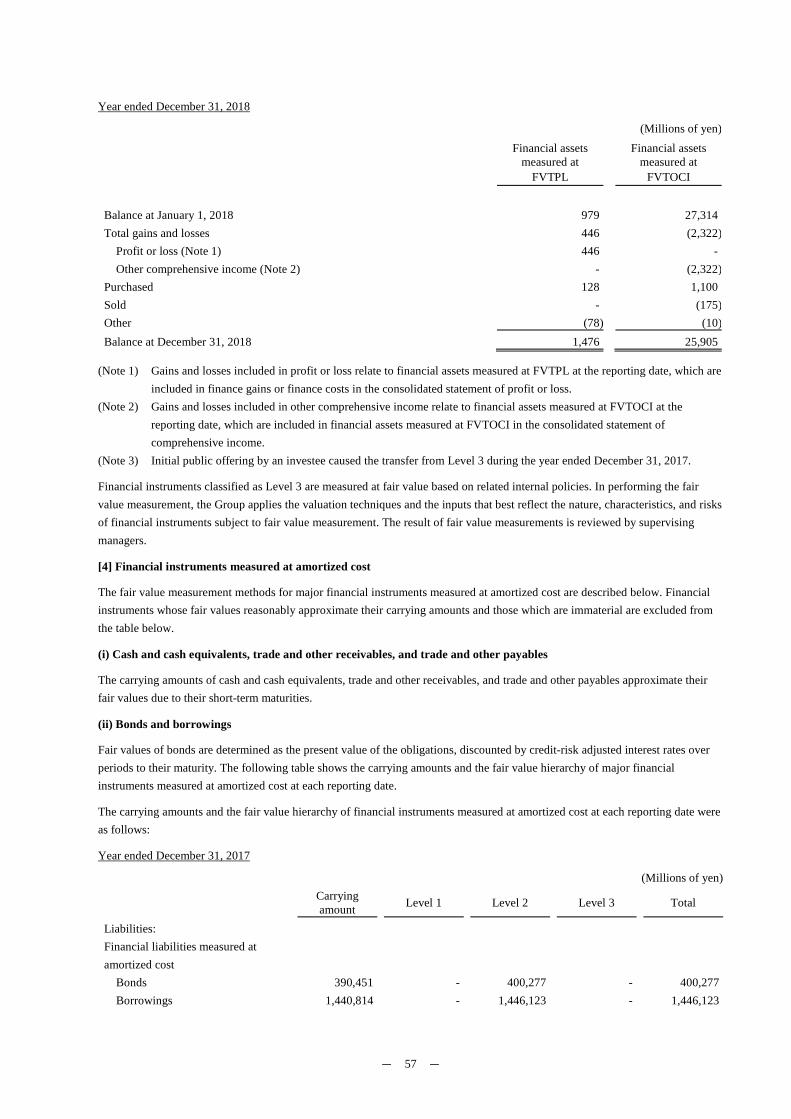
- 57 -
Year ended December 31, 2018
(Millions of yen)
Financial assets
measured at FVTPL
Financial assets
measured at FVTOCI
Balance at January 1, 2018 979 27,314 Total gains and losses 446 (2,322)
Profit or loss (Note 1) 446 - Other comprehensive income (Note 2) - (2,322)
Purchased 128 1,100 Sold - (175)Other (78) (10)Balance at December 31, 2018 1,476 25,905
(Note 1) Gains and losses included in profit or loss relate to financial assets measured at FVTPL at the reporting date, which are included in finance gains or finance costs in the consolidated statement of profit or loss.
(Note 2) Gains and losses included in other comprehensive income relate to financial assets measured at FVTOCI at the reporting date, which are included in financial assets measured at FVTOCI in the consolidated statement of comprehensive income.
(Note 3) Initial public offering by an investee caused the transfer from Level 3 during the year ended December 31, 2017.
Financial instruments classified as Level 3 are measured at fair value based on related internal policies. In performing the fair value measurement, the Group applies the valuation techniques and the inputs that best reflect the nature, characteristics, and risks of financial instruments subject to fair value measurement. The result of fair value measurements is reviewed by supervising managers.
[4] Financial instruments measured at amortized cost
The fair value measurement methods for major financial instruments measured at amortized cost are described below. Financial instruments whose fair values reasonably approximate their carrying amounts and those which are immaterial are excluded from the table below.
(i) Cash and cash equivalents, trade and other receivables, and trade and other payables
The carrying amounts of cash and cash equivalents, trade and other receivables, and trade and other payables approximate their fair values due to their short-term maturities.
(ii) Bonds and borrowings
Fair values of bonds are determined as the present value of the obligations, discounted by credit-risk adjusted interest rates over periods to their maturity. The following table shows the carrying amounts and the fair value hierarchy of major financial instruments measured at amortized cost at each reporting date.
The carrying amounts and the fair value hierarchy of financial instruments measured at amortized cost at each reporting date were as follows:
Year ended December 31, 2017
(Millions of yen)
Carrying amount Level 1 Level 2 Level 3 Total
Liabilities: Financial liabilities measured at amortized cost
Bonds 390,451 - 400,277 - 400,277 Borrowings 1,440,814 - 1,446,123 - 1,446,123
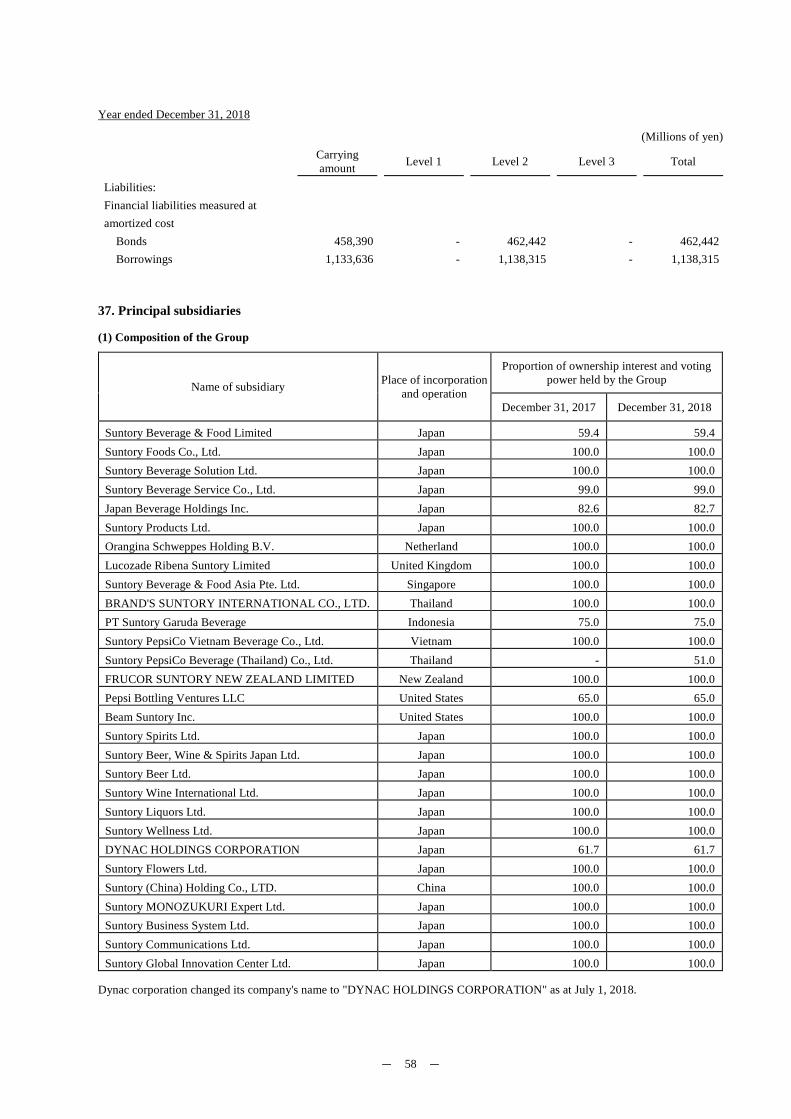
- 58 -
Year ended December 31, 2018
(Millions of yen)
Carrying amount Level 1 Level 2 Level 3 Total
Liabilities: Financial liabilities measured at amortized cost
Bonds 458,390 - 462,442 - 462,442 Borrowings 1,133,636 - 1,138,315 - 1,138,315
37. Principal subsidiaries
(1) Composition of the Group
Name of subsidiary Place of incorporation and operation
Proportion of ownership interest and voting power held by the Group
December 31, 2017 December 31, 2018
Suntory Beverage & Food Limited Japan 59.4 59.4 Suntory Foods Co., Ltd. Japan 100.0 100.0 Suntory Beverage Solution Ltd. Japan 100.0 100.0 Suntory Beverage Service Co., Ltd. Japan 99.0 99.0 Japan Beverage Holdings Inc. Japan 82.6 82.7 Suntory Products Ltd. Japan 100.0 100.0 Orangina Schweppes Holding B.V. Netherland 100.0 100.0 Lucozade Ribena Suntory Limited United Kingdom 100.0 100.0 Suntory Beverage & Food Asia Pte. Ltd. Singapore 100.0 100.0 BRAND'S SUNTORY INTERNATIONAL CO., LTD. Thailand 100.0 100.0 PT Suntory Garuda Beverage Indonesia 75.0 75.0 Suntory PepsiCo Vietnam Beverage Co., Ltd. Vietnam 100.0 100.0 Suntory PepsiCo Beverage (Thailand) Co., Ltd. Thailand - 51.0 FRUCOR SUNTORY NEW ZEALAND LIMITED New Zealand 100.0 100.0 Pepsi Bottling Ventures LLC United States 65.0 65.0 Beam Suntory Inc. United States 100.0 100.0 Suntory Spirits Ltd. Japan 100.0 100.0 Suntory Beer, Wine & Spirits Japan Ltd. Japan 100.0 100.0 Suntory Beer Ltd. Japan 100.0 100.0 Suntory Wine International Ltd. Japan 100.0 100.0 Suntory Liquors Ltd. Japan 100.0 100.0 Suntory Wellness Ltd. Japan 100.0 100.0 DYNAC HOLDINGS CORPORATION Japan 61.7 61.7 Suntory Flowers Ltd. Japan 100.0 100.0 Suntory (China) Holding Co., LTD. China 100.0 100.0 Suntory MONOZUKURI Expert Ltd. Japan 100.0 100.0 Suntory Business System Ltd. Japan 100.0 100.0 Suntory Communications Ltd. Japan 100.0 100.0 Suntory Global Innovation Center Ltd. Japan 100.0 100.0
Dynac corporation changed its company's name to "DYNAC HOLDINGS CORPORATION" as at July 1, 2018.
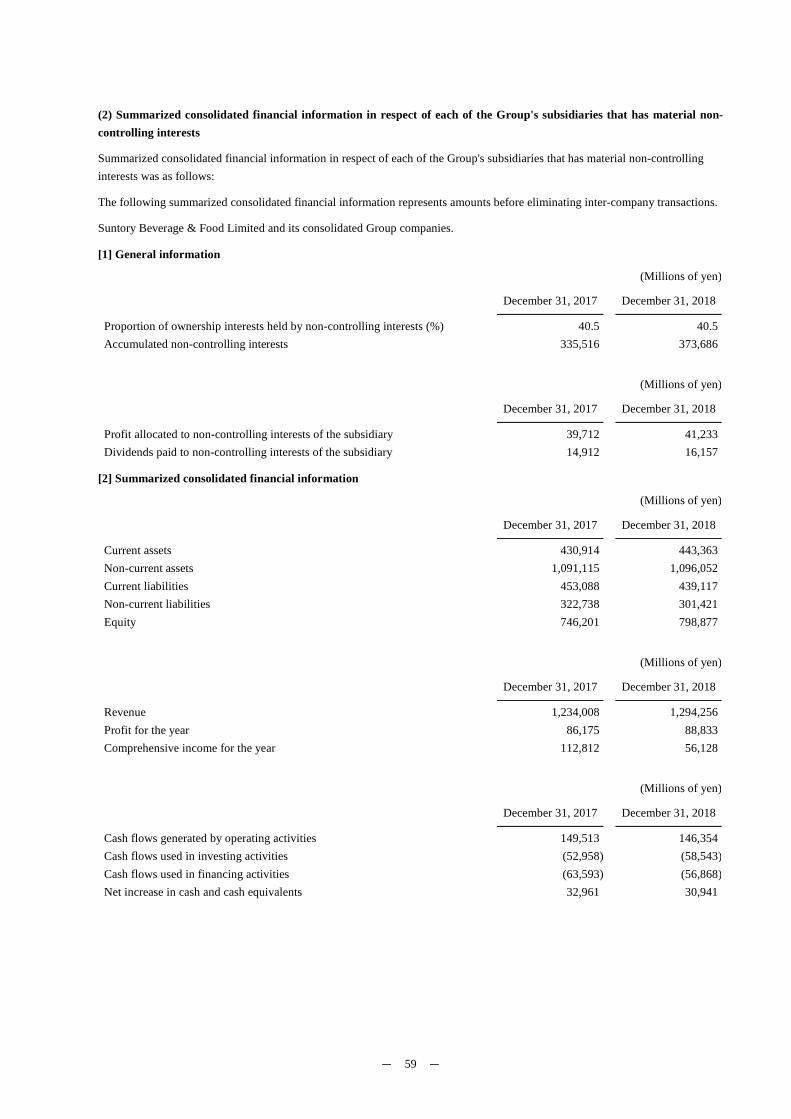
- 59 -
(2) Summarized consolidated financial information in respect of each of the Group's subsidiaries that has material non-controlling interests
Summarized consolidated financial information in respect of each of the Group's subsidiaries that has material non-controlling interests was as follows:
The following summarized consolidated financial information represents amounts before eliminating inter-company transactions.
Suntory Beverage & Food Limited and its consolidated Group companies.
[1] General information
(Millions of yen)
December 31, 2017 December 31, 2018
Proportion of ownership interests held by non-controlling interests (%) 40.5 40.5 Accumulated non-controlling interests 335,516 373,686
(Millions of yen)
December 31, 2017 December 31, 2018
Profit allocated to non-controlling interests of the subsidiary 39,712 41,233 Dividends paid to non-controlling interests of the subsidiary 14,912 16,157
[2] Summarized consolidated financial information
(Millions of yen)
December 31, 2017 December 31, 2018
Current assets 430,914 443,363 Non-current assets 1,091,115 1,096,052 Current liabilities 453,088 439,117 Non-current liabilities 322,738 301,421 Equity 746,201 798,877
(Millions of yen)
December 31, 2017 December 31, 2018
Revenue 1,234,008 1,294,256 Profit for the year 86,175 88,833 Comprehensive income for the year 112,812 56,128
(Millions of yen)
December 31, 2017 December 31, 2018
Cash flows generated by operating activities 149,513 146,354 Cash flows used in investing activities (52,958) (58,543)Cash flows used in financing activities (63,593) (56,868)Net increase in cash and cash equivalents 32,961 30,941
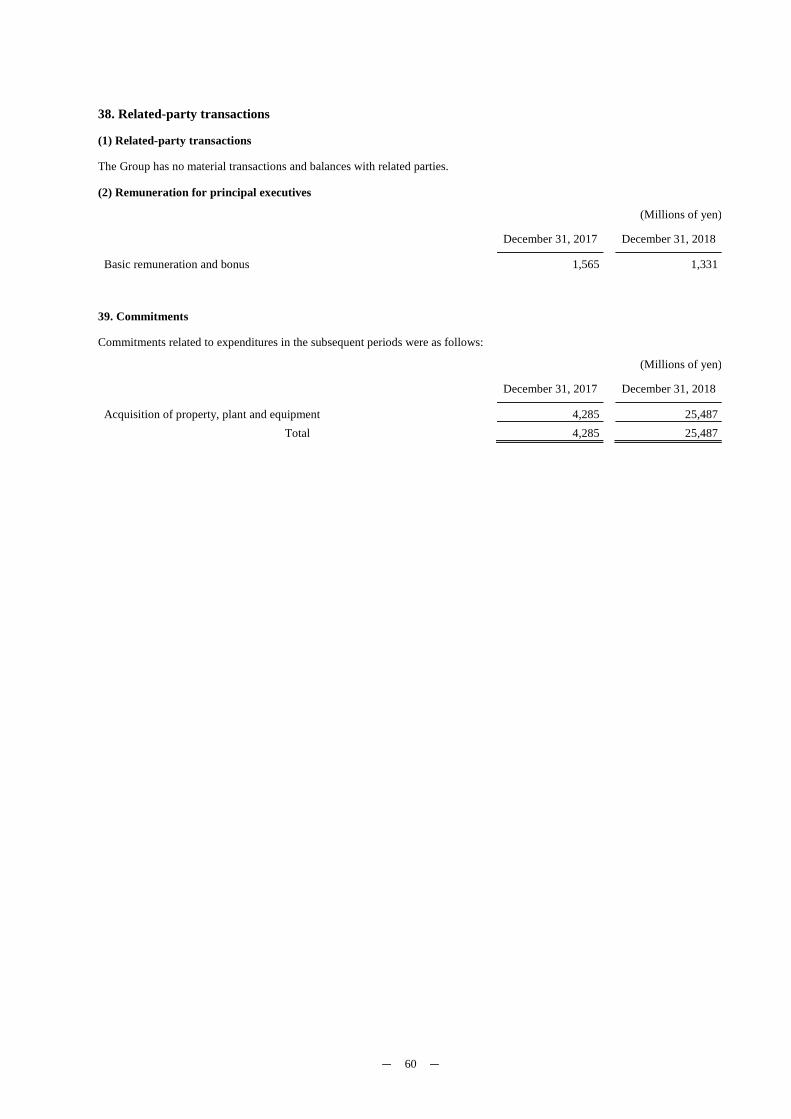
- 60 -
38. Related-party transactions
(1) Related-party transactions
The Group has no material transactions and balances with related parties.
(2) Remuneration for principal executives
(Millions of yen)
December 31, 2017 December 31, 2018
Basic remuneration and bonus 1,565 1,331
39. Commitments
Commitments related to expenditures in the subsequent periods were as follows:
(Millions of yen)
December 31, 2017 December 31, 2018
Acquisition of property, plant and equipment 4,285 25,487 Total 4,285 25,487