Embed Size (px)
Citation preview

I LLINIUNIVERSITY OF ILLINOIS AT URBANA-CHAMPAIGN
PRODUCTION NOTE
University of Illinois atUrbana-Champaign Library
Large-scale Digitization Project, 2007.
S


199?8 19)
Natural History SirveyLibrary
SUMMER EPHEMEROPTERA, PLECOPTERA, AND TRICHOPTERA (EPT)SPECIES RICHNESS AND HILSENHOFF BIOTIC INDEX AT EIGHT STREAM
SEGMENTS IN THE LOWER ILLINOIS RIVER BASIN
Dr. R. Edward DeWalt and Dr. Donald W. WebbCenter for Biodiversity
Illinois Natural History Survey607 East Peabody DriveChampaign, IL 61820
TECHNICAL REPORT 1998 (9)ILLINOIS NATURAL HISTORY SURVEY
CENTER FOR BIODIVERSITY11 May 1998
PREPARED FOR
United States Geological SurveyNational Water Quality Program
Urbana, IL 61801


ABSTRACT
Adult Ephemeroptera, Plecoptera, and Trichoptera (EPT) species were collected from eight
lower Illinois River basin streams sites during June, July, and August 1997. A total of 17,889
specimens were collected, comprising 67 species in 17 families. Caddisflies, or Trichoptera, were
dominant both in the number of species (40 species) and in abundance (88.3% of all individuals).
Mayflies (Ephemeroptera) contributed far less to species richness and abundance, while most
streams were nearly devoid of stoneflies (Plecoptera). Log 0oEPT species richness differed
significantly across stream sites (ANOVA, F=12.61, p=0.0001), and peak in July (ANOVA,
F=67.69, p=0.0001). Hilsenhoff Biotic Index (HBI) was not significantly different across stream
sites (Fig. 5, ANOVA, F=0.89, p=0.53). However, mean monthly HBI scores were highly
significantly different (ANOVA, F=4.99, p=0.008), with July being closest in score to the HBI
calculated over all species collected for the summer. All basin sites rated as at least "fair", based on
Hilsenhoff's scale. Virtually no difference in mean total HBI values existed between large and
small streams (4.86 and 4.71, respectively). Several weaknesses exist in using a taxonomic
richness metric or a biotic index alone. We suggest that both be used in concert to assess stream
health. Where ever possible, multiple light traps samples over a season should be used to
encompassed more variation in the metrics. If only one can be taken, early in July seems to be the
time frame to produce results closest to season-long investigations.
INTRODUCTION
Monitoring stream ecosystems using aquatic macroinvertebrates has been an effective tool
for documenting changes in community health (Plafkin et al. 1989). Some macroinvertebrate
indices of stream health have been identified as most useful and efficacious. These include the
EPT index (sum of Ephemeroptera + Plecoptera + Trichoptera species richnesses, Lenat and
Penrose 1996), total macroinvertebrate taxa richness (Plafkin, et al. 1989), and several numerical
biotic indices (Hilsenhoff Biotic Index, or HBI of Hilsenhoff 1987, and the North Carolina Biotic
Index, or NCBI of Lenat 1993). Wallace et al. (1996) recently endorsed the EPT index as
possibly the most efficient of the macroinvertebrate indices. Similarly, Barbour et al. (1992)
2

compared a large number of macroinvertebrate indices and found that simple species counts,
especially those of sensitive taxa, were most effective at determining impairment of streams.
Aquatic stages of EPT taxa are most often used for stream monitoring. However, this
leads to underestimates of the EPT assemblage in a stream segment since immature stages are often
identified only to the generic level. Most identification keys to the species level focus on the adult
stage.
Illinois is fortunate to have published, statewide monographs on their EPT fauna. Frison
(1935) published a classic treatment of the stoneflies (Plecoptera) of Illinois. Shortly thereafter,
Ross (1944) presented his "Caddisflies (Trichoptera) of Illinois." The mayflies (Ephemeroptera)
of the Illinois was published by Burks (1953). The information gathered by Illinois Natural
History Survey (INHS) researchers on these EPT taxa is unsurpassed in any region of the country.
Despite this vast knowledge, the number of EPT taxa cannot be reliably estimated for any particular
stream reach in Illinois since these studies were for the purposes of gathering specimens for
taxonomic treatment of the orders not for ecological purposes.
The Illinois River basin drains much of what was the wet-prairie region of central Illinois.
Lack of detailed benthic studies in the central and western part of the state precludes knowledge of
"typical" EPT composition there. However, Ross (1944), Burks (1953), and Frison (1935)
generalize about the fauna of large and small rivers in Illinois.
The USGS- National Water Quality Assessment (NAWQA) program has targeted the
Illinois River system for study. The long-term goals of this program are to describe the status and
trends in the quality of a large, representative part of the Nation's surface- and ground-water
resources, and to provide a sound, scientific understanding of the primary factors affecting the
quality of these resources. Several sampling stations in the lower Illinois basin have been
established, benthic macroinvertebrate samples collected and are now being processed. Results of
these studies are expected to require much time to compile. Collection of the adult EPT species at
these sites would provide a rapid view of local river health and provide a species list to guide
identifications of the immature stages found in benthic samples.

Our objectives were to use summer-emerging EPT species to characterize the biotic
integrity of eight NAWQA sites in the lower Illinois River basin. Use of a second measure of
biotic integrity, the HBI, allows for direct comparison of the performance of both indices.
Questions asked were 1) How do the EPT and HBI indices vary throughout the summer months?
2) Do EPT and HBI vary significantly with the number of individuals sampled? 3) Are there
differences in EPT and HBI between sites?, and 4) Do EPT and HBI say the same things about the
streams in which they are used. These collections will also aid in the identification of immature
insects taken in benthic samples. A search of Frison (1935), Ross (1944), Burks (1953) and
databases at the INHS will also provide a historical assemblage for sites in the Illinois River basin.
METHODOLOGY
Eight existing NAWQA sites were chosen in the lower Illinois River basin to survey for
EPT species (Fig. 1, Table 1). These sites correspond with local benthic macroinvertebrate
sampling efforts. Adult EPT were trapped from areas adjacent to the stream using a BioquipTM
AC/DC 12 volt ultraviolet collecting light during June, July, and August of 1997. This apparatus
was suspended 1 m above the ground so as to reflect off a vertically hung white sheet. Two 20 cm
X 30 cm white plastic trays placed below the sheet trapped insects in a pool of 80% EtOH. The
light trap ran for 1 hr beginning at sunset. Air temperature was monitored at most sites at the
beginning and end of the 1 hr period.
Caddisflies struck the sheet several times and fell to the trays below. However, mayflies
and stoneflies required some additional care to obtain high quality specimens. Mayfly sub-adults
(subimagoes) were collected directly off the sheet and placed into styrofoam cups, where they were
held until they had transformed to the imago, a terminal stage of development. They were then
preserved in 80% EtOH. Several species of male stoneflies require eversion of internal genitalia
before they can be successfully identified. Males of Perlesta sp. and Isoperla sp. were picked from
the sheet and their lower abdomens squeezed gently until their genitalia extruded. The entire insect
was then immersed in 80% EtOH, maintaining extrusion of the genitalia, until the insect no longer
4

struggled. These males were stored in separate vials. The trays of insects were then poured into a
11 container for transport back to the laboratory.
Adults were subsampled, where appropriate, and sorted into vials. Specimens were
identified to species in most cases. Females could not be identified to species in some cases. All
data was entered into an ExcelT database and analyzed using the Statistical Analysis System (SAS
1985). The dataset was sorted by location and month, the percentages for each taxon calculated,
and the total numbers of EPT taxa counted. The HBI is a Midwest index of stream organic
pollution (Hilsenhoff 1987). Tolerance values have been assigned to many taxa that range from 0
to 10, with higher numbers indicating a greater tolerance for organic pollution. Tolerance values
were only available at the genus level for some species, e.g. caddisfly genera Cheumatopsyche
and Hydroptila. Tolerance values were absent for some species entirely, necessitating removal of
those species from the HBI calculations. All taxa encountered and their assigned tolerance values,
are provided Table 2. The influence of month and site upon EPT and HBI values was investigated
using the General Linear Models (GLM) approach of Analysis of Variance (ANOVA, SAS 1985).
Logio transformations of data eliminated the discrete nature of the EPT count. A Duncan's Multiple
Range Test (SAS 1985) was used to determine relationships between sites and months for EPT
and HBI parameters. The ANOVA was an exploratory analysis and its conclusions should be
accepted with care. Small sample size (degrees of freedom = 32, 8 sites and four "month" levels
including total, June, July, and August EPT and HBI) may pose a problem with interpretation.
We used the Spearman Rank Correlation (SAS 1985) to investigate the relationships
untransformed HBI values to that of the EPT and its components.
Most specimens were accessioned into the INHS collections as vouchers for the study. All
specimen-level data from voucher specimens (species, location, numbers, etc.) have been added to
searchable Ephemeroptera, Plecoptera, and Trichoptera databases maintained by the INHS.
RESULTS
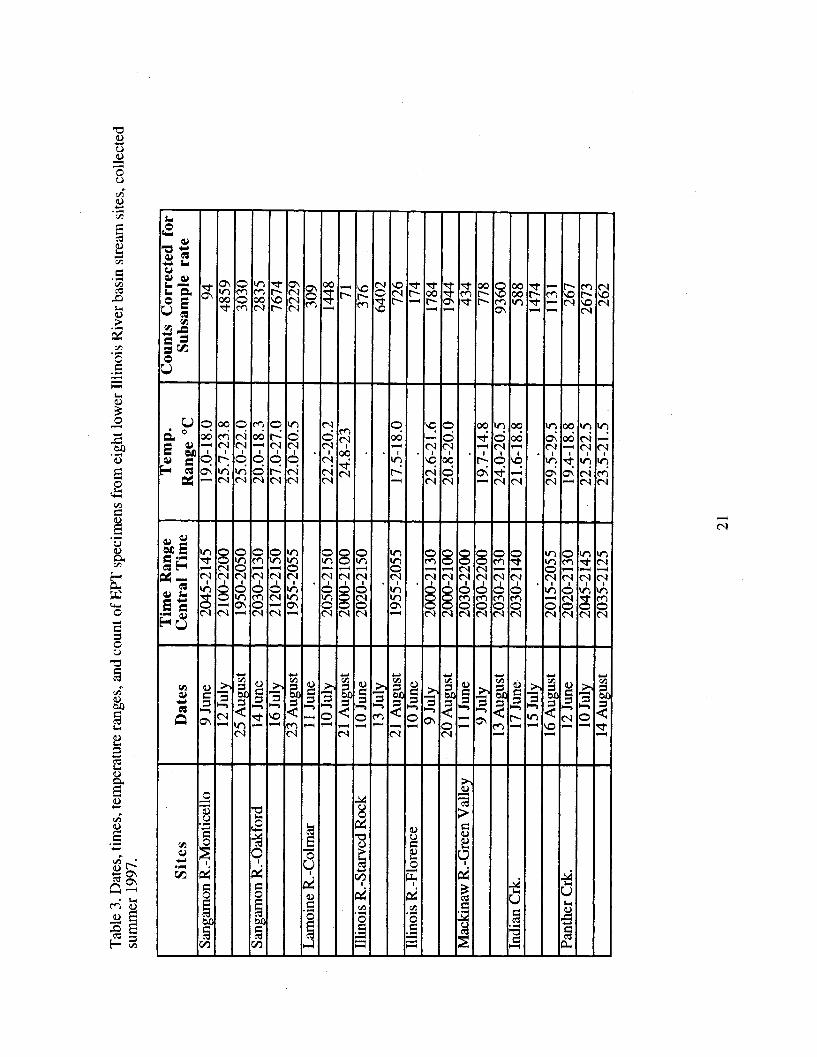
Dates of collection, times, temperatures, and total counts corrected for subsample rates are
presented in Table 3. Ultraviolet black light traps yielded 17,889 subsampled EPT adults and 67
5

species over the summer, 1997 sampling period (Table 4). Trichoptera contributed 61.2% (41
species) of this total, while mayflies provided another 34.3% (25 species). Stoneflies were a
relatively minor component of the EPT fauna, contributing only 4.5% (3) of the total.
Abundance: Abundances, standardized for subsampling effort and to a 1 hr collection period
were extremely variable across sites sampled (Table 3). Mean values of log 0o adjusted abundance
were not significantly different across sites (ANOVA, F=1.23, p=0.35). It is probable that a low
degrees of freedom obscured abundance relationships. However, larger rivers (Sangamon River at
Oakford, Mackinaw River, Illinois River at Starved Rock) accounted for three of the top four mean
abundances. Smaller streams either supported lower densities or provided less visible area around
the ultraviolet light trap. Significant log 0l abundance differences were found across months
(ANOVA, F=6.10, p=0.01). A Duncan's MRT produced the following relationships :
Duncan Grouping Mean N MonthA 3.40 8 July
AB 3.03 8 AugustB 2.57 8 June
June and July were the only months with different abundances. July and August mean air
temperatures, taken during sample visits, were 14-15% warmer than during June. This would
reduce the numbers of insects flying in June. Additionally, most of Illinois had experienced a
cooler-than-normal spring which delayed the development of adults until July.
Dominant taxa: Three of four large stream sites (Illinois River sites, Sangamon R. at Oakford,
Mackinaw River near Green Valley) were dominated by species of net-spinning caddisflies in the
family Hydropsychidae (Fig. 2). Chief among these was Potamyiaflava (Hagen) whose percent
contribution over the entire summer ranged from 16 to nearly 55%. Ross (1942) characterizes this
species as a large river inhabitant, often of great abundance. We have personally witnessed this
tawny species emerging in large numbers from the shores of the Mississippi and other large rivers
in the state. Hydropsyche bidens Ross was common at three of the four sites. Ross (1944) found
no definite association with stream size for this species. Cheumatopsyche sp. was an abundant
6

taxon at all stream sites. Most of the individuals were females whose identity was impossible to
ascertain. Males were identified as Cheumatopsyche lasia Ross, C. campyla Ross, and C. pettiti
(Banks). Ross (1944) found that C. lasia and C. pettiti most often occurred in small streams, but
could be found in large rivers as well. Cheumatopsyche campyla has a preference for large rivers.
Small-to-medium streams demonstrated much less overlap in dominant taxa than did large
streams (Fig. 3). Cheumatopsyche sp. was found at three of the four sites. Again, most were
unidentifiable females. Sometimes all three species found in large rivers were also present in the
smaller ones. However, C. pettiti was often the most common of the three. Nectopsyche sp. were
commonly taken in these streams. Females were unidentifiable to species and were most often the
bulk of the individuals. When males were present, N. candida Ross and N. diarina Ross were
the abundant species. Ceraclea sp. were dominant at three of four sites, and were almost
exclusively composed of C. tarsipunctata and C. transversa. Both species have been collected
throughout the state in a wide variety of stream sizes (Ross 1944; Moulton and Stewart 1996).
Species Richness: Log 0oEPT species richness (Fig. 4) differed significantly across stream sites
(ANOVA, F=12.61, p=0.0001). A Duncan's MRT (a=0.05) found the following relationships:
Logl0Duncan Grouping Mean EPT N Site
A 2.39 4 IndianA 2.36 4 Mackinaw
AB 2.31 4 Sangamon-MonticelloAB 2.31 4 PantherBC 2.25 4 La MoineBC 2.24 4 Illinois-Starved RockCD 2.16 4 Illinois-FlorenceD 2.10_ 4 Sangamon-Oakford
Generally, small and medium-sized streams had the highest EPT values. Indian Creek displayed
the highest overall richness at 38 species, while the medium-sized La Moine River tallied only 21
total EPT (Fig. 4). The Mackinaw River was the most diverse large river. It produced 41.9%
7

more EPT than the Sangamon River at Oakford, which had the lowest EPT richness of the large
rivers (Fig. 4).
LogD0 of EPT species richness was also different across months (ANOVA, F=67.69,
p=0.0001). A Duncan's MRT demonstrated three distinct groupings (a=0.05) with the following
relationships:
Duncan Grouping Log 0o N MonthMean EPT
A 2.45 8 TotalB 2.30 8 JulyB 2.24 8 AugustC 2.07 8 June
The month "Total" represents a count of all species for a particular site. It is not surprising then
that this EPT tally forms a distinct grouping. July and August values were not significantly
different, but June EPT totals were significantly different from both months. Most EPT species
were cued to emerge in July this particular year--the cool spring delaying transformation of larval
stages to adults until that time.
Hilsenhoff's Biotic Index: There were no significant differences in mean HBI scores across
stream sites (Fig. 5, ANOVA, F=0.89, p=0.53). However, mean monthly HBI scores were
highly significantly different (ANOVA, F=4.99, p=0.008). A Duncan's MRT produced the
following relationships among monthly means:
Duncan Grouping Mean N MonthA 5.33 8 August
AB 4.78 8 TotalB 4.53 8 JulyB 4.23 8 June
This is a complex relationship, but the most obvious outcome is that June had a significantly lower
(greater health/quality) HBI score than did August. All other relationships cannot be clarified at
this time; however, it appeared that HBI scores increased as the summer waned. Late season
dominance by such species as P. flava and the several Cheumatopsyche species produced higher
values in August. Species with lower tolerance values dominated in June. Total HBI values are

the most appropriate ones on which to base decisions, since they represent the average tolerance of
the whole community. Given a similar thermal regime, July might be the best month to estimate
tolerance of the entire community if only one monthly sample could be collected. Hilsenhoff
(1987) presented the following ranges and quality designations.
HBI Ranges Quality Rating0.00-3.50 Excellent3.51-4.50 Very Good4.51-5.50 Good5.51-6.50 Fair6.51-7.50 Fairly Poor7.51-8.50 Poor8.51-10.00 Very Poor
Total HBI values are the most appropriate measures of biotic integrity since they encompass the
entire summer fauna. These are provided along with tentative ratings from Hilsenhoff (1987).----------------------------- - ----------- --Qua----Total HBI Quality
Site Score RatingMedium-to-Large Rivers
Mackinaw 4.87 GoodIllinois -Starved Rock 4.63 Good
Illinois-Florence 5.52 FairSangamon-Oakford 4.40 Very Good
Small-to-Medium RiversSangamon-Monticello 4.93 Good
La Moine-Colmar 4.07 Very GoodIndian 5.14 Good
Panther 4.69 Good
All sites were rated as at least "fair", having scored 5.50 or below. Virtually no difference in mean
total HBI values existed between large and small streams (4.86 and 4.71, respectively). The
Sangamon River at Oakford and the La Moine River at Colmar were rated at "very good" by the
HBI. This is disturbing since these sites demonstrated low EPT taxa richness.
Relationships of HBI, EPT and its Components: A Spearman Rank Correlation (n=32)
found very low correlations of HBI and EPT values:

Variables HBI EPT EPHEM PLEC TRICH ADJABUNDHBI 1Fm PT 1
EPHEM 0.33PLEC -0.39TRICH 0.26ADJABUND 0.10
1-0.154 1
0.45 0.06 10.39 0.37 0.24 1
Additionally, no components of the EPT index were found to have a predictable (inverse)
relationship with the HBI. This was possibly due to the heavy weighting of abundant species in
the calculation of the HBI and the fact that a large percentage of EPT taxa were represented by
relatively few individuals. Trichoptera and Ephemeroptera richnesses were highly correlated with
the EPT index. Plecoptera were not abundant in most streams and usually were represented by
only one or two species. This accounted for its low correlation to the EPT index. The variable
"adjabund" is abundance adjusted for subsampling effort. It showed a positive, but small
relationship to any of the HBI and EPT indices, demonstrating that the number of individuals had
only a minor effect on these indices of stream health.
Notes on Species Encountered: Only 6 of the 31 baetid mayflies known from Illinois (Burks 1953,
McCafferty website: www.entm.purdue.edu/entomology/mayfly/mayfly.html) were collected or
historically known from the sample locations. Species records in Burks (1953) and in about 4000
database records of Ephemeroptera at the INHS showed that only Callibaetisfluctuans (Walsh) had
been previously reported from the area. We recorded five species at four of eight sites in medium-
to-small rivers and streams (Table 4). Three of the six caenid mayflies known to occur in Illinois
were taken from these silty prairie streams. Some species, such as Caenis hilaris (Say) and C.
latipennis Banks were dominant inhabitants across all stream sizes. The Sangamon River at
Monticello produced huge numbers of C. latipennis during August. Heptageniid mayflies
accounted for 10 species (26 known from Illinois, Burks 1953, Bednarik and McCafferty 1979),
the most common of which being Stenacron interpunctatum (Say). This species occurred in both
large and small streams and is tolerant of siltation and low dissolved oxygen (Hilsenhoff 1987,
10

Lenat 1993). Isonychia rufa McDunnough, one of five Isonychia to occur in Illinois and an
inhabitant of the swifter portions of streams, was documented at several sites across all stream
sizes. Only the males of this species can be identified. Female specimens identified to Isonychia
were probably this species. Burks (1953) and Kondratieff and Voshell (1984) characterize the
genus Isonychia as a common inhabitant of prairie streams in the Mississippi River drainage.
Species richness of stoneflies was very low for the study area. Seven summer-emerging
(perlids and perlodids) species are historically known from the drainage (Table 4), but only
Perlesta decipiens (Walsh) and Isoperla bilineata (Say) widely occur in the region during summer.
Snellen and Stewart (1979) reported a lengthy egg diapause in P. decipiens (as P. placida
(Hagen). Hynes (1961) postulated that this type of diapause may permit drought resistance and
avoidance of competition for food and space. It may also allow for avoidance of high summer
water temperatures and the concomitant low dissolved oxygen concentrations. No such study had
been conducted for L bilineata. It is disturbing that no specimens of Acroneuria, Agnetina, or
Neoperla were collected. Species in these genera may have experienced drastic declines in Illinois
during the last several decades.
Three families contributed the largest number of caddisfly species during the study. These
were the hydropsychids, hydroptilids, and the leptocerids. Twelve species of hydropsychids were
collected or have been known to occur at or near the sites sampled. Ceratopsyche bronta (Ross)
was a dominant species at the two smallest streams, Indian and Panther Creeks. Ross (1944) and
Schefter and Wiggins (1986) report this species frequents cool, headwater streams and is tolerant
of moderate organic enrichment. Although Ross (1944) discusses some preferences of
Cheumatopsyche species for large or small streams, our data suggests that the three species
encountered have wide ranges of stream size preference. Cheumatopsyche lasia Ross has been
noted to be abundant in heavily silted streams throughout the central prairie of North America
(Ross 1944, Moulton and Stewart 1996). Hydropsyche betteni Ross occurred only in small-to-
medium-sized streams, where it was occasionally dominant. Schuster and Etnier (1978) and
Hilsenhoff (1987) found it to be highly tolerant of organic enrichment. Hydropsyche bidens Ross
11

was collected from all sites except Panther Creek. It appeared to prefer larger rivers (Moulton and
Stewart 1996), where it was often abundant.
Eleven species of hydroptilid, or micro-, caddisflies were taken from or known to occur in
the lower Illinois River basin near the stream sites. Two species were abundant, Hydroptila ajax
Ross and H. angusta Ross. The greatest abundance of H. ajax occurred in Indian Creek, a small,
open stream. Hydroptila angusta inhabited small stream and large rivers and has been found in
abundance in light trap samples from the Ohio River (DeWalt, 1998). Another micro-caddisfly,
Mayatrichia ayama Mosely, was taken only at the Illinois River near Florence. Ross (1944) and
Moulton and Stewart (1996) describe its habitat preference as being for small-to-medium-sized,
rapid, clear streams. Although several specimens were taken at Florence, some doubt exists that
this was their origin. Small brooks run out of the bluff above this site nearby.
Leptocerid caddisflies, with 17 species, contribute the greatest species richness for
caddisflies in this study. A significant finding was that of several females of the rarely collected,
N. pavida (Hagen) at the Sangamon River, Monticello site. Ross (1944) reported this from two
collections, Monticello and Herod (southern Illinois). Oecetis inconspicua (Walker) was present at
all sites. It is perhaps the most widely distributed caddisfly species in Illinois due to its ability to
live in both lotic and lentic environments (Ross 1944). Small populations of five other Oecetis
species were take during the study. A large number of female Triaenodes melacus Ross were
taken from Panther Creek. To date this species has only been recorded from two other location in
the state, Cooper Creek near Mill Creek and it type locality of Blackman Creek near Rudement,
both in the Shawnee Hills of southern Illinois. It has been taken in low numbers from scattered
locations in AL, IN, KS, KY, MO, MS, and OH.
Cyrnellusfraterus (Banks) was the only other widespread and abundant caddisfly species.
Ross (1944) and Moulton and Stewart (1996) report it principally from large rivers, but it has been
found in smaller streams and at the shores of lakes (DeWalt, pers. obs.). Hilsenhoff (1987) rates
it as being highly tolerant of organic enrichment.
12

CONCLUSIONS
Inspection of 17,889 specimens from this Illinois River basin study has demonstrated that
its EPT assemblage, as represented by light trap collections, was overwhelmingly dominated by
caddisflies. Sixty-one percent of all species and 88.3% of all individuals were caddisflies. Three
caddisfly families contributed 40 of the 67 EPT species encountered. These were the
Hydroptilidae (11 species), Hydropsychidae (12), and the Leptoceridae (17). These same families
also dominated abundance. Hydropsychid caddisflies contributed 56.6% of all individuals, while
the leptocerids added 19.4%, and the hydroptilids provided 7.9%. Moulton et al. (1993) studied
the caddisfly fauna of the Brazos River in Texas. They found 42 species occurring over an
equivalent time period. The same three families that were diverse and abundant in our study were
found to be diverse and abundant in the Brazos River. The species P. flava, H. bidens, and
several Cheumatopsyche sp. were dominant at several sites, the former two mostly in medium-to-
large rivers.
Mayflies contributed 34.3% of the EPT species collected, but only 11.3% of individuals.
Caenids provided three species and 6.6% of the abundance. Heptageniids provided 11 species and
2.9% of abundance. Stoneflies provided only 4.5% of all species (3 total) and only 0.4% of
abundance.
Species richness was greatest in Indian Creek (38 taxa). Lowest richness was found in the
La Moine River (21). Small-to-medium-sized streams tended to have more species than the largest
rivers. Richness peaked in July at nearly all sites, followed by August and June. Low richness in
June was most likely due to lower air and water temperature that prevented emergence early in that
month. EPT richness values were not significantly correlated with HBI values. The predicted
relationship would be inverse since low HBI numbers indicate greater stream health/biotic
integrity. In fact, the La Moine River at Colmar had the lowest overall EPT richness of any site,
but had one of the lowest (best) HBI scores. Several reasons may account for this lack of
relationship. EPT richness is counts every species encountered equally, so rare species have a
great impact upon it. Whereas, the HBI weights the tolerance values of taxa by their abundance.
13

Additionally, for several abundant taxa (Cheumatopsyche sp., Hydroptila sp. and others) we were
forced to assign tolerance value for the genus, as no species-level tolerance values exist. Some
species within a genus may well have biologically significant differences in ecological tolerance.
These weaknesses demonstrate the need to use both taxonomic richness and a biotic index for
monitoring of stream health.
Both EPT and HBI values, calculated on adult data, should be focused on the entire
community within an emergence season. This can best occur when light trap samples are available
for several months. If this is not possible, then an early July light trap sample would be the next
best choice. We have found that an HBI score based solely on July light trap collections best
mimicked the HBI score taken across June, July, and August. Similarly, the number of EPT
found in July samples was much closer to the summer-long EPT list.
14

ACKNOWLEDGMENTS
We wish to thank the INHS for providing facilities and time relief for this project. Mitch
A. Harris, of the USGS, helped secure funding and aided in the design of collection protocols.
We wish to thank D. L. Adolphson, P. J. Terrio, and K. Gao, of the USGS, and L. J. Peraino, of
the INHS, for help with light trapping of insects. The University of Illinois through the Federal
WorkStudy program provided student workers who helped collect, sort, label, and database
specimens. These students were P. Li, M. Lavin , D. Duong, B. Lopez, and L. Hernandez.
Without their help, this project would not have been feasible.
15

LITERATURE CITED
Barbour, M. T., J. L. Plafkin, B. P. Bradley, C. G. Graves, and R. W. Wisseman. 1992.
Evaluation of EPA's rapid bioassessment benthic metrics: metric redundancy and variability
among reference stream sites. Environmental Toxicology and Chemistry 11: 437-449.
Bednarik, A. F., and W. P. McCafferty. 1979. Biosystematic revision of the genus Stenonema
(Ephemeroptera: Heptageniidae). Canadian Bulletin Fisheries Aquatic Sciences 201: 73 p.
Burks, B. D. 1953. The mayflies, or Ephemeroptera, of Illinois. Bulletin Illinois Natural History
Survey 26: 216 pp.
Frison, T. H. 1935. The stoneflies, or Plecoptera, of Illinois. Bulletin Illinois Natural History
Survey 20: 471 pp.
DeWalt, R. E., B. P. Stark, and M. A. Harris. 1998. Perlesta golconda, a new stonefly species
from Illinois (Plecoptera: Perlidae). Entomological News 109: ? pp.
Hilsenhoff, W. L. 1987. An improved biotic index of organic stream pollution. Great Lakes
Entomologist 20: 31-39.
Hynes, H. B. N. 1961. The invertebrate fauna of a Welsh mountain stream. Archives fur
Hydrobiologia 57: 344-388.
Kondratieff, B. C., and J. R. Voshell, Jr. 1984. The North and Central American species of
Isonychia (Ephemeroptera: Oligoneuriidae). Transactions American Entomological
Society, 110: 129-244.
Lenat, D. R. 1993. A biotic index for the southeastern United States: derivation and list of
tolerance values, with criteria for assigning water-quality ratings. Journal North American
Benthological Society 12: 279-290.
Lenat D. R., and D. L. Penrose. 1996. History of the EPT taxa richness metric. Bulletin North
American Benthological Society 13: 305-307.
Moulton, S. R. II, and K. W. Stewart. 1996. Caddisflies (Trichoptera) of the Interior Highlands
of North America. Memoirs American Entomological Institute 56: 313 pp.
16

Moulton, S. R. II, Daniel Petr, and K. W. Stewart. 1993. Caddisflies (Insecta: Trichoptera) of
the Brazos River drainage in north-central Texas. Southwestern Naturalist 38: 19-23.
Plafkin, J. L., M. T. Barbour, K. D. Porter, S. K. Gross, R. M. Hughes. 1989. Rapid
Bioassessment Protocols for Use in Streams and Rivers: Benthic Macroinvertebrates and
Fish. USEPA, EPA/44/4-89-001.
Ross, H. H. 1944. The caddis flies, or Trichoptera, of Illinois. Bulletin Illinois Natural History
Survey 23: 326 pp.
SAS. 1985. SAS User's Guide: Statistics, 5th ed. Statistical Analysis Institute. Cary, North
Carolina. 956 pp.
Schuster, G. A., and D. A. Etnier. 1978. A manual for the identification of the larvae of the
caddisfly genera Hydropsyche Pictet and Symphitopsyche Ulmer in eastern and central
North America (Trichoptera: Hydropsychidae). USEPA, EPA 600/4-78-060.
Snellen, R. K., and K. W. Stewart. 1979. The life cycle of Perlesta placida (Plecoptera: Perlidae)
in an intermittent stream in northern Texas. Annals Entomological Society of America 72:
659-666.
Wallace, J. B., J. W. Grubaugh, and M. R. Whiles. 1996. Biotic indices and stream ecosystem
processes: results from an experimental study. Ecological Applications 6:140-151.
17

0\
E
C0
ed
O
"i,u0
ocri
2

Table 2. Hilsenhoff Biotic Index (HBI) values and brief discussion of tolerance values for EPTspecies collected during summer 1997 at eight lower Illinois River basin sites.
Taxon HBI DiscussionAcentrella ampla No HBI availableBaetis intercalaris 6Fallceon quilleri No HBI availableLabiobaetis propinquus 6Paracloeodes minutus No HBI availableCaenis amica 7 for genus Caenis, none for species givenCaenis hilaris 7Caenis latipennis 7Hexagenia bilineata 6 for genus Hexagenia, none for species givenHexagenia limbata 6Pentagenia vittigera 6Heptagenia diabasia 3Heptageniaflavescens No HBI availableLeucrocuta aphrodite No HBI availableLeucrocuta maculipennis No HBI availableNixe inconspicua _No HBI availableStenacron interpunctatum 7Stenonema mexicanum 4 S. integrum is a synonym of S. mexicanumStenonema luteum No HBI availableStenonema prob. pulchellum 3_Stenonema terminatum 4Isonychia rufa 2 for genus Isonychia, none for species givenEphoron album 2 for genus Ephoron, none for species givenEphoron leukon 2Anthopotamus myops 4Perlesta decipiens 5 as Perlesta placida, a complex, containing P. decipiens,
the most common species in the region.Perlinella drymo 1Isoperla bilineata 4Helicopsyche borealis 3Ceratopsyche bronta 5Cheumatopsyche aphanta 5 for genus Cheumatopsyche, none for species givenCheumatopsyche campyla 5Cheumatopsyche lasia 5Cheumatopsyche pettiti 5Hydropsyche betteni 6Hydropsyche bidens 3Hydropsyche simulans 7Potamyia flava 5Hydroptila ajax 6 for genus Hydroptila, none for species givenHydroptila albicornis 6 __________________________
Hydroptila angusta 6Hydroptila consimilis 6_____..Hydroptila perdita 6____Hydroptila waubesiana 6
19

Table 2. Hilsenhoff Biotic Index (HBI) values and brief discussion of tolerance values for EPTspecies collected during summer 1997 at eight lower Illinois River basin sites.
Taxon HBI DiscussionMayatrichia ayama No HBI availableOrthotrichia cristata No HBI availableOxyethira pallida 3 for genus Oxyethira, none for species givenCeraclea punctata 3 for genus Ceraclea, none for species givenCeraclea tarsipunctata 3Ceraclea transversa 3Leptocerus americanus No HBI availableNectopsyche candida 3 for genus Nectopsyche, none for species givenNectopsyche diarina 3Oecetis avara 8 for genus Oecetis, none for species givenOecetis cinerascens 8Oecetis inconspicua 8Oecetis persimilis 8Triaenodes marginatus 6 for genus Triaenodes, none for species givenTriaenodes tardus 6Anabolia consocia 5 for genus Anabolia, none for species givenChimarra obscura 4 for genus Chimarra, none for species givenPhryganea sayi 8 for genus Phryganea, none for species givenCyrellus fraternus 8Neureclipsis crepuscularis 7 for genus Neureclipsis, none for species givenParanyctiophylax affinis 5 for genus Paranyctiophylax, none for species givenPolycentropus sp. 6 for genus Polycentropus, none for species given
20
C.)
0
C.
-o
· I-
C.)
C.)
C.)
C.)
C.)
C.)
~ON
C.)
0 a
I 0 1.1
5-
t or-q q *6 O -- 4"
: q
0-----o---------------1---- ---------------- - ------
in n N on W) N t o <n en oO e e
E § 0 CC ) . rC00
N N
(N I5 o- (( o ( ( Nt ^ O r. o( I
(jD s-8 ci -cmi c>i-cw
Sr0C '- N 0- -C 0 -- 0 - - -- 0 -t a a
2'· 2- 2 0000 00
N I N - -g -
a) "0 l ' 3 a
_ 0
(Nl

E0
00
0
CI
0Ci.3i
0
E
0)
,)
cn
a)
C,cn
a4)
0C.o
oE0o
0
a.
a-o
C
O.
L_
Cbi) qr - I I SI I I I I Cn I I -Iw ygw 's s g 3 SE ss ^S^^ .C
-__M II ^ ^· U ^ = ^ f 3^^ ^^^ ^^^
* 00 00 C
666t - --- --- --- - -
CC)
--------------_----_------_------------------------0 N N O
----------------- ------------------------- -- --------- --
00 00
odIsr e n
0 l 0° °° ^^ m o d <N
--------------------------------------------------- __ ------------
^d oddd(O dI
I N-, -: r; c j^Cl Icl dlI~
666 666
Zd al l, oS o I d
CU ____^ 0^ ^ ^ _ _ _ _ _ _ _ _ _
< 0 I I (N oo
CU ____ 6-- - - ! _ _ _
z 00 Cl 0C
0 6
Nc^3 N^ ClN :.* 66 6 6 66d d
* 9Z * *
6 6n
i; I I I g^L -·. iS lo I sig l I I IcBtl tIl&~ I ^I
C4C1.

E0
cno
0
o.,
0
e-0.
o£
cn
o
'c
0-6-0cz6CE
E
0u-
ۥ
0rr
0
Lco
0
0
cn
L_
0
I--CD(n
0
Q.0
..,.0-UJO0
I *O0 -dO c0
^ '1
^5 Ia, |
I.- .* |l ^ |a .| 1 liI
004 40 a! V) Cý Q S: 04 ft% A zliz)
jI *1zIs ^ W4 CIO 9101qS~ *I1
Ic
Il~ <y 2^ I
9 ------ ---- - -- __- _2- Cq . -.
------------------------------------------- - -
00
cii
-I In -
= *z * * *
Cu
a
-_..
CA
S-- --
E Cl
6 6l; *li * I I I
6 6o
1 *l 5 * * *
- 0
41eQ --
- *-» * * *
A rT s
Q) ^z% ^ -
A
dl I S l^ I I I tf I .a I I I I IBz d <-2 Is 1& I a"'s-a S
c,

E0
0
00
a)
r-
t-
0
0
O
0
C
0
a)
0
LC
C0
E
(0
C
o
I
a)
Qf
"3 </
Q) '1
, 42 ZZ :3l IZia ;n QOI cot Cot r-n r'lI"t IE =i ·1^ §e Pi ^P i-ts .|
g a- -- S ii~v UHA: ?~ yyzzý :Z. :z 9C1 Wd ·6 w l = z
CuINC
I~ " J I ° 1 I
e~3 b~ d l l l lallc a
L; vz d a^ 2
^~~~- rlr °n^ S <
00
ECP Cl
00l 0\00
6J C3 dl0 dld I I ^1
Cu
OwT
CC1
\110 ISO".-
CSl^l d^ cba j I I I I I I (C~ C ClJ
· Z ^t (M ·s ON d ^"
c~cq
Clo ClV 0 \~
- - - il d^ ^ 'C; cT t^"' ^
00g
00
^ < yo r- d CT d cj
CuC
--------------- _-----------------p ~ ~ ~ ~ ~ C e~cicl·iV ;p
S CMrr^ -\
E~ 6\
------------------- -^----^----
- ------------------- £--------a
---
------------ _- ---- ^---- --------
eer 0~
^0so vdo<^ - ^t 0
.2 --- - - -- -------------- i o---^
CC r-c^ON €
* Cl 00 0
a ^z ^6 S * ''^ * e^ * %
---- -- - - - - - ------------ ---
6 - O
* * Cl3 CI C
---- ---- ---- --- ------- 1 -- ^- _
^ ^
AC id dc;V S u d"
ag||Egl~~8,|sIL^ , ^ ^ S L ^S a S ^ ^ ^ ^ ^ * o ^.: o t
Cr

E0
V)
0
coa,
0.
L
e-
C
0)
0)
a)E
I)cn
a)
CL0
0
Cl
a)
a)
(I)
C
0
o
L..
eQ
s c l l l Q Q Q a tn i r1 §|Is Z. 5. C- ;
• g, .. -.. , ? ., ' * (z c )
'j 'i L i·
~ 8 r= '
U ~7 ~1 ~ I ~ t~)~1OOO
s' L
0 0
060 0
-g - - -0
^~~~~ ^_--____--_----__--_
00ca
2o -0 0 - 6
Cu - -
<0 , N o0 6. .
c-S -- _ - - - - -- --c-- -- - - --
Cu a -
-t w -d d6d -
-------------------------------------------- - __ _-------
S6 00 -
a --- - --- ----- -- ---- - ----- -------- --
C C l irN C 0 - 0
a ~-------- ------------- - -- -- --------- ---00 0 C d d Cl ^ <
Cl I 0 d0 o o 0
o ___ --- -- -- -- -- -- -- -- --------- ---- ----- -
- -- - - - - - - - - - - - - - - - - - - - - - - -
I>Sc
LCUCIl

E0
C,,
0
0C-,
a.)
E
L_
C,
cu
a)
0C
c-
E
3
C,
a)
C)
I--
0
c0
.D a)
I4-~C
m cnS)CZ
0)
a Z0 -
aQ)
* n
z- s -t E i . ^ s '8EO E Y CI rot rotF
/. W CL
t3 3 r E Cr ^ '*^ ''S ''aI~ll i .
i * rotB g oU L1 t~ 9~ rotW ·· (Z O..ý E· tC =c
I _
0
§ ------- -------
|---- --------
bCl
ie ------------------ I
- *
or
----- ----
6 6
- - 0 -
I 1(" *i
A < r
|J~ ^::::E:::
-c0CM*-

30 0 30 60
Fig. 1. EPT collection sites in the lower Illinois River basin, summer 1997. A indicates samplelocations. 1 = Illinois River-Starved Rock, 2 = Panther Creek, 3 = Mackinaw River, 4 = IndianCreek, 5 = Sangamon River-Monticello, 6 = Sangamon River-Oakford, 7 = La Moine River, 8 =Illinois River-Florence.
27
-M -m i

Uor. nquoo rq a3
"°"» W O,,,
C
CI
Q)
3
0
0
Td
Q)
S00
<O
o
0\*-U
03
€
C r
"0
0
3
" 0
&X)
0
0Qa
0O- -
X
$ZI-
1cn
I
* -
0 c/s
O
31s L(8 1,
O
M 8&bbb *c
COCMj
u~LpOq 11LII0

l"Ueu^jop -,1eua"-ra d
0\
cn
o
-Q )'-
0.-o '
0-
* 1
.0
CNcqJ
I/ 7s
aOuVu.rwr -(e)

ss t t sf" " ^ °
"0"0U
U
0D
0
Ub
Ud
d)0 ,
O
E-"
0

N r,-,"0Q
Q
E
cr0
0n
0)
0
"0
0
c, "