Embed Size (px)
DESCRIPTION
Summarizing Relational Databases. Xiaoyan Yang National University of Singapore Cecilia Magda Procopiuc Divesh Srivastava AT&T Labs-Research. Labs-Research. Motivation. Complex databases are challenging to explore and query Consisting of hundreds of inter-linked tables - PowerPoint PPT Presentation
Citation preview

Summarizing Relational Databases
Xiaoyan YangNational University of Singapore
Cecilia Magda Procopiuc Divesh Srivastava
AT&T Labs-Research
Labs-Research
Motivation
• Complex databases are challenging to explore and query– Consisting of hundreds of inter-linked tables– Users unfamiliar with the schema– Insufficient or unavailable schema information
• Propose a principled approach to summarize the contents of a relational database– Cluster similar tables– Label each cluster by its most important table
04/19/2023 2Summarizing Relational Databases

04/19/2023 Summarizing Relational Databases 3
TPCE
Outline
• Motivation• Our Approach
– Define table importance– Define a metric space over the tables– Clustering: Weighted k-Center
• Experimental Results• Conclusions
04/19/2023 4Summarizing Relational Databases

Table Importance
• Depends on– Internal information content
– External connectivity• Join behavior• Taxrate: 1 join• Customer: 5 joins
04/19/2023 Summarizing Relational Databases 5
2 columns 24 columns3 columns

Table Importance (cont’d)
• Entropy of Attribute A in table R is defined as
– R.A = {a1, …, ak}
– pi is the fraction of tuples in R that have value ai on attribute A
• The Information Content of a table R is defined as
– Create a primary key R.Key to table R– Add a self-loop R.Key – R.Key
04/19/2023 6Summarizing Relational Databases

Table Importance (cont’d)
• Entropy transfer matrix associated with schema graph G is defined as: – For a join edge e = R.A – S.B
– For a pair of tables R and S, define
04/19/2023 7Summarizing Relational Databases
,
qA': number of join edges involving R.A' (including self-join)
VE – Variable entropy transfer Model

Table Importance (cont’d)
• The importance of table R is defined as the stable-state value of a random walk on G, using probability matrix – Vector , s.t. – Importance , R G
• Example
04/19/2023 Summarizing Relational Databases 8
… S_SymbA
B
T_S_Symb T_ID …A 1
B 2
TR_S_Symb TR_T_ID …A 1
B 2
Trade (T)
G(TPCE)Trade_Request (TR)
Security (S)
H(S.S_Symb) = α; qS_Symb = 3
Pr(S.S_Symb T.T_S_Symb) H(S.S_Symb) αIC(S)+(qS_Symb-1) ·H(S.S_Symb) IC(S)+2α
=
=
[S,T] = Pr(S.S_Symb T.T_S_Symb) = α / (IC(S)+2α)
Outline
• Motivation• Our Approach
– Define table importance– Define a metric space over the tables– Clustering: Weighted k-Center
• Experimental Results• Conclusions
04/19/2023 Summarizing Relational Databases 9

Table Similarity
• Distance = 1 - similarity• Goal: define metric distance
– Enables meaningful clustering over relational databases
• Table similarity depends on how join edges and join paths are instantiated
04/19/2023 Summarizing Relational Databases 10
1 123
23
A B
R S
1 123
12
A B
R
S
2233
1 124
23
A B
R S
R.A = S.B
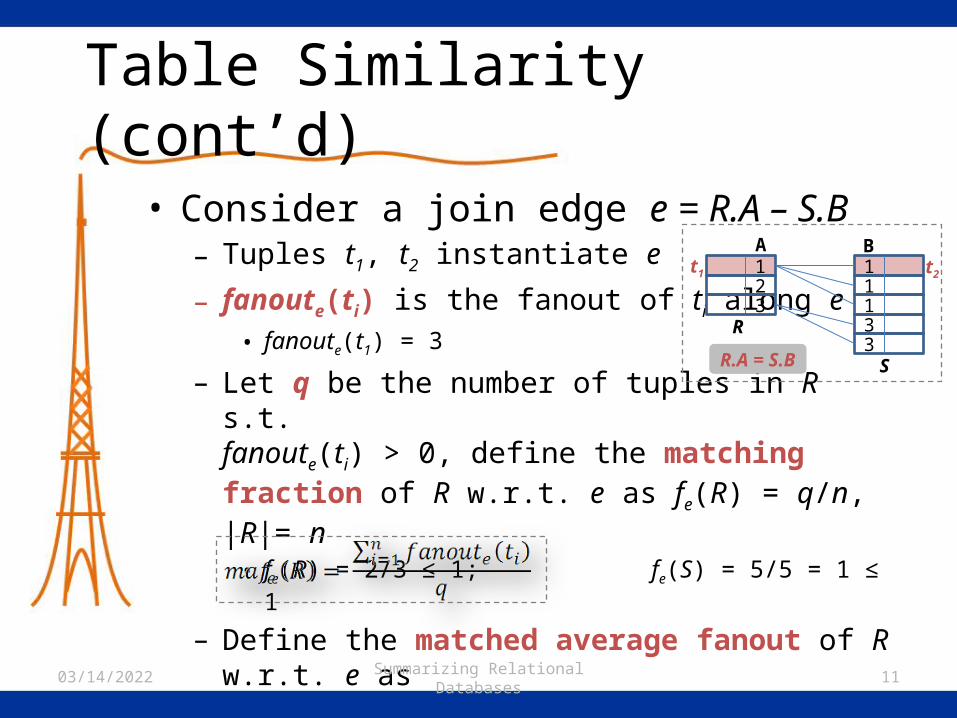
Table Similarity (cont’d)
• Consider a join edge e = R.A – S.B– Tuples t1, t2 instantiate e
– fanoute(ti) is the fanout of ti along e• fanoute(t1) = 3
– Let q be the number of tuples in R s.t. fanoute(ti) > 0, define the matching fraction of R w.r.t. e as fe(R) = q/n, |R|= n
• fe(R) = 2/3 ≤ 1; fe(S) = 5/5 = 1 ≤ 1
– Define the matched average fanout of R w.r.t. e as
• mafe(R) = (3+2)/2 = 2.5 ≥ 1; mafe(S) = 5/5 = 1 ≥ 1
04/19/2023 Summarizing Relational Databases 11
1 123
1133
A B
R
S
t1 t2
R.A = S.B

Table Similarity (cont’d)
04/19/2023 Summarizing Relational Databases 12
1 123
23
A B
R S
1 124
23
A B
R S
e: R.A = S.B
fe(R) = fe(S) =1 fe(R) = fe(S) =2/3
1 123
23
A B
R S
1 123
12
A B
R
S
e: R.A = S.B
2233
mafe(R) = mafe(S) =1
mafe(R) = 7/3mafe(S) =1
– Property 2: Inverse proportional to the matched average
fanouts mafe(R) and mafe(S)
• The similarity of tables R and S (w.r.t. e(R,S)) must satisfy: – Property 1: Proportional to the matching fractions fe(R)
and fe(S)– Property 2: Inverse proportional to the matched average
fanouts mafe(R) and mafe(S)
• Define the strength of tables R and S (w.r.t. e(R,S)) as
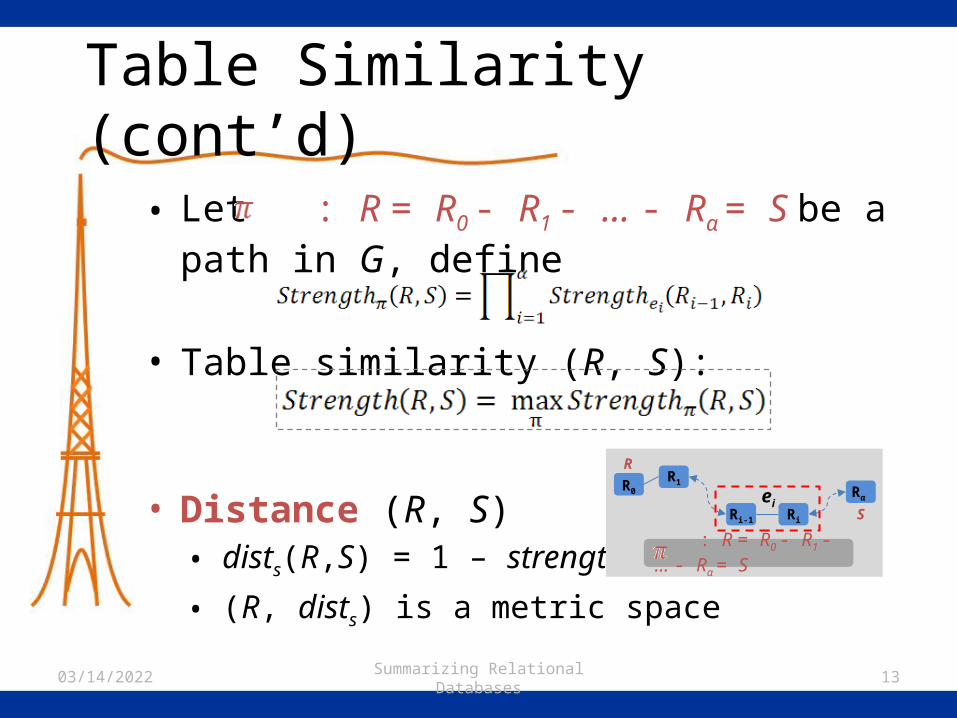
Table Similarity (cont’d)
• Let : R = R0 - R1 - … - Rα = S be a path in G, define
• Table similarity (R, S):
• Distance (R, S)• dists(R,S) = 1 – strength(R,S)
• (R, dists) is a metric space
04/19/2023 Summarizing Relational Databases 13
R0R1
Ri-1 Ri
Rα
R
S
: R = R0 - R1 - … - Rα = S
ei
Outline
• Motivation• Our Approach
– Define table importance– Define a metric space over the tables– Clustering: Weighted k-Center
• Experimental Results• Conclusions
04/19/2023 Summarizing Relational Databases 14

Clustering: Weighted k-Center
• Clustering Criteria:– Minimize the maximum distance between a cluster
center and a table in that cluster– Take table importance into consideration, avoid
grouping top important tables into one cluster
• Weighted k-Center clustering– Weights: table importance– Given k clusters C = {C1, C2, …, Ck}, minimize
– NP-Hard
04/19/2023 Summarizing Relational Databases 15

Weighted k-Center: Greedy Approximation Algorithm
04/19/2023 Summarizing Relational Databases 16
Start with one cluster, whose center is the top-1 important table.
Iteratively chooses the table Ri whose weighted distancefrom its cluster center is largest, and creates a new cluster with Ri as its center.
All tables that are closer to Ri than to their currentcluster center are reassigned to cluster Ci.

Outline
• Motivation• Our Approach
– Define table importance– Define a metric space over the tables– Clustering: Weighted k-Center
• Experimental Results• Conclusions
04/19/2023 Summarizing Relational Databases 17

Experimental Results
• Validate the proposed three components in our approach– Model for table importance IE
– Distance function dists – Clustering: Weighted k-Center
• Other methods
04/19/2023 Summarizing Relational Databases 18
Entropy-based
Strength-based
Table Importance
IE
IC
Distancedists
distc
distp
ClusteringWeighted k-Center
Balanced-Summary
[1] C.Yu and H.V.Jagadish. Schema summarization. VLDB 2006.[2] H.Tong, C.Faloutsos and Y.Koren. Fast direction-aware proximity for graph mining. KDD 2007.
[1]
[2]
distc = 1 – coverage
Ic: Cardinality-initialized
distp = 1 – proximity[1][1]
Experimental Results (cont’d)
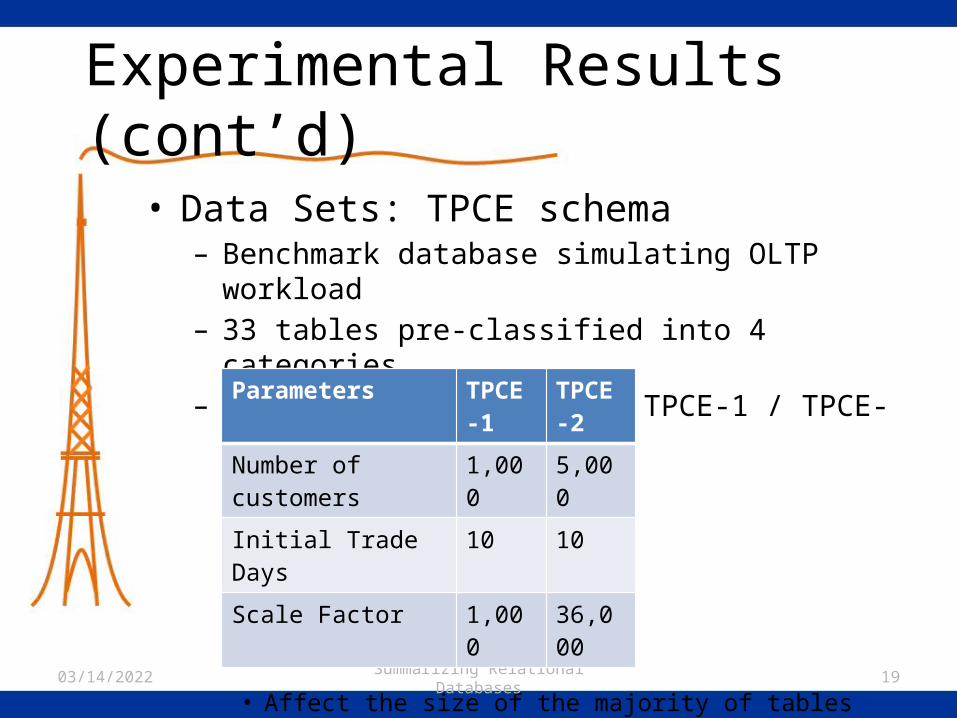
• Data Sets: TPCE schema– Benchmark database simulating OLTP workload– 33 tables pre-classified into 4 categories– Two database instances: TPCE-1 / TPCE-2
• Affect the size of the majority of tables• Affect Pr(R.AS.B), strength(R,S) for most pairs and mafe for 1/3
of edges
04/19/2023 Summarizing Relational Databases 19
Parameters TPCE-1 TPCE-2
Number of customers 1,000 5,000
Initial Trade Days 10 10
Scale Factor 1,000 36,000

04/19/2023 Summarizing Relational Databases 20
TPCE

Table Importance
• Comparison of IE and IC models
04/19/2023 Summarizing Relational Databases 21
Top-5 Important Tables in IE and their ranks in IC
Top-5 Important Tables in IC and their ranks in IE
IE more accurate than IC

Table Importance (cont’d)
• Consistency of IE and IC models
04/19/2023 Summarizing Relational Databases 22
Top-7 Important Tables in IE and IC
for TPCE-1 and TPCE-2
IE more consistent than IC
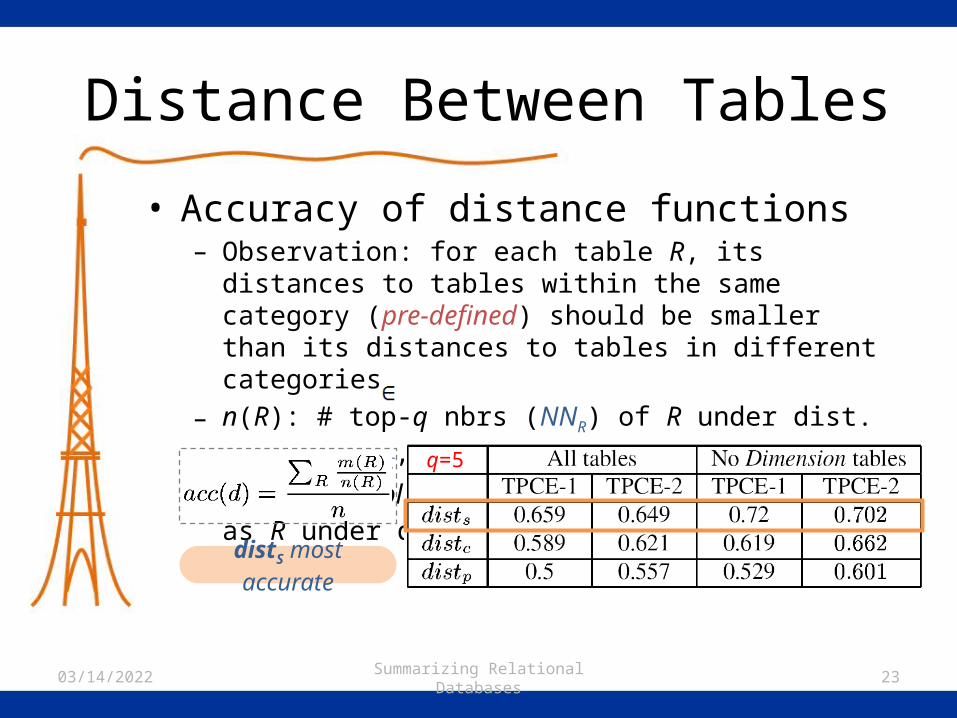
Distance Between Tables
• Accuracy of distance functions– Observation: for each table R, its distances to tables within
the same category (pre-defined) should be smaller than its distances to tables in different categories
– n(R): # top-q nbrs (NNR) of R under dist. d (distS, distC, distP)
– m(R): # tables ( NNR) in the same category as R under dist. d– Calculate:
04/19/2023 Summarizing Relational Databases 23
distS most accurate
q=5

Clustering Algorithms
• Accuracy of a summary– TPCE is pre-classified into 4
categories: Broker, Customer, Market and Dimension
– m(Ci): # tables in Ci with the
same category as center(Ci)
– Given a summary C = {C1, C2, …, Ck}, calculate
– Balanced-Summary (BS) [1] – Weighted k-Center (WKC)
04/19/2023 Summarizing Relational Databases 24
Based on IC and distC (coverage)
WKC is more accurate

Summarization Algorithms
• Weighted k-Center over three distance functions
04/19/2023 Summarizing Relational Databases 25
Summary Accuracy
distS: most balanced and accurate

Related Work
• C. Yu and H. V. Jagadish. Schema summarization. VLDB’06
• H.Tong, C.Faloutsos and Y.Koren. Fast direction-aware proximity for graph mining. KDD’07
• W. Wu, B. Reinwald, Y. Sismanis and R. Manjrekar. Discovering topical structures of databases. SIGMOD’08
04/19/2023 Summarizing Relational Databases 26

Conclusions
• We proposed a novel approach for summarizing relational schemas– A new model for table importance– A metric distance over schema tables– A summarization algorithm
04/19/2023 Summarizing Relational Databases 27
Q&A