Embed Size (px)
Citation preview
C O N S O L I D A T E D F I N A N C I A L S T A T E M E N T S A N D S U P P L E M E N T A R Y I N F O R M A T I O N
Summa Health System and Subsidiaries Years Ended December 31, 2013 and 2012 With Report of Independent Auditors
Ernst & Young LLP
1401-1180831
Summa Health System and Subsidiaries
Consolidated Financial Statements and Supplementary Information
Years Ended December 31, 2013 and 2012
Contents
Report of Independent Auditors.......................................................................................................1
Consolidated Financial Statements
Consolidated Statements of Financial Position................................................................................2 Consolidated Statements of Operations and Changes in Net Assets ...............................................4 Consolidated Statements of Net Assets ...........................................................................................5 Consolidated Statements of Cash Flows ..........................................................................................6 Notes to Consolidated Financial Statements....................................................................................7
Supplementary Information
Report of Independent Auditors on Supplementary Information ..................................................60 Consolidating Statement of Financial Position – December 31, 2013 ..........................................61 Consolidating Statement of Operations – Year Ended December 31, 2013 ..................................63 Consolidating Statement of Financial Position – December 31, 2012 ..........................................64 Consolidating Statement of Operations – Year Ended December 31, 2012 ..................................66
1401-1180831 1
Report of Independent Auditors
The Board of Directors Summa Health System
We have audited the accompanying consolidated financial statements of Summa Health System and Subsidiaries, which comprise the consolidated statements of financial position as of December 31, 2013 and 2012, and the related consolidated statements of operations and changes in net assets, and cash flows for the years then ended, and the related notes to the consolidated financial statements.
Management’s Responsibility for the Financial Statements
Management is responsible for the preparation and fair presentation of these financial statements in conformity with U.S. generally accepted accounting principles; this includes the design, implementation, and maintenance of internal control relevant to the preparation and fair presentation of financial statements that are free of material misstatement, whether due to fraud or error.
Auditor’s Responsibility
Our responsibility is to express an opinion on these financial statements based on our audits. We conducted our audits in accordance with auditing standards generally accepted in the United States. Those standards require that we plan and perform the audit to obtain reasonable assurance about whether the financial statements are free of material misstatement.
An audit involves performing procedures to obtain audit evidence about the amounts and disclosures in the financial statements. The procedures selected depend on the auditor’s judgment, including the assessment of the risks of material misstatement of the financial statements, whether due to fraud or error. In making those risk assessments, the auditor considers internal control relevant to the entity’s preparation and fair presentation of the financial statements in order to design audit procedures that are appropriate in the circumstances, but not for the purpose of expressing an opinion on the effectiveness of the entity’s internal control. Accordingly, we express no such opinion. An audit also includes evaluating the appropriateness of accounting policies used and the reasonableness of significant accounting estimates made by management, as well as evaluating the overall presentation of the financial statements.
We believe that the audit evidence we have obtained is sufficient and appropriate to provide a basis for our audit opinion.
Opinion
In our opinion, the financial statements referred to above present fairly, in all material respects, the consolidated financial position of Summa Health System and Subsidiaries at December 31, 2013 and 2012, and the consolidated results of their operations and their cash flows for the years then ended in conformity with U.S. generally accepted accounting principles.
April 18, 2014
A member firm of Ernst & Young Global Limited
Ernst & Young LLP Suite 1200 50 South Main Street Akron, OH 44308
Tel: +1 330 255 5800 Fax: +1 330 255 5830 ey.com
2 1401-1180831
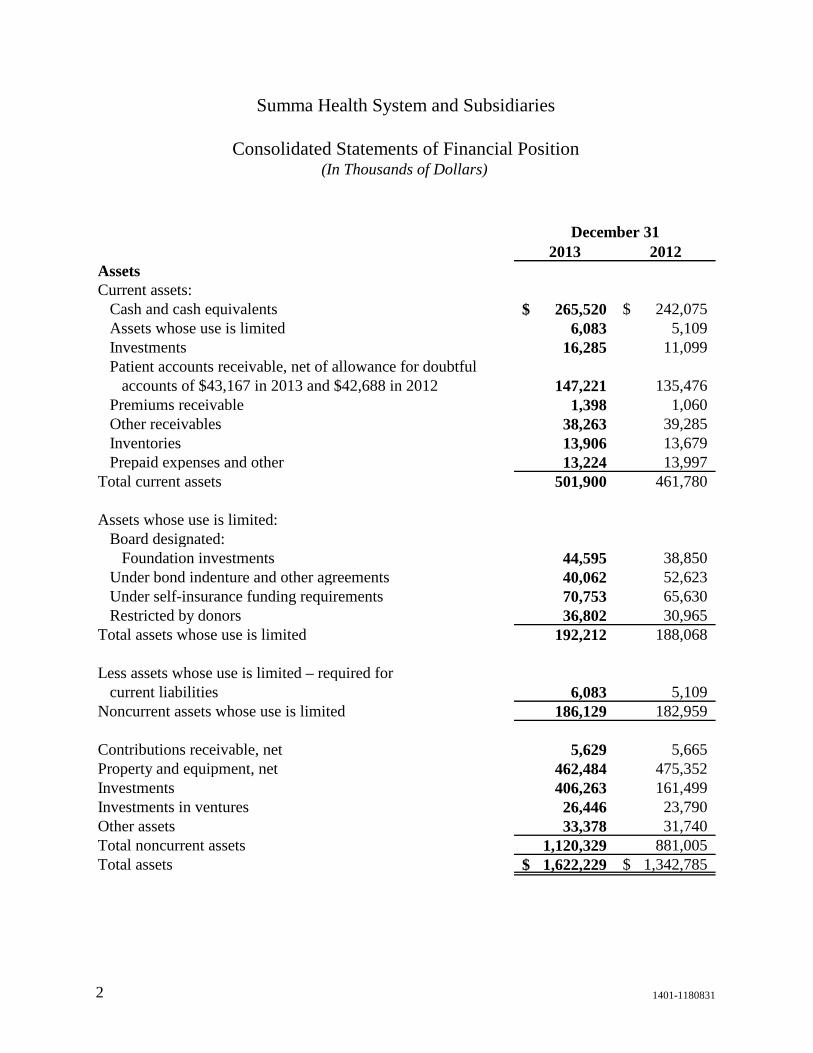
2013 2012Assets Current assets:
Cash and cash equivalents 265,520$ 242,075$ Assets whose use is limited 6,083 5,109 Investments 16,285 11,099 Patient accounts receivable, net of allowance for doubtful
accounts of $43,167 in 2013 and $42,688 in 2012 147,221 135,476 Premiums receivable 1,398 1,060 Other receivables 38,263 39,285 Inventories 13,906 13,679 Prepaid expenses and other 13,224 13,997
Total current assets 501,900 461,780 Assets whose use is limited:
Board designated: Foundation investments 44,595 38,850
Under bond indenture and other agreements 40,062 52,623 Under self-insurance funding requirements 70,753 65,630 Restricted by donors 36,802 30,965
Total assets whose use is limited 192,212 188,068
Less assets whose use is limited – required for current liabilities 6,083 5,109
Noncurrent assets whose use is limited 186,129 182,959 Contributions receivable, net 5,629 5,665 Property and equipment, net 462,484 475,352 Investments 406,263 161,499 Investments in ventures 26,446 23,790 Other assets 33,378 31,740 Total noncurrent assets 1,120,329 881,005 Total assets 1,622,229$ 1,342,785$
December 31
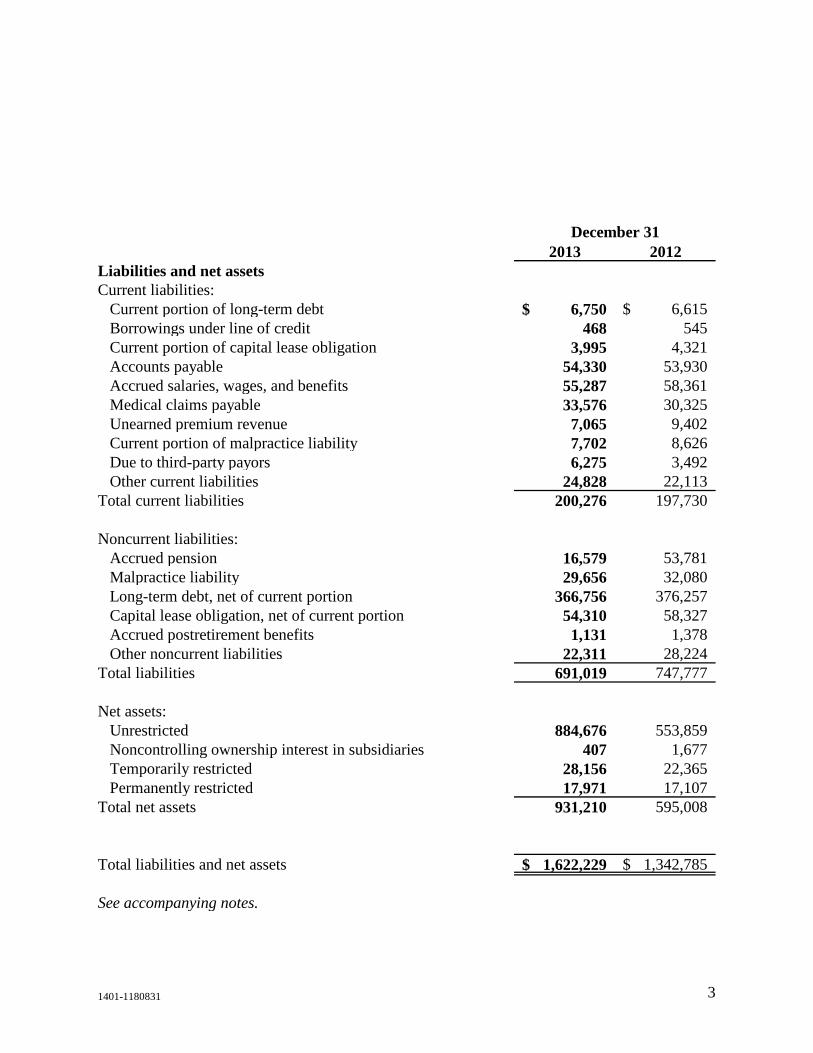
Summa Health System and Subsidiaries
Consolidated Statements of Financial Position(In Thousands of Dollars)
1401-1180831 3
2013 2012Liabilities and net assets Current liabilities:
Current portion of long-term debt 6,750$ 6,615$ Borrowings under line of credit 468 545 Current portion of capital lease obligation 3,995 4,321 Accounts payable 54,330 53,930 Accrued salaries, wages, and benefits 55,287 58,361 Medical claims payable 33,576 30,325 Unearned premium revenue 7,065 9,402 Current portion of malpractice liability 7,702 8,626 Due to third-party payors 6,275 3,492 Other current liabilities 24,828 22,113
Total current liabilities 200,276 197,730 Noncurrent liabilities:
Accrued pension 16,579 53,781 Malpractice liability 29,656 32,080 Long-term debt, net of current portion 366,756 376,257 Capital lease obligation, net of current portion 54,310 58,327 Accrued postretirement benefits 1,131 1,378 Other noncurrent liabilities 22,311 28,224
Total liabilities 691,019 747,777 Net assets:
Unrestricted 884,676 553,859 Noncontrolling ownership interest in subsidiaries 407 1,677 Temporarily restricted 28,156 22,365 Permanently restricted 17,971 17,107
Total net assets 931,210 595,008
Total liabilities and net assets 1,622,229$ 1,342,785$ See accompanying notes.
December 31
1401-1180831 4
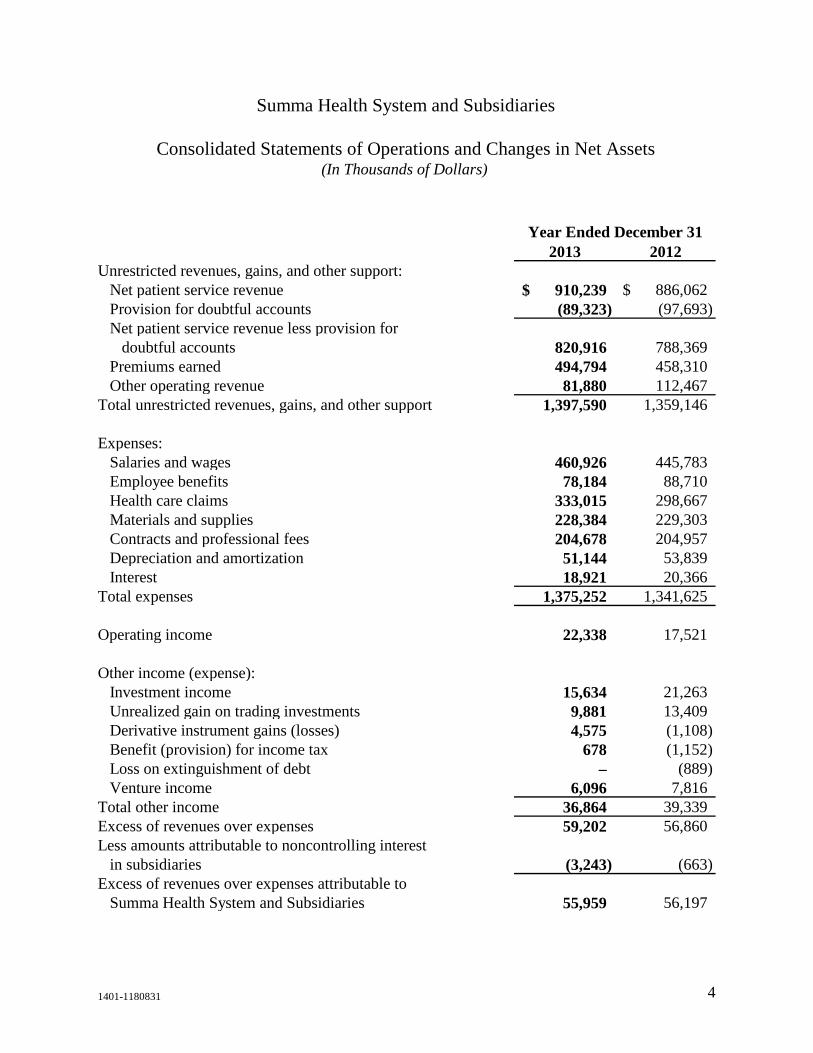
2013 2012Unrestricted revenues, gains, and other support:
Net patient service revenue 910,239$ 886,062$ Provision for doubtful accounts (89,323) (97,693) Net patient service revenue less provision for
doubtful accounts 820,916 788,369 Premiums earned 494,794 458,310 Other operating revenue 81,880 112,467
Total unrestricted revenues, gains, and other support 1,397,590 1,359,146
Expenses:Salaries and wages 460,926 445,783 Employee benefits 78,184 88,710 Health care claims 333,015 298,667 Materials and supplies 228,384 229,303 Contracts and professional fees 204,678 204,957 Depreciation and amortization 51,144 53,839 Interest 18,921 20,366
Total expenses 1,375,252 1,341,625
Operating income 22,338 17,521
Other income (expense):Investment income 15,634 21,263 Unrealized gain on trading investments 9,881 13,409 Derivative instrument gains (losses) 4,575 (1,108) Benefit (provision) for income tax 678 (1,152) Loss on extinguishment of debt – (889) Venture income 6,096 7,816
Total other income 36,864 39,339 Excess of revenues over expenses 59,202 56,860 Less amounts attributable to noncontrolling interest
in subsidiaries (3,243) (663) Excess of revenues over expenses attributable to
Summa Health System and Subsidiaries 55,959 56,197
Summa Health System and Subsidiaries
Consolidated Statements of Operations and Changes in Net Assets
Year Ended December 31
(In Thousands of Dollars)
1401-1180831 5
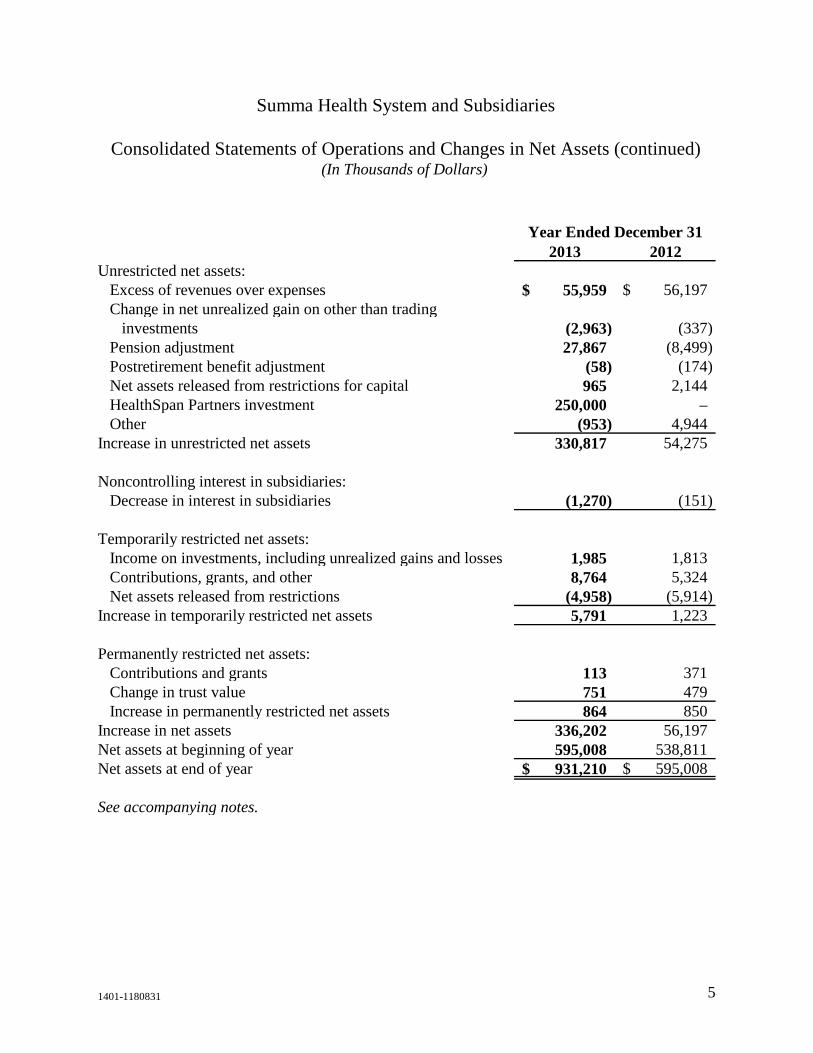
2013 2012Unrestricted net assets:
Excess of revenues over expenses 55,959$ 56,197$ Change in net unrealized gain on other than trading
investments (2,963) (337) Pension adjustment 27,867 (8,499) Postretirement benefit adjustment (58) (174) Net assets released from restrictions for capital 965 2,144 HealthSpan Partners investment 250,000 – Other (953) 4,944
Increase in unrestricted net assets 330,817 54,275
Noncontrolling interest in subsidiaries:Decrease in interest in subsidiaries (1,270) (151)
Temporarily restricted net assets:Income on investments, including unrealized gains and losses 1,985 1,813 Contributions, grants, and other 8,764 5,324 Net assets released from restrictions (4,958) (5,914)
Increase in temporarily restricted net assets 5,791 1,223
Permanently restricted net assets:Contributions and grants 113 371 Change in trust value 751 479 Increase in permanently restricted net assets 864 850
Increase in net assets 336,202 56,197 Net assets at beginning of year 595,008 538,811 Net assets at end of year 931,210$ 595,008$
See accompanying notes.
Year Ended December 31
Summa Health System and Subsidiaries
Consolidated Statements of Operations and Changes in Net Assets (continued)(In Thousands of Dollars)
1401-1180831 6
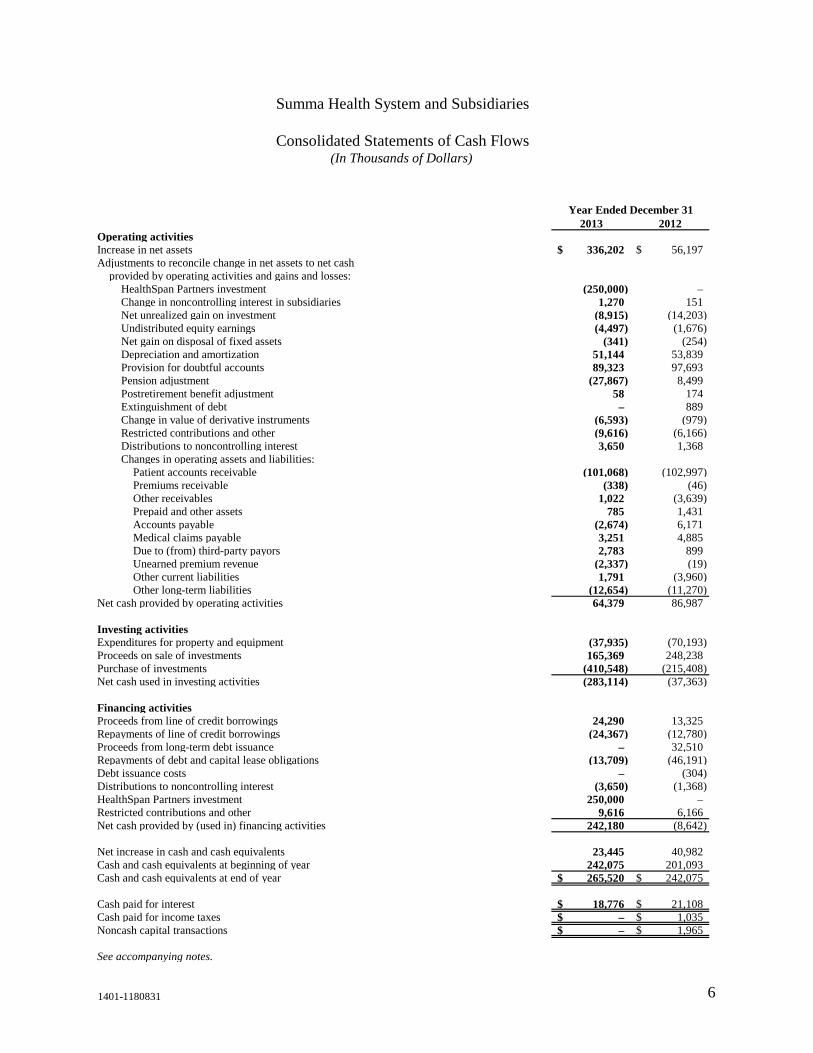
2013 2012Operating activitiesIncrease in net assets 336,202$ 56,197$ Adjustments to reconcile change in net assets to net cash
provided by operating activities and gains and losses:HealthSpan Partners investment (250,000) – Change in noncontrolling interest in subsidiaries 1,270 151 Net unrealized gain on investment (8,915) (14,203) Undistributed equity earnings (4,497) (1,676) Net gain on disposal of fixed assets (341) (254) Depreciation and amortization 51,144 53,839 Provision for doubtful accounts 89,323 97,693 Pension adjustment (27,867) 8,499 Postretirement benefit adjustment 58 174 Extinguishment of debt – 889 Change in value of derivative instruments (6,593) (979) Restricted contributions and other (9,616) (6,166) Distributions to noncontrolling interest 3,650 1,368 Changes in operating assets and liabilities:
Patient accounts receivable (101,068) (102,997) Premiums receivable (338) (46) Other receivables 1,022 (3,639) Prepaid and other assets 785 1,431 Accounts payable (2,674) 6,171 Medical claims payable 3,251 4,885 Due to (from) third-party payors 2,783 899 Unearned premium revenue (2,337) (19) Other current liabilities 1,791 (3,960) Other long-term liabilities (12,654) (11,270)
Net cash provided by operating activities 64,379 86,987
Investing activitiesExpenditures for property and equipment (37,935) (70,193) Proceeds on sale of investments 165,369 248,238 Purchase of investments (410,548) (215,408) Net cash used in investing activities (283,114) (37,363)
Financing activitiesProceeds from line of credit borrowings 24,290 13,325 Repayments of line of credit borrowings (24,367) (12,780) Proceeds from long-term debt issuance – 32,510 Repayments of debt and capital lease obligations (13,709) (46,191) Debt issuance costs – (304) Distributions to noncontrolling interest (3,650) (1,368) HealthSpan Partners investment 250,000 – Restricted contributions and other 9,616 6,166 Net cash provided by (used in) financing activities 242,180 (8,642)
Net increase in cash and cash equivalents 23,445 40,982 Cash and cash equivalents at beginning of year 242,075 201,093 Cash and cash equivalents at end of year 265,520$ 242,075$
Cash paid for interest 18,776$ 21,108$ Cash paid for income taxes –$ 1,035$ Noncash capital transactions –$ 1,965$
See accompanying notes.
Summa Health System and Subsidiaries
Consolidated Statements of Cash Flows(In Thousands of Dollars)
Year Ended December 31
1401-1180831 7
Summa Health System and Subsidiaries
Notes to Consolidated Financial Statements (In Thousands of Dollars)
December 31, 2013 and 2012
1. Organization and Basis of Presentation
Summa Health System and Subsidiaries (the System), located in Akron, Ohio, is a nonprofit integrated health care delivery system and is a provider of health services and health insurance to communities in Northeast Ohio. Summa Health System (SHS) serves as the parent of Summa Akron City and St. Thomas Hospitals (SAC/STH), Summa Insurance Company, Inc. and Subsidiaries (SIC), Summa Health Network (SHN), Summa Physicians, Inc. (SPI), Summa Cuyahoga Falls General Hospital (SCFGH), Summa Barberton Hospital (SBH), Summa Wadsworth Rittman Hospital (SWH), Middlebury Assurance Company (MAC), Summa Enterprise Group (SEG), Summa Foundation (SF), Summa Insurance Agency (SIA), Summa Integrated Services Organization (SISO), Summa Management Services Organization (SMSO) and Summa Health System Corporation and subsidiaries (SHSC). SHSC is the parent of an affiliated group of for-profit corporations, including SIC. SHS has a wholly owned, nonprofit, federally taxable subsidiary, Summa Accountable Care Organization (d/b/a NewHealth Collaborative (NHC)). NHC integrates and aligns health care providers to simultaneously improve quality, satisfaction, and efficiency and reduce the total cost of care.
SHS has an 80% ownership interest in Ohio Health Choice, Inc. (OHC). SHS has a 52% controlling interest in a for-profit rehabilitation hospital, Summa Rehab Hospital, LLC (SRH). The System controls OHC and SRH, and thus these entities are included on a consolidated basis, with noncontrolling interests considered.
In September 2013, the System finalized a partnership with HealthSpan Partners (HSP), a secular, auxiliary organization of Catholic Health Partners whereby HSP became a 30% (minority) owner of the System by investing $250 million in conjunction with a Definitive Agreement. HSP does not manage or control the operations of the System.
Basis of Presentation
The consolidated financial statements include the accounts of the System as described above. All significant intercompany balances and transactions have been eliminated in consolidation.
Summa Health System and Subsidiaries
Notes to Consolidated Financial Statements (continued) (In Thousands of Dollars)
1401-1180831 8
2. Accounting Policies
Income Taxes
The System and most of its subsidiaries are not-for-profit corporations as described in Section 501(c)(3) of the Internal Revenue Code (Code) and are exempt from federal income taxes pursuant to Section 501(a) of the Code. The System also has certain subsidiaries that are taxable for federal income tax purposes. SIC, together with affiliates of SHSC, file a consolidated federal income tax return in accordance with a tax-sharing agreement dated January 1, 2010. The entities utilize a consolidated approach to the allocation of federal income taxes, whereas SHSC’s tax-sharing agreement with its subsidiaries allows it to make certain code elections in its consolidated federal tax return. In the event such code elections are made, any benefit or liability is the responsibility of SHSC and is accrued and paid by the participating subsidiaries. SIC is not subject to state income taxes as it is licensed as a health insurance company under Chapter 1751 of the Ohio Revised Code.
Deferred tax assets and liabilities are recognized for the future tax consequences attributable to differences between the financial statement carrying amounts of existing assets and liabilities and the respective tax basis and operating loss and tax credit carryforwards. Deferred tax assets and liabilities are measured using enacted tax rates expected to apply to taxable income in the years in which those temporary differences are expected to be recovered or settled. The effect on deferred tax assets and liabilities of a change in tax rates is recognized in income in the period that includes the enactment date.
The System recognizes interest income, interest expense, and penalties related to uncertain tax positions within the provision for income tax.
Use of Estimates
The preparation of financial statements in conformity with accounting principles generally accepted in the United States requires management to make estimates and assumptions that affect the amounts reported in the consolidated financial statements. Actual results could differ from those estimates.
Summa Health System and Subsidiaries
Notes to Consolidated Financial Statements (continued) (In Thousands of Dollars)
1401-1180831 9
2. Accounting Policies (continued)
Cash and Cash Equivalents
The System considers all highly liquid investments purchased with original maturities of three months or less, excluding amounts limited as to use by donor or board designation or other arrangements under various trust agreements, to be cash and cash equivalents.
Investments and Investment Income
Investments in equity securities with readily determinable fair values and all investments in debt securities are measured at fair value in the accompanying consolidated statements of financial position.
Investment income, including interest, dividends, and unrealized and realized gains and losses on investments classified as trading, as well as alternative investments, are reported as other income (expense) in the accompanying consolidated statements of operations and changes in net assets, unless designated by donor restrictions in which case the amounts are classified as increases in temporarily restricted net assets. Realized gains and losses are determined by comparison of the actual cost to the proceeds at the time of disposition. Realized gains and losses are recognized using the average cost method. Unrealized gains and losses on other-than-trading investments are excluded from the determination of excess of revenues over expenses unless the unrealized losses are considered other-than-temporary. Earnings on permanently restricted investments are recorded as investment income in temporarily restricted net assets and subsequently used in accordance with the donor’s designation.
Management regularly reviews its investment portfolio to evaluate the necessity of recording other-than-temporary impairments for declines in the fair value of other-than-trading investments. A number of criteria are considered during this process, including, but not limited to, the current fair value as compared to amortized cost or cost, as appropriate, of the investment, the length of time the investment’s fair value has been below amortized cost or cost, as appropriate, and by how much, specific credit issues related to the issuer, current economic conditions and management’s ability and intent to hold the securities until maturity or recovery. Impairments are included in realized gains and losses in investment income. Based on management’s evaluation and the System’s ability and intent to hold these investments for a reasonable period of time sufficient for a recovery of fair value, there were no other-than-temporary impairment losses recorded in 2013 and 2012.
Summa Health System and Subsidiaries
Notes to Consolidated Financial Statements (continued) (In Thousands of Dollars)
1401-1180831 10
2. Accounting Policies (continued)
Alternative Investments
Alternative investments include private equity funds that invest in fund of funds and real estate. The System’s alternative investments are reported using the equity method of accounting based on net asset value provided by the respective partnership. Generally, the equity method investment balance of the System’s holding in alternative investments reflects net contributions to the partnerships and the System’s share of the realized and unrealized investment income and expenses. The equity value of the System’s alternative investments are not readily determinable and may include short sales on securities and trading in future contracts, options, foreign currency contracts, other derivative instruments and private equity investments. The recorded value is based on valuations provided by the general partner and are based on historical cost, appraisals or other valuation estimates that require varying degrees of judgment. Alternative investments can be divested only at specified times in accordance with the terms of the partnership agreements. Because these investments are not readily marketable, their estimated value is subject to uncertainty and, therefore, may differ from the value that would have been used had a ready market for such investments existed. The System’s risk is limited to its carrying value.
Fair Value Measurements
Fair value measurements are defined as the price that would be received to sell an asset or paid to transfer a liability in an orderly transaction between market participants at the measurement date. Authoritative guidance establishes a three-level hierarchy for fair value measurements based upon the transparency of inputs to the valuation of an asset or liability as of the measurement date.
The framework for measuring fair value is comprised of a three-level hierarchy for disclosure of fair value measurements. The valuation hierarchy is based upon the transparency of inputs to the valuation of an asset or liability as of the measurement date. The three levels are defined as follows:
• Level 1 – inputs to the valuation methodology are quoted prices (unadjusted) for identical assets or liabilities in active markets.
Summa Health System and Subsidiaries
Notes to Consolidated Financial Statements (continued) (In Thousands of Dollars)
1401-1180831 11
2. Accounting Policies (continued)
• Level 2 – inputs to the valuation methodology include quoted prices for similar assets or liabilities in active markets, and inputs that are observable for the asset or liability, either directly or indirectly, for substantially the full term of the financial instrument.
• Level 3 – inputs to the valuation methodology are unobservable and significant to the fair value measurement.
A financial instrument’s categorization within the valuation hierarchy is based upon the lowest level of input that is significant to the fair value measurement.
Inventories
Inventories consist principally of pharmaceuticals and operating supplies. Operating supplies are stated at the lower of cost (determined by the first-in, first-out method) or market. Pharmaceuticals are stated at average cost.
Assets Whose Use Is Limited
Assets whose use is limited includes assets designated for the Foundation, bond indenture and other agreements, self-insurance and assets restricted by donors. Amounts required to meet current liabilities of the System have been classified as current assets in the accompanying consolidated statements of financial position.
Property and Equipment
Property and equipment are reported at cost if purchased or fair value at date received if donated. Maintenance and repairs are charged to expense as incurred. Renewals and betterments, which extend the useful lives of assets, are capitalized. At the time property and equipment are retired or otherwise disposed of, the cost thereof and the accumulated depreciation are adjusted, and any profit or loss on disposition is credited or charged to operations.
Depreciation, including amortization of capital leased assets, of property and equipment is provided on the straight-line basis. Depreciation is based on the estimated useful lives of the assets. Building and improvements are depreciated over estimated useful lives ranging generally from 5 to 40 years. Estimated useful lives of equipment vary generally from 3 to 15 years.
Summa Health System and Subsidiaries
Notes to Consolidated Financial Statements (continued) (In Thousands of Dollars)
1401-1180831 12
2. Accounting Policies (continued)
Amortization of equipment capitalized under lease obligations is based on the term of the lease or estimated useful life of the asset, whichever is shorter.
Interest cost incurred on borrowed funds during the period of construction of a long-lived asset is capitalized as a component of the cost of constructing or acquiring those assets. The System recorded $847 and $1,323 of capitalized interest during 2013 and 2012, respectively.
Impairment of Long-Lived Assets
The System evaluates the recoverability of long-lived assets and the related estimated remaining lives at each consolidated statement of financial position date. The System records an impairment charge whenever events or changes in circumstances indicate that the amount may not be recoverable or the useful life has changed. In 2012, the System recorded an impairment charge of $4,916 as a component of depreciation and amortization expense in the consolidated statements of operations and changes in net assets related to a change in the scope of a capital project. The System did not record impairment charges in 2013.
Asset Retirement Obligations
The fair value of legal obligations to perform asset retirement obligations are estimated and recorded. The System recognizes a liability for the fair value of a conditional asset retirement obligation if the fair value can be reasonably estimated.
Bond Issuance Costs
Financing and issuance costs related to long-term debt are capitalized in long-term other assets in the accompanying consolidated statements of financial position and amortized over the period during which the debt is outstanding using the straight-line method. Unamortized bond issuance costs at December 31, 2013 and 2012, are $6,194 and $6,443, respectively.
Malpractice Costs
The System manages its professional and general liability insurance program through a captive insurance arrangement.
Summa Health System and Subsidiaries
Notes to Consolidated Financial Statements (continued) (In Thousands of Dollars)
1401-1180831 13
2. Accounting Policies (continued)
In the ordinary course of business, professional and general liability claims have been asserted against the System by various claimants. These claims are in various stages of processing or, in certain instances, are in litigation. In addition, there are known incidents, and there also may be unknown incidents, which may result in the assertion of additional claims. The System has accrued its best undiscounted estimate of both asserted and unasserted claims based on actuarially determined amounts. These estimates are subject to the effects of trends in loss severity and frequency and the ultimate settlement of professional and general liability claims may vary significantly from the estimated amounts.
The System owns MAC, a wholly owned captive insurance subsidiary, to cover the majority of its professional and general liability. The System also maintains a malpractice trust fund totaling $13,379 and $12,878 at December 31, 2013 and 2012, respectively. MAC was incorporated as an exempted company under the Companies Law of the Cayman Islands on February 26, 2003, and holds an Unrestricted Class ‘B’ Insurer’s license under Section 4(2) of the Cayman Islands Insurance Law. This license allows MAC to transact insurance business other than domestic business from within the Cayman Islands.
The System purchases excess professional and general liability insurance coverage from a third-party insurer for $50,000 over the self-insurance amount of $8,000 per occurrence and $24,000 in aggregate. Prior to June 1, 2012, the professional and general liability insurance coverage limit was $50,000 over the self-insurance amount of $7,500 per occurrence and $24,000 in aggregate.
The excess coverage does not provide coverage for claims for punitive damages; therefore, the System remains fully liable for such potential losses. Annual costs associated with estimated malpractice costs are charged to operations based upon actual and estimated claims. The portion estimated to be paid during the next year is included in current liabilities. The estimate for incurred but not reported self-insured claims is based on actuarial projections of costs using historical claims paid data. Estimates are continually monitored and reviewed and, as settlements are made or estimates adjusted, differences are reflected in current operations. Given the inherent variability of such estimates, the actual liability could differ significantly from the amounts provided. While the ultimate payments for self-insured claims are dependent on future developments, management is of the opinion that the reserve for self-insured risks is adequate.
Summa Health System and Subsidiaries
Notes to Consolidated Financial Statements (continued) (In Thousands of Dollars)
1401-1180831 14
2. Accounting Policies (continued)
Net Patient Service Revenue and Patient Accounts Receivable
The System grants equal access for health services to all members of the community regardless of financial status. Net patient service revenue is reported at the estimated net realizable amounts from patients, third-party payors, public programs, or others. It is the System’s policy to bill for, and pursue collection of, all services rendered. An estimated provision for doubtful accounts is recorded that results in net patient service revenue being reported at the net amount expected to be received. The System has determined, based on an assessment at the consolidated level, that patient service revenue is primarily recorded prior to assessing the patient’s ability to pay and as such, the entire provision for doubtful accounts related to patient revenue is recorded as a deduction from patient service revenue in the accompanying consolidated statements of operations and changes in net assets. At the point in time that a charge is believed to be uncollectible, the related receivable is written off as a doubtful account.
The System maintains an allowance for doubtful accounts based on the expected collectibility of patient accounts receivable. The provision for doubtful accounts is based upon management’s assessment of historical and expected net collections considering historical business and economic conditions, trends in health care coverages, and other collection indicators. Periodically through the year, management assesses the adequacy of the allowance for doubtful accounts based upon historical write-off experience by payor category. The results of this review are then used to make modifications to the provision for doubtful accounts to establish an appropriate allowance for the uncollectible receivables. After satisfaction of amounts due from insurance, the System follows established guidelines for placing certain past due patient balances with collection agencies, subject to the terms of certain restrictions on collection efforts as determined by the System.
Estimates of retroactive adjustments under reimbursement agreements with third-party payors are accrued in the period the related services are rendered and adjusted in future periods as adjustments become known or as years are no longer subject to audits, reviews, and investigations.
Summa Health System and Subsidiaries
Notes to Consolidated Financial Statements (continued) (In Thousands of Dollars)
1401-1180831 15
2. Accounting Policies (continued)
Charity Care
The System provides care to all patients, regardless of their ability to pay, which includes patients who qualify for charity services under the System’s charity care policy. Charity services are defined as those for which patients have the obligation and willingness to pay but do not have the ability to do so. The cost of charity care provided in 2013 and 2012 was $33,147 and $38,262, respectively. The System estimated these costs by calculating a ratio of gross charges associated with charity patients to gross charges to all patients then applying that ratio to net costs of providing care.
The System participates in the Hospital Care Assurance Program (HCAP). Ohio created HCAP to financially support those hospitals that service a disproportionate share of low-income patients unable to pay for care. HCAP assists in funding medically necessary hospital services for patients whose family income is at or below the federal poverty level, which includes Medicaid patients and patients without health insurance. The System recorded HCAP revenues of $9,477 and $9,795 for the years ended December 31, 2013 and 2012, respectively, which is included in net patient service revenue in the accompanying consolidated statements of operations and changes in net assets.
Electronic Health Record Incentive Program
The Centers for Medicare & Medicaid Services (CMS) have implemented provisions of the American Recovery and Reinvestment Act of 2009 that provide incentive payments for the meaningful use of certified electronic health record (EHR) technology. CMS has defined meaningful use as meeting certain objectives and reporting clinical quality measures based on current and updated technology capabilities over predetermined reporting periods as established by CMS. The Medicare EHR incentive program provides annual incentive payments to eligible professionals, acute care hospitals, and critical access hospitals, as defined, that are “meaningful users” of EHR technology. The Medicaid EHR incentive program provides annual incentive payments to eligible professionals and hospitals for efforts to adopt, implement, and meaningfully use certified EHR technology. The System utilizes a grant accounting model to recognize EHR incentive revenues. The System records EHR revenue ratably throughout the incentive reporting period when it is reasonably assured that it will meet the meaningful use objectives for the required reporting period and that the grants will be received. The EHR reporting period for hospitals is based on the federal fiscal year, which runs from October 1
Summa Health System and Subsidiaries
Notes to Consolidated Financial Statements (continued) (In Thousands of Dollars)
1401-1180831 16
2. Accounting Policies (continued)
through September 30. In 2013 and 2012, the System recorded EHR incentive revenues of $7,783 and $10,421, comprised of $6,556 and $8,742 of Medicare revenues and $1,227 and $1,679 of Medicaid revenues, respectively. EHR incentive revenues are included in other operating revenue in the accompanying consolidated statements of operations and changes in net assets. EHR incentive receivables from Medicare, which are included in other current assets on the consolidated statements of financial position, were $4,021 and $741 at December 31, 2013 and 2012, respectively.
Premium Revenue and Receivables
Premiums earned include premiums from employer groups, individuals, and Medicare. Medicare revenue includes premiums based on predetermined prepaid rates under Medicare risk contracts. Premiums are recognized in the month in which the members are entitled to health care services. Premiums collected in advance are deferred and recorded as unearned premium revenue. Premium deficiency losses are recognized when it is probable that expected future claim expenses will exceed future premiums on existing health and other insurance contracts. For purposes of premium deficiency losses, contracts are grouped in a manner consistent with the System’s method of acquiring, servicing, and measuring the profitability of such contracts. The System evaluated the need for a premium deficiency reserve and concluded no reserve was required at December 31, 2013. The System recorded a premium deficiency reserve of $1,100 at December 31, 2012.
Premiums receivable represent amounts due from members but currently uncollected by the System, including employer groups, individuals, and the Medicare programs.
Summa Health System and Subsidiaries
Notes to Consolidated Financial Statements (continued) (In Thousands of Dollars)
1401-1180831 17
2. Accounting Policies (continued)
Health Care Claims Expense and Services Cost Recognition
The cost of health care services is recognized in the period in which services are provided. Health care expenses also include an estimate of the cost of services provided to SIC members by third-party providers, which have been incurred but not reported to SIC. The estimate for incurred but not reported claims is based on actuarial projections of costs using historical paid claims data. Estimates are continually monitored and reviewed and, as settlements are made or estimates adjusted, differences are reflected in current operations. Such estimates are subject to the impact of changes in the regulatory environment and economic conditions. Given the inherent variability of such estimates, the actual liability could differ significantly from the amounts provided. While the ultimate amount of claims paid is dependent on future developments, management is of the opinion that the reserves for claims are a reasonable provision to cover such claims.
Health care costs representing medical services performed by other System entities are eliminated in consolidation.
Activity in medical claims payable is summarized as follows:
Year Ended December 31 2013 2012 Balance at January 1 $ 30,325 $ 25,440
Provision for claims incurred in: Current year 344,449 300,775 Prior years (3,520) 1,661
Total incurred 340,929 302,436 Claims paid related to:
Current year 311,008 270,473 Prior years 26,670 27,078
Total paid 337,678 297,551 Balance at December 31 $ 33,576 $ 30,325
Summa Health System and Subsidiaries
Notes to Consolidated Financial Statements (continued) (In Thousands of Dollars)
1401-1180831 18
2. Accounting Policies (continued)
Reinsurance (Stop-Loss Insurance)
Reinsurance premiums are recorded as a reduction in premiums earned. Reinsurance recoveries are recorded as a reduction of health care claims expense.
Beneficial Interest in Perpetual Trust
The System has received gifts of beneficial interests in trusts held by bank trustees. Under the terms of the trusts, the System has the irrevocable right to receive the income earned on the trust assets in perpetuity, but never receives the assets held in trust. Annual distributions from the trusts are reported as investment income and classified as temporarily restricted based upon the donor designation. The beneficial interests in perpetual trusts are reported at the System’s pro rata share of the fair value of the assets and are included in other assets in the accompanying consolidated statements of financial position, with the change in fair value reported as an increase or decrease in permanently restricted net assets.
Net Asset Categories
Unrestricted net assets are those that are free of donor-imposed restriction, and include all revenue, expenses, gains, and losses that do not relate to temporarily or permanently restricted net assets. Temporarily restricted net assets are those whose use has been limited by donors to a specific time period or purpose. Permanently restricted net assets are those restricted by donors to be maintained in perpetuity, the income from which is included in investment income of temporarily restricted net assets until appropriated in accordance with donor intentions.
Excess of Revenues Over Expenses
The accompanying consolidated statements of operations and changes in net assets include excess of revenues over expenses, which is the System’s performance indicator. Changes in unrestricted net assets, which are excluded from excess of revenues over expenses, consistent with industry practice, include unrealized gains and losses on other-than-trading investments (unless the unrealized loss is considered other-than-temporary), contributions of long-lived assets (including assets acquired using contributions, which by donor restriction were to be used for the purposes of acquiring such assets), and pension and postretirement benefit adjustments.
Summa Health System and Subsidiaries
Notes to Consolidated Financial Statements (continued) (In Thousands of Dollars)
1401-1180831 19
2. Accounting Policies (continued)
Gifts and Contributions
Unconditional donor pledges to give cash and other assets are reported at fair value at the date the promise is made. Conditional donor pledges to give and indications of intentions to give are not recognized until the condition is satisfied. Gifts are reported as either temporarily or permanently restricted support if they are received with donor stipulations that limit the use of the donated assets. When a donor restriction expires, that is, when a stipulated time restriction ends or purpose restriction is accomplished, temporarily restricted net assets are transferred as unrestricted net assets and reported in the accompanying consolidated statements of operations and changes in net assets as net assets released from restrictions. Donor-restricted contributions whose restrictions are met within the same year as received are classified within other operating revenue.
No amounts have been reflected in the consolidated financial statements for donated services. The System pays for most services requiring specific expertise. However, many individuals volunteer their time and perform a variety of tasks that assist the System with various programs.
Gifts of long-lived assets such as land, buildings, or equipment are reported as an addition to unrestricted net assets unless explicit donor stipulations specify how the donated assets must be used. Gifts of long-lived assets with explicit restrictions that specify how the assets are to be used and gifts of cash or other assets that must be used to acquire long-lived assets are reported as contributions and other or as an addition to temporarily restricted net assets in the accompanying consolidated statements of operations and changes in net assets. Absent explicit donor stipulations about how long those long-lived assets must be maintained, expirations of donor restrictions are reported when the donated or acquired long-lived assets are placed in service.
Summa Health System and Subsidiaries
Notes to Consolidated Financial Statements (continued) (In Thousands of Dollars)
1401-1180831 20
2. Accounting Policies (continued)
Concentration of Credit Risk
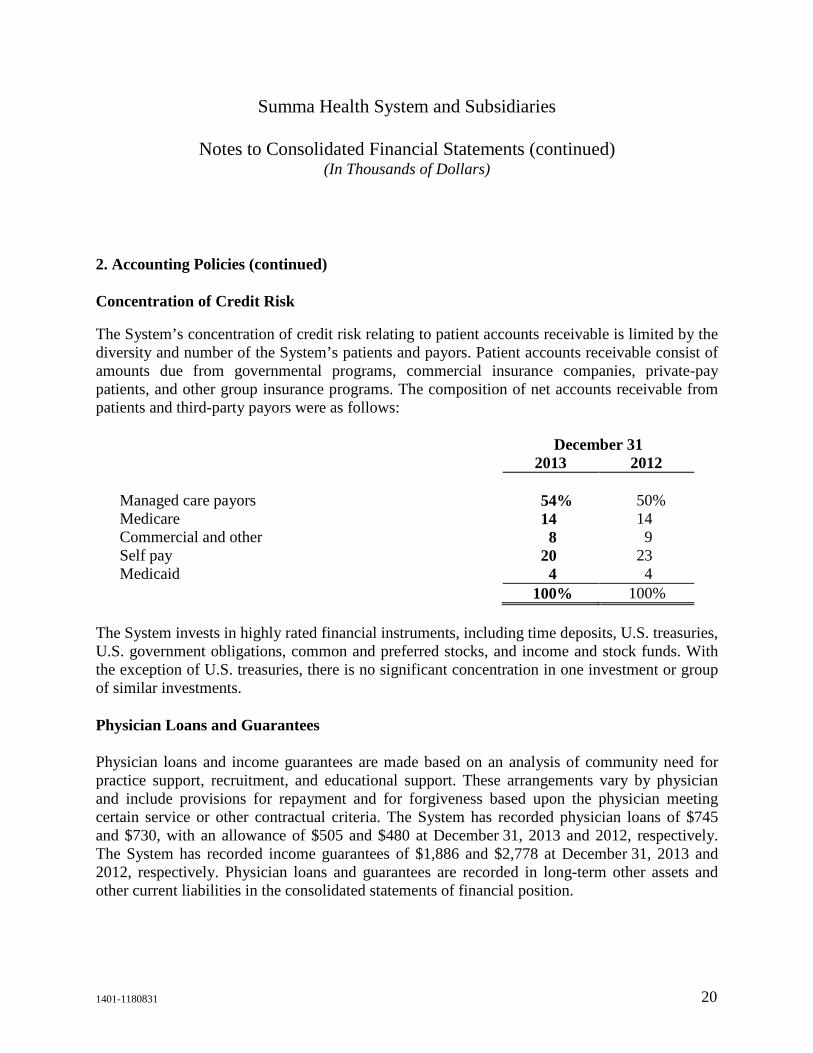
The System’s concentration of credit risk relating to patient accounts receivable is limited by the diversity and number of the System’s patients and payors. Patient accounts receivable consist of amounts due from governmental programs, commercial insurance companies, private-pay patients, and other group insurance programs. The composition of net accounts receivable from patients and third-party payors were as follows:
December 31 2013 2012 Managed care payors 54% 50% Medicare 14 14 Commercial and other 8 9 Self pay 20 23 Medicaid 4 4 100% 100%
The System invests in highly rated financial instruments, including time deposits, U.S. treasuries, U.S. government obligations, common and preferred stocks, and income and stock funds. With the exception of U.S. treasuries, there is no significant concentration in one investment or group of similar investments.
Physician Loans and Guarantees
Physician loans and income guarantees are made based on an analysis of community need for practice support, recruitment, and educational support. These arrangements vary by physician and include provisions for repayment and for forgiveness based upon the physician meeting certain service or other contractual criteria. The System has recorded physician loans of $745 and $730, with an allowance of $505 and $480 at December 31, 2013 and 2012, respectively. The System has recorded income guarantees of $1,886 and $2,778 at December 31, 2013 and 2012, respectively. Physician loans and guarantees are recorded in long-term other assets and other current liabilities in the consolidated statements of financial position.
Summa Health System and Subsidiaries
Notes to Consolidated Financial Statements (continued) (In Thousands of Dollars)
1401-1180831 21
2. Accounting Policies (continued)
Interest Rate Swaps
Interest rate swaps are recognized as liabilities in the accompanying consolidated statements of financial position at fair value. Interest rate swaps are not being accounted for as hedge transactions. Therefore, the changes in fair value are recorded as derivative instrument gain (loss) in the accompanying consolidated statements of operations and changes in net assets.
Interest rate swap agreements are used as part of the System’s program to manage the fixed and floating interest rate mix of the System’s total debt portfolio and related overall cost of borrowing. The interest rate swap agreements involve the periodic exchange of payments without the exchange of the notional amount upon which the payments are based. The related amount payable to counterparties is included in other noncurrent liabilities in the accompanying consolidated statements of financial position.
Reclassifications
Certain amounts included in the 2012 consolidated financial statements have been reclassified to conform to the 2013 presentation. The reclassifications had no impact on total net assets or the excess of revenues over expenses.
Summa Health System and Subsidiaries
Notes to Consolidated Financial Statements (continued) (In Thousands of Dollars)
1401-1180831 22
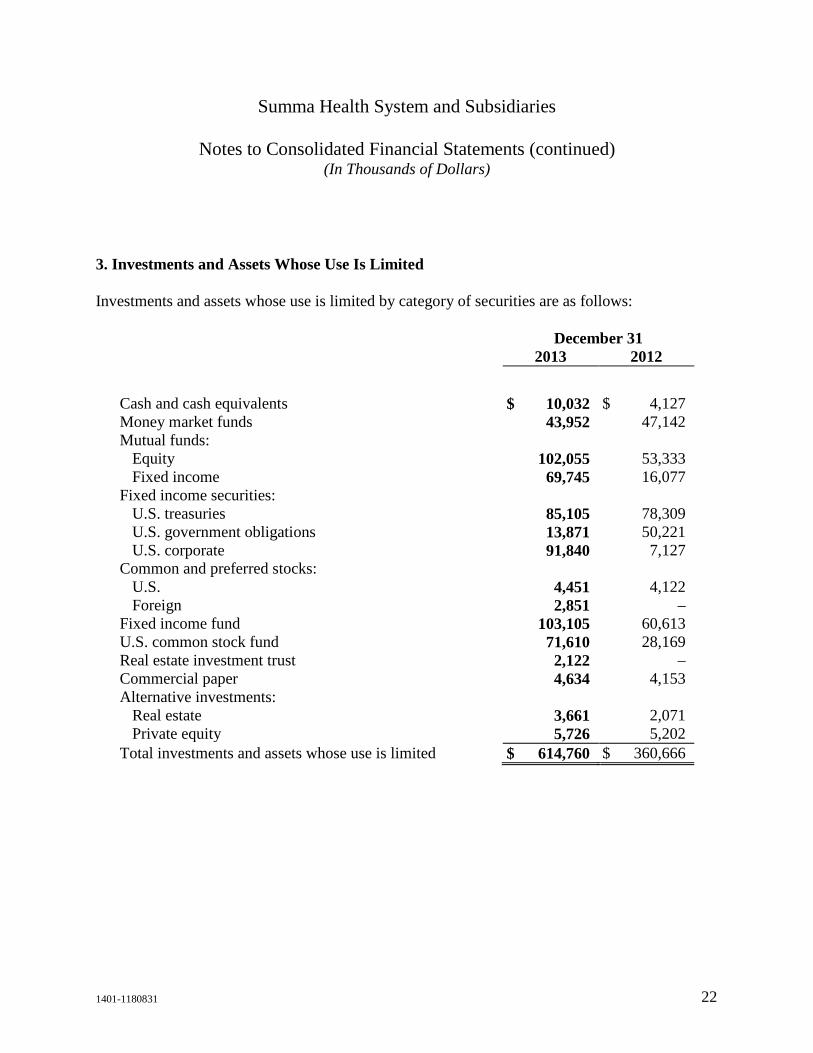
3. Investments and Assets Whose Use Is Limited
Investments and assets whose use is limited by category of securities are as follows:
December 31 2013 2012
Cash and cash equivalents $ 10,032 $ 4,127 Money market funds 43,952 47,142 Mutual funds:
Equity 102,055 53,333 Fixed income 69,745 16,077
Fixed income securities: U.S. treasuries 85,105 78,309 U.S. government obligations 13,871 50,221 U.S. corporate 91,840 7,127
Common and preferred stocks: U.S. 4,451 4,122 Foreign 2,851 –
Fixed income fund 103,105 60,613 U.S. common stock fund 71,610 28,169 Real estate investment trust 2,122 – Commercial paper 4,634 4,153 Alternative investments:
Real estate 3,661 2,071 Private equity 5,726 5,202
Total investments and assets whose use is limited $ 614,760 $ 360,666
Summa Health System and Subsidiaries
Notes to Consolidated Financial Statements (continued) (In Thousands of Dollars)
1401-1180831 23
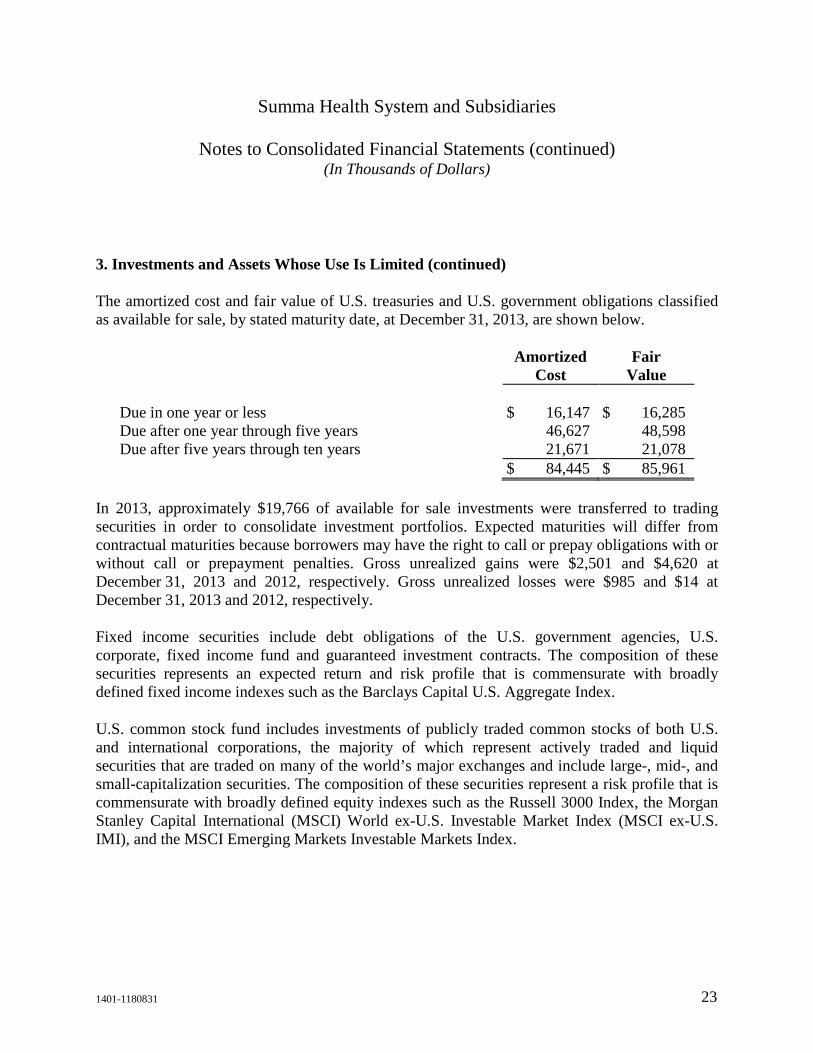
3. Investments and Assets Whose Use Is Limited (continued)
The amortized cost and fair value of U.S. treasuries and U.S. government obligations classified as available for sale, by stated maturity date, at December 31, 2013, are shown below.
Amortized
Cost Fair
Value Due in one year or less $ 16,147 $ 16,285 Due after one year through five years 46,627 48,598 Due after five years through ten years 21,671 21,078 $ 84,445 $ 85,961
In 2013, approximately $19,766 of available for sale investments were transferred to trading securities in order to consolidate investment portfolios. Expected maturities will differ from contractual maturities because borrowers may have the right to call or prepay obligations with or without call or prepayment penalties. Gross unrealized gains were $2,501 and $4,620 at December 31, 2013 and 2012, respectively. Gross unrealized losses were $985 and $14 at December 31, 2013 and 2012, respectively.
Fixed income securities include debt obligations of the U.S. government agencies, U.S. corporate, fixed income fund and guaranteed investment contracts. The composition of these securities represents an expected return and risk profile that is commensurate with broadly defined fixed income indexes such as the Barclays Capital U.S. Aggregate Index.
U.S. common stock fund includes investments of publicly traded common stocks of both U.S. and international corporations, the majority of which represent actively traded and liquid securities that are traded on many of the world’s major exchanges and include large-, mid-, and small-capitalization securities. The composition of these securities represent a risk profile that is commensurate with broadly defined equity indexes such as the Russell 3000 Index, the Morgan Stanley Capital International (MSCI) World ex-U.S. Investable Market Index (MSCI ex-U.S. IMI), and the MSCI Emerging Markets Investable Markets Index.
Summa Health System and Subsidiaries
Notes to Consolidated Financial Statements (continued) (In Thousands of Dollars)
1401-1180831 24
3. Investments and Assets Whose Use Is Limited (continued)
The System’s investments are exposed to various kinds and levels of risk. Equity investments expose the System to market risk, performance risk, and liquidity risk. Market risk is the risk associated with major movements of the equity markets. Performance risk is that risk associated with a company’s operating performance. Fixed income securities expose the System to interest rate risk, credit risk, and liquidity risk. As interest rates change, the value of many fixed income securities is affected, including those with fixed interest rates. Credit risk is the risk that the obligor of the security will not fulfill its obligations. Liquidity risk is affected by the willingness of market participants to buy and sell given securities. Liquidity risk tends to be higher for equities related to small capitalization companies. Due to the volatility of the capital markets, there is a reasonable possibility of changes in fair value, resulting in additional gains and losses in the near term.
The remaining capital contribution commitment on alternative investments at December 31, 2013, is $6,573. Funds from the real estate fund can be withdrawn after a one-year period with 90 days notice. The private equity funds do not have withdrawal restrictions.
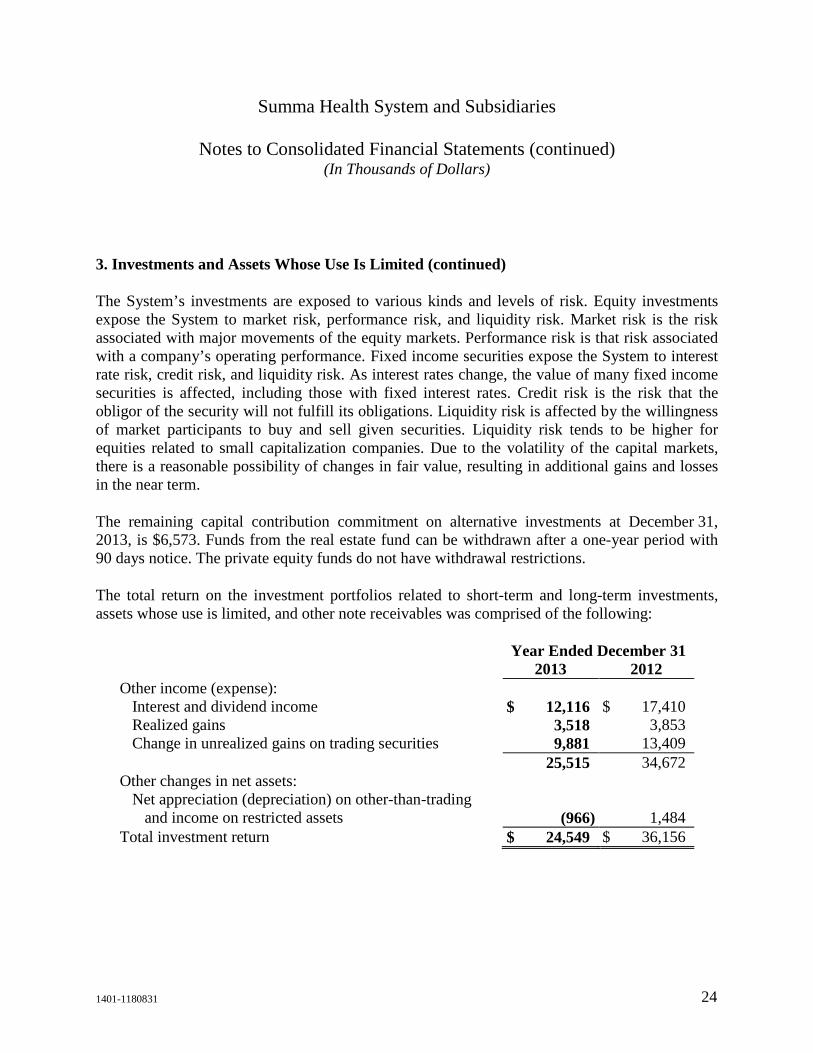
The total return on the investment portfolios related to short-term and long-term investments, assets whose use is limited, and other note receivables was comprised of the following:
Year Ended December 31 2013 2012 Other income (expense):
Interest and dividend income $ 12,116 $ 17,410 Realized gains 3,518 3,853 Change in unrealized gains on trading securities 9,881 13,409
25,515 34,672 Other changes in net assets:
Net appreciation (depreciation) on other-than-trading and income on restricted assets (966) 1,484
Total investment return $ 24,549 $ 36,156
Summa Health System and Subsidiaries
Notes to Consolidated Financial Statements (continued) (In Thousands of Dollars)
1401-1180831 25
4. Fair Value Measurement
The carrying values of cash and cash equivalents, accounts receivable and accounts payable are reasonable estimates of fair value due to the short-term nature of these financial instruments. Investments, other than alternative investments, are recorded at their fair value. At December 31, 2013 and 2012, the fair value of the System’s long-term debt, as estimated by discounted cash flow analyses using current borrowing rates for similar types of borrowing arrangements and adjusted for credit, was $385,052 and $410,302, respectively (see carrying value in Note 9). Long-term debt would be classified as Level 2 in the fair value hierarchy.
Summa Health System and Subsidiaries
Notes to Consolidated Financial Statements (continued) (In Thousands of Dollars)
1401-1180831 26
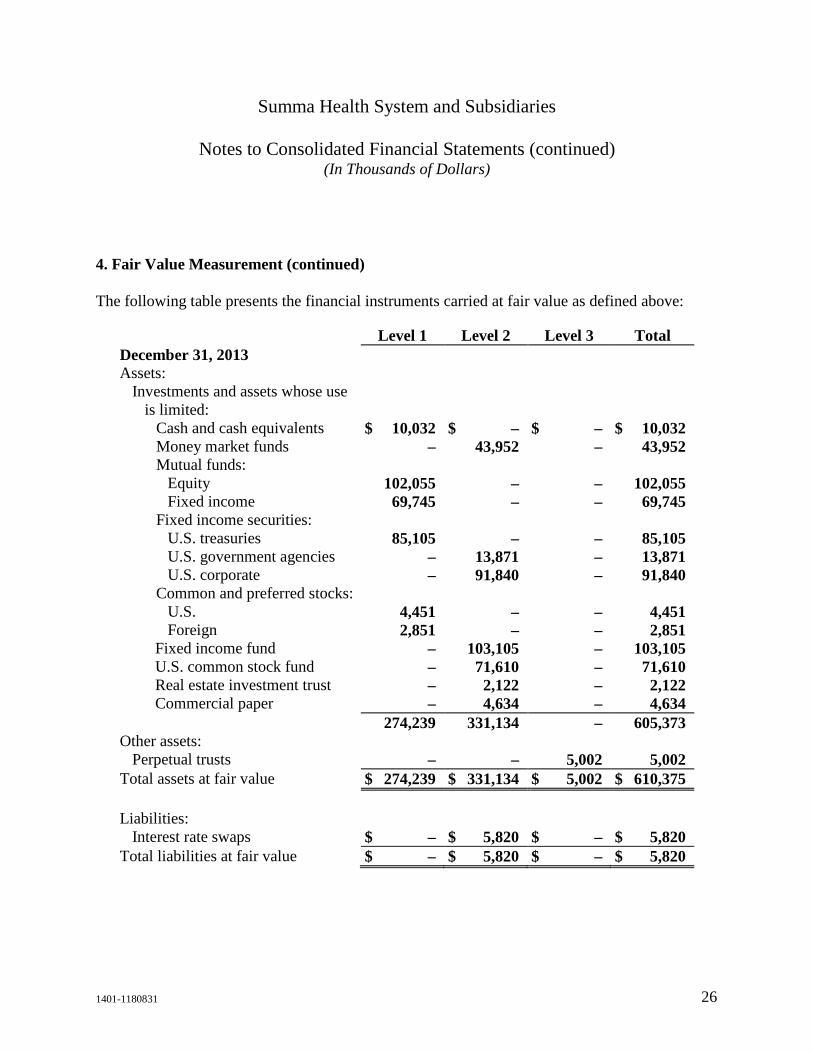
4. Fair Value Measurement (continued)
The following table presents the financial instruments carried at fair value as defined above:
Level 1 Level 2 Level 3 Total December 31, 2013 Assets:
Investments and assets whose use is limited:
Cash and cash equivalents $ 10,032 $ – $ – $ 10,032 Money market funds – 43,952 – 43,952 Mutual funds:
Equity 102,055 – – 102,055 Fixed income 69,745 – – 69,745
Fixed income securities: U.S. treasuries 85,105 – – 85,105 U.S. government agencies – 13,871 – 13,871 U.S. corporate – 91,840 – 91,840
Common and preferred stocks: U.S. 4,451 – – 4,451 Foreign 2,851 – – 2,851
Fixed income fund – 103,105 – 103,105 U.S. common stock fund – 71,610 – 71,610 Real estate investment trust – 2,122 – 2,122 Commercial paper – 4,634 – 4,634
274,239 331,134 – 605,373 Other assets:
Perpetual trusts – – 5,002 5,002 Total assets at fair value $ 274,239 $ 331,134 $ 5,002 $ 610,375 Liabilities:
Interest rate swaps $ – $ 5,820 $ – $ 5,820 Total liabilities at fair value $ – $ 5,820 $ – $ 5,820
Summa Health System and Subsidiaries
Notes to Consolidated Financial Statements (continued) (In Thousands of Dollars)
1401-1180831 27
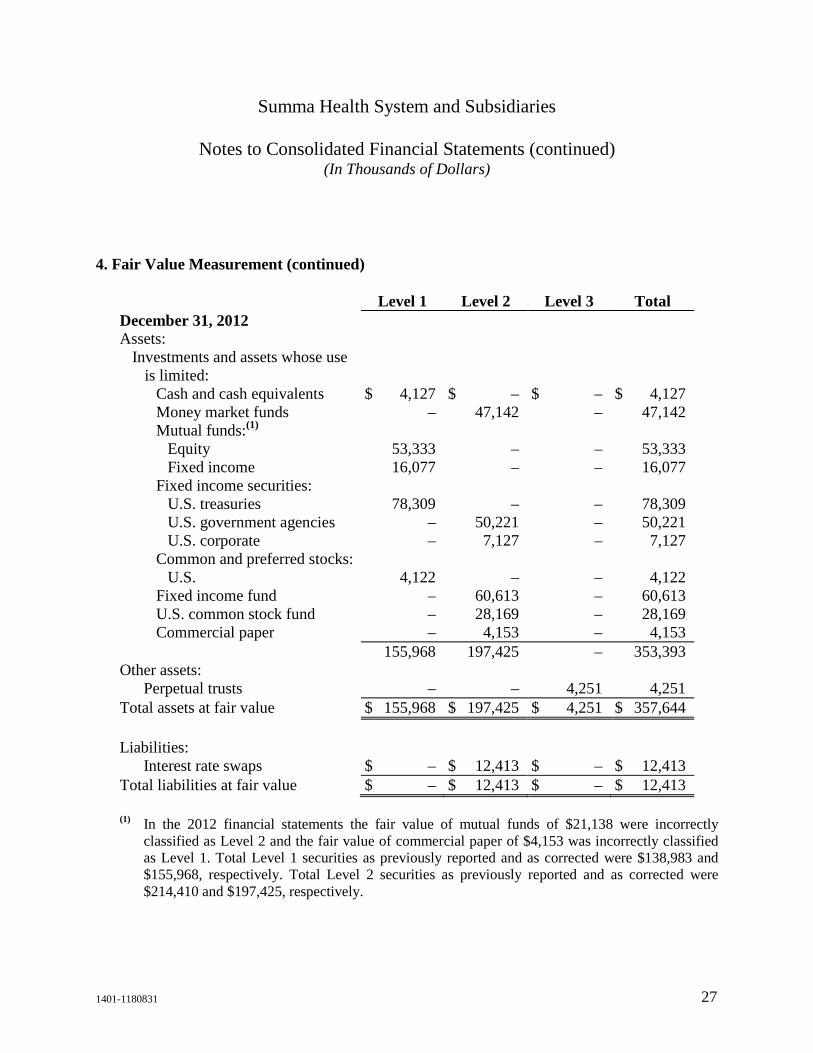
4. Fair Value Measurement (continued)
Level 1 Level 2 Level 3 Total December 31, 2012 Assets:
Investments and assets whose use is limited:
Cash and cash equivalents $ 4,127 $ – $ – $ 4,127 Money market funds – 47,142 – 47,142 Mutual funds:(1)
Equity 53,333 – – 53,333 Fixed income 16,077 – – 16,077
Fixed income securities: U.S. treasuries 78,309 – – 78,309 U.S. government agencies – 50,221 – 50,221 U.S. corporate – 7,127 – 7,127
Common and preferred stocks: U.S. 4,122 – – 4,122
Fixed income fund – 60,613 – 60,613 U.S. common stock fund – 28,169 – 28,169 Commercial paper – 4,153 – 4,153
155,968 197,425 – 353,393 Other assets:
Perpetual trusts – – 4,251 4,251 Total assets at fair value $ 155,968 $ 197,425 $ 4,251 $ 357,644 Liabilities:
Interest rate swaps $ – $ 12,413 $ – $ 12,413 Total liabilities at fair value $ – $ 12,413 $ – $ 12,413
(1) In the 2012 financial statements the fair value of mutual funds of $21,138 were incorrectly
classified as Level 2 and the fair value of commercial paper of $4,153 was incorrectly classified as Level 1. Total Level 1 securities as previously reported and as corrected were $138,983 and $155,968, respectively. Total Level 2 securities as previously reported and as corrected were $214,410 and $197,425, respectively.
Summa Health System and Subsidiaries
Notes to Consolidated Financial Statements (continued) (In Thousands of Dollars)
1401-1180831 28
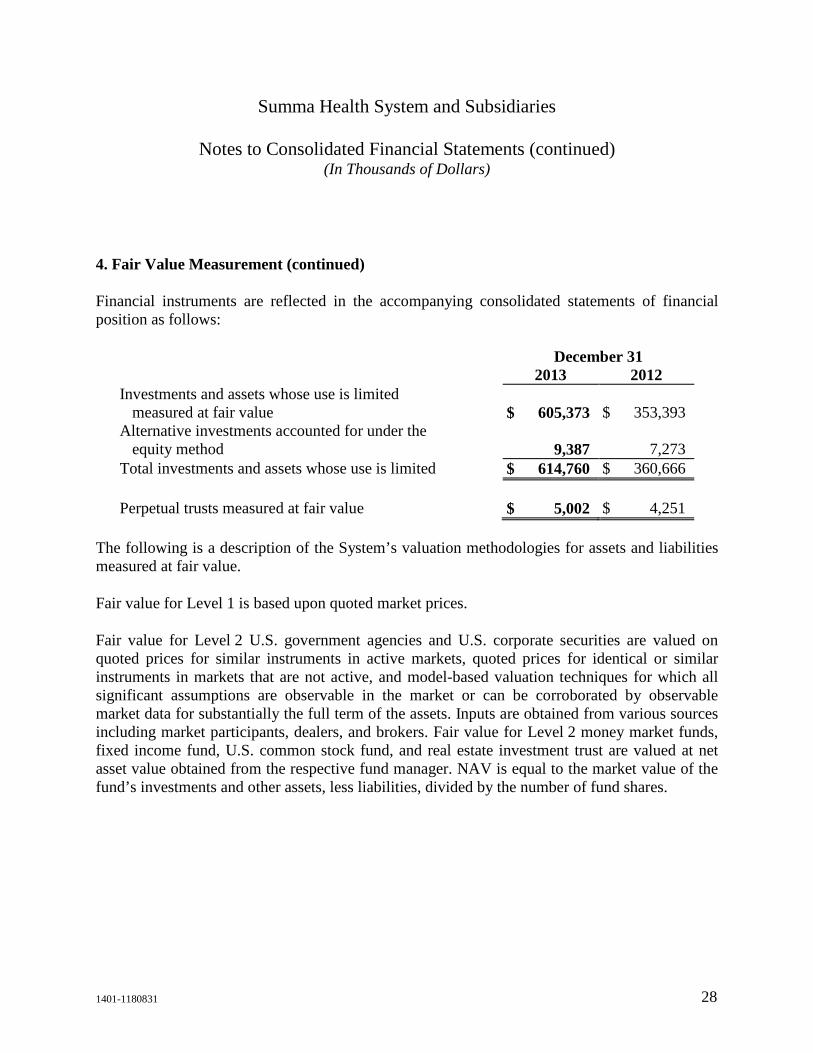
4. Fair Value Measurement (continued)
Financial instruments are reflected in the accompanying consolidated statements of financial position as follows:
December 31 2013 2012 Investments and assets whose use is limited
measured at fair value $ 605,373 $ 353,393 Alternative investments accounted for under the
equity method 9,387 7,273 Total investments and assets whose use is limited $ 614,760 $ 360,666 Perpetual trusts measured at fair value $ 5,002 $ 4,251
The following is a description of the System’s valuation methodologies for assets and liabilities measured at fair value.
Fair value for Level 1 is based upon quoted market prices.
Fair value for Level 2 U.S. government agencies and U.S. corporate securities are valued on quoted prices for similar instruments in active markets, quoted prices for identical or similar instruments in markets that are not active, and model-based valuation techniques for which all significant assumptions are observable in the market or can be corroborated by observable market data for substantially the full term of the assets. Inputs are obtained from various sources including market participants, dealers, and brokers. Fair value for Level 2 money market funds, fixed income fund, U.S. common stock fund, and real estate investment trust are valued at net asset value obtained from the respective fund manager. NAV is equal to the market value of the fund’s investments and other assets, less liabilities, divided by the number of fund shares.
Summa Health System and Subsidiaries
Notes to Consolidated Financial Statements (continued) (In Thousands of Dollars)
1401-1180831 29
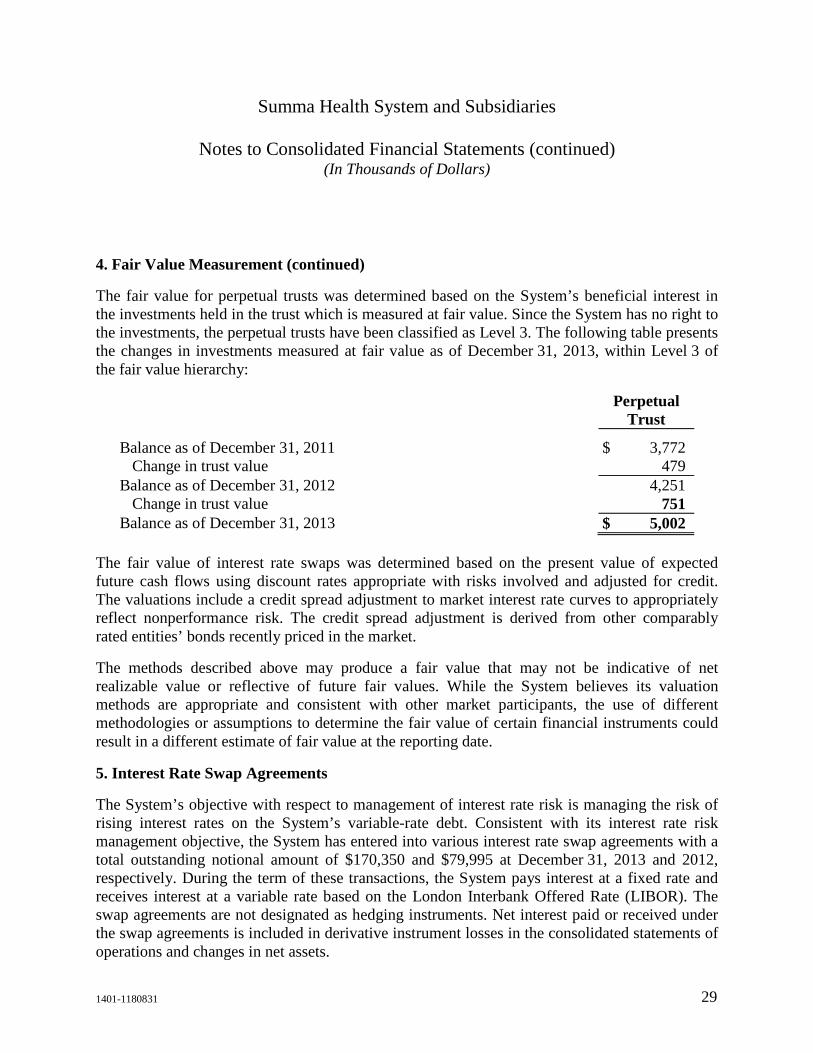
4. Fair Value Measurement (continued)
The fair value for perpetual trusts was determined based on the System’s beneficial interest in the investments held in the trust which is measured at fair value. Since the System has no right to the investments, the perpetual trusts have been classified as Level 3. The following table presents the changes in investments measured at fair value as of December 31, 2013, within Level 3 of the fair value hierarchy:
Perpetual
Trust
Balance as of December 31, 2011 $ 3,772 Change in trust value 479
Balance as of December 31, 2012 4,251 Change in trust value 751
Balance as of December 31, 2013 $ 5,002 The fair value of interest rate swaps was determined based on the present value of expected future cash flows using discount rates appropriate with risks involved and adjusted for credit. The valuations include a credit spread adjustment to market interest rate curves to appropriately reflect nonperformance risk. The credit spread adjustment is derived from other comparably rated entities’ bonds recently priced in the market.
The methods described above may produce a fair value that may not be indicative of net realizable value or reflective of future fair values. While the System believes its valuation methods are appropriate and consistent with other market participants, the use of different methodologies or assumptions to determine the fair value of certain financial instruments could result in a different estimate of fair value at the reporting date.
5. Interest Rate Swap Agreements
The System’s objective with respect to management of interest rate risk is managing the risk of rising interest rates on the System’s variable-rate debt. Consistent with its interest rate risk management objective, the System has entered into various interest rate swap agreements with a total outstanding notional amount of $170,350 and $79,995 at December 31, 2013 and 2012, respectively. During the term of these transactions, the System pays interest at a fixed rate and receives interest at a variable rate based on the London Interbank Offered Rate (LIBOR). The swap agreements are not designated as hedging instruments. Net interest paid or received under the swap agreements is included in derivative instrument losses in the consolidated statements of operations and changes in net assets.
Summa Health System and Subsidiaries
Notes to Consolidated Financial Statements (continued) (In Thousands of Dollars)
1401-1180831 30
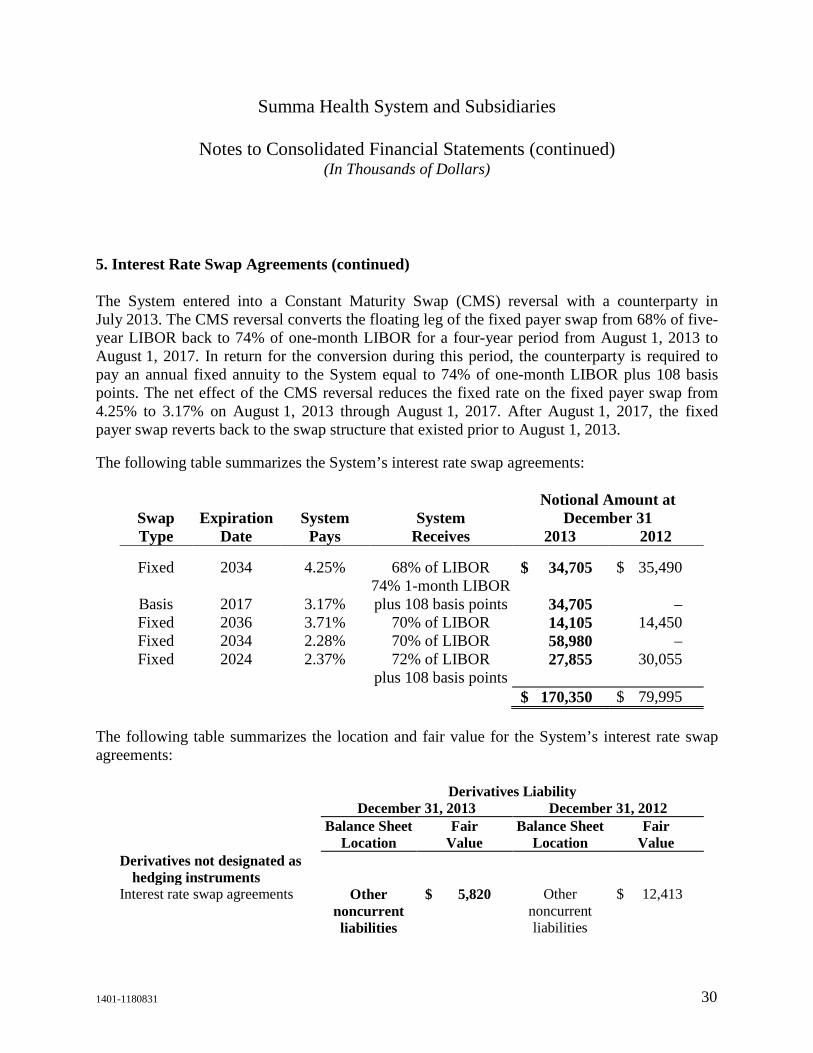
5. Interest Rate Swap Agreements (continued)
The System entered into a Constant Maturity Swap (CMS) reversal with a counterparty in July 2013. The CMS reversal converts the floating leg of the fixed payer swap from 68% of five-year LIBOR back to 74% of one-month LIBOR for a four-year period from August 1, 2013 to August 1, 2017. In return for the conversion during this period, the counterparty is required to pay an annual fixed annuity to the System equal to 74% of one-month LIBOR plus 108 basis points. The net effect of the CMS reversal reduces the fixed rate on the fixed payer swap from 4.25% to 3.17% on August 1, 2013 through August 1, 2017. After August 1, 2017, the fixed payer swap reverts back to the swap structure that existed prior to August 1, 2013.
The following table summarizes the System’s interest rate swap agreements:
Notional Amount at Swap Expiration System System December 31 Type Date Pays Receives 2013 2012
Fixed 2034 4.25% 68% of LIBOR $ 34,705 $ 35,490
Basis 2017 3.17% 74% 1-month LIBOR plus 108 basis points 34,705 –
Fixed 2036 3.71% 70% of LIBOR 14,105 14,450 Fixed 2034 2.28% 70% of LIBOR 58,980 – Fixed 2024 2.37% 72% of LIBOR
plus 108 basis points 27,855 30,055
$ 170,350 $ 79,995 The following table summarizes the location and fair value for the System’s interest rate swap agreements:
Derivatives Liability December 31, 2013 December 31, 2012 Balance Sheet
Location Fair
Value Balance Sheet
Location Fair
Value Derivatives not designated as
hedging instruments
Interest rate swap agreements Other noncurrent liabilities
$ 5,820 Other noncurrent liabilities
$ 12,413
Summa Health System and Subsidiaries
Notes to Consolidated Financial Statements (continued) (In Thousands of Dollars)
1401-1180831 31
5. Interest Rate Swap Agreements (continued)
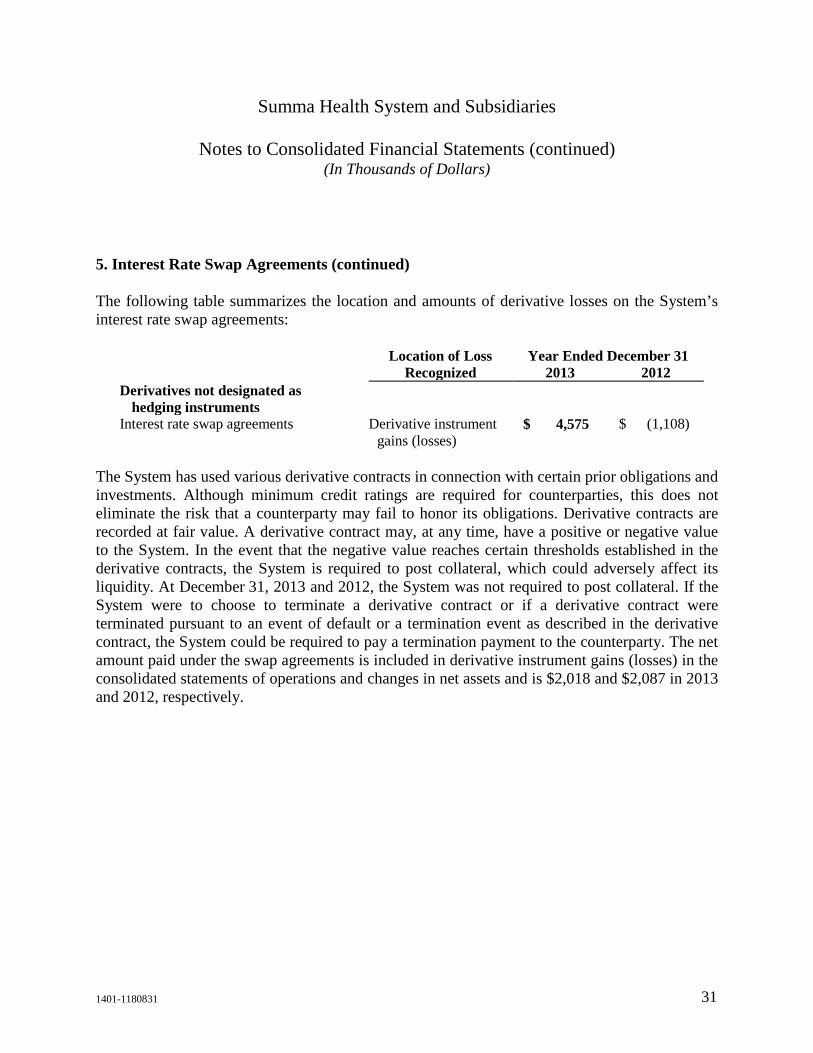
The following table summarizes the location and amounts of derivative losses on the System’s interest rate swap agreements:
Location of Loss Year Ended December 31 Recognized 2013 2012 Derivatives not designated as
hedging instruments
Interest rate swap agreements Derivative instrument gains (losses)
$ 4,575 $ (1,108)
The System has used various derivative contracts in connection with certain prior obligations and investments. Although minimum credit ratings are required for counterparties, this does not eliminate the risk that a counterparty may fail to honor its obligations. Derivative contracts are recorded at fair value. A derivative contract may, at any time, have a positive or negative value to the System. In the event that the negative value reaches certain thresholds established in the derivative contracts, the System is required to post collateral, which could adversely affect its liquidity. At December 31, 2013 and 2012, the System was not required to post collateral. If the System were to choose to terminate a derivative contract or if a derivative contract were terminated pursuant to an event of default or a termination event as described in the derivative contract, the System could be required to pay a termination payment to the counterparty. The net amount paid under the swap agreements is included in derivative instrument gains (losses) in the consolidated statements of operations and changes in net assets and is $2,018 and $2,087 in 2013 and 2012, respectively.
Summa Health System and Subsidiaries
Notes to Consolidated Financial Statements (continued) (In Thousands of Dollars)
1401-1180831 32
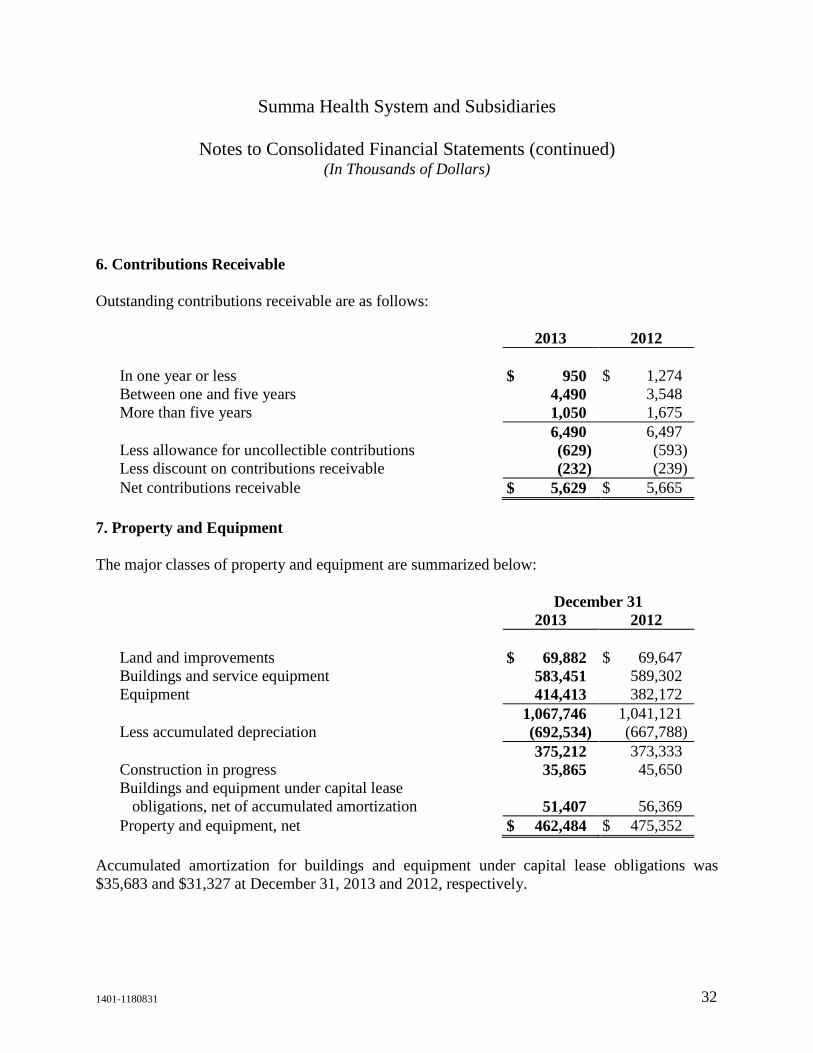
6. Contributions Receivable
Outstanding contributions receivable are as follows:
2013 2012 In one year or less $ 950 $ 1,274 Between one and five years 4,490 3,548 More than five years 1,050 1,675 6,490 6,497 Less allowance for uncollectible contributions (629) (593) Less discount on contributions receivable (232) (239) Net contributions receivable $ 5,629 $ 5,665
7. Property and Equipment
The major classes of property and equipment are summarized below:
December 31 2013 2012 Land and improvements $ 69,882 $ 69,647 Buildings and service equipment 583,451 589,302 Equipment 414,413 382,172 1,067,746 1,041,121 Less accumulated depreciation (692,534) (667,788) 375,212 373,333 Construction in progress 35,865 45,650 Buildings and equipment under capital lease
obligations, net of accumulated amortization 51,407 56,369 Property and equipment, net $ 462,484 $ 475,352
Accumulated amortization for buildings and equipment under capital lease obligations was $35,683 and $31,327 at December 31, 2013 and 2012, respectively.
Summa Health System and Subsidiaries
Notes to Consolidated Financial Statements (continued) (In Thousands of Dollars)
1401-1180831 33
7. Property and Equipment (continued)
Approximately $15,350 and $9,914 of unamortized computer software is included in equipment at December 31, 2013 and 2012, respectively. The computer software will be amortized over five years. The System recorded amortization expense on computer software of $1,134 in 2013.
At December 31, 2013, the remaining commitment on construction contracts was $5,622.
The legal obligations to perform asset retirement obligations that are conditional on a future event have been estimated. Legal obligations to perform asset retirement obligations relate primarily to the removal of asbestos containing building materials. The liability for asset retirement obligations recorded in other noncurrent liabilities in the accompanying consolidated statements of financial position is $2,148 and $2,059 at December 31, 2013 and 2012, respectively. The System recorded expense of $89 in 2013 and $133 in 2012 to accrete the liability. Depreciation expense of $18 in 2013 and 2012 was recorded against the asset in property and equipment.
8. Pension and Postretirement Benefit Plans
The System maintains a noncontributory defined benefit pension plan for the benefit of eligible employees, Summa Health System Retirement Income Plan and Trust Plan (Plan). The benefits are based upon years of service, as defined by the Plan. It is the System’s policy to contribute annually to the plan amounts that are actuarially determined to provide the Plan with sufficient assets to meet future benefit payment requirements. Effective June 30, 2011, the System froze the Plan for all nonunion participants under age 60 as of December 31, 2010. In August, 2013, the System amended its union contract with respect to the Plan and union employees who are participants in the Plan as of December 31, 2012 will continue to accrue benefits and additional service for vesting under the terms of the Plan. Union employees who are not participants in the Plan as of December 31, 2012 shall not become participants in the Plan and may contribute 1% of their pay up to a maximum of 50% not to exceed the limit under the Internal Revenue Code to the System’s Tax Sheltered Annuity Plan.
Summa Health System and Subsidiaries
Notes to Consolidated Financial Statements (continued) (In Thousands of Dollars)
1401-1180831 34
8. Pension and Postretirement Benefit Plans (continued)
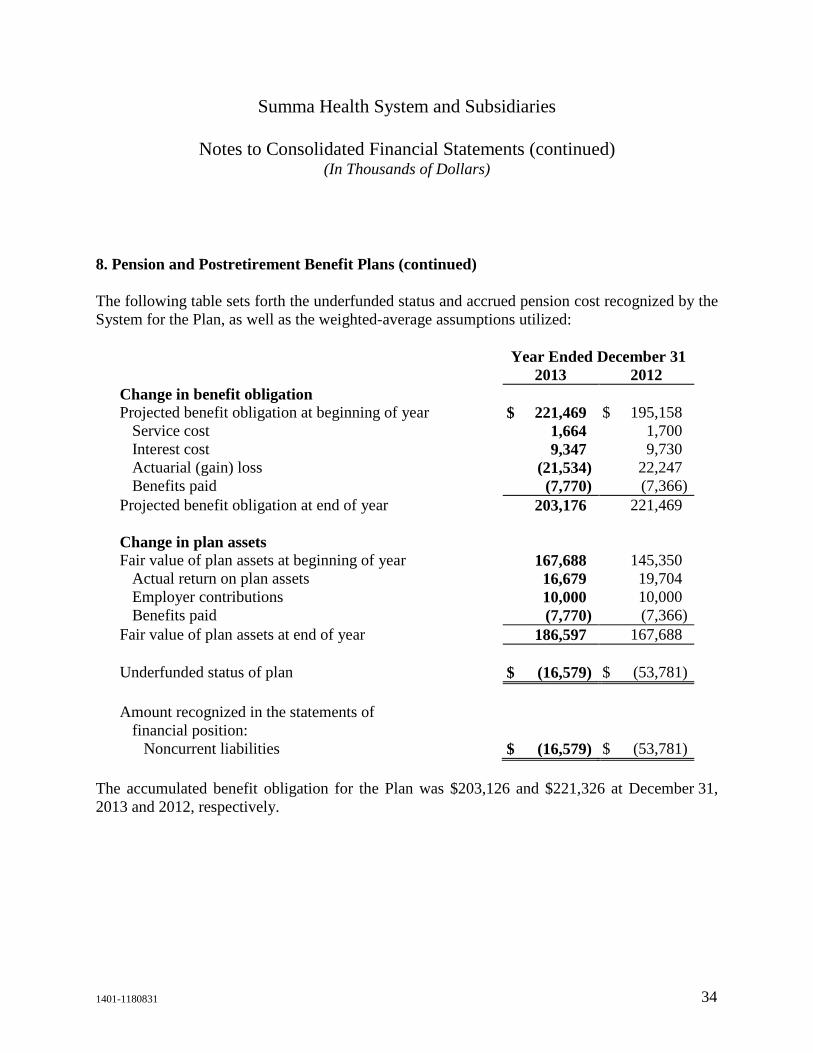
The following table sets forth the underfunded status and accrued pension cost recognized by the System for the Plan, as well as the weighted-average assumptions utilized:
Year Ended December 31 2013 2012 Change in benefit obligation Projected benefit obligation at beginning of year $ 221,469 $ 195,158
Service cost 1,664 1,700 Interest cost 9,347 9,730 Actuarial (gain) loss (21,534) 22,247 Benefits paid (7,770) (7,366)
Projected benefit obligation at end of year 203,176 221,469 Change in plan assets Fair value of plan assets at beginning of year 167,688 145,350
Actual return on plan assets 16,679 19,704 Employer contributions 10,000 10,000 Benefits paid (7,770) (7,366)
Fair value of plan assets at end of year 186,597 167,688 Underfunded status of plan $ (16,579) $ (53,781) Amount recognized in the statements of
financial position: Noncurrent liabilities $ (16,579) $ (53,781)
The accumulated benefit obligation for the Plan was $203,126 and $221,326 at December 31, 2013 and 2012, respectively.
Summa Health System and Subsidiaries
Notes to Consolidated Financial Statements (continued) (In Thousands of Dollars)
1401-1180831 35
8. Pension and Postretirement Benefit Plans (continued)
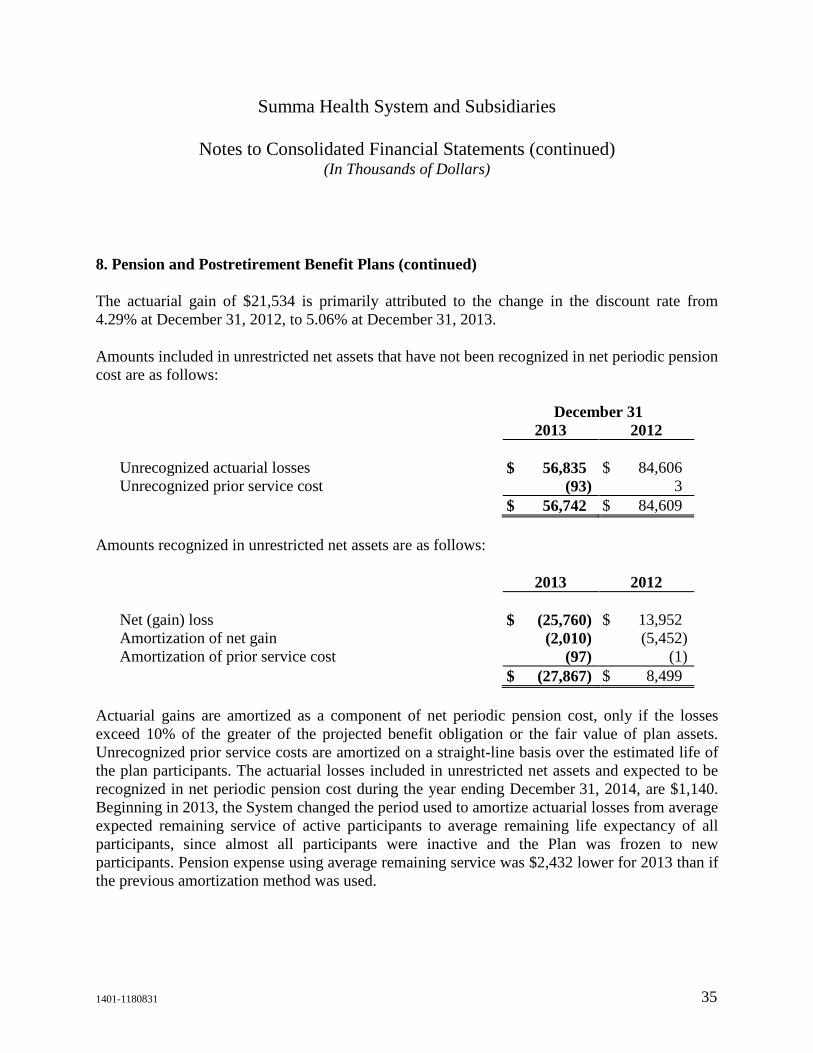
The actuarial gain of $21,534 is primarily attributed to the change in the discount rate from 4.29% at December 31, 2012, to 5.06% at December 31, 2013.
Amounts included in unrestricted net assets that have not been recognized in net periodic pension cost are as follows:
December 31 2013 2012 Unrecognized actuarial losses $ 56,835 $ 84,606 Unrecognized prior service cost (93) 3 $ 56,742 $ 84,609
Amounts recognized in unrestricted net assets are as follows:
2013 2012 Net (gain) loss $ (25,760) $ 13,952 Amortization of net gain (2,010) (5,452) Amortization of prior service cost (97) (1) $ (27,867) $ 8,499
Actuarial gains are amortized as a component of net periodic pension cost, only if the losses exceed 10% of the greater of the projected benefit obligation or the fair value of plan assets. Unrecognized prior service costs are amortized on a straight-line basis over the estimated life of the plan participants. The actuarial losses included in unrestricted net assets and expected to be recognized in net periodic pension cost during the year ending December 31, 2014, are $1,140. Beginning in 2013, the System changed the period used to amortize actuarial losses from average expected remaining service of active participants to average remaining life expectancy of all participants, since almost all participants were inactive and the Plan was frozen to new participants. Pension expense using average remaining service was $2,432 lower for 2013 than if the previous amortization method was used.
Summa Health System and Subsidiaries
Notes to Consolidated Financial Statements (continued) (In Thousands of Dollars)
1401-1180831 36
8. Pension and Postretirement Benefit Plans (continued)
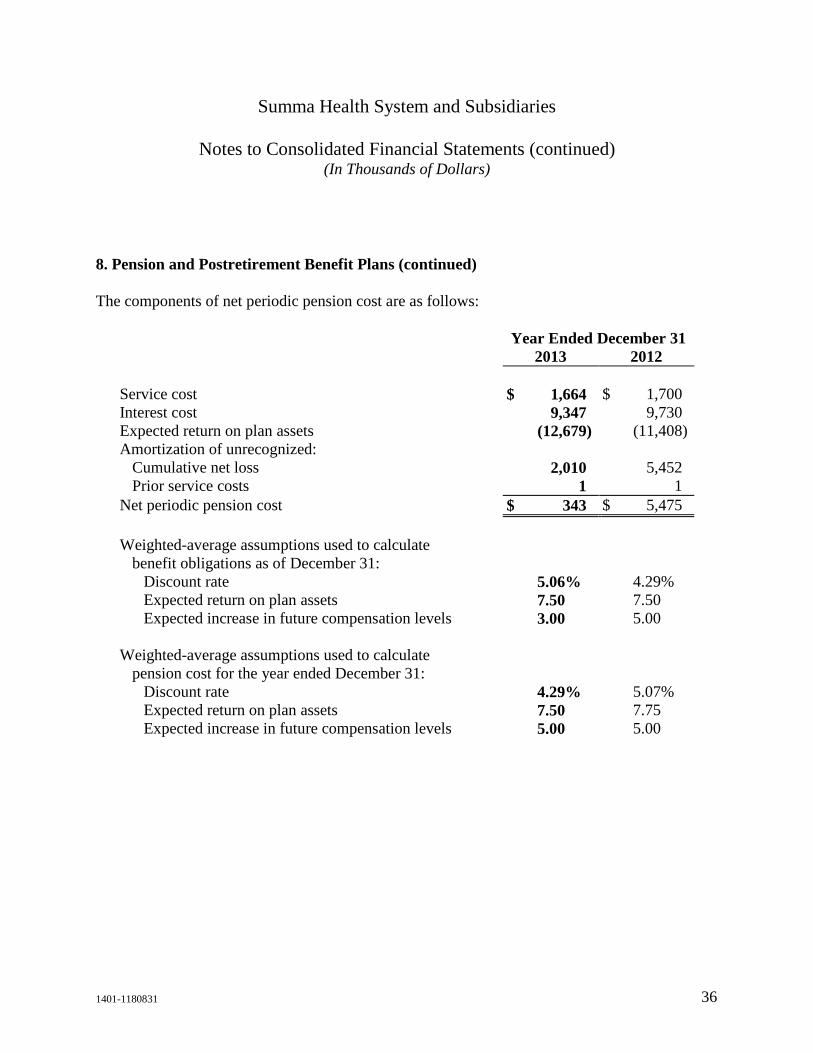
The components of net periodic pension cost are as follows:
Year Ended December 31 2013 2012 Service cost $ 1,664 $ 1,700 Interest cost 9,347 9,730 Expected return on plan assets (12,679) (11,408) Amortization of unrecognized:
Cumulative net loss 2,010 5,452 Prior service costs 1 1
Net periodic pension cost $ 343 $ 5,475 Weighted-average assumptions used to calculate
benefit obligations as of December 31: Discount rate 5.06% 4.29% Expected return on plan assets 7.50 7.50 Expected increase in future compensation levels 3.00 5.00
Weighted-average assumptions used to calculate
pension cost for the year ended December 31: Discount rate 4.29% 5.07% Expected return on plan assets 7.50 7.75 Expected increase in future compensation levels 5.00 5.00
Summa Health System and Subsidiaries
Notes to Consolidated Financial Statements (continued) (In Thousands of Dollars)
1401-1180831 37
8. Pension and Postretirement Benefit Plans (continued)
The investment policy covering plan assets is established by the Investment Committee of the Board of Directors for the System. This committee meets on a quarterly basis and makes periodic changes to the policy. The written investment policy for the Plan includes a target allocation of 17.5% in U.S. equities, 17.5% in non-U.S. equities, 40% in fixed income investments, 10% in real estate, 5% in master limited partnerships, 5% in alternative investments, and 5% in cash and cash equivalents. The Plan’s obligations are long-term in nature, and the investment policy is therefore focused on a long-term horizon. Goals include achieving returns at least equal to relevant indices. Management, outside advisors and the Investment Committee regularly review and discuss investment performance, adherence to the written investment policy and the investment policy itself. In performing these tasks, the Investment Committee approves changes in asset managers and asset allocation.
The investment policy is furthermore utilized as the basis for determining the long-term return assumption for the assets. Historical data, combined with future expected returns of each asset class, are the primary components utilized in developing this assumption. Additional information, such as specific manager performance and risk characteristics, is also included in the assessment of the long-term rate of return assumption.
The System’s pension portfolio return assumption of 7.5% at December 31, 2013 and 2012, is based on the targeted assumed rate of return through a diversified portfolio designed to mitigate short-term return volatility and achieve an efficient trade-off between return and risk. Expected returns and risk for each asset class are formed using a global capital asset pricing model framework in which the expected return is the compensation earned from taking risk. Forward-looking adjustments are made to expected return, volatility and correlation estimates as well. Additionally, constraints such as permissible asset classes, portfolio guidelines and liquidity considerations are included in the model.
Summa Health System and Subsidiaries
Notes to Consolidated Financial Statements (continued) (In Thousands of Dollars)
1401-1180831 38
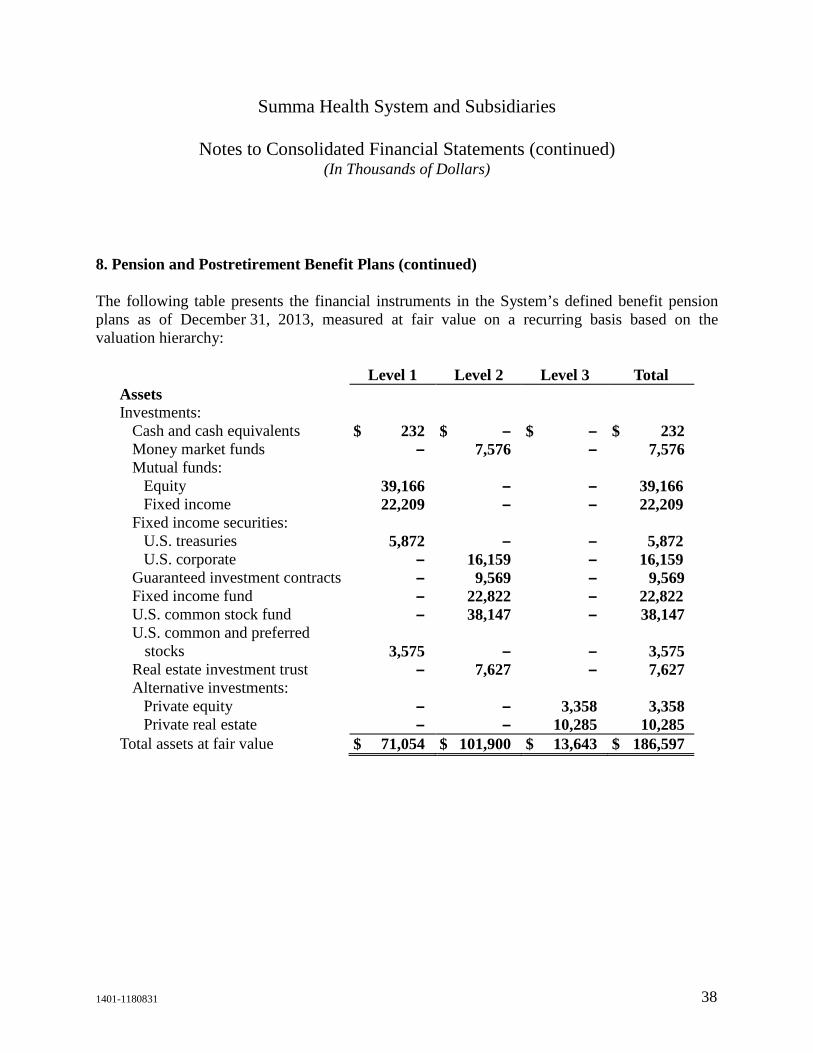
8. Pension and Postretirement Benefit Plans (continued)
The following table presents the financial instruments in the System’s defined benefit pension plans as of December 31, 2013, measured at fair value on a recurring basis based on the valuation hierarchy:
Level 1 Level 2 Level 3 Total Assets Investments:
Cash and cash equivalents $ 232 $ – $ – $ 232 Money market funds – 7,576 – 7,576 Mutual funds:
Equity 39,166 – – 39,166 Fixed income 22,209 – – 22,209
Fixed income securities: U.S. treasuries 5,872 – – 5,872 U.S. corporate – 16,159 – 16,159
Guaranteed investment contracts – 9,569 – 9,569 Fixed income fund – 22,822 – 22,822 U.S. common stock fund – 38,147 – 38,147 U.S. common and preferred
stocks 3,575 – – 3,575 Real estate investment trust – 7,627 – 7,627 Alternative investments:
Private equity – – 3,358 3,358 Private real estate – – 10,285 10,285
Total assets at fair value $ 71,054 $ 101,900 $ 13,643 $ 186,597
Summa Health System and Subsidiaries
Notes to Consolidated Financial Statements (continued) (In Thousands of Dollars)
1401-1180831 39
8. Pension and Postretirement Benefit Plans (continued)
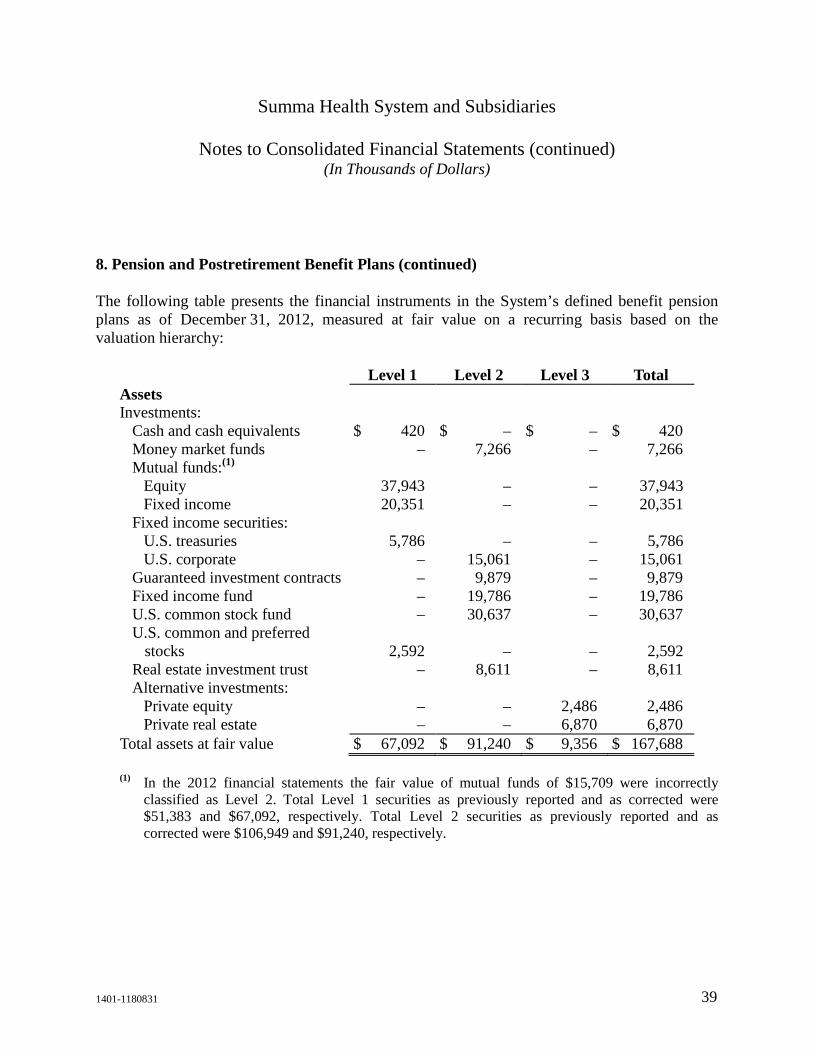
The following table presents the financial instruments in the System’s defined benefit pension plans as of December 31, 2012, measured at fair value on a recurring basis based on the valuation hierarchy:
Level 1 Level 2 Level 3 Total Assets Investments:
Cash and cash equivalents $ 420 $ – $ – $ 420 Money market funds – 7,266 – 7,266 Mutual funds:(1)
Equity 37,943 – – 37,943 Fixed income 20,351 – – 20,351
Fixed income securities: U.S. treasuries 5,786 – – 5,786 U.S. corporate – 15,061 – 15,061
Guaranteed investment contracts – 9,879 – 9,879 Fixed income fund – 19,786 – 19,786 U.S. common stock fund – 30,637 – 30,637 U.S. common and preferred
stocks 2,592 – – 2,592 Real estate investment trust – 8,611 – 8,611 Alternative investments:
Private equity – – 2,486 2,486 Private real estate – – 6,870 6,870
Total assets at fair value $ 67,092 $ 91,240 $ 9,356 $ 167,688
(1) In the 2012 financial statements the fair value of mutual funds of $15,709 were incorrectly classified as Level 2. Total Level 1 securities as previously reported and as corrected were $51,383 and $67,092, respectively. Total Level 2 securities as previously reported and as corrected were $106,949 and $91,240, respectively.
Summa Health System and Subsidiaries
Notes to Consolidated Financial Statements (continued) (In Thousands of Dollars)
1401-1180831 40
8. Pension and Postretirement Benefit Plans (continued)
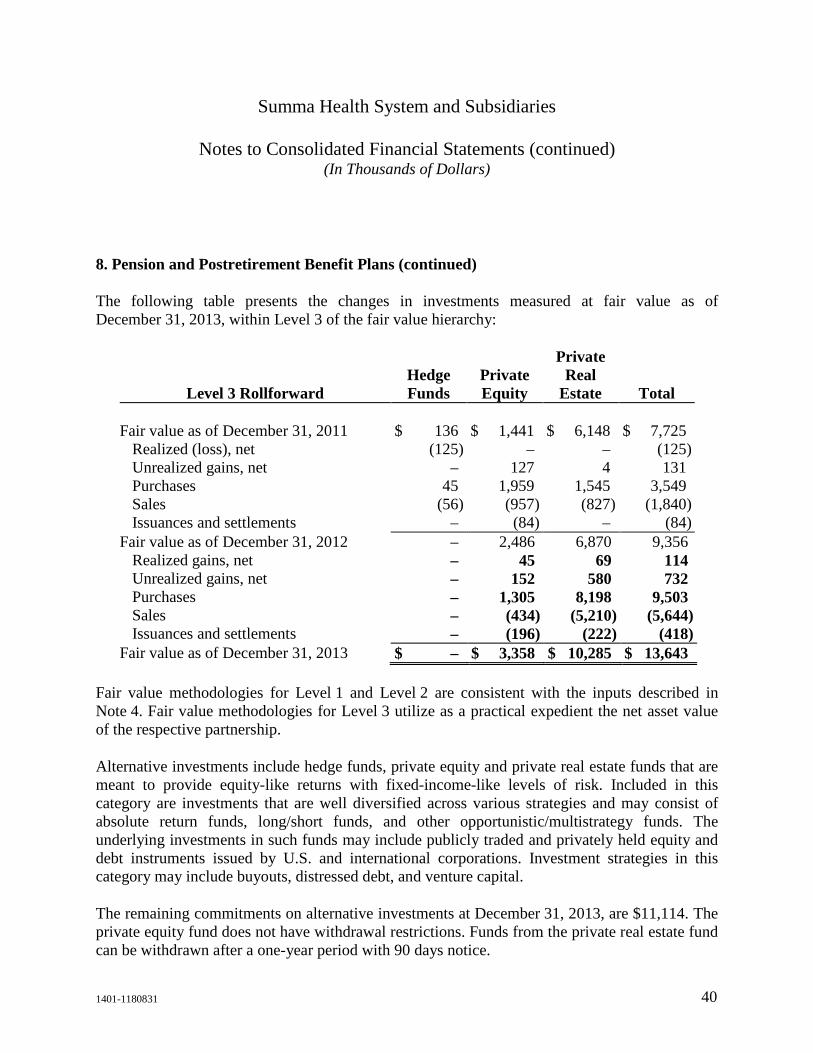
The following table presents the changes in investments measured at fair value as of December 31, 2013, within Level 3 of the fair value hierarchy:
Level 3 Rollforward Hedge Funds
Private Equity
Private Real
Estate Total Fair value as of December 31, 2011 $ 136 $ 1,441 $ 6,148 $ 7,725
Realized (loss), net (125) – – (125) Unrealized gains, net – 127 4 131 Purchases 45 1,959 1,545 3,549 Sales (56) (957) (827) (1,840) Issuances and settlements – (84) – (84)
Fair value as of December 31, 2012 – 2,486 6,870 9,356 Realized gains, net – 45 69 114 Unrealized gains, net – 152 580 732 Purchases – 1,305 8,198 9,503 Sales – (434) (5,210) (5,644) Issuances and settlements – (196) (222) (418)
Fair value as of December 31, 2013 $ – $ 3,358 $ 10,285 $ 13,643 Fair value methodologies for Level 1 and Level 2 are consistent with the inputs described in Note 4. Fair value methodologies for Level 3 utilize as a practical expedient the net asset value of the respective partnership.
Alternative investments include hedge funds, private equity and private real estate funds that are meant to provide equity-like returns with fixed-income-like levels of risk. Included in this category are investments that are well diversified across various strategies and may consist of absolute return funds, long/short funds, and other opportunistic/multistrategy funds. The underlying investments in such funds may include publicly traded and privately held equity and debt instruments issued by U.S. and international corporations. Investment strategies in this category may include buyouts, distressed debt, and venture capital.
The remaining commitments on alternative investments at December 31, 2013, are $11,114. The private equity fund does not have withdrawal restrictions. Funds from the private real estate fund can be withdrawn after a one-year period with 90 days notice.
Summa Health System and Subsidiaries
Notes to Consolidated Financial Statements (continued) (In Thousands of Dollars)
1401-1180831 41
8. Pension and Postretirement Benefit Plans (continued)
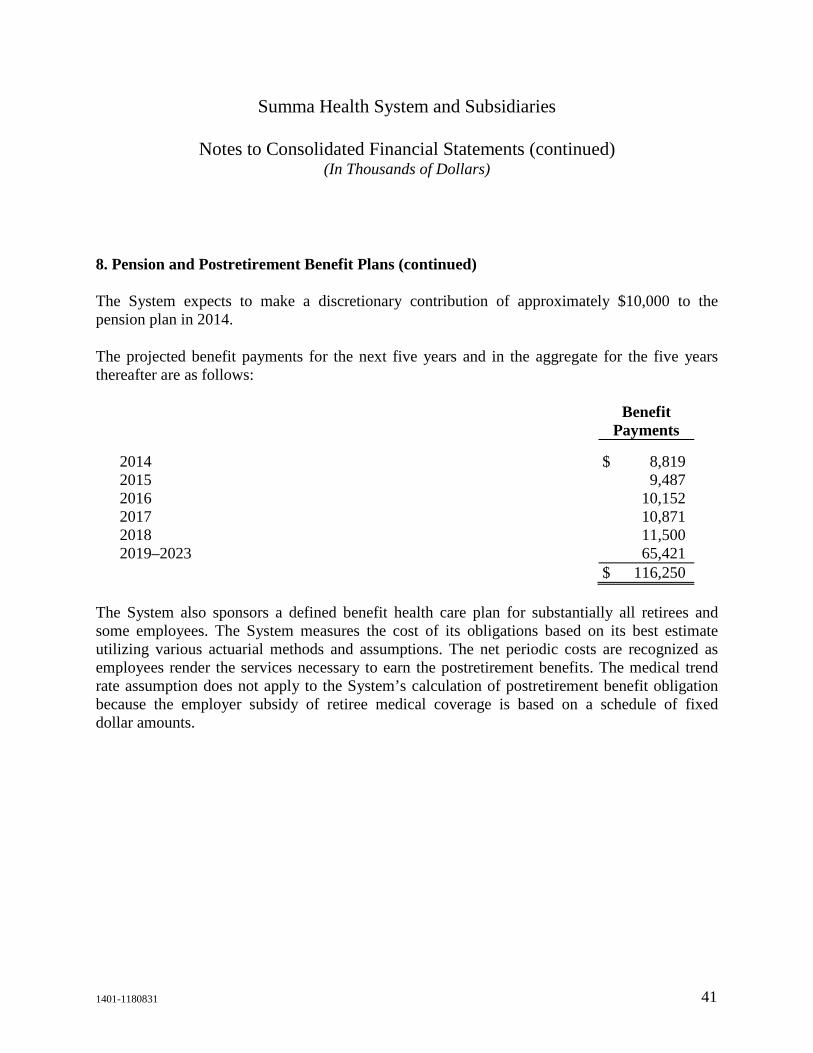
The System expects to make a discretionary contribution of approximately $10,000 to the pension plan in 2014.
The projected benefit payments for the next five years and in the aggregate for the five years thereafter are as follows:
Benefit
Payments 2014 $ 8,819 2015 9,487 2016 10,152 2017 10,871 2018 11,500 2019–2023 65,421 $ 116,250
The System also sponsors a defined benefit health care plan for substantially all retirees and some employees. The System measures the cost of its obligations based on its best estimate utilizing various actuarial methods and assumptions. The net periodic costs are recognized as employees render the services necessary to earn the postretirement benefits. The medical trend rate assumption does not apply to the System’s calculation of postretirement benefit obligation because the employer subsidy of retiree medical coverage is based on a schedule of fixed dollar amounts.
Summa Health System and Subsidiaries
Notes to Consolidated Financial Statements (continued) (In Thousands of Dollars)
1401-1180831 42
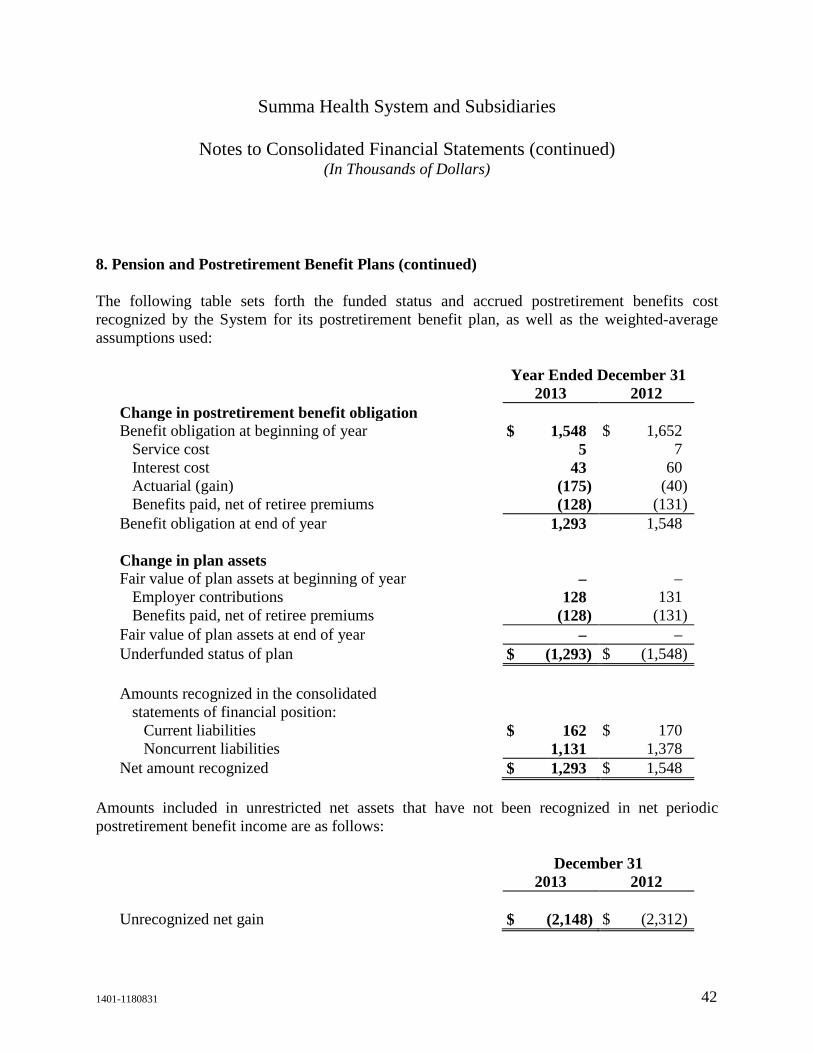
8. Pension and Postretirement Benefit Plans (continued)
The following table sets forth the funded status and accrued postretirement benefits cost recognized by the System for its postretirement benefit plan, as well as the weighted-average assumptions used:
Year Ended December 31 2013 2012 Change in postretirement benefit obligation Benefit obligation at beginning of year $ 1,548 $ 1,652
Service cost 5 7 Interest cost 43 60 Actuarial (gain) (175) (40) Benefits paid, net of retiree premiums (128) (131)
Benefit obligation at end of year 1,293 1,548 Change in plan assets Fair value of plan assets at beginning of year – –
Employer contributions 128 131 Benefits paid, net of retiree premiums (128) (131)
Fair value of plan assets at end of year – – Underfunded status of plan $ (1,293) $ (1,548) Amounts recognized in the consolidated
statements of financial position: Current liabilities $ 162 $ 170 Noncurrent liabilities 1,131 1,378
Net amount recognized $ 1,293 $ 1,548 Amounts included in unrestricted net assets that have not been recognized in net periodic postretirement benefit income are as follows:
December 31 2013 2012 Unrecognized net gain $ (2,148) $ (2,312)
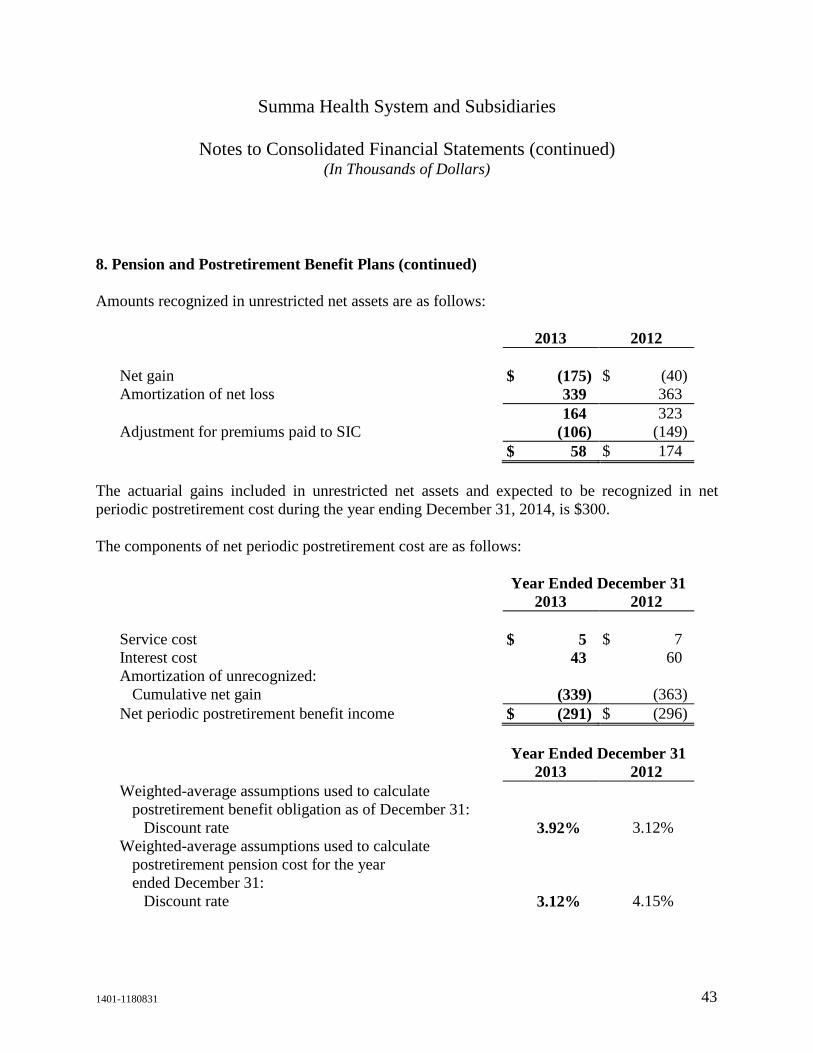
Summa Health System and Subsidiaries
Notes to Consolidated Financial Statements (continued) (In Thousands of Dollars)
1401-1180831 43
8. Pension and Postretirement Benefit Plans (continued)
Amounts recognized in unrestricted net assets are as follows:
2013 2012 Net gain $ (175) $ (40) Amortization of net loss 339 363 164 323 Adjustment for premiums paid to SIC (106) (149) $ 58 $ 174
The actuarial gains included in unrestricted net assets and expected to be recognized in net periodic postretirement cost during the year ending December 31, 2014, is $300.
The components of net periodic postretirement cost are as follows:
Year Ended December 31 2013 2012 Service cost $ 5 $ 7 Interest cost 43 60 Amortization of unrecognized:
Cumulative net gain (339) (363) Net periodic postretirement benefit income $ (291) $ (296)
Year Ended December 31 2013 2012 Weighted-average assumptions used to calculate
postretirement benefit obligation as of December 31: Discount rate 3.92% 3.12%
Weighted-average assumptions used to calculate postretirement pension cost for the year ended December 31:
Discount rate 3.12% 4.15%
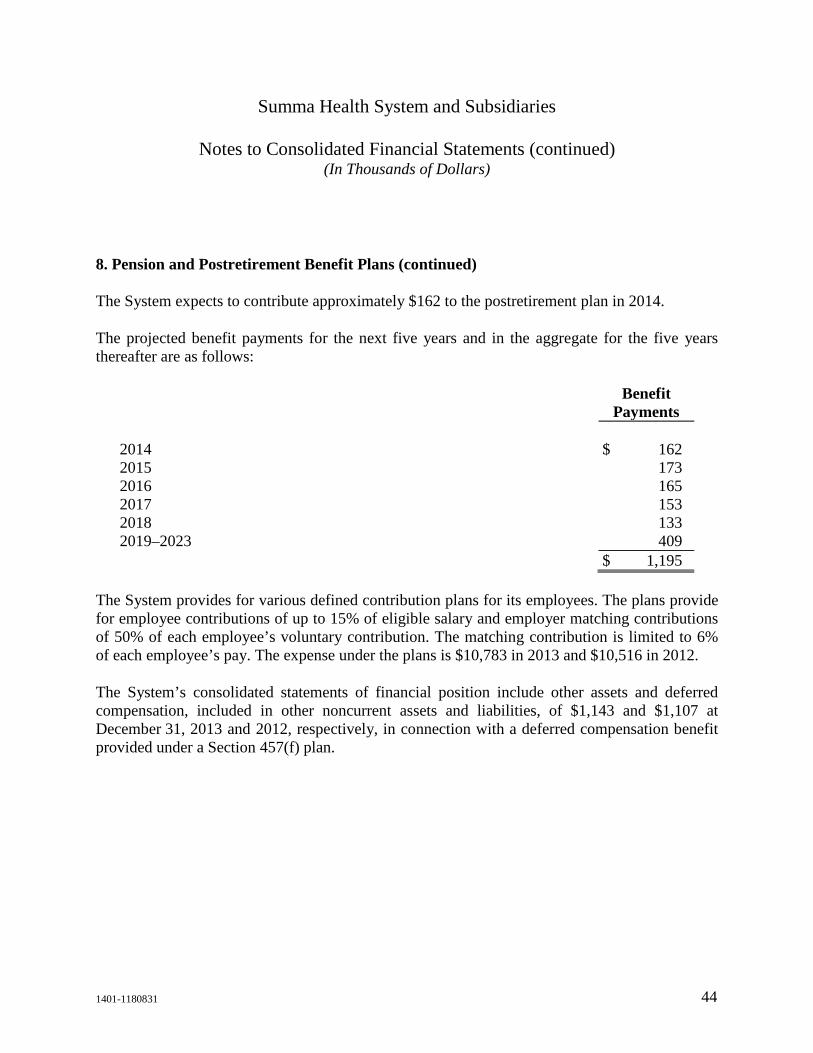
Summa Health System and Subsidiaries
Notes to Consolidated Financial Statements (continued) (In Thousands of Dollars)
1401-1180831 44
8. Pension and Postretirement Benefit Plans (continued)
The System expects to contribute approximately $162 to the postretirement plan in 2014.
The projected benefit payments for the next five years and in the aggregate for the five years thereafter are as follows:
Benefit
Payments 2014 $ 162 2015 173 2016 165 2017 153 2018 133 2019–2023 409 $ 1,195
The System provides for various defined contribution plans for its employees. The plans provide for employee contributions of up to 15% of eligible salary and employer matching contributions of 50% of each employee’s voluntary contribution. The matching contribution is limited to 6% of each employee’s pay. The expense under the plans is $10,783 in 2013 and $10,516 in 2012.
The System’s consolidated statements of financial position include other assets and deferred compensation, included in other noncurrent assets and liabilities, of $1,143 and $1,107 at December 31, 2013 and 2012, respectively, in connection with a deferred compensation benefit provided under a Section 457(f) plan.
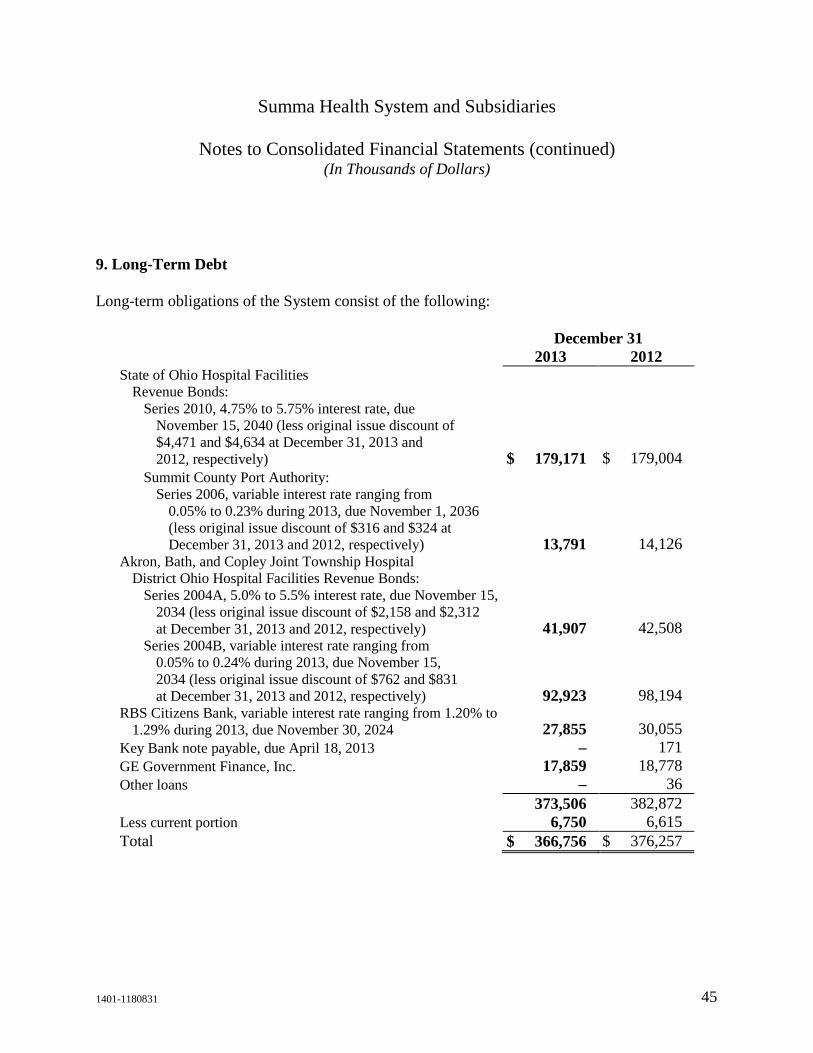
Summa Health System and Subsidiaries
Notes to Consolidated Financial Statements (continued) (In Thousands of Dollars)
1401-1180831 45
9. Long-Term Debt
Long-term obligations of the System consist of the following:
December 31 2013 2012 State of Ohio Hospital Facilities
Revenue Bonds: Series 2010, 4.75% to 5.75% interest rate, due
November 15, 2040 (less original issue discount of $4,471 and $4,634 at December 31, 2013 and 2012, respectively) $ 179,171 $ 179,004
Summit County Port Authority: Series 2006, variable interest rate ranging from
0.05% to 0.23% during 2013, due November 1, 2036 (less original issue discount of $316 and $324 at December 31, 2013 and 2012, respectively) 13,791 14,126
Akron, Bath, and Copley Joint Township Hospital District Ohio Hospital Facilities Revenue Bonds:
Series 2004A, 5.0% to 5.5% interest rate, due November 15, 2034 (less original issue discount of $2,158 and $2,312 at December 31, 2013 and 2012, respectively) 41,907 42,508
Series 2004B, variable interest rate ranging from 0.05% to 0.24% during 2013, due November 15, 2034 (less original issue discount of $762 and $831 at December 31, 2013 and 2012, respectively) 92,923 98,194
RBS Citizens Bank, variable interest rate ranging from 1.20% to 1.29% during 2013, due November 30, 2024 27,855 30,055
Key Bank note payable, due April 18, 2013 – 171 GE Government Finance, Inc. 17,859 18,778 Other loans – 36 373,506 382,872 Less current portion 6,750 6,615 Total $ 366,756 $ 376,257
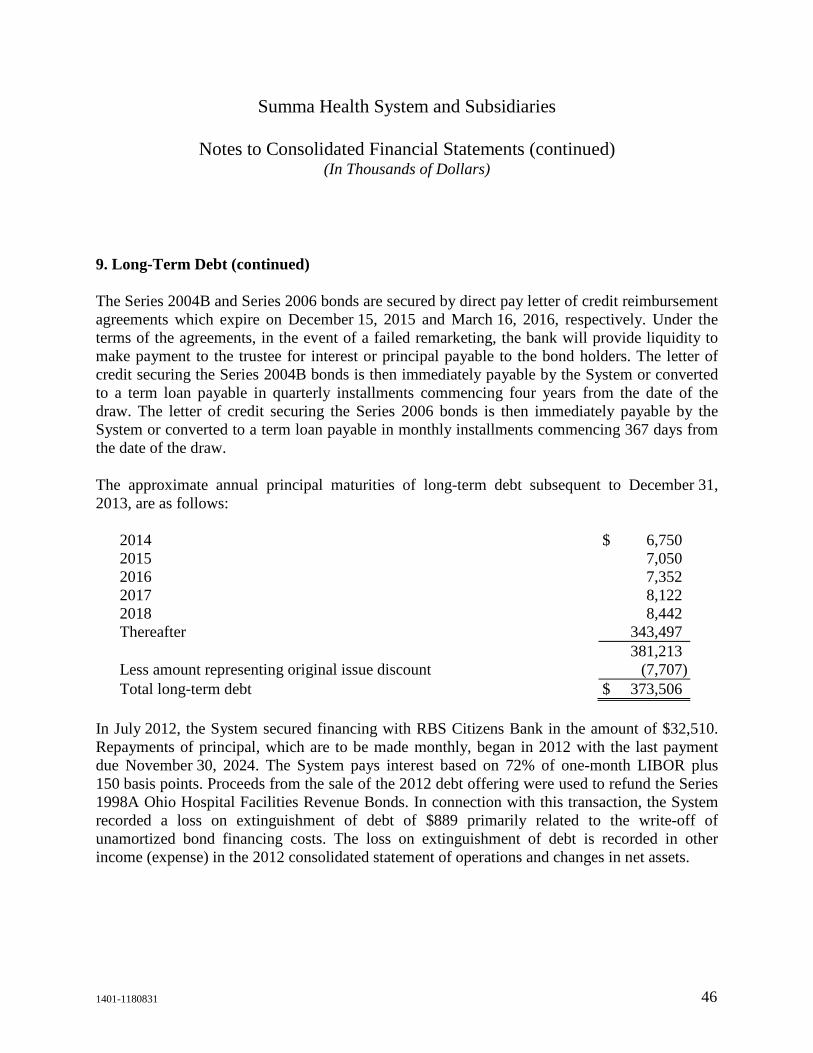
Summa Health System and Subsidiaries
Notes to Consolidated Financial Statements (continued) (In Thousands of Dollars)
1401-1180831 46
9. Long-Term Debt (continued)
The Series 2004B and Series 2006 bonds are secured by direct pay letter of credit reimbursement agreements which expire on December 15, 2015 and March 16, 2016, respectively. Under the terms of the agreements, in the event of a failed remarketing, the bank will provide liquidity to make payment to the trustee for interest or principal payable to the bond holders. The letter of credit securing the Series 2004B bonds is then immediately payable by the System or converted to a term loan payable in quarterly installments commencing four years from the date of the draw. The letter of credit securing the Series 2006 bonds is then immediately payable by the System or converted to a term loan payable in monthly installments commencing 367 days from the date of the draw.
The approximate annual principal maturities of long-term debt subsequent to December 31, 2013, are as follows:
2014 $ 6,750 2015 7,050 2016 7,352 2017 8,122 2018 8,442 Thereafter 343,497 381,213 Less amount representing original issue discount (7,707) Total long-term debt $ 373,506
In July 2012, the System secured financing with RBS Citizens Bank in the amount of $32,510. Repayments of principal, which are to be made monthly, began in 2012 with the last payment due November 30, 2024. The System pays interest based on 72% of one-month LIBOR plus 150 basis points. Proceeds from the sale of the 2012 debt offering were used to refund the Series 1998A Ohio Hospital Facilities Revenue Bonds. In connection with this transaction, the System recorded a loss on extinguishment of debt of $889 primarily related to the write-off of unamortized bond financing costs. The loss on extinguishment of debt is recorded in other income (expense) in the 2012 consolidated statement of operations and changes in net assets.
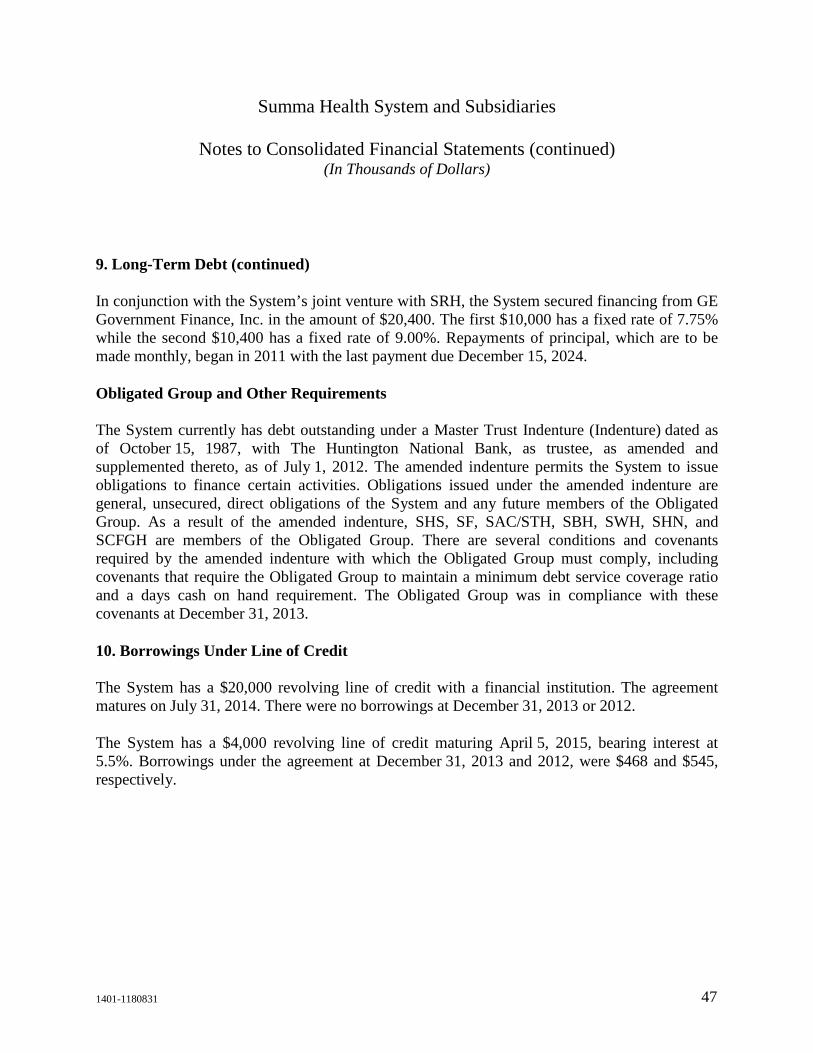
Summa Health System and Subsidiaries
Notes to Consolidated Financial Statements (continued) (In Thousands of Dollars)
1401-1180831 47
9. Long-Term Debt (continued)
In conjunction with the System’s joint venture with SRH, the System secured financing from GE Government Finance, Inc. in the amount of $20,400. The first $10,000 has a fixed rate of 7.75% while the second $10,400 has a fixed rate of 9.00%. Repayments of principal, which are to be made monthly, began in 2011 with the last payment due December 15, 2024.
Obligated Group and Other Requirements
The System currently has debt outstanding under a Master Trust Indenture (Indenture) dated as of October 15, 1987, with The Huntington National Bank, as trustee, as amended and supplemented thereto, as of July 1, 2012. The amended indenture permits the System to issue obligations to finance certain activities. Obligations issued under the amended indenture are general, unsecured, direct obligations of the System and any future members of the Obligated Group. As a result of the amended indenture, SHS, SF, SAC/STH, SBH, SWH, SHN, and SCFGH are members of the Obligated Group. There are several conditions and covenants required by the amended indenture with which the Obligated Group must comply, including covenants that require the Obligated Group to maintain a minimum debt service coverage ratio and a days cash on hand requirement. The Obligated Group was in compliance with these covenants at December 31, 2013.
10. Borrowings Under Line of Credit
The System has a $20,000 revolving line of credit with a financial institution. The agreement matures on July 31, 2014. There were no borrowings at December 31, 2013 or 2012.
The System has a $4,000 revolving line of credit maturing April 5, 2015, bearing interest at 5.5%. Borrowings under the agreement at December 31, 2013 and 2012, were $468 and $545, respectively.
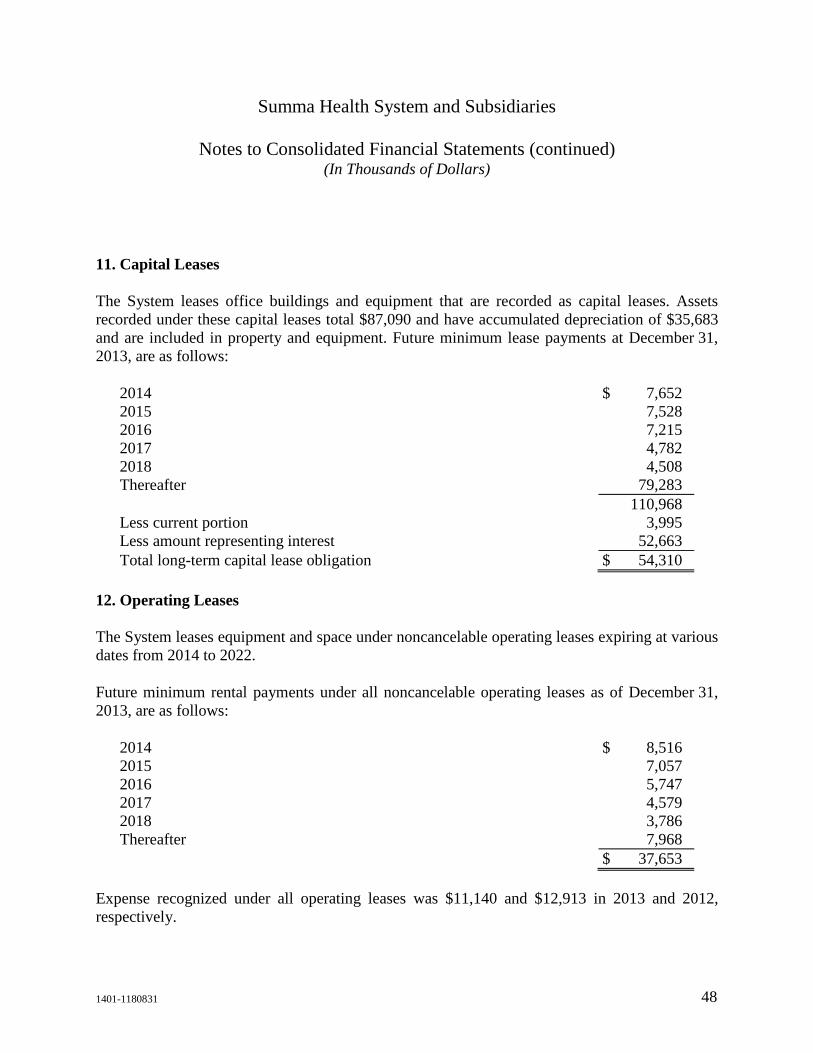
Summa Health System and Subsidiaries
Notes to Consolidated Financial Statements (continued) (In Thousands of Dollars)
1401-1180831 48
11. Capital Leases
The System leases office buildings and equipment that are recorded as capital leases. Assets recorded under these capital leases total $87,090 and have accumulated depreciation of $35,683 and are included in property and equipment. Future minimum lease payments at December 31, 2013, are as follows:
2014 $ 7,652 2015 7,528 2016 7,215 2017 4,782 2018 4,508 Thereafter 79,283 110,968 Less current portion 3,995 Less amount representing interest 52,663 Total long-term capital lease obligation $ 54,310
12. Operating Leases
The System leases equipment and space under noncancelable operating leases expiring at various dates from 2014 to 2022.
Future minimum rental payments under all noncancelable operating leases as of December 31, 2013, are as follows:
2014 $ 8,516 2015 7,057 2016 5,747 2017 4,579 2018 3,786 Thereafter 7,968 $ 37,653
Expense recognized under all operating leases was $11,140 and $12,913 in 2013 and 2012, respectively.
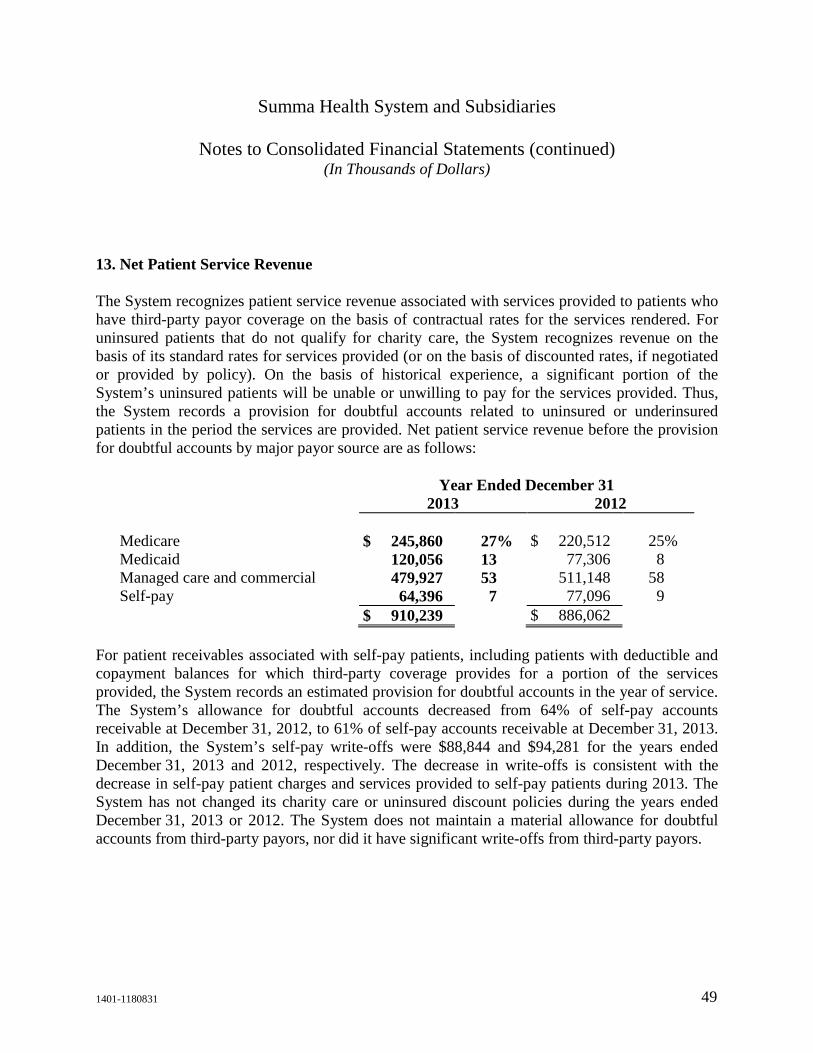
Summa Health System and Subsidiaries
Notes to Consolidated Financial Statements (continued) (In Thousands of Dollars)
1401-1180831 49
13. Net Patient Service Revenue
The System recognizes patient service revenue associated with services provided to patients who have third-party payor coverage on the basis of contractual rates for the services rendered. For uninsured patients that do not qualify for charity care, the System recognizes revenue on the basis of its standard rates for services provided (or on the basis of discounted rates, if negotiated or provided by policy). On the basis of historical experience, a significant portion of the System’s uninsured patients will be unable or unwilling to pay for the services provided. Thus, the System records a provision for doubtful accounts related to uninsured or underinsured patients in the period the services are provided. Net patient service revenue before the provision for doubtful accounts by major payor source are as follows:
Year Ended December 31 2013 2012 Medicare $ 245,860 27% $ 220,512 25% Medicaid 120,056 13 77,306 8 Managed care and commercial 479,927 53 511,148 58 Self-pay 64,396 7 77,096 9 $ 910,239 $ 886,062
For patient receivables associated with self-pay patients, including patients with deductible and copayment balances for which third-party coverage provides for a portion of the services provided, the System records an estimated provision for doubtful accounts in the year of service. The System’s allowance for doubtful accounts decreased from 64% of self-pay accounts receivable at December 31, 2012, to 61% of self-pay accounts receivable at December 31, 2013. In addition, the System’s self-pay write-offs were $88,844 and $94,281 for the years ended December 31, 2013 and 2012, respectively. The decrease in write-offs is consistent with the decrease in self-pay patient charges and services provided to self-pay patients during 2013. The System has not changed its charity care or uninsured discount policies during the years ended December 31, 2013 or 2012. The System does not maintain a material allowance for doubtful accounts from third-party payors, nor did it have significant write-offs from third-party payors.
Summa Health System and Subsidiaries
Notes to Consolidated Financial Statements (continued) (In Thousands of Dollars)
1401-1180831 50
13. Net Patient Service Revenue (continued)
A significant portion of the System’s services is provided to patients under hospitalization or other related health benefit contracts with third-party payors such as Medicare, Medicaid, and other contractors. Differences between amounts reimbursed and normal billing rates are charged to provision for contractual allowances.
The System is paid a prospectively determined rate for the majority of inpatient acute care and outpatient, skilled nursing and rehabilitation services provided (principally Medicare, Medicaid and certain insurers). These rates vary according to a patient classification system that is based on clinical, diagnostic, and other factors. Medicare payments for capital are received on a prospective basis and on a cost reimbursement methodology for Medicaid. Payments are received on a prospective basis for the System’s medical education costs, subject to certain limits. The System is paid for cost reimbursable items at a tentative rate, with final settlement determined after submission of annual cost reports by the System and audits thereof by the Medicare fiscal intermediary. Laws and regulations governing the Medicare and Medicaid programs are extremely complex and subject to interpretation. As a result, there is at least a reasonable possibility that recorded estimates will change by a material amount in the near term. The 2013 and 2012 net patient service revenue increased approximately $752 and $1,885, respectively, due to adjustments of allowances previously estimated that are no longer subject to audits, reviews, and investigations.
The System believes that it is in compliance, in all material respects, with all applicable laws and regulations and is not aware of any pending or threatened investigations involving allegations of potential wrongdoing. While no such regulatory inquiries have been made, compliance with such laws and regulations can be subject to future government review and interpretation and could result in repayments of amounts improperly reimbursed, substantial monetary fines, civil and criminal penalties, and exclusion from the Medicare and Medicaid programs. Management is currently unaware of any regulatory or other legal matters that may have a material adverse effect on the System’s financial position or results from operations.
Summa Health System and Subsidiaries
Notes to Consolidated Financial Statements (continued) (In Thousands of Dollars)
1401-1180831 51
14. Temporarily and Permanently Restricted Net Assets
Temporarily and permanently restricted net assets are available for the following purposes:
December 31 2013 2012 Temporarily restricted net assets:
Research $ 4,060 $ 3,757 Scholarship and loans 1,345 1,204 Education 7,470 4,681 Plant replacement and expansion 10,143 7,063 Other 5,138 5,660
Total temporarily restricted net assets $ 28,156 $ 22,365 Permanently restricted net assets, the income from
which is expendable for various purposes: Research $ 135 $ 135 Scholarship and loans 1,557 1,527 Education 11,324 10,686 Financial support 3,652 3,482 Other 1,303 1,277
Total permanently restricted net assets $ 17,971 $ 17,107 15. Functional Expenses
The System provides general and tertiary health care services to residents within its geographic location. Expenses related to providing these services are as follows:
Year Ended December 31 2013 2012 Health care services $ 1,153,865 $ 1,125,973 General and administrative 219,003 213,709 Fundraising 2,384 1,943 $ 1,375,252 $ 1,341,625
Summa Health System and Subsidiaries
Notes to Consolidated Financial Statements (continued) (In Thousands of Dollars)
1401-1180831 52
16. Income Taxes
The System is a not-for-profit corporation as described in Section 501(c)(3) of the Code and is exempt from federal income taxes pursuant to Section 501(a) of the Code.
The System recorded federal income tax expense, primarily related to SIC as follows:
Year Ended December 31 2013 2012 Current tax (benefit) expense $ (1,217) $ 1,039 Deferred tax expense 539 113 Total federal income tax (benefit) expense $ (678) $ 1,152
The System had deferred tax assets of $2,412 and $3,199, at December 31, 2013 and 2012, respectively, which are included in other assets on the consolidated statements of financial position. The System had deferred tax liabilities of $1,176 and $2,279, at December 31, 2013 and 2012, respectively, which are included in other noncurrent liabilities on the consolidated statements of financial position.
No valuation allowance was recorded for net deferred tax assets at December 31, 2013 or December 31, 2012. The System had net operating loss carryforwards for federal income tax purposes as of December 31, 2013 and 2012, totaling $9,149 and $7,607, respectively. These net operating loss carryforwards are available to offset future federal taxable income, if any, through 2033 and are offset by a valuation allowance, as management does not believe that it is more likely than not they will utilize the carryforwards within the allowable periods.
Summa Health System and Subsidiaries
Notes to Consolidated Financial Statements (continued) (In Thousands of Dollars)
1401-1180831 53
17. Commitments and Contingencies
Lease Agreement – YMCA
The System entered into a ground lease with the YMCA in order for the YMCA to construct a wellness facility (Improvements) on the SAC/STH campus. The System contributed $5,000 to the Improvements and in exchange entered into a lease agreement for a term of 40 years. The System is not obligated to pay any rental payments in conjunction with the lease agreement. The System has an option to purchase the Improvements after 40 years. As a result, the transaction did not meet the requirements of sale-leaseback accounting and is accounted for as if the System owns the Improvements. As of December 31, 2013 and 2012, $8,713 and $8,946, respectively, is recorded in property and equipment, net in the accompanying consolidated statements of financial position.
Litigation
The System is involved in various legal proceedings, including professional liability, employment-related litigation, and other claims with respect to their operations. In the opinion of management, based upon current facts and circumstances, the resolution of these matters is not expected to have a material adverse effect on the financial position or results of operations of the System.
Workers’ Compensation
The System is self-insured for the cost of workers’ compensation coverage and has estimated reserves for claims incurred but not reported. The estimate of workers’ compensation costs is reflected in accrued salaries, wages, and benefits in the amount of $3,864 and $3,883 at December 31, 2013 and 2012, respectively.
Summa Health System and Subsidiaries
Notes to Consolidated Financial Statements (continued) (In Thousands of Dollars)
1401-1180831 54
17. Commitments and Contingencies (continued)
Stop-Loss Insurance
SIC has contracted with several provider networks to provide health care services to SIC members. SIC maintains reinsurance in order to limit its liability for providing certain health care services to its members. Under the provisions of these policies, SIC cedes premiums based on membership. SIC is reimbursed a percentage of charges in excess of a deductible for inpatient and outpatient hospital and related services provided to individual members. SIC purchases reinsurance for losses in excess of $225 per year for each enrolled Medicare member and $300 per year for each commercial member for eligible hospital services. This coverage is subject to certain contracted limits and a lifetime benefit limit of $2,000 per member. The first $100 of eligible commercial reimbursement comes from MAC, a wholly owned subsidiary of SHS. Reinsurance premiums ceded of $3,772 and $3,176 are included as a reduction in premiums earned for the years ended December 31, 2013 and 2012, respectively. Recoveries of $4,512 and $2,713 were received and included as a reduction in claims expense for the years ended December 31, 2013 and 2012, respectively. Reinsurance does not relieve SIC from its obligations to members. Failure of reinsurers to honor their obligations could result in losses to SIC; consequently, allowances are established for amounts when deemed uncollectible. There is no allowance recorded at December 31, 2013 or 2012, for recoverables from reinsurers. SIC evaluates the financial condition of its reinsurers and monitors its concentrations of credit risk.
State Guarantee Fund Deposit
Current state laws governing HMOs in Ohio require a deposit to be maintained in the name of the Ohio Department of Insurance (ODI). Accordingly, SummaCare, a subsidiary of SIC, purchased a U.S. Treasury Bond in the name of the ODI. The U.S. Treasury Bond, totaling approximately $470 and $469 is included in other assets at December 31, 2013 and 2012, respectively.
Regulatory
SIC and SummaCare, a subsidiary of SIC, are required to periodically file financial statements with regulatory agencies, including the Ohio Department of Insurance (ODI), in accordance with statutory accounting and reporting practices. SIC and SummaCare must comply with the minimum statutory net worth requirements under the regulations of the ODI. The regulatory net worth of SIC and SummaCare exceeded the aggregate minimum requirements.
Summa Health System and Subsidiaries
Notes to Consolidated Financial Statements (continued) (In Thousands of Dollars)
1401-1180831 55
17. Commitments and Contingencies (continued)
On November 15, 2013, SummaCare converted from a for-profit corporation to a non-profit corporation under Ohio law. This conversion was approved by the ODI.
Dividend Restriction
In accordance with the Ohio Revised Code, SIC must receive approval from the ODI to pay a dividend or distribution during 2013 which, when combined with dividends or distributions paid within the preceding 12 months, exceeds the greater of either (a) 10% of SIC’s statutory capital and surplus as of December 31, 2012, or (b) SIC’s net gain from operations on a statutory basis for 2012. Accordingly, during 2013, prior approval from the ODI is required for any dividend or distribution payment that exceeds $3,547.
18. Related Parties
Certain members of the System’s Board of Directors serve as management of entities that provide services to the System, including certain banking, and supplier relationships. Also, certain members of the System’s Board of Directors are physicians who serve as medical directors or provide other services in the System.
In September 2013, the System finalized a partnership with HealthSpan Partners (HSP), a secular auxiliary organization of Catholic Health Partners, whereby HSP became a 30% (minority) owner of the System by investing $250 million in conjunction with a Definitive Agreement. HSP does not manage or control the operations of the System. The partnership is intended to improve access to affordable quality care and further develop the System’s integrated patient care delivery model. Summa will pay HSP for costs HSP incurs to assist the System in achieving certain performance improvement levels. For the first ten years of the partnership, neither partner can independently require dissolution of the partnership.
The System incurred approximately $2,000 in 2013 for services provided by HSP which are included in contracts and professional fees expense in the consolidated statements of operations and changes in net assets.
Summa Health System and Subsidiaries
Notes to Consolidated Financial Statements (continued) (In Thousands of Dollars)
1401-1180831 56
19. Venture Activities
Summa Western Reserve Hospital, LLC
The System formed a joint venture in a for-profit community hospital, Summa Western Reserve Hospital, LLC (SWRH). The System owns 40% of SWRH but does not manage or control the operations. The investment is accounted for under the equity method wherein the System’s share of the income (loss) of SWRH is reflected in the System’s consolidated statements of operations and changes in net assets and as an increase (decrease) in the carrying value of the investment.
The System renders certain services to SWRH. Total services rendered to SWRH during 2013 and 2012 were $1,919 and $2,047, respectively, and is included in other operating revenue in the accompanying consolidated statements of operations and changes in net assets. The total net receivable from SWRH related to these agreements was $272 at December 31, 2013 and $155 at December 31, 2012, and is recorded in other receivables in the accompanying consolidated statements of financial position.
The System has a facility and equipment lease agreement with SWRH that expired on June 30, 2012. Following the initial three-year term that matured in 2012, SWRH has available three one-year renewal options. The option on the facility lease was exercised and is in effect through June 30, 2014. Effective March 15, 2013, SWRH signed a purchase agreement to purchase the leased equipment at fair value. The System recorded a gain on the sale of the leased equipment of $692 in other operating revenue. The System has recorded rental income of $3,144 and $4,134 for 2013 and 2012, respectively, in other operating revenue in the accompanying consolidated statements of operations and changes in net assets related to these lease agreements.
At December 31, 2013 and 2012, the investment in SWRH was approximately $9,967 and $9,100, respectively, and is included in investment in ventures in the consolidated statements of financial position. The System recorded a net gain on its investment of $1,184 and $662 in 2013 and 2012, respectively, which is included in venture income in the consolidated statements of operations and changes in net assets.
Summa Health System and Subsidiaries
Notes to Consolidated Financial Statements (continued) (In Thousands of Dollars)
1401-1180831 57
19. Venture Activities (continued)
Crystal Clinic Orthopaedic Center, LLC
The System has a joint venture in a for-profit orthopaedic hospital, Crystal Clinic Orthopaedic Center, LLC (CCOC). The System owns 49.65% of the CCOC but does not manage or control the operations. The investment is accounted for under the equity method wherein the System’s share of the income (loss) of CCOC is reflected in the System’s consolidated statements of operations and changes in net assets as an increase (decrease) in the carrying value of the investment.
The System renders certain services to CCOC. Total services rendered to CCOC for 2013 and 2012 were $5,638 and $6,184, respectively, and are included in other operating revenue in the accompanying consolidated statements of operations and changes in net assets. The total net receivable from CCOC related to these agreements was $767 at December 31, 2013 and $492 at December 31, 2012, and is recorded in other receivables in the accompanying consolidated statements of financial position.
The System has a facility lease agreement with CCOC which expires January 1, 2018. Annual base rental income is $2,600. The System has recorded $2,600 for 2013 and 2012 in other operating revenue in the accompanying consolidated statements of operations and changes in net assets related to this lease agreement.
In 2009, the System received a $23,000 promissory note from the CCOC for the value of non-trauma orthopaedic service offerings contributed to CCOC in excess of the System’s underlying equity in the net assets of the CCOC. The promissory note was not recorded in the consolidated statements of financial position when applying carryover basis accounting. The note was paid in full during 2012, and the System recorded $23,000 in other operating revenue in the consolidated statements of operations and changes in net assets. Interest recognized on the note in 2012 was $5,856, and is included in investment income in the accompanying consolidated statement of operations and changes in net assets.
Summa Health System and Subsidiaries
Notes to Consolidated Financial Statements (continued) (In Thousands of Dollars)
1401-1180831 58
19. Venture Activities (continued)
The System entered into a promissory note dated March 2009 with the CCOC for the advancement of funds related to a capital project. The note receivable at December 31, 2013 and 2012 was $10,524 and is recorded in noncurrent assets on the consolidated statements of financial position. Effective November 1, 2012, the interest rate was amended from 11% per annum to 7.75%. Principal payments on the note are due in 120 consecutive payments beginning in April 15, 2014. The System did not accrue interest on the note for the period May 2009 through December 2012; the CCOC paid accrued interest on the note related to this period of $4,306 in December 2012 and $816 in 2013 which is included in investment income in the accompanying consolidated statements of operations and changes in net assets.
The System entered into a promissory note dated May 2009 with the CCOC for the advancement of funds related to working capital and other operational needs. The note receivable is $3,836 and $5,191 at December 31, 2013 and 2012, respectively, and is recorded in other noncurrent assets in the consolidated statements of financial position. The note bears interest at 6%. Interest recorded on the note was $274 in 2013 and 2012 and is included in investment income in the accompanying consolidated statements of operations and changes in net assets.
As of December 31, 2013 and 2012, the System’s investment in the CCOC was $1,916 and $0, respectively, and is included in investment in ventures in the consolidated statements of financial position. The System’s share (49.65%) of the CCOC’s equity balance was approximately $25,621 and $20,100 at December 31, 2013 and 2012, respectively. The System received distributions of $2,644 and $3,598 in 2013 and 2012, respectively, which is included in venture income in the consolidated statements of operations and changes in net assets.
ARIS Teleradiology Holdings, Inc.
The System has a joint venture in a for-profit Teleradiology company, ARIS Teleradiology, LLC (ARIS). The System does not manage or control the operations of ARIS. The investment is accounted for under the equity method wherein the System’s share of the income (loss) of ARIS is reflected in the System’s consolidated statements of operations and changes in net assets and as an increase (decrease) in the carrying value of the investment.
The System’s investment in ARIS was approximately $7,353 and $7,775 at December 31, 2013 and 2012, respectively. The System recorded a loss on its investment of $422 and $780 in 2013 and 2012, respectively, which is included in venture income in the consolidated statements of operations and changes in net assets.
Summa Health System and Subsidiaries
Notes to Consolidated Financial Statements (continued) (In Thousands of Dollars)
1401-1180831 59
19. Venture Activities (continued)
Cornerstone Medical Services – Midwest, LLC
The System has a joint venture in a for-profit home medical equipment and supply company, Cornerstone Medical Services – Midwest, LLC (CSMW). The System owns 50% of CSMW and does not manage or control the operations. The investment is accounted for under the equity method wherein the System’s share of the income (loss) of CSMW is reflected in the System’s consolidated statements of operations and changes in net assets and as an increase (decrease) in the carrying value of the investment.
The System’s investment in CSMW was approximately $6,349 and $6,900 at December 31, 2013 and 2012, respectively. The System recorded a net gain on its investment of $524 and $1,794 in 2013 and 2012, respectively, which is included in venture income in the consolidated statements of operations and changes in net assets.
Patient Centered Collaborative Network
In 2013, the System formed a joint venture in Patient Centered Collaborative Network, LLC (PCCN) contributing $750. The System owns 49% of PCCN and does not manage or control the operations. The investment is accounted for under the equity method wherein the System’s share of the income (loss) of PCCN is reflected in the System’s consolidated statements of operations and changes in net assets and as an increase (decrease) in the carrying value of the investment.
At December 31, 2013, the System’s investment in PCCN was approximately $860. The System recorded a net gain on its investment of $237 in 2013 which is included in venture income in the consolidated statements of operations and changes in net assets.
20. Subsequent Events
The System evaluated events and transactions occurring subsequent to December 31, 2013 through April 18, 2014, the date the consolidated financial statements were issued.

1401-1180831
Supplementary Information
1401-1180831 60
Report of Independent Auditors on Supplementary Information
The Board of Directors Summa Health System
Our audits were conducted for the purpose of forming an opinion on the consolidated financial statements as a whole. The following consolidating statements of financial position and statements of operations are presented for purposes of additional analysis and are not a required part of the consolidated financial statements. Such information is the responsibility of management and was derived from and relates directly to the underlying accounting and other records used to prepare the consolidated financial statements. The information has been subjected to the auditing procedures applied in the audits of the consolidated financial statements and certain additional procedures, including comparing and reconciling such information directly to the underlying accounting and other records used to prepare the consolidated financial statements or to the consolidated financial statements themselves, and other additional procedures in accordance with auditing standards generally accepted in the United States. In our opinion, the information is fairly stated in all material respects in relation to the consolidated financial statements taken as a whole.
April 18, 2014
A member firm of Ernst & Young Global Limited
Ernst & Young LLP Suite 1200 50 South Main Street Akron, OH 44308
Tel: +1 330 255 5800 Fax: +1 330 255 5830 ey.com
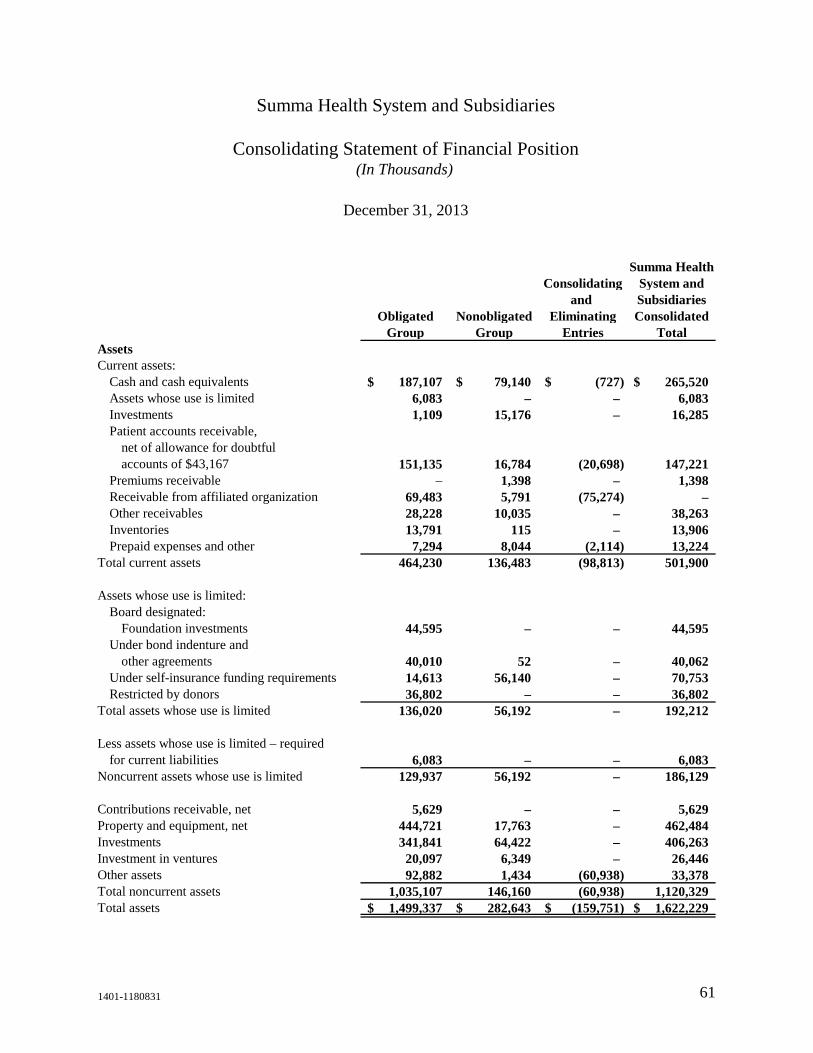
1401-1180831 61
Summa HealthConsolidating System and
and SubsidiariesObligated Nonobligated Eliminating Consolidated
Group Group Entries TotalAssets Current assets:
Cash and cash equivalents 187,107$ 79,140$ (727)$ 265,520$ Assets whose use is limited 6,083 – – 6,083 Investments 1,109 15,176 – 16,285 Patient accounts receivable,
net of allowance for doubtful accounts of $43,167 151,135 16,784 (20,698) 147,221
Premiums receivable – 1,398 – 1,398 Receivable from affiliated organization 69,483 5,791 (75,274) – Other receivables 28,228 10,035 – 38,263 Inventories 13,791 115 – 13,906 Prepaid expenses and other 7,294 8,044 (2,114) 13,224
Total current assets 464,230 136,483 (98,813) 501,900 Assets whose use is limited:
Board designated: Foundation investments 44,595 – – 44,595
Under bond indenture and other agreements 40,010 52 – 40,062
Under self-insurance funding requirements 14,613 56,140 – 70,753 Restricted by donors 36,802 – – 36,802
Total assets whose use is limited 136,020 56,192 – 192,212 Less assets whose use is limited – required
for current liabilities 6,083 – – 6,083 Noncurrent assets whose use is limited 129,937 56,192 – 186,129 Contributions receivable, net 5,629 – – 5,629 Property and equipment, net 444,721 17,763 – 462,484 Investments 341,841 64,422 – 406,263 Investment in ventures 20,097 6,349 – 26,446 Other assets 92,882 1,434 (60,938) 33,378 Total noncurrent assets 1,035,107 146,160 (60,938) 1,120,329 Total assets 1,499,337$ 282,643$ (159,751)$ 1,622,229$
Summa Health System and Subsidiaries
Consolidating Statement of Financial Position(In Thousands)
December 31, 2013
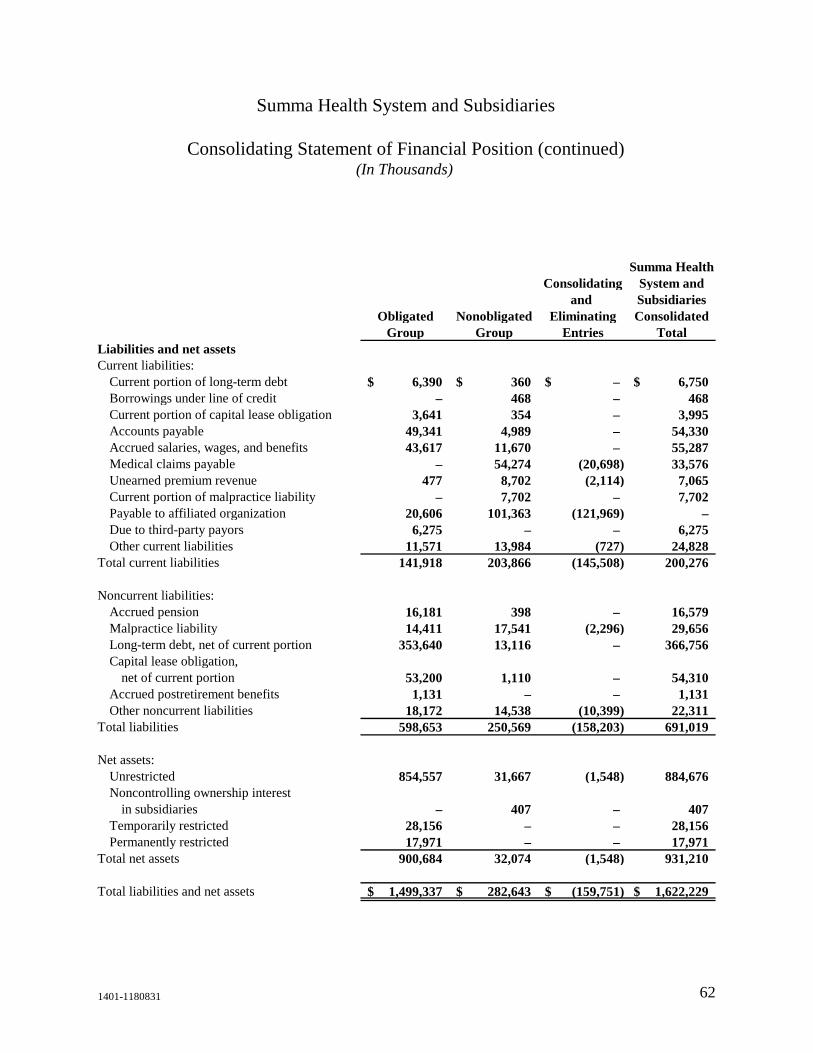
1401-1180831 62
Summa HealthConsolidating System and
and SubsidiariesObligated Nonobligated Eliminating Consolidated
Group Group Entries TotalLiabilities and net assets Current liabilities:
Current portion of long-term debt 6,390$ 360$ –$ 6,750$ Borrowings under line of credit – 468 – 468 Current portion of capital lease obligation 3,641 354 – 3,995 Accounts payable 49,341 4,989 – 54,330 Accrued salaries, wages, and benefits 43,617 11,670 – 55,287 Medical claims payable – 54,274 (20,698) 33,576 Unearned premium revenue 477 8,702 (2,114) 7,065 Current portion of malpractice liability – 7,702 – 7,702 Payable to affiliated organization 20,606 101,363 (121,969) – Due to third-party payors 6,275 – – 6,275 Other current liabilities 11,571 13,984 (727) 24,828
Total current liabilities 141,918 203,866 (145,508) 200,276 Noncurrent liabilities:
Accrued pension 16,181 398 – 16,579 Malpractice liability 14,411 17,541 (2,296) 29,656 Long-term debt, net of current portion 353,640 13,116 – 366,756 Capital lease obligation,
net of current portion 53,200 1,110 – 54,310 Accrued postretirement benefits 1,131 – – 1,131 Other noncurrent liabilities 18,172 14,538 (10,399) 22,311
Total liabilities 598,653 250,569 (158,203) 691,019 Net assets:
Unrestricted 854,557 31,667 (1,548) 884,676 Noncontrolling ownership interest
in subsidiaries – 407 – 407 Temporarily restricted 28,156 – – 28,156 Permanently restricted 17,971 – – 17,971
Total net assets 900,684 32,074 (1,548) 931,210 Total liabilities and net assets 1,499,337$ 282,643$ (159,751)$ 1,622,229$
Summa Health System and Subsidiaries
Consolidating Statement of Financial Position (continued)(In Thousands)
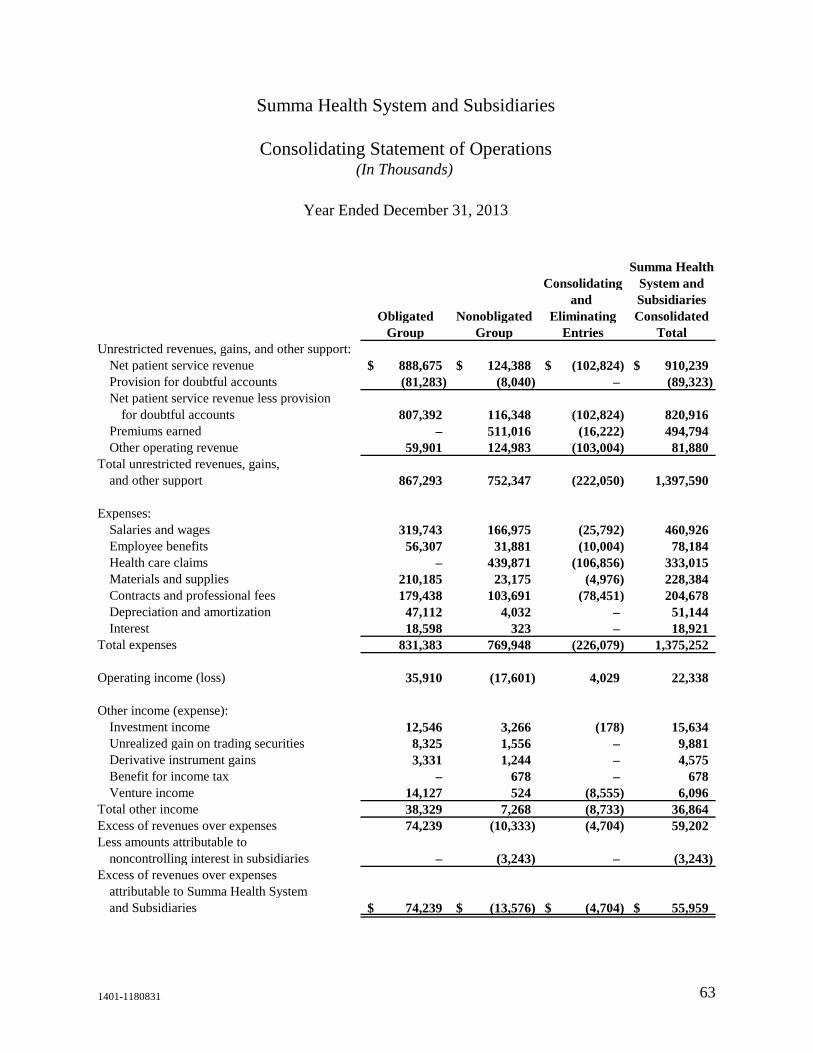
1401-1180831 63
Summa HealthConsolidating System and
and SubsidiariesObligated Nonobligated Eliminating Consolidated
Group Group Entries TotalUnrestricted revenues, gains, and other support:
Net patient service revenue 888,675$ 124,388$ (102,824)$ 910,239$ Provision for doubtful accounts (81,283) (8,040) – (89,323) Net patient service revenue less provision
for doubtful accounts 807,392 116,348 (102,824) 820,916 Premiums earned – 511,016 (16,222) 494,794 Other operating revenue 59,901 124,983 (103,004) 81,880
Total unrestricted revenues, gains, and other support 867,293 752,347 (222,050) 1,397,590
Expenses:
Salaries and wages 319,743 166,975 (25,792) 460,926 Employee benefits 56,307 31,881 (10,004) 78,184 Health care claims – 439,871 (106,856) 333,015 Materials and supplies 210,185 23,175 (4,976) 228,384 Contracts and professional fees 179,438 103,691 (78,451) 204,678 Depreciation and amortization 47,112 4,032 – 51,144 Interest 18,598 323 – 18,921
Total expenses 831,383 769,948 (226,079) 1,375,252 Operating income (loss) 35,910 (17,601) 4,029 22,338 Other income (expense):
Investment income 12,546 3,266 (178) 15,634 Unrealized gain on trading securities 8,325 1,556 – 9,881 Derivative instrument gains 3,331 1,244 – 4,575 Benefit for income tax – 678 – 678 Venture income 14,127 524 (8,555) 6,096
Total other income 38,329 7,268 (8,733) 36,864 Excess of revenues over expenses 74,239 (10,333) (4,704) 59,202 Less amounts attributable to
noncontrolling interest in subsidiaries – (3,243) – (3,243) Excess of revenues over expenses
attributable to Summa Health Systemand Subsidiaries 74,239$ (13,576)$ (4,704)$ 55,959$
Summa Health System and Subsidiaries
Consolidating Statement of Operations(In Thousands)
Year Ended December 31, 2013
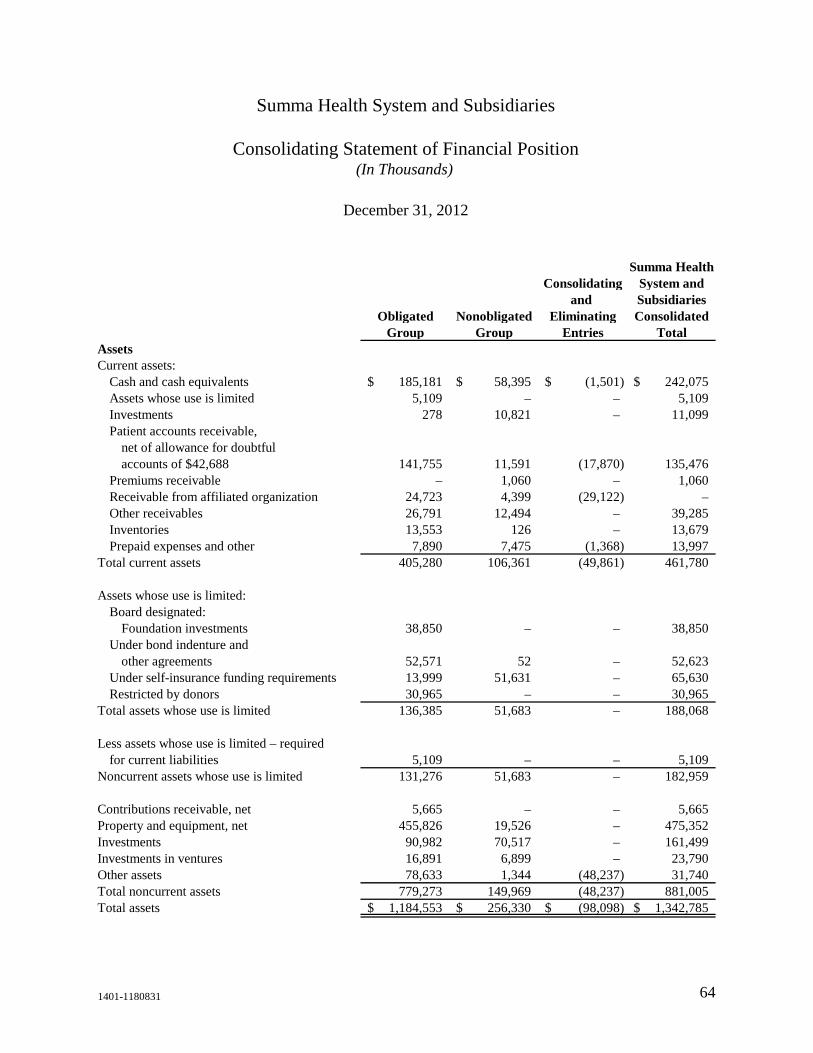
1401-1180831 64
Summa HealthConsolidating System and
and SubsidiariesObligated Nonobligated Eliminating Consolidated
Group Group Entries TotalAssets Current assets:
Cash and cash equivalents 185,181$ 58,395$ (1,501)$ 242,075$ Assets whose use is limited 5,109 – – 5,109 Investments 278 10,821 – 11,099 Patient accounts receivable,
net of allowance for doubtful accounts of $42,688 141,755 11,591 (17,870) 135,476
Premiums receivable – 1,060 – 1,060 Receivable from affiliated organization 24,723 4,399 (29,122) – Other receivables 26,791 12,494 – 39,285 Inventories 13,553 126 – 13,679 Prepaid expenses and other 7,890 7,475 (1,368) 13,997
Total current assets 405,280 106,361 (49,861) 461,780 Assets whose use is limited:
Board designated: Foundation investments 38,850 – – 38,850
Under bond indenture and other agreements 52,571 52 – 52,623
Under self-insurance funding requirements 13,999 51,631 – 65,630 Restricted by donors 30,965 – – 30,965
Total assets whose use is limited 136,385 51,683 – 188,068 Less assets whose use is limited – required
for current liabilities 5,109 – – 5,109 Noncurrent assets whose use is limited 131,276 51,683 – 182,959 Contributions receivable, net 5,665 – – 5,665 Property and equipment, net 455,826 19,526 – 475,352 Investments 90,982 70,517 – 161,499 Investments in ventures 16,891 6,899 – 23,790 Other assets 78,633 1,344 (48,237) 31,740 Total noncurrent assets 779,273 149,969 (48,237) 881,005 Total assets 1,184,553$ 256,330$ (98,098)$ 1,342,785$
Summa Health System and Subsidiaries
Consolidating Statement of Financial Position(In Thousands)
December 31, 2012
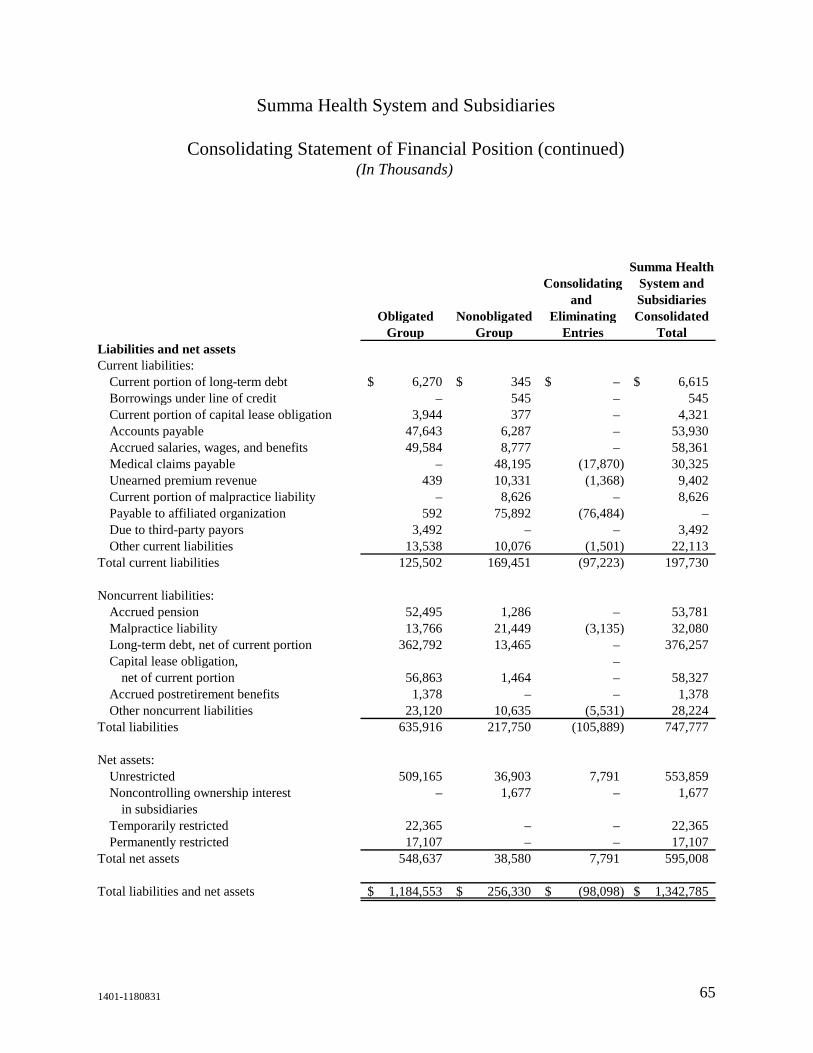
1401-1180831 65
Summa HealthConsolidating System and
and SubsidiariesObligated Nonobligated Eliminating Consolidated
Group Group Entries TotalLiabilities and net assets Current liabilities:
Current portion of long-term debt 6,270$ 345$ –$ 6,615$ Borrowings under line of credit – 545 – 545 Current portion of capital lease obligation 3,944 377 – 4,321 Accounts payable 47,643 6,287 – 53,930 Accrued salaries, wages, and benefits 49,584 8,777 – 58,361 Medical claims payable – 48,195 (17,870) 30,325 Unearned premium revenue 439 10,331 (1,368) 9,402 Current portion of malpractice liability – 8,626 – 8,626 Payable to affiliated organization 592 75,892 (76,484) – Due to third-party payors 3,492 – – 3,492 Other current liabilities 13,538 10,076 (1,501) 22,113
Total current liabilities 125,502 169,451 (97,223) 197,730 Noncurrent liabilities:
Accrued pension 52,495 1,286 – 53,781 Malpractice liability 13,766 21,449 (3,135) 32,080 Long-term debt, net of current portion 362,792 13,465 – 376,257 Capital lease obligation, –
net of current portion 56,863 1,464 – 58,327 Accrued postretirement benefits 1,378 – – 1,378 Other noncurrent liabilities 23,120 10,635 (5,531) 28,224
Total liabilities 635,916 217,750 (105,889) 747,777 Net assets:
Unrestricted 509,165 36,903 7,791 553,859 Noncontrolling ownership interest – 1,677 – 1,677
in subsidiaries Temporarily restricted 22,365 – – 22,365 Permanently restricted 17,107 – – 17,107
Total net assets 548,637 38,580 7,791 595,008 Total liabilities and net assets 1,184,553$ 256,330$ (98,098)$ 1,342,785$
Summa Health System and Subsidiaries
Consolidating Statement of Financial Position (continued)(In Thousands)
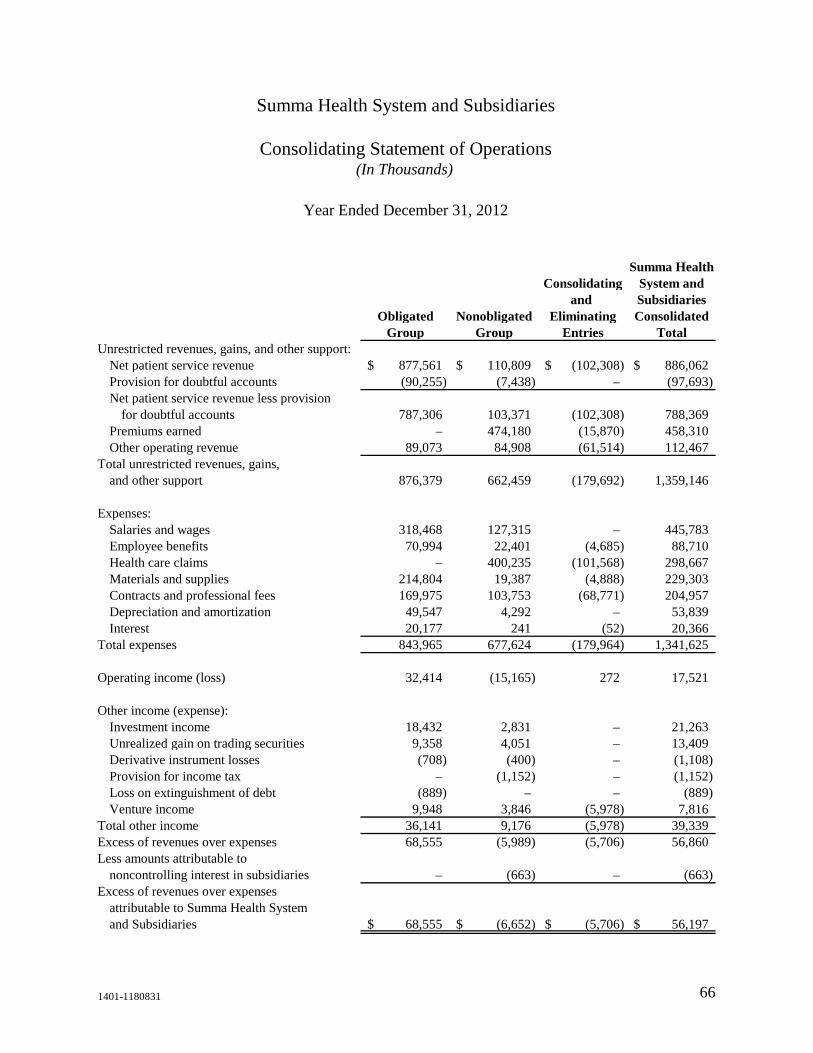
1401-1180831 66
Summa HealthConsolidating System and
and SubsidiariesObligated Nonobligated Eliminating Consolidated
Group Group Entries TotalUnrestricted revenues, gains, and other support:
Net patient service revenue 877,561$ 110,809$ (102,308)$ 886,062$ Provision for doubtful accounts (90,255) (7,438) – (97,693) Net patient service revenue less provision
for doubtful accounts 787,306 103,371 (102,308) 788,369 Premiums earned – 474,180 (15,870) 458,310 Other operating revenue 89,073 84,908 (61,514) 112,467
Total unrestricted revenues, gains, and other support 876,379 662,459 (179,692) 1,359,146
Expenses:
Salaries and wages 318,468 127,315 – 445,783 Employee benefits 70,994 22,401 (4,685) 88,710 Health care claims – 400,235 (101,568) 298,667 Materials and supplies 214,804 19,387 (4,888) 229,303 Contracts and professional fees 169,975 103,753 (68,771) 204,957 Depreciation and amortization 49,547 4,292 – 53,839 Interest 20,177 241 (52) 20,366
Total expenses 843,965 677,624 (179,964) 1,341,625 Operating income (loss) 32,414 (15,165) 272 17,521 Other income (expense):
Investment income 18,432 2,831 – 21,263 Unrealized gain on trading securities 9,358 4,051 – 13,409 Derivative instrument losses (708) (400) – (1,108) Provision for income tax – (1,152) – (1,152) Loss on extinguishment of debt (889) – – (889) Venture income 9,948 3,846 (5,978) 7,816
Total other income 36,141 9,176 (5,978) 39,339 Excess of revenues over expenses 68,555 (5,989) (5,706) 56,860 Less amounts attributable to
noncontrolling interest in subsidiaries – (663) – (663) Excess of revenues over expenses
attributable to Summa Health Systemand Subsidiaries 68,555$ (6,652)$ (5,706)$ 56,197$
Summa Health System and Subsidiaries
Consolidating Statement of Operations(In Thousands)
Year Ended December 31, 2012
EY | Assurance | Tax | Transactions | Advisory
About EYEY is a global leader in assurance, tax, transaction and advisory services. The insights and quality services we deliver help build trust and confidence in the capital markets and in economies the world over. We develop outstanding leaders who team to deliver on our promises to all of our stakeholders. In so doing, we play a critical role in building a better working world for our people, for our clients and for our communities.
EY refers to the global organization, and may refer to one or more, of the member firms of Ernst & Young Global Limited, each of which is a separate legal entity. Ernst & Young Global Limited, a UK company limited by guarantee, does not provide services to clients. For more information about our organization, please visit ey.com.
© 2013 Ernst & Young LLP. All Rights Reserved.
ey.com