Embed Size (px)
Citation preview
SUGGESTED SOLUTIONS
All Rights Reserved
KE2 – Management Accounting Information
March 2017
KE2 – Suggested Solutions March 2017 Page 2 of 18
SECTION 01 Answer 01 1.1
1.2
1.3
1.4
Relevant Learning outcome : 1.1.2 Explain the nature, scope and purpose of cost classifications (direct/indirect, fixed/ variable/semi-variable, production/period, controllable/non-controllable, relevant/ non-relevant costs). Study Text reference: Page No. 84, 86, 89, 92
Correct Answer: D
Relevant Learning outcome : 1.3.1 Explain the types of remuneration (time based, piece based and incentive schemes) and accounting for cost of labour (including flexible working and labour turnover). Study Text reference: Page No. 176
Correct Answer: C
Relevant Learning outcome : 2.1.1 Calculate mark-up and margin, and arrive at the amount in rupees for given mark-up/margin percentages in scenarios (including VAT, income tax and discounts) Study Text reference: Page No. 22
Rs.
Retail price = 2070/90% 2,300.00
Discounted price to the retail shop (75%*2,300) 1,725.00
After VAT (1,725/1.15) 1,500.00
Profit margin (20%) 300.00
Cost of the item 1,200.00
Correct answer is A
Relevant Learning outcome : 2.3.1
Calculate and interpret mean, standard deviation and coefficient of variation.
Study Text reference: Page No. 33
Correct Answer: B
KE2 – Suggested Solutions March 2017 Page 3 of 18
1.5
1.6
1.7
1.8
1.9
1.10
(Total 20 marks)
Relevant Learning outcome : 2.6.1 Interpret simple and aggregate indices. Study Text reference: Page No. 42 Correct Answer: A
Relevant Learning outcome : 4.1.1 Calculate simple and compound interest, effective rate of interest, the yield amount when the rate of interest changes with time, regular investment interest, and amortisation schedule. Study Text reference: Page No. 413 Correct Answer: B
Relevant Learning outcome : 5.2.1 Calculate and interpret basic variances on direct material cost, direct labour cost, variable production overheads, fixed production overheads, and sales. Study Text reference: Page No. 520 Correct Answer: C
Relevant Learning outcome : 6.1.1 Identify linear and quadratic functions related to revenue, costs and profit in the algebraic, and graphical forms. Study Text reference: Page No. 554, 555 Correct Answer: C
Relevant Learning outcome : 7.1.2 Discuss the purposes of budgeting Study Text reference: Page No. 606, 607, 622 Correct Answer: C
Relevant Learning outcome : 7.4.1 Discuss the purposes of budgeting Study Text reference: Page No. 611 Correct Answer: B
KE2 – Suggested Solutions March 2017 Page 4 of 18
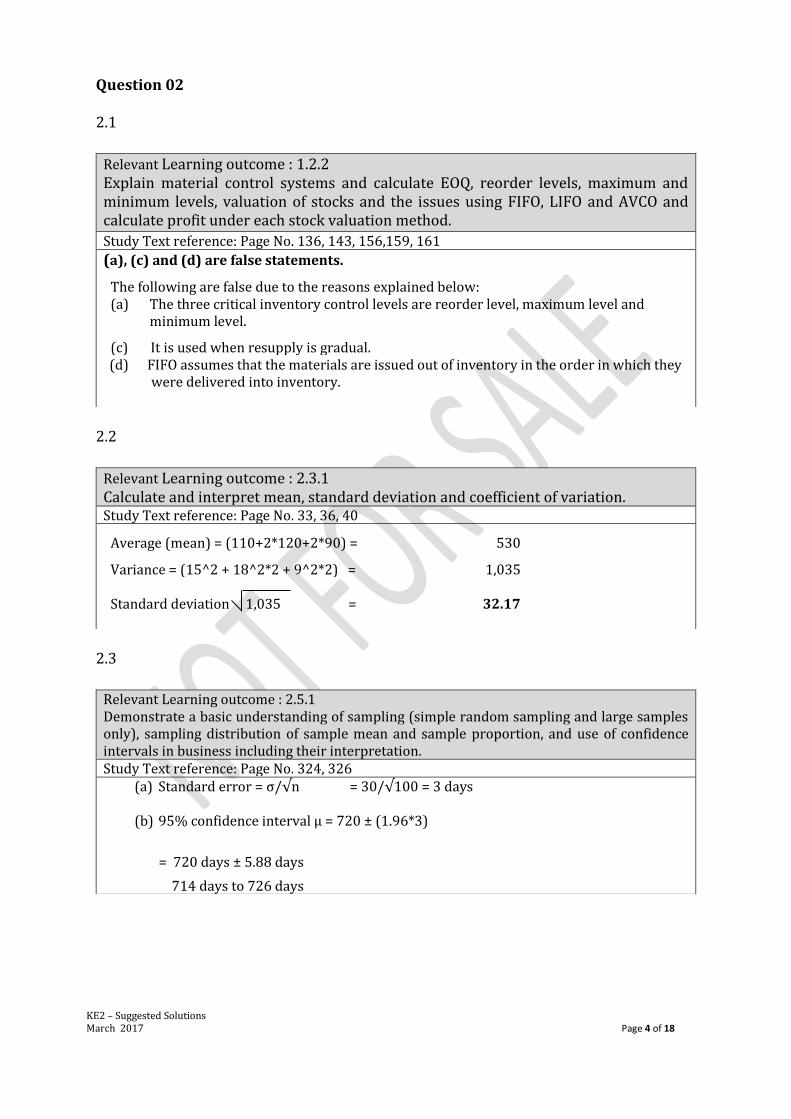
Question 02 2.1
2.2
2.3
Relevant Learning outcome : 1.2.2 Explain material control systems and calculate EOQ, reorder levels, maximum and minimum levels, valuation of stocks and the issues using FIFO, LIFO and AVCO and calculate profit under each stock valuation method.
Study Text reference: Page No. 136, 143, 156,159, 161
(a), (c) and (d) are false statements.
The following are false due to the reasons explained below: (a) The three critical inventory control levels are reorder level, maximum level and
minimum level.
(c) It is used when resupply is gradual. (d) FIFO assumes that the materials are issued out of inventory in the order in which they
were delivered into inventory.
Relevant Learning outcome : 2.3.1 Calculate and interpret mean, standard deviation and coefficient of variation. Study Text reference: Page No. 33, 36, 40
Average (mean) = (110+2*120+2*90) = 530
Variance = (15^2 + 18^2*2 + 9^2*2) = 1,035
Standard deviation 1,035
=
32.17
Relevant Learning outcome : 2.5.1 Demonstrate a basic understanding of sampling (simple random sampling and large samples only), sampling distribution of sample mean and sample proportion, and use of confidence intervals in business including their interpretation. Study Text reference: Page No. 324, 326
(a) Standard error = σ/√n
= 30/√100 = 3 days
(b) 95% confidence interval µ = 720 ± (1.96*3)
= 720 days ± 5.88 days
714 days to 726 days
KE2 – Suggested Solutions March 2017 Page 5 of 18
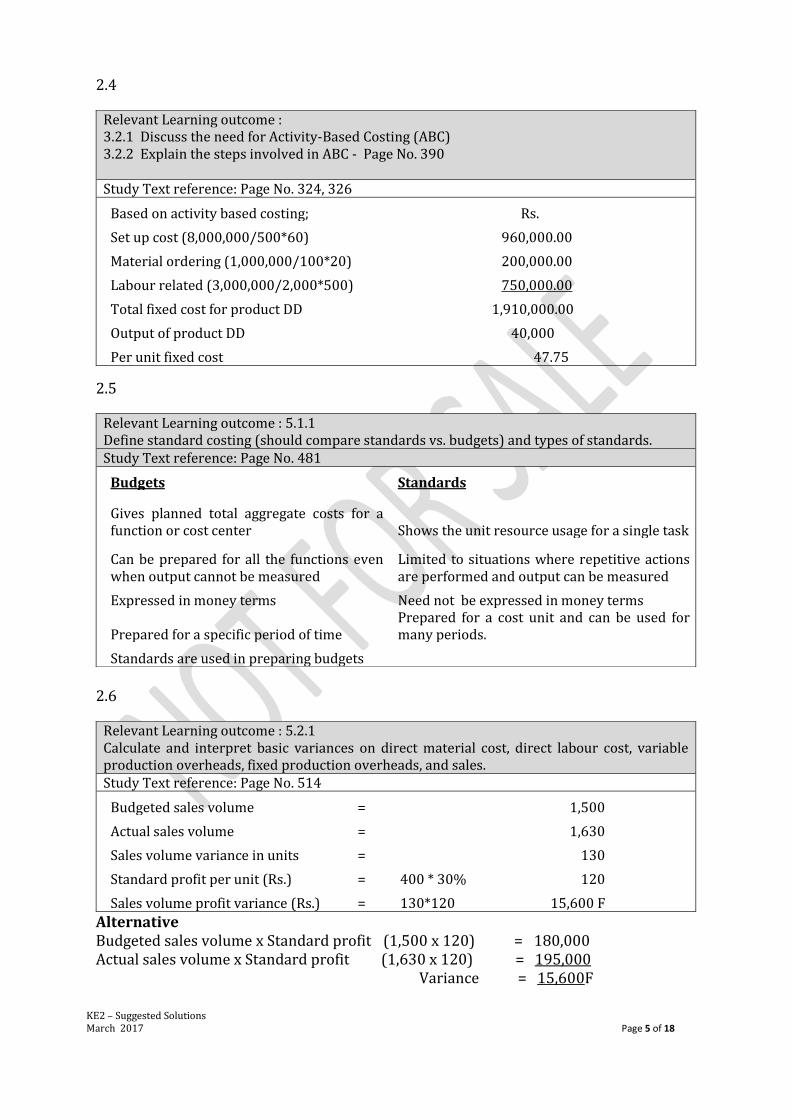
2.4
2.5
2.6
Alternative Budgeted sales volume x Standard profit (1,500 x 120) = 180,000 Actual sales volume x Standard profit (1,630 x 120) = 195,000 Variance = 15,600F
Relevant Learning outcome : 3.2.1 Discuss the need for Activity-Based Costing (ABC) 3.2.2 Explain the steps involved in ABC - Page No. 390 Study Text reference: Page No. 324, 326
Based on activity based costing; Rs.
Set up cost (8,000,000/500*60) 960,000.00
Material ordering (1,000,000/100*20) 200,000.00
Labour related (3,000,000/2,000*500) 750,000.00
Total fixed cost for product DD 1,910,000.00
Output of product DD 40,000
Per unit fixed cost 47.75
Relevant Learning outcome : 5.1.1 Define standard costing (should compare standards vs. budgets) and types of standards. Study Text reference: Page No. 481
Budgets Standards
Gives planned total aggregate costs for a function or cost center Shows the unit resource usage for a single task
Can be prepared for all the functions even when output cannot be measured
Limited to situations where repetitive actions are performed and output can be measured
Expressed in money terms Need not be expressed in money terms
Prepared for a specific period of time Prepared for a cost unit and can be used for many periods.
Standards are used in preparing budgets
Relevant Learning outcome : 5.2.1 Calculate and interpret basic variances on direct material cost, direct labour cost, variable production overheads, fixed production overheads, and sales. Study Text reference: Page No. 514
Budgeted sales volume = 1,500
Actual sales volume = 1,630
Sales volume variance in units = 130
Standard profit per unit (Rs.) = 400 * 30% 120
Sales volume profit variance (Rs.) = 130*120 15,600 F
KE2 – Suggested Solutions March 2017 Page 6 of 18
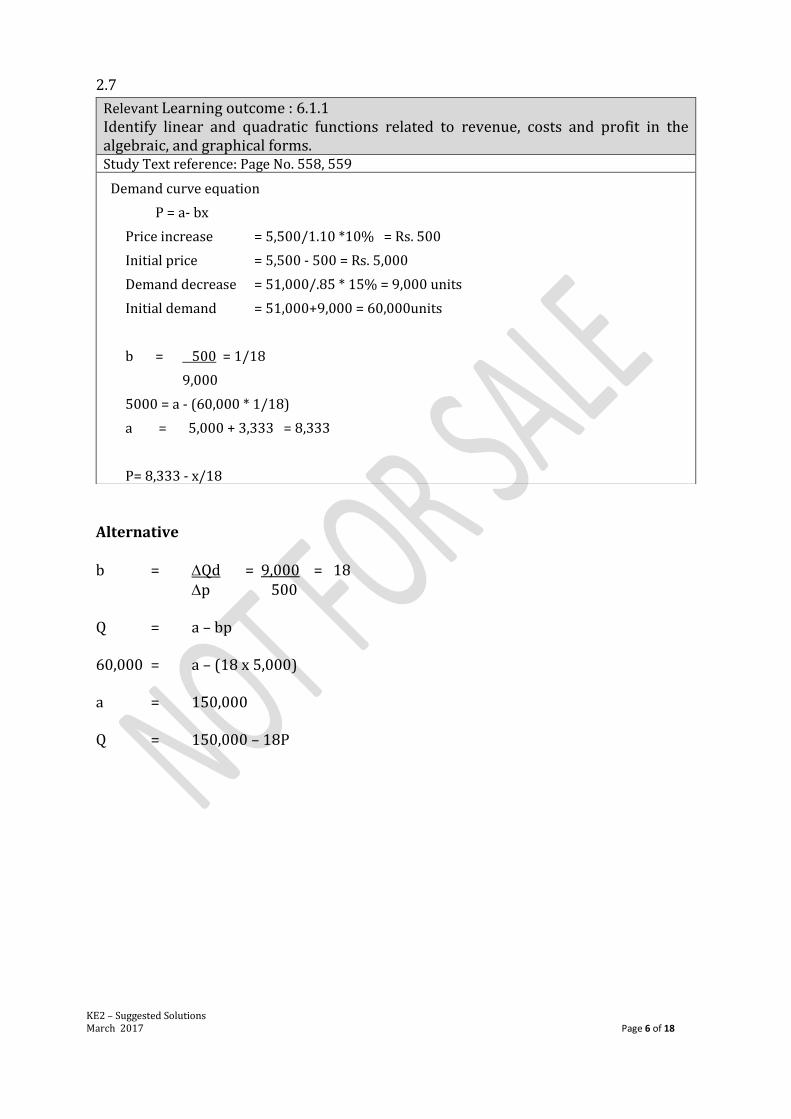
2.7
Alternative b = Qd = 9,000 = 18 p 500 Q = a – bp 60,000 = a – (18 x 5,000) a = 150,000 Q = 150,000 – 18P
Relevant Learning outcome : 6.1.1 Identify linear and quadratic functions related to revenue, costs and profit in the algebraic, and graphical forms. Study Text reference: Page No. 558, 559
Demand curve equation
P = a- bx
Price increase = 5,500/1.10 *10% = Rs. 500
Initial price = 5,500 - 500 = Rs. 5,000
Demand decrease = 51,000/.85 * 15% = 9,000 units
Initial demand = 51,000+9,000 = 60,000units
b = 500 = 1/18
9,000
5000 = a - (60,000 * 1/18)
a = 5,000 + 3,333 = 8,333
P= 8,333 - x/18
KE2 – Suggested Solutions March 2017 Page 7 of 18
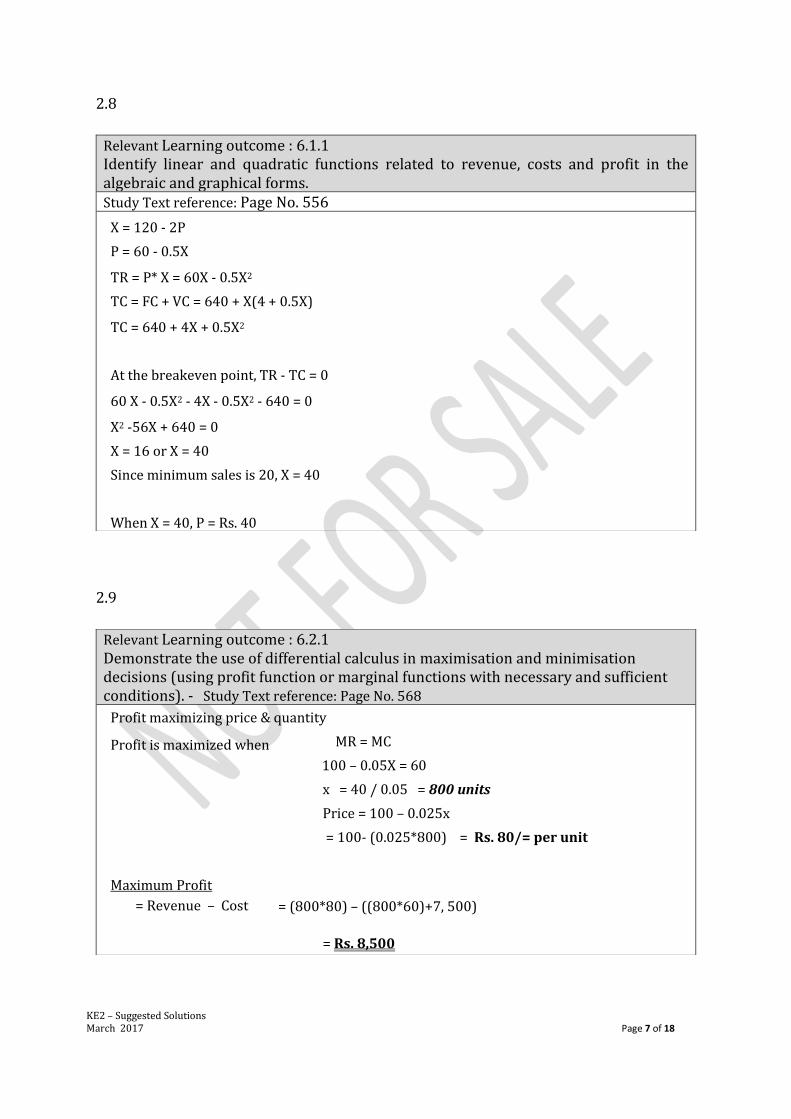
2.8
2.9
Relevant Learning outcome : 6.1.1 Identify linear and quadratic functions related to revenue, costs and profit in the algebraic and graphical forms. Study Text reference: Page No. 556
X = 120 - 2P
P = 60 - 0.5X
TR = P* X = 60X - 0.5X2
TC = FC + VC = 640 + X(4 + 0.5X)
TC = 640 + 4X + 0.5X2
At the breakeven point, TR - TC = 0
60 X - 0.5X2 - 4X - 0.5X2 - 640 = 0
X2 -56X + 640 = 0
X = 16 or X = 40
Since minimum sales is 20, X = 40
When X = 40, P = Rs. 40
Relevant Learning outcome : 6.2.1 Demonstrate the use of differential calculus in maximisation and minimisation decisions (using profit function or marginal functions with necessary and sufficient conditions). - Study Text reference: Page No. 568
Profit maximizing price & quantity
Profit is maximized when MR = MC
100 – 0.05X = 60
x = 40 / 0.05 = 800 units
Price = 100 – 0.025x
= 100- (0.025*800) = Rs. 80/= per unit
Maximum Profit
= Revenue – Cost
= (800*80) – ((800*60)+7, 500)
= Rs. 8,500
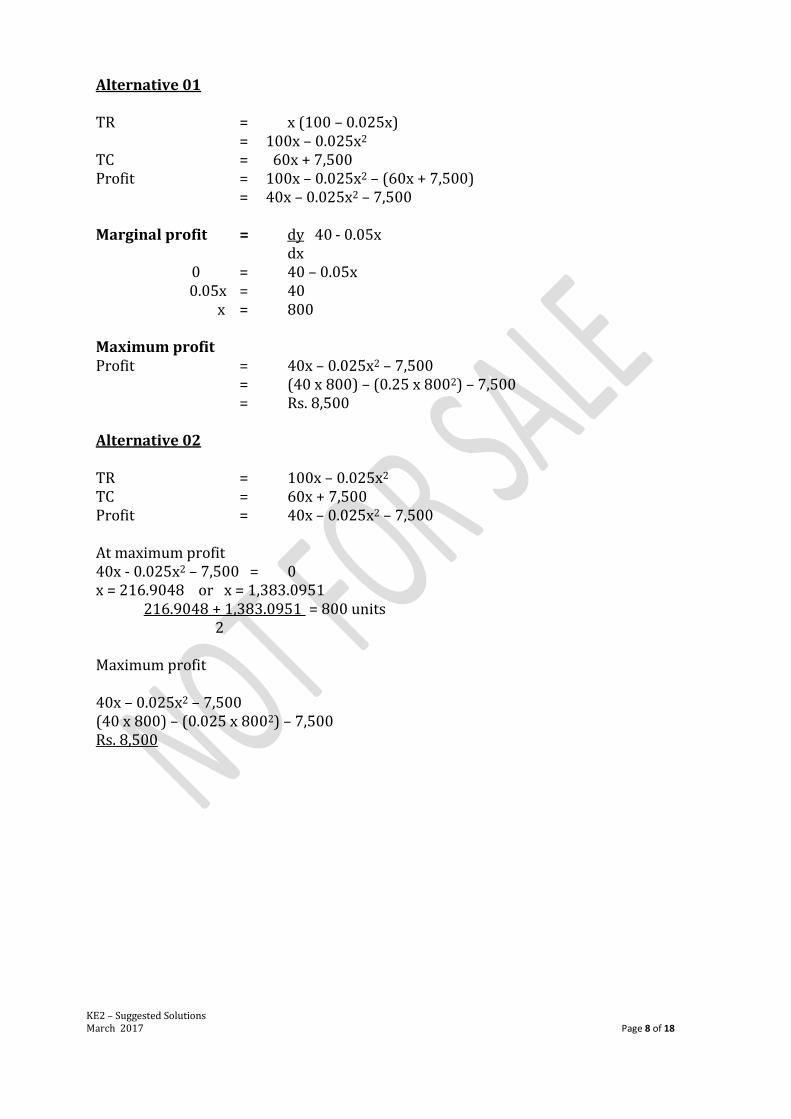
KE2 – Suggested Solutions March 2017 Page 8 of 18
Alternative 01 TR = x (100 – 0.025x) = 100x – 0.025x2 TC = 60x + 7,500 Profit = 100x – 0.025x2 – (60x + 7,500) = 40x – 0.025x2 – 7,500 Marginal profit = dy 40 - 0.05x dx 0 = 40 – 0.05x 0.05x = 40 x = 800 Maximum profit Profit = 40x – 0.025x2 – 7,500 = (40 x 800) – (0.25 x 8002) – 7,500 = Rs. 8,500 Alternative 02 TR = 100x – 0.025x2 TC = 60x + 7,500 Profit = 40x – 0.025x2 – 7,500 At maximum profit 40x - 0.025x2 – 7,500 = 0 x = 216.9048 or x = 1,383.0951 216.9048 + 1,383.0951 = 800 units 2 Maximum profit 40x – 0.025x2 – 7,500 (40 x 800) – (0.025 x 8002) – 7,500 Rs. 8,500
KE2 – Suggested Solutions March 2017 Page 9 of 18
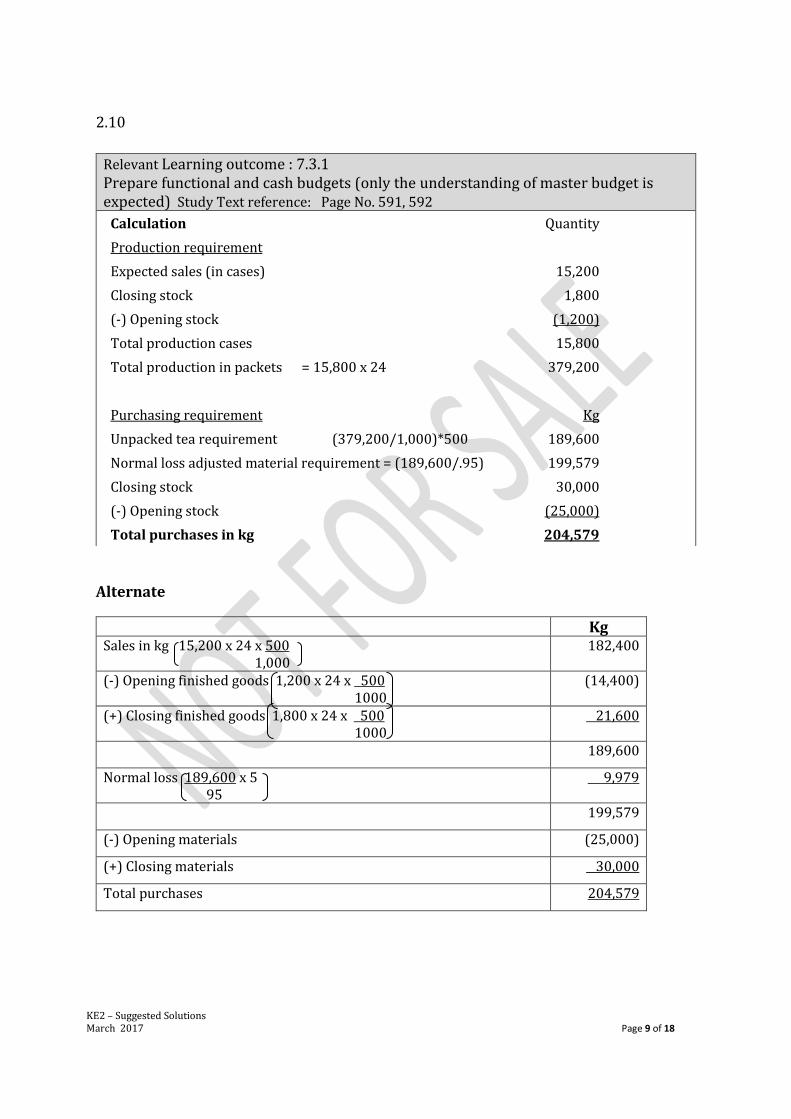
2.10
Alternate
Kg Sales in kg 15,200 x 24 x 500 1,000
182,400
(-) Opening finished goods 1,200 x 24 x 500 1000
(14,400)
(+) Closing finished goods 1,800 x 24 x 500 1000
21,600
189,600
Normal loss 189,600 x 5 95
9,979
199,579
(-) Opening materials (25,000)
(+) Closing materials 30,000
Total purchases 204,579
Relevant Learning outcome : 7.3.1 Prepare functional and cash budgets (only the understanding of master budget is expected) Study Text reference: Page No. 591, 592
Calculation Quantity
Production requirement
Expected sales (in cases) 15,200
Closing stock 1,800
(-) Opening stock (1,200)
Total production cases 15,800
Total production in packets = 15,800 x 24 379,200
Purchasing requirement Kg
Unpacked tea requirement (379,200/1,000)*500 189,600
Normal loss adjusted material requirement = (189,600/.95) 199,579
Closing stock 30,000
(-) Opening stock (25,000)
Total purchases in kg 204,579
KE2 – Suggested Solutions March 2017 Page 10 of 18
SECTION 2 Answer 03
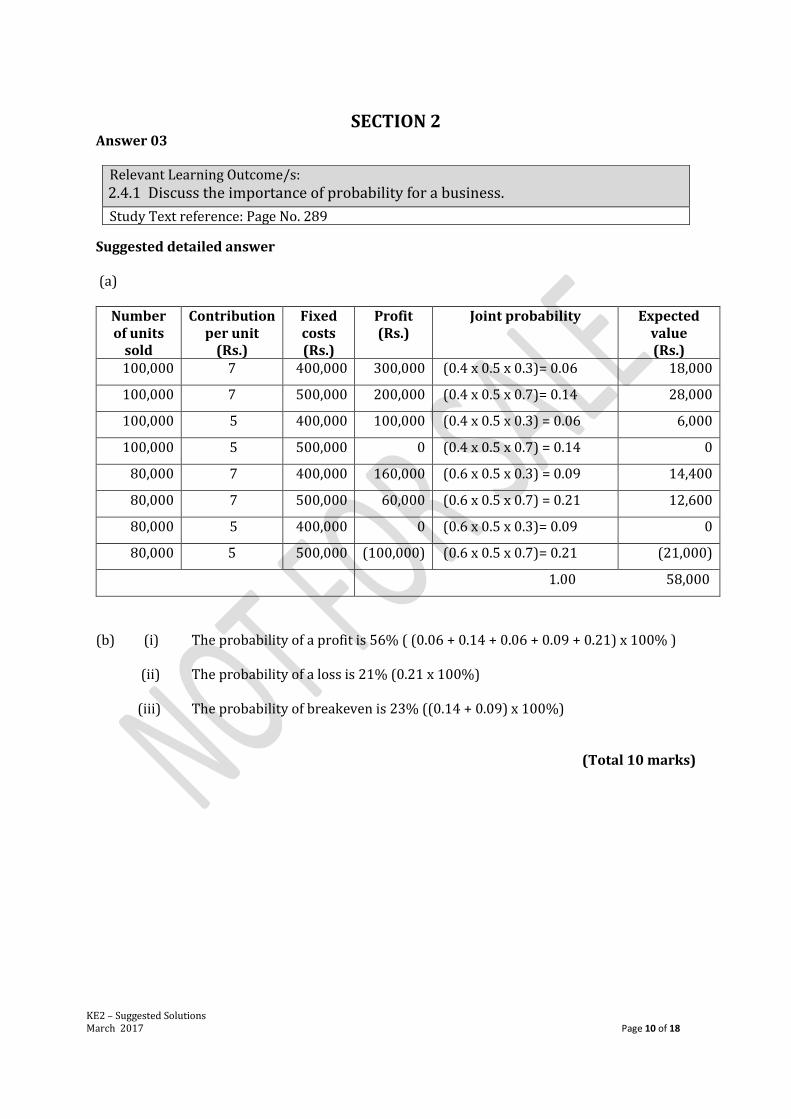
Suggested detailed answer (a)
Number of units
sold
Contribution per unit
(Rs.)
Fixed costs (Rs.)
Profit (Rs.)
Joint probability Expected value (Rs.)
100,000 7 400,000 300,000 (0.4 x 0.5 x 0.3)= 0.06 18,000
100,000 7 500,000 200,000 (0.4 x 0.5 x 0.7)= 0.14 28,000
100,000 5 400,000 100,000 (0.4 x 0.5 x 0.3) = 0.06 6,000
100,000 5 500,000 0 (0.4 x 0.5 x 0.7) = 0.14 0
80,000 7 400,000 160,000 (0.6 x 0.5 x 0.3) = 0.09 14,400
80,000 7 500,000 60,000 (0.6 x 0.5 x 0.7) = 0.21 12,600
80,000 5 400,000 0 (0.6 x 0.5 x 0.3)= 0.09 0
80,000 5 500,000 (100,000) (0.6 x 0.5 x 0.7)= 0.21 (21,000)
1.00 58,000
(b) (i) The probability of a profit is 56% ( (0.06 + 0.14 + 0.06 + 0.09 + 0.21) x 100% )
(ii) The probability of a loss is 21% (0.21 x 100%)
(iii) The probability of breakeven is 23% ((0.14 + 0.09) x 100%)
(Total 10 marks)
Relevant Learning Outcome/s:
2.4.1 Discuss the importance of probability for a business.
Study Text reference: Page No. 289
KE2 – Suggested Solutions March 2017 Page 11 of 18
Answer 04
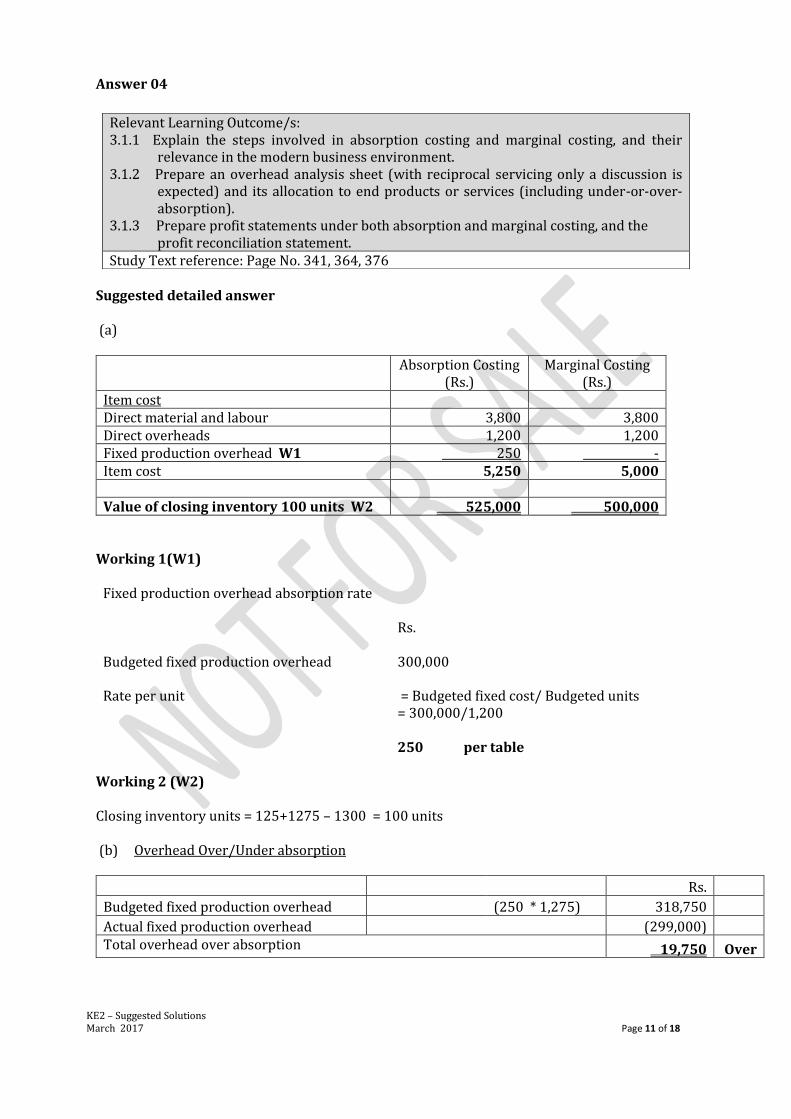
Suggested detailed answer (a)
Absorption Costing
(Rs.) Marginal Costing
(Rs.) Item cost Direct material and labour 3,800 3,800 Direct overheads 1,200 1,200 Fixed production overhead W1 250 - Item cost 5,250 5,000 Value of closing inventory 100 units W2 525,000 500,000
Working 1(W1)
Fixed production overhead absorption rate
Rs.
Budgeted fixed production overhead
300,000
Rate per unit = Budgeted fixed cost/ Budgeted units = 300,000/1,200
250 per table
Working 2 (W2) Closing inventory units = 125+1275 – 1300 = 100 units (b) Overhead Over/Under absorption
Rs.
Budgeted fixed production overhead (250 * 1,275) 318,750
Actual fixed production overhead (299,000)
Total overhead over absorption 19,750 Over
Relevant Learning Outcome/s: 3.1.1 Explain the steps involved in absorption costing and marginal costing, and their
relevance in the modern business environment. 3.1.2 Prepare an overhead analysis sheet (with reciprocal servicing only a discussion is
expected) and its allocation to end products or services (including under-or-over-absorption).
3.1.3 Prepare profit statements under both absorption and marginal costing, and the profit reconciliation statement.
Study Text reference: Page No. 341, 364, 376
KE2 – Suggested Solutions March 2017 Page 12 of 18
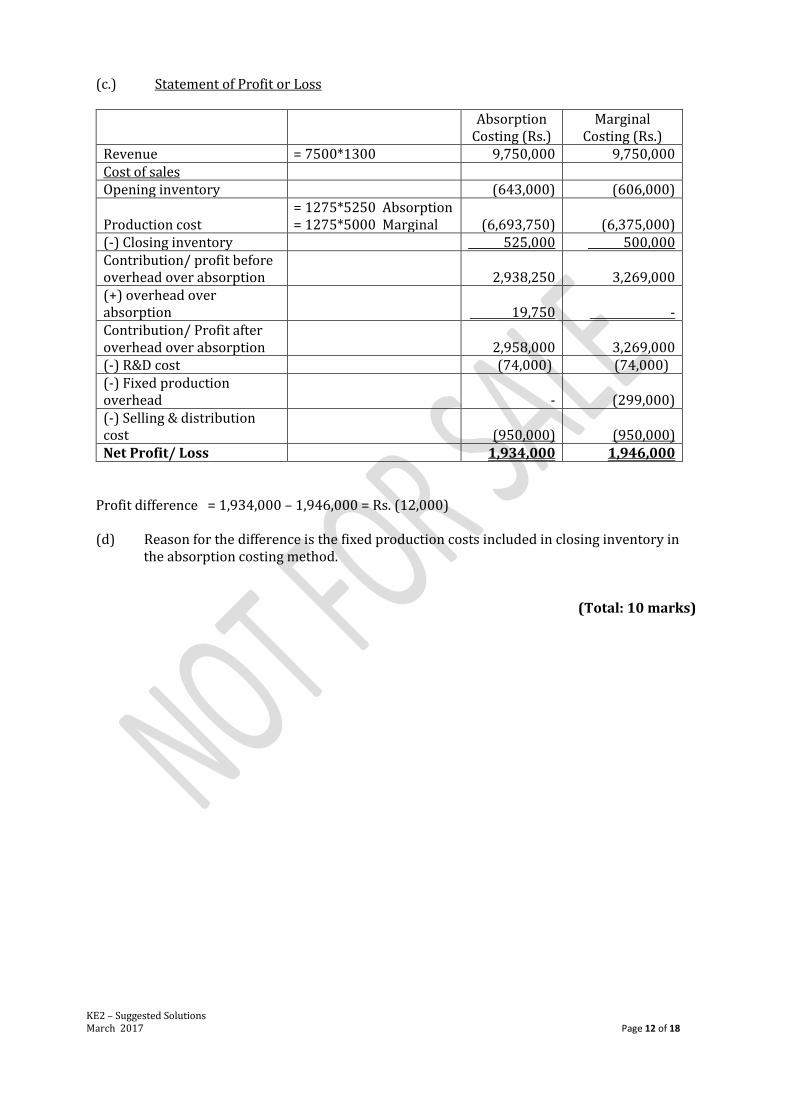
(c.) Statement of Profit or Loss
Absorption
Costing (Rs.) Marginal
Costing (Rs.) Revenue = 7500*1300 9,750,000 9,750,000 Cost of sales Opening inventory (643,000) (606,000)
Production cost = 1275*5250 Absorption = 1275*5000 Marginal
(6,693,750)
(6,375,000)
(-) Closing inventory 525,000 500,000 Contribution/ profit before overhead over absorption
2,938,250
3,269,000
(+) overhead over absorption 19,750 - Contribution/ Profit after overhead over absorption
2,958,000
3,269,000
(-) R&D cost (74,000) (74,000) (-) Fixed production overhead - (299,000) (-) Selling & distribution cost
(950,000)
(950,000)
Net Profit/ Loss 1,934,000 1,946,000 Profit difference = 1,934,000 – 1,946,000 = Rs. (12,000) (d) Reason for the difference is the fixed production costs included in closing inventory in
the absorption costing method.
(Total: 10 marks)
KE2 – Suggested Solutions March 2017 Page 13 of 18
Answer 05
Suggested detail answer (a)
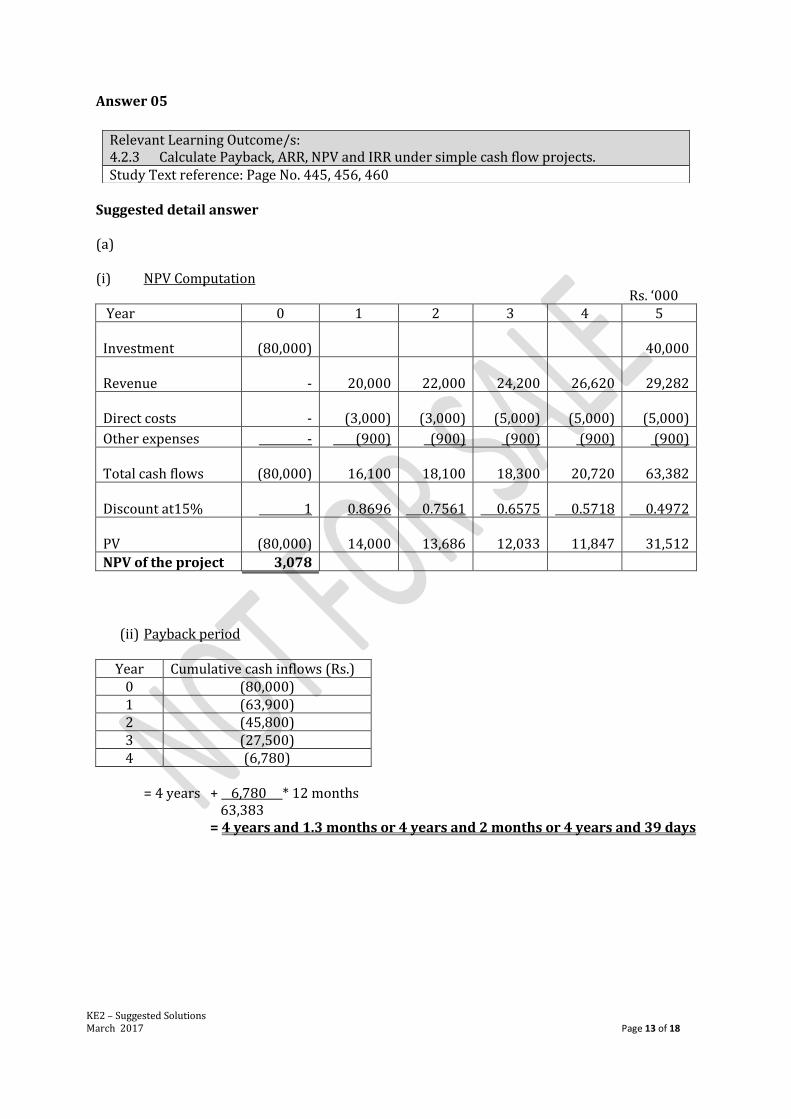
(i) NPV Computation
Rs. ‘000 Year 0 1 2 3 4 5
Investment
(80,000) 40,000
Revenue -
20,000 22,000 24,200 26,620 29,282
Direct costs - (3,000)
(3,000)
(5,000)
(5,000)
(5,000)
Other expenses - (900) (900) (900) (900) (900)
Total cash flows
(80,000)
16,100 18,100 18,300 20,720 63,382
Discount at15% 1
0.8696 0.7561 0.6575 0.5718 0.4972
PV
(80,000)
14,000 13,686 12,033 11,847 31,512
NPV of the project 3,078
(ii) Payback period
Year Cumulative cash inflows (Rs.) 0 (80,000) 1 (63,900) 2 (45,800) 3 (27,500) 4 (6,780)
= 4 years + 6,780 * 12 months
63,383 = 4 years and 1.3 months or 4 years and 2 months or 4 years and 39 days
Relevant Learning Outcome/s: 4.2.3 Calculate Payback, ARR, NPV and IRR under simple cash flow projects. Study Text reference: Page No. 445, 456, 460
KE2 – Suggested Solutions March 2017 Page 14 of 18
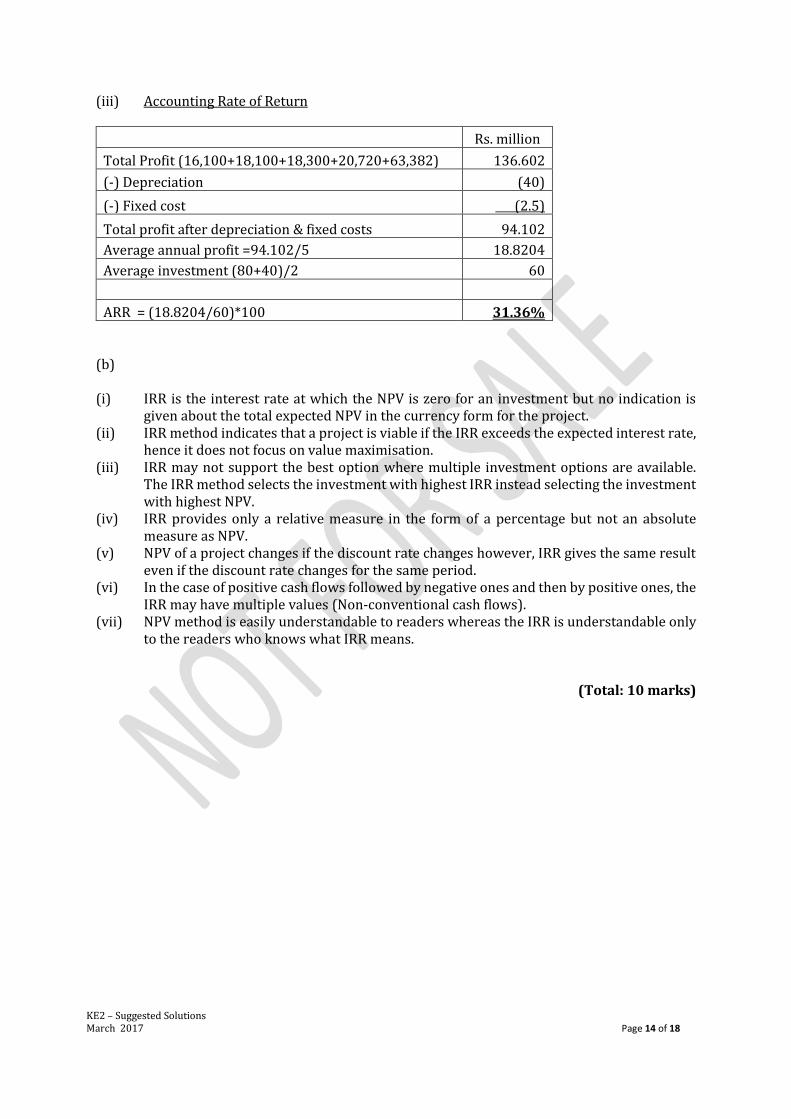
(iii) Accounting Rate of Return
Rs. million
Total Profit (16,100+18,100+18,300+20,720+63,382) 136.602
(-) Depreciation (40)
(-) Fixed cost (2.5)
Total profit after depreciation & fixed costs 94.102
Average annual profit =94.102/5 18.8204
Average investment (80+40)/2 60
ARR = (18.8204/60)*100 31.36%
(b)
(i) IRR is the interest rate at which the NPV is zero for an investment but no indication is given about the total expected NPV in the currency form for the project.
(ii) IRR method indicates that a project is viable if the IRR exceeds the expected interest rate, hence it does not focus on value maximisation.
(iii) IRR may not support the best option where multiple investment options are available. The IRR method selects the investment with highest IRR instead selecting the investment with highest NPV.
(iv) IRR provides only a relative measure in the form of a percentage but not an absolute measure as NPV.
(v) NPV of a project changes if the discount rate changes however, IRR gives the same result even if the discount rate changes for the same period.
(vi) In the case of positive cash flows followed by negative ones and then by positive ones, the IRR may have multiple values (Non-conventional cash flows).
(vii) NPV method is easily understandable to readers whereas the IRR is understandable only to the readers who knows what IRR means.
(Total: 10 marks)
KE2 – Suggested Solutions March 2017 Page 15 of 18
Answer 06
Suggested detail answer
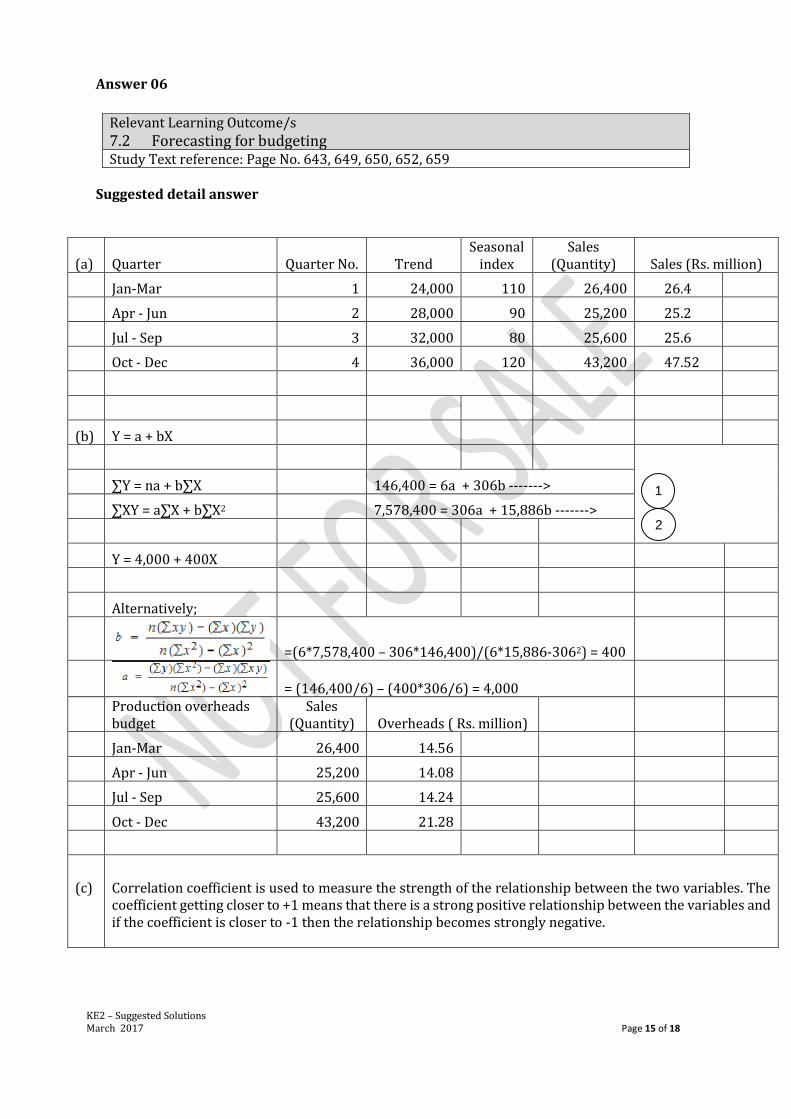
(a) Quarter Quarter No. Trend Seasonal
index Sales
(Quantity) Sales (Rs. million)
Jan-Mar 1 24,000 110 26,400 26.4
Apr - Jun 2 28,000 90 25,200 25.2
Jul - Sep 3 32,000 80 25,600 25.6
Oct - Dec 4 36,000 120 43,200 47.52
(b) Y = a + bX
∑Y = na + b∑X 146,400 = 6a + 306b ------->
∑XY = a∑X + b∑X2 7,578,400 = 306a + 15,886b ------->
Y = 4,000 + 400X
Alternatively;
=(6*7,578,400 – 306*146,400)/(6*15,886-3062) = 400
= (146,400/6) – (400*306/6) = 4,000
Production overheads budget
Sales (Quantity) Overheads ( Rs. million)
Jan-Mar 26,400 14.56
Apr - Jun 25,200 14.08
Jul - Sep 25,600 14.24
Oct - Dec 43,200 21.28
(c)
Correlation coefficient is used to measure the strength of the relationship between the two variables. The coefficient getting closer to +1 means that there is a strong positive relationship between the variables and if the coefficient is closer to -1 then the relationship becomes strongly negative.
Relevant Learning Outcome/s
7.2 Forecasting for budgeting Study Text reference: Page No. 643, 649, 650, 652, 659
1
2
KE2 – Suggested Solutions March 2017 Page 16 of 18
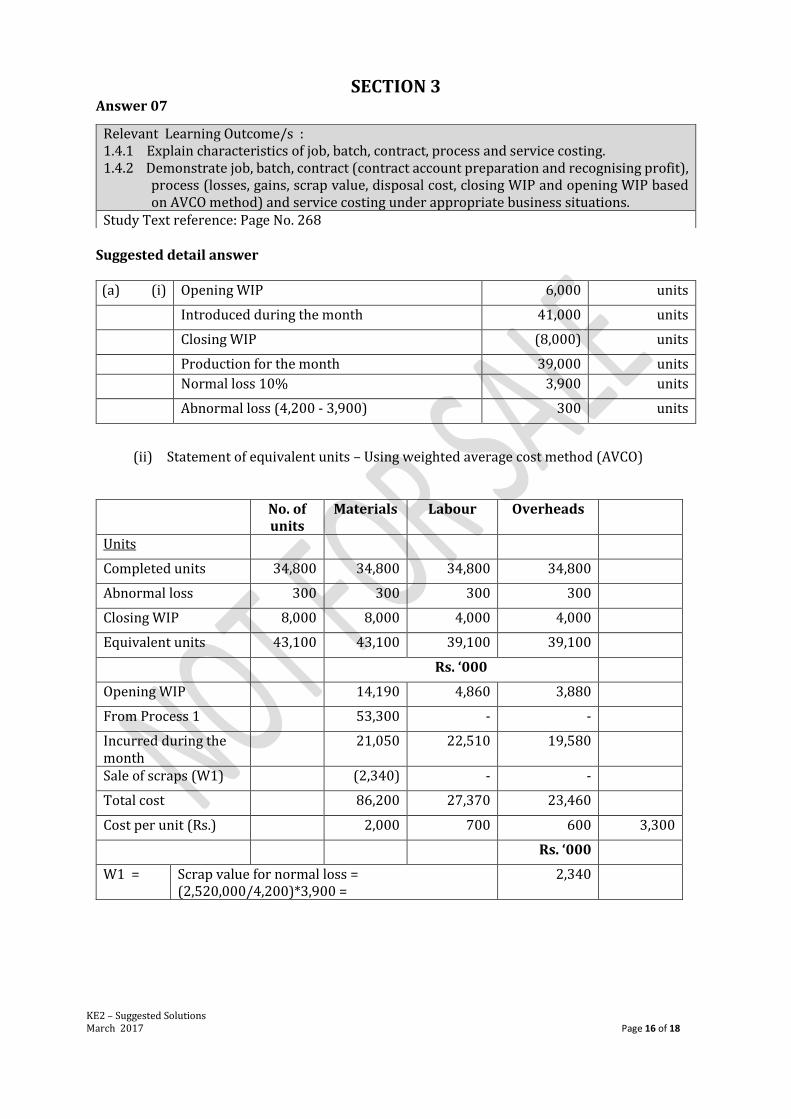
SECTION 3 Answer 07
Suggested detail answer (a) (i) Opening WIP 6,000 units
Introduced during the month 41,000 units
Closing WIP (8,000) units
Production for the month 39,000 units Normal loss 10% 3,900 units
Abnormal loss (4,200 - 3,900) 300 units
(ii) Statement of equivalent units – Using weighted average cost method (AVCO)
No. of units
Materials Labour Overheads
Units
Completed units 34,800 34,800 34,800 34,800
Abnormal loss 300 300 300 300
Closing WIP 8,000 8,000 4,000 4,000
Equivalent units 43,100 43,100 39,100 39,100
Rs. ‘000
Opening WIP
14,190 4,860 3,880
From Process 1
53,300 - -
Incurred during the month
21,050 22,510 19,580
Sale of scraps (W1)
(2,340) - -
Total cost
86,200 27,370 23,460
Cost per unit (Rs.)
2,000 700 600 3,300
Rs. ‘000
W1 = Scrap value for normal loss = (2,520,000/4,200)*3,900 =
2,340
Relevant Learning Outcome/s : 1.4.1 Explain characteristics of job, batch, contract, process and service costing. 1.4.2 Demonstrate job, batch, contract (contract account preparation and recognising profit),
process (losses, gains, scrap value, disposal cost, closing WIP and opening WIP based on AVCO method) and service costing under appropriate business situations.
Study Text reference: Page No. 268
KE2 – Suggested Solutions March 2017 Page 17 of 18
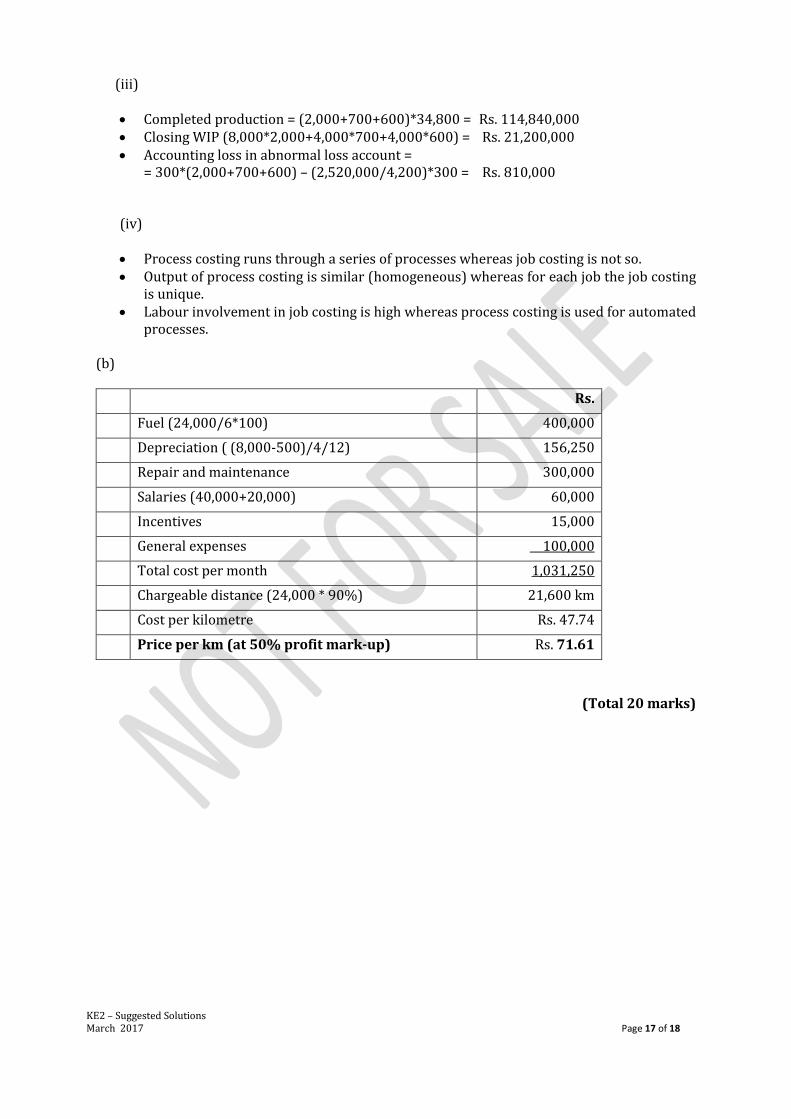
(iii)
Completed production = (2,000+700+600)*34,800 = Rs. 114,840,000 Closing WIP (8,000*2,000+4,000*700+4,000*600) = Rs. 21,200,000 Accounting loss in abnormal loss account =
= 300*(2,000+700+600) – (2,520,000/4,200)*300 = Rs. 810,000
(iv)
Process costing runs through a series of processes whereas job costing is not so. Output of process costing is similar (homogeneous) whereas for each job the job costing
is unique. Labour involvement in job costing is high whereas process costing is used for automated
processes.
(b)
Rs.
Fuel (24,000/6*100) 400,000
Depreciation ( (8,000-500)/4/12) 156,250
Repair and maintenance 300,000
Salaries (40,000+20,000) 60,000
Incentives 15,000
General expenses 100,000
Total cost per month 1,031,250
Chargeable distance (24,000 * 90%) 21,600 km
Cost per kilometre Rs. 47.74
Price per km (at 50% profit mark-up) Rs. 71.61
(Total 20 marks)
KE2 – Suggested Solutions March 2017 Page 18 of 18
Notice of Disclaimer
The answers given are entirely by the Institute of Chartered Accountants of Sri Lanka (CA Sri Lanka)
and you accept the answers on an "as is" basis.
They are not intended as “Model answers’, but rather as suggested solutions.
The answers have two fundamental purposes, namely:
1. to provide a detailed example of a suggested solution to an examination question; and
2. to assist students with their research into the subject and to further their understanding and
appreciation of the subject.
The Institute of Chartered Accountants of Sri Lanka (CA Sri Lanka) makes no warranties with respect
to the suggested solutions and as such there should be no reason for you to bring any grievance against
the Institute of Chartered Accountants of Sri Lanka (CA Sri Lanka). However, if you do bring any
action, claim, suit, threat or demand against the Institute of Chartered Accountants of Sri Lanka (CA
Sri Lanka), and you do not substantially prevail, you shall pay the Institute of Chartered Accountants
of Sri Lanka's (CA Sri Lanka’s) entire legal fees and costs attached to such action. In the same token,
if the Institute of Chartered Accountants of Sri Lanka (CA Sri Lanka) is forced to take legal action to
enforce this right or any of its rights described herein or under the laws of Sri Lanka, you will pay the
Institute of Chartered Accountants of Sri Lanka (CA Sri Lanka) legal fees and costs.
© 2013 by the Institute of Chartered Accountants of Sri Lanka (CA Sri Lanka).
All rights reserved. No part of this document may be reproduced or transmitted in any form or by any
means, electronic, mechanical, photocopying, recording, or otherwise, without prior written permission
of the Institute of Chartered Accountants of Sri Lanka (CA Sri Lanka).
KE2 – Management Accounting Information: Executive Level Examination March 2017


![SUGGESTED SOLUTIONS - CA Sri Lanka – Fundamentals of Taxation and Law. Suggested Solutions ... Suggested Solutions ... (MCQs) = 10 ] : 1.3.1. : C : 3.1.1](https://img.dokumen.tips/doc/110x75/5b1c02aa7f8b9a46258f371a/suggested-solutions-ca-sri-lanka-fundamentals-of-taxation-and-law-suggested.jpg)