Embed Size (px)
Citation preview

Corporate presentation 2017 1
Corporate presentation 2017AGRANA Beteiligungs-AG
S U G A RS TA R C HF R U I TThe natura l upgrade

Corporate presentation 2017 2
OVERVIEW
About us
AGRANA-products in daily life
Strategy
Production sites
Group- & ownership structure
History
Financials
Investment
Segment SUGAR
Segment STARCHSegment FRUIT
Research & Development
Sustainability
Economic footprint
Business figures 2016|17
Outlook
1
2
3
4
5
6
7 15
12
13
9
10
11
8
14
16

Corporate presentation 2017 3
ABOUT US
We refine agricultural raw materials, turning them into a range of different industrial products to supply local producers as well as large multinational companies active in the food processing industry, in particular
We also serve the end-consumer market in the Sugar segment with country-specific brands such as „Wiener Zucker“ in Austria
AGRANA FACTS
8,900employees
57production
sites2.6 €bn
revenue
Leading
SUGAR SUPPLIERIn Central, Eastern & South-Eastern Europe
Major manufacturer of customer-specific
STARCHPRODUCTS
World market leaderin the production of
FRUITPREPARATIONS

Corporate presentation 2017 4
WE ALL CONSUME AGRANA (PRODUCTS)STRATEGIC POSITIONING B2B
At the beginning there is always agriculture…
AGRANA refines agricultural raw
materials...
AGRANA supplies the Big Names...
We all consume AGRANA every
day...
confectionery, beverage, fermentation industries, food retailers; paper,
textile, pharmaceutical industries; feed industry; dairy, ice-cream, bakery
industries and many more

Corporate presentation 2017 5
AT A GLANCEAGRANA-PRODUCTS IN DAILY LIFE
SUGAR STARCH FRUIT
for consumers: „Wiener Zucker“ (20%) for food producers:
e.g. for pastries, confectionery, dairy products, preserves, drinks etc. (80%)
as food ingredients, e.g. forsauces, potato products etc. as child and infant food for cosmetic products for technical applications, e.g.
for paper finishing as animal feeds for bioethanol
fruit preparations in dairyproducts, ice-cream, in baked goods or as fruitdecoration fruit juice concentrates in
soft drinks and alcoholicbeverages

Corporate presentation 2017 6
STRATEGYREFINING OF AGRICULTURAL RAW MATERIALS
SUGARCENTRAL & EASTERN EUROPE
FRUITGLOBAL
STARCHEUROPE
SynergiesUse synergies between business segments to position the Group optimally for the increasingly volatile operating environment in the segments
Customer- and market-oriented growth in CEE and
Southeastern Europe
Organic growth, and adding value by tailor-made products
Customer- and market-oriented global growth
Capital marketA long-term asset for shareholders
Investors & Customers Balance of risk, exchange of know-how between the segments, cost savings through synergies

Corporate presentation 2017 7
57 PRODUCTION SITES WORLDWIDEINTERNATIONAL PRODUCTION MEETS INT. CUSTOMERS
Austria
Czech Rep.
Hungary*Romania
Slovakia
Bosnia-Herzegovina Bulgaria
SUGAR7 sugar beet plants2 raw sugar refineries & Instantina plant
Countries with production sitesMain marketsStarch plantsBioethanol plants
Beet sugar plantsRaw sugar refinery
Countries with plantsOther markets
* Also with refiningactivities
FRUIT28 fruit preparation plants and14 fruit concentrate plants
Distribution centre Potential Growth RegionsCountries with production sites
STARCH5 starch plants (incl. 2 bioethanol plants)

Corporate presentation 2017 8
AGRANA IS PROCESSING 10 MILLION TONNES OF RAW MATERIALS
6.70.2
1.9
0.3 0.9
Beet Raw sugar Grain Potato Fruits
Including 50% of the JVs HUNGRANA and STUDEN
million tonnes

Corporate presentation 2017 9
AGRANA IS SELLING 5.4 MILLION TONNES OF HIGH-QUALITY PRODUCTS
2.2
2.4
0.8
Sugar Starch Fruit
Including 50% of the JVs HUNGRANA and STUDEN
million tonnes
1.3 m tonnes of core products Sugar Sugar speciality products (Quota and non-quota sugar)
0.9 m tonnes of by-products + other Feedstuffs & fertilisers Molasses, beet pulp…
1.2 m tonnes of core products Native starches Modified starches Saccharification products Alcohol and ethanol
0.7 m tonnes of by-products Feedstuffs & fertilisers Proteins (incl. DDGS / ActiProt©) Corn germ / mash
0.5 m tonnes of other products Soy Dried beet pulp
0.7 m tonnes of core products Fruit preparations (dairy and non-dairy Fruit juice concentrates Other juice core products (NFC, fruit
wine
0.07 m tonnes of by-products/other Particularly pomace Natural flavours, beverage bases
Sugar 41%Sugar 41%Starch 45%Starch 45%
Fruit 14%Fruit 14%

Corporate presentation 2017 10
GROUP STRUCTURE
AGRANA Internationale Verwaltungs-& Asset Management GmbH
AGRANA Stärke GmbHAGRANA Zucker GmbH
42 sites5,761 employees1,155.5 €m revenue
10 sites2,135 employees671.9 €m revenue
5 sites974 employees733.9 €m revenue
57 sites8,870 employees2.6 €bn revenue
FRUITSUGAR STARCH
AGRANA Beteiligungs-AG

Corporate presentation 2017 11
OWNERSHIP STRUCTURE
~78.4%
TOTAL: 15,622,244 shares
Z & SZucker und Stärke
Holding AG
ZBG
Südzucker
RübenproduzentenBeteiligungs-GmbH
Raiffeisen-HoldingNÖ-Wien
~50%
~70%
~30%
~10% ~50%
~2.7%1
~18.9%
1 directly held by Südzucker

Corporate presentation 2017 12
HISTORYOUR
1988 1989 1990 1991 2012 201320082003 2010 - 2011 2014
FOUNDINGof AGRANA Beteiligungs-AG
PARTNER-SHIPwith Germany‘sSüdzucker AG
INITIAL PUBLIC OFFERING (IPO)of AGRANA Beteiligungs-AG
OPENINGOf the bioethanol facility in Pischelsdorf|Austria
MERGERof AGRANA JuiceHolding GmbH andYbbstaler Juice AustriaGmbH and the launchof the new brandAUSTRIA JUICE
OPENINGof the new AGRANAResearch & Innovation Center (ARIC) in Tulln|Austria
50% ACQUISITIONIn the Hungarian cornstarch und Isoglucose millHUNGRANA
DEVELOPMENTof the third businesssegment, Fruit, with theareas of fruitpreparations and fruitjuice concentrates
OPENINGof the wheat starch plant in Pischelsdorf|Austria
EXPANSIONof the company‘s presencein the area of fruitpreparations in the MiddleEast and Africa with plantsin Cairo|Egypt andJohannesburg|South Africa
EXPANSION of the Sugar andStarch segments by means ofacquisitions in Bosnia-Herzegovina, Bulgaria, Romania, Slovakia, Czech Republic andHungary
EXPANSIONof the company‘s presence in the area of fruit
preparations with a fourth US-plant in Lysander|USA
2015
OPENINGof packagingstock andlogistics hub in Kaposvár|HU
2016 2017
EXPANSIONof market position in South Americathrough theacquisition of 100% ofthe share in Main Process S.A., a producer of fruitpreparations in Buenos Aires
EXPANSIONOf market position in Asia through theacquisition of theIndian fruit processingplant SAIKRUPA FruitProcessing Pvt. Ltd.

Corporate presentation 2017 13
SOLID ECONOMIC GROWTHSINCE 1988
Revenue EBIT
355.8
24.7
467.6684.6
866.4
2,026.3
42.276.8
34.6
CAGR Revenue: 7.0 % CAGR EBIT: 6.9 %
€m
15.0
2,561.3
172.4
Annual growth rates:2,841.7
166.9

Corporate presentation 2017 14
STEADY DIVIDEND POLICY
4.00
3.00
2.00
1.00
0
€
*Dividend proposal to the AGM on 7 July 2017: € 4.00 per share
0
20
40
60
80
100
120
140
AGRANA share price Dividend per share
Performance (10 July 1991 – 23 May 2017): AGRANA +119.09% (last: € 101.90)
*

Corporate presentation 2017 15
REVENUE-, EBIT- AND MARGIN DEVELOPMENT
2009-2017
REVENUE
EBIT-MARGIN
EBIT
* The prior-year data have been restated under IAS 8.
1.989,2 2.165,9
2.577,6
3.065,92.841,7
86,9
128,6
231,0 217,9166,9
121,7 129,0 172,4
2.493,5 2.477,6
4,4 %
9,0 %7,1 %
5,9 % 5,2 %
in M
io. €
5,9 % 4,9 %
2.561,3
6,7 %

Corporate presentation 2017 16
INVESTMENT DEVELOPMENT
*equity-method
SUGARSTARCHFRUITGROUP
25.355.9 43.1 34.5 46.1
23,3
29.3
59.1
35.0
13.7
28.257,6
42.5
34.8
51.8
43.0
41.7 33,8
0
20
40
60
80
100
120
140
160
2011|12 2012|13 2013|14 2014|15* 2015|16* 2016|17*
€m
149.8
97.1
130.0
91.2
116.0 114.7

Corporate presentation 2017 17
INVESTMENT OVERVIEW2016|17
46.1
23.3
28.257.6
41.733.8
2015|16 2016|17
Sugar Starch Fruit
116.0 2016|17
SUGAR General overhaul of the high-bay warehouse in Tulln, Austria Renewal of the fresh water treatment in Tulln, Austria Construction of the pelleted dried beet bagging station in
Leopoldsdorf, Austria
STARCH Expansion of corn processing in Aschach, Austria Expansion of starch saccharification facilities in Aschach, Austria Construction of a new maltodextrin spray drying plant in Aschach,
Austria
FRUIT Construction of a third production line in Lysander, New York, USA Installation of a bag-in-box packaging in Botkins, Ohio, USA Installation of a new production line in Mitry-Mory, France
€m
114.7
GROUP

Corporate presentation 2017 18
SUGARSEGMENT
18

Corporate presentation 2017 19
SUGAR SEGMENT
Sugar: is obtained from sugar beet without any additives pure, natural product
is a natural provider of energy as part of a balanced diet
AGRANA: market leader in Austria and top provider in Eastern and South-Eastern Europe
Close partnerships with sugar beet growers: AGRANA offers wide range of advice on growing sugar beet
End-consumer-market is served with country-specific brands
Europe’s largest producer of organic sugar: ‘Wiener Bio Kristall- und Staubzucker’: sugar made
from organically grown Austrian beet

Corporate presentation 2017 20
AGRANA SUGARBENEFIT FROM THE STRONG MARKET POSITION IN CEE AND SEE
7 SUGAR PLANTS AND2 RAW SUGAR REFINERIES
Austria
Czech Rep.
Hungary*
Romania
Slovakia
Bosnia-Herzegovina
Bulgaria
Beet sugar plants
Raw sugar refinery
Countries with plants
Other markets
* Also with refining activities
Distribution centre

Corporate presentation 2017 21
SUGAR SEGMENT
Maintenance of regional products…
....and specialty products

Corporate presentation 2017 22
STARCHSEGMENT

Corporate presentation 2017 23
STARCH SEGMENT
Processing and refinement of top-quality corn, wheat and potatoes to create a variety of different, highly refined starch products
Manufacture of products made of valuable raw materials at the highest quality level, using modern, environmentally friendly methods
Starch and special starch products (e.g. organic and GMO free starch) to numerous industrial sectors: food and beverage industries baby food industry paper and paper processing industry textile industry construction chemicals industry pharmaceutical and cosmetic industries

Corporate presentation 2017 24
MARKET POSITIONSTARCH SEGMENT
Austrian production sites: potato starch factory in Gmünd|AUT corn starch plant in Aschach|AUT Bioethanol & wheat starch plant in
Pischelsdorf|AUT
AGRANA Stärke GmbH: operational management and coordination of international holdings in Hungary and Romania
Focus on highly refined speciality products Innovative, customer-driven products supported
by application advice Leading position in organic and in GMO-free
starches for the food industry Bioethanol business: part of the Starch segment
STARCH
5 starch plants (incl. 2 bioethanol plants)
Countries with production sites
Main markets
Starch plants
Bioethanol plants

Corporate presentation 2017 25
FRUITSEGMENT

Corporate presentation 2017 26
FRUIT SEGMENT Processing of fruit in the gentlest way possible,
applying state-of-the-art production processes. Refinement of fruit into top quality fruit preparations and fruit juice concentrates
fruit juice concentrate business: operated by AUSTRIA JUICE (formerly Ybbstaler) as a joint venture between AGRANA and RWA (Raiffeisen Ware Austria AG)
AGRANA Fruit … is the global market leader in producing fruit
preparations for the dairy, baking and ice-cream industries
is a leading producer of fruit juice concentrates in Europe and
has established a global presence based on its production facilities and international sales activities

Corporate presentation 2017 27
28 FRUIT PREPARATION PLANTS &14 FRUIT JUICE CONCENTRATE PLANTS
Potential Growth Regions
Countries with production sites
MARKET POSITIONFRUIT SEGMENT
World Market Leader in Fruit preparations: global market share > 30%
Currently: Europe: stagnating market’s sales volumes of fruit
preparations in Europe at a high absolute level good market growth rates in the Asia-Pacific region
Most important producer of fruit juice concentrates in Europe (AUSTRIA JUICE)
Additional customer portfolio and new markets Optimisation measures taken in previous years show
their positive effects
FRUIT PREPARATIONS
FRUIT JUICE CONCENTRATES

Corporate presentation 2017 28
FRUIT PREPARATION – WHAT IS IT ABOUT?
+ =
… most important ingredient of fruit preparations Frozen (IQF or block) Aseptic Purees Concentrates
… sweetens and supports taste anddurability Crystal sugar Liquid sugar (syrup) Other sweeteners
create a good mouth-feel and prevent emulsions
Pectins Starch Guar, Xanthan, …
optional flavors and coloursfor an even fruitier taste and an intense colour
THICKENERS
FRUIT SUGAR FRUIT PREPARATIONS

Corporate presentation 2017 29
RESEARCH & DEVELOPMENTAGRANA RESEARCH & INNOVATION CENTER
Bundling of all R&D activities at ARIC in Tulln|AUT
Synergies in crossdivisional research topics:Clean Label / Nutrition / Sweeteners / Flavors
Networking with other research institutions
Aim: to secure and actively shape the company’s success in the future through innovations: product innovations innovations related to our processes and production
technology
State-accredited testing unit for yield and quality evaluation of sugar beets
Specialised R&D expertise is also made available to third parties
AGRANA Research & Innovation Center (ARIC)

Corporate presentation 2017 30
AGRANA‘S UNDERSTANDING OF SUSTAINABILITY
utilise almost 100% of our raw materials and employ low-emission technologies to protect the environment,
respect all our stakeholders and the communities where we operate,
engage in long-term partnerships.
At AGRANA, we …
Balance of economic, environmental and social responsibility

Corporate presentation 2017 31
AGRANA‘S CORE SUBJECTS ALONG THE VALUE CHAIN
Labour practices and human rights of employees
Product responsibility
and sustainable products
Compliance and business
conduct
Social engagement
Environmental and energy aspects of production
Environmental and social
criteria in the sourcing of agricultural
raw materials
Sustainability Reporting:Acc. to GRI integrated in AGRANA‘s annual reports since 2012|13

Corporate presentation 2017 32
SUSTAINABLE AGRICULTURE INITIATIVE (SAI)
ENVIRONMENTAL AND SOCIAL CRITERIA IN THE SOURCING OF AGRICULTURAL RAW MATERIALS
SAI is an initiative of stakeholders of the food industry, founded in 2002 by Nestlé, Unilever and Danone.
SAI develops principles and practices of sustainable agriculture
SAI‘s 2 major tools to document sustainable environmental and social practices in the agricultural value chain Farm Sustainability Assessment (FSA) Benchmarking Tool for international certification
standards & national legislation
AGRANA has been a member of SAI since 2014 and uses the FSA questionnaire to assess contract growers and the benchmarking tool in all its business segments
Farm Sustainability Assessment (FSA) & Benchmarking Tool
FSA is a questionnaire (applicable worldwide), that enables agricultural producers to assess the status of their operations in terms of environmentally and socially sustainable production (112 questions on farm management, soil and nutrient management as well as plant protection).
The benchmarking tool compares requirements of internat. certification standards with the requirements of the FSA-questionnaire

Corporate presentation 2017 33
SUSTAINABILITY AT AGRANAMEASURES IN THE CORE BUSINESS
• 2014: Introduction of an energy-management-system in all Austrian production plants and certification according to ISO 50001; CEE sites as of 2015|16
• Low temperature dryers installed at the Tulln & Leopoldsdorf site, both Austria, have saved more than 100,000 tonnes CO2equ. since their installation in 2011|12
• Target: energy-self-sufficient in terms of figures of the sugarplant Kaposvár|HU
The Kaposvár sugar plant in Hungary generated about 30 million cubicmetres of biogas from beet pulp in the 2016|17 financial year. This wouldhave been sufficient for the site:
to cover 80% of its primary energy requirement for the 2016|17 beetcampaign, or
60% of its total primary energy needs for beet processing and therefining of raw sugar
about 8.3 million cubic metres of the biogas produced at the facilitywere refined by the biogas upgrading plant installed in 2015 intoapproximately 4.9 million cubic metres of biomethane for feeding intothe local natural gas grid and this was equivalent to the annual heatingrequirement of about 1,950 single-family homes
ENERGY EFFICIENCYTargets 2020|21
Sugar (baseline 2013|14):
• 5% reduction of direct energy / tonne of core- & by-products
Starch (baseline 2013|14): • 50 GWh (all measures
summed up) reduction of energy consumption until 2020|21
Fruit (baseline 2014|15):• 6.8% reduction of total
energy consumption / tonne of fruit preparation (baseline 2013|14)
• Hold energy use per tonne of fruit juice concentrate & by-products constant at 2014|15 baseline

Corporate presentation 2017 34
SUSTAINABILITY AT AGRANAMEASURES IN THE CORE BUSINESS
Almost complete (98.6 to 99.9%) of raw materials use in all segments through the efficient use of raw materials technical innovations and product development (main & by-products)
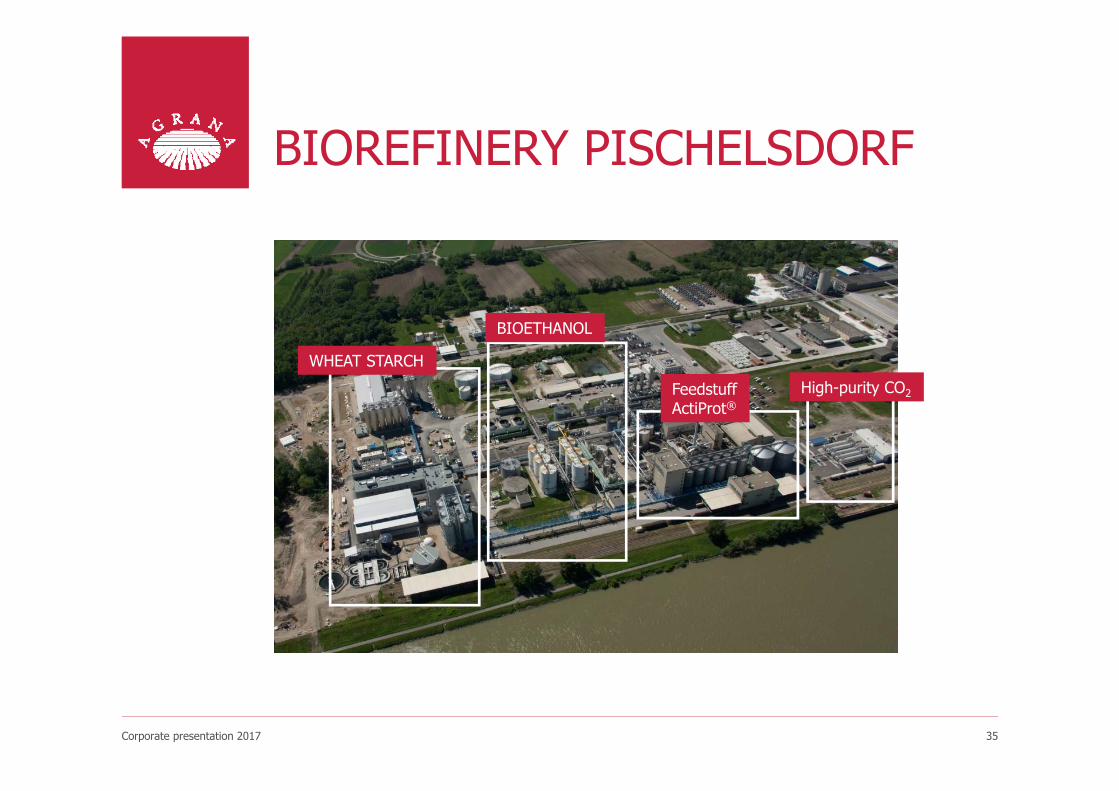
Biorefinery Pischelsdorf|AUT: Integration of 2013 opened wheat starch plant and the bioethanol facility 100% grain utilization resource efficiency
„ZERO-WASTE“-PRINCIPLE
Corporate presentation 2017 35
BIOREFINERY PISCHELSDORF
WHEAT STARCH
BIOETHANOL
FeedstuffActiProt®
High-purity CO2

Corporate presentation 2017 36
100% UTILISATION OF RAW MATERIALS ENVIRONMENTAL AND ENERGY ASPECTS OF PRODUCTION
WHEAT
WHEAT + CORN
roller-mill
Starch-factory
Fermenterhammer-mill
Ethanol-plant
WHEAT BRAN
A-WHEAT STARCH
WHEAT GLUTEN
BIOETHANOL
ACTIPROT®
BIOGENIC CO2
B+C -Starch
Wheat-Starch-Products1
2
3
4
approx. 105,000 t
approx. 55,000 t
approx. 23,500 t
up-to 240,000m³
„WITH ONE RAW MATERIAL TO FOUR PRODUCTS“
approx. 180,000 t
approx. 100,000 t

Corporate presentation 2017 37
AGRANAS ECONOMIC FOOTPRINT
Study carried out by “Economica”
Calculation of the economic impact of AGRANA's business operations according to the companies understanding of sustainability, as a balance of economic, environmental and social aspects
Methodology: Input-Output Analysis
Based on data of the 2014|15 financial year
Gross value-added: the gross value added calculates the amount that is available to remunerate the production factors of labour (wages and salaries) and capital (profit, interest on borrowed capital and deductions).
Direct effects: Include that value of gross value creation or employment that is earned directly in the enterprise under consideration or generates jobs.
Indirect effects: Come into existence through the advance services interfaces of the observed enterprise in other sectors (e.g. a clinic requires advance services medications, electricity, etc., through which the final demand in the pharmaceutical industry and the electricity economy are stimulated and then in turn need advance services, etc.).
Induced effects: The jobs created and/or secured in the direct or indirect effect generate income that is then spent again by the workers (above all for consumption). This promotes ultimate demand in the respective sectors (especially retail).
Multipliers: Represent the extent to which the total effects exceed the original direct effect. A multiplier is calculated as the sum of the total value added divided by the direct economic value added generated by AGRANA.

Corporate presentation 2017 38
RESULTS ECONOMIC FOOTPRINTAGRANA-GROUP
511
142
975
8,708 30,970
direct indirect + induced
Gross value-added (business operations): in €m
Employment effects (business operations):
Gross value-added (investment):in €m
Employment effects (investments):
€ 172 m
40,000 jobs
4,622 jobs
€ 1.5 bn
Macroeconomically relevant!
Share of the Austrian GDP: • Direct effect: around 0.2% • Total effect: around 0.5%
Gross value-added multiplier:
Every Euro of gross value-addedgenerated by AGRANA, created upto two additional euros of value-added in other companies.
Employment multiplier:

Corporate presentation 2017 39
GROSS VALUE-ADDED (GVA) EFFECTSAGRANA GROUP (BUSINESS OPERATIONS)
Gross value-added effects of the AGRANA Group‘s business operations by segment in €m, 2014|15
510.6
840.9
133.8 1,485.3
The largest single contribution (58%) is made by the Fruit segment
The largest economic lever expressed as the multiplier, is also found in the Fruit segment.
Multiplier:• Sugar: 2.85
• Starch: 2.69
• Fruit: 3.03

Corporate presentation 2017 40
EMPLOYMENT EFFECTSAGRANA GROUP (BUSINESS OPERATIONS)
Employment effects of the AGRANA Group‘s businessoperations by segments, (heads), 2014|15
39,678
8,708
29,103
1,867
The largest contribution to the employment effects is made by the Fruit segment because of the global presence and the employment model.
The larger economic levers, are however found in the Starch and Sugar segments. Multiplier:
• Sugar: 5.52
• Starch: 5.81
• Fruit: 3.95

Corporate presentation 2017 41
BUSINESS FIGURES2016|17

Corporate presentation 2017 42
REVENUE BY SEGMENT2016|17 VS PRIOR YEAR
672.6 721.61,083.4
2,477.6
671.9733.9
1,155.5
2,561.3
0
1.000
2.000
3.000
Reve
nue
in €
m
2015|162016|17 2015|16 2016|17 2015|162016|17 2015|162016|17
SUGARSTARCHFRUITGROUP
27.2%
29.1%
43.7%
2015|16
26.2%
28.7%
45.1%
2016|17

Corporate presentation 2017 43
EBIT BY SEGMENT2016|17 VS PRIOR YEAR
4.3
65.958.8
129.0
24.4
76.2 71.8
172.4
0
50
100
150
200
EBIT
in €
m
2015|162016|17 2015|162016|17 2015|162016|17 2015|162016|17
3.3%
51.1%
45.6%
2015|16
14.2%
44.2%
41.6%
2016|17
6.2%3.6%
10.4%EBIT margin
5.4%
0.6%
9.1%
SUGARSTARCHFRUITGROUP

Corporate presentation 2017 44
CONSOLIDATED INCOMESTATEMENT
€m (condensed) 2016|17 2015|16 Change
Revenue 2,561.3 2,477.6 +3,4%
EBITDA1 235.2 192.0 +22,5%
Operating profit before except. items and results of equity-accounted JV 150.8 107.5 +40.3%
Share of results of equity-accounted JV 30.6 24.5 +24.9%
Exceptional items (9.0) (3.1) -190.3%
EBIT 172.4 129.0 +33.6%
EBIT margin 6.7% 5.2% +1.5pp
Net financial items (17.9) (24.5) +26.9%
Profit before tax 154.5 104.4 +48.0%
Income tax expense (36.6) (23.5) -55.7%
Profit for the period 117.9 80.9 +45.7%
Attributable to shareholders of the parent 111.3 82.7 +34.6%
Earnings per share € 7.132 € 5.82 +22.5%
1 EBITDA represents operating profit before exceptional items, results of equity-accounted joint ventures, and operating depreciation and amortisation.
2 EPS is calculated on the basis of 15,622,244 outstanding shares at the balance sheet date (29 Feb 2017)

Corporate presentation 2017 45
CONSOLIDATED BALANCE SHEET€m (condensed) 2016|17 2015|16 Change
Non-current assets 1,135.3 1,027.7 +10.5%
Current assets 1,346.1 1,213.9 +10.9%
Non-current assets held for sale 0.0 1.6 -100,0%
Total assets 2,481.4 2,243.2 +10.6%
Equity 1,411.9 1,200.1 +17.6%
Non-current liabilities 296.6 378.7 -21.7%
Current liabilities 772.9 664.4 +16.3%
Total equity and liabilities 2,481.4 2,243.2 +10.6%
Equity ratio 56.9% 53.5% +3.4pp
Net debt 239.9 405.8 -40.9%
Gearing 17.0% 33.8% -16.8pp

Corporate presentation 2017 46
CONSOLIDATED CASH FLOW STATEMENT
€m (condensed) 2016|17 2015|16 Change
Operating cash flow before changes in working capital 258.0 225.9 +14.2%
Changes in working capital 31.8 (73.7) +143.1%
Total of interest paid/received and tax paid (34.0) (50.3) +32.4%
Net cash from operating activities 255.8 101.9 +151.0%
Net cash (used in) investing activities (171.5) (19.9) -761.8%
Net cash (used in) financing activities 9.3 (163.6) +105.7%
Net (decrease)/increase in cash and cash equivalents 93.6 (81.6) +214.7%

Corporate presentation 2017 47
ANALYSIS OF NET FINANCIAL ITEMS
€m 2016|17 2015|16 Change
Net interest expense (10.2) (8.4) -21.4%
Currency translation differences (1.2) (13.5) +91.1%
Share of results of non-consolidated subsidiaries and outside companies
0.6 0.03 +1,900.0%
Other financial items (7.1) (2.6) -173.1%
Total (17.9) (24.5) +26.9%

Corporate presentation 2017 48
OUTLOOK
AGRANA

Corporate presentation 2017 49
OUTLOOK
2017|18
AGRANA expects Group revenue to increase slightly and operating profit (EBIT) to increase significantly for the 2017|18 financial year.
Total investment in the three business segments, at about € 140 million, will significantly exceed depreciation of about € 90 million.

Corporate presentation 2017 50
DISCLAIMER
This presentation is being provided to you solely for your information and may not be reproduced or further distributed to any other person or published, in whole or in part, for any purpose. This presentation comprises the written materials/slides for a presentation concerning AGRANA Beteiligungs-AG (“Company”) and its business.
This presentation does not constitute or form part of any offer or invitation to sell or issue, or any solicitation of any offer to purchase or subscribe for, any shares in the Company, nor shall it or any part of it form the basis of, or be relied on in connection with, any contract or investment decision.
This presentation includes forward-looking statements, i.e. statements that are not historical facts, including statements about the Company's beliefs and expectations and the Company's targets for future performance are forward-looking statements. These statements are based on current plans, estimates and projections, and therefore investors should not place undue reliance on them. Forward-looking statements speak only as of the date they are made, and the Company undertakes no obligation to update publicly any of them in light of new information or future events.
Although care has been taken to ensure that the facts stated in the presentation are accurate, and that the opinions expressed are fair and reasonable, the contents of this presentation have not been verified by the Company no representation or warranty, express or implied, is given by or on behalf of the Company any of its respective directors, or any other person as to the accuracy or completeness of the information or opinions contained in this presentation. Neither the Company nor any of its respective members, organs, representatives or employees or any other person accepts any liability whatsoever for any loss howsoever arising from any use of this presentation or its contents or otherwise arising in connection therewith.