Embed Size (px)
Citation preview

Subsea Pumped Hydro Storage
A Technology Assessment
Master’s Thesis within the Sustainable Energy Systems programme
JOHN ALMÉN
JOHAN FALK
Department of Energy and Environment
Division of Energy Technology
CHALMERS UNIVERSITY OF TECHNOLOGY
Göteborg, Sweden 2013
Master’s Thesis T2013-387

MASTER’S THESIS T2013-387
Subsea Pumped Hydro Storage
A Technology Assessment
Master’s Thesis within the Sustainable Energy Systems programme
JOHN ALMÉN
JOHAN FALK
SUPERVISOR
Emil Nyholm
EXAMINER
Filip Johnsson
Department of Energy and Environment
Division of Energy Technology
CHALMERS UNIVERSITY OF TECHNOLOGY
Göteborg, Sweden 2013
Subsea Pumped Hydro Storage
A Technology Assessment
Master’s Thesis within the Sustainable Energy Systems programme
JOHN ALMÉN
JOHAN FALK
© JOHN ALMÉN, JOHAN FALK, 2013
Master’s Thesis T2013-387
Technical report no: T2013-387
Department of Energy and Environment
Division of Energy Technology
Chalmers University of Technology
SE-412 96 Göteborg
Sweden
Telephone: + 46 (0)31-772 1000
Chalmers Reproservice
Göteborg, Sweden 2013
Report no: T2013-387
I
Subsea Pumped Hydro Storage
A Technology Assessment
Master’s Thesis within the Sustainable Energy Systems programme
JOHN ALMÉN
JOHAN FALK
Department of Energy and Environment
Division of Energy Technology
Chalmers University of Technology
ABSTRACT
A new technology for energy storage called Subsea Pumped Hydro Storage (SPHS)
has been evaluated from a techno-economical point of view. Intermittent renewable
energy sources are becoming more common in the electricity grid; hence the need of
regulating power is increasing. One way of balancing the demand of electricity with
the production is by implementing energy storage in the system. This thesis has
assessed such a concept, which is a sea-based version of the already existing pumped
hydro storage technology. A SPHS unit is composed of a hollow structure placed at
the seabed which can be emptied of water by the use of a pump at times of low
demand and high production of electricity in the system, the unit is at that point
charged. When this excess energy is needed in the system water is allowed to flow
back into the cavity through a turbine and thus generating electricity. This work has
defined which components are needed for the concept to function and how these are
implemented to create a complete technical system. In order to compare SPHS to
alternative solutions for energy storage, so called Key Performance Parameters were
determined and quantified. The two technologies pumped hydro storage (PHS) and
compressed air energy storage (CAES) were used for comparison with the SPHS
concept due to their similar operation characteristics. The last step of the analysis was
performed with an energy systems model where energy storage was included in the
Danish electricity system due to its high penetration of fluctuating wind power. A
number of scenarios were examined and it was shown that at larger installation depths
the capital cost was reduced due to a lower material requirement. It should however
be clarified that the costs for installation at large depths are very uncertain. Compared
to PHS (with a levelized cost of electricity, LCOE, of 187-278 €/MWh) it was
concluded that the subsea pumped hydro storage concept (with a LCOE of 212-336
€/MWh) needs to be developed further in order to be competitive from a cost point of
view. Furthermore, unless subsidies for the delivered electricity are implemented the
storage technology will not yield a sufficient income when operating on the spot
market as a buyer and seller of electricity. A better alternative could be to connect the
technology to an offshore wind power plant where the wind energy can be stored
directly as the wind turbine drives the pump in the storage unit mechanically. This
would imply that electricity, which is more expensive than any other fuel, doesn’t
have to be bought at market price and that the wind power plant and storage unit
become one integrated facility.
Keywords: energy storage, intermittency, balancing power, subsea construction,
wind power integration
II
Undervattensbaserat pumpkraftverk
En teknikutvärdering
Examensarbete inom masterprogrammet Sustainable Energy Systems
JOHN ALMÉN
JOHAN FALK
Institutionen för energi och miljö
Avdelningen för energiteknik
Chalmers tekniska högskola
SAMMANFATTNING
En ny teknik för energilagring, ett undervattensbaserat pumpkraftverk, har utvärderats
utifrån ett tekno-ekonomiskt perspektiv. Förnybara intermittenta energikällor blir allt
vanligare i energisystemet, vilket gör att allt mer balanskraft krävs. Ett sätt att uppnå
denna balansering är att implementera energilagring i systemet. Detta arbete har
analyserat ett sådant koncept, vilket är ett undervattensbaserat alternativ till ett
pumpkraftverk. Denna teknik består av en ihålig konstruktion som placeras på
havsbottnen och som kan tömmas på vatten med hjälp av en pump då efterfrågan på
elektricitet är låg och produktionen är hög, lagret är vid denna tidpunkt laddat. Då
denna överskottsenergi efterfrågas i systemet låts vatten strömma in i håligheten
genom en turbin som därmed alstrar elektricitet. Detta arbete har definierat vilka
komponenter som krävs för att konceptet ska fungera och hur dessa samverkar för att
skapa ett komplett tekniskt system. För att jämföra undervattensbaserade
pumpkraftverk med alternativa lösningar för energilagring bestämdes ett antal
nyckeltal. Det studerade konceptet jämfördes det med pumpkraftverk och
energilagring med trycksatt luft på grund av de liknande driftegenskaperna. Slutligen
skapades en energisystemmodell där energilager inkluderades i det danska
elektricitetssystemet på grund av dess höga andel fluktuerande vindkraft. Ett antal
scenarion studerades och det visades att vid större installationsdjup minskade
kapitalkostnaden på grund av ett lägre materialbehov. Det bör dock tilläggas att
kostnaderna för installation på stora djup är mycket osäkra. Jämfört med
pumpkraftverk (med en produktionskostnad mellan 187-278 €/MWh) dras slutsatsen
att konceptet för ett undervattensbaserat pumpkraftverk (med en produktionskostnad i
spannet 212-336 €/MWh) måste utvecklas ytterligare för att kunna vara
kostnadsmässigt konkurrenskraftigt. Vidare krävs även subventioner på den
elektricitet som levereras från enheten för att en tillräcklig inkomst ska inbringas då
denna arbetar på spotmarknaden som en köpare och säljare av elektricitet. Ett bättre
alternativ kan vara att koppla tekniken till ett havsbaserat vindkraftverk då energin i
vinden kan lagras direkt genom att vindturbinen driver pumpen i energilagret
mekaniskt. Detta innebär att elektricitet, vilket är dyrare än något annat bränsle, inte
måste köpas till marknadspriset och att vindkraftverket och energilagret kombineras
till en integrerad anläggning.
Nyckelord: energilagring, intermittens, balanskraft, undervattenskonstruktion,
vindkraftsintegration
CHALMERS, Energy and Environment, Master’s Thesis T2013-387 III
Contents
1 INTRODUCTION 1
1.1 Background 1
1.2 Purpose and aim 1
1.3 Scope 2
1.4 Thesis outline 2
2 THEORY 3
2.1 Energy system 3
2.2 The Nordic power system 3
2.3 The Danish power system 3
2.4 Energy storage 4
2.5 Energy storage technologies 6
2.6 Subsea Pumped Hydro Storage 8
3 METHOD 17
3.1 Design requirements 17
3.2 Comparison with other technologies 17
3.3 Energy system modelling 18
3.4 Scenarios 22
4 RESULTS 24
4.1 Techno-economic analysis 24
4.2 Comparison of energy storage technologies 26
4.3 Energy systems modelling results 30
5 DISCUSSION 39
5.1 Construction aspects 39
5.2 Future developments of the power system 40
5.3 Alternative storage solutions 41
5.4 Required electricity price arbitrage 43
5.5 Uncertainty in estimated parameters 43
6 CONCLUSION 45
7 BIBLIOGRAPHY 46
CHALMERS, Energy and Environment, Master’s Thesis T2013-387 IV
COSTS FOR COMPARABLE TECHNOLOGIES A-1 APPENDIX A
PAYBACK PERIODS FOR ALL SCENARIOS B-1 APPENDIX B
CHALMERS, Energy and Environment, Master’s Thesis T2013-387 V
Preface
This study has evaluated a new concept for energy storage called Subsea Pumped
Hydro Storage. The work has been performed during the spring of 2013 at the
Department of Energy and Environment, Chalmers University of Technology,
Sweden.
The writers would like to thank Claes Nyqvist for providing the studied concept and
for contributing with many useful insights to the project. Furthermore, the expertise of
Lars Strömberg has also been very helpful in the process of analysing the technology.
Finally, we would like to thank our supervisor Emil Nyholm for his continuous
support during the spring, without which the completion of the thesis wouldn’t have
been possible.
Göteborg June 2013
John Almén and Johan Falk
CHALMERS, Energy and Environment, Master’s Thesis T2013-387 VI
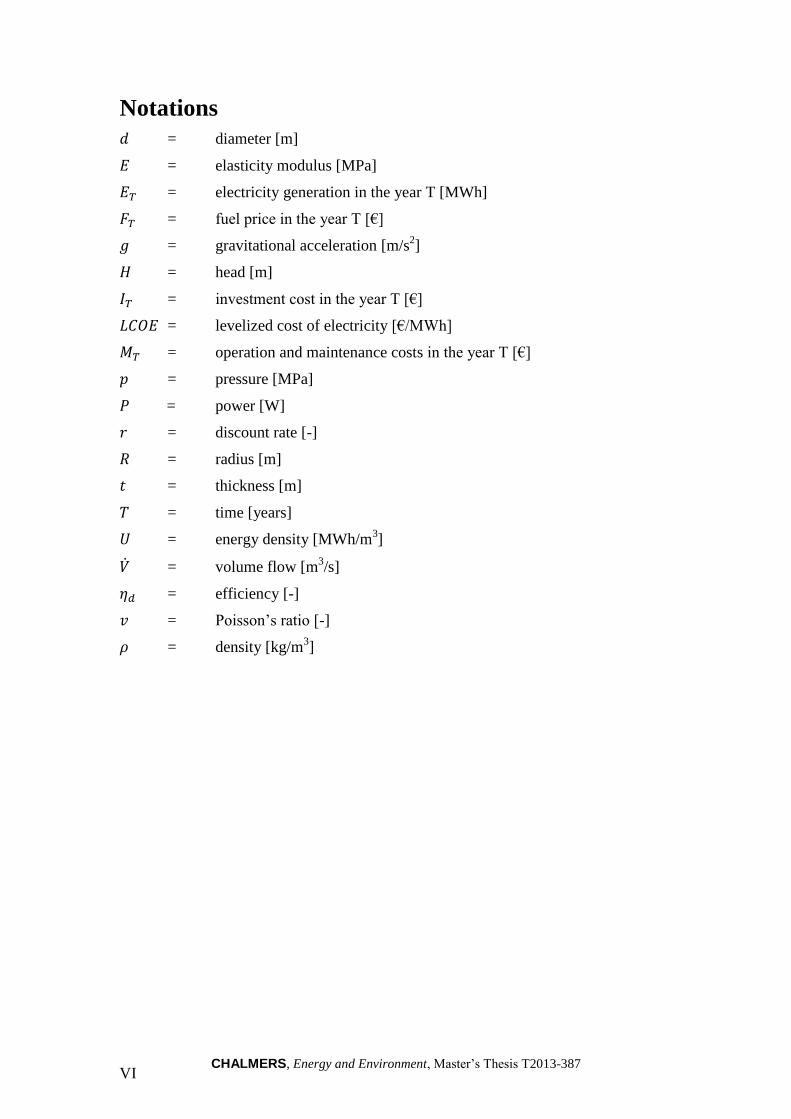
Notations
= diameter [m]
= elasticity modulus [MPa]
= electricity generation in the year T [MWh]
= fuel price in the year T [€]
= gravitational acceleration [m/s2]
= head [m]
= investment cost in the year T [€]
= levelized cost of electricity [€/MWh]
= operation and maintenance costs in the year T [€]
= pressure [MPa]
= power [W]
= discount rate [-]
= radius [m]
= thickness [m]
= time [years]
= energy density [MWh/m3]
= volume flow [m3/s]
= efficiency [-]
= Poisson’s ratio [-]
= density [kg/m3]
CHALMERS, Energy and Environment, Master’s Thesis T2013-387 1
1 Introduction
In the following sections the thesis work will be introduced through descriptions of
the underlying aspects of the problem at hand, the problem itself and the aim of the
thesis.
1.1 Background
The amount of anthropogenic greenhouse gases in the earth’s atmosphere is
constantly increasing, leading to an increase of the average temperature
(Intergovernmental Panel on Climate Change, 2007). The sector which contributes
primarily to these emissions is the power generation industry (Intergovernmental
Panel on Climate Change, 2008). In order to reduce the emissions of carbon dioxide,
which is the largest contributor to the increase of greenhouse gases
(Intergovernmental Panel on Climate Change, 2008), renewable energy sources are
being built in an increasingly rapid pace. These intermittent energy sources, such as
wind and wave power, are becoming increasingly influential in the present energy
system and efficient technologies to balance the fluctuating supply and demand of
electricity are needed. Currently, thermal power plants are used to balance intermittent
production by operating at part load or by standing by as reserve units. Such balancing
power is possible up to a certain level of intermittent generation, but eventually other
means of balancing are required such as; demand side management, increased
transmission capacity and energy storage systems, the latter which will be the focus of
this master thesis work. At present, there are a number of such storage technologies;
both emerging and more developed ones. As renewable energy power plants are being
constructed at an increasing rate, with a large portion of those at or close to the sea,
new means of accumulative capacity at those locations is needed. Space close to
populated and industrial areas where electricity is needed is also becoming scarcer,
which demands the development of storage technologies at locations without
competition with housing or industry etc.
The largest utility scale storage technology as of today is by far pumped hydro storage
which provides approximately 99% of all storage (Electric Power Research Institute,
2010). The large drawbacks with these types of storage facilities are the unique siting
issues arising for each unit as they all need to be completely custom-made depending
on location as well as the severe impacts they have on the surrounding environment
and population.
Combined, these issues create the need for a sea-based energy storage technology
which will not compete for space with other sectors of the society.
1.2 Purpose and aim
This thesis will evaluate a new technology concept for energy storage called Subsea
Pumped Hydro Storage, SPHS in short. The aim is to describe the technology,
determine its performance based on a number of criterions and compare it to other
means of energy storage.
CHALMERS, Energy and Environment, Master’s Thesis T2013-387 2
1.3 Scope
Due to the early development phase in which the SPHS technology is no detailed
mechanical analyses of the constituent parts will be performed. The ecological
impacts from the technology will also be neglected in this study. The technologies
used for comparison with the subsea pumped hydro storage concept will be limited to
pumped hydro storage and compressed air energy storage since these two are at the
moment the only options for large-scale energy storage.
1.4 Thesis outline
To create a knowledge base the report will begin with a theory chapter in which
current alternatives for energy storage will be presented. The concept of the Nordic
power system will also be introduced to the reader, creating a context on which
following reasoning will build. The subsequent method part will describe in what way
the work was conducted, stating important assumptions and simplifications. The
results gained from the methods used will thereafter be presented and a thorough
discussion of these results will be conducted in order to connect them to theories
stated earlier and to state the certainty of them. Finally, the conclusion will summarize
the findings and describe possible future studies regarding the technology.
CHALMERS, Energy and Environment, Master’s Thesis T2013-387 3
2 Theory
The concepts and theories used in this master thesis will be introduced in the
following sections.
2.1 Energy system
The electricity system’s main task is to supply the end-users with a sufficient amount
of power at all times. This is achieved with a combination of several different
electricity generating technologies forming a system. The demand curve varies over
time (yearly, monthly, daily, hourly, instantly) and to supply the required load there is
a need for an efficient and balanced system. With the increased amount of sustainable
energy sources (which often correspond to intermittency) in the future, development
of the system is needed to keep utilization factors high, i.e. avoiding high over-
capacity for long times.
2.2 The Nordic power system
The Nordic power system is unregulated and primarily governed by Nord Pool Spot, a
company which manages the trade of electricity in the region. Prices are set on a day-
ahead basis on the Elspot market – with the possibility to trade continuously, up until
30 minutes before the delivery of electricity, on the Elbas market. Prices are
determined by supply and demand, using the power transmission capacity as a limit,
and contracts for buying electricity can be created in advance for long periods of time.
Balancing of the power grid, which means ensuring security of supply and the correct
grid frequency, is carried out by the Transmission System Operator (TSO) in each
country. In order to achieve this balance the TSO has the possibility to change the
operation of power plants taking part in a certain agreement (Nord Pool Spot, 2013).
2.3 The Danish power system
The Danish power systems consists mainly of coal fired power plants, natural gas
power plants and wind turbines. Almost 30% of the electricity share is currently
generated from wind power, (Energistyrelsen, 2012) making Denmark the world’s
leading wind power producer in terms of share of production. The power exchange is
included in the Nord Pool Spot market and the transmission system operator is
Energinet.dk. Future plans are to expand the wind power to be able to achieve the EU
environmental targets (European Commission, 2010). In 2035 Denmark expects the
power sector to be 100% carbon dioxide emission free with only renewable sources
contributing to power output. The final target is set to be reached in 2050. This
includes a full electrification of the transport sector and a system completely free from
fossil fuels (Danish Ministry of Climate, Energy and Building, 2012).
CHALMERS, Energy and Environment, Master’s Thesis T2013-387 4
2.4 Energy storage
Energy storage technologies can be categorized into several development areas:
Electrochemical storage - batteries and hydrogen storage (in combination with
fuel-cells)
Mechanical storage - pumped hydro, compressed air and flywheels
Electrical storage - super capacitors
Heat storage - accumulators
This thesis will focus on one of the balancing measures mentioned above, mechanical
energy storage. These units traditionally accumulate the energy generated by larger
thermal plants with low flexibility in order to even out loads at peak and off-peak
hours. Financing of these constructions is accomplished by using the price difference
of energy at different times to make economically beneficial trades (Barnes & Levine,
2011). The efficiency of the electricity system is increased through the use of energy
storage as power generating plants can run for longer at optimum levels despite lower
demand, as long as the storage capacity is high enough and the system can handle the
loads. Without energy storage no more than 15 (Cavallo, 2001) to 20% (Denholm &
Kulcinski, 2003) of the electricity demand in a region can be fulfilled by intermittent
energy sources.
When the power generation fluctuates by up to about 10% balancing can most often
be achieved by using spinning reserves, i.e. modifying the operation of running plants
in the system (Barnes & Levine, 2011). However, when fluctuations increase a need
for non-spinning reserves arises. These reserves consist of plants not usually
connected to the system but with short start-up times, such as gas turbine power
plants, and plants with the possibility to be shut off (Huggins, 2010). To remove these
fossil fuelled plants from the system energy storage units could be implemented
instead. The storage facilities may be placed near the location of generation to balance
loads during peak or off-peak hours, close to the load to reduce transmission losses on
lower voltage levels or to supply an area with sufficient power in times of increasing
demand (Barnes & Levine, 2011).
The components of energy storage units can be grouped into three different
categories; the storage medium, the power conversion system and the balance of plant
equipment. The cost of the storage medium becomes more influential with the size of
the storage unit. This is why the largest types of units utilize water and air, which are
cheap and plentiful and have low losses, as a medium. From an economical point of
view the cost of the medium is usually half of that of the entire storage facility. This
cost can be divided into the cost for acquiring the medium and the cost for keeping it
in a state of energy storing. The power conversion system handles the conversion
between alternating and direct current and vice versa, and is the interface between the
storage facility and the electricity grid. For mechanical energy storage units the PCS
consists of the motor and generator train, which convert kinetic energy to electrical.
Apart from power conversion, the subsystem also acts as a security buffer to prevent
damage to the storage facility and the electricity grid by controlling the power
conditions. This system is often very expensive, with costs reaching almost half of the
cost for the entire storage unit. The balance of plant comprises all surrounding
equipment required to keep the facility running, including housing, control systems
and connections between power conversion system and the grid. This part requires the
CHALMERS, Energy and Environment, Master’s Thesis T2013-387 5
least amount of funds and the cost is largely dependent on whether the subsystem is
highly modular or customized to a certain storage unit (Baxter, 2007).
2.4.1 Key performance parameters
To characterize energy storage technologies certain key performance parameters are
used:
Round trip efficiency (RTE)
Energy storage capacity
Rated power
Energy density
Cost
o Investment cost
o Operation and maintenance costs
o Discount rate
o Levelized cost of electricity
Lifetime
The round trip efficiency is, when considering the electricity system, a parameter
unique for energy storage technologies. Regular electricity generation plants use some
kind of resource (wind, solar flux, fuels etc.) which generate electricity through an
energy conversion process. The energy content in the resource and the electricity
generation is known and thus the efficiency can be calculated. For the energy storage
technologies the same procedure is used when releasing energy to the system. The
difference is that the resource (water elevation, chemical energy, rotational speed,
pressure difference etc.) is charged by a non-perfect energy converting technology.
This charge implements energy conversion from electricity to potential energy of
some sort (depending on which technology is used). The round trip efficiency
includes the losses from both charging and generating mode of the storage unit and is
simply a combination of the two efficiencies. In some cases it can also include losses
occurring during storage.
Depending on which application is considered, the capacity and rated power is of
interest. The energy storage capacity is simply the amount of energy (in MWh) one
storage unit can contain. The rated power relates to the size of the power generating
unit (turbine, generator etc., in MW). The combination of rated power and energy
storage capacity determines the discharge time, i.e. the time during which a
continuous level of power can be delivered.
Energy density relates to the energy content per volume, usually in kilowatt hours per
cubic meter. The energy density is calculated differently depending on energy storage
technology, but the result can be used for comparison between technologies. The
purpose of this is to be able to see the difference in volumes required for different
technologies, and it can be a useful tool when determining the best storage technology
for a given location.
Considering cost, a comparison could be made regarding different aspects. Firstly, the
investment cost comprises the costs of all components and sub-systems and it is often
expressed as a cost per installed power. The annual capital costs relates to the
CHALMERS, Energy and Environment, Master’s Thesis T2013-387 6
investment cost, discount rate and the expected economic lifetime of the unit. This is a
tool for profitability calculations of the investment since the annual cost and income
generates the yearly results, however, it also provides the payback time etc. Operation
and maintenance costs include all the costs of keeping the unit running and functional.
It includes reparation, employees’ salaries, working capital and generation bills,
generally these vary with production. To compare the different technologies an
economic assessment widely used is the levelized cost of electricity (LCOE). This
includes all the cost features, including investment, interest rate, operation and
maintenance costs and efficiency (IRENA, 2013). The LCOE (in €/kWh or €/MWh)
is calculated using the total investment, operation and maintenance costs, and total
power generation during the lifetime of the technology, and it is a measure of how
much each unit of generated electricity needs to be sold for in order for the technology
to break even. The levelized cost of electricity is expressed as:
∑
∑
(1)
= investment cost in the year T
= operations and maintenance costs in the year T
= fuel cost in the year T (electricity cost)
= electricity generation in the year T
= discount rate
= economic lifetime
2.5 Energy storage technologies
Today there are a number of technologies which can be used to store electric energy
in a variety of ways. Two technologies with similar operational properties as subsea
pumped hydro storage will be introduced and described in the following sections.
2.5.1 Pumped hydro storage
Pumped hydro storage, or PHS, has by far the largest capacity of the energy storage
technologies being used today. Roughly 127 GW is currently installed worldwide
(Rastler, 2010), and facilities generating over 1 GW of power for a total time of 24
hours are installed on several locations (Ginley & Cahen, 2012). Because of the
beneficial operational aspects (fast response times), this is an appropriate technology
for balancing the fluctuating power generation and load in the system.
The technology needs two fundamental resources to work:
Water
Elevation (referred to as head)
These two properties determine how large capacity the plant will have. The location at
which the technology is placed determines available resources, meaning that if the
head is larger the water requirements can be small, and vice versa. At places where
there are limited amounts of water it is desirable to maximize the head, and where
CHALMERS, Energy and Environment, Master’s Thesis T2013-387 7
there are limited heads it is desirable to maximize the flow in order to maximize the
power output.
The technology works similarly to regular hydropower by using the difference in
potential energy between locations at different altitudes. This potential energy is
converted to kinetic energy with a high efficiency when releasing the water through
paths from a higher to a lower elevation. The difference from regular hydropower is
the possibility to pump water in the opposite direction to store energy. For this to be
possible the facility must include several different main parts such as: upper and lower
reservoirs (the elevation difference between these yields the head and the reservoirs
can be natural or man-made), waterways (including penstocks, head works, tailraces
and one or several surge tanks), turbines and pumps. Pumping back the water can
either be done by using the turbines in reverse mode, the component is then called a
pump-turbine, or by using separate components.
With the high efficiency of turbines, pumps, motors, generators and electrical
equipment the overall storage round trip efficiencies (RTEs) of modern PHS plants
reach around 0.7-0.8 (Barnes & Levine, 2011). Losses depend mainly, as mentioned,
on component efficiencies but also on pressure losses (due to turbulence and friction)
in the waterways.
Depending on the location, different configurations of plants are used. The two most
important design criteria are, as mentioned, water resources and head. Considering
these, three common turbine types are used:
The Kaplan turbine
The Francis turbine
The Pelton turbine
More detailed information about the different turbine technologies can be found in
Chapter 2.6.1.
Current research within PHS technology is mainly focusing on upgrading existing
plants, implementing variable speed turbines and underground PHS (UPHS). With
today’s technology a lot of existing old plants can be upgraded and show remarkable
change in power output. There are examples where the power output has increased by
as much as 12% after an upgrade (Ginley & Cahen, 2012).
With an increased amount of renewables in the energy system, it is important to have
turbines running with variable speeds in order to have the ability to follow the
fluctuations from these sources. Research is on-going to improve the offset efficiency
of the system when storage units are operated outside their design point.
The configuration of the turbines and pumps (number of stages, number of units etc.)
will determine capital costs but also other parameters, e.g. time for switching from
pumping to generating mode and efficiency. The issue becomes an optimization
problem with certain trade-offs, and depending on the properties sought a lot of
different configurations are possible (Ter-Gazarian, 2011).
2.5.2 Compressed air energy storage
In a compressed air energy storage (CAES) system air is pressurized by a compressor
powered by an electrical motor, the air is then stored in geological formations (cf.
CHALMERS, Energy and Environment, Master’s Thesis T2013-387 8
CCS) or man-made pressure vessels at the same temperature as the surroundings
(since the reservoirs are uninsulated). When the compressed air has been stored in the
reservoirs electric energy can be extracted at any given moment by expanding the
pressurized air through a turbine which powers a generator. Often a single
motor/generator unit is used to reduce costs and complexity of the CAES facility and
a transmission system is used to shift between the different modes of operation
(compression or expansion). To increase flexibility and to decrease the switch time a
separate motor and generator could be used, meaning that theoretically both can be
used simultaneously. Before entering the turbine the air is heated by letting it flow
through a heat exchanger together with the turbine exit gases. During expansion fuel
is combusted in the stream of pressurized air in order to increase the temperature and
thus increasing the work output and reducing the risk for ice formation at the blades
due to gases cooling down during expansion. Using porous rock formations as
reservoirs often result in the lowest costs, but hard rock mines and aquifers can also
be used. Underground CAES systems have the best cost-efficiency as the storage
already exists, however the airtightness needs to be examined before construction and
lead times are long. Water compensated systems can be used, where an underground
water reservoir provides a constant head to the storage volume; however this requires
a deep storage volume to get an adequate pressure. Constructing a CAES system
above ground is more flexible but capacity is reduced. CAES has a high part-load
efficiency compared to regular gas turbines since temperatures are kept constant while
the mass flow of air is controlled instead of the other way around. The ramp rates are
very high with rates reaching up to 19 MW per minute (Barnes & Levine, 2011). A
CAES system produces roughly three times more power in the expansion part of the
system than a conventional gas turbine, in which two thirds of the power generated by
the turbines is needed for compression of the air, since compression has been
achieved prior to production (Ter-Gazarian, 2011). In the future, adiabatic systems not
using any external fuel are proposed, these systems would store the heat generated at
compression and use it to reheat the air before expansion. The compressor inlet
temperature has a large impact on the work needed to drive the compressor, a
temperature of -10°C (winter) instead of 30°C (summer) requires 10-15% less work
(Dinçer & Zamfirescu, 2011).
2.5.2.1 Underwater CAES
Air can be stored in large underwater balloons where the weight of the surrounding
water provides the pressure needed for compression. The flexible structures used will
not be able to withstand an as high pressure as solid geological formations and thus
the energy density will suffer. A depth of 80 m has been proposed as reasonable for
the application. Research has been conducted at the University of Windsor in Ontario,
Canada (Cheung, Carriveau, & Ting, 2012).
Nottingham University is also involved in the development of the technology and they
propose an operation depth of 500 m.
2.6 Subsea Pumped Hydro Storage
Subsea Pumped Hydro Storage, or SPHS, is a new version of the existing Pumped
Hydro Storage (PHS) technology. The main difference is that the head of water is
CHALMERS, Energy and Environment, Master’s Thesis T2013-387 9
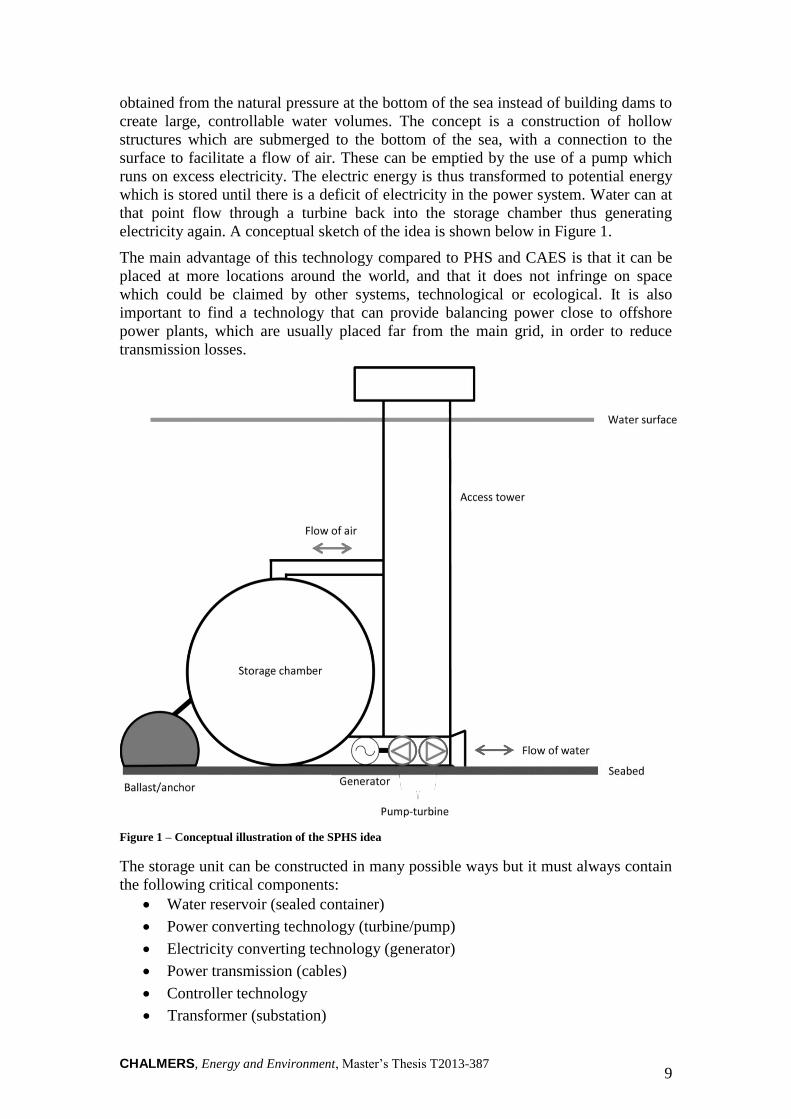
obtained from the natural pressure at the bottom of the sea instead of building dams to
create large, controllable water volumes. The concept is a construction of hollow
structures which are submerged to the bottom of the sea, with a connection to the
surface to facilitate a flow of air. These can be emptied by the use of a pump which
runs on excess electricity. The electric energy is thus transformed to potential energy
which is stored until there is a deficit of electricity in the power system. Water can at
that point flow through a turbine back into the storage chamber thus generating
electricity again. A conceptual sketch of the idea is shown below in Figure 1.
The main advantage of this technology compared to PHS and CAES is that it can be
placed at more locations around the world, and that it does not infringe on space
which could be claimed by other systems, technological or ecological. It is also
important to find a technology that can provide balancing power close to offshore
power plants, which are usually placed far from the main grid, in order to reduce
transmission losses.
Figure 1 – Conceptual illustration of the SPHS idea
The storage unit can be constructed in many possible ways but it must always contain
the following critical components:
Water reservoir (sealed container)
Power converting technology (turbine/pump)
Electricity converting technology (generator)
Power transmission (cables)
Controller technology
Transformer (substation)
CHALMERS, Energy and Environment, Master’s Thesis T2013-387 10
2.6.1 Turbine and pump
The turbine’s main purpose is to convert the kinetic energy in flowing water to
rotational energy in a shaft. The conversion can be done with different types of
turbines working under different types of principles, and for regular hydropower and
PHS there are two main categories depending on how the power is extracted; impulse
and reaction turbines. The choice of turbine usually depends on the location (head and
water supply), but also on cost, variation in flow and part load behaviour. While not
extracting energy from a flow of water, certain turbines can also be used as pumps
(when operating in reverse direction); the unit is then called a pump-turbine.
The reaction turbine is driven by a hydrostatic pressure of water (the change in
velocity and reduction in pressure while passing the turbine makes the runner rotate)
and the housing enclosing the runner maintains this pressure profile. The fundamental
theory regarding this technology is described by Newton’s third law. The impulse
turbine is driven by the flow of water which uses its kinetic energy to make the shaft
rotate; a larger water velocity gives higher energy transfer and more torque (Wagner
& Mathur, 2011). In this type the rotor blades are bucket-shaped to catch as much
water as possible. Before the turbine, nozzles create high velocity water jets that
impinge on the turbine blades. Unlike the reaction turbine, the energy transfer process
operates under atmospheric conditions (Guerrero-Lemus & Martinez-Duart, 2012).
The Kaplan turbine is a reaction turbine suitable for small heads (see Figure 3),
usually not more than a few meters (Sorensen, 2011). It has a rotor shaped like a
propeller, and when operating according to the design point an as high efficiency as
0.9 (Sorensen, 2011) can be reached. When working during offset conditions the
efficiency remains high for a large variation of water mass flows (see Figure 2). For
PHS systems the Kaplan turbine is rather inefficient in pumping the water upwards
(though it is possible), and for instalments that are using this turbine separate pumps
and pathways are usually constructed.
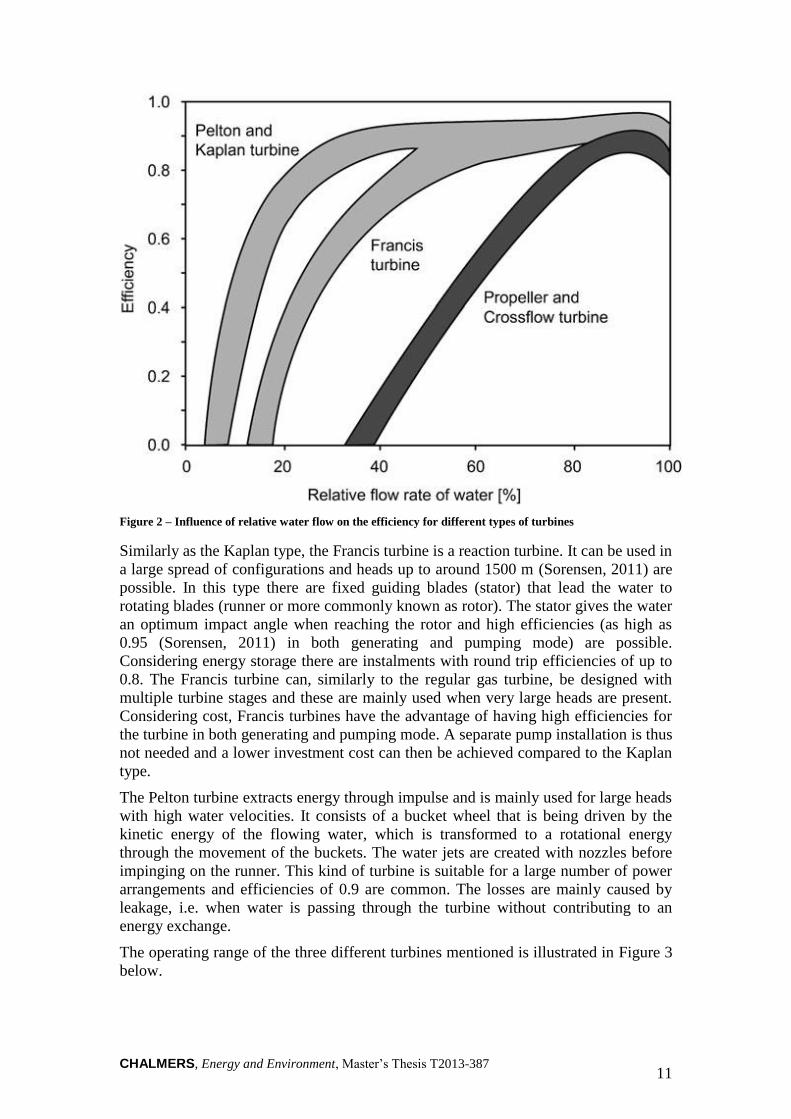
CHALMERS, Energy and Environment, Master’s Thesis T2013-387 11
Figure 2 – Influence of relative water flow on the efficiency for different types of turbines
Similarly as the Kaplan type, the Francis turbine is a reaction turbine. It can be used in
a large spread of configurations and heads up to around 1500 m (Sorensen, 2011) are
possible. In this type there are fixed guiding blades (stator) that lead the water to
rotating blades (runner or more commonly known as rotor). The stator gives the water
an optimum impact angle when reaching the rotor and high efficiencies (as high as
0.95 (Sorensen, 2011) in both generating and pumping mode) are possible.
Considering energy storage there are instalments with round trip efficiencies of up to
0.8. The Francis turbine can, similarly to the regular gas turbine, be designed with
multiple turbine stages and these are mainly used when very large heads are present.
Considering cost, Francis turbines have the advantage of having high efficiencies for
the turbine in both generating and pumping mode. A separate pump installation is thus
not needed and a lower investment cost can then be achieved compared to the Kaplan
type.
The Pelton turbine extracts energy through impulse and is mainly used for large heads
with high water velocities. It consists of a bucket wheel that is being driven by the
kinetic energy of the flowing water, which is transformed to a rotational energy
through the movement of the buckets. The water jets are created with nozzles before
impinging on the runner. This kind of turbine is suitable for a large number of power
arrangements and efficiencies of 0.9 are common. The losses are mainly caused by
leakage, i.e. when water is passing through the turbine without contributing to an
energy exchange.
The operating range of the three different turbines mentioned is illustrated in Figure 3
below.
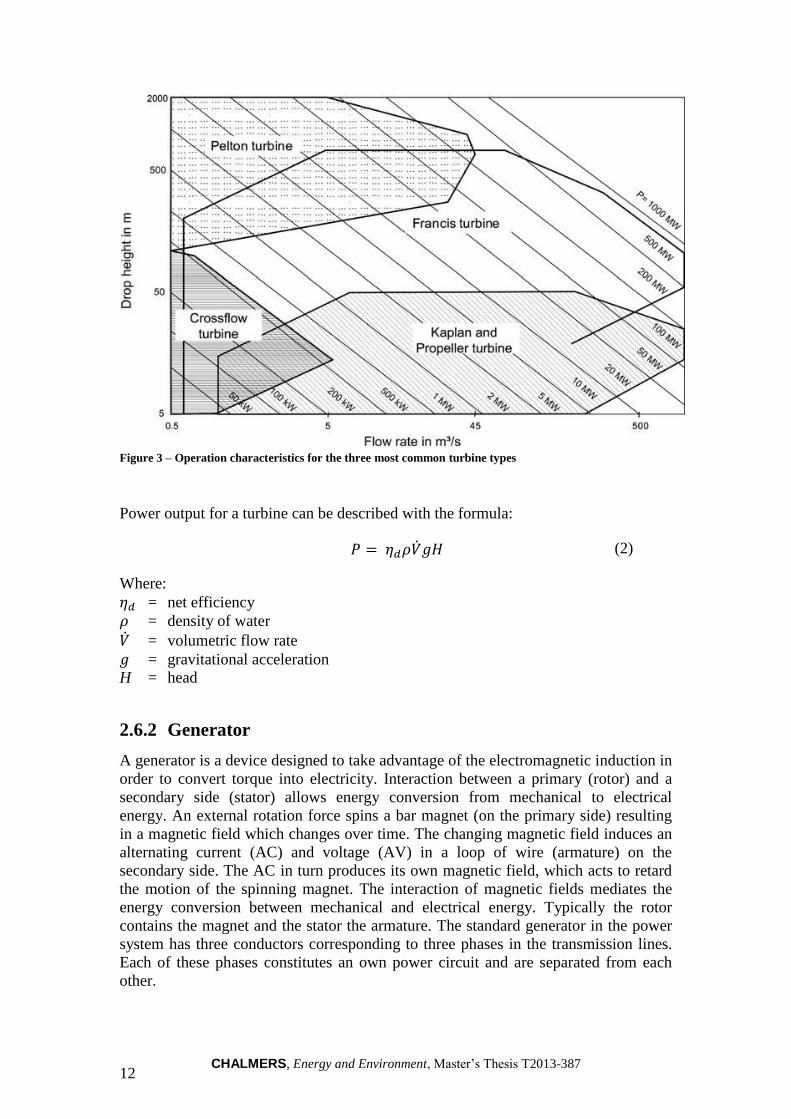
CHALMERS, Energy and Environment, Master’s Thesis T2013-387 12
Figure 3 – Operation characteristics for the three most common turbine types
Power output for a turbine can be described with the formula:
(2)
Where:
= net efficiency
= density of water
= volumetric flow rate
= gravitational acceleration
H = head
2.6.2 Generator
A generator is a device designed to take advantage of the electromagnetic induction in
order to convert torque into electricity. Interaction between a primary (rotor) and a
secondary side (stator) allows energy conversion from mechanical to electrical
energy. An external rotation force spins a bar magnet (on the primary side) resulting
in a magnetic field which changes over time. The changing magnetic field induces an
alternating current (AC) and voltage (AV) in a loop of wire (armature) on the
secondary side. The AC in turn produces its own magnetic field, which acts to retard
the motion of the spinning magnet. The interaction of magnetic fields mediates the
energy conversion between mechanical and electrical energy. Typically the rotor
contains the magnet and the stator the armature. The standard generator in the power
system has three conductors corresponding to three phases in the transmission lines.
Each of these phases constitutes an own power circuit and are separated from each
other.
CHALMERS, Energy and Environment, Master’s Thesis T2013-387 13
A generator running in the opposite direction (converting electrical to mechanical
energy) is called a motor. For pumped hydro storage the generator works as a
generator in discharging mode and as a motor in charging mode.
For the hydroelectric turbine technology the rotational speed of the turbine is low
compared to other turbine technologies (usually around 500 rpm). The standard
operation frequency for the electrical grid and generators in Europe is 50 Hz (von
Meier, 2006). To achieve the needed condition generators have more pole pairs and
these induce electricity more than once in each revolution. A generator connected to a
500 rpm turbine and working with 50 Hz frequency should have 6 pair poles to
achieve the wanted condition.
There are two types of generators. The synchronous generators are the most common
in the electricity system and they deliver power with a rotor and a stator field
operating at the same frequency. These are, together with shunt capacitors, the
backbone for stability in the electric power system. For offshore wind farms induction
generators are usually used. These are asynchronous generators and operate without a
dependent source for its rotor field current. The rotation is not fixed and varies with
power, having the ability to absorb fluctuations of mechanical power (delivered by the
fluctuating wind resource). Certain equipment (controlling platforms) is then used to
deliver the right frequency to the grid. Another advantage compared to the
synchronous generator is the lower cost.
2.6.3 Storage chamber
The size of the submersed chamber will be determined by the demands on energy
storage capacity from the power system.
2.6.3.1 Subsea construction
The thickness required to withstand the outer forces from the water is found as a
function of the external pressure and the properties of the chamber material. The main
mode of failure which needs to be avoided when constructing shells that will be
experiencing an external pressure is buckling. Buckling is a mode of failure caused by
the formation of dimples in a hollow shell when it is exposed to a high enough
external pressure. When the energy storage reservoir has been lowered into place at
the seabed it will experience a varying external pressure along its height due to the
increasing water pressure with depth. It will also be subjected to a cyclic load when
the chamber is emptied and filled, which could lead to fatigue failure. To get a first
approximation of the thickness the situation is simplified as a case with constant
pressure across the chamber, corresponding to an occasion when the chamber is
empty, and where there are no cyclic loads.
It is assumed that the storage unit is spherical as this shape gives the least amount of
surface area per unit of volume and also withstanding pressure better than any other
shape; due to its lack of corners it experiences an equal force in every direction. The
thickness can then be obtained from classical buckling theory, where the buckling
pressure of a spherical shell with radius r is described as (Samuelson, 1990):
CHALMERS, Energy and Environment, Master’s Thesis T2013-387 14
√ (
)
(3)
Concrete is chosen as the construction material for the reservoir due to its low price
and the vast competence connected to it. The material has a Poisson ratio ( ) of 0.2
and an elasticity modulus (E) of 36 GPa, which gives a simplified formula as
√ (
)
(4)
According to (Mekjavić, 2011) buckling occurs at approximately 10% of the
theoretical buckling pressure, a typical value of the safety factor is 6 (Sinnott, 2005)
giving an expression for the thickness t as:
√ √
(5)
2.6.3.2 Energy density
The energy density U for the SHPS technology is dependent on the depth d at which
the unit is placed. Energy is extracted from the head of water above the turbine,
corresponding to a value per cubic meter of water of:
(6)
When the reservoir is filled with water during discharging the energy density
continuously decreases as the pressure potential is decreased. Because of this the
height of the storage unit becomes restricted if there is a limit on the accepted loss of
head. The restriction becomes more influential at lower depths where the height of the
structure is proportionally larger than at larger depths. If the necessary energy storage
capacity is known, the depth at which the storage unit will be placed determines the
required inner volume of the reservoir. Regardless of the shape of the reservoir the
volume and height restrictions together produce restrictions on all other dimensions.
2.6.4 Conceptual design
There are two possible concepts for the energy storage unit. Either a centralized
capacity is used, where several storage units are connected and the power is generated
from a single turbine and generator. Or a decentralized capacity is considered, with
each unit containing a separate turbine and generator. In the centralized case
additional pipes are needed to connect the units to the turbine, this will lead to some
pressure losses in the system. There will be lower investment costs for the power
generating components (fewer components), but higher investment costs for the
additional piping and a cost related to the increased pressure losses. Maintenance and
operation costs will be lower for the centralized option. The decentralized option has a
higher investment cost for the mechanical components, however, the pipe network
connecting several tanks is not needed. The turbines will be located either inside the
container or outside in a sealed water filled container (to maintain the high conversion
CHALMERS, Energy and Environment, Master’s Thesis T2013-387 15
efficiency). Depending on the design reparation costs will differ, though in both cases
it will be substantially higher than for the centralized option. Feasible constructions
will give the limitations for the energy capacity. Depending on if a centralized or
decentralized configuration is chosen what is feasible will differ. A centralized facility
has the potential for capacities in the order of gigawatt hours and is entirely dependent
on the geographical location. The separate units have a limited amount of energy
(most likely in the order of megawatt hours) since it is not feasible to construct too big
reservoirs, but this is entirely dependent on the depth.
In both cases a connection between the storage unit and the surface is needed for
facilitating the needed flow of gas (air), transmitting energy and controlling the
system. A connection tower could serve this purpose. Due to cost related issues this
would probably only be implemented for shallow locations. For deep ocean sites a
different design would most likely be implemented. The facilitating of needed gas
would then be solved with a membrane construction compressing the gas when water
fills the container. When water is pumped out the membrane expands (pressure
difference) and the void created is filled with the expanding gas. For controlling and
transmitting energy to the surface cables which connect the units to substations are
used.
Considering energy density, the height of the water pillar gives the amount of energy
stored in a given volume. The depth in SPHS (head in PHS) thus determines the
energy density. Considering a fixed energy storage capacity, a shallow location will
need a larger container compared to if the depth is increased. Furthermore, since a
large reservoir is needed the cost for construction will be high. On the other hand the
cost for installation, operation and maintenance increases with increased depth
yielding a trade-off between the different costs.
There are several aspects and design considerations when choosing the turbine. The
water depths give limitations on which turbine types that are possible to implement.
Design properties like using a separate pump or a reversible turbine, constant rpm
(mass flow) or constant power output, part load efficiencies and starting
characteristics of the turbine are important to consider. Choosing a constant power
output the rpm of the turbine will change during operation. When charging and
discharging the efficiency of SPHS changes since the turbine is not working under
designed conditions. Another concept that affects the efficiency is turbulence and
frictional losses from water movement. Since the penstock is virtually inexistent,
these losses are considered to be very low.
Because of the large amount of possible configurations the cost for the turbine setup
can differ widely. Mainly two types of turbines, Francis and Kaplan, were considered
for implementation. Both types shows good properties for low heads (Francis works at
a wider range and large heads are possible). The advantage with the Kaplan turbine is
the ability to work under changing conditions without dropping much in efficiency
(Figure 2). The main disadvantage with this technology is the bad efficiency in
pumping mode, (reversed direction) which leads to the fact that if choosing a Kaplan
turbine a separate pump is essential for remaining a high round trip efficiency. More
components do not only increase the investment cost but also the operation and
maintenance costs (operation and maintenance cost are already substantial considering
the fact that the technology will operate on the seabed). The Francis turbine on the
other hand has the advantage of having high efficiency in both pumping and
generating mode (if working under designed conditions) and fewer components are
thus needed.
CHALMERS, Energy and Environment, Master’s Thesis T2013-387 16
For other electronic components, such as generators and transformers, several
solutions are possible. The wanted voltage and current levels determine the size of the
transformers. Generally an as high voltage level as possible (and hence low current
level) is wanted to minimize the losses in transmission (von Meier, 2006). An
induction generator is most likely to be used since the properties of having a relatively
low cost and the ability to absorb mechanical fluctuations are considered to be
favourable. Discussions (Nilsson, 2013) led to the decision of using a regular
asynchronous generator (induction) and then converting the electricity to the right
frequency. The generator will not be designed to yield a given frequency since the
turbine rotational speed will change and with it the frequency. The frequency would,
with frequency changers, be correlated in the substation to match the grid’s design.
Cables used are dimensioned based on the operating current and voltage of the turbine
and generator (Åkerlind, 2013). Two cables for each unit are needed for connection to
the surface and the substation. Further, connecting the substation to the grid onshore,
HVDC cables (Bresesti, Kling, Hendriks, & Vailati, 2007) are generally used for
offshore wind power today. Since the energy storage sites would be near offshore
wind power units, the same substation and connection to the grid could be used to
keep the investment costs down (Odenberger, 2013).
The material decision is of great importance since the SPHS units will mostly be
located in the ocean. The operating medium is salt water which requires a material
that is highly resistant to corrosion. The cost for offshore implementation will thus be
higher compared to units exposed to freshwater.
2.6.5 Geographic aspects
Different locations are possible for subsea pumped hydro storage, and criteria for the
locations depend on several design parameters (discussed in the previous chapter) of
the technology and also on implementation in the electricity system. The water depth
determines, as mentioned, the possible pressure drop and energy density. A higher
density corresponds to smaller units for the same energy content. It is important to
note that the related costs for operation increases with increased depth due to the need
of more sophisticated technologies.
As offshore wind farm developments increase, a combination of the two technologies
can contribute to a more steady electricity output profile. For this implementation in
the energy system it can be preferable to place the storage units close to a wind farm,
mainly because of the substantial cost of high voltage cables. The combination of
these technologies limits possible sites since there are restrictions from both to
account for.
Other aspects that affect the choice of location could be availability and surroundings
that affect installation.
CHALMERS, Energy and Environment, Master’s Thesis T2013-387 17
3 Method
Considering the large amount of wind power in the Danish electricity system, this was
considered suitable for a case study as it would represent a region with a highly
fluctuating power production. The future energy targets in this region are also well
defined and give a solid base for modelling future scenarios. The Nord Pool spot
market provided an extensive database for the Danish power system including data for
demand and electricity prices, and the Danish TSO, energinet.dk, provided data for
wind power output, imports and exports and centralized power production.
3.1 Design requirements
Large variations of setups are possible and the challenge is to find the most suitable
configuration for implementation. Literature study and guidance by involved
individuals determined a suitable design. Deeper technological evaluation was
disregarded in this study and reliance on insights from competent people was
considered to be enough.
3.2 Comparison with other technologies
Studying the possible energy storage technologies, not all serve the same purpose as
SPHS. Regular PHS and CAES are technologies considered for the same widespread
implementation (bulk storage). As mentioned in Chapter 2.4.1, the key performance
parameters are indicators used to characterize and compare different energy storage
technologies. With a literature study and interviews with the industry these inputs
could be determined and a comparison between the technologies was made.
When estimating the LCOE a modified version of equation (1) was used. Since the
comparison is made between energy storage technologies and not power generation,
the fuel costs should be interpreted differently. Here, the electricity price was
implemented instead since, similar to fuel costs, this is a variable costs that increases
with increased utilisation. For calculations, the energy amount and electricity cost
were determined with the actor’s perspectives energy model (see Chapter 3.3). The
RTE was included in the electricity cost since the utilisation of power differs between
technologies. Considering the discount rate, a large variation of numbers is used and
depending on which one the result will differ widely. For wind projects the rate varies
between 5.5% and 12.5% (IRENA, 2012). The discount rate was determined by
choosing a mean value of this interval, resulting in 9%. The capital costs vary
depending on references, but the most recurring values from different sources were
used for calculation, see Appendix A for capital cost intervals. Estimating the cost for
operation and maintenance a literature study provided values, and the mean value
method was used to determine the inputs used. Depending on what technology was
studied different economic lifetimes were implemented in the calculation.
With all these parameters determined, a levelized cost of electricity could be
calculated and the result provided a value for comparison between the technologies.
CHALMERS, Energy and Environment, Master’s Thesis T2013-387 18
3.3 Energy system modelling
In order to illustrate the characteristics of the chosen reference energy system and to
evaluate the potential of energy storage, an energy systems model was created. The
model uses production data for wind and thermal power as well as the load curve and
the corresponding price for the Danish power system to model the charge and
discharge characteristics of a generic energy storage technology. The thermal power is
assumed to be generated at constant levels during winter and summer to simulate a
case where these electricity generating technologies are not part of the balancing
power in the grid; this function is covered by the energy storage instead. The amount
of electricity generated by the thermal plants remains the same, but this generation
becomes more efficient as the plants can run at their design point for a longer time
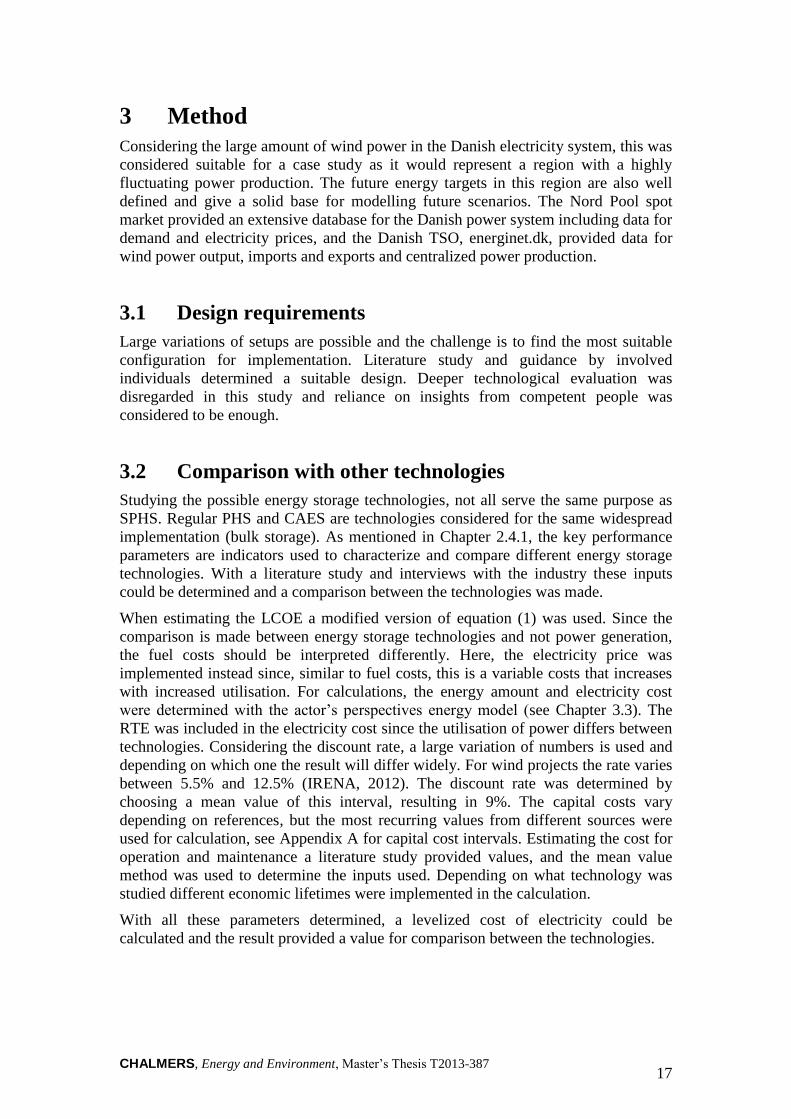
without major changes in operation. The system characteristics, with and without the
assumption of constant thermal power generation, are shown below in Figure 4.
Figure 4 - System characteristics with and without the assumption of constant thermal generation
CHALMERS, Energy and Environment, Master’s Thesis T2013-387 19
To find how the energy storage behaves in terms of charging and discharging during a
year a number of properties were analysed continuously at each time step. The data
for electricity generation, from both wind and thermal power, was measured every
five minutes so this time step was used in the model. The price and load curve for the
chosen year (2012) only contained data entries at every hour so these curves were
interpolated to match the more detailed production curves. The criteria for charging is
that there is a surplus of electricity in the grid after the thermal production curve has
been evened out and that the price level of electricity is low enough. The amount of
energy which can be stored is also limited by the capacity of the power conversion
system. The criteria for discharging are the opposites of the charging criteria, but the
limitations of the power conversion system still apply. The principle of charging and
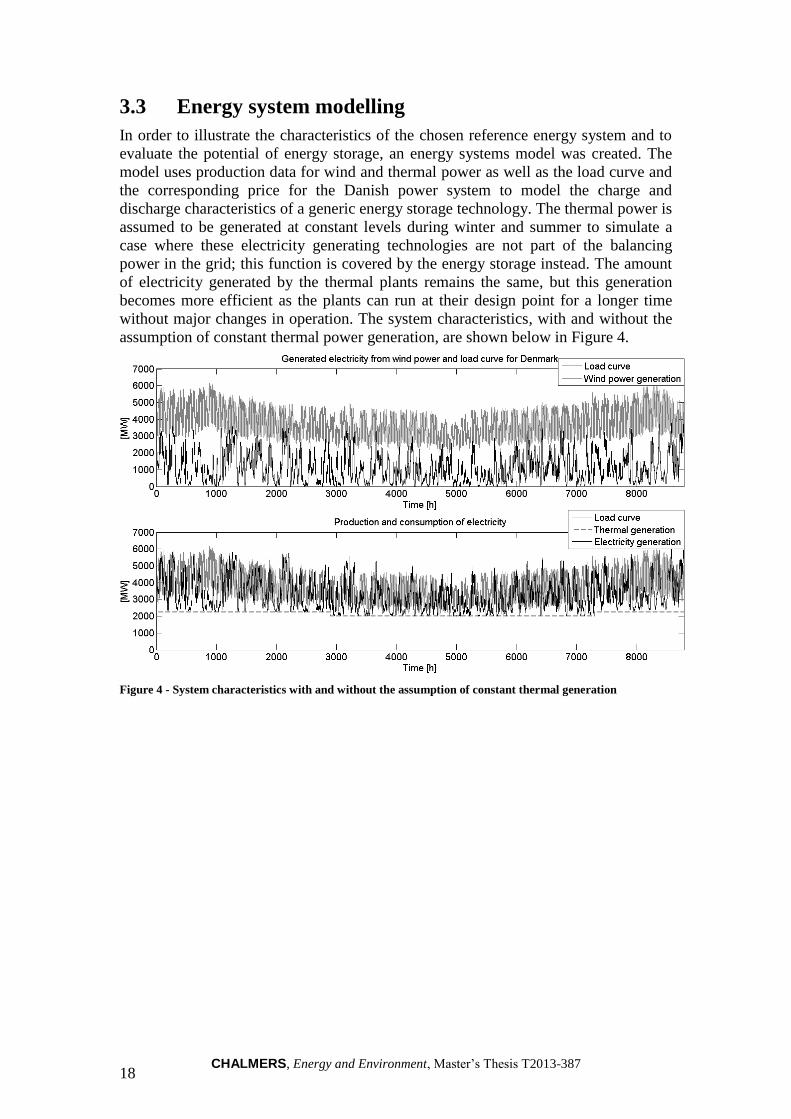
discharging is illustrated in Figure 5 below.
Figure 5 – Concept of evening out the power fluctuations with energy storage
The first part of the model determines the total balancing need that arises due to the
assumption of constant thermal power. The model runs through every time step,
comparing the load to the production (wind and thermal power), and if the production
surpasses the demand at that point the excess energy is stored to a vector. As long as
this behaviour is observed the value at each vector position represents the
accumulated energy stored. When the opposite occurs, that the production is lower
than the demand, the required energy to cover this gap is released as long as the stored
energy doesn’t drop below zero. The value of the specific vector position (the amount
of energy currently stored) is decreased slightly more than what is released to the
system due to an assumed efficiency which represents the losses throughout the
storage process; all losses are allocated to the discharge for simplification. The total
storage curve can be used to determine the maximum capacity needed for balancing
all fluctuations and to estimate how often a certain capacity is needed.
In order to balance all of the arising fluctuations the storage needs to be dimensioned
for one maximum capacity case, but since it is unlikely that this will be accomplished
due to the resulting low utilization factor two other cases with lower storage capacities
will be examined as well. The storage capacity in the first case is based on the mean
CHALMERS, Energy and Environment, Master’s Thesis T2013-387 20
value of storage requirements throughout the year, and the second case evaluates a
case where the storage limit is half of the maximum storage limit.
The three chosen storage limits were implemented in the next step of the storage
model. Compared to the first step, the methodology remains the same, but with an
added upper limit of energy storage as a complement to the physical limit that
describes an empty unit. The possible power in- and outputs from pumps and turbines
were also considered by limiting the conversion of energy at each time step to the
rated power. To determine the total power, the number of units was calculated. This is
achieved by comparing the storage capacity of a single unit, which is set to a fixed
value, to the system capacity for each limit. In addition to fixing the single unit
storage capacity, the power is set as well. The two parameters result in a limit of
energy conversion for each scenario. Furthermore, an economic aspect was
implemented to evaluate the possibilities of profit from using the technology. The
financial flow can be determined by applying the current electricity price to the
amount of energy being stored or released at each time step and at the end of the year
the result is obtained.
In an effort to improve income and illustrate a more likely operation of an energy
storage unit, the electricity price was implemented as another criterion for charging.
In the Nordic power system the electricity prices for the following 24 hours are
revealed daily through Nord Pool, this means that a scheme for charging and
discharging based on this information can be created in order to maximize income.
Since the power-to-storage capacity ratio is fixed, the charge and discharge times are
known. The model uses this to choose the hours with the cheapest and most expensive
electricity prices for the following 24 hours in order to schedule charging and
discharging, within the predefined limits of the technical system.
3.3.1 Actor’s perspective
The energy model created uses input data based on the current power system of
Denmark and in order to keep these characteristics the energy storage technology is
implemented in the model from an actor’s perspective. This implies that only one unit
is studied as a part of the system, and due to its small impact the system as a whole is
not affected. For the single unit it is assumed that there is always a sufficient amount
of electricity in the system, due to a well-developed power grid, and that the charging
and discharging occurs when prices are low or high enough.
3.3.2 Future developments
The Danish government has set ambitious energy targets for the future. In the year
2020, 50% of the electricity generation (Danish Ministry of Climate, Energy and
Building, 2012) has to come from wind power. With the increased amount of power
fluctuations due to the large share of intermittent wind power, more problems with
regulating power will become apparent. Trends show that the demand will not
increase significantly (Rasch, 2009) because of energy efficiency measures on the
demand side (more efficient energy services and end-use). In order to reach the 50%
target the yearly energy output from wind power needs to be increased by 83%, which
was implemented in the energy systems model.
CHALMERS, Energy and Environment, Master’s Thesis T2013-387 21
3.3.3 Sizing of subsystems
As a first estimate it was assumed that the storage chamber should be able to store
energy from a large offshore wind turbine (5 MW) for four hours. This 20 MWh
storage unit was used as a definition of a single decentralized unit throughout the
analysis. The effects of varying storage capacity and pump-turbine power were also
evaluated.
3.3.4 Input data
Data for price and consumption levels for the year 2012 in the chosen system was
obtained from the Nord Pool website (Nord Pool Spot). The data entries are given for
each hour of the year, resulting in a total of 8784 entries (due to that 2012 was a leap
year). The analysis considers all of Denmark as the chosen system and data for this
region is obtained by using the mean value of the two price areas in the country. In
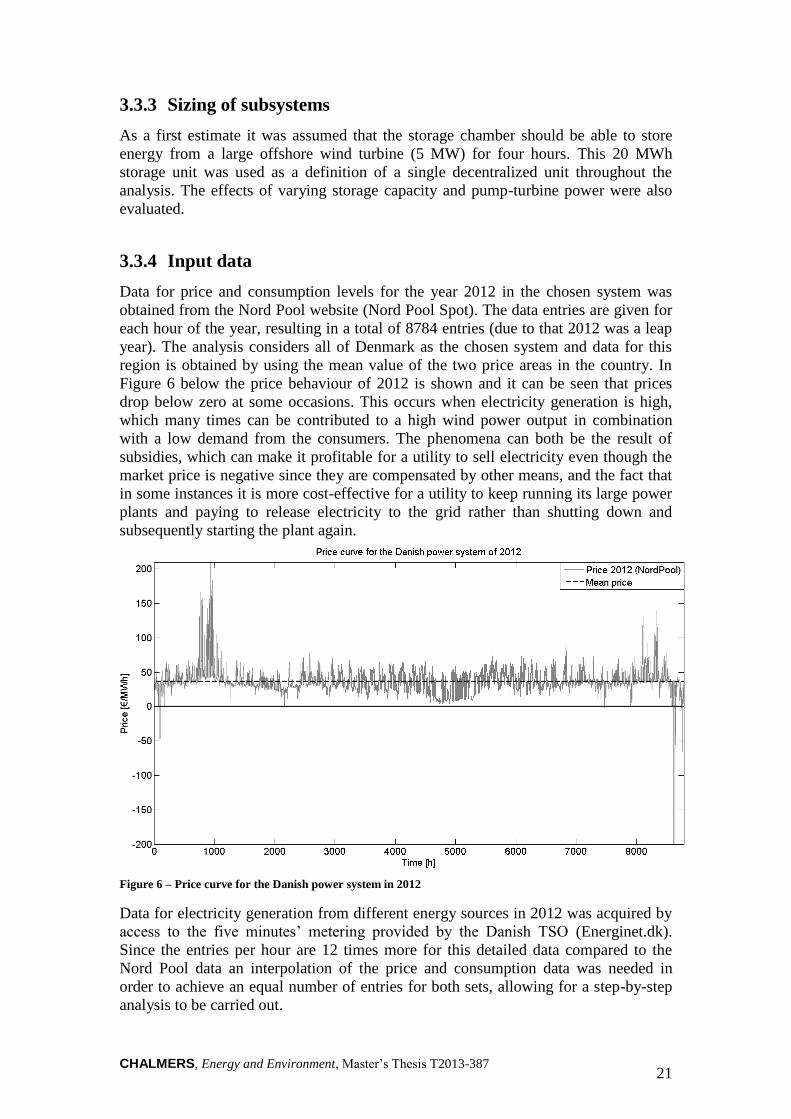
Figure 6 below the price behaviour of 2012 is shown and it can be seen that prices
drop below zero at some occasions. This occurs when electricity generation is high,
which many times can be contributed to a high wind power output in combination
with a low demand from the consumers. The phenomena can both be the result of
subsidies, which can make it profitable for a utility to sell electricity even though the
market price is negative since they are compensated by other means, and the fact that
in some instances it is more cost-effective for a utility to keep running its large power
plants and paying to release electricity to the grid rather than shutting down and
subsequently starting the plant again.
Figure 6 – Price curve for the Danish power system in 2012
Data for electricity generation from different energy sources in 2012 was acquired by
access to the five minutes’ metering provided by the Danish TSO (Energinet.dk).
Since the entries per hour are 12 times more for this detailed data compared to the
Nord Pool data an interpolation of the price and consumption data was needed in
order to achieve an equal number of entries for both sets, allowing for a step-by-step
analysis to be carried out.
CHALMERS, Energy and Environment, Master’s Thesis T2013-387 22
To study future developments and how these influence the use of an energy storage
unit, price curves for the year 2020 was needed. This information was obtained from a
model created at the Division of Energy Technology, which simulate a possible
outcome given certain parameters.
Price information for the different components of the Subsea Pumped Hydro Storage
unit was attained through contact with representatives from the industry and through
literature studies of relevant technologies with similar properties.
3.4 Scenarios
Different scenarios were implemented in both the calculation of the LCOE and the
evaluation in the energy systems model in order to capture the characteristics of the
energy storage technology.
3.4.1 Centralized or decentralized configuration
The additional cost for centralisation was assumed to be an increase in construction
costs of 10% (see Chapter 4.1) to account for additional piping and connecting several
storage units. This additional cost was used throughout the entire investigation.
3.4.2 Charge and discharge time
Considering different discharge times the LCOE changes. Lower charge and
discharge times improve the ability to take advantage of peaks in the electricity price
throughout the day. A potential higher income for the energy storage unit can be
reached since shorter time intervals for buying and selling electricity yields lower and
higher mean values of the price (and a larger difference between buy and sell price).
To analyse the behaviour of changed charge and discharge times, both a 5 MW and a
10 MW pump-turbine were implemented in the LCOE calculations.
3.4.3 Depths
Considering the possibility of installing the technology at different depths, the
investment differs and apart from the power converting components, all the costs
change. Unlike the installation cost, which increases, the concrete structure cost
decreases with increased depth. The first depth analysed was 100 m, which was
chosen since it is likely that an installation at this depth can be achieved within a
foreseeable future. Lower depths have the advantage of higher energy densities which
lead to smaller constructions, so the depths at which the concrete cost was reduced to
half and a third of that of the first case was chosen for analysis as well. These depths
where determined to be 458 m and 1212 m, respectively. The increased cost of
installation is difficult to estimate since there are no facilities in operation, but a
symbolic rate was used. For a depth of 458 m an increase of 20% was estimated and
used for installation and operations and maintenance costs. At 1212 m an increase of
62% (to keep the same cost increase per meter) in installation and operations and
maintenance costs was used.
CHALMERS, Energy and Environment, Master’s Thesis T2013-387 23
3.4.4 Future scenarios
As explained in Chapter 3.3.4, a price curve for a possible future Danish power
system (in the year 2020) was obtained from an external electricity price forecast
model. Fluctuations in this curve were lower than in 2012 so further scenarios were
implemented. The third scenario implemented a price increase of 20% compared to
the situation of 2012. The highest fluctuating region regarding price from the 2020
forecast model, the UK2 price area, was also analysed as it was believed that this
would be a good representation of a future highly intermittent region.
3.4.5 Best and worst case scenario
Because of the uncertainties in the design inputs, an analysis is necessary to show the
range of possible outcomes. The critical parameters are: installations costs, operation
and maintenance costs, the round trip efficiency, electricity prices and the water
depth. When implementing the analysis into the model the impact will be a changing
cost for the energy storage unit. A best and worst case scenario is included containing
a change in all the parameters at the same time. With these scenarios a LCOE interval
can then be estimated describing a possible cost range for the technology. With this, a
more accurate LCOE analysis resulted in a range of costs rather than exact values. For
the low boundary (best case scenario) the installation cost was approximated to be the
same as the estimations of (Garg, Lay, & Füllmann, 2012), namely 300 €/kW. The
operation and maintenance cost was set to be the same as the lower value of offshore
wind power (IRENA, 2012). The pump-turbine cost remained the same for all the
calculations because this was considered to be the most certain value (Sander, 2013).
Due to the uncertainty of the performance of the technology, the RTE for the best case
scenario was set to 80%, as high as the best pumped hydro storage facility today
(IRENA, 2012). Considering the depth, 1212 m was chosen since with the lower
values of operating cost the 62% increase affected the unit less than for the original
case.
The worst case scenario includes an efficiency of 70% and a water depth of 100 m
which yielded a concrete structure cost of 1973 €/kW. The installation cost was set to
500 €/kW and the operation and maintenance cost was set to 5 €cents/kWh, higher
than the highest value for offshore wind power (IRENA, 2012).
3.4.6 Subsidies
To see how economic support influences the possible income for an energy storage
technology, a subsidy is incorporated into the energy systems model. The value of the
subsidy was chosen as that for offshore wind power in Germany, 150 €/MWh
(dejure.org), since that technology share many issues with Subsea Pumped Hydro
Storage.
CHALMERS, Energy and Environment, Master’s Thesis T2013-387 24
4 Results
In the following sections the results from the techno-economic analysis and the
energy systems model will be presented.
4.1 Techno-economic analysis
4.1.1 Turbine
A consultation (Nilsson, 2013) led to the decision of using a Francis turbine. The
turbine is set to operate under a fixed power output. This yields a varying rotational
speed since the pressure head changes while the storage unit is filled with water.
Depending on the location, the technical properties for the turbine varies. For
shallower depths a larger mass flow of water is needed to yield a given power output
compared to a deeper location. Different water depths (depths of 100, 458 and 1212
meters were evaluated) will thus give different volume flows for the same power
output and are calculated with equation (1).
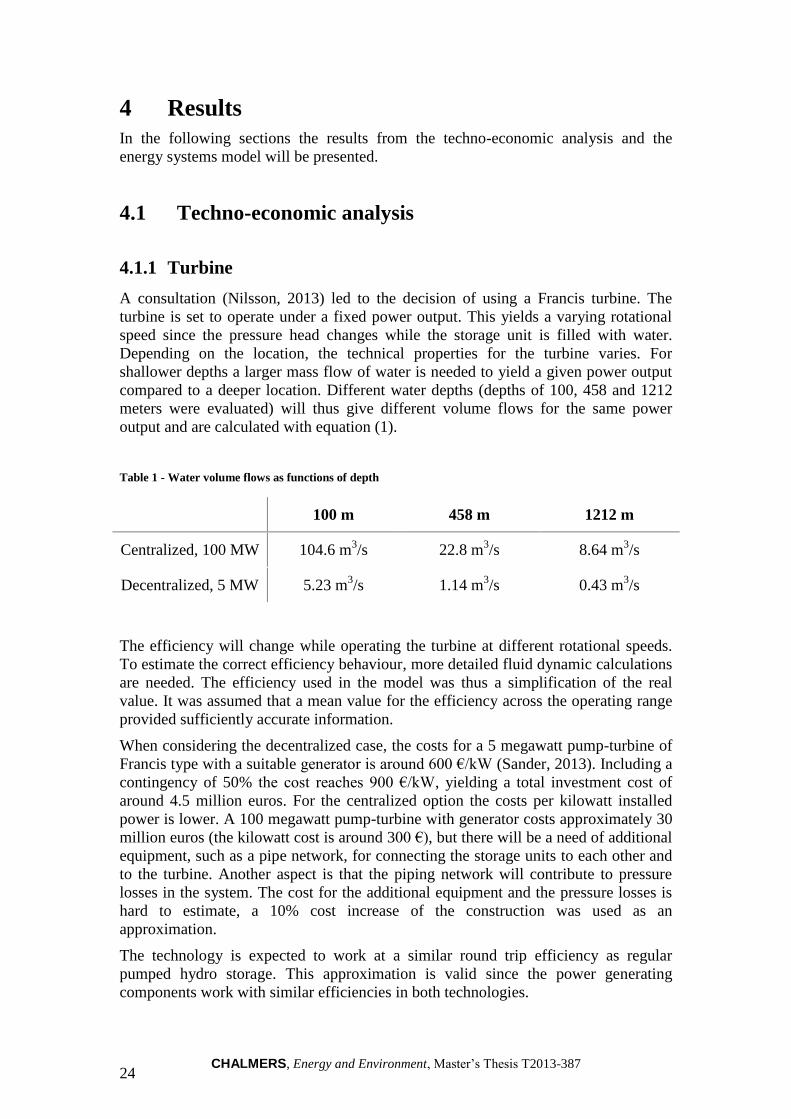
Table 1 - Water volume flows as functions of depth
100 m 458 m 1212 m
Centralized, 100 MW 104.6 m3/s 22.8 m
3/s 8.64 m
3/s
Decentralized, 5 MW 5.23 m3/s 1.14 m
3/s 0.43 m
3/s
The efficiency will change while operating the turbine at different rotational speeds.
To estimate the correct efficiency behaviour, more detailed fluid dynamic calculations
are needed. The efficiency used in the model was thus a simplification of the real
value. It was assumed that a mean value for the efficiency across the operating range
provided sufficiently accurate information.
When considering the decentralized case, the costs for a 5 megawatt pump-turbine of
Francis type with a suitable generator is around 600 €/kW (Sander, 2013). Including a
contingency of 50% the cost reaches 900 €/kW, yielding a total investment cost of
around 4.5 million euros. For the centralized option the costs per kilowatt installed
power is lower. A 100 megawatt pump-turbine with generator costs approximately 30
million euros (the kilowatt cost is around 300 €), but there will be a need of additional
equipment, such as a pipe network, for connecting the storage units to each other and
to the turbine. Another aspect is that the piping network will contribute to pressure
losses in the system. The cost for the additional equipment and the pressure losses is
hard to estimate, a 10% cost increase of the construction was used as an
approximation.
The technology is expected to work at a similar round trip efficiency as regular
pumped hydro storage. This approximation is valid since the power generating
components work with similar efficiencies in both technologies.
CHALMERS, Energy and Environment, Master’s Thesis T2013-387 25
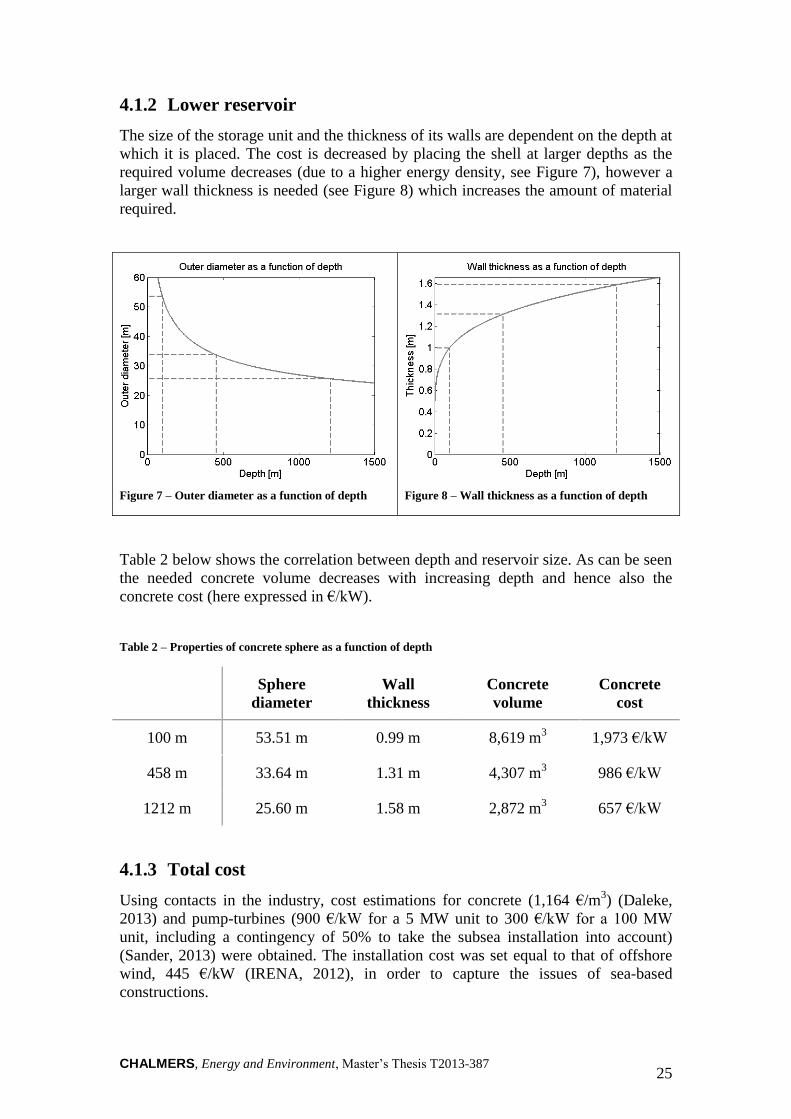
4.1.2 Lower reservoir
The size of the storage unit and the thickness of its walls are dependent on the depth at
which it is placed. The cost is decreased by placing the shell at larger depths as the
required volume decreases (due to a higher energy density, see Figure 7), however a
larger wall thickness is needed (see Figure 8) which increases the amount of material
required.
Figure 7 – Outer diameter as a function of depth
Figure 8 – Wall thickness as a function of depth
Table 2 below shows the correlation between depth and reservoir size. As can be seen
the needed concrete volume decreases with increasing depth and hence also the
concrete cost (here expressed in €/kW).
Table 2 – Properties of concrete sphere as a function of depth
Sphere
diameter
Wall
thickness
Concrete
volume
Concrete
cost
100 m 53.51 m 0.99 m 8,619 m3 1,973 €/kW
458 m 33.64 m 1.31 m 4,307 m3 986 €/kW
1212 m 25.60 m 1.58 m 2,872 m3 657 €/kW
4.1.3 Total cost
Using contacts in the industry, cost estimations for concrete (1,164 €/m3) (Daleke,
2013) and pump-turbines (900 €/kW for a 5 MW unit to 300 €/kW for a 100 MW
unit, including a contingency of 50% to take the subsea installation into account)
(Sander, 2013) were obtained. The installation cost was set equal to that of offshore
wind, 445 €/kW (IRENA, 2012), in order to capture the issues of sea-based
constructions.
CHALMERS, Energy and Environment, Master’s Thesis T2013-387 26
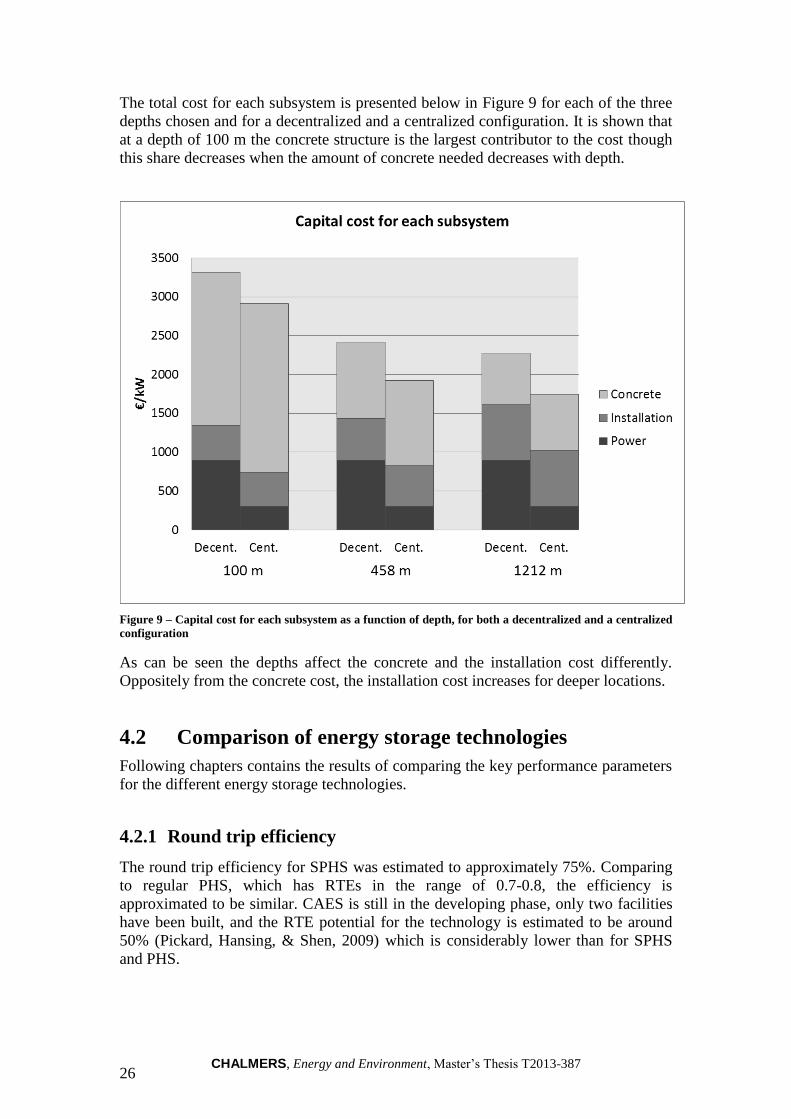
The total cost for each subsystem is presented below in Figure 9 for each of the three
depths chosen and for a decentralized and a centralized configuration. It is shown that
at a depth of 100 m the concrete structure is the largest contributor to the cost though
this share decreases when the amount of concrete needed decreases with depth.
Figure 9 – Capital cost for each subsystem as a function of depth, for both a decentralized and a centralized
configuration
As can be seen the depths affect the concrete and the installation cost differently.
Oppositely from the concrete cost, the installation cost increases for deeper locations.
4.2 Comparison of energy storage technologies
Following chapters contains the results of comparing the key performance parameters
for the different energy storage technologies.
4.2.1 Round trip efficiency
The round trip efficiency for SPHS was estimated to approximately 75%. Comparing
to regular PHS, which has RTEs in the range of 0.7-0.8, the efficiency is
approximated to be similar. CAES is still in the developing phase, only two facilities
have been built, and the RTE potential for the technology is estimated to be around
50% (Pickard, Hansing, & Shen, 2009) which is considerably lower than for SPHS
and PHS.
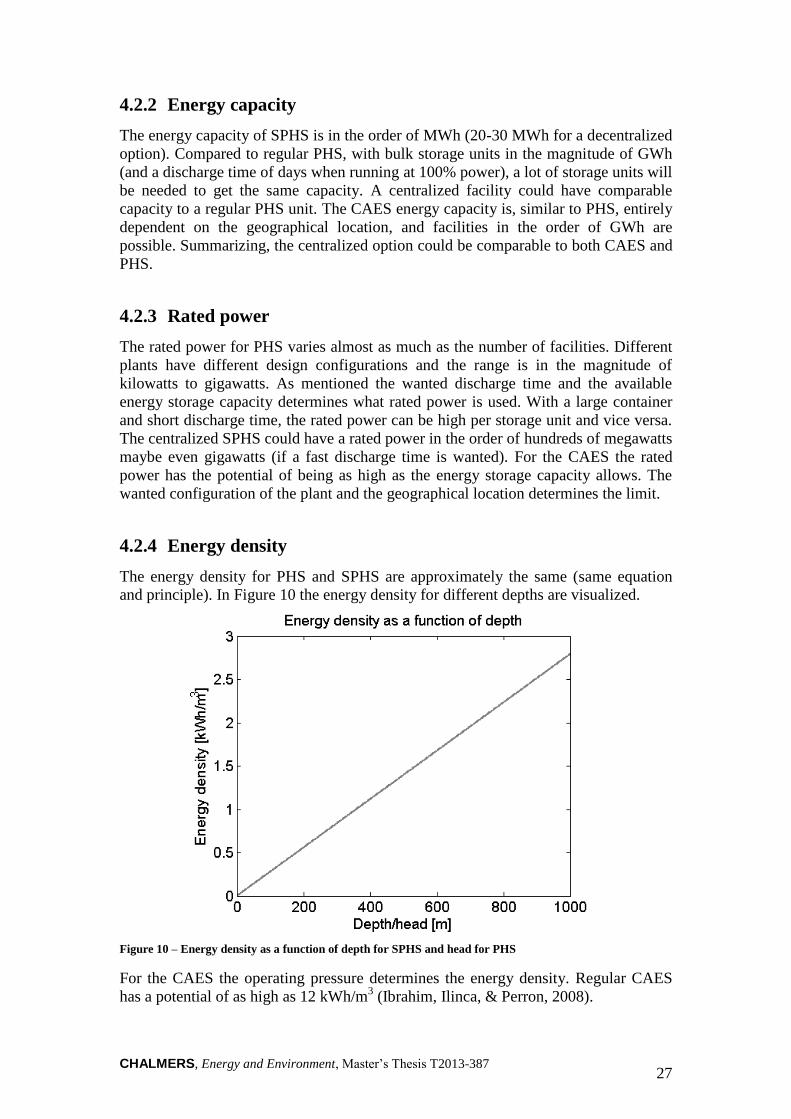
CHALMERS, Energy and Environment, Master’s Thesis T2013-387 27
4.2.2 Energy capacity
The energy capacity of SPHS is in the order of MWh (20-30 MWh for a decentralized
option). Compared to regular PHS, with bulk storage units in the magnitude of GWh
(and a discharge time of days when running at 100% power), a lot of storage units will
be needed to get the same capacity. A centralized facility could have comparable
capacity to a regular PHS unit. The CAES energy capacity is, similar to PHS, entirely
dependent on the geographical location, and facilities in the order of GWh are
possible. Summarizing, the centralized option could be comparable to both CAES and
PHS.
4.2.3 Rated power
The rated power for PHS varies almost as much as the number of facilities. Different
plants have different design configurations and the range is in the magnitude of
kilowatts to gigawatts. As mentioned the wanted discharge time and the available
energy storage capacity determines what rated power is used. With a large container
and short discharge time, the rated power can be high per storage unit and vice versa.
The centralized SPHS could have a rated power in the order of hundreds of megawatts
maybe even gigawatts (if a fast discharge time is wanted). For the CAES the rated
power has the potential of being as high as the energy storage capacity allows. The
wanted configuration of the plant and the geographical location determines the limit.
4.2.4 Energy density
The energy density for PHS and SPHS are approximately the same (same equation
and principle). In Figure 10 the energy density for different depths are visualized.
Figure 10 – Energy density as a function of depth for SPHS and head for PHS
For the CAES the operating pressure determines the energy density. Regular CAES
has a potential of as high as 12 kWh/m3 (Ibrahim, Ilinca, & Perron, 2008).
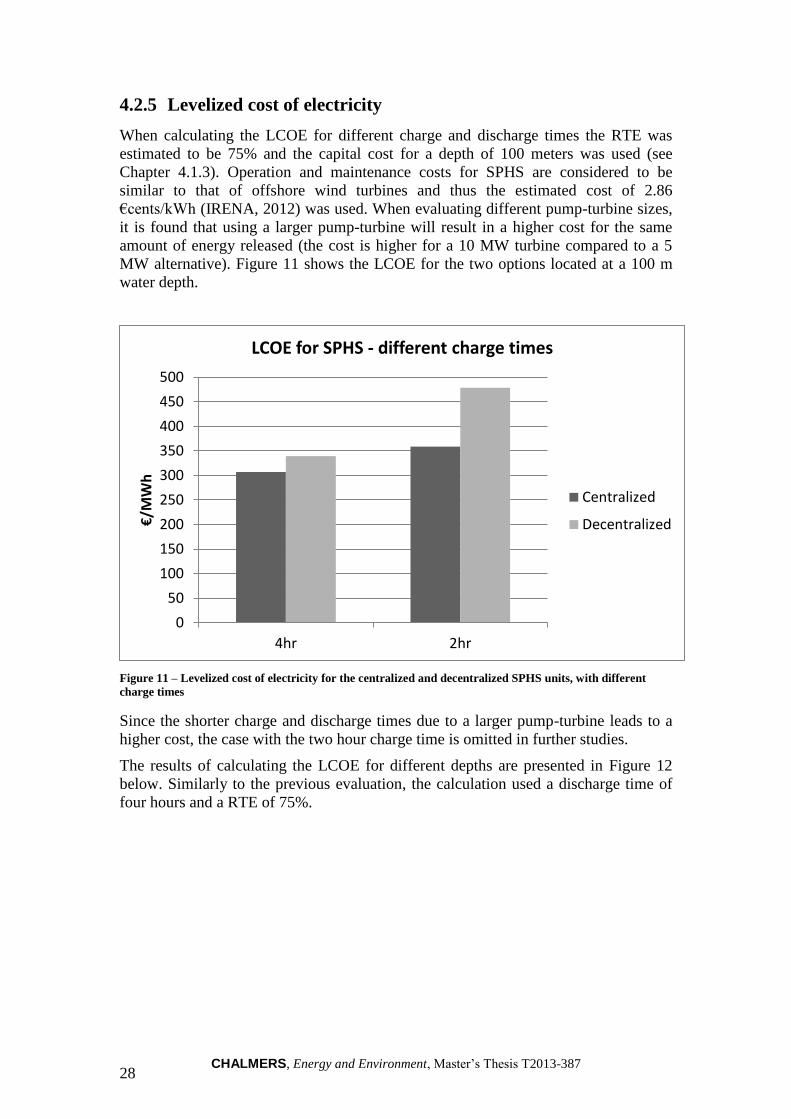
CHALMERS, Energy and Environment, Master’s Thesis T2013-387 28
4.2.5 Levelized cost of electricity
When calculating the LCOE for different charge and discharge times the RTE was
estimated to be 75% and the capital cost for a depth of 100 meters was used (see
Chapter 4.1.3). Operation and maintenance costs for SPHS are considered to be
similar to that of offshore wind turbines and thus the estimated cost of 2.86
€cents/kWh (IRENA, 2012) was used. When evaluating different pump-turbine sizes,
it is found that using a larger pump-turbine will result in a higher cost for the same
amount of energy released (the cost is higher for a 10 MW turbine compared to a 5
MW alternative). Figure 11 shows the LCOE for the two options located at a 100 m
water depth.
Figure 11 – Levelized cost of electricity for the centralized and decentralized SPHS units, with different
charge times
Since the shorter charge and discharge times due to a larger pump-turbine leads to a
higher cost, the case with the two hour charge time is omitted in further studies.
The results of calculating the LCOE for different depths are presented in Figure 12
below. Similarly to the previous evaluation, the calculation used a discharge time of
four hours and a RTE of 75%.
0
50
100
150
200
250
300
350
400
450
500
4hr 2hr
€/M
Wh
LCOE for SPHS - different charge times
Centralized
Decentralized
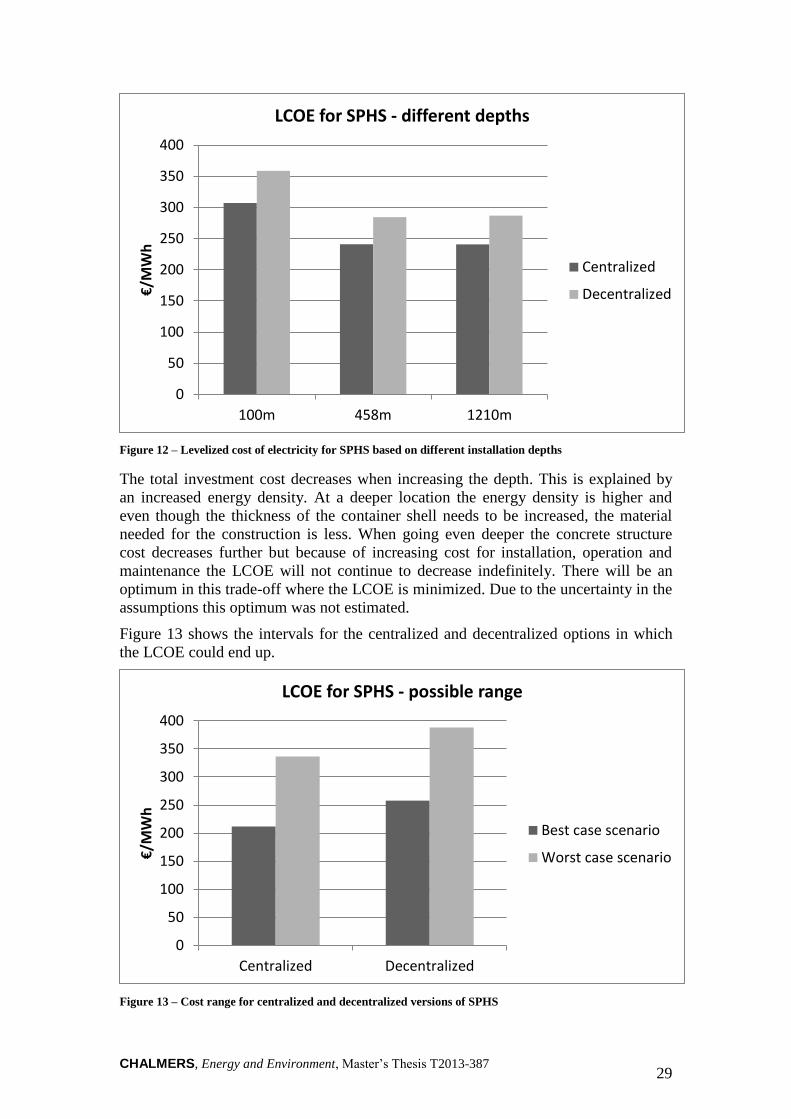
CHALMERS, Energy and Environment, Master’s Thesis T2013-387 29
Figure 12 – Levelized cost of electricity for SPHS based on different installation depths
The total investment cost decreases when increasing the depth. This is explained by
an increased energy density. At a deeper location the energy density is higher and
even though the thickness of the container shell needs to be increased, the material
needed for the construction is less. When going even deeper the concrete structure
cost decreases further but because of increasing cost for installation, operation and
maintenance the LCOE will not continue to decrease indefinitely. There will be an
optimum in this trade-off where the LCOE is minimized. Due to the uncertainty in the
assumptions this optimum was not estimated.
Figure 13 shows the intervals for the centralized and decentralized options in which
the LCOE could end up.
Figure 13 – Cost range for centralized and decentralized versions of SPHS
0
50
100
150
200
250
300
350
400
100m 458m 1210m
€/M
Wh
LCOE for SPHS - different depths
Centralized
Decentralized
0
50
100
150
200
250
300
350
400
Centralized Decentralized
€/M
Wh
LCOE for SPHS - possible range
Best case scenario
Worst case scenario
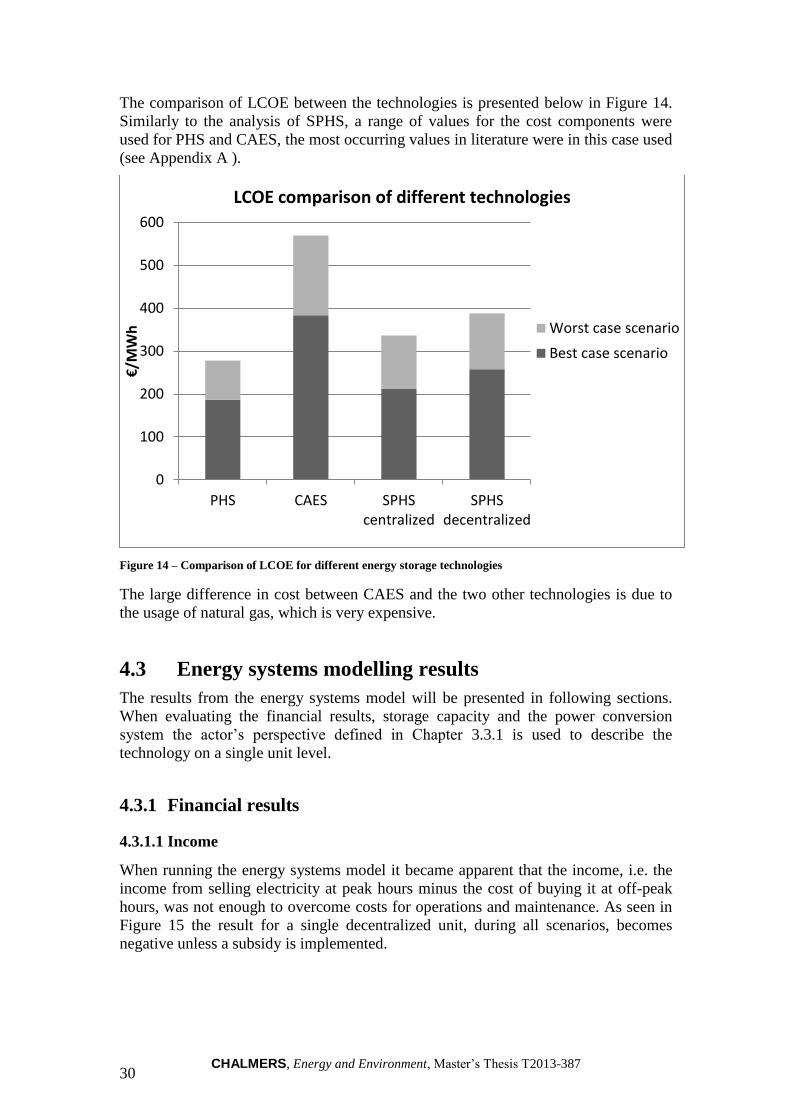
CHALMERS, Energy and Environment, Master’s Thesis T2013-387 30
The comparison of LCOE between the technologies is presented below in Figure 14.
Similarly to the analysis of SPHS, a range of values for the cost components were
used for PHS and CAES, the most occurring values in literature were in this case used
(see Appendix A ).
Figure 14 – Comparison of LCOE for different energy storage technologies
The large difference in cost between CAES and the two other technologies is due to
the usage of natural gas, which is very expensive.
4.3 Energy systems modelling results
The results from the energy systems model will be presented in following sections.
When evaluating the financial results, storage capacity and the power conversion
system the actor’s perspective defined in Chapter 3.3.1 is used to describe the
technology on a single unit level.
4.3.1 Financial results
4.3.1.1 Income
When running the energy systems model it became apparent that the income, i.e. the
income from selling electricity at peak hours minus the cost of buying it at off-peak
hours, was not enough to overcome costs for operations and maintenance. As seen in
Figure 15 the result for a single decentralized unit, during all scenarios, becomes
negative unless a subsidy is implemented.
0
100
200
300
400
500
600
PHS CAES SPHScentralized
SPHSdecentralized
€/M
Wh
LCOE comparison of different technologies
Worst case scenario
Best case scenario
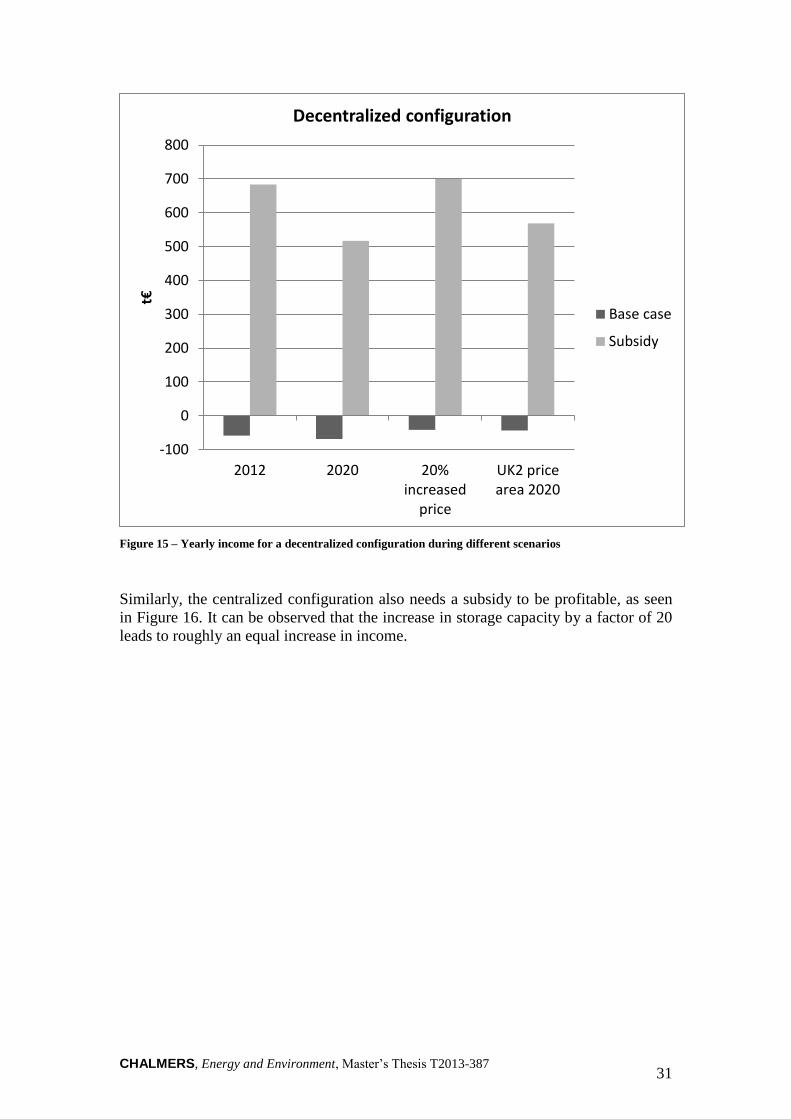
CHALMERS, Energy and Environment, Master’s Thesis T2013-387 31
Figure 15 – Yearly income for a decentralized configuration during different scenarios
Similarly, the centralized configuration also needs a subsidy to be profitable, as seen
in Figure 16. It can be observed that the increase in storage capacity by a factor of 20
leads to roughly an equal increase in income.
-100
0
100
200
300
400
500
600
700
800
2012 2020 20%increased
price
UK2 pricearea 2020
t€
Decentralized configuration
Base case
Subsidy
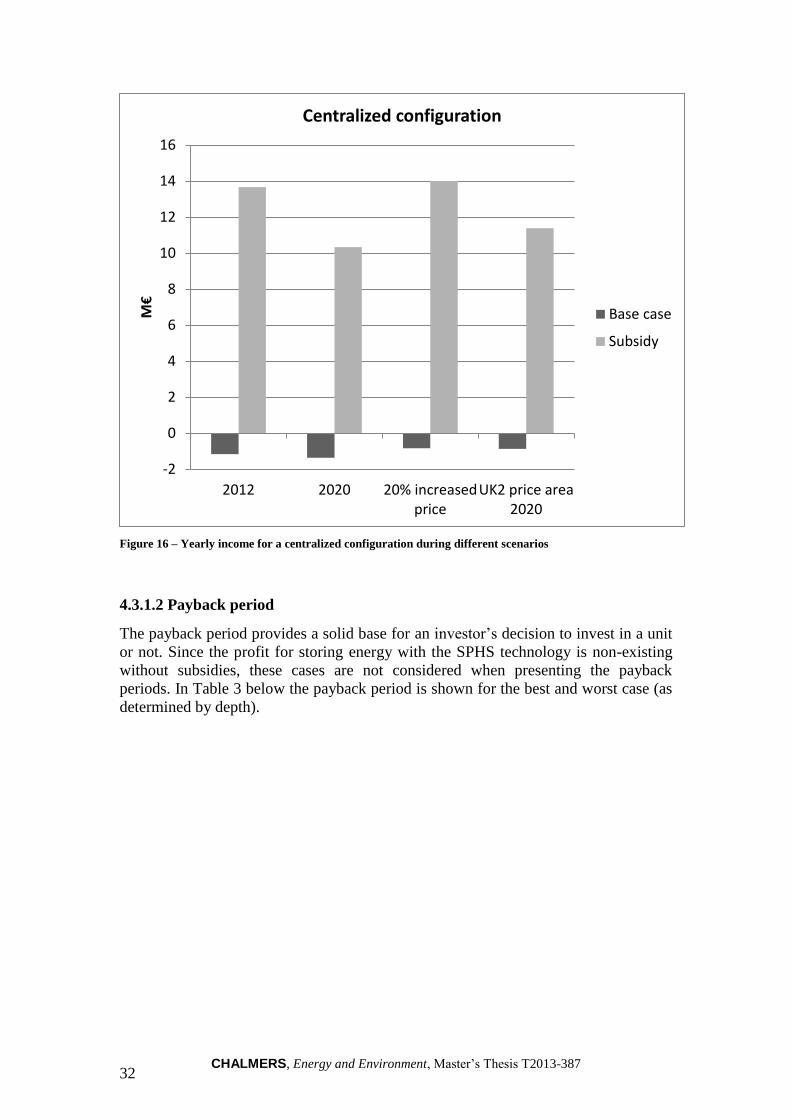
CHALMERS, Energy and Environment, Master’s Thesis T2013-387 32
Figure 16 – Yearly income for a centralized configuration during different scenarios
4.3.1.2 Payback period
The payback period provides a solid base for an investor’s decision to invest in a unit
or not. Since the profit for storing energy with the SPHS technology is non-existing
without subsidies, these cases are not considered when presenting the payback
periods. In Table 3 below the payback period is shown for the best and worst case (as
determined by depth).
-2
0
2
4
6
8
10
12
14
16
2012 2020 20% increasedprice
UK2 price area2020
M€
Centralized configuration
Base case
Subsidy
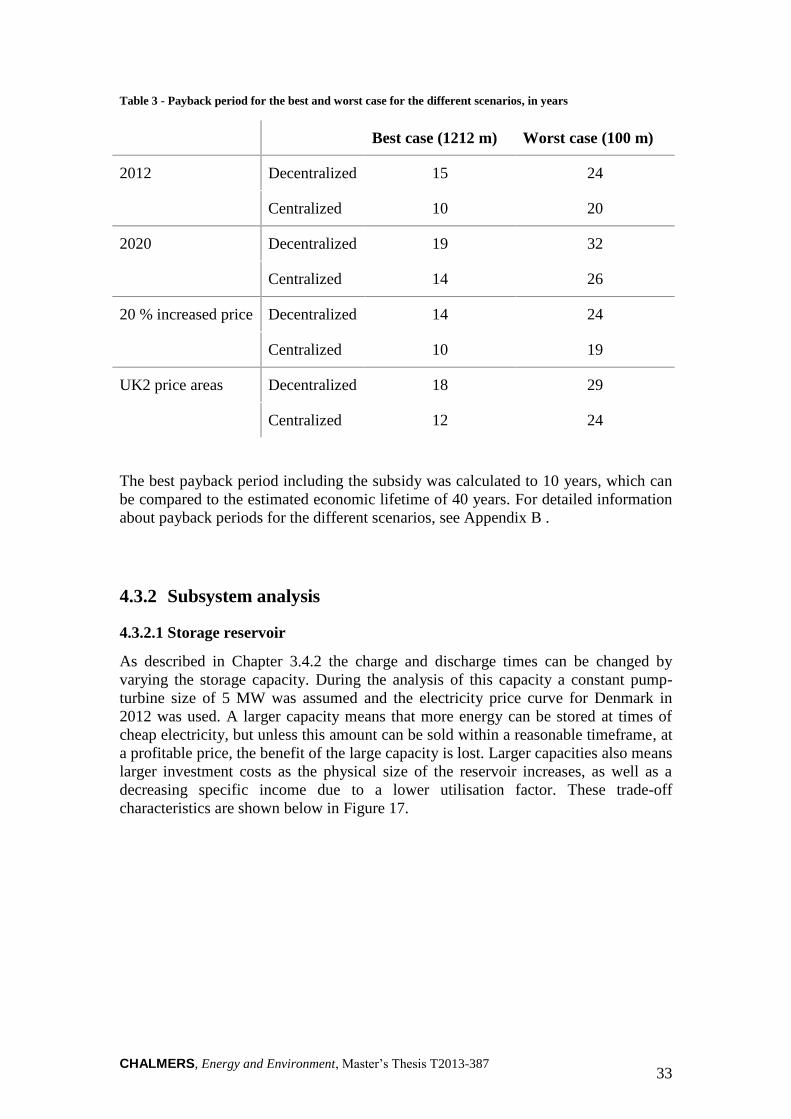
CHALMERS, Energy and Environment, Master’s Thesis T2013-387 33
Table 3 - Payback period for the best and worst case for the different scenarios, in years
Best case (1212 m) Worst case (100 m)
2012 Decentralized 15 24
Centralized 10 20
2020 Decentralized 19 32
Centralized 14 26
20 % increased price Decentralized 14 24
Centralized 10 19
UK2 price areas Decentralized 18 29
Centralized 12 24
The best payback period including the subsidy was calculated to 10 years, which can
be compared to the estimated economic lifetime of 40 years. For detailed information
about payback periods for the different scenarios, see Appendix B .
4.3.2 Subsystem analysis
4.3.2.1 Storage reservoir
As described in Chapter 3.4.2 the charge and discharge times can be changed by
varying the storage capacity. During the analysis of this capacity a constant pump-
turbine size of 5 MW was assumed and the electricity price curve for Denmark in
2012 was used. A larger capacity means that more energy can be stored at times of
cheap electricity, but unless this amount can be sold within a reasonable timeframe, at
a profitable price, the benefit of the large capacity is lost. Larger capacities also means
larger investment costs as the physical size of the reservoir increases, as well as a
decreasing specific income due to a lower utilisation factor. These trade-off
characteristics are shown below in Figure 17.
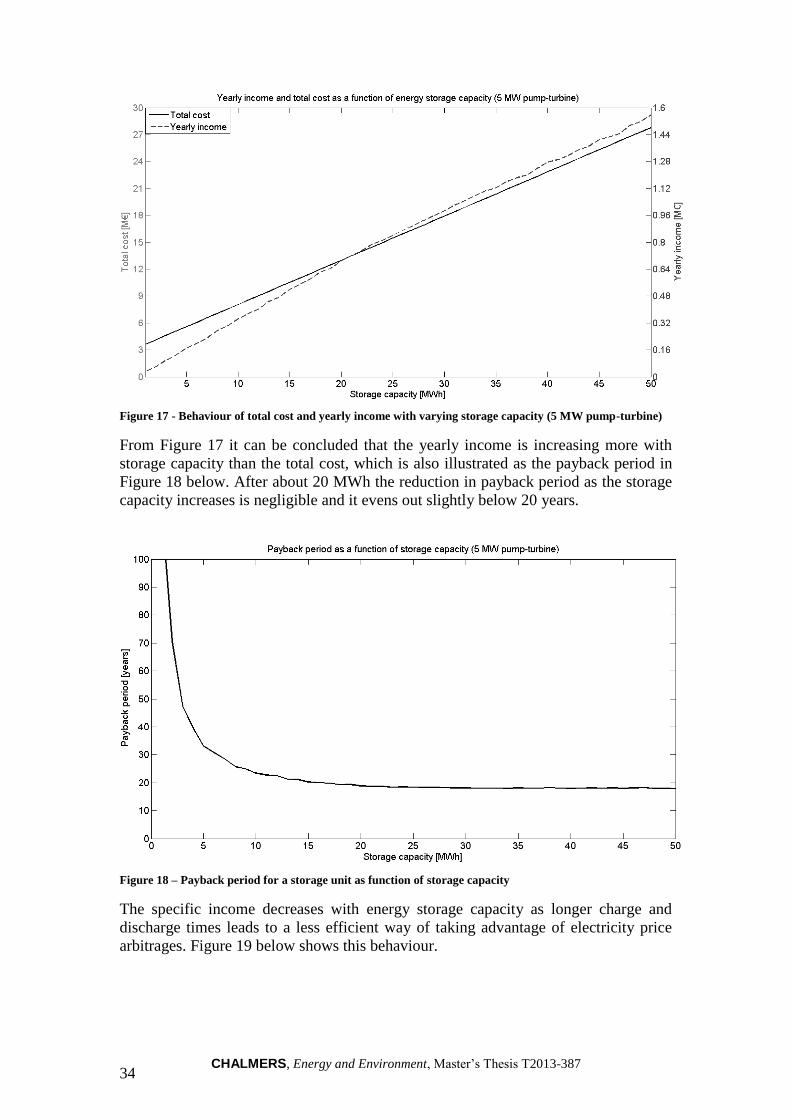
CHALMERS, Energy and Environment, Master’s Thesis T2013-387 34
Figure 17 - Behaviour of total cost and yearly income with varying storage capacity (5 MW pump-turbine)
From Figure 17 it can be concluded that the yearly income is increasing more with
storage capacity than the total cost, which is also illustrated as the payback period in
Figure 18 below. After about 20 MWh the reduction in payback period as the storage
capacity increases is negligible and it evens out slightly below 20 years.
Figure 18 – Payback period for a storage unit as function of storage capacity
The specific income decreases with energy storage capacity as longer charge and
discharge times leads to a less efficient way of taking advantage of electricity price
arbitrages. Figure 19 below shows this behaviour.
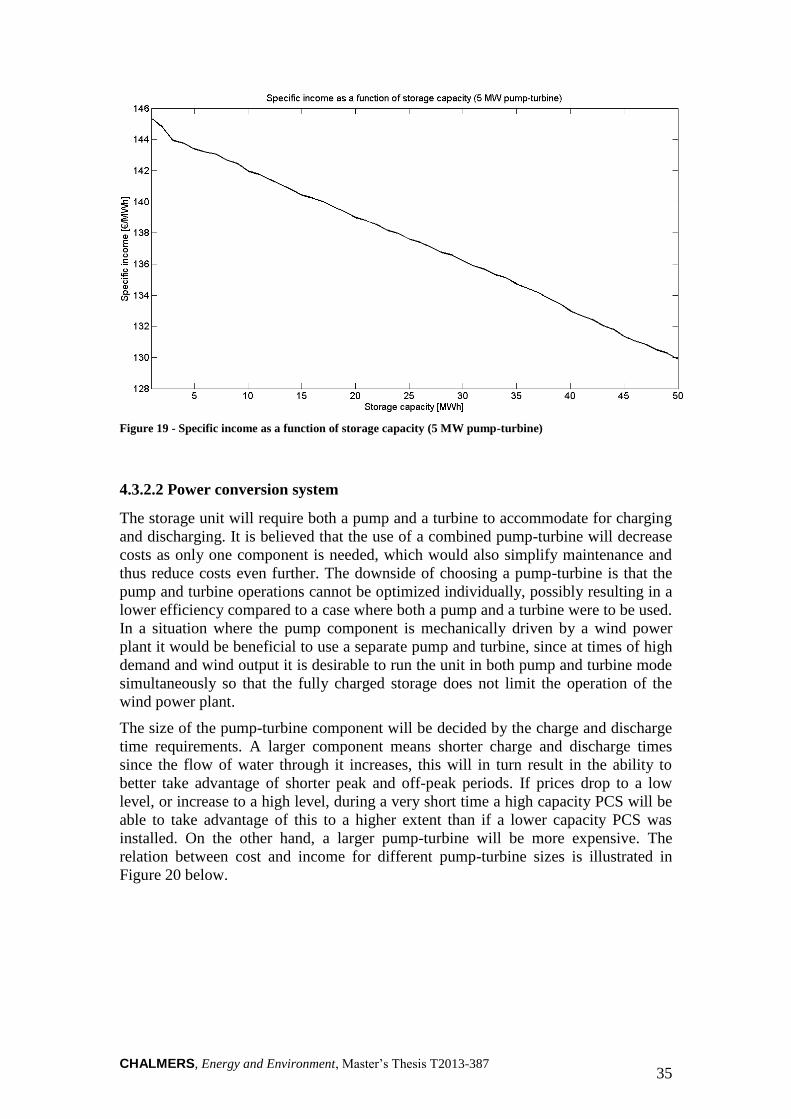
CHALMERS, Energy and Environment, Master’s Thesis T2013-387 35
Figure 19 - Specific income as a function of storage capacity (5 MW pump-turbine)
4.3.2.2 Power conversion system
The storage unit will require both a pump and a turbine to accommodate for charging
and discharging. It is believed that the use of a combined pump-turbine will decrease
costs as only one component is needed, which would also simplify maintenance and
thus reduce costs even further. The downside of choosing a pump-turbine is that the
pump and turbine operations cannot be optimized individually, possibly resulting in a
lower efficiency compared to a case where both a pump and a turbine were to be used.
In a situation where the pump component is mechanically driven by a wind power
plant it would be beneficial to use a separate pump and turbine, since at times of high
demand and wind output it is desirable to run the unit in both pump and turbine mode
simultaneously so that the fully charged storage does not limit the operation of the
wind power plant.
The size of the pump-turbine component will be decided by the charge and discharge
time requirements. A larger component means shorter charge and discharge times
since the flow of water through it increases, this will in turn result in the ability to
better take advantage of shorter peak and off-peak periods. If prices drop to a low
level, or increase to a high level, during a very short time a high capacity PCS will be
able to take advantage of this to a higher extent than if a lower capacity PCS was
installed. On the other hand, a larger pump-turbine will be more expensive. The
relation between cost and income for different pump-turbine sizes is illustrated in
Figure 20 below.
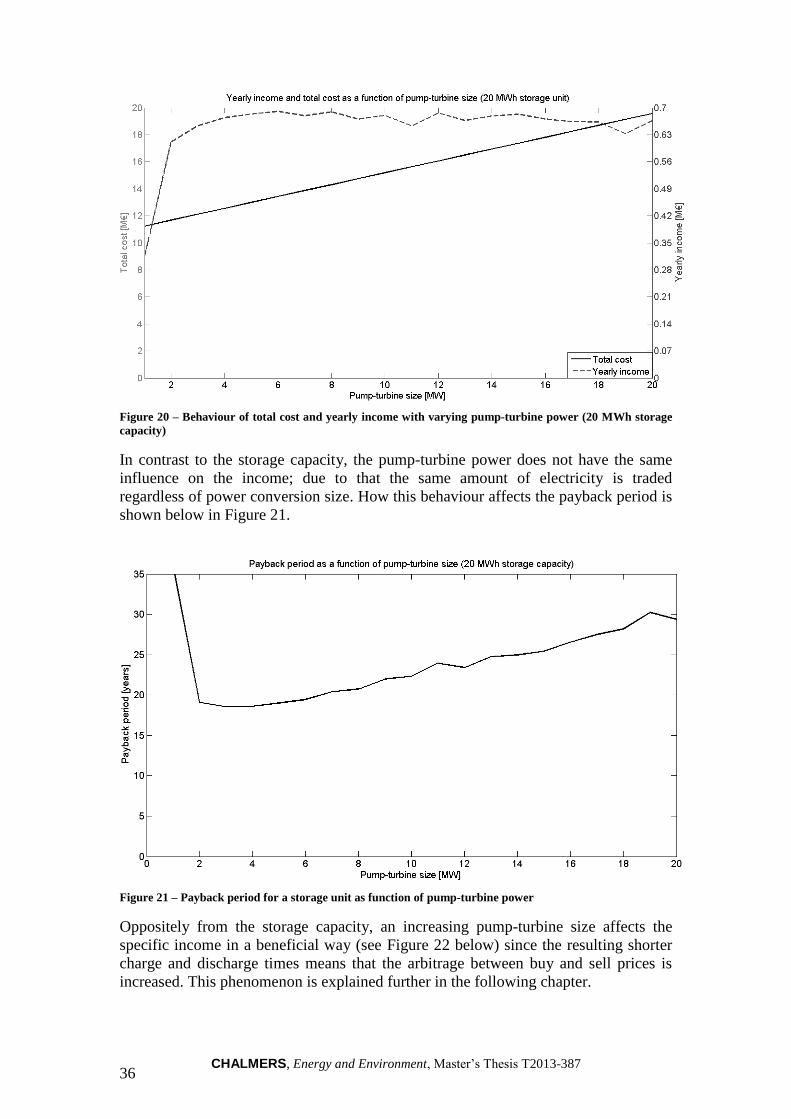
CHALMERS, Energy and Environment, Master’s Thesis T2013-387 36
Figure 20 – Behaviour of total cost and yearly income with varying pump-turbine power (20 MWh storage
capacity)
In contrast to the storage capacity, the pump-turbine power does not have the same
influence on the income; due to that the same amount of electricity is traded
regardless of power conversion size. How this behaviour affects the payback period is
shown below in Figure 21.
Figure 21 – Payback period for a storage unit as function of pump-turbine power
Oppositely from the storage capacity, an increasing pump-turbine size affects the
specific income in a beneficial way (see Figure 22 below) since the resulting shorter
charge and discharge times means that the arbitrage between buy and sell prices is
increased. This phenomenon is explained further in the following chapter.
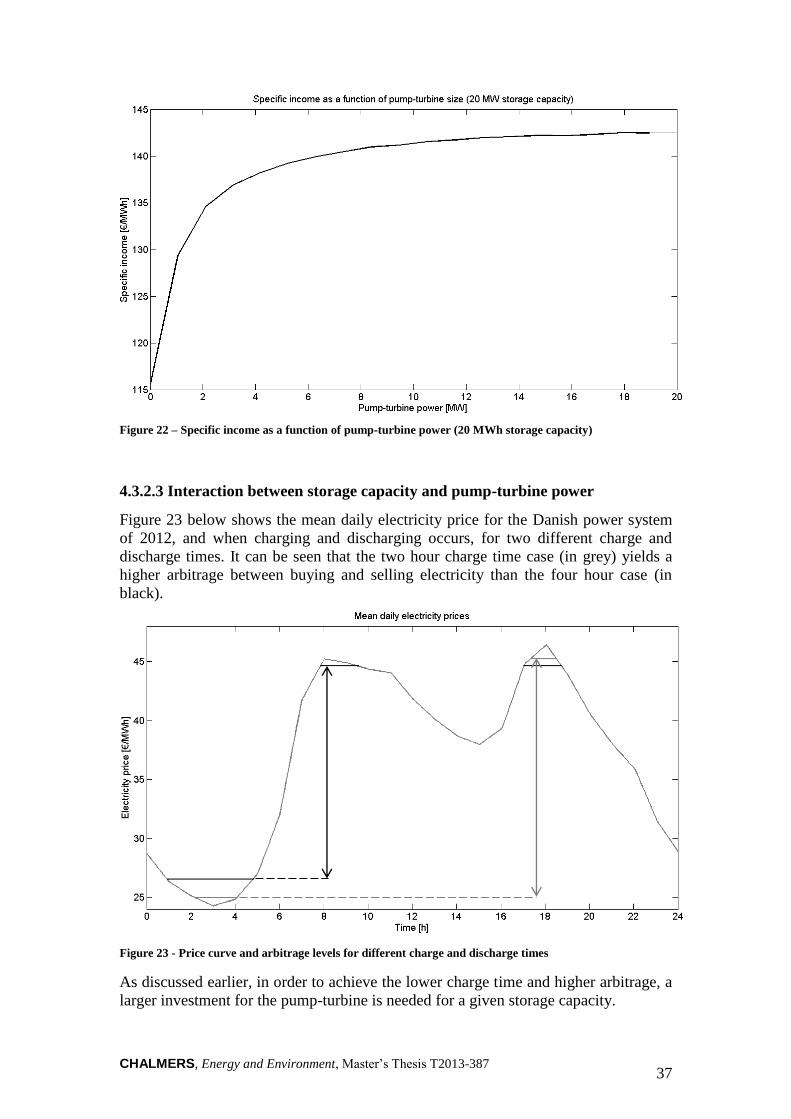
CHALMERS, Energy and Environment, Master’s Thesis T2013-387 37
Figure 22 – Specific income as a function of pump-turbine power (20 MWh storage capacity)
4.3.2.3 Interaction between storage capacity and pump-turbine power
Figure 23 below shows the mean daily electricity price for the Danish power system
of 2012, and when charging and discharging occurs, for two different charge and
discharge times. It can be seen that the two hour charge time case (in grey) yields a
higher arbitrage between buying and selling electricity than the four hour case (in
black).
Figure 23 - Price curve and arbitrage levels for different charge and discharge times
As discussed earlier, in order to achieve the lower charge time and higher arbitrage, a
larger investment for the pump-turbine is needed for a given storage capacity.
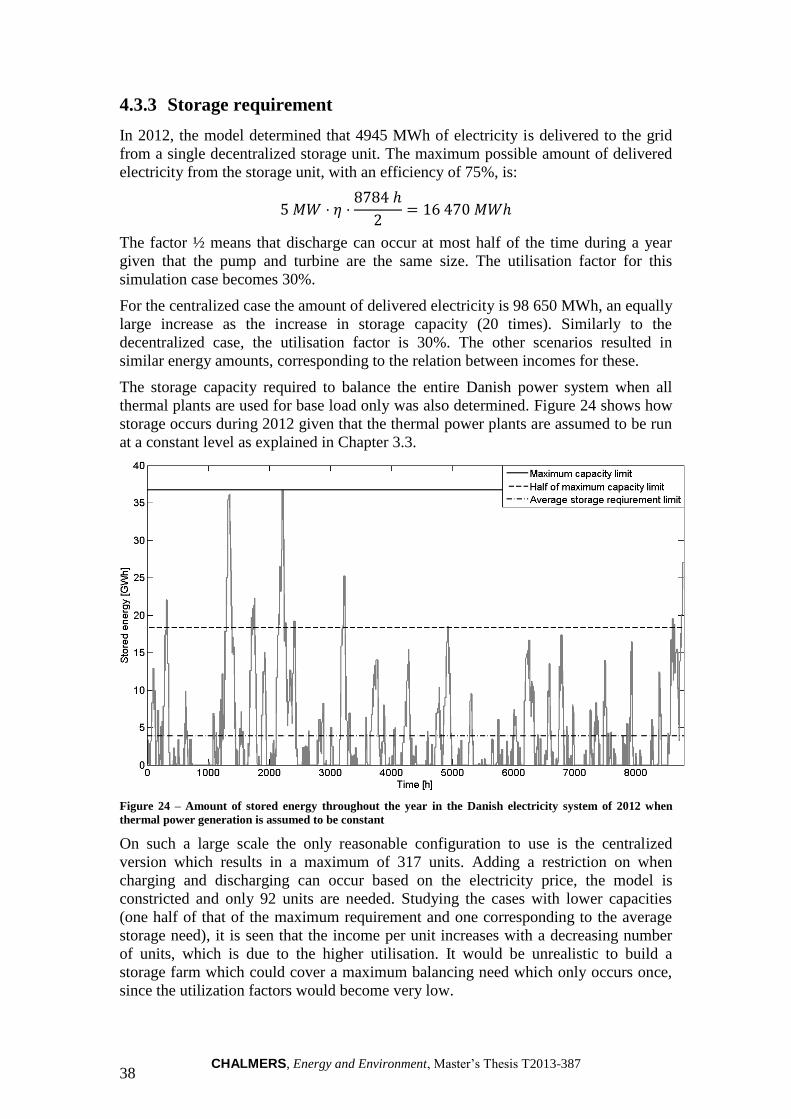
CHALMERS, Energy and Environment, Master’s Thesis T2013-387 38
4.3.3 Storage requirement
In 2012, the model determined that 4945 MWh of electricity is delivered to the grid
from a single decentralized storage unit. The maximum possible amount of delivered
electricity from the storage unit, with an efficiency of 75%, is:
The factor ½ means that discharge can occur at most half of the time during a year
given that the pump and turbine are the same size. The utilisation factor for this
simulation case becomes 30%.
For the centralized case the amount of delivered electricity is 98 650 MWh, an equally
large increase as the increase in storage capacity (20 times). Similarly to the
decentralized case, the utilisation factor is 30%. The other scenarios resulted in
similar energy amounts, corresponding to the relation between incomes for these.
The storage capacity required to balance the entire Danish power system when all
thermal plants are used for base load only was also determined. Figure 24 shows how
storage occurs during 2012 given that the thermal power plants are assumed to be run
at a constant level as explained in Chapter 3.3.
Figure 24 – Amount of stored energy throughout the year in the Danish electricity system of 2012 when
thermal power generation is assumed to be constant
On such a large scale the only reasonable configuration to use is the centralized
version which results in a maximum of 317 units. Adding a restriction on when
charging and discharging can occur based on the electricity price, the model is
constricted and only 92 units are needed. Studying the cases with lower capacities
(one half of that of the maximum requirement and one corresponding to the average
storage need), it is seen that the income per unit increases with a decreasing number
of units, which is due to the higher utilisation. It would be unrealistic to build a
storage farm which could cover a maximum balancing need which only occurs once,
since the utilization factors would become very low.
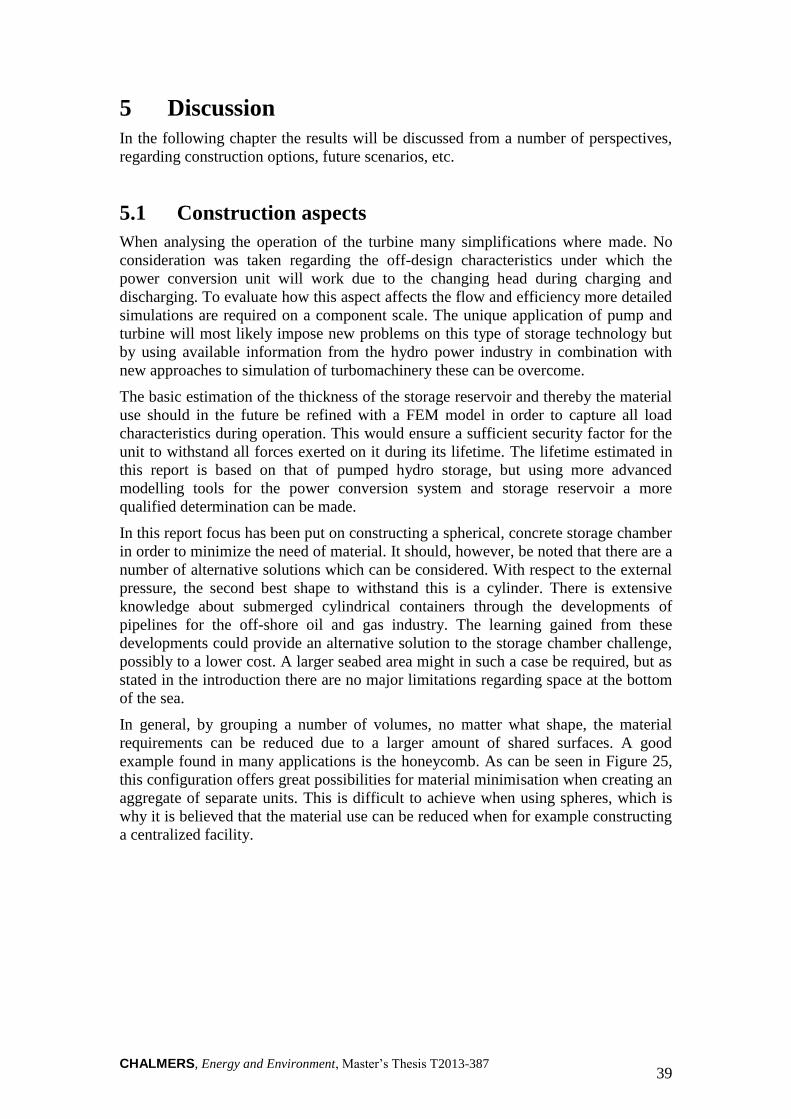
CHALMERS, Energy and Environment, Master’s Thesis T2013-387 39
5 Discussion
In the following chapter the results will be discussed from a number of perspectives,
regarding construction options, future scenarios, etc.
5.1 Construction aspects
When analysing the operation of the turbine many simplifications where made. No
consideration was taken regarding the off-design characteristics under which the
power conversion unit will work due to the changing head during charging and
discharging. To evaluate how this aspect affects the flow and efficiency more detailed
simulations are required on a component scale. The unique application of pump and
turbine will most likely impose new problems on this type of storage technology but
by using available information from the hydro power industry in combination with
new approaches to simulation of turbomachinery these can be overcome.
The basic estimation of the thickness of the storage reservoir and thereby the material
use should in the future be refined with a FEM model in order to capture all load
characteristics during operation. This would ensure a sufficient security factor for the
unit to withstand all forces exerted on it during its lifetime. The lifetime estimated in
this report is based on that of pumped hydro storage, but using more advanced
modelling tools for the power conversion system and storage reservoir a more
qualified determination can be made.
In this report focus has been put on constructing a spherical, concrete storage chamber
in order to minimize the need of material. It should, however, be noted that there are a
number of alternative solutions which can be considered. With respect to the external
pressure, the second best shape to withstand this is a cylinder. There is extensive
knowledge about submerged cylindrical containers through the developments of
pipelines for the off-shore oil and gas industry. The learning gained from these
developments could provide an alternative solution to the storage chamber challenge,
possibly to a lower cost. A larger seabed area might in such a case be required, but as
stated in the introduction there are no major limitations regarding space at the bottom
of the sea.
In general, by grouping a number of volumes, no matter what shape, the material
requirements can be reduced due to a larger amount of shared surfaces. A good
example found in many applications is the honeycomb. As can be seen in Figure 25,
this configuration offers great possibilities for material minimisation when creating an
aggregate of separate units. This is difficult to achieve when using spheres, which is
why it is believed that the material use can be reduced when for example constructing
a centralized facility.
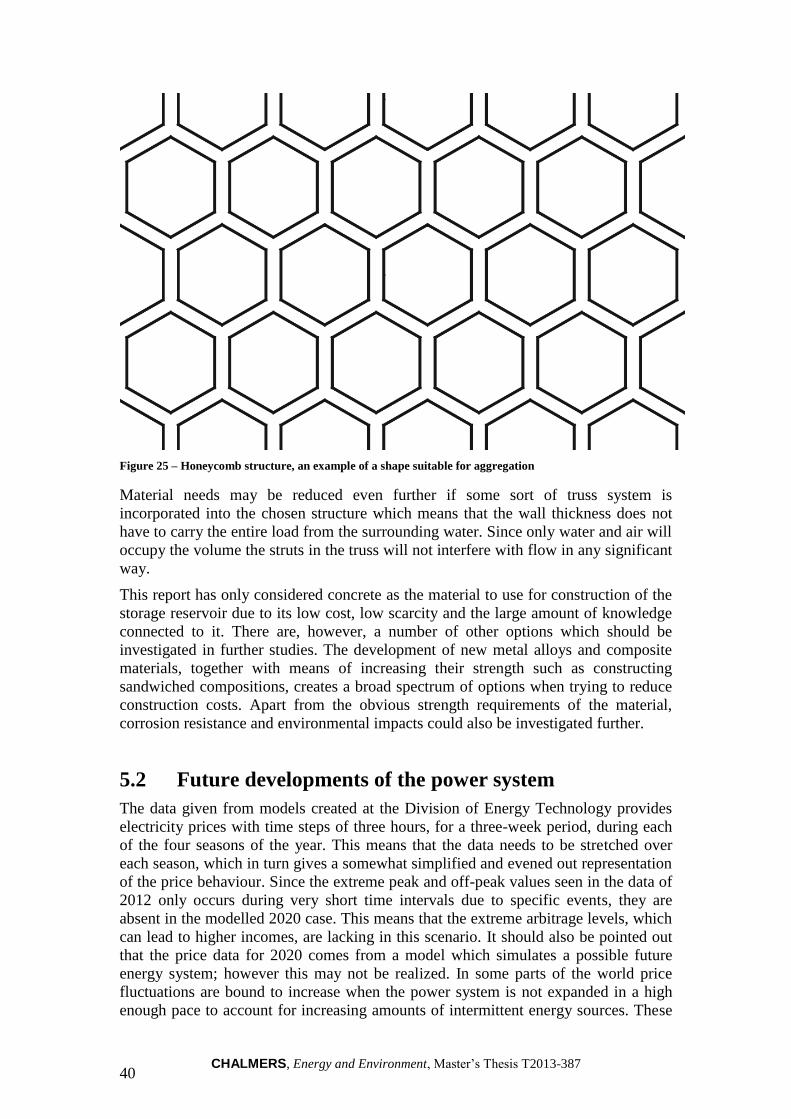
CHALMERS, Energy and Environment, Master’s Thesis T2013-387 40
Figure 25 – Honeycomb structure, an example of a shape suitable for aggregation
Material needs may be reduced even further if some sort of truss system is
incorporated into the chosen structure which means that the wall thickness does not
have to carry the entire load from the surrounding water. Since only water and air will
occupy the volume the struts in the truss will not interfere with flow in any significant
way.
This report has only considered concrete as the material to use for construction of the
storage reservoir due to its low cost, low scarcity and the large amount of knowledge
connected to it. There are, however, a number of other options which should be
investigated in further studies. The development of new metal alloys and composite
materials, together with means of increasing their strength such as constructing
sandwiched compositions, creates a broad spectrum of options when trying to reduce
construction costs. Apart from the obvious strength requirements of the material,
corrosion resistance and environmental impacts could also be investigated further.
5.2 Future developments of the power system
The data given from models created at the Division of Energy Technology provides
electricity prices with time steps of three hours, for a three-week period, during each
of the four seasons of the year. This means that the data needs to be stretched over
each season, which in turn gives a somewhat simplified and evened out representation
of the price behaviour. Since the extreme peak and off-peak values seen in the data of
2012 only occurs during very short time intervals due to specific events, they are
absent in the modelled 2020 case. This means that the extreme arbitrage levels, which
can lead to higher incomes, are lacking in this scenario. It should also be pointed out
that the price data for 2020 comes from a model which simulates a possible future
energy system; however this may not be realized. In some parts of the world price
fluctuations are bound to increase when the power system is not expanded in a high
enough pace to account for increasing amounts of intermittent energy sources. These
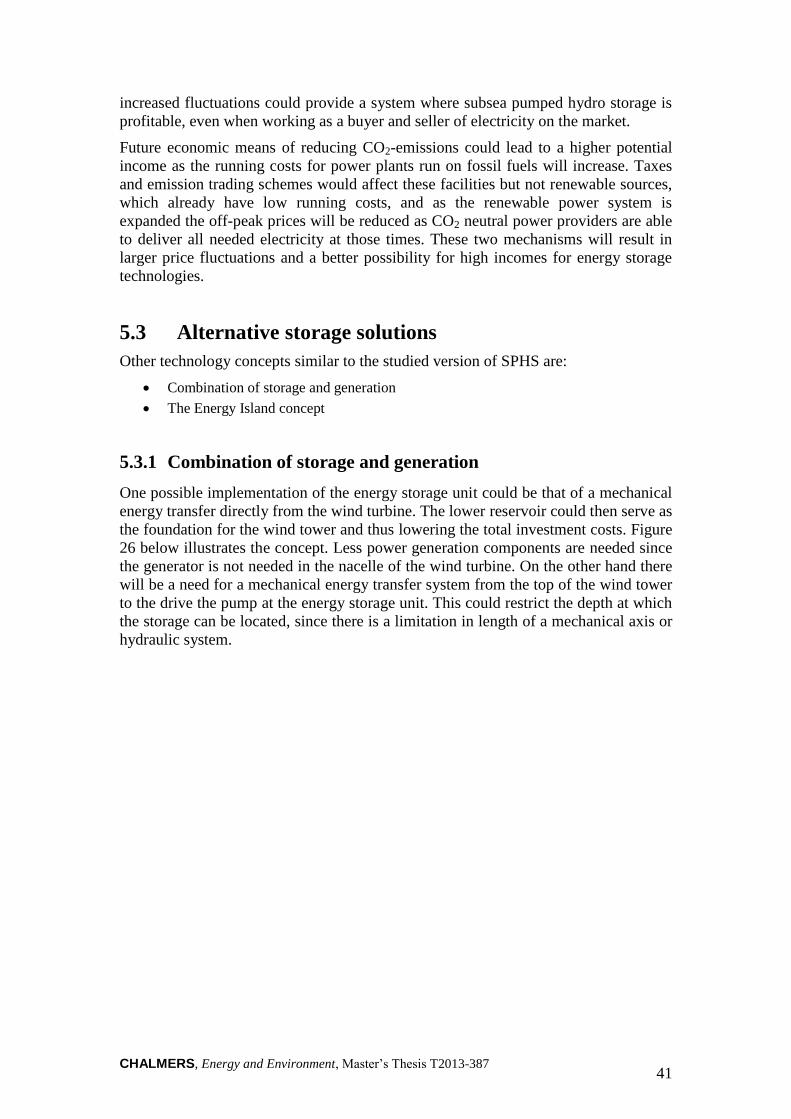
CHALMERS, Energy and Environment, Master’s Thesis T2013-387 41
increased fluctuations could provide a system where subsea pumped hydro storage is
profitable, even when working as a buyer and seller of electricity on the market.
Future economic means of reducing CO2-emissions could lead to a higher potential
income as the running costs for power plants run on fossil fuels will increase. Taxes
and emission trading schemes would affect these facilities but not renewable sources,
which already have low running costs, and as the renewable power system is
expanded the off-peak prices will be reduced as CO2 neutral power providers are able
to deliver all needed electricity at those times. These two mechanisms will result in
larger price fluctuations and a better possibility for high incomes for energy storage
technologies.
5.3 Alternative storage solutions
Other technology concepts similar to the studied version of SPHS are:
Combination of storage and generation
The Energy Island concept
5.3.1 Combination of storage and generation
One possible implementation of the energy storage unit could be that of a mechanical
energy transfer directly from the wind turbine. The lower reservoir could then serve as
the foundation for the wind tower and thus lowering the total investment costs. Figure
26 below illustrates the concept. Less power generation components are needed since
the generator is not needed in the nacelle of the wind turbine. On the other hand there
will be a need for a mechanical energy transfer system from the top of the wind tower
to the drive the pump at the energy storage unit. This could restrict the depth at which
the storage can be located, since there is a limitation in length of a mechanical axis or
hydraulic system.
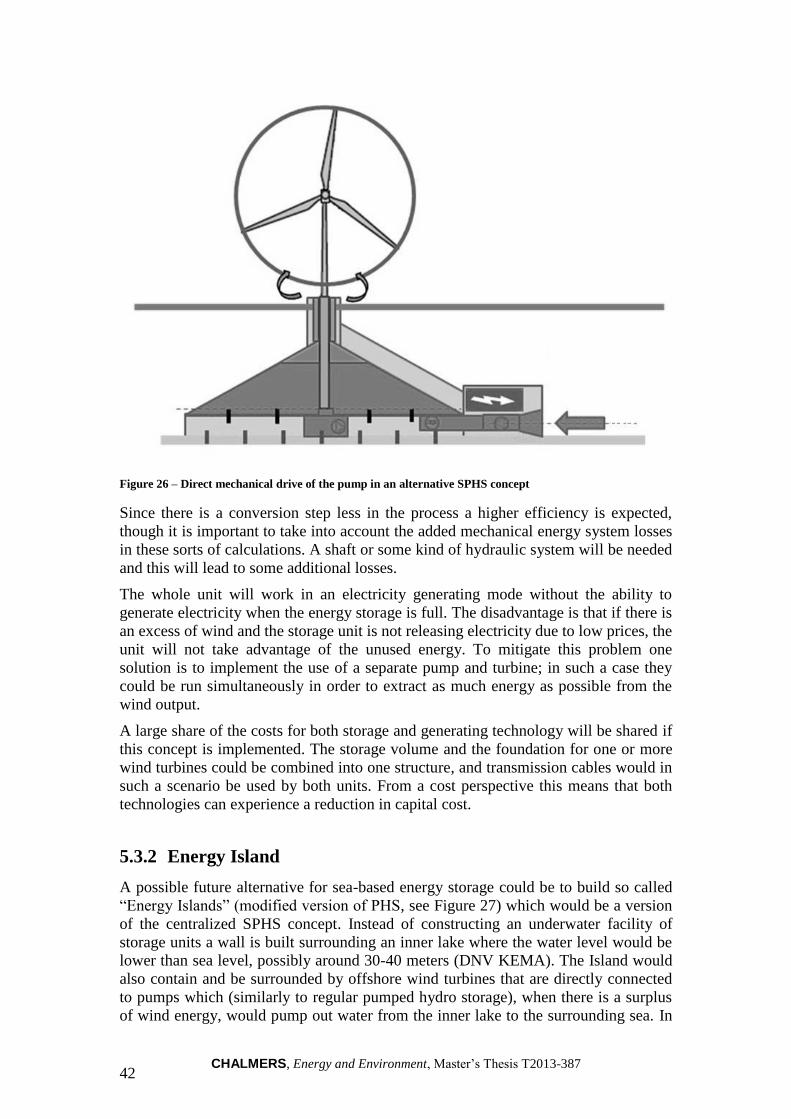
CHALMERS, Energy and Environment, Master’s Thesis T2013-387 42
Figure 26 – Direct mechanical drive of the pump in an alternative SPHS concept
Since there is a conversion step less in the process a higher efficiency is expected,
though it is important to take into account the added mechanical energy system losses
in these sorts of calculations. A shaft or some kind of hydraulic system will be needed
and this will lead to some additional losses.
The whole unit will work in an electricity generating mode without the ability to
generate electricity when the energy storage is full. The disadvantage is that if there is
an excess of wind and the storage unit is not releasing electricity due to low prices, the
unit will not take advantage of the unused energy. To mitigate this problem one
solution is to implement the use of a separate pump and turbine; in such a case they
could be run simultaneously in order to extract as much energy as possible from the
wind output.
A large share of the costs for both storage and generating technology will be shared if
this concept is implemented. The storage volume and the foundation for one or more
wind turbines could be combined into one structure, and transmission cables would in
such a scenario be used by both units. From a cost perspective this means that both
technologies can experience a reduction in capital cost.
5.3.2 Energy Island
A possible future alternative for sea-based energy storage could be to build so called
“Energy Islands” (modified version of PHS, see Figure 27) which would be a version
of the centralized SPHS concept. Instead of constructing an underwater facility of
storage units a wall is built surrounding an inner lake where the water level would be
lower than sea level, possibly around 30-40 meters (DNV KEMA). The Island would
also contain and be surrounded by offshore wind turbines that are directly connected
to pumps which (similarly to regular pumped hydro storage), when there is a surplus
of wind energy, would pump out water from the inner lake to the surrounding sea. In
CHALMERS, Energy and Environment, Master’s Thesis T2013-387 43
generation mode (shortage of wind), the water is allowed to flow back through
turbines and generate electricity.
Figure 27 – Possible design of an Energy Island
This concept has the potential of reaching high energy storage capacities while
reducing the specific material use per unit of stored energy, since the entire storage
volume does not have to be enclosed by an artificial structure on all sides.
The Energy Island could also comprise other resources like algae cultivation and solar
power. The reservoir would be serving as a production basin for the algae, which later
could be converted into high energy biofuels (Gottlieb Paludan).
5.4 Required electricity price arbitrage
Since the income of the SPHS technology is insufficient to reach break-even within
the unit’s lifetime without subsidies, it is interesting to find out at what price arbitrage
the technology will become profitable on its own. A larger difference between the
prices of purchase and sale of electricity during charging and discharging will result in
a higher income. This arbitrage is a result of the electricity system in such a way that a
system with a large amount of fluctuating power output will experience fluctuating
prices to a similar extent. With this information it is possible to identify at which
locations it would be profitable to place an energy storage unit.
5.5 Uncertainty in estimated parameters
Even though an interval for the levelized cost of electricity was used there are large
uncertainties in the input parameters and it is important to note that the actual cost can
be outside this range. The installation and operations and maintenance costs
experience the greatest variations because of the currently untested methods and
technology to which these costs are attached. One important variable which will
influence the cost is the depth, how this affects installation and maintenance is very
uncertain and further studies regarding this is needed. The values used in this work are
very arbitrary and it is believed that they underestimate the costs of subsea
constructions.
CHALMERS, Energy and Environment, Master’s Thesis T2013-387 44
In the comparison between SPHS and regular PHS there is an important aspect
missing from the discussion. A dam used for pumped hydro storage can be charged
naturally, without the need of artificial water flows, by rain or inflows from other
water sources upstream of the dam. This means that the PHS technology is a
combination of a storage and generation unit, resulting in lower costs for storage
compared to other storage technologies and higher costs for generation compared to a
hydro power plant.
CHALMERS, Energy and Environment, Master’s Thesis T2013-387 45
6 Conclusion
The SPHS concept is one possible solution for balancing an increasingly intermittent
power system. The subsystems which make up the technical system are well
developed and fairly simple on a component level, which should lead to an easy
construction process. The main remaining issues to be dealt with are those of
installation and maintenance at the seabed. Underwater operations are always very
costly and if the technology is to be placed below about 50 m due to the higher energy
densities there, divers cannot be used and cost increases even further. From such a
point of view it is advisable to construct an as maintenance-free unit as possible, with
the option of sending crucial parts to the surface if needed.
To minimize capital costs it is advisable to build the facility in a centralized fashion,
using one or a few large power conversion units connected to an aggregate of subsea
reservoirs. This would require a lower investment per installed kW of power due to
cheaper pumps and turbines and the possibility to use the same supporting walls for
several of the reservoir sections. Furthermore, the total operation and maintenance
cost will be lower due to the fact that fewer components are needed.
Compared to similar technologies it was shown that subsea pumped hydro storage has
a lower cost than compressed air energy storage due to that the operation does not
require any fuel. However, regular pumped hydro storage is still a cheaper option for
energy storage due to its maturity and utilization of existing geological formations.
It was shown that operating the energy storage unit as an actor on the electricity
market, buying and selling electricity at spot prices, will not be profitable unless
subsidies are implemented. Due to this finding it is recommended to investigate an
alternative concept, in which an offshore wind turbine is directly connected to the
storage unit. In such a case the wind turbine foundation would also work as the energy
storage’s reservoir, or vice versa, thus reducing costs if the two units are considered as
one instead. Apart from the foundation/storage reservoir, substations for power
quality control and cables for transmission can be shared between the two
technologies and thus reducing capital costs further. Regarding the possibilities for
income; if the pump is directly powered by a wind turbine, expensive electricity does
not have to be bought for this purpose. The potential for high revenue is thereby
increased since the specific cost per unit of electricity only has to be overcome by the
electricity price and not the arbitrage between the price of buying and selling
electricity.
CHALMERS, Energy and Environment, Master’s Thesis T2013-387 46
7 Bibliography
Barnes, F. S., & Levine, J. G. (2011). Large Energy Storage Systems Handbook. Boca
Raton, FL, USA: Taylor & Francis Group.
Bartos, F. J. (2012). Battery Storage Developments. Control Engineering.
Baxter, R. (2007). Energy Storage - A Nontechnical Guide. Tulsa, OK, USA:
PennWell Corporation.
Bresesti, P., Kling, W. L., Hendriks, L. R., & Vailati, R. (2007). HCDV Connection
of Offshore Wind Farms to the Transmission System. IEEE Transactions on
Energy Converiosn Vol. 22.
Cavallo, A. J. (2001). Energy Storage Technologies for Utility Scale Intermittent
Renewable Energy Systems. Journal of Solar Energy Engineering, 387-389.
Cheung, B., Carriveau, R., & Ting, D. S. (2012). Storing Energy Underwater.
Mechanical Engineering, 38-41.
Daleke, O. (2013, March 14). Cost of concrete. (J. Falk, Interviewer)
Danish Ministry of Climate, Energy and Building. (2012). Accelerating Green Energy
Towards 2020. prinfohhk.dk.
dejure.org. (n.d.). Erneuerbare-Energien-Gesetz § 31 (Renewable Energy Sources law
§ 31). Retrieved May 29, 2013, from dejure.org:
http://dejure.org/gesetze/EEG/31.html
Denholm, P., & Kulcinski, G. L. (2003). Life Cycle Energy Requirements and
Greenhouse Gas Emissions from Large Scale Energy Storage Systems. Energy
Conversion and Management, 2153-2172.
Dinçer, İ., & Zamfirescu, C. (2011). Sustainable Energy Systems and Applications.
New York, NY, USA: Springer Science+Business Media.
DNV KEMA. (n.d.). Large-scale Electricity Storage. Retrieved April 2, 2013, from
DNV KEMA: http://www.dnvkema.com/services/etd/es/large-scale-
storage.aspx
Electric Power Research Institute. (2010). Electricity Energy Storage Technology
Options. Palo Alto: Electric Power Research Institute.
Energinet.dk. (n.d.). Five minutes' metering. Retrieved February 19, 2013, from
Energinet.dk: http://energinet.dk/EN/El/Engrosmarked/Udtraek-af-
markedsdata/Sider/Femminutters-maalinger.aspx
Energistyrelsen. (2012). Energistatistik 2011. Copenhagen: Energistyrelsen.
European Commission. (2010). 2009 Environment Policy Review, Part 3. Brussels:
European Commission.
Europe's Energy Portal. (n.d.). Natural Gas Industry. Retrieved June 3, 2013, from
Europe's Energy Portal: http://www.energy.eu
Evans, A., Strezov, V., & Evans, T. J. (2012). Assessment of Utility Energy Storage
Options for Increased Renewable Energy Penetration. Renewable and
Sustainable Energy Reviews, 4141-4147.
CHALMERS, Energy and Environment, Master’s Thesis T2013-387 47
Garg, A., Lay, C., & Füllmann, R. (2012). Stensea - Stored Energy at Sea: The
Feasibility of an Underwater Pumped Hydro Storage System. 7th IRES
Conference .
Ginley, D. S., & Cahen, D. (2012). Fundementals of Materials for Energy and
Environmental Sustainability. Cambridge university press.
Gottlieb Paludan. (n.d.). Green Power Island. Retrieved May 21, 2013, from Gottlieb
Paludan Architects: http://www.gottliebpaludan.com/en/project/green-power-
island
Guerrero-Lemus, R., & Martinez-Duart, J. M. (2012). Renewable Energies and CO2,
2013 Cost Analysis, Environmental Impacts and Technological Trends .
Huggins, R. A. (2010). Energy Storage. Stanford, CA, USA: Springer
Science+Business Media.
Ibrahim, H., Ilinca, A., & Perron, J. (2008). Energy Storage Systems - Characteristics
and Comparisons. Renewable and Sustainable Energy Reviews.
Intergovernmental Panel on Climate Change. (2007). Climate Change 2007 - The
Physical Science Basis. New York: Cambridge University Press.
Intergovernmental Panel on Climate Change. (2008). Climate Change 2007 -
Synthesis Report. Geneva: Intergovernmental Panel on Climate Change.
IRENA. (2012). Electricity Storage - Technology Brief. IEA-ETSAP and IRENA.
IRENA. (2012). Renewable Energy Technologies: Cost Analysis Series - Wind Power.
IRENA.
IRENA. (2013). Renewable Power Generation Costs in 2012: An Overview. Bonn:
IRENA.
Kaiser, M. J., & Snyder, B. F. (2012). Offshore Wind Energy Cost Modeling. London:
Springer-Verlag .
Kaldellis, J. K. (2010). Stand-alone and Hybrid Wind Energy Systems - Technology,
Energy Storage and Applications. Woodhead Publishing Limited.
Mekjavić, I. (2011). Buckling Analysis of Concrete Spherical Shells. Technical
Gazette, 633-639.
Nilsson, H. (2013, March 14). Associate Professor. (J. Almén, & J. Falk,
Interviewers)
Nord Pool Spot. (2013). Europe's leading power markets. Oslo: Nord Pool Spot.
Nord Pool Spot. (n.d.). Data download page. Retrieved February 21, 2013, from Nord
Pool Spot: http://nordpoolspot.com/Market-data1/Downloads/Historical-Data-
Download1/Data-Download-Page/
Odenberger, M. (2013). Research Assistant. (J. Falk, Interviewer)
Pickard, W. F., Hansing, N. J., & Shen, A. Q. (2009). Can large-scale advanced-
adiabatic compressed air energy storage be justified economically in the age of
sustainable energy? Journal of Renewable and Sustainable Energy.
Rasch, C. (2009). Elforbrugsfremskrivning 2009. Energinet.dk.
Rastler, D. (2008). New Demand for Energy Storage. Electric Perspectives, 30-47.
CHALMERS, Energy and Environment, Master’s Thesis T2013-387 48
Rastler, D. (2010). Electricity Energy Storage Technology Options. Palo Alto:
Electric Power Research Institute (EPRI).
Samuelson, Å. (1990). Skalhandboken. Stockholm: Mekanförbundets Förlag.
Sander, B. (2013, April 15). Cost of pump-turbines. (J. Almén, & J. Falk,
Interviewers)
Schoenung, S. M., & Hassenzahl, W. V. (2003). Long- vs. Short-Term Energy Storage
Technologies Analysis - A Life-Cycle Cost Study. Albuquerque: Sandia
National Laboratories.
Sinnott, R. K. (2005). Chemical Engineering Design. Oxford: Elsevier Butterworth-
Heinemann.
Sorensen, B. (2011). Renewable Energy - Physics, Engineering, Environmental
Impacts, Economics & Planning.
Ter-Gazarian, A. (2011). Energy Storage for Power Systems. London: The Institution
of Engineering and Technology.
Wagner, H.-J., & Mathur, J. (2011). Introduction to Hydro Energy Systems - Basics,
Technology and Operation. Springer-Verlag Berlin Heidelberg.
von Meier, A. (2006). Electric Power Systems. Hoboken, New Jersey: John Wiley &
Sons INC.
Åkerlind, L. (2013). Vice president Global Marketing & Sales, Offshore Wind
Connections, ABB AB. (J. Almén, Interviewer)
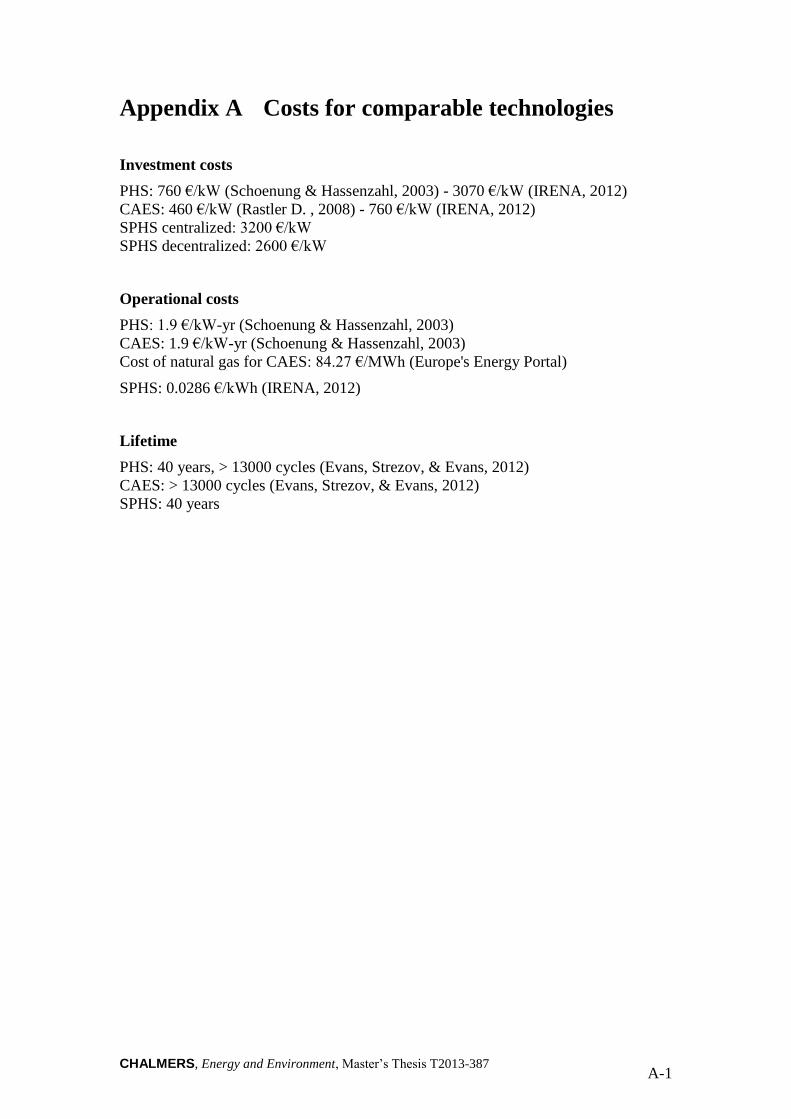
CHALMERS, Energy and Environment, Master’s Thesis T2013-387 A-1
Costs for comparable technologies Appendix A
Investment costs
PHS: 760 €/kW (Schoenung & Hassenzahl, 2003) - 3070 €/kW (IRENA, 2012)
CAES: 460 €/kW (Rastler D. , 2008) - 760 €/kW (IRENA, 2012)
SPHS centralized: 3200 €/kW
SPHS decentralized: 2600 €/kW
Operational costs
PHS: 1.9 €/kW-yr (Schoenung & Hassenzahl, 2003)
CAES: 1.9 €/kW-yr (Schoenung & Hassenzahl, 2003)
Cost of natural gas for CAES: 84.27 €/MWh (Europe's Energy Portal)
SPHS: 0.0286 €/kWh (IRENA, 2012)
Lifetime
PHS: 40 years, > 13000 cycles (Evans, Strezov, & Evans, 2012)
CAES: > 13000 cycles (Evans, Strezov, & Evans, 2012)
SPHS: 40 years

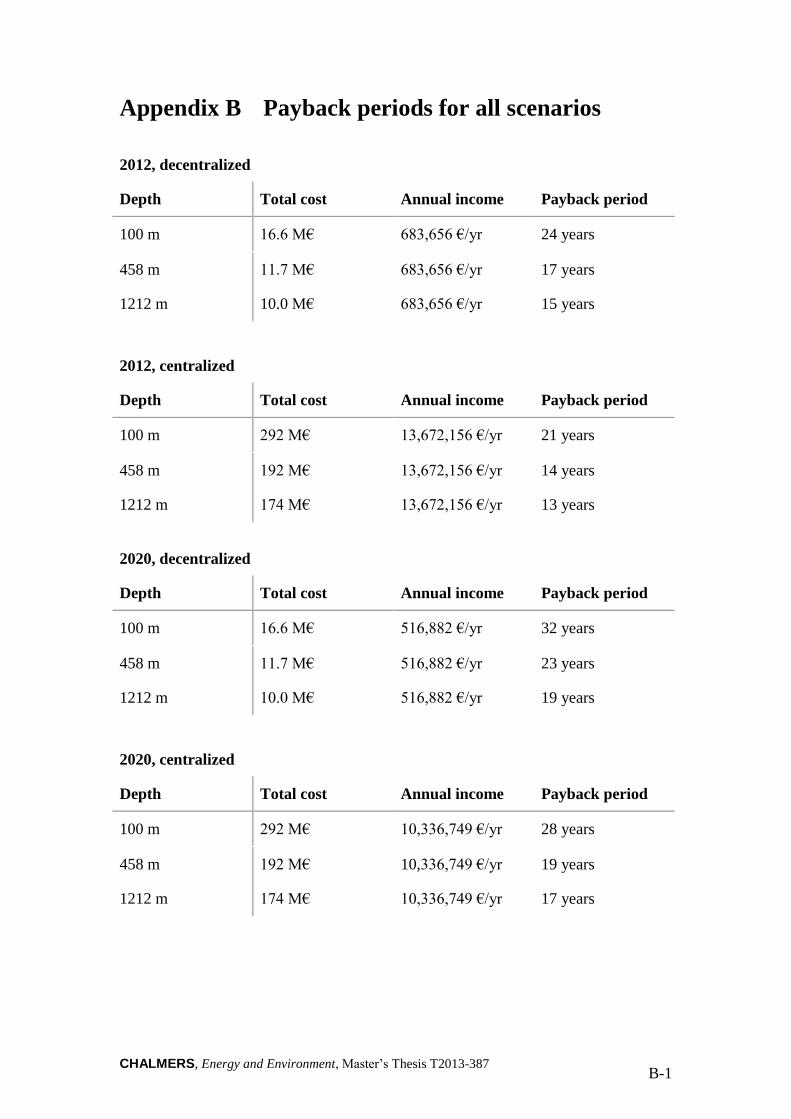
CHALMERS, Energy and Environment, Master’s Thesis T2013-387 B-1
Payback periods for all scenarios Appendix B
2012, decentralized
Depth Total cost Annual income Payback period
100 m 16.6 M€ 683,656 €/yr 24 years
458 m 11.7 M€ 683,656 €/yr 17 years
1212 m 10.0 M€ 683,656 €/yr 15 years
2012, centralized
Depth Total cost Annual income Payback period
100 m 292 M€ 13,672,156 €/yr 21 years
458 m 192 M€ 13,672,156 €/yr 14 years
1212 m 174 M€ 13,672,156 €/yr 13 years
2020, decentralized
Depth Total cost Annual income Payback period
100 m 16.6 M€ 516,882 €/yr 32 years
458 m 11.7 M€ 516,882 €/yr 23 years
1212 m 10.0 M€ 516,882 €/yr 19 years
2020, centralized
Depth Total cost Annual income Payback period
100 m 292 M€ 10,336,749 €/yr 28 years
458 m 192 M€ 10,336,749 €/yr 19 years
1212 m 174 M€ 10,336,749 €/yr 17 years
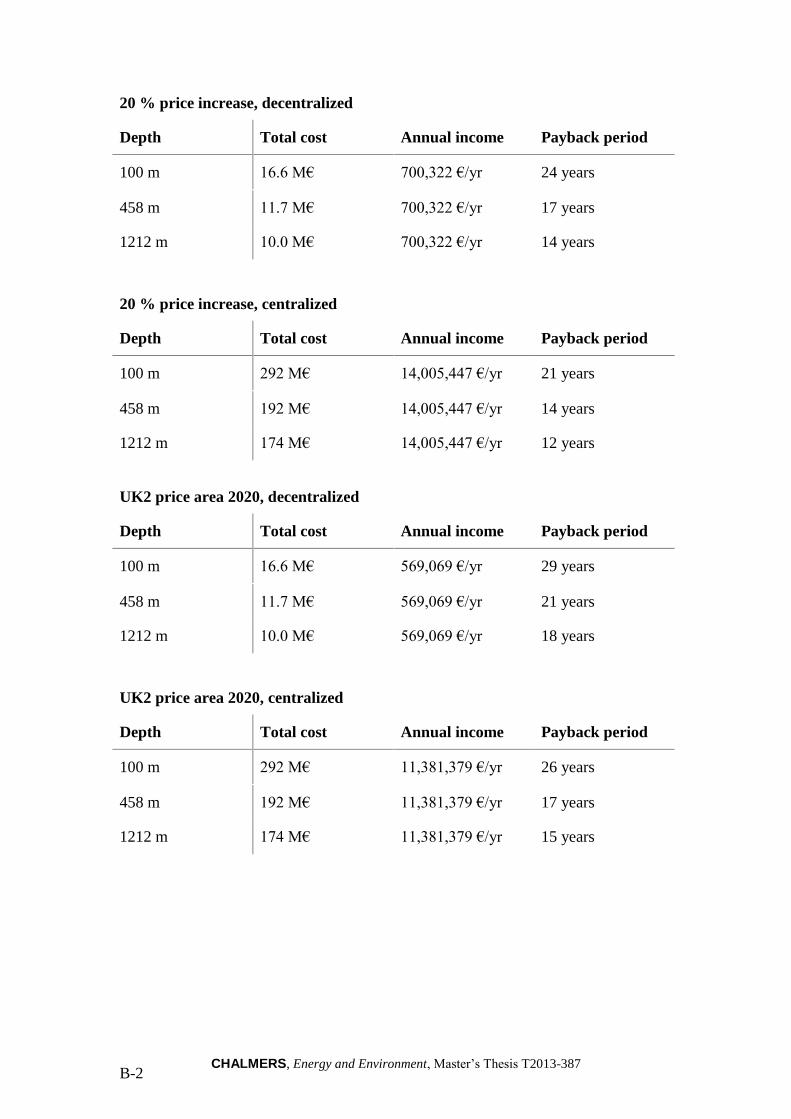
CHALMERS, Energy and Environment, Master’s Thesis T2013-387 B-2
20 % price increase, decentralized
Depth Total cost Annual income Payback period
100 m 16.6 M€ 700,322 €/yr 24 years
458 m 11.7 M€ 700,322 €/yr 17 years
1212 m 10.0 M€ 700,322 €/yr 14 years
20 % price increase, centralized
Depth Total cost Annual income Payback period
100 m 292 M€ 14,005,447 €/yr 21 years
458 m 192 M€ 14,005,447 €/yr 14 years
1212 m 174 M€ 14,005,447 €/yr 12 years
UK2 price area 2020, decentralized
Depth Total cost Annual income Payback period
100 m 16.6 M€ 569,069 €/yr 29 years
458 m 11.7 M€ 569,069 €/yr 21 years
1212 m 10.0 M€ 569,069 €/yr 18 years
UK2 price area 2020, centralized
Depth Total cost Annual income Payback period
100 m 292 M€ 11,381,379 €/yr 26 years
458 m 192 M€ 11,381,379 €/yr 17 years
1212 m 174 M€ 11,381,379 €/yr 15 years