Embed Size (px)
Citation preview
Studying Methane Emission in the North
of Western SiberiaA. I. Reshetnikov
a, A. V. Zinchenko
a, S. V. Yagovkina
a, I. L. Karol
a,
V. E. Lagunb, and N. N. Paramonova
a
aVoeikov Main Geophysical Observatory, ul. Karbysheva 7, St. Petersburg, 194021 RussiabArctic and Antarctic Research Institute, ul. Beringa 38, St. Petersburg, 199397 Russia
Received March 20, 2008
Abstract—Methane emitted into the atmosphere from sources located in the Urengoi natural gas fieldis estimated from direct methane concentration measurements in the atmospheric boundary layer andmodeling. The results of direct profile measurements in the summer-fall season of 2003 are generalizedversus the data from the previous field studies and background monitoring of greenhouse gases in thenorthern polar region. The use of models for calculating the intensity of emission from sources locatedin the field area together with a set of methane concentration measurements at three altitudes allowedthe authors to develop a method of verification of emission from a specific source, a deposit. Themethod estimates the emission both from part of the field area and from the whole field with an irregulardistribution of the intensity of sources across the deposit area.
DOI: 10.3103/S1068373909030054
1. INTRODUCTION
In spite of a significant interest paid to studying greenhouse gas balance in the atmosphere, the estimatesof the main sources of one of the most important greenhouse gases, methane, are rather uncertain [3, 16]. Inaccordance with [12, 14], the contribution of methane releases from oil and gas production and transporta-tion is estimated at ~40–70 billion m3 per year, or about 10–20% of the global anthropogenic methane emis-sion. Russia is the world’s largest producer and exporter of natural gas (NG). The major regions of gas pro-duction (above 85% of the total volume) are in the north of Western Siberia. A modern expert approach toestimating the anthropogenic methane emission into the atmosphere in the areas of natural gas production[8, 13] should be supplemented with new independent estimates based on measurements of the atmosphericmethane concentration. The earlier derived estimates of the regional anthropogenic emission based on athree-dimensional tropospheric pollution transport model are preliminary [11, 17]: they estimated the con-tribution of the region on the whole rather than the contribution of specific anthropogenic sources. Mecha-nisms of methane emissions from gas production were studied in [5]. The contribution of natural sources,mainly, wetlands that make up the greater part of the region, was estimated for the entire region and forboggy landscapes [5, 15, 17, 19].
The purpose of this work is to study the possibilities of estimating methane emissions from large-scaleanthropogenic sources, NG fields, based on measurements of methane concentrations in the atmosphericboundary layer (ABL) and numerical modeling of its dispersion in the atmosphere.
2. TECHNIQUE AND MEANS OF MEASUREMENTS
The major subject of investigations was one of the largest gas deposits in the region, the Urengoi field.At the moment the observations were organized, only expert estimates of methane emissions from naturalgas production enterprises were available [6, 7]. In this work, an attempt is made to estimate methaneemission in a separate field based on the experimental results. Solution of the inverse problem makes itpossible to determine the source intensity from measurements of methane concentration in air samples,which were analyzed with a gas-chromatograph supplied with reference gas mixtures to relate methaneconcentration measurements to the international scale.
The Urengoi field was chosen as a subject for studies because, first, its natural gas production volumebefore 2003 was the largest in Russia (in 2003, the Urengoi field production amounted to ~150 billion m3/year)
ISSN 1068-3739, Russian Meteorology and Hydrology, 2009, Vol. 34, No. 3, pp. 171–179. � Allerton Press, Inc., 2009.
Original Russian Text � A.I. Reshetnikov, A.V. Zinchenko, S.V. Yagovkina, I.L. Karol, V.E. Lagun, N.N. Paramonova, 2009, published in Meteorologiya i
Gidrologiya, 2009, No. 3, pp. 52–64.
171
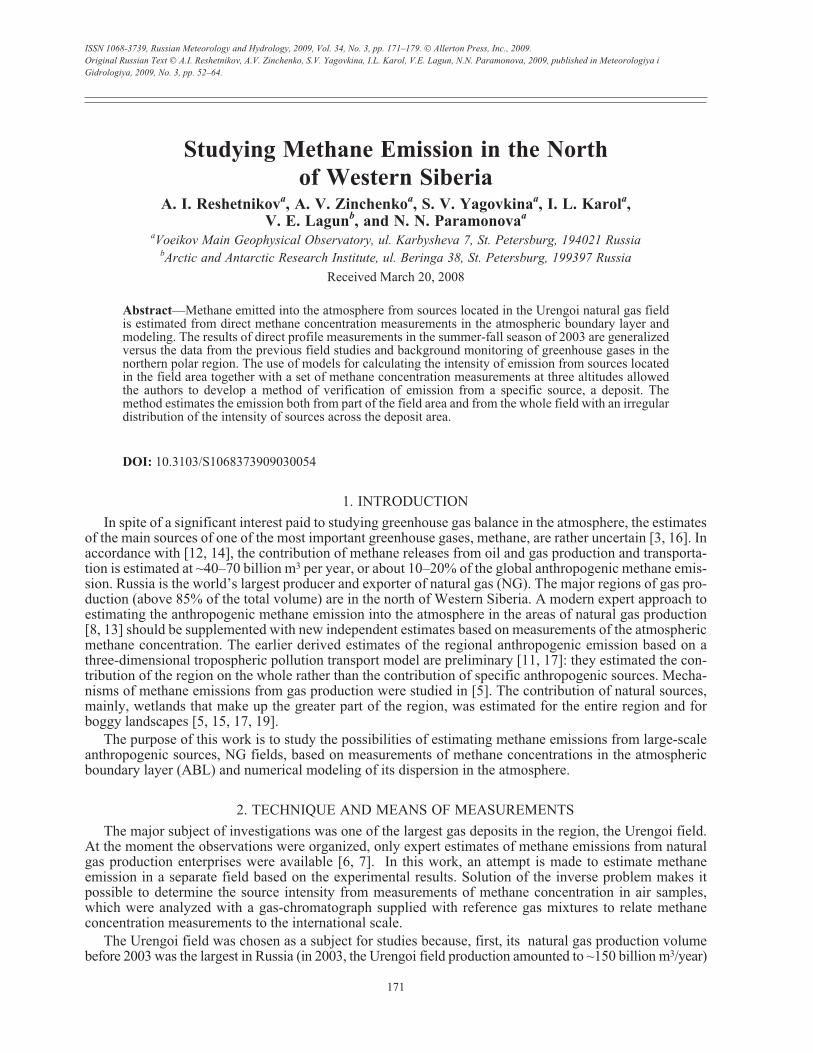
[4], and, second, the contribution of the Yamsovey and Yubiley fields (the gas production of those fields inthe period of observations amounted to ~20 billion m3/year) to the observed methane concentration,because of their large remoteness (~120 and ~180 km, respectively) and a comparatively small productionvolume, was significantly lower than the contribution of the Urengoi field. The contribution from theYamburg field could affect the observational results (the distance to it was 220–240 km, and the productionvolume in 2003 was 154 billion m3/year), but methane concentration measurements were performed alongthe air-mass (AM) transport trajectories in the sector from 250� to 300� with respect to the observationalpoint. The Yamburg field was in the sector of angles 320�–350�, and the other relatively large field,Zapolyarnoe, was in the sector of angles 20�–50� (the distance from the observational point was ~80–90 km).Therefore, they did not take part in the formation of the methane concentration field.
Figure 1 shows a map of the study area with the two largest oil and gascondensate fields (OGCFs):Urengoi and Yamburg. In 2003, the regional enterprises of OAO Gazprom produced 537 billion m3 of NG,of which 98% was methane [4]. Compared with the previous observations of 1999–2000 [9], there occurredchanges in the volumes of NG production. The production decreased by 35% in the Urengoi OGCF and by14% in the Yamburg field, while production in the Zapolyarnoe field, which was out of operation in 1999,reached 67 billion m3/year in 2003. The gas production also increased in several fields south of the Urengoifield (Yamsovey, Yubiley) [4]. More than 1000 wells were exploited in the Urengoi field stretched for 180 kmfrom south to north; the debit of each well ranged from 200 to 1000 thousand m3 of NG per day [7]. Theobservational point was selected at a distance of ~40 km from its eastern borderline (see Fig. 1) at a 60-mtower of a nonfunctioning well of ultra-deep construction.
The regional methane background formed from continuous emissions connected with organized andnon-organized permanent leakage as well as from salvo emissions connected with the technologies of gasproduction and its preparation for transportation; in the summertime, there are also natural sources. Perma-nent sources of NG emission were leaks from the poorly cemented space behind the well casing, leaks fromvalves, cranes, and dump fittings of the pipeline, and equipment defects. Certain volumes of methane wereemitted into the atmosphere from the combustion of its treatment products and when oil and gas plumeswere quenched in strong wind. Nonpermanent sources of methane emission into the atmosphere are wells,which permanently reduce their productivity, and in order to partly restore their production, natural gas isblown through the wells and part of it is released into the atmosphere. The procedure is performed whennew wells are put into operation and after major overhaul. The gas is emitted when it is removed from thepipeline during repairs, preventive measures, and in accidents [2, 8]. Several frequent short-term emissionsresult from the technology of operation of compressor stations and systems preparing gas for transportation[7].
RUSSIAN METEOROLOGY AND HYDROLOGY Vol. 34 No. 3 2009
172 RESHETNIKOV et al.
Fig. 1. The map of the region with natural gas production fields (only the two largest OGCFs are shown: the Urengoi and
Yamburg fields) and observational points located 3 km northwest of the settlement of Korotchaevo and at Novyi Port.
An experimental study of methane emission from August 30 to September 13, 2003, differed from thatin 1999–2000 [9]: the measurements were carried out at the mast at several levels: 20, 30, and 60 m abovethe ground surface, 3 km northwest of the settlement of Korotchaevo (the coordinates of the observationalpoint are 65�5 �8 N, 78�0 �7 E). With a change in the wind direction from 250� to 270� and from 270� to300�, the distance which air masses passed between the central axis of the Urengoi field and the measure-ment point varied from 80 to 60 and from 60 to 140 km, respectively. About 100 air samples were collectedand analyzed during the observation period. Almost half of the air samples corresponded to the sector ofdirections of air-mass transport trajectories crossing the Urengoi field. Vacuum-collectors were used as airsamplers. They were filled with air through the buffer capacity. The sample was pumped into the buffer for10 min. An automated unit based on the national chromatograph TsVET-500M was used to analyze thesamples. The chromatograms were processed with a Multichrom digital programmer connected with apersonal computer [10]. The observational data were analyzed with the help of the operational synopticinformation received from a weather station at the Urengoi airport (10 km east of the observational point),data from the European Center for Medium-Range Weather Forecasts (ECMWF), and results of calculationswith the NOAA HYSPLIT model accessible on the Internet in the interactive regime (www.arl.noaa.gov/ready/hysplite.html). The parameters of the atmospheric boundary layer (ABL), in particular, the height ofits upper boundary, air-mass transport trajectories, methane concentration at different distances from itssource were calculated with the help of that model. The technique of the methane emission determinationwas based on the solution of an inverse problem: from methane concentration changes at different heights(20, 30, and 60 m) in the air mass that had passed over large-scale sources, it was necessary to estimate theintensity of methane emissions from those sources.
3. OBSERVATIONS OF METHANE CONCENTRATION
One part of measurements was carried out in the daytime under conditions of intense vertical mixing ofthe atmosphere; the other part was carried out at night, when pollutants accumulated in the boundary layerwith stable atmospheric stratification. The results of observations at 60 m under conditions of intense mix-ing with a wind speed above 3 m/s were used to determine the regional methane background. In lateAugust–early September, a significant (compared with the daytime values under conditions of more intenseturbulent mixing) increase in the methane concentration was observed in a nocturnal temperature inversion.Generally, in the evening and at night, five air samples were taken at each of three altitudes: at 18:00(19:00), 22:00 of the current day, and at 3:00 and 6:00 LT of the next day. The fist sample was taken in thedaytime in a well-mixed atmospheric boundary layer. The results of methane concentration measurements aregiven in the table. The measured methane concentrations are given on the WMO-NOAA/CMDL-83 scale.Calculated and measured wind characteristics are given in the table as supplements. Model wind speed val-ues are derived with a three-dimensional regional model of tropospheric pollution transport [11] from theECMWF reanalysis data. During the observational cycle, at the tower (with a temporal weather station in-
RUSSIAN METEOROLOGY AND HYDROLOGY Vol. 34 No. 3 2009
STUDYING METHANE EMISSION IN THE NORTH OF WESTERN SIBERIA 173
Results of measurements of methane concentration in the surface atmospheric layer and measured and calculatedwind parameters for the period from August 30 to September 1, 2003
Local time
Methane concentration at altitudes, ppbModel values of the wind
speed at 30 m
Measured wind speed atthe Urengoi weather
station
20 m 30 m 60 mdirection,
degreemodule,
m/sdirection,
degreemodule,
m/s
18:0022:000:003:006:00
19:0022:000:003:006:00
–1967200821102377
–2059237732212744
–1992200820802397
–2034237530672697
1910196719672054233819712003216926392320
213217220250273299296295286271
4.73.83.12.82.74.33.83.42.82.3
220180210230270–––––
4211120000
stalled nearby), the direction of air-mass transport changed from 210� to 270� on the night from August 30to 31. The difference from wind observations at the weather station at Urengoi airport (10 km east of thewell of super-deep construction) was, as a rule, within ±30�.
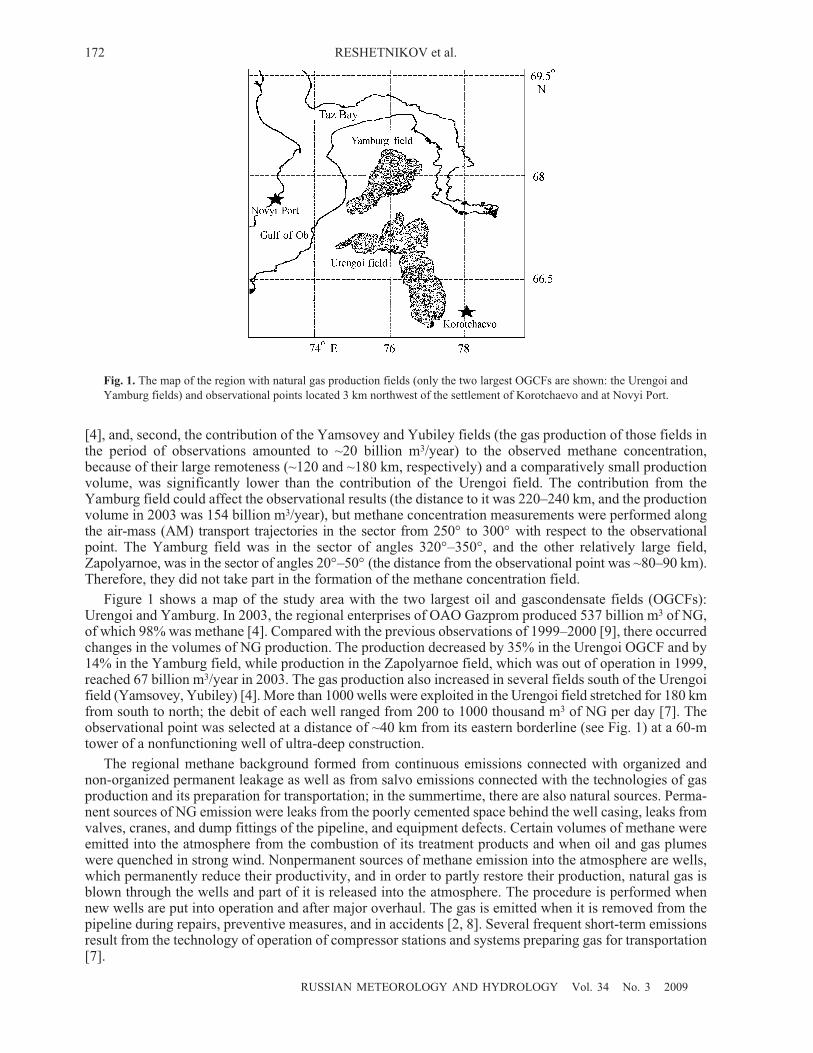
Figure 2 shows the observations of two periods of a nighttime increase in the methane concentration andresults of calculations that were performed to interpret the causes of that phenomenon. As follows from Fig. 2,the vertical gradients of the methane concentration and the character of their temporal dependence weresubstantially different in both periods considered. On the night from August 30 to 31 (Fig. 2a), the methaneconcentration increased at all altitudes, mainly from 3:00 to 6:00 LT. On the night from August 31 toSeptember 1 (see Fig. 2b), there was a significant methane concentration increase at 20 m from 0:00 to 3:00 LT.A high negative vertical concentration gradient was also observed in the 30- to 60-m layer. For that time,the wind direction changed from 295� to 286�. By 6:00 LT, the methane concentration decreased at allaltitudes, while the negative vertical gradient was maintained.
4. ESTIMATE OF METHANE EMISSION FROM NEARBY ANTHROPOGENIC SOURCES
The observations carried out at three altitudes made it possible to distinguish what sources, nearby or re-mote, determined the measured methane concentration. A respective conclusion was made from the verticalgradient of the concentration: nearby sources were to produce higher gradients, while remote sources wereto produce lower concentration gradients or the gradients remained unchanged. The formation of a highnegative vertical concentration gradient (see Fig. 2b) on the night from August 31 to September 1 can beexçlained by the location of the emission source at a relatively short distance from the measurement point,and the gas plume from that source spread toward the well of ultra-deep construction. It was assumed thatthe methane concentration maximum was observed when the axis of the methane plume from the sourcepassed close to the sampling point at 3:00 LT on September 1. The plume shifted with a change in thewind direction, and, as a result, the methane concentration decreased at all altitudes, while a high verticalgradient was maintained in spite of stable nighttime stratification of the atmosphere. The features of themethane distribution in the surface layer can be qualitatively described with the Gaussian diffusion model[1], commonly used for calculating pollution emission from point technogenic sources. In this case, theGaussian model was used to explain the concentration deviations from the initial values. The model can beused when the distances to the source do not exceed 10 km. The sources in the field located at a distance ofseveral tens of kilometers were simulated using models of another type. The position and strength of thesuggested nearby source were determined under the assumption that its influence, which is manifested inthe formation of vertical methane distribution with a high gradient, is superimposed upon the influence ofremote sources, which determine the vertically uniform background methane distribution. The calculation
RUSSIAN METEOROLOGY AND HYDROLOGY Vol. 34 No. 3 2009
174 RESHETNIKOV et al.
Fig. 2. Results of observations of the methane concentration in the period from August 30 to September 1, 2003, and
calculation with the Gaussian model of its highest concentrations observed on September 1. (a) Concentrations observed at
three levels and subject to the influence of remote sources on the night from August 30 to 31 at (1) 18:00, (2) 22:00, (3) 0:00,
(4) 3:00, and (5) 6:00 LT; (b) concentrations observed at three levels and subject to the influence of nearby sources on the
night from August 31 to September 1 at (6) 19:00, (7) 22:00, (8) 0:00, (9) 3:00, and (10) 6:00 LT; (c) calculated dependence of
coefficients of (11) horizontal and (12) vertical variance (standard deviations) of pollution on the distance from the source;
(d) comparison of (13) calculated and (14) measured vertical methane concentration distribution at 3:00 on September 1 for a
source with the methane emission intensity of 130 m3/h at a distance of 3.4 km from the observational point.
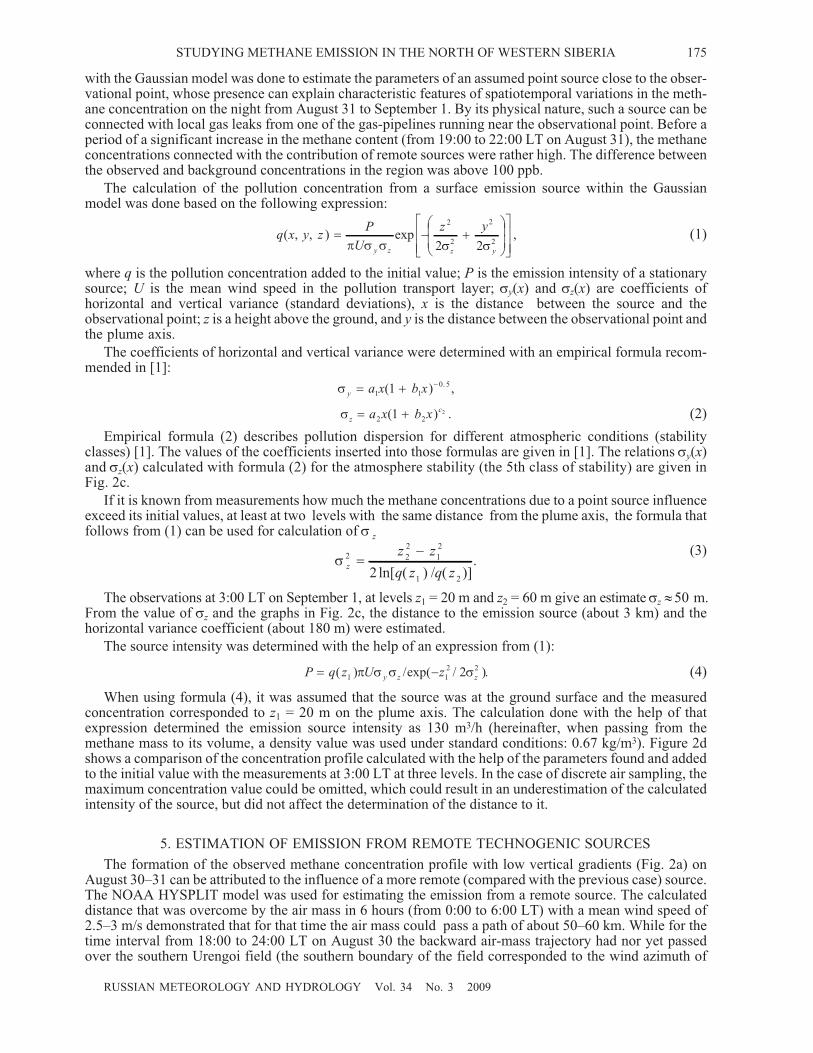
with the Gaussian model was done to estimate the parameters of an assumed point source close to the obser-vational point, whose presence can explain characteristic features of spatiotemporal variations in the meth-ane concentration on the night from August 31 to September 1. By its physical nature, such a source can beconnected with local gas leaks from one of the gas-pipelines running near the observational point. Before aperiod of a significant increase in the methane content (from 19:00 to 22:00 LT on August 31), the methaneconcentrations connected with the contribution of remote sources were rather high. The difference betweenthe observed and background concentrations in the region was above 100 ppb.
The calculation of the pollution concentration from a surface emission source within the Gaussianmodel was done based on the following expression:
q x y zP
U
z y
y z z y
( , , ) exp ,� � �
�
�
�
�
�
�
�
�
�
�
�
�� � � � �
2
2
2
22 2(1)
where q is the pollution concentration added to the initial value; P is the emission intensity of a stationarysource; U is the mean wind speed in the pollution transport layer; �y(x) and �z(x) are coefficients ofhorizontal and vertical variance (standard deviations), x is the distance between the source and theobservational point; z is a height above the ground, and y is the distance between the observational point andthe plume axis.
The coefficients of horizontal and vertical variance were determined with an empirical formula recom-mended in [1]:
� y a x b x� ��
1 1
0 51( ) . ,
� z
ca x b x� �2 21 2( ) . (2)
Empirical formula (2) describes pollution dispersion for different atmospheric conditions (stabilityclasses) [1]. The values of the coefficients inserted into those formulas are given in [1]. The relations �y(x)and �z(x) calculated with formula (2) for the atmosphere stability (the 5th class of stability) are given inFig. 2c.
If it is known from measurements how much the methane concentrations due to a point source influenceexceed its initial values, at least at two levels with the same distance from the plume axis, the formula thatfollows from (1) can be used for calculation of � z
� z
z z
q z q z
2 2
2
1
2
1 22
��
ln[ ( ) / ( )].
(3)
The observations at 3:00 LT on September 1, at levels z1 = 20 m and z2 = 60 m give an estimate �z � 50 m.From the value of �z and the graphs in Fig. 2c, the distance to the emission source (about 3 km) and thehorizontal variance coefficient (about 180 m) were estimated.
The source intensity was determined with the help of an expression from (1):
P q z U zy z z� �( ) /exp( / ).1 1
2 22� � � � (4)
When using formula (4), it was assumed that the source was at the ground surface and the measuredconcentration corresponded to z1 = 20 m on the plume axis. The calculation done with the help of thatexpression determined the emission source intensity as 130 m3/h (hereinafter, when passing from themethane mass to its volume, a density value was used under standard conditions: 0.67 kg/m3). Figure 2dshows a comparison of the concentration profile calculated with the help of the parameters found and addedto the initial value with the measurements at 3:00 LT at three levels. In the case of discrete air sampling, themaximum concentration value could be omitted, which could result in an underestimation of the calculatedintensity of the source, but did not affect the determination of the distance to it.
5. ESTIMATION OF EMISSION FROM REMOTE TECHNOGENIC SOURCES
The formation of the observed methane concentration profile with low vertical gradients (Fig. 2a) onAugust 30–31 can be attributed to the influence of a more remote (compared with the previous case) source.The NOAA HYSPLIT model was used for estimating the emission from a remote source. The calculateddistance that was overcome by the air mass in 6 hours (from 0:00 to 6:00 LT) with a mean wind speed of2.5–3 m/s demonstrated that for that time the air mass could pass a path of about 50–60 km. While for thetime interval from 18:00 to 24:00 LT on August 30 the backward air-mass trajectory had nor yet passedover the southern Urengoi field (the southern boundary of the field corresponded to the wind azimuth of
RUSSIAN METEOROLOGY AND HYDROLOGY Vol. 34 No. 3 2009
STUDYING METHANE EMISSION IN THE NORTH OF WESTERN SIBERIA 175
240�), in the period between 0:00 and 3:00 LT on August 31, the azimuth of the air-mass transporttrajectory changed from 220� to 250�, and by 6:00 LT, it changed up to 273�. A substantial methaneconcentration increase at all altitudes from 3:00 to 6:00 LT can be attributed to the influence of remotesources located in the Urengoi field. As follows from the analysis of backward trajectories of pollutiontransport in the ABL, the trajectory that passed over the observational point at 6:00 LT had crossed thecentral axis of the field at a distance of about 50–60 km from the sampling point. If we assume that a singlemethane source was located at the point of intersection of the field axis with the backward trajectory ofair-mass transport that at the moment when the maximum concentrations were recorded was passing overthe observational point (see table, Fig. 2a), it is possible to estimate the intensity of a source responsible forthe observed increase in the concentration. As follows from calculations with the HYSPLIT pollutiondispersion model, the permanent sources, in order to form the observed increase in the concentration at thesampling point, were to have an emission intensity of an order of 104 kg/h. The sector of the gas plumespreading from the source to the measurement point was about 40�. The area of the Urengoi field, whoseemission could influence the observations, in this case approximately corresponds to the trapezium arealimited by the eastern and western boundaries of the field and by the boundaries of the sector that issymmetric about the pollution dispersion sector. When the air-mass transport direction is close to 270�,with a distance between the field boundaries of about 20–25 km, the trapezium area will be about 800 km2.When the methane emission intensity from that area is 104 kg CH4/h and the total area of the field is 5200 km2,the annual mean emission volume of the field should be about 0.6 million t CH4/year (900 million m3/year)under the assumption that the intensity of the source emission is uniform in area and constant in time. Whenthe values of the emission intensity at different sites of the field and their areas are known, the estimate ofthe mean emission intensity of the field can be improved.
RUSSIAN METEOROLOGY AND HYDROLOGY Vol. 34 No. 3 2009
176 RESHETNIKOV et al.
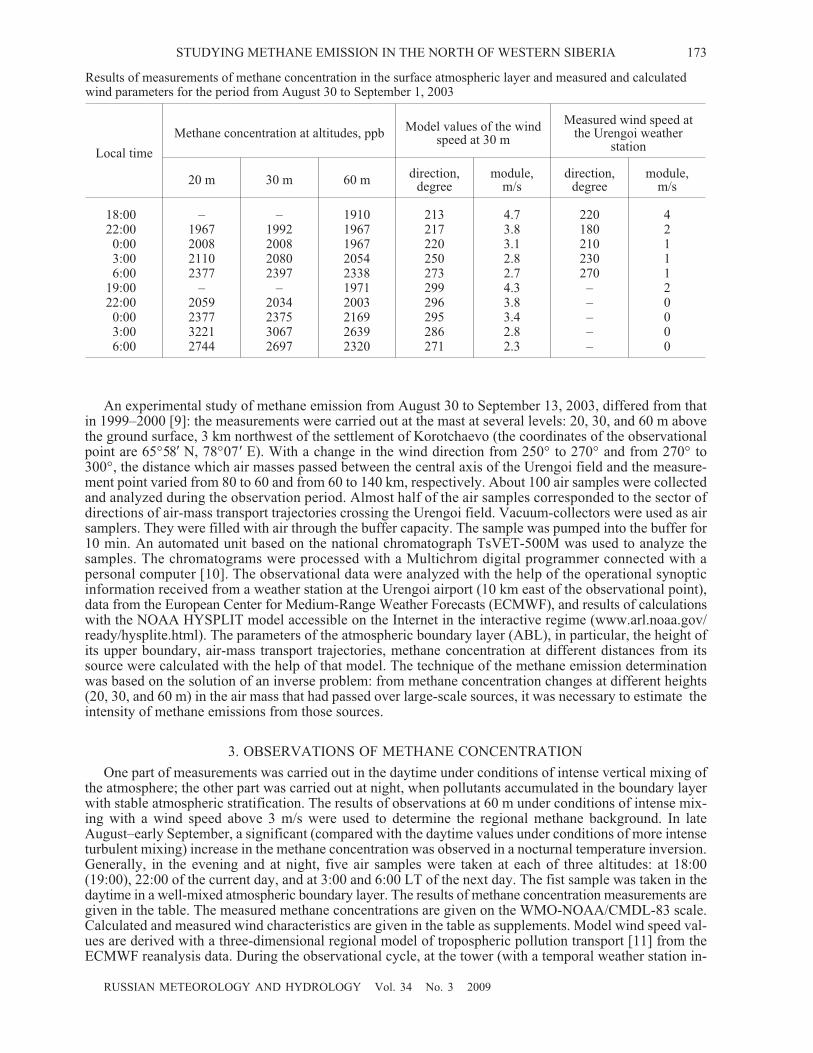
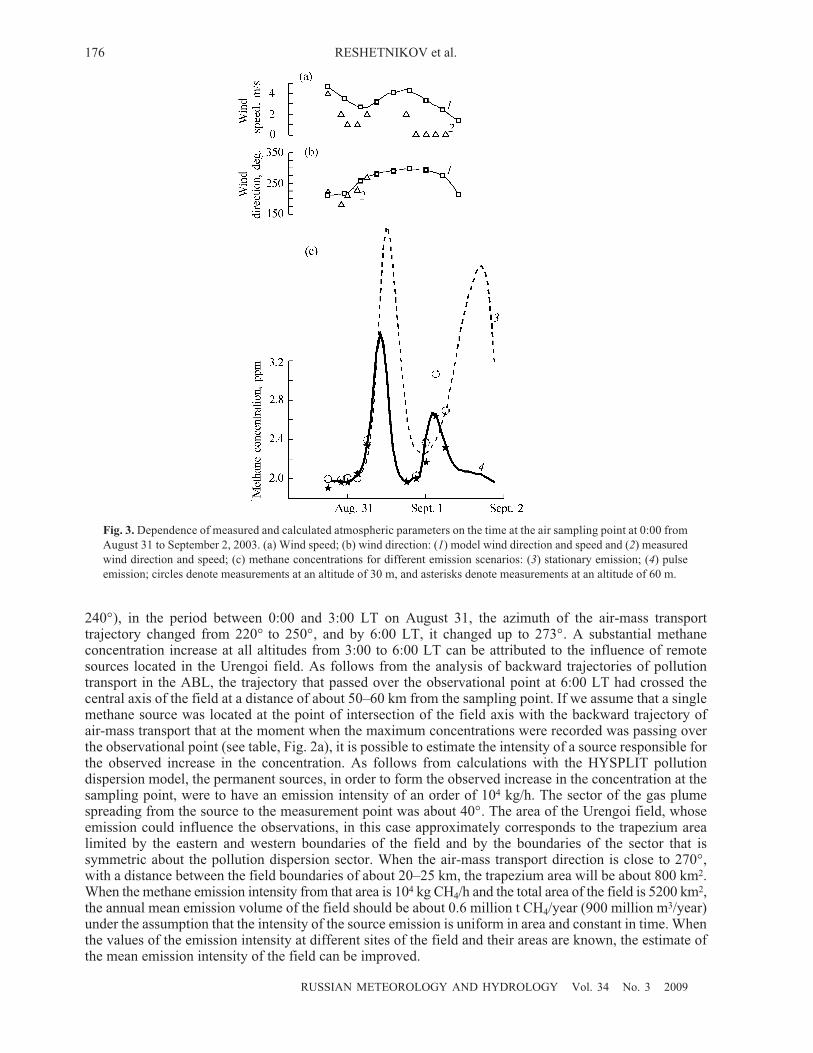
Fig. 3. Dependence of measured and calculated atmospheric parameters on the time at the air sampling point at 0:00 from
August 31 to September 2, 2003. (a) Wind speed; (b) wind direction: (1) model wind direction and speed and (2) measured
wind direction and speed; (c) methane concentrations for different emission scenarios: (3) stationary emission; (4) pulse
emission; circles denote measurements at an altitude of 30 m, and asterisks denote measurements at an altitude of 60 m.
The assumption of the pulse (salvo) emissions was also used to analyze the measurement data (August 30–September 13). The numerical model described in [11, 17, 18] was also used to estimate methane emissionunder different scenarios of salvo emissions when air masses moved from the Urengoi field for the periodsof August 30–31 and August 31– September 1, 2003. The data on the methane concentration at 60 m, whenthe effect of local sources was minimal, were used in the analysis. Figure 3 presents the results ofcomparison of calculated and measured concentrations. The versions of stationary (curve 3 in Fig. 3c),periodic, and pulse (curve 4 in Fig. 3c) emissions for several values of its intensity and duration wereconsidered. For the observations on August 30–31, in accordance with the model calculations, it was foundthat the pulse (salvo) emission could occur in the interval between 22:00 and 24:00 LT on August 30; thepulse (salvo emission) parameters, when calculated and measured concentrations were in best agreement,were the following: duration 1 h (from 22:00 to 23:00 LT), and intensity 6 g/(m2/day). The pulse parametersof the emission that occurred on August 31 were estimated at 3–4 g/(m2/day), and its duration was about45 min. Annual mean emissions (on conditions there was one salvo emission per day) with the aboveintensity values should be about 700 million m3 (0.5 million t/year) and 300 million m3 (0.2 million t/year).When the location of an anthropogenic source is known (the field area), one can select the form and time ofthe salvo emission effect in a way to provide the best reproduction of measurement data, but to guaranteethe adequacy of the approximation, several versions of such measurements are required. To make theestimate usable for a long time (generally, the volume of technogenic emission is estimated for a year), oneshould posses the information about the statistics of such emissions or provide continuous monitoringthroughout the year.
6. BACKGROUND OF METHANE CONCENTRATION IN THE REGION
The measurements that were carried out allowed the authors to estimate the regional background of themethane concentration for the summer-fall period of observations in the region of basic natural gas fieldsand at the northern border of the region (station Novyi Port on the southern coast of the Yamal Peninsula,the distance to the nearest Yamburg field is 70 km) and to compare it with observations at the Arctic back-ground stations Teriberka, Alert, and Barrow for a similar period of the year taking into account known lat-itudinal variations in the methane concentration.
The regional background of the methane concentration was determined using measurement dataobtained during the intense turbulent mixing with a wind speed (according to the data of the Urengoiweather station) of at least 3 m/s and air-mass transport directions not passing over the fields considered.The regional background methane concentration qrb1 determined in such a way at the measurement point ofthe tower of the well of ultra-deep construction was 1883 ± 26 ppb, and at Novyi Port qrb2 was 1890 ± 14 ppb.The closeness of the mean background concentrations at one of the central and boundary points of the regionindicated that the area of pollution dispersion, when the regional background is formed, is much wider thanthe geographic boundaries of the region. It is of interest that the regional background value in 2000, at thepoint located 10 km east of the tower of a well of ultra-deep construction (TWUD), was 1882 ± 32 ppb,which indicated no significant decrease in the regional background level over the three years. At the sametime, if to compare the difference of 65 ppb between the background values in this region (assuming thatboth observational points, TWUD and the point 10 km east of it, characterize the regional background) in2000 with a mean background of the three Arctic stations Teriberka, Barrow, and Alert [20] (monthly meanvalues for these stations in August and September 2003 were 1852 and 1850 ppb at Teriberka; 1851 and1860 ppb at Barrow; and 1841 and 1857 ppb at Alert, respectively, i.e., on average for the three stations, itamounted to 1852 ppb) with a similar difference in 2003 that was 31 ppb, it can be assumed that thecontribution of methane emission sources reduced, which can be attributed both to the energy conservationmeasures and to the reduced emission from bogs in the north of Western Siberia in the dry summer of 2003(the precipitation amount in August was 26 mm, according to the Urengoi weather station). It is verydifficult to determine the actual cause of a reduced difference as well as the cause of an abrupt reductionsince 1992 in the global rate of the methane concentration increase from 14–16 ppb to 2 ppb per year by2005 with the interannual variations from 16 to 2 ppb [20]. The mean regional background values in summer1999 at the western boundary of the region were 1859 ± 29 ppb (the Tanlova River bank) and 1851 ± 21 ppb(the Nadym River bank), only 15–20 ppb above the background concentrations at Barrow and Teriberka.As follows from the above, a significant increase in the regional background of the methane concentrationfrom west to east, is most likely connected with a dominant northwesterly direction of air-mass transport inthat period, when the air mass arrived at observational points (Tanlova, Nadym) from unpolluted areas ofWestern Siberia and the subpolar Urals. While moving eastward, the air mass was enriched in methanefrom local anthropogenic and natural sources. In order to distinguish correctly between the contributions
RUSSIAN METEOROLOGY AND HYDROLOGY Vol. 34 No. 3 2009
STUDYING METHANE EMISSION IN THE NORTH OF WESTERN SIBERIA 177
from natural and anthropogenic sources responsible for the regional background, measurements should becarried out in the wintertime, when the contribution from natural sources can be neglected, or to use theatmospheric methane isotope composition for analysis (measurements of the stable methane isotope 13C).
7. DISCUSSION AND MAIN RESULTS
The observations of gas concentrations at three levels in the atmosphere made it possible to provide amore adequate (than earlier) description of mechanisms of the formation of the methane concentrationfield, whose increased values were attributed to the emissions from anthropogenic and natural sources.Emissions from large-scale anthropogenic sources were estimated using simple and accessible computationmodels by “viewing” the territory where the sources were located when scanning it with a wind vector rela-tive to the observational point. Thus, it has become possible to verify the emission from a specific source, afield, whose annual mean emission should be estimated by the natural gas production company on condi-tions of its yearly inventory [2]. The results obtained make it possible to estimate the methane emissionboth from part of the field area and from the whole field (depending on the field area and its distance fromthe observational point) under conditions of the irregular distribution of the source intensity over the fieldarea. All year-round measurement cycles are required to determine the annual mean volume of methanelosses.
At the present stage of activity, it is too early to recommend the above estimates of the annual meanemission from the Urengoi field as a whole for use. An equipollent answer to the question concerning thecontribution of continuous and pulse emission components to the total emission in the field can be got onlyafter conducting continuous methane measurements and the estimation of the component contribution ofcontinuous leaks and the contribution of natural sources responsible for the increase in the regional back-ground of the methane concentration.
Observations of the regional background of the methane concentration in the region of the settlement ofKorotchaevo are of special interest because of the exploitation natural gas fields located in the region. It fol-lows from the 1999 and 2000 observations that the regional background of the methane concentration inthat period was higher than in 2003. The comparison with the data from the background stations located inthe same latitudinal zone shows that the regional background outside the field zone in 2003 exceeded thevalues of the global methane background for the Arctic latitudes in the Northern Hemisphere by approxi-mately 30–40 ppb, which was due to the contribution of both anthropogenic and natural sources to its for-mation.
ACKNOWLEDGMENTS
The work was supported by the Russian Foundation for Basic Research (grant 05-05-64760).
REFERENCES
1. The Atmosphere. Handbook (Gidrometeoizdat, St. Petersburg, 1999) [in Russian].
2. G. P. Bosnyatskii, A. I. Gritsenko, and A. D. Sedykh, Problems of Ecological Monitoring in Gas Industry (Nedra,Moscow, 1993) [in Russian].
3. A. I. Gritsenko, G. S. Akopova, and V. M. Maksimov, Ecology. Oil and Gas (Nauka, Moscow, 1997) [inRussian].
4. OAO Gazprom Natural Gas Production, http:/www.gazprom.com/articles/about.shtmlhttp/
5. A. V. Zinchenko, N. N. Paramonova, V. I. Privalov, et al., “Estimation of Methane Sources from ConcentrationMeasurements in the Area of Gas Production in the North of Western Siberia,” Meteorol. Gidrol., No. 1 (2008)[Russ. Meteorol. Hydrol., No. 1, 33 (2008)].
6. Yu. V. Kobzev, G. S. Akopova, and N. G. Gladkaya, “Estimation of the Atmospheric Methane Emissions fromRAO Gazprom Objects in 1996,” Gazovaya Promyshlennost, No. 10 (1997) [Gas Industry, No. 10 (1997)].
7. V. V. Maslennikov, G. A. Lanchakov, V. N. Maslov, et al., Gas Industry. Ser. Development and Exploitation ofGas and Gas-condensate Fields. Complex Control of Development of the Senomanskaya Gas Deposit and Techni-cal State of the Urengoi Field Well Equipment (OAO Gazprom, Moscow, 1998) [in Russian].
8. Technique of Calculation of Emission Parameters and Hazardous Substance Emissions from Torch Units forBurning Hydrocarbon Pollutants (OAO Gazprom, VNIIGAZ, Moscow, 1996).
9. A. I. Reshetnikov, A. V. Zinchenko, N. N. Paramonova, et al., “Experimental Study of Methane Emissions in theArea of Natural Gas Production in the North of Western Siberia,” Ekologicheskaya Khimiya, No. 3, 15 (2006)[Ecological Chemistry, No. 3, 15 (2006)].
RUSSIAN METEOROLOGY AND HYDROLOGY Vol. 34 No. 3 2009
178 RESHETNIKOV et al.
10. G. N. Smetanin, V. I. Privalov, A. I. Reshetnikov, and N. N. Paramonova, “A Gas-chromatic Unit for PrecisionMeasurements of Atmospheric Methane Concentrations against the Background Level,” Trudy Filiala GGO,Prikladnaya Meteorologiya, No. 2 (548) (2000) [Trans. MGO Branch, Research Center for Remote Sensing of theAtmosphere, Applied Meteorology, No. 2 (548) (2000)].
11. S. V. Yagovkina, I. L. Karol, V. A. Zubov, et al., “Estimates of the Atmospheric Methane Fluxes from the GasDeposits in the North of Western Siberia with a Three-dimensional Regional Transport Model,” Meteorol.Gidrol., No. 4 (2003) [Russ. Meteorol. Hydrol., No. 4 (2003)].
12. Y.-H. Chen and R. G. Prinn, “Estimation of Atmospheric Methane Emissions between 1996–2001 Using 3-DGlobal Chemical Model,” J. Geophys. Res., No. D 10307, 111 (2002).
13. J. V. Dedikov, G. S. Akopova, et al., “Estimating Methane Release from Natural Gas Production andTransmission in Russia,” Atmos. Environ., No. 16, 33 (1999).
14. R. Hein, P. G. Cruttzen, and M. Heimann, “An Inverse Modeling Approach to Investigate the Global AtmosphericMethane Cycle,” Global Biogeochem. Cycles, 11 (1997).
15. J. Heyer, U. Berger, I. L. Kuzin, and O. N. Yakovlev, “Methane Emissions from Different Ecosystem Structuresof the Subarctic Tundra in Western Siberia during Midsummer and during the Thawing Period,” Tellus, 54B(2002).
16. IPCC Fourth Assessment Report—Climate Change 2007, www.ipcc.ch.
17. S. Yagovkina, I. Karol, V. Zubov, et al., “Reconstruction of the Methane Fluxes from the Western Siberia GasFields by the 3-D Regional Chemical Transport Model,” Air, Water and Soil Pollution, Focus 1 (2001).
18. V. E. Lagun, S. V. Jagovkina, and I. L. Karol, “Western Siberian Natural Methane Emission Assessment Based onExperimental Data Analysis and 3-D Regional Modeling,” in Non-CO, Greenhouse Scientific Understanding,Control Options, and Policy Aspects, Ed. by J. van Ham, A. P. M. Baede, R. Guicherit, J. G. F. M. Williams-Jacobse(Milpress, Rotterdam, 2002).
19. N. Tomoko, K. Shunich, and F. Masami, “Temporal Variations in Methane Emissions from Tundra Wetlands in aPermafrost Area, Northeastern Siberia,” Atmos. Environ., 34 (2000).
20. WMO World Data Center for Greenhouse Gases (WCGGG) (Japan Meteorological Agency, 2007),http:/gaw.kishou.go.jp/wdcgg.html.
RUSSIAN METEOROLOGY AND HYDROLOGY Vol. 34 No. 3 2009
STUDYING METHANE EMISSION IN THE NORTH OF WESTERN SIBERIA 179