Embed Size (px)
Citation preview
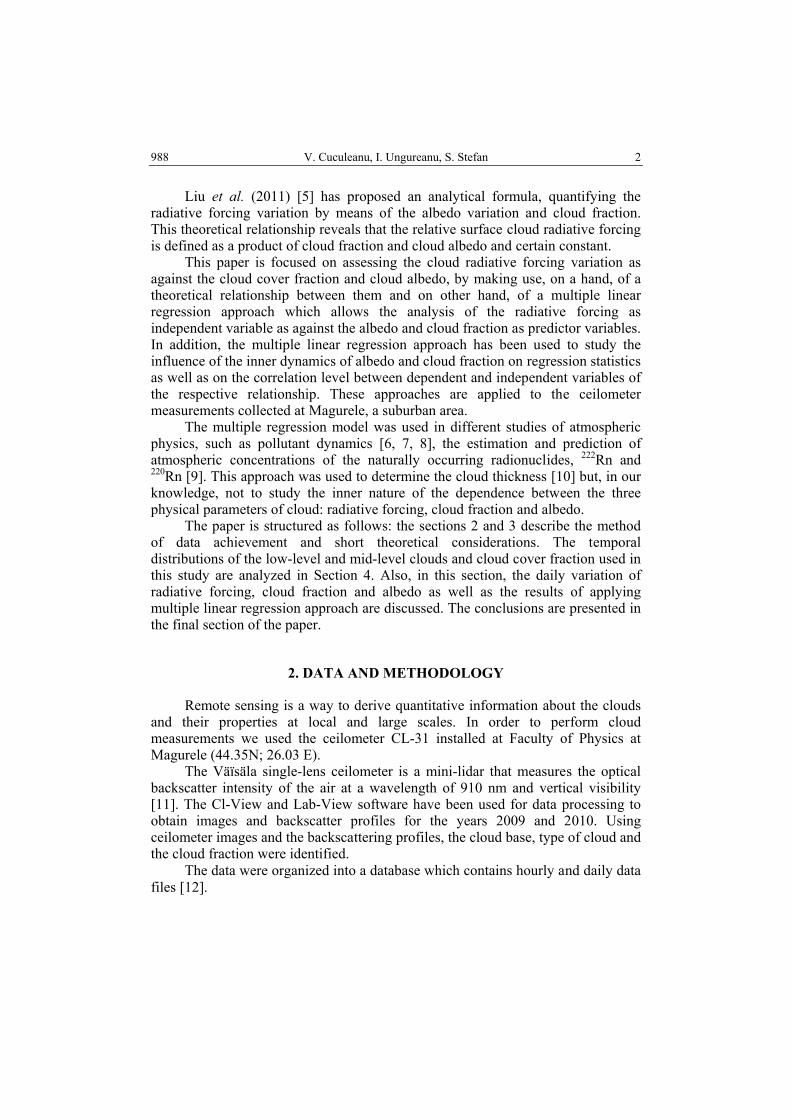
STUDY ON THE RELATIONSHIP AMONG RADIATIVE FORCING, ALBEDO AND COVER FRACTION OF THE CLOUDS
V. CUCULEANU1, 2, I. UNGUREANU1, S. STEFAN1
1University of Bucharest, Faculty of Physics, P.O.BOX Mg-11, Bucharest, Romania E-mail: [email protected]
2Academy of Romanian Scientists, 54 Splaiul Independentei, RO-050094, Bucharest, Romania E-mail: [email protected]
Received March 13, 2012
In order to reveal the real dependence among cloud radiative forcing on physical quantities characterizing the clouds, cloud cover fraction (cloudiness) and cloud albedo we made use of the multiple linear regression with radiative forcing as dependent variable and the cloud fraction and albedo, as independent variables. The regression statistics have made evident the inner dynamics of predictors as well as the correlation intensity between radiative forcing and the two independent variables.
Key words: radiative forcing, albedo, cloud fraction, multiple linear regression.
1. INTRODUCTION
The effects of clouds on radiative forcing are topics of particular interest and of direct relevance to climate change [1]. The clouds have radiative effects in both the solar and thermal regions of electromagnetic spectrum. In general, clouds have opposite effects in these two spectral regions and the net effect for the Earth-atmosphere column is the difference between these two large forcings [2].
The studies of global distribution of the individual and combined forcing at the top of atmosphere indicated [3] that at the global annual scale, clouds have a cooling effect, i.e. the reflection of solar radiation dominates the thermal trapping effect. In order to include the radiative effects of clouds in climate models it is necessary to consider all the processes that could change cloud cover and cloud radiative properties. In this respect, the most significant parameters are the cloud structure, cloud fraction, cloud thickness, the effective radius and the liquid water content which control cloud optical depth. In addition, a relationship between cloud radiative forcing, cloud cover fraction and cloud albedo could be a tool for diagnosing deficiencies of cloud- radiation parameterization in models [4, 5].
Rom. Journ. Phys., Vol. 58, Nos. 7–8, P. 987–999, Bucharest, 2013
V. Cuculeanu, I. Ungureanu, S. Stefan 2 988
Liu et al. (2011) [5] has proposed an analytical formula, quantifying the radiative forcing variation by means of the albedo variation and cloud fraction. This theoretical relationship reveals that the relative surface cloud radiative forcing is defined as a product of cloud fraction and cloud albedo and certain constant.
This paper is focused on assessing the cloud radiative forcing variation as against the cloud cover fraction and cloud albedo, by making use, on a hand, of a theoretical relationship between them and on other hand, of a multiple linear regression approach which allows the analysis of the radiative forcing as independent variable as against the albedo and cloud fraction as predictor variables. In addition, the multiple linear regression approach has been used to study the influence of the inner dynamics of albedo and cloud fraction on regression statistics as well as on the correlation level between dependent and independent variables of the respective relationship. These approaches are applied to the ceilometer measurements collected at Magurele, a suburban area.
The multiple regression model was used in different studies of atmospheric physics, such as pollutant dynamics [6, 7, 8], the estimation and prediction of atmospheric concentrations of the naturally occurring radionuclides, 222Rn and 220Rn [9]. This approach was used to determine the cloud thickness [10] but, in our knowledge, not to study the inner nature of the dependence between the three physical parameters of cloud: radiative forcing, cloud fraction and albedo.
The paper is structured as follows: the sections 2 and 3 describe the method of data achievement and short theoretical considerations. The temporal distributions of the low-level and mid-level clouds and cloud cover fraction used in this study are analyzed in Section 4. Also, in this section, the daily variation of radiative forcing, cloud fraction and albedo as well as the results of applying multiple linear regression approach are discussed. The conclusions are presented in the final section of the paper.
2. DATA AND METHODOLOGY
Remote sensing is a way to derive quantitative information about the clouds and their properties at local and large scales. In order to perform cloud measurements we used the ceilometer CL-31 installed at Faculty of Physics at Magurele (44.35N; 26.03 E).
The Väïsäla single-lens ceilometer is a mini-lidar that measures the optical backscatter intensity of the air at a wavelength of 910 nm and vertical visibility [11]. The Cl-View and Lab-View software have been used for data processing to obtain images and backscatter profiles for the years 2009 and 2010. Using ceilometer images and the backscattering profiles, the cloud base, type of cloud and the cloud fraction were identified.
The data were organized into a database which contains hourly and daily data files [12].
3 Radiative forcing, albedo and cover fraction of the clouds 989
These data have been used to determine the radiative properties of the cloud and the relationship between a dependent variable (radiative forcing) and two independent variables (albedo and cloud fraction) using a multiple regression model.
3. SHORT THEORETICAL CONSIDERATIONS
3.1. OPTICAL PROPERTIES OF THE CLOUDS
The study of clouds, how they are generated and their characteristics, play a key role in the understanding of Earth’s radiation budget. The different studies have shown that cloud radiative properties and its forcing are sensitive to the microphysical properties such as droplet number concentrations or/and, liquid water content, the droplet effective radius and physical characteristics like the geometric thickness [13, 14, 15]. The present work assesses the cloud albedo ( A ), cloud cover fraction ( )f and associated indirect forcing )( F∆ , assuming a horizontally homogeneous single layer cloud of geometrical thickness, Z∆ . In addition, it was neglected the surface albedo.
The radiative forcing of the clouds was expressed as [16]:
AfTFF A ∆−=∆ 20 (1)
where: 0F is the average downward flux at the top of the atmosphere (solar constant), AT is the atmospheric transmission, f is the cloud fraction and A∆ is the variation of the albedo associated with the variation of the cloud droplet number concentration ( N ) and optical depth of the cloud [17]. The formula for calculating the albedo [18] is:
τ
τ)1(32
)1(3g
gA−+
−= (2)
where g represents the asymmetry factor and τ is the optical depth of the cloud. The cloud optical depth has been computed using the extinction coefficient at cloud top and cloud geometrical thickness [15]. The geometrical thickness Z∆ is retrieved from ceilometer measurements, using the height of the base and top of clouds.
3.2. MULTIPLE LINEAR REGRESSION
Multiple linear regression is widely used in science to describe the possible relationship between a dependent variable and a number of independent variables used as predictors [19].
V. Cuculeanu, I. Ungureanu, S. Stefan 4 990
3.2.1. Estimation procedure
The estimation of radiative forcing is made by using the analytical expression of the multiple linear regression with the albedo and cloud fraction from the time period on which the regression is defined [9]. Multiple linear regression model assumes a linear relationship between the radiative forcing as dependent variable and the albedo and cloud fraction as independent or predictor variables. The regression coefficients are determined making use of the least-square method. The performances of the regression model are quantified by the following statistics: R-multiple correlation coefficient, R2-squared multiple correlation coefficient called coefficient of determination, F-test, p-value and SSR-sum squared residual [20]. Multiple correlation coefficient, R, is a measure of the strength of the linear relationship between dependent and the set of independent variables.
Collinearity being a linear relationship between two predictor variables, the analysis of collinearity reveals the independent variables, having correlation coefficients close to 1 (0.99 and larger). The main statistic for multicollinearity diagnostic is the Variance Inflation Factor (VIF) defined as [22]: VIF = 1/(1-Rj
2), where R2
j is the coefficient of determination when variable xj is regressed on the j-1 remaining independent variables. A variable is considered to be problematic if its VIF is larger than 10.0 [21].
3.2.2. Prediction procedure
After building up the multiple linear regression on a time period one may use the corresponding analytical expression to predict the values of the dependent variable on the next period by making use of the independent variable values from the prediction period [6, 9]. This means that the regression coefficients are kept constant and the albedo and cloud fraction values from the prediction period are used. As for criteria for prediction performances, we have used the SSR and correlation coefficient (r) between predicted and calculated radiative forcing, the corresponding level of significance (p value) and the relative error specific to each predicted forcing value.
4. RESULTS AND DISCUSSIONS
4.1. ABOUT CLOUDINESS OVER MAGURELE AND CLOUD RADIATIVE PROPERTIES
The cloud bases and types and cloud cover fraction were analyzed for the period January 2009–December 2010. This period was selected because ceilometer data were physically compatible with the satellite data [22].
5 Radiative forcing, albedo and cover fraction of the clouds 991
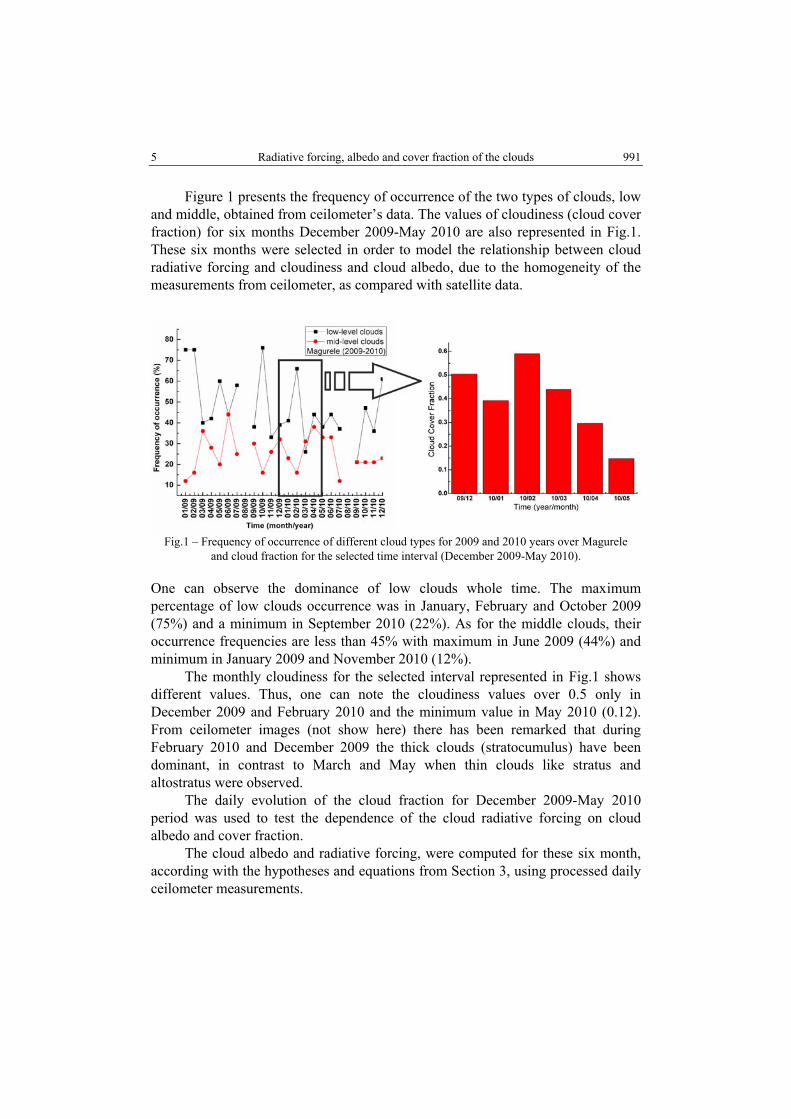
Figure 1 presents the frequency of occurrence of the two types of clouds, low and middle, obtained from ceilometer’s data. The values of cloudiness (cloud cover fraction) for six months December 2009-May 2010 are also represented in Fig.1. These six months were selected in order to model the relationship between cloud radiative forcing and cloudiness and cloud albedo, due to the homogeneity of the measurements from ceilometer, as compared with satellite data.
Fig.1 – Frequency of occurrence of different cloud types for 2009 and 2010 years over Magurele
and cloud fraction for the selected time interval (December 2009-May 2010).
One can observe the dominance of low clouds whole time. The maximum percentage of low clouds occurrence was in January, February and October 2009 (75%) and a minimum in September 2010 (22%). As for the middle clouds, their occurrence frequencies are less than 45% with maximum in June 2009 (44%) and minimum in January 2009 and November 2010 (12%).
The monthly cloudiness for the selected interval represented in Fig.1 shows different values. Thus, one can note the cloudiness values over 0.5 only in December 2009 and February 2010 and the minimum value in May 2010 (0.12). From ceilometer images (not show here) there has been remarked that during February 2010 and December 2009 the thick clouds (stratocumulus) have been dominant, in contrast to March and May when thin clouds like stratus and altostratus were observed.
The daily evolution of the cloud fraction for December 2009-May 2010 period was used to test the dependence of the cloud radiative forcing on cloud albedo and cover fraction.
The cloud albedo and radiative forcing, were computed for these six month, according with the hypotheses and equations from Section 3, using processed daily ceilometer measurements.
V. Cuculeanu, I. Ungureanu, S. Stefan 6 992
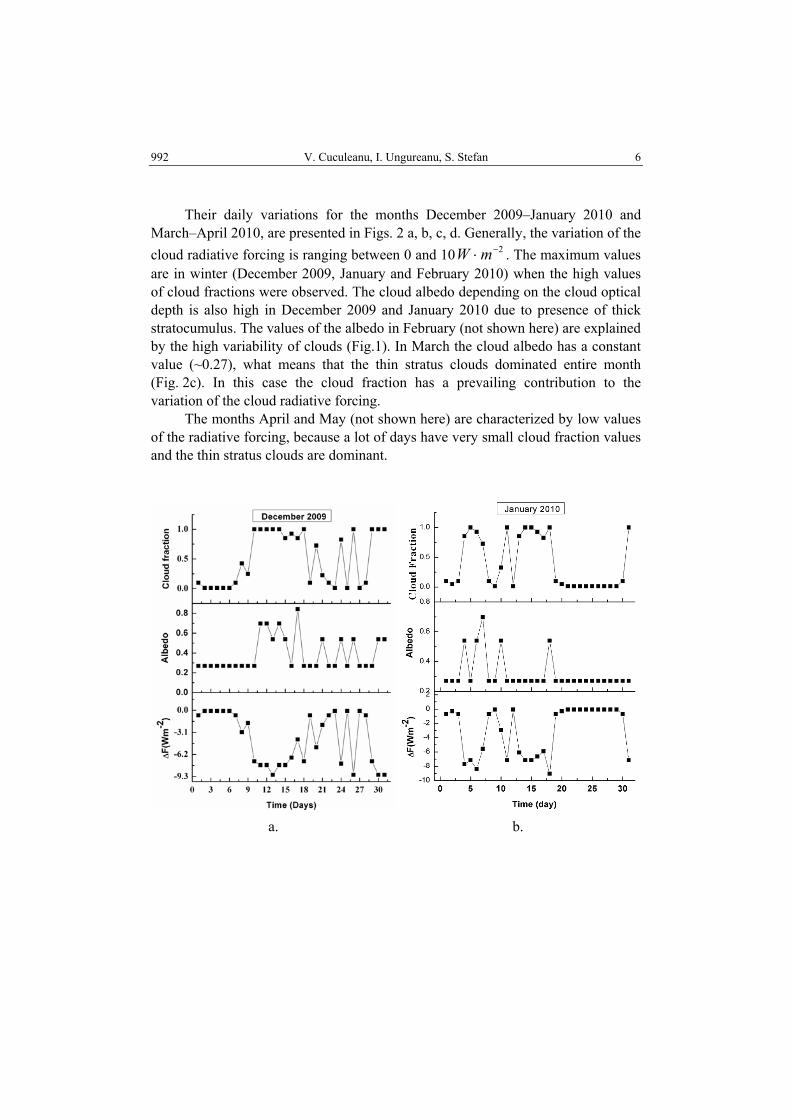
Their daily variations for the months December 2009–January 2010 and
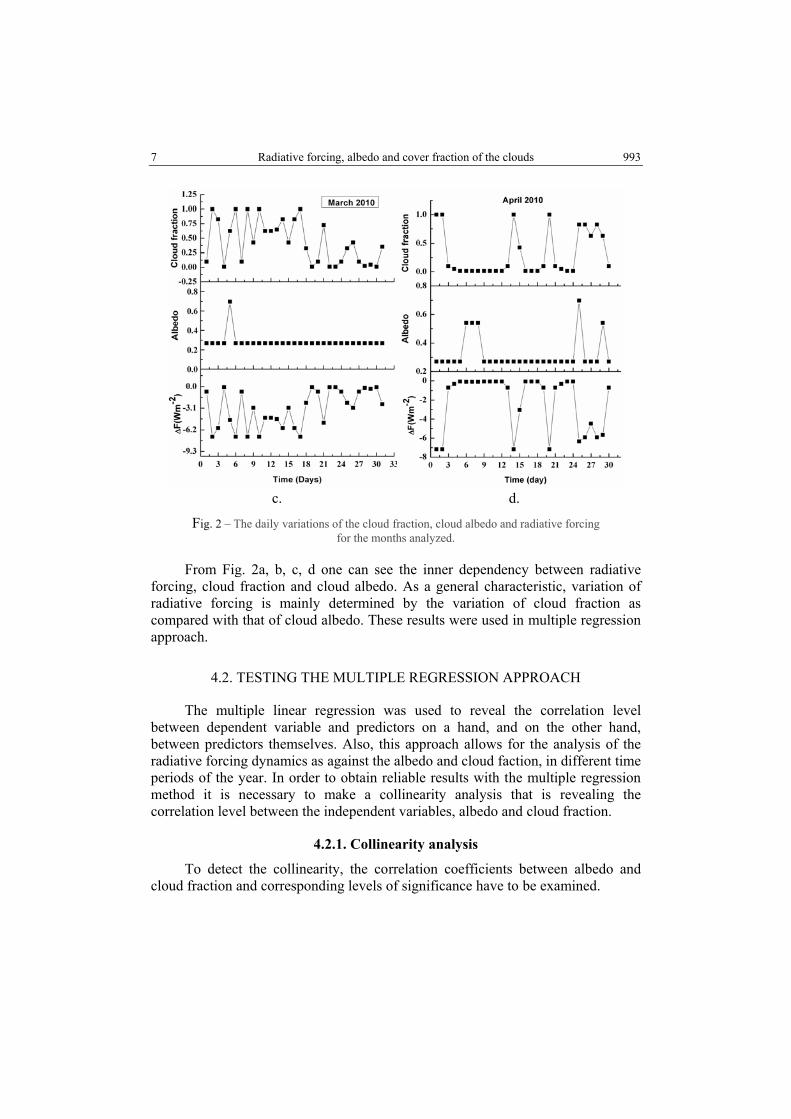
March–April 2010, are presented in Figs. 2 a, b, c, d. Generally, the variation of the cloud radiative forcing is ranging between 0 and 10 2−⋅mW . The maximum values are in winter (December 2009, January and February 2010) when the high values of cloud fractions were observed. The cloud albedo depending on the cloud optical depth is also high in December 2009 and January 2010 due to presence of thick stratocumulus. The values of the albedo in February (not shown here) are explained by the high variability of clouds (Fig.1). In March the cloud albedo has a constant value (~0.27), what means that the thin stratus clouds dominated entire month (Fig. 2c). In this case the cloud fraction has a prevailing contribution to the variation of the cloud radiative forcing.
The months April and May (not shown here) are characterized by low values of the radiative forcing, because a lot of days have very small cloud fraction values and the thin stratus clouds are dominant.
a. b.
7 Radiative forcing, albedo and cover fraction of the clouds 993
c. d.
Fig. 2 – The daily variations of the cloud fraction, cloud albedo and radiative forcing for the months analyzed.
From Fig. 2a, b, c, d one can see the inner dependency between radiative forcing, cloud fraction and cloud albedo. As a general characteristic, variation of radiative forcing is mainly determined by the variation of cloud fraction as compared with that of cloud albedo. These results were used in multiple regression approach.
4.2. TESTING THE MULTIPLE REGRESSION APPROACH
The multiple linear regression was used to reveal the correlation level between dependent variable and predictors on a hand, and on the other hand, between predictors themselves. Also, this approach allows for the analysis of the radiative forcing dynamics as against the albedo and cloud faction, in different time periods of the year. In order to obtain reliable results with the multiple regression method it is necessary to make a collinearity analysis that is revealing the correlation level between the independent variables, albedo and cloud fraction.
4.2.1. Collinearity analysis
To detect the collinearity, the correlation coefficients between albedo and cloud fraction and corresponding levels of significance have to be examined.
V. Cuculeanu, I. Ungureanu, S. Stefan 8 994
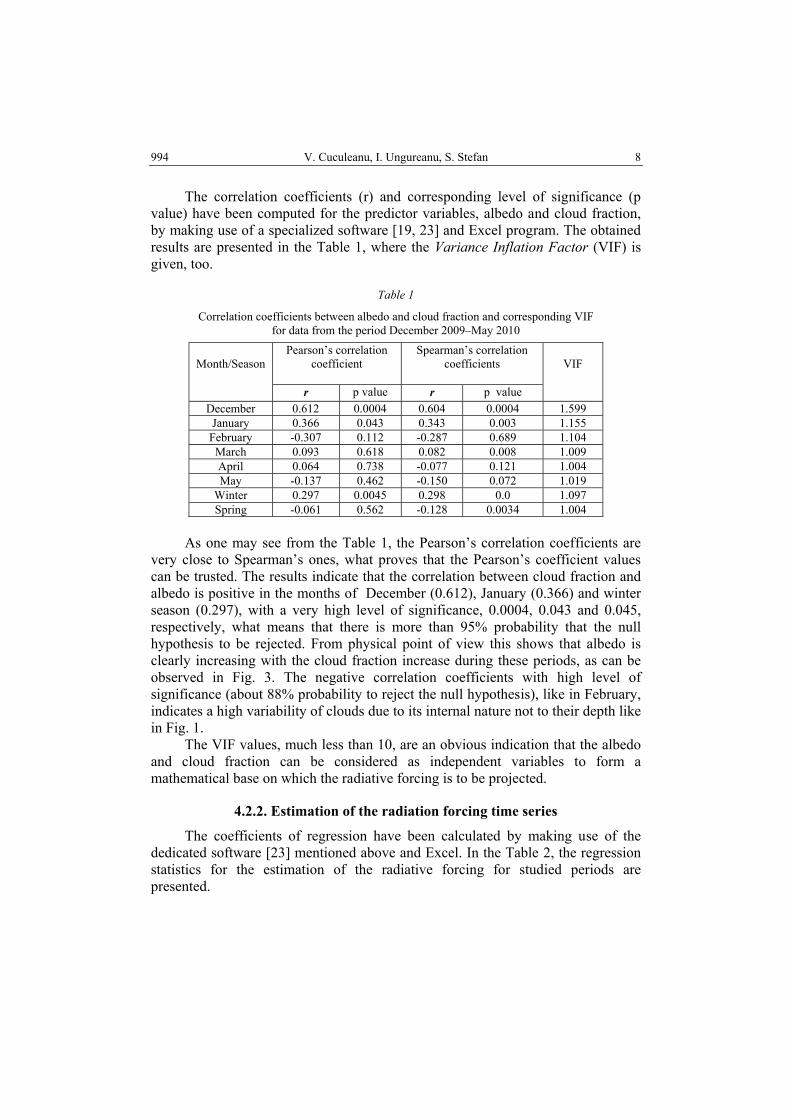
The correlation coefficients (r) and corresponding level of significance (p value) have been computed for the predictor variables, albedo and cloud fraction, by making use of a specialized software [19, 23] and Excel program. The obtained results are presented in the Table 1, where the Variance Inflation Factor (VIF) is given, too.
Table 1
Correlation coefficients between albedo and cloud fraction and corresponding VIF for data from the period December 2009–May 2010
Pearson’s correlation coefficient
Spearman’s correlation coefficients
Month/Season
r p value r p value
VIF
December 0.612 0.0004 0.604 0.0004 1.599 January 0.366 0.043 0.343 0.003 1.155 February -0.307 0.112 -0.287 0.689 1.104 March 0.093 0.618 0.082 0.008 1.009 April 0.064 0.738 -0.077 0.121 1.004 May -0.137 0.462 -0.150 0.072 1.019
Winter 0.297 0.0045 0.298 0.0 1.097 Spring -0.061 0.562 -0.128 0.0034 1.004
As one may see from the Table 1, the Pearson’s correlation coefficients are
very close to Spearman’s ones, what proves that the Pearson’s coefficient values can be trusted. The results indicate that the correlation between cloud fraction and albedo is positive in the months of December (0.612), January (0.366) and winter season (0.297), with a very high level of significance, 0.0004, 0.043 and 0.045, respectively, what means that there is more than 95% probability that the null hypothesis to be rejected. From physical point of view this shows that albedo is clearly increasing with the cloud fraction increase during these periods, as can be observed in Fig. 3. The negative correlation coefficients with high level of significance (about 88% probability to reject the null hypothesis), like in February, indicates a high variability of clouds due to its internal nature not to their depth like in Fig. 1.
The VIF values, much less than 10, are an obvious indication that the albedo and cloud fraction can be considered as independent variables to form a mathematical base on which the radiative forcing is to be projected.
4.2.2. Estimation of the radiation forcing time series
The coefficients of regression have been calculated by making use of the dedicated software [23] mentioned above and Excel. In the Table 2, the regression statistics for the estimation of the radiative forcing for studied periods are presented.
9 Radiative forcing, albedo and cover fraction of the clouds 995
Table 2
Regression statistics for estimation of the radiative forcing using cloud fraction and albedo as independent variables
Regression statistics for the radiative forcing estimation Decemb.
2009 January
2010 February
2010 Winter
2009/2010March 2010
April 2010
May 2010
Spring 2010
R 0.979 0.995 0.993 0.987 1 0.998 0.9997 0.9988 R2 0.958 0.991 0.986 0.974 1 0.996 0.9995 0.9975 p val 2.34E-19 2.12E-29 6.81E-24 7.35E-70 0 3.72E-33 5.97E-48 3.8E-117 F-test 310.37 1550.1 879.24 1646.045 1.64E+21 3394.96 33044.9 18338.8 SSR 15.30 3.10 3.673 26.57 1.82E-18 0.942 0.043 1.503
The main finding from Table 2 is the fact that a multiple linear regression
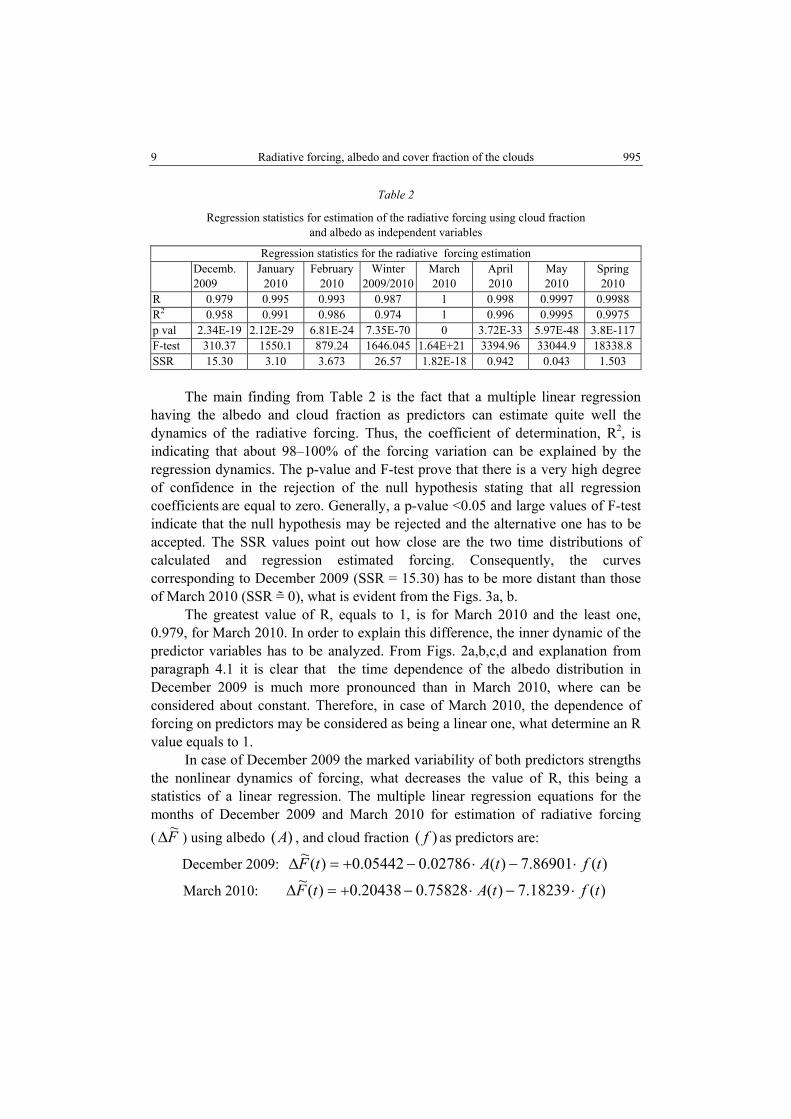
having the albedo and cloud fraction as predictors can estimate quite well the dynamics of the radiative forcing. Thus, the coefficient of determination, R2, is indicating that about 98–100% of the forcing variation can be explained by the regression dynamics. The p-value and F-test prove that there is a very high degree of confidence in the rejection of the null hypothesis stating that all regression coefficients are equal to zero. Generally, a p-value <0.05 and large values of F-test indicate that the null hypothesis may be rejected and the alternative one has to be accepted. The SSR values point out how close are the two time distributions of calculated and regression estimated forcing. Consequently, the curves corresponding to December 2009 (SSR = 15.30) has to be more distant than those of March 2010 (SSR = 0), what is evident from the Figs. 3a, b.
The greatest value of R, equals to 1, is for March 2010 and the least one, 0.979, for March 2010. In order to explain this difference, the inner dynamic of the predictor variables has to be analyzed. From Figs. 2a,b,c,d and explanation from paragraph 4.1 it is clear that the time dependence of the albedo distribution in December 2009 is much more pronounced than in March 2010, where can be considered about constant. Therefore, in case of March 2010, the dependence of forcing on predictors may be considered as being a linear one, what determine an R value equals to 1.
In case of December 2009 the marked variability of both predictors strengths the nonlinear dynamics of forcing, what decreases the value of R, this being a statistics of a linear regression. The multiple linear regression equations for the months of December 2009 and March 2010 for estimation of radiative forcing ( F~∆ ) using albedo )(A , and cloud fraction )( f as predictors are:
December 2009: )(86901.7)(02786.005442.0)(~ tftAtF ⋅−⋅−+=∆
March 2010: )(18239.7)(75828.020438.0)(~ tftAtF ⋅−⋅−+=∆
V. Cuculeanu, I. Ungureanu, S. Stefan 10 996
a. ….. b. Fig. 3 – Calculated and regression estimated forcing for December 2009 (a) and for March 2010 (b).
In the Fig. 3a, b the corresponding estimated time series as compared with calculated ones, are presented.
4.2.3. Prediction of the radiation forcing time series
In the Table 3 there are presented the statistics for the prediction of the radiative forcing using regression build up on one month interval.
Table 3
Regression statistics for prediction of radiative forcing using cloud fraction and albedo as independent variables
Regression statistics for radiative forcing prediction
January 2010
February 2010
March 2010
April 2010 May 2010
r 0.990 0.992 0.999 0.998 0.994 p value 1.35E-13 2.06E-12 4.91E-14 1.52E-13 8.59E-14
SSR 7.091 5.393 2.022 1.053 1.341
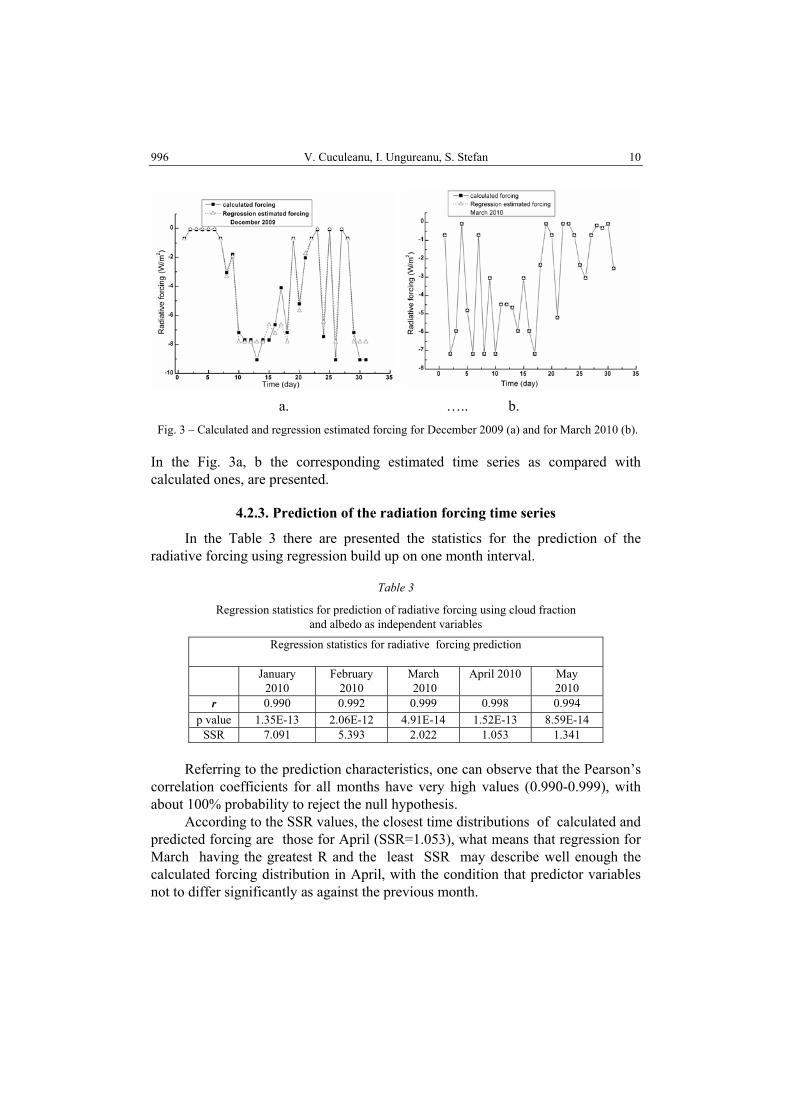
Referring to the prediction characteristics, one can observe that the Pearson’s correlation coefficients for all months have very high values (0.990-0.999), with about 100% probability to reject the null hypothesis.
According to the SSR values, the closest time distributions of calculated and predicted forcing are those for April (SSR=1.053), what means that regression for March having the greatest R and the least SSR may describe well enough the calculated forcing distribution in April, with the condition that predictor variables not to differ significantly as against the previous month.
11 Radiative forcing, albedo and cover fraction of the clouds 997
a. b.
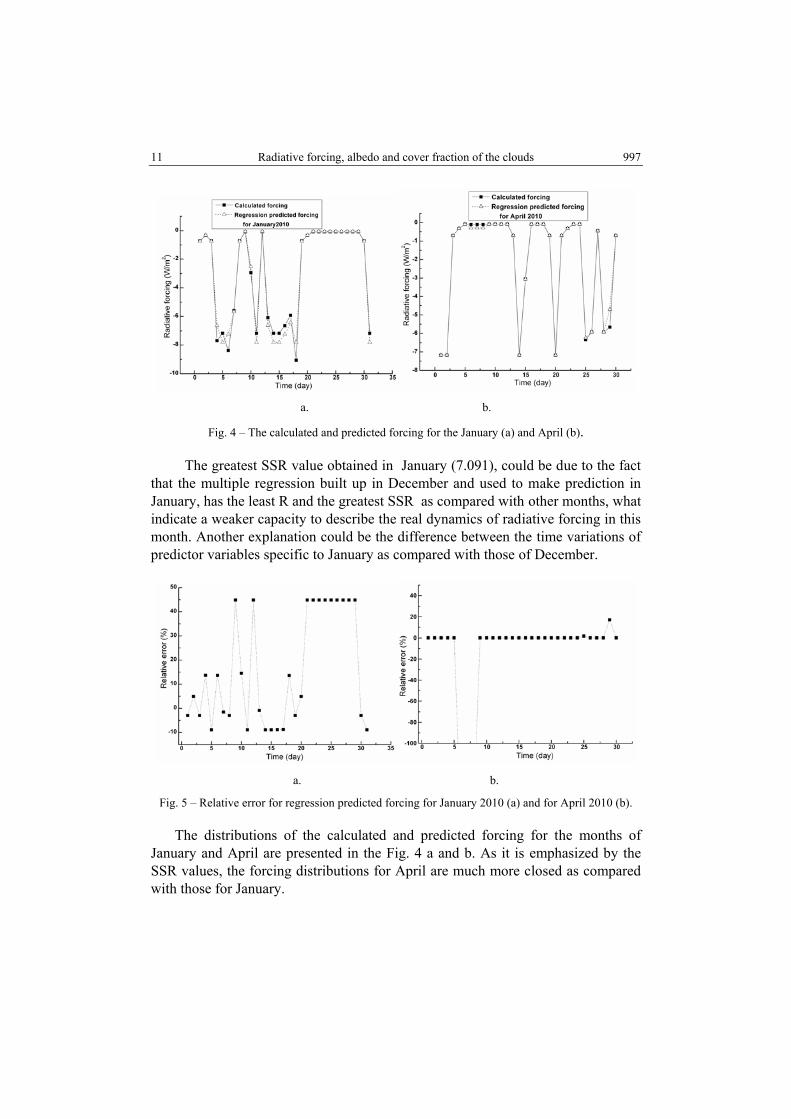
Fig. 4 – The calculated and predicted forcing for the January (a) and April (b).
The greatest SSR value obtained in January (7.091), could be due to the fact that the multiple regression built up in December and used to make prediction in January, has the least R and the greatest SSR as compared with other months, what indicate a weaker capacity to describe the real dynamics of radiative forcing in this month. Another explanation could be the difference between the time variations of predictor variables specific to January as compared with those of December.
a. b.
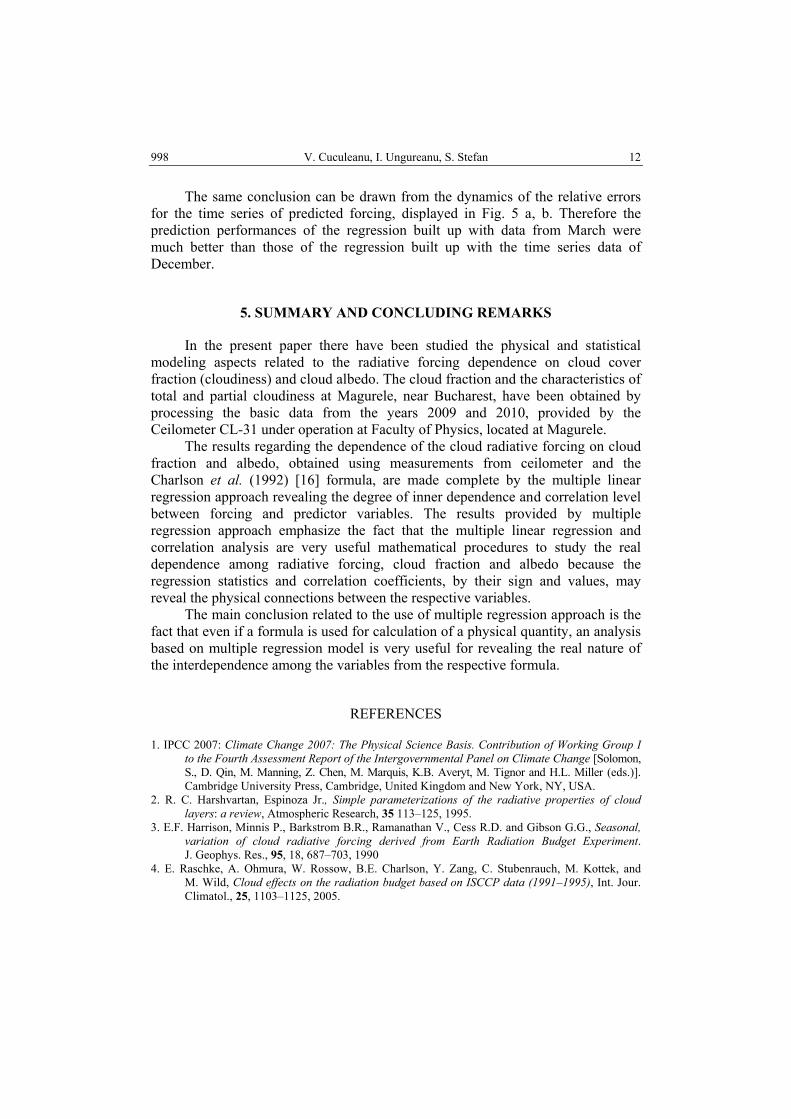
Fig. 5 – Relative error for regression predicted forcing for January 2010 (a) and for April 2010 (b).
The distributions of the calculated and predicted forcing for the months of January and April are presented in the Fig. 4 a and b. As it is emphasized by the SSR values, the forcing distributions for April are much more closed as compared with those for January.
V. Cuculeanu, I. Ungureanu, S. Stefan 12 998
The same conclusion can be drawn from the dynamics of the relative errors for the time series of predicted forcing, displayed in Fig. 5 a, b. Therefore the prediction performances of the regression built up with data from March were much better than those of the regression built up with the time series data of December.
5. SUMMARY AND CONCLUDING REMARKS
In the present paper there have been studied the physical and statistical modeling aspects related to the radiative forcing dependence on cloud cover fraction (cloudiness) and cloud albedo. The cloud fraction and the characteristics of total and partial cloudiness at Magurele, near Bucharest, have been obtained by processing the basic data from the years 2009 and 2010, provided by the Ceilometer CL-31 under operation at Faculty of Physics, located at Magurele.
The results regarding the dependence of the cloud radiative forcing on cloud fraction and albedo, obtained using measurements from ceilometer and the Charlson et al. (1992) [16] formula, are made complete by the multiple linear regression approach revealing the degree of inner dependence and correlation level between forcing and predictor variables. The results provided by multiple regression approach emphasize the fact that the multiple linear regression and correlation analysis are very useful mathematical procedures to study the real dependence among radiative forcing, cloud fraction and albedo because the regression statistics and correlation coefficients, by their sign and values, may reveal the physical connections between the respective variables.
The main conclusion related to the use of multiple regression approach is the fact that even if a formula is used for calculation of a physical quantity, an analysis based on multiple regression model is very useful for revealing the real nature of the interdependence among the variables from the respective formula.
REFERENCES
1. IPCC 2007: Climate Change 2007: The Physical Science Basis. Contribution of Working Group I to the Fourth Assessment Report of the Intergovernmental Panel on Climate Change [Solomon, S., D. Qin, M. Manning, Z. Chen, M. Marquis, K.B. Averyt, M. Tignor and H.L. Miller (eds.)]. Cambridge University Press, Cambridge, United Kingdom and New York, NY, USA.
2. R. C. Harshvartan, Espinoza Jr., Simple parameterizations of the radiative properties of cloud layers: a review, Atmospheric Research, 35 113–125, 1995.
3. E.F. Harrison, Minnis P., Barkstrom B.R., Ramanathan V., Cess R.D. and Gibson G.G., Seasonal, variation of cloud radiative forcing derived from Earth Radiation Budget Experiment. J. Geophys. Res., 95, 18, 687–703, 1990
4. E. Raschke, A. Ohmura, W. Rossow, B.E. Charlson, Y. Zang, C. Stubenrauch, M. Kottek, and M. Wild, Cloud effects on the radiation budget based on ISCCP data (1991–1995), Int. Jour. Climatol., 25, 1103–1125, 2005.
13 Radiative forcing, albedo and cover fraction of the clouds 999
5. Y. Liu, W. Wu, M.P. Jensen, and T. Toto, Relationship between cloud radiative forcing, cloud fraction and cloud albedo, and new surface-based approach for determining cloud albedo, Atmospheric Chemistry and Physics, 11,7155–7170, 2011;
6. M.C. Hubbard, W.G Cobourn, 1998, Development of a regression model to forecast ground-level ozone concentration in Louisville, KY. Atmos.Environ. 32, 14/15, 2637–2647, Elsevier.
7. C. Perrino, Pietrodangelo, A., Febo, A., 2001 An atmospheric stability index based on radon progeny measurements for the evaluation of primary urban pollution. Atmos. Environ. 35, 5235–5244
8. A. Vlachogianni, Kassomenos P., Karppinen A., Karakitsios S., Kukkonen, J., 2011. Evaluation of a multiple regression model for the forecasting of the concentrations of NOx and PM10 in Athens and Helsinki. Science of the Total Environment 409 1559–1571, 2011
9. F. Simion V. Cuculeanu E. Simion A. Geicu, Modeling the 222Rn and 220Rn progeny concentrations in atmosphere using multiple linear regression with meteorological variables as predictors, Romanian Reports in Physics, 65, no. 2, 524–544, 2013.
10. D. Chakrapani, R. Doelling and A. D. Rapp, Cloud Thickness Estimation from GOES-8 Satellite Data Over the ARM-SGP Site; Twelfth ARM Science Team Meeting Proceedings, St. Petersburg, Florida, April 8–12, 2002;
11. C.Münkel, Mixing height determination with lidar ceilometers - results from Helsinki Testbed, Meteorol. Z. 16, 451–459, 2007.
12. I. Ungureanu, S. Stefan, D. Nicolae, Investigation of the Cloud Cover and Planetary Boundary Layer (PBL) Characteristics Using Ceilometer CL31, Romanian Reports in Physics, 62, No2, p. 396–404, 2010.
13. J.E. Hansen, L.D Travis, Light Scattering in planetary atmosphere, Space Sci. Rev., 16, 527–610, 1974.
14. M Hess, P. Koepke, I. Schultz, Optical properties of aerosols andclouds: The software package OPAC, Bull. A.M.S., vol 79, No.5, pp 831–844, 1998
15. H. Pawlowska, J. L. Brenguier, F. Burnet, Microphysical properties of stratocumulus cloud, Atmos. Res., 55, 15–33, 2000.
16. R. J. Charlson, S.E. Schwartz, J.M. Hales, R.D. Cess, J.A. Jr Coakley, J.E. Hansen, D.J. Hofmann, Climate forcing by antropogenic aerosols, Science, 255, 423–430, 1992.
17. S. Platnick, and Twomey, S: Determining the susceptibility of cloud albedo to change in droplet concentration with the advanced very high resolution radiometer, J. Appl. Meteorol., 33, 334–347, 1993.
18. A.A. Lacis, J.E. Hansen, A parameterization for the absorbtion of solar radiation in the Earth’s atmosphere, J. Atmos. Sci., 31, 1974.
19. J.M. Chambers, Linear models, Eds J. M. Chambers and T. J. Hastie, Wadsworth & Brooks/Cole, 1992
20. D.S Wilks, Statistical methods in atmospheric sciences: an introduction. Academic Press 1995 21. P.A Rogerson, Statistical methods in geography. London: Sage Publications, Inc. 2001 22. S. Stefan, I. Ungureanu, C. Grigoras, Cloud fraction and cloud radiative properties in Magurele,
Romania, Geophysical Research Abstracts, 14, EGU General Assembly 2012, Vienna-Austria 23. P. Wessa, Free Statistics Software, Office for Research Development and Education, version
1.1.23-r7, 2012. URL http://www.wessa.net/.