Embed Size (px)
Citation preview

Study Of Velocity in Ferrous and
Non-Ferrous Weld Zones Research completed by Nathaniel G. Pendley
In conjunction with Stephen Rowland
and the Non Destructive Testing program, San Jacinto College
Abstract:
This project will identify changes in ultrasonic velocity due to the effects of welding heat and stress
on ferrous and non-ferrous weld zones which will translate into predicting the velocity and
attenuation in these zones. Methods for evaluating this, and explanations related to inherent
processes will be listed as follows.
Basics of Welding and Weld Zones:
Most welding techniques are focused around connecting a positive or negatively charged metal
clamp to a base metal material, and applying constant voltage and current to cause an electric arc to
be struck between the base metal and the consumable electrode, which deposits new metal
material on the surface due to the great amount of heat created. However, the heat that is created
changes the material grain structures around it in many materials, often times weakening them,
creating undesirable characteristic changes, and changing the materials velocity in that area.
Among the other issues the change in material velocity causes difficulty when ultrasonic inspection
is used to evaluate materials due to unanticipated variables leading unreliable results.

Test Sample Containing Ferrous and Non-Ferrous Material:
The portion of the test sample colored in salmon represents the non-ferrous portion or the Inconel
625. The green portion of the test sample represents the ferrous side which is carbon steel 514. The
method for connecting the two materials was through typical GTAW method, and then the welded
mass was then machined to the dimension 1.00” x 4.20” x 7.00”. The depth of overlay indicated in
purple is approximately .25” thick. The length of Inconel at the end of the test sample indicated in
orange is approximately 1.00” thick. All other dimensions are indicated in the picture.
Materials:
Inconel 625: (Face Centered Cubic) Inconel alloys are oxidation and corrosion resistant materials
well suited for service in extreme environments. When heated, Inconel forms a thick, stable,
passivating oxide layer protecting the surface from further attack. Inconel retains strength over a
wide temperature range, attractive for high temperature applications where aluminum and steel
would succumb to creep as a result of thermally-induced crystal vacancies (see Arrhenius
equation). Inconel's high temperature strength is developed by solid solution strengthening or
precipitation strengthening, depending on the alloy. In age hardening or precipitation
strengthening varieties, small amounts of niobium combine with nickel to form the intermetallic
compound Ni3Nb or gamma prime (γ'). Gamma prime forms small cubic crystals that inhibit slip
and creep effectively at elevated temperatures. Due to a large grain structure it is a highly
attenuative material. (Longitudinal wave velocity of .2290 in/us – microseconds 1 x 10^-6)

Inconel 625 Grain Structure:
The ASTM size grain number of the Inconel 625 on the test sample was achieved by indicating the
number of grains found in a 1.00” circle known as planimetric procedure at 100x which yielded
log 192/ log 2= 7.5747 ASTM Grain Size Number
Materials:
514 Carbon Steel: (Body Centered Cubic) Carbon steel, also called plain-carbon steel, is steel where
the main alloying constituent is carbon. The American Iron and Steel Institute (AISI) defines carbon
steel as: "Steel is considered to be carbon steel when no minimum content is specified or required
for chromium, cobalt, niobium, molybdenum, nickel, titanium, tungsten, vanadium or zirconium, or
any other element to be added to obtain a desired alloying effect; when the specified minimum for
copper does not exceed 0.40 percent; or when the maximum content specified for any of the
following elements does not exceed the percentages noted: manganese 1.65, silicon 0.60, copper
0.60."[1]. The 518 designation is primarily used for pressure piping due to its strength which can
be attributed to its fine grain structure. (Longitudinal material velocity of .23 in/us – microseconds
1 x 10^-6).

514 Carbon Steel Grain Structure:
The ASTM size grain number of the 514 carbon steel on the test sample was achieved by indicating
the number of grains found in a 1.00” circle known as planimetric procedure at 100x which yieled
log 60/ log 2 = 5.9068 ASTM Grain Size Number
Polishing Procedure:
The illustrations above were achieved my microscopic analysis after polishing the applicable
surface of the sample and performing an acid etch, of which the procedure will be listed. Due to
unique dimensional characteristics an unorthodox method was used to polish the surface which
consisted of wrapping and securing a high thread count fabric upon a flat fixed surface, wetting it
with .o5 micron alumina infused water, and then moving the test sample back and forth upon it
until a lustrous surface was achieved. Macroscopic evaluation verified that any deep surface
scratches that would impede grain evaluation were removed in preparation for acid etching.

Metallographic Etching:
Etching is the process of using strong acid to dissolve the less resilient constituents of a material to
reveal underlying structures that could not otherwise be seen. Common methods are cold etching
and electro etching. Cold etching simply means pouring strong acid on the polished surface of a
metal for a pre-determined duration of time and then washing it away. Upon a successful etch the
individual performing the test will be able to see a “bloom” on the surface which is simply a fogging
due to the grain boundaries of the metal being revealed.
Electro Etching Basics:
Electro etching consists of submerging a test sample in a container filled with enough etchant to
cover the affected area and then touching the Anode rod to the sample surface, and positioning the
Cathode metal paddle to the side. The electro etching machine is then activated, and in the case of
this test sample 6 Volts at .2 Amps is sent through the Anode to the Cathode causing a high velocity
of current movement through the acid electrolyte assisting in dissolving the grain boundaries,
causing what is called an etch.

Etching Procedure:
Oxalic acid (H2C2O4 dicarboxylic acid) was poured over the entire polished side and remained on
the surface for 30 seconds which only etched only the carbon steel and left the Inconel side
unaffected. An attempt was made to cold etch the Inconel area using Marbles reagent (CuSO4
hydrochloric acid and copper sulfate) but was unsuccessful in achieving a proper etch. A successful
etching was achieved by electro etching using Nital (10% HNO3 Nitric acid – solution of methanol
and Nitric acid). However, due to unique material characteristics an unorthodox method for etching
the Inconel side of the test sample was used which consisted of using rubber cement to mask the
514 carbon steel side as the Inconel 625 side was electro etched in a large acid resistant Pyrex
container for 30 seconds. This method was used because Nital would over etch the carbon steel
side.

Superficial Hardness Basics:
The specimen is positioned on what is referred to as an anvil on the hardness evaluator (refer to
illustrations 3), such that the side to be tested is faced upward toward the penetrator. The specimen
is then tightened in position with the penetrator touching the surface. Being a Rockwell A test a
minor load of 10 KG is is applied to properly seat the indenter and remove and surface
irregularities, and then the major load of 60 kg is released and the diamond indenter penetrates the
specimen and the machine gives its reading, either by dial or digitally.
Ill. 3 Ill. 2
Ill. 3

ASTM Metal Hardness Conversion Chart:

Superficial Hardness Testing:
An array of 12 Rockwell A superficial hardness tests, spaced 1/1oth of an inch apart starting in the
carbon steel area, through the carbon steel/ inconel interface and into the Inconel area. The first 5
were taken in the isotropic 514 carbon steel area, and a subsequent 2 were taken in the carbon
steel area, one in the quench zone and one in the heat affected zone. The next reading was taken in
the quench zone of the Inconel, followed by another taken in the heat affected zone. The last 3 were
taken at a 45 degree angle which is transverse to the weld pass pattern to attain more accurate
readings.

Hardness Readings:
1. 59.1 RA/ CS 514/ 4.5”
2. 59.1 RA/ CS 514/ 4.6”
3. 58.8 RA/ CS 514/ 4.7”
4. 59.0 RA/ CS 514/ 4.8”
5. 58.8 RA / CS 514/ 4.9”
6. 59.3 RA/ CS 514 HAZ/ 5.0”
7. 59.4 RA/ CS 514 QZ/ 5.1”
8. 60.4 RA/ INC. 625 QZ/ 5.2”
9. 62.2 RA/ INC. 625 HAZ/ 5.3’
10. 57.9 RA/ INC. 625/ 5.4”
11. 58.9 RA/ INC. 625/ 5.5”
12. 57.9 RA/ INC. 625/ 5.6”
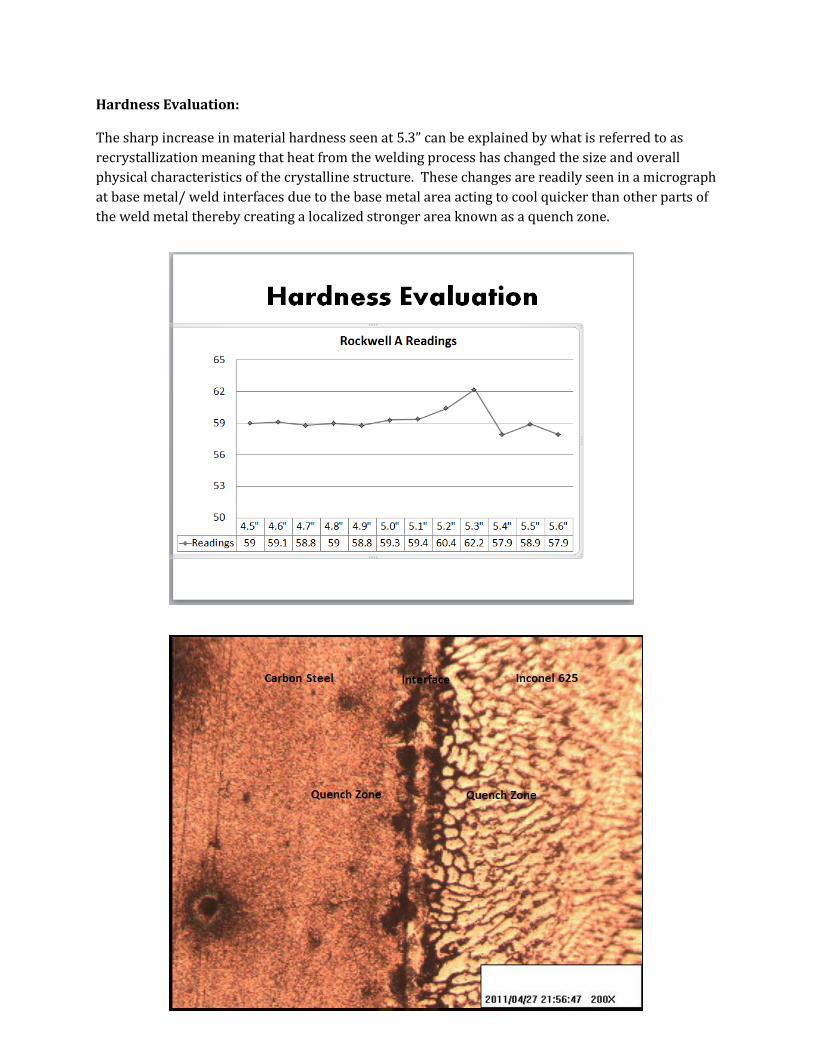
Hardness Evaluation:
The sharp increase in material hardness seen at 5.3” can be explained by what is referred to as
recrystallization meaning that heat from the welding process has changed the size and overall
physical characteristics of the crystalline structure. These changes are readily seen in a micrograph
at base metal/ weld interfaces due to the base metal area acting to cool quicker than other parts of
the weld metal thereby creating a localized stronger area known as a quench zone.

Material Velocity Evaluation:
The velocity of a material is given by (distance divided by time). It is simply the rate at which a
given energy in this case sound (768 mph), displaces particles or attenuates in a medium once it is
transferred. This energy may also be reflected inversely when it reaches an interface of different
material or geometry. More specifically as pertaining to metal it is given by a ratio related to
Poissons ratio, Bulk modulus, Shear modulus, and Young’s modulus. This is used to create a rate
such as inches per microsecond. Due to owner restrictions the mentioned measurements could not
be performed on the test sample because they would effectively destroy the sample. To resolve the
velocity without destroying the sample non destructive ultrasonic equipment was utilized and the
procedure is documented in this report.
Material Velocity Formulas:
E = Youngs modulus
(p) Rho = Material density
V = Poissons Ratio
Velocity = (delta) x (distance)
(delta) (time)

Material Velocity Simplified:
Take for instance a Slinky, stretch it out and quickly apply a jolt of movement to one side and that
energy propagates through the Slinky and returns to where the incident load was transferred. Now,
take a spring, similar to a slinky, but made of thicker more tense material and apply the same jolt,
or load and it can clearly be seen that the same load does not propagate at the same rate but is
attenuated (gradual loss of intensity through a medium) more quickly. Best explained by the title of
the 1983 song “One Thing Leads To Another” by the band The Fixx.

Hookes Law:
In mechanics, and physics, Hooke's law of elasticity is an approximation that states that the
extension of a spring is in direct proportion with the load applied to it. Many materials obey this
law as long as the load does not exceed the material's elastic limit. Materials for which Hooke's law
is a useful approximation are known as linear-elastic or "Hookean" materials. Hooke's law in simple
terms says that strain is directly proportional to stress.
Mathematically, Hooke's law states that
F = -kx
where
x is the displacement of the spring's end from its equilibrium position (a distance, in SI units: m);
F is the restoring force exerted by the material (in SI units: N or kg·m·s-2); and
k is a constant called the rate or spring constant (in SI units: N·m-1 or kg·s-2).
When this holds, the behavior is said to be linear. If shown on a graph, the line should show a direct
variation. There is a negative sign on the right hand side of the equation because the restoring force
always acts in the opposite direction of the displacement (for example, when a spring is stretched
to the left, it pulls back to the right).
Hooke's law is named after the 17th century British physicist Robert Hooke. He first stated this law
in 1660 as a Latin anagram,[3] whose solution he published in 1678 as Ut tensio, sic vis, meaning,
"As the extension, so the force".

Ultrasonic Transducer Basics:
The velocity of a material is given by (distance divided by time). It is simply the rate at which a
given energy in this case sound (768 mph), displaces particles or attenuates in a medium once it is
transferred. This energy may also be reflected inversely when it reaches an interface of different
material or geometry. More specifically as pertaining to metal it is given by a ratio related to
Poisson’s ratio, Bulk modulus, Shear modulus, and Young’s modulus. This is used to create a rate
such as inches per microsecond. Due to owner restrictions the mentioned measurements could not
be performed on the calibration block because they would effectively destroy the sample. To
resolve the velocity without destroying the sample non destructive ultrasonic equipment was
utilized and the procedure is documented in this report.
“Pip”

Effect of Temperature on Material Velocity:
As metal raises in temperature the electrical bonds between the atoms within it expand causing the
materials velocity to decrease compared to its ambient temperature status. The inverse is true
when the temperature of metal is lowered past its ambient temperature. To combat these adverse
conditions the test sample was placed in a refrigeration unit for approximately 30 minutes until it
reached an the ambient temperature range of 82 degrees Fahrenheit indicating optimal testing
conditions.
Material Velocity Evaluation Procedure, Part 1:
A 5 mHz transducer was used with a Epoch LTC Olympus ultrasonic flaw detection unit. The
procedure consisted of coupling the transducer to each of the 6 sides of the calibration block in 9
separate orientations, then calibrating the flaw detection unit to read double the value of the
calibration blocks thickness at that orientation which elicits a more accurate reading of material
velocity when dealing with 2 materials connected to each other. However, the first reading taken
through only the Inconel 625 side and the thickness and velocity were taken from the first pip. This
yielded a material velocity reading of .2293 In/ per microsecond.
GE / 5 mHz/ .25” Diamter Transducer used for readings

Material Thickness Verification/ Material Velocity Evaluation, Part 2:
The second reading was taken from the 1 inch thick orientation through the .25” Inconel and .75”
carbon steel, and a velocity reading was taken where the detection unit indicated through a pip the
interface between the Inconel and carbon steel and where it indicated the total thickness in relation
to orientation which was 1 inch. The material velocity at the .25” interface was found to be .2323
inches per microsecond.

Material Velocity Evaluation Procedure, Part 3:
The next 4 material velocity readings were taken in conjunction with the hardness readings that
were taken near 5.4” , 4.8”, 4.5”, and 4.1”.
Reading 1 @ 4.1” (carbon steel) - .2298 in/ us
Reading 2 @ 4.5” (carbon steel) - .2329 in/ us
Reading 3 @ 4.8 “ (carbon steel HAZ) - .2331 in/ us
Reading 4 @ 5.4 (Inconel quench zone) - .2298 in/ us
1
2
3
4

Material Velocity Evaluation Procedure, Part 4:
The next 4 velocity readings were taken in conjunction with the material hardness readings taken
at 5.0”, 5.2”, 5.5” , and 5.8”.
Reading 1 @ 5.0” (carbon steel) .2313 in/ us
Reading 2 @ 5.2” (carbon steel HAZ) .2328 in/ us
Reading 3 @ 5.5” (Inconel HAZ) .2334 in/ us
Reading 4 @ 5.8” (Inconel weld metal) .2377 in/ us

Material Velocity Evaluation Procedure, Part 5:
The next 4 velocity readings were taken in conjunction with the material hardness readings taken
at 3.9”, 4.1”, 4.4” , and 4.8”.
Reading 1 @ 3.9” (carbon steel) .2324 in/ us
Reading 2 @ 4.1” (carbon steel) .2327 in/ us
Reading 3 @ 4.4 (carbon steel) .2324 in/ us
Reading 4 @ 4.8 (interface) .2324 in/ us

Material Velocity Evaluation Procedure, Part 6:
The next reading was taken from the carbon steel side with the test sample in the flat position with
the transducer approximately 1.5” away from the interface of the 2 materials. The pip representing
the Inconel interface was used to take the velocity reading.
Reading @ 1.5” from interface (c/s to Inconel) .2028 in/ us

Material Velocity Evaluation Procedure, part 7:
The next reading was taken from the carbon steel side with the test sample in the flat position with
the transducer approximately 1.5” away from the edge of the block. The pip representing the total
thickness was used to take the velocity reading.
Reading @ 1.5” away from edge (c/s to Inconel) .2326 in/ us

Material Velocity Evaluation Procedure, Part 8:
The next reading was taken from the Inconel side with the test sample in the flat position. The
Transducer placement was approximately in the middle of the block. The pip representing the
Inconel interface was used to evaluate material velocity.
Reading @ middle of block (Inconel to c/s) .2804 in/us

Material Velocity Evaluation Procedure, Part 9:
The next reading was taken from the Inconel side with the calibration block in the flat position. The
Transducer placement was approximately in the middle of the block. The pip representing the
thickness of the calibration block was used to evaluate material velocity.
Reading @ middle of block (Inconel to c/s) .2300 in/ us

Material Velocity Evaluation Procedure, Part 10:
The next reading was taken from the carbon steel side with the block in a standing position. The
transducer was placed approximately in the middle of this surface and the velocity reading was
taken for the pip representing the Inconel interface
Reading @ middle (c/s to Inconel) .2707 in/ us

Material Velocity Evaluation Procedure, Part 11:
The next reading was taken from the carbon steel side with the block in a standing position. The
transducer was placed approximately in the middle of this surface and the velocity reading was
taken for the pip representing the total thickness given the orientation.
Reading @ middle (c/s to Inconel) .2312 in/ us

Material Velocity Evaluation Procedure, Part 12:
The next reading was taken from the Inconel side with the block in a standing position. The
transducer was placed approximately in the middle of this surface and the velocity reading was
taken for the pip representing the carbon steel interface.
Reading @ middle (Inconel to c/s) .2325 in/ us

Material Velocity Evaluation Procedure, Part 13:
The next reading was taken from the Inconel side with the block in a standing position. The
transducer was placed approximately in the middle of this surface and the velocity reading was
taken for the pip representing the total thickness based on orientation.
Reading @ middle (Inconel to c/s) .2676 in/us

Material Velocity Compared to Hardness Readings:
The analysis of material velocity readings versus hardness readings revealed that there is a
distinctive drop in material velocity in the quench zone and heat affected zone on the Inconel side.
The reason for this can be seen in the micrographs as a drastic change in grain size which causes
any energy passing through it to be attenuated more rapidly.

Conclusions:
The information generated by this report aims to determine the effects of weld zone variables and
increase reliability by generating data that can be used to simplify many complex inspection
problems. As the San Jacinto College NDT department looks towards the future a supplemental
study of shear wave velocity and refraction in weld zones between two different materials should
be completed as this can present a cumbersome task for even the most seasoned technician during
field conditions.
References:
www.ndt.net
www.ndt-ed.org
www.wikipedia.org
www.sanjac.edu/areas-study#non-destructive-testing-technology
www.olympus-ims.com
http://www.auto-met.com/Rockwell_hardness_tester/ASTM_Hardness_Chart.htm


![METALLOGRAPHIC ETCHING REAGENTS I, · PDF fileLoZi'S] MetallographicEtchingReagentsforCopper 643 typicalofthesemaybementionedtheworkofStead,^ofRosen](https://img.dokumen.tips/doc/110x75/5abe18367f8b9aa15e8c6682/metallographic-etching-reagents-i-s-metallographicetchingreagentsforcopper.jpg)