Embed Size (px)
Citation preview

i
Lõrincz Máté János
Students Energy Saving Behavior
Case study of University of Coimbra
2011

ii
Acknowledgments
I would like to express my gratitude to all people who helped me in some way to develop this master
thesis.
First of all, I would like to thank my supervisor Prof. Patrícia Pereira da Silva for academic guidance,
scientific and technical support. Her constant availability, encouragements were crucial for this project.
My gratitude to Prof. António Gomes Martins; Prof. Humberto Jorge; Prof. Álvaro Gomes and Ana
Ramos, for their support in the preliminary phase of the project.
A special thanks to my colleagues for their support and suggestions.
Also, I would like to express my appreciation to students from University of Coimbra, for their
invaluable help and kindness in filling in the online survey.
Last but not least, I would like to acknowledge the support, patience and encouragement of my family,
especially from Melinda, friends (for the “white nights” spent with proofreading an earlier version of this
thesis) and everyone else, who kept sending me messages asking “Have you already finished your
dissertation?”

iii
Abstract
According to Portuguese Directorate-General for Geology and Energy, renewable energy in Portugal
was the source for 52% of country’s electricity generation in 2010 [DGGE 2010, page 6]. The current
Portuguese policy makers in the energy area argue that the story behind Portugal’s success lies in government
led initiatives in forms of efficient energy policies, which not only influenced the adoption of renewable
technologies but also encouraged people to adopt a more energy efficient behavior.
In the context of a new consciousness around a difficult but desirable environmental, economic and
economic equilibrium, consumer behavior plays a very important role.
The overall purpose of this study is to analyze the influence of Energy or Environmental lectures
(or both) on university students’ intention to pursue energy saving measures, because they will, in the short
run, represent a relevant part of the future end-user consumers and bill-payers and will drive changes in the
patterns of energy consumption.
An online survey (N=1582) on students’ energy saving behavior was conducted to predict students’
intention to perform energy saving measures. Based on the received responses, two groups of students were
formed: one, with students who had access to one or more Energy or Environmental (or both) lectures and,
another, with students who did not have access to Energy or Environmental (or both) lectures. This research
departs from AJZEN (1988) Theory of Planned Behavior. According to this theory, students intention to
conserve energy was compared between the groups; energy saving advice influence on students’ intention to
save energy was analyzed but also the choice between traditional light bulbs and energy saving bulb based on
price was discussed.
Final findings show that Energy lectures stand as long term measures that influence students’ intention
to engage in energy saving measures. Energy lectures seem to increase student confidence and strengthen the
social pressure of the intention to engage in energy saving measure. They have stronger influence on students’
energy saving intention than the television campaigns, for instance.
Measuring the price influence on students’ intention to peruse energy saving measure it was identified
that those students who have access to Energy or Environmental lectures (or both) could estimate correctly the
price between a traditional and energy saving bulb and have higher intention to engage in energy saving
measures.
Furthermore, several interviews with staff in charge of energetic measures at European Universities
were conducted to identify energy saving incentives and future measures are proposed to reduce energy
demand.
Keywords: sustainability; energy; TPB; students

iv
Table of Contents
Acknowledgments ...........................................................................................................................................ii
Abstract ......................................................................................................................................................... iii
List of Tables................................................................................................................................................. vii
List of Figures and Equations .....................................................................................................................viii
List of Graphs ................................................................................................................................................ ix
Abbreviations .................................................................................................................................................. x
Introduction . ……………………………………………………………………………………………….......11
Chapter I - An Overview of the Portuguese Electricity Market…………………………….........................13
Chapter II - Definitions of Sustainable Consumption.....................................................................................16
2.1. Individual Consumer Behavior in Socio-Economic and Psychological Studies ..................................... 17
2.2. Individual Consumer Decisions in Different Context ............................................................................ 20
2.3. Studies on Behavioral Energy Consumption ......................................................................................... 21
2.4. Common Factors Acting on Sustainable Energy Consumption ............................................................. 30
2.5. Conclusions .......................................................................................................................................... 31
Chapter III - Theory of Planned Behavior ............................................................... ………………………32
3.1. Statistical Support for the Theory of Planned Behavior…………………………….…………...............35
3.2. Measurement of the Components-Theory of Planned Behavior by the Questionnaire……………….....35
3.3. Questionnaire Design ........................................................................................................................... 37
3.4. Reliability of the Questionnaire ............................................................................................................ 38
3.5. Conclusion ........................................................................................................................................... 39
Chapter IV – Discussion ............................................................................................................................... 40
4.1. Demographics ...................................................................................................................................... 40
4.2. Conclusion – Demographics ................................................................................................................. 45
4.3. Source of Energy Saving Advice .......................................................................................................... 46
4.3. Conclusion - Source of Energy Saving Advice ..................................................................................... 52
4.4 Electricity Bill Payer ............................................................................................................................. 53
4.5 Conclusion Electricity Bill Payer ………………………………………………………………………...55

v
4.6. Choice between Traditional Light Bulb and Energy Saving Light Bulb ………………………………...55
4.7.Conclusion - Choice between Traditional Light Bulb and Energy Saving Light
Bulb…………………………………………………………………………………………………………...57
Chapter V - Determinants of Students Energy Savings: An Application of the Theory of Planned
Behavior………………………………………………………………………………………………………...58
5.1. Energy Saving Behavior . ………………………………………………………………………………...58
5.2. Energy Saving Intention ....................................................................................................................... 59
5.3. Energy Saving Attitude (Indirect Measures) ......................................................................................... 59
5.4. Energy Saving Attitude (Direct Measures) ............................................................................................ 61
5.5. Subjective Norm................................................................................................................................... 62
5.6. Perceived Behavioral Control (Indirect Measure) ................................................................................. 63
5.7. Perceived Behavioral Control (Direct) .................................................................................................. 64
5.8. Conclusion ........................................................................................................................................... 65
Chapter VI – Hypothesis Tests ................................................................................................ ……………..66
6.1. Statistical Analysis of the Attitude towards Behavior, Subjective Norm and Perceived Behavioral Control
on the General Group of Students (N = 1535) .............................................................................................. 66
6.2. Comparisons between Different Groups of Students ............................................................................. 66
6.3. The Influence of the Television on Energy Saving Advice on Different Groups ................................... 75
6.4. Price influence in Purchase Decision .................................................................................................... 80
6.5 Changes in Energy Saving Intention over the Years ............................................................................... 84
6.6. Conclusions .......................................................................................................................................... 87
Chapter VII- Energy Efficiency at European Universities ......................................................................... 89
7.1. Implementation of Low Cost Measures ................................................................................................ 89
7.2. The Use of Metering Systems and the Implementation of Incentive Systems ........................................ 90
7.3. Changes in Building Infrastructure ....................................................................................................... 92
7.4. Conclusions .......................................................................................................................................... 93
Chapter VIII – Conclusions and Recommendations ................................................................................... 94
8.1. Conclusions .......................................................................................................................................... 94
8.2. Recommendations and Limitations ....................................................................................................... 99

vi
Bibliography ............................................................................................................................................... 101
Annex .......................................................................................................................................................... 110
Index ............................................................................................................................................................ 111

vii
List of Tables
Table 1. Four-fold typology of behaviors ....................................................................................................... 18
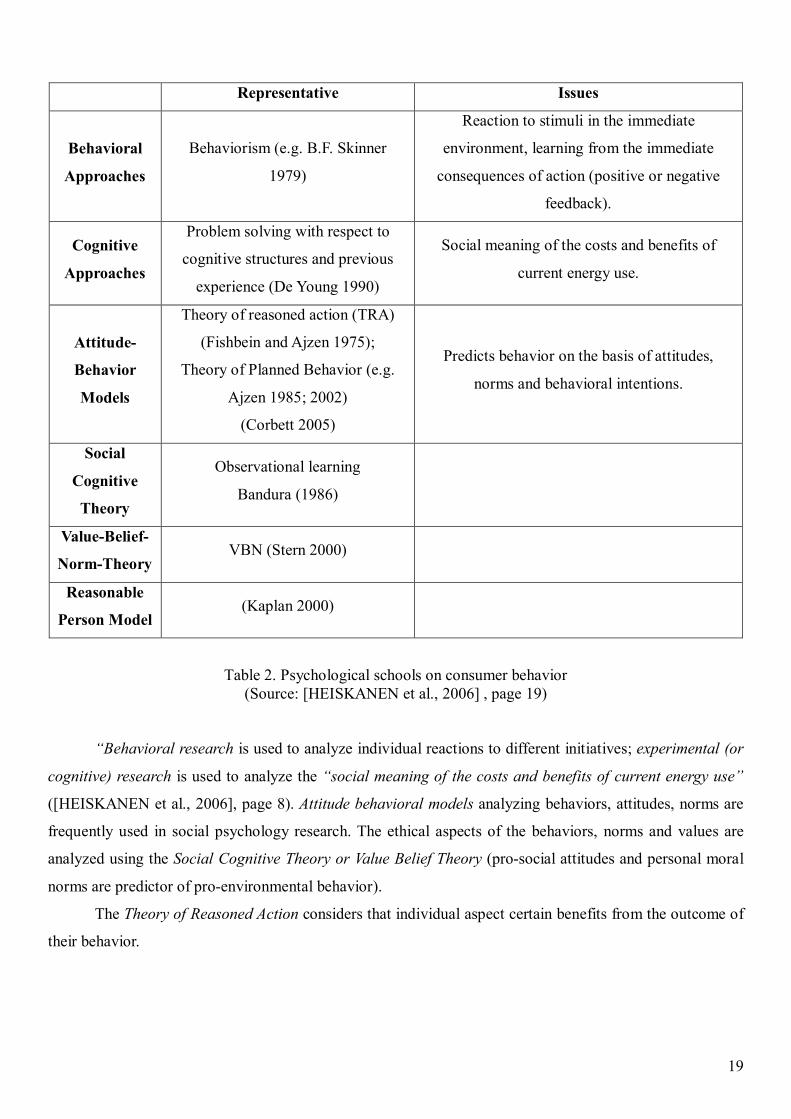
Table 2. Psychological schools on consumer behavior.................................................................................... 19
Table 3. Demographic Profile of Survey Respondents .................................................................................... 45
Table 4. Summary of the Energy Saving Advice Frequency ........................................................................... 52
Table 5. Summary of the Results of the Choice between Traditional Light Bulb and Energy Saving Light Bulb .......... 56
Table 6. –Way ANOVA – Attitude toward Behavior (Direct Measures) ......................................................... 67
Table 7. One –Way ANOVA – Attitude toward Behavior (Indirect Measures) ............................................... 68
Table 8. One –Way ANOVA – Attitude toward Behavior Indirect and Direct Measures................................. 69
Table 9. One –Way ANOVA – Subjective Norm Indirect Measures ............................................................... 69
Table 10. One –Way ANOVA – Perceived Behavioral Control Indirect Measures ......................................... 70
Table 11. One –Way ANOVA – Relationship between Behavior and Perceived Behavioral Control .............. 71
Table 12. Environmental and Energy lectures Influence on Energy Saving Behavior (Indirect Measures) ...... 72
Table 13. Means and Standard Deviations of the Intentions, Behaviors, Attitudes, Subjective Norms and
Perceived Behavioral Controls between the Two Groups of Students .............................................................. 73
Table 14. Influence of Equal Comparison Group Samples on Intention, Behavior, Attitude, Subjective Norm
and Perceived Behavioral Control Means. ....................................................................................................... 74
Table 15. Comparison of the Means and Standard Deviations of the First Group (Environmental or Energy (or
both)) on the Intention to Save Energy ............................................................................................................ 75
Table 16. Results from Group Comparisons of the Energy Saving Advice from Television ............................ 76
Table 17. One –Way ANOVA - Energy Saving Advice from the Television .................................................. 77
Table 18. Energy Saving Advice from the Television (Second Group - Indirect Measures) ............................ 78
Table 19. Influence of the Environmental or Energy lectures (or both) and Energy saving Advice from the
Television on Intention, Behavior, Attitude, Subjective Norm and Perceived Behavioral Control in the Case of
Equal Sample Sizes ........................................................................................................................................ 79
Table 20. Results from Group Comparisons of Energy or Environmental lectures (or both) and Energy Saving
advice from Television on Students Intention to Perform Energy Saving Behavior ......................................... 80
Table 21. One –Way ANOVA- Price Influence on Energy Saving Intention.................................................. 81
Table 22. Results from Group Comparisons on the Cost of an Energy Saving Light ....................................... 82
Table 23. Comparisons of Equal Groups Means on the Cost of an Energy Saving Light Bulb ........................ 83
Table 24. Results from Group Comparison of Beginning of Education at the University. ............................... 84
Table 25. One- Way ANOVA - Beginning of the Study Influence on Energy Saving Behavior ...................... 85
Table 26. Results from Group Comparison of University Graduation ............................................................. 85
Table 27. One- Way ANOVA - End of the Study Influence on Energy Saving Behavior ................................ 86

viii
List of Figures and Equations
Figure 1. Portuguese Electricity System in 2008 ......................................................................................... 13
Figure 2. A linear and techno-economic model of technology transfer ........................................................ 26
Figure 3. RUBIK (2000) categorization of environmental product information scheme ............................... 29
Figure 4. The Theory of Planned Behavior .................................................................................................. 33
Equation 1. Computation of Attitude toward Behavior ............................................................................... 33
Equation 2. Computation of Subjective Norm ............................................................................................ 34
Equation 3. Computation of Perceived Behavioral Control ........................................................................ 34

ix
List of Graphs
Graph 1. Student access to Environmental Course based on their study area. .............................................. 41
Graph 2. Student access to Energy Course based on their study area. .......................................................... 41
Graph 3. The Q-Q Plot of the Energy Saving Behavior (N = 1582 responses) ............................................. 58
Graph 4. The Q-Q Plot of Intention (N = 1582 responses). ......................................................................... 59
Graph 5. The Q-Q Plot of Attitude toward Energy Saving(N = 1582 responses) ......................................... 61
Graph 6. The Q-Q Plot of Attitude toward Energy Saving(N = 1582 responses) ......................................... 62
Graph 7. The Q-Q Plot of Subjective Norm (N = 1582 responses) .............................................................. 63
Graph 8. The Q-Q Plot of Perceived Behavioral Control(N = 1582 responses) ............................................ 64
Graph 9. Histogram Perceived Behavioral Control (Direct Measure, N = 1519 responses) ......................... 64

x
Abbreviations
ATT Attitude toward Behavior
BEH Behavior
F F-ratio (test statistic used in ANOVA)
INT Intention
M Mean
n.s. Non Significant
N Sample Size
p Probability (the probability value, p-value or significance of a test are usually denoted
by p)
PBC Perceived Behavioral Control
R The multiple correlation coefficient
SD Standard Deviation
SN Subjective Norm
SPSS Statistical Package for the Social Sciences
TpB Theory of Planned Behavior

11
Introduction
Several studies have identified that citizens are aware of the benefits of using energy more
efficiently, but a variety of social, economic or cultural factors discourage them from doing so
[MARTISKAINEN, 2007][BROHMANN et al., 2009]. Identifying people energy-saving behaviors is a
difficult task, but the observed behaviors may result in behavioral changes.
Moreover, an increasing number of energy policies and programs account for consumer behavior
based on social and behavioral research. Policies designed to encourage energy-saving behavior need to
target specific actions, to identify the barriers to these actions and to propose solutions to overcome the
identified problems.
Hence, behavioral science and energy use are beginning to play a key role in solving the energy
dilemma in the framework of the current economic context, in Europe and, namely, in Portugal.
This work tries to contribute to enlighten energy policy makers and university board members on
students’ energy consumption behaviors.
Universities are powerful independent institutions that benefit society and are extremely important in
the diffusion and application of the sustainability concept. The University of Gloucestershire (United
Kingdom), for example, considers that “The University can best serve its local communities and enable
sustainability to become reality and when it engages staff and students in partnership activities with local
groups and businesses. Local collaborations and local action are key priorities for sustainability, and the
University campuses are an important resource to be harnessed for promoting such projects.” [UoG, 2011]
Today several Universities offer degrees on Renewable Energy, Environmental Risk Assessment,
Sustainable Development or Energy for Sustainability. But do the lectures included in their study plans
really influence student’s behavior to conserve energy at the University or in their private lives?
Are Energy or Environmental lectures (or both) institutional prerogatives in defining University
energy policy?
This thesis (developed in a four month period!) is a contribution to the analysis and a tentative
answer of these questions.
The first part of the thesis focuses on the theoretical background concerning energy saving behavior
concepts. Then, an overview over the Portuguese electricity market is provided, followed by studies on
individual decision of energy consumers and their relationship to sustainable consumption.
The second part of this thesis has a more practical character. The development of strategies to change
energy consumer behavior requires an understanding of both the behavior and the influencing factors (in
particular, beliefs, attitudes, and social influences). The Theory of Planned Behavior (TpB) is one of the
most used and accepted models of the intention-behavior relationship [AJZEN, 2002] . TpB is considered to

12
be the most predicative persuasion theory, i.e., it is a theory that measures the link between attitudes and
intention. Consequently, we hypothesized that students who have access to Energy or Environmental
lectures (or both) would have a higher intention to engage in energy saving behavior then the others. To test
the hypotheses we surveyed students attending University of Coimbra1 during the school year of 2010/2011,
obtaining 1581 valid questionnaires. The questionnaire measured behavioral intention, attitude towards
behavior, behavioral beliefs, normative beliefs, subjective norms, perceived behavioral control and behavior
to perform energy saving measures.
We identified that students who have access to Energy or Environmental lectures (or both) have a
higher intention to engage in energy saving measures than the others.
We also measured the influence of the energy saving advice received from television on different
groups of students and we found that an increased frequency of energy saving advice has a passive influence
on the student energy saving behavior.
Also the energy saving advice from the television has a smaller influence on student’s intention to
engage in energy saving measure then the Environmental or Energy lectures (or both).
Further we identified that student attitude, confidence, subjective norm increases over the years; and
with monetary rewards they can be influenced. Several interviews with persons in charge of energetic
measures at European Universities are used to evaluate the actual situation and future measures are proposed
to reduce energy demand.
Based on the theoretical findings of the first part of the thesis and practical examination of the
second part, recommendations will finally be given of possible other electricity saving measures at the
Universities.
1 University of Coimbra has around 20000 students (Source: University of Coimbra, http://en.wikipedia.org/wiki/University_of_Coimbra)

13
Chapter I - An Overview of the Portuguese Electricity Market
The electricity sector in Portugal is organized in accordance with the laws and principles set by
Decree-Law No. 182/95, of 27 July, amended by Decree-Law 29/2006, of 15 February.
The Directorate-General of Energy and Geology (DGEG) through the Ministry of Economy is
responsible for conceiving, designing, assessing, advising the Government on energy related policies.
Figure 1.Portuguese Electricity System in 2008
(SOURCE: [AMORIM et al. 2010])
The National Electricity System (NES) can be divided into five major functions: generation,
transmission, distribution, supply, and market operations [REN, 2010] .
In Portugal, the production of electricity is nowadays a liberalized activity (or market-based), but is
subject to licensing and is carried out in a competitive environment. Electricity generation is performed with
the use of several different technologies and energy sources that are divided into two categories: ordinary
regime (which refers to the generation of electricity through traditional non-renewable sources and large
hydro-electric plants) and special regime (in mini-hydro, cogeneration, producers at low voltage up to 150
kW, as well as from other renewable energy). Environmental concerns led to the creation of incentives that
promoted the production of electricity through renewable resources.
In 2010 the renewable energy in Portugal accounted 52% of the country’s electricity generation
(DGGE, 2010, page 6). Thus, in recent years; there has been a very significant increase in the use of sources
of renewable in electricity generation, expressly wind. Despite these figures, Portugal is still not self-
sufficient in energy production. Currently, the main producers of electricity in Portugal are EDP Production,
EDIA, Tejo Energia and Turbogás, which can sign contracts with suppliers and end customers, or may
Technical Management
Ordinary Regime Special Regime Interconnection Generation
Transmission
Distribution
Supply
Transmission Network
Distribution Network
Retailer of last resort
Electricity market
Free retailer
Consumer of last resort Free consumer
Market operation
National Electricity System (NES)

14
participate in organized markets. Also the special regime allows them to sell the electricity they produce
from the supplier of last resort2.
The energy transportation in Portugal is managed by the National Transmission Grid, through an
exclusive concession granted by the Portuguese State to REN (Redes Energéticas Nacionais) on June 15,
2007 for a 50-year period.
Today REN not only fits the role of the physical operator of the system (providing a link between the
production and distribution via the transport function), but as well as the role of an economic operator (being
the only buyer of energy producers).The National Transmission covers almost the entire national territory,
having also some points of interconnection to the Spanish system, allowing the exchange of electricity in
Iberia. These networks meet the quality standards established in Regulation of Quality of Service and allow
access to all interested parties in a non-discriminatory and transparent way.
The distribution of electricity is carried out through the National Network Distribution. Currently the
electricity distribution (in high and medium voltage) is undertaken by EDP Distribuição. The operation of
low voltage distribution grids is based on contracts between local governments and distributors.
The electricity supply is open to competition, and is subject only to a licensing regime. Consumers
may choose and change their supplier of electricity without paying any type of additional charge. Also they
can purchase electricity directly from producers, traders or through organized markets. The process of
changing supplier is provided by an independent entity with the scope to overcome the logistical operations
that facilitate switching suppliers for consumers.
The electricity supply to Public Electric System (SEP) is assured by the suppliers of last resort, who
are required to assure universal installment of the supply of electricity to all who request it, and practice a
selling price set by ERSE (Entidade Reguladora dos Serviços Energéticos).
The Non-Linked Electricity System (SENV) consists of traders who can buy and sell electricity
freely, paying access charges to the transmission and distribution defined by ERSE. Among the major
retailers are EDP, Endesa, Iberdrola, Union Fenosa, EGL and Galp Energy.
Legislation obliges all retailers to comply with certain standards regarding the quality of service and
provide information to consumer. This includes information on the general services, tariffs and prices, on the
efficient and rational use of resources. This information must be provided in a not discriminatory,
transparent manner.
Trading electricity is an activity of buying and selling electrical energy. In a liberalized market
trading constitutes the same approach: customers are free to choose their supplier, further they can change
supplier according to the provider that meets up their needs.
2 Supplier of the last resort means that they “Can refer to either an energy supplier who is automatically assigned to serve an existing customer immediately following deregulation, or an energy supplier who must supply a given classification or sub classification of customers who may not be able to acquire energy from any other provider. In most cases, the supplier of last resort is the utility company that the customer used before deregulation”, Energy Dictionary http://www.energyvortex.com/energydictionary/supplier_of_last_resort.html

15
Two different markets were developed to trade electricity: Non-Organized (or Bilateral Trading) and
Organized Trading. The first one (Non-Organized) also known as Over-the-Counter (OTC) meaning that the
transactions are carried out directly between the parties involved, without a clearing house and where the
contracts are not regulated. On this market electricity is traded either by means of physical delivery or by
using financial contracts (Forwards and Option contracts). The second (Organized Trading) is a structured
market, organized in Power Exchanges or Power Pools. The trading procedures and the structural conditions
to operate are established by the market rules.
The management of organized electricity markets in Portugal is a market-based activity based on the
responsibilities of market participants. As mentioned earlier, both the producers and the traders may become
members of these markets and are subject to authorizations granted jointly by the Minister of Finance and by
the Minister of Economy responsible for the energy sector.
To ensure that these activities take place without abuse of the National Electric System, and within
the legal parameters, to ensure the efficiency and rationality of operations in terms of transparency, non-
discrimination and competitive, there needs to be regulation on transport activities, distribution and supply
of last resort, as well on logistics operations, changing supplier and market management.
In Portugal, the regulation of the electricity sector is attributed to the ERSE (Entidade Reguladora
dos Serviços Energéticos) which, as described in Article 3 of Decree-Law No. 97/2002 of April 12, serves
not only to ensure that the entire population is served in a continuously and non-discriminatory manner, the
minimum standards of quality and security of supply are respected, but also to set rules and obligations, to
promote price transparency and confidence to consumer and to prevent abuse of dominant position and
“predatory behavior”.
It is still a function of the regulatory authority to protect consumers' interests, to promote access to
information and to promote effective competition in order to get either a higher performance of the regulated
companies or a greater satisfaction of end customers. Other additional functions are the promotion of
environmental performance in transmission and distribution; loss reduction in electrical power and active
distribution networks to better serve the market.

16
Chapter II - Definitions of Sustainable Consumption
Sustainable development is vital for a green and protected future. The idea behind sustainable
development is very simple:”it is about ensuring a better quality of life for everyone, now for generations to
come” [UNESCO, 2005] In 1987 the United Nation World Commission on Environment and Development
(WCED) elaborated “Our Common Future” best known as the “BRUNDTLAND REPORT” that defines
sustainable development as: “Development that meets the needs of the present without compromising the
ability of future generations to meet their own needs. It contains within it two key concepts: (1) the concept
of “needs”, in particular the essential needs of the world’s poor, to which overriding priority should be
given; and (2) the idea of limitations imposed by the state of technology and social organization on the
environment’s ability to meet present and future needs” [WCED, 1987] .
Particularly sustainable development means delivering economic growth in the form of higher living
standards while preserving the environment. The objectives of sustainable development are: social progress
based on people needs (for instance reduction of unemployment, pollution, etc.); active protection of the
environment (for instance climate change, protection of wildlife); wise use of natural resources (for instance
renewable sources) and support of high and stable levels of economic growth and employment (for instance
high quality goods) [UK FORESTRY, 2010] .
It is suggested that consumption is fundamental in achieving a sustainable development; otherwise
unsustainable consumption might be one of the causes for the climate change and pollution.
Sustainable consumption is “the use of goods and services that respond to basic needs and bring a
better quality of life, while minimizing the use of natural resources, toxic materials and emissions of waste
and pollutants over the life cycle, so as not to jeopardize the needs of future generations” [IISD, 2010] .
But is sustainable consumption a support for consumer behavior change? Individual consumption
behavior is driven by a variety of factors such as lifestyles, habits, and routines; hence consumer behavior
change is faced with a large variety of actions and needs of modification. However, it is suggested that
changing to a sustainable consumption behavior requires more than rising awareness among consumers, it
requires new product policies or the existence of sustainable supply.
JACKSON (2005) defines sustainable behavior as “a function of partly attitudes and intentions,
partly of habitual responses, and partly of the situational constraints and conditions under which people
operate” [JACKSON, 2005]
Individual energy consumer behavior is restricted to a specific context that characterizes a part of his
or her energy consumption (for instance, he may be a rent payer and may not be interested in energy

17
savings). Most of the studies refer to private household’s energy conservation3. Specific research on
student’s electricity saving behavior in the University context could not be found the literature. Therefore we
assume that the behavior of students in the University is similar to the behavior of the same group of
individual in their private ambience.
The next section analyzes individual consumer decision and its relationship with sustainable
consumption.
2.1. Individual Consumer Behavior in Socio-Economic and Psychological Studies
The structure of this part is as follows: first consumer decision models are presented (consumer
sovereignty and bounded rationality model) followed by JAGER (2000) classification of the consumer
behavior; finally the common psychological models used to analyze the consumer behavior are referenced.
The first consumer decision model was developed based on the belief that people try to maximize
their utility under budget constraints. HANSEN (2007) affirms that “consumers in the market should be
sovereign and that they are indeed sovereign, at least partly. Prerequisites for consumer sovereignty are
freedom of consumption, on the demand side and (perfect) competition, on the supply side. Given their
preferences, consumers can decide which goods they want to purchase at what price” ([HANSEN et al.,
2007] , page 447).
Specifically consumer psychology (individual behavior and habit) decides what will be produced not
the budget constraints.
HERBERT SIMON (in 1957) proposed the “bounded rationality” as an alternative for the
mathematical modeling of decision making. He identified that “rationality of individuals is limited by the
information they have and the finite amount of time they have to make decisions”[WU, 2009] . For instance
someone spills coffee on his shirt in a bar, and immediately goes next door to buy a new one. The best
alternative is to buy the same type of shirt, but his decision is limited by time; hence a cheap shirt is
appropriate. His choice is maybe not the best overall, but it is the best within the current situation. Therefore
people decide rationally only in a limited number of situations, their decision is based on the interpretation
of the present situation.
BROHMANN (2009) propose an economic interpretation to the bounded rationality since “time- and
resource-consuming effort of information can be interpreted as costs” ([BROHMANN et al., 2009] , page
5). After all, the received information helps customer in the decision making process (it is a positive cost),
they conclude that the model of bounded rationality match the approach of consumer sovereignty (in a free
market consumer determine the goods that are produced).
3For more information about the Intervention Studies on Household Energy Conservation please see the attached CD (Information can be found
in Chapter II – Definitions of Sustainable Consumption)

18
Therefore based on the consumer sovereignty each individual itself decides how to maximize
information cost. This also means that information may result behaviors that are not optimal from an
individual perspective (for instance, fast food is cheap (price) but may cause obesity (health)).
In the case of energy consumption this behavior may change influenced by the increasing energy
prices, which may encourage energy-saving behavior. Studies identified that in the case of energy-related
investment, people give more importance to the initial investments (to the money invested to start the
business) than to the gains from cost savings.
The sustainability-oriented approach is concerned with joining the relationship between changed
behavior and individual decisions. Specifically sustainable “consumption in itself is not a behavior, but
rather a consequence of behaviors such as turning the lights off or lowering thermostat levels”
([MARTISKAINEN, 2007] , page 12).
A particularly energy consumption behavior in many cases is based on habits or routines. Analyzing
behaviors JAGER (2000) differentiates between “reasoned behavior” (analyzed by economic models) and
“automated reactions” (habits and routines). Moreover he differentiates between those behaviors and
decisions that are less influenced by the others behavior (individually determined) and those that depend on
the observation of others (socially determined). The result is a four-fold typology of behaviors illustrated by
Table 1.
Table 1. Four-fold typology of behaviors (Source: [MARTISKAINEN, 2007] , page 19)
The analysis of consumer behavior is based on several psychological approaches and identifies the
most common psychological models and approaches applied to analyze consumer behavior, as summarized
in Table 2.
Automated Reactions Reasoned Actions
Individually
determined
Repetition / habit
Conditioning
Deliberation
Planned behavior
Attitudes
Behavioral Control
Socially
determined
Imitation
Social learning/
normative conduct
Social comparison
Relative deprivation / social
comparison
19
Representative Issues
Behavioral
Approaches
Behaviorism (e.g. B.F. Skinner
1979)
Reaction to stimuli in the immediate
environment, learning from the immediate
consequences of action (positive or negative
feedback).
Cognitive
Approaches
Problem solving with respect to
cognitive structures and previous
experience (De Young 1990)
Social meaning of the costs and benefits of
current energy use.
Attitude-
Behavior
Models
Theory of reasoned action (TRA)
(Fishbein and Ajzen 1975);
Theory of Planned Behavior (e.g.
Ajzen 1985; 2002)
(Corbett 2005)
Predicts behavior on the basis of attitudes,
norms and behavioral intentions.
Social
Cognitive
Theory
Observational learning
Bandura (1986)
Value-Belief-
Norm-Theory VBN (Stern 2000)
Reasonable
Person Model (Kaplan 2000)
Table 2. Psychological schools on consumer behavior (Source: [HEISKANEN et al., 2006] , page 19)
“Behavioral research is used to analyze individual reactions to different initiatives; experimental (or
cognitive) research is used to analyze the “social meaning of the costs and benefits of current energy use”
([HEISKANEN et al., 2006], page 8). Attitude behavioral models analyzing behaviors, attitudes, norms are
frequently used in social psychology research. The ethical aspects of the behaviors, norms and values are
analyzed using the Social Cognitive Theory or Value Belief Theory (pro-social attitudes and personal moral
norms are predictor of pro-environmental behavior).
The Theory of Reasoned Action considers that individual aspect certain benefits from the outcome of
their behavior.

20
2.2. Individual Consumer Decisions in Different Context
The purpose of this section is to identify the relationships between individual consumer decisions in
a different environment. Specifically the following characteristics and functions of the consumption
behavior are identified: complexity, nonverbal communication, adaptation (in the sense to conform),
influence of the self esteem (or information), influence of the lifestyle (or information).
Individual choice is influenced by the present circumstances. EBERLE (2004) suggest that there is
no “on-dimensional” consumer behavior, since today individuals pursue “diverse and interdependent mix of
roles as citizen, market participant and employee, and as member of a household or family performing
coordination, repair, provisioning and purchasing functions”([EBERLE et al., 2004] , page 13).
Others argue that nonverbal details of consumption may reveal who we are and how we relate to
other people. Specifically BARTIAUX (2003) underlines the importance of the consumption “as a non-
verbal means of communication: goods allow communication, they create identity and establish
relationship. But also they exclude as well as they include since goods are mean of distinction”
([BARTIAUX, 2003] , page 1240).
DOUGLAS (1979) considers that the consumption role is not to fulfill our “body needs” but rather
its capability to conform. When we are hungry we consider any type of food might be able to satisfy our
body needs, but we are aware that we would not eat human flesh (not because it lacks nutritional value) but
because of our perception on human being. Hence the role of goods: “are needed for making visible and
stable the categories of culture” ([DOUGLAS et al., 1979] , page 59). Moreover “goods in their assemblage
present a set of meanings more or less coherent, more or less intentional. They are read by those who know
the code and scan them for information” ([DOUGLAS et al., 1979] , page 59).
Domestic tasks (housework) may increase people self-esteem or to influence people self-realization
by action. KAUFMANN (1993) in his analysis identifies consumption as a method of identity management:
“Self-esteem is at the origin of every change (…) the demand for acknowledgment overcomes society.
Everyone is on the lookout for approval admiration, and love in the eyes of the others. (…) Without
limitations. (…). The necessity of identity management seems indeed to be powerful explanatory factor of
behavioral change, even when it comes to household chores and every-day routines”([ANDERSEN, 2006] ,
page 24). BARTIAUX (2003) identifies some gender differences how men and women view the electric
appliances: “Housework nowadays implies the use of electric appliances and there are gender differences in
their associated meanings: men are attributing an instrumental value to these objects which represent their
social achievements whereas women more often insist on the objects’ symbolic value that represent affective
ties”([BARTIAUX, 2003] , page 1240).

21
Technological sociologist research on consumption practices are based on consumer lifestyle.
ANTHONY GIDDENS (1991) examines the problems faced by individuals in maintaining self-identities in
today’s modern world. He determines self-identity as: “the self as reflexivity understood by the individual in
terms of his or her biography”([EMILE et al., 2009] , page 6). For GIDDENS (1991) the biggest challenge
to the individual is the fact that “Modernity confronts the individual with a complex diversity of choices and,
because it is non-foundational, at the same time offers little help as to which options should be selected”
([GIDDENS, 1991] , page 80). From this results the supremacy of the lifestyle which “can be identified as a
more or less integrated set of practices which an individual embraces, not only because such practices fulfill
utilitarian needs, but because they give material form to a particular narrative of self-identity” ([GIDDENS,
1991] , page 81)
2.3. Studies on Behavioral Energy Consumption
This part reviews the literature from different disciplines (behavioral psychology, cognitive
psychology and social psychology) that are relevant and applicable in this research.
We will present behavioral studies on energy consumption, particularly we focus on the different
intervention measures such as: commitments, goals settings, information, workshops, mass media, TV,
feedback, rewards, Eco Teams, master meters, etc., applied to change energy consumer behavior. Also
sociological investigations on energy conservation will be reviewed (effect of eco-labeling, lifestyle,
environment, etc.)
The literature identifies three different psychological schools analyzing energy conservation
behavior: behavioral psychology, cognitive psychology (or experimental psychology), and social psychology
(especially attitude-behavior models) ([BROHMANN et al., 2009] , page 8). Almost all focus on the
individual aspect of behavioral change.
Psychologists who investigate energy related behaviors underline the importance of the participation,
social context, as well as the macro-level factors (namely technological development, economic growth,
demographic factors, institutional factors and cultural factors) influence on energy conservation.
ABRAHAMSE (2005) reviews thirty-eight energy related studies applied in the field of social and
environmental psychology. Studies are classified as involving either “antecedent strategies” (i.e.
commitment, goal setting, information, and modeling) and consequence strategies (i.e. feedback, rewards).
The difference of these interventions is that the first one “influence one or more determinants prior to the
performance of behavior”([ABRAHAMSE et al., 2005] , page 275) and that strategies of the second “are
based on the assumption that the presence of positive or negative consequences will influence
behavior”([ABRAHAMSE et al., 2005] , page 278).

22
Antecedent interventions are considered: commitments, goal settings, information and modeling.
Commitments are “oral or written pledge or promise to change behavior” ([ABRAHAMSE et al., 2005] ,
page 275).
KATZEV (1983) analyzed the influence of commitments on electricity consumption, of course
supposing that individual electricity consumption depends on the extent of the energy-related task. They
examined the electricity use of four groups using the following techniques: (1) short questionnaire about
energy use and asking them to reduce their consumption with 10%; (2) a written commitment to save 10%
of electricity and (3) using a “foot-in-the-door” treatment they applied a questionnaire and they requested
individuals to sign a commitment to reduce their electricity consumption by 10%. As a feedback households
received their monthly electric bill. KATZEV (1983) found that participants in the “foot-in-the-door group”
behaved as “conservers” during the 12-week follow-up phase.
However, the actual savings “foot-in-the-door group” was almost similar to the other groups, “their
behavior was consistent with a greater desire to conserve” ( [McCALLEY et al., 2006] , page 130).
Goal setting is similar to the commitment: the defined reference point (for instance to save 10%) on
electricity saving makes the difference. BECKER (1978) experimenting the effectiveness of the goal setting
intervention found that the stated goal should be difficult (less easy) to achieve. In his research he assigned
households with two-reference point in saving electricity. First, they had to save 2% of electricity; later, he
set a more difficult goal to save 20% of electricity. He also provided information on the electricity
consumption of appliances. BECKER (1978) identified that 20% savings proved to be more effective than an
easy 2% saving goal [BECKER, 1978].Hence a goal should have an intermediate level of difficulty.
Information is a frequently used intervention to influence individual behavior on energy efficiency.
Information can be given in several different ways: workshops, mass media campaigns or home audits.
GELLER (1981) studied the effectiveness of seven energy conservation workshops. He conducted
workshops were he surveyed 117 participants applying before-after questionnaires. He identified a
modification in people attitude and behavior in energy conservation. Moreover he continued this
investigation after the workshop; after six weeks he made home visits to approximately half of the
participants and concluded that the workshop had minimal effect on energy conservation behavior. In other
words, there was no relevant difference between attendees and non-attendees based on the number of
adopted energy-saving measure. GELLER (1981) identified that information influence people in energy
conservation, but it does not result in behavioral change [GELLER, 1981] .
STAATS (1996a) identified the effectiveness of a mass media campaign. Moreover they evaluated
the mass media information campaign on the greenhouse effect. During more than two months the Dutch
mass media (national television, newspaper, and billboards) intensively promoted to the public the causes of
greenhouse effect, its consequences and ways of dealing with environmental problems. In their analyses they
used a pre- (965 participants) and post- (704 participants) campaign survey. STAATS (1996a) found that

23
“with the exception of a slight increase of knowledge about the greenhouse effect, no campaign effects were
found for problem awareness” [STAATS et al., 1996a] , page 198). In other words they found that
knowledge and problem awareness are less efficient promoting behavioral change.
MCMAKIN (2002) conducted energy-conservation surveys in two US military installations where
residents do not pay their own utility bills. Specific tailored approaches were used for each installation based
on social-psychological models. They measured before-and-after the energy use and survey was conducted
to measure resident end-use behavior. The residents wanted to do the save energy, to be an example for their
children. MCMAKIN (2002) identified that “some aspects of social-psychological model appear useful in
motivating energy-use behavior change, but others are not as effective ”([McMAKIN et al., 2002] , page
15).
WINETT (1985) used a television channel to broadcast energy saving measures. The programs were
modeled and directed to middle-class homeowners and showed different energy saving behavior. Their
research reported the following: “One viewing of 20-minute TV program resulted in the adoption of some
simple no-cost strategies that yielded overall electricity savings across conditions of close to 10%, with no
reported loss in comfort, and about 23% savings on electricity used for cooling” ([WINETT et al., 1985] ,
page 42). They suggest that TV could possibly be used in a behavior change strategy. However a follow-up
study applied one year later showed that energy savings were not maintained.
The second type of measures –consequence interventions- suppose that the presence of positive or
negative consequences will influence behavior. The most common consequence strategies are feedback and
reward. Feedback consists in “providing households information about their energy consumption or energy
savings” ([ABRAHAMSE et al., 2005] , page 278). They are characterized based on their frequency.
VAN HOUWELINGEN (1989) investigated the effects of continuous versus monthly feedback on
gas consumption. Several identical homes are heated with natural gas in Nieuwegein. Their target group was
325 families separated in two groups: the first group committed themselves to save 10% of gas while the
second group did not agree to the conservation goal. Fifty households received electronic monitor devices to
monitor natural gas use. This so called “Indicator” displayed the daily gas consumption compared with the
conservation goal. The remaining households were divided into two groups: the first received monthly
external feedback and the second monitored their gas consumption based on their utility meters. As result
VAN HOUWELINGEN (1989) found that the self monitoring group, who had the option of checking their
utility meters as frequently as desired, regarding to the other groups managed to achieve an average
reduction of 5,1%. The group that received monthly feedbacks achieved an average reduction of 7,7%. The
greatest average reduction 12% was achieved by the “Indicator” group. However after one year a post
analysis identified that gas use had increase for all groups. VAN HOUWELINGEN (1989) found that “The
Indicator has a positive impact on consumer knowledge of household energy use and helps residence to
reduce gas use” ([VAN HOUWELINGEN et al., 1989] , page 103).

24
STAATS (2004b) investigated “The Eco Team” program by targeting different behaviors related on
waste management, gas, electricity and water use, on transportation and food consumption. They focused on
the relationship between intentions and changes in habitual behavior. Eco Teams are small groups consisting
of six to ten members (like neighbors, friends, church members, etc.). Usually they hold monthly meetings
to discuss experiences, ideas and achievements related to energy-savings. STAATS (2004b) during one year
period applied questionnaire surveys to a total of 60 Eco Teams who committed to save energy. The result
was 20,5% savings on natural gas, 4,6% savings on electricity usage, 2.8% savings on water use and they
reduced their waste with 28,5%. A post-analysis applied after 2 year period measured the following savings:
16,9% natural gas use, 7,6% for electricity use, 6,7% for water use and 32,1% for waste reduction. Hence
long term energy saving measures was maintained. STAATS (2004b) identified that “perceived behavioral
control and habit, two components that have become stronger during participation in the Eco Team
Program, are factors that promote the use of more environmentally friendly transportation means”
([STAATS et al., 2004b] , page 6). In other words durable changes in habits result from a pre-existing
intention to change to sustainable consumption.
MCCLELLAND (1980) conducted an experiment in master-meter apartments. They organized an
energy conservation contest (on natural gas usage) among four apartment buildings. The participants
received weekly feedbacks on their and rival energy savings and practical information on how to save
energy. After every two week of competition the winning building was awarded 80$. After 12 weeks the
competing apartments managed to reduce 6,6% of natural gas consumption which covered the cost of
competition. MCCLELLAND (1980) identified that money factor has a short-term effect on conserving
energy [McCLELLAND et al., 1980] .
KURZ (2002) demonstrates that the rational-economic, social dilemmas, attitudinal, behavioral
approaches to energy saving behavior suffer certain limitation: “These limitations arise primarily, out of
what appears to be a need to explain behavior in a particular way, as opposed to simply trying to explain
behavior” ([KURZ, 2002] , page 276). He suggests four psychological approaches to environmentally
sustainable behavior: 1) rational-economic models, 2) social-dilemmas models, 3) attitude models, and 4)
models based on behavior modification and learning theory; and investigates their application complexity.
KURZ (2002) considers that rational-economic approach limits the motivation of the consumer. As
example when analyzing the contribution of single-occupant motor vehicles to long rush hours, the rational
economic model would not examine such motivations as a sense of personal status, or freedom. Moreover
price increase at the pump will not reduce their gas consumption; they will not change to more
environmental transportation (bicycle, public transport). Social-dilemmas are based on game theory research
and their lack in practical applicability to complex global environmental issues. As example he considers
that game theory presumes that all participants feel the loss of resources equally, which is not true in the real
word: Americans pay less for gas then Europeans. Attitude models approaches fail to predict exactly or to

25
explain behavior. He states that attitudes are considered as “inherently static and separable from the other
aspects of the system” ([KURZ, 2002] , page 269). As example many organizations are promoting water
save devices in households. But if in the newly installed households, people tend to take long, hot showers
maybe the pro-environmental reasons are negligible.
KURZ (2002) proposes a social-ecological framework for analyzing environmentally sustainable
behavior. Moreover the analysis of the environmentally sustainable behavior:” needs to consider the
interaction between the individual and the relevant objects as the unit of analysis” ([KURZ, 2002] , page
269). It is also important to know if individuals “are equipped with the knowledge and skills (i.e.
affectivities) required to utilize objects in such a way as to reduce their environmental impact” ([KURZ,
2002] , page 276).
In sociology the investigation on energy conservation is applied not on individuals, but on society
and social groups or social practices. Sociology investigates the behavior of socio-technical networks: the
technology we use in our everyday life is shaped by social factors. Sociologist considers that the obstacles to
energy efficiency are not only the characteristics of individuals. They suppose asking people to become
aware of their energy consumption means asking people to perform a task what they are not used to do.
Hence energy use is socially invisible.
AUNE (1998) analyzed the influence of lifestyles in energy use. He considers that energy use is a
“determinant and result of different constructions of the material and cultural spheres.” ([PALM, 2009] ,
page 6) She develops a framework on how culture is formed through energy consumption and how energy
consumption is connected with everyday life.
AUNE (1998) considers that a specific mixture is created “through negotiation between individuals
and technologies” ([PALM, 2009] , page 6). Also introduce a new concept “domestication”; which
describes in what way the negotiation are performed “including the practical, symbolic, and cognitive
content of the process” ([PALM, 2009] , page 6). AUNE (1998) defines the notion of energy culture, and
classifies cultures with different implications on energy consumption as: “the self-indulgent” who do not
consider at all their energy consumption, “the environmentalists“ who are involved in ecological problems.
AUNE (1998) research underlines the need of studying symbolic and material conditions involved in energy
use process.
WILHITE (2000) considers “the nature and causes of “energy demand” have been oversimplified,
reduced or ignored in the community of energy research and policy”. They consider that energy-related
social science has “largely been limited to the “behavior” of the “end users” ([WILHITE et al., 2000] , page
1). Although during years several energy efficiency measures were developed the energy demand in the
United States and Europe has increased, moreover there is an increasing need for new policies in climate
change. The new approach should consider not only “prices and degree of consumer awareness, but also on
social norms and a network of social institutions” ([WILHITE et al., 2000] , page 109). In other words with

26
the new approach we would not only analyze decisions on energy conservation but also how people
possibilities are organized by infrastructural networks, and other people decisions at a different points of the
network.
BIGGART (2007) analyses prove that usually policy makers are often sending ordinary energy users
conflicting messages. BIGGART (2007) considers that “Traditional approaches to energy analysis and
policy prescriptions in this sector have relied upon constructs from neoclassical economics regarding
market prices, technical efficiencies, rational calculation, and so on to formulate analyses and
solutions...Unfortunately, these have proven to be of limited value in either explaining or influencing the
behavior of the actors involved…”.
WOOSLEY identified that “...energy use...[is]......now defined largely by economic reasoning ...
[which] ... presupposes an autonomous and rational individual unaffected by others. This simplifying
assumption ignores the impact of social relations...In fact, the role of community and any non-individual
element is not considered” [BIGGART et al., 2007] , page 6).
SHOVE (2000) analyzed the sociology of technology on energy efficiency in buildings. They use a
critical approach to the techno-economical model of technology transfer, which consists of a linear issue
from development to energy-saving action as shown in Figure 2. They identify the “social” or “non-
technical” barriers to be the obstacles for the energy efficiency knowledge into practice.
Figure 2. A linear and techno-economic model of technology transfer
(Source: [HEISKANEN et al., 2006], page 4).
Also they debate the difference between technological, social and political aspects of
energy efficiency; “they argue that these different aspects make up a ‘seamless web’ – thus, there is work for
social scientists in all stages of the production and consumption of energy efficiency knowledge
“([HEISKANEN et al., 2006] , page 4). Hence social scientist should research these new “socio-technical”
networks; they should examine “how tacit knowledge about energy efficiency develops, and how the
adoption of new solutions starts to ‘make sense’ in a specific context” ([HEISKANEN et al., 2006] , page 4).
They suggest that applications of energy efficiency in practice should consider: (1) Participants social
context; (2) “Innovative and valuable practices can also arise from the local context and from users’
everyday experiences” ([HEISKANEN et al., 2006] , page 5) (3) Analyzes of the energy consumer attitude
is less important than the interaction between energy users and the advocate of energy efficient measures.
R&D demon-stration
dissemi-nation
social ornon-technical barriers
energy-saving action

27
In a sociological context, claiming that single issue measures have not led to change in energy use in
the past ([VAN VLIET, 2002] , page 11) debates :“lack a proper scheme for analyzing the interplay
between ‘action’ and ‘structure’ or between ‘micro’ and ‘macro’ levels. Economic models […] do not pay
attention to the ‘motives’ or ‘reasons’ of citizen-consumers behind a certain pattern of behavior. Within the
economic theory of ‘revealed preferences’, everything judged an ‘irrational’ factor is excluded from
conceptual schemes.”
In a recent work WILHITE (2007) argued that technologies play a crucial role in increasing energy
use. The introduction of these technologies may increase energy use “but at the same time create potentials
for new energy intensive practices” ( [WILHITE, 2007] , page 23). He underlined the need for change on
technology and in the social-cultural context. Based on the available energy technology, systems, social
networks and movements the individual behavior is characterized as (efficiency behavior) and routine
behavior (curtailment behavior).
MARTISKAINEN (2007) in his literature review on household energy consumption identifies two
groups of energy saving behavior: (1) Curtailment Behavior (which includes conservation efforts such as
turning appliances off) and (2) Efficiency Behavior (which include buying decisions – addressing the
investment phase). However behavioral researchers could not agree on whether curtailment or efficiency
behaviors are more effective in domestic energy saving [MARTISKAINEN, 2007] .
SCHÄFER (2008) conducts a research on the opportunities for sustainable consumption, they target
people who trapped by circumstances must change their behavior (birth of the first child and relocation).
They assumed that people in these life moments are more open to change to sustainable consumption. Their
approach is based on a theory-based interaction marketing campaign [SCHAFER et al., 2008] .
POORTINGA (2003) measured the adoption of different energy-saving measures. Mainly “they
energy saving measures on acceptability, next to the relationships between preferences for different types of
energy-saving measures and various socio-demographic variables, and environmental concerns of the
respondents”([POORTINGA et al., 2003] , page 59).
During almost 2 months they applied a survey to 455 randomly selected households in Netherlands.
POORTINGA (2003) identified differences in acceptability of energy-saving strategy measures with regard
to age, household type, income, and level of education.
CAREW (2002) applied a questionnaire survey to 52 undergraduate students to measure their
understandings on sustainability. Each of the students had to answer the question “In your own words, what
is sustainability?” They found that “there was substantial variation in the way that our engineering
undergraduate students described sustainability. These descriptions ranged from pre-structural in which
students had only the vaguest notions of what sustainability might be, to extended abstract conceptions
which were structurally sophisticated and included evidence of critical and/or creative thinking about
sustainability.” ([CAREW et al., 2002] , page 358). Hence although today a variety of literature exists on

28
what students should learn in terms of sustainability, only a few researches investigate what students
understand on the subject.
However KAGAWA’s (2007) study on “Dissonance in students’ perceptions of sustainable
development and sustainability Implications for curriculum change” found that more than 90% of students
held a positive attitude towards sustainability, naming sustainability as a “good thing” or declaring
supporters of sustainability[KAGAWA, 2007]
GRAM (2004) research on household energy consumption resulted that electricity consumption
depends on income and age, education, gender, or ethnicity have a small influence. The first target group
included over 50,000 households, and he analyzed the connection between individual electricity and socio-
economic data, building size and type. The second group included 100 households, with electricity
consumption “every 10 minutes during one month for each appliance and for the most lamps” ([GRAM et
al., 2004] , page 3). Survey was conducted to identify the connection between use of appliances and socio-
economic factors, building size and type.
GRAM (2004) found that electricity consumption is “highly dependent on income. Age, education,
gender and ethnicity seem to have very little influence”([GRAM et al., 2004] , page 11). Moreover
analyzing purchasing behavior he found no evidence justifying decisions on environmental concerns. For
instance “Electricity use for refrigerators/freezers and television seems independent of both age and income,
whereas dishwashing, washing/drying, lighting and standby depend both on age and income, whereas
computers depend on income not age” ([GRAM et al., 2004] , page 11).
PEDERSEN (2000) in his analysis assumes that “environmental concern is a factor behind the
consumption of organic food” ([PEDERSEN, 2000] , page 202). Investigating the relationship between
organic food and electricity consumer has found little correlation. He states: “investigation of the social
norms on electricity consumption in the household demonstrates that norms on energy saving exist within
certain situation specific areas, but that these norms are not correlated with the consumption of organic
food” ([PEDERSEN, 2000] , page 207). PEDERSEN (2000) considers that individual purchasing behavior
is not predictable, there is a little connection between “green consumption” and people needs: “different
types of consumption show different possibilities if the social signaling effect shall be used” ([PEDERSEN,
2000] , page 193).
KAENZIG (2006) suggests a “classification for categorizing different cost profiles for eco-
innovation and a conceptual model for the influence of LCC information on consumer decisions regarding
eco-innovation” ([KAENZIG et al., 2006] , page 122). Life cycle cost (LCC) is used for evaluation and
investigation of the environmental impacts of a product or service. He reviews empirical studies
investigating LCC information on consumer investment decision. KAENZIG (2006) finds that “existing
studies report a positive effect of LCC information on the purchase likelihood of eco-innovations.”
([KAENZIG et al., 2006] , page 121)

29
Also the literature considers the importance of eco-labeling for an efficient energy behavior.
Figure 3. RUBIK (2000) categorization of environmental product information scheme
(Source: [LOCK, 2000] , page 3)
Environmental labeling was introduced by the International organization for Standardization (ISO).
There are three types of labeling. The first one provides information on environmental information. The
second is self-proclaimed environmental claim (are used by manufacturers, importers, distributors, retailers).
The third one “is quantified environmental data for a product with preset categories of parameters based on
the ISO 14040 series of standards “ ([DG Environment, 2002] , page 18).
RUBIK (2000) suggest that “eco-labels” to be defined as ISO type one label (Figure 3). They
suggest a new classification of labeling, type one should be divided in two groups: “classical ISO Type Ι
approaches and ISO Type Ι-like labeling which include the major elements of ISO Type Ι systems but in
some sense differs from the classical type” ([RUBIK et al., 2006] , page 13). RUBIK (2000) classification
provides environmental information to producers and consumers. The environmental information may be
administrated: (1) using specific figures (for instance the amount of carbon dioxide emissions), or (2) using
qualitative data to describe certain types of information or (3) by using a graphically designed methods.
Moreover they argue that the Environmental Product Information Scheme should provide reference to
consumer on how to best use a product. RUBIK (2000) concludes that the success or failures of an eco-
labeling scheme is specific for the product group.

30
2.4. Common Factors Acting on Sustainable Energy Consumption
The majority of the studies analyzing consumer energy consumption is applied to household and uses
concepts from economics, psychology and sociology. These analyses on energy-efficient activities typically
consider factors related to: (1) characteristics of occupants, (2) characteristics of the residence, (3)
characteristics of the technology, (4) economic factors, (5) weather and climate factors, (6) information
diffusion, (7) attitudes/preferences towards the environment ([CARLSSON-KANYAMA et al., 2007] )
In the literature there exists an agreement on the classification of the energy-saving measures: (i)
low-cost or no-cost measures (consider measures like switching off lights, substituting compact fluorescent
lamps for incandescent light bulb) (ii) measures which require capital investment moreover they may
require technical changes in the house.
Purchasing a new energy efficient appliance usually does not require technical changes in the house,
but purchasing price may be high. DILLMAN [DILLMAN et al., 1983] and LONG [LONG, 1993] for the
US, WALSH [MARTISKAINEN, 2007] and FERGUSON [FERGUSON, 1993] for Canada, and MILLS
[MILLS et al., 2008] for Germany identifies that people with higher income save more. YOUNG (2008)
investigation proved that richer households invest more in energy-efficient appliances [YOUNG, 2008]
Higher levels of education generate greater energy-saving activities
([HIRST et al., 1982] ).The economic explanation of this issue is that higher education level reduces the cost
of information acquisition.
Social status, lifestyle ([WEBER et al., 2000] ) has a strong influence on energy conservation, also
higher energy prices may accelerate technological improvements of the energy appliances ([MILLS et al.,
2008] ).
Younger households adopt more easily new technology, which is usually also more energy efficient
([CARLSSON-KANYAMA et al., 2007] ). Also younger people are more familiar with energy saving
measures than older people ([MARTISKAINEN, 2007] ).
Family size may influence household energy saving. House insulation, household size and
composition may be less relevant. In terms of research, the literature provides mixed results ([CURTIS et al.,
1984] , [LONG, 1993] ).
Large cities tend to be more open to implement and promote environmental policies. Information on
energy operating costs is typically transmitted via energy bills. Hence the electricity bill frequency, design
and other marketing elements may be relevant. WILHITE (1996) reports that more frequent and more
informative billing, results energy savings [WILHITE et al., 1996]
Energy-consumption labels can transfer information on energy performance of appliances.
Information on energy-efficient technologies is often transmitted by local campaigns, regional, national and
international administrations or institutions, by energy agencies, consumer associations, technology

31
providers and their associations, or by utilities [SCOTT, 1997] . Information may level the quality of
knowledge, but it does not mean that it improved the result in sustained energy savings.
2.5. Conclusions
The objective of this chapter was to review individual consumer decision and its relationship with
sustainable consumption. Consumer behavior is defined by individual decisions and is influenced by
economic measures or socio-political factors (eco-labels). There is no “one-dimensional” consumer
behavior, they from our self-identity, our lifestyle. Hence behavior must be analyzed in a specific context.
Once it was underlined that the analyses of the beliefs, norms and values should be pursued in a sustainable
consumption context.
Based on the literature review we identified the following factors influencing energy consumer
behavior:
1. Characteristics of the households: influenced by age, family members and size, ownership, income,
education etc;
2. Characteristics of the building: influenced by the age of the building and location (urban versus
rural);
3. Information: Energy bills or energy labels encourage energy saving behaviors. Information
credibility is higher if it is administrated by state agency than by utility company;
4. Economic factor: Energy price has a strong influence on reducing energy use. Once it is suggested
that higher prices encourage consumers to save more energy (to purchase more energy saving
technology) and
5. Attitudes, beliefs, and norms are important, but no author proved that these factors are determinants
of energy consumption.
My personal opinion is that the new research should be based on the following questions: Which
combinations of intervention techniques give the most effective energy saving results? (For instance: Which
is more efficient to the consumer: to save energy or to save CO2? (Energy saving bulbs or house insulation)).
Or how to obtain “long-term” intervention measures for energy savings?

32
Chapter III - Theory of Planned Behavior
This section is a brief description of the Theory of Planned Behavior (TpB). First the application of
TpB is presented, followed by the definition of the TpB components and the measurement of the belief
based measures.
The aim of the study is to measure the effectiveness of students attending Energy or Environmental
courses (or both) with other mass media which simulates the electricity saving behavior. The research
framework was based on the Theory of Planned Behavior developed by ICEK AJZEN (1985). TpB
considers that “behavioral change is ultimately the result of changes in beliefs” ([AJZEN, 1991] , page
181). In practice the TpB is used to forecast and explain situation-specific human behavior, for instance the
decision to donate blood ([ARMITAGE et al., 2001] ) the use of legal and illegal drugs ([ARMITAGE et
al., 2001] ) but it is also used to predict energy saving behavior [CHEUG et al., 1999] examined the waste
paper recycling behavior among college students in Hong Kong. Their results “reveal that TpB significantly
predicted both behavioral intention and subsequent wastepaper-recycling behavior self-reported a month
later”.
TpB is useful in predicting student behavior. For instance, BECK (1991) used with success the TpB
to analyze student class attendance. However, we should state that TpB should be used to predict
environmental problems rather than college student’s behavior!
Based on the Theory of Planned Behavior human behavior is affected by three equivalent factors:
individual beliefs about the consequences of a particular belief (behavioral belief), individual perception
about a particular belief (normative beliefs) and “beliefs about the presence of factors that may facilitate or
impede performance of the behavior”([AJZEN, 2002] , page 1).
They behave in certain characteristic ways: “behavioral beliefs produce positive or negative attitude
toward the behavior, normative beliefs contain the subjective norm or perceived social pressure, and the
control beliefs define the level of perceived behavior control. Jointly, attitude toward the behavior,
subjective norms and perceived behavior control define the creation of behavioral intention” ([AJZEN,
2002] , page 1).
Therefore behavioral intention is believed to be the most powerful tool to predict a specific behavior.
Intention to apply for a benefit is defined by AJZEN (2002) “as the degree of willingness one has to engage
in a specific behavior.” Specifically “the more favorable the attitude and the subjective norm and the
greater the perceived control the stronger should be the person’s intention to perform the behavior in
question” ([AJZEN, 2002] , page 1).

33
Also if an individual has a sufficient degree of actual control over the behavior AJZEN (2002)
considers that perceived behavioral control can act as an assistant for intention, and provide directly to the
prediction of behavior [AJZEN, 2002] , page 1).
Figure 4. The Theory of Planned Behavior (Source: [AJZEN, 2002] , page 1)
The free determinants of behavioral intention have been further characterized using an expectancy-
value model defined by MARIN FISHBEIN (1977).
Attitude toward a fundamental behavior ishh computed, according to Equation 1, by summing up the
products of one’s behavioral beliefs and their corresponding outcome evaluations.
n
itt ebATB
1
Equation 1. Computation of Attitude toward Behavior (Source: [AJZEN, 2002] , page 10)
Hence ATB is the Attitudinal toward Behavior, bt is the belief that performing a specific behavior
will lead to a desired outcome, and et is the individual’s evaluation of the positive or negative value of
outcome. These are summed over n beliefs, which are the number of significant beliefs an individual holds
about performing a specific behavior.
The normative part identifies the individual’s perceived social pressure to perform or not perform the
behavior. In other words subjective norms are one’s attitude about the importance of other’s belief
regarding the performing of a specific behavior.

34
SN n i m i
i 1
n
Equation 2. Computation of Subjective Norm (Source: [AJZEN, 2002] , page 12)
Specifically “ni is the individual’s normative belief that a specific person or important group
(referent i) thinks that he or she should or should not perform a specific behavior, and mi is the individual’s
motivation to comply or not to comply with that particular referent” ([FISHBEIN et al., 1977] , page 68).
These are summed over n normative beliefs that an individual holds about performing specific behavior.
The Perceived Behavioral Control refers to the individual’s “confidence that they are capable of
performing the behavior under investigation” ([AJZEN, 2002] ,page.6).
The Perceived Behavioral Control is calculated as:
n
iii pcPBC
1
Equation 3. Computation of Perceived Behavioral Control (Source: [AJZEN, 2002] , page 13 )
Where PBC is perceived behavioral control “ci is the control belief that a specific factor will
facilitate or inhibit the performance of a specific behavior, and pi is the perceived power of a specific
control factor to facilitate or inhibit the performance of the behavior.” ([AJZEN, 2002] , page 13). These
are summed over n control beliefs that an individual holds about performing a specific behavior.
In other words, TpB works with three “determinants of behavioral intentions”, and these three
determinants are deviated from:
(1) “beliefs about the likely consequences of a behavior, and the evaluation of these outcomes
(Behavioral Consequences X Evaluation) ([AJZEN, 2002] , page 9).
(2) Beliefs about the normative expectations of important others and the motivation to comply with
these expectations (Normative Beliefs X Motivation to Comply)
([AJZEN, 2002] , page 12) and
(3) beliefs about the presence of factors that may facilitate or impede performance, and the perceived
power of these factors (Control Beliefs X Motivation to Comply) ([AJZEN, 2002] , page 13)”.
AJZEN (2002) considers that the “perceived behavioral control “can serve as a proxy for actual
control and contribute to the prediction of the behavior in question” ([AJZEN, 2002] , page 1).

35
3.1. Statistical Support for the Theory of Planned Behavior
Four classical literature reviews of TpB have demonstrated the theory’s predictive
power.[ARMITAGE et al., 2001] ARMITAGE et al. (2001), based on nineteen TpB studies, have analyzed
the relationship between Interaction and Perceived Behavioral Control. They found that “nine (47%)
reported evidence of a significant interaction effect. In each case, higher levels of PBC were associated with
stronger intention–behavior relationships ([ARMITAGE et al., 2001] , page 475).”
GODIN AND KOK’s (1996) review found that the Perceived Behavioral Control “contributed a
mean additional 13% of variance to the prediction of intentions and 12% to the prediction of behavior”
([ARMITAGE et al., 2001] , page 475). Particularly findings showed that the attitude toward the behavior
and the perceived behavior control were used to predict intention and intention significantly predicted
behavior.
AJZEN’s (1991) review of the application of TpB resulted “an average multiple correlation of
attitude”, subjective norm and PBC, with intention of R = .71 (19 correlations), and an average multiple
correlation of R = .51 (17 correlations) for prediction of behavior from intention and PBC” ([ARMITAGE et
al., 2001] , page 475). The author concluded that the TpB is an effective predictor of both self-reported as
well as observed behavior.
NOTANI (1998) based on 36 studies from various domains assessing TpB analyzed the theory
robustness and circumstances in which the PBC component predicted behavioral intention and behavior. He
concluded “PBC was a significant determinant of behavior for samples familiar with the behavior, whereas
it was not a significant determinant of behavior among samples unfamiliar with the behavior”
([AMIREAULT et al., 2008] , page 3)
Specifically PBC could be a better predictor with students versus non-students samples!
3.2. Measurement of the Components-Theory of Planned Behavior by the
Questionnaire
This part presents the construction of the TpB questionnaire components: the methodology and the
scale used to measure the TpB components are described.
A questionnaire on student’s electricity saving behavior was constructed based on AJZEN (2002)
suggestions in “Construction of a Standard Questionnaire for the Theory of Planned Behavior”. AJZEN
(2002) underlines the fact that the TpB prediction accuracy depends on “three antecedents and the intention
must be accurately assessed in relation to the focal behavior by following four specific guidelines”
([AJZEN, 2002] , page 2).” In other words each behavior must be clearly defined in terms of target, action,

36
context and time. After these terms are clearly defined, indicators of the TpB’s constructs can be obtained by
questionnaires. Although AJZEN (2002) considers “there is no standard TpB questionnaire”!
There are two different belief assessment methods, one direct and one indirect. The indirect method
offers the best results concerning individual’s underlying cognitive process.
In the following we will present construction of the TpB questionnaire.
Belief: The energy saving behavior is defined in terms of its Target, Action, Context, and Time
aspect. One example: “In the past 2 months, how many times you turned off the lights when you left the
room for more than 5 minutes?” measured on a scale 1-Never, 2-Rarely, 3-Quite Infrequently, 4-
Moderately, 5-Quite Frequently, 6-Often and 7-Always. Turning off the light is the action element; the room
is the target in a general context. The time element refers to the time the behavior is performed, and in this
example it is defined as the past 2 month.
Attitude toward the behavior. AJZEN (2002) underlines “dealing with personal or modal accessible
beliefs, two questions are asked with respect of the generated outcomes” ([AJZEN, 2002] ). In other words
two questions should be formulated to measure behavioral belief strength (b) and outcome evaluation (e).
Assume that one of the advantages observed is that the energy saving behavior can decrease University
expenses. In this case belief strength and outcome evaluation are assessed as follows:
Behavioral belief strength (b)
“Do you agree with that: Saving electricity at the University will decrease University expenses?”
measured on a scale 1-Never, 2-Rarely, 3-Quite Infrequently, 4-Moderately, 5-Quite Frequently, 6-Often and
7-Always.
Outcome evaluation (e)
“How much importance do you give to the following aspects: Decreasing University expenses?”
measured on a scale -3-Not at all important, -2- Low Importance, -1-Slightly Importance, 0-Neutral, 1-
Moderatly Importance, 2-Very Important, 3-Extremly Important.
Subjective norms. AJZEN (2002) suggests that the “assessment of normative beliefs follows a logic
similarity to that involved in the measurement of behavioral beliefs”
([AJZEN, 2002] , page 12). Hence two questions should be formulated to measure normative belief strength
(n) and motivation to comply (m). In this case normative belief strength and motivation to comply are
assessed as follows:
Normative belief strength (n)
“Do you think that your parents expect you to perform electricity saving behavior?”
measured on a scale 1-Never, 2-Rarely, 3-Quite Infrequently, 4-Moderately, 5-Quite
Frequently, 6-Often and 7-Always.
Motivation to comply (m)

37
“Do you want to have the same electricity saving behavior as your parents?” measured on a
scale -3-Never, -2-Rarely, -1-Quite Infrequently, 0-Moderately, 1-Quite Frequently, 2-Often
and 3-Always.
Perceived behavioral control: AJZEN (2002) considers that two questions should be asked “with
respect to each accessible behavior” ([AJZEN, 2002] , page 13). Hence these two questions should be
formulated to measure control belief strength (c) and control belief power (p). In this case normative belief
strength and motivation to comply are assessed as follows:
Control belief strength (c)
“Do you think that the appearance of new TV channel will influence your behavior?”
measured on a scale 1-Never, 2-Rarely, 3-Quite Infrequently, 4-Moderately, 5-Quite
Frequently, 6-Often and 7-Always.
Control belief power (p)
“Do you think that mass media will influence your energy saving behavior?” measured on a
scale -3-Never, -2-Rarely, -1-Quite Infrequently, 0-Moderately, 1-Quite Frequently, 2-Often
and 3-Always.
Behavioral intentions: AJZEN (2002) suggest that “several items are used to assess behavioral
intentions” ([AJZEN, 2002] , page 4). For instance energy saving behavior was measured by the following
questions:
“In the past 2 months how many times did you leave the computer in “Safe Mode” when it
was not in use?” measured on a scale 1-Never, 2-Rarely, 3-Quite Infrequently, 4-Moderately,
5-Quite Frequently, 6-Often
and 7-Always.
“In the next 2 months how much will you try to leave the computer in “Safe Mode” when it
is not in use?” measured on a scale 1-Very Improbably,
2- Improbably, 3- Somewhat Improbably, 4- Neither Probably nor Improbably 5- Somewhat
Probably, 6- Probably, 7- Highly Probably.
3.3. Questionnaire Design
The questionnaire was first prepared in English and translated into Portuguese with small
modifications.
The design of the questionnaire was made using Google Documents and the collected data was
analyzed using SPSS version 17.

38
The students from the University of Coimbra are familiar with this type of surveys and with the
Likert scale because each time they subscribe to a new study year they are obliged, based on a questionnaire
survey with Likert scale, to evaluate their course.
The first twelve questions of the questionnaire are for identifying student background characteristics,
namely: specialization, gender, age, marital status, residence, etc.
The following multi optional questions are figuring out the background information for electricity,
electricity bill payer or electricity expenses.
In the next section three set of electricity saving behavior questions are directed to the respondents in
a seven point Likert scale from “Never” till “Always”.
In what follows six multiple choice questions are asked to understand factors influencing purchase
decision.
This is followed by five questions measuring student intention to save electricity. After these twelve
questions (six measuring belief strength and six measuring outcome of evaluation) measuring attitude
toward behavior are asked in a seven point Likert scale from Strongly Disagree till Strongly Agree.
Subjective norm is measured by four set of questions (four measuring control belief strength and four
measuring control belief power). The responses were treated on a Likert scale from Strongly Agree till
Strongly Disagree.
The questionnaire is ended with some measurement of perceived behavioral control. The responses
were treated on a Likert scale from Always till Never.
3.4. Reliability of the Questionnaire
AJZEN (2002) underlines “People’s attitude toward a behavior can be ambivalent if they believe
that the behavior is likely to produce positive as well as negative outcomes. And the same is true for the set
of accessible normative beliefs and to the set of accessible control beliefs. Consequently, internal
consistency is not a necessary feature for belief-based measures of attitude, subjective norm, and perceived
behavioral control.”([AJZEN, 2002] , page 8)
Based on AJZEN (2002) suggestion, no reliability assessment was conducted on the belief-based
aspects of the TpB antecedents of attitude, subjective norm and perceived control behavior.
The questionnaire was pre-tested and the Cronbach’s alpha internal consistency coefficient estimates
was λ=0,847 (N = 63). The normality of the data was analyzed after that some of the questions was
removed; in some cases the scale was also changed.
The changed questionnaire was constructed using Google Documents and applied online; during
one-month period (between 15th of February 2011 and 15th of March 2011) and 1582 responses were

39
collected. The results were collected in an excel sheets. After collecting, the data was analyzed by SPSS 17,
the statistical package for Windows.
3.5. Conclusion
The purpose of this chapter was to assess the Theory of Planned Behavior. The chapter starts with
the brief description of the TpB and its components. The use of the TpB is exemplified with different
application areas; the statistical support of the theory is reviewed and the construction of the components is
described.
The chapter ends with the presentation of the design and of the reliability of the questionnaire.

40
Chapter IV – Discussion
4.1. Demographics4
The first twelve questions of the questionnaire are for identifying student background characteristics-
namely: specialization, gender, age, marital status, residence, etc.
The first question “Please select your Faculty” is aimed to identify student specialization. This
question was answered by 1570 students5. A summary of the responses is as follows: 40.2% of the students
are from Faculty of Science and Technology, 24.1% of the students are from Faculty of Economics, 12.8%
of the students are from Faculty of Humanities, 8.3% of the students are from Faculty of Medicine, 6.5% of
the students are from Faculty of Psychology and Education Sciences, 4.5% of the students are from Faculty
of Pharmacy, 1.8% of the students are from Faculty of Law and 1.8% of the students are from Faculty of
Sport Sciences and Physical Education. Hence 64.3% (!) of the responses was given by students from
Faculty of Economics and students from Faculty of Science and Technology, and the remaining 35.7% was
given by students from other Faculties.
The second and third questions were “crucial” questions aimed to identify student access to
Environmental or Energy courses6 (or both). Based on the responses we constructed two sample groups.
The first group consists of students who had access to Energy courses and Environmental courses but
also students who had either an Environmental course or an Energy course. The second group consists of
students who had no access to Energy course or to Environmental courses.
The second question was answered by 1546 students, and the results are: 66.5% of the responses did
not have access to environmental courses, and only 33.5% of the answers were positive.
Based on the first question, on student specialization, we identified (verified) the specialization of the
students who had Environmental courses. Hence using the Statistical Package for the Social Sciences
(SPSS) we constructed a graph based on the student’s study area and their access to Environmental Courses.
The graph below identifies students from the Faculty of Science and Technology with the most
Environmental Courses followed by the students from the Faculty of Economics.
4 For more information about the Demographics please see the attached CD (Information can be found in Chapter IV/4.1. Demographics) 5 Students could choose between 1- Faculty of Humanities, 2- Faculty of Law, 3- Faculty of Medicine, 4- Faculty of Science and Technology, 5-
Faculty of Pharmacy, 6- Faculty of Economics, 7- Faculty of Psychology and Education Sciences and 8- Faculty of Sport Sciences and Physical
Education. 6 Students could response either 1-Yes, I have or 0-No, I haven’t.

41
Graph 1. Student access to Environmental Course based on their study area.
The third question (“During my studies I have had one or more Energy Course?”) was answered by
1547 students. The results are as follows: 78.2% of the students did not have access to Energy Courses and
only 21.8% of the answers were positive. This statistic identifies two facts: the Faculty of Science and
Technology offers the biggest access to energy related lectures and not all students from Departments of
Faculty of Science and Technology (for instance Anthropology) have access to energy related courses.
Hence the below graph confirms our assumption, several students from Faculty of Science and Technology
responded negatively to this question. Furthermore the graph identifies students from Faculty of Economics
(for instance: Utilities Management course) and the Faculty of Law having access to energy related courses
in contrast with students from the Faculty of Medicine or Faculty of Pharmacy.
Graph 2. Student access to Energy Course based on their study area.

42
We were also interested to find the number and the specialty of students who had access to
Environmental and Energy course. This group accounts 224 students; the majority is from the Faculty of
Science and Technology. As I mentioned earlier based on the questions two and three we constructed two
sample groups: a.) group of students who had access to Environmental or Energy (or both) courses and b.)
group of students who had no access to Environmental or Energy courses.
Using SPSS, we created the two groups: sample one (“Environmental or Energy (or both)” Group)
consisting of 619 students and the second sample (“Others” Group) much larger with 911 students. The
difference between the groups is 292 responses.
The fourth question was used to identify the gender of the students. The question was responded by
1560 students, and the results are as follows: 59.4% of the answers were given by female students and
40.6% of the responses were given by male students.
Based on gender we were interested to see the gender distribution of the two groups.
In the first group (“Environmental or Energy (or both)” Group, N = 614 responses) consisting of
47.4% of male students and 52.6% of female students. In the second group (“Others” Group, N = 910
responses) consisting of 36.2% of male students and 63.8% of female students. The first group
(“Environmental or Energy (or both)” group) has more male students then the second one, but it has less
female students than the second group (“Others” Group).
The questionnaire continued with the question: “Q5.What is your age?”. This question was
answered by 1539 students and majority of responses was 20 and 21 (N = 409 responses, 25.8%).
In the case of the first group (“Environmental or Energy (or both)” Group, N = 680 responses) the
mean was 23.99 age. A more accurate measure of the age is calculated by the mode (identifies the score that
occurs most frequently in the data set) and is 22 year. In other words the majority of the students from this
group are in third or fourth year (master students) of their study. In the second group (“The Others” Group,
N = 897) the mean was 23.67 and the mode 20! Hence the majority of the students are in their first or
second year of study.
Question number six aimed to identify the student’s marital status. The question was responded by
1548 students choosing between Single or Married. The big majority 93% in this case are single only 7% are
married. In the case of the first group (“Environmental or Energy (or both)” Group, N = 610 responses) the
responses showed that 94% of the students are single, and only 39 students (6%) are married. Based on
marital status we wanted to find out how many of the married students belong to the “Environmental or
Energy (or both)” group. We identified sixteen married students from the Faculty of Science and
Technology and eleven married students from Faculty of Economics, eight married students from Faculty of
Humanities, two from Faculty of Sport Sciences and Physical Education, and two from Faculty of Law and
one from Faculty of Pharmacy.

43
In case of the second group (“Others” Group, N = 906 responses) the responses showed that 93.2%
of the students were single and 6.8% were married.
Why is this important? We consider married students to be more responsible for their action than the
others.
Question seven “How many children do you have?” was answered by 1454 students and the big
majority 93.3% has no children, 6.7% of the students have more than one child (This could be true in the
previous question only 6.8% of the students stated that they are married!).In the case of the first group
(“Environmental or Energy (or both)” Group, N =574 responses) the responses showed that 93.25 of the
students have no children, 39 students (6.8%) have more than one children.
Based on specialization, age, and marital status we identified those students who have one or more
than one child. Practically only 26 (from 39) are married; eighteen students are from Faculty of Science and
Technology and thirteen students are from Faculty of Economics, six from Faculty of Humanities and two
student is from Faculty of Psychology and Education Sciences. The mode (the most frequently occurring
score) of their age is 34 and the mean age is 35.51. These students could be PhDs or University Professors,
Lecturers.
In case of the second group (The “Others” Group, N = 850 responses) the responses showed that
93.6% of the students have no children and 6.4% had one or more children.
Question eight and nine aimed to determine the period of study at the University. Question eight
asked “In what year did you begin your studies?” This question was answered by 1463 students, the mean
of this data set was 1973.67 and the mode was 2009 (215 responses).
In the case of the first group (“Environmental or Energy (or both)” Group, N = 586 responses) the
responses showed that the majority of the students started their studies in 2007 (N = 86 responses). We were
researching those students (N = 418) who started their studies at the University till 2007. They are from the
Faculty of Science and Technology (N = 141), there are single and the mode of their age is 22 years. This
could verify the assumption that the majority of these students are in their last year of study.
In the case of the second group (“Others” Group, N = 846 responses) the responses showed that
30.5% of the students stated that they started their studies till 2005.
Question nine “In what year do you plan to complete your studies?” was answered by 1466 students;
the mean of the data set was 2027.81, and the mode was 2012. In other words the majority of the students
who filled in the questionnaire consider finalizing their study between 2011 and 2012.
In case of the first group (“Environmental or Energy (or both)” Group, N = 583 responses) the mean
was 2045.68 and the mode was 2011 (28.6%). This proves our assumption that the majority of the students
from the first group (“Environmental or Energy (or both)” group) who filled in the questionnaire are in their
last year of studies. These students consider ending their studies until 2012 (54.2%). We conducted a
research on this group (N = 195 responses) who considers ending their studies until 2011, analyzing their

44
specialization, age, marital status and the starting year of their studies. First we found out that 20.5% of
these students started their studies in 2005. Analyzing their specialization, age and marital status we found
that, the majority of the students are from the Faculty of Science and Technology (N = 107), they are single
and the mode of their age in 23.
In case of the second group (“Others” Group, N = 851 responses) the responses showed that 90.6%
of the students intend to end their studies between 2011- 2015.
Question number ten, aimed to identify the average of the student’s grade for the last year. This
question was answered by 1310 students, the median is 14 (from 20) and the mode (the most frequently
occurring score) is 13 (from 20).
In case of the first group (“Environmental or Energy (or both)” Group, N = 547 responses) the
median is 13.00 and the mode (the most frequently occurring score) is 12; 51.5% of the students from the
first group (“Environmental or Energy (or both)” Group) have a last year average between 13 and 15. Based
on their specialization, age and graduation year we researched students from the first group (“Environmental
or Energy (or both)” Group) who have their average between 13 and 15 (N = 273 responses). The majority
of students are from Faculty of Science (56.8%) and from Faculty of Economics (15.4%) their age is
between 22 and 25; 33.1% of the students consider graduating in 2011.
In case of the second group (“Others” Group, N = 739 responses) the median (the typical score) is 14
and the mode (the most frequently occurring score) is 13; 53.2% of the students have their last year average
between 13 and 15.
Question eleven and twelve aimed to identify students who leave in a student residence. Students
could choose between “On-Campus Residence” and “Off-Campus Residence”. The majority of the
responses (N = 1495 responses) indicated that 94.4% of the students leave off-campus residence and only 83
students indicated that they leave on-campus residence.
In case of the first group (“Environmental or Energy (or both)” Group, N = 589 responses) the
majority, 95.4% of the students indicated that they leave off-residence and 4.6% (27 students) indicated that
they leave in an on-campus residence. Based on specialization, gender, age and graduation year we
researched the group of the students (N = 27 responses) who live in a residence. We identified sixteen
students from Faculty of Science and Technology, five students from Faculty of Economics and four
students from Faculty of Medicine, one from Faculty of Pharmacy and one from Faculty of Humanities; the
majority are twenty-three years old, 40% of them considers finalizing their studies until 2011, 56%
considers finalizing their studies between 2012 and 2014.
In case of the second group (“Others” Group, N = 877 responses) 94% of the students stated that
they live in an off-campus residence and 53 students stated that they live in an on-campus residence. We
were interested to find more about these 53 students who did not have access to Environmental or Energy
(or both) courses. Sixteen students from Faculty of Science and Technology, fourteen students are from the

45
Faculty of Economics, eight from Faculty of Humanities, five from Faculty of Medicine, five from Faculty
of Pharmacy and five from Faculty of Sport Sciences and Physical Education; 45.1% of students are
between 19-20 years old (We assume they are first year students) and 82.4% of the students consider
graduating between 2012-2015. The difference between the first group (“Environmental or Energy (or
both)” Group) and the second group (“Others” Group) of students based on number of students who leave in
the residence is twenty six.
Question twelve aimed to collect the email addresses of the students, for further research. In this case
25 students living in residence shared their email addresses. This means that in the case of the first group of
students (“Environmental or Energy (or both)” Group) ten (from 27 students) emails were collected and in
the case of the second group of students (“The Others” Group) fifteen (from 53 students) email addresses
were received.
4.2. Conclusion – Demographics
Based on the first twelve questions we could characterize (based on the majority of responses) one
student from each sample group.
The “Environmental or Energy (or both) Student” studies (maybe) at the Faculty of Science and
Technology, the student is a 22 years old male, is single, started his studies in 2007 and in this year he will
graduate. His last year average was 13 and he lives off-campus. The “Other Student“ studies (maybe) at
Faculty of Economics, the student is a 20 years old female, single, started her studies in 2009 and she
assumes that she will graduate in 2011. Her last year average was 14 and she lives off-campus.
Environmental or Energy
(or both) Student
The Other
Student
Specialization Faculty of Science and
Technology
Faculty of
Economics
Gender Male Female
Age 22 21
Marital Status Single Single
Period of Study From 2007 2009
Until 2011 2012
Last Year Average 13.00 14.00
Residence (on-campus residence or off-campus
residence) Off-Campus Off-Campus
Table 3. Demographic Profile of Survey Respondents

46
4.3. Source of Energy Saving Advice7
Based on the demographics we were interested to find out from where and how much energy saving
information receives the two sample groups. The thirteenth question asked students to choose “How often
you receive “Energy Saving” advice from the following sources?” In other words we wanted to identify the
source and frequency of the energy saving tips received by the students. The sources were: Internet, TV,
Radio, Newspaper, Brochure, Billboard, Flyers and Person. Students could choose between 1-Everday,
2-Per week (1 time), 3-Per week times (2-3 times), 4-Per month (5-6 times), 0-Never.
Some will observe that the scale per month (5-6 times) is identical with the per week scale (1 times).
Let us consider January with 31 days. If a student receives 5-6 times energy saving advice in a month this
means after each 6 days he receives one advice per week. The difference between the scales relies in its
frequency: you can receive 5 advices in the last week of the month. For more accurate measures two other
scales were defined: 4-5 times per week and 1 times per month. Unfortunately the design of the
questionnaire (namely the grid in Google Documents allows only 5 columns) limited the size of the scale.
In case of the Internet we received 1543 responses. The results are as follows: 31.3% of the students
said that they received energy saving advices from the Internet 5-6 times per month and 15.6% of the
students said that they receive energy saving advice from the Internet once per week. Almost 30% of the
students consider that they don’t receive any energy saving advice from the Internet; 14.7% of the students
consider that they receive per week two-three times energy saving advice from the Internet and 8.5% of the
students considers receiving energy saving advice every day from the Internet.
Hence we could assume that 91.5% of the daily energy saving advice is collected from other sources
than the Internet.
In case of the first group (“Environmental or Energy (or both)” Group) we received 611 responses.
In this case the 30.9% of the students considered that they receive per month five-six times energy saving
advice from the Internet, and only 16.4% of the students considered that they receive energy saving advice
from the Internet once per week. Also 13.4% of the students considered that they received per month 2-3%
energy saving advice from the Internet, 10.8% of the students considered that they receive energy saving
advices from the Internet every day, and only 28.5% of the of the students considered that they never receive
energy saving advice from the Internet.
Hence we could assume that 89.2% of the daily energy saving advice is collected from other sources
than the Internet.
In the case of the second group (The “Others” group) we received 898 answers. In this case 31.6% of
the students reported that they receive energy saving advice from the Internet five-six times per month, and
7 For more information about the Energy Saving Advice please see the attached CD (Information can be found in Chapter IV/4.3. Energy Saving
Advice)

47
seventeen percent of the students reported that they receive energy saving advice from the Internet once a
week. Only fifteen responses differ in the option receiving energy saving advice once per week (15%) and
receiving energy saving advice two-three times per week (15.4%). Only seven percent of the students
reported that they receive energy saving advice everyday (in the case of the first group this percentage was
10.8) and 31% of the students considered that they don’t receive energy saving advices.
Hence we could assume that 93% of the daily energy saving advice is collected from other sources
than the Internet.
The second source of energy saving advice was considered to be the television. In this case we
received 1541 responses. In this case 27.3% of the students considered that they receive energy saving
advice from television five-six times per month, 21% of the students considered that they receive energy
saving advice from television once per week or two-three times per week and 24.7% consider receiving
energy saving advice 2-3 times per week. Only 16.7% of the students reported that they receive everyday
energy saving advice from television, and only 10.3% consider that they did not received any energy saving
advice from TV.
Hence we could assume that 85.6% of the daily energy saving advice is collected from other sources
than the television.
In case of the first group (“Environmental or Energy (or both)” Group) of students we received 609
responses. In this case 22.7% of the students considered that they receive energy saving advice from TV
two-three times per week but also 27.3% of the students considered that they receive energy saving advice
from TV five-six times per month and 23.3% of the students considered that they receive energy saving
advice from TV once per week. Only 17.1% of the students considered that they receive energy saving
advices from TV every day and 9.7 % of the students considered that they don’t receive any energy saving
advice from TV.
We can assume that 82.9% of the daily energy saving advice is collected from other sources than the
television.
In the case of the second group (“Others” Group, N = 898 responses) of students we identified that
27.6% of the students consider that they receive energy saving advice from television five-six times per
month, 19.6% of the students consider that they receive energy saving advice from television once per week
and 25.9% of the students consider that they receive energy saving advice from television two-three times
per week. Also 16.6% of the students considered that they receive energy saving advice from the TV every
day and only 10.2% of the students considered that they don’t receive energy saving advices from the TV.
Hence we could assume that 83.4% of the daily energy saving advice is collected from other sources
than the television.
The third source of energy saving advice was considered to be the radio. We received 1531
responses the results are as follows: 35.7% of responses were negative, 26.5% of the student answered that

48
they receive energy saving advices from radio five-six times per week, 16.7% considered that they receive
energy saving advices from the radio once per week, and 15.9% considered that they receive energy saving
advices two-three times per week from the radio and 5.2% of the students considered receiving everyday
energy saving advices from the radio.
Hence we could assume that 94.8% of the daily energy saving advice is collected from other sources
than the radio.
In the case of the first group of students (“Environmental or Energy (or both)” Group) from 606
students 34% considered that they do not receive energy saving advices from the radio. Also 27.9% of the
students considered that they receive energy saving advice from the radio five-six times per week, 17.3% of
the students considered that they receive energy saving advice from the radio once per week, 15.2% of the
students considered to receive energy saving advice from radio two-three times per week and 27.9% of the
students considered receiving energy saving advice from radio every day.
We can assume that 95.3% of the daily energy saving advice is collected from other sources than the
radio.
In the case of the second group (The “Others” Group) from 899 students 328 students (36.8%)
percent considered that they never receive energy saving advice from radio. However 25.5% of the students
considers receiving energy saving advices from radio five-six times per month, 16.4% of the students state
that they receive energy saving advices from the radio two-three times per week, 16.4% of the students
receive energy saving advices from radio once per week and 36.8% of the responses state that they never
receive energy saving advices from the radio and 4.9% receive everyday energy saving advice from the
radio.
We could assume that 95.1% of the daily energy saving advice is collected from other sources than
the radio.
The fourth source for energy saving advice was considered the newspaper. From 1522 answers more
that 31.1% of the students receive per month five-six times energy saving advice from the newspaper.
Moreover, 19.1% of the students receive energy saving advice from newspaper once per week and 17% of
the students receive energy saving advices from the newspaper two-three times per week. This statistics
indicate that they receive more energy saving advice from newspaper than from the Internet.
However 28.1% of the students considered that they never receive energy saving advice from
newspaper and only 4.8% of the students considered receiving everyday energy saving advice from it.
Hence we could assume that 95.2% of the daily energy saving advice is collected from other sources
than the newspaper.
In the case of the first group 600 answers were collected, and 32.7% of the students receive energy
saving advice from the newspaper five-six times per month. Moreover 19.1% receive energy saving advice
from the newspaper at least once per week and 17% receive energy saving advice from newspaper two-three

49
times per week. A significant number of students (26%) considered that they never receive advice of energy
saving measures from the newspaper and only 4.7% of the students receive energy saving information from
the newspaper every day.
Hence we could assume that 95.3% of the daily energy saving advice is collected from other sources
than the newspaper.
The second group of students (N = 889 responses) considered that 29.8% receive energy saving
advice from newspaper five-six times per month, 18.7% consider that they receive energy saving advice
from newspaper 1 time per week, 17.2% of the students receive energy saving advice from the newspaper
two-three times per week. 260 students (29.2%) consider that they do not receive energy saving advice at all
from the newspapers and only 5.1% of the students receive energy saving advice from the newspaper every
day.
Hence we could assume that 94.9% of the daily energy saving advice is collected from other sources
than the newspaper.
For the fifth source for advising energy saving measures we considered the brochure. Brochures can
commonly be found in major shops, or in hospitals (here they are called pamphlets). From 1509 responses
45% stated that they have never received energy saving advices from brochures. However 34.8% received
energy saving advice from brochure at least five-six times per month, 10.8% received energy saving advices
two-three times per week, 8.5% received energy saving advice once per week. Only thirteen (optimistic)
students (0.9%) receive energy saving advice from brochures every day.
We could assume that 99.1% of the daily energy saving advice is collected from other sources than a
brochure.
Almost half of students of the first group (“Environmental or Energy (or both)” Group,
N = 591 responses), more exactly 43.3% considered that they never receive energy saving advice from a
brochure, however 35.5% responded that five-six times per month they received advice from the brochures.
Only 8.5% of the students receive energy saving advice from brochure once a week, 70 students (11.8%)
receive energy saving advice from brochure two-three times per week, and five students 0.8% receive
everyday energy saving advice from brochure.
We can assume that 99.2% of the daily energy saving advice is collected from other sources than
brochures.
In the case of the second group (“The Others” Group, N = 885) 406 students (45.9%) considered that
they have never received energy saving advices from brochures, but also 34.5% of the students received
energy saving advices five-six times per month. A small number of students, 8.8% responded that receive
energy saving advices from brochures once per week, and 9.9% of the students receive energy saving
advice two-three times per week and eight students (0.9%) received energy saving advice from brochure
every day.

50
We could assume that 99.1% of the daily energy saving advice is collected from other sources than
brochure.
The fifth source for energy saving advice was the billboard. Billboards are highly visible; they
usually present large advertisements to pedestrians or drivers. From 1519 responses 49.4% were negative
about receiving energy saving advice from a billboard. However 25.4% of the students considered that they
receive five-six times per month energy saving advice from a billboard, 12.2% of the students considered
receiving two-three times per week energy saving advice from a billboard, ten percent of the students
receive energy saving information from billboards once per week and three percent of the students receive
energy saving advice from billboards every day.
We can assume that 97% of the daily energy saving advice is collected from other sources than
billboards.
In case of the first group (“Environmental or Energy (or both)” Group, N = 600) a number of 281
students (46.8%) considered that they never receive energy saving advices from billboards, and 25.5%
received energy saving advice from a billboard five-six times per month. Also 14.3% of the students receive
energy saving advice from a billboard two-three times per week, 9.8% of the students receive energy saving
advice from a billboard once per week and 3.5% of the students receive energy saving advice from a
billboard every day.
We could assume that 96.5% of the daily energy saving advice is collected from other sources than
billboards.
The big majority of the second group 51.4% (The “Others” Group, N = 886 responses) considered
that they do not receive any energy saving measures from billboards but also 25.1% of the students
considered that they receive energy saving advice from a billboard five-six times per month. Moreover
10.3% of the students receive energy saving advice from the billboard once per week and 10.6% of the
students receive energy saving advice from billboard two-three times per week. A number of twenty four
students (2.7%) receive energy saving advice from the billboard every day.
We can assume that 97.3% of the daily energy saving advice is collected from other sources than
billboards.
As the sixth source for energy saving advice we considered the flyers. Typically used by individuals
for advertisement or for the promotion of a product, flyers are an inexpressive way to direct marketing.
Thus from 1517 responses 40.3% of the students considered that they do not receive energy saving
advices from flyers, and 36.7% received energy saving advice from flyers five-six times per month. Also
12.1% of the students received energy saving advices from flyers two-three times per week, 9.7% received
energy saving advice from flyers once per week and more than one percent (1.3%) receives energy saving
advices from flyers every day.

51
We can assume that 98.7% of the daily energy saving advice is collected from other sources than
flyers.
In the case of the first group (“Environmental or Energy (or both)” Group, N = 599) 39.1% of the
students consider that they never receive energy saving advice from flyers, but 37.1% of the students receive
five-six times per month energy saving advice from flyers. Also a number of 77 students (12.9%) receive
energy saving advice from flyers two-three times per week, 9.6% receive energy saving advice from flyers
once per week but only 1.2% (seven students) receives energy saving advice from flyers every day.
Hence we could assume that 98.3% of the daily energy saving advice is collected from other sources
than flyers.
In the second group of students (“The Others” Group, N = 886) 40.4% of the responses considered
that they never receive energy saving advice from flyers but 36.9% receive energy saving advice from flyers
five-six times per month. Also 11.5% of the students receive energy saving advice from flyers 2-3 times per
week, 9.8% receive energy saving advice from flyers once per week and 1.4% of the students receive energy
saving advice from flyers every day.
Hence we could assume that 98.6% of the daily energy saving advice is collected from other sources
than flyers.
The last source of energy saving advice was considered to be a third-party person. In this case 1527
responses were received, 31.4% of the students receive energy saving advice from a third-party five-six
times per month, 18% of the students receive energy saving advice from a third-party once per week, and
18.9% of the students receive energy saving advice two-three times per week.
However 21.8% of the students consider that they never receive energy saving advice from a third-
party person and 9.8% receive energy saving information every day.
We can assume that 90.2% of the daily energy saving advice is collected from other sources than
from third-party persons.
The “Environmental or Energy (or both)” Group (the first group, N = 607 responses) 31.6% receive
energy saving advices from a third-party five-six times per week, 17.8% receive energy saving advices from
a third-party once per week and 20.3% receive energy saving advices two-three times per week. Only 19.8%
of the students consider that they do not receive energy advice from a third-party person and 10.5% of the
students receive energy saving advice from this source every day.
We can assume that 89.5% of the daily energy saving advice is collected from other sources than
from third-party persons.
In the case of the second group (“The Others” Group, N = 888 responses) 31.5% of the students
receive energy saving advices from a third-party person five-six times per week, 17.9% receive energy
saving advices two-three times per week and 18.1% receive energy saving advices from this source once per
week.

52
More than 23% of the students consider that they do not receive energy advice from a third-party and
9.3% of the students receive energy saving advice from this source every day.
We can assume that 90.7% of the daily energy saving advice is collected from other sources than
from third-party persons.
4.3. Conclusion - Source of Energy Saving Advice
The findings are summarized in the table below (Table 4.). In the case of the first group
(“Environmental or Energy (or both)” Group), students have never received energy saving advices from
billboard or from brochures. They receive energy saving information from television, from another person or
from the Internet every day. During the week they receive advice on energy saving from television, from a
person or from a newspaper. However considering the long term, the highest number of energy saving
advices is collected from flyers, brochures or from newspapers (printed media).
In the case of the second group students had never received energy saving advices from a billboard,
brochure or flyers. They receive energy saving information daily from the television, a person or from the
newspaper. Once per week they receive advice from the television, newspaper or from the Internet. During
the week they receive at least two-three times advice from the television, from a third party or from the
newspaper. However, on the long term the biggest amount of energy saving advice is collected from flyers,
brochures or internet. Both groups of students receive few advices with daily frequency.
Table 4. Summary of the Energy Saving Advice Frequency
Environmental or Energy Group (or both) The Others Group
N Never
(%)
Everyday
(%)
Per
Week 1
time
(%)
Per
Week
2-3
times
(%)
Per
month
5-6
times
(%)
N Never
(%)
Everyday
(%)
Per
Week
1 time
(%)
Per
Week
2-3
times
(%)
Per
month
5-6
times
(%)
Internet 611 28.5 10.8 16.4 13.4 30.9 898 31 7 15 15.4 31.6
TV 609 9.7 17.1 23.3 22.7 27.3 898 10.2 16.6 19.6 25.9 27.6
Radio 606 34 5.6 17.3 15.2 27.9 891 36.8 4.9 16.4 16.4 25.5
Newspaper 600 26 4.7 19.7 17 32.7 889 29.2 5.1 18.7 17.2 29.8
Brochure 591 43.3 0.8 8.5 11.8 35.5 885 45.9 0.9 8.8 9.9 34.5
Billboard 600 47.6 3.5 9.8 14.3 25.5 886 51.4 2.7 10.3 10.6 25.1
Flyers 599 39.1 1.2 9.8 12.9 37.1 886 40.4 1.4 9.8 11.5 36.9
Person 607 19.8 10.5 17.8 20.3 31.6 888 23.1 9.3 18.1 17.9 31.5
53
4.4 Electricity Bill Payer8
The survey continued with the question “Are you the person who usually pays the electric bill in the
house?” The question was responded by 1508 students, 35.7% were positive (539 responses) and 64.3%
were negative (969 responses).
In the case of the first group (“Environmental or Energy (or both)” Group) from 598 responses
36.6% are electricity bill payer and 63.4% are not. In the case of the second group (“The Others” Group)
from 461 responses 34.2% are electricity bill payer and 64.9% are not.
We were researching students who pay their electricity bill from the first group (“Environmental or
Energy (or both)”, N = 219) based on specialization, age, marital status, graduation year and energy saving
advice.
Based on their specialization the majority is from Faculty of Science and Technology (130 students)
59.4% and Faculty of Economics (37 students) 26.7%. The mode (the most frequently occurring score) of
their age is 23 and the mean is 26.57. The majority is single 85% and only 15% are married. More than 30%
of the students consider graduating in 2011, and more 77% of the students consider graduating between
2011 and 2013. They receive energy saving advice from the television, the Internet or from a person every
day. Once per week they find advice on energy saving on the television, from a person or in a newspaper.
During the week they receive at least 2-3 times energy saving advice from the television, from the radio or
from a third party-person. However for long term the biggest amount of energy saving advice is collected
from flyers, internet or brochures.
Question fifteen is an open question aimed to identify the electricity bill payer. Hence students
(N = 1582 responses) were asked to name their relative who pays their electricity bill. The big majority of
the students did not answer this question however the responses pointed out that 55.3% of the electricity bill
is paid by students families (father, mother, sister, brother, etc.), 3.1% t of the students name their landlords
as their electricity payer.
In the case of the first group (“Environmental or Energy (or both)” Group, N = 619 responses)
55.9% of the electricity bill is paid by the family, 19 students have their electricity bill included in their
room rent. In the case of the second group (“The Others” Group, N = 911 responses) the 55.9% of the
students named their electricity bill payer to be one member for their families, and only 3.2% of the students
pay their electricity together with room rent.
Question sixteen aimed to identify student awareness of the electricity bill expense. Hence students
were asked to rate their electricity bill size in their expenses9. From 1529 responses, the majority 54.2%
8 For more information about the Electricity Bill Payer please see the attached CD (Information can be found in Chapter IV/4.5. Electricity Bill
Payer) 9 Students could choose between 1- Between 5% - 25%, 2- Between 25% - 50%, 3- Over 50% and 0- I don’t know.

54
considered that the electricity bill rate in their expenses is between 5%-25%, 30.6% of the students
responded with “I don’t know”, 12.8% of the students considered that the rate of the electricity bill in their
expenses is between 25%-50% and 36 students considered that the rate of their electricity bill in their
expenses is more than 50%.
However is hard to believe that the electricity bill weighs more than 25% in student expenses,
therefore 15.2% of the responses are incorrect. Hence the percentage of the students who cannot weigh
exactly their electricity bill in their expenses is 45.8% (from 1521 students!)
In the first group (“Environmental or Energy (or both)” Group, N = 601 responses) 54.6% of the
students considered that the rate of their electricity bill in their expenses is between 5%-25%, 29.5% of the
students responded with “I don’t know” and 13% of the students considered that the rate of their electricity
bill in their expenses is between 25%-50% and eighteen students consider that that the rate of their
electricity bill in their expenses is between 50%.
Hence we could assume that 45.5% of the students belonging to the first group could not estimate
their electricity bill expenses correctly (accounting also the responses given as “I don’t know”).
In the case of the second group (The “Others Group”, N = 887 responses) more than half (53.7%) of
the students considered that the electricity bill rate in their expenses is between 5%-25%, 31.6% of the
responses were negative; 12.7% consider that the rate of their electricity bill in their expenses is between
25%-50% and 18 students (2%) consider that the rate of their electricity bill in their expenses is
more than 50%.
Hence in the case of the second group we could assume that 46.3% of the students could not estimate
their electricity bill expenses correctly.
We researched those students belonging to the “Environmental or Energy (or both)” Group, who
considered that the rate of their electricity bill in their expenses is between 25%-50% or over 50% based on
their specialization, age, marital status, end of study, average, place of residence and electricity saving
advice. Based on specialization the majority of the students (N = 96 responses) are from Faculty of Science
and Technology (60.4%) and 18.8% are from Faculty of Economics, the mode (most frequently occurring
score) of their age is 22 and the mean is 25.20 year. Two students are married the others are single, 33.6% of
the students consider graduating in 2011 and 78.5% between 2011 and 2013. Their last year average means
is 13.16 (the mode 12) and their leave off-campus residence (97.9% off-campus residence). Their daily
energy saving advice is from the television (22.1%), from a person (9.4%) and from the internet (11.5%).
I assume that those students who belong to the first group (“Environmental or Energy (or both)”
Group) and who could estimate correctly their electricity bill expense have better averages as the students
who missed the estimation.

55
Thus the result showed the majority of the students 48.6% has their last year average between 14-18
and 56.1% of the students from the first group who mismatched the rate of their electricity bill in their
expenses has their last year average between 10-13.
Hence we could assume that students with higher last year average have a better estimation of energy
saving efficiencies.
We were interested to see the difference between students who live in University residences and those
who don’t in estimation of their electricity bill weigh in their expenses.
Only 27 students from 80 (11 students belonging to the “Environmental or Energy (or both)” Group
and 16 students belonging to the “Others group”) who live in the residence could rate correctly their
electricity bill expenses. In other words 66.25% of the students who live on-campus residence cannot rate
correctly their electricity bill.
In the case of the students who live off residence from 824 responses 742 students responded
correctly (298 students from the first group “Environmental or Energy (or both)” Group and 444 students
from the second group).
Moreover 42.6% of the students who live off campus residence cannot rate correctly their electricity
bill.
4.5 Conclusion Electricity Bill Payer
Hence we can conclude that in the first student group (“Environmental or Energy (or both)”) the
electricity bill is paid by a family member, but he is familiar with the electricity bill expense.
In the case of the second student group (The “Others”) she also lives off-campus residence, the
electricity bill is paid by a family member, and she has a relative idea on the rate of their electricity bill in
her expenses.
4.6. Choice between Traditional Light Bulb and Energy Saving Light Bulb10
Question twenty asked students if they have bought energy saving bulb. Only 6% (95 students) from
1546 responses were negative. In the case of the first group (“Environmental or Energy (or both)” Group)
from 609 responses 94.7% were positive and in the case of the second group (“The Others” group) from 903
responses 93.2% were positive. The questionnaire continued with a set of question aimed to identify those
characteristics (factors) of the energy-saving light bulb that could have an influence on students buying
10 For more information about the Choice between Traditional Light Bulb and Energy Saving Light Bulb see the attached CD (Information can
be found in Chapter IV/4.7. Choice between Traditional Light Bulb and Energy Saving Light Bulb)

56
decision. We considered that based on the variety of the targeted sample and type of question a three type
Likert scale is sufficient to capture the required information.
The findings are summarized in the table below (Table 5.). Hence from 1468 responses 37.4% of the
students considered that energy saving light bulbs are more expensive than traditional light bulbs, 38.4% of
the students could not decide if energy saving light bulbs is more expensive than the traditional light bulbs
and 24.2% of the students consider that energy saving light bulbs is more expensive than traditional light
bulbs. If we compare the price of an energy saving light bulb with a traditional light bulb we find that the
energy saving light bulbs price could double the price of the traditional light bulbs.
Hence the energy saving light bulb is more expensive than the traditional light bulbs. Based on the
responses we can conclude that 75.8% of the students consider that the price of an energy saving light bulbs
has low importance in purchase decision (the acquisition frequency maybe low).
Also 42% of students consider that the shape, or the design of the energy saving light bulb may
alternate their buying decision. Based on light bulbs energy saving performance, efficiency, eco-friendliness
and quality students choice is for the energy saving light bulb.
Environmental or Energy Group (or both)
(Energy Saving Light Bulb vs. Traditional Light Bulb)
The Others Group
(Energy Saving Light Bulb vs. Traditional Light Bulb)
N Disagree
(%)
Undecided
(%)
Agree
(%) N
Disagree
(%)
Undecided
(%)
Agree
(%)
Price (are
cheaper?) 580 23.8 38.4 37.8 857 37.3 37.8 24.9
Design (has a
better design?) 564 19 41.5 39.5 840 21.2 40.8 38
Eco-friendly
product (has a
better
environmental
performance?)
563 2.5 15.5 82.1 838 3 16.8 80.2
Efficiency (save
more energy?) 559 0.5 14 85.5 839 1.2 17.3 81.5
Expected Life
(last longer?) 556 4.1 31.1 64.8 837 5.9 35.4 58.8
Quality (are of
better quality?) 571 5.6 38 56.4 843 8.1 41.0 50.9
Table 5. Summary of the Results of the Choice between Traditional Light Bulb and Energy Saving Light Bulb

57
4.7. Conclusion - Choice between Traditional Light Bulb and Energy Saving Light
Bulb
Hence in the case of the first group (“Environmental or Energy (or both)” Group), student choice for
an energy saving light bulb is influenced by the product environmental performance, efficiency and
expected life. Price or designs are secondary factors that influence the choice for an energy saving light
bulb.
In the case of the second group (The “Others” Group), student choice for an energy saving light bulb
is influenced by the product environmental performance, efficiency and expected life. Price, designs or
quality are secondary factors that influence the choice for an energy saving light bulb.

58
Chapter V - Determinants of Students Energy Savings: An Application of
the Theory of Planned Behavior11
The questionnaire was designed to predict student intention in saving energy. What we want to
research is whether student intention in energy saving could be broken down into specific forms of attitudes,
norms or beliefs.
The questionnaire reliability (measured by 34 items, measuring intention, behavior and beliefs) was
Cronbach’s Alfa .819
5.1. Energy Saving Behavior
Energy saving behavior was measured by three questions (2 actions: turn off the lights and set
computer in safe mode) on a scale from 1 (Never) to 7 (Always)12: Q17 (“In the past 2 months, how often did
you turn off the lights when you left the room for more than 5 minutes?”), Q18 (“In the past 2 months, how
many times did you turn off the lights before leaving a room?”) and Q19 (“In the past 2 months, how many
times did you leave the computer in “Safe Mode” when it was not in use?”).
To measure the energy saving behavior the means of the Q17 and the Q19 were summed13.
The means indicate a positive behavior (Between Moderate and Quite Frequent) to save energy.
Graph 3. The Q-Q Plot of the Energy Saving Behavior (N = 1582 responses) 11 Additional information available on CD (Folder: Chapter V- Determinants of Students Energy Saving Behavior)
12 The Likert scale of the energy saving behavior is: 1-Never, 2-Rarely, 3-Quite Infrequent, 4-Moderate, 5-Quite Frequent, 6-Often, 7-Always
13 Icek Ajzen suggestion how to analyze complex behaviors: ”I am studying a category of behaviors, not a single action. How can I apply the
TPB to a behavioral category? We are often interested in predicting, explaining, or changing categories of behavior, such as exercising,
studying, or conserving energy -- not any single action. It is possible to deal with such a criterion by assessing attitudes, subjective norms,
perceptions of control, intentions, and actual behavior with respect to each of a representative set of actions that comprise the category of
interest. These measures can then be aggregated to arrive at indices representing the behavioral category.” (Source: Icek Ajzen FAQ
http://www.people.umass.edu/aizen/faq.html)

59
5.2. Energy Saving Intention
The energy saving intention was measured by five questions on a scale from 1 (Very Improbable) to
7 (Very Probable14): Q27 (“In the next 2 months how much will you try to turn off the lights when you leave
room for more than 5 minutes?”), Q28 (“In the next two months how much will you try to turn off the lights
before leaving the room?”), Q29 (“In the next two months how much will you try to leave the computer in
“Safe Mode” when it is not in use?”), Q30 (“In the next two months how much will you try to turn on the
lights when you leave the room?”) and Q31 (“In the next two months how much will you try to leave the
computer on when you leave the room?”).
The average results of Q27 and Q29 were summed up to measure the student’s energy saving
intention.
The means indicate a positive intention (between Somewhat Probable - Probable) to save energy.
The distribution of the intention data is leptokurtic (positive kurtosis) indicating a relatively peak
distribution (because of the large sample size).
Graph 4. The Q-Q Plot of Intention (N = 1582 responses).
5.3. Energy Saving Attitude (Indirect Measures)
AJZEN (2001) considers “The belief strengths and outcome evaluations for the different accessible
beliefs provide substantive information about the attitudinal considerations that guide people’s decision to
engage or not to engage in the behavior under consideration”. Moreover they are used “to compute an
indirect measure of attitude towards the behavior” ([AJZEN, 2002] , page 10).
14 The Likert scale of the energy saving intention is: 1-Very Improbable, 2- Improbable, 3-Somewhat Improbable, 4-Neither Probable nor Improbable, 5-Somewhat Probable, 6-Probable and 7-Very Probable

60
In other words the attitude towards behavior indicates individual positive or negative feeling towards
the behavior.
Belief strength was measured by six questions on a scale from 1 (Strongly Disagree) to 7 (Strongly
Agree)15: Q32 (“Do you agree with: Saving electricity at the university will decrease university’s
expenses?”), Q33 (“Do you agree with: saving electricity at the university will make us an example for other
universities?”), Q34 (“Do you agree with saving electricity at the university will help to preserve natural
resources?”), Q35 (“Do you agree with saving electricity at the university will decrease the import of
electricity from neighboring countries?”), Q36 (“Do you agree with saving electricity at the University will
help to reduce our carbon emission?”) and Q37 (“Do you agree with saving electricity at the university will
improve the national balance of payment?”).
Behavioral beliefs are measured by six questions on a scale from -3 (Not at all important) to +3
(Extremely Important)16: Q38 (“How much importance do you give to decreasing university expenses?”), Q39
(“How much importance do you give to the following: serving as an example to other universities?”), Q40
(“How much importance do you give to the following aspect: preserving natural resources?”), Q41(”How
much importance do you give to the following aspect: decreasing the import of electricity from neighboring
countries?”), Q42 (“How much importance do you give to the following aspect: reducing our carbon
emission?”), and Q43 (“How much importance do you give to the following aspect: improving the national
balance of payment?”)
The indirect measures of the attitude towards energy saving17 was calculated as: “belief strength
multiplied by the outcome of the evaluation, and the resulting product is summed over all accessible
behavioral outcomes” ([AJZEN, 1991] , page 10).
The average results indicate certainty towards energy saving behavior. The distribution of the
indirect measure of attitude toward energy saving is leptokurtic (positive kurtosis) indicating a relatively
peak distribution (because of the large sample size).
15 The Likert scale of the Attitude Belief Strength : 1-Strongly Disagree, 2- Moderately Disagree, 3-Slightly Disagree, 4-Neurtral, 5-Slightly
Agree, 6-Moderatly Agree and 7-Strongly Agree (Slightly is a synonym for HARDLY)
16 AJZEN (2002) on bipolar scaling “…outcome evaluations should receive bipolar scoring because the low end of the scale represents a
negative evaluation of the outcome and the high end a positive evaluation. A similar argument, however, cannot be made with respect to the
measure of belief strength.”([AJZEN, 2002] , page 10)
17 The Likert scale of the Attitude Belief Strength : 1-Strongly Disagree, 2- Moderately Disagree, 3-Slightly Disagree, 4-Neutral, 5-Slightly
Agree, 6-Moderatly Agree and 7-Strongly Agree (Slightly is a synonym for HARDLY)

61
Graph 5. The Q-Q Plot of Attitude toward Energy Saving
(Indirect Measures, N = 1582 responses)
5.4. Energy Saving Attitude (Direct Measures)
Attitude towards energy saving is also measured directly by six questions on a scale18 from 1
(Strongly Disagree) to 7 (Strongly Agree): Q44 (“Do you agree with: energy efficiency should be a school
priority?”), Q45 (“Do you agree with: the current economic recession is more of worry for me than energy
saving at university?”), Q46 (“Do you agree with: electricity saving is a Government responsibility, not the
responsibility of students?”), Q47 (“Do you agree with: since students don’t pay the university’s electricity
bill, we don’t need to save electricity?”), Q48 (“Do you agree with: electricity saving at the university will
not increase the quality of education?”) and Q49 (“Do you agree with: I cannot see the obvious benefits of
electricity saving at the university?”).
These six questions are summed up to estimate the attitude towards energy saving.
The means tend to be between Moderately Disagree and Neutral, slightly negative scale, indicates a
certain uncertainty towards energy saving measures.
18 The Likert scale of the Attitude Belief Strength : 1-Strongly Disagree, 2- Moderately Disagree, 3-Slightly Disagree, 4-Neutral, 5-Slightly
Agree, 6-Moderatly Agree and 7-Strongly Agree (Slightly is a synonym for HARDLY)

62
Graph 6. The Q-Q Plot of Attitude toward Energy Saving
(Direct Measure, N = 1582 responses)
The distribution of the direct measure of attitude towards energy saving is leptokurtic (positive
kurtosis) indicating a relatively peak distribution.
5.5. Subjective Norm
The calculation of the normative beliefs is similar to the measurements of behavioral beliefs. Two
questions are asked to measure normative belief strength and motivation to comply.
Normative beliefs are measured by four questions on a scale19 from 1 (Never) to 7 (Always):
Q50 (“Do you think that your parents expect you to perform electricity saving behavior?”), Q52 (“Do you
think your professors expect you to perform electricity saving behavior?”), Q54 (“Do you think that your
colleagues expect you to perform electricity saving behavior?”) and Q56 (“Do you think that the University
staff expect you to perform electricity saving behavior?”).
Motivation to comply is measured by four questions on a scale20 from -3 (Never) to +3 (Always):
Q51 (“Do you want to have the same electricity saving behavior as your parents?”), Q53 (“Do you want to
perform electricity saving behaviors as your professors?”), Q55 (“Do you want to perform electricity saving
behaviors as your colleagues?”) and Q57 (“Do you want to perform electricity saving behaviors as the
university staff?”).
The means tend to be between Never and Always, slightly positive, indicating that students
perceived that only a few people important to them would expect them to save energy.
19 The Likert scale for normative belief measures is: 1-Never, 2-Rarely, 3-Quite Infrequent, 4-Moderate, 5-Quite Frequent, 6-Often and 7-
Always 20 The Likert scale for motivation to comply is: -3-Never, -2-Rarely, -1-Quite Infrequent, 0-Moderate, 1-Quite Frequent, 2-Often and 3-Always

63
The belief base measure of subjective norm is obtained by summing the product of normative belief
strength with motivation to comply.
Graph 7. The Q-Q Plot of Subjective Norm (N = 1582 responses)
5.6. Perceived Behavioral Control (Indirect Measure)
The calculation of the perceived behavioral control follows the same rule as that of the
measurements of behavioral beliefs. Two questions are asked to measure control belief strength and control
belief power.
Control belief strength is measured by four questions on a scale from 1 (Never) to 7 (Always):
Q59 (“How often do you think that the weather will change?”), Q61 (“Do you think that the appearance of a
new TV channel will influence your behavior?”), Q63 (“Do you consider buying a new appliance?”) and
question Q65 (“Are you considering getting a job soon?”).
Control belief power is measured by four questions on a scale from -3 (Never) to +3 (Always): Q60
(“Do you think that weather will influence your energy saving behavior?”), Q62 (“Do you think that mass
media will influence your energy saving behavior?”), Q64 (“Do you think that a new electricity appliance
could act as an obstacle to saving electricity?”) and Q66 (“Do you anticipate that having a job in the future is
an obstacle to save electricity?”).
The means tend to be between Moderate and Quite Often, slightly positive.
The perceived behavioral control is the sum of the products of the control beliefs and control belief
powers.
The distribution of the perceived behavioral control of energy saving is leptokurtic (positive
kurtosis) indicating a relative peak distribution.

64
Graph 8. The Q-Q Plot of Perceived Behavioral Control
(Indirect Measure, N = 1582 responses)
5.7. Perceived Behavioral Control (Direct)
The Perceived Behavioral Control was also measured directly by question fifty-eight “Do you think
that you can control yourself to save electricity?”21; measured on a scale from 1 (Never) to 7 (Always).
The direct measure of the distribution of the perceived behavioral control of energy saving is
leptokurtic (positive kurtosis) indicating a relative peak distribution ([FIELD, 2009] , page 148). It is also
negatively skewed and it lacks symmetry.
.
Graph 9. Histogram Perceived Behavioral Control (Direct Measure, N = 1519 responses)
The relationship between variables was assed using the Pearson correlation. The results showed a
strong correlation between Intention and Behavior, also they moderately correlate with other predictor
21 The Likert scale for perceived behavioral control (direct measure): 1-Never, 2-Rarely, 3-Quite Infrequent, 4-Moderate, 5-Quite
Frequent, 6-Often and 7-Always

65
variables in the matrix. Perceived Behavioral Control do not correlate with the Behavior and Intention
component indicating low interest to pursue energy saving behavior.
5.8. Conclusion
This chapter presents the structure and the components of the TpB. Questions used to measure the
TpB components are presented, Q-Q Plots analyzing the normal distribution of the beliefs are assessed. This
is followed by the evaluation of each TpB component based on the received responses.

66
Chapter VI – Hypothesis Tests
Based on Theory of Planned Behavior components the following 5 hypotheses were tested.
Hypothesis 1: Students from the first group (“Environmental or Energy (or both)” Group) have a favorable
attitude and subjective norm, a higher perceived control than the students from the second group; hence a
stronger intention to perform energy saving behavior.
Hypothesis 2: The belief-based measures of attitude provide a more accurate measure of intention than the
direct ones.
Hypothesis 3: Advice from television has a significant influence on the students from the second group
(The “Other” Group); they have a favorable attitude and subjective norm, a higher perceived control to
perform energy saving behavior.
Hypothesis 4: Price and energy saving information has a significant influence on the students’ intention to
save energy. Those students from the “Environmental or Energy Group (or both)” who can estimate exactly
the cost of energy saving light bulb have a favorable attitude and subjective norm, a higher perceived control
to perform energy saving behavior then the others.
Hypothesis 5: Students’ attitude, confidence and subjective norm increases with the years of study at the
University.
6.1. Statistical Analysis of the Attitude towards Behavior, Subjective Norm and
Perceived Behavioral Control on the General Group of Students (N = 1535)
The Attitude towards Behavior was measured using Direct and Indirect Measures.
Hypothesis 2: First using One-Way ANOVA we analyzed the relationship between the Attitude towards Behavior
Variables (Direct Measures) and the Intention to save energy.

67
ANOVA
Sum of Squares df Mean Square F Sig.
Q44_ATTITUDE_Direct_E
NERGY_EFFICIENCY_A_
SCHOOL_PRIORITY
Between Groups 68.502 13 5.269 3.315 .000
Within Groups 2411.063 1517 1.589
Total 2479.565 1530
Q45_ATTITUDE_Direct_E
CONOMIC_RECESSION
Between Groups 26.854 13 2.066 .788 .673
Within Groups 3948.516 1507 2.620
Total 3975.370 1520
Q46_ATTITUDE_Direct_G
OVERNMENT_RESPONS
ABILITY
Between Groups 45.322 13 3.486 1.494 .112
Within Groups 3515.814 1507 2.333
Total 3561.136 1520
Q47_ATTITUDE_Direct_D
O_NOT_NEED_TO_SAVE
_ELECTRICTY
Between Groups 48.912 13 3.762 2.547 .002
Within Groups 2232.072 1511 1.477
Total 2280.984 1524
Q48_ATTITUDE_Direct_W
ILL_NOT_INCREASE_TH
E_QUALITY_OF_EDUCA
TION
Between Groups 89.038 13 6.849 1.877 .028
Within Groups 5534.645 1517 3.648
Total 5623.683 1530
Q49_ATTITUDE_Direct_I_
CANNOT_SEE_THE_BEN
EFITS_OF_SAVINGS
Between Groups 57.774 13 4.444 1.847 .032
Within Groups 3661.851 1522 2.406
Total 3719.625 1535
Table 6. –Way ANOVA – Attitude toward Behavior (Direct Measures)
Hence two of the Attitudes towards Behavior (Direct Measure, N = 1535) variables showed no
significant to the Intention to Save Energy: (1) the “economic recession” variable did not show significance
with intention to save energy, multivariate F(13, 1507) = .79, n.s. and (2) the “political belief” (or
“government responsibility”) variable did not show any significance with intention to save energy,
multivariate F(13, 1507) = 1.49, p > .05, n.s.
Using One-Way ANOVA we analyzed the relationship between the Attitude toward Behavior Variables
(Indirect Measures) and the Intention to save energy.

68
ANOVA
Sum of Squares df Mean Square F Sig.
ATT122 Between Groups 1659.664 12 138.305 3.053 .000
Within Groups 67995.845 1501 45.300
Total 69655.509 1513
ATT223 Between Groups 2240.248 13 172.327 2.132 .010
Within Groups 122064.672 1510 80.838
Total 124304.921 1523
ATT324 Between Groups 2403.153 13 184.858 5.171 .000
Within Groups 53842.394 1506 35.752
Total 56245.547 1519
ATT425 Between Groups 1955.453 13 150.419 2.443 .003
Within Groups 92664.071 1505 61.571
Total 94619.525 1518
ATT526 Between Groups 2272.498 13 174.808 3.768 .000
Within Groups 68933.286 1486 46.388
Total 71205.784 1499
ATT627 Between Groups 3018.309 13 232.178 3.851 .000
Within Groups 90849.563 1507 60.285
Total 93867.871 1520
Table 7. One –Way ANOVA – Attitude toward Behavior (Indirect Measures)
In this case the Attitude towards Behavior is defined by two questions measuring belief strength and
outcome evaluation. The lowest significance had the variable “show one example to other Universities”,
multivariate F(13, 1510) = 2.13, p < .05. Hence student’s attitude towards “being one example to other
Universities” is a factor with low significance in students’ decision to engage or not in energy saving
behavior. Hence the Attitude towards Behavior (Indirect Measure) showed a significant relationship with
the Intention to save energy, multivariate F(13, 1530) = 4.57, p < .001 and the direct measure of the Attitude
towards Behavior was significant, multivariate F(13, 1530) = 1.75, p < .05.
22 ATT1= “decrease University expenses” variable 23 ATT2=”show one example to other Universities” variable 24 ATT3= the environmental concern (or “to preserve natural resources”) variable 25 ATT4= the economic variable (or “decrease import) 26 ATT5=“reduce carbon emission” variable 27 ATT6=“to improve the national balance of payment” variable

69
ANOVA
Sum of Squares df Mean Square F Sig.
ATTITUDE Between Groups 191403.524 13 14723.348 4.404 .000
Within Groups 5114601.958 1530 3342.877
Total 5306005.482 1543
ATTITUDEdirect Between Groups 546.940 13 42.072 1.754 .045
Within Groups 36705.679 1530 23.991
Total 37252.619 1543
Table 8. One –Way ANOVA – Attitude toward Behavior Indirect and Direct Measures
Specifically indirect measure of Attitude towards behavior is more efficient than the direct measure.
Secondly using One-Way ANOVA we also analyzed the relationship between the Subjective Norm
(Indirect Measures) and the Intention to save energy.
ANOVA
Sum of Squares Df Mean Square F Sig.
SN128 Between Groups 10915.143 13 839.626 4.153 .000
Within Groups 306109.181 1514 202.186
Total 317024.324 1527
SN229 Between Groups 1690.356 13 130.027 1.754 .045
Within Groups 110869.849 1496 74.111
Total 112560.205 1509
SN330 Between Groups 1624.651 13 124.973 1.661 .063
Within Groups 112037.011 1489 75.243
Total 113661.662 1502
SN431 Between Groups 1164.881 13 89.606 1.299 .206
Within Groups 101859.518 1477 68.964
Total 103024.398 1490
SUBJECTIVE_NORM Between Groups 39307.248 13 3023.634 3.298 .000
Within Groups 1400091.901 1527 916.891
Total 1439399.149 1540
Table 9. One –Way ANOVA – Subjective Norm Indirect Measures
28 SN1=“parents influence” variable 29 SN2=”professor influence” variable 30 SN3=“colleagues influence” variable 31 SN4=“staff influence” variable

70
In this case the Subjective Norm is defined by two questions measuring normative belief and
motivation to comply. Hence two of the Subjective Norm variables showed no significant to the Intention to
Save Energy The results are as follows: (1) the “colleagues influence” variable show no significance with the
intention to save energy, multivariate F(13, 1489) = 1.66, p > .05, n.s. and (2) the “staff influence” showed
no significance with the intention to save energy, multivariate F(13, 1477) = 1.30, p >.05, n.s.
Hence the measurement of the Subjective Norm (Indirect Measure) showed a significant relationship
with the Intention to save energy, multivariate F(13, 1527) = 3.30, p <.001. The “professor influence” may
offer some clues on the perceived pressure on students’ intention to save energy.
Finally the Perceived Behavioral Control was measured using Direct and Indirect measures. Using
One-Way ANOVA we analyzed the relationship between the Perceived Behavioral Control (Direct Measure)
and the Intention to save energy.
In this case only one question was used (!) the result is as follows: the “control belief” variable
showed high significance with the intention to save energy, multivariate F(13, 1505) = 7.69, p < .001.
Using One-Way ANOVA we continued to analyze the Perceived Behavioral Control (Indirect
Measure) influence on Intention to save energy and we did not identified any significant relations between
the Intention variable and the Perceived Behavioral Control variables, multivariate F(13, 1525) = 1.27,
p > .05, n.s.
ANOVA
Sum of Squares df Mean Square F Sig.
PBC132 Between Groups 2449.711 13 188.439 1.314 .197
Within Groups 213543.097 1489 143.414
Total 215992.808 1502
PBC233 Between Groups 350.850 13 26.988 .820 .639
Within Groups 49276.243 1497 32.917
Total 49627.093 1510
PBC334 Between Groups 454.306 13 34.947 1.205 .269
Within Groups 43310.707 1493 29.009
Total 43765.013 1506
PBC435 Between Groups 1704.378 13 131.106 1.405 .149
Within Groups 139746.731 1498 93.289
Total 141451.108 1511
PBC Between Groups 6649.093 13 511.469 1.266 .227
Within Groups 616278.187 1525 404.117
Total 622927.280 1538
Table 10. One –Way ANOVA – Perceived Behavioral Control Indirect Measures
32 PBC1=“weather belief control” variable 33 PBC2= “mass media belief control” variable 34 PBC3= “new appliance purchase” variable 35 PBC4=“employment belief control” variable

71
Moreover analyzing the relationship between Behavior and the Perceived Behavioral Control
variables we identified tow variables that showed significance to the intention to save energy : (1) “new
appliance purchase” show significance with the intention to save energy, multivariate F(13, 1493) = 2.87,
p < .001 and (2) “employment belief control” show significance with the intention to save energy,
multivariate F(13, 1498) = 2.28 p < .05;
ANOVA
Sum of Squares Df Mean Square F Sig.
PBC136 Between Groups 2357.411 13 181.339 1.264 .228
Within Groups 213635.396 1489 143.476
Total 215992.808 1502
PBC237 Between Groups 578.577 13 44.506 1.358 .173
Within Groups 49048.516 1497 32.765
Total 49627.093 1510
PBC338 Between Groups 1072.923 13 82.533 2.886 .000
Within Groups 42692.090 1493 28.595
Total 43765.013 1506
PBC439 Between Groups 2748.361 13 211.412 2.283 .006
Within Groups 138702.747 1498 92.592
Total 141451.108 1511
PBC Between Groups 8085.993 13 621.999 1.543 .095
Within Groups 614841.287 1525 403.175
Total 622927.280 1538
Q58_PBC_Direct_ELECTRICI
TY_SAVE_CONTROL
Between Groups 62.680 13 4.822 4.603 .000
Within Groups 1576.508 1505 1.048
Total 1639.188 1518
Table 11. One –Way ANOVA – Relationship between Behavior and Perceived Behavioral Control
The highest significance had the variable “new appliance purchase”, multivariate F(13, 1493) = 2.87,
p < .001. Hence this means “purchase” may facilitate or may impede their intention to save energy.
36 PBC1=“weather belief control” variable 37 PBC2= “mass media belief control” variable 38 PBC3= “new appliance purchase” variable 39 PBC4=“employment belief control” variable

72
6.2. Comparisons between Different Groups of Students
There are two groups of students: the first group (or the “Environmental or Energy” (or both) group)
includes students who had Energy or Environmental lectures (or both) and the second group (or The
“Others” group) includes students who didn’t have Energy and (or) Environmental lectures. AJZEN (2001)
states that “As a general rule, the more favorable the attitude and subjective the norm, and the greater the
perceived control, the stronger should be the person’s intention to perform the behavior in question”
([AJZEN, 2002] , page 1).
Based on the TpB model we want to analyze the influence of Energy or Environmental (or both)
lectures on the students intention, behavior, attitude toward behavior, subjective norm and perceived
behavioral control. In other words we want to answer the question: “Does Energy or Environment (or both)
courses influence student behavior to pursue energy saving measures?”
Hypothesis 1: From the statistical analysis there was a significant effect of the Energy lectures on the
General group (N = 1500), Wilks’ Lambda=0.99, multivariate F(5,1496)=3.42, p<.05.
Multivariate Testsb
Effect Value F Hypothesis df Error df Sig.
Intercept Pillai's Trace .935 4284.791a 5.000 1496.000 .000
Wilks’ Lambda .065 4284.791a 5.000 1496.000 .000
Hotelling's Trace 14.321 4284.791a 5.000 1496.000 .000
Roy's Largest Root 14.321 4284.791a 5.000 1496.000 .000
During_my_studies_I_have_
had_one_or_more_ENVIRO
NMENTAL_COURSE
Pillai's Trace .005 1.578a 5.000 1496.000 .163
Wilks’ Lambda .995 1.578a 5.000 1496.000 .163
Hotelling's Trace .005 1.578a 5.000 1496.000 .163
Roy's Largest Root .005 1.578a 5.000 1496.000 .163
During_my_studies_I_have_
had_one_or_more_ENERG
Y_COURSE
Pillai's Trace .011 3.422a 5.000 1496.000 .004
Wilks’ Lambda .989 3.422a 5.000 1496.000 .004
Hotelling's Trace .011 3.422a 5.000 1496.000 .004
Roy's Largest Root .011 3.422a 5.000 1496.000 .004
During_my_studies_I_have_
had_one_or_more_ENVIRO
NMENTAL_COURSE *
During_my_studies_I_have_
had_one_or_more_ENERG
Y_COURSE
Pillai's Trace .002 .609a 5.000 1496.000 .693
Wilks’ Lambda .998 .609a 5.000 1496.000 .693
Hotelling's Trace .002 .609a 5.000 1496.000 .693
Roy's Largest Root .002 .609a 5.000 1496.000 .693
a. Exact statistic
b.Design:Intercept+During_my_studies_I_have_had_one_or_more_ENVIRONMENTAL_COURSE+During_my_studies_I_have_had_one_or_more_EN
ERGY_COURSE+During_my_studies_I_have_had_one_or_more_ENVIRONMENTAL_COURSE*During_my_studies_I_have_had_one_or_more_EN
ERGY_COURSE
Table 12. Environmental and Energy lectures Influence on Energy Saving Behavior (Indirect Measures)

73
Further in the comparison between the groups; the sample sizes of the groups are different, the
second group is larger.
The results (Table 13.) are as follows: students with Environmental lectures (only!) have the highest
confidence, attitude and intention to engage in energy saving behavior and students with Energy lectures
(only!) have the highest means scores to perform energy saving behavior feel the highest level of social
pressure performing energy saving behavior.
The difference between the sample sizes is significant however in the first group (“Environmental or
Energy (or both)” Group) students with Environmental or Energy (or both) lectures (N = 613) are more
likely to engage in energy saving measure than the others from the second group (N = 907)
N Intention Behavior Attitude Subjective
Norm
Perceived Behavioral
Control
First Group (Environmental or Energy (or
both))
Students with Environmental Lectures (ONLY!)
285
M 10.90 9.76 82.91 42.30 22.05
SD 2.45 2.40 30.48 28.31 18.41
N 285 285 283 283 282
Students with Energy Lectures (ONLY!)
107
M 10.89 10.32 76.85 45.96 17.85
SD 2.39 2.44 35.72 35.30 18.45
N 107 107 106 105 104
Students with Environmental and Energy Lectures
224
M 10.82 9.92 82.84 45.76 17.78
SD 2.58 2.67 35.03 32.93 23.31
N 221 221 219 218 217
Second Group (The “Others”) 907
M 10.64 9.88 80.82 41.09 19.92
SD 2.53 2.38 34.72 29.97 20.05
N 907 909 903 902 903
Table 13. Means and Standard Deviations of the Intentions, Behaviors, Attitudes, Subjective Norms and
Perceived Behavioral Controls between the Two Groups of Students
In the following we consider two equal sized sample groups. Hence we selected randomly 619
responses for the first group (“Environmental or Energy (or both)” Group) and 619 responses for the second
group (The “Others” Group).
The results (Table 14.) are as follows: students from the first group (“Environmental or Energy (or
both)” Group) have a favorable attitude and subjective norm, behavior and intention to engage in energy

74
saving measure than the students from the second group; hence a stronger intention to perform energy
saving behavior. Therefore, Hypothesis 1 is accepted.
N
Intention Behavior Attitude Subjective Norm
Perceived
Behavioral
Control
First Group
(Environmental
or Energy (or
both))
619
M 10.87 10.92 81.83 44.18 19.79
SD 2.48 2.51 33.14 31.30 20.39
N 613 614 608 605 603
Second Group
(The “Others”) 619
M 10.58 9.83 80.70 41.68 20.71
SD 2.49 2.37 35.07 30.00 19.93
N 616 618 613 613 614
Table 14. Influence of Equal Comparison Group Samples on Intention, Behavior, Attitude, Subjective Norm
and Perceived Behavioral Control Means.
In the following section we consider analyzing the First group (“Environmental or Energy (or both)”
Group) based on three equal sized sample groups. Hence we selected 351 responses from the first group
(“Environmental or Energy (or both)” group): 107 responses for students with Environmental lectures
(only); 107 responses for students with Energy lectures (only) and 107 responses for students with
Environmental or Energy (or both) lectures.
The results (Table 15.) are as follows: students with Energy lectures (only) have the strongest
behavior and intention and feel the strongest social pressure to engage in energy saving behavior; students
with Environmental lectures (only) have the strongest confidence to pursue energy saving behavior. Those
students who had Environmental or Energy (or both) lectures have the strongest attitude toward energy
saving.
Hence we could assume that students with Energy lectures have the strongest intention to engage in
energy saving behavior

75
N Intention Behavior Attitude Subjective
Norm
Perceived
Behavioral
Control
First Group
(Environmental or
Energy (or both))
Students with
Environmental
Lectures (ONLY!)
107
M 10.60 9.65 81.83 41.51 22.49
SD 2.48 2.55 30.46 28.57 16.97
N 107 107 106 106 105
Students with
Energy Lectures
(ONLY!)
107
M 10.89 10.32 76.85 45.96 17.84
SD 2.39 2.44 35.72 35.30 18.45
N 107 107 106 104 104
Students with
Environmental or
Energy (or both)
Lectures
107
M 10.54 9.73 82.36 44.91 19.63
SD 2.58 2.72 35.79 32.19 22.55
N 106 106 106 105 105
Table 15. Comparison of the Means and Standard Deviations of the First Group (Environmental or Energy
(or both)) on the Intention to Save Energy
6.3. The Influence of the Television on Energy Saving Advice on Different Groups
Section 4.3 identified the most trusted source of the energy saving advice for the students. Usually
students collect energy saving advices from the television. We decided to resize the scale based on the
frequency of energy saving advices received per week. Hence the new scale will be: 1-Students who receive
more than once energy saving advice per week from TV (for instance every day, Per week 2-3 times, Per
month 5-6 times) and 0-Students who receive less than once energy saving advice per week from TV (for
instance Never or Once per week).
Based on this we will analyze the influence of the television on students’ behavior, intention,
attitude, subjective norm and perceived behavioral control. This analysis gives rise to interesting questions:
Does the advice from the television influence students’ energy saving behavior?
The sample size of the two groups differs significantly; the second group doubled the first one.
However we computed each subgroup based on TpB components. The table below (Table 16.) summarizes
the findings

76
N Intention Behavior Attitude Subjective
Norm
Perceived
Behavioral
Control
First Group (Env.
or Energy (or both))
More than
once per
week
408
M 10.96 10.01 83.79 43.86 19.52
SD 2.45 2.43 31.88 31.16 20.84
N 404 408 402 399 397
Once or
zero times
per week
201
M 10.64 9.70 77.82 44.26 20.15
SD 2.54 2.64 35.00 31.65 19.29
N 199 201 196 197 196
Second Group (The
“Others”)
More than
once per
week
630
M 10.51 9.79 80.75 40.82 19.55
SD 2.51 2.35 33.95 29.80 19.37
N 627 629 624 623 625
Once or
zero times
per week
268
M 10.97 10.11 80.80 41.46 20.8
SD 2.56 2.43 36.62 30.47 21.74
N 268 268 267 268 267
Table 16. Results from Group Comparisons of the Energy Saving Advice from Television
The two groups cannot be compared (the sample sizes are not adequate), but they show some
interesting results.
In the case of the first group (“Environmental or Energy (or both)” Group) we can observe that as the
sample size increases the intention, behavior and attitude to perform energy saving measures increases. In
other words, this may suggest that for large sample sizes Environmental or Energy lectures (or both) joined
by an increase frequency of energy saving advice from the television has a positive impact on students’
intention, behavior and attitude to perform energy saving measures. Also as the sample size increases, the
subjective norm and perceived behavioral control decreases. The statistical analysis in the case of the first
group (“Environmental or Energy (or both)” Group) the covariate (or the outcome variable), energy saving
advice from the television was significantly related to the energy saving attitude towards energy saving,
multivariate F(4,593)=2.80, p<.05

77
ANOVA
Sum of
Squares df Mean Square F Sig.
INTENTION Between Groups 33.932 4 8.483 1.378 .240
Within Groups 3682.516 598 6.158
Total 3716.448 602
BEHAVIOR Between Groups 24.068 4 6.017 .960 .429
Within Groups 3760.748 600 6.268
Total 3784.817 604
ATTITUDE Between Groups 12073.126 4 3018.281 2.800 .025
Within Groups 639194.140 593 1077.899
Total 651267.266 597
SUBJECTIVE_NORM Between Groups 8399.127 4 2099.782 2.161 .072
Within Groups 574334.846 591 971.802
Total 582733.973 595
PBC Between Groups 232.861 4 58.215 .140 .967
Within Groups 244389.968 588 415.629
Total 244622.830 592
Table 17. One –Way ANOVA - Energy Saving Advice from the Television
This indicates that the energy saving advice from the television has significant effect on students who
have access to Environmental or Energy lectures (or both).
Hypothesis 3: In the case of the second group (“The Others” Group) we can observe that as the
sample size increases, together with the amount of advice from the television, students’ intention and
behavior decreases in terms to performing energy saving measures. In other words this may suggest that
with the increase in the sample size the advice from television has a smaller influence on student’s intention,
behavior and belief about how others assess energy saving measures. Also as the sample size increases the
attitude, subjective norm and the perceived behavioral control increase as well; Hypothesis three is accepted.
From the statistical analysis in the case of the second group (The “Others”), the covariate (or the outcome
variable), energy saving advice from the television, was significantly related to the participants’ confidence,
multivariate F(4,875) =2.75, p<.05. There was also a significant effect of energy saving advice of the
television on subjective norm F(4,886)=3.60, p<.05. This indicates that the energy saving advice from the
television has an effect on students who have no access to Energy or Environmental lectures (or both)

78
ANOVA
Sum of Squares df Mean Square F Sig.
INTENTION Between Groups 47.209 4 11.802 1.851 .117
Within Groups 5675.108 890 6.377
Total 5722.317 894
BEHAVIOR Between Groups 40.779 4 10.195 1.812 .124
Within Groups 5017.295 892 5.625
Total 5058.074 896
ATTITUDE Between Groups 3157.429 4 789.357 .653 .625
Within Groups 1071399.076 886 1209.254
Total 1074556.505 890
SUBJECTIVE_NORM Between Groups 12812.663 4 3203.166 3.604 .006
Within Groups 787391.117 886 888.703
Total 800203.780 890
PBC Between Groups 4406.539 4 1101.635 2.747 .027
Within Groups 355688.578 887 401.002
Total 360095.117 891
Table 18. Energy Saving Advice from the Television (Second Group - Indirect Measures)
In the following section we consider two equal size sample groups. Hence we selected randomly 200
responses for the first group (“Environmental or Energy (or both)” group) and 200 responses for the second
group (The “Others”) group.

79
N Intention Behavior Attitude Subjective
Norm
Perceived
Behavioral
Control
First Group
(Environmental or Energy
(or both))
More than once
per week 200
M 10.87 10 80.34 41.04 18.10
SD 2.50 2.50 33.54 32.30 19.07
N 198 198 197 196 194
Once or zero times
per week 200
M 10.64 9.69 77.81 44.26 20.15
SD 2.54 2.64 35.01 31.65 19.29
N 199 200 195 195 195
Second Group
(The “Others”)
More than once
per week 200
M 10.21 9.65 79.51 40.68 20.65
SD 2.54 2.35 34.75 31.47 18.06
N 198 200 196 196 197
Once or zero times
per week 200
M 11 10.10 79.14 40.96 20.71
SD 2.54 2.50 37.36 29.01 21.85
N 200 200 199 200 199
Table 19. Influence of the Environmental or Energy lectures (or both) and Energy saving Advice from the
Television on Intention, Behavior, Attitude, Subjective Norm and Perceived Behavioral Control in the Case
of Equal Sample Sizes
The results are as follows (Table 19.): in case of the first group (Environmental or Energy Group (or
both)) as the frequency of the energy saving advice from the television increases, students’ confidence and
social pressure to engage in energy saving behavior decreases.
In case of the second group (The “Others”) as the frequency of the energy saving advice from
television increases, students’ confidence and social pressure decreases.
Hence energy saving advice from the television could not influence students’ confidence and
strengthen the social pressure to engage in energy saving behavior.
Is the Environmental or Energy (or both) lectures influence on students energy saving measures
bigger than the advertisement from the television?
The above table (Table 20.) underlines the fact that the Environmental or Energy lectures (or both)
are powerful in influencing student’s intention to save energy.

80
N
Intention Behavior Attitude Subjective
Norm
Perceived
Behavioral
Control
First Group
(Environmental
or Energy (or
both))
Students with
Environmental
Lectures
(ONLY!)
107
M 10.60 9.65 81.83 41.51 22.49
SD 2.48 2.55 30.46 28.57 16.97
N 107 107 106 106 105
Students with
Energy
Lectures
(ONLY!)
107
M 10.89 10.32 76.85 45.96 17.84
SD 2.39 2.44 35.72 35.30 18.45
N 107 107 106 104 104
Students with
Environmental
or Energy (or
both) Lectures
107
M 10.54 9.73 82.36 44.91 19.63
SD 2.58 2.72 35.79 32.19 22.55
N 106 106 106 105 104
Second Group
(The “Others”)
More than
once per week 107
M 10.4 9.88 81.88 40.05 20.90
SD 2.44 2.26 32.19 33.13 17.95
N 105 107 105 105 105
Once or zero
times per week 107
M 10.7 9.65 77.25 41.65 21.58
SD 2.71 2.69 30.05 30.05 21.80
N 107 107 106 107 106
Table 20. Results from Group Comparisons of Energy or Environmental lectures (or both) and Energy
Saving advice from Television on Students Intention to Perform Energy Saving Behavior
6.4. Price influence in Purchase Decision
Section 4.6 identified factors influencing the students’ buying decision. The majority of the students
choose an energy saving bulb against a traditional bulb because of its efficiency, quality, expected life or
eco-friendliness. Price and design are less important in the buying decision. In what follows we will analyze
the influence of price on the intention to save energy. In other words, we will answer the question “How
does the price of electricity influence students’ intention to save energy?” From the statistical analysis on the

81
general group (N = 1446), the covariate (or the outcome variable), the price of the energy saving bulb was
significantly related to the participants’ attitude towards energy saving, multivariate F(2,1453)=9.679,
p< .001 and subjective norm, multivariate F(2,1451) = 5.144, p<.05. This indicates that the price of the
energy saving bulb has an effect on the TpB components.
ANOVA
Sum of Squares df Mean Square F Sig.
INTENTION Between Groups 28.813 2 14.407 2.281 .103
Within Groups 9234.234 1462 6.316
Total 9263.047 1464
BEHAVIOR Between Groups 2.814 2 1.407 .240 .787
Within Groups 8595.047 1465 5.867
Total 8597.861 1467
ATTITUDE Between Groups 22099.819 2 11049.910 9.679 .000
Within Groups 1658835.064 1453 1141.662
Total 1680934.884 1455
SUBJECTIVE_NORM Between Groups 9583.803 2 4791.902 5.144 .006
Within Groups 1351694.956 1451 931.561
Total 1361278.760 1453
PBC Between Groups 1325.259 2 662.630 1.642 .194
Within Groups 584706.201 1449 403.524
Total 586031.460 1451
Table 21. One –Way ANOVA- Price Influence on Energy Saving Intention
Question twenty-one asked “If yes (if you have bought energy saving bulbs), compared to traditional
light bulbs, do you think energy-saving light bulbs are cheaper?” Based on the answers we constructed two
groups. The first group consists of students from the “Environmental or Energy (or both)” group; they are
divided in two groups: one who responded positively (“Disagree”) to the question and one with students
who responded with “Undecided” or negatively (“Agree”) to the question. We will follow the same
methodology for the construction of the second group (“Others” Group).
The sample size of the two groups differs significantly. However, each subgroup was computed
based on TpB components.
The table above (Tabel 22.) summarizes our findings:

82
N Intention Behavior Attitude Subjective
Norm
Perceived
Behavioral
Control
First Group
(Environmental
or Energy
(or both))
Agree and
Undecided 361
Ms 10.72 9.83 82.38 45.22 20.85
SD 2.48 2.48 33.74 30.21 21.13
N 360 361 358 358 356
Disagree 219
M 11.07 10.07 81.23 43.07 18.22
SD 2.48 2.51 32.67 33.25 19.13
N 219 219 217 216 215
Second Group
(The “Others”)
Agree and
Undecided 537
M 10.7 9.95 83.1 42.92 20.28
SD 2.47 2.37 35.16 29.73 20.17
N 537 537 533 637 639
Disagree 320
M 10.6 9.86 79.44 39.25 19.71
SD 2.61 2.40 32.68 30.34 19.67
N 320 320 318 317 318
Table 22. Results from Group Comparisons on the Cost of an Energy Saving Light
The two groups cannot be compared (the sample size is not adequate), but some interesting trends
can be seen.
In the case of the first group (“Environmental or Energy (or both)” Group) we observe that students
who responded correctly to the question have higher intention and behavior to perform energy saving
measures than the others.
In case of the second group (The “Others” Group) the sample sizes differ significantly; hence a
different approach will be used.
In the following section two equal sized sample groups are considered: a set of randomly selected
200 replies from the first group (“Environmental or Energy (or both)” Group) and another of 200 replies
from the second group (The “Others” Group).

83
Table 23. Comparisons of Equal Groups Means on the Cost of an Energy Saving Light Bulb
Hypothesis 4: In case of the First Group (“Environmental or Energy (or both)” Group) students who
responded correctly (with “Disagree”) feel the strongest social pressure, attitude, behavior and intention to
engage in energy saving behavior. Students who responded negatively with “Agree” or “Undecided” have
the highest confidence to engage in energy saving. Hypothesis four is accepted.
In the case of the second group, (“The Others” Group) we conclude that students who responded
incorrectly have the strongest intention to engage in energy saving behavior.
Hence price and energy saving information is a powerful tool to strengthen student’s subjective
norm. But as the social pressure increases student’s confidence to perform energy saving measures
decreases.
N Intention Behavior Attitude Subjective
Norm
Perceived
Behavioral
Control
First Group
(Environmental
or Energy
(or both))
Agree and
Undecided 200
M 10.62 9.8 80.69 41.89 20.43
SD 2.54 2.55 33.61 29.70 20.78
N 199 200 198 199 197
Disagree 200
M 11.08 10.10 81.17 42.27 18.15
SD 2.51 2.57 33.20 33.49 19.41
N 200 200 198 197 196
Second Group
(The “Others”)
Agree and
Undecided 200
M 10.62 9.87 81.83 41.94 21.45
SD 2.51 2.46 37.58 30.36 19.41
N 198 200 196 198 198
Disagree 200
M 10.56 9.91 77.84 40.30 20.19
SD 2.57 2.38 33.27 30.08 19.32
N 200 200 200 200 198

84
6.5 Changes in Energy Saving Intention over the Years
We analyzed the influence of the university environment on students’ energy saving behavior. In
other words, we will answer the question: “How does university environment influence students’ energy
saving behavior?”
Hypothesis 5: To have large sample sizes we decided not to split the groups. We constructed a table
based on TpB components: with students who started their studies at the university between 2007 and 2010.
The results are as follows:
N
Intention Behavior Attitude
Subjective
Norm
Perceived
Behavioral
Control
General Group
2007 168
M 10.81 9.98 79.45 41.69 21.77
SD 2.57 2.32 36.00 29.42 18.88
N 168 168 168 168 168
2008 168
M 10.68 9.75 76.49 39.70 21.15
SD 2.41 2.48 33.52 28.35 19.32
N 168 168 168 166 166
Table 24. Results from Group Comparison of Beginning of Education at the University.
Thus the results are as follows (Table 24.): We identified that students’ intention, behavior, attitude
towards energy saving, subjective norm and perceived behavioral control increases as students tend to be
more advanced in their curriculum. As students “grow older”, their confidence and attitude toward energy
saving, perceived social pressure to perform energy saving measures increases. From the statistical analysis
on the general group (N = 1391), the covariate (or the outcome variable), the beginning of the study at the
university, was significantly related to the participants’ perceived behavioral control, multivariate
F(46,1394)=1.563, p<.05.

85
ANOVA
Sum of Squares df Mean Square F Sig.
INTENTION Between Groups 312.363 47 6.646 1.051 .380
Within Groups 8887.164 1406 6.321
Total 9199.527 1453
BEHAVIOR Between Groups 200.978 47 4.276 .724 .919
Within Groups 8330.534 1410 5.908
Total 8531.512 1457
ATTITUDE Between Groups 63940.838 47 1360.443 1.157 .219
Within Groups 1641541.912 1396 1175.890
Total 1705482.750 1443
SUBJECTIVE_NORM Between Groups 53075.347 46 1153.812 1.247 .127
Within Groups 1290989.155 1395 925.440
Total 1344064.502 1441
PBC Between Groups 28546.619 46 620.579 1.563 .010
Within Groups 553330.716 1394 396.937
Total 581877.335 1440
Table 25. One- Way ANOVA - Beginning of the Study Influence on Energy Saving Behavior
This indicates that the variable beginning of the study has an effect on the TpB components.
Our assumption was verified, by analyzing students’ intention from the second group (“The Others”)
who consider graduating between 2011 and 2012.
The results are as follows in Table 26.:
N
Intention Behavior Attitude Subjective
Norm
Perceived
Behavioral
Control
General Group
2011 168
M 10.43 9.67 79.39 41.87 16.95
SD 2.47 2.47 36.94 29.92 19.26
N 168 168 166 167 166
2012 168
M 10.79 10.03 80.38 41.78 20.09
SD 2.68 2.55 34.60 31.11 18.68
N 167 168 165 166 163
Table 26. Results from Group Comparison of University Graduation

86
Hence students’ attitude, confidence and subjective norm increases with the years of study at the
University. From the statistical analysis on the general group (N = 1410), the covariate (or the outcome
variable), the conclusion of the study at the university, was significantly related to the participants’
perceived behavioral control, multivariate F(30, 1413)=1.800, p<.05
ANOVA
Sum of Squares df Mean Square F Sig.
INTENTION Between Groups 250.746 30 8.358 1.336 .107
Within Groups 8921.788 1426 6.257
Total 9172.534 1456
BEHAVIOR Between Groups 178.863 30 5.962 1.010 .451
Within Groups 8439.356 1430 5.902
Total 8618.219 1460
ATTITUDE Between Groups 35692.665 30 1189.755 1.018 .440
Within Groups 1655226.534 1416 1168.945
Total 1690919.198 1446
SUBJECTIVE_NORM Between Groups 38312.113 30 1277.070 1.387 .080
Within Groups 1301944.285 1414 920.753
Total 1340256.399 1444
PBC Between Groups 21373.477 30 712.449 1.800 .005
Within Groups 559387.783 1413 395.887
Total 580761.260 1443
Table 27. One- Way ANOVA - End of the Study Influence on Energy Saving Behavior
This indicates that the variable completing the study has an effect on the TpB components;
Hypothesis five is accepted.

87
6.6. Conclusions
First the TpB belief components were analyzed based on their statistical significance to the intention
to save energy. The analyses identified that the indirect measurement of Attitude towards Behavior showed
significance to the energy saving intention, multivariate F(13,1530)=4.57, p<.001. The direct measures of
the Attitude toward behavior showed significance to the intention to save energy, multivariate
F(13,1530)=1.75, p<.05. Hence the belief based measurements are more reliable than the direct measures.
Secondly the subjective norm was analyzed based on their statistical significance to the intention to
save energy. The analyses identified that the indirect measurement of the subjective norm showed
significance to the energy saving intention, multivariate F(13,1527)=3.30, p<.001. The highest significance
with the intention to save energy had the “parents”, multivariate F(13,1514)=4.15, p<.001 and “professors”
variables multivariate F(13,1496)=1.75, p<.05. Hence they are relevant normative referents for the students
in pursuing energy saving behavior.
Finally the perceived behavioral control was analyzed based on their statistical significance to the
intention to save energy. The analyses identified that there is no significant relationship between the
perceived control variable with the energy saving intention, multivariate F(13,1525)=1.27, p>.05, n.s.; but
with energy saving behavior the purchase variable was significant, multivariate F(13,1493)=2.87, p<.001.
These beliefs can provide a basis for future study; for constructing a new standard questionnaire!
Further the two groups of students were compared analyzing their intention to save energy.
Statistically it was found a significant relationship between Energy lectures and students’ intention to save
energy Wilks’ Lambda=0.99, multivariate F(5,1496)=3.42, p<.05. Considering equal sample sizes for the
first group (The “Environmental or Energy (or both)” group) it was identified that students who had one or
more Energy lectures had the highest intention to save energy, followed by students who had Environmental
lectures.
Three equal sample sizes (N = 619) were constructed with students from the first group
(“Environmental or Energy (or both)” Group) and students from the second group (The “Others” Group) and
the means of the TpB components were analyzed. It was found that students who had access to
Environmental or Energy (or both) lectures have higher intention to engage in energy saving measures as the
others.
It was concluded that students’ access to Environmental or Energy (or both) or Energy lectures (or
both) increase their intention to engage in energy saving measures.
Statistical analyzes of the influence of the television on the students from the second group (The
“Others” group) were significant, multivariate F(4,875) =2.75, p<.05 Comparing two equal size samples
88
from the second group showed that with the increase in frequency of the energy saving advice from
television students’ subjective norms and perceived behavioral control decreases. Hence the television has a
negative effect on their intention to pursue energy saving measures.
Also it was identified in the case of the first group (The “Environmental or Energy (or both)” Group)
statistically the television showed significance, multivariate F(4,593)=2.80, p<.05 with students intention to
save energy.
Analyzing the price influence on students’ intention to save energy, it was found that the price of the
energy saving bulb was significantly related to the participants’ attitude towards energy saving, multivariate
F(2,1453)=9.679, p< .001 and subjective norm, multivariate F(2,1451) = 5.144, p<.05.Further it was
identified that students who known the prize and hold information on energy saving light bulb have higher
intention to save energy than the others.
Statistical analysis showed significant relationship between students’ admission (or study start) to the
perceived behavioral control, multivariate F(46,1394)=1.563, p<.05 Students’ attitude, confidence and
subjective norm increases with the years of study at the University.

89
Chapter VII- Energy Efficiency at European Universities
This last section outlines the situation at European Universities relating electricity saving incentives
and metering systems. Interviews were conducted (via email; from 1st October 2010 until 1st November
2010) with 30 European Universities40. Specific questions were asked about the university electricity
consumption and infrastructure, National Electricity Market and Tariff Systems, and on the University
incentives and metering system.
The findings were grouped into three different categories:
1. Implementation of low cost measures, or “passive” measures.
2. The use of metering systems and implementation of an incentive system.
3. Changes in the building’s infrastructure.
7.1. Implementation of Low Cost Measures
Universities use low cost measures to reduce their electricity consumption, such as energy efficient light
bulbs, installation of timers, movement detectors, use of LED technology for lighting, purchase of low
carbon technologies and others. These measures require none or little interaction with the energy consumer.
Hence the switching on or off (lights, ventilation) can be managed by automation. In what follows we will
mention some low cost university-specific measures:
Replacement of energy-intensive (e.g. halogen lamps) lamps by low-energy lamps. (e.g. T5 lights).
T5 lights save around 70% energy costs and increase illumination but they are expensive.
Inverter control of electric motors. Inverter is an electrical tool that converts direct current to
alternative current. In practice a frequency inverter or (AC drive) is used for speed control to decrease the
energy of the fan and pump. The driving force can be reduced when the speed of the fan and pump is
reduced hence the air volume and the flow rate can be controlled. Frequency inverters are installed usually
on the following equipments: feed water pump, air conditioning pump, boiler water pump, ventilation fan,
etc. [INVERTER]
Investment in reactive power compensation and harmonic filtering to save energy and to
improve power quality. The amortization period of such an investment is about one year.
Boiler optimization. Today there are several intelligent boiler management systems. The system
reacts to changes in temperature, “automatically manages the boiler output to meet the demanded in the
most efficient manner possible”[SOLAR] reducing fuel consumption and greenhouse gas emissions.
40 Additional information available on CD (Folder: Chapter VII- Energy Efficient Measures at European Universities)

90
Lagging, isolation used to prevent heat diffusion from a steam pipe. Studies suggest that this way
heat loss can be cut up to 70%. Several universities adopted the use of thermal isolation jackets (or
removable insulation covers) to save between 25%-40% of their energy bill.
Replacement of thermostatic valve heads (to avoid manual temperature changes). Thermostatic
radiator valves measure the air temperature around them. They work by managing the flow of water through
the radiator which they are connected to. This measure can save up 10% on energy costs.
Use of carbon-dioxide sensors to control ventilation system. The initial cost (cost of sensors and
control system) is the main disadvantage of these demand controlled ventilation systems.
Warwick University (United Kingdom) uses “free cooling” technologies so called “eco evaporative
cooling”. The evaporative coolers function is based on the principle of air change. Hence cool air is used to
cool buildings; the building cooling system is used only on the hottest days. In the case of Warwick
University the electricity use was reduced by 58,824 kWh/year and financial savings were £5,000 per year41.
Motion detectors can automatically switch light on or off, depending on the presence of people in the
room. Motion detectors can be easily installed, they are inexpensive but they are not suitable for energy
saving bulbs, and their use is limited due to small detection range.
Controlling the power utilization of personal computers. Unfortunately there are only few initiatives
to adjust personal computers for minimal power consumption, although computers have a high consumption
in a stand-by state.
Several studies proved that these low cost, automation and information measures alone result low energy
savings. In order to be successful, energy conservation requires awareness and effort. Therefore it should be
combined with consumer awareness measures.
7.2. The Use of Metering Systems and the Implementation of Incentive Systems
In order to identify changes in energy savings, the energy consumption in buildings must be
measured as detailed as possible. Usually measuring is done by low-cost non-calibrated meters or small
measuring devices. These devices function without a building control system. This data is collected locally
or it can be transmitted to a central device. In United Kingdom usually electricity is measured by sub meters
half-hourly meters and fiscal meters. In the case of sub meters universities own their meters and the costs are
allocated on the base of the usage measured by a sub meter installed in each unit. In the case of half-hourly
metering the electricity meter “records a reading each half hour through a year.” [HALF HOURLY
METERING] Fiscal metering is defined by the Metering Regulation as “Metering related to the purchase
and sale and calculation of taxes”[FISCAL METER]. There are different systems (applications) for data
processing:
41 Warwickshire Energy Advisors http://www.warwickshire.gov.uk/web/corporate/pages.nsf/Links/668BA650CCF32DE28025764F003BC722

91
University of Tampere (Finland) developed an online, web based application to visualize its energy
consumption.
University of Cambridge (United Kingdom) uses a sophisticated building energy management
system which enables “its staff to play a key role in energy saving and carbon reduction.”42
University of Stavanger (Norway) owns a private metering system, but the data processing was
awarded to a local company.
University of St. Gallen (Switzerland) uses a very expensive metering system based on the
buildings CO2 footprint.
HAGEN (1985) characterizes initiatives as intrinsic and extrinsic motivators. The intrinsic motivation
increases the person’s environmental and energy awareness. They address the person’s attitude and
conscience; hence it is a powerful to influence people’s energy saving behavior.
In the following section I will review university-specific intrinsic motivation initiatives:
Online web based applications indicating student and staff energy consumption and savings in kWh
as in price.
Striking posters, drawings next to often used electrical devices. Their purpose is to indicate the
environmental impact of the electrical device.
Commitments made to reduce energy consumption. In United Kingdom University divisions,
departments are responsible for their energy consumption. They publish their energy consumption and set
targets to staff and students. Also Environmental and Energy Policy can act as a commitment to reduce
energy use and protect the environment.
Roksilde University (Denmark) encourages staff and students to become “Green Ambassadors”.
Hence students are encouraged to lower their energy consumption and act eco friendly (plant trees; consume
organic food, recycle, etc.).
Manifestations (workshops, meetings), Campaigns (Earth Hour, Earth Day, Energy Saving Weeks,
Switch and Save) are used to:
o show and educate staff and students how to save energy,
o inform students and staff on the latest green energy project,
o promote the use of sustainable form of travel and transport, etc.
The disadvantage of these incentives is that they require “trained mind” as well as time and money.
Other possibilities are the national-wide or European-wide competitions to energy savings:
“People & Planet Green League Table” ranks United Kingdom Universities based on their
environmental performance, is credited “putting climate change on the desk of every Vice-Chancellor in the
UK.”43
42 Cambridge University https://www.trendcontrols.com/en-GB/Pages/EngCSCambridgeUniversity.aspx 43 People and Planet Green League http://peopleandplanet.org/greenleague

92
London’s “Green500” awards organizations for their carbon reduction initiatives. In 2010 the Golden
Awards was given to University of East London (United Kingdom)44.
Extrinsic motivation refers to motivation which comes from outside of an individual. Common extrinsic
motivations are monetary rewards, restraints or punishments. In the following I will review university-
specific extrinsic motivational initiatives:
Energy saving competition between University Halls of Residence. Halls within each University
compete against each other to reduce their energy consumption from the current year. Prizes include:
Money, Eco-gadgets, Club tickets, Ice-cream etc.
Profit sharing on the saved electricity. The reward is the cash savings from the saved electricity. If
the budget for electricity and for the acquisition of electric appliances remains on a constant level, then less
electricity consumption generates more money for acquisition. Hence this results in acquisition of more
energy-efficient appliances.
There are many different types of grants or discount to help universities to finance their energy saving
measures:
Low Carbon Building Programme (United Kingdom)
Salix Funds (United Kingdom)
Fonds Belval (Luxembourg)
Government Funds
University Estate Funds
7.3. Changes in Building Infrastructure
The following actions are taken to make university buildings “green”:
University of Luxembourg (Luxembourg) conducts feasibility studies on estate buildings to ensure
that buildings meet eco-certifications for energy efficiency and environmental responsibility.
Some consider refurbishment of buildings as an alternative to energy saving. This measure also
accounts changes in building infrastructure such as installation of solar panels or small wind mills on
buildings. University of East London (United Kingdom) Dockland Campus uses a wind turbine to
generate electricity and to reduce carbon dioxide emissions.
Not every university generates electricity by its own, but several universities use combined heat and
power (CHP) plants to produce electricity with lower heat temperature. University of Warwick (United
Kingdom) implemented the combined heat and power technology and today 50% of the Campus’ annual
44 London Green 500 http://www.green500.co.uk/cms/about/)

93
electricity consumption is supplied by CHP engines. The installation of combined heat and power solutions
requires massive changes in the infrastructure. University of Bradford (United Kingdom) estimates the total
cost of the project to £4.5million. More than half of the investment is funded by Salix fund (£2.4m) and the
remaining by University Funds. The long term savings rise up £400,000/year45.
University of Graz (Austria) considers building insulations (such as of double glass windows, PHV
systems) as a method to reduce demand for heat, to save more energy.
A more “drastic measure” is to reduce the number of buildings. Manchester Metropolitan University
(United Kingdom) considers replacing of old buildings with new ones, reducing the number of campuses
from seven to three.
The majority of universities consider in case of refurbishments the installation of building automation
systems for heat, lights, ventilation and energy demand management systems. The advantage of these
systems is that data can be linked with energy management systems to monitor the energy consumption of
cost centers. This system requires an adequate building fabric because space is needed for data storage and
for the meters.
7.4. Conclusions
Surveying several European universities we identified three measures used to improve energy efficiency:
(1) Implementation of low cost measures, or “passive” measures; (2) The use of metering systems and
implementation of an incentive system; and (3) Changes in the building’s infrastructure.
Several measures showed high efficiency, long-term energy savings. Almost all European Universities
account with energy saving policy and measures. Moreover their uses specific energy management programs
to manage energy demand.
However it is difficult to define a measure that fits the best for University Environment, metering system
proved to be the most efficient measure in reducing energy demand.
45 University of Bradford http://www.brad.ac.uk/chp/faqs/

94
Chapter VIII – Conclusions and Recommendations
8.1. Conclusions
Higher education plays a critical role in sustainable education. Universities educate students on
sustainability through a variety of programs and activities. Students’ energy use impacts the national energy
consumption; therefore it should be analyzed and measures identified to influence their energy consumption
behavior.
The key elements of this thesis are sustainable consumption, individual behavior and decision in
different context, energy consumption behavior, determinants of student energy savings (analyzing students’
intention, behavior, attitude, subjective norm and perceived behavioral control based on TpB) and
investigation of the application of the energy efficient measures at universities.
The first chapter presented the structure of the Portuguese electricity market.
In the second chapter we investigated the relationship between individual decision and sustainable
energy consumption. Consumption is fundamental factor in achieving a sustainable development:
unsustainable consumption is one of the causes of the climate change and pollution.
We investigated the behavioral studies on energy consumption, particular focus was on different
intervention measures such as: commitments[KATZEV et al., 1983] goal settings [BECKER,
1978]information [GELLER, 1981] workshops, mass media campaigns [STAATS et al., 1996a] TV
[WINETT et al., 1985] feedback [VAN HOUWELINGEN et al., 1989] , Eco Teams[STAATS et al.,
2004b] and master meters [McCLELLAND et al., 1980] Also sociological investigation on energy
conservation was presented; specifically eco-labelling, lifestyle (AUNE (1998), [GRAM et al., 2004] ,
[McMAKIN et al., 2002] , purchase [PEDERSEN, 2000] and the environment effect [RUBIK et al., 2006]
Based on the literature review we identified the following factors influencing energy consumer behavior:
1. Characteristics of the households: influenced by age, family members and size, ownership, income,
education etc;
2. Characteristics of the building: influenced by the age of the building and location (urban versus rural);
3. Information: energy bills or energy labels encourage energy saving behaviors. Information credibility
is higher if it is administrated by state agency than by utility company;
4. Economic factor: energy price has a strong influence on reducing energy use. It is suggested that
higher prices encourage consumers to save more energy (or to purchase higherenergy saving
technology).and

95
5. Attitudes, beliefs, norms: are important, but nobody proved that these factors are determinants of
energy consumption.
In the third chapter of this research, the objective was to review the Theory of Planned Behavior.
First the application of the TpB was presented followed by the definition of its components and the
computation of the belief based measures.
In the fourth chapter, we constructed two sample sizes used to test the hypotheses and we analyzed
the two groups based on the frequency of the energy saving information, electricity bill payment and
purchase decision. First, based on the first twelve questions, we could characterize the two sample sizes as:
the “Environmental or Energy (or both) Student” studies at Faculty of Science and Technology, the student
is a 23 years old male, single, started its studies in 2007 and in this year he will graduate. His last year
average was 13 and he lives off-campus. The “Other Student“ studies at Faculty of Economics, the student is
a 21 years old female, single, started her studies in 2009 and she assumes that she will graduate in 2011. Her
last year average was 13 and she lives off-campus.
Secondly, based on the demographics, we were interested to find out from where and how much
energy saving information receives the two sample groups. In the case of the first group (“Environmental or
Energy (or both)” Group), students had never received energy saving advices from billboard or from
brochures. They receive energy saving information from television, person or from the Internet every day.
During the week they receive advice on energy saving from television, from a person or from a newspaper.
However considering the long term, the highest number of energy saving advices is collected from
flyers, brochures or from newspapers. The second group of students had never received energy saving
advices from a billboard, brochure or flyers. They receive energy saving information every day from the
television, a person or from the radio. Once per week they receive advice from the television, newspaper or
from the Internet. During the week they receive at least two-three times advice from the television, from the
radio or from the newspaper. However, on the long term the biggest amount of energy saving advice is
collected from flyers, brochures or persons. Both groups of students receive few advices with daily
frequency.
Thirdly, based on the electricity bill payer, we identified that: for the first group student
(“Environmental or Energy (or both)”) the electricity bill is paid by a family member, but he is familiar with
the electricity bill expense. In the case of the second group student (The “Other Student”), he also leaves off-
campus residence, the electricity bill is paid by a family member, and he has a relative idea on the rate of
their electricity bill in his expenses.
And finally analyzing the choice between traditional light bulb and energy saving bulb we identified
that the first group’s (“Environmental or Energy (or both)” Group) choice for an energy saving light bulb is
influenced by the product environmental performance, efficiency and expected life. Price or designs are

96
secondary factors that influence the choice for an energy saving light bulb. In the case of the second group
(The “Others” Group), students’ choice for an energy saving light bulb is influenced by the product
environmental performance, efficiency and expected life. Price, designs or quality are secondary factors that
influence the choice for an energy saving light bulb.
In the fifth chapter, we investigated if students’ intention in energy saving can be broken down into
specific forms of attitudes, norms or beliefs. Using SPSS 17, the correlation between TpB components was
assessed; intention and behavior did not correlate with the perceived behavioral component indicating low
interest to pursue energy saving intention.
In the sixth chapter we analyzed the following 5 hypothesis.
Hypothesis 1: Students from the first group (“Environmental or Energy (or both)” Group) have a favorable
attitude and subjective norm, a higher perceived control than the students from the second group; hence a
stronger intention to perform energy saving behavior.
Hypothesis 2: The belief-based measures of attitude provide a more accurate measure of intention than the
direct ones.
Hypothesis 3: Advice from the television has a significant influence on the students from the second group
(The “Others” Group); they have a favorable attitude and subjective norm, a higher perceived control to
perform energy saving behavior.
Hypothesis 4: In the case of the first group (“Environmental or Energy (or both)” Group) the price has a
significant influence on the students’ intention to save energy. Those students who can estimate exactly the
cost of energy saving light bulb have a favorable attitude and subjective norm, a higher perceived control to
perform energy saving behavior than the others.
Hypothesis 5: Students’ attitude, confidence and subjective norm increases with the years of study at the
University.
The findings were as follow:
1. The TpB belief components were analyzed based on their statistical significance to the
intention to save energy. The analyses identified that the indirect measurement of Attitude
toward Behavior showed significance to the energy saving intention, multivariate
F(13,1530)=4.57, p<.001.The direct measures of the Attitude toward behavior showed
significance to the intention to save energy, multivariate F(13,1530)=1.75, p<.05. Hence the

97
belief based measurements are more reliable than the direct measures; Hypothesis two is
accepted.
2. The subjective norm was analyzed based on their statistical significance to the intention to
save energy. The analyses identified that the indirect measurement of the subjective norm
showed significance to the energy saving intention, multivariate F(13,1527)=3.30, p<.001.
3. The perceived behavioral control was analyzed based on their statistical significance to the
intention to save energy. The analyses identified that there is no significant relationship
between the perceived control variable with the energy saving intention multivariate
F(13,1525)=1.27, p>.05; but with energy saving behavior the purchase variable was
significant multivariate F(13,1493)=2.87, p<.001.
Further the two groups of students were compared analyzing their intention to save energy.
Statistically it was found a significant relationship between Energy lectures and student intention to save
energy Wilks’ Lambda=0.99,multivariate F(5,1496)=3.42, p<.05.
Considering equal sample sizes for the first group (The “Environmental or Energy (or both)” group) it
was identified that students who had one or more Energy lectures had the highest intention to save energy,
followed by students who had both Environmental lectures.
Two equal sample sizes (N =619) were constructed with students from the first group
(“Environmental or Energy (or both)” Group) and students from the second group (The “Others” Group) and
the means of the TpB components were analyzed. It was found that students who had access to Energy or
Environmental lectures (or both) have higher intention to engage in energy saving measures as the others.
It was concluded that students’ access to energy and Energy or Environmental lectures (or both)
increase their intention to engage in energy saving measures; Hypothesis one accepted.
Statistical analyzes of the influence of the television on the students from the second group (The
“Others” group) was significant multivariate F(4,875) =2.75, p<.05. Comparing two equal size samples from
the second group showed that with the increase in frequency of the energy saving advice from television
students’ subjective norms and perceived behavioral control decreases. Hence the television has a negative
effect on their intention to pursue energy saving measures; Hypothesis three accepted.
Also it was identified in the case of the first group (The “Environmental or Energy (or both)” Group)
statistically the television showed relations with students intention to save energy, multivariate
F(4,593)=2.80, p<.05.
Analyzing the price influence on student intention to save energy it was found that the price was
significantly related to the participants’ attitude towards energy saving, multivariate F(2,1453)=9.679,
p< .001 and subjective norm, multivariate F(2,1451) = 5.144, p<.05.Further it was identified that students
who are familiar with the costs and with the product have higher intention to save energy then the others;
Hypothesis four accepted.

98
Statistical analysis showed significant relationship between to the perceived behavioral control,
multivariate F(46,1394)=1.563, p<.05. It was found that student’ attitude, confidence and subjective norm
increases with the years of study at the University. Hypothesis five accepted.
In chapter seven we surveyed several European Universities asking questions about the University
electricity consumption and infrastructure. The findings were grouped into three different categories:
1.) Implementation of low cost measures: (a) replacement of energy intensive lamps by low-energy
lamps; (b) inverter control of electric motors; (c) reactive power compensation and harmonic filtering; (d)
boiler optimization; (e) lagging; (f) replacement of thermostatic valve heads; (g) use of carbon-dioxide
sensors to control ventilation system; (h) “eco evaporative cooling”; (i) motion detectors and (j) controlling
the power utilization of personal computers.
2.) Use of metering systems and implementation of incentive systems.
Usually measuring is done by low-cost non-calibrated meters or small measuring devices. These
devices function without a building control system. There are different systems for data processing: web
based applications or metering systems based on the buildings CO2 footprint.
We identified the following University-specific intrinsic motivation initiatives:
i. Online web based applications indicating student and staff energy consumption and savings in
kWh as in price.
ii. Striking posters, drawings next to often used electrical devices. Their purpose is to indicate
the environmental impact of the electrical device.
iii. Commitments made to reduce energy consumption.
iv. Encouragements of staff and students to become “Green Ambassadors”
v. Manifestations (workshops, meetings), Campaigns (Earth Hour, Earth Day, Energy Saving
Weeks, Switch and Save) are used to:
a. show and educate staff and students how to save energy,
b. inform students and staff on the latest green energy project,
c. promote the use of sustainable form of travel and transport, etc.
vi. “People & Planet Green League Table” ranks United Kingdom Universities based on their
environmental performance,
vii. London’s “Green500” awards organizations for their carbon reduction initiatives.
viii. Energy saving competition between University Halls of Residence. Halls within each
University compete against each other to reduce their energy consumption from the current
year. Prizes include: Money, Eco-gadgets, Club tickets, Ice-cream etc.
ix. Profit sharing on the saved electricity. The reward is the cash savings from the saved
electricity. If the budget for electricity and for the acquisition of electric appliances remains

99
on a constant level, then less electricity consumption generates more money for acquisition.
Hence this result in acquisition of more energy-efficient appliances.
These measures are supported by different types of grant for instance Salix Funds (United Kingdom) or Low
Carbon Building Programme (United Kingdom).
3.) Changes in building infrastructure: buildings eco-certifications, refurbishments, building
insulations and reduction of the number of the estates buildings.
However the metering systems proved to be the most efficient measure in reducing energy demand it
is difficult to define measure that fits the best for University Environment.
8.2. Recommendations and Limitations
The first hypothesis demonstrated that people from the first group (“Environmental or Energy (or
both)” Group) have a favorable attitude and subjective norm, a higher perceived control than the students
from the second group; hence a stronger intention to perform energy saving behavior. Hence the Energy or
Environmental (or both) lectures have a positive effect on students’ intention to save energy.
However the big majority of students don’t have access to Environmental or Energy (or both)
lectures. One should question, is there a method (or measure) to influence these students to save more
energy? Or could all the students be influenced to save more energy at the University?
In the following we will present four measures which could be applied to influence energy savings at
the University.
First, measure is a competition between different departments. A competition between different
departments of the University could be organized to encourage energy savings. Group of students and staff
members (N = 10) from different departments (is important!) should compete with each other in an energy
saving championship during one academic year.
At the beginning of the scholar year (September) recruitment of teams with ten members should be
made. The teams should be formed by students from different departments (two groups of students from the
same department is not allowed; but two teams from the same Faculty, with different specialization is
allowed). Also a jury formed from the organizers and academic staff should be selected to define the task and
judge the competition.
The groups receive a workbook with energy saving tasks. The tasks are identical to all groups;
moreover groups can help each other; they can ask for assistance from academic department. The task should
consist of realistic, low cost and easy to implement measures. At the end of each month the groups should
present their findings and the jury should elect the winner.
At the end of each month an Eco Champion is elected and rewarded.

100
Secondly, competition between residences on energy saving should be organized. This measure is
applied only to students. The recruitment of the Eco Rangers is made at each residence at the beginning of
the scholar year (September). These are students who intend to save energy.
Each Eco-Ranger must encourage students from the residence to act in energy efficient way. This
could be done by using different actions (some of these actions were already applied at different
universities): (1) picture competitions to raise awareness on energy saving; (2) movie nights on climate
change, recycling or energy saving (screening movies like Fuel; Age of Stupid; Gasland; Tapped); (3)
parties with organic food; (4) climate quiz competition or (5) creation of social groups (Facebook, Hi5, etc.)
At the end of the month energy consumption should be measured and the most efficient residence
should be named as Eco-efficient and rewarded with different prizes.
After each week the Eco-Rangers should report their findings or the planned activities to the
organizers.
Thirdly, academic departments should be advised to use railway for official trip as transportation
instead of airplane (directive of University of Zurich). There is no time-related disadvantage; moreover the
railway can be used as labor time (e.g. by working with a laptop), whereas working in the airplane is more
difficult.
And finally, Energy Saving Days or the so-called One Hour Switch Off days should be held. The
University of Leeds promotes measures such as Earth Hour Campaign or Heater Amnesty. During one hour
students are advised to switch off their computers, laptops, printers, phone chargers etc. to save energy. In
2011 during one hour they saved 12,442kWh. Further measures include the promotion of a short period of
time of coffee machines, microwaves, and kettles.
As in any research, there are some limitations to this study which should be considered.
Firstly, it would have been more advantageous a more focused research one the main behaviors. For
instance for the “turn-off the lights behavior” very few students measure (or are aware of) the time spent
outside of the room and therefore may not know exactly how long the lights in their room remain on. It is
possible that students who did report that they are turning off the lights if they are leaving the room for more
than five minutes, may not be true. In addition, if somebody performs this behavior periodically as a habit the
importance of the other factors may be irrelevant!
Secondly, usually TpB components are evaluated using the direct methodology. This study did not
assess the TpB components using the direct methodology; instead a more complicated indirect measure was
used. The main advantages of the direct assessment are: (1) eliminates the optimal scaling issue and (2)
reduces the size of the questionnaire. Using direct assessment the TpB approach may have resulted higher
predictive power. However, Ajzen [2002] considers that “belief-based measures have the advantage of
providing insight into the cognitive foundation underlying perceptions of behavioral control.”

101
Thirdly, we observed that several students agreed to complete the questionnaire as a course
requirement, hence they are not highly motivated to report accurate responses.
Finally, TpB is used to predict and understand human behaviors not as a methodology for guiding
intervention development.
With the changes in technology the energy consumer behavior of people changes rapidly. Future
research should reexamine these behaviors; interventions must be updated to reflect the current energy
consumption behavior: for instance the computer shut-down behavior may soon no longer be a reasonable
behavior to target within an intervention.

102
References
[ABRAHAMSE et al., 2005] Abrahamse, W., Steg, L., Vlek., Ch., Rothengatte, T., (2005), A Review Of
Intervention Studies Aimed At Household Energy Conservation, Journal of
Environmental Psychology, 25, 273–291.
[AJZEN et al., 1980] Ajzen, I., Fishbein, M. (1980) Understanding attitudes and predicting social behavior.
Englewood Cliffs: Prentice-Hall.
[AJZEN, 1991] Ajzen, I. (1991) The theory of planned behavior. Organizational Behavior and Human
Decision Process, 50(2), 179-211.
[AJZEN, 2002] Ajzen, I. (2002) Construction of a standard questionnaire for the theory of planned
behavior. http://www.people.umass.edu/aizen/pdf/tpb.measurement.pdf
[AMIREAULT et al., 2008] Amireault, S., Godin, G., Vohl., MC., Perusse L. (2008) Moderators of the
intention-behaviour and perceived behavioural control-behaviour relationships for leisure-
time physical activity, International Journal of Behavioral Nutrition and Physical Activity,
Volume 5, Number 1.
[AMORIM et al. 2010] Amorim, F., Silva, P., Martins, V., A new perspective to account for renewables
impacts in Portugal, Energy Market (EEM), 2010 7th International Conference on the
European,IEEExplore, August 2010.
[ANDERSEN, 2006] Andersen M, Tukker (2006) A Perspective on Radical Changes to Sustainable
Consumption and Production (SCP), Workshop of the Sustainable Consumption Research
Exchange (SCORE!) Network, Copenhagen, Denmark.
[ARVOLA et al., 1993] Arvola, A., Uutela, A., Anttila, U. (1993) Billing feedback as a means to encourage
household electricity conservation: A field experiment in Helsinki. In Proceedings of the
1993 summer study of the European Council for an energy efficient economy, 11–21.
[ARMITAGE et al., 2001] Armitage, C.J., & Conner, M. (2001) Social cognitive determinants of blood
donation. Journal of Applied Social Psychology, 31, 1431-1457.
[BARTIAUX, 2003] Bartiaux F. (2003) A socio-anthropological approach to energy related behaviors and
innovations at the household level, ECEEE 2003, Summer Study, St. Raphael.
[BECK et al., 1991] Beck, L., & Ajzen, I. (1991). Predicting dishonest actions using the theory of planned
behavior. Journal of Research in Personality, 25(3), 285-301.
[BECKER, 1978] Becker, L. J. (1978) Joint effect of feedback and goal setting on performance: A field
study of residential energy conservation., Journal of Applied Psychology, 63(4), 428–433.
[BIGGART et al., 2007] Biggart, N. W., Lutzenhiser, L. (2007) Economic Sociology and the
Social Problem of Energy Inefficiency,American Behavioral Scientist, 50(8), 1070-1087.

103
[BITTLE et al., 1979-1980] Bittle, R. G., Valesano, R., Thaler, G. (1979) The effects of daily cost feedback
on residential electricity consumption. Behavior Modification 3(2), 187–202.
[BRANDON et al., 1999] Brandon, G., Lewis, A. (1999) Reducing household energy consumption: A
qualitative and quantitative field study. Journal of Environmental Psychology, 19, 75–85.
[BROHMANN et al., 2009] Bettina Brohmann, Stefanie Heinzle, Julia Nentwich, Ursula Offenberger, Klaus
Rennings, Joachim Scleich, Rolf Wüstenhagen, (2009) Working Paper No.1 within the
project: Soziale, ökologische und ökonomische Dimensionen eines nachhaltigen
Energiekonsums in Wohngebäuden.
[CAREW et al., 2002] Carew, A., Mitchell, C. (2002) Characterizing undergraduate engineering
students understanding of sustainability, European Journal of Engineering Education,
vol. 27, no. 4, pp. 349-61.
[CARLSSON-KANYAMA et al., 2007] Carlsson-Kanyama, A., A.-L. Linden (2007), Energy efficiency in
residences-challenges for women and men in the North. Energy Policy 35, 2163–2172.
[CHEUG et al., 1999] Cheung, S.F., Chan, D.K.S., & Wong., Z.S.Y (1999). Reexamining the theory of
planned behavior in understanding wastepaper recycling. Environment & Behavior, 31(5),
587-612.
[CURTIS et al., 1984] Curtis, F.; P. Simpson-Housley; S. Drever (1984) Household energy conservation,
Energy Policy 12, 452–456.
[DG Environment, 2002] European Commission (2002) Final Report. Evaluation o Environmental. Product
Declaration Schemes. DG Environment.
[DGGE 2010] DGGE, 2010, Direcção Geral de Energia e Geologia, (2011), “Renováveis, Estatísticas
Rápidas”, nº 70 .
[DILLMAN et al., 1983] Dillman, D., E. Rosa and J. Dillman (1983) Lifestyle and home energy
conservation in the United States: the poor accept lifestyle cutbacks while the wealthy
invest in conservation, Journal of Economic Psychology 3, 299–315.
[DOBSON et al., 1992] Dobson, J. K., Griffin, J. D. A. (1992) Conservation effect of immediate electricity
cost feedback on residential consumption behavior. In Proceedings of the ACEEE 1992-
Study on Energy Efficiency in Buildings 10, 33–35.
[DOUGLAS et al., 1979] Douglas M., Isherwood (1979) The World of Goods: Towards an Anthropology of
Consumption, New York.
[DWYER et al., 1993] Dwyer,W. O., Leeming, F. C., Cobern,M. K., Porter, B. E., Jackson, J.M. (1993).
Critical review of behavioral interventions to preserve the environment. Research since
1980. Environment and Behavior, 25(3), 275–321.
[EBERLE et al., 2004] Eberle (2004) Sustainable Consumption Needs Visions (2004) Position Paper by the
Institute of Applied Ecology, Öko-Institut Freiburg/Darmstadt.

104
[EGAN, 1999] Egan, C. (1999) Graphical displays and comparative energy information: What do people
understand and prefer? Paper presented at the Summer Study of the European Council for
an Energy Efficient Economy, 1999, paper no. 2–12.
[EMILE et al., 2009] Renu E., Lees M C (2009) I am what I am – The question of reflexivity in consumer
discourses, ANZMAC, University of New Zeland, page 1-8.
[FERGUSON, 1993] Ferguson M. R. (1993) Energy-saving housing improvements in Canada (1979 - 82): a
nested logit analysis, Environment and Planning 25, 609 – 625.
[FERREIRA et al., 2006] Ferreira P., Araujo, M. (2006) An overview of the Portugal electricity market.
[FIELD, 2009] Field, A. P. (2009). Discovering statistics using SPSS: and sex and drugs and rock 'n'
roll (third edition), Sage Publications Ltd, London (page18, Frequency distribution).
[FISCAL METER] Fiscal Meter http://wiki.answers.com/Q/What_is_the_Meaning_of_fiscal_meter
[FISHBEIN et al., 1977] Fishbein, M., & Ajzen, I. (1975) Belief, attitude, intention, and behavior: An
introduction to theory and research. Reading, Addison-Wesley.
[FISHER, 2008] Fischer, C. (2008) Feedback on Household. Electricity Consumption: a Tool for Saving
Energy?,Energy Efficiency, Vol. 1, 79–104.
[GELLER, 1981] Geller, E. S. (1981) Evaluating energy conservation programs: Is verbal
report enough? Journal of Consumer Research, 8, 331–335.
[GIDDENS, 1991] Giddens A. (1991 ) Modernity and Self-Identity. Self and Society in the Late Modern
Age. Polity Press Cambridge.
[GODIN et al., 1996] Godin, G., & Kok, G. (1996) The theory of planned behavior: A review of its
applications to health-related behaviors. American Journal of Health Promotion, 11(2), 87-
98.
[GONZALES et al., 1988] Gonzales, M. H., Aronson, E., Costanzo, M. A. (1988) Using social cognition
and persuasion to promote energy conservation: A quasi-experiment. Journal of Applied
Social Psychology, 18(12), 1049–1066.
[GRAM et al., 2004] Gram-Hansen, K.; Kofod C.; Petersen N,K (2004) Different Everday Live – Different
Patterns of Electricity Use., 2004, Proceedings of the 2004 American Council for an Energy
Efficient Economy Summerstudy in Buildings. Washington, D.C.
[HAAKANA et al., 1997] Haakana, M., Sillanpää, L., & Talsi, M. (1997) The effect of feedback and
focused advice on household energy consumption. Paper presented at the Summer Study of
the European Council for an Energy Efficient Economy, 1997.
[HALF HOURLY METERING] Half Hourl Metering http://cfe.custhelp.com/app/answers/detail/a_id/6325/~/business:-half-hourly-metering
[HANSEN et al., 2007] Hansen U., U. Schrader, (2007) A Modern Model of Consumption for a Sustainable
Society, Journal of Consumer Policy 20, 443-468.

105
[HAYES et al., 1977] Hayes, S. C., & Cone, J. D. (1977) Reducing residential electrical energy use:
Payments, information, and feedback. Journal of Applied Behavior Analysis, 10, 425–435.
[HEBERLEIN et al., 1983] Heberlein, T. A., Warriner, G. K. (1983) The influence of price and attitude on
shifting residential electricity consumption from on- to off peak periods. Journal of Economic
Psychology, 4, 107–130.
[HEISKANEN et al., 2006] Heiskanen E., Rask M (2006) From Sociotechnical Theory to Sociotechnical
Practice: An Action Research Project, Proceedings: Sustainable Consumption and
Production: Opportunities and Threats, 23-25 November 2006, Wuppertal, Germany.
[HIRST et al., 1982] Hirst, E., Goeltz, R. (1982) Residential energy conservation actions: analysis of
disaggregated data, Energy Systems and Policy 6, 135–150.
[HUTTON et al., 1986] Hutton, R. B., Mauser, G. A., Filiatrault, P., Ahtola, O. T. (1986) Effects of cost-
related feedback on consumer knowledge and consumption behavior: A field experimental
approach. Journal of Consumer Research, 13, 327–336.
[IISD, 2010] International Institute for Sustainable Development, Sustainable Consumption
and Production http://www.iiSD.ca/consume/overview.html
[INVERTER] Understanding a Frequency Inverter
http://www.inverter-china.com/blog/articles/Knowledge-of-frequency-converter-ac-motor-
drive/understanding-frequency-inverter.html
[JACKSON, 2005] Peter Jackson (2005) Motivating Sustainable Consumption, Sustainable
Development Research Network briefing.
[JENSEN, 2003] Jensen, O. M. (2003). Visualisation turns down energy demand. In Proceedings of the
2003 summer study of the European Council for an energy efficient economy, 451–454.
[KAENZIG et al., 2006] Kaenzig, J., R.Wüstenhagen (2006) Understanding strategic choices for
sustainable consumption: the case of residential energy supply, Proceedings: Sustainable
Consumption and Production: Opportunities and Threats, Wuppertal.
[KAGAWA, 2007] Kagawa, F. (2007) Dissonance in students perceptions of sustainable development and
sustainability: Implications for curriculum change”, International Journal of
Sustainability in Higher Education, vol. 8, no. 3, 317-338.
[KANTOLA et al., 1984] Kantola, S. J., Syme, G. J., Campbell, N. A. (1984) Cognitive dissonance and
energy conservation. Journal of Applied Psychology, 69(3), 416–421.
[KASULIS et al., 1981] Kasulis, J. J., Huettner, D. A., Dikeman, N. J. (1981) The feasibility of changing
electricity consumption patterns. Journal of Consumer Research, 8(December): 279-290.
[KATZEV et al., 1983] R.D. Katzev, T.R. Johnson (1983) A social-psychological analysis of residential
electricity consumption: the impact of minimal justification techniques, Journal of
Economic Psychology, pp. 267–284.

106
[KAUFMANN, 1993] Kaufmann J, (1993) Sociologie du couple, PUF (Que sais-je?) nr. 2787, Paris
[KURZ, 2002] Kurz, T., (2002) The Psychology of Environmentally Sustainable Behaviour: Fitting
Together Pieces of Puzzles, Analysis of Social Issues and Public Policy 2 (1), 257-278.
[LARSON et al., 1995] Larson, M. E., D. Houlihan, and P. N. Goernert (1995) Brief report: Effects on
informational feedback on aluminum can recycling. Behavioral Interventions 10(2):111-117.
[LOCK, 2000] Energy Saving Recommended: Key Principles for a Successful Product Labelling Scheme.
Accreditation Manager, Energy Efficiency – Energy Saving Trust, UK Secretary, EnR
Working Group on Labelling and Eco-design, 2000.
[LONG, 1993] Long, J. (1993) An econometric analysis of residential expenditures on energy conserva-
tion and renewable energy sources, Energy Economics 15, 232-238.
[LUDWIG et al., 1998]Ludwig, T. D., T. W. Gray, A. Rowell., (1998) Increasing recycling in academic
buildings: A systematic replication. Journal of Applied Behavior Analysis 31(4):683-686.
[LUYBEN, 1982] Luyben, P. D. (1982) Prompting thermostat setting behavior: Public response to a
presidential appeal for conservation. Environment and Behavior, 14(1), 113–128.
[MARTISKAINEN, 2007] Martiskainen M. (2007) Affecting Consumer Behavior on Energy Demand, Final
Report to EdF Energy, Brighton, East Sussex.
[MACK et al., 2004] Mack, B., Hallmann, S. (2004) Stromsparen in Lummerlund—eine Interventionsstudie
in einer Passiv- und Niedrigenergie-haussiedlung. [Conserving electricity in Lummerlund.
An intervention study in a passive and low energy house residential area].
Umweltpsychologie, 8(1), 12–29.
[McCALLEY et al., 2006] Verbeek P, Slob A (2006) User behavior and technology
development : shaping sustainable relations between consumers and technologies, 2006,
Springer, Dordrecht; McCalley L, Midden J - Chapter 13: Making Energy feedback work:
Goal –Setting and the Roles of Attention and Minimal Justification
[McCLELLAND et al., 1980] McClelland, L., Cook, S. W. (1980) Promoting energy
conservation in master-metered apartments through group financial incentives, Journal of
Applied Psychology, 10(1), 20–31.
[McMAKIN et al., 2002] McMakin, A. H., Malone, E. L., Lundgren, R. E., (2002) Motivating residents to
conserve energy without financial incentives, Environment and Behavior, 34(6), 848–863.
[MILLS et al., 2008] Mills, B., J. Schleich (2008) Why Don’t Households See the Light?
Explaining the Diffusion of Compact Fluorescent Lamps, Paper presented at the 16th Annual
Conference of the European Association of Environmental and Resource Economists
(EAERE), June 25-28, Gothenburg, Sweden.

107
[MOSLER et al., 2004] Mosler, H.-J., Gutscher, H. (2004). Die Förderung von Energiesparverhalten durch
Kombination von instruierter Selbstverbreitung mit Interventionsinstrumenten. [Promoting
Energy Conserving Behaviour by Combining Instructed Self-Diffusion with Intervention
Instruments]. Umweltpsychologie, 8(1), 50–65
[NOTANI, 1998] Notani, A.S. (1998). Moderators of perceived behavioral control’s predictiveness in the
theory of planned behavior: A meta-analysis. Journal of Consumer Psychology, 7(3),
247-271.
[PALLAK et al., 1976] Pallak, M. S., Cummings, N. (1976) Commitment and voluntary energy
conservation. Personality and Social Psychology Bulletin, 2(1), 27–31.
[PALM, 2009] Palm J. (2009) Placing barriers to industrial energy efficiency in a social
context: a discussion of lifestyle categorization, Energy Efficiency, (2), 3, 263-270.
[PAUL et al., 1994] Paul F. Andersen, Douglas E. Allen (1994) Consumption and Social Startification:
Bourdieu’s Distinction, Consumer Research Volume, Nr. 21, Pages 70-74.
[http://www.acrwebsite.org/volumes/display.asp?id=7565]
[PEDERSEN, 2000] Pedersen, L.H. (2000) The dynamics of green consumption: a matter of visibility?,
Journal of Environmental Policy and Planning 2, 193-210.
[PITTS, 1981] Pitts, R. E., Wittenbach, J. L. (1981) Tax credits as a means of influencing consumer
behavior. Journal of Consumer Research, 8, 335–338.
[POORTINGA et al., 2003] Poortinga, W., L. Steg, C. Vlek, G. Wiersma, (2003) Household preferences for
energy-saving measures: a conjoint analysis, Journal of Economic Psychology 24, 49-64.
[REN, 2010] Rede Eléctrica National, National Electricity System,
http://www.ren.pt/vEN/Electricity/NationalElectricitySystem/Pages/electricidade_national-
electricity-system.aspx
[RUBIK et al., 2006] Rubik, F., P. Frankl, L. Pietroni, D. Scheer (2006), Eco-labelling and consumers –
Towards a re-focus and integrated approaches, SCORE! Proceedings 2006 Wuppertal.
[SCHAFER et al., 2008] Schäfer, M., S. Bamberg (2008) Breaking habits: Linking sustainable campaigns to
life sensitive events, SCORE! Proceedings 10-11 March 2008, Brussels.
[SCHULTZ, 1975] Schultz, T.W. (1975) The Value of the Ability to Deal with Disequilibrium, Journal of
Economic Literature 13(3): 827-46. [Available online http://www.jstor.org/pss/2722032]
[SCOTT, 1997] Scott, S. (1997) Household energy efficiency in Ireland: a replication study of owner of
energy saving items, 1997 Energy Economics 19, 187–208.
[SERNHERD et al., 2003] Sernhed, K., Pyrko, J., Abaravicius, J. (2003). Bill me this way!—customer
preferences regarding electricity bills in Sweden. In Proceedings of the 2003 summer study
of the European Council for an energy efficient economy 1147–1150.

108
[SEXTON et al., 1987] Sexton, R. J., Brown Johnson, N., Konakayama, A. (1987) Consumer response to
continuous-display electricity-use monitors in a time-of-use pricing experiment. Journal of
Consumer Research, 14, 55–62. [ Available online http://www.jstor.org/pss/2489242]
[SHOVE, 2003] Shove, E. (2003) Converging conventions of comfort, cleanliness and convenience, Journal
of Consumer Policy 26, 395-418.
[SLATER, 1997] Slater D., (1997)Consumer culture and Modernity, Blackwell Publishing Ltd., Cambridge,
UK. [Available online http://www.uwyo.edu/sustaindevsupport/docs/Global%20Consumer%20Culture.pdf]
[SOLAR] Solar Essence http://www.solaressence.co.uk/solaressence-ecomaster.html
[SPAARGAREN et al., 2007] Spaargaren, G. F.; Martens S; Beckers T (2007) Sustainable technologies and
everyday life, User behavior Technology Development, Part 2, 107-118.
[STAATS et al., 1996a] Staats, H. J., Wit, A. P., Midden, C. Y. H. (1996) Communicating the greenhouse
effect to the public: Evaluation of a mass media campaignfrom a social dilemma
perspective, Journal of Environmental Management, 45, 189–203.
[STAATS et al., 2004b] Staats, H., Harland, P., Wilke, H. (2004) Effecting durable change. A team
approach to improve environmental behavior in the household. Environment and
Behavior, 36(3), 341–367.
[UK FORESTRY, 2010] UK Forestry Commission, Sustainability http://www.forestry.gov.uk/forestry/EDIK-59FMZF
[UNESCO, 2005] United Nations Educational, Scientific and Cultural Organization – Consumer Education,
2005.
[UoG, 2011] University of Gloucestershire (United Kingdom), Sustainable Partnership,
http://www.glos.ac.uk/vision/sustainability/partnerships/Pages/default.aspx
[VAN HOUWELINGEN et al., 1989] Van Houwelingen, J. H., Van Raaij, F. W. (1989) The effect of goal-
setting and daily electronic feedback on in-home energy use, Journal of Consumer Research,
16, 98–105.
[VAN VLIET, 2002] Van Vliet, B. (2002), Greening the Grid. The Ecological Modernisation of Network-
bound Systems. PhD-Thesis Wageningen University.
[VŐLLINK et al., 1999] Völlink, T., & Meertens, R. M. (1999) De effectiviteit van Elektronische feedback
over het energie- en waterverbruik door middel van teletekst bij huishoudens. (The
effectiveness of electronic feedback on household energy use and water use by means
of text TV). In R. M. Meertens, R. Vermunt, J. B. F. De Wit, & J. F. Ybema (Eds.),
Sociale psychologie en haar toepassingen (pp. 79–91). ASPO.
[WCED, 1987] World Commision on Environment and Development, Our Common Future, 1987, Oxford
University Press, Oxford.
[WEBER et al., 2000] Weber, C., A. Perrels (2000) Modelling lifestyle effects on energy demand and
related emissions, Energy Policy 28, 549-566.

109
[WILHITE et al., 1996] Wilhite, H., R. Ling (1996) Measured energy savings from a more informative
energy bill, Energy and Buildings 22, 145–155.
[WILHITE et al., 2000] Wilhite, H., E. Shove, L. Lutzenhiser, W. Kempton (2000), The Legacy of Twenty
Years of Demand Side Management: We Know More about Individual Behaviour But next
to Nothing About Demand, In: E. Jochem, J. Stathaye and D. Bouille (Eds), Society,
Behaviour and Climate Change Mitigation, Luwer Academic Press, Dordrect.
[WILHITE, 2007] Wilhite, H. (2007) Will efficient technologies save the world? A call for new thinking on
the ways that end use technologies affect energy using practices, ECEEE 2007 Summer
Study, La Colle sur Loup.
[WINETT et al., 1985] Winett, R. A., Leckliter, I. N., Chinn, D. E., Stahl, B., Love, S. Q. (1985) Effects of
television modeling on residential energy conservation., Journal of Applied Behavior
Analysis, 18, 33–44.
[WU, 2009] Wu A (2009) Rationality Model and Choice Optimization: One Answer to Aumann’s “Open
Problem” and one Introduction to a New Mathematical Tool, School of Management,
Dalian University, China.
[YOUNG, 2008] Young, D. (2008) When do energy-efficient appliances generate energy savings? Some
evidence from Canada., Energy Policy 36, 34-46.

110
Annex
Annex 1-Correlations between TpB Components
Correlations
INTENTION BEHAVIOR ATTITUDE
SUBJECTIVE_N
ORM PBC
INTENTION Pearson Correlation 1 .627** .163
** .104
** .047
Sig. (2-tailed) .000 .000 .000 .067
N 1555 1554 1544 1541 1539
BEHAVIOR Pearson Correlation .627** 1 .097** .054* .031
Sig. (2-tailed) .000 .000 .033 .231
N 1554 1558 1544 1541 1539
ATTITUDE Pearson Correlation .163** .097** 1 .294** .100**
Sig. (2-tailed) .000 .000 .000 .000
N 1544 1544 1544 1538 1538
SUBJECTIVE_NORM Pearson Correlation .104** .054* .294** 1 .138**
Sig. (2-tailed) .000 .033 .000 .000
N 1541 1541 1538 1543 1537
PBC Pearson Correlation .047 .031 .100** .138
** 1
Sig. (2-tailed) .067 .231 .000 .000
N 1539 1539 1538 1537 1539
**. Correlation is significant at the 0.01 level (2-tailed).
*. Correlation is significant at the 0.05 level (2-tailed).

111
Index
A
Advice, 51
Attitude toward behavior, 36
B
Behavioral beliefs, 69
Belief strength, 68
Bounded rationality, 18, 19, 100
Bulb, 62
C
Commitments, 23, 96, 106
Control belief power, 41, 73
Control belief strength, 40, 73
D
Domestication, 27
E
Eco Teams, 23, 26, 100
Efficiency, 14, 24, 27, 28, 29, 30, 62, 65, 70, 86,
97, 98, 102, 110, 115, 116
Electricity Bill, 59
Entidade Reguladora dos Serviços Energéticos, 15
Environmental or Energy, 46
I
Identity management, 22
Information, 23
Intention, 3, 11, 26, 35, 36, 38, 39, 42, 66, 67, 76,
77, 78, 79, 80, 81, 82, 83, 84, 85, 86, 88, 89, 90,
91, 92, 99, 101, 102, 103, 104, 105, 106, 109,
111
L
Labeling, 23, 31, 32, 62
Lifestyle, 16, 21, 22, 23, 33, 34, 100, 110, 115,
118
M
Mass Media, 23, 24, 35, 41, 73, 79, 100, 117
Motivation to comply, 40, 72
N
National Electricity System, 12
Normative beliefs, 71
P
Perceived Behavioral Control, 37
S
Subjective Norm, 37
Sustainable behavior, 18, 26, 27, 100
Sustainable consumption, 16, 100
Sustainable development, 16
T
Television, 3, 6, 11, 24, 25, 31, 52, 53, 58, 59, 61,
76, 82, 83, 84, 85, 92, 102, 103, 104, 105, 118
Theory of Planned Behavior, 35
W
Workshops, 23, 24, 96, 100, 106

112